
Proceedings of the CleanUp Conference 2019 - CRC Care
634
ADELAIDE 2019 8-12 September 2019 Adelaide Convention Centre adelaide2019.cleanupconference.com 8th International Contaminated Site Remediation Conference Incorporating the 2nd International PFAS Conference Remediating the planet Proceedings Conference information Table of contents Author index Search
-
Upload
khangminh22 -
Category
Documents
-
view
0 -
download
0
Transcript of Proceedings of the CleanUp Conference 2019 - CRC Care

ADELAIDE 2019
8-12 September 2019 Adelaide Convention Centreadelaide2019.cleanupconference.com
8th International Contaminated Site
Remediation ConferenceIncorporating the 2nd
International PFAS Conference
Remediatingthe planet
Proceedings
Conference information
Table of contents
Author index
Search

Contents PrefaceCooperative Research Centre for Contamination Assessment and Remediation of the Environment
September 2019
Copyright © CRC CARE Pty Ltd, 2019
This book is copyright. Except as permitted under the Australian Copyright Act 1968 (Commonwealth) and subsequent amendments, no part of this publication may be reproduced, stored or transmitted in any form or by any means, electronic or otherwise, without the specific written permission of the copyright owner.
ISBN: 978-1-921431-66-1
Enquiries: CRC CARE, C/- Newcastle University LPO, P.O. Box 18, Callaghan, NSW 2308, Australia Tel: +61 (0)2 4985 4941 [email protected] www.crccare.com
These proceedings should be cited as: CRC CARE 2019, 8th International Contaminated Site Remediation Conference incorporating the 2nd International PFAS Conference: Program and Proceedings, CleanUp 2019 Conference, Adelaide, Australia, 8-12 September 2019.
Disclaimer: This publication is provided for the purpose of disseminating information relating to scientific and technical matters. Participating organisations of CRC CARE do not accept liability for any loss and/or damage, including financial loss, resulting from the reliance upon any information, advice or recommendations contained in this publication. The contents of this publication should not necessarily be taken to represent the views of the participating organisations.
3 Welcome
4 CRC CARE
4 Global Centre for Environmental Remediation
5 Organising Committees
6 Program Overview
7 Detailed Program
8 Sunday, 8 September
10 Monday, 9 September
18 Tuesday, 10 September
24 Wednesday, 11 September
26 Thursday, 12 September
27 Conference Sponsors
28 Abstracts

WelcomeOn behalf of CRC CARE, the University of Newcastle and the conference organising committee, I am delighted to welcome you to CleanUp 2019, the 8th International Contaminated Site Remediation Conference. I’m sure you’ll agree that the two years since our last Australian conference have rolled around incredibly quickly.I’m thrilled that CleanUp is returning to Adelaide – the town of CleanUp’s birth, and one in which I spent the better part of three decades – with the Adelaide Convention Centre as the host venue. This truly world-class facility not only allows presenters to put their work in the very best light, but also provides numerous formal and informal networking opportunities – often the most valuable part of any conference. The venue also parallels CleanUp’s environmental ethos, becoming in 2018 the first convention centre in the world to achieve EarthCheck Platinum Certification, representing best practice in sustainability. We are proud to have the Convention Centre, along with the Adelaide Convention Bureau and the South Australian Government, as Principal Conference Partners.
The theme of this conference – ‘Remediating the Planet’ – brings together new thinking from research and industry’s leaders in recognition of the staggering extent and severity of environmental contamination and its attendant impact on environmental and human health.
In the past two years, the CleanUp series has continued to grow its global footprint, most notably with the Inaugural Global CleanUp Congress, held in Coimbatore, India, in October 2018. CleanUp events are also scheduled for Korea and Vietnam in the next 12 months. This year, the organising committee has outdone itself in preparing a stellar scientific and educational program – in my opinion the best yet
While CleanUp provides an outstanding forum for knowledge on conventional contaminants – including measurement, risk, policy, remediation and social issues – the conference continues its focus on emerging contaminants. CleanUp this year again incorporates the International PFAS Conference, highlighting the growing issue of per and poly-fluoroalkyl substances (PFAS). As much as we would love the national and global PFAS problem to have
been solved in the past two years, it is fair to say that it has gotten considerably bigger. New PFAS-contaminated sites seem to be identified every month, and remediation – especially at sites where groundwater contamination has occurred – remains a major challenge. On the positive side, government and industry alike are recognising the need to devote more resources to this issue. As a result, we are seeing the rapid development and uptake of promising remediation approaches and technologies – something that I’m sure many of you are looking forward to hearing about at the conference. You will notice in the program overview that all sessions belonging to the PFAS conference are highlighted purple.
I trust that CleanUp 2019 will foster much interaction amongst our industry, regulator and research delegates, and that strong links are established to enable action to follow. This is the opportunity to collectively put science, engineering and practice together to meet our human and environmental aspirations and to depart, at the end of this week, feeling a reinvigorated sense of purpose.
I am always humbled by the support CleanUp receives from sponsors and exhibitors, without whom this event would not be possible – thank you. I would also like to thank the members of the various organising committees who have generously volunteered their time and expertise. Finally, the conference owes considerable gratitude to Plevin and Associates, whose professionalism and calm amidst the chaos help us ensure that CleanUp is a resounding success.
Professor Ravi Naidu
Chair, CleanUp 2019 Conference Organising Committee Managing Director and CEO, CRC CARE Global Innovation Chair and Director, Global Centre for Environmental Remediation, University of Newcastle
International CleanUp Conference Adelaide 2019 3

International CleanUp Conference Adelaide 20194
CRC CAREThe Cooperative Research Centre for Contamination Assessment and Remediation of the Environment (CRC CARE) is a multi-partner Australian research organisation developing innovative technologies and guidance for the assessment, prevention and remediation of contaminated soil, water and air. World-class researchers at CRC CARE work with industry on global contamination issues, engaging with major end users such as the mining and petroleum industries, environmental regulators, government organisations, small-to-medium enterprises and environmental consultants.
CRC CARE’s research program is complemented by a focus on educating and training postgraduate research students and industry professionals. In so doing, CRC CARE supports the growth of highly qualified and suitably trained researchers and decision-makers in the area of environmental risk assessment and remediation.
For more information, visit www.crccare.com
Global Centre for Environmental RemediationThe Global Centre for Environmental Remediation (GCER) aims to safeguard people’s social, economic and physical health and wellbeing by developing innovative, cost-effective and sustainable technologies and solutions that reduce the impact of pollutants on the environment. A leading proponent of risk-based and in situ approaches to the clean-up or management of contaminated sites, GCER is leading a more rational, effective and affordable approach to contamination science and clean-up. In addition to research, GCER offers PhD and research masters, masters by coursework and honours programs. GCER graduates enter the workforce ready to take up challenging positions in the field of environmental risk assessment and remediation of contaminated sites.
For more information, visit www.newcastle.edu.au/research-and-innovation/centre/gcer

Professor Ravi Naidu Chair, CleanUp Conference Series
Dr Prashant Srivastava Program Chair
Mr Adam Barclay Media and Communications Chair
International CleanUp Conference Adelaide 2019 5
Organising Committees
Executive Committee
International organising committee
Professor Ravi Naidu, CRC CARE / University of Newcastle (Australia)
Mr Naji Akladiss, State of Maine Department of Environmental Protection (USA)
Professor Paul Nathanail, Land Quality Management (UK)
Mr Scott Warner, Ramboll Environ (USA)
Professor Fawzi Banat, The Petroleum Institute (UAE)
Mr Andrew Pruszinski, SA EPA
Dr Morrow Dong, Peking University (China)
Professor Kannan Kurunthachalam, New York State Department of Health (USA)
Ms Jacki McManus, Department of National Defence (Canada)
Dr Rula Deeb, Geosyntec (USA)
Professor Ming Wong, Education University of Hong Kong
National organising committee
Mr Andrew Pruszinski, SA EPA
Dr Bruce Kennedy, CRC CARE
Dr Cheryl Lim, National Measurement Institute
Professor Jack Ng, CRC CARE / University of Queensland
Professor Megharaj Mallavarapu, University of Newcastle
Dr Joytishna Jit, CRC CARE / University of South Australia
Dr Sreenivasulu Chadalavada, CRC CARE / University of Newcastle
Dr Mark Bowman, Department of Defence
Ms Helen Horn, Department of Defence
Mr Ratin Mathur, CRC CARE
Professor Nanthi Bolan, University of Newcastle
Dr Mahmud Rahman, University of Newcastle
Dr Raja Dharamarajan, University of Newcastle
Dr Mezbaul Bahar, University of Newcastle
Dr Balaji Shesadri, University of Newcastle
Dr Ayanka Wijayawardena, University of Newcastle
Dr Cheng Fang, University of Newcastle
Dr Dane Lamb, University of Newcastle
Mr Danidu Kudagamage, University of Newcastle
Dr Dawit Bekele, University of Newcastle
Dr Jianhua Du, University of Newcastle
Dr Liang Wang, University of Newcastle
Dr Logeshwaran Panneerselvan, University of Newcastle
Dr Luchun Duan, University of Newcastle
Dr Peter Sanderson, University of Newcastle
Dr Prasath Annamalai, University of Newcastle
Dr Suresh Subhashchandrabose, University of Newcastle
Dr Yanju Liu, University of Newcastle
Ms Jean Meaklim, Greencap
Mr Ross McFarland, AECOM
Dr Peter Nadebaum, GHD
Dr John Hunt, Ventia
Dr Aravind Surapaneni, South East Water
Dr Nick Crosbie, Melbourne Water
Dr Anand Chandra, Ramboll
Dr Annette Nolan, Ramboll
Mr Andre Smit, GHD
Mr Danny Slee, National Measurement Institute
Local organising committee
Professor Ravi Naidu, CRC CARE / University of Newcastle
Dr Prashant Srivastava, CRC CARE
Mr Adam Barclay, CRC CARE
Mr Ratin Mathur, CRC CARE
Mr Phil Plevin, Plevin & Associates
Ms Irene Plevin, Plevin & Associates
Mr Andrew Pruszinski, SA EPA
Dr Joytishna Jit, CRC CARE / University of South Australia
Mr Mark Flick, CRC CARE
Professor Nanthi Bolan, University of Newcastle
Dr Peter Sanderson, University of Newcastle
Dr Yanju Liu, University of Newcastle
Dr Bhabananda Biswas, CRC CARE / University of South Australia
Dr Dawit Bekele, University of Newcastle

SUN
DA
YM
ON
DA
YTU
ESD
AY
WED
NES
DA
YTH
UR
SDA
Y
Hall L City Room 1 City Room 2 City Room 3 City Room 4 L1B Riverbank 8
8:00 – 9:00am Registration - Foyer M
9:00 – 10:30am
11:00 – 12:30pm
Workshop SM1. Add a new angle to well drilling, or make it horizontal
Workshop SM2. Almost everything you always wanted to know about ecological and human health risk assessment (but were afraid to ask)
Workshop SM3. All you need to know about the characterisation of non-aqueous phase liquid (NAPL) contaminated sites in 4 hours!
Workshop SM4. The miracle of molecular diagnostic tools (MBT) for bioremediation
Workshop SM5. Simulation of groundwater and surface water systems: Practical theory and applications
1:30 – 3:00pm
3:30 – 5:00pm
Workshop SA1. Risk based standards made easy
Workshop SA2. Optimising the investigation and remediation process from plume delineation through site closure using computer assisted design strategies
Workshop SA3. Fractured rock characterisation and remediation is difficult but not impossible, this is how you do it successfully!
Workshop SA4. Clean it up with bacteria – Bioremediation and MNA of chlorinated solvents: from source areas to dilute plumes
Workshop SA5. Risk communication – putting good practice principles into practice
5.15 – 5.40pm Welcome to Country and traditional smoking ceremony
5.40 – 6:00pm Official conference opening
6:00 – 6.45pm Commemorative Brian Robinson Lecture
6:45 – 7:30pm Welcome reception drinks
8:00 – 9:00am Registration - Foyer M
9:00 – 10:00am M11 - Plenary session: Tony Circelli, Chief Executive, SA Environment Protection Authority- From crisis to collaboration: the evolution of South Australia’s approach to managing legacy site contamination
10:30 – 12:15pm M21 - Recent advances in the PFAS Science
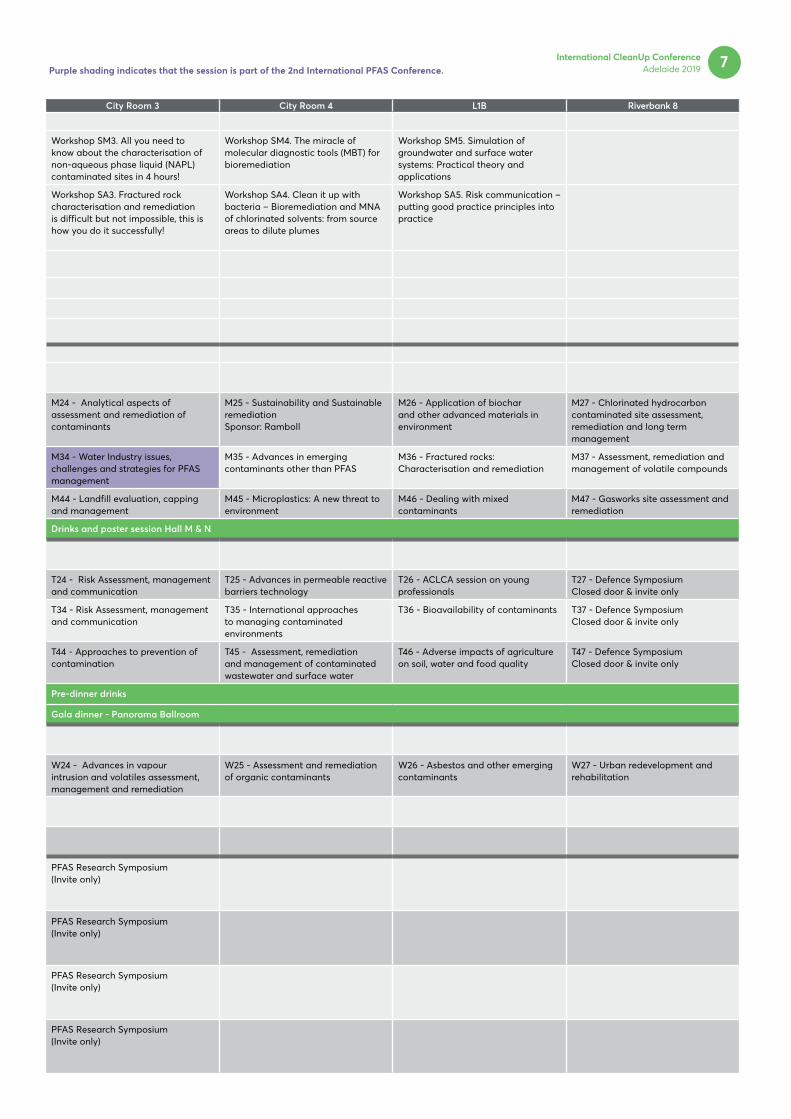
M22 - Advances in PFAS remediation M23 - National Remediation Framework M24 - Analytical aspects of assessment and remediation of contaminants
M25 - Sustainability and Sustainable remediationSponsor: Ramboll
M26 - Application of biochar and other advanced materials in environment
M27 - Chlorinated hydrocarbon contaminated site assessment, remediation and long term management
1:15 – 3:00pm M31 - International approaches to managing PFAS
M32 - Advances in PFAS remediation M33 - Advances in the measurement and management of ground gases
M34 - Water Industry issues, challenges and strategies for PFAS management
M35 - Advances in emerging contaminants other than PFAS
M36 - Fractured rocks: Characterisation and remediation
M37 - Assessment, remediation and management of volatile compounds
3:30 – 5:15pm M41 - Sampling, behaviour and characterisation of PFAS
M42 - Advances in PFAS remediation M43 - Green approaches to managing wastes
M44 - Landfill evaluation, capping and management
M45 - Microplastics: A new threat to environment
M46 - Dealing with mixed contaminants
M47 - Gasworks site assessment and remediation
5:15 – 6:15pm Drinks and poster session Hall M & N Drinks and poster session Hall M & N
9:00 – 10:00am T11 - Plenary session: Peter Nadebaum, Principal and Senior Technical Director – Environment, GHD – Emerging issues in dealing with contaminated sites in Australia
10:30 – 12:15pm T21 - PFAS risk assessment, management and mitigation
T22 - Legal responses to site contamination issues
T23 - Metals, metalloids and radionuclides T24 - Risk Assessment, management and communication
T25 - Advances in permeable reactive barriers technology
T26 - ACLCA session on young professionals
T27 - Defence SymposiumClosed door & invite only
1:15 – 3:00pm T31 - PFAS risk assessment, management and mitigation
T32 - Advances in nanotechnology in contamination assessment and remediation
T33 - LNAPL Natural source zone depletion T34 - Risk Assessment, management and communication
T35 - International approaches to managing contaminated environments
T36 - Bioavailability of contaminants T37 - Defence SymposiumClosed door & invite only
3:30 – 5:15pm T41 - PFAS toxicity, health risks, fate and transport
T42 - Petroleum hydrocarbon contaminated site assessment, remediation and management
T43 - Recent advances in site characterisation
T44 - Approaches to prevention of contamination
T45 - Assessment, remediation and management of contaminated wastewater and surface water
T46 - Adverse impacts of agriculture on soil, water and food quality
T47 - Defence SymposiumClosed door & invite only
6:30 – 7:00pm Pre-dinner drinks Pre-dinner drinks
7:00 - 11:00pm Gala dinner - Panorama Ballroom Gala dinner - Panorama Ballroom
9:00 – 10:00am W11 - Plenary session: Pushpam Kumar, Chief Environmental Economist, United Nations Environment – Nature-based solutions to climate change: evidence from Africa and Asia
10:30 – 12:15pm W21 - PFAS analysis and measurement W22 - Challenges with PFAS remediation and management
W23 - Innovative in-situ and ex-situ remediation technologies
W24 - Advances in vapour intrusion and volatiles assessment, management and remediation
W25 - Assessment and remediation of organic contaminants
W26 - Asbestos and other emerging contaminants
W27 - Urban redevelopment and rehabilitation
1:15 – 3:00pm W31 - Plenary session: Expert panel for ABC Radio National’s ‘Big Ideas’ - Trust and expert risk communication in the age of social media
3:30 – 5:15pm W41 - Plenary sessionUnsession and closing
9:00 – 10:30am
Technical Tour departing from
west entrance of Adelaide Convention Centre
(meet at 8:30am for a
9:00am departure)
Workshop TF1. Managing per- and polyfluoroalkyl substances (PFAS) at your site: Key technical and regulatory issues associated with PFAS
Workshop TM1. Understanding TPH for the management of contaminated sites
PFAS Research Symposium (Invite only)
11:00 – 12:30pm Workshop TF1. Managing per- and polyfluoroalkyl substances (PFAS) at your site: Key technical and regulatory issues associated with PFAS
Workshop TM1. Understanding TPH for the management of contaminated sites
PFAS Research Symposium (Invite only)
1:30 – 3:00pm Workshop TF1. Managing per- and polyfluoroalkyl substances (PFAS) at your site: Key technical and regulatory issues associated with PFAS
Workshop TA1. Understanding the vapor intrusion pathway
PFAS Research Symposium (Invite only)
3:30 – 5:00pm Workshop TF1. Managing per- and polyfluoroalkyl substances (PFAS) at your site: Key technical and regulatory issues associated with PFAS
Workshop TA1. Understanding the vapor intrusion pathway
PFAS Research Symposium (Invite only)
Program Overview6
Hall L City Room 1 City Room 2 City Room 3 City Room 4 L1B Riverbank 8
8:00 – 9:00am Registration - Foyer M
9:00 – 10:30am
11:00 – 12:30pm
Workshop SM1. Add a new angle to well drilling, or make it horizontal
Workshop SM2. Almost everything you always wanted to know about ecological and human health risk assessment (but were afraid to ask)
Workshop SM3. All you need to know about the characterisation of non-aqueous phase liquid (NAPL) contaminated sites in 4 hours!
Workshop SM4. The miracle of molecular diagnostic tools (MBT) for bioremediation
Workshop SM5. Simulation of groundwater and surface water systems: Practical theory and applications
1:30 – 3:00pm
3:30 – 5:00pm
Workshop SA1. Risk based standards made easy
Workshop SA2. Optimising the investigation and remediation process from plume delineation through site closure using computer assisted design strategies
Workshop SA3. Fractured rock characterisation and remediation is difficult but not impossible, this is how you do it successfully!
Workshop SA4. Clean it up with bacteria – Bioremediation and MNA of chlorinated solvents: from source areas to dilute plumes
Workshop SA5. Risk communication – putting good practice principles into practice
5.15 – 5.40pm Welcome to Country and traditional smoking ceremony
5.40 – 6:00pm Official conference opening
6:00 – 6.45pm Commemorative Brian Robinson Lecture
6:45 – 7:30pm Welcome reception drinks
8:00 – 9:00am Registration - Foyer M
9:00 – 10:00am M11 - Plenary session: Tony Circelli, Chief Executive, SA Environment Protection Authority- From crisis to collaboration: the evolution of South Australia’s approach to managing legacy site contamination
10:30 – 12:15pm M21 - Recent advances in the PFAS Science
M22 - Advances in PFAS remediation M23 - National Remediation Framework M24 - Analytical aspects of assessment and remediation of contaminants
M25 - Sustainability and Sustainable remediationSponsor: Ramboll
M26 - Application of biochar and other advanced materials in environment
M27 - Chlorinated hydrocarbon contaminated site assessment, remediation and long term management
1:15 – 3:00pm M31 - International approaches to managing PFAS
M32 - Advances in PFAS remediation M33 - Advances in the measurement and management of ground gases
M34 - Water Industry issues, challenges and strategies for PFAS management
M35 - Advances in emerging contaminants other than PFAS
M36 - Fractured rocks: Characterisation and remediation
M37 - Assessment, remediation and management of volatile compounds
3:30 – 5:15pm M41 - Sampling, behaviour and characterisation of PFAS
M42 - Advances in PFAS remediation M43 - Green approaches to managing wastes
M44 - Landfill evaluation, capping and management
M45 - Microplastics: A new threat to environment
M46 - Dealing with mixed contaminants
M47 - Gasworks site assessment and remediation
5:15 – 6:15pm Drinks and poster session Hall M & N Drinks and poster session Hall M & N
9:00 – 10:00am T11 - Plenary session: Peter Nadebaum, Principal and Senior Technical Director – Environment, GHD – Emerging issues in dealing with contaminated sites in Australia
10:30 – 12:15pm T21 - PFAS risk assessment, management and mitigation
T22 - Legal responses to site contamination issues
T23 - Metals, metalloids and radionuclides T24 - Risk Assessment, management and communication
T25 - Advances in permeable reactive barriers technology
T26 - ACLCA session on young professionals
T27 - Defence SymposiumClosed door & invite only
1:15 – 3:00pm T31 - PFAS risk assessment, management and mitigation
T32 - Advances in nanotechnology in contamination assessment and remediation
T33 - LNAPL Natural source zone depletion T34 - Risk Assessment, management and communication
T35 - International approaches to managing contaminated environments
T36 - Bioavailability of contaminants T37 - Defence SymposiumClosed door & invite only
3:30 – 5:15pm T41 - PFAS toxicity, health risks, fate and transport
T42 - Petroleum hydrocarbon contaminated site assessment, remediation and management
T43 - Recent advances in site characterisation
T44 - Approaches to prevention of contamination
T45 - Assessment, remediation and management of contaminated wastewater and surface water
T46 - Adverse impacts of agriculture on soil, water and food quality
T47 - Defence SymposiumClosed door & invite only
6:30 – 7:00pm Pre-dinner drinks Pre-dinner drinks
7:00 - 11:00pm Gala dinner - Panorama Ballroom Gala dinner - Panorama Ballroom
9:00 – 10:00am W11 - Plenary session: Pushpam Kumar, Chief Environmental Economist, United Nations Environment – Nature-based solutions to climate change: evidence from Africa and Asia
10:30 – 12:15pm W21 - PFAS analysis and measurement W22 - Challenges with PFAS remediation and management
W23 - Innovative in-situ and ex-situ remediation technologies
W24 - Advances in vapour intrusion and volatiles assessment, management and remediation
W25 - Assessment and remediation of organic contaminants
W26 - Asbestos and other emerging contaminants
W27 - Urban redevelopment and rehabilitation
1:15 – 3:00pm W31 - Plenary session: Expert panel for ABC Radio National’s ‘Big Ideas’ - Trust and expert risk communication in the age of social media
3:30 – 5:15pm W41 - Plenary sessionUnsession and closing
9:00 – 10:30am
Technical Tour departing from
west entrance of Adelaide Convention Centre
(meet at 8:30am for a
9:00am departure)
Workshop TF1. Managing per- and polyfluoroalkyl substances (PFAS) at your site: Key technical and regulatory issues associated with PFAS
Workshop TM1. Understanding TPH for the management of contaminated sites
PFAS Research Symposium (Invite only)
11:00 – 12:30pm Workshop TF1. Managing per- and polyfluoroalkyl substances (PFAS) at your site: Key technical and regulatory issues associated with PFAS
Workshop TM1. Understanding TPH for the management of contaminated sites
PFAS Research Symposium (Invite only)
1:30 – 3:00pm Workshop TF1. Managing per- and polyfluoroalkyl substances (PFAS) at your site: Key technical and regulatory issues associated with PFAS
Workshop TA1. Understanding the vapor intrusion pathway
PFAS Research Symposium (Invite only)
3:30 – 5:00pm Workshop TF1. Managing per- and polyfluoroalkyl substances (PFAS) at your site: Key technical and regulatory issues associated with PFAS
Workshop TA1. Understanding the vapor intrusion pathway
PFAS Research Symposium (Invite only)
Purple shading indicates that the session is part of the 2nd International PFAS Conference. International CleanUp Conference
Adelaide 2019 7

Time Hall L City Room 1 City Room 2 City Room 3 City Room 4 L1B Riverbank 8
8:00 - 9:00am 1:00 Registration - Foyer M
9:00 - 10:30am 1:30 Workshop SM1. Add a new angle to well drilling, or make it horizontal
Workshop SM2. Almost everything you always wanted to know about ecological and human health risk assessment (but were afraid to ask)
Workshop SM3. All you need to know about the characterisation of non-aqueous phase liquid (NAPL) contaminated sites in 4 hours!
Workshop SM4. The miracle of molecular diagnostic tools (MBT) for bioremediation
Workshop SM5. Simulation of groundwater and surface water systems: Practical theory and applications
10:30 - 11:00am 0:30 Morning tea Morning tea
11:00 - 12:30pm 1:30 Workshop SM1. Add a new angle to well drilling, or make it horizontal
Workshop SM2. Almost everything you always wanted to know about ecological and human health risk assessment (but were afraid to ask)
Workshop SM3. All you need to know about the characterisation of non-aqueous phase liquid (NAPL) contaminated sites in 4 hours!
Workshop SM4. The miracle of molecular diagnostic tools (MBT) for bioremediation
Workshop SM5. Simulation of groundwater and surface water systems: Practical theory and applications
12:30 - 1:30pm 1:00 Lunch Lunch
1:30 - 3:00pm 1:30 Workshop SA1. Risk based standards made easy
Workshop SA2. Optimising the investigation and remediation process from plume delineation through site closure using computer assisted design strategies
Workshop SA3. Fractured rock characterisation and remediation is difficult but not impossible, this is how you do it successfully!
Workshop SA4. Clean it up with bacteria – Bioremediation and MNA of chlorinated solvents: from source areas to dilute plumes
Workshop SA5. Risk communication – putting good practice principles into practice
3:00 - 3:30pm 0:30 Afternoon tea Lunch
3:30 - 5:00pm 1:30 Workshop SA1. Risk based standards made easy
Workshop SA2. Optimising the investigation and remediation process from plume delineation through site closure using computer assisted design strategies
Workshop SA3. Fractured rock characterisation and remediation is difficult but not impossible, this is how you do it successfully!
Workshop SA4. Clean it up with bacteria – Bioremediation and MNA of chlorinated solvents: from source areas to dilute plumes
Workshop SA5. Risk communication – putting good practice principles into practice
5:15 - 5:40pm 0:25 Welcome to Country and Kaurna smoking ceremony, led by Michael O’Brien
5:40 - 6:00pm 0:20 Conference opening and remarks by His Excellency the Honourable Hieu Van Le AC, Governor of South Australia, Mr Sam Duluk MP, Member for Waite, representing the SA Minister for the Environment and Water, and Prof Ravi Naidu, CRC CARE CEO and Chair of the CleanUp Organising Committee
6:00 - 6:45pm 0:45 Brian Robinson memorial lecture presented by the Hon Zuraida Kamaruddin MP, Minister of Housing and Local Government, Malaysia
6:45 - 7:30pm 0:45 Welcome Reception Drinks Exhibition Area - Hall M & N
SUN
DA
Y, 8
SEP
TEM
BER
FULL
DA
YDetailed Program8

International CleanUp Conference Adelaide 2019 9
Time Hall L City Room 1 City Room 2 City Room 3 City Room 4 L1B Riverbank 8
8:00 - 9:00am 1:00 Registration - Foyer M
9:00 - 10:30am 1:30 Workshop SM1. Add a new angle to well drilling, or make it horizontal
Workshop SM2. Almost everything you always wanted to know about ecological and human health risk assessment (but were afraid to ask)
Workshop SM3. All you need to know about the characterisation of non-aqueous phase liquid (NAPL) contaminated sites in 4 hours!
Workshop SM4. The miracle of molecular diagnostic tools (MBT) for bioremediation
Workshop SM5. Simulation of groundwater and surface water systems: Practical theory and applications
10:30 - 11:00am 0:30 Morning tea Morning tea
11:00 - 12:30pm 1:30 Workshop SM1. Add a new angle to well drilling, or make it horizontal
Workshop SM2. Almost everything you always wanted to know about ecological and human health risk assessment (but were afraid to ask)
Workshop SM3. All you need to know about the characterisation of non-aqueous phase liquid (NAPL) contaminated sites in 4 hours!
Workshop SM4. The miracle of molecular diagnostic tools (MBT) for bioremediation
Workshop SM5. Simulation of groundwater and surface water systems: Practical theory and applications
12:30 - 1:30pm 1:00 Lunch Lunch
1:30 - 3:00pm 1:30 Workshop SA1. Risk based standards made easy
Workshop SA2. Optimising the investigation and remediation process from plume delineation through site closure using computer assisted design strategies
Workshop SA3. Fractured rock characterisation and remediation is difficult but not impossible, this is how you do it successfully!
Workshop SA4. Clean it up with bacteria – Bioremediation and MNA of chlorinated solvents: from source areas to dilute plumes
Workshop SA5. Risk communication – putting good practice principles into practice
3:00 - 3:30pm 0:30 Afternoon tea Lunch
3:30 - 5:00pm 1:30 Workshop SA1. Risk based standards made easy
Workshop SA2. Optimising the investigation and remediation process from plume delineation through site closure using computer assisted design strategies
Workshop SA3. Fractured rock characterisation and remediation is difficult but not impossible, this is how you do it successfully!
Workshop SA4. Clean it up with bacteria – Bioremediation and MNA of chlorinated solvents: from source areas to dilute plumes
Workshop SA5. Risk communication – putting good practice principles into practice
5:15 - 5:40pm 0:25 Welcome to Country and Kaurna smoking ceremony, led by Michael O’Brien
5:40 - 6:00pm 0:20 Conference opening and remarks by His Excellency the Honourable Hieu Van Le AC, Governor of South Australia, Mr Sam Duluk MP, Member for Waite, representing the SA Minister for the Environment and Water, and Prof Ravi Naidu, CRC CARE CEO and Chair of the CleanUp Organising Committee
6:00 - 6:45pm 0:45 Brian Robinson memorial lecture presented by the Hon Zuraida Kamaruddin MP, Minister of Housing and Local Government, Malaysia
6:45 - 7:30pm 0:45 Welcome Reception Drinks Exhibition Area - Hall M & N

International CleanUp Conference Adelaide 201910
Start Finish Duration8:00am 9:00am 1:00 Registration 9:00am 10:00am 1:00 M11: PLENARY SESSION 9:00am 9:15am 0:15 Welcome and announcements 9:15am 10:00am 0:45 FROM CRISIS TO COLLABORATION: THE EVOLUTION OF SOUTH AUSTRALIA’S APPROACH TO MANAGING LEGACY SITE CONTAMINATION, Tony Circelli, South Australian Environment Protection Authority, Australia
Hall L City Room 1 City Room 2 City Room 3 City Room 4 L1B Riverbank 8
Times 10:30am - 12:15pm Duration: 1:45
ID M21 - Recent advances in the PFAS Science Chair: Ryan Wymore
ID M22 - Advances in PFAS remediation Chair: Dan Bryant
ID M23 - National Remediation Framework Chair: Arminda Ryan
ID M24 - Analytical aspects of assessment and remediation of contaminants Chair: Danny Slee
ID M25 - Sustainability and Sustainable remediationSponsor: Ramboll Chair: Annette Nolan
ID M26 - Application of biochar and other advanced materials in environment Chair: Kenneth Sajwan
ID M27 - Chlorinated hydrocarbon contaminated site assessment, remediation and long term management Chair: Heather Rectanus
10:30 - 10:45am
0:15 112 SERDP/ESTCP RESEARCH ON EMERGING CONTAMINANTS, Hans Stroo, Stroo Consulting, United States
399 IN-SITU PFAS REMEDIATION USING COLLOIDAL ACTIVATED CARBON, Grant Carey, Porewater Solutions, Canada
419 THE NATIONAL REMEDIATION FRAMEWORK FOR THE REMEDIATION AND MANAGEMENT OF CONTAMINATED SITES IN AUSTRALIA, Bruce Kennedy, CRC CARE, Australia
383 WHEN WILL A LEACHATE SAMPLE NEVER FAIL?, Ross McFarland, AECOM, Australia
372 DEFINING SUSTAINABILITY AND RESILIENCY IN REMEDIATION DESIGN: NOT AN “AND” VERSUS “OR” PROPOSITION, Scott Warner, Ramboll, United States
137 ENHANCED REMOVAL OF ANTIBIOTICS AND HERBICIDES FROM AQUEOUS MEDIA USING WOOD BASED COLLOIDAL BIOCHAR, Meththika Vithanage, University of Sri Jayewardenepura, Sri Lanka
336 TCE BEHAVIOUR IN THE ADELAIDE PLAINS, Mark Chapman, AECOM, Australia
10:45 - 11:00am
0:15 cont.. cont.. cont.. cont.. cont.. cont.. cont..
11:00 - 11:15am
0:15 387 PFAS RESEARCH AND DEVELOPMENT: OVERVIEW OF KEY ISSUES AND TECHNOLOGIES, Charles Newell, GSI Environmental, United States
365 OCCURRENCE, DISTRIBUTION, ANALYSIS, TOXICOLOGY AND REMEDIATION OF PERFLUORINATED POLLUTANTS IN GERMANY, Volker Birke, University of Wismar, Germany
185 THE NATIONAL REMEDIATION FRAMEWORK - IMPLICATIONS, Peter Nadebaum, GHD, Australia
116 VARIABILITY AND UNCERTAINTY ASSOCIATED WITH SAMPLING, ANALYSIS, AND RISK ASSESSMENT, Naji Akladiss, ITRC, United States
427 SUSTAINABLE ENERGY GENERATION BY UTILISING ORGANIC WASTE, Jayant Keskar, Enpro Envirotech, Australia
412 WASTES TO RESOURCES: BIOCHAR APPLICATION MODULATES SOIL HEALTH AND FERTILITY, Nanthi Bolan, University of Newcastle, Australia
181 MULTI-STAGE FULL SCALE REMEDIATION OF HEAVILY IMPACTED VICTORIAN CHLORINATED SOLVENT SITE, Lyndon Bell, JBS&G, Australia
11:15 - 11:30am
0:15 cont.. 180 FULL SCALE TREATMENT OF PFAS CONTAMINATED SOIL IN SWEDEN, Helena Hinrichsen, Envytech, Sweden
cont.. cont.. cont.. 352 ZIRCONIUM-MODIFIED BIOCHAR FOR THE REMOVAL OF ARSENIC(V) FROM AQUEOUS SOLUTION, Md. Aminur Rahman, University of Newcastle, Australia
cont..
11:30 - 11:45am
0:15 428 STATE OF THE SCIENCE OF THE FATE AND TRANSPORT OF PFAS, Ian Cousins, Stockholm University, Sweden
374 THE EFFECT OF PH AND IONIC STRENGTH ON SORPTION OF PFOS USING SOILS WITH DIFFERENT TOC, Yanju Liu, University of Newcastle, Australia
508 PANEL DISCUSSION, Bruce Kennedy, CRC CARE, Australia
133 PERFORMANCE OF ANALYTICAL METHODS USED FOR MEASUREMENT OF ELEMENTS IN ENVIRONMENTAL SAMPLES - OUTCOMES FROM PROFICIENCY TESTING STUDIES, LUMINITA ANTIN, National Measurement Institute, Australia
141 DEBUNKING MYTHS ABOUT SUSTAINABLE REMEDIATION, Gavin Kerrison, Shell Global Solutions, Australia
174 PRODUCTION AND CHARACTERISATION OF NUTRIENT-ENRICHED BIOCHAR, Md Zahangir Hossain, University of Newcastle, Australia
131 SOURCE ZONE TREATMENT USING ENHANCED IN-SITU BIOREMEDIATION FOR CHLORINATED ETHENES, Paul Nicholson, Geosyntec, Canada
11:45am - 12:00pm
0:15 cont.. 253 TREATING PFAS IMPACTED GROUNDWATER UNDER A NON-FEDERAL REGULATIONS - A CASE STUDY, Andrew Thomas, Enviropacific Services, Australia
cont.. 439 PFAS ANALYSIS BY LC-HRMS, Eddie Wang, Symbio Laboratories, Australia
200 A SUSTAINABLE ALTERNATIVE TO EXCAVATION OF PFAS SOURCE AREAS, Ian Ross, Arcadis, United Kingdom
243 PERFLUOROOCTYL SULFONATE (PFOS) ADSORPTION BY MODIFIED SAWDUST, REDMUD, AND RED MUD-SAWDUST COMPOSITE MATERIALS FROM AQUEOUS SOLUTION, Masud Hassan, University of Newcastle, Australia
319 INTEGRATED SITE ASSESSMENT TO INFORM EISB REMEDIATION OF CHLORINATED SOLVENTS IN A SEDIMENTARY AQUIFER, Andrew Labbett, CDM Smith, Australia
12:00 - 12:15pm
0:15 428 PFAS REMEDIATION: CHALLENGES AND OPTIONS, Cheng Fang, University of Newcastle, Australia
155 INNOVATIVE WASTE MINIMISATION DURING PFAS CONTAMINATED WATER REMEDIATION, Mark Kuffer, Emerging Compounds Treatment Technologies, United States
cont.. 343 THE CHANGES IN PB SPECIATION DURING PB BIOAVAILABILITY ASSESSMENTS, Kenny Yan, University of Newcastle, Australia
262 PHYTHOMAS TO BIOENERGY: A PROMISING WAY TO UTILIZE DIFFERENT EFFLUENTS FOR SUSTAINABLE ENERGY PRODUCTION, Sonia Shilpi, University of Newcastle, Australia
108 HIERARCHICAL IMMOBILIZATION OF NZVI ONTO ELECTROSPUN PVA-PAA NANOFIBER MEMBRANE FOR GROUNDWATER REMEDIATION, Jiawei Ren, University of Technology Sydney, Australia
179 USE OF MULTIPLE LINES OF EVIDENCE TO RESOLVE THE CSM FOR A COMPLEX GROUNDWATER TCE DISTRIBUTION, Rory Lane, BlueSphere Environmental, Australia
12:15 - 1:15pm
1:00 Lunch Lunch
MO
ND
AY,
9 S
EPTE
MB
ERM
OR
NIN
G

International CleanUp Conference Adelaide 2019 11
Hall L City Room 1 City Room 2 City Room 3 City Room 4 L1B Riverbank 8
Times 10:30am - 12:15pm Duration: 1:45
ID M21 - Recent advances in the PFAS Science Chair: Ryan Wymore
ID M22 - Advances in PFAS remediation Chair: Dan Bryant
ID M23 - National Remediation Framework Chair: Arminda Ryan
ID M24 - Analytical aspects of assessment and remediation of contaminants Chair: Danny Slee
ID M25 - Sustainability and Sustainable remediationSponsor: Ramboll Chair: Annette Nolan
ID M26 - Application of biochar and other advanced materials in environment Chair: Kenneth Sajwan
ID M27 - Chlorinated hydrocarbon contaminated site assessment, remediation and long term management Chair: Heather Rectanus
10:30 - 10:45am
0:15 112 SERDP/ESTCP RESEARCH ON EMERGING CONTAMINANTS, Hans Stroo, Stroo Consulting, United States
399 IN-SITU PFAS REMEDIATION USING COLLOIDAL ACTIVATED CARBON, Grant Carey, Porewater Solutions, Canada
419 THE NATIONAL REMEDIATION FRAMEWORK FOR THE REMEDIATION AND MANAGEMENT OF CONTAMINATED SITES IN AUSTRALIA, Bruce Kennedy, CRC CARE, Australia
383 WHEN WILL A LEACHATE SAMPLE NEVER FAIL?, Ross McFarland, AECOM, Australia
372 DEFINING SUSTAINABILITY AND RESILIENCY IN REMEDIATION DESIGN: NOT AN “AND” VERSUS “OR” PROPOSITION, Scott Warner, Ramboll, United States
137 ENHANCED REMOVAL OF ANTIBIOTICS AND HERBICIDES FROM AQUEOUS MEDIA USING WOOD BASED COLLOIDAL BIOCHAR, Meththika Vithanage, University of Sri Jayewardenepura, Sri Lanka
336 TCE BEHAVIOUR IN THE ADELAIDE PLAINS, Mark Chapman, AECOM, Australia
10:45 - 11:00am
0:15 cont.. cont.. cont.. cont.. cont.. cont.. cont..
11:00 - 11:15am
0:15 387 PFAS RESEARCH AND DEVELOPMENT: OVERVIEW OF KEY ISSUES AND TECHNOLOGIES, Charles Newell, GSI Environmental, United States
365 OCCURRENCE, DISTRIBUTION, ANALYSIS, TOXICOLOGY AND REMEDIATION OF PERFLUORINATED POLLUTANTS IN GERMANY, Volker Birke, University of Wismar, Germany
185 THE NATIONAL REMEDIATION FRAMEWORK - IMPLICATIONS, Peter Nadebaum, GHD, Australia
116 VARIABILITY AND UNCERTAINTY ASSOCIATED WITH SAMPLING, ANALYSIS, AND RISK ASSESSMENT, Naji Akladiss, ITRC, United States
427 SUSTAINABLE ENERGY GENERATION BY UTILISING ORGANIC WASTE, Jayant Keskar, Enpro Envirotech, Australia
412 WASTES TO RESOURCES: BIOCHAR APPLICATION MODULATES SOIL HEALTH AND FERTILITY, Nanthi Bolan, University of Newcastle, Australia
181 MULTI-STAGE FULL SCALE REMEDIATION OF HEAVILY IMPACTED VICTORIAN CHLORINATED SOLVENT SITE, Lyndon Bell, JBS&G, Australia
11:15 - 11:30am
0:15 cont.. 180 FULL SCALE TREATMENT OF PFAS CONTAMINATED SOIL IN SWEDEN, Helena Hinrichsen, Envytech, Sweden
cont.. cont.. cont.. 352 ZIRCONIUM-MODIFIED BIOCHAR FOR THE REMOVAL OF ARSENIC(V) FROM AQUEOUS SOLUTION, Md. Aminur Rahman, University of Newcastle, Australia
cont..
11:30 - 11:45am
0:15 428 STATE OF THE SCIENCE OF THE FATE AND TRANSPORT OF PFAS, Ian Cousins, Stockholm University, Sweden
374 THE EFFECT OF PH AND IONIC STRENGTH ON SORPTION OF PFOS USING SOILS WITH DIFFERENT TOC, Yanju Liu, University of Newcastle, Australia
508 PANEL DISCUSSION, Bruce Kennedy, CRC CARE, Australia
133 PERFORMANCE OF ANALYTICAL METHODS USED FOR MEASUREMENT OF ELEMENTS IN ENVIRONMENTAL SAMPLES - OUTCOMES FROM PROFICIENCY TESTING STUDIES, LUMINITA ANTIN, National Measurement Institute, Australia
141 DEBUNKING MYTHS ABOUT SUSTAINABLE REMEDIATION, Gavin Kerrison, Shell Global Solutions, Australia
174 PRODUCTION AND CHARACTERISATION OF NUTRIENT-ENRICHED BIOCHAR, Md Zahangir Hossain, University of Newcastle, Australia
131 SOURCE ZONE TREATMENT USING ENHANCED IN-SITU BIOREMEDIATION FOR CHLORINATED ETHENES, Paul Nicholson, Geosyntec, Canada
11:45am - 12:00pm
0:15 cont.. 253 TREATING PFAS IMPACTED GROUNDWATER UNDER A NON-FEDERAL REGULATIONS - A CASE STUDY, Andrew Thomas, Enviropacific Services, Australia
cont.. 439 PFAS ANALYSIS BY LC-HRMS, Eddie Wang, Symbio Laboratories, Australia
200 A SUSTAINABLE ALTERNATIVE TO EXCAVATION OF PFAS SOURCE AREAS, Ian Ross, Arcadis, United Kingdom
243 PERFLUOROOCTYL SULFONATE (PFOS) ADSORPTION BY MODIFIED SAWDUST, REDMUD, AND RED MUD-SAWDUST COMPOSITE MATERIALS FROM AQUEOUS SOLUTION, Masud Hassan, University of Newcastle, Australia
319 INTEGRATED SITE ASSESSMENT TO INFORM EISB REMEDIATION OF CHLORINATED SOLVENTS IN A SEDIMENTARY AQUIFER, Andrew Labbett, CDM Smith, Australia
12:00 - 12:15pm
0:15 428 PFAS REMEDIATION: CHALLENGES AND OPTIONS, Cheng Fang, University of Newcastle, Australia
155 INNOVATIVE WASTE MINIMISATION DURING PFAS CONTAMINATED WATER REMEDIATION, Mark Kuffer, Emerging Compounds Treatment Technologies, United States
cont.. 343 THE CHANGES IN PB SPECIATION DURING PB BIOAVAILABILITY ASSESSMENTS, Kenny Yan, University of Newcastle, Australia
262 PHYTHOMAS TO BIOENERGY: A PROMISING WAY TO UTILIZE DIFFERENT EFFLUENTS FOR SUSTAINABLE ENERGY PRODUCTION, Sonia Shilpi, University of Newcastle, Australia
108 HIERARCHICAL IMMOBILIZATION OF NZVI ONTO ELECTROSPUN PVA-PAA NANOFIBER MEMBRANE FOR GROUNDWATER REMEDIATION, Jiawei Ren, University of Technology Sydney, Australia
179 USE OF MULTIPLE LINES OF EVIDENCE TO RESOLVE THE CSM FOR A COMPLEX GROUNDWATER TCE DISTRIBUTION, Rory Lane, BlueSphere Environmental, Australia
12:15 - 1:15pm
1:00 Lunch Lunch
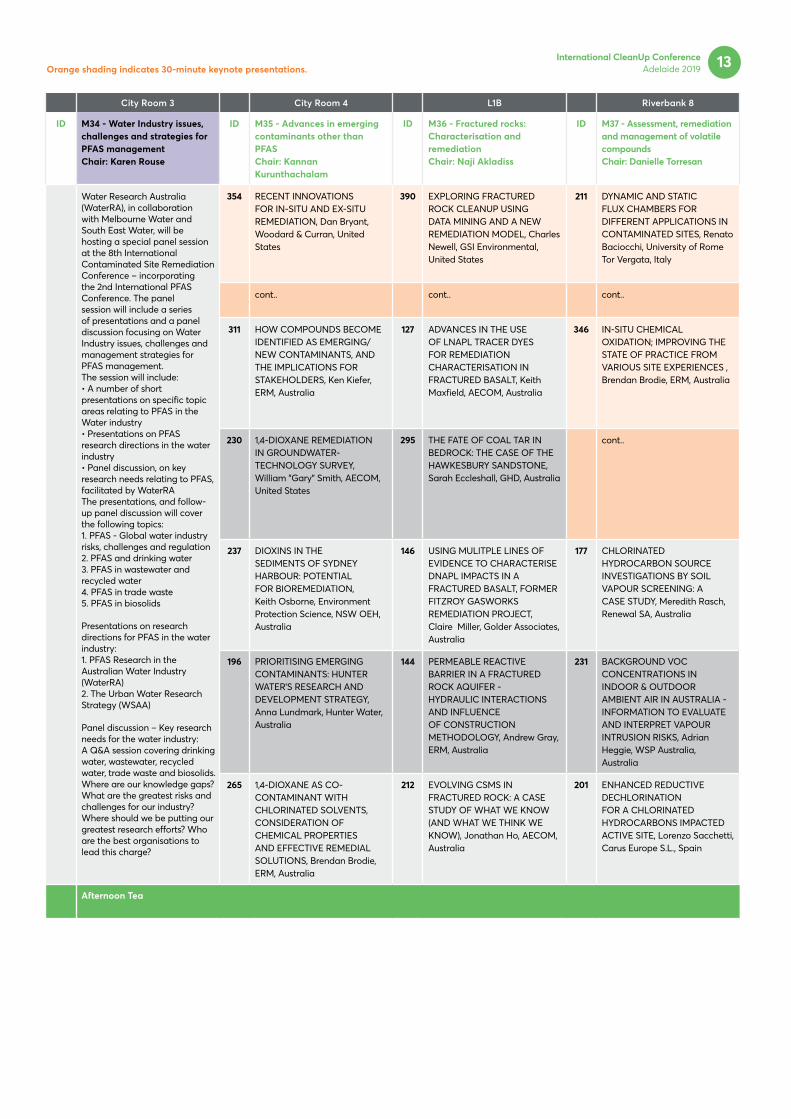
Orange shading indicates 30-minute keynote presentations.

International CleanUp Conference Adelaide 201912
Hall L City Room 1 City Room 2 City Room 3 City Room 4 L1B Riverbank 8
Times 1:15 - 3:00pm Duration: 1:45
ID M31 - International approaches to managing PFASChair: Rebecca Hughes
ID M32 - Advances in PFAS remediationChair: Nanthi Bolan
ID M33 - Advances in the measurement and management of ground gases Chair: Dan Ombalski
ID M34 - Water Industry issues, challenges and strategies for PFAS management Chair: Karen Rouse
ID M35 - Advances in emerging contaminants other than PFAS Chair: Kannan Kurunthachalam
ID M36 - Fractured rocks: Characterisation and remediation Chair: Naji Akladiss
ID M37 - Assessment, remediation and management of volatile compounds Chair: Danielle Torresan
1:15 - 1:30pm
0:15 331 PFOS, PFOA AND OTHER PFAS: A FOCUS ON CANADIAN GUIDELINES AND GUIDANCE, Darcy Longpre, Health Canada, Canada
348 PER- AND POLYFLUOROALKYL SUBSTANCES AND IN SITU MICROBIAL POPULATIONS INTERACTIONS AT A LEGACY FIREFIGHTING TRAINING AREA?, Denis O'Carroll, UNSW, Australia
366 METHANE DETECTION EQUIVALENCY AND WHY METHANE MATTERS IN THE REMEDIATION FIELD, Ona Papageorgiou, NYSDEC, United States
Water Research Australia (WaterRA), in collaboration with Melbourne Water and South East Water, will be hosting a special panel session at the 8th International Contaminated Site Remediation Conference – incorporating the 2nd International PFAS Conference. The panel session will include a series of presentations and a panel discussion focusing on Water Industry issues, challenges and management strategies for PFAS management.The session will include:• A number of short presentations on specific topic areas relating to PFAS in the Water industry• Presentations on PFAS research directions in the water industry • Panel discussion, on key research needs relating to PFAS, facilitated by WaterRA The presentations, and follow-up panel discussion will cover the following topics:1. PFAS - Global water industry risks, challenges and regulation2. PFAS and drinking water3. PFAS in wastewater and recycled water4. PFAS in trade waste5. PFAS in biosolids
Presentations on research directions for PFAS in the water industry:1. PFAS Research in the Australian Water Industry (WaterRA)2. The Urban Water Research Strategy (WSAA)
Panel discussion – Key research needs for the water industry:A Q&A session covering drinking water, wastewater, recycled water, trade waste and biosolids. Where are our knowledge gaps? What are the greatest risks and challenges for our industry? Where should we be putting our greatest research efforts? Who are the best organisations to lead this charge?
354 RECENT INNOVATIONS FOR IN-SITU AND EX-SITU REMEDIATION, Dan Bryant, Woodard & Curran, United States
390 EXPLORING FRACTURED ROCK CLEANUP USING DATA MINING AND A NEW REMEDIATION MODEL, Charles Newell, GSI Environmental, United States
211 DYNAMIC AND STATIC FLUX CHAMBERS FOR DIFFERENT APPLICATIONS IN CONTAMINATED SITES, Renato Baciocchi, University of Rome Tor Vergata, Italy
1:30 - 1:45pm
0:15 cont.. cont.. cont.. cont.. cont.. cont..
1:45 - 2:00pm
0:15 402 THE EVOLUTION AND BASIS OF PFAS GUIDELINES IN THE NETHERLANDS, THEIR CONSEQUENCES AND A REFLECTION WITH INTERNATIONAL GUIDANCE, Tessa Pancras, Arcadis Nederland B.V. , Netherlands
140 BIOTRANSFORMATION OF PER- AND POLY- FLUOROALKYL SUBSTANCES IN SOIL USING ENHANCED BIOREMEDIATION METHODS, John Stevanoni, Liberty Industrial, Australia
213 SOIL GAS DATA UTILIZATION: ITALIAN GUIDELINES AND THE RISK-NET 3.1 PRO HHRA SOFTWARE, Alessandro Girelli, Industria Ambiente srl, Italy
311 HOW COMPOUNDS BECOME IDENTIFIED AS EMERGING/NEW CONTAMINANTS, AND THE IMPLICATIONS FOR STAKEHOLDERS, Ken Kiefer, ERM, Australia
127 ADVANCES IN THE USE OF LNAPL TRACER DYES FOR REMEDIATION CHARACTERISATION IN FRACTURED BASALT, Keith Maxfield, AECOM, Australia
346 IN-SITU CHEMICAL OXIDATION; IMPROVING THE STATE OF PRACTICE FROM VARIOUS SITE EXPERIENCES , Brendan Brodie, ERM, Australia
2:00 - 2:15pm
0:15 cont.. 330 EVALUATING THE POTENTIAL USE OF FLURO-SORB® 100 FOR PFAS IN-SITU CONTAINMENT: A LABORATORY SCALE STUDY, Antonios Evangelos Alvertos, The University of Texas at Austin, United States
cont.. 230 1,4-DIOXANE REMEDIATION IN GROUNDWATER-TECHNOLOGY SURVEY, William "Gary" Smith, AECOM, United States
295 THE FATE OF COAL TAR IN BEDROCK: THE CASE OF THE HAWKESBURY SANDSTONE, Sarah Eccleshall, GHD, Australia
cont..
2:15 - 2:30pm
0:15 332 POLICY ASPECTS OF MANAGING PFAS - CASE FINLAND, Jussi Reinikainen, Finnish Environment Institute, Finland
286 A LOW-WASTE ELECTROCHEMICAL PROCESS FOR REMOVING PFAS FROM WATER TO NON-DETECT LEVELS, Brent Davey, Monarc Environmental, Australia
379 DIAGNOSTIC TOOL FOR METHANE SOIL GAS EMISSION AT AGED HYDROCARBON FUEL CONTAMINATED SITES, Dawit Bekele, University of Newcastle, Australia
237 DIOXINS IN THE SEDIMENTS OF SYDNEY HARBOUR: POTENTIAL FOR BIOREMEDIATION, Keith Osborne, Environment Protection Science, NSW OEH, Australia
146 USING MULITPLE LINES OF EVIDENCE TO CHARACTERISE DNAPL IMPACTS IN A FRACTURED BASALT, FORMER FITZROY GASWORKS REMEDIATION PROJECT, Claire Miller, Golder Associates, Australia
177 CHLORINATED HYDROCARBON SOURCE INVESTIGATIONS BY SOIL VAPOUR SCREENING: A CASE STUDY, Meredith Rasch, Renewal SA, Australia
2:30 - 2:45pm
0:15 310 THE EVOLUTION OF GLOBAL REGULATION FOR PER- AND POLY-FLUORINATED ALKYL SUBSTANCES, Ken Kiefer, ERM, Australia
325 LARGE SCALE PFAS REMEDIATION PROGRESS AT RAAF BASE WILLIAMTOWN, NSW, AUSTRALIA, Paul McCabe, AECOM, Australia
284 APPROACHES TO MODELLING VAPOUR INTRUSION IN WET BASEMENT CONSTRUCTION SCENARIOS, Victoria Lazenby, Arcadis Australia Pacific, Australia
196 PRIORITISING EMERGING CONTAMINANTS: HUNTER WATER’S RESEARCH AND DEVELOPMENT STRATEGY, Anna Lundmark, Hunter Water, Australia
144 PERMEABLE REACTIVE BARRIER IN A FRACTURED ROCK AQUIFER - HYDRAULIC INTERACTIONS AND INFLUENCE OF CONSTRUCTION METHODOLOGY, Andrew Gray, ERM, Australia
231 BACKGROUND VOC CONCENTRATIONS IN INDOOR & OUTDOOR AMBIENT AIR IN AUSTRALIA - INFORMATION TO EVALUATE AND INTERPRET VAPOUR INTRUSION RISKS, Adrian Heggie, WSP Australia, Australia
2:45 - 3:00pm
0:15 430 PFAS IN SOIL AND GROUNDWATER- GUIDANCE FOR THE ASSESSMENT AND REMEDIATION MEASURES IN GERMANY, Joerg Frauenstein, German Environment Agency, Germany
111 VEG TECHNOLOGY FOR EX-SITU THERMAL DESORPTION OF POLY- AND PERFLUOROALKYL SUBSTANCES, Mehrdad Javaherian, Endpoint Consulting, United States
440 MULTI-DIMENSIONAL VAPOUR MODELING FOR ASSESSING VAPOUR RISK AT HYDROCARBON CONTAMINATED SITES, Aravind Unnithan, University of Newcastle, Australia
265 1,4-DIOXANE AS CO-CONTAMINANT WITH CHLORINATED SOLVENTS, CONSIDERATION OF CHEMICAL PROPERTIES AND EFFECTIVE REMEDIAL SOLUTIONS, Brendan Brodie, ERM, Australia
212 EVOLVING CSMS IN FRACTURED ROCK: A CASE STUDY OF WHAT WE KNOW (AND WHAT WE THINK WE KNOW), Jonathan Ho, AECOM, Australia
201 ENHANCED REDUCTIVE DECHLORINATION FOR A CHLORINATED HYDROCARBONS IMPACTED ACTIVE SITE, Lorenzo Sacchetti, Carus Europe S.L., Spain
3:00 - 3:30pm
0:30 Afternoon Tea Afternoon Tea
MO
ND
AY,
9 S
EPTE
MB
ERA
FTER
NO
ON
International CleanUp Conference Adelaide 2019 13
Hall L City Room 1 City Room 2 City Room 3 City Room 4 L1B Riverbank 8
Times 1:15 - 3:00pm Duration: 1:45
ID M31 - International approaches to managing PFASChair: Rebecca Hughes
ID M32 - Advances in PFAS remediationChair: Nanthi Bolan
ID M33 - Advances in the measurement and management of ground gases Chair: Dan Ombalski
ID M34 - Water Industry issues, challenges and strategies for PFAS management Chair: Karen Rouse
ID M35 - Advances in emerging contaminants other than PFAS Chair: Kannan Kurunthachalam
ID M36 - Fractured rocks: Characterisation and remediation Chair: Naji Akladiss
ID M37 - Assessment, remediation and management of volatile compounds Chair: Danielle Torresan
1:15 - 1:30pm
0:15 331 PFOS, PFOA AND OTHER PFAS: A FOCUS ON CANADIAN GUIDELINES AND GUIDANCE, Darcy Longpre, Health Canada, Canada
348 PER- AND POLYFLUOROALKYL SUBSTANCES AND IN SITU MICROBIAL POPULATIONS INTERACTIONS AT A LEGACY FIREFIGHTING TRAINING AREA?, Denis O'Carroll, UNSW, Australia
366 METHANE DETECTION EQUIVALENCY AND WHY METHANE MATTERS IN THE REMEDIATION FIELD, Ona Papageorgiou, NYSDEC, United States
Water Research Australia (WaterRA), in collaboration with Melbourne Water and South East Water, will be hosting a special panel session at the 8th International Contaminated Site Remediation Conference – incorporating the 2nd International PFAS Conference. The panel session will include a series of presentations and a panel discussion focusing on Water Industry issues, challenges and management strategies for PFAS management.The session will include:• A number of short presentations on specific topic areas relating to PFAS in the Water industry• Presentations on PFAS research directions in the water industry • Panel discussion, on key research needs relating to PFAS, facilitated by WaterRA The presentations, and follow-up panel discussion will cover the following topics:1. PFAS - Global water industry risks, challenges and regulation2. PFAS and drinking water3. PFAS in wastewater and recycled water4. PFAS in trade waste5. PFAS in biosolids
Presentations on research directions for PFAS in the water industry:1. PFAS Research in the Australian Water Industry (WaterRA)2. The Urban Water Research Strategy (WSAA)
Panel discussion – Key research needs for the water industry:A Q&A session covering drinking water, wastewater, recycled water, trade waste and biosolids. Where are our knowledge gaps? What are the greatest risks and challenges for our industry? Where should we be putting our greatest research efforts? Who are the best organisations to lead this charge?
354 RECENT INNOVATIONS FOR IN-SITU AND EX-SITU REMEDIATION, Dan Bryant, Woodard & Curran, United States
390 EXPLORING FRACTURED ROCK CLEANUP USING DATA MINING AND A NEW REMEDIATION MODEL, Charles Newell, GSI Environmental, United States
211 DYNAMIC AND STATIC FLUX CHAMBERS FOR DIFFERENT APPLICATIONS IN CONTAMINATED SITES, Renato Baciocchi, University of Rome Tor Vergata, Italy
1:30 - 1:45pm
0:15 cont.. cont.. cont.. cont.. cont.. cont..
1:45 - 2:00pm
0:15 402 THE EVOLUTION AND BASIS OF PFAS GUIDELINES IN THE NETHERLANDS, THEIR CONSEQUENCES AND A REFLECTION WITH INTERNATIONAL GUIDANCE, Tessa Pancras, Arcadis Nederland B.V. , Netherlands
140 BIOTRANSFORMATION OF PER- AND POLY- FLUOROALKYL SUBSTANCES IN SOIL USING ENHANCED BIOREMEDIATION METHODS, John Stevanoni, Liberty Industrial, Australia
213 SOIL GAS DATA UTILIZATION: ITALIAN GUIDELINES AND THE RISK-NET 3.1 PRO HHRA SOFTWARE, Alessandro Girelli, Industria Ambiente srl, Italy
311 HOW COMPOUNDS BECOME IDENTIFIED AS EMERGING/NEW CONTAMINANTS, AND THE IMPLICATIONS FOR STAKEHOLDERS, Ken Kiefer, ERM, Australia
127 ADVANCES IN THE USE OF LNAPL TRACER DYES FOR REMEDIATION CHARACTERISATION IN FRACTURED BASALT, Keith Maxfield, AECOM, Australia
346 IN-SITU CHEMICAL OXIDATION; IMPROVING THE STATE OF PRACTICE FROM VARIOUS SITE EXPERIENCES , Brendan Brodie, ERM, Australia
2:00 - 2:15pm
0:15 cont.. 330 EVALUATING THE POTENTIAL USE OF FLURO-SORB® 100 FOR PFAS IN-SITU CONTAINMENT: A LABORATORY SCALE STUDY, Antonios Evangelos Alvertos, The University of Texas at Austin, United States
cont.. 230 1,4-DIOXANE REMEDIATION IN GROUNDWATER-TECHNOLOGY SURVEY, William "Gary" Smith, AECOM, United States
295 THE FATE OF COAL TAR IN BEDROCK: THE CASE OF THE HAWKESBURY SANDSTONE, Sarah Eccleshall, GHD, Australia
cont..
2:15 - 2:30pm
0:15 332 POLICY ASPECTS OF MANAGING PFAS - CASE FINLAND, Jussi Reinikainen, Finnish Environment Institute, Finland
286 A LOW-WASTE ELECTROCHEMICAL PROCESS FOR REMOVING PFAS FROM WATER TO NON-DETECT LEVELS, Brent Davey, Monarc Environmental, Australia
379 DIAGNOSTIC TOOL FOR METHANE SOIL GAS EMISSION AT AGED HYDROCARBON FUEL CONTAMINATED SITES, Dawit Bekele, University of Newcastle, Australia
237 DIOXINS IN THE SEDIMENTS OF SYDNEY HARBOUR: POTENTIAL FOR BIOREMEDIATION, Keith Osborne, Environment Protection Science, NSW OEH, Australia
146 USING MULITPLE LINES OF EVIDENCE TO CHARACTERISE DNAPL IMPACTS IN A FRACTURED BASALT, FORMER FITZROY GASWORKS REMEDIATION PROJECT, Claire Miller, Golder Associates, Australia
177 CHLORINATED HYDROCARBON SOURCE INVESTIGATIONS BY SOIL VAPOUR SCREENING: A CASE STUDY, Meredith Rasch, Renewal SA, Australia
2:30 - 2:45pm
0:15 310 THE EVOLUTION OF GLOBAL REGULATION FOR PER- AND POLY-FLUORINATED ALKYL SUBSTANCES, Ken Kiefer, ERM, Australia
325 LARGE SCALE PFAS REMEDIATION PROGRESS AT RAAF BASE WILLIAMTOWN, NSW, AUSTRALIA, Paul McCabe, AECOM, Australia
284 APPROACHES TO MODELLING VAPOUR INTRUSION IN WET BASEMENT CONSTRUCTION SCENARIOS, Victoria Lazenby, Arcadis Australia Pacific, Australia
196 PRIORITISING EMERGING CONTAMINANTS: HUNTER WATER’S RESEARCH AND DEVELOPMENT STRATEGY, Anna Lundmark, Hunter Water, Australia
144 PERMEABLE REACTIVE BARRIER IN A FRACTURED ROCK AQUIFER - HYDRAULIC INTERACTIONS AND INFLUENCE OF CONSTRUCTION METHODOLOGY, Andrew Gray, ERM, Australia
231 BACKGROUND VOC CONCENTRATIONS IN INDOOR & OUTDOOR AMBIENT AIR IN AUSTRALIA - INFORMATION TO EVALUATE AND INTERPRET VAPOUR INTRUSION RISKS, Adrian Heggie, WSP Australia, Australia
2:45 - 3:00pm
0:15 430 PFAS IN SOIL AND GROUNDWATER- GUIDANCE FOR THE ASSESSMENT AND REMEDIATION MEASURES IN GERMANY, Joerg Frauenstein, German Environment Agency, Germany
111 VEG TECHNOLOGY FOR EX-SITU THERMAL DESORPTION OF POLY- AND PERFLUOROALKYL SUBSTANCES, Mehrdad Javaherian, Endpoint Consulting, United States
440 MULTI-DIMENSIONAL VAPOUR MODELING FOR ASSESSING VAPOUR RISK AT HYDROCARBON CONTAMINATED SITES, Aravind Unnithan, University of Newcastle, Australia
265 1,4-DIOXANE AS CO-CONTAMINANT WITH CHLORINATED SOLVENTS, CONSIDERATION OF CHEMICAL PROPERTIES AND EFFECTIVE REMEDIAL SOLUTIONS, Brendan Brodie, ERM, Australia
212 EVOLVING CSMS IN FRACTURED ROCK: A CASE STUDY OF WHAT WE KNOW (AND WHAT WE THINK WE KNOW), Jonathan Ho, AECOM, Australia
201 ENHANCED REDUCTIVE DECHLORINATION FOR A CHLORINATED HYDROCARBONS IMPACTED ACTIVE SITE, Lorenzo Sacchetti, Carus Europe S.L., Spain
3:00 - 3:30pm
0:30 Afternoon Tea Afternoon Tea
Orange shading indicates 30-minute keynote presentations.

International CleanUp Conference Adelaide 201914
Hall L City Room 1 City Room 2 City Room 3 City Room 4 L1B Riverbank 8
Times 3:30 - 5:15pm Duration: 1:45
ID M41 - Sampling, behaviour and characterisation of PFAS Chair: Hans Stroo
ID M42 - Advances in PFAS remediation Chair: Grant Carey
ID M43 - Green approaches to managing wastes Chair: Jayant Keskar
ID M44 - Landfill evaluation, capping and management Chair: Atul Salhotra
ID M45 - Microplastics: A new threat to environment Chair: Larry Deschaine
ID M46 - Dealing with mixed contaminants Chair: Tim Payne
ID M47 - Gasworks site assessment and remediation Chair: John Hunt
3:30 - 3:45pm
0:15 126 PFAS IN VERMONT-A SUMMARY OF RESULTS FOR VERMONT'S COMPREHENSIVE MULI-MEDIA SAMPLING PROGRAM, Richard Spiese, Vermont Department of Environmental Conservation, United States
356 TRANSPORT AND REMEDIATION OF PER AND POLYFLUOROALKYL SUBSTANCES (PFAS) IN THE SUBSURFACE, Kurt Pennell, Brown University, United States
186 A BIO-PHYTOREMEDIATION TRIAL OF SURGE BASIN SLUDGE FROM A VICTORIAN PAPER MILL, Geordie McMillan, Environmental Earth Sciences, Australia
315 PFAS IMPACTS ON SOLID WASTE LANDFILLS, Scott Grieco, Jacobs, United States
101 ECOTOXICITY OF PARTICULATE PLASTICS IN TERRESTRIAL AND AQUATIC ECOSYSTEMS, Nanthi Bolan, University of Newcastle, Australia
435 ECOTOXICITY AND BIOAVAILABILITY OF MIX CONTAMINANTS: IMPLICATIONS TO BIOREMEDIATION, Megharaj Mallavarapu, University of Newcastle, Australia
161 CASE STUDY: REMEDIATION IN THE BIG CITY. BARANGAROO AND THE CHALLENGES, Jessica Hannaford, GHD, Australia
3:45 - 4:00pm
0:15 cont.. cont.. cont.. cont.. cont.. cont.. 277 LEGACY CONTAMINATION TO REMEDIATION: MANAGING APPROVALS AND EXPECTATIONS ON A FORMER GASWORKS SITE, Jarrod Irving, Jemena, Australia
4:00 - 4:15pm
0:15 259 AFFF - METHODS FOR PRODUCT SAMPLING, Ken Kiefer, ERM, Australia
171 ASSESSING A NOVEL MEDIA FOR REDUCING PFAS MIGRATION VIA STORMWATER SYSTEMS, Nick Marquez, Beca, Australia
236 REUSE OF SOIL CONTAMINATED BY TYRE FIRE, Lyn Denison, ERM, Australia
121 JOHN MATHWIN RESERVE, KAURI PARADE, SEACLIFF PARK, SA – AUDITING TRANSFORMATION FROM LANDFILL TO COMMUNITY AND SPORTING PRECINCT, Adrian Hall, GHD, Australia
509 POLYMER AND POLYMER WASTE RECYCLING, Ken Sajwan, Savannah State University, USA
294 MIXED CONTAMINATION (INCLUDING PFAS) ASSESSMENT AND MANAGEMENT AT A ZINC GALVANISING PLANT, Alice Walker, GHD, Australia
407 REMEDIATION OF PAHS CONTAMINATION IN AN AGED GASWORKS SITE SOIL USING SURFACTANT AND OXIDANTS, Monica Esposito, University of Newcastle, Australia
4:15 - 4:30pm
0:15 cont.. 208 FIREFIGHTING FOAM TRANSITION TO FLUORINE FREE: IS IT PLUG AND PLAY?, Peter Storch, Arcadis, Australia
220 RISK-BASED DECISION MAKING TO AVOID WASTE, SAVE PUBLIC MONEY AND ALLOW BENEFICIAL USE OF WATER TREATMENT RESIDUALS, Graeme Miller, Senversa, Australia
631 ASSESSMENT OF OPTIONS FOR REUSE OR DISPOSAL OF SOILS CONTAMINATED WITH PFAS – AN EVALUATION OF THE AUSTRALIAN STANDARD LEACHING PROCEDURE (ASLP), Andrew Mitchell, RPS Group, Australia
cont.. 250 VALIDATING BIOACCESSIBILITY TESTS FOR ASSESSING CONTAMIANTS IN MIXED CONTAMINATED SOILS, Ayanka Wijayawardena, University of Newcastle, Australia
321 TREATMENT OF HEAVILY IMPACTED GROUNDWATER FROM THE FORMER MILLERS POINT GASWORKS, Sagar Adhikari, Enviropacific Services, Australia
4:30 - 4:45pm
0:15 429 LIQUID INJECTION OF BIOSOLIDS IN SOIL: CHARACTERISATION OF PFAS IN SOIL, GROUNDWATER AND HERBAGE, Aravind Surapaneni, South East Water, Australia
158 PFAS REMOVAL FROM A DRINKING WATER SUPPLY, Skefos Tsoulakis, NT Power and Water Corporation, United States
241 MICROALGAE-BACTERIA CONSORTIA FOR NUTRIENTS REMOVAL IN WASTEWATER, Isiri Perera, University of Newcastle, Australia
272 RESIDENTIAL DEVELOPMENT ON A LANDFILL €“ A WESTERN AUSTRALIAN CASE STUDY, Stuart Thurlow, Australian Environmental Auditors, Australia
341 MICROPLASTICS AN ANALYTICAL PERSPECTIVE, Robert Symons, Eurofins Environment Testing Australia, Australia
269 ECOTOXICITY MODELLING: COMPETITIVE, MULTI-SPECIES AND OTHER MODELS FOR TERRESTRIAL ENVIRONMENTS, Dane Lamb, UoN, Australia
235 CAN THE GASTROINTESTINAL MOBILISATION OF PAH NONEXTRACTABLE RESIDUES FROM SOILS RESULT IN UNACCEPTABLE CANCER RISKS?, Anthony Umeh, University of Newcastle, Australia
4:45 - 5:00pm
159 WHAT IS REALLY IN AQUEOUS FILM FORMING FOAM AND DOES IT MATTER?, Steve Woodard, Emerging Compounds Treatment Technologies, United States
313 DEVELOPMENT OF ADVANCED CHEMICAL TREATMENT FOR PFAS IN CO-CONTAMINATED GROUNDWATER, Scott Grieco, Jacobs, United States
424 EFFECT OF LIQUID INJECTION OF BIOSOLIDS ON GROUNDWATER AND SOIL PROPERTIES, Balaji Seshadri, University of Newcastle, Australia
320 LANDFILL MINING TO TRANSFORM A FORMER DUMP INTO USABLE LAND. GROUND-BREAKING GAS VAPOUR INVESTIGATION, REMEDIATION & VALIDATION, Martin Kelly, Enviropacific Services, Australia
229 MICRO-PLASTIC DETCTION, IDENTIFICATION AND VISUALISATION, Cheng Fang, University of Newcastle, Australia
223 PILOT SCALE THERMAL REMEDIATION OF A MIXTURE OF DIFFERENT MERCURY SPECIES AND A MIX OF PESTICIDES, Niels Ploug, Kruger, Denmark
150 REMEDIATION BY PERMANGANATE IN SITU CHEMICAL OXYDATION OF A MANUFACTURED GAS PLANT SITE IMPACTED BY POLY AROMATIC HYDROCARBONS (PAHS), Lorenzo Sacchetti, Carus Europe S.L., Spain
5:00 - 5:15pm
0:15 183 PFAS COMPOSITION IN SURFACE WATER ECOLOGIES, Andrew Mitchell, RPS Group, Australia
156 SOURCE REMOVAL COMBINED WITH DRINKING WATER TREATMENT ON A PFAS-CONTAMINATED GROUNDWATER, Marilyn Sinnett, Emerging Compounds Treatment Technologies, United States
609 BIOMASS HIGH TEMPERATURE AND HIGH EFFCIENCY COMBUSTION TECHNOLOGY, Bo Xiao, Huazhong Uni of Sci & Tech, China
359 RELATIVE PERFORMANCE OF COMPOSITE LINERS (HDPE + GCL) IN CONTAINING LANDFILL LEACHATE , Patrick Ndere, GHD, Australia
264 THE TOXICITY EFFECT OF MICROPLASTIC VECTOR FOR PFOS AND PFOA ON EARTHWORM, Zahra Sobhani, University of Newcastle, Australia
210 IMMOBILIZATION OF CD AND AS BY APATITE CONVERTED FROM MICROBIAL INDUCED CALCIUM CARBONATE, Shijun Wu, Chinese Academy of Sciences, China
254 A NOVEL FRAMEWORK TO IDENTIFY, PREDICT AND IMPROVE THE EFFICIENCY OF BIOREMEDIATION, Ramesha H Jayaramaiah, Western Sydney University, Australia
5:15 - 6:00pm
1:00 Drinks and Poster Session Drinks and Poster Session
MO
ND
AY,
9 S
EPTE
MB
EREV
ENIN
G

International CleanUp Conference Adelaide 2019 15
Hall L City Room 1 City Room 2 City Room 3 City Room 4 L1B Riverbank 8
Times 3:30 - 5:15pm Duration: 1:45
ID M41 - Sampling, behaviour and characterisation of PFAS Chair: Hans Stroo
ID M42 - Advances in PFAS remediation Chair: Grant Carey
ID M43 - Green approaches to managing wastes Chair: Jayant Keskar
ID M44 - Landfill evaluation, capping and management Chair: Atul Salhotra
ID M45 - Microplastics: A new threat to environment Chair: Larry Deschaine
ID M46 - Dealing with mixed contaminants Chair: Tim Payne
ID M47 - Gasworks site assessment and remediation Chair: John Hunt
3:30 - 3:45pm
0:15 126 PFAS IN VERMONT-A SUMMARY OF RESULTS FOR VERMONT'S COMPREHENSIVE MULI-MEDIA SAMPLING PROGRAM, Richard Spiese, Vermont Department of Environmental Conservation, United States
356 TRANSPORT AND REMEDIATION OF PER AND POLYFLUOROALKYL SUBSTANCES (PFAS) IN THE SUBSURFACE, Kurt Pennell, Brown University, United States
186 A BIO-PHYTOREMEDIATION TRIAL OF SURGE BASIN SLUDGE FROM A VICTORIAN PAPER MILL, Geordie McMillan, Environmental Earth Sciences, Australia
315 PFAS IMPACTS ON SOLID WASTE LANDFILLS, Scott Grieco, Jacobs, United States
101 ECOTOXICITY OF PARTICULATE PLASTICS IN TERRESTRIAL AND AQUATIC ECOSYSTEMS, Nanthi Bolan, University of Newcastle, Australia
435 ECOTOXICITY AND BIOAVAILABILITY OF MIX CONTAMINANTS: IMPLICATIONS TO BIOREMEDIATION, Megharaj Mallavarapu, University of Newcastle, Australia
161 CASE STUDY: REMEDIATION IN THE BIG CITY. BARANGAROO AND THE CHALLENGES, Jessica Hannaford, GHD, Australia
3:45 - 4:00pm
0:15 cont.. cont.. cont.. cont.. cont.. cont.. 277 LEGACY CONTAMINATION TO REMEDIATION: MANAGING APPROVALS AND EXPECTATIONS ON A FORMER GASWORKS SITE, Jarrod Irving, Jemena, Australia
4:00 - 4:15pm
0:15 259 AFFF - METHODS FOR PRODUCT SAMPLING, Ken Kiefer, ERM, Australia
171 ASSESSING A NOVEL MEDIA FOR REDUCING PFAS MIGRATION VIA STORMWATER SYSTEMS, Nick Marquez, Beca, Australia
236 REUSE OF SOIL CONTAMINATED BY TYRE FIRE, Lyn Denison, ERM, Australia
121 JOHN MATHWIN RESERVE, KAURI PARADE, SEACLIFF PARK, SA – AUDITING TRANSFORMATION FROM LANDFILL TO COMMUNITY AND SPORTING PRECINCT, Adrian Hall, GHD, Australia
509 POLYMER AND POLYMER WASTE RECYCLING, Ken Sajwan, Savannah State University, USA
294 MIXED CONTAMINATION (INCLUDING PFAS) ASSESSMENT AND MANAGEMENT AT A ZINC GALVANISING PLANT, Alice Walker, GHD, Australia
407 REMEDIATION OF PAHS CONTAMINATION IN AN AGED GASWORKS SITE SOIL USING SURFACTANT AND OXIDANTS, Monica Esposito, University of Newcastle, Australia
4:15 - 4:30pm
0:15 cont.. 208 FIREFIGHTING FOAM TRANSITION TO FLUORINE FREE: IS IT PLUG AND PLAY?, Peter Storch, Arcadis, Australia
220 RISK-BASED DECISION MAKING TO AVOID WASTE, SAVE PUBLIC MONEY AND ALLOW BENEFICIAL USE OF WATER TREATMENT RESIDUALS, Graeme Miller, Senversa, Australia
631 ASSESSMENT OF OPTIONS FOR REUSE OR DISPOSAL OF SOILS CONTAMINATED WITH PFAS – AN EVALUATION OF THE AUSTRALIAN STANDARD LEACHING PROCEDURE (ASLP), Andrew Mitchell, RPS Group, Australia
cont.. 250 VALIDATING BIOACCESSIBILITY TESTS FOR ASSESSING CONTAMIANTS IN MIXED CONTAMINATED SOILS, Ayanka Wijayawardena, University of Newcastle, Australia
321 TREATMENT OF HEAVILY IMPACTED GROUNDWATER FROM THE FORMER MILLERS POINT GASWORKS, Sagar Adhikari, Enviropacific Services, Australia
4:30 - 4:45pm
0:15 429 LIQUID INJECTION OF BIOSOLIDS IN SOIL: CHARACTERISATION OF PFAS IN SOIL, GROUNDWATER AND HERBAGE, Aravind Surapaneni, South East Water, Australia
158 PFAS REMOVAL FROM A DRINKING WATER SUPPLY, Skefos Tsoulakis, NT Power and Water Corporation, United States
241 MICROALGAE-BACTERIA CONSORTIA FOR NUTRIENTS REMOVAL IN WASTEWATER, Isiri Perera, University of Newcastle, Australia
272 RESIDENTIAL DEVELOPMENT ON A LANDFILL €“ A WESTERN AUSTRALIAN CASE STUDY, Stuart Thurlow, Australian Environmental Auditors, Australia
341 MICROPLASTICS AN ANALYTICAL PERSPECTIVE, Robert Symons, Eurofins Environment Testing Australia, Australia
269 ECOTOXICITY MODELLING: COMPETITIVE, MULTI-SPECIES AND OTHER MODELS FOR TERRESTRIAL ENVIRONMENTS, Dane Lamb, UoN, Australia
235 CAN THE GASTROINTESTINAL MOBILISATION OF PAH NONEXTRACTABLE RESIDUES FROM SOILS RESULT IN UNACCEPTABLE CANCER RISKS?, Anthony Umeh, University of Newcastle, Australia
4:45 - 5:00pm
159 WHAT IS REALLY IN AQUEOUS FILM FORMING FOAM AND DOES IT MATTER?, Steve Woodard, Emerging Compounds Treatment Technologies, United States
313 DEVELOPMENT OF ADVANCED CHEMICAL TREATMENT FOR PFAS IN CO-CONTAMINATED GROUNDWATER, Scott Grieco, Jacobs, United States
424 EFFECT OF LIQUID INJECTION OF BIOSOLIDS ON GROUNDWATER AND SOIL PROPERTIES, Balaji Seshadri, University of Newcastle, Australia
320 LANDFILL MINING TO TRANSFORM A FORMER DUMP INTO USABLE LAND. GROUND-BREAKING GAS VAPOUR INVESTIGATION, REMEDIATION & VALIDATION, Martin Kelly, Enviropacific Services, Australia
229 MICRO-PLASTIC DETCTION, IDENTIFICATION AND VISUALISATION, Cheng Fang, University of Newcastle, Australia
223 PILOT SCALE THERMAL REMEDIATION OF A MIXTURE OF DIFFERENT MERCURY SPECIES AND A MIX OF PESTICIDES, Niels Ploug, Kruger, Denmark
150 REMEDIATION BY PERMANGANATE IN SITU CHEMICAL OXYDATION OF A MANUFACTURED GAS PLANT SITE IMPACTED BY POLY AROMATIC HYDROCARBONS (PAHS), Lorenzo Sacchetti, Carus Europe S.L., Spain
5:00 - 5:15pm
0:15 183 PFAS COMPOSITION IN SURFACE WATER ECOLOGIES, Andrew Mitchell, RPS Group, Australia
156 SOURCE REMOVAL COMBINED WITH DRINKING WATER TREATMENT ON A PFAS-CONTAMINATED GROUNDWATER, Marilyn Sinnett, Emerging Compounds Treatment Technologies, United States
609 BIOMASS HIGH TEMPERATURE AND HIGH EFFCIENCY COMBUSTION TECHNOLOGY, Bo Xiao, Huazhong Uni of Sci & Tech, China
359 RELATIVE PERFORMANCE OF COMPOSITE LINERS (HDPE + GCL) IN CONTAINING LANDFILL LEACHATE , Patrick Ndere, GHD, Australia
264 THE TOXICITY EFFECT OF MICROPLASTIC VECTOR FOR PFOS AND PFOA ON EARTHWORM, Zahra Sobhani, University of Newcastle, Australia
210 IMMOBILIZATION OF CD AND AS BY APATITE CONVERTED FROM MICROBIAL INDUCED CALCIUM CARBONATE, Shijun Wu, Chinese Academy of Sciences, China
254 A NOVEL FRAMEWORK TO IDENTIFY, PREDICT AND IMPROVE THE EFFICIENCY OF BIOREMEDIATION, Ramesha H Jayaramaiah, Western Sydney University, Australia
5:15 - 6:00pm
1:00 Drinks and Poster Session Drinks and Poster Session
Orange shading indicates 30-minute keynote presentations.

International CleanUp Conference Adelaide 201916
Hall L City Room 1 City Room 2 City Room 3 City Room 4 L1B Riverbank 8
5:15 -6:00pm ID M51 - Poster session and drinks ID M51 - Poster session and drinks ID M51 - Poster session and drinks ID M51 - Poster session and drinks ID M51 - Poster session and drinks ID M51 - Poster session and drinks
5:15 - 6:15pm
1:00 P1 INFLUENCE OF SOIL PROPERTIES AND PLANT SPECIES ON PFASS BIOACCUMULATION, Siyuan Liu, University of Newcastle, Australia
P9 INVESTIGATION, RISK ASSESSMENT AND REMEDIATION OF MULTIPLE PFAS SOURCE ZONES AT AN AIRPORT TO SAFEGUARD A WATER SUPPLY, Ian Ross, Arcadis, United Kingdom
P17 EFFECT OF AMENDMENTS ON WATER USE EFFICIENCY IN RICE WHEAT CROPPING SYSTEM UNDER LIGHT TEXTURE SOIL, Yanendra K. Singh, Bihar Agricultural University, India
P51 ALUMINOSILICATE NANO-SKELETON TO FIRM THE STRUCTURE AND PROPERTIES OF NANO-HERBICIDE FORMULATIONS, Santosh Kumar Paul, University of Newcastle, Australia
P33 ELECTROCHEMICAL OXIDATION OF 2,4-D, Young Hwan Hyun, Kyungpook National University, South Korea
P41 MULTIPLE TREATMENT SYSTEMS COMBINE TO ENHANCE REMOVAL OF PER- AND POLY-FLUOROALKYL SUBSTANCES FROM CONTAMINATED WATER AT RAAF BASE WILLIAMTOWN, NSW AUSTRALIA, Steve Woodard, Emerging Compounds Treatment Technologies, United States
5:15 - 6:15pm
1:00 P49 BIOCHAR APPLICATION EFFECTS ON SOME MAIZE GROWING SOILS OF BIHAR, ANSHUMAN KOHLI, Bihar Agricultural University, India
P10 THE EVOLUTION AND APPLICATION OF FLUORINE FREE FOAMS FOR EFFECTIVE EXTINGUISHMENT OF CLASS B FIRES, Ian Ross, Arcadis, United Kingdom
P18 SCREENING OF AUSTRALIAN NATIVE PLANT SPECIES FOR RHIZOREMEDIATION OF PETROLEUM HYDROCARBON CONTAMINATED SOIL, Anh Hoang, University of Newcastle, Australia
P26 OPTIMIZING THE PFAS PUZZLE: PIECING TOGETHER A HOLISTIC PFAS RESTORATION STRATEGY, Ian Ross, Arcadis, United Kingdom
P34 POTENTIAL OF ACID TOLERANT MICROALGAE FOR IRON RECOVERY VIA UPTAKE FROM ACID MINE DRAINAGE, Abinandan Sudharsanam, University of Newcastle, Australia
P42 PILOT TEST VERIFICATION OF THERMAL DESORPTION OF PFAS FROM SOIL, Scott Grieco, Jacobs, United States
5:15 - 6:15pm
1:00 P3 EVALUATION OF HEAVY METALS (AS, CD, CU, PB, ZN) UPTAKE FACTORS OF NATIVE PLANTS IN THAI NGUYEN MINING SITES €“ A STUDY FOR PHYTOREMEDIATION, Ngoc Son Hai Nguyen, University of Newcastle, Australia
P11 UNDERSTANDING FATE AND TRANSPORT OF PFASS TO DEVELOP EFFECTIVE CONCEPTUAL SITE MODELS, Ian Ross, Arcadis, United Kingdom
P19 ASBESTOS: ENVIRONMENTAL HEALTH INEQUALITIES BETWEEN DEVELOPED AND DEVELOPING NATIONS, Dawit Bekele, University of Newcastle, Australia
P27 1,4-DIOXANE INDUCES CHROMOSOMAL ABERRATIONS IN ALLIUM CEPA, Sadhvika Chandrasekar, University of Newcastle, Australia
P35 SORPTION OF FENAMIPHOS IN SOILS FROM TEMPERATE AND TROPICAL REGIONS, Tanya Caceres, University of Newcastle, Australia
P43 ARSENIC PHYTOTOXCITY IN SOIL: THE IMPACT OF RESIDENCE TIME, sedigheh abbasi, University of Newcastle, Australia
5:15 - 6:15pm
1:00 P4 PFAS CLEARANCE IN CATTLE, Tarah Hagen, ToxConsult, Australia
P12 PFAS TISSUE DISTRIBUTION IN CATTLE, Roger Drew, ToxConsult, Australia
P20 DYNAMIC BIOPILES AS A METHOD OF ENHANCED BIOREMEDIATION OF GASWORKS POLYCYCLIC AROMATIC HYDROCARBON IMPACTED SOIL , Mark Stuckey, Environmental Earth Sciences, Australia
P28 HEAVY METAL EXPOSURE RISK OF COMMERCIALLY GROWN VEGETABLES IN SRI LANKA, Mudalige Kulathunga, University of Newcastle, Australia
P36 PFAS SOURCE ZONE REMEDIATION USING FLUIDISATION AND FRACTIONATION, David Burns, OPEC Systems, Australia
P44 IN SITU FORMATION OF MAGNETITE NANOPARTICLES ON HALLOYSITE NANOTUBE: SYNTHESIS AND CHARACTERISATION, Amal Deb, University of Newcastle, Australia
5:15 - 6:15pm
1:00 P5 A SOIL CONTAMINATION RECORD MANAGEMENT SYSTEM IN REPUBLIC OF KOREA, Jung-Auk Park, Korea Environment Corporation, South Korea
P13 SITE ASSESSMENT AND REMEDIATION PLAN FOR LEAD CONTAMINATION FROM MINING ACTIVITY; KLITY, KANCHANABURI, THAILAND, Netnapid Tantemsapya, Suranaree University of Technology, Thailand
P50 PERFLUOROOCTANOIC ACID (PFOA) INDUCED BEHAVIORAL IMPACTS IN C. ELEGANS, Tanmoy Sana, University of Newcastle, Australia
P29 CYTOTOXICTY OF PERFLUOROALKYL AND POLYFLUOROALKYL SUBSTANCES AND THEIR MIXTURES IN HEPG2 CELLS, ATINUKE FAVOUR OJO, University of Queensland, Australia
P37 CHRONIC EXPOSURE TO PERFLUOROOCTANE SULFONATE (PFOS) HAMPERS REPRODUCTION CAPACITY AND LOCOMOTION IN CAENORHABDITIS ELEGANS, Manjurul Islam Chowdhury, University of Newcastle, Australia
P44 APPLICATION OF DECISION UNIT MULTI-INCREMENT SAMPLING (DUMIS) IN CONFIRMATION SAMPLING AT A NICKEL CONTAMINATED SITE IN CHINA, Jing Song, Chinese Academy of Sciences, China
5:15 - 6:15pm
1:00 P6 INVESTIGATION OF PFAS CONTAMINATION FROM LAND-APPLIED INDUSTRIAL COMPOST AND AFFF SOURCES, Ian Ross, Arcadis, United Kingdom
P14 IRON PLAQUE FORMATION AND ITS EFFECT ON CADMIUM ACCUMULATION BY RICE SEEDLINGS, Abu Bakkar Siddique, University of Newcastle, Australia
P22 LIMITING MIGRATION OF PFAS - GROUNDWATER AND SURFACE WATER: APPLICATION OF MATERIALS AND METHODS FOR IN-SITU PERMEABLE REACTIVE BARRIERS (PRBS), John Collins, AquaBlok, United States
P30 LNAPL MOBILITY AND RECOVERABILITY IN FRACTURED BASALT: FINDINGS FROM SEVERAL MULTI-TIERED CASE STUDIES, Keith Maxfield, AECOM, Australia
P38 PROGRESS AND CHALLENGES FOR SUBSURFACE REMEDIATION TECHNOLOGIES FOR TPHS, Anish Saini, University of Newcastle, Australia
P46 ROOT BEHAVIOUR AND NUTRIENT MEDIUM: PH, EC AND CD LEVEL OF WHEAT GRASSES (ANTHOSACHNE SCABRA) UNDER CADMIUM STRESS, Md Halim, University of Newcastle, Australia
5:15 - 6:15pm
1:00 P7 STANDARDIZED APPROACHES FOR RISK RANKING PORTFOLIO OF SITES IMPACTED WITH PFAS , Ian Ross, Arcadis, United Kingdom
P15 COMPARING GROUNDWATER LEVEL FLUCTUATION UNDER DIFFERENT LAND USE SCENARIOS: IMPLICATIONS TO REMEDIATION TREATMENT, Adnan Mohammed, University of Newcastle, Australia
P23 BIOAVAILABILITY REDUCTION OF CADMIUM IN BIOSOLIDS BLENDED WITH LIMESTONE IN AGRICULTURAL UTILIZATION, Thammared Chuasavathi, Khon Kaen University, Thailand
P31 NATURAL SOURCE ARSENIC CONTAMINATION MANAGEMENT STRATEGIES IN TAIWAN €“ CONTAMINATION STATUS, NOVEL SCREENING TOOL AND PRECAUTIONS, Bing-Nan Wang, Sinotech Environmental Technology, Taiwan
P39 PARTICLE-SIZE DISTRIBUTION OF TRACE ELEMENTS IN LEGACY MINE SITE SOILS, NSW, AUSTRALIA, A S M Fazle Bari, University of Newcastle, Australia
P47 1,4-DIOXANE INDUCES OXIDATIVE STRESS IN RAPHIDOCELIS SUBCAPITATA, Nucharee Juntarachot, University of Newcastle, Australia
5:15 - 6:15pm
1:00 P8 NITRATE, PHOSPHATE, AND SULFATE CONCENTRATIONS IN EFFLUENT WATER FROM NINE WASTEWATER TREATMENT PLANTS IN SAVANNAH, GEORGIA, USA, Ken Sajwan, Savannah State University, USA
P16 PFAS BACKGROUND CONSIDERATIONS FROM STATIONERY - SIGNIFICANT OR NOT?, Ken Kiefer, ERM, Australia
P24 FLYASH - ATTRIBUTES, UTILIZATION AND MITIGATION STRATEGIES FOR ECO-FRIENDLY MANAGEMENT, SUDHA JALA KOHLI, Tilkamanjhi Bhagalpur University, India
282 P32 TREATMENT OF PFAS IMPACTED WASTEWATER USING OZOFRACTIONATION AND SONLYSIS WITH TREATMENT VALIDATION USING TOP ASSAY, Ian Ross, Arcadis, United Kingdom
P40 OHS&E PLANNING OF PFAS INVESTIGATION PROGRAMS: WEIGHING THE RISKS OF VECTOR BORNE INFECTIOUS DISEASES?, Freya Amon, CDM Smith, Australia
P48 COMPUTATIONAL AND EVOLUTIONARY ANALYSIS OF LYTIC POLYSACCHARIDE MONOOXYGENASES (LPMOS), Kaniz Fatema, University of Newcastle, Australia
MO
ND
AY,
9 S
EPTE
MB
ERP
OST
ER S
ESSI
ON
AN
D D
RIN
KS

International CleanUp Conference Adelaide 2019 17
Hall L City Room 1 City Room 2 City Room 3 City Room 4 L1B Riverbank 8
5:15 -6:00pm ID M51 - Poster session and drinks ID M51 - Poster session and drinks ID M51 - Poster session and drinks ID M51 - Poster session and drinks ID M51 - Poster session and drinks ID M51 - Poster session and drinks
5:15 - 6:15pm
1:00 P1 INFLUENCE OF SOIL PROPERTIES AND PLANT SPECIES ON PFASS BIOACCUMULATION, Siyuan Liu, University of Newcastle, Australia
P9 INVESTIGATION, RISK ASSESSMENT AND REMEDIATION OF MULTIPLE PFAS SOURCE ZONES AT AN AIRPORT TO SAFEGUARD A WATER SUPPLY, Ian Ross, Arcadis, United Kingdom
P17 EFFECT OF AMENDMENTS ON WATER USE EFFICIENCY IN RICE WHEAT CROPPING SYSTEM UNDER LIGHT TEXTURE SOIL, Yanendra K. Singh, Bihar Agricultural University, India
P51 ALUMINOSILICATE NANO-SKELETON TO FIRM THE STRUCTURE AND PROPERTIES OF NANO-HERBICIDE FORMULATIONS, Santosh Kumar Paul, University of Newcastle, Australia
P33 ELECTROCHEMICAL OXIDATION OF 2,4-D, Young Hwan Hyun, Kyungpook National University, South Korea
P41 MULTIPLE TREATMENT SYSTEMS COMBINE TO ENHANCE REMOVAL OF PER- AND POLY-FLUOROALKYL SUBSTANCES FROM CONTAMINATED WATER AT RAAF BASE WILLIAMTOWN, NSW AUSTRALIA, Steve Woodard, Emerging Compounds Treatment Technologies, United States
5:15 - 6:15pm
1:00 P49 BIOCHAR APPLICATION EFFECTS ON SOME MAIZE GROWING SOILS OF BIHAR, ANSHUMAN KOHLI, Bihar Agricultural University, India
P10 THE EVOLUTION AND APPLICATION OF FLUORINE FREE FOAMS FOR EFFECTIVE EXTINGUISHMENT OF CLASS B FIRES, Ian Ross, Arcadis, United Kingdom
P18 SCREENING OF AUSTRALIAN NATIVE PLANT SPECIES FOR RHIZOREMEDIATION OF PETROLEUM HYDROCARBON CONTAMINATED SOIL, Anh Hoang, University of Newcastle, Australia
P26 OPTIMIZING THE PFAS PUZZLE: PIECING TOGETHER A HOLISTIC PFAS RESTORATION STRATEGY, Ian Ross, Arcadis, United Kingdom
P34 POTENTIAL OF ACID TOLERANT MICROALGAE FOR IRON RECOVERY VIA UPTAKE FROM ACID MINE DRAINAGE, Abinandan Sudharsanam, University of Newcastle, Australia
P42 PILOT TEST VERIFICATION OF THERMAL DESORPTION OF PFAS FROM SOIL, Scott Grieco, Jacobs, United States
5:15 - 6:15pm
1:00 P3 EVALUATION OF HEAVY METALS (AS, CD, CU, PB, ZN) UPTAKE FACTORS OF NATIVE PLANTS IN THAI NGUYEN MINING SITES €“ A STUDY FOR PHYTOREMEDIATION, Ngoc Son Hai Nguyen, University of Newcastle, Australia
P11 UNDERSTANDING FATE AND TRANSPORT OF PFASS TO DEVELOP EFFECTIVE CONCEPTUAL SITE MODELS, Ian Ross, Arcadis, United Kingdom
P19 ASBESTOS: ENVIRONMENTAL HEALTH INEQUALITIES BETWEEN DEVELOPED AND DEVELOPING NATIONS, Dawit Bekele, University of Newcastle, Australia
P27 1,4-DIOXANE INDUCES CHROMOSOMAL ABERRATIONS IN ALLIUM CEPA, Sadhvika Chandrasekar, University of Newcastle, Australia
P35 SORPTION OF FENAMIPHOS IN SOILS FROM TEMPERATE AND TROPICAL REGIONS, Tanya Caceres, University of Newcastle, Australia
P43 ARSENIC PHYTOTOXCITY IN SOIL: THE IMPACT OF RESIDENCE TIME, sedigheh abbasi, University of Newcastle, Australia
5:15 - 6:15pm
1:00 P4 PFAS CLEARANCE IN CATTLE, Tarah Hagen, ToxConsult, Australia
P12 PFAS TISSUE DISTRIBUTION IN CATTLE, Roger Drew, ToxConsult, Australia
P20 DYNAMIC BIOPILES AS A METHOD OF ENHANCED BIOREMEDIATION OF GASWORKS POLYCYCLIC AROMATIC HYDROCARBON IMPACTED SOIL , Mark Stuckey, Environmental Earth Sciences, Australia
P28 HEAVY METAL EXPOSURE RISK OF COMMERCIALLY GROWN VEGETABLES IN SRI LANKA, Mudalige Kulathunga, University of Newcastle, Australia
P36 PFAS SOURCE ZONE REMEDIATION USING FLUIDISATION AND FRACTIONATION, David Burns, OPEC Systems, Australia
P44 IN SITU FORMATION OF MAGNETITE NANOPARTICLES ON HALLOYSITE NANOTUBE: SYNTHESIS AND CHARACTERISATION, Amal Deb, University of Newcastle, Australia
5:15 - 6:15pm
1:00 P5 A SOIL CONTAMINATION RECORD MANAGEMENT SYSTEM IN REPUBLIC OF KOREA, Jung-Auk Park, Korea Environment Corporation, South Korea
P13 SITE ASSESSMENT AND REMEDIATION PLAN FOR LEAD CONTAMINATION FROM MINING ACTIVITY; KLITY, KANCHANABURI, THAILAND, Netnapid Tantemsapya, Suranaree University of Technology, Thailand
P50 PERFLUOROOCTANOIC ACID (PFOA) INDUCED BEHAVIORAL IMPACTS IN C. ELEGANS, Tanmoy Sana, University of Newcastle, Australia
P29 CYTOTOXICTY OF PERFLUOROALKYL AND POLYFLUOROALKYL SUBSTANCES AND THEIR MIXTURES IN HEPG2 CELLS, ATINUKE FAVOUR OJO, University of Queensland, Australia
P37 CHRONIC EXPOSURE TO PERFLUOROOCTANE SULFONATE (PFOS) HAMPERS REPRODUCTION CAPACITY AND LOCOMOTION IN CAENORHABDITIS ELEGANS, Manjurul Islam Chowdhury, University of Newcastle, Australia
P44 APPLICATION OF DECISION UNIT MULTI-INCREMENT SAMPLING (DUMIS) IN CONFIRMATION SAMPLING AT A NICKEL CONTAMINATED SITE IN CHINA, Jing Song, Chinese Academy of Sciences, China
5:15 - 6:15pm
1:00 P6 INVESTIGATION OF PFAS CONTAMINATION FROM LAND-APPLIED INDUSTRIAL COMPOST AND AFFF SOURCES, Ian Ross, Arcadis, United Kingdom
P14 IRON PLAQUE FORMATION AND ITS EFFECT ON CADMIUM ACCUMULATION BY RICE SEEDLINGS, Abu Bakkar Siddique, University of Newcastle, Australia
P22 LIMITING MIGRATION OF PFAS - GROUNDWATER AND SURFACE WATER: APPLICATION OF MATERIALS AND METHODS FOR IN-SITU PERMEABLE REACTIVE BARRIERS (PRBS), John Collins, AquaBlok, United States
P30 LNAPL MOBILITY AND RECOVERABILITY IN FRACTURED BASALT: FINDINGS FROM SEVERAL MULTI-TIERED CASE STUDIES, Keith Maxfield, AECOM, Australia
P38 PROGRESS AND CHALLENGES FOR SUBSURFACE REMEDIATION TECHNOLOGIES FOR TPHS, Anish Saini, University of Newcastle, Australia
P46 ROOT BEHAVIOUR AND NUTRIENT MEDIUM: PH, EC AND CD LEVEL OF WHEAT GRASSES (ANTHOSACHNE SCABRA) UNDER CADMIUM STRESS, Md Halim, University of Newcastle, Australia
5:15 - 6:15pm
1:00 P7 STANDARDIZED APPROACHES FOR RISK RANKING PORTFOLIO OF SITES IMPACTED WITH PFAS , Ian Ross, Arcadis, United Kingdom
P15 COMPARING GROUNDWATER LEVEL FLUCTUATION UNDER DIFFERENT LAND USE SCENARIOS: IMPLICATIONS TO REMEDIATION TREATMENT, Adnan Mohammed, University of Newcastle, Australia
P23 BIOAVAILABILITY REDUCTION OF CADMIUM IN BIOSOLIDS BLENDED WITH LIMESTONE IN AGRICULTURAL UTILIZATION, Thammared Chuasavathi, Khon Kaen University, Thailand
P31 NATURAL SOURCE ARSENIC CONTAMINATION MANAGEMENT STRATEGIES IN TAIWAN €“ CONTAMINATION STATUS, NOVEL SCREENING TOOL AND PRECAUTIONS, Bing-Nan Wang, Sinotech Environmental Technology, Taiwan
P39 PARTICLE-SIZE DISTRIBUTION OF TRACE ELEMENTS IN LEGACY MINE SITE SOILS, NSW, AUSTRALIA, A S M Fazle Bari, University of Newcastle, Australia
P47 1,4-DIOXANE INDUCES OXIDATIVE STRESS IN RAPHIDOCELIS SUBCAPITATA, Nucharee Juntarachot, University of Newcastle, Australia
5:15 - 6:15pm
1:00 P8 NITRATE, PHOSPHATE, AND SULFATE CONCENTRATIONS IN EFFLUENT WATER FROM NINE WASTEWATER TREATMENT PLANTS IN SAVANNAH, GEORGIA, USA, Ken Sajwan, Savannah State University, USA
P16 PFAS BACKGROUND CONSIDERATIONS FROM STATIONERY - SIGNIFICANT OR NOT?, Ken Kiefer, ERM, Australia
P24 FLYASH - ATTRIBUTES, UTILIZATION AND MITIGATION STRATEGIES FOR ECO-FRIENDLY MANAGEMENT, SUDHA JALA KOHLI, Tilkamanjhi Bhagalpur University, India
282 P32 TREATMENT OF PFAS IMPACTED WASTEWATER USING OZOFRACTIONATION AND SONLYSIS WITH TREATMENT VALIDATION USING TOP ASSAY, Ian Ross, Arcadis, United Kingdom
P40 OHS&E PLANNING OF PFAS INVESTIGATION PROGRAMS: WEIGHING THE RISKS OF VECTOR BORNE INFECTIOUS DISEASES?, Freya Amon, CDM Smith, Australia
P48 COMPUTATIONAL AND EVOLUTIONARY ANALYSIS OF LYTIC POLYSACCHARIDE MONOOXYGENASES (LPMOS), Kaniz Fatema, University of Newcastle, Australia

International CleanUp Conference Adelaide 201918
Start Finish Duration8:00am 9:00am 1:00 Registration 9:00am 10:00am 1:00 T11: PLENARY SESSION 9:00am 9:15am 0:15 Welcome and announcements 9:15am 10:00am 0:45 EMERGING ISSUES IN DEALING WITH CONTAMINATED SITES IN AUSTRALIA, Peter Nadebaum, GHD, Australia
Hall L City Room 1 City Room 2 City Room 3 City Room 4 L1B Riverbank 8
Times 10:30am - 12:15pm Duration: 1:45
ID T21 - PFAS risk assessment, management and mitigation Chair: Rainer Lohmann
ID T22 - Legal responses to site contamination issues Chair: Andrew Pruszinski
ID T23 - Metals, metalloids and radionuclides Chair: Mark Cave
ID T24 - Risk Assessment, management and communication Chair: Geoff Borg
ID T25 - Advances in permeable reactive barriers technology Chair: Megh Mallavarapu
ID T26 - ACLCA session on young professionals Chair: Larissa Willoughby
ID T27 - Defence Symposium Closed door & Invite only
10:30 - 10:45am
0:15 113 TOXICOLOGY, RISK ASSESSMENT, AND RISK MANAGEMENT OF PFAS: STATE OF THE SCIENCE, Jason Conder, Geosyntec Consultants, United States
291 LESSONS LEARNT IN ENVIRONMENTAL AUDITING, Jean-Paul Pearce, Australian Environmental Auditors, Australia
225 WHY SITE CHARACTERISATION IS IMPORTANT: CASE STUDY OF AN AUSTRALIAN LEGACY LOW LEVEL RADIOACTIVE WASTE SITE, Tim Payne, ANSTO, Australia
434 HEALTH IMPLICATIONS OF FOOD CONTAMINANTS: GEOCHEMICAL AND ENVIRONMENTAL POLLUTANTS, Ming Hung Wong, Education University of Hong Kong, Hong Kong
364 ASSESSMENT AND SELECTION OF VARIOUS TECHNICAL GRADES ZERO VALENT IRONS FOR REMEDIATION OF CHLORINATED ETHENES FOR VALIDATING THE EFFICACY OF RHEINE SITE PERMEABLE REACTIVE BARRIER, GERMANY, Volker Birke, University of Wismar, Germany
610 INTRODUCTION, Session Chair, ACLCA, Australia
Closed door & Invite only
10:45 - 11:00am
0:15 cont.. cont.. cont.. cont.. cont.. 600 ISOTOPIC ANALYSIS TO DIFFERENTIATE GROUND-GAS SOURCES ON A CONTAMINATED SITE, Nicholas Grbich, EI Australia,
11:00 - 11:15am
0:15 414 PFAS - FOREVER CHEMICAL GLOBAL RISK AND RESPONSE, Jimmy Seow, Pumps United, Australia
147 CONSULTANT LIABILITY - THE TRUTH ABOUT BEING SUED, Sarah Mansfield, Norton Rose Fulbright, Australia
260 ASSESSMENT, REMEDIATION AND MANAGEMENT OF LEAD TAILINGS AT NORTHAMPTON WESTERN AUSTRALIA - A LEGACY OF MINING, Peter Beck, GHD, Australia
154 APPLICATION OF RISK ASSESSMENT TO MANAGE PETROLEUM HYDROCARBON IMPACTS AT AN OPERATING TERMINAL, Atul Salhotra, Risk Assessment & Management (RAM) Group, United States
214 ZVI HORIZONTAL PERMEABLE REACTIVE BARRIERS FOR THE TREATMENT OF CHLORINATED SOLVENTS VAPORS, Iason Verginelli, University of Rome Tor Vergata, Italy
601 REDEVELOPING LANDFILL POTENTIALLY IMPACTED BY MIXED CONTAMINATION, ACACIA RIDGE, BRISBANE, Emma Cornish, Golder Associates, Australia
11:15 - 11:30am
0:15 285 TOP ASSAY AND RISK ASSESSMENT: ASSESSING EXPOSURES TO PRECURSORS, Victoria Lazenby, Arcadis Australia Pacific, Australia
cont.. 184 IN THE CROSS HAIRS: A REGULATOR'S PERSPECTIVE OF SHOOTING RANGE CONTAMINATION, Matt Baronio, Environment Protection Authority Victoria, Australia
316 CHRONIC EFFECTS OF ZNO NANOPARTICLES TO EARTHWORM, EISENIA FETIDA , Chamila Samarasinghe, University of Newcastle, Australia
cont.. 602 INSTALLATION AND VALIDATION OF CRAWL SPACE VENTILATION AND SUB SLAB DEPRESSURIZATION SYSTEMS FOR MITIGATION OF TCE VAPOUR INTRUSION, David Butterfield, BlueSphere Environmental, Australia
11:30 - 11:45am
0:15 182 FATE AND TRANSPORT OF PFAS IN AN ARID SETTING, Alice Walker, GHD, Australia
266 BY THE LETTER OF THE LAW: PREPARING FOR WHEN CONSULTING GOES TO COURT, Emmylou Cooke, GHD, Australia
340 ARSENATE IN PHOSPHORUS SENSITIVE PLANTS, sedigheh abbasi, University of Newcastle, Australia
400 TOWARDS THE DEVELOPMENT OF AN AUSTRALIAN HUMAN-HEALTH SCREENING CRITERIA FOR TCE IN GROUNDWATER, Anand Chandra, Ramboll Australia, Australia
175 PERFORMANCE OF A ZVI-BASED PERMEABLE REACTIVE BARRIER FOR ABIOTIC DEGRADATION OF CHLORINATED HYDROCARBONS IN GROUNDWATER, Andrew Gray, ERM, Australia
603 ARE MICROBES FUSSY EATERS WITH SOPHISTICATED PALATES – OR IS THERE A CASE FOR NATURAL SOURCE ZONE DEPLETION AT DENSE NON-AQUEOUS PHASE LIQUID IMPACTED SITES?, Matthew Russ, GHD, Australia
11:45am - 12:00pm
0:15 289 WHISK ASSESSMENT: PFAS STOCK WATERING SCREENING LEVELS TO PROTECT PEOPLE CONSUMING HOME PRODUCED CHICKEN EGGS, Katie Richardson, Senversa, Australia
410 THE EFFECTS OF CONTAMINATION ON MARKET VALUE: VALUING CONTAMINATED LAND AND THE ALEXANDRIA LANDFILL DECISION, Anneliese Korber, Norton Rose Fulbright Australia, Australia
376 ORICA BOTANY - MERCURY CONTAINMENT BY CUT-OFF WALL USING CSM EQUIPMENT, Russell Denny, Wagstaff Piling, Australia
421 SUMMARY OF AUSTRALIA'S RISK-BASED APPROACH TO REMEDIATION, Joytishna Jit, CRCCARE / FII - UniSA, Australia
cont. 604 A CASE STUDY IN THE TRANSFER OF SITE LEASEHOLDERS AND THE IMPACTS OF CONFLICTING REGULATORY FRAMEWORKS ON CONTAMINATED SITES INVESTIGATION, Dylan Pritchard, AECOM, Australia
12:00 - 12:15pm
0:15 308 ASSESSING CONFIRMED PFAS EXPOSURE PATHWAYS TO INFORM MITIGATION, Julian Howard, GHD, Australia
145 PRINCIPLE-BASED REGULATION IN VICTORIA - IMPLICATIONS OF THE ENVIRONMENT PROTECTION AMENDMENT ACT 2018 FOR THE REGULATION AND CLEAN UP OF CONTAMINATED SITES, Mark Beaufoy, King & Wood Mallesons, Australia
394 RICE GROWTH AND SOIL ENZYME ACTIVITIES IN CADMIUM (CD) CONTAMINATED INCEPTISOL, Manoj Shrivastava, Indian Agricultural Research Institute, India
317 APPLICATION OF RAPID RISK ASSESSMENT UNDER AUDIT TO DRIVE INTERIM CLEAN-UP OF AN ABANDONED MINE SITE, Christian Wallis, CDM Smith, Australia
432 FIELD TRIAL FOR SOIL MIX PERMEABLE REACTIVE BARRIER IN LAND REMEDIATION: EXECUTION AND EARLY AGE MONITORING, ZIYAD ABUNADA, Central Queensland University, Australia
611 PANEL DISCUSSION, Session Chair, ACLCA, Australia
12:15 - 1:15pm
1:00 Lunch Lunch
TUES
DA
Y, 1
0 S
EPTE
MB
ERM
OR
NIN
G

International CleanUp Conference Adelaide 2019 19
Keynote presentations highlighted Keynote Presentation = 30 minutes (25 min + 5 min Q&A)Standard Platform Presentation = 15 minutes (12 min + 3 min Q&A)
Hall L City Room 1 City Room 2 City Room 3 City Room 4 L1B Riverbank 8
Times 10:30am - 12:15pm Duration: 1:45
ID T21 - PFAS risk assessment, management and mitigation Chair: Rainer Lohmann
ID T22 - Legal responses to site contamination issues Chair: Andrew Pruszinski
ID T23 - Metals, metalloids and radionuclides Chair: Mark Cave
ID T24 - Risk Assessment, management and communication Chair: Geoff Borg
ID T25 - Advances in permeable reactive barriers technology Chair: Megh Mallavarapu
ID T26 - ACLCA session on young professionals Chair: Larissa Willoughby
ID T27 - Defence Symposium Closed door & Invite only
10:30 - 10:45am
0:15 113 TOXICOLOGY, RISK ASSESSMENT, AND RISK MANAGEMENT OF PFAS: STATE OF THE SCIENCE, Jason Conder, Geosyntec Consultants, United States
291 LESSONS LEARNT IN ENVIRONMENTAL AUDITING, Jean-Paul Pearce, Australian Environmental Auditors, Australia
225 WHY SITE CHARACTERISATION IS IMPORTANT: CASE STUDY OF AN AUSTRALIAN LEGACY LOW LEVEL RADIOACTIVE WASTE SITE, Tim Payne, ANSTO, Australia
434 HEALTH IMPLICATIONS OF FOOD CONTAMINANTS: GEOCHEMICAL AND ENVIRONMENTAL POLLUTANTS, Ming Hung Wong, Education University of Hong Kong, Hong Kong
364 ASSESSMENT AND SELECTION OF VARIOUS TECHNICAL GRADES ZERO VALENT IRONS FOR REMEDIATION OF CHLORINATED ETHENES FOR VALIDATING THE EFFICACY OF RHEINE SITE PERMEABLE REACTIVE BARRIER, GERMANY, Volker Birke, University of Wismar, Germany
610 INTRODUCTION, Session Chair, ACLCA, Australia
Closed door & Invite only
10:45 - 11:00am
0:15 cont.. cont.. cont.. cont.. cont.. 600 ISOTOPIC ANALYSIS TO DIFFERENTIATE GROUND-GAS SOURCES ON A CONTAMINATED SITE, Nicholas Grbich, EI Australia,
11:00 - 11:15am
0:15 414 PFAS - FOREVER CHEMICAL GLOBAL RISK AND RESPONSE, Jimmy Seow, Pumps United, Australia
147 CONSULTANT LIABILITY - THE TRUTH ABOUT BEING SUED, Sarah Mansfield, Norton Rose Fulbright, Australia
260 ASSESSMENT, REMEDIATION AND MANAGEMENT OF LEAD TAILINGS AT NORTHAMPTON WESTERN AUSTRALIA - A LEGACY OF MINING, Peter Beck, GHD, Australia
154 APPLICATION OF RISK ASSESSMENT TO MANAGE PETROLEUM HYDROCARBON IMPACTS AT AN OPERATING TERMINAL, Atul Salhotra, Risk Assessment & Management (RAM) Group, United States
214 ZVI HORIZONTAL PERMEABLE REACTIVE BARRIERS FOR THE TREATMENT OF CHLORINATED SOLVENTS VAPORS, Iason Verginelli, University of Rome Tor Vergata, Italy
601 REDEVELOPING LANDFILL POTENTIALLY IMPACTED BY MIXED CONTAMINATION, ACACIA RIDGE, BRISBANE, Emma Cornish, Golder Associates, Australia
11:15 - 11:30am
0:15 285 TOP ASSAY AND RISK ASSESSMENT: ASSESSING EXPOSURES TO PRECURSORS, Victoria Lazenby, Arcadis Australia Pacific, Australia
cont.. 184 IN THE CROSS HAIRS: A REGULATOR'S PERSPECTIVE OF SHOOTING RANGE CONTAMINATION, Matt Baronio, Environment Protection Authority Victoria, Australia
316 CHRONIC EFFECTS OF ZNO NANOPARTICLES TO EARTHWORM, EISENIA FETIDA , Chamila Samarasinghe, University of Newcastle, Australia
cont.. 602 INSTALLATION AND VALIDATION OF CRAWL SPACE VENTILATION AND SUB SLAB DEPRESSURIZATION SYSTEMS FOR MITIGATION OF TCE VAPOUR INTRUSION, David Butterfield, BlueSphere Environmental, Australia
11:30 - 11:45am
0:15 182 FATE AND TRANSPORT OF PFAS IN AN ARID SETTING, Alice Walker, GHD, Australia
266 BY THE LETTER OF THE LAW: PREPARING FOR WHEN CONSULTING GOES TO COURT, Emmylou Cooke, GHD, Australia
340 ARSENATE IN PHOSPHORUS SENSITIVE PLANTS, sedigheh abbasi, University of Newcastle, Australia
400 TOWARDS THE DEVELOPMENT OF AN AUSTRALIAN HUMAN-HEALTH SCREENING CRITERIA FOR TCE IN GROUNDWATER, Anand Chandra, Ramboll Australia, Australia
175 PERFORMANCE OF A ZVI-BASED PERMEABLE REACTIVE BARRIER FOR ABIOTIC DEGRADATION OF CHLORINATED HYDROCARBONS IN GROUNDWATER, Andrew Gray, ERM, Australia
603 ARE MICROBES FUSSY EATERS WITH SOPHISTICATED PALATES – OR IS THERE A CASE FOR NATURAL SOURCE ZONE DEPLETION AT DENSE NON-AQUEOUS PHASE LIQUID IMPACTED SITES?, Matthew Russ, GHD, Australia
11:45am - 12:00pm
0:15 289 WHISK ASSESSMENT: PFAS STOCK WATERING SCREENING LEVELS TO PROTECT PEOPLE CONSUMING HOME PRODUCED CHICKEN EGGS, Katie Richardson, Senversa, Australia
410 THE EFFECTS OF CONTAMINATION ON MARKET VALUE: VALUING CONTAMINATED LAND AND THE ALEXANDRIA LANDFILL DECISION, Anneliese Korber, Norton Rose Fulbright Australia, Australia
376 ORICA BOTANY - MERCURY CONTAINMENT BY CUT-OFF WALL USING CSM EQUIPMENT, Russell Denny, Wagstaff Piling, Australia
421 SUMMARY OF AUSTRALIA'S RISK-BASED APPROACH TO REMEDIATION, Joytishna Jit, CRCCARE / FII - UniSA, Australia
cont. 604 A CASE STUDY IN THE TRANSFER OF SITE LEASEHOLDERS AND THE IMPACTS OF CONFLICTING REGULATORY FRAMEWORKS ON CONTAMINATED SITES INVESTIGATION, Dylan Pritchard, AECOM, Australia
12:00 - 12:15pm
0:15 308 ASSESSING CONFIRMED PFAS EXPOSURE PATHWAYS TO INFORM MITIGATION, Julian Howard, GHD, Australia
145 PRINCIPLE-BASED REGULATION IN VICTORIA - IMPLICATIONS OF THE ENVIRONMENT PROTECTION AMENDMENT ACT 2018 FOR THE REGULATION AND CLEAN UP OF CONTAMINATED SITES, Mark Beaufoy, King & Wood Mallesons, Australia
394 RICE GROWTH AND SOIL ENZYME ACTIVITIES IN CADMIUM (CD) CONTAMINATED INCEPTISOL, Manoj Shrivastava, Indian Agricultural Research Institute, India
317 APPLICATION OF RAPID RISK ASSESSMENT UNDER AUDIT TO DRIVE INTERIM CLEAN-UP OF AN ABANDONED MINE SITE, Christian Wallis, CDM Smith, Australia
432 FIELD TRIAL FOR SOIL MIX PERMEABLE REACTIVE BARRIER IN LAND REMEDIATION: EXECUTION AND EARLY AGE MONITORING, ZIYAD ABUNADA, Central Queensland University, Australia
611 PANEL DISCUSSION, Session Chair, ACLCA, Australia
12:15 - 1:15pm
1:00 Lunch Lunch
Orange shading indicates 30-minute keynote presentations.

International CleanUp Conference Adelaide 201920
Hall L City Room 1 City Room 2 City Room 3 City Room 4 L1B Riverbank 8
Times 1:15 - 3:00pm Duration: 1:45
ID T31 - PFAS risk assessment, management and mitigation Chair: Richard Spiese
ID T32 - Advances in nanotechnology in contamination assessment and remediation Chair: Raja Dharmarajan
ID T33 - LNAPL Natural source zone depletion Chair: Robin Wright
ID T34 - Risk Assessment, management and communication Chair: Ming Wong
ID T35 - International approaches to managing contaminated environments Chair: Joytishna Jit
ID T36 - Bioavailability of contaminantsChair: Jean Meaklim
ID T37 - Defence Symposium Closed door & Invite only
1:15 - 1:30pm
0:15 139 EXPOSURE PATHWAYS FOR PFASS AND OTHER PERSISTENT CHEMICALS IN BIOTA, Rainer Lohmann, University of Rhode Island, United States
109 FATE AND TRANSPORT OF NANO ZERO-VALENT IRON FOR ARSENIC REMEDIATION IN SUBSURFACE ENVIRONMENT AND ITS POTENTIAL ENVIRONMENTAL RISKS, Irene Lo, Hong Kong Uni of Sci & Tech, Hong Kong
263 MANAGING LNAPL SITES WITH NATURAL SOUCE ZONE DEPLETION , Andre Smit, GHD, Australia
510 RISK COMMUNICATION – AN EMPIRICAL CANON, Paul Nathanail, Land Quality Management, UK
160 OVERVIEW OF ENVIRONMENTAL CONTAMINATION ISSUES IN AFRICA: FROM POLICY, RISK AND REMEDIATION PERSPECTIVES, Lucian Obinna Chukwu, University of Lagos, Nigeria
405 THE IMPORTANCE OF BIOACCESSIBILITY TESTING FOR METAL(LOIDS) IN SOIL AT CONTAMINATED SITES , Mark Cave, British Geological Survey, United Kingdom
Closed door & Invite only
1:30 - 1:45pm
0:15 cont.. cont.. cont.. cont.. cont.. cont..
1:45 - 2:00pm
0:15 165 APPLICATION OF SOIL AMENDMENTS FOR REDUCING PFAS EXPOSURE AND BIOAVAILABILITY, Albert Juhasz, University of South Australia, Australia
138 ADSORPTIVE REMOVAL OF OXYTETRACYCLINE ANTIBIOTIC IN AQUEOUS MEDIA USING HALLOYSITE NANOCLAY, Sammani Ramanayaka, University of Sri Jayewardenepura, Sri Lanka
351 NATURAL SOURCE ZONE DEPLETION (NSZD) ASSESSMENT OF A COMPLEX SITE USING CO2 EFFLUX METHOD, Grant Cozens, Golder Associates, Australia
357 GUIDANCE FOR ASSESSING THE ECOLOGICAL RISKS OF THREATENED AND ENDANGERED SPECIES AT AQUEOUS FILM FORMING FOAM (AFFF)-IMPACTED SITES, Jason Conder, Geosyntec Consultants, United States
511 INDIAN APPROACH TO MANAGING CONTAMINATED ENVIRONMENTS, Sudeep Shukla, Amity University Haryana, India
442 CHALLENGES ASSOCIATED WITH ASSESSING THE RELATIVE ORAL BIOAVAILABILITY OF ORGANIC CHEMICALS FOR USE IN HUMAN HEALTH RISK ASSESSMENT, Yvette Lowney, Alloy, LLC, USA
2:00 - 2:15pm
0:15 170 SITE SPECIFIC INVESTIGATION LEVELS FOR PFOS AND PFOA IN SOIL, Ken Kiefer, ERM, Australia
251 INTERACTIONS BETWEEN NANOPARTICLES AND FLAME RETARDANTS IN WASTEWATER TREATMENT AGGREGATES, Anwar Khan, University of Newcastle, Australia
267 WHAT LIES BENEATH? HIGH RESOLUTION SITE CHARACTERISATION TOOLS USED TO DEVELOP LNAPL CONCEPTUAL SITE MODELS, Scott Robinson, AECOM, Australia
128 COMMUNICATION PITFALLS IN LARGE SCALE PROJECTS, Shandel Coleman, Australian Environmental Auditors, Australia
cont.. cont..
2:15 - 2:30pm
0:15 342 WHAT DOES EXCEEDENCE OF A TOXICITY REFERENCE VALUE REALLY MEAN? CASE STUDY: PFOS, Tarah Hagen, SLR Consulting (formerly of ToxConsult), Australia
345 SMECTITE-SUPPORTED NANO ZERO VALENT IRON FOR ARSENIC REMOVAL FROM WATER: KINETICS AND EFFECT OF PH , Kh Ashraf Uz-Zaman, University of Newcastle, Australia
248 NATURAL SOURCE ZONE DEPLETION ASSESSMENT USING SOIL FLUX DATA - PASSIVE FLUX TRAP VERSUS STATIC FLUX BOX METHODS, Bobby Wang, Cardno, Australia
381 A RISK BASED APPROACH FOR THE MANAGEMENT OF DISUSED RAILWAY SLEEPERS, Mezbaul Bahar, University of Newcastle, Australia
431 ENVIRONMENTAL POLLUTION AND REMEDIATION STRATEGIES IN PAKISTAN, Hafiz Asghar Chudhary, University of Agriculture Faisalabad, Pakistan
408 INFLUENCE OF SOIL CARBON AND CARBONACEOUS AMENDMENTS ON THE BIOAVAILABILITY OF BENZO[A]PYRENE IN SOILS, Luchun Duan, University of Newcastle, Australia
2:30 - 2:45pm
0:15 608 REMEDIATION OF PFAS IMPACTED WATER AT FIRE FIGHTING TRAINING SITE USING OCRA TECHNOLOGY, David Hunter, Evocra, Australia
398 INTERACTIONS OF SURFACE ACTIVATED HALLOYSITE NANOTUBE WITH IMIDACLOPRID, Md Nuruzzaman, University of Newcastle, Australia
329 THE USE OF NATURAL SOURCE ZONE DEPLETION (NSZD) AS A VALID APPROACH TO ACHIEVE CLOSURE OF AN ACTIVE LNAPL RECOVERY SYSTEM, Ruben Espinosa, AECOM, Australia
333 INHALATION BIOACCESSIBILITY OF METAL(LOID)S IN DUST FROM MINE IMPACTED SOIL, Peter Sanderson, University of Newcastle, Australia
425 PRESENCE OF MULTIPLE POLLUTANTS IN THE ENVIRONMENT: BANGLADESH PERSPECTIVES, Mohammad Rahman, University of Newcastle, Australia
278 USING ARSENIC SITE-SPECFIC BIOACCESSIBILITY IN SOILS TO REFINE REMEDIAL TARGETS, Lyn Denison, ERM, Australia
2:45 - 3:00pm
0:15 363 EFFICIENT SORPTIVE REMOVAL OF PFOS BY LAYERED DOUBLE HYDROXIDES: KINETIC AND ISOTHERM STUDY, Xin Song, Chinese Academy of Sciences, China
166 REMOVAL OF PFOA FROM CONTAMINATED WATER BY COBALT ZINC FERRITES NANOCRYSTALS, Sudeep Shukla, Amity University Haryana, India
163 BENEFITS OF A MULTIPLE LINES OF EVIDENCE APPROACH FOR NSZD, Steven gaito, AECOM, United States
334 BIOACCESSIBILTY OF HEAVY METAL(LOID)S AS IMPACTED BY GUT MICROBES, Shiv Bolan, University of Newcastle, Australia
514 SRI LANKA’S APPROACH TO MANAGING THE CONTAMINATED ENVIRONMENTS, Meththika Vithanage, University of Sri Jayewardenepura, Sri Lanka
255 ELEMENT MOBILIZATION AND BIOAVAILABILITY DURING WEATHERING AND SOIL FORMATION, Deepika Pandey, Amity University Haryana, India
3:00 - 3:30pm
0:30 Afternoon Tea Afternoon Tea
TUES
DA
Y, 1
0 S
EPTE
MB
ERA
FTER
NO
ON

International CleanUp Conference Adelaide 2019 21
Hall L City Room 1 City Room 2 City Room 3 City Room 4 L1B Riverbank 8
Times 1:15 - 3:00pm Duration: 1:45
ID T31 - PFAS risk assessment, management and mitigation Chair: Richard Spiese
ID T32 - Advances in nanotechnology in contamination assessment and remediation Chair: Raja Dharmarajan
ID T33 - LNAPL Natural source zone depletion Chair: Robin Wright
ID T34 - Risk Assessment, management and communication Chair: Ming Wong
ID T35 - International approaches to managing contaminated environments Chair: Joytishna Jit
ID T36 - Bioavailability of contaminantsChair: Jean Meaklim
ID T37 - Defence Symposium Closed door & Invite only
1:15 - 1:30pm
0:15 139 EXPOSURE PATHWAYS FOR PFASS AND OTHER PERSISTENT CHEMICALS IN BIOTA, Rainer Lohmann, University of Rhode Island, United States
109 FATE AND TRANSPORT OF NANO ZERO-VALENT IRON FOR ARSENIC REMEDIATION IN SUBSURFACE ENVIRONMENT AND ITS POTENTIAL ENVIRONMENTAL RISKS, Irene Lo, Hong Kong Uni of Sci & Tech, Hong Kong
263 MANAGING LNAPL SITES WITH NATURAL SOUCE ZONE DEPLETION , Andre Smit, GHD, Australia
510 RISK COMMUNICATION – AN EMPIRICAL CANON, Paul Nathanail, Land Quality Management, UK
160 OVERVIEW OF ENVIRONMENTAL CONTAMINATION ISSUES IN AFRICA: FROM POLICY, RISK AND REMEDIATION PERSPECTIVES, Lucian Obinna Chukwu, University of Lagos, Nigeria
405 THE IMPORTANCE OF BIOACCESSIBILITY TESTING FOR METAL(LOIDS) IN SOIL AT CONTAMINATED SITES , Mark Cave, British Geological Survey, United Kingdom
Closed door & Invite only
1:30 - 1:45pm
0:15 cont.. cont.. cont.. cont.. cont.. cont..
1:45 - 2:00pm
0:15 165 APPLICATION OF SOIL AMENDMENTS FOR REDUCING PFAS EXPOSURE AND BIOAVAILABILITY, Albert Juhasz, University of South Australia, Australia
138 ADSORPTIVE REMOVAL OF OXYTETRACYCLINE ANTIBIOTIC IN AQUEOUS MEDIA USING HALLOYSITE NANOCLAY, Sammani Ramanayaka, University of Sri Jayewardenepura, Sri Lanka
351 NATURAL SOURCE ZONE DEPLETION (NSZD) ASSESSMENT OF A COMPLEX SITE USING CO2 EFFLUX METHOD, Grant Cozens, Golder Associates, Australia
357 GUIDANCE FOR ASSESSING THE ECOLOGICAL RISKS OF THREATENED AND ENDANGERED SPECIES AT AQUEOUS FILM FORMING FOAM (AFFF)-IMPACTED SITES, Jason Conder, Geosyntec Consultants, United States
511 INDIAN APPROACH TO MANAGING CONTAMINATED ENVIRONMENTS, Sudeep Shukla, Amity University Haryana, India
442 CHALLENGES ASSOCIATED WITH ASSESSING THE RELATIVE ORAL BIOAVAILABILITY OF ORGANIC CHEMICALS FOR USE IN HUMAN HEALTH RISK ASSESSMENT, Yvette Lowney, Alloy, LLC, USA
2:00 - 2:15pm
0:15 170 SITE SPECIFIC INVESTIGATION LEVELS FOR PFOS AND PFOA IN SOIL, Ken Kiefer, ERM, Australia
251 INTERACTIONS BETWEEN NANOPARTICLES AND FLAME RETARDANTS IN WASTEWATER TREATMENT AGGREGATES, Anwar Khan, University of Newcastle, Australia
267 WHAT LIES BENEATH? HIGH RESOLUTION SITE CHARACTERISATION TOOLS USED TO DEVELOP LNAPL CONCEPTUAL SITE MODELS, Scott Robinson, AECOM, Australia
128 COMMUNICATION PITFALLS IN LARGE SCALE PROJECTS, Shandel Coleman, Australian Environmental Auditors, Australia
cont.. cont..
2:15 - 2:30pm
0:15 342 WHAT DOES EXCEEDENCE OF A TOXICITY REFERENCE VALUE REALLY MEAN? CASE STUDY: PFOS, Tarah Hagen, SLR Consulting (formerly of ToxConsult), Australia
345 SMECTITE-SUPPORTED NANO ZERO VALENT IRON FOR ARSENIC REMOVAL FROM WATER: KINETICS AND EFFECT OF PH , Kh Ashraf Uz-Zaman, University of Newcastle, Australia
248 NATURAL SOURCE ZONE DEPLETION ASSESSMENT USING SOIL FLUX DATA - PASSIVE FLUX TRAP VERSUS STATIC FLUX BOX METHODS, Bobby Wang, Cardno, Australia
381 A RISK BASED APPROACH FOR THE MANAGEMENT OF DISUSED RAILWAY SLEEPERS, Mezbaul Bahar, University of Newcastle, Australia
431 ENVIRONMENTAL POLLUTION AND REMEDIATION STRATEGIES IN PAKISTAN, Hafiz Asghar Chudhary, University of Agriculture Faisalabad, Pakistan
408 INFLUENCE OF SOIL CARBON AND CARBONACEOUS AMENDMENTS ON THE BIOAVAILABILITY OF BENZO[A]PYRENE IN SOILS, Luchun Duan, University of Newcastle, Australia
2:30 - 2:45pm
0:15 608 REMEDIATION OF PFAS IMPACTED WATER AT FIRE FIGHTING TRAINING SITE USING OCRA TECHNOLOGY, David Hunter, Evocra, Australia
398 INTERACTIONS OF SURFACE ACTIVATED HALLOYSITE NANOTUBE WITH IMIDACLOPRID, Md Nuruzzaman, University of Newcastle, Australia
329 THE USE OF NATURAL SOURCE ZONE DEPLETION (NSZD) AS A VALID APPROACH TO ACHIEVE CLOSURE OF AN ACTIVE LNAPL RECOVERY SYSTEM, Ruben Espinosa, AECOM, Australia
333 INHALATION BIOACCESSIBILITY OF METAL(LOID)S IN DUST FROM MINE IMPACTED SOIL, Peter Sanderson, University of Newcastle, Australia
425 PRESENCE OF MULTIPLE POLLUTANTS IN THE ENVIRONMENT: BANGLADESH PERSPECTIVES, Mohammad Rahman, University of Newcastle, Australia
278 USING ARSENIC SITE-SPECFIC BIOACCESSIBILITY IN SOILS TO REFINE REMEDIAL TARGETS, Lyn Denison, ERM, Australia
2:45 - 3:00pm
0:15 363 EFFICIENT SORPTIVE REMOVAL OF PFOS BY LAYERED DOUBLE HYDROXIDES: KINETIC AND ISOTHERM STUDY, Xin Song, Chinese Academy of Sciences, China
166 REMOVAL OF PFOA FROM CONTAMINATED WATER BY COBALT ZINC FERRITES NANOCRYSTALS, Sudeep Shukla, Amity University Haryana, India
163 BENEFITS OF A MULTIPLE LINES OF EVIDENCE APPROACH FOR NSZD, Steven gaito, AECOM, United States
334 BIOACCESSIBILTY OF HEAVY METAL(LOID)S AS IMPACTED BY GUT MICROBES, Shiv Bolan, University of Newcastle, Australia
514 SRI LANKA’S APPROACH TO MANAGING THE CONTAMINATED ENVIRONMENTS, Meththika Vithanage, University of Sri Jayewardenepura, Sri Lanka
255 ELEMENT MOBILIZATION AND BIOAVAILABILITY DURING WEATHERING AND SOIL FORMATION, Deepika Pandey, Amity University Haryana, India
3:00 - 3:30pm
0:30 Afternoon Tea Afternoon Tea
Orange shading indicates 30-minute keynote presentations.
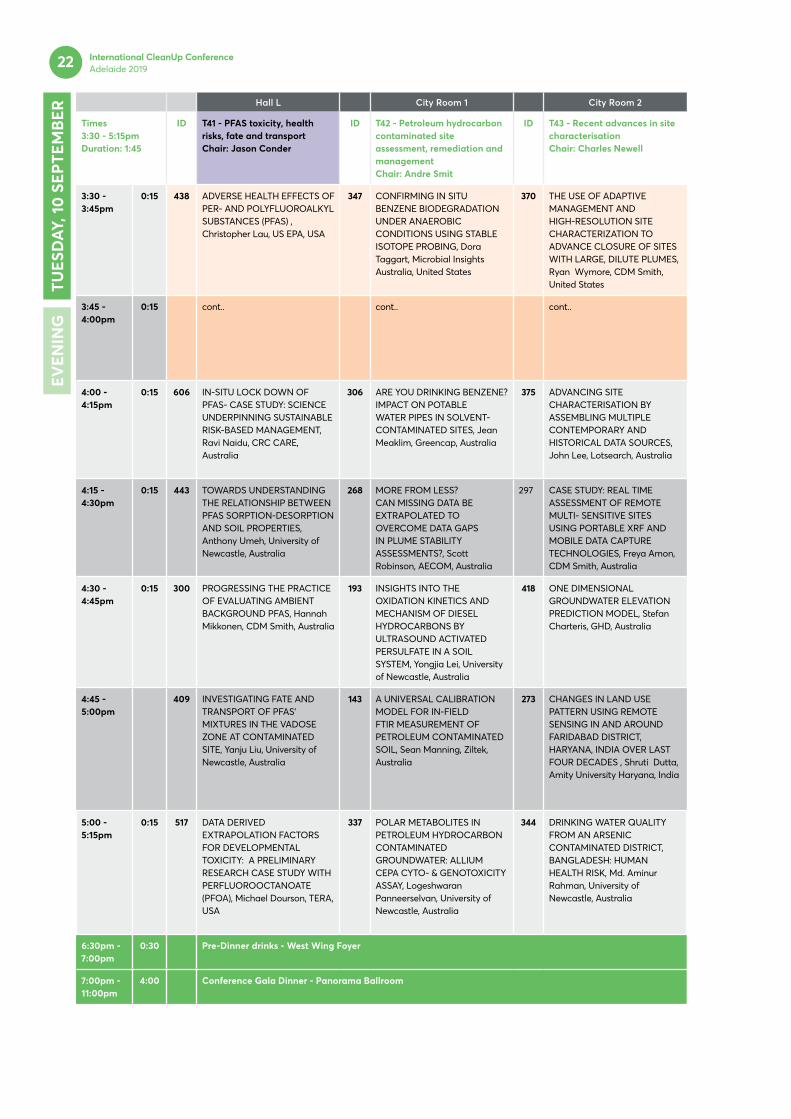
International CleanUp Conference Adelaide 201922
Hall L City Room 1 City Room 2 City Room 3 City Room 4 L1B Riverbank 8
Times 3:30 - 5:15pm Duration: 1:45
ID T41 - PFAS toxicity, health risks, fate and transport Chair: Jason Conder
ID T42 - Petroleum hydrocarbon contaminated site assessment, remediation and management Chair: Andre Smit
ID T43 - Recent advances in site characterisation Chair: Charles Newell
ID T44 - Approaches to prevention of contamination Chair: Bruce Kennedy
ID T45 - Assessment, remediation and management of contaminated wastewater and surface waterChair: Obinna L. Chukwu
ID T46 - Adverse impacts of agriculture on soil, water and food quality Chair: Hafiz Asghar Chudhary
ID T47 - Defence Symposium Closed door & Invite only
3:30 - 3:45pm
0:15 438 ADVERSE HEALTH EFFECTS OF PER- AND POLYFLUOROALKYL SUBSTANCES (PFAS) , Christopher Lau, US EPA, USA
347 CONFIRMING IN SITU BENZENE BIODEGRADATION UNDER ANAEROBIC CONDITIONS USING STABLE ISOTOPE PROBING, Dora Taggart, Microbial Insights Australia, United States
370 THE USE OF ADAPTIVE MANAGEMENT AND HIGH-RESOLUTION SITE CHARACTERIZATION TO ADVANCE CLOSURE OF SITES WITH LARGE, DILUTE PLUMES, Ryan Wymore, CDM Smith, United States
117 REGULATORY APPROACH TO PREVENTING POLLUTION, Kristin Wasley, EPA Victoria, Australia
190 FATE AND TRANSPORT OF PFASS IN SURFACE WATERS AND SEDIMENTS: POTENTIAL FOR LONG RANGE TRANSPORT?, Ian Ross, Arcadis, United Kingdom
245 ARSENIC IN RICE FROM BANGLADESH: GEOGRAPHICAL VARIATION, CANCER RISK AND MITIGATION OPTIONS , Mohammad Rahman, University of Newcastle, Australia
Closed door and invite only
3:45 - 4:00pm
0:15 cont.. cont.. cont.. cont.. 322 cont.. 322 EFFECT OF ZINC AND CADMIUM ON HYDROPONICALLY GROWN MUNGBEAN VARIETIES, Md Harunur Rashid, University of Newcastle, Australia
4:00 - 4:15pm
0:15 606 IN-SITU LOCK DOWN OF PFAS- CASE STUDY: SCIENCE UNDERPINNING SUSTAINABLE RISK-BASED MANAGEMENT, Ravi Naidu, CRC CARE, Australia
306 ARE YOU DRINKING BENZENE? IMPACT ON POTABLE WATER PIPES IN SOLVENT-CONTAMINATED SITES, Jean Meaklim, Greencap, Australia
375 ADVANCING SITE CHARACTERISATION BY ASSEMBLING MULTIPLE CONTEMPORARY AND HISTORICAL DATA SOURCES, John Lee, Lotsearch, Australia
172 A NEW ENVIRONMENT PROTECTION ACT FOR VICTORIA - IMPLICATIONS, Robyn Madsen, GHD, Australia
309 DERIVATION OF WATER QUALITY GUIDELINE VALUE FOR MARINE DISCHARGE OF MONOETHYLENE GLYCOL, Ken Kiefer, ERM, Australia
270 ARE ROOT ELONGATION ASSAYS SUITABLE FOR ESTABLISHING METALLIC ANION ECOTOXICITY THRESHOLDS?, Marjana Yeasmin, University of Newcastle, Australia
4:15 - 4:30pm
0:15 443 TOWARDS UNDERSTANDING THE RELATIONSHIP BETWEEN PFAS SORPTION-DESORPTION AND SOIL PROPERTIES, Anthony Umeh, University of Newcastle, Australia
268 MORE FROM LESS? CAN MISSING DATA BE EXTRAPOLATED TO OVERCOME DATA GAPS IN PLUME STABILITY ASSESSMENTS?, Scott Robinson, AECOM, Australia
297 CASE STUDY: REAL TIME ASSESSMENT OF REMOTE MULTI- SENSITIVE SITES USING PORTABLE XRF AND MOBILE DATA CAPTURE TECHNOLOGIES, Freya Amon, CDM Smith, Australia
cont.. 406 ADSORPTION OF PB(?) IN WASTEWATER BY MODIFIED IRON ORE TAILINGS, Yongliang Chen, University of Newcastle, Australia
129 APPLICATION OF DATA-DRIVEN PREDICTION MODELS FOR MODELING SEAWATER INTRUSION IN AQUIFERS , Alvin Lal, James Cook University, Australia
4:30 - 4:45pm
0:15 300 PROGRESSING THE PRACTICE OF EVALUATING AMBIENT BACKGROUND PFAS, Hannah Mikkonen, CDM Smith, Australia
193 INSIGHTS INTO THE OXIDATION KINETICS AND MECHANISM OF DIESEL HYDROCARBONS BY ULTRASOUND ACTIVATED PERSULFATE IN A SOIL SYSTEM, Yongjia Lei, University of Newcastle, Australia
418 ONE DIMENSIONAL GROUNDWATER ELEVATION PREDICTION MODEL, Stefan Charteris, GHD, Australia
326 THE IMPACT OF CLIMATE EVOLUTION ON CONTAMINATED GROUNDWATER RESOURCES: SOLVING A SOLVABLE HUMAN AND ECOLOGICAL HEALTH CRISIS IN THE MAKING, Scott Warner, Ramboll, United States
239 ADSORPTION AND CO-PRECIPITATION OF COBALT ON BIOMASS MANGANESE OXIDE, James O'Connor, Ventia, Australia
238 GEOGRAPHICAL VARIATION OF CADMIUM DISTRIBUTION IN RICE FROM BANGLADESH: A MARKET BASKET SURVEY, Syfullah Shahriar, University of Newcastle, Australia
4:45 - 5:00pm
409 INVESTIGATING FATE AND TRANSPORT OF PFAS' MIXTURES IN THE VADOSE ZONE AT CONTAMINATED SITE, Yanju Liu, University of Newcastle, Australia
143 A UNIVERSAL CALIBRATION MODEL FOR IN-FIELD FTIR MEASUREMENT OF PETROLEUM CONTAMINATED SOIL, Sean Manning, Ziltek, Australia
273 CHANGES IN LAND USE PATTERN USING REMOTE SENSING IN AND AROUND FARIDABAD DISTRICT, HARYANA, INDIA OVER LAST FOUR DECADES , Shruti Dutta, Amity University Haryana, India
350 USE OF ENVIRONMENTAL CONTROL ENCLOSURES TO MANAGE VOC EMISSIONS FOR REMEDIATION PROJECTS – WHAT IS BEST PRACTICE?, John Hunt, Ventia, Australia
391 ASSESSMENT OF PHYSICO-CHEMICAL PROPERTIES OF SOIL AND GROUNDWATER POLLUTION WITH POST METHANATED DISTILLERY EFFLUENT IRRIGATION IN WESTERN UTTAR PRADESH OF INDIA, U.P. Shahi, SVP Univ of Ag & Tech, India
393 ADDITION OF ORGANIC MATTER CAN REDUCE ARSENIC UPTAKE IN WHEAT, Jajati Mandal, Bihar Agricultural University, India
5:00 - 5:15pm
0:15 517 DATA DERIVED EXTRAPOLATION FACTORS FOR DEVELOPMENTAL TOXICITY: A PRELIMINARY RESEARCH CASE STUDY WITH PERFLUOROOCTANOATE (PFOA), Michael Dourson, TERA, USA
337 POLAR METABOLITES IN PETROLEUM HYDROCARBON CONTAMINATED GROUNDWATER: ALLIUM CEPA CYTO- & GENOTOXICITY ASSAY, Logeshwaran Panneerselvan, University of Newcastle, Australia
344 DRINKING WATER QUALITY FROM AN ARSENIC CONTAMINATED DISTRICT, BANGLADESH: HUMAN HEALTH RISK, Md. Aminur Rahman, University of Newcastle, Australia
192 A COMPARISON OF TREATMENT METHODS FOR PFAS IMPACTED CONCRETE: RESULTS FROM LABORATORY AND FIELD TRIALS, Danielle Toase, Arcadis Australia Pacific, Australia
353 STORM WATER - UST’S CATCH BASIN INSERT - A REVOLUTION IN “AT SOURCE” STORM WATER QUALITY IMPROVEMENT-ONTAMINATION SOURCE INTO A NEW WATER SOURCE / RESOURCE, Craig Rothleitner, UST, Australia
433 EFFECT OF ARBUSCULAR MYCORRHIZAL FUNGI ON NUTRIENT CONTENT OF FINGER MILLET UNDER ZINC CONTAMINATION, Deeksha Krishna, Fiji National University, Fiji
6:30pm - 7:00pm
0:30 Pre-Dinner drinks - West Wing Foyer Pre-Dinner drinks - West Wing Foyer
7:00pm - 11:00pm
4:00 Conference Gala Dinner - Panorama Ballroom Conference Gala Dinner - Panorama Ballroom
TUES
DA
Y, 1
0 S
EPTE
MB
EREV
ENIN
G

International CleanUp Conference Adelaide 2019 23
Hall L City Room 1 City Room 2 City Room 3 City Room 4 L1B Riverbank 8
Times 3:30 - 5:15pm Duration: 1:45
ID T41 - PFAS toxicity, health risks, fate and transport Chair: Jason Conder
ID T42 - Petroleum hydrocarbon contaminated site assessment, remediation and management Chair: Andre Smit
ID T43 - Recent advances in site characterisation Chair: Charles Newell
ID T44 - Approaches to prevention of contamination Chair: Bruce Kennedy
ID T45 - Assessment, remediation and management of contaminated wastewater and surface waterChair: Obinna L. Chukwu
ID T46 - Adverse impacts of agriculture on soil, water and food quality Chair: Hafiz Asghar Chudhary
ID T47 - Defence Symposium Closed door & Invite only
3:30 - 3:45pm
0:15 438 ADVERSE HEALTH EFFECTS OF PER- AND POLYFLUOROALKYL SUBSTANCES (PFAS) , Christopher Lau, US EPA, USA
347 CONFIRMING IN SITU BENZENE BIODEGRADATION UNDER ANAEROBIC CONDITIONS USING STABLE ISOTOPE PROBING, Dora Taggart, Microbial Insights Australia, United States
370 THE USE OF ADAPTIVE MANAGEMENT AND HIGH-RESOLUTION SITE CHARACTERIZATION TO ADVANCE CLOSURE OF SITES WITH LARGE, DILUTE PLUMES, Ryan Wymore, CDM Smith, United States
117 REGULATORY APPROACH TO PREVENTING POLLUTION, Kristin Wasley, EPA Victoria, Australia
190 FATE AND TRANSPORT OF PFASS IN SURFACE WATERS AND SEDIMENTS: POTENTIAL FOR LONG RANGE TRANSPORT?, Ian Ross, Arcadis, United Kingdom
245 ARSENIC IN RICE FROM BANGLADESH: GEOGRAPHICAL VARIATION, CANCER RISK AND MITIGATION OPTIONS , Mohammad Rahman, University of Newcastle, Australia
Closed door and invite only
3:45 - 4:00pm
0:15 cont.. cont.. cont.. cont.. 322 cont.. 322 EFFECT OF ZINC AND CADMIUM ON HYDROPONICALLY GROWN MUNGBEAN VARIETIES, Md Harunur Rashid, University of Newcastle, Australia
4:00 - 4:15pm
0:15 606 IN-SITU LOCK DOWN OF PFAS- CASE STUDY: SCIENCE UNDERPINNING SUSTAINABLE RISK-BASED MANAGEMENT, Ravi Naidu, CRC CARE, Australia
306 ARE YOU DRINKING BENZENE? IMPACT ON POTABLE WATER PIPES IN SOLVENT-CONTAMINATED SITES, Jean Meaklim, Greencap, Australia
375 ADVANCING SITE CHARACTERISATION BY ASSEMBLING MULTIPLE CONTEMPORARY AND HISTORICAL DATA SOURCES, John Lee, Lotsearch, Australia
172 A NEW ENVIRONMENT PROTECTION ACT FOR VICTORIA - IMPLICATIONS, Robyn Madsen, GHD, Australia
309 DERIVATION OF WATER QUALITY GUIDELINE VALUE FOR MARINE DISCHARGE OF MONOETHYLENE GLYCOL, Ken Kiefer, ERM, Australia
270 ARE ROOT ELONGATION ASSAYS SUITABLE FOR ESTABLISHING METALLIC ANION ECOTOXICITY THRESHOLDS?, Marjana Yeasmin, University of Newcastle, Australia
4:15 - 4:30pm
0:15 443 TOWARDS UNDERSTANDING THE RELATIONSHIP BETWEEN PFAS SORPTION-DESORPTION AND SOIL PROPERTIES, Anthony Umeh, University of Newcastle, Australia
268 MORE FROM LESS? CAN MISSING DATA BE EXTRAPOLATED TO OVERCOME DATA GAPS IN PLUME STABILITY ASSESSMENTS?, Scott Robinson, AECOM, Australia
297 CASE STUDY: REAL TIME ASSESSMENT OF REMOTE MULTI- SENSITIVE SITES USING PORTABLE XRF AND MOBILE DATA CAPTURE TECHNOLOGIES, Freya Amon, CDM Smith, Australia
cont.. 406 ADSORPTION OF PB(?) IN WASTEWATER BY MODIFIED IRON ORE TAILINGS, Yongliang Chen, University of Newcastle, Australia
129 APPLICATION OF DATA-DRIVEN PREDICTION MODELS FOR MODELING SEAWATER INTRUSION IN AQUIFERS , Alvin Lal, James Cook University, Australia
4:30 - 4:45pm
0:15 300 PROGRESSING THE PRACTICE OF EVALUATING AMBIENT BACKGROUND PFAS, Hannah Mikkonen, CDM Smith, Australia
193 INSIGHTS INTO THE OXIDATION KINETICS AND MECHANISM OF DIESEL HYDROCARBONS BY ULTRASOUND ACTIVATED PERSULFATE IN A SOIL SYSTEM, Yongjia Lei, University of Newcastle, Australia
418 ONE DIMENSIONAL GROUNDWATER ELEVATION PREDICTION MODEL, Stefan Charteris, GHD, Australia
326 THE IMPACT OF CLIMATE EVOLUTION ON CONTAMINATED GROUNDWATER RESOURCES: SOLVING A SOLVABLE HUMAN AND ECOLOGICAL HEALTH CRISIS IN THE MAKING, Scott Warner, Ramboll, United States
239 ADSORPTION AND CO-PRECIPITATION OF COBALT ON BIOMASS MANGANESE OXIDE, James O'Connor, Ventia, Australia
238 GEOGRAPHICAL VARIATION OF CADMIUM DISTRIBUTION IN RICE FROM BANGLADESH: A MARKET BASKET SURVEY, Syfullah Shahriar, University of Newcastle, Australia
4:45 - 5:00pm
409 INVESTIGATING FATE AND TRANSPORT OF PFAS' MIXTURES IN THE VADOSE ZONE AT CONTAMINATED SITE, Yanju Liu, University of Newcastle, Australia
143 A UNIVERSAL CALIBRATION MODEL FOR IN-FIELD FTIR MEASUREMENT OF PETROLEUM CONTAMINATED SOIL, Sean Manning, Ziltek, Australia
273 CHANGES IN LAND USE PATTERN USING REMOTE SENSING IN AND AROUND FARIDABAD DISTRICT, HARYANA, INDIA OVER LAST FOUR DECADES , Shruti Dutta, Amity University Haryana, India
350 USE OF ENVIRONMENTAL CONTROL ENCLOSURES TO MANAGE VOC EMISSIONS FOR REMEDIATION PROJECTS – WHAT IS BEST PRACTICE?, John Hunt, Ventia, Australia
391 ASSESSMENT OF PHYSICO-CHEMICAL PROPERTIES OF SOIL AND GROUNDWATER POLLUTION WITH POST METHANATED DISTILLERY EFFLUENT IRRIGATION IN WESTERN UTTAR PRADESH OF INDIA, U.P. Shahi, SVP Univ of Ag & Tech, India
393 ADDITION OF ORGANIC MATTER CAN REDUCE ARSENIC UPTAKE IN WHEAT, Jajati Mandal, Bihar Agricultural University, India
5:00 - 5:15pm
0:15 517 DATA DERIVED EXTRAPOLATION FACTORS FOR DEVELOPMENTAL TOXICITY: A PRELIMINARY RESEARCH CASE STUDY WITH PERFLUOROOCTANOATE (PFOA), Michael Dourson, TERA, USA
337 POLAR METABOLITES IN PETROLEUM HYDROCARBON CONTAMINATED GROUNDWATER: ALLIUM CEPA CYTO- & GENOTOXICITY ASSAY, Logeshwaran Panneerselvan, University of Newcastle, Australia
344 DRINKING WATER QUALITY FROM AN ARSENIC CONTAMINATED DISTRICT, BANGLADESH: HUMAN HEALTH RISK, Md. Aminur Rahman, University of Newcastle, Australia
192 A COMPARISON OF TREATMENT METHODS FOR PFAS IMPACTED CONCRETE: RESULTS FROM LABORATORY AND FIELD TRIALS, Danielle Toase, Arcadis Australia Pacific, Australia
353 STORM WATER - UST’S CATCH BASIN INSERT - A REVOLUTION IN “AT SOURCE” STORM WATER QUALITY IMPROVEMENT-ONTAMINATION SOURCE INTO A NEW WATER SOURCE / RESOURCE, Craig Rothleitner, UST, Australia
433 EFFECT OF ARBUSCULAR MYCORRHIZAL FUNGI ON NUTRIENT CONTENT OF FINGER MILLET UNDER ZINC CONTAMINATION, Deeksha Krishna, Fiji National University, Fiji
6:30pm - 7:00pm
0:30 Pre-Dinner drinks - West Wing Foyer Pre-Dinner drinks - West Wing Foyer
7:00pm - 11:00pm
4:00 Conference Gala Dinner - Panorama Ballroom Conference Gala Dinner - Panorama Ballroom
Orange shading indicates 30-minute keynote presentations.

International CleanUp Conference Adelaide 201924
Start Finish Duration8:00am 9:00am 1:00 Registration 9:00am 10:00am 1:00 W11: PLENARY SESSION 9:00am 9:15am 0:15 Welcome and announcements 9:15am 10:00am 0:45 NATURE BASED SOLUTIONS TO CLIMATE CHANGE: EVIDENCE FROM AFRICA AND ASIA, Pushpam Kumar, UN Environment, Kenya
Hall L City Room 1 City Room 2 City Room 3 City Room 4 L1B Riverbank 8
Times 10:30am - 12:15pm Duration: 1:45
ID W21 - PFAS analysis and measurementChair: Cheryl Lim
ID W22 - Challenges with PFAS remediation and managementChair: Tessa Pancras
ID W23 - Innovative in-situ and ex-situ remediation technologiesChair: Kurt Pennell
ID W24 - Advances in vapour intrusion and volatiles assessment, management and remediationChair: Rob Hogan
ID W25 - Assessment and remediation of organic contaminantsChair: Volker Birke
ID W26 - Asbestos and other emerging contaminantsChair: Peter Nadebaum
ID W27 - Urban redevelopment and rehabilitationChair: Paul Nathanail
10:30 - 10:45am
0:15 369 ANALYSIS OF EMERGING PFAS CONTAMINANTS USING HIGH RESOLUTION ACCURATE MASS SPECTROMETRY, Robert Symons, Eurofins | mgt, Australia
292 BENCH-SCALE EVALUATION OF FLOCCULANT TECHNOLOGY FOR TREATING PFAS-CONTAMINATED WATER, Kent Sorenson, CDM Smith, United States
396 OPTIMISATION OF INTEGRATED AND ADAPTIVE REMEDIATION DESIGN AND OPERATIONS SCHEDULING, Larry Deschaine, HydroGeoLogic, United States
153 USE OF SUB-SLAB SOIL VAPOUR CONCENTRATIONS TO ESTIMATE INDOOR AIR INHALATION RISK USING THE VAPOUR CLOUD MODEL, Atul Salhotra, Risk Assessment & Management (RAM) Group, United States
287 FIELD PILOT STUDIES FOR INSITU STABILISATION/SOLIDIFICATION (ISS) OF HYDROCARBON CONTAMINATED SEDIMENTS IN KENDALL BAY, SYDNEY, NEW SOUTH WALES (NSW), AUSTRALIA, Matthew Clutterham, Ventia, Australia
437 HUMAN EXPOSURE TO EMERGING ENVIRONMENTAL CHEMICALS: A COMPREHENSIVE ANALYSIS IN INDOOR DUST, Kurunthachalam Kannan, New York State Department of Health, USA
276 HOW MUCH WILL YOUR REMEDIATION PROJECT REALLY COST? , John Hunt, Ventia, Australia
10:45 - 11:00am
0:15 cont.. cont.. cont.. cont.. 130 PHOTOLYTIC DEGRADATION OF BETRIXABAN IN AQUEOUS SOLUTIONS, Lokesh Padhye, The University of Auckland, New Zealand
cont.. cont..
11:00 - 11:15am
0:15 164 PFAS TOP ASSAY INTERLABORATORY STUDY - SUPPORTING ANALYTICAL LABORATORIES, Raluca Iavetz, National Measurement Institute, Australia
301 QUICK & DIRTY? MOBILITY OF PFAS IN GROUND AND SURFACE WATER: A FOUR SITE CASE STUDY, Christopher Sandiford, Senversa, Australia
384 ADVANCES IN HORIZONTAL REMEDIATION WELLS: THE HRX WELL, Dan Ombalski, Ellingson DTD, United States
386 EFFICIENT VAPOR INTRUSION INVESTIGATIONS IN LARGE MANUFACTURING BUILDINGS, Heather Rectanus, Geosyntec, United States
368 OHS&E PLANNING OF PFAS INVESTIGATION PROGRAMS: ARE ALL SUNSCREENS THE SAME? ARE WE MISSING SOMETHING?, Antti Mikkonen, CDM Smith, Australia
328 INNOVATIVE SCALABLE APPROACHES FOR THE ASSESSMENT AND REMEDIATION OF ASBESTOS-IN-SOIL (ASBINS), Ross McFarland, AECOM, Australia
299 REVISITING REMEDIATION - EVALUATING FIELD AND LABORATORY DATA TO ASSESS THE SUCCESS OF A HISTORICAL REMEDIATION PROJECT, Zoe Smith, AECOM, Australia
11:15 - 11:30am
0:15 167 IMPROVING MEASUREMENT RELIABILITY OF THE PFAS TOP ASSAY, Annette Nolan, Ramboll, Australia
281 LOGISTICAL CHALLENGES TRANSPORTING PFAS IMPACTED SOILS FROM A REMOTE LOCATION TO VICTORIA FOR THERMAL TREATMENT, Andrew Thomas, Enviropacific Services, Australia
cont.. cont.. 288 TAMING THE SHREW: REFINING PFAS REHABILITATION GOALS BY UNDERSTANDING YOUR IMPACTS AND YOUR ECOSYSTEM, Katie Richardson, Senversa, Australia
206 AN ADAPTIVE APPROACH TO COMMUNITY ENGAGEMENT TO MANAGE LEGACY ASBESTOS CONTAMINATION IN A RESIDENTIAL SETTING, Hamish Campbell, NSW Environment Protection Authority, Australia
293 ACHIEVING THE SUCCESSFUL DELIVERY OF ONE OF SYDNEY'S LARGEST REMEDIATION PROJECTS: BARANGAROO, Adam Fletcher, Ventia, Australia
11:30 - 11:45am
0:15 275 FACT CHECK: DO LABORATORY METHODS REALLY AFFECT THE QUALITY OF PFAS DATA?, Giorgio De Nola, SLR Consulting, Australia
168 A NOVEL APPROACH TO PRIORITISING PFAS SOURCE ZONES FOR REMEDIAL ACTION USING A BROAD SCALE MASS CONTRIBUTION ASSESSMENT, Gemma Wakefield, Golder Associates, Australia
373 ISCO IN AUSTRALIA: WHAT IS THE STATE OF THE ART?, Denton Mauldin, Kleinfelder Australia, Australia
169 AN ALGORITHM FOR CREATING REASONABLE WORST CASE EXPOSURE MAPS FOR VAPOUR INTRUSION SCREENING, Richard Evans, SA Health, Australia
302 OCCURRENCE AND DISTRIBUTION OF OXYGENATED POLYCYCLIC AROMATIC HYDROCARBONS (OXY-PAHS) IN SOILS OF AN AUSTRALIAN INDUSTRIAL CITY, Oluyoye Idowu, University of Newcastle, Australia
124 COMMUNITY SCALE ASBESTOS REMEDIATION USING DIGITAL DATA CAPTURE TOOLS, Ashton Betti, Senversa, Australia
305 WHAT'S UNDER THE TENT? AN INSIGHT INTO THE REMEDIAL OPERATIONS OF THE BARANGAROO BLOCKS 4 & 5 REMEDIATION PROJECT, Daniel O'Hanlon, Ventia, Australia
11:45 - 12:00pm
0:15 314 APPLICATION AND CONFIRMATION OF TOTAL OXIDIZED PRECURSORS ASSAY (TOPA) TO MONITOR PFAS WITH A PORTABLE READING KIT, Md Al Amin, University of Newcastle, Australia
232 DERIVATION AND SELECTION OF AQUATIC PFOS SCREENING LEVELS FOR SITE INVESTIGATIONS, Heather Lanza, GHD, Australia
176 RADIO FREQUENCY HEATING FOR IN SITU THERMAL TREATMENT OF ETHYLENE DICHLORIDE AND 1,1,2-TRICHLOROETHANE IN GROUNDWATER, Andrew Gray, ERM, Australia
173 VOLATILE CHLORINATED HYDROCARBON VAPOUR INTRUSION: ESTABLISHING A BASIS FOR PUBLIC HEALTH ACTION FOR TRICHLOROETHENE, Ian Delaere, SA Health, Australia
240 SORPTION AND DESORPTION BEHAVIOUR OF 2,4-D IN NINE SELECTED URBAN SOILS OF AUSTRALIA, Md Meftaul Islam, University of Newcastle, Australia
194 BIOBURDEN OF DIOXIN-LIKE POLYCHLORINATED BIPHENYLS (PCBS) IN A TROPICAL CREEK: HEALTH RISK IMPLICATIONS, Amii Usese, University of Lagos, Nigeria
120 ELIZABETH QUAY DEVELOPMENT, PERTH WA: CASE STUDY, David Sim, RPS, Australia
12:00 - 12:15pm
0:15 605 BALANCING REGULATORY PFAS QUANTIFICATION WITH EMERGING PFAS IDENTIFICATION USING LC-MS/MS AND LC-Q/TOF, Tarun Anumol, Agilent Technologies, USA
335 DOES AGRICULTURAL LAND CONTAMINATED WITH PFAS NEED MANAGEMENT?, Antti Mikkonen, University of South Australia, Australia
123 THE HORIZONTAL REACTIVE MEDIA TREATMENT WELL (HRX WELL®) FOR PASSIVE IN SITU REMEDIATION: DESIGN, IMPLEMENTATION, AND FIELD DEMONSTRATION, Peter Storch, Arcadis, Australia
218 INSTALLATION AND VALIDATION OF CRAWL SPACE VENTILATION AND SUB SLAB DEPRESSURIZATION SYSTEMS FOR MITIGATION OF TCE VAPOUR INTRUSION, David Butterfield, BlueSphere Environmental, Australia
307 EVALUATION OF GENOTOXICITY OF PERFLUOROOCTANE SULFONATE (PFOS) TO ALLIUM CEPA L., Anithadevi Kenday Sivaram, University of Newcastle, Australia
415 NOT IN OUR BACKYARD: RESEARCH FINDINGS ON THE EMERGING CONTAMINATES FROM CLANDESTINE LABORATORIES AND THE IMPACT ON THE HEALTH AND ENVIRONMENT OF REGIONAL AUSTRALIAN COMMUNITIES, Juliet Duffy, Regional EnviroScience, Australia
224 EFFECTIVE PFAS REHABILITATION OF A LARGE FORMER FIRE TRAINING FACILITY, Michael Rehfisch, Senversa, Australia
12:15 - 1:15pm
1:00 Lunch Lunch
WED
NES
DA
Y, 1
1 SE
PTE
MB
ERM
OR
NIN
G

International CleanUp Conference Adelaide 2019 25
Hall L City Room 1 City Room 2 City Room 3 City Room 4 L1B Riverbank 8
Times 10:30am - 12:15pm Duration: 1:45
ID W21 - PFAS analysis and measurementChair: Cheryl Lim
ID W22 - Challenges with PFAS remediation and managementChair: Tessa Pancras
ID W23 - Innovative in-situ and ex-situ remediation technologiesChair: Kurt Pennell
ID W24 - Advances in vapour intrusion and volatiles assessment, management and remediationChair: Rob Hogan
ID W25 - Assessment and remediation of organic contaminantsChair: Volker Birke
ID W26 - Asbestos and other emerging contaminantsChair: Peter Nadebaum
ID W27 - Urban redevelopment and rehabilitationChair: Paul Nathanail
10:30 - 10:45am
0:15 369 ANALYSIS OF EMERGING PFAS CONTAMINANTS USING HIGH RESOLUTION ACCURATE MASS SPECTROMETRY, Robert Symons, Eurofins | mgt, Australia
292 BENCH-SCALE EVALUATION OF FLOCCULANT TECHNOLOGY FOR TREATING PFAS-CONTAMINATED WATER, Kent Sorenson, CDM Smith, United States
396 OPTIMISATION OF INTEGRATED AND ADAPTIVE REMEDIATION DESIGN AND OPERATIONS SCHEDULING, Larry Deschaine, HydroGeoLogic, United States
153 USE OF SUB-SLAB SOIL VAPOUR CONCENTRATIONS TO ESTIMATE INDOOR AIR INHALATION RISK USING THE VAPOUR CLOUD MODEL, Atul Salhotra, Risk Assessment & Management (RAM) Group, United States
287 FIELD PILOT STUDIES FOR INSITU STABILISATION/SOLIDIFICATION (ISS) OF HYDROCARBON CONTAMINATED SEDIMENTS IN KENDALL BAY, SYDNEY, NEW SOUTH WALES (NSW), AUSTRALIA, Matthew Clutterham, Ventia, Australia
437 HUMAN EXPOSURE TO EMERGING ENVIRONMENTAL CHEMICALS: A COMPREHENSIVE ANALYSIS IN INDOOR DUST, Kurunthachalam Kannan, New York State Department of Health, USA
276 HOW MUCH WILL YOUR REMEDIATION PROJECT REALLY COST? , John Hunt, Ventia, Australia
10:45 - 11:00am
0:15 cont.. cont.. cont.. cont.. 130 PHOTOLYTIC DEGRADATION OF BETRIXABAN IN AQUEOUS SOLUTIONS, Lokesh Padhye, The University of Auckland, New Zealand
cont.. cont..
11:00 - 11:15am
0:15 164 PFAS TOP ASSAY INTERLABORATORY STUDY - SUPPORTING ANALYTICAL LABORATORIES, Raluca Iavetz, National Measurement Institute, Australia
301 QUICK & DIRTY? MOBILITY OF PFAS IN GROUND AND SURFACE WATER: A FOUR SITE CASE STUDY, Christopher Sandiford, Senversa, Australia
384 ADVANCES IN HORIZONTAL REMEDIATION WELLS: THE HRX WELL, Dan Ombalski, Ellingson DTD, United States
386 EFFICIENT VAPOR INTRUSION INVESTIGATIONS IN LARGE MANUFACTURING BUILDINGS, Heather Rectanus, Geosyntec, United States
368 OHS&E PLANNING OF PFAS INVESTIGATION PROGRAMS: ARE ALL SUNSCREENS THE SAME? ARE WE MISSING SOMETHING?, Antti Mikkonen, CDM Smith, Australia
328 INNOVATIVE SCALABLE APPROACHES FOR THE ASSESSMENT AND REMEDIATION OF ASBESTOS-IN-SOIL (ASBINS), Ross McFarland, AECOM, Australia
299 REVISITING REMEDIATION - EVALUATING FIELD AND LABORATORY DATA TO ASSESS THE SUCCESS OF A HISTORICAL REMEDIATION PROJECT, Zoe Smith, AECOM, Australia
11:15 - 11:30am
0:15 167 IMPROVING MEASUREMENT RELIABILITY OF THE PFAS TOP ASSAY, Annette Nolan, Ramboll, Australia
281 LOGISTICAL CHALLENGES TRANSPORTING PFAS IMPACTED SOILS FROM A REMOTE LOCATION TO VICTORIA FOR THERMAL TREATMENT, Andrew Thomas, Enviropacific Services, Australia
cont.. cont.. 288 TAMING THE SHREW: REFINING PFAS REHABILITATION GOALS BY UNDERSTANDING YOUR IMPACTS AND YOUR ECOSYSTEM, Katie Richardson, Senversa, Australia
206 AN ADAPTIVE APPROACH TO COMMUNITY ENGAGEMENT TO MANAGE LEGACY ASBESTOS CONTAMINATION IN A RESIDENTIAL SETTING, Hamish Campbell, NSW Environment Protection Authority, Australia
293 ACHIEVING THE SUCCESSFUL DELIVERY OF ONE OF SYDNEY'S LARGEST REMEDIATION PROJECTS: BARANGAROO, Adam Fletcher, Ventia, Australia
11:30 - 11:45am
0:15 275 FACT CHECK: DO LABORATORY METHODS REALLY AFFECT THE QUALITY OF PFAS DATA?, Giorgio De Nola, SLR Consulting, Australia
168 A NOVEL APPROACH TO PRIORITISING PFAS SOURCE ZONES FOR REMEDIAL ACTION USING A BROAD SCALE MASS CONTRIBUTION ASSESSMENT, Gemma Wakefield, Golder Associates, Australia
373 ISCO IN AUSTRALIA: WHAT IS THE STATE OF THE ART?, Denton Mauldin, Kleinfelder Australia, Australia
169 AN ALGORITHM FOR CREATING REASONABLE WORST CASE EXPOSURE MAPS FOR VAPOUR INTRUSION SCREENING, Richard Evans, SA Health, Australia
302 OCCURRENCE AND DISTRIBUTION OF OXYGENATED POLYCYCLIC AROMATIC HYDROCARBONS (OXY-PAHS) IN SOILS OF AN AUSTRALIAN INDUSTRIAL CITY, Oluyoye Idowu, University of Newcastle, Australia
124 COMMUNITY SCALE ASBESTOS REMEDIATION USING DIGITAL DATA CAPTURE TOOLS, Ashton Betti, Senversa, Australia
305 WHAT'S UNDER THE TENT? AN INSIGHT INTO THE REMEDIAL OPERATIONS OF THE BARANGAROO BLOCKS 4 & 5 REMEDIATION PROJECT, Daniel O'Hanlon, Ventia, Australia
11:45 - 12:00pm
0:15 314 APPLICATION AND CONFIRMATION OF TOTAL OXIDIZED PRECURSORS ASSAY (TOPA) TO MONITOR PFAS WITH A PORTABLE READING KIT, Md Al Amin, University of Newcastle, Australia
232 DERIVATION AND SELECTION OF AQUATIC PFOS SCREENING LEVELS FOR SITE INVESTIGATIONS, Heather Lanza, GHD, Australia
176 RADIO FREQUENCY HEATING FOR IN SITU THERMAL TREATMENT OF ETHYLENE DICHLORIDE AND 1,1,2-TRICHLOROETHANE IN GROUNDWATER, Andrew Gray, ERM, Australia
173 VOLATILE CHLORINATED HYDROCARBON VAPOUR INTRUSION: ESTABLISHING A BASIS FOR PUBLIC HEALTH ACTION FOR TRICHLOROETHENE, Ian Delaere, SA Health, Australia
240 SORPTION AND DESORPTION BEHAVIOUR OF 2,4-D IN NINE SELECTED URBAN SOILS OF AUSTRALIA, Md Meftaul Islam, University of Newcastle, Australia
194 BIOBURDEN OF DIOXIN-LIKE POLYCHLORINATED BIPHENYLS (PCBS) IN A TROPICAL CREEK: HEALTH RISK IMPLICATIONS, Amii Usese, University of Lagos, Nigeria
120 ELIZABETH QUAY DEVELOPMENT, PERTH WA: CASE STUDY, David Sim, RPS, Australia
12:00 - 12:15pm
0:15 605 BALANCING REGULATORY PFAS QUANTIFICATION WITH EMERGING PFAS IDENTIFICATION USING LC-MS/MS AND LC-Q/TOF, Tarun Anumol, Agilent Technologies, USA
335 DOES AGRICULTURAL LAND CONTAMINATED WITH PFAS NEED MANAGEMENT?, Antti Mikkonen, University of South Australia, Australia
123 THE HORIZONTAL REACTIVE MEDIA TREATMENT WELL (HRX WELL®) FOR PASSIVE IN SITU REMEDIATION: DESIGN, IMPLEMENTATION, AND FIELD DEMONSTRATION, Peter Storch, Arcadis, Australia
218 INSTALLATION AND VALIDATION OF CRAWL SPACE VENTILATION AND SUB SLAB DEPRESSURIZATION SYSTEMS FOR MITIGATION OF TCE VAPOUR INTRUSION, David Butterfield, BlueSphere Environmental, Australia
307 EVALUATION OF GENOTOXICITY OF PERFLUOROOCTANE SULFONATE (PFOS) TO ALLIUM CEPA L., Anithadevi Kenday Sivaram, University of Newcastle, Australia
415 NOT IN OUR BACKYARD: RESEARCH FINDINGS ON THE EMERGING CONTAMINATES FROM CLANDESTINE LABORATORIES AND THE IMPACT ON THE HEALTH AND ENVIRONMENT OF REGIONAL AUSTRALIAN COMMUNITIES, Juliet Duffy, Regional EnviroScience, Australia
224 EFFECTIVE PFAS REHABILITATION OF A LARGE FORMER FIRE TRAINING FACILITY, Michael Rehfisch, Senversa, Australia
12:15 - 1:15pm
1:00 Lunch Lunch
Keynote presentations highlighted Keynote Presentation = 30 minutes (25 min + 5 min Q&A)Standard Platform Presentation = 15 minutes (12 min + 3 min Q&A)
Orange shading indicates 30-minute keynote presentations.

International CleanUp Conference Adelaide 201926
Hall L
1:15 - 3:00pm 1:45 W31 PLENARY SESSION
1:15 - 3:00pm 1:45 Expert panel for ABC Radio National’s ‘Big Ideas’ - Trust and expert risk communication in the age of social media
3:00 - 3:30pm 0:30 Lunch
3:30 - 5:15pm 1:45 W41 PLENARY SESSION
3:30 - 5:15pm 1:45 527 The Unsession and Closing
WED
NES
DA
Y, 1
1 SE
PTE
MB
ERA
FTER
NO
ON
THU
RSD
AY,
12
SEP
TEM
BER
Hall L City Room 1 City Room 2 City Room 3
8:00 - 9:00am
1:00 Registration - Foyer M
9:00 - 10:30am
1:30 Workshop TF1. Managing per- and polyfluoroalkyl substances (PFAS) at your site: Key technical and regulatory issues associated with PFAS
Workshop TM1. Understanding TPH for the management of contaminated sites
PFAS Research Symposium (Invite only)
Technical Tour
10:30 - 11:00am
0:30 Morning Tea
11:00 - 12:30pm
1:30 Workshop TF1. Managing per- and polyfluoroalkyl substances (PFAS) at your site: Key technical and regulatory issues associated with PFAS
Workshop TM1. Understanding TPH for the management of contaminated sites
PFAS Research Symposium (Invite only)
Technical Tour
12:30 - 1:30pm
1:00 Lunch
1:30 - 3:00pm
1:30 Workshop TF1. Managing per- and polyfluoroalkyl substances (PFAS) at your site: Key technical and regulatory issues associated with PFAS
Workshop TA1. Understanding vapor intrusion pathway
PFAS Research Symposium (Invite only)
Technical Tour
3:00 - 3:30pm
0:30 Afternoon Tea
3:30 - 5:00pm
1:30 Workshop TF1. Managing per- and polyfluoroalkyl substances (PFAS) at your site: Key technical and regulatory issues associated with PFAS
Workshop TA1. Understanding vapor intrusion pathway
PFAS Research Symposium (Invite only)
Technical Tour
FULL
DA
Y

International CleanUp Conference Adelaide 2019 27
CleanUp 2019 partners
SilverGold Bronze
Drink bottle sponsorGala dinner sponsor Barista sponsor
Satchel, lanyard and app sponsor
Innovation in Analytical Science Award SponsorSession sponsors
CleanUp 2019 Sponsors

Table of Contents
M11 — Plenary Session
M11bFrom Crisis to Collaboration: The Evolution of South Australia’s Approach to Managing Legacy SiteContamination . . . . . . . . . . . . . . . . . . . . . . . . . . . . . . . . . . . . . . . . . . . . . . . . . . . . . . . . . . . . . . . . . . . . . . . . . . . . . . . . . . . . . . . . . . . . . . . . . . . . . . . 51Tony Circelli
M21 — Recent Advances in the PFAS Science
M21aSERDP/ESTCP Research on Emerging Contaminants. . . . . . . . . . . . . . . . . . . . . . . . . . . . . . . . . . . . . . . . . . . . . . . . . . . . . . . . . . . . . 52Hans Stroo, Andrea Leeson
M21bPFAS Research and Development: Overview of Key Issues and Technologies . . . . . . . . . . . . . . . . . . . . . . . . . . . . . . . . . . 54Charles J. Newell, David T. Adamson, Poonam R. Kulkarni, Linda Hall
M21cState of the Science of the Fate and Transport of PFAS . . . . . . . . . . . . . . . . . . . . . . . . . . . . . . . . . . . . . . . . . . . . . . . . . . . . . . . . . . . 56Ian T. Cousins
M21dPFAS Remediation: Challenge and Options. . . . . . . . . . . . . . . . . . . . . . . . . . . . . . . . . . . . . . . . . . . . . . . . . . . . . . . . . . . . . . . . . . . . . . . . 58Cheng Fang, Megharaj Mallavarapu, Ravi Naidu
M22 — Advances in PFAS Remediation
M22aIn-situ PFAS Remediation Using Colloidal Activated Carbon . . . . . . . . . . . . . . . . . . . . . . . . . . . . . . . . . . . . . . . . . . . . . . . . . . . . . 60Grant R. Carey, Anh Le-Tuan Pham, Seyfollah Gilak Hakimabadi, Rick McGregor, Brent Sleep
M22bOccurrence, Distribution, Analysis,Toxicology and Remediation of Perfluorinated Pollutants inGermany . . . . . . . . . . . . . . . . . . . . . . . . . . . . . . . . . . . . . . . . . . . . . . . . . . . . . . . . . . . . . . . . . . . . . . . . . . . . . . . . . . . . . . . . . . . . . . . . . . . . . . . . . . . . . 62Volker Birke, Thomas Straßburger, Stefan Schroers, Peer Hendrik Leßlich, Harald Burmeier, Lothar Vigelahn,
Tamara Grummt, Alexander Eckhardt
M22cFull Scale Treatment of PFAS Contaminated Soil in Sweden . . . . . . . . . . . . . . . . . . . . . . . . . . . . . . . . . . . . . . . . . . . . . . . . . . . . . . 64Helena Hinrichsen, Mats Nises
M22dThe Effect of pH and Ionic Strength on Sorption of PFOS Using Soils with Different TOC. . . . . . . . . . . . . . . . . . . . . . . 66Yanju Liu, Fangjie Qi, Cheng Fang, Ravi Naidu, Luchun Duan, Rajarathnam Dharmarajan, Prasath Annamalai
M22ePFAS Water Treatment Operating Under State Regulations — A Case Study. . . . . . . . . . . . . . . . . . . . . . . . . . . . . . . . . . . . . 68Andrew Thomas
M22fInnovative Waste Minimisation During PFAS Contaminated Water Remediation . . . . . . . . . . . . . . . . . . . . . . . . . . . . . . . . . 70Steve Woodard, Mark Kuffer
28

M23 — National Remediation Framework
M23aThe National Remediation Framework for the Remediation and Management of Contaminated Sitesin Australia (NRF) . . . . . . . . . . . . . . . . . . . . . . . . . . . . . . . . . . . . . . . . . . . . . . . . . . . . . . . . . . . . . . . . . . . . . . . . . . . . . . . . . . . . . . . . . . . . . . . . . . . . 72Bruce Kennedy, Kerry Scott, Joytishna Jit, Ravi Naidu
M23bThe National Remediation Framework — Implications. . . . . . . . . . . . . . . . . . . . . . . . . . . . . . . . . . . . . . . . . . . . . . . . . . . . . . . . . . . . . 75Peter Nadebaum
M24 — Analytical Aspects of Assessment and Remediation of Contaminants
M24aWhen Will a Leachate Sample Never Fail?. . . . . . . . . . . . . . . . . . . . . . . . . . . . . . . . . . . . . . . . . . . . . . . . . . . . . . . . . . . . . . . . . . . . . . . . . . 77Ross McFarland
M24bVariability and Uncertainty Associated with Sampling, Analysis, and Risk Assessment . . . . . . . . . . . . . . . . . . . . . . . . 79Naji Akladiss
M24cPerformance of Analytical Methods Used for Measurement of Elements in Environmental Samples— Outcomes from Proficiency Testing Studies . . . . . . . . . . . . . . . . . . . . . . . . . . . . . . . . . . . . . . . . . . . . . . . . . . . . . . . . . . . . . . . . . . . . 81Luminita Antin, Jeffrey Merrick, Ian White
M24dPFAS Analysis by LC-HRMS . . . . . . . . . . . . . . . . . . . . . . . . . . . . . . . . . . . . . . . . . . . . . . . . . . . . . . . . . . . . . . . . . . . . . . . . . . . . . . . . . . . . . . . . 83Eddie Wang, Feng Shi, Philip Williams, Bruce Chen
M24eThe Changes in Lead Speciation During Bioavailability Assessments . . . . . . . . . . . . . . . . . . . . . . . . . . . . . . . . . . . . . . . . . . . 85Kaihong Yan, Ravi Naidu, Yanju Liu, Zhaomin Dong, M.A. Ayanka Wijayawardena, Yeling Li, Peter Sanderson,
Hongbo Li
M25 — Sustainability and Sustainable Remediation (Sponsor: Ramboll)
M25aDefining Sustainability and Resiliency in Remediation Design: Not an “And” versus “Or” Proposition. . . . . . . . . 87Scott D. Warner, Christopher J. Ritchie
M25bSustainable Energy Generation by Utilising Organic Waste . . . . . . . . . . . . . . . . . . . . . . . . . . . . . . . . . . . . . . . . . . . . . . . . . . . . . . . 89Jayant Keskar
M25cDebunking Myths About Sustainable Remediation . . . . . . . . . . . . . . . . . . . . . . . . . . . . . . . . . . . . . . . . . . . . . . . . . . . . . . . . . . . . . . . . 91G.A. Kerrison, J.W.N. Smith
M25dA Sustainable Alternative to Excavation of PFAS Source Areas . . . . . . . . . . . . . . . . . . . . . . . . . . . . . . . . . . . . . . . . . . . . . . . . . . 93Ian Ross, Jeffrey McDonough, Jake Hurst, Jonathan Miles, Danielle Toase, Jason Lagowski, Peter Storch
M25ePhythomas to Bioenergy: A Promising Way to Utilize Different Effluents for Sustainable EnergyProduction . . . . . . . . . . . . . . . . . . . . . . . . . . . . . . . . . . . . . . . . . . . . . . . . . . . . . . . . . . . . . . . . . . . . . . . . . . . . . . . . . . . . . . . . . . . . . . . . . . . . . . . . . . . 95Sonia Shilpi, Balaji Seshadri, Nanthi Bolan, Ravi Naidu
29

M26 — Application of Biochar and Other Advanced Materials in Environment
M26aEnhanced Removal of Antibiotics and Herbicides from Aqueous Media Using Wood Based ColloidalBiochar . . . . . . . . . . . . . . . . . . . . . . . . . . . . . . . . . . . . . . . . . . . . . . . . . . . . . . . . . . . . . . . . . . . . . . . . . . . . . . . . . . . . . . . . . . . . . . . . . . . . . . . . . . . . . . . 97Meththika Vithanage, Sammani Ramanayaka, Yohan Jayawardhana, Heshan Galagedara, Athula Wijayasinghe,
Yong Sik Ok
M26bWastes to Resources: Biochar Application Modulates Soil Health and Fertility . . . . . . . . . . . . . . . . . . . . . . . . . . . . . . . . . 99Nanthi Bolan
M26cZirconium-Modified Biochar for the Removal of Arsenic(V) from Aqueous Solution. . . . . . . . . . . . . . . . . . . . . . . . . . . . 101Md. Aminur Rahman, D.T. Lamb, Mohammad Mahmudur Rahman, Peter Sanderson, Md. Mezbaul Bahar,
Md. Zahangir Hossain, Ravi Naidu
M26dProduction and Characterisation of Nutrient-Enriched Biochar. . . . . . . . . . . . . . . . . . . . . . . . . . . . . . . . . . . . . . . . . . . . . . . . . . 103Md. Zahangir Hossain, Md. Mezbaul Bahar, Binoy Sarkar, Scott W. Donne, D.T. Lamb, Nanthi Bolan
M26ePerfluorooctyl Sulfonate (PFOS) Adsorption by Modified Sawdust, Redmud, and Red Mud-SawdustComposite Materials from Aqueous Solution . . . . . . . . . . . . . . . . . . . . . . . . . . . . . . . . . . . . . . . . . . . . . . . . . . . . . . . . . . . . . . . . . . . . . 105Masud Hassan, Yanju Liu, Ravi Naidu, Jianhua Du
M26fHierarchical Immobilization of nZVI onto Electrospun PVA-PAA Nanofiber Membrane forGroundwater Remediation . . . . . . . . . . . . . . . . . . . . . . . . . . . . . . . . . . . . . . . . . . . . . . . . . . . . . . . . . . . . . . . . . . . . . . . . . . . . . . . . . . . . . . . . . 107Jiawei Ren, Leonard D. Tijing, Ho Kyong Shon
M27 — Chlorinated Hydrocarbon Contaminated Site Assessment, Remediation and Long TermManagement
M27aTCE Behaviour in the Adelaide Plains . . . . . . . . . . . . . . . . . . . . . . . . . . . . . . . . . . . . . . . . . . . . . . . . . . . . . . . . . . . . . . . . . . . . . . . . . . . . . 109Mark Chapman, Tony Paparella
M27bMulti-Stage Full Scale Remediation of Heavily Impacted Victorian Chlorinated Solvent Site. . . . . . . . . . . . . . . . . . . 110Lyndon Bell, Richard Fassbender
M27cSource Zone Treatment Using Enhanced in-situ Bioremediation for Chlorinated Ethenes . . . . . . . . . . . . . . . . . . . . . 112Paul Nicholson, Julie Konzuk, Ebru Onder, Geoff Ellis
M27dIntegrated Site Assessment to Inform EISB Remediation of Chlorinated Solvents in a SedimentaryAquifer . . . . . . . . . . . . . . . . . . . . . . . . . . . . . . . . . . . . . . . . . . . . . . . . . . . . . . . . . . . . . . . . . . . . . . . . . . . . . . . . . . . . . . . . . . . . . . . . . . . . . . . . . . . . . . 114Alessandro Sica, Andrew Labbett
M27eUse of Multiple Lines of Evidence to Resolve the CSM for a Complex Groundwater TCE Distribution. . . . . . . . . 116Rory Lane, Meredith Rasch
30

M31 — International Approaches to Managing PFAS
M31aPFOS, PFOA and Other PFAS: A Focus on Canadian Guidelines and Guidance . . . . . . . . . . . . . . . . . . . . . . . . . . . . . . . . 118Darcy Longpré, Luigi Lorusso, Christine Levicki, Richard Carrier
M31bThe Evolution and Basis of PFAS Guidelines in The Netherlands,Their Consequences and aReflection with International Guidance . . . . . . . . . . . . . . . . . . . . . . . . . . . . . . . . . . . . . . . . . . . . . . . . . . . . . . . . . . . . . . . . . . . . . . . . . . . . 120Tessa Pancras, Hans Slenders
M31cPolicy Aspects of Managing PFAS-Case Finland . . . . . . . . . . . . . . . . . . . . . . . . . . . . . . . . . . . . . . . . . . . . . . . . . . . . . . . . . . . . . . . . . 122Jussi Reinikainen
M31dThe Evolution of Global Regulation for Per- and Poly-Fluorinated Alkyl Substances (PFAS) . . . . . . . . . . . . . . . . . . . 124Ken Kiefer, Nanda Hermes, Andrea Herch, Jennifer Byrd
M31ePFAS in Soil and Groundwater — Guidance for the Assessment and Remediation Measures inGermany . . . . . . . . . . . . . . . . . . . . . . . . . . . . . . . . . . . . . . . . . . . . . . . . . . . . . . . . . . . . . . . . . . . . . . . . . . . . . . . . . . . . . . . . . . . . . . . . . . . . . . . . . . . . 126Annegret Biegel-Engler, Joerg Frauenstein, Thomas Held, Michael Reinhard
M32 — Advances in PFAS Remediation
M32aPer- and Polyfluoroalkyl Substances and in-situ Microbial Populations Interactions at a LegacyFirefighting Training Area? . . . . . . . . . . . . . . . . . . . . . . . . . . . . . . . . . . . . . . . . . . . . . . . . . . . . . . . . . . . . . . . . . . . . . . . . . . . . . . . . . . . . . . . . . 128Denis M. O’Carroll, Thomas C. Jeffries, Matthew Lee, Song Thao Le, Anna Yeung, Sarah Wallace, Nick Battye,
Michael J. Manefield, Kela P. Weber
M32bBiotransformation of Per- and Poly-Fluoroalkyl Substances in Soil Using Enhanced BioremediationMethods . . . . . . . . . . . . . . . . . . . . . . . . . . . . . . . . . . . . . . . . . . . . . . . . . . . . . . . . . . . . . . . . . . . . . . . . . . . . . . . . . . . . . . . . . . . . . . . . . . . . . . . . . . . . . 129John Stevanoni
M32cEvaluating the Potential Use of Fluoro-Sorb 100 for PFAS in-situ Containment: A Laboratory ScaleStudy . . . . . . . . . . . . . . . . . . . . . . . . . . . . . . . . . . . . . . . . . . . . . . . . . . . . . . . . . . . . . . . . . . . . . . . . . . . . . . . . . . . . . . . . . . . . . . . . . . . . . . . . . . . . . . . . 131Antonios E. Alvertos, Michael S. Donovan, John M. Allen, Ash McCartney, Chadi S. El Mohtar
M32dA Low-Waste Electrochemical Process for Removing PFAS from Water to Non-Detect Levels. . . . . . . . . . . . . . . . . 133Brent Davey, Abbas Alghurabi, Elliott Lewis
M32eLarge Scale PFAS Remediation Progress at RAAF Base Williamtown, NSW, Australia . . . . . . . . . . . . . . . . . . . . . . . . . 135Luke McLeod, Paul McCabe
M32fVEG Technology for ex-situ Thermal Desorption of Poly- and Perfluoroalkyl Substances . . . . . . . . . . . . . . . . . . . . . . 136Mehrdad Javaherian
M33 — Advances in the Measurement and Management of Ground Gases
M33aMethane Detection Equivalency and Why Methane Matters in the Remediation Field: Guidance forRegulators and the Regulated Community . . . . . . . . . . . . . . . . . . . . . . . . . . . . . . . . . . . . . . . . . . . . . . . . . . . . . . . . . . . . . . . . . . . . . . . . 138Ona Papageorgiou, Marie Barnes, Nathan Putnam, Suzanne Hagell
M33bSoil Gas Data Utilization: Italian Guidelines and the Risk-Net 3.1 Pro HHRA Software . . . . . . . . . . . . . . . . . . . . . . . . . 140A. Girelli, Renato Baciocchi, Iason Verginelli
31
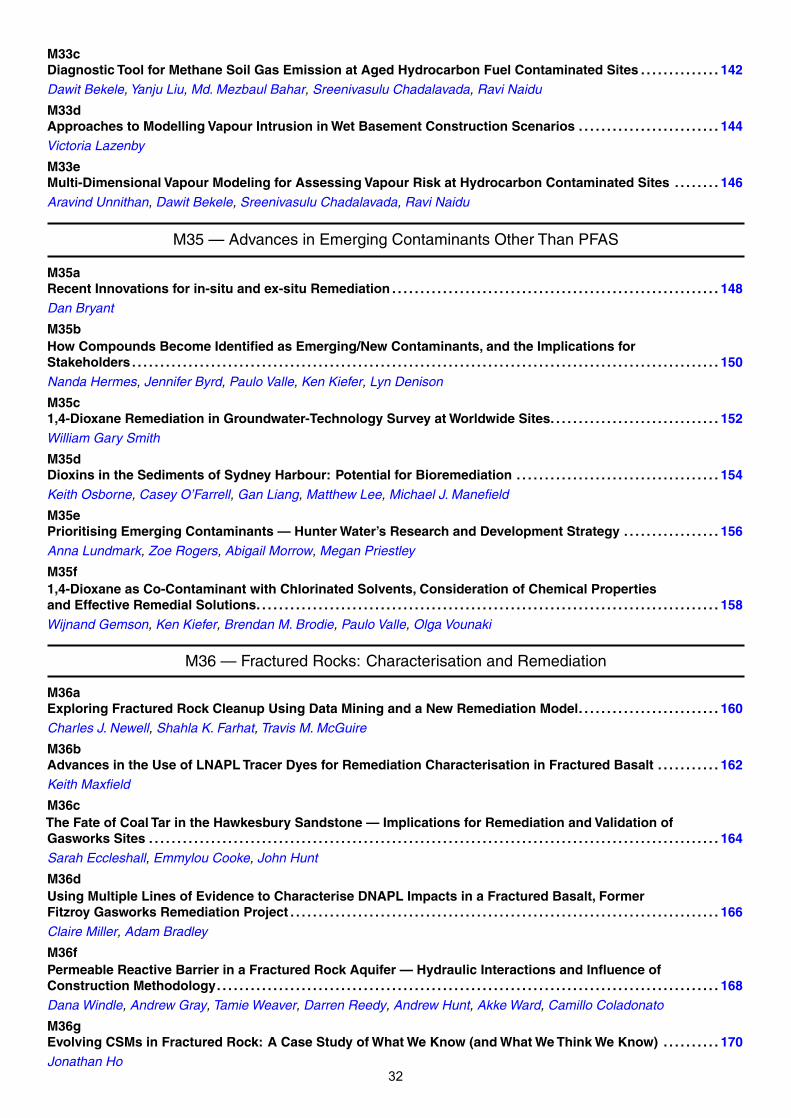
M33cDiagnostic Tool for Methane Soil Gas Emission at Aged Hydrocarbon Fuel Contaminated Sites . . . . . . . . . . . . . . 142Dawit Bekele, Yanju Liu, Md. Mezbaul Bahar, Sreenivasulu Chadalavada, Ravi Naidu
M33dApproaches to Modelling Vapour Intrusion in Wet Basement Construction Scenarios . . . . . . . . . . . . . . . . . . . . . . . . . 144Victoria Lazenby
M33eMulti-Dimensional Vapour Modeling for Assessing Vapour Risk at Hydrocarbon Contaminated Sites . . . . . . . . 146Aravind Unnithan, Dawit Bekele, Sreenivasulu Chadalavada, Ravi Naidu
M35 — Advances in Emerging Contaminants Other Than PFAS
M35aRecent Innovations for in-situ and ex-situ Remediation . . . . . . . . . . . . . . . . . . . . . . . . . . . . . . . . . . . . . . . . . . . . . . . . . . . . . . . . . . 148Dan Bryant
M35bHow Compounds Become Identified as Emerging/New Contaminants, and the Implications forStakeholders . . . . . . . . . . . . . . . . . . . . . . . . . . . . . . . . . . . . . . . . . . . . . . . . . . . . . . . . . . . . . . . . . . . . . . . . . . . . . . . . . . . . . . . . . . . . . . . . . . . . . . . . 150Nanda Hermes, Jennifer Byrd, Paulo Valle, Ken Kiefer, Lyn Denison
M35c1,4-Dioxane Remediation in Groundwater-Technology Survey at Worldwide Sites. . . . . . . . . . . . . . . . . . . . . . . . . . . . . . 152William Gary Smith
M35dDioxins in the Sediments of Sydney Harbour: Potential for Bioremediation . . . . . . . . . . . . . . . . . . . . . . . . . . . . . . . . . . . . 154Keith Osborne, Casey O’Farrell, Gan Liang, Matthew Lee, Michael J. Manefield
M35ePrioritising Emerging Contaminants — Hunter Water’s Research and Development Strategy . . . . . . . . . . . . . . . . . 156Anna Lundmark, Zoe Rogers, Abigail Morrow, Megan Priestley
M35f1,4-Dioxane as Co-Contaminant with Chlorinated Solvents, Consideration of Chemical Propertiesand Effective Remedial Solutions. . . . . . . . . . . . . . . . . . . . . . . . . . . . . . . . . . . . . . . . . . . . . . . . . . . . . . . . . . . . . . . . . . . . . . . . . . . . . . . . . . 158Wijnand Gemson, Ken Kiefer, Brendan M. Brodie, Paulo Valle, Olga Vounaki
M36 — Fractured Rocks: Characterisation and Remediation
M36aExploring Fractured Rock Cleanup Using Data Mining and a New Remediation Model. . . . . . . . . . . . . . . . . . . . . . . . . 160Charles J. Newell, Shahla K. Farhat, Travis M. McGuire
M36bAdvances in the Use of LNAPL Tracer Dyes for Remediation Characterisation in Fractured Basalt . . . . . . . . . . . 162Keith Maxfield
M36cThe Fate of Coal Tar in the Hawkesbury Sandstone — Implications for Remediation and Validation ofGasworks Sites . . . . . . . . . . . . . . . . . . . . . . . . . . . . . . . . . . . . . . . . . . . . . . . . . . . . . . . . . . . . . . . . . . . . . . . . . . . . . . . . . . . . . . . . . . . . . . . . . . . . . 164Sarah Eccleshall, Emmylou Cooke, John Hunt
M36dUsing Multiple Lines of Evidence to Characterise DNAPL Impacts in a Fractured Basalt, FormerFitzroy Gasworks Remediation Project . . . . . . . . . . . . . . . . . . . . . . . . . . . . . . . . . . . . . . . . . . . . . . . . . . . . . . . . . . . . . . . . . . . . . . . . . . . . 166Claire Miller, Adam Bradley
M36fPermeable Reactive Barrier in a Fractured Rock Aquifer — Hydraulic Interactions and Influence ofConstruction Methodology. . . . . . . . . . . . . . . . . . . . . . . . . . . . . . . . . . . . . . . . . . . . . . . . . . . . . . . . . . . . . . . . . . . . . . . . . . . . . . . . . . . . . . . . . 168Dana Windle, Andrew Gray, Tamie Weaver, Darren Reedy, Andrew Hunt, Akke Ward, Camillo Coladonato
M36gEvolving CSMs in Fractured Rock: A Case Study of What We Know (and What We Think We Know) . . . . . . . . . . 170Jonathan Ho
32

M37 — Assessment, Remediation and Management of Volatiles Compounds
M37aDynamic and Static Flux Chambers for Different Applications at Contaminated Sites . . . . . . . . . . . . . . . . . . . . . . . . . 172Iason Verginelli, Renato Baciocchi
M37bIn-situ Chemical Oxidation: Improving the State of Practice from Various Site Experiences . . . . . . . . . . . . . . . . . . . 174Brendan M. Brodie, Tim Pac
M37cChlorinated Hydrocarbon Source Investigations by Soil Vapour Screening — A Case Study . . . . . . . . . . . . . . . . . . 176Meredith Rasch, Rory Lane
M37dBackground VOC Concentrations in Indoor and Outdoor Ambient Air in Australia — Information toEvaluate and Interpret Vapour Intrusion Risks . . . . . . . . . . . . . . . . . . . . . . . . . . . . . . . . . . . . . . . . . . . . . . . . . . . . . . . . . . . . . . . . . . . . 178Adrian Heggie, Bianca Shnaiderman, Matthew Miklos
M37eEnhanced Reductive Dechlorination for a Chlorinated Hydrocarbons Impacted Active Site . . . . . . . . . . . . . . . . . . . 180Lorenzo Sacchetti, Jordi Aragones
M41 — Sampling, Behaviour and Characterisation of PFAS
M41aPFAS Occurrence in Vermont — A Summary of Results for Vermont’s Comprehensive Multi-MediaSampling Program. . . . . . . . . . . . . . . . . . . . . . . . . . . . . . . . . . . . . . . . . . . . . . . . . . . . . . . . . . . . . . . . . . . . . . . . . . . . . . . . . . . . . . . . . . . . . . . . . . 181Richard Spiese
M41bAFFF — Methods for Product Sampling . . . . . . . . . . . . . . . . . . . . . . . . . . . . . . . . . . . . . . . . . . . . . . . . . . . . . . . . . . . . . . . . . . . . . . . . . . . 182Matthew Colthorpe, Kathryn East, Peter Lavelle, Ken Kiefer
M41cSoil Injection of Liquid Biosolids: Tracking the PFAS Threat in Groundwater, Soil and ForageSorghum . . . . . . . . . . . . . . . . . . . . . . . . . . . . . . . . . . . . . . . . . . . . . . . . . . . . . . . . . . . . . . . . . . . . . . . . . . . . . . . . . . . . . . . . . . . . . . . . . . . . . . . . . . . . 184Aravind Surapaneni, Balaji Seshadri, James Hampton, Graeme Short, Peter Uren, Chris Hetherington,
Megharaj Mallavarapu
M41dWhat is Really in Aqueous Film Forming Foam and Does it Matter?. . . . . . . . . . . . . . . . . . . . . . . . . . . . . . . . . . . . . . . . . . . . . 187Mike Nicklesen, Steve Woodard
M41ePFAS Composition in Surface Water Ecologies Arising from Legacy Use of AFFF Firefighting Foams. . . . . . . . 188Andrew S. Mitchell, Karl C. Bowles
M42 — Advances in PFAS Remediation
M42aTransport and Remediation of Per- and Polyfluoroalkyl Substances (PFAS) in the Subsurface . . . . . . . . . . . . . . . . 190Kurt Pennell, Jed Costanza, Chen Lui, Masoud Arshadi, Changwoo Kim, Jason Hnatko, Natalie Capiro,
John Fortner, Linda Abriola
M42bAssessing a Novel Media for Reducing PFAS Migration via Stormwater Systems . . . . . . . . . . . . . . . . . . . . . . . . . . . . . . 192Nick Marquez, Rebecca Valkan
M42cFirefighting Foam Transition to Fluorine Free — Is it Plug and Play?. . . . . . . . . . . . . . . . . . . . . . . . . . . . . . . . . . . . . . . . . . . . 194Peter Storch, Ian Ross, Justin Morris, Tom Statham
33

M42dPFAS Removal from a Drinking Water Supply . . . . . . . . . . . . . . . . . . . . . . . . . . . . . . . . . . . . . . . . . . . . . . . . . . . . . . . . . . . . . . . . . . . . . 196Dale Wynkoop, Skefos Tsoukalis
M42eDevelopment of Advanced Chemical Treatment for PFAS in Co-Contaminated Groundwater . . . . . . . . . . . . . . . . . . 198Scott A. Grieco, Jessica H. Person, Laura Cook, Doug Gustafson
M42fSource Removal Combined with Drinking Water Treatment on a PFAS-Contaminated Groundwater. . . . . . . . . . . 199Steve Woodard, Marilyn Sinnett
M43 — Green Approaches to Managing Wastes
M43aA Bio-Phytoremediation Trial of Surge Basin Sludge from a Victorian Paper Mill . . . . . . . . . . . . . . . . . . . . . . . . . . . . . . . 201Philip Mulvey, Candan Desem, Tien Ngo, Esmaeil Shahsavari, Andrew S. Ball
M43bReuse of Soil Contaminated from a Tyre Fire . . . . . . . . . . . . . . . . . . . . . . . . . . . . . . . . . . . . . . . . . . . . . . . . . . . . . . . . . . . . . . . . . . . . . 203Lyn Denison, Keisuke Nakayama, Eugenia Balanova, Lisa Thomson
M43cRisk-Based Decision Making to Avoid Waste, Save Public Money and Allow Beneficial Use of WaterTreatment Residuals . . . . . . . . . . . . . . . . . . . . . . . . . . . . . . . . . . . . . . . . . . . . . . . . . . . . . . . . . . . . . . . . . . . . . . . . . . . . . . . . . . . . . . . . . . . . . . . . 205Graeme Miller, Dainis Skabe
M43dMicroalgae-Bacteria Consortia for Nutrients Removal in Wastewater. . . . . . . . . . . . . . . . . . . . . . . . . . . . . . . . . . . . . . . . . . . . 207Isiri A. Perera, Suresh R. Subashchandrabose, Ravi Naidu, Megharaj Mallavarapu
M43fEffect of Liquid Injection of Biosolids on Groundwater and Soil Properties . . . . . . . . . . . . . . . . . . . . . . . . . . . . . . . . . . . . 209Balaji Seshadri, Aravind Surapaneni, James Hampton, Graeme Short, Peter Uren, Chris Hetherington,
Matthew Currell
M43gBiomass High Temperature and High Efficiency Combustion Technology . . . . . . . . . . . . . . . . . . . . . . . . . . . . . . . . . . . . . . 212Bo Xiao, Jinbo Wang, Jiakuan Yang, Jianfen Li, Xun Wang, Dabin Guo
M44 — Landfill Evaluation, Capping and Management
M44aPFAS Impacts on Solids Waste Landfills . . . . . . . . . . . . . . . . . . . . . . . . . . . . . . . . . . . . . . . . . . . . . . . . . . . . . . . . . . . . . . . . . . . . . . . . . . 214Scott A. Grieco
M44bJohn Mathwin Reserve, Kauri Parade, Seacliff Park, SA — Auditing Transformation from Landfill toCommunity and Sporting Precinct. . . . . . . . . . . . . . . . . . . . . . . . . . . . . . . . . . . . . . . . . . . . . . . . . . . . . . . . . . . . . . . . . . . . . . . . . . . . . . . . . 215Adrian Hall, Dilara Valiff
M44cAssessment of Options for Reuse or Disposal of Soils Contaminated with PFAS — An Evaluation ofthe Australian Standard Leaching Procedure (ASLP). . . . . . . . . . . . . . . . . . . . . . . . . . . . . . . . . . . . . . . . . . . . . . . . . . . . . . . . . . . . . 217Andrew S. Mitchell, Karl C. Bowles
M44dResidential Development on a Landfill — A Western Australian Case Study . . . . . . . . . . . . . . . . . . . . . . . . . . . . . . . . . . . . 219Stuart Thurlow, Charlie Barber
M44eLandfill Mining to Transform a Former Dump into Usable Land: Ground-Breaking Gas VapourInvestigation, Remediation & Validation . . . . . . . . . . . . . . . . . . . . . . . . . . . . . . . . . . . . . . . . . . . . . . . . . . . . . . . . . . . . . . . . . . . . . . . . . . . 221Martin Kelly, Chris Sordy, Nick Cowman
34

M44fRelative Performance of Composite Liners (HDPE + GCL) in Containing Landfill Leachate. . . . . . . . . . . . . . . . . . . . 223Patrick Ndere
M45 — Microplastics: A New Threat to Environment
M45aEcotoxicity of Particulate Plastics in Terrestrial and Aquatic Ecosystems . . . . . . . . . . . . . . . . . . . . . . . . . . . . . . . . . . . . . . 224Nanthi Bolan, Lauren Bradney, Hasintha Wijesekara
M45bPolymer and Polymer Waste Management. . . . . . . . . . . . . . . . . . . . . . . . . . . . . . . . . . . . . . . . . . . . . . . . . . . . . . . . . . . . . . . . . . . . . . . . . 225Kenneth S. Sajwan
M45cMicroplastics: An Analytical Perspective . . . . . . . . . . . . . . . . . . . . . . . . . . . . . . . . . . . . . . . . . . . . . . . . . . . . . . . . . . . . . . . . . . . . . . . . . 227Bob Symons, Edward Nagul, Darren Robey
M45dMicro-Plastic Detection, Identification and Visualisation . . . . . . . . . . . . . . . . . . . . . . . . . . . . . . . . . . . . . . . . . . . . . . . . . . . . . . . . . 229Cheng Fang, Megharaj Mallavarapu, Ravi Naidu
M45eThe Toxicity Effect of Microplastic Vector for PFOS and PFOA on Earthworm. . . . . . . . . . . . . . . . . . . . . . . . . . . . . . . . . . . 230Zahra Sobhani, Cheng Fang, Megharaj Mallavarapu
M46 — Dealing with Mixed Contaminants
M46aEcotoxicity and Bioavailability of Mix Contaminants: Implications to Bioremediation . . . . . . . . . . . . . . . . . . . . . . . . . 232Megharaj Mallavarapu, Ravi Naidu
M46bMixed Contamination (Including PFAS) Assessment and Management at a Zinc Galvanising Plant . . . . . . . . . . . 234Alice Walker, Andre Smit, Joshua Nolan, Faraz Alam
M46cValidating Bioaccessibility Tests for Assessing Contaminants in Mixed Contaminated Soils . . . . . . . . . . . . . . . . . . 236M.A. Ayanka Wijayawardena, Kaihong Yan, Yanju Liu, Ravi Naidu
M46dEcotoxicity Modelling: Competitive, Multi-Species and Other Models for Terrestrial Environments . . . . . . . . . . . 238D.T. Lamb, Liang Wang, Sedigheh Abbasi, Peter Sanderson, M. Kader, Megharaj Mallavarapu, Ravi Naidu
M46ePilot Scale Thermal Remediation of Different Mercury Species and a Mix of Pesticides. . . . . . . . . . . . . . . . . . . . . . . . 240Niels Ploug, Søren Eriksen, Jesper Holm, Jacob Brix
M46fImmobilization of Cd and As by Apatite Converted from Microbial Induced Calcium Carbonate. . . . . . . . . . . . . . . 242Shijun Wu, Maolin Wang, Fanrong Chen, Yongqiang Yang
M47 — Gasworks Site Assessment and Remediation
M47aCase Study: Remediation in the Big City. Barangaroo and the Challenges . . . . . . . . . . . . . . . . . . . . . . . . . . . . . . . . . . . . . 243Jessica Hannaford
M47bLegacy Contamination to Remediation — Managing Approvals and Expectations on a FormerGasworks Site . . . . . . . . . . . . . . . . . . . . . . . . . . . . . . . . . . . . . . . . . . . . . . . . . . . . . . . . . . . . . . . . . . . . . . . . . . . . . . . . . . . . . . . . . . . . . . . . . . . . . . 245Jarrod Irving
35

M47cRemediation of PAHS Contamination in an Aged Gasworks Site Soil Using Surfactant and Oxidants . . . . . . . . 247Monica Esposito, Luchun Duan, Cheng Fang, Dawit Bekele, Ravi Naidu
M47dTreatment of Heavily Impacted Groundwater from Former Millers Point Gasworks . . . . . . . . . . . . . . . . . . . . . . . . . . . . . 249Sagar Adhikari, Nick Cowman
M47eCan the Gastrointestinal Mobilisation of PAH Nonextractable Residues from Soils Result inUnacceptable Cancer Risks? . . . . . . . . . . . . . . . . . . . . . . . . . . . . . . . . . . . . . . . . . . . . . . . . . . . . . . . . . . . . . . . . . . . . . . . . . . . . . . . . . . . . . . 251Anthony C. Umeh, Luchun Duan, Monica Esposito, Ravi Naidu, Kirk T. Semple
M47fRemediation by Permanganate in-situ Chemical Oxidation of a Manufactured Gas Plant SiteImpacted by Poly Aromatic Hydrocarbons (PAHs) . . . . . . . . . . . . . . . . . . . . . . . . . . . . . . . . . . . . . . . . . . . . . . . . . . . . . . . . . . . . . . . . 253Lorenzo Sacchetti, Jordi Aragones
M47gA Novel Framework to Identify, Predict and Improve the Efficiency of Bioremediation . . . . . . . . . . . . . . . . . . . . . . . . . 255Ramesha H. Jayaramaiah, Eleonora Egidi, Catriona A. Macdonald, Thomas C. Jeffries, Megharaj Mallavarapu,
Brajesh K. Singh
M51 — Poster Session and Drinks
M51-P1Influence of Soil Properties and Plant Species on PFASs Bioaccumulation . . . . . . . . . . . . . . . . . . . . . . . . . . . . . . . . . . . . 257Siyuan Liu, Luchun Duan, Ravi Naidu
M51-P2Biochar Application Effects on Some Maize Growing Soils of Bihar. . . . . . . . . . . . . . . . . . . . . . . . . . . . . . . . . . . . . . . . . . . . . 259Anshuman Kohli, Yanendra K. Singh, Jajati Mandal, Swati Kumari, Kumar R. Raj
M51-P3Evaluation of Heavy Metals (As, Cd, Cu, Pb, Zn) Uptake Factors of Native Plants in Thai NguyenMining Sites — A Study for Phytoremediation . . . . . . . . . . . . . . . . . . . . . . . . . . . . . . . . . . . . . . . . . . . . . . . . . . . . . . . . . . . . . . . . . . . . 261Ngoc Son Hai Nguyen, Peter Sanderson, Jianhua Du, Fangjie Qi, Ngoc Nong Nguyen, Nanthi Bolan, Ravi Naidu
M51-P4PFAS Clearance in Cattle. . . . . . . . . . . . . . . . . . . . . . . . . . . . . . . . . . . . . . . . . . . . . . . . . . . . . . . . . . . . . . . . . . . . . . . . . . . . . . . . . . . . . . . . . . . 263Tarah Hagen, Roger Drew, David Champness, Amelie Sellier
M51-P5A Soil Contamination Record Management System in Republic of Korea . . . . . . . . . . . . . . . . . . . . . . . . . . . . . . . . . . . . . . . 265Jung-Auk Park, Na-ri Oh, Hoe-Jung Noh
M51-P6Investigation of PFAS Contamination from Land-Applied Industrial Compost and AFFF Sources. . . . . . . . . . . . . 267Ian Ross, Jeffrey McDonough, Jake Hurst, Jonathan Miles, Danielle Toase, Jason Lagowski, Peter Storch
M51-P7Standardized Approaches for Risk Ranking Portfolio of Sites Impacted with PFAS . . . . . . . . . . . . . . . . . . . . . . . . . . . . 268Ian Ross, Jeffrey McDonough, Jake Hurst, Jonathan Miles, Danielle Toase, Jason Lagowski, Peter Storch
M51-P8Nitrate, Phosphate and Sulphate Concentrations in Effluent Waters from Nine Wastewater TreatmentPlants in Savannah, Georgia . . . . . . . . . . . . . . . . . . . . . . . . . . . . . . . . . . . . . . . . . . . . . . . . . . . . . . . . . . . . . . . . . . . . . . . . . . . . . . . . . . . . . . . 269Liz Ortiz, Skyla Bailey, Micheala Goodwin, Sasha Mays, Brooklynn West, Zarion Hurston, Kenneth S. Sajwan
M51-P9Investigation, Risk Assessment and Remediation of Multiple PFAS Source Zones at an Airport toSafeguard a Water Supply . . . . . . . . . . . . . . . . . . . . . . . . . . . . . . . . . . . . . . . . . . . . . . . . . . . . . . . . . . . . . . . . . . . . . . . . . . . . . . . . . . . . . . . . . . 271Ian Ross, Jeffrey McDonough, Jake Hurst, Jonathan Miles, Danielle Toase, Jason Lagowski, Peter Storch
M51-P10The Evolution and Application of Fluorine Free Foams for Effective Extinguishment of Class B Fires . . . . . . . . 273Ian Ross, Jonathan Miles, Niall Ramsden, Peter Storch
36

M51-P11Understanding Fate and Transport of PFASS to Develop Effective Conceptual Site Models . . . . . . . . . . . . . . . . . . . 275Ian Ross, Jeffrey McDonough, Jake Hurst, Jonathan Miles, Danielle Toase, Jason Lagowski, Peter Storch
M51-P12PFAS Tissue Distribution in Cattle . . . . . . . . . . . . . . . . . . . . . . . . . . . . . . . . . . . . . . . . . . . . . . . . . . . . . . . . . . . . . . . . . . . . . . . . . . . . . . . . . 277Roger Drew, Tarah Hagen, David Champness, Amelie Sellier
M51-P13Site Assessment and Remediation Plan for Lead Contamination from Mining Activity; Klity,Kanchanaburi,Thailand . . . . . . . . . . . . . . . . . . . . . . . . . . . . . . . . . . . . . . . . . . . . . . . . . . . . . . . . . . . . . . . . . . . . . . . . . . . . . . . . . . . . . . . . . . . . 279N. Tantemsapya, W. Wirojanagud, V. Thathong
M51-P14Iron Plaque Formation and its Effect on Cadmium Accumulation by Rice Seedlings. . . . . . . . . . . . . . . . . . . . . . . . . . . 281Abu Bakkar Siddique, Mohammad Mahmudur Rahman, Md. Rafiqul Islam, Ravi Naidu
M51-P15Comparing Groundwater Level Fluctuation Under Different Land Use Scenarios: Implications toRemediation Treatment . . . . . . . . . . . . . . . . . . . . . . . . . . . . . . . . . . . . . . . . . . . . . . . . . . . . . . . . . . . . . . . . . . . . . . . . . . . . . . . . . . . . . . . . . . . . . 283Adnan Mohammed, Dawit Bekele, Sreenivasulu Chadalavada, Scott D. Warner, Ravi Naidu
M51-P16PFAS Background Considerations — Significant or Not? . . . . . . . . . . . . . . . . . . . . . . . . . . . . . . . . . . . . . . . . . . . . . . . . . . . . . . . . 285Kathleen Prohasky, Gaelle Ng, Darren Reedy, Ken Kiefer
M51-P17Effect of Amendments on Water Use Efficiency in Rice Wheat Cropping System Under Light TextureSoil . . . . . . . . . . . . . . . . . . . . . . . . . . . . . . . . . . . . . . . . . . . . . . . . . . . . . . . . . . . . . . . . . . . . . . . . . . . . . . . . . . . . . . . . . . . . . . . . . . . . . . . . . . . . . . . . . . 287Yanendra K. Singh, Rajendra Prasad
M51-P18Screening of Australian Native Plant Species for Rhizoremediation of Petroleum HydrocarbonContaminated Soils. . . . . . . . . . . . . . . . . . . . . . . . . . . . . . . . . . . . . . . . . . . . . . . . . . . . . . . . . . . . . . . . . . . . . . . . . . . . . . . . . . . . . . . . . . . . . . . . . 289Anh Hoang, D.T. Lamb, Balaji Seshadri, Binoy Sarkar, Liang Wang, Ying Cheng, Nanthi Bolan
M51-P19Asbestos: Environmental Health Inequalities Between Developed and Developing Nations . . . . . . . . . . . . . . . . . . . 291Getachew D. Gebreeyessus, Meron Worku, Belina Terfassa, Dawit Bekele
M51-P20Dynamic Biopiles as a Method of Enhanced Bioremediation of Gasworks Polycyclic AromaticHydrocarbon Impacted Soil . . . . . . . . . . . . . . . . . . . . . . . . . . . . . . . . . . . . . . . . . . . . . . . . . . . . . . . . . . . . . . . . . . . . . . . . . . . . . . . . . . . . . . . . 293Mark Stuckey, Temma Carruthers-Taylor, Susan C. Wilson, Philip Mulvey
M51-P21Perfluorooctanoic Acid (PFOA) Induced Behavioral Impacts in C. elegans . . . . . . . . . . . . . . . . . . . . . . . . . . . . . . . . . . . . . 295Tanmoy Sana, Manjurul Islam Chowdhury, Logeshwaran Panneerselvan, Rajarathnam Dharmarajan,
Megharaj Mallavarapu
M51-P22Limiting Migration of PFAS — Groundwater and Surface Water: Application of Materials andMethods for in-situ Permeable Reactive Barriers (PRB) . . . . . . . . . . . . . . . . . . . . . . . . . . . . . . . . . . . . . . . . . . . . . . . . . . . . . . . . . . 297John A. Collins, John Hull
M51-P23Bioavailability Reduction of Cadmium in Biosolids Blended with Limestone in Agricultural Utilization. . . . . . . . 298Thammared Chuasavathi, Sireepron Kamsopa, Balaji Seshadri, Nanthi Bolan
M51-P24Flyash — Attributes, Utilization and Mitigation Strategies for Eco-Friendly Management . . . . . . . . . . . . . . . . . . . . . . 300Sudha J. Kohli, Dinesh Goyal
M51-P25Aluminosilicate Nano-Skeleton to Firm the Structure and Properties of Nano-Herbicide Formulations. . . . . . . . 302Santosh Kumar Paul, Md. Nuruzzaman, Tanya C. Correa, Ravi Naidu
M51-P26Optimizing the PFAS Puzzle: Piecing Together a Holistic PFAS Restoration Strategy . . . . . . . . . . . . . . . . . . . . . . . . . . 304Ian Ross, Jeffrey McDonough, Jake Hurst, Jonathan Miles, Danielle Toase, Jason Lagowski, Peter Storch
37

M51-P271,4-Dioxane Induces Chromosomal Aberrations in Allium cepa . . . . . . . . . . . . . . . . . . . . . . . . . . . . . . . . . . . . . . . . . . . . . . . . . 306Sadhvika Chandrasekar, Suresh R. Subashchandrabose, Anithadevi Kenday Sivaram, Logeshwaran Panneerselvan,
Rajendran Selvakumar, Sreenivasulu Chadalavada, Ravi Naidu, Megharaj Mallavarapu
M51-P28Heavy Metal Exposure Risk of Commercially Grown Vegetables in Sri Lanka. . . . . . . . . . . . . . . . . . . . . . . . . . . . . . . . . . . 308M.R.D.L. Kulathunga, M.A. Ayanka Wijayawardena, Ravi Naidu
M51-P29Cytotoxicity of Perfluoroalkyl and Polyfluoroalkyl Substances and Their Mixtures in HepG2 Cell . . . . . . . . . . . . . 310Atinuke F. Ojo, Cheng Peng, Jack C. Ng
M51-P30LNAPL Recoverability in Fractured Basalt — Findings from Several Multi-Tiered Remediation CaseStudies . . . . . . . . . . . . . . . . . . . . . . . . . . . . . . . . . . . . . . . . . . . . . . . . . . . . . . . . . . . . . . . . . . . . . . . . . . . . . . . . . . . . . . . . . . . . . . . . . . . . . . . . . . . . . . 312Keith Maxfield
M51-P31Natural Source Arsenic Contamination Management Strategies in Taiwan — Contamination Status,Novel Screening Tool and Precautions . . . . . . . . . . . . . . . . . . . . . . . . . . . . . . . . . . . . . . . . . . . . . . . . . . . . . . . . . . . . . . . . . . . . . . . . . . . . 314Bing-Nan Wang, Yu-Chen Su, Sheng-Wei Wang, Han-Yu Chang, Hao-Chun Hung, Yi-Ning Yang, Shyh-Wei Chen
M51-P32Treatment of PFAS Impacted Wastewater Using Ozofractionation and Sonolysis with TreatmentValidation Using Top Assay . . . . . . . . . . . . . . . . . . . . . . . . . . . . . . . . . . . . . . . . . . . . . . . . . . . . . . . . . . . . . . . . . . . . . . . . . . . . . . . . . . . . . . . . 316Ian Ross, Jonathan Miles, Danielle Toase, Jason Lagowski, Michael Dickson, Peter Storch
M51-P33Electrochemical Oxidation of 2,4-Dichlorophenoxyacetic Acid (2,4-D) . . . . . . . . . . . . . . . . . . . . . . . . . . . . . . . . . . . . . . . . . . 318Young Hwan Hyun, Jiyeon Choi, Jin Peel Kim, Won Sik Shin
M51-P34Potential of Acid Tolerant Microalgae for Iron Recovery via Uptake from Acid Mine Drainage . . . . . . . . . . . . . . . . . 320Abinandan Sudharsanam, Suresh R. Subashchandrabose, Megharaj Mallavarapu
M51-P35Sorption of Fenamiphos in Soils from Temperate and Tropical Regions. . . . . . . . . . . . . . . . . . . . . . . . . . . . . . . . . . . . . . . . . 322Tanya Cáceres, Megharaj Mallavarapu, Ravi Naidu, Kadiyala Vekateswarlu
M51-P36PFAS Source Zone Remediation Using Fluidisation and Fractionation. . . . . . . . . . . . . . . . . . . . . . . . . . . . . . . . . . . . . . . . . . 324David Burns, Robert K. Niven, Nasser Khalili, Richard Pashley, Mark Taylor, Vladimir Strezov, Scott Wilson,
Peter Murphy
M51-P37Chronic Exposure to Perfluorooctane Sulfonate (PFOS) Hampers Reproduction Capacity andLocomotion in Caenorhabditis elegans . . . . . . . . . . . . . . . . . . . . . . . . . . . . . . . . . . . . . . . . . . . . . . . . . . . . . . . . . . . . . . . . . . . . . . . . . . . 326Manjurul Islam Chowdhury, Tanmoy Sana, Logeshwaran Panneerselvan, Rajarathnam Dharmarajan,
Megharaj Mallavarapu
M51-P38Progress and Challenges for Subsurface Remediation Technologies for TPHs . . . . . . . . . . . . . . . . . . . . . . . . . . . . . . . . . 328Anish Saini, Dawit Bekele, Sreenivasulu Chadalavada, Cheng Fang, Ravi Naidu
M51-P39PArticle-Size Distribution of Trace Elements in Legacy Mine Site Soils, NSW, Australia . . . . . . . . . . . . . . . . . . . . . . . . 330A.S.M. Fazle Bari, Mohammad Mahmudur Rahman, D.T. Lamb, Nanthi Bolan, Balaji Seshadri, Ravi Naidu
M51-P40OHS&E Planning of PFAS Investigation Programs: Weighing the Risks of Vector Borne InfectiousDiseases? . . . . . . . . . . . . . . . . . . . . . . . . . . . . . . . . . . . . . . . . . . . . . . . . . . . . . . . . . . . . . . . . . . . . . . . . . . . . . . . . . . . . . . . . . . . . . . . . . . . . . . . . . . . 332Freya Amon, Antti Mikkonen, John Frangos, Christian Wallis
M51-P41Multiple Treatment Systems Combine to Enhance Removal Of Per- and Poly-Fluoroalkyl Substancesfrom Contaminated Water At RAAF Base Williamtown, NSW Australia . . . . . . . . . . . . . . . . . . . . . . . . . . . . . . . . . . . . . . . . . . 334Steve Woodard, Charlie Gordon
38

M51-P42Pilot Test Verification of Thermal Desorption of PFAS from Soil . . . . . . . . . . . . . . . . . . . . . . . . . . . . . . . . . . . . . . . . . . . . . . . . . 336Scott A. Grieco, Ross Edwards
M51-P43Arsenic Phytotoxicity in Soil: The Impact of Residence Time . . . . . . . . . . . . . . . . . . . . . . . . . . . . . . . . . . . . . . . . . . . . . . . . . . . . 337Sedigheh Abbasi, D.T. Lamb, M. Kader, Ravi Naidu, Megharaj Mallavarapu
M51-P44In-situ Formation of Magnetite Nanoparticles on Halloysite Nanotube: Synthesis andCharacterisation . . . . . . . . . . . . . . . . . . . . . . . . . . . . . . . . . . . . . . . . . . . . . . . . . . . . . . . . . . . . . . . . . . . . . . . . . . . . . . . . . . . . . . . . . . . . . . . . . . . . 339Amal Kanti Deb, Mohammad Mahmudur Rahman, Bhabananda Biswas, Ravi Naidu
M51-P45Application of Decision Unit Multi-Increment Sampling (DUMIS) in Confirmation Sampling at aNickel Contaminated Site in China. . . . . . . . . . . . . . . . . . . . . . . . . . . . . . . . . . . . . . . . . . . . . . . . . . . . . . . . . . . . . . . . . . . . . . . . . . . . . . . . . 341J. Song, R. Brewer, W. Tang, G.Y. Xu, X. Gao, J. Mao, Y. Qian
M51-P46Root Behaviour and Nutrient Medium’s pH, EC and Cd Level of Wheat Grasses (Anthosachnescabra) Under Cadmium Stress. . . . . . . . . . . . . . . . . . . . . . . . . . . . . . . . . . . . . . . . . . . . . . . . . . . . . . . . . . . . . . . . . . . . . . . . . . . . . . . . . . . . 343M.A. Halim, Mohammad Mahmudur Rahman, Megharaj Mallavarapu, Ravi Naidu
M51-P471,4-Dioxane Induces Oxidative Stress in Raphidocelis subcapitata . . . . . . . . . . . . . . . . . . . . . . . . . . . . . . . . . . . . . . . . . . . . . 345Nucharee Juntarachot, Abinandan Sudharsanam, Suresh R. Subashchandrabose, Sreenivasulu Chadalavada,
Ravi Naidu, Megharaj Mallavarapu, Chaiyavat Chaiyasut
M51-P48Computational and Evolutionary Analysis of Lytic Polysaccharide Monooxygenases (LPMOs) . . . . . . . . . . . . . . . 347Kaniz Fatema, Suresh R. Subashchandrabose, Logeshwaran Panneerselvan, Megharaj Mallavarapu
T11 — PLENARY SESSION
T11bEmerging Issues in Dealing with Contaminated Sites in Australia. . . . . . . . . . . . . . . . . . . . . . . . . . . . . . . . . . . . . . . . . . . . . . . 349Peter Nadebaum
T21 — PFAS Risk Assessment, Management and Mitigation
T21aToxicology, Risk Assessment, and Risk Management of PFAS: State of the Science . . . . . . . . . . . . . . . . . . . . . . . . . . . 354Jason Conder, Jennifer Arblaster, Emily Larson
T21bPFAS — The Forever Chemical Global Risk and Emerging Concerns . . . . . . . . . . . . . . . . . . . . . . . . . . . . . . . . . . . . . . . . . . . 356Jimmy Seow
T21cAssessing Exposure to PFAS Precursors . . . . . . . . . . . . . . . . . . . . . . . . . . . . . . . . . . . . . . . . . . . . . . . . . . . . . . . . . . . . . . . . . . . . . . . . . 358Victoria Lazenby
T21dFate and Transport of PFAS in an Arid Setting . . . . . . . . . . . . . . . . . . . . . . . . . . . . . . . . . . . . . . . . . . . . . . . . . . . . . . . . . . . . . . . . . . . . 360Alice Walker, Mark Clough, Peter Nadebaum, Jacqui Hallchurch
T21eWhisk Assessment: PFAS Stock Watering Screening Levels to Protect People Consuming HomeProduced Chicken Eggs. . . . . . . . . . . . . . . . . . . . . . . . . . . . . . . . . . . . . . . . . . . . . . . . . . . . . . . . . . . . . . . . . . . . . . . . . . . . . . . . . . . . . . . . . . . . 362Katie Richardson, Kristi Hanson, Michael Rehfisch
T21fAssessing Confirmed PFAS Exposure Pathways to Inform Mitigation. . . . . . . . . . . . . . . . . . . . . . . . . . . . . . . . . . . . . . . . . . . 364Julian Howard, Krystle Mitchell
39

T22 — Legal Responses to Site Contamination Issues
T22aLessons Learnt in Environmental Auditing. . . . . . . . . . . . . . . . . . . . . . . . . . . . . . . . . . . . . . . . . . . . . . . . . . . . . . . . . . . . . . . . . . . . . . . . 366Jean-Paul Pearce
T22bConsultant Liability — The Truth About Being Sued . . . . . . . . . . . . . . . . . . . . . . . . . . . . . . . . . . . . . . . . . . . . . . . . . . . . . . . . . . . . . . 367Sarah Mansfield
T22cBy the Letter of the Law — Preparing for When Consulting Goes to Court. . . . . . . . . . . . . . . . . . . . . . . . . . . . . . . . . . . . . . 368Emmylou Cooke, Andre Smit
T22dThe Effect on Market Value of Contamination: The 2019 Alexandria Landfill Decision and the Role ofExperts and Consultants in Valuing Contaminated Land . . . . . . . . . . . . . . . . . . . . . . . . . . . . . . . . . . . . . . . . . . . . . . . . . . . . . . . . . 370Anneliese Korber
T22ePrinciple-Based Regulation in Victoria — Implications of the Environment Protection AmendmentAct 2018 for the Regulation and Clean Up of Contaminated Sites . . . . . . . . . . . . . . . . . . . . . . . . . . . . . . . . . . . . . . . . . . . . . . . 371Mark Beaufoy
T23 — Metals, Metalloids and Radionuclides
T23aWhy Site Characterisation is Important — Case Study of an Australian Legacy Low LevelRadioactive Waste Site . . . . . . . . . . . . . . . . . . . . . . . . . . . . . . . . . . . . . . . . . . . . . . . . . . . . . . . . . . . . . . . . . . . . . . . . . . . . . . . . . . . . . . . . . . . . . 373Timothy E. Payne
T23bAssessment, Remediation and Management of Lead Tailings at Northampton Western Australia — ALegacy of Mining . . . . . . . . . . . . . . . . . . . . . . . . . . . . . . . . . . . . . . . . . . . . . . . . . . . . . . . . . . . . . . . . . . . . . . . . . . . . . . . . . . . . . . . . . . . . . . . . . . . 374Peter Beck, Jon Cramer
T23cIn the Cross Hairs: A Regulator’s Perspective of Shooting Range Contamination. . . . . . . . . . . . . . . . . . . . . . . . . . . . . . 376Matt Baronio, Scott Jones, Julia Caluzzi
T23dArsenate in Phosphorus Sensitive Plants . . . . . . . . . . . . . . . . . . . . . . . . . . . . . . . . . . . . . . . . . . . . . . . . . . . . . . . . . . . . . . . . . . . . . . . . . 378Sedigheh Abbasi, D.T. Lamb, Zahra Sobhani, Md. Aminur Rahman, Ravi Naidu, Megharaj Mallavarapu
T23eOrica Botany — Mercury Containment by Cut-Off Wall Using CSM Equipment . . . . . . . . . . . . . . . . . . . . . . . . . . . . . . . . . 380Russell Denny, Lech Wypych, Peter O. Dea
T23fRice Growth and Soil Enzyme Activities in Cadmium (Cd) Contaminated Inceptisol . . . . . . . . . . . . . . . . . . . . . . . . . . . 382Manoj Shrivastava, Ashish Khandewal, Akansha Srivastav, S.D. Singh
T24 — Risk Assessment, Management and Communication
T24aHealth Implications of Food Contaminants: Geochemical and Environmental Pollutants . . . . . . . . . . . . . . . . . . . . . . 384Ming Hung Wong
T24bApplication of Risk Assessment to Manage Petroleum Hydrocarbon Impacts at an OperatingTerminal . . . . . . . . . . . . . . . . . . . . . . . . . . . . . . . . . . . . . . . . . . . . . . . . . . . . . . . . . . . . . . . . . . . . . . . . . . . . . . . . . . . . . . . . . . . . . . . . . . . . . . . . . . . . . 386Atul M. Salhotra
40

T24cChronic Effects of ZnO Nanoparticles to Earthworm, Eisenia fetida . . . . . . . . . . . . . . . . . . . . . . . . . . . . . . . . . . . . . . . . . . . . . 387Chamila Samarasinghe Vidane Arachchige, Kannan Krishnan, Robert John Aitken, Ravi Naidu,
Megharaj Mallavarapu
T24dTowards the Development of an Australian Human-Health Screening Criteria for TCE in Groundwater. . . . . . . . 389Anand P. Chandra, Robert P. DeMott
T24eAustralia’s Risk-Based Approach. . . . . . . . . . . . . . . . . . . . . . . . . . . . . . . . . . . . . . . . . . . . . . . . . . . . . . . . . . . . . . . . . . . . . . . . . . . . . . . . . . 391Joytishna Jit, Bruce Kennedy, Ravi Naidu
T24fApplication of Rapid Risk Assessment to Drive Interim Clean-Up for Abandoned Mine Sites . . . . . . . . . . . . . . . . . 393Christian Wallis, John Frangos, H. Mikkonen, Russell Merz, Antti Mikkonen
T25 — Advances in Permeable Reactive Barriers Technology
T25aAssessment and Selection of Various Technical Grades Zero Valent Irons for Remediation ofChlorinated Ethenes for Validating the Efficacy of Rheine Site Permeable Reactive Barrier, Germany . . . . . . . . 394Volker Birke, Rahul Singh, Lothar Vigelahn, Sumedha Chakma, Christine Schuett, Harald Burmeier
T25bZVI Horizontal Permeable Reactive Barriers for the Treatment of Chlorinated Solvents Vapors . . . . . . . . . . . . . . . . 396Daniela Zingaretti, Iason Verginelli, Renato Baciocchi
T25cPerformance of a ZVI-Based Permeable Reactive Barrier for Abiotic Degradation of ChlorinatedHydrocarbons in Groundwater . . . . . . . . . . . . . . . . . . . . . . . . . . . . . . . . . . . . . . . . . . . . . . . . . . . . . . . . . . . . . . . . . . . . . . . . . . . . . . . . . . . . . 398Andrew Gray, Andrew Hunt, Akke Ward, Dana Windle, Darren Reedy, Camillo Coladonato
T25dField Trial for Soil Mix Permeable Reactive Barrier in Land Remediation: Execution and Early AgeMonitoring . . . . . . . . . . . . . . . . . . . . . . . . . . . . . . . . . . . . . . . . . . . . . . . . . . . . . . . . . . . . . . . . . . . . . . . . . . . . . . . . . . . . . . . . . . . . . . . . . . . . . . . . . . 400Ziyad Abunada, Abir Al-Tabbaa
T26 — ACLCA Session on Young Professionals
T26bIsotopic Analysis to Differentiate Ground-Gas Sources on a Contaminated Site . . . . . . . . . . . . . . . . . . . . . . . . . . . . . . . 402Nicholas Grbich
T26cRedeveloping Landfill Potentially Impacted by Mixed Contamination, Acacia Ridge, Brisbane . . . . . . . . . . . . . . . . 404Emma Cornish, Andrew Howes, Greg Whitmore
T26dInstallation and Validation of Crawl Space Ventilation and Sub Slab Depressurization Systems forMitigation of TCE Vapour Intrusion . . . . . . . . . . . . . . . . . . . . . . . . . . . . . . . . . . . . . . . . . . . . . . . . . . . . . . . . . . . . . . . . . . . . . . . . . . . . . . . . 406David Butterfield, Rory Lane, Paul Nicholson
T26eAre Microbes Fussy Eaters with Sophisticated Palates — Or is There a Case for Natural Source ZoneDepletion at Dense Non-Aqueous Phase Liquid Impacted Sites?. . . . . . . . . . . . . . . . . . . . . . . . . . . . . . . . . . . . . . . . . . . . . . . . 408Matthew Russ
T26fA Case Study in the Transfer of Site Leaseholders and the Impacts of Conflicting RegulatoryFrameworks on Contaminated Sites Investigation. . . . . . . . . . . . . . . . . . . . . . . . . . . . . . . . . . . . . . . . . . . . . . . . . . . . . . . . . . . . . . . . 410Dylan Pritchard
41

T31 — PFAS Risk Assessment, Management and Mitigation
T31aExposure Pathways for PFASs and Other Persistent Chemicals in Biota. . . . . . . . . . . . . . . . . . . . . . . . . . . . . . . . . . . . . . . . 412Rainer Lohmann
T31bApplication of Soil Amendments for Reducing PFAS Exposure and Bioavailability . . . . . . . . . . . . . . . . . . . . . . . . . . . . 414Albert L. Juhasz, Richard Stewart
T31cSite-Specific Investigation Levels for PFOS and PFOA in Soil . . . . . . . . . . . . . . . . . . . . . . . . . . . . . . . . . . . . . . . . . . . . . . . . . . . 416S. Wood, Ken Kiefer, Kylie Dodd
T31dWhat Does Exceedence of a Toxicity Reference Value Really Mean? Case Study: PFOS. . . . . . . . . . . . . . . . . . . . . . . 418Tarah Hagen, Giorgio De Nola, Anthony Lane
T31eRemediation of PFAS Impacted Water at Fire Fighting Training Site Using OCRA Technology . . . . . . . . . . . . . . . . . 420David M. Hunter, Thavamani Palanisami, Michael Dickson, Richard Bush, Geoffrey Evans
T31fEfficient Sorptive Removal of PFOS by Layered Double Hydroxides: Kinetic and Isotherm Study . . . . . . . . . . . . 422Xin Song, Zhihao Hu
T32 — Advances in Nanotechnology in Contamination Assessment and Remediation
T32aFate and Transport of Nano Zero-Valent Iron for Arsenic Remediation in Subsurface Environmentand its Potential Environmental Risks . . . . . . . . . . . . . . . . . . . . . . . . . . . . . . . . . . . . . . . . . . . . . . . . . . . . . . . . . . . . . . . . . . . . . . . . . . . . . 424Zhigang Yu, Irene M.C. Lo
T32bAdsorptive Removal of Oxytetracycline Antibiotic in Aqueous Media Using Halloysite Nanoclay . . . . . . . . . . . . . 425Sammani Ramanayaka, Meththika Vithanage, Binoy Sarkar, Yong Sik Ok
T32cInteractions Between Nanoparticles and Flame Retardants in Wastewater Treatment Aggregates. . . . . . . . . . . . . 427Anwar Ul Haq Khan, Yanju Liu, Ravi Naidu, Rajarathnam Dharmarajan, Cheng Fang
T32dSmectite-Supported Nano Zero Valent Iron for Arsenic Removal from Water: Kinetics and Effect of pH. . . . . . . . 429Kh. Ashraf Uz-Zaman, Bhabananda Biswas, Mohammad Mahmudur Rahman, Ravi Naidu
T32eInteractions of Surface Activated Halloysite Nanotube with Imidacloprid . . . . . . . . . . . . . . . . . . . . . . . . . . . . . . . . . . . . . . . 431Md. Nuruzzaman, Yanju Liu, Ravi Naidu
T32fRemoval of Perfluorooctanoic Acid (PFOA) from Contaminated Water by Cobalt Zinc Ferrites(Co0.5Zn0.5Fe2O4) Nanocrystals. . . . . . . . . . . . . . . . . . . . . . . . . . . . . . . . . . . . . . . . . . . . . . . . . . . . . . . . . . . . . . . . . . . . . . . . . . . . . . . . . . . . 433Sudeep Shukla, Prem Gupta, Deepika Pandey, Shruti Dutta, Preeti Thakur, Atul Thakur
T33 — LNAPL Natural Source Zone Depletion
T33aManaging LNAPL Sites with Natural Source Zone Depletion — When is it the Right Path? . . . . . . . . . . . . . . . . . . . . 435Andre Smit, Matt Rousseau, Peter Nadebaum, Therese Hammond
T33bNatural Source Zone Depletion (NSZD) Assessment of a Complex Site Using CO2 Efflux Method . . . . . . . . . . . . 437G. Cozens, J. Duran, I. Hers, J. Rayner, M. Donn
42

T33cWhat Lies Beneath? High Resolution Site Characterisation Tools Used to Develop LNAPLConceptual Site Models . . . . . . . . . . . . . . . . . . . . . . . . . . . . . . . . . . . . . . . . . . . . . . . . . . . . . . . . . . . . . . . . . . . . . . . . . . . . . . . . . . . . . . . . . . . . 439Scott Robinson, Daniel Der Tateossian, Chris Arends
T33dNatural Source Zone Depletion Assessment Using Soil Flux Data — Passive Flux Trap versus StaticFlux Box Methods . . . . . . . . . . . . . . . . . . . . . . . . . . . . . . . . . . . . . . . . . . . . . . . . . . . . . . . . . . . . . . . . . . . . . . . . . . . . . . . . . . . . . . . . . . . . . . . . . . 441Bobby Wang, Danny McDonald
T33eThe Use of Natural Source Zone Depletion (NSZD) as a Valid Approach to Achieve Closure of anActive LNAPL Recovery System . . . . . . . . . . . . . . . . . . . . . . . . . . . . . . . . . . . . . . . . . . . . . . . . . . . . . . . . . . . . . . . . . . . . . . . . . . . . . . . . . . . 443Ruben Espinosa, David Alcalde
T33fBenefits of a Multiple Lines of Evidence Approach for NSZD . . . . . . . . . . . . . . . . . . . . . . . . . . . . . . . . . . . . . . . . . . . . . . . . . . . . 445Steven Gaito, Jonathon Smith, Brad Koons
T34 — Risk Assessment, Management and Communication
T34aRisk Communication — An Empirical Canon . . . . . . . . . . . . . . . . . . . . . . . . . . . . . . . . . . . . . . . . . . . . . . . . . . . . . . . . . . . . . . . . . . . . . 447Paul Nathanail
T34bGuidance for Assessing the Ecological Risks of Threatened and Endangered Species at AqueousFilm Forming Foam (AFFF)-Impacted Sites . . . . . . . . . . . . . . . . . . . . . . . . . . . . . . . . . . . . . . . . . . . . . . . . . . . . . . . . . . . . . . . . . . . . . . . 449Jason Conder, Jennifer Arblaster, Emily Larson, Juliane Brown, Christopher Higgins
T34cCommunication Pitfalls in Large Scale Projects . . . . . . . . . . . . . . . . . . . . . . . . . . . . . . . . . . . . . . . . . . . . . . . . . . . . . . . . . . . . . . . . . . 451Shandel Coleman, Charlie Barber
T34dA Risk Based Approach for the Management of Disused Railway Sleepers . . . . . . . . . . . . . . . . . . . . . . . . . . . . . . . . . . . . . 453Dawit Bekele, Zhaomin Dong, Yanju Liu, Jianhua Du, Md. Mezbaul Bahar, Prashant Srivastava, Ravi Naidu
T34eInhalation Bioaccessibility of Metal(loid)s in Dust from Mine Impacted Soil . . . . . . . . . . . . . . . . . . . . . . . . . . . . . . . . . . . . 455Peter Sanderson, D.T. Lamb, Ravi Naidu
T34fBeryllium Sorption to Sandy Soil at a Legacy Waste Site . . . . . . . . . . . . . . . . . . . . . . . . . . . . . . . . . . . . . . . . . . . . . . . . . . . . . . . . 457Md. Rashidul Islam, Peter Sanderson, Ravi Naidu, Mathew P. Johansen, Timothy E. Payne
T35 — International Approaches to Managing Contaminated Environments
T35aOverview of Environmental Contamination Issues in Africa: From Policy, Risk and RemediationPerspectives . . . . . . . . . . . . . . . . . . . . . . . . . . . . . . . . . . . . . . . . . . . . . . . . . . . . . . . . . . . . . . . . . . . . . . . . . . . . . . . . . . . . . . . . . . . . . . . . . . . . . . . . 459Lucian Obinnaya Chukwu
T35bIndian Approach to Managing Contaminated Environments . . . . . . . . . . . . . . . . . . . . . . . . . . . . . . . . . . . . . . . . . . . . . . . . . . . . . 461Sudeep Shukla, Shruti Dutta, Deepika Pandey
T35cEnvironmental Pollution and Remediation Strategies in Pakistan . . . . . . . . . . . . . . . . . . . . . . . . . . . . . . . . . . . . . . . . . . . . . . . 463Hafiz Naeem Asghar, Zahir Ahmad Zahir, Muhammad Javed Akhtar
T35dPresence of Multiple Pollutants in the Environment: Bangladesh Perspectives . . . . . . . . . . . . . . . . . . . . . . . . . . . . . . . . 465Mohammad Mahmudur Rahman, Ravi Naidu
43

T35eSri Lanka’s Approach on Managing the Contaminated Environments . . . . . . . . . . . . . . . . . . . . . . . . . . . . . . . . . . . . . . . . . . . 467Meththika Vithanage
T36 — Bioavailability of Contaminants
T36aThe Importance of Bioaccessibility Testing for Metal(loids) in Soil at Contaminated Sites . . . . . . . . . . . . . . . . . . . . . 469Mark Cave, M.A. Ayanka Wijayawardena, Ravi Naidu
T36bChallenges Associated with Assessing the Relative Oral Bioavailability of Organic Chemicals forUse in Human Health Risk Assessment . . . . . . . . . . . . . . . . . . . . . . . . . . . . . . . . . . . . . . . . . . . . . . . . . . . . . . . . . . . . . . . . . . . . . . . . . . . 471Yvette W. Lowney, Luchun Duan, Ravi Naidu
T36cInfluence of Soil Carbon and Carbonaceous Amendments on the Bioavailability of Benzo[a]pyrenein Soils . . . . . . . . . . . . . . . . . . . . . . . . . . . . . . . . . . . . . . . . . . . . . . . . . . . . . . . . . . . . . . . . . . . . . . . . . . . . . . . . . . . . . . . . . . . . . . . . . . . . . . . . . . . . . . 473Luchun Duan, Ravi Naidu
T36dUsing Arsenic Site-Specific Bioaccessibility in Soils to Refine Remedial Targets . . . . . . . . . . . . . . . . . . . . . . . . . . . . . . 475Kathleen Prohasky, Lyn Denison, Ken Kiefer
T36eElement Mobilization and Bioavailability During Weathering and Soil Formation . . . . . . . . . . . . . . . . . . . . . . . . . . . . . . . 477Deepika Pandey
T41 — PFAS Toxicity, Health Risks, Fate and Transport
T41aAdverse Health Effects of Per- and Polyfluoroalkyl Substances (PFAS) . . . . . . . . . . . . . . . . . . . . . . . . . . . . . . . . . . . . . . . . . 479Christopher Lau
T41bIn-Situ Lock Down of PFAS — Case Study: Science Underpinning Sustainable Risk-BasedManagement . . . . . . . . . . . . . . . . . . . . . . . . . . . . . . . . . . . . . . . . . . . . . . . . . . . . . . . . . . . . . . . . . . . . . . . . . . . . . . . . . . . . . . . . . . . . . . . . . . . . . . . . 481Ravi Naidu, Kaihong Yan, Sreenivasulu Chadalavada, Dawit Bekele, Luchun Duan, Yanju Liu
T41cTowards Understanding the Relationship Between PFAS Sorption-Desorption and Soil Properties . . . . . . . . . . . 483Anthony C. Umeh, Sonia Shilpi, Ravi Naidu, Sreenivasulu Chadalavada, D.T. Lamb, Luchun Duan, Yanju Liu,
Dawit Bekele
T41dProgressing the Practice of Evaluating Ambient Background PFAS. . . . . . . . . . . . . . . . . . . . . . . . . . . . . . . . . . . . . . . . . . . . . 485H. Mikkonen, Antti Mikkonen, Christian Wallis, S.-Y. Chiang
T41eInvestigating Fate and Transport of PFAS’ Mixtures in the Vadose Zone at Contaminated Site. . . . . . . . . . . . . . . . . 487Dawit Bekele, Yanju Liu, Anthony C. Umeh, Jianhua Du, Sreenivasulu Chadalavada, Mark Donaghey, Ravi Naidu
T41fData Derived Extrapolation Factors for Developmental Toxicity: A Preliminary Research Case Studywith Perfluorooctanoate (PFOA) . . . . . . . . . . . . . . . . . . . . . . . . . . . . . . . . . . . . . . . . . . . . . . . . . . . . . . . . . . . . . . . . . . . . . . . . . . . . . . . . . . . 489Michael L. Dourson, Bernard Gadagbui, Chijioke Onyema, Patricia M. McGinnis, Raymond G.York
44

T42 — Petroleum Hydrocarbon Contaminated Site Assessment, Remediation and Management
T42aConfirming in-situ Benzene Biodegradation Under Anaerobic Conditions Using Stable IsotopeProbing. . . . . . . . . . . . . . . . . . . . . . . . . . . . . . . . . . . . . . . . . . . . . . . . . . . . . . . . . . . . . . . . . . . . . . . . . . . . . . . . . . . . . . . . . . . . . . . . . . . . . . . . . . . . . . 491Dora Taggart, Kate Clark, Karen Hebbard
T42bAre You Drinking Benzene? Impact on Potable Water Pipes in Solvent-Contaminated Sites . . . . . . . . . . . . . . . . . . . 493Jean Meaklim
T42cMore from Less? Can Missing Data be Extrapolated to Overcome Data Gaps in Plume StabilityAssessments? . . . . . . . . . . . . . . . . . . . . . . . . . . . . . . . . . . . . . . . . . . . . . . . . . . . . . . . . . . . . . . . . . . . . . . . . . . . . . . . . . . . . . . . . . . . . . . . . . . . . . . 495Scott Robinson, Daniel Der Tateossian
T42dInsights into the Oxidation Kinetics and Mechanism of Diesel Hydrocarbons by UltrasoundActivated Persulfate in a Soil System. . . . . . . . . . . . . . . . . . . . . . . . . . . . . . . . . . . . . . . . . . . . . . . . . . . . . . . . . . . . . . . . . . . . . . . . . . . . . . 497Yongjia Lei, Yu Tian, Cheng Fang, Ravi Naidu
T42eA Universal Calibration Model for In-Field FTIR Measurement of Petroleum Contaminated Soil . . . . . . . . . . . . . . . 499Sean Manning, Tao Zhang, Andrew Toop, Richard Stewart
T42fPolar Metabolites in Petroleum Hydrocarbon Contaminated Groundwater: Allium cepa Cyto- &Genotoxicity Assay . . . . . . . . . . . . . . . . . . . . . . . . . . . . . . . . . . . . . . . . . . . . . . . . . . . . . . . . . . . . . . . . . . . . . . . . . . . . . . . . . . . . . . . . . . . . . . . . . 501Logeshwaran Panneerselvan, Megharaj Mallavarapu, Sreenivasulu Chadalavada, Ravi Naidu
T43 — Recent Advances in Site Characterisation
T43aThe Use of Adaptive Management and High-Resolution Site Characterization to Advance Closure ofSites with Large, Dilute Plumes . . . . . . . . . . . . . . . . . . . . . . . . . . . . . . . . . . . . . . . . . . . . . . . . . . . . . . . . . . . . . . . . . . . . . . . . . . . . . . . . . . . . 503Ryan A. Wymore, Nathan Smith, Michael B. Smith, Tamzen Macbeth
T43bAdvancing Site Characterisation by Assembling Multiple Contemporary and Historical Data Sources. . . . . . . . 505John Lee, Peter A. Rodgers, Howard D. Waldron
T43cCase Study: Real Time Assessment of Remote Multi-Sensitive Sites Using Portable XRF and MobileData Capture Technologies. . . . . . . . . . . . . . . . . . . . . . . . . . . . . . . . . . . . . . . . . . . . . . . . . . . . . . . . . . . . . . . . . . . . . . . . . . . . . . . . . . . . . . . . . 507Freya Amon, Christian Wallis, Andrew Barker
T43dOne Dimensional Groundwater Elevation Prediction Model. . . . . . . . . . . . . . . . . . . . . . . . . . . . . . . . . . . . . . . . . . . . . . . . . . . . . . 509Stefan Charteris
T43eChanges in Land Use Pattern Using Remote Sensing in and Around Faridabad District, Haryana,India Over Last Four Decades . . . . . . . . . . . . . . . . . . . . . . . . . . . . . . . . . . . . . . . . . . . . . . . . . . . . . . . . . . . . . . . . . . . . . . . . . . . . . . . . . . . . . 511Shruti Dutta, Koorapati Kirtana
T43fDrinking Water Quality from an Arsenic Contaminated District, Bangladesh: Human Health Risk. . . . . . . . . . . . . 514Md. Aminur Rahman, D.T. Lamb, Mohammad Mahmudur Rahman, Peter Sanderson, Md. Mezbaul Bahar, Ravi Naidu
45

T44 — Approaches to Prevention of Contamination
T44aA Regulators Perspective on Preventative Based Clean Up. . . . . . . . . . . . . . . . . . . . . . . . . . . . . . . . . . . . . . . . . . . . . . . . . . . . . . 516Kristin Wasley, Barbara Schulz
T44bA New Environment Protection Act for Victoria — Implications . . . . . . . . . . . . . . . . . . . . . . . . . . . . . . . . . . . . . . . . . . . . . . . . . . 518Robyn Madsen, Peter Nadebaum
T44cThe Impact of Climate Evolution on Contaminated Groundwater Resources: Solving a SolvableHuman and Ecological Health Crisis in the Making. . . . . . . . . . . . . . . . . . . . . . . . . . . . . . . . . . . . . . . . . . . . . . . . . . . . . . . . . . . . . . . 520Scott D. Warner
T44dUse of Environmental Control Enclosures to Manage VOC Emissions for Remediation Projects —What is Best Practice? . . . . . . . . . . . . . . . . . . . . . . . . . . . . . . . . . . . . . . . . . . . . . . . . . . . . . . . . . . . . . . . . . . . . . . . . . . . . . . . . . . . . . . . . . . . . . 522John Hunt, Mark Bennett, Adam Fletcher, Campbell McNiven, Ryan Morrish, William Taggart
T44eA Comparison of Treatment Methods for PFAS Impacted Concrete: Results from Laboratory andField Trials. . . . . . . . . . . . . . . . . . . . . . . . . . . . . . . . . . . . . . . . . . . . . . . . . . . . . . . . . . . . . . . . . . . . . . . . . . . . . . . . . . . . . . . . . . . . . . . . . . . . . . . . . . . 524Danielle Toase, Jason Lagowski, Ian Ross, Peter Storch, Tom Statham
T45 — Assessment, Remediation and Management of Contaminated Wastewater and SurfaceWater
T45aFate and Transport of PFASs in Surface Waters and Sediments: Potential for Long Range Transport?. . . . . . . . 525Ian Ross, Jonathan Miles, Danielle Toase, Peter Storch
T45bDerivation of Water Quality Guideline Value for Marine Discharge of Monoethylene Glycol . . . . . . . . . . . . . . . . . . . . 527Vida Maulina, Lisa Thomson, Ken Kiefer
T45cAdsorption of Pb(II) in Wastewater by Modified Iron Ore Tailings . . . . . . . . . . . . . . . . . . . . . . . . . . . . . . . . . . . . . . . . . . . . . . . . 529Yongliang Chen, Jinyang Du, Yanju Liu, Ravi Naidu
T45dAdsorption and Co-Precipitation of Cobalt on Biomass Manganese Oxide . . . . . . . . . . . . . . . . . . . . . . . . . . . . . . . . . . . . . 531James O’Connor, Kato Tomoaki, Toshihiko Ohnuki
T45eAssessment of Physico-Chemical Properties of Soil and Groundwater Pollution with PostMethanated Distillery Effluent Irrigation in Western Uttar Pradesh of India . . . . . . . . . . . . . . . . . . . . . . . . . . . . . . . . . . . . . 533Uday Pratap Shahi, Ashok Kumar, B.P. Dhyani
T45fUST’s Catch Basin Inserts — A Revolution in “at Source” Stormwater Quality Improvement . . . . . . . . . . . . . . . . . . 535Craig Rothleitner, Robert Humphries
T46 — Adverse Impacts of Agriculture on Soil, Water and Food Quality
T46aArsenic in Rice from Bangladesh: Geographical Variation, Potential Cancer Risk and MitigationOptions. . . . . . . . . . . . . . . . . . . . . . . . . . . . . . . . . . . . . . . . . . . . . . . . . . . . . . . . . . . . . . . . . . . . . . . . . . . . . . . . . . . . . . . . . . . . . . . . . . . . . . . . . . . . . . 537Mohammad Mahmudur Rahman, Shofiqul Islam, Ravi Naidu
T46bEffect of Zinc and Cadmium on Hydroponically Grown Mungbean Varieties . . . . . . . . . . . . . . . . . . . . . . . . . . . . . . . . . . . . 539Md. Harunur Rashid, Mohammad Mahmudur Rahman, Ravi Naidu
46

T46cAre Root Elongation Assays Suitable for Establishing Metallic Anion Ecotoxicity Thresholds? . . . . . . . . . . . . . . . 541Marjana Yeasmin, D.T. Lamb, Mohammad Mahmudur Rahman, Ravi Naidu
T46dApplication of Data-Driven Prediction Models for Modeling Seawater Intrusion in Aquifers . . . . . . . . . . . . . . . . . . . 543Alvin Lal, Bithin Datta
T46eGeographical Variation of Cadmium Distribution in Rice from Bangladesh: A Market Basket Survey . . . . . . . . . 545Syfullah Shahriar, Mohammad Mahmudur Rahman, Ravi Naidu
T46fAddition of Organic Matter Can Reduce Arsenic Uptake in Wheat . . . . . . . . . . . . . . . . . . . . . . . . . . . . . . . . . . . . . . . . . . . . . . . 547Jajati Mandal, Anshuman Kohli, Akanksha, Preety Bala Kumari
T46gEffect of Arbuscular Mycorrhizal Fungi on Nutrient Content of Finger Millet Under ZincContamination . . . . . . . . . . . . . . . . . . . . . . . . . . . . . . . . . . . . . . . . . . . . . . . . . . . . . . . . . . . . . . . . . . . . . . . . . . . . . . . . . . . . . . . . . . . . . . . . . . . . . . 549Deeksha Krishna, H.K. Sachan
W11 — Plenary Session
W11bNature Based Solutions to Climate Change: Evidence from Africa and Asia . . . . . . . . . . . . . . . . . . . . . . . . . . . . . . . . . . . 552Pushpam Kumar
W21 — PFAS Analysis and Measurement
W21aAnalysis of Emerging PFAS Contaminants Using High Resolution Accurate Mass Spectrometry . . . . . . . . . . . . . 554Bob Symons, Jonathon Angell, Jack Thompson
W21bPFAS Top Assay Interlaboratory Study — Supporting Analytical Laboratories . . . . . . . . . . . . . . . . . . . . . . . . . . . . . . . . . 557Raluca Iavetz, Mark Lewin, Geoff Morschel, Danny Slee, Cheryl Lim, Annette Nolan, Charles Grimison,
Marc Centner, Steven McGrath, Bob Symons
W21cImproving Measurement Reliability of the PFAS Top Assay . . . . . . . . . . . . . . . . . . . . . . . . . . . . . . . . . . . . . . . . . . . . . . . . . . . . . . 559Annette Nolan, Charles Grimison, Raluca Iavetz, Danny Slee, Cheryl Lim, Marc Centner, Steven McGrath,
Bob Symons, Karl C. Bowles
W21dFact Check: Do Laboratory Methods Really Affect the Quality of PFAS Data? . . . . . . . . . . . . . . . . . . . . . . . . . . . . . . . . . . 561Giorgio De Nola, Tarah Hagen, Anthony Lane
W21eApplication and Confirmation of Total Oxidizable Precursors Assay (TOPA) to Monitor PFAS with aPortable Reading Kit. . . . . . . . . . . . . . . . . . . . . . . . . . . . . . . . . . . . . . . . . . . . . . . . . . . . . . . . . . . . . . . . . . . . . . . . . . . . . . . . . . . . . . . . . . . . . . . . 563Md. Al Amin, Zahra Sobhani, Yanju Liu, Rajarathnam Dharmarajan, Ravi Naidu, Cheng Fang
W21fBalancing Regulatory PFAS Quantification with Emerging PFAS Identification Using LC-MS/MS andLC-Q/TOF. . . . . . . . . . . . . . . . . . . . . . . . . . . . . . . . . . . . . . . . . . . . . . . . . . . . . . . . . . . . . . . . . . . . . . . . . . . . . . . . . . . . . . . . . . . . . . . . . . . . . . . . . . . . 565Tarun Anumol, James Pyke, Hui Zhao, Jerry Zweigenbaum
47

W22 — Challenges with PFAS Remediation and Management
W22aBench-Scale Evaluation of Flocculant Technology for Treating PFAS-Contaminated Water . . . . . . . . . . . . . . . . . . . . 566Kent Sorenson, Charles Schaefer, Dung Nguyen, Christopher Higgins, Sarah Mass, Andrew Maizel,
Youn Jeong Choi
W22bQuick & Dirty? Mobility of PFAS in Ground and Surface Water — A Four Site Case Study. . . . . . . . . . . . . . . . . . . . . 568Christopher Sandiford, Bradly Clarke
W22cLogistical Challenges Transporting PFAS Impacted Soils from a Remote Location to Victoria forThermal Treatment . . . . . . . . . . . . . . . . . . . . . . . . . . . . . . . . . . . . . . . . . . . . . . . . . . . . . . . . . . . . . . . . . . . . . . . . . . . . . . . . . . . . . . . . . . . . . . . . . . 570Andrew Thomas
W22dA Novel Approach to Prioritising PFAS Source Zones for Remedial Action Using a Broad Scale MassContribution Assessment . . . . . . . . . . . . . . . . . . . . . . . . . . . . . . . . . . . . . . . . . . . . . . . . . . . . . . . . . . . . . . . . . . . . . . . . . . . . . . . . . . . . . . . . . . 571Gemma Wakefield, Rachael Wall, Jonathan Medd, Ken De Greene
W22eDerivation and Selection of Aquatic PFOS Screening Levels for Site Investigations . . . . . . . . . . . . . . . . . . . . . . . . . . . 573Heather A. Lanza, Kylie Dodd, Peter Nadebaum, Jill Woodworth
W22fDoes Agricultural Land Contaminated by PFAS Need Management?. . . . . . . . . . . . . . . . . . . . . . . . . . . . . . . . . . . . . . . . . . . . 574Antti Mikkonen, Jen Martin, Robert McKenzie, Roger Drew, Clare Death, David Champness, Michael Roberts
W23 — Innovative in-situ and ex-situ Remediation Technologies
W23aOptimisation of Integrated and Adaptive Remediation Design and Operations Scheduling. . . . . . . . . . . . . . . . . . . . 576Larry M. Deschaine, Metin Ozbek
W23bAdvances in Horizontal Remediation Wells: The HRX Well . . . . . . . . . . . . . . . . . . . . . . . . . . . . . . . . . . . . . . . . . . . . . . . . . . . . . . . 579Dan Ombalski, Michael Lubrecht, Craig E. Divine
W23cISCO in Australia: What is the State of the Art?. . . . . . . . . . . . . . . . . . . . . . . . . . . . . . . . . . . . . . . . . . . . . . . . . . . . . . . . . . . . . . . . . . . 581Denton Mauldin
W23dRadio Frequency Heating for in-situ Thermal Treatment of Ethylene Dichloride and1,1,2-Trichloroethane in Groundwater . . . . . . . . . . . . . . . . . . . . . . . . . . . . . . . . . . . . . . . . . . . . . . . . . . . . . . . . . . . . . . . . . . . . . . . . . . . . . 583Andrew Gray, Andrew Hunt, Joe Fiacco, Darren Reedy, Cole Pearson, Camillo Coladonato, Jeb Rong,
Ray Kasevich, John McTigue
W23eThe Horizontal Reactive Media Treatment Well (HRX Well) for Passive in-situ Remediation: Design,Implementation, and Field Demonstration. . . . . . . . . . . . . . . . . . . . . . . . . . . . . . . . . . . . . . . . . . . . . . . . . . . . . . . . . . . . . . . . . . . . . . . . . 585Craig E. Divine, Peter Storch, Jesse Wright, Jack Wang, Jesse Hinkle, Jeffrey McDonough, Michelle Crimi,
J.F. Devlin, Michael Lubrecht, Dan Ombalski, Kathleen Gerber
48

W24 — Advances in Vapour Intrusion and Volatiles Assessment, Management and Remediation
W24aUse of Sub-Slab Soil Vapor Concentrations to Estimate Indoor Air Inhalation Risk Using the VaporCloud Model . . . . . . . . . . . . . . . . . . . . . . . . . . . . . . . . . . . . . . . . . . . . . . . . . . . . . . . . . . . . . . . . . . . . . . . . . . . . . . . . . . . . . . . . . . . . . . . . . . . . . . . . 587Atul M. Salhotra
W24bEfficient Vapor Intrusion Investigations in Large Manufacturing Buildings . . . . . . . . . . . . . . . . . . . . . . . . . . . . . . . . . . . . . 589Heather V. Rectanus, Todd Creamer
W24cAn Algorithm for Creating Reasonable Worst Case Exposure Maps for Vapour Intrusion Screening . . . . . . . . . . 591R.A. Evans, Ian M. Delaere, Kateryna Babina
W24dVolatile Chlorinated Hydrocarbon Vapour Intrusion — Establishing a Basis for Public Health Actionfor Trichloroethene. . . . . . . . . . . . . . . . . . . . . . . . . . . . . . . . . . . . . . . . . . . . . . . . . . . . . . . . . . . . . . . . . . . . . . . . . . . . . . . . . . . . . . . . . . . . . . . . . . 593Ian M. Delaere, David L. Simon, R.A. Evans, Kateryna Babina, Chris Lease
W25 — Assessment and Remediation of Organic Contaminants
W25aField Pilot Studies for in-situ Stabilisation/Solidification (ISS) of Hydrocarbon ContaminatedSediments in Kendall Bay, Sydney, New South Wales (NSW), Australia. . . . . . . . . . . . . . . . . . . . . . . . . . . . . . . . . . . . . . . . . . 595Matthew Clutterham, Nathan Sparke, Phil Hutson, Christopher Robb, Dogus Meric
W25bPhotolytic Degradation of Betrixaban in Aqueous Solutions. . . . . . . . . . . . . . . . . . . . . . . . . . . . . . . . . . . . . . . . . . . . . . . . . . . . . 597Tahereh Jasemi Zad, Lokesh P. Padhye
W25cOHS&E Planning of PFAS Investigation Programs: Are All Sunscreens the Same? Are We MissingSomething? . . . . . . . . . . . . . . . . . . . . . . . . . . . . . . . . . . . . . . . . . . . . . . . . . . . . . . . . . . . . . . . . . . . . . . . . . . . . . . . . . . . . . . . . . . . . . . . . . . . . . . . . . 599Antti Mikkonen, Freya Amon, R. Poole, H. Mikkonen, John Frangos, Christian Wallis
W25dTaming the Shrew: Refining PFAS Rehabilitation Goals by Understanding Your Impacts and YourEcosystem . . . . . . . . . . . . . . . . . . . . . . . . . . . . . . . . . . . . . . . . . . . . . . . . . . . . . . . . . . . . . . . . . . . . . . . . . . . . . . . . . . . . . . . . . . . . . . . . . . . . . . . . . . 601Katie Richardson, Michael Rehfisch, Phoebe Hopkins
W25eOccurrence and Distribution of Oxygenated Polycyclic Aromatic Hydrocarbons (oxy-PAHs) in Soilsof an Australian Industrial City. . . . . . . . . . . . . . . . . . . . . . . . . . . . . . . . . . . . . . . . . . . . . . . . . . . . . . . . . . . . . . . . . . . . . . . . . . . . . . . . . . . . . 603Oluyoye Idowu, Kirk T. Semple, Thavamani Palanisami
W25fSorption and Desorption Behaviour of 2,4-D in Nine Selected Urban Soils of Australia . . . . . . . . . . . . . . . . . . . . . . . . 605Md. Meftaul Islam, Rajarathnam Dharmarajan, Megharaj Mallavarapu
W25gEvaluation of Genotoxicity of Perfluorooctane Sulfonate (PFOS) to Allium cepa L. . . . . . . . . . . . . . . . . . . . . . . . . . . . . 607Anithadevi Kenday Sivaram, Logeshwaran Panneerselvan, Ravi Naidu, Megharaj Mallavarapu
W26 — Asbestos and Other Emerging Contaminants
W26aHuman Exposure to Emerging Environmental Chemicals: A Comprehensive Analysis in Indoor Dust. . . . . . . . 609Kurunthachalam Kannan
W26bInnovative Scalable Approaches for the Assessment and Remediation of Asbestos-In-Soil (ASBINS) . . . . . . . . 611Ross McFarland, Marc Wydro, Sam Mitchell
49

W26cAn Adaptive Approach to Community Engagement to Manage Legacy Asbestos Contamination in aResidential Setting . . . . . . . . . . . . . . . . . . . . . . . . . . . . . . . . . . . . . . . . . . . . . . . . . . . . . . . . . . . . . . . . . . . . . . . . . . . . . . . . . . . . . . . . . . . . . . . . . 612Hamish Campbell, Michelle Battam
W26dCommunity Scale Asbestos Remediation Using Digital Data Capture Tools . . . . . . . . . . . . . . . . . . . . . . . . . . . . . . . . . . . . 613Ashton Betti
W26eBioburden of Dioxin-Like Polychlorinated Biphenyls (PCBs) in a Tropical Creek: Health RiskImplications . . . . . . . . . . . . . . . . . . . . . . . . . . . . . . . . . . . . . . . . . . . . . . . . . . . . . . . . . . . . . . . . . . . . . . . . . . . . . . . . . . . . . . . . . . . . . . . . . . . . . . . . . 615Amii Usese, Maureen Onyinye Egbuatu, Lucian Obinnaya Chukwu
W26fNot in Our Backyard . . . Research Findings on the Emerging Contaminates from ClandestineLaboratories and the Impact on the Health and Environment of Regional Australian Communities . . . . . . . . . . . 617Juliet L. Duffy, Kathy R. Woolley
W27 — Urban Redevelopment and Rehabilitation
W27aHow Much Will Your Remediation Project Really Cost?. . . . . . . . . . . . . . . . . . . . . . . . . . . . . . . . . . . . . . . . . . . . . . . . . . . . . . . . . . . 619John Hunt, Ian Brookman, William Taggart
W27bRevisiting Remediation — Evaluating Field and Laboratory Data to Assess the Success of aHistorical Remediation Project. . . . . . . . . . . . . . . . . . . . . . . . . . . . . . . . . . . . . . . . . . . . . . . . . . . . . . . . . . . . . . . . . . . . . . . . . . . . . . . . . . . . . 620Zoe Smith
W27cAchieving the Successful Delivery of One of Sydney’s Largest Remediation Projects: Barangaroo . . . . . . . . . . 622Adam Fletcher
W27dWhat’s Under the Tent? An Insight into the Remedial Operations of the Barangaroo Blocks 4 & 5Remediation Project . . . . . . . . . . . . . . . . . . . . . . . . . . . . . . . . . . . . . . . . . . . . . . . . . . . . . . . . . . . . . . . . . . . . . . . . . . . . . . . . . . . . . . . . . . . . . . . . 623Dan O’Hanlon, Nigel Drought, Allan Garland
W27eElizabeth Quay Development, Perth WA: Case Study . . . . . . . . . . . . . . . . . . . . . . . . . . . . . . . . . . . . . . . . . . . . . . . . . . . . . . . . . . . . . 624David Sim, Alan Foley, Carl Davies
W27fEffective PFAS Rehabilitation of a Large Former Fire Training Facility . . . . . . . . . . . . . . . . . . . . . . . . . . . . . . . . . . . . . . . . . . 626Michael Rehfisch, Juan Riveros, Phoebe Hopkins
W41 — Plenary Session
W41aCleanup 2019 — The Unsession . . . . . . . . . . . . . . . . . . . . . . . . . . . . . . . . . . . . . . . . . . . . . . . . . . . . . . . . . . . . . . . . . . . . . . . . . . . . . . . . . . . 628Paul Nathanail, Ravi Naidu, Prashant Srivastava
50

FROM CRISIS TO COLLABORATION: THE EVOLUTION OF SOUTH AUSTRALIA’S APPROACH TO
MANAGING LEGACY SITE CONTAMINATION
Tony Circelli
South Australian Environment Protection Authority, AUSTRALIA CRC Care, AUSTRALIA [email protected]
Each jurisdiction around Australia has its own regulatory framework to manage legacy site contamination. But the issues and challenges of identifying, assessing, remediating and communicating with affected communities are similar. We have made major strides in building an effective legacy management framework in Australia, with very effective collaboration on building common approaches and tools to provide the best possible outcomes for our communities.
Tony will speak about South Australia’s experience and learnings in managing legacy site contamination, its modern regulatory framework and its evolving approach to working with affected communities. He will also outline what’s on the horizon for the site contamination sector, both from a state and national perspective. This includes the proposed strengthening of state based planning systems to ensure proper assessment and measures around state government urban consolidation objectives, as well as from a national perspective, the development of the PFAS National Environmental Management Plan and the proposed National Remediation Framework and their benefits to the sector.
M11b
Copyright © CRC CARE Pty. Ltd., 2019
CleanUp Conference 2019Adelaide, Australia
8 –12 September 201951
Table of Contentsfor this manuscript

SERDP/ESTCP RESEARCH ON EMERGING CONTAMINANTS
Hans Stroo1, Andrea Leeson2
1Stroo Consulting LLC, 300 Skycrest Dr., Ashland, OR 97520, USA 2SERDP, 4800 Mark Center Drive, Suite 16F16, Alexandria, VA 22350-3605, USA
INTRODUCTION The Strategic Environmental Research and Development Program (SERDP) and the related Environmental Security Technology Certification Program (ESTCP) have been funding research, development, and demonstration projects for over 25 years, with the goal of improving the environmental performance by the U.S. Department of Defense (DoD). One of the primary pillars of the SERDP/ESTCP research program has been the restoration of DoD sites contaminated with chloroethenes and munitions. In recent years, attention has shifted to emerging contaminants, particularly PFAS and 1,4-dioxane. This presentation will briefly summarize the mission and history of SERDP/ESTCP, the lessons learned regarding effective research, development, and demonstration (RD&D) on environmental restoration, and the recent work on two important emerging contaminants. The rationale for recent Statements of Need (SONs) will be described, and the advances resulting from the work on emerging contaminants will be summarized. SERDP/ESTCP HISTORY SERDP and ESTCP have funded environmental restoration RD&D focused on several contaminants, including fuel hydrocarbons, conventional munitions, metals and chlorinated ethenes, as well as some earlier emerging contaminants (notably perchlorate and insensitive munitions. Because the chloroethenes have historically represented DoD’s most difficult groundwater contamination problem, they were the primary focus of SERDP/ESTCP efforts for two decades. Several lessons from that effort provide a basis for responding to more recent emerging contaminants. A particularly important example of applied research in response to a rapidly emerging contaminant is the SERDP/ESTCP research effort after perchlorate was identified as a potentially significant DoD liability. A brief history of that response will be included, with lessons that may be applicable to the current urgent need to manage sites impacted by per- and polyfluorinated alkyl substances (PFAS). 1,4-DIOXANE The most significant emerging contaminants for DoD include PFAS and 1,4-dioxane (1,4-D). Although the presence of 1,4-D in chlorinated solvents has been known for many years, it has become a more pressing problem in the 2000s as regulatory concern about it has increased. SERDP started research on 1,4-D in about 2005, with research establishing the biodegradability of 1,4-D by both metabolic and cometabolic bacteria. Further work in the 2010s has focused on defining the nature and extent of the problem and ensuring site managers and regulators had accurate conceptual site models. Research has since shown that 1,4-D is not as recalcitrant as originally thought, and plumes are not as long as originally feared. Field-scale testing showed that extreme soil vapor extraction (XSVE) can be an effective vadose zone treatment technology, and that aerobic cometabolism can be effective for groundwater treatment. Biomarkers for 1,4-D degrading bacteria have been identified, improving the ability to measure natural and enhanced attenuation processes. Ongoing work is focusing on improving in situ chemical oxidation formulations to treat 1,4-D, as well as using gas mixtures to stimulate a variety of cometabolic bacteria and treat plumes contaminated with both chloroethenes and 1,4-D.
M21a
Copyright © CRC CARE Pty. Ltd., 2019
CleanUp Conference 2019Adelaide, Australia8 –12 September 2019 52
Table of Contentsfor this manuscript

PER- AND POLYFLUOROALKYL SUBSTANCES Over the last decade, PFAS has rapidly become the leading focus of SERDP RD&D efforts, as the magnitude and complexity of DoD’s challenges have become recognized. The bulk of the presentation will focus on the PFAS research efforts. The use of aqueous film-forming foam (AFFF) to suppress hydrocarbon fires has resulted in PFAS contamination at potentially hundreds of sites, and there is an urgent need to characterize sites efficiently and develop and demonstrate efficient and effective remediation options. Research on PFAS in groundwater was initiated in 2011, and funded work has led to several advances, including an understanding of the nature of the PFASs (and other components) present in different AFFF formulations, fundamental PFAS fate and transport information, identification of perfluoroalkyl acid (PFAA) precursors present in AFFFs and their transformation pathways, development of the Total Oxidizable Precursor assay, and initial research on several potential remediation technologies. An August 2017 SERDP workshop on AFFF contamination summarized the nature of DoD’s problems, and identified the most critical RD&D needs. The critical research needs included: 1) a better understanding of PFAS fate and transport in the subsurface; 2) basic research on PFAS toxicity, bioavailability and biomagnification; 3) less costly and more effective treatment technologies, including methods to treat concentrated PFAS wastes on-site and off-site; 4) standardized sampling and analytical procedures; and 5) forensic methods to identify sources and characterize groundwater plumes. The key demonstration and validation needs included: 1) demonstrations of promising treatment technologies, including methods to treat concentrated wastes and both in situ and ex situ groundwater treatment technologies; 2) measurements of mass flux and source depletion, particularly from the vadose zone to groundwater; 3) improved tools for field assessment and rapid screening; and 4) validation of PFAS fate and transport models. In addition, technology transfer needs were highlighted, notably the development of better risk communication tools. Progress towards these goals has been rapid. In the last three years, 10 SONs related to AFFF contamination have been released, with several projects selected under each SON. Current research includes several ecotoxicity projects focused on developing relevant criteria and guidance on ecological risk assessments, proof-of-concept demonstrations for promising technologies to treat investigation-derived wastes, bench-and field-scale testing of several technologies to sequester and treat PFASs, and research to improve PFAS analyses. CONCLUSION The presentation will conclude with some lessons learned from responding to these and other emerging contaminants. Responses are often highly reactive, and can be chaotic and difficult to manage efficiently. Characteristics of effective emerging contaminant research efforts include fostering private sector innovation, ensuring scientific rigor and objectivity, providing credible cost and performance data, getting input from diverse perspectives, and building sustained efforts to transfer the knowledge to defined target audiences effectively. Having built an infrastructure and institutional knowledge over more than 25 years of RD&D on cleanup has allowed SERDP/ESTCP to respond rapidly to these new emerging contaminants. Sustaining such an infrastructure will ensure effective responses to new contaminants of concern and future changes in criteria for existing contaminants.
53
Table of Contentsfor this manuscript

PFAS RESEARCH AND DEVELOPMENT: OVERVIEW OF KEY ISSUES AND TECHNOLOGIES
Charles J. Newell1, David T. Adamson1, Poonam R. Kulkarni1, Linda Hall2
1GSI Environmental, Inc., 2211 Norfolk, Suite 1000, Houston Texas, 77098, USA
2GSI Environmental, Inc., 155 Grand Ave., Suite 704, Oakland, California, 94612, USA [email protected]
INTRODUCTION Per- and Polyfluoroalkyl Substances (PFAS) are now recognized as perhaps the most important class of emerging contaminants at soil and groundwater cleanup sites. For example, approximately 20% of the population of the U.S. State of Michigan is served by water supply systems with detected PFAS in the drinking water. The U.S. Department of Defense (DOD) has spent over US $200 million over the past five years on PFAS sites and developed a “back of the envelope” estimate that an additional US $2 billion may be needed for PFAS cleanup at DOD sites. The cost of cleanup, risk management, and mitigation associated with PFAS are still highly uncertain because many regulatory and technical questions remain unanswered. However, the potential scale and challenges associated with managing PFAS sites has catalyzed the research community to better understand PFAS toxicology, transport and fate, remediation technologies, and the true nature and scale of the PFAS problem. A broad overview of this research effort is described in more detail below. METHODS Key PFAS research targets were compiled based on the scientific literature, project experience, recent conference proceedings, and by comparing the PFAS problem to that associated with historical groundwater contaminants. RESULTS AND DISCUSSION The PFAS research effort was first put into context by comparing the PFAS problem to the history of subsurface contamination research since the 1980s. Then key research target areas are summarized. Scale of the Problem PFAS have been in use since the 1940s as ingredients of firefighting foam and other industrial products, and in many consumer products such as cookware, stain repellents, and packaging. Research studies have shown that these uses have contributed to the worldwide distribution of PFAS in humans, other biota, and the environment. The State of Michigan was one of the first states in the U.S. to look for PFAS in the environment, and as of mid-2019 identified 46 sites exceeded the USEPA’s 70 ppt drinking water health advisory for PFOA and/or PFOS. There is still uncertainty about the relative scale of subsurface PFAS contamination vs. other contaminant classes such as hydrocarbons and chlorinated solvents however. Impact on Subsurface Contamination Research Schwartz et al. (2018) wrote "What’s Next Now That the Boom in Contaminant Hydrogeology Has Busted?” that explained how subsurface hydrology grew from a small niche area in the 1960s to become the dominant environmental research area by 1995, but then this “1000-year flood” of research, (based on the number of published research articles) receded. The authors concluded that the research community was unable to sustain transformational change in the field and “The focus of research has clearly shifted away from SH (Subsurface Hydrology) to areas of hydrology associated with climate change, water cycle modeling and similar themes.” The PFAS problem may be serious enough to spark another flood of subsurface research funding to address key PFAS-centric issues related to toxicology,
M21b
Copyright © CRC CARE Pty. Ltd., 2019
CleanUp Conference 2019Adelaide, Australia8 –12 September 2019 54
Table of Contentsfor this manuscript

transport and fate, and remediation. The key contaminated site research programs in the U.S. i.e., the DOD’s SERDP and ESTCP programs, have steadily increased their emphasis on PFAS with more and more PFAS research initiatives over the past five years. Key Research Areas Key challenges for managing the PFAS problem include the following:
• Analytical Challenges. Currently analytical techniques are relatively expensive and only characterize a fraction of the PFAS compounds present at contaminated sites. Research is ongoing for better screening technologies such as the PIGE analysis and other techniques.
• Toxicology. Of the many PFAS that are or have been in commercial use, the majority are uncharacterized with respect to their toxicity. The extraordinary structural diversity and number of individual PFAS means that it is not feasible to continue to evaluate PFAS toxicity one chemical at a time. As a result, Federal research agencies have begun to apply contemporary toxicological methods, including high throughput testing (HTT), to complete initial hazard assessments of 75 PFAS and to prioritize chemicals and structural categories for in vivo testing (Patlewicz et al., 2019). Because even HTT takes significant amounts of time, there is a pressing need for an interim strategy to characterize the toxicity of the many PFAS present in the environment.
• Transport and Fate. The transport and fate of PFAS are being studied from a number of perspectives, including high-resolution sampling of PFAS sites, detailed data mining studies, and contaminant transport models that simulate retardation and matrix diffusion processes in PFAS plumes.
• In-Situ Remediation. There are currently no in-situ remediation technologies that will completely destroy or convert PFAS to innocuous end products, but researchers are studying how in-situ oxidation technologies convert precursor compounds, how stabilization technologies perform, and on novel in-situ technologies for PFAS. One important research question is whether in-situ remediation strategy, like the strategy employed at many chlorinated solvent sites, is appropriate for PFAS sites or does point of use treatment and control/stabilization strategies provide more benefit to society.
• Ex-Situ Remediation. Most PFAS plumes that require some type of control are being managed with pump and treat systems, with treatment primarily via activated carbon. Research efforts are focusing on better sorbents and novel treatment processes such as use of plasma, sonolysis, and photodecomposition technologies.
CONCLUSIONS The toxicological, fate and transport, and remediation research community has had an increasing focus on PFAS related issues over the past several years as the scope of the problem has become clearer. The scale and severity of the PFAS problem may be large enough that significant research funding will be provided to better understand the health risks associated with PFAS, the transport and fate of these substances, and how to manage PFAS contaminated sites. REFERENCES Patlewicz, G., Richard, A., Williams, A., Grulke, C., Sams, R., Lambert, J., Noyes, P., DeVito,
M., Hines, R., Strynar, M., Guiseppi-Elie, A., and R. Thomas (2019) A Chemical Category Approach for Selecting 75 Per- and Polyfluoroalkyl substances (PFAS) for Tiered Toxicity and Toxicokinetic Testing. Environmental Health Perspectives. 127(1):14501-14505.
Schwartz, F., Y. Zhang, and M. Ibaraki (2018) What’s Next Now That the Boom in Contaminant Hydrogeology Has Busted? Groundwater, Dec. 2018 doi: 10.1111/gwat.12851
55
Table of Contentsfor this manuscript

STATE OF THE SCIENCE OF THE FATE AND TRANSPORT OF PFAS
Ian T. Cousins
Department of Environmental Science and Analytical Chemistry (ACES),
Stockholm University, SE-106 91 Stockholm, SWEDEN [email protected].
INTRODUCTION Understanding the fate and transport of per- and polyfluoroalkyl substances (PFAS) has been the subject of extensive scientific effort since the early 2000s. Among the more than 4000 PFAS on the global market, the long-chain perfluoroalkyl acids (PFAAs) have been identified as global contaminants of concern due to their widespread presence in wildlife and humans, persistence, bioaccumulative potential, and toxicity (Wang et al., 2017). As a result of voluntary actions by industry and regulation, the long-chain PFAAs have been largely phased-out from use in North America, Europe and Australasia, although legacy contamination problems in these regions associated with long-chain PFAAs will keep scientists occupied for some years to come. In addition to the long-chain PFAAs and their precursors, there has also been increasing concern regarding the thousands of other PFAS in use. This concern is driven by the lack of knowledge of chemical structures, properties, uses, and toxicological profiles of these relatively poorly studied PFAS (Wang et al., 2017). Understanding fate and transport of PFAS is key to understanding the wildlife and human exposure to PFAS, which is turn is key to risk assessment. In my own research, my colleagues and I have developed and applied computer models to predict the fate, transport and exposure of PFAS. Applying such models requires knowledge of source emissions of PFAS, which my research group has compiled (Prevedouros et al., 2006). In this keynote presentation, I will provide an overview of the state of the science of the fate and transport of PFAS. I will focus my presentation on PFAAs (with both “short” and “long” perfluoroalkyl chains) and their precursors, but will also provide my thoughts on similarities and differences in the fate and transport behaviour of other classes of PFAS. METHODS In compiling this keynote presentation, which is a critical review, I have searched the scientific literature using electronic databases or “search engines”, specifically; Clarivate Analytics’ Web of Science and Elsevier’s Scopus. I used a combination of the articles that I found through my literature searches together with my own expertise and experience in the field of fate and transport of PFAS. I decided to present my findings on key PFAS properties that affect fate and transport behaviour and then discuss the fate and transport of PFAS at different spatial scales, namely; 1) global, 2) “regional” and 3) “local” i.e. near to contamination “hot spots”. RESULTS AND DISCUSSION Properties. PFAAs do not degrade in the environment. They are furthermore acidic and dissociate to their anionic form at environmental pH. PFAAs thus are relatively soluble in water, do not sorb to organic matter as strongly as neutral hydrophobic organic substances, and do not undergo gas-phase transport from water-to-air (Wang et al., 2017). Sorption of PFAAs to natural organic matter increases with perfluoroalkyl chain length (Guelfo and Higgins, 2013). Solubility in water and relatively low sorption to natural organic matter leads to mobility of PFAAs in soil and water. Strong surface active behaviour leads to interfacial adsorption and unique fate and transport behaviour (e.g. sea spray aerosol transport and adsorption to air-water interfaces in the unsaturated zone) (Prevedouros et al., 2006, Brusseau et al., 2019).
M21c
Copyright © CRC CARE Pty. Ltd., 2019
CleanUp Conference 2019Adelaide, Australia8 –12 September 2019 56
Table of Contentsfor this manuscript

Global fate and transport. For PFCAs, the major historical emission source was from fluoropolymer (e.g. PTFE) manufacturing (Prevedouros et al., 2006). The vast majority of PFCAs that have been historically emitted reside in the global oceans, where they will be slowly vertically transported to deeper waters. Precursor degradation had a relatively lower contribution to the global presence of PFCAs. For perfluoroalkane sulfonates (PFSAs), several different sources, including precursor degradation, contributed to global emissions. Similar to PFCAs, the major global reservoir and sink for PFSAs is the global oceans. A complication in understanding global fate and transport of PFAAs is the possible role of seas spray aerosols in long-range transport (Prevedouros et al., 2006). “Regional” fate and transport. In urban regions where wastewater is often discharged into rivers, it has been shown that PFAA levels in rivers can be correlated to population density and GDP in the river catchments, which are indicators of PFAS-containing consumer product use (Lindim et al., 2016). Remote river catchments, inland lakes/seas and inland terrestrial environments, receive inputs of PFAAs predominantly from atmospheric deposition. All PFAAs in surface waters, groundwater and soils are ultimately discharged to the oceans, but residence times of PFAAs can be highly variable depending on, for example, extent of retention in the unsaturated zone and hydrological residence times. “Local” fate and transport. Contamination hot spots are, for example, known to occur where aqueous film forming foams (AFFF) have been used for fire-fighting. Key to understanding how PFAAs are transported to groundwater, which is often a drinking water resource, is understanding the transport through the unsaturated zone. PFAA sorption to soils has been shown to be affected by the magnitude and nature of organic matter, magnitude and type of metal oxides, and clay mineralogy (Guelfo and Higgins, 2013). Soil organic matter has been shown to be an important soil-parameter affecting sorption of PFAAs, indicating the role of hydrophobic interactions. In addition to the properties of the solids, sorption of PFAAs is sensitive to the water chemistry such as ionic strength, pH, and presence of other PFAAs and co-contaminants (Guelfo and Higgins, 2013). A complication for understanding the transportation of PFAAs in the unsaturated zone is the recently reported unique retention behaviour of PFAAs due to their strong surface activity (Brusseau et al., 2019). Brusseau et al. have suggested that, as a result of the unique surface activity of PFAAs, sorption to soil particles is not a good predictor of retention of PFAAs in the unsaturated zone. Significant additional retardation of PFAS transport is expected to occur in the unsaturated zone due to adsorption at air-water interfaces. CONCLUSIONS A good understanding has been gained over the last 20 years regarding the fate and transport of PFAS at different spatial scales. Remaining challenges include understanding the unique fate and transport processes related to the high surface activity of PFAAs (Brusseau et al., 2019) and studying the transport and fate of additional classes of PFAS. REFERENCES Brusseau, M. L., Yan, N., Van Glubt, S., Wang, Y. K., Chen, W., Lyu, Y., Dungan, B., Carroll,
K. C. & Holguin, F. O. 2019. Comprehensive Retention Model For PFAS Transport In Subsurface Systems. Water Research, 148, 41-50.
Guelfo, J. L. & Higgins, C. P. 2013. Subsurface Transport Potential Of Perfluoroalkyl Acids At Aqueous Film-Forming Foam (AFFF)-Impacted Sites. Environmental Science & Technology, 47, 4164-4171.
Lindim, C., Van Gils, J. & Cousins, I. T. 2016. A Large-Scale Model For Simulating The Fate & Transport Of Organic Contaminants In River Basins. Chemosphere, 144, 803-810.
Prevedouros, K., Cousins, I. T., Buck, R. C. & Korzeniowski, S. H. 2006. Sources, Fate and Transport of Perfluorocarboxylates. Environmental Science & Technology, 40, 32-44.
Wang, Z. Y., Dewitt, J. C., Higgins, C. P. & Cousins, I. T. 2017. A Never-Ending Story of Per- and Polyfluoroalkyl Substances (PFASs)? Environmental Science & Technology, 51, 2508-2518.
57
Table of Contentsfor this manuscript

PFAS REMEDIATION: CHALLENGE AND OPTIONS
Cheng Fang1,2, Megharaj Mallavarapu1,2, Ravi Naidu1,2
1Cooperative Research Centre for Contamination Assessment and Remediation of the Environment (CRC CARE), University of Newcastle, Callaghan, NSW 2308, AUSTRALIA
2Global Centre for Environmental Remediation (GCER), University of Newcastle, Callaghan, NSW 2308, AUSTRALIA
INTRODUCTION Poly- and perfluoroalkyl substances (PFAS) feature unique physical and chemical properties, such as hydrophobicity and oleophobicity, which have not being evidenced in other compounds. Therefore, they have been widely used in such applications as clothing, upholstery, carpeting, painting, food containers, cookware, aqueous film-forming foams (AFFF) etc.[1]. On the other hands, PFAS also exhibit extreme stability with respect to thermal, chemical and bio-degradation so that those compounds are also generally categorised as persistent organic pollutants (POP). That is, their inert fluoro-carbon skeletons are resistant to degradation under natural environmental conditions. Consequently, their usage and inertness have led to their global distribution and accumulation in the environment. This has in turn raised serious concerns about their impact on the environment and public health[2]. Once PFAS contamination is identified and monitored[3], the scientific community typically responds by developing remediation strategies. Numerous remediation approaches currently exist, including adsorption, stabilisation, filtration, coagulation, separation, chemical oxidation / reduction, thermal decomposition, UV / photo-catalytic degradation, etc. All these remediation approaches can be generally categorised into two types, removal (such as adsorption) and degradation (mineralisation), which will be discussed here. matCARETM CRC CARE has developed matCARETM to effectively remove PFAS from surface water and groundwater. MatCARE™ is a novel adsorbent formulated by surface modification of mineral palygorskite, for specific adsorption of PFAS including fluorosurfactants. That is, the natural clay base (molecular structure) has been modified towards to the high removal efficiency and high binding capacity. The matCARE™ material is available as a granular and powdered product. In this case, PFAS are irreversibly loaded to the adsorbent matrix for in-situ treatment and removal. Although effective with the removal of PFAS from water and immobilisation in soil, matCARETM is not designed to mineralise PFAS. Where regulatory requirement is complete mineralisation of PFAS, further treatment should be followed up. EAOP-pfas CARE Advanced oxidation process (AOP) has received world-wide attention in last decades. It uses radicals, typically hydroxyl radicals (OH), to attack the POP and degrade them into fragments or inorganic ions/molecules [4]. However, the AOP requires chemicals or others (such as UV, catalysis) to generate radicals. Electrochemical advanced oxidation process (EAOP) overcomes some of these limitations because the radicals can be generated in-situ via electrochemistry, which means the oxidation process can be driven by electricity rather than by chemicals to produce radicals. The less consumption on chemicals of EAOP promises a more environmental-friendly approach.
M21d
Copyright © CRC CARE Pty. Ltd., 2019
CleanUp Conference 2019Adelaide, Australia8 –12 September 2019 58
Table of Contentsfor this manuscript

Furthermore, the electrochemical process can directly oxidise the targets or generate other radicals beyond OH[5][6]. However, it usually be hampered by expensive electrode materials and surface fouling. CRC CARE has developed and patented pfas CARETM to effectively destruct PFAS using cheap materials and a combined technology to maintain the electrode surface clean. The lab test is encouraging and further research is on the way towards scale-up application. SONO-CHEM The basic idea of sono-chemistry is the super-sonication-generated micro-bubbles (cavitation and plasma), which experience a temperature of > 5000 °C. Consequently, PFAS can be effectively “burned” / decomposed at this temperature. Furthermore, water molecules can be split as radicals of OH, which are among the strongest and most aggressive oxidants [7]. The combined interaction between radicals/cavitation and PFAS will lead to their breakdown, gradually but ultimately to carbon dioxide and fluoride ions [8]. THERM-CHEM Thermal destruction means the burning / mineralisation of PFAS at high temperature (> 1200 °C). However, the approach can be improved as well, either using plasma or sorption. Recent research demonstrated that the destruction can occur at < 500 °C, if the PFAS has been previously adsorbed onto a matrix surface. This open a new remediation way to collect PFAS from environment, by selectively concentrating PFAS firstly, towards a subsequent destruction directly. The research is on the embryo stage. In conclusion, with further investigation and development of the EAOP, wide applications for real sample remediation can be anticipated. REFERENCES [1] R.C. Buck, J. Franklin, U. Berger, J.M. Conder, I.T. Cousins, P. de Voogt, A.A. Jensen, K.
Kannan, S.A. Mabury, S.P.J. van Leeuwen, Perfluoroalkyl and polyfluoroalkyl substances in the environment: Terminology, classification, and origins, Integrated Environmental Assessment and Management, 7 (2011) 513-541.
[2] R. Naidu, A23 AFFF: CURRENT RESEARCH, UNDERSTANDINGS AND FUTURE RESEARCH, 5th International Contaminated Site Remediation Conference, Melbourne, Australia, 2013.
[3] C. Fang, R. Dharmarajan, M. Megharaj, R. Naidu, Gold nanoparticle-based optical sensors for selected anionic contaminants, TrAC Trends in Analytical Chemistry, 86 (2017) 143-154.
[4] S. Gligorovski, R. Strekowski, S. Barbati, D. Vione, Environmental Implications of Hydroxyl Radicals (•OH), Chemical Reviews, 115 (2015) 13051-13092.
[5] C.D. Vecitis, H. Park, J. Cheng, B.T. Mader, M.R. Hoffmann, Treatment technologies for aqueous perfluorooctanesulfonate (PFOS) and perfluorooctanoate (PFOA), Frontiers of Environmental Science & Engineering in China, 3 (2009) 129-151.
[6] C. Fang, Z. Sobhani, J. Niu, R. Naidu, Removal of PFAS from aqueous solution using PbO2 from lead-acid battery, Chemosphere, 219 (2018) 36-44.
[7] C. Fang, M. Megharaj, R. Naidu, Electrochemical Advanced Oxidation Processes (EAOP) to degrade poly- and perfluoroalkyl substances (PFASs) Journal of Advanced Oxidation Technologies, DOI (2017) 20170014.
[8] C. Fang, M. Megharaj, R. Naidu, Electrochemical switch on-off response of a self-assembled monolayer (SAM) upon exposure to perfluorooctanoic acid (PFOA), J electroanal. Chem, 785 (2017) 249-254.
59
Table of Contentsfor this manuscript

IN-SITU PFAS REMEDIATION USING COLLOIDAL ACTIVATED CARBON
Grant R. Carey1, Anh Le-Tuan Pham2, Seyfollah Gilak Hakimabadi2, Rick McGregor3,
Brent Sleep4
1Porewater Solutions, 27 Kingsford Crescent, Ottawa, K2K 1T5, CANADA 2University of Waterloo, Department of Civil & Environmental Engineering, Waterloo,
CANADA 3InSitu Remediation Services Limited, P.O. Box 324, St. George, N0E 1N0, CANADA 4University of Toronto, Department of Civil & Mineral Engineering, Toronto, CANADA
INTRODUCTION Colloidal activated carbon (CAC) particles have diameters of 1-2 microns, and thus are readily injected into transmissive sand and gravel aquifers. After injection, CAC will attach to soil particles in the near-vicinity of the injection wells, resulting in a sorption-based barrier. McGregor (2018) demonstrated the successful in-situ remediation of PFOS and PFOA at a site in Central Canada, with the implementation of a single CAC injection event. The mass discharge of PFOS from the source zone at this site was estimated to be 0.6 grams per year (Carey et al., 2019). Transport modelling indicated that the CAC remedy implemented at this site will likely be effective for PFOS remediation for decades (Carey et al., 2019). This current study evaluates the range in longevity of an in-situ CAC remedy for sites with higher mass discharge rates. A hypothetical site scenario was developed based on similar chemical and hydrogeologic conditions to a former fire training area (FTA) in the United States that is described in McGuire et al. (2014). At the actual FTA site, PFHxS had the highest groundwater concentration (up to 313 ug/L), with lower concentrations of PFOA and PFOS (up to 152 and 74 ug/L, respectively). MODEL SCENARIOS A transport model was constructed using the In-Situ Remediation (ISR-MT3DMS) model, and various simulations were conducted to evaluate the longevity of a CAC remedy at a hypothetical FTA site (Site). PFHxS is the main risk driver for this scenario based on groundwater concentrations, laboratory isotherm results for a range of PFAS constituents, and regulatory drinking water criteria. Two source zones were simulated at the Site: 1. A smaller, more intense source zone with dimensions of approximately 15 m by 15 m, and 2. a larger source zone surrounding it with lower concentrations and dimensions of 100 m by 100 m, to represent historical spreading of source materials around the FTA. The simulated PFHxS total mass discharge from the combined sources was approximately 450 grams per year, with a plume width of approximately 240 m downgradient of the source areas. The base case incorporated the implementation of a CAC barrier with a width of 260 m and a length of 6 m (parallel to groundwater flow) after a simulation time of approximately 50 years to allow for the growth of the downgradient plume prior to remediation. A sensitivity analysis was conducted to evaluate the sensitivity of the CAC remedy longevity to various PFAS constituent properties, mass discharge rates, length of the CAC barrier, and the in-situ CAC concentration. RESULTS AND DISCUSSION Laboratory-derived isotherms indicate that the sorption affinity of various PFAS to CAC is directly proportional to molecular chain length, and sulfonates generally have a higher affinity than carboxylates having the same chain length. Isotherms also indicate that sorption affinity to CAC is reduced for mixtures of PFAS compounds with high total organic carbon, relative to single compound solutions. Model results indicate that CAC injection may represent an effective technology for in-situ remediation of PFAS at former FTAs, although site-specific
M22a
Copyright © CRC CARE Pty. Ltd., 2019
CleanUp Conference 2019Adelaide, Australia8 –12 September 2019 60
Table of Contentsfor this manuscript

isotherms are required to evaluate long-term performance. A review of GAC performance with PFAS mixtures suggests that there may be a gradual decline in removal efficiency due to competitive sorption effects over the long-term. The potential implications of these GAC study findings are discussed relative to in-situ CAC implementation which have much longer retention times in the sorption zone. Strategies for incorporating CAC-based mass flux reduction alternatives for managing PFAS sites are discussed, including benefits and limitations of this remedial approach. Research needs for evaluating factors influencing CAC performance at the laboratory and field scale are presented.
Fig. 1. Simulated PFHxS plume prior to and following CAC injection.
REFERENCES Carey, G.R., McGregor, R., Pham, A.L., Sleep, B. and Gilak Hakimabadi, S. (2019)
Evaluating the longevity of a PFAS in situ colloidal activated carbon remedy. Remediation J. 29:17-31.
McGregor, R. (2018) In situ treatment of PFAS-impacted groundwater using colloidal activated carbon. Remediation J. 28:33-41.
McGuire, M.E., Schaefer, C., Richards, T., Backe, W.J., Field, J.A., Houtz, E., Sedlak, D.L., Guelfo, J.L., Wunsch, A. and Higgins, C.P. (2014) Evidence of remediation-induced alteration of subsurface poly- and perfluoroalkyl substance distribution at a former firefighter training area. Environmental Science & Technology 48:6644-6652.
61
Table of Contentsfor this manuscript

OCCURRENCE, DISTRIBUTION, ANALYSIS, TOXICOLOGY AND REMEDIATION OF PERFLUORINATED POLLUTANTS IN GERMANY
Volker Birke1, Thomas Straßburger2, Stefan Schroers3, Peer Hendrik Leßlich4, Harald Burmeier5, Lothar Vigelahn6, Tamara Grummt6, Alexander Eckhardt6
1University of Wismar, Faculty of Engineering, GERMANY
2Federal Ministry for the Environment, Nature Conservation and Nuclear Safety, Robert-Schuman-Platz 3, 53175 Bonn, GERMANY
3Ministry for the Environment, Agriculture, Conservation and Consumer Protection of the Federal State of North Rhine-Westphalia, Schwannstraße 3, 40476 Düsseldorf, GERMANY
4Flughafen Düsseldorf GmbH, Flughafenstraße 105, 40474 Düsseldorf, GERMANY 5Ostfalia University of Applied Sciences, Faculty of Civil and Environmental Engineering,
Campus Suderburg, Herbert-Meyer-Straße 7, 29556 Suderburg, GERMANY 6German Environment Agency (Umweltbundesamt – UBA), Wörlitzer Platz 1, 06844 Dessau-
Roßlau / Heinrich-Heine-Straße 12, 08645 Bad Elster, GERMANY [email protected], [email protected],
[email protected], [email protected], lothar.vigelahn, tamara.grummt, [email protected]
INTRODUCTION The extent of knowledge of contaminations of the environment by perfluorinated compounds (PFC), especially Per- and polyfluoroalkyl substances (PFAS), in Germany currently develops at a disturbingly spanking pace, and there is no end in sight. “The more you look, the more you find”. It is a vastly increasing environmental problem, that is, current data may just represent the tip of an iceberg; though, with ice what could hardly ever melt. Highly appreciated for decades in industrial and manufacturing processes because of their well beneficial physical and chemical properties, PFC turn out to be one of the most detrimental emerging contaminants. Due to their applications in hundreds of consumer products and manufacturing processes, PFC are accumulating in the environment due to their persistence. A report on residues of PFC in the North and the Baltic Sea showed the highest concentrations in the estuary of the Elbe river near Stade (in the vicinity of Hamburg). The report showed that municipal sewage, mainly stemming from private households, discharges PFC into the Elbe. The contaminants are then discharged into the North Sea, spreading over time into the deep sea and the Arctic. A closer look on PFC in wastewater from municipal sewage treatment plants without special loads resulted in some 10 – 20 ng/l PFC – on average. Considering an annual release of 10 billion cubic meters of wastewater in Germany, this is an impressive drain of PFC into the environment. And still, this is just a fraction of the total PFC load, as they have already been substituted over years, partly by other PFC. Besides wastewater, sewage sludge is another source of PFC pollution. Sampling sludge of 150 wastewater treatment plants in the Federal State of Baden-Württemberg showed that the limit value of 100 µg/kg dry matter was exceeded by one third of the samples. Besides diffuse pollution there are numerous findings of PFC at local scale across Germany. The use of aqueous film-forming foams (AFFF) is one of the main reasons for the occurrence of PFC in Germany. In the Federal State of North Rhine-Westphalia an inventory of PFC pollution in soil and groundwater has shown that both the number of cases and the number of counties and cities affected is constantly rising. Starting with 18 cases in 2011, the figure is up to 100 in 2018 – two third are caused by the use of fire extinguishing agents. It is to be assumed that this will be the same in all German states. Unfortunately, it has never been mandatory to register the use of AFFF, hence, their use cannot be tracked (e.g., a state- or a nationwide overview of sites where these foams have been used). Rather often, but not exclusively, military sites are especially affected. The German military has contributed to the overall PFC problem (in and around military sites) mainly by using AFFF for decades in routine fire training or real deployments at military installations across the country. As of
M22b
Copyright © CRC CARE Pty. Ltd., 2019
CleanUp Conference 2019Adelaide, Australia8 –12 September 2019 62
Table of Contentsfor this manuscript
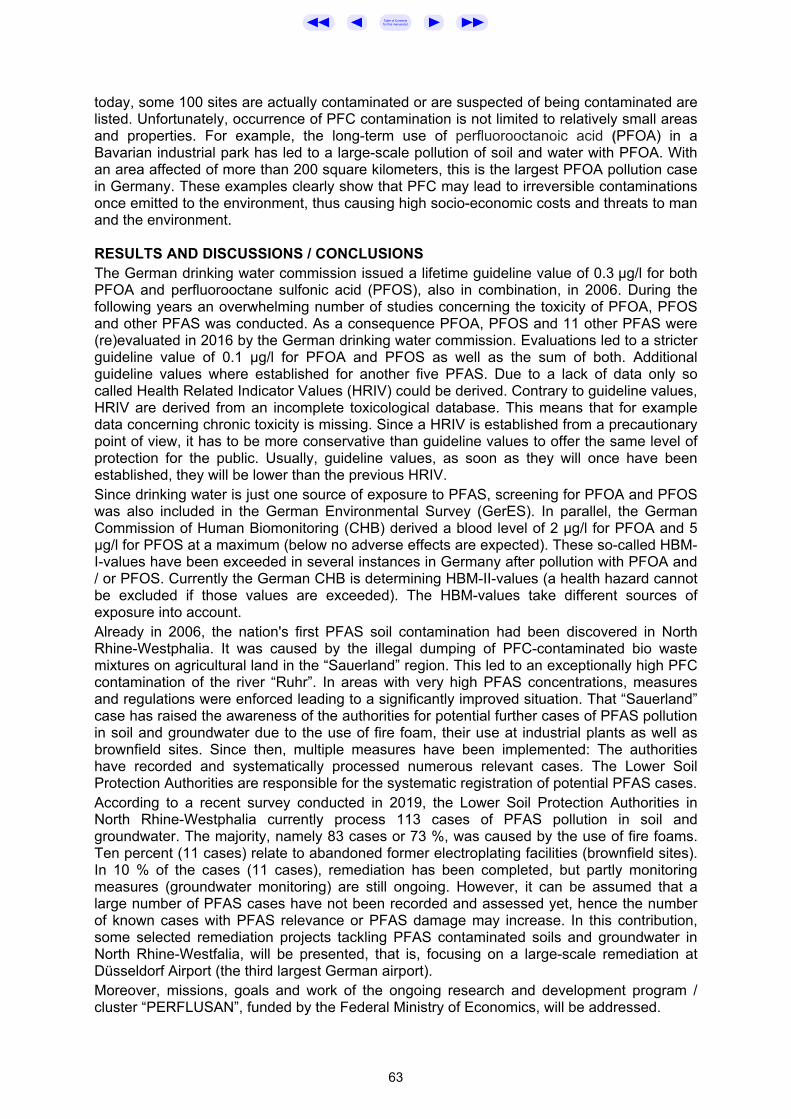
today, some 100 sites are actually contaminated or are suspected of being contaminated are listed. Unfortunately, occurrence of PFC contamination is not limited to relatively small areas and properties. For example, the long-term use of perfluorooctanoic acid (PFOA) in a Bavarian industrial park has led to a large-scale pollution of soil and water with PFOA. With an area affected of more than 200 square kilometers, this is the largest PFOA pollution case in Germany. These examples clearly show that PFC may lead to irreversible contaminations once emitted to the environment, thus causing high socio-economic costs and threats to man and the environment. RESULTS AND DISCUSSIONS / CONCLUSIONS The German drinking water commission issued a lifetime guideline value of 0.3 µg/l for both PFOA and perfluorooctane sulfonic acid (PFOS), also in combination, in 2006. During the following years an overwhelming number of studies concerning the toxicity of PFOA, PFOS and other PFAS was conducted. As a consequence PFOA, PFOS and 11 other PFAS were (re)evaluated in 2016 by the German drinking water commission. Evaluations led to a stricter guideline value of 0.1 µg/l for PFOA and PFOS as well as the sum of both. Additional guideline values where established for another five PFAS. Due to a lack of data only so called Health Related Indicator Values (HRIV) could be derived. Contrary to guideline values, HRIV are derived from an incomplete toxicological database. This means that for example data concerning chronic toxicity is missing. Since a HRIV is established from a precautionary point of view, it has to be more conservative than guideline values to offer the same level of protection for the public. Usually, guideline values, as soon as they will once have been established, they will be lower than the previous HRIV. Since drinking water is just one source of exposure to PFAS, screening for PFOA and PFOS was also included in the German Environmental Survey (GerES). In parallel, the German Commission of Human Biomonitoring (CHB) derived a blood level of 2 µg/l for PFOA and 5 µg/l for PFOS at a maximum (below no adverse effects are expected). These so-called HBM-I-values have been exceeded in several instances in Germany after pollution with PFOA and / or PFOS. Currently the German CHB is determining HBM-II-values (a health hazard cannot be excluded if those values are exceeded). The HBM-values take different sources of exposure into account. Already in 2006, the nation's first PFAS soil contamination had been discovered in North Rhine-Westphalia. It was caused by the illegal dumping of PFC-contaminated bio waste mixtures on agricultural land in the “Sauerland” region. This led to an exceptionally high PFC contamination of the river “Ruhr”. In areas with very high PFAS concentrations, measures and regulations were enforced leading to a significantly improved situation. That “Sauerland” case has raised the awareness of the authorities for potential further cases of PFAS pollution in soil and groundwater due to the use of fire foam, their use at industrial plants as well as brownfield sites. Since then, multiple measures have been implemented: The authorities have recorded and systematically processed numerous relevant cases. The Lower Soil Protection Authorities are responsible for the systematic registration of potential PFAS cases. According to a recent survey conducted in 2019, the Lower Soil Protection Authorities in North Rhine-Westphalia currently process 113 cases of PFAS pollution in soil and groundwater. The majority, namely 83 cases or 73 %, was caused by the use of fire foams. Ten percent (11 cases) relate to abandoned former electroplating facilities (brownfield sites). In 10 % of the cases (11 cases), remediation has been completed, but partly monitoring measures (groundwater monitoring) are still ongoing. However, it can be assumed that a large number of PFAS cases have not been recorded and assessed yet, hence the number of known cases with PFAS relevance or PFAS damage may increase. In this contribution, some selected remediation projects tackling PFAS contaminated soils and groundwater in North Rhine-Westfalia, will be presented, that is, focusing on a large-scale remediation at Düsseldorf Airport (the third largest German airport). Moreover, missions, goals and work of the ongoing research and development program / cluster “PERFLUSAN”, funded by the Federal Ministry of Economics, will be addressed.
63
Table of Contentsfor this manuscript

FULL SCALE TREATMENT OF PFAS CONTAMINATED SOIL IN SWEDEN
Helena Hinrichsen1, Mats Nises2
1Envytech Solutions AB, Sörhallstorget 10, 417 63 Göteborg, SWEDEN
2Geokompaniet, Geokompaniet Sverige AB, Januarigatan 5, 256 61, Helsingborg, SWEDEN [email protected]
INTRODUCTION The management of soil contaminated with per- and poly-fluorinated alkyl substances (PFAS) is a major challenge worldwide. Traditional remediation processes such as bioremediation and chemical oxidation are not applicable due to the inherent chemical stability of the PFAS substances. Landfill disposal, a common practice in Europe for other soil contaminants, has its own challenges for PFAS contaminants because disposal of PFAS soil in a landfill creates a concentrated point source of these toxic and water soluble substances, which creates a risk to human health and the environment through transfer via the landfill leachate. Therefore, new methods of disposal are required to ensure the safety of the community. This project involved the remediation of a former metal plating site near Hasselholm, Sweden. Contaminants of concern included PFOS which resulted from the use of foams in the metal plating baths. There was approximately 3,000 tonnes of soil that requires treatment or disposal. Envytech asked the local landfills if they could accept the PFOS contaminated soil but no plant would accept the soil. As a result, Envytech worked with the site owner and one of the landfill owners on an innovative solution which involved stabilising the soil prior to disposal, to reduce the risk of leaching. This paper will present the results from the full scale stabilisation of 3,000 tonnes of soil that was disposed safely to landfill with full sign off. METHODS Preliminary lab scale trials were conducted on PFAS contaminated soil samples collected from the project site using a chemical adsorbent at an addition rate of 3%. Soil samples were mixed thoroughly with added water (to ~20% moisture content) and left to fix for 24 hours before being sent to Eurofins for external analysis using the shaker test EN 12457/1-4. Sequential leach numbers L/S 2 and L/S 8 were used to compare PFAS concentrations in soil leachates before and after treatment. After the lab trials, Envytech and Geokompaniet completed the full scale treatment of the soil by mixing of the soil with the stabilization product (3% and 5% addition rate) in the field using a Trommel screen, water truck and a conventional loader. See Figure 1. Two composite validation soil samples (designated Samples 1 and 2) were collected from the field after treatment and sent to Eurofins for leachate analysis using the test outlined above.
M22c
Copyright © CRC CARE Pty. Ltd., 2019
CleanUp Conference 2019Adelaide, Australia8 –12 September 2019 64
Table of Contentsfor this manuscript

Figure 1: Full scale stabilisation of 3,000 tonnes of PFAS contaminated soil
RESULTS AND DISCUSSION The PFAS concentrations in soil leachates before and after treatment with 3% and 5% adsorbent are summarised in Table 1. Results showed that the PFOS and PFHxS concentrations in soil leachates after treatment were sufficiently low to allow safe disposal to the local HEM waste management facility/landfill. 3,000 tonnes of soil was treated and disposed in this way. The reduction in total PFAS concentrations in soil leachates after treatment ranged from 86% to 99.5%. Table 1: Reduction in PFAS concentrations in soil leachates following stabilisation with an adsorbent
CONCLUSIONS This was the first successful full scale stabilisation of PFAS contaminated soil in Sweden (and possibly the first in Europe) of this size. This project demonstrated that stabilisation is a relatively quick, easy and cost-effective management solution for PFAS contaminated soil in Europe. This project resulted in a safe and sustainable outcome for industry, government and the community.
65
Table of Contentsfor this manuscript

THE EFFECT OF PH AND IONIC STRENGTH ON SORPTION OF PFOS USING SOILS WITH DIFFERENT TOC
Yanju Liu1,2, Fangjie Qi1,2, Cheng Fang1,2, Ravi Naidu1,2, Luchun Duan1,2,
Raja Dharmarajan1,2, Prasath Annamalai1,2 1Global Centre for Environmental Remediation, University of Newcastle, Callaghan Campus,
NSW 2308; AUSTRALIA 2CRC CARE, Callaghan Campus, NSW 2308, AUSTRALIA
Yanju.liu, [email protected]
INTRODUCTION Detailed knowledge on the fate and behaviour of PFAS in soils is one of the priority research topics recommended by the Strategic Environmental Research and Development Program (SERDP) and Environmental Security Technology Certification Program (ESTCP) in the U.S.A. The sorption is a critical process in controlling the fate and transport of PFAS in the environment (Weber et al., 1991; You et al., 2010). The sorption of PFOS onto soil has been reported to be influenced by various soil properties with total organic carbon (TOC) or soil organic matter (SOM) frequently reported to be the primary influencing factor. The sorption of PFOS was found to increase with TOC content in sediments (Higgins and Luthy, 2006) and in soils (Chen et al., 2013). This was attributed to the hydrophobicity of PFOS (Higgins and Luthy, 2006). Similarly, the sorption affinity of soils for PFOS decreased after removal of SOM (Qian et al., 2017). A sorption study of PFOS onto six soils (Wei et al., 2017) showed that Freundlich Kf was positively correlated with soil TOC as well as Al2O3 and Fe2O3 contents. However, there are studies that showed no correlation between sediment TOC content and sorption capacity of PFOS (Becker et al., 2008). At the same time, the sorption of PFOS by pure minerals was investigated to exclude the organic matter content effect. For instance, the sorption of PFOS on boehmite (AlOOH) was found to decrease with increasing solution pH and the addition of electrolytes (NaCl and CaCl2). This was attributed to increases in ligand exchange and decreases of electrostatic interactions when pH increased, compression of the electrical double layer, and competitive adsorption of Cl- when electrolyte was added (Wang et al., 2012). Similarly, the sorption of PFOS onto Ottawa sand, goethite, kaolinite, and iron rich sand was investigated by Johnson et al. (2007b). The sorption capacity showed linear increases with increasing initial concentrations and decreases with increases in pH. This demonstrated that electrostatic interactions played a role when organic carbon was absent. Chen et al. (2009) found the addition of phosphate reduced sorption of PFOS by soils (Qian et al., 2017), which was attributed to increases of negative charge on soil surfaces. The influence of cations and pH on sorption of 14 PFAS (including PFOS) on one organic rich soil was investigated (Campos Pereira et al., 2018). The sorption was found to inversely related to both pH and SOM bulk net charge. There is still a need to investigate influences of TOC, pH and ionic strength on sorption of PFOS by soils to provide more realistic information on the fate and behaviour of PFOS or similar PFAS. This study investigated the sorption of PFOS by eight soils varying in TOC at different pH and ionic strength conditions to reveal the mechanism and influencing effects. METHODS The measurements of PFOS sorption by soils were conducted in 50 mL polypropylene (PP) centrifuge tube at constant room temperature (24±0.5°C). All sorption measurements were conducted at various pH which were adjusted by 0.1 M HNO3 or NaOH and equilibrated until a stable targeted pH was achieved prior to sorption. Briefly, one gram of soil was added to 50 mL PP centrifuge tubes, followed by addition PFOS stock solution (1 mg/L in MilliQ water) and electrolyte solution (0.03M or 0.3 M NaNO3) to achieve the desired PFOS initial concentrations (360µg/L). The mixture suspension was then shaken in an end-over-end shaker. After shaking, the suspensions were centrifuged (Sigma 3-30KS) at 4000 rpm (1664
M22d
Copyright © CRC CARE Pty. Ltd., 2019
CleanUp Conference 2019Adelaide, Australia8 –12 September 2019 66
Table of Contentsfor this manuscript

g) for 25 min prior to being filtered through 0.22 µm PES (polyethersulfone) filter and PP syringe. The filtrate were then diluted and analysed using HPLC-MS. RESULTS AND DISCUSSION The influences of solution pH and soil TOC on the sorption of PFOS were shown in Figure 1 at different ionic strength (IS= 0.03, and 0.3 M NaNO3). The bigger bubbles indicated greater sorption. A general trend of decreasing sorption with increasing pH was observed. There was much less sorption at higher pH, particularly at pH > 7. However, the influence of pH was less pronounced when soils contained greater TOC contents, in particular for sorption at the stronger IS (0.3). At lower IS (0.03), few soils showed increased sorption even at high pH and low TOC content. This clearly demonstrates other component in soils contributed significantly for sorption when there is little TOC, e.g. BDA (3.27%), BNA (0.37%), and STA (1.35%). There is larger fraction of clay in soil for BDA (30.7%) but there are greater fractions of sand (>90%) in soils BNA and STA. The mineral fractions contributed to sorption of PFOS even at higher pH combined when the TOC content was small. This suggests electrostatic interaction between soil minerals and PFOS are influenced by pH. However, greater sorption of PFOS was related to high TOC contents at higher IS (0.3). At higher IS, the contribution from minerals can be influenced by pH and ionic strength. The change in IS influenced the surface charge of minerals and organic matter through depressing the electrical double layer. Thus, it can potentially influence the sorption of PFOS due to electronic interaction between PFOS and soils. A paired t-test indicated significantly greater sorption of PFOS at IS 0.3 than at 0.03 (p=0.02). This was attributed to the decrease in repulsive interactions between similarly charged soil surface and PFOS as PFOS exist in anionic form at the pH range studied (3 – 10.5) (the pKa values of PFOS is expected to be less than 1) (Lampert et al., 2007).
Fig. 1 The adsorption capacity (µg/g) at different solution pH and ionic strength (0.03 and 0.3 M NaNO3) for soils varying in TOC CONCLUSIONS The results demonstrated a significant influence of TOC as well as other soil components, which is reflected through the IS effect when TOC is low. REFERENCES (SELECTED) Higgins CP, Luthy RG. Sorption of Perfluorinated Surfactants on Sediments†. Environmental
Science & Technology 2006; 40: 7251-7256. Qian J, Shen M, Wang P, Wang C, Hou J, Ao Y, et al. Adsorption of perfluorooctane
sulfonate on soils: Effects of soil characteristics and phosphate competition. Chemosphere 2017; 168: 1383-1388.
Chen H, Chen S, Quan X, Zhao Y, Zhao H. Sorption of perfluorooctane sulfonate (PFOS) on oil and oil-derived black carbon: Influence of solution pH and [Ca2+]. Chemosphere 2009; 77: 1406-1411.
67
Table of Contentsfor this manuscript

PFAS WATER TREATMENT OPERATING UNDER STATE REGULATIONS — A CASE STUDY
Andrew Thomas
Enviropacific Services Pty Ltd, 1392 Kingsford Smith Drive, Pinkenba, Brisbane, 4008,
AUSTRALIA [email protected]
INTRODUCTION Enviropacific Services Pty Ltd (Enviropacific) have been engaged by John Holland Group (JHG) to undertake construction dewatering activities and associated treatment of the extracted water as part of the Sunshine Coast Airport Expansion Project. Our scope includes the design, supply, installation commissioning, operations and maintenance and performance monitoring of a 1-2 megalitres/day PFAS Water Treatment Plant (WTP). The system is designed to treat not only PFAS to achieve the most stringent criteria (i.e. 99% species protection) set by the QLD Department of Science (QLD DES) in accordance with the National Environmental Management Plan (PFAS NEMP) and the most, but a range of other constituents including heavy metals, nutrients, petroleum hydrocarbons, polycyclic aromatic hydrocarbons and a range of physico-chemical parameters such as pH, turbidity, dissolved oxygen in order to protect the receiving water environment. This system represents one of the first PFAS water treatment systems designed and operated under the regulatory direction of QLD DES (given the airport is owned by the Sunshine Coast Regional Council) and as such, the regulatory challenges for both the local Council and the State Regulator will be an overarching theme of the presentation. FOCUS OF PRESENTATION Our presentation will aim to focus on a range of issues as outlined briefly below. Project Background The airport is owned, operated, managed and developed by the Sunshine Coast Regional Council (SCRC). The airport expansion works consists of a new 2,450m runway to replace the existing 650m runway and allow larger aircraft to access the aircraft, allowing direct flights to Southeast Asia, China and Hawaii as well as additional domestic flight capacity. Establishing Treatment Goals The surrounding environment is sensitive in nature, and a local community that is very environmentally conscious. There are two treated water discharge points with different treated discharge quality criteria established. Establishing Raw Water Quality The establishment of a raw water quality criteria is critical to establish a basis of design to enable appropriate flexibility in a water treatment plant design. We will share details of the information provided to Enviropacific which was used to establish a set of raw water quality criteria, the actual raw water quality observed during operations to date and highlight the variations observed between the two. Managing/Optimising Dewatering Activities Due to experience gained on other sites, we suggested to the client that we manage all dewatering activities on site to enable better control and coordination between dewatering efforts and associated treatment. Some of the benefits of this approach include enhanced extraction which aims to reduce flow rates and increased water quality, while also better informing water treatment operational and maintenance activities. We will share real life examples of the challenges and associated positive impacts on the overall project.
M22e
Copyright © CRC CARE Pty. Ltd., 2019
CleanUp Conference 2019Adelaide, Australia8 –12 September 2019 68
Table of Contentsfor this manuscript

Treatment System Design We will cover the treatment system design, focussing on the Whole of Life financial considerations made at the design phase. A key focus of this discussion will be on the difficulties in designing a treatment system that can achieve very stringent discharge criteria for a diverse list of parameters, even before PFAS is considered. Another key element will be the importance of dealing with co-contaminants in order to optimise the treatment of PFAS and to minimise treatment costs. Operational Challenges Further to the discussion above regarding the variabilities observed between the raw water quality criteria and the observed influent water quality, we will discuss the impacts of this water quality variability on the treatment system performance, the operational issues encountered and how these were managed/resolved. Treatment Performance Depending on client approval, we will aim to share an overview of treatment system performance, with particular focus on PFAS removal. This will also include a discussion on the key treatment steps that were most effective overall, and areas where future improvements may be considered for future systems. Regulatory Framework This will form a key element of the presentation, focussing on managing all stakeholders both upfront and during the operational works. CONCLUSIONS Summary of What Worked and Considerations for Future Projects Managed by State Regulators This will aim to summarise the issues outlined in the above sections and the associated lessons learnt and solutions found on this project that may be worth considering for future projects involving construction dewatering where PFAS impacts are encountered.
69
Table of Contentsfor this manuscript

INNOVATIVE WASTE MINIMISATION DURING PFAS CONTAMINATED WATER REMEDIATION
Steve Woodard1, Mark Kuffer2
1ECT2, 75 Washington Avenue, Portland, 04101-2617, USA
2Conscia Pty Ltd, 110 Giles Street, Kingston, 2604, AUSTRALIA [email protected]
INTRODUCTION As part of its response to per- and poly-fluoroalkyl substances (PFAS) contamination resulting from the historical uses of aqueous film forming foam (AFFF), the Australian Department of Defence (Defence) completed a detailed environmental site investigation of an area of over 150 square kilometres, incorporating RAAF Base Tindal and private land in the vicinity of the Defence property. The investigation identified that PFAS contamination had entered groundwater and migrated offsite towards the Katherine River. RAAF Base Tindal is located in the Northern Territory, approximately 17 kilometres from Katherine and 330 kilometres from Darwin. Katherine is a small town of only approximately 8,000 people. The location of the property makes it critical that any equipment and consumables needed, or waste removed from the property, are carefully considered as it is logistically challenging to transport products to and from the property, particularly during the wet season. In addition, waste disposal and treatment facilities are limited in the NT. Emerging Compounds Treatment Technologies (ECT2) have installed two water treatment systems on the property to extract contaminated water from the aquifer and reinject the treated water back into the aquifer. The purpose of these systems is to reduce the levels of PFAS contamination in the area. Resin regeneration technology is also being utilised on site to reduce the volume of waste being generated and requiring transport and disposal/destruction. The innovative combination of multiple IX resin systems, coupled with a centralized regeneration system, was selected by Defence as an innovative way to meet multiple project goals for the Site. APPROACH ECT2 has installed a water treatment system at each of the two main groundwater source areas on the Tindal property; the Fire Training Area (FTA) and the Fire Station Area (FSA). The central regeneration system is located alongside the FTA water treatment system and serves both the FTA and the FSA. Contaminated groundwater is extracted from wells located within each of the plumes and is pumped to the two individual treatment systems. Until soil excavation works have been completed at the FTA site, extraction wells are unable to be placed in the areas of the most significant contamination; however, these wells may be installed following completion of the works. PFAS concentrations of up to 50ug/l are being treated at the Fire Station Area and up to 40ug/l at the FTA. Regenerable ion exchange (IX) resin is being used to remove PFAS compounds from the water using a lead/lag/polish treatment train arrangement. When PFAS compounds are detected following the lead treatment vessel, that vessel is removed from the treatment train and transported to the regeneration system to strip the PFAS back off the resin, The regeneration process takes approximately 6 to 8 hours to complete, after which the vessel is transported and placed back into service in the treatment train. The proprietary regeneration process involves removing PFAS from the resin using a solvent-brine blend, followed by regenerant recovery/reuse using distillation and a process called super-loading. The combination of groundwater treatment using IX resin, on-site regeneration of the resin within the vessel, distillation of the regenerant solution for reuse, and super-loading the still bottoms to form a highly-concentrated solids waste, has minimized PFAS waste generation at the Tindal site.
M22f
Copyright © CRC CARE Pty. Ltd., 2019
CleanUp Conference 2019Adelaide, Australia8 –12 September 2019 70
Table of Contentsfor this manuscript

RESULTS AND DISCUSSION The FTA treatment system was commissioned in December 2018 and the FTS system was commissioned in March 2019. The use of multiple extraction wells has allowed contaminated water to be extracted from various combinations of wells, providing operators with the ability to maximise PFAS mass removal from the well network, thereby optimising the remediation efforts. Treated effluent quality has been consistent at both the FTA and FSA, consistently below the level of reporting (LOR) for all 28 PFAS compounds being monitored. The use of IX resin proven to have a high capacity for the removal of PFAS, combined with the unique resin regeneration technology, has results in the generation of minimal PFAS waste, while treating approximately 2.2 million litres of water per day. The lead/lag configuration of the resin vessels, multiple electronic failsafe features and remote monitoring capabilities has helped facilitate 98% uptime during 24/7 operations. CONCLUSIONS The application of innovative technology at RAAF Base Tindal has proven effective AT consistently providing a very high level of PFAS removal, while ensuring the contaminants are not simply being concentrated on absorbent media for disposal or thermal desorption. This has helped avoid passing along the problem for future generations to resolve and has greatly diminished the reliance subsequent thermal desorption/destruction, which requires significant transportation and energy use. Overall, regenerable IX resin treatment technology holds significant promise for expediting the remediation of PFAS contaminated waters and reducing the associated carbon footprint.
71
Table of Contentsfor this manuscript

THE NATIONAL REMEDIATION FRAMEWORK FOR THE REMEDIATION AND MANAGEMENT OF
CONTAMINATED SITES IN AUSTRALIA (NRF)
Bruce Kennedy1, Kerry Scott1, Joytishna Jit1,2, Ravi Naidu1,3
1Cooperative Research Centre for Contamination Assessment and Remediation of the Environment (CRC CARE), Newcastle NSW 2308, AUSTRALIA
2Future Industries Institute, University of South Australia, Adelaide, SA 5095, AUSTRALIA 3Global Centre for Environmental Remediation (GCER), University of Newcastle, Newcastle,
NSW 2308, AUSTRALIA [email protected]
INTRODUCTION Australia’s National Remediation Framework (NRF) provides a nationally harmonised approach for the remediation and management of contaminated sites in Australia. The draft framework was released for consultation in 2018, and is on path towards finalisation by late 2019 (CRC CARE 2019). The development of a national framework for remediation and management was and is supported by site contamination regulators, practitioners and industry (CRCCARE 2013). The NRF complements Australia’s assessment framework, the National Environment Protection (Assessment of Site Contamination) Measure (ASC NEPM). The ASC NEPM was first published in 1999 (NEPC 1999). Given that issues related to remediation and management of contaminated land are common throughout Australian jurisdictions it would be expected that policy, procedures and best practice would be characterised by a degree of uniformity and consensus. WHAT IS THE NRF? This national framework for remediation and management of contaminated sites codifies existing practice and enhances guidance for best practice remediation and management. The three modules of the framework are:
• Development of Remediation Action Plans (including remediation objectives) • Implementation • Post-remediation issues (including residual contamination issues)
Harmonisation of approach and best practice will not only yield commercial benefits but also provide governments and the public an assurance of consistency and competence in the remediation and management of contaminated sites. A harmonised national approach supports:
• Ready transfer of best practice among jurisdictions • Use of national expertise across jurisdictions, thereby improving overall standards
over time • Cost efficiencies for remediation • Common remediation language across jurisdictions • Training efficiencies, including the ability to ensure that all practitioners meet a
recognised professional standard, enhanced workforce mobility and mutual recognition of skills, and enhanced recognition of the contaminated sites profession; and
• Improved certainty and confidence in remediation outcomes.
M23a
Copyright © CRC CARE Pty. Ltd., 2019
CleanUp Conference 2019Adelaide, Australia8 –12 September 2019 72
Table of Contentsfor this manuscript

The purpose of the NRF is to: • Establish a nationally consistent approach to remediating and managing
contaminated sites; • Provide practical guidance for those who remediate and manage contaminated sites;
and • Educate and inform government, industry and the community about the issues.
The objectives of the NRF are to: • Protect human health and the environment; • Facilitate more effective and efficient remediation; • Provide net community benefit (including consideration of the broader economic
context). The NRF comprises two principal areas:
• Philosophy, including context and principles; and • Practice, including practical guidance.
The principles are based on Australia’s Inter-Governmental Agreement on the Environment (1992) and reflected in its state and territory environment protection legislation. The framework comprises modules and guidelines (24) for the development and implementation of remediation action plans, and for post-remediation matters, including residual contamination. NRF SUMMARISED The flowchart at Figure 1 indicates three broad stages of remediation:
• Define; • Design and implement; and • Finalise
The “define” stage captures the sometimes uncertain transition from assessment to remediation, involving an iterative process of defining the nature and extent of the contamination requiring remediation, consulting with regulators and other stakeholders, developing remediation objectives, and ultimately planning for site closure. In this stage the remediation action plan (RAP) and/or site management plan (SMP) will begin to be developed. Note that the ASC NEPM (Figure 2) refers to a RAP as a site remediation plan. Jurisdictional terminology may vary. Similarly, the “design and implement” stage captures the detailed yet sometimes iterative nature of choosing a remediation technology option, including pilot trials, cost-benefit and sustainability considerations, regulatory considerations and planning for validation. In this stage the RAP and/or SMP will be finalised and implemented. The “finalise” stage captures the administrative and operational process of achieving site closure, through validation, using lines of evidence to demonstrate the remediation objectives have been met (or not), implementing long-term monitoring or institutional controls if required, and ultimately achieving site closure. REFERENCES CRCCARE 2019 National Remediation Framework, CRC for Contamination Assessment and
Remediation of the Environment, Adelaide, Australia. Available: https://www.crccare.com/knowledge-sharing/national-remediation-framework
CRC CARE 2013, Defining the Philosophy, Context and Principles of the National Framework for Remediation and Management of Contaminated Sites in Australia, CRC CARE Technical Report no. 27, CRC for Contamination Assessment and Remediation of the Environment, Adelaide, Australia.
NEPC 2013. National Environmental Protection (Assessment of Site Contamination) Amendment Measure 2013 (No. 1). National Environment Protection Council, April 2013.
73
Table of Contentsfor this manuscript

Figure 1. Flowchart of the remediation and management stages and relevant NRF guidelines (CRCCARE 2019).
74
Table of Contentsfor this manuscript

THE NATIONAL REMEDIATION FRAMEWORK — IMPLICATIONS
Peter Nadebaum
GHD Pty Ltd, 180 Lonsdale Street, Melbourne, 3000, AUSTRALIA
CRC CARE has been coordinating the preparation of a “National Remediation Framework” to provide guidance on the remediation of contaminated sites. The document is the outcome of a considerable effort over several years, and has involved both regulatory agencies and industry. A draft of this guidance has been published for comment. When finalised, it is intended that the Framework will form companion document to the National Environment Protection Measure (Assessment of Site Contamination), which provides authoritative guidance on the assessment of contamination of soil and groundwater. While much of the guidance in the Framework reflects current practice, it is significant in providing more comprehensive guidance on the process for developing and applying remediation action plans. The Framework is far reaching, and lays out the principles and approach to determining the remediation objectives for sites, and the considerations that should apply. Overall, the Framework can be expected to improve the approach that we take and the outcomes of the remediation process, and is an important advance. The Framework involves a set of 24 modules, and the extent of the guidance is such that many in the industry will not have yet read the whole of the document, and will not have come to grips with what it is advocating. The author participated in a review of the draft Framework undertaken by the Australasian Land and Groundwater Association (ALGA), and in preparing this presentation has drawn on ALGA’s submission on the draft. This presentation outlines some key areas where the Framework may change practice, and where it may also change the outcomes of site remediation. Commentary on matters that may be considered when finalising the guidance is provided. These include:
• The Framework provides a more rigorous and comprehensive approach to identifying remediation options, and the decision process applied in determining which remedial option or combination of options is preferred. In particular, the proposed decision process can avoid the pitfalls of the simple multi-criteria analysis that is often adopted in the industry.
• The Framework formally outlining the principles that underpin environmental legislation and should apply to remediation. There is a module on setting remediation objectives. The Framework includes reference to ISO 31000 (Risk Management), and includes a module on Cost Benefit and Sustainability Analysis, and an Options hierarchy. The Framework formalises the adoption of a risk-based sustainable remediation approach, supportive of an approach that is consistent with an appropriate response to climate change, and is an advance on current practices. Victoria is introducing the principle of a “proportionate response”, something that could be considered when finalising the draft.
• The Framework includes quite detailed guidance relating to cost benefit and sustainability analysis. This welcome and important, but may be ambitious for the industry to carry out. A simpler approach such as that outlined in the recently published ISO 18504 (Sustainable Remediation) may be something that could be referred to when finalising the draft.
• The Framework includes a guide on identifying and assessing various technologies for remediation and management of sites. This is accompanied by 13 guides that outline important considerations for particular soil and groundwater technologies, including the requirements for trialling technologies. These guides draw out the important factors that should be considered and which may be pivotal in assessing
M23b
Copyright © CRC CARE Pty. Ltd., 2019
CleanUp Conference 2019Adelaide, Australia
8 –12 September 201975
Table of Contentsfor this manuscript

the relevance of a particular technology, and how it compares with other technologies. These guides can be a particularly useful introductory reference for practitioners. They are not complete, and could be expanded to include additional technologies and contaminant specific strategies, some of which CRC CARE has already prepared and is in the process of preparing (such as LNAPL management including Natural Source Zone Depletion, B(a)P, and PFAS assessment and management), and which may be included in the future (such as asbestos).
• The Framework includes a module outlining the approaches to Institutional Control as part of the management strategy for contaminated land and groundwater; this is an important topic, and information is included on State-specific approaches and tools.
• The Framework extends to other topics, such as Community Consultation, Occupational Health and Safety, Long Term Monitoring, and auditing – all important factors in developing and applying a remediation strategy.
CONCLUSIONS Overall, the development of a National Remediation Framework for Australia is an important and much needed advance, and is to be commended.
76
Table of Contentsfor this manuscript

WHEN WILL A LEACHATE SAMPLE NEVER FAIL?
Ross McFarland
AECOM Australia Pty Ltd, PO Box 73 Hunter Region MC NSW 2310, AUSTRALIA
OVERVIEW Environmental contaminant mobility potential, from source to receptor, is a key factor in the determination of its human health and environmental risk. Many tools have been devised in an attempt to establish this mobility, ranging from using simple fundamental rules of environmental chemistry (e.g. sulphides are generally low solubility) to elegant geochemical modelling, to long-term large scale empirical testing under near real world conditions (e.g. modified lysimeter studies). More experienced risk assessors often apply a “weight-of-evidence” approached, used in the metaphorical sense (Weed, 2005), so that the details of their methodology need not be prescribed. Within the wide range of tools to help estimate contaminant mobility is the use of various leachate tests, such as “TCLP” (USEPA, 1992), “SPLP” (USEPA, 1994), “ASLP” (AS4439.1-1999), and more recently “LEAF” (USEPA 2012a, 2012b, 2013a, 2013b). Many limitations have been discussed for these leachate tests applied to contaminant mobility estimation (for example see: WADER 2015) and the difficulties in interpreting and comparing any results obtained, but often the procedures have been enshrined into regulation and so they continues to be applied, noting their limitations. Notwithstanding these considerable limitations of leaching procedures, a relative sense of contaminant mobility is possible, and a comparison of mobility is possible. THE THEORETICAL TCLP? One of the more common leachate tests is the “TCLP” where a ratio of leaching solution to the solid being tested is maintained at 1 to 20 (i.e.100g of solid to 2,000mL of eluent). This simple ratio of 0.05kg/L allows a “theoretical TCLP” to be calculated. Using this solid-to-liquid ratio, and assuming 100% mobility from the solid to the eluent, it is possible to calculate the maximum concentration that could be produced. In fact, the NSWEPA Waste Classification Guidelines (NSWEPA 2014) publish maximum values to use for waste classification without TCLP testing. These values are known as “CT1” for “General Solid Waste” classification and “CT2” for “Restricted Solid Waste” classification and they are simply calculated using this 0.05kg/L ratio. So, if a total Specific Contaminant Concentration (SCC) is less than CT1, it will never exceed the TCLP1 because the CT1 concentration assumes that 100% of the contaminant is mobilised from its solid phase. The same paradigm applies to the NSWEPA’s CT2 and TCLP2 values. In other words, a leachate sample will never fail the NSWEPA’s TCLP1 value if the total contaminant concentration (or SCC) is less than CT1 (i.e. using the 0.05kg/L ratio) because this CT1 assumes the contaminant is 100% mobilised. Strangely, this simple “theoretical TCLP” calculation is commonly overlooked by contaminated land practitioners and many unnecessary TCLP tests are being performed on samples that would never have exceeded the relevant TCLP values. LESSONS LEARNT This paper acknowledges that many limitations in leachate testing have been reviewed elsewhere, but notes that leachate testing continues as one of the many tools used for contaminant mobility assessment.
M24a
Copyright © CRC CARE Pty. Ltd., 2019
CleanUp Conference 2019Adelaide, Australia
8 –12 September 201977
Table of Contentsfor this manuscript

More specifically, this paper notes the Solid-to-Liquid ratio of the TCLP test (i.e. 0.05kg/L) allows a “theoretical TCLP” to be calculated. So, by staging laboratory analysis so that total contaminant concentrations (also known as SCCs) are reported first, much unnecessary and costly TCLP testing can be avoided. Remarkably (and sadly), it has been this Site Auditor’s experience that the contaminated land industry appears to have forsaken the cost-effective staging of obtaining lab results for the haste to instruct laboratories to produce data as quickly as possible. Smarter staging of analytical work can result in substantial time and cost savings, while still achieving data of adequate quality for the proposed decision-making purposes. KEY REFERENCES ALS Environmental (2000) Environmental News No.11, Leachate Analysis, April, 2000. Australian Standard (1999) Wastes, sediments and contaminated soils Preparation of
leachates. Preliminary assessment (ASLP). AS 4439.1-1999, 1999. NSWEPA (2014) Waste Classification Guidelines: Part 1: Classifying waste. EPA
2014/0796, November 2014. USEPA (1992) Method 1311 “Toxicity Characteristic Leaching Procedure – TCLP, in
SW846, July 1992. USEPA (1994) Method 1312 “Synthetic Precipitation Leaching Procedure – SPLP, in
SW846, September 1994. USEPA (2012a) Method 1313 “Liquid-Solid Partitioning as a function of Extract pH using
Parallel Batch Extraction Procedure, in SW846, October 2012. USEPA (2012b) Method 1316 “Liquid-Solid Partitioning as a function of liquid-solid ratio in
solid materials using Parallel Batch Extraction Procedure, in SW846, October 2012. USEPA (2013a) Method 1314 “Liquid-Solid Partitioning as a function of liquid-solid ratio for
constituents in solid materials using an up-flow percolation column procedure, in SW846, January 2013.
USEPA (2013b) Method 1315 “Mass Transfer rates of constituents in monolithic or compacted granular materials using a semi-dynamic tank leaching procedure, in SW846, January 2013.
WA Department of Environmental Regulation (2015) Background paper on the use of leaching tests for assessing the disposal and reuse of waste-derived materials. July, 2015.
Weed, Douglas L (2005) “Weight of Evidence: a review of concept and method”. Risk Anal: 2005 Dec: 25 (6): 1545-1557.
78
Table of Contentsfor this manuscript

VARIABILITY AND UNCERTAINTY ASSOCIATED WITH SAMPLING, ANALYSIS, AND RISK ASSESSMENT
Naji Akladiss
State of Maine Department of Environmental Protection, Augusta, Maine, USA
INTRODUCTION Variability associated with sampling and analysis of environmental media and the uncertainty and bias inherent in risk assessment can impact the site conceptual model and thereby influence the final remedy selection and engineering design. The intrinsic variability in soil concentrations across short distances (even a few centimeters) and the temporal and spatial variability in groundwater can be challenging when determining the extent of contamination. ANALYTICAL VARIABILITY Sampling variability and bias can be compounded by analytical variability associated with sample preparation techniques, analyst competencies, and instrument capabilities that can influence the final reported results. An example will be provided to demonstrate that sample preparation techniques and analyst competencies are critical to identifying and quantifying the compound being analyzed. BIAS & UNCERTAINTY IN RISK ASSESSMENT Data generated from this inexact process is then utilized in risk assessment calculations that bring additional uncertainty and bias. This is attributable to risk assessment’s use of toxicity values developed by extrapolating from animal studies to human toxicity and from high-to-low-doses. Uncertainty is compounded by its inability to address possible synergistic or antagonistic effects associated with multiple chemical exposures. The outcome of this cumulative variability and/or uncertainty may lead to misestimates of the actual risk and improper remedy selection and cleanup activities. CONCLUSIONS While this uncertainty can never be eliminated completely, the purpose of this presentation is to shed some light on the sources of variability and their relative importance, and to present ways the cleanup team can manage this uncertainty to allow the team to properly manage the ambiguity associated with the risk assessment process.
Fig. 1 Typical Calibration Curve
M24b
Copyright © CRC CARE Pty. Ltd., 2019
CleanUp Conference 2019Adelaide, Australia
8 –12 September 201979
Table of Contentsfor this manuscript

Aroclor-1242 Aroclor-1248
Fig. 2 Typical chromatograms for Aroclor-1242 and Aroclor-1248 REFERENCES The ITRC - Decision Making at Contaminated Sites: Issues and Options in Human Health
Risk Assessment (RISK-3) Jan-15 Factors Influencing Variability in Groundwater Monitoring Data Sets by T.E. McHugh, L.M.
Beckley, C.Y. Liu, and C.J. Newell
80
Table of Contentsfor this manuscript

PERFORMANCE OF ANALYTICAL METHODS USED FOR MEASUREMENT OF ELEMENTS IN ENVIRONMENTAL SAMPLES ―
OUTCOMES FROM PROFICIENCY TESTING STUDIES
Luminita Antin, Jeffrey Merrick, Ian White
National Measurement Institute, 105 Delhi Road, North Ryde, NSW 2113, AUSTRALIA [email protected]
INTRODUCTION Proficiency Testing (PT) is a well-recognised external quality control tool used to monitor, assess and improve the performance of analytical laboratories. Since PT involves the analysis of common test materials by laboratories using various methods, PT can also assess the analytical methods involved. The performance of analytical methods used by analytical laboratories in NMI PT studies for measurement of elements in environmental samples is discussed. METHODS The mechanics of a NMI PT scheme involves distribution of a homogeneous and stable testing material to participating laboratories; each laboratory is instructed to use its normal test method and to report a single results with an associated uncertainty. The performance of participants is evaluated using z-scores and En-scores. A comprehensive questionnaire is also sent by NMI to participants at the beginning of each study. Information regarding the sample preparation procedures, extraction methods and instrumental techniques is collected and analysed in the final reports. Investigations further conducted by NMI using various extraction regimes or instrumental techniques also assist laboratories to assessing the performance of their analytical methods. RESULTS AND DISCUSSION Some of the issues identified within analytical methods used by participants for measurement of elements in environmental samples are presented below:
• Sample S1 of AQA 18-12 was a contaminated soil sample with high level of elements including the lanthanides (Sm, Nd, Gd, Dy, Eu, Er, Ho) present in high levels. Most participants reported using ICP-MS with various collision/reaction cells (CC/RC) and He or high energy He as collision gas. No assigned value could be set for As and Se in this sample because the reported results were too variable. An investigation was conducted by NMI using the same extraction procedure but various instrumental techniques and conditions. The results are presented in Table 1.
Table 1. NMI As and Se results versus instrumental technique
Instrumental Technique Used
ICP-MS CC/RC
He*
ICP-MS CC/RC
H2
ICP-MS/MS CC/RC
O2 (25%)
HR-ICP-MS HR mode**
ICP-OES (188.98 nm)
As Result (mg/kg) 7.80 6.0 5.4 5.6 5.9 Se Result (mg/kg) 0.49 0.10 NA 0.08 NA *The high As and Se results are an indication of unsolved interferences. ** High Resolution ICP-MS in high resolution mode; NA - Not Applicable
The result from ICP-MS-CC/RC He measurements was significantly different from results produced by other instrumental techniques. ICP-MS technique operated in collision mode is an effective way to remove most of the common interferences; however, because the interferences are removed based upon differences in atomic size, collision mode is not so effective in removing doubly charged ions’ interferences.
M24c
Copyright © CRC CARE Pty. Ltd., 2019
CleanUp Conference 2019Adelaide, Australia
8 –12 September 201981
Table of Contentsfor this manuscript

Doubly charged lanthanides appearing at half of their mass can produce spectral overlap on 75As or on 78Se and 82Se [1, 2]. When measuring low level As and Se in contaminated soil, laboratories should consider screening for lanthanides in the sample and using an alternative technique/instrumental conditions or increasing their level of reporting for these elements.
• In the first PT study conducted for Chromium (VI) in soil participating laboratories encountered difficulties with reducing properties of the matrix, high coloured background in the soil extract and the low level of Cr (VI) in the test sample. No assigned value was set because the results were too variable (Figure 1). The second round of PT studies showed an improvement in laboratory performance (Figure 2) possibly due to increase awareness of problems with methodology highlighted in the previous study.
Fig. 1. Box plots for AQA 16-18 S1Cr (VI) results in soil
.
Fig. 2. Box plots for AQA 18-06 S1Cr (VI) results in soil CONCLUSIONS Shortcomings in the test procedures used by participants for As, Se and Cr (VI) measurements in contaminated soil have been identified in PT rounds. This once again demonstrates the value of PT as a tool to assess the performance of analytical methods. In most cases, the identification of such issues triggers further investigation by participant laboratories in order to improve the accuracy of their methods. REFERENCES [1] Spectroscopy, Reducing the Effects of Interferences in Quadrupole ICP-MS,
http://www.spectroscopyonline.com/reducing-effects-interferences-quadrupole-icp-ms (November 2018).
[2] Jackson, B. and Liba, A. 2015, Advantages of reaction cell ICP-MS on doubly charged interferences for arsenic and selenium analysis in foods J. Anal. At. Spectrometry 30:1179-1183.
82
Table of Contentsfor this manuscript

PFAS ANALYSIS BY LC-HRMS
Eddie Wang, Feng Shi, Philip Williams, Bruce Chen
Symbio Laboratories, 52 Brandl Street, Eight Mile Plains, 4113, AUSTRALIA [email protected]
INTRODUCTION The ubiquitous distribution and subsequent reporting of Per- and Poly- fluoroalkyl substances (PFASs) continues to maintain public awareness and concern of these persistent organic pollutants (POPs). PFASs chemicals with respective precursor and degradation products represent an extensive group of fluorinated organic compounds with unique and complexed properties. In response to the phase out of products containing C8 based PFOS and PFOA, there has been an increased use of products containing short chain PFASs and related precursors. Many of these substances are considered to be POPs and have yet to be extensively tested. Commonly used Low Resolution Mass Spectrometry (LRMS) techniques for an ever-expanding portfolio of anthropogenic PFASs analytes are hampered by technological limitations, particularly in relation to confirmatory requirements for short chain PFAS compounds. These limitations relate to the working principle of LRMS systems which require both a specific precursor ion and unique fragment ions to facilitate quantitation and confirmation of the compound in question. When confronted with certain short chain PFASs e.g. PFBA, PFPeA and PFPrS, LRMS is unable to generate unique fragment ion resulting in ambiguous data and lack of confirmation capability. Detection of unknown PFASs is also unlikely to occur with LRMS as the system must be pre-configured to capture both defined precursor and fragment ions prior to analysis. In other words, the analyst must know what they are looking for and have access to a suitable reference material prior to undertaking analyses. In many instances reference materials are not available making this an unachievable task when employing LRMS detection. A new analytical technique based on High Resolution Mass Spectrometry (HRMS) offers a valuable alternative to LRMS methodology. At least two accurate mass of each difficult short chain PFAS can be generated providing confidence for both confirmation and quantification. Unknown PFASs can be discovered by post acquisition interrogation of the acquired HRMS data. Using the chemical structure of the analyte molecule in question along with the advanced HRMS MS/MS scan information, analysis of this data can achieve simultaneous determination and confirmation of the previously unknown PFAS without a need for reference material or reanalyses. METHODS Environmental samples including water, soil, sediment and biota were extracted using Solid Phase Extraction (SPE) or modified Quick Easy Cheap Effective Rugged Safe (QuEChERS) technique and analysed on LC-HRMS. Retrospective investigation of past samples were carried out by analysing acquired data and in-house database for matching accurate mass of molecular ion, fragment ions and retention time to identify and confirm the presence of previously un-targeted PFAS. CONCLUSIONS A successful application of HRMS for the accurate quantification and confirmation of 39 targeted PFAS on environmental samples such as water, soil, sediment and biota. The HRMS provides excellent confirmations for difficult analytes such as short chain PFAS – FPBA, PFPeA and PFPrS. The significant advantage of the use of LC-HRMS in PFAS analysis is that certain untargeted PFAS can be discovered and confirmed by the subsequent interrogation of the data without the needs of reanalysing the sample that may or may not be available anymore.
M24d
Copyright © CRC CARE Pty. Ltd., 2019
CleanUp Conference 2019Adelaide, Australia
8 –12 September 201983
Table of Contentsfor this manuscript

REFERENCES Assets.thermofisher.com. (2019). [online] Available at: https://assets.thermofisher.com/TFS-
Assets/CMD/Application-Notes/AN-667-LC-MS-Polyfluoroalkyl-Substances-EPA-Method-537-AN65013-EN.pdf [Accessed 24 Jul. 2019].
Ruan, T. and Jiang, G. (2017). Analytical methodology for identification of novel per- and polyfluoroalkyl substances in the environment. TrAC Trends in Analytical Chemistry, 95, pp.122-131.
Weiner, B., Yeung, L., Marchington, E., D'Agostino, L. and Mabury, S. (2013). Organic fluorine content in aqueous film forming foams (AFFFs) and biodegradation of the foam component 6 : 2 fluorotelomermercaptoalkylamido sulfonate (6 : 2 FTSAS). Environmental Chemistry, 10(6), p.486.
Xiao, F. (2017). Emerging poly- and perfluoroalkyl substances in the aquatic environment: A review of current literature. Water Research, 124, pp.482-495.
84
Table of Contentsfor this manuscript

THE CHANGES IN LEAD SPECIATION DURING BIOAVAILABILITY ASSESSMENTS
Kaihong Yan1,2, Ravi Naidu1,2, Yanju Liu1,2, Zhaomin Dong4, M.A. Ayanka Wijayawardena1,2,
Yeling Li3, Peter Sanderson1,2, Hongbo Li5
INTRODUCTION Soil properties and lead (Pb) mineral phases have been reported to influence Pb bioavailability (Pb-BA). However, there is limited information on the changes in Pb minerals during Pb-BA and Pb bioaccessibility (Pb-BAc) assessments. In this study two commonly used in vitro models, RBALP and UBM, were validated using in vivo mice models. SEM, XRD and XANEs were applied to investigate Pb speciation in selected soils, soil residues after in vitro extraction, and in mice excreta following in vivo assays. MATERIALS AND METHODS Nine soils were used in this study. Soil H2 was collected from Port Pirie, South Australia. Soils H3 to H10 were collected from mining areas in Western Australia. All soil samples were thoroughly mixed and dried in an oven at a constant temperature (37 °C) prior to gentle crushing to pass through a 2-mm stainless steel sieve. A portion of each soil was sieved to pass through a 250-µm stainless steel sieve and used for Pb BA and BAc studies. The total heavy metal content in soils was analysed in Aqua Regia extracts (1 HCl (37%): 3 HNO3 (69%)) (MARS 6™, CEM) (USEPA method 3051). Both the RBALP (Drexler and Brattin, 2007) and UBM (Denys et al., 2012) methods were used for determination of Pb-BAc. The Pb-RBA was measured using mice at Nanjing University, Nanjing, China. Specific-pathogen-free grade female Balb/c mice which body weights (BW) ranging from 16.7 to 19.6g (mean BW = 18.1±0.70g) were used in this study. Animal care procedures complied with the Guide for the Care and Use of Laboratory Animals at Nanjing University (Li et al., 2014). The metal concentrations in solutions were measured using Inductively-coupled Plasma Mass Spectrometry (ICP-MS) (model 7900, Agilent Technologies, Tokyo, Japan) after filtering and sufficient dilution. RESULTS AND DISCUSSION • The Pb-RBA values derived from kidneys were significantly correlated with those for
livers in our study, which suggested that both kidneys and livers are reliable indicators Pb-RBA in mice. The slopes and R squares of Pb-RBA from kidneys vs Pb-RBA from livers in our study were very similar to those for swine, while the y-intercepts were slightly positive in our study and negative in swine studies (Casteel et al., 2006; Denys et al., 2012) (Figure 1).
• The components of soil H8 indicating that PbS may be the dominant component but a portion of PbS was oxidized to PbSO4 during weathering (Topolska et al., 2013) (Figure 2). A portion of S in soil was combined with metals in soils (such as Fex+ and Mg2+) and was oxidized to the forms of metal-Ox-Pb, including FeOx Pb, MgO Pb and other forms. There was also a small portion of S combined to Cl- and PO4
3+ and in the form of Pb5(PO4)3Cl (Ma et al., 1994).
• It is likely that only PbSO4, PbO2 and MgO Pb were dissolved prior to Pb5(PO4)3Cl during in vitro extraction (Figure 2). These results suggested that the extraction of Pb by both
1Global Centre for Environmental Remediation, University of Newcastle, AUSTRALIA
2CRC CARE, University of Newcastle, AUSTRALIA 3School of Earth & Space Sciences, University of Science & Technology of China, CHINA
4School of Space & Environment, Beihang University, CHINA 5School of the Environment, Nanjing University, CHINA
M24e
Copyright © CRC CARE Pty. Ltd., 2019
CleanUp Conference 2019Adelaide, Australia
8 –12 September 201985
Table of Contentsfor this manuscript

the RBALP and UBM models started dissolution with relatively soluble forms (PbSO4, PbO2 and MgO Pb) rather than all forms of Pb minerals. The large portion of organically-complexed Pb was identified in mice excreta may because the dissolved Pb2+ in mice stomachs were combined with humic acid during the clearance in the small intestines, where pH is neutral. The components in H8E differed between H8R and H8U, and indicated that the mechanism of Pb dissolution and metabolism in in vivo mice gastrointestinal tract is different with either chemical or physiological-based in vitro models.
Figure 2 Normalized XANES spectraand components for soil H8 (H8-U: residual of H8 after UBM model; H8-R: residual of H8 after RBALP model; H8E: mice excretion after exposure to soil H8)
2+
Figure 1 Correlation between Pb-RBA of liver and kidney
CONCLUSIONS Comparison of Pb mineral forms using XANEs on residual Pb after in vitro extractions, demonstrated no differences in the dissolution mechanisms between chemical (RBALP) and physiologically-based (UBM) models. The free Pb2+ released from Pb minerals with relatively high solubility products (Ksp), including PbO2, PbSO4 and MgO Pb, combine with free Cl- and PO4
3- in solution. Lower Ksp Pb minerals such as Pb5(PO4)3Cl and organically-complexed Pb were identified in mice excreta. The studies demonstrated that a portion of free Pb2+ combined with food and humic acid to generate organically-complexed Pb, and that Pb5(PO4)3Cl is a resilient product that is not bioavailable. REFERENCES Casteel, S.W., Weis, C.P., Henningsen, G.M., Brattin, W.J., 2006. Estimation of relative
bioavailability of lead in soil and soil-like materials using young swine. Environ Health Persp 114, 1162-1171.
Denys, S., Caboche, J., Tack, K., Rychen, G., Wragg, J., Cave, M., Jondreville, C., Feidt, C., 2012. In vivo validation of the Unified BARGE Method to assess the bioaccessibility of arsenic, antimony, cadmium, and lead in soils. Environ Sci Technol 46, 6252-6260.
Drexler, J.W., Brattin, W.J., 2007. An in vitro procedure for estimation of lead relative bioavailability: With validation. Hum Ecol Risk Assess 13, 383-401.
Li, H.-B., Cui, X.-Y., Li, K., Li, J., Juhasz, A.L., Ma, L.Q., 2014. Assessment of in vitro lead bioaccessibility in house dust and its relationship to in vivo lead relative bioavailability. Environ Sci Technol 48, 8548-8555.
Ma, Q.Y., Logan, T.J., Traina, S.J., Ryan, J.A., 1994. Effects of NO3-, Cl-, F-, SO42-, and CO32-on Pb2+ immobilization by hydroxyapatite. Environ Sci Technol 28, 408-418.
Topolska, J., Borowicz, P., Manecki, M., Bajda, T., Kaschabek, S., Merkel, B.J., 2013. The effect of gluconic acid secretion by phosphate-solubilizing Pseudomonas putida bacteria on dissolution of pyromorphite Pb5 (PO4) 3Cl and Pb remobilization. Annales Societatis Geologorum Poloniae, pp. 343-351.
86
Table of Contentsfor this manuscript

DEFINING SUSTAINABILITY AND RESILIENCY IN REMEDIATION DESIGN: NOT AN “AND” VERSUS “OR” PROPOSITION
Scott D. Warner, Christopher J. Ritchie
Ramboll, 2200 Powell Street, Suite 700, Emeryville 94608 USA
INTRODUCTION The concepts of sustainability and resiliency remain a developing and growing theme in environmental protection. When focused on approaches involving the design of soil and groundwater contaminant clean up measures, sustainability is used to capture methods that reduce negative impacts on the environment by complying with the concepts of social, economic, and ecological balance and protection – the so-called “do no harm” approach even when constructing remediation systems. Equally important, but less directly referred to in remediation design and application, the concept of resiliency considers how a remediation system can adjust to environmental adversity (such as changing groundwater gradients and flow rates for a groundwater remediation system) and still meet performance and compliance objectives. A review of the past three decades within the environmental remediation community may find that “sustainability” and “resiliency” have been used as synonymous concepts during remediation design. We make the point herein; however, that each concept has its own important place and should be considered and applied unequivocally as a modern manifestation of remediation practice. DISCUSSION Often termed “green remediation,” the concept of sustainability focuses on techniques that reduce the overall environmental footprint of a remedial measure throughout the entire remediation implementation process (Warner and Hadley, 2012). This includes the phases of site and design characterization, remedy construction, and long-term operation. For example, by concept alone, in situ techniques that apply subsurface passive biological and/or geochemical (e.g., bioremediation and permeable reactive barriers) may be considered more sustainable than (a) groundwater extraction using pumping wells and (b) soil excavation that uses conventional construction and waste removal measures because of the need for energy intensive processes including extraction well operation, use of heavy construction equipment, and waste management including transportation and disposal. Sustainable remediation also focuses attention to the treatment media that is used to promote remediation (such as the use of compost for biological treatment and nature-based natural methods including phytoremediation). Numerous government organizations, including Federal Agencies in the United States have as far back as 2007 (USEPA, 2007) mandated that environmental, transportation, and energy activities be performed to increase sustainable practice – the use of sustainable remediation is consistent with that approach. Resilience is the practice of designing things to endure physical, social, and economic disruptions. With respect to remediation design and operation, a resilient treatment system is used primarily to describe the ability or capacity to withstand disruptions in site or environmental conditions that typically would limit or restrict the ability of the remedy to meet performance objectives. For example, an in-situ groundwater treatment remedy using a permeable reactive barrier, which does not rely on groundwater pumping or other anthropogenic control, typically has been designed under the assumption that groundwater hydraulic conditions – e.g., flow gradients and rates, potentiometric conditions, and geochemical conditions – would be relatively unchanged over the life of the treatment system. However, with the observation that the evolution of climatic conditions in a given area can alter the full breadth of hydraulic conditions such that the design assumptions deviate from developing conditions, the lack of the system to be resilient to change may rapidly doom the ability of the system to meet treatment objectives. The resulting lack of
M25a
Copyright © CRC CARE Pty. Ltd., 2019
CleanUp Conference 2019Adelaide, Australia
8 –12 September 201987
Table of Contentsfor this manuscript

performance may thus allow contaminants to negatively impact sensitive environmental receptors unless a new and potentially costly system is implemented. Rationale and Objectives We recognize that the environmental and economic health of many global communities is linked to the security of fresh water resources and the implementation of reliable and protective groundwater restoration and water resource protection measures. With the continued progress of climatic shifts that manifests into extreme hydrologic events (for example consider the noticeable increase in extreme flooding events in major industrial areas in the United States, including Texas and North Carolina, in recent years), the stress on existing groundwater and surface water protection measures will continue to increased and the need for these systems to be resilient under extreme conditions will be an increased area of focus (Rowe, et al., 2017). Research into and application of new methods and tools for designing groundwater and soil contamination clean-up measures that are adaptable to the short and long-term hydrologic perturbations caused by climate change should increase in priority. However, the challenge will be to not discount the benefit of “sustainable” approaches that can enhance the ability of a treatment system to be resilient. The example of an engineered wetland to both restore environmentally damaged coastal settings (for example, from contaminant plumes emanating from urban river systems or landfills) and provide a level of resiliency under times of extreme flooding events (as the wetland systems can restore themselves) is a well-envisioned concept. More challenging is the case of designing an upland treatment system at a mine-site or industrial setting that must be functional for perhaps decades. However, modern advances in numerical modelling that can simulate a wider variety of scenarios under changed hydraulic conditions, and application of adaptable engineering solutions (such as passive “siphon” assisted hydraulic gradient control) are one of numerous likely new concepts that are to be developed in the coming years. CLOSING The intent of this presentation and discussion is to examine remediation designs that consider both sustainability and resiliency but not, to the extent practicable, at the expense of each concept. Decisions on priority will always be important and limiting the risks to sensitive receptors will need to take precedence. We promote that both performance and economic vitality of the remedial design will be improved greatly over historical approaches when both sustainable and resilient design and considered to be mutually beneficial and not competitive. REFERENCES Rowe, D., Greene, G., Warner, S., and Gimre, K. (2017) Remediation and water resource
protection under changing climatic conditions. Environ. Tech. & Innovation. 8:291-298. United States Environmental Protection Agency (USEPA) (2007) Energy Independence and
Security Act of 2007. https://www.epa.gov/greeningepa/energy-independence-and-security-act-2007, December 19, 2007.
Warner, S.D. and Hadley, P. W. (2012) Sustainable remediation: Integrating risk, science, and sustainability principles. In: Meyers, R.A. (Ed.) Encyclopedia of Sustainability Science and Technology. DOI https://doi.org/10.1007/978-1-4419-0851-3_55. Springer Science + Business Media, New York, 2012.
88
Table of Contentsfor this manuscript

SUSTAINABLE ENERGY GENERATION BY UTILISING ORGANIC WASTE
Jayant Keskar
Enpro Envirotech Pty Ltd Adelaide AUSTRALIA
INTRODUCTION According to one of the reports published in Australia, about 48 million tonnes of waste is generated in Australia excluding fly ash. In South Australia 3.9 million tonnes of waste is generated excluding fly ash. A large part of this waste is organic in nature and mainly utilised for composting. However still remaining part of organic waste ends up in landfill generating substantial amount of greenhouse gas emissions. Organic waste in South Australia is mainly from agriculture, livestock, food & beverage, meat industry sector as well as fruit and vegetables. Certain portion of municipal solid waste is also organic and termed as OFMSW (organic fraction of municipal solid waste). Such organic waste can be utilised for sustainable energy generation in the form of biogas. Multiple organic waste which are not typically used for biogas generation can also be considered in order to generate higher energy and various organic waste streams including atypical waste are assessed for sustainable energy generation. ORGANIC WASTE GENERATION Various reports have been published on waste generation in South Australia. Recently the organic waste available in South Australia is mapped and a new platform is developed to add the data that will be available publicly for consultants, industries as well as government organisation. This data when developed fully, will be able to provide better view of potential bioenergy generation from available waste in the region. There will be different types of waste material categorised under this which mainly includes livestock industry (pig, poultry, dairy etc), Wineries (as South Australia is having maximum number of wineries), municipal biosolids, food waste as well as agriculture biomass (Pickin et al 2018). There are 13475 farms in South Australia with 286 dairy farmers. One of the biggest meat producer and exporter is located in South Australia. There are about 10 million sheep, 1 million cattle and 0.4 million pigs in South Australia which generates the manure as well as organic waste after processing in an abattoir. Atypical waste such as grass, cactus, jatropha seedcake, glycerol, water hyacinth can also be utilised for biogas generation either as a single feedstock or in co-digestion. Sustainable energy in the form of biogas Different organic waste streams have different biomethane potential (Duna_deIRisco et al 2011). In an anaerobic digestion process, organic waste is converted into biogas which mainly contains about 50-70% methane. Biogas can be used in versatile manner as source of energy. It can directly be combusted in boiler to generate heat or steam. When passed through CHP (combined heat and power) engines, it generates electricity. In Europe, the biogas is cleaned and further injected in the natural gas grid. Many countries in Europe have vehicles run on the purified biogas which leads to zero pollution. In developing countries, the biogas is also utilised for cooking purpose. CONCLUSIONS South Australia has considerable potential to generate bioenergy from organic waste. With current available data, it could be possible to generate bioenergy that could form about 1-2% of total energy demand in the state. The share of bioenergy can be increased substantially by generating scientific data and implementing anaerobic digestion technologies.
M25b
Copyright © CRC CARE Pty. Ltd., 2019
CleanUp Conference 2019Adelaide, Australia
8 –12 September 201989
Table of Contentsfor this manuscript

The atypical waste is available around us in considerable quantity. Most of these atypical wastes can be grown (Giant reed grass, Jatropha, cactus) on a degraded land with negligible amount of water. This does not compete with land for food production as well. Environmental benefits of such projects include- reduction of GHG, achieving sustainability, partially replacing chemical fertiliser. REFERENCES Pickin, J., Trinh, J, Rundell, P., Grant, B. (2018) National Waste Report 2018 final Duna_deIrisco, M., Normak, A., Orupold, K. (2011) Biochemical methane production of
different organic wastes and energy crops from Estonia. Agronomy Res. 9(1-2):331-342
90
Table of Contentsfor this manuscript

DEBUNKING MYTHS ABOUT SUSTAINABLE REMEDIATION
G.A. Kerrison1, J.W.N. Smith2
1Shell Global Solutions (Australia) Pty Ltd, Melbourne, Australia 2Shell Global Solutions (UK) Ltd, Rijswijk, The Netherlands
gavin [email protected] INTRODUCTION Sustainable remediation has emerged over the past decade as an evolution of the establish risk-based approach to assessment and management of contaminated soil and groundwater. In this period the contaminated land industry has worked to develop good practice guidance, and recently international standards (ISO18502, 2017). METHODS Practice and application of sustainable remediation principles and tools has grown and developed over this period, but not without some misunderstanding or misinterpretation in some quarters that has, on occasion, led to reluctance to accept the approach. The reason for such hesitations is frequently based on incorrect understanding of sustainable remediation, or the motivations behinds its development. CONCLUSIONS This paper concludes and presents a series of misconceptions and frequently stated concerns about sustainable remediation to help debunk the myths that underlie these concerns. The lessons learned by the SuRF-UK steering board since it was established in 2007 are synthesized and presented to help dispel similar concerns in other locations. REFERENCES Bardos, R. P., Bone, B. D., Boyle, R., Ellis, D., Evans, F., Harries, N., & Smith, J. W. N.
(2011). Applying sustainable development principles to contaminated land management using the SuRF-UK framework. Remediation, 21(2), 77–100. https://doi.org/10.1002/rem.20283
Bardos, R. P., Bone, B. D., Boyle, R., Evans, F., Harries, N., Howard, T., & Smith, J. W. N. (2016). The rationale for simple approaches for sustainability assessment and management in contaminated land practice. Science of the Total Environment, 563–564, 755–768. https://doi.org/10.1016/j.scitotenv.2015.12.001
Bardos, R. P., Thomas, H. F., Smith, J. W. N., Harries, N. D., Evans, F., …Haslam, A. (2018). The development and use of sustainability criteria in SuRF-UK's Sustainable Remediation Framework. Sustainability, 10, 1781. https://doi.org/10.3390/su10061781
Harclerode, M., Risdale, D. R., Darmendrail, D., Bardos, R. P., Alexandrescu, F., Nathanail, P., … Rizzo, E. (2015). Integrating the social dimension in remediation decision-making: State of the practice and way forward. Remediation Journal, 26(1), 11–42. https://doi.org/10.1002/rem.21447
Laurent,A., Olsen, S. I.,&Hauschild,M.Z. (2012). Limitations of carbon footprint as indicator of environmental sustainability. Environmental Science & Technology, 46(7), 4100–4108. https://doi.org/10.1021/es204163f
Li, X., Bardos, P., Cundy, A., Harder, M.K., Doick, K.J., Norrman, J.Chen, W. (2019). Using a conceptual site model for assessing the sustainability of brownfield regeneration for a soft reuse: A case study of Port Sunlight River Park (UK). Science of Total Environment, 652, 810–821. https://doi.org/10.1016/j.scitotenv.2018.10.278
Nathanail, C. P., Bakker, L. M. M., Bardos, P., Furikawa, Y., Nardella, A., Smith, G., … Goetsche, G. (2017). Towards an international standard: The ISO/DIS 18504 standard on sustainable remediation. Remediation Journal, 28(1), 9–15. https://doi.org/10.1002/rem.21538
M25c
Copyright © CRC CARE Pty. Ltd., 2019
CleanUp Conference 2019Adelaide, Australia
8 –12 September 201991
Table of Contentsfor this manuscript

O'Connor,D.,&Hou,D. (2018). Targeting clean-ups towards a more sustainable future. Environmental Science: Processes and Impacts, 20, 266–269. https://doi.org/10.1039/C7EM00518K
Rizzo, E., Bardos, P., Pizzol, L., Critto, A., Giubilato, E., Marcomini, A., … Smith, G. (2016). Comparison of international approaches to sustainable remediation. Journal of Environmental Management, 184(1), 4–17. https://doi.org/10.1016/j.jenvman.2016.07.062
Smith, J. W. N., & Harries, N. D. (2016). The life and times of the Sustainable Remediation Forum-UK. What worked, and mistakes to avoid. In: Proceedings of Sustainable Remediation 2016. Montreal, Canada
Smith, J. W. N., & Kerrison, G. (2013). Benchmarking of decision-support tools used for tiered sustainable remediation appraisal. Water, Air & Soil Pollution, 224(12), 1706. https://doi.org/10.1007/s11270-013-1706-y
Sustainable Remediation Forum (SURF). (2009). Sustainable remediation white paper—Integrating sustainable principles, practices, and metrics into remediation projects. Remediation, 19(1), 5–114. https://doi.org/10.1002/rem.20210
The Horinko Group. (2014). The rise and future of green and sustainable remediation. Washington DC: The Horinko Group. Retrieved from http://www.thgadvisors.org/wp-content/uploads/2014/03/The-Riseand-Future-of-Green-and-Sustainable-Remediation.pdf
Thornton, S.F., Tobin, K., & Smith, J.W.N. (2013). Comparison of constant and transient-source zones on simulated contaminant plume evolution in groundwater: Implications for hydrogeological risk assessment. Ground Water Monitoring & Remediation, 33(3), 78–91. https://doi.org/10.1111/gwmr.12008
92
Table of Contentsfor this manuscript

A SUSTAINABLE ALTERNATIVE TO EXCAVATION OF PFAS SOURCE AREAS
Ian Ross1, Jeffrey McDonough2, Jake Hurst1, Jonathan Miles1, Danielle Toase3,
Jason Lagowski3, Peter Storch4
1Arcadis, 1 Whitehall Riverside, Leeds, LS1 4BN, UK 2Arcadis, 10 Friends Lane, Newtown, PA 18940, USA
3Arcadis, Level 16/580 George St, Sydney, NSW 2000, AUSTRALIA 4Arcadis, 32/140 William St, Melbourne, VIC 3000, AUSTRALIA
INTRODUCTION Per- and polyfluoroalkyl substances (PFAS) include persistent, bioaccumulative, and mobile fluorinated compounds that potentially present a risk to human health and the environment. The prolonged application of aqueous film-forming foams (AFFF) containing PFAS at firefighting training areas (FTAs) has resulted in long-term sources of PFAS leaching into soil and groundwater. The leachability risk of PFAS from resultant soil source zones to groundwater can be mitigated by reducing their mobility in the subsurface via fixation. A treatability test program was designed to explore the in-situ soil stabilization (ISS) of PFAS in FTA source zones using commercially-available adsorption media (i.e., “fixants”). ISS presents a potential PFAS source zone management alternative that eliminates ex-situ management of PFAS wastes while protecting groundwater from future leaching. ISS consists of the use of heavy-construction equipment, augers, and/or cutting tools to mix soil, water, and fixants in place in the vadose and saturated zones. ISS can be a highly-effective method for accessing source mass because it homogenizes soil, reduces geological anisotropy, and provides immediate access to soluble PFAS stored in low-permeable strata. The ISS reduces leachability through stabilization with the fixants and minimizes vertical infiltration and lateral hydraulic conductivity by homogenizing preferential pathways with low-permeability strata. Laboratory tests were conducted with four objectives: 1) establish basic adsorption performance of selected fixants for PFAS; 2) test performance as a function of pH; 3) compare performance with and without Portland cement; and 4) obtain leachability data to demonstrate potential long-term stability of in-situ treatment. METHODS Bulk soil and groundwater samples were collected from an airport site in Australia known to be impacted with PFAS from AFFF use. Three commercially-available fixants were selected for the test program based on their potential for adsorption of anionic PFAS: Aluminum Hydroxide (AlOH)/Carbon Blend (AHCB), Pyrolyzed Cellulose (PC), and Modified Clay (MC). The program consisted of batch contact tests of impacted soil and groundwater mixed in a Liquid/Solid Ratio of 2:1. The batches were mixed on a linear mixing table for 18 hours. Control and duplicate batches were run and pH was monitored at points along the process. After mixing, samples were separated and filtrate samples were analyzed for a PFAS suite of 28 compounds using LC/MS/MS method at an accredited commercial lab in Australia. Larger batch contacts were run with soil and groundwater to simulate in-situ soil mixing. Leachability tests were then conducted on treated batches with and without Portland cement. RESULTS AND DISCUSSION All three reagents tested demonstrated effective adsorption of PFAS and have potential for stabilization of PFAS. MC demonstrated the best removal of perfluorinated sulfonates, which were the main contaminants. The result at the lowest dose of 5-percent on a weight basis (% wt) represents better than 99.9% reduction in dissolved-phase concentration. The AHCB demonstrated the best overall removal of perfluorinated carboxylate (PFCAs) compounds, particularly for short-chain PFCAs. Adsorption capacities measured for AHCB, PC, and MC
M25d
Copyright © CRC CARE Pty. Ltd., 2019
CleanUp Conference 2019Adelaide, Australia
8 –12 September 201993
Table of Contentsfor this manuscript

of the 28 PFAS Standard Suite in were 25.6, 15.3, and 38.3 microgram PFAS per gram fixant, respectively. The PC showed a significantly less removal capacity of short-chain PFAS compared to the AHCB and the MC. The sequential leaching test of the MC exhibited up to two order-of-magnitude decrease in leachability over the control sample. The overall mass of PFAS leached was approximately 1% of the total PFAS mass after an estimated 50 pore volumes of leaching. The test work simulation of ISS demonstrates the strong potential of this technology as an effective tool for mitigating migration of PFAS through soil and groundwater. This treatability test serves as the basis for a Department of Defense funded three-year field-scale comparison of commercially available fixants targeted for implementation in 2018.
94
Table of Contentsfor this manuscript

PHYTHOMAS TO BIOENERGY: A PROMISING WAY TO UTILIZE DIFFERENT EFFLUENTS FOR
SUSTAINABLE ENERGY PRODUCTION
Sonia Shilpi1,2, Balaji Seshadri1,2, Nanthi S. Bolan1,2, Ravi Naidu1,2
1Global Centre for Environmental Remediation (GCER), University of Newcastle, Callaghan,
New South Wales 2308, AUSTRALIA 2Co-operative Research Centre for Contamination Assessment and Remediation of the
Environment (CRC CARE), PO Box 18, Callaghan NSW 2308, AUSTRALIA [email protected]
INTRODUCTION Importance in energy production from biomass can be increased by measuring other environmental and social benefits, which are not always assessed in common cost–benefit analysis. These are the reduction of greenhouse gas emission due to the fact that less CO2 is emitted in biomass combustion than is absorbed by the plant through photosynthesis, (Lewandowski et al., 1995); the replacement of excess food crops with alternative non-food species that may represent a new opportunity for the population of rural areas (McKendry, 2002); the self-production of energy in the farms and forest companies; and the reduction of soil degradation, preventing marginal land abandonment by growing energy crops. It is necessary to develop sustainable energy supply systems that aims to address the energy demand from renewable sources using wastewater streams. Mitigation of greenhouse gas emissions through renewable energy production is of rising importance. Biogas production is a key technology for the sustainable use of biomass as a renewable energy source. High energy yields per hectare can be achieved through biogas production. The overall objective of the study is to examine the effects of abattoir and municipal wastewater irrigation on different energy crops. The specific objectives of the study include:
• To quantify the biomass produced from energy crops irrigated with water resources of two irrigation rates (Abattoir wastewater and municipal wastewater)
• To determine the methane production of the experimental species METHODS This field experiment was conducted in a landfill site. The experimental (Coleman land treatment site) site is located at St Kilda, 23 km NNE of the capital of South Australia. Seeds of sunflower (Helianthus annuus), sugar beet (Beta vulgaris), canola (Brassica napus L.), alfalfa (Medicago sativa), maize (Zea mays), napier grass (Pennisetum purpureum) and giant reed (Arundo donax) were sown in each plot of 1m2 size. The plot of each crop was irrigated with abattoir wastewater (AWW), municipal wastewater (MWW) with two irrigation rate (400mm yr-1 ha-1; 800mm yr-1 ha-1) and tap water (TW) as control. All the plots were harvested three months after planting and fresh biomass of the harvested plants were recorded. Biochemical methane potential assay: Anaerobic digester was used to determine a reference methane yield from finely ground substrates under optimal conditions. Microbial inoculum was obtained from wastewater sludge at Bolivar plant, Salisbury city council. Substrate/inoculum ratio based on volatile solid (VS) basis was used in all batch experiments, performed in 500 ml bottles (working volume 400 ml) in triplicate, incubated on a shaking water bath (70 rounds minute-1 (rpm)) at 37±1°C. The digestion was continued until methane production became negligible (<5 ml CH4 d-1). The methane production was calculated by the following formula.
, (1)
M25e
Copyright © CRC CARE Pty. Ltd., 2019
CleanUp Conference 2019Adelaide, Australia
8 –12 September 201995
Table of Contentsfor this manuscript

Where, BMP is the normalised volume of methane produced per gram VS of substrate added (Nl g-1 VS); VS is the accumulated volume of methane produced from the reactor with sample (i.e., inoculum and substrate); VB is the mean value of the accumulated volume of methane produced by the three blanks (i.e., inoculum); mIS is the total amount of inoculum in the sample; mIB is the total amount of inoculum in the blank; mVS,sS is the amount of organic material (i.e., volatile solids) of substrate contained in the sample bottle RESULTS AND DISCUSSION High nutrient uptake and fast growing energy plants can utilise the ready source of nutrient supplied by wastewater before it leach to the environment. Methane production was high from energy crops irrigated with abattoir wastewater with 800mm irrigation rate compared to others.
Fig. 1. Mean value of dry biomass yield of the alfalfa and sugarbeet root irrigated with AWW, MWW and TW.
a) Alfalfa b) Sugarbeet root
Fig. 2. Production of CH4 by anaerobic digestion of fresh biomass from alfalfa and sugarbeet root irrigated with AWW, MWW and TW. CONCLUSIONS AWW is a good source of nutrient input during land application. Non-food crops such as energy crops can be grown irrigating with AWW in field. And methane production is high in crops irrigated with AWW. REFERENCES Lewandowski, I., Kicherer, A. & Vonier, P. (1995) CO2-balance for the cultivation and
combustion of Miscanthus. Biom. and Bioen., 8:81-90. Mckendry, P. (2002) Energy production from biomass (part 2): conversion technologies. Bior.
tec., 83:47-54.
96
Table of Contentsfor this manuscript

ENHANCED REMOVAL OF ANTIBIOTICS AND HERBICIDES FROM AQUEOUS MEDIA USING WOOD BASED COLLOIDAL BIOCHAR
Meththika Vithanage1, Sammani Ramanayaka1, Yohan Jayawardhana2,
Heshan Galagedara2, Athula Wijayasinghe2, Yong Sik Ok3
1Ecosphere Resilience Research Center, Faculty of Applied Sciences, University of Sri Jayewardenepura, Nugegoda 10250, SRI LANKA
2National Institute of Fundamental Studies, Hantana Road, Kandy 20000, SRI LANKA 3Korea Biochar Research Center, O-Jeong Eco-Resilience Institute (OJERI) &
Division of Environmental Science & Ecological Engineering, Korea University, KOREA [email protected]
INTRODUCTION Emerging contaminants (ECs) in aquatic environments has received recent attention due to their ecological toxicity. Therefore, various research work has been conducted to prepare materials with a potential of removing ECs such as antibiotics from aqueous media. Among various materials such as clay, activated carbon, zeolite, biochar received recent attention due to its carbon negativity and excellent adsorbent capacity for various pollutants (Ahmad et al., 2014). Antibiotics and herbicides have been being paid consideration due to its presence in water as conventional wastewater treatment plants are incapable of removing them from wastewaters, due to the origin of antibiotic-resistant microorganisms and carcinogenicity (Gogoi et al., 2018). Biochar has been promising in removing various antibiotics and herbicides including oxytetracycline, one of the extensively used medications in the veterinary industry and glyphosate, the widely used herbicide in agriculture worldwide (Mayakaduwa et al., 2016, Vithanage et al., 2014). Although biochar has been widely researched for antibiotic and herbicide retention, the capacities still remain less than that of the nanomaterials. Simultaneously, researches on colloidal biochar where inherent properties of the nanometer-sized particles may increase the adsorption capacity, are lacking. Hence, the objective of this study was to prepare colloidal biochar (CBC) from bioenergy waste derived biochar through mechanized grinding and apply for the removal of Oxytetracycline Hydrochloride (OTC) and Glyphosate from aqueous media. METHODS Biochar was mixed with ethanol and mechanically ground using a ball mill for 6 hrs around 5000 rpm with 30 minutes intervals for every 1.5 hrs. Resulted CBC was characterized by using Scanning Electron Microscopy (SEM), Fourier transforms infrared spectroscopy (FTIR) and Nanoscale Particle Size Analyzer. Adsorption experiments were conducted in various environmental conditions; the effect of pH (3-9) and the adsorbate dosage from 10-500 mg//L. Experiments were conducted at 1 g/L CBC dosage. The resultants were analyzed by using UV/Vis spectrophotometer at the wavelength of 354 nm and 570 nm after 12 hrs of reaction time for OTC and glyphosate respectively. RESULTS AND DISCUSSION The average particle size of colloidal biochar was given as 15 – 400 nm whereas the SEM images indicated round shaped structure with porous morphology. FTIR spectrum indicated intense peaks at the fingerprint area is accountable due to the presence of aromatics (1650 cm-1) and the presence of C-H bending at 1000 cm-1 which confirmed further the aromaticity in the biochar. Edge experiments indicated that the OTC adsorption was pH dependant where glyphosate adsorption was shown no pH dependency (Figure 1). Since OTC shows speciation based upon the pH of the media, where zwitterion is prominent (pH 3.5-7.0), adsorption was apparent. The maximum adsorption of OTC was observed from pH 4.5 to 6 where the
M26a
Copyright © CRC CARE Pty. Ltd., 2019
CleanUp Conference 2019Adelaide, Australia
8 –12 September 201997
Table of Contentsfor this manuscript

cationic form of zwitterion may have had non-specific adsorption through electrostatic interactions. Both OTC and glyphosate indicated >75% removal during the experiments at best solution pHs.
Fig. 1. Edge experiments for Oxytetracycline and Glyphosate with colloidal biochar in the pH range of 3 to 10. Dosage of colloidal biochar was kept as 1 g/L with an initial concentration of oxytetracycline and glyphosate at 25 mg/L. CONCLUSIONS Colloidal carbon or biochar was prepared from bioenergy waste derived biochar through mechanized grinding and applied for the removal of Oxytetracycline Hydrochloride (OTC) and the herbicide glyphosate. Both OTC and glyphosate showed the best removal capacity of 16.2 mg/g at the best solution pH. The results indicate that the colloidal biochar produced by mechanized technique has been promising for the removal of emerging contaminants from aqueous media. REFERENCES Ahmad, M., Rajapaksha, A. U., Lim, J. E., Zhang, M., Bolan, N., Mohan, D., Vithanage, M.,
Lee, S. S. & Ok, Y. S. 2014. Biochar as a sorbent for contaminant management in soil and water: A review. Chemosphere, 99, 19-33.
Gogoi, A., Mazumder, P., Tyagi, V. K., Tushara Chaminda, G. G., An, A. K. & Kumar, M. 2018. Occurrence and fate of emerging contaminants in water environment: A review. Groundwater for Sustainable Development, 6, 169-180.
Mayakaduwa, S. S., Kumarathilaka, P., Herath, I., Ahmad, M., Al-Wabel, M., Ok, Y. S., Usman, A., Abduljabbar, A. & Vithanage, M. 2016. Equilibrium and kinetic mechanisms of woody biochar on aqueous glyphosate removal. Chemosphere, 144, 2516-2521.
Vithanage, M., Rajapaksha, A. U., Tang, X., Thiele-Bruhn, S., Kim, K. H., Lee, S.-E. & Ok, Y. S. 2014. Sorption and transport of sulfamethazine in agricultural soils amended with invasive-plant-derived biochar. Journal of Environmental Management, 141, 95-103.
98
Table of Contentsfor this manuscript

WASTES TO RESOURCES: BIOCHAR APPLICATION MODULATES SOIL HEALTH AND FERTILITY
Nanthi Bolan
Global Centre for Environmental Remediation, University of Newcastle, NSW, AUSTRALIA
INTRODUCTION With increasing human population and decreasing available land for cultivation, food security is becoming a critical issue in many countries. Food security can be achieved by increasing the yield potential of crops, and by improving the soil health and productivity. Soil health and fertility continue to decline in many parts of the world mainly because of nutrient and carbon mining, poor water management and soil erosion. Soil health, as measured by the physical, chemical, and biological characteristics of soil, determines the yield potential of many crops and other ecosystem services. Biochar, produced from various organic resources is resistant to decomposition, and is used to store carbon in soil. Biochar application also improves soil health, thereby increasing biomass production and carbon sequestration (Novak et al., 2016). MATERIALS AND METHODS This paper will review the literature for the influence of biochar application on soil physical, chemical, and biological fertility, and present the results of a meta-analysis of these data from publications. Statistical meta-analytical methods have been developed for quantitative analysis of research results from multiple independent experiments. A treatment effect size estimator commonly employed in meta-analysis is the magnitude of an experimental treatment (i.e., with biochar application) mean, relative to the control treatment (i.e., without biochar application) mean. A typical effect size metric is the response ratio or the relative impact on a measured parameter (e.g., soil bulk density) following biochar application compared to that in control treatment without biochar application. RESULTS AND DISCUSSION Meta-analysis indicated that biochar application modulate many physical, chemical, and biological properties of soils, and the extent of biochar-induced changes depend on the nature and level of biochar application, and soil type (Figure 1). This paper will also cover a number of variables (i.e., biochar and soil properties, and climatic factors) on soil properties, thereby developing a generalised model for the utilization of biochar to increase soil fertility and sustainability.
Figure 1. Meta-analysis of the value of biochar on physical, chemical and biological properties of soil.
M26b
Copyright © CRC CARE Pty. Ltd., 2019
CleanUp Conference 2019Adelaide, Australia
8 –12 September 201999
Table of Contentsfor this manuscript

CONCLUSION Biochar application has shown to enhance the physical, chemical and biological properties of soils, thereby improving the overall soil health and productivity. REFERENCES Novak, J., Ro, K., Ok, Y. S., Sigua, G., Spokas, K., Uchimiya, S., & Bolan, N. (2016). Bio-
chars multifunctional role as a novel technology in the agricultural, environmental, and industrial sectors. Chemosphere, 142, 1-3.
100
Table of Contentsfor this manuscript

ZIRCONIUM-MODIFIED BIOCHAR FOR THE REMOVAL OF ARSENIC(V) FROM AQUEOUS SOLUTION
Md. Aminur Rahman1,2, Dane Lamb1, Mohammad Mahmudur Rahman1, Peter Sanderson1,
Md. Mezbaul Bahar1, Md. Zahangir Hossain1, Ravi Naidu1
1Global Centre for Environmental Remediation (GCER), The University of Newcastle,
Callaghan, NSW 2308, AUSTRALIA 2Department of Public Health Engineering (DPHE), Zonal Lab, Khulna 9100, BANGLADESH
INTRODUCTION Arsenic (As), a class I toxic metal(loid) is ubiquitous in the environment and has been recognized as human carcinogen (IARC, 2004). Arsenic contamination in groundwater and surface water has become a major environmental problem worldwide (Naidu et al. 2006). Many As-contaminated sites have been reported around the world due to anthropogenic activities, especially poorly managed discharge from mining and metallurgical industries, combustion of fossil fuels, unregulated application of As-containing pesticides, herbicides and crop desiccants (Niazi et al. 2018). Biochar is an emerging and low-cost potential sorbent for environmental contaminants especially As removal from contaminated water. Biochar (BC) can be produced from a wide variety of agricultural residues, plants, urban, and industrial wastes, which has attracted significant attention for their potential application in waste-water treatment (Shimabuku et al. 2016). In this study, a zirconium-biosolid biochar (Zr-BSBC) composite has been synthesized and used to evaluate arsenate (As(V)) adsorption efficiency from aqueous solution. The effects of various experimental conditions, such as solution pH, contact time, initial concentration, adsorbate dosage, effect of temperature and coexisting anions on As(V) adsorption were investigated. METHODS Stock solution of 1000 mg L-1 As(V), was prepared by dissolving sodium arsenate dibasic heptahydrate in MQ water. The required concentrations for working solutions were obtained through diluting the As(V) stock solutions. Biochar was produced from biosolid by slow pyrolysis at 300 °C for 30 min, under oxygen free nitrogen atmosphere (Vithanage et al. 2015). Biosolid biochar (BSBC) was modified with 0.1 M zirconium chloride solution (solid: solution ratio = 1:10) by continuous stirring for 12 hours. The pH of the suspension was neutralized to 7.0 by drop-wise addition of 0.1 M NaOH or 0.1 M HNO3. Finally, the biochar composites were centrifuged at 5000 rpm for 20 min, filtered (0.22 µm) and dried at 80 °C for 12 h. The modified Zr-BSBC was kept in a desiccator for further experiments. Kinetic adsorption experiments were performed to assess As(V) sorption by the adsorbents as a function of reaction time. To evaluate the maximum adsorption capacity of BSBC and Zr-BSBC, isotherms were determined with As(V) concentration between 1.0 and 100 mg/L, and the adsorption were terminated after 24 h. The effect of pH on As(V) adsorption was determined at pH range 2–10. The adsorption thermodynamics were examined at varying temperatures of 4, 15, 20, 25, 30 and 37 °C. All batch sorption experiments were conducted in sealed 50 mL centrifuge tube (at room temperature (25±1 °C). Biochar Characterization The cation exchange capacity of solids were determined by BaCl2 compulsive exchange modified method (Gillman and Sumpter 1986). Specific surface area of biochar samples (<2 mm) were measured with nitrogen adsorption isotherms at liquid nitrogen temperature (-196 °C) by a Surface Area Analyzer (Micromeritics Tristar II, USA). The carbon, nitrogen and sulfur contents (wt %) of biochars (<150 µm) were measured by a CNS analyzer. Fourier transform infrared (FT-IR) spectra were recorded (using a Nicolet IS10, Agilent technologies, Cary 600 Series) to identify the surface functional groups of biochar samples.
M26c
Copyright © CRC CARE Pty. Ltd., 2019
CleanUp Conference 2019Adelaide, Australia
8 –12 September 2019101
Table of Contentsfor this manuscript
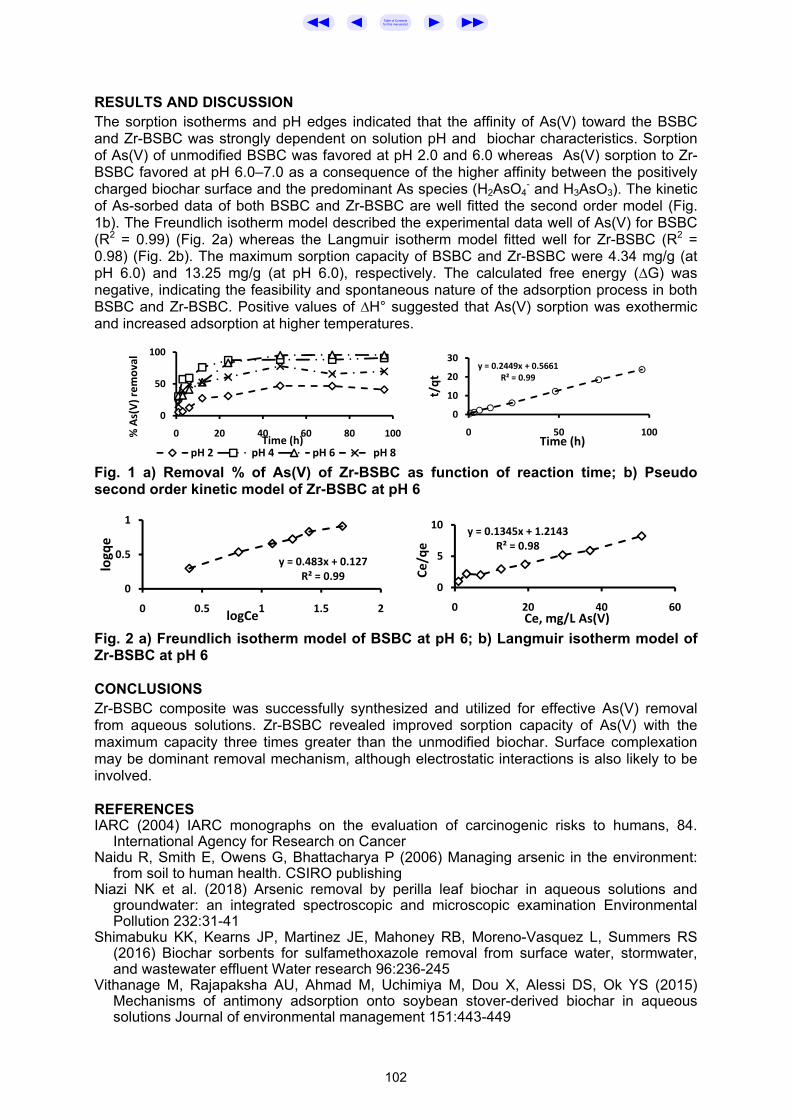
RESULTS AND DISCUSSION The sorption isotherms and pH edges indicated that the affinity of As(V) toward the BSBC and Zr-BSBC was strongly dependent on solution pH and biochar characteristics. Sorption of As(V) of unmodified BSBC was favored at pH 2.0 and 6.0 whereas As(V) sorption to Zr-BSBC favored at pH 6.0–7.0 as a consequence of the higher affinity between the positively charged biochar surface and the predominant As species (H2AsO4
- and H3AsO3). The kinetic of As-sorbed data of both BSBC and Zr-BSBC are well fitted the second order model (Fig. 1b). The Freundlich isotherm model described the experimental data well of As(V) for BSBC (R2 = 0.99) (Fig. 2a) whereas the Langmuir isotherm model fitted well for Zr-BSBC (R2 = 0.98) (Fig. 2b). The maximum sorption capacity of BSBC and Zr-BSBC were 4.34 mg/g (at pH 6.0) and 13.25 mg/g (at pH 6.0), respectively. The calculated free energy (∆G) was negative, indicating the feasibility and spontaneous nature of the adsorption process in both BSBC and Zr-BSBC. Positive values of ∆H° suggested that As(V) sorption was exothermic and increased adsorption at higher temperatures.
Fig. 1 a) Removal % of As(V) of Zr-BSBC as function of reaction time; b) Pseudo second order kinetic model of Zr-BSBC at pH 6
Fig. 2 a) Freundlich isotherm model of BSBC at pH 6; b) Langmuir isotherm model of Zr-BSBC at pH 6 CONCLUSIONS Zr-BSBC composite was successfully synthesized and utilized for effective As(V) removal from aqueous solutions. Zr-BSBC revealed improved sorption capacity of As(V) with the maximum capacity three times greater than the unmodified biochar. Surface complexation may be dominant removal mechanism, although electrostatic interactions is also likely to be involved. REFERENCES IARC (2004) IARC monographs on the evaluation of carcinogenic risks to humans, 84.
International Agency for Research on Cancer Naidu R, Smith E, Owens G, Bhattacharya P (2006) Managing arsenic in the environment:
from soil to human health. CSIRO publishing Niazi NK et al. (2018) Arsenic removal by perilla leaf biochar in aqueous solutions and
groundwater: an integrated spectroscopic and microscopic examination Environmental Pollution 232:31-41
Shimabuku KK, Kearns JP, Martinez JE, Mahoney RB, Moreno-Vasquez L, Summers RS (2016) Biochar sorbents for sulfamethoxazole removal from surface water, stormwater, and wastewater effluent Water research 96:236-245
Vithanage M, Rajapaksha AU, Ahmad M, Uchimiya M, Dou X, Alessi DS, Ok YS (2015) Mechanisms of antimony adsorption onto soybean stover-derived biochar in aqueous solutions Journal of environmental management 151:443-449
0
50
100
0 20 40 60 80 100% A
s(V
) rem
oval
Time (h)pH 2 pH 4 pH 6 pH 8
y = 0.2449x + 0.5661R² = 0.99
0
10
20
30
0 50 100t/
qtTime (h)
y = 0.483x + 0.127R² = 0.99
0
0.5
1
0 0.5 1 1.5 2
logq
e
logCe
y = 0.1345x + 1.2143R² = 0.98
0
5
10
0 20 40 60
Ce/q
e
Ce, mg/L As(V)
102
Table of Contentsfor this manuscript

PRODUCTION AND CHARACTERISATION OF NUTRIENT-ENRICHED BIOCHAR
Md. Zahangir Hossain1,3, Mezbaul Bahar1, Binoy Sarkar4,5, Scott W. Donne2, Dane Lamb1,
Nanthi S. Bolan1,6
1Global Centre for Environmental Remediation, University of Newcastle,
Callaghan, NSW 2308, AUSTRALIA 2School of Environmental and Life Sciences (Chemistry), University of Newcastle,
Callaghan, NSW 2308, AUSTRALIA 3Agrotechnology Discipline, Khulna University, Khulna-9208, BANGLADESH
4Leverhulme Centre for Climate Change Mitigation, Department of Animal and Plant Sciences, The University of Sheffield, Western Bank, Sheffield S10 2TN, UK
5Future Industries Institute, University of South Australia, Mawson Lakes, SA 5095, AUSTRALIA
6Program 3 (New Products) of Soil CRC, University of Newcastle, Callaghan, NSW 2308, AUSTRALIA [email protected]
INTRODUCTION Biochar and charcoal have been synonymously used but can be differentiated by their use, because charcoal is used for energy, whereas biochar has environmental implications including carbon sequestration. They are generally produced through pyrolysis process of different types of biomass under anaerobic or slightly aerobic conditions at <700 °C temperature. Biochar is a stable grained porous material which contains ash, C, H, S, P, O, N and significant amount of trace elements. Biochar promotes the stability of macro- and micro-aggregates, porosity, improves water retention and reduces bulk density in soil (Ralebitso-Senior et. al., 2016; Coomes & Miltner, 2017). Biochar can also boost the soil microbial biomass C and influence the shift in bacterial community towards low C turnover bacterial taxa. Biochar-induced nutrient release to soil can be sustained by the modification of biochar in different way. The modification can be done by altering the porosity, surface characteristics and functional groups. Several technologies have been developed to modify biochar such as surface oxidation and impregnation, ammonification, pelleting and organo-mineral complex, thermal plasma process, grafting and soaking etc. (Igalavithana et al., 2018). Modified biochar may have potential to be used as an effective slow-release fertiliser (Wen et al., 2017). The aim of this study is to synthesise and characterise nutrient-enriched biochars derived from selected feedstocks of manures and biosolid. METHODS Based on nutrient content five biochars were selected from the previous study. These are cow manure, chicken manure, chicken litter, horse manure and biosolid biochar. The selected biochars will be produced by mixing the feedstock and chemical fertiliser before pyrolysing. The pre-pyrolysing mixing will be performed at different ratios based on expected nutrient enrichment of these biochars. For biochar production all feedstocks will be ground with mortar and pestle and sieved to particle size <2 mm, and then stored in labelled air-tight plastic bags separately. Biochars will be produced from the feedstocks by slow pyrolysis in a muffle furnace (Labec muffle furnace, CEMLS-SD, Australia) at 300 ºC temperature under limited oxygen environment. After reaching the target temperature, the samples will be kept in the operating furnace for 2 hours (residence time). The furnace will be left over-night to cool down the temperature goes below 50 °C. Then the biochars will be removed from the furnace, cooled in a desiccator, weighted and stored in airtight plastic containers with proper labelling. The elemental C, N and S of the biochars will be analysed by dry combustion method in an elemental analyser. The total P, K, Ca, Mg and other trace elements were
M26d
Copyright © CRC CARE Pty. Ltd., 2019
CleanUp Conference 2019Adelaide, Australia
8 –12 September 2019103
Table of Contentsfor this manuscript
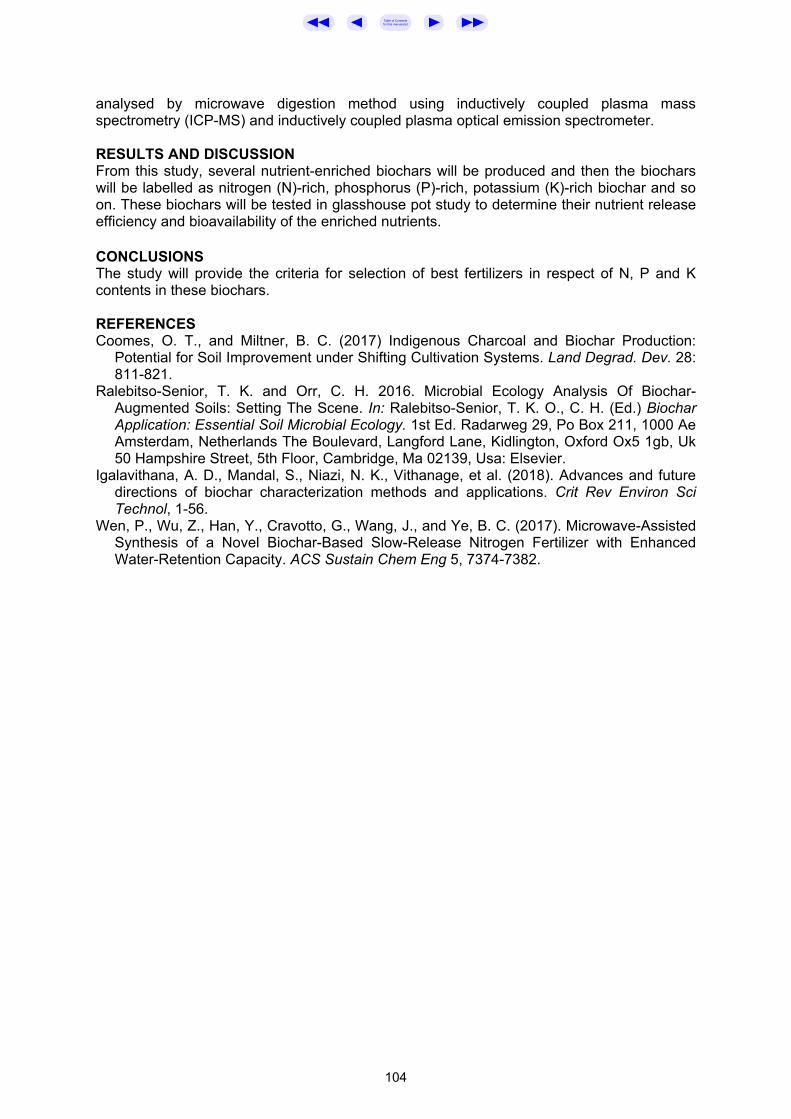
analysed by microwave digestion method using inductively coupled plasma mass spectrometry (ICP-MS) and inductively coupled plasma optical emission spectrometer. RESULTS AND DISCUSSION From this study, several nutrient-enriched biochars will be produced and then the biochars will be labelled as nitrogen (N)-rich, phosphorus (P)-rich, potassium (K)-rich biochar and so on. These biochars will be tested in glasshouse pot study to determine their nutrient release efficiency and bioavailability of the enriched nutrients. CONCLUSIONS The study will provide the criteria for selection of best fertilizers in respect of N, P and K contents in these biochars. REFERENCES Coomes, O. T., and Miltner, B. C. (2017) Indigenous Charcoal and Biochar Production:
Potential for Soil Improvement under Shifting Cultivation Systems. Land Degrad. Dev. 28: 811-821.
Ralebitso-Senior, T. K. and Orr, C. H. 2016. Microbial Ecology Analysis Of Biochar-Augmented Soils: Setting The Scene. In: Ralebitso-Senior, T. K. O., C. H. (Ed.) Biochar Application: Essential Soil Microbial Ecology. 1st Ed. Radarweg 29, Po Box 211, 1000 Ae Amsterdam, Netherlands The Boulevard, Langford Lane, Kidlington, Oxford Ox5 1gb, Uk 50 Hampshire Street, 5th Floor, Cambridge, Ma 02139, Usa: Elsevier.
Igalavithana, A. D., Mandal, S., Niazi, N. K., Vithanage, et al. (2018). Advances and future directions of biochar characterization methods and applications. Crit Rev Environ Sci Technol, 1-56.
Wen, P., Wu, Z., Han, Y., Cravotto, G., Wang, J., and Ye, B. C. (2017). Microwave-Assisted Synthesis of a Novel Biochar-Based Slow-Release Nitrogen Fertilizer with Enhanced Water-Retention Capacity. ACS Sustain Chem Eng 5, 7374-7382.
104
Table of Contentsfor this manuscript

PERFLUOROOCTYL SULFONATE (PFOS) ADSORPTION BY MODIFIED SAWDUST, REDMUD, AND RED MUD-SAWDUST
COMPOSITE MATERIALS FROM AQUEOUS SOLUTION
Masud Hassan1,2, Yanju Liu1,2, Ravi Naidu1,2, Jianhua Du1,2
1GCER, The University of Newcastle, University Drive, NSW 2308, AUSTRALIA 2CRC CARE, The University of Newcastle, NSW 2308, AUSTRALIA
[email protected] INTRODUCTION Perfluorooctyl sulfonate (PFOS) is a persistent organic contaminant that has received extensive scientific attention in recent years (Hekster et al., 2003). Due to its high toxicity, and bioaccumulation and biomagnification properties, the presence of PFOS in the aquatic environment can pose detrimental effects to human health and ecological systems (Ghisi et al., 2019, Jian et al., 2017). It has been reported that around 6 billion peoples in the US and 3.6 billion peoples in Sweden are exposed to PFOS that are exceeding lifetime dietary intake limit (Hu et al., 2016, Banzhaf et al., 2017). The sources of PFOS release including paper, textile, electrical industries, and firefighting foams (Zareitalabad et al., 2013, Tsai et al., 2002). The PFOS remediation is challenging using conventional techniques including oxidation, reduction, precipitation, biological degradation and photo-degradation due to its properties, cost, time and secondary wastes. However, adsorption is a promising, economical, and effective method for remediation of PFOS (Vecitis et al., 2009). The surface functional groups and pore structure of adsorbents are reported to play essential roles in the adsorption of PFOS. Sorption of PFOS through hydrophobic and electrostatic interactions are reported in the literature. For example, the char adsorbed PFOS by electrostatic interaction whereas CNTs (carbon nanotubes) adsorbed PFOS mainly by hydrophobic interaction (Deng et al., 2012). Alumina is also used for PFOS adsorption through electrostatic interaction that largely depends on the pH of the solution(Wang and Shih, 2011). Due to the hydrophobic and oleophobic properties of PFOS molecular, PFOS would have different adsorption behaviour compared to other hydrocarbon compounds (Du et al., 2014). Most researchers believe the involvement of hydrophobic interaction in the adsorption of PFOS on some adsorbents with hydrophobic moiety. However, the hydrophobic difference between conventional hydrocarbon compounds and PFOS requires further study (Lu et al., 2016). In this study, we aim to understand the potential application of biochar derived from sawdust, red mud, and red mud modified biochar for sorption of PFOS, including investigations on their isotherm, kinetic, pH, and adsorption mechanism. MATERIALS AND METHODS
was controlled around 100 ml min−1 in the tube furnace, and the temperature was programmed to increase at 10°C min−1. Characterization method The sorbents was characterized using the elemental analyzer, surface area analyzer, zeta potential meter, scanning electron microscope (SEM), X-ray powder diffraction (XRD),
PFOS (>98% purity) were purchased from Sigma-Aldrich Co. The raw red mud (RRM) sample was collected from Rio Tinto Alcan Yarwun refinery, Australia. The sample was air dried and sieved to <1 mm before any treatment. Sawdust (SD) raw material was collected from Palletco SA. After washing and drying, the sawdust samples were pyrolyzed at 600 °C under nitrogen environment. A portion of red mud was mixed with SD at 3:2 (weight ratio) and ground in a ball mill at 40 Hz for 30 min for adequate mixing. The particles of the mixture were <1 mm after grinding. The mixture was incubated with water (1:5 weight [g] to volume [ml]) for 24 days. The solid part obtained after centrifugation (3452g for 30 min) was calcinated in a tube furnace at 600°C for 2 h and labelled RMSDN600. The nitrogen flow rate
M26e
Copyright © CRC CARE Pty. Ltd., 2019
CleanUp Conference 2019Adelaide, Australia
8 –12 September 2019105
Table of Contentsfor this manuscript

Fourier-transform infrared spectroscopy (FTIR). The surface area was measured utilizing N2 sorption on a NOVA 1200 analyzer and calculated via the Brunauer–Emmett–Teller (BET) theory. Sorption experiment The sorption isotherm was conducted at different concentrations ranging from 0.1 ppm to 200 ppm mg L−1 at 25 °C and constant pH. The solution pH was adjusted with 0.1 M NaOH or HCl solution. Different time interval ranges from 0.5 h to 48 h were used for kinetic study at 50 mg/L of PFOS concentration at constant pH and temperatures. After the sorption isotherm and kinetic experiments, the final solution pH was determined. All experiments were conducted in duplicates, and the average value was reported. RESULTS AND DISCUSSION Characterization of adsorbent The surface area of RMN600, SDN600, and RMSDN600 are 24.96, 395.51 and 120.65 m2/g respectively. The surface area of SDN, RMSDN are increased with the increasing pyrolysis temperature, whereas for redmud the relationship is insignificant. Redmud-sawdust additive contains Boehmite, Hematite, Magnetite, Carbonate, and other organic components (fig 1d). The RMSDN contains diverse functional group than RMN (fig 1e & 1f). The details characterization and properties of adsorbents were published in our previous study (Liu et al., 2016).
Fig 1: a) SEM image of biochar derived from sawdust pyrolysis at 600 °C (b) SEM image of redmud (c) SEM image of sawdust-redmud additive (d) XRD pattern for redmud and redmud-sawdust additive (e) FTIR spectra for redmud and (f) FTIR spectra for redmud-sawdust additive materials. PFOS adsorption study The PFOS sorption kinetic study indicated equilibration by 48 hours, and the kinetics were fitted with pseudo first and second order models. The fitting could reveal the physicochemical interaction between PFOS and sorbents used. Further results on adsorption kinetics, isotherm, and influences of pH will be completed before the conferences and reported accordingly. REFERENCES (SELECTED) DU, Z., DENG, S., BEI, Y., HUANG, Q., WANG, B., HUANG, J. & YU, G. 2014. Adsorption
behavior and mechanism of perfluorinated compounds on various adsorbents—A review. Journal of Hazardous Materials, 274, 443-454.
HEKSTER, F. M., LAANE, R. W. & DE VOOGT, P. 2003. Environmental and toxicity effects of perfluoroalkylated substances. Reviews of Environmental Contamination and Toxicology. Springer.
LIU, Y., NAIDU, R., MING, H., DHARMARAJAN, R. & DU, J. 2016. Effects of thermal treatments on the characterisation and utilisation of red mud with sawdust additive. Waste Management & Research, 34, 518-526.
LU, X., DENG, S., WANG, B., HUANG, J., WANG, Y. & YU, G. 2016. Adsorption behavior and mechanism of perfluorooctane sulfonate on nanosized inorganic oxides. Journal of colloid and interface science, 474, 199-205.
106
Table of Contentsfor this manuscript

HIERARCHICAL IMMOBILIZATION OF NZVI ONTO ELECTROSPUN PVA-PAA NANOFIBER MEMBRANE FOR
GROUNDWATER REMEDIATION
Jiawei Ren*, Leonard D. Tijing, Ho Kyong Shon
Centre for Technology in Water and Wastewater, School of Civil and Environmental Engineering, University of Technology Sydney, P.O. Box 123, 15 Broadway, NSW 2007,
AUSTRALIA *[email protected]
INTRODUCTION Nanoscale zero-valent iron particles (nZVI), with its high reactivity towards a broad range of contaminants, has been a promising technology widely studied in groundwater remediation. However, nZVI agglomeration and its difficulty of recycle are the main restrictions for its application in groundwater remediation. In this study, a hierarchical immobilization method is put forward to immobilize nZVI nanopartilces onto electrospun membrane to protect nZVI from aggregation and oxidation. Specifically, a functionalized membrane was dip-coated into Fe(III) and Polyacrylic acid (PAA) solutions respectively and repeatedly to get more Fe(III) ions which are used for the synthesis of nZVI. The aim of this study is to obtain membranes with highly-loaded nZVI particles for heavy metal removal and recycle. METHODS In this study, PAA (Mw=450,000, 11.5wt% in a mixed solvent of ethanol: water=4:1) and PVA (Mw=85,000-124,000, 3.5w% in DI water) blended solutions were prepared for membrane electrospinning. The applied voltage, flow rate and TCD of electrospinning were 17.5 kV, and 15 cm. The as-spun PAA/PVA nanofiber membranes were first cross-linked by thermal treatment in an oven at 120°C for 8 hrs to make them water-stable. As is shown in Fig.1, the thermally cross-linked membranes were soaked in 0.2M Fe(III) solution to obtain PVA-PAA-Fe(III) membrane. In order to increase the amount of complexed Fe(III) for nZVI reduction, the PVA-PAA-Fe(III) were in turn dip-coated into 0.1 wt% PAA and 0.2 M Fe(III) solution as crosslinkers for each other to obtain a layer-by-layer structure. The dip-coating cycle varies from 0 to 3 cycles. Membranes with different dip-coating cycles were respectively reduced by 1 mol/L NaBH4 solution in an anaerobic chamber (filled with nitrogen gas) to form nZVI particles. After 10 mins reaction, nZVI-loaded membranes with different dip-coating cycles (DC-0-nZVI, DC-1-nZVI, DC-2-nZVI and DC-3-nZVI) were prepared well. The four nZVI membranes were used to test the removal of Cd(II) by gravity-driven membrane filtration (GDMF) process.
Figure 1. SEM images and nZVI particle size distribution of (a) DC-0-nZVI, (b) DC-1-nZVI, (c) DC-2-nZVI and (d) DC-3-nZVI
M26f
Copyright © CRC CARE Pty. Ltd., 2019
CleanUp Conference 2019Adelaide, Australia
8 –12 September 2019107
Table of Contentsfor this manuscript

RESULTS AND DISCUSSION As shown in Fig. 2, we successfully immobilized nZVI onto all the electrospun nanofiber membrane. DC-0-nZVI (Fig. 2a) without further dip-coating cycles immobilized only 29.3 wt% nZVI particles on the membrane surface. In contrast, with the increase of dip-coating cycles, the amount of nZVI particles immobilized increased significantly. DC-1-nZVI (Fig. 2b), DC-2-nZVI (Fig. 2c) and DC-3-nZVI (Fig. 2d) respectively immobilized 32.8 wt%, 44.1 wt% and 56.4 wt%. In terms of the distribution, nZVI particles were mainly immobilized on the fiber surface of DC-0-nZVI and DC-1-nZVI. On the other hand, nZVI particles on DC-2-nZVI and DC-3-nZVI were more off-fiber, i.e. in the voids among fibers. Briefly, the introduction of layer-by-layer structure had a positive effect on the immobilization of nZVI particles.
Figure 2. SEM images of (a) DC-0-nZVI, (b) DC-1-nZVI, (c) DC-2-nZVI and (d) DC-3-nZVI
91 94.5 99.05 97.4
0102030405060708090
100
DC-3-nZVIDC-2-nZVIDC-1-nZVI
Rem
oval
(%)
DC-0-nZVI Figure 3. Performance of Cd(II) removal by (a) DC-0-nZVI, (b) DC-1-nZVI, (c) DC-2-nZVI and (d) DC-3-nZVI In Fig. 3, DC-2-nZVI had the highest Cd(II) removal at 99.05% due to more nZVI immobilized than DC-0-nZVI, DC-1-nZVI. Although DC-3-nZVI immobilized the most amount of nZVI (56.4 wt%), it excess nZVI particles blocked the voids of membrane and led the raw water to be filtrated through the voids without nZVI particles, thereby reducing removal slightly. Briefly, DC-2-nZVI with the a better nZVI immobilization and a less dip-coating procedure than DC-3-nZVI had the best performance in Cd(II) removal. CONCLUSIONS This hierarchical immobilization method successfully loaded more nZVI particle on membrane surface and the nZVI membranes had excellent performance in removing Cd(II).
(a) (b)
(c) (d)
108
Table of Contentsfor this manuscript

TCE BEHAVIOUR IN THE ADELAIDE PLAINS
Mark Chapman, Tony Paparella
AECOM, Level 28, 91 King William Street, Adelaide, 5000, AUSTRALIA mark.chapman, [email protected]
INTRODUCTION Groundwater investigations initially focussed on petroleum hydrocarbon impacts at a service station in Mansfield Park, SA, also found trichloroethene (TCE). Subsequent investigations found more than 1 mg/L of TCE in groundwater about 3 m below ground on the western portion of the service station site and down-gradient to the northwest. Several phases of environmental assessment followed including TCE delineation in groundwater, additional site history for the site and surrounds, soil vapour investigations and risk assessment. However, the source of the TCE remained uncertain, as the site had been concrete sealed with no known use of TCE for at least the past 30 years. Temporal trend analysis identified relatively rapid decreasing TCE concentration trends in the on-site wells. This observed decline was unusual for TCE plumes in the Adelaide Plains, where legacy TCE sites have generally been relatively stable in the aerobic Quaternary aquifers. METHODS In addition to traditional groundwater well installation, sampling and testing, the site assessment program incorporated the use of: • nested soil vapour bores to attempt to distinguish vadose zone from groundwater sources
via vertical concentration profiles • sampling of stratified groundwater samples for comparison to the bulk groundwater and
adjacent soil vapour data • compound specific isotope analysis (CSIA) of groundwater samples • saturated zone modelling of TCE migration to attempt to calibrate observed concentration
trends and thereby help identify source location and release dates. RESULTS AND DISCUSSION • The site history concluded that TCE was likely historically used for degreasing purposes
when a workshop/mechanics operated at the site pre-1985. • Following concrete sealing of the site post-1985, rainwater infiltration through the vadose
zone would have been effectively stopped and any residual TCE within the vadose zone soils (from historic disposal) likely then remained relatively immobile.
• In September 2010, tank excavation works at the site included installation of new tanks in a new tank pit on the eastern side of the site. Following removal of the existing tanks in the central portion of the site, this large (10 m x 15 m) excavation was filled to near ground surface with groundwater from the de-watered new tank pit excavation.
• It is inferred that this water management resulted in the generation of a 3 m high groundwater mound in this central western portion of the site, around the old tank pit/building. This process likely then mobilised residual TCE present in vadose zone soils, nearby to the tank pit, beneath the concrete surface.
• This is inferred to have led to a moving plume, in the process of dislocating from the site. Concentrations on-site are declining with half-lives of approximately two to three years, while wells down-gradient of the site are increasing in concentration.
• Soil vapour data, CSIA and vertically stratified groundwater concentration data are all consistent with this CSM.
ACKNOWLEDGEMENTS Thanks to Viva Energy Australia Pty Ltd for supporting this presentation of data.
M27a
Copyright © CRC CARE Pty. Ltd., 2019
CleanUp Conference 2019Adelaide, Australia
8 –12 September 2019109
Table of Contentsfor this manuscript

MULTI-STAGE FULL SCALE REMEDIATION OF HEAVILY IMPACTED VICTORIAN CHLORINATED SOLVENT SITE
Lyndon Bell1, Richard Fassbender2
1JBS&G Australia Pty Ltd, Level 2, 155 Queen Street, Melbourne, 3000, AUSTRALIA
2JBS&G Australia Pty Ltd, 100 Hutt Street, Adelaide, 5000, AUSTRALIA [email protected]
INTRODUCTION Following initial residential use in the mid-1940s, the confidential subject site was then developed for commercial use in stages, with laundry washing operations commencing in the mid-1960s, with additional dry-cleaning activities occurring from the early 1970s until circa 1995. Laundry activities subsequently ceased in late 2014, just prior to demolition of all above and below ground improvements to enable completion of full-scale soil and groundwater remedial works at the site, as discussed further below. Two underground storage tanks (USTs) previously containing diesel and petrol for refuelling vehicles were decommissioned in-situ in the early 1990s and were subsequently removed from the site in April 2013. The former dry-cleaning activities and former USTs at the Client’s site were identified by JBS&G as presenting the greatest potential risk of contamination, with the main contaminants of potential concern comprising:
• chlorinated hydrocarbons, specifically perchloroethylene (PCE) and its breakdown products (trichloroethylene (TCE), cis-1,2-dichloroethylene (cDCE) and vinyl chloride (VC));
• total recoverable hydrocarbons (TRH); and • benzene, toluene, ethylbenzene and xylenes (BTEX).
An extensive Environmental Site Assessment (ESA) program was completed by JBS&G to assess on-site and off-site impacts associated with former dry cleaning and fuel storage activities undertaken at the site. These impacts were delineated by JBS&G extending over 1 km from the subject site and discharging into a regional marine surface water body. The extent of off-site impacts were related to the significant levels of historical contamination identified at the site:
• Soil – up to 13,000 mg/kg of PCE; • Groundwater - up to 99 mg/L of PCE; and • Soil vapour – up to 112,000 mg/ m3 of PCE.
As outlined in this paper, following completion of remedial pilot trials, a full-scale multi-stage soil and groundwater remedial works program was able to be successfully achieved at the site by JBS&G, which culminated in Clean Up to the Extent Practicable (CUTEP) being determined by the Environment Protection Authority Victoria (EPA). All assessment and remedial works were completed under the auspices of a voluntary Environmental Audit process, consistent with the requirements of the Environment Protection Act 1970 (VIC). REMEDIATION METHODOLOGY AND RESULTS A summary of the remediation methodology undertaken at the site and the results achieved are summarised below and presented in more detail in the paper:
• Soil Excavation and Validation Works. Soil excavation and validation works that were completed at the site were aimed at restoring the protected beneficial uses of land in accordance with legislative requirements. Removal of identified contaminant impacts from PCE and its breakdown products TCE, cDCE and VC and TRH soil sources to below the derived site-specific risk-based remediation criteria, significantly reduced the mass of contaminants contributing to the groundwater plume and thereby limiting the continued off-site migration of the contaminants in groundwater. In addition, removal of the contaminated soils limited the future risks associated with the generation of soil vapour and intrusion into surface structures;
M27b
Copyright © CRC CARE Pty. Ltd., 2019
CleanUp Conference 2019Adelaide, Australia8 –12 September 2019 110
Table of Contentsfor this manuscript

• Soil Remediation Works. Soil remediation works were completed at the site which were aimed at reducing the contaminant concentrations using ex-situ soil vapour extraction (SVE) technologies in order to facilitate either on-site reuse or cost effective off-site disposal of the soils. Given the results obtained, the ex-situ treated soil was able to be retained on-site at the Client’s direction, re-spread and used to level the site during decommissioning and environmental make good works undertaken by JBS&G in preparation of the divestment of the property, as it was surplus to the Client’s future operational needs;
• Groundwater Remediation Works. Groundwater remediation works at the site were conducted in accordance with legislative requirements and involved the reduction of groundwater concentrations with the purpose of limiting the future risks associated with the generation of soil vapour intrusion both on-site and off-site. Pilot and then subsequently full scale implementation of multiple injection rounds of in situ chemical oxidation (ISCO) (Stage 1) and then enhanced in situ bioremediation (EISB) (Stage 2), including bioaugmentation to accelerate remediation efficacy, were successfully completed. This two stage full scale treatment program essentially depleted the remaining primary PCE contaminant to negligible concentrations. Similarly, breakdown products were depleted in the majority of monitored wells, with the exception of elevated cDCE and VC concentrations within the former primary source zone. Given the low concentrations of PCE and TCE, the breakdown products cDCE and VC were considered to be transitory and would continue to decline over time, as designed;
• Groundwater Remediation Contingency Measure. A subterranean gravity feed injection system with a holding volume of 2,500 L was also designed and constructed by JBS&G to allow future injection of substrate (to facilitate EISB) into the vadose zone and underlying Newer Volcanics Basalt (NVB) and Moorabool Viaduct Sands (MVS) aquifers at the site, if triggered as a post-remediation contingency measure;
• Post Remediation Soil Vapour Sampling. A targeted soil vapour assessment was conducted in February 2017 and repeated in March 2018, with all results reported to be below derived site-specific risk-based soil vapour assessment criteria, with the minor exception of vinyl chloride at one location within the former primary source zone in the March 2018 monitoring round. JBS&G concluded that given that groundwater within the former primary PCE source zone was continuing to attenuate, the presence of PCE breakdown products such as VC was not unexpected. Given that potential fugitive vapour emissions at the site would be managed regardless through the installation of a Vapour Risk Mitigation System (VRMS) at the request of the Environmental Auditor, the potential risks to on‐site receptors from residual contamination was assessed to be low and acceptable and would remain so as residual sub‐surface contamination fully attenuates, as designed.
CONCLUSIONS Soil and groundwater remediation of a former commercial laundry and dry cleaning site that was heavily impacted with PCE (and also TRH) was successfully undertaken by JBS&G within a timeframe of only 18 months. Approximately 800 tonnes of highly impacted soils were successfully excavated and treated on-site through volatilisation and off-gas treatment of the contaminant. Following treatment to below adopted site-specific risk based remediation criteria, the soils were able to be reused on-site, hence avoiding high off-site disposal costs. The maximum PCE contaminant concentration in groundwater was successfully reduced from 99 mg/L in the source zone area to less than 0.1 mg/L. This was achieved using a two stage full-scale ISCO and subsequent EISB using safe food grade chemicals. Site boundary groundwater PCE concentrations were also successfully reduced from between 5 and 15 mg/L to below laboratory detection limits. As a result, further off-site migration of the contaminant has been halted and following determination of CUTEP by EPA, the site is now able to be divested and redeveloped for future commercial/ industrial uses.
111
Table of Contentsfor this manuscript

SOURCE ZONE TREATMENT USING ENHANCED IN-SITU BIOREMEDIATION FOR CHLORINATED ETHENES
Paul Nicholson1, Julie Konzuk1, Ebru Onder2, Geoff Ellis2
1Geosyntec Consultants Pty Ltd, Sydney, NSW, 2010, AUSTRALIA
2Golder Associates Pty Ltd, Richmond, 3121, AUSTRALIA [email protected]
INTRODUCTION Enhanced In-Situ Bioremediation (EISB) as a source zone treatment technology for chlorinated solvents is becoming an increasingly accepted remedy in Australia. EISB consists of engineering the subsurface environment to the necessary conditions such that microorganisms degrade contaminants to non-toxic daughter products. Chlorinated volatile organic compounds (VOCs) such as tetrachloroethene (PCE) and trichloroethene (TCE) can be successfully degraded through cis-1,2-dichloroethene (cDCE) and vinyl chloride (VC) to ethene and ethane through anaerobic processes. The addition of carbon-based amendments and as necessary bioaugmentation of microbial cultures can enhance the natural degradation process. Some key factors to consider are the injection of amendments, monitoring for complete degradation, evaluating the potential for increased soil vapour concentrations, monitoring reductions in pH, and the presence of non-aqueous phase liquids (NAPLs). METHODS The presentation will discuss a case study at a site in Victoria where the successful design, construction and monitoring of an EISB remedy has been conducted in two source areas. The design of the EISB system in each source area incorporated extraction of groundwater, amendment of emulsified vegetable oil (EVO), and re-injection into wells under the footprint of an active facility. Bioaugmentation with a low-pH tolerant bioaugmentation culture was completed to enhance in-situ bioremediation and overcome microbial inhibition related to pH reductions in a poorly buffered aquifer. Sustainability objectives were met by using extracted groundwater for amendment additions saving over 2.5 Megalitres of potable water as well as maintaining hydraulic containment. Injections were successfully completed within a narrow plant shutdown period (5 days) to avoid shutdown of operations using 24-hour injections and an adaptive design approach that allowed for modifications “on the fly” to overcome injection rate limitations, incremental reductions in permeability, etc. RESULTS AND DISCUSSION Two years of post-injection monitoring data have shown reductions in total molar VOC concentrations in the first source area exceeding 95% within 18 months after injections. In the second source area where baseline TCE concentrations exceeded 50% of solubility limits, TCE reductions exceeding 75% of baseline (i.e., >350 mg/L) were achieved within 18 months. Not uncommon in source zone treatment, due to the degradation of the parent compounds, total molar VOC concentrations increased by nearly 1.5X, indicating successful enhancement of source mass treatment, which will proportionally reduce the lifespan of the source material. Transient reductions of pH were observed in both areas; however, bioaugmentation with a low-pH tolerant culture (SiREM’s KB-1 Plus) successfully prevented inhibition of microbial activity and pH levels later rebounded back into the neutral range. Bioaugmentation also helped to prevent stalling at VC and degradation to the innocuous ethene was demonstrated. Soil vapour levels were closely monitored during the full-scale implementation including methane which can be produced as a by-product of VOC degradation and can migrate under building foundations.
M27c
Copyright © CRC CARE Pty. Ltd., 2019
CleanUp Conference 2019Adelaide, Australia8 –12 September 2019 112
Table of Contentsfor this manuscript

CONCLUSIONS This case study demonstrates that through thoughtful design and implementation, many challenges often associated with EISB (e.g., production of VC) can be overcome and EISB can be successfully implemented at sites in Australia, even where more challenging conditions exist (e.g., reductions in pH, high concentration source materials, active manufacturing areas). REFERENCES References as applicable will be provided in final presentation.
113
Table of Contentsfor this manuscript

INTEGRATED SITE ASSESSMENT TO INFORM EISB REMEDIATION OF CHLORINATED SOLVENTS IN A SEDIMENTARY AQUIFER
Alessandro Sica, Andrew Labbett
CDM Smith Australia Pty Ltd, 1/30 Wangaratta Street, Richmond VIC 3121, AUSTRALIA
INTRODUCTION Historical manufacturing activities at an industrial site in the south eastern suburbs of Melbourne resulted in trichloroethene (TCE) impact of soil, groundwater and soil vapour. CDM Smith was engaged to prepare a clean-up plan (CUP) to remediate the identified impacts and satisfy the requirements of a Clean Up Notice (CUP) issued by EPA Victoria. A multiple line of evidence and adaptive approach was developed as part of the CUP to assist with identification and delineation of TCE source zones requiring remediation. SITE DESCRIPTION The site is underlain by fill materials of variable thickness followed by the sands of the Brighton Group, which comprise three distinctive sub-units (from shallower to deeper): Red Sands, Grey Sands and Black Sands. TCE impacts are predominantly present in the unsaturated and saturated portion of the shallower Red Sand sub-unit, which contains the water table and acts as an unconfined aquifer. Relatively small-scale variations of the sand, silt and clay content within the Red Sands sub-unit resulted in complex vertical and lateral migration of TCE impacts from historical release areas, posing significant challenges in developing adequate characterisation of source zones requiring remediation. REMEDIATION APPROACH The remediation approach developed in the CUP comprised excavation, on-site treatment and reuse of impacted soils in the vadose zone (i.e. above the groundwater table) and implementation of enhanced in-situ bioremediation (EISB) for treatment of TCE in groundwater. To improve delivery of EISB amendments in the heterogeneous and relatively low transmissivity Red Sands sub-unit of the aquifer, the CUP proposed construction of a series of ‘injection galleries’, by placing a layer of coarse rock aggregate across TCE sources zones, immediately above the groundwater table. METHODS A multiple line of evidence approach was developed in the CUP to assist with identification of location/extent of TCE source zones at the site and spacing/orientation of the injection galleries. This included review and analysis of the following:
• Information on historical site practises, areas of the site where TCE solvents were used and location of significant above ground or below ground storage of TCE.
• Layout of underground infrastructure at the site, with a focus on stormwater and sewer pits and conduits.
• Results of previous investigations at the site, which included: o Laboratory analysis of soil samples collected from drilled boreholes. o A Membrane interface probe (MIP) investigation. o A Passive soil vapour (PSV) survey. o TCE concentrations at groundwater monitoring wells across the site.
The historical data set was supplemented by additional investigations, which included field screening and laboratory analysis of soil samples collected from delineation test pits and from excavations realised as part of soil remediation works. These additional data were
M27d
Copyright © CRC CARE Pty. Ltd., 2019
CleanUp Conference 2019Adelaide, Australia8 –12 September 2019 114
Table of Contentsfor this manuscript

collected and uploaded in real time using a tablet-based, customised data collection tool, which streamlined the exchange of information between field and office personnel and assisted in making quick, informed decisions on how to progress remediation. RESULTS AND DISCUSSION The multiple line of evidence approach was well suited to manage the uncertainty associated delineation TCE source zones requiring remediation. The historical data were used to develop a preliminary remediation plan to delineate the extent of excavation areas and locations of EISB injection galleries. The new data collected from the field enabled the necessary adjustments to the initial plan (Fig. 1).
Fig. 1. Visualising Data from Multiple Lines of Evidence to Direct Remediation
The methodology provided several insights on the fate and transport of contaminants at the site, as well as the effectiveness of various characterisation techniques to assist in delineation of these impacts, including:
• Drainage infrastructure (such as stormwater) can play an important role in facilitating migration of TCE impacts from potential release areas, leading to larger than anticipated source zones.
• Because of complex migration pathways and chemical properties of chlorinated solvents, traditional characterisation techniques based on laboratory analysis of soil samples from drilled boreholes were not effective for source zone delineation purposes.
• The results of the PSV survey were considered the most reliable for the development of the preliminary remediation plan. However, changed conditions that occurred at the site since the PSV survey was undertaken (i.e. demolition of buildings), potential presence of multiple sources to the observed soil vapour concentrations and potential attenuation of contaminant concentrations along the vertical profile must be considered in the interpretation of the PSV results.
• Observation of the Red Sands at the exposed excavation walls indicated a relatively high degree of variability in the proportion of sands, silts and clays. This is reflected in the complex distribution of TCE impacts at the source zones and is likely to pose several challenges to effective distribution of EISB amendments in the aquifer.
CONCLUSIONS A multiple line of evidence approach was adopted to assist with implementation of soil and groundwater remediation of a sedimentary (Brighton Group) aquifer impacted by chlorinated solvents. Delineation of the extent of TCE impacts at source areas was aided by reviewing data from several sources of information and through periodic updates of the initial remediation plan. Use of a ‘real time’ data collection tool greatly enhanced communication between field and office staff and the ability to effectively direct remediation activities.
115
Table of Contentsfor this manuscript

USE OF MULTIPLE LINES OF EVIDENCE TO RESOLVE THE CSM FOR A COMPLEX GROUNDWATER TCE DISTRIBUTION
Rory Lane1, Meredith Rasch2
1BlueSphere Environmental, 438 Goodwood Road, Cumberland Park, 5041, AUSTRALIA
2Renewal SA, GPO Box 698, Adelaide, 5001, AUSTRALIA [email protected]
INTRODUCTION The Tonsley Innovation District comprises an area of 61 Ha which was operated from 1964 to 2008 as a car manufacturing facility by Mitsubishi Motors Australia Ltd (MMAL). The site lies within a broader industrial precinct which also contains the operational Monroe Australia Pty Ltd manufacturing facility and the former Reckitt & Colman (R&C) facility. A large amount of environmental investigation work has been conducted within this area, generating approximately 200 environmental reports over the last 20 years. Investigations conducted circa 2012 and 2013 identified significant trichloroethene (TCE) vapour intrusion issues immediately south of the MMAL site, leading to demolition of residences on the former R&C site and voluntary relocation and subsequent demolition of approximately 25 dwellings within the suburb of Clovelly Park, to the west of the R&C site and south of the MMAL site. BlueSphere Environmental conducted a large-scale groundwater investigation in 2015 and 2016 which incorporated approximately 75 on-site monitoring wells and 52 off-site wells to the west and south of the site. The data generated from these investigations, in conjunction with the extensive existing data set (including data from the Monroe site), identified a very complex distribution of dissolved-phase groundwater TCE impacts within the industrial precinct and surrounding areas. Up to eight potentially distinct plumes of varying size and concentrations were identified within the uppermost Quaternary aquifer across the investigation area. These plumes were located within the MMAL, Monroe and R&C sites as well as residential areas to the west and south, with the largest plume extending approximately 1.5 km north-west into the suburb of Mitchell Park. The degree of connectivity between the various plume areas was not understood and the sources of a number of the plumes had not been identified. While some of the plumes appeared to originate within the MMAL site, no evidence of unsaturated zone TCE impacts had been found on the MMAL site despite numerous investigations and hundreds of soil sample analyses. Furthermore, no satisfactory explanation had been proposed to explain how the TCE in groundwater had migrated 1.5 km into the surrounding suburbs, when all the potential source areas were located in areas where the uppermost Quaternary aquifer sediments were known to comprise predominantly low hydraulic conductivity sandy clays. These data gaps posed substantial challenges in developing a comprehensive Conceptual Site Model (CSM) which adequately explained the distribution of TCE in groundwater across the investigation area. METHODS During 2017 and 2018 BlueSphere employed a wide range of investigation techniques, providing a number of different lines of evidence, to develop an understanding of the complex plume architecture across the investigation area. These included: • Groundwater monitoring well and soil vapour bore installation and sampling; • Down-hole gamma logging; • Hydraulic conductivity studies, including hydraulic profiling tool (HPT); • Membrane Interface Probe (MIP) studies; • Broad scale soil vapour screening using temporary soil vapour probes and photo-
ionisation detector (PID) screening; • Review of historical and contemporary sewer and stormwater plans; and • Review of historical aerial photographs and other historical records.
M27e
Copyright © CRC CARE Pty. Ltd., 2019
CleanUp Conference 2019Adelaide, Australia8 –12 September 2019 116
Table of Contentsfor this manuscript

The lines of evidence provided by each of investigation methods was brought together to develop a comprehensive CSM for the site which explained the complex distribution of TCE groundwater contamination across the site and the contributing contaminant release and transport mechanisms. RESULTS AND DISCUSSION The investigations revealed a number of key pieces of evidence that contributed to developing a sound understanding of site. These included: • Substantial differences in the saturated zone geology were observed between the
industrial area and the residential areas to the west of the MMAL site. Bulk hydraulic conductivity values were observed to be approximately two orders of magnitude higher to the west of the site in Mitchell Park compared to those seen beneath MMAL, Monroe and R&C.
• The main off-site plume extending into Mitchell Park appeared to be disconnected from the plumes within MMAL, Monroe and R&C as evidenced by multiple groundwater and soil vapour monitoring points. The origin of this plume appeared to lie within the residential area approximately 250 m west of MMAL.
• Two source areas had previously been identified by URS / AECOM beneath the Monroe site and a third source area was inferred to be present within the former R&C site. Investigations conducted by BlueSphere identified two further likely source areas within the MMAL site, although the concentrations of TCE in the soil profile were very low (<1 ppm). The source of a large plume passing beneath the southern end of the main assembly building could not be identified as a result of the lack of data from beneath the very large structure.
• During demolition of a large remnant slab on the former R&C site, a 10 m long by 1.2 m wide by 2 m deep concrete lined trench was discovered beneath the slab. The trench was filled with heavily TCE impacted soil and water but did not appear to have leaked.
• Historic plans from the 1980’s showed the presence of an abandoned private sewer line that ran from the R&C site (adjacent the buried trench) along the boundary of the MMAL site to join the public sewer adjacent the south-western corner of the MMAL site. Subsequent MIP and soil boring studies showed TCE impacts through the unsaturated zone to the water table along a portion of the sewer alignment, indicating likely historical leakage of TCE impacted waste water from the sewer.
• Inspection of the sewer plans for the area showed that wastewater from the historical private sewer would have flowed through the public sewer directly past the inferred point of origin of the main off-site plume 250 m west of the MMAL boundary.
CONCLUSIONS From the multiple lines of evidence described it is clear that the primary means of transport and release of TCE within the MMAL site and the areas to the south and west was TCE impacted waste water rather than direct losses of TCE solvent to ground. This explains the absence of grossly impacted unsaturated zone soils and the absence of dense non-aqueous phase liquid (DNAPL) TCE within the plumes in these areas. Several supporting lines of evidence indicate that TCE impacted waste water originating from the former R&C site has leaked from the historical private sewer just south of the MMAL site boundary giving rise to the large TCE plume present beneath the south-west corner of the MMAL site. The wastewater stream then flowed a further 300 m to the north-west in the public sewer to a second release point within the suburb of Mitchell Park beyond the low hydraulic conductivity zone in an area of much higher hydraulic conductivity, giving rise to the large off-site groundwater plume extending 1.5 km north-west of the MMAL site. REFERENCES BlueSphere (2018). Conceptual Site Model (CSM): Tonsley VSCAP Investigation – Rev 4.
Tonsley Innovation District, Former MMAL Site, Tonsley SA. 26 September 2018.
117
Table of Contentsfor this manuscript

PFOS, PFOA AND OTHER PFAS: A FOCUS ON CANADIAN GUIDELINES AND GUIDANCE
Darcy Longpré1, Luigi Lorusso2, Christine Levicki2, Richard Carrier3
1Health Canada, 200 Réné-Lévesque Blvd W, Montreal, H2Z 1X4, CANADA
2Health Canada, Contaminated Sites Department, 269 Laurier W, Ottawa, K1A 0P8, CANADA
3Health Canada, Existing Substances and Risk Assessment Bureau, 269 Laurier W, Ottawa, K1A 0P8, CANADA
INTRODUCTION The Canadian government has been involved in PFAS work since the early 2000s. Several departments are implicated in various aspects of this work, especially those involved in contaminated sites management, due to PFAS being identified as a contaminated sites issue at federally-managed lands associated with AFFF (aqueous film foaming film) use. Assessment and regulation of PFAS in Canada has evolved over time with several regulations being added or modified over the years. Canadian regulations and risk management plans are based on risk assessment. Environmental limits are an essential tool to permit the application of regulatory and voluntary tools. Risk management at contaminated sites in Canada has also been a driver for several research efforts. Following an overview of the federal regulatory history of PFAS and a brief history of PFAS in Canada, this presentation will focus on federal guidelines and guidance related to federal contaminated sites management in Canada specific to PFAS and the path forward. CANADIAN POLICY In 2006, PFOS, its salts and certain other compounds was added to the List of Toxic Substances in Schedule 1 under the Canadian Environmental Protection Act, 1999 (CEPA). In 2009, PFOS and its salts were added to the Virtual Elimination List under subsection 65(2) of CEPA. PFOA, its salts and precurors and long-chain perfluoroalkyl acids (LC-PFCA), their salts and precurors were evaluated in 2012 and added to Schedule 1. In 2018, updates were proposed to the regulations governing PFOS, PFOA, LC-PFCAs and four fluorotelomer substances that would eliminate the exemptions to the importation, manufacture and use of these substances, including AFFFs, which were allowed in the earlier regulations. FEDERAL CONTAMINATED SITES - GUIDELINES AND GUIDANCE The Federal Contaminated Sites Action Plan (FCSAP) was initiated by the Government of Canada in 2005 to reduce environmental and human health risks from known federal contaminated sites and associated federal financial liabilities. Several departments; Health, Environment, Transport, National Defence, National Research Council and Public Services, as part of an interdepartmental working group help coordinate and share work related to PFAS. Many aspects of PFAS science in Canada have evolved thanks to the collaborative work of these departments. Several interim and final guidelines and screening values are available for the management of PFAS-impacted sites including:
• Federal Environmental Quality Guidelines for PFOS (available for the following ecological media: water, fish tissue, wildlife diet (mammalian and avian) and bird egg.
• Canadian Drinking Water Quality Guidelines for PFOS and PFOA • Drinking Water Screening Values for 9 other PFAS compounds • Soil Screening Values for 11 PFAS compounds
M31a
Copyright © CRC CARE Pty. Ltd., 2019
CleanUp Conference 2019Adelaide, Australia8 –12 September 2019 118
Table of Contentsfor this manuscript

Additional guidance used to manage PFAS impacted sites will also be presented related to environmental sampling, human health risk assessment and advice on site management. MOVING INTO THE FUTURE Health Canada is currently conducting genotoxicity research on PFAS and PFAS mixtures to advance the PFAS toxicity science to better facilitate guideline development. Additionally, pilot projects by other federal departments are informing assessment, remediation and risk management activities. We will address current challenges faced and next steps as the science progresses. REFERENCES Canadian Council of Ministers of the Environment (CCME). 2018. Canadian Soil and Groundwater Quality Guidelines for the Protection of Environmental and Human Health – Perfluorooctane Sulfonate (Draft for review). CCME. Winnipeg, MB, Canada. CCME. 2018. Scientific Criteria Document for the Development of the Canadian Soil and
Groundwater Quality Guidelines for Perfluorooctane Sulfonate (Draft for review). Winnipeg, MB, Canada.
Environment Canada (EC). 2006. Ecological Screening Assessment Report on Perfluorooctane Sufonate, its Salts and its Precursors that Contain the C8F17SO2 or C8F17SO3+, or C8F17SO2N Moiety. June 2006. Ottawa, ON, Canada.
Environment Canada and Health Canada (EC and HC). 2012. Final Screening Assessment on Perfluorooctanoic Acid (PFOA), its Salts and its Precursors. August 2012. Ottawa, ON, Canada
Environment and Climate Change Canada (ECCC). 2018. Canadian Environmental Protection Act, 1999 – Federal Environmental Quality Guidelines – Perfluorooctane Sulfonate (PFOS). Gatineau, QC, Canada. May 2018.
Federal Contaminated Sites Action Plan (FCSAP). 2018. Interim advice to Federal Custodian Departments for the Management of Federal Contaminated Sites Containing Perfluorooctane Sulfonate (PFOA) and other Per- and Polyfluoroalkyl Substances (PFAS).
Health Canada (HC). 2018a. Guidelines for Canadian Drinking Water Quality. Guideline Technical Document. Perfluorooctane Sulfonate (PFOS). December 2018.
HC. 2018b. Guidelines for Canadian Drinking Water Quality. Guideline Technical Document. Perfluorooctanoic Acid (PFOA). December 2018.
HC. 2018c. Drinking Water Screening Value for Perfluorononanoic Acid. July 5, 2018. Ottawa, ON, Canada.
HC. 2019. Summary Table: Health Canada Draft Guidelines, Screening Values and Toxicological Reference Values (TRVs) for Perfluoroalkyl Substances (PFAS). Health Canada, Ottawa, ON.
HC. 2019. Human Health Risk Assessment Framework for Federal Sites Imacted with Per- and Polyfluoroalkylated Substances. Health Canada, Ottawa, ON.
Transport Canada (TC). 2017. Guide d’échantillonnage sur le terrain de substances perfluoroalkylées et polyfluoroalkylées (PFAS).
119
Table of Contentsfor this manuscript

THE EVOLUTION AND BASIS OF PFAS GUIDELINES IN THE NETHERLANDS, THEIR CONSEQUENCES AND A REFLECTION
WITH INTERNATIONAL GUIDANCE
Tessa Pancras1, Hans Slenders2
1Arcadis Nederland B.V., Beaulieustraat 22, 6814 DV Arnhem, THE NETHERLANDS 2Arcadis Nederland B.V. Mercatorplein 1, 5223 LL ‘s Hertogenbosch, THE NETHERLANDS
INTRODUCTION PFAS have been an issue in the Netherlands since 2008, when an incident happened at a site near the Schiphol airport with an unintended release of PFOS-containing AFFF. Following this incident, guideline values for PFOS in environmental media have been derived in 2010/2011 by the RIVM (Netherlands National Institute for Public Health and the Environment) (Moermond et al., 2010, Bodar et al., 2011), based upon the then available toxicity data. This release was regarded as an incident and these values were not given a legal status. It was thought to be a local problem. Globally however, PFAS appeared to be a larger problem than anticipated, and PFOS was phased out via the Stockholm Convention and REACH (registration and evaluation of chemicals in the EU). A start was made with the phase out of PFOA on a voluntarily basis by the larger producers. In Europe we really came to realize the impact of PFAS in 2013, when the AA-EQS (annual average environmental quality standard) was set by the European Union in the Water framework Directive, at an extremely low level of 0.65 ng/l for PFOS in inland surface waters. This level again was derived by the Dutch institute RIVM. This AA-EQS was the reason that CONCAWE, the environmental research institute for the oil and gas industry, initiated a study on the Fate and Environmental effects of PFAS (Pancras et al., 2016). PFAS IN THE NETHERLANDS Until 2016 data on the presence of PFAS in the environment in the Netherlands were lacking. It was unclear whether PFAS were a significant problem in the environment or that there were only a few incidents. The situation changed when another major PFAS issue came into publicity and in politics; in the city of Dordrecht, a PTFE production facility impacted the environment with PFOA and GenX (a PFOA substitute). Emissions to air and surface water were already going on since the 70’s, and elevated bloodlevels in civilians and in drinkingwater wells were detected. The municipality of Dordrecht and the Ministry of Infrastructure and Environment commissioned The Dutch Center of Expertise on PFAS (a cooperation of the consulting companies Arcadis, Witteveen+Bos and TTE) to conduct a two-year research program. The main goals were to investigate whether PFAS are a problem in the Netherlands, what the risks are, and how authorities can handle PFAS contamination. The program comprised:
• A knowledge document on PFAS, including properties, threshold values, sampling, analyses and remediation.
• Deriving a method to assess the toxicity of other PFAS (C4-C18 PFAA’s), together with the RIVM (Zeilmaker et al., 2018).
• A sampling campaign at 29 suspected sites. • An evaluation of all existing data on PFAS in soil, groundwater, drinking water and
surface water in the Netherlands. • A policy document on PFAS.
Resulting in a guidance framework for PFAS in the Netherlands. The reports are available on the website of the Center of Expertise (www.expertisecentrumPFAS.nl, in Dutch). The combined information gathered show that PFAS are not only present at suspected sites in high concentrations, but also ubiquitous present in our environment. 99% of our surface
M31b
Copyright © CRC CARE Pty. Ltd., 2019
CleanUp Conference 2019Adelaide, Australia8 –12 September 2019 120
Table of Contentsfor this manuscript

water used for drinking water purposes contains PFAS. In soil relatively low concentrations of 2-5 µg/kg were found as background concentrations over larger areas in the Netherlands, areas that are not at all related to specific source zones. Furthermore, the toxicity assessment has shown that the existing guideline values for PFOS need a reevaluation, since more toxicity data have become available in the meantime. During the project Relative Potency factors for 12 PFAS were also derived. In parallel, a study on the atmospheric deposition of the PTFE facility revealed an impact in soil over an area of more than 50 km long, and another facility was discovered with a GenX plume of 5-6 km long in soil. Gradually more toxicity data become available and indicate a need for lower guidance values. The risk limits for PFOS, PFOA and GenX (PFOA substitute) are currently being reevaluated. Temporary risk limits have been derived for PFOS, PFOA and GenX based on three critical routes; direct ecotoxicology, indirect ecotoxicology (secondary poisoning) and human toxicology, for three types of uses (Wintersen et al., 2019): (1) Agriculture, nature & vegetable gardens, (2) Residential areas and (3) Industry. With the new values being assessed, a temporary guidance is being set up concerning soil movement for dry applications (above groundwater level), which is expected for June 2019. The final risk limits are expected for 2020/2021, they will also include the exposure routes of leaching towards groundwater, and towards arable farming. In parallel there is a rather strong debate going on about the toxicity of PFAS. The EFSA (European Food and Safety Authority) has derived new values for health-based guidance values for PFOS and PFOA, and compared to the previous evaluation in 2008, these values have declined significantly (2-3 orders of magnitude) (EFSA, 2018). The RIVM has questioned the scientific basis of the values published by the EFSA, about the interpretation and analysis of data from epidemiological studies. According to the RIVM it is unclear whether exposure to PFOA or PFOS case the changes identified in the epidemiological studies. Also Denmark and Germany have raised questions. The outcome of this discussion might affect the risk limits currently derived. CONSEQUENCES First of all, it is obvious that the levels are that low that pragmatic approaches in many cases are rapidly becoming out of reach. Especially with the EFSA levels, and one has to question the usability of these levels. Furthermore, the question is whether this ubiquitous presence of PFAS is an issue. This question is at this moment the basis of a discussion in the Netherlands. Since these concentrations are above the detection level, and new cases of contamination have to be removed completely according to the Dutch Soil Act, all these soils are marked as contaminated, and soil movement from one site to another (hence all construction activities) is hampered by these findings. This is not just a local issue, but a national issue and has put PFAS back on the agenda of the national authorities. REFERENCES Bodar, C., Lijzen, J, Moermond, C., Peijnenburg, W., Smit, E., Verbruggen, E., Janssen, M.
(2011) Advies risicogrenzen grond en grondwater voor PFOS. RIVM briefrapport 601050002/2011.
EFSA Panel on Contaminants in the Food Chain (CONTAM) (2018) Risk to human health related to the presence of perfluorooctane sulfonic acid and perfluorooctanoic acid in food. In: EFSA Journal 2018; 1(12); 5194.
Moermond, C.T.A., Verbruggen, E.M.J., Smit, C.E. (2010) Environmental risk limits for PFOS. RIVM report 601714013/2010.
Pancras, T., G. Schrauwen, T. Held, K. Baker, I. Ross, H. Slenders (2016) Environmental fate and effects of poly- and perfluoroalkyl substances (PFAS) Concawe report no. 8/16.
Wintersen, A., Otte, P. (2019). Overzicht van risicogrenzen voor PFOS, PFOA en GenX ten behoeve van een tijdelijk handelingskader voor het toepassen van grond en baggerspecie op of in de landbodem. Memo RIVM, 067/2019 DMG/BL/AW, d.d. 4 march 2019.
Zeilmaker, M.J., Fragki, S., Verbruggen, E.M.J., Bokkers, B.G.H., Lijzen, J.P.A. (2018) Mixture exposure to PFAS: A Relative Potency Factor approach. RIVM report 2018-0070.
121
Table of Contentsfor this manuscript

POLICY ASPECTS OF MANAGING PFAS-CASE FINLAND
Jussi Reinikainen
Finnish Environment Institute, Latokartanonkaari 11, Helsinki, FI-00790, FINLAND [email protected]
INTRODUCTION In Finland, the national policy on PFAS, in many respects, is based on the regulatory approach of the European Union, in which PFOS and PFOA, alongside their precursors, have aroused greatest attention among the wide range of per- and polyfluoroalkyl substances. In 2008, restrictions were laid down on the marketing and use of PFOS and its precursors by the REACH regulation (EC/1907/2006). In 2009, PFOS and its precursors were added to the Stockholm Convention on Persistent Organic Pollutants (POPs), and in 2010 the REACH restrictions on PFOS were transferred to the POP regulation (EY/850/2004). These policy instruments define industries where PFOS may or may not to be used, and set limit values for the content of PFOS in different products and wastes. The Stockholm Convention also obliges its parties to develop national implementation plans (NIP) that provide information about the measures taken with regard to POPs. In relation to PFOS, the measures in Finland have included e.g. the identification and evaluation of PFOS emission sources such as target industries, waste water treatment plants and fire-fighting training sites. PFOA and its precursors were attached to the REACH regulation in 2017, and its associated restrictions will take effect gradually from 2020. Moreover, a proposal for adding other long-chained perfluoroalkyl carboxylic acids (C9-14-PFCA) to the REACH regulation is currently in the hearing, and many other PFASs (e.g. PFHxS ) are listed as Substances of Very High Concern (SVHC). The overall goal of all the above-mentioned policy measures is to phase-out the most problematic PFAS from the European market, and hence to promote industries in the development and implementation of safer chemical alternatives and products. Due to the comprehensive restrictions and the voluntary actions by the industry and other operators, the direct environmental emissions of many PFAS, such as PFOS and PFOA, have indeed reduced dramatically in Finland during the last 15 years. ENVIRONMENTAL STANDARDS AND MONITORING In 2013, PFOS and its precursors were included in the list of priority substances in Directive 2013/39/EU complementing the EU water policy. The directive imposed Environmental Quality Standards (EQS) for the annual average (AA) and maximum concentration (MAC) of PFOS in surface waters (AA-EQS = 0,65 ng/L and 0,13 ng/L, and MAC-EQS = 36 µg/L and 7,2 µg/L for inland waters and other waters, respectively), and biota (EQS-biota = 9,1 µg/kg). In Finland, however, only the MAC-EQSs and the EQS-biota (i.e. fish) have been implemented in the national regulatory framework (i.e. AA-EQSs are not applied). The EU Drinking Water Directive (98/83/EC) that is currently under revision includes proposals as quality standards for both individual PFAS (0,1 µg/L) and the sum of PFAS (0,5 µg/L). The same values have been proposed as national EQSs for groundwater to be used in the assessment of chemical status of groundwater bodies according to the Water Framework Directive 2000/60/EC. Furthermore, in 2018 the European Food Safety Agency (EFSA) established new health-based reference values for PFOS (TWI = 13 ng/kgBW-d) and PFOA (TWI = 6 ng/kgBW-d). These values are substantially lower than the previous EFSA values from 2008 (TDIPFOS = 150 ng/kgBW-d and TDIPFOA = 1500 ng/kgBW-d), which have been widely used in health risk assessments in the EU, including the derivation of the above-mentioned EQS values for surface water and biota. In addition to regulations and standards, the Finnish public authorities have addressed the PFAS issue by implementing several other policy measures. These include for example information steering (e.g. providing guidelines and organizing training), the establishment of
M31c
Copyright © CRC CARE Pty. Ltd., 2019
CleanUp Conference 2019Adelaide, Australia8 –12 September 2019 122
Table of Contentsfor this manuscript

a national PFAS network, and the implementation of monitoring programmes and screening studies targeted e.g. at waste water treatment plants and sludges, fire-fighting training sites, drinking water at municipal waterworks, surface waters, biota, and human exposure. PFAS has also been a focal topic on the academic research agenda. Based on the results of the monitoring programmes, screening studies and research projects, PFAS are ubiquitous in all the environmental compartments in Finland, but their concentration levels in most cases are low enough so that no immediate measures for risk reduction are required. Also the dietary exposure to the general population or specific sub-populations has not indicated a major concern for adverse health effects, being also lower for PFOS and PFOA than the new health-based reference values by EFSA. CONTAMINATED LAND MANAGEMENT In Finland, the regulatory policy on contaminated land management, independent of the source of contamination, is governed by risk-based approach. Hence, reliable risk assessment is a prerequisite for justified and sustainable risk management also on PFAS contaminated sites. In the Finnish context, a turnover from often over-conservative and unfounded risk assessments that rely on generic guideline values to more realistic and more justified site-specific risk-based decisions was considered as necessary already several years ago. In order to avoid compromising this policy, generic concentration thresholds for assessing PFAS contamination in soil or groundwater have not been introduced. In terms of sustainable risk-based decision-making, setting generic thresholds for the remediation of PFAS is particularly questionable as PFAS are ubiquitous and for the moment cannot be permanently removed from the environment in a practical and cost-efficient manner. With regard to PFAS, the major focus in contaminated land management in Finland has been on sites where fire-fighting foams have been used extensively in the past. On those sites the most relevant risks usually apply to the transport of PFAS and its associated impacts on the recipient surface waters or groundwater usage. Based on recent surveys by the Finnish Environment Institute, e.g. the discharges of PFOS from single fire-fighting training sites into the recipient surface waters may equal or even exceed the total PFOS loading in some of the largest river catchment areas in Finland. As a result of these discharges, the concentrations of PFAS, especially PFOS and other long-chain PFSAs, are also clearly elevated in biota (i.e. fish). Due to these findings, a comprehensive health risk assessment regarding the consumption of fish (including risk-benefit analysis) has been initiated by the National Institute for Health and Welfare. Discussions on sustainable measures for risk management on PFAS contaminated sites are still ongoing, and for the time being only a few sites have actually been remediated. In order to advance justified and sustainable risk-based remediation in the future, technological development in the remediation market is crucial, but further information is also needed on specific risk factors such as the toxicity and long-term effects of short-chain PFAS and precursors. Moreover, open dialogue and policy decisions are required on the protocols and environmental objectives within regulatory risk assessment, taking also into account the relevance and applicability of the very low EQSs and health-based reference values on site-specific decision-making. CONCLUSIONS Despite the wide range of targeted policy measures and the satisfactory generic quality of the environment with regard to PFAS in Finland (based on existing knowledge), concerns are still related to specific emission sources (e.g. fire-fighting training sites, and waste water treatment plants and their sludges) and the huge number of substances in the PFAS family still in active use. Concerns also involve the data gaps regarding the potential environmental impacts of the majority of these substances as well as their contents in commercial products. Furthermore, it is evident that the extensive historical use of nowadays banned PFAS, particularly PFOS, will continue to cause long-term pressure on the environment.
123
Table of Contentsfor this manuscript

THE EVOLUTION OF GLOBAL REGULATION FOR PER- AND POLY-FLUORINATED ALKYL SUBSTANCES (PFAS)
Ken Kiefer1, Nanda Hermes2, Andrea Herch3, Jennifer Byrd4
1ERM, Locked Bag 3012 Australia Square, NSW 1215, AUSTRALIA
2ERM, Posthoflei 5 B6, 2600 Antwerp, BELGIUM 3ERM, Techno-Pôle 4, 3960 Sierre, SWITZERLAND
45000 Meridian Boulevard, Suite 300 Franklin, Tennessee, USA
INTRODUCTION Global interest in PFAS has increased over the last five years. As data emerge regarding the prevalence and potential effect of these compounds, regulatory scrutiny has increased on facilities that have manufactured or used PFAS or PFAS-containing materials. Several countries, and regions within those countries, have begun to establish regulatory guidelines with a focus on mitigating the human health and environmental risk associated with the release of PFAS into the environment. Because PFAS have been used in such a large variety of commercial and household goods, low concentrations of PFAS have been detected not only in environmental media near manufacturing facilities and firefighting/firefighting training areas, but also in wastewater treatment plant effluent, landfill leachate, and surface water far removed from industrial areas. PFAS are also detected in the blood stream of populations in Europe, North America and other industrialized areas. The large-scale exposure risks have led to public demand for swift government action. This has led to inconsistent regulations/guidance for PFAS in different media that continues to change. METHODS This presentation provides a review of available PFAS regulations across Australia, the United States, and some countries within the European Union, with a focus on rationale behind the development of compound specific advisory levels. The review availability of guidance documents in Australia, the United States, and some countries within the European Union. RESULTS AND DISCUSSION Criteria and target compound list change rapidly across many jurisdictions:
• US – PFOA Drinking Water Levels o 400 ng/L - USEPA November 2015 o 100 ng/L - USEPA January 2016 o 70 ng/L - USEPA May 2015 o 11 ng/L – ATSDR 2018
• Germany – PFOA+PFOS Drinking Water Levels o 300 ng/L - 2006 o 100 ng/L - 2017
The body of toxicology data available for these chemicals is still not yet fully developed. The list of PFAS compounds contains over 3000 and for many no toxicity data are available. While many jurisdictions focus on regulating PFOA and PFOS, there are several examples of regulation being developed for more PFAS compounds.
• PFOA and PFOS – primary or only focus in many regulatory jurisdictions • PFOA, PFOS, PFNA – New Jersey USA • PFOA, PFOS and PFHxS –Australia • PFOA, PFOS, PFNA, PFHxS, PFHpA – focus of several US States
M31d
Copyright © CRC CARE Pty. Ltd., 2019
CleanUp Conference 2019Adelaide, Australia8 –12 September 2019 124
Table of Contentsfor this manuscript

• PFOA, PFOS, PFNA, PFHxS, PFHpA, PFBA, PFBS, PFPeA, PFHxA – Canada • PFOA, PFOS, PFNA, PFHxS, PFHpA, PFBS, PFPeA, PFHxA + 6 more - Texas
There exists inconsistent regulations/guidance for different media or uses: • In Germany, sewage sludge containing max.100 µg/kg PFOA+PFOS may be used as
fertilizer on agricultural land, but local legislation states that measures may be needed if concentration in soil leachate exceeds certain concentration, e.g. 0,4 µg/l PFOA according to Bavarian guideline.
• In the US there are requirements to treat water to less than drinking water criteria or even to non-detect prior to discharge to sewers.
• USEPA just released draft interim groundwater screening value of 40 ppt for PFOA and PFOS (total and individually) but recommends 70 ppt as a preliminary remediation goal.
Acceptance of criteria from one regulatory entity by another entity is complicated as human/ecological toxicological thresholds or calculated bioaccumulation factors may be different.
• E.g. EQS for PFOA for human fish consumption: 2017 Dutch proposed value = 0.048 µg/l vs. calculated with Bavarian average fish consumption = 28 to 109 µg/l.
CONCLUSIONS The continuous evolution of PFAS regulation has an impact on Businesses:
• Products and processes need to be reformulated. • Material/equipment needs to be replaced. • Close follow up of supply chain management. • Re-opening of closed remedial sites/investigations. • Hidden liabilities in portfolio, and for mergers or acquisitions. • Toxic tort claims. • Wastewater treatment installations may need upgrades.
and on Remediation strategies: • Today’s investigation and remediation may be insufficient for tomorrow’s criteria. • Changing regulatory criteria require flexible strategies. • Treatment of water to “ND” to cover all future outcomes. • Concern that disposal of impacted media may result in future liabilities. • Challenge of large dilute plumes with limited attenuation. • Return of “Pump & Treat” and other containment strategies: Focus on blocking
exposure pathways (e.g. treat drinking water). REFERENCES USEPA. 2015. Letter to Mayor Borge, Hoosick Falls, NY. Provision health advisory for
PFOA. November 25. USEPA. 2016. EPA Statement on Private Wells The Town of Hoosick and Village of Hoosick
Falls, NY. January 28. USEPA. 2016. Drinking Water Health Advisory for PFOS and PFOA. May. ATSDR. 2018. Toxicological Profiles for Perfluoroalkyls. June. Germany Ministry of Health. 2006. Statement by the Drinking Water Commission. July 13.
125
Table of Contentsfor this manuscript

PFAS IN SOIL AND GROUNDWATER — GUIDANCE FOR THE ASSESSMENT AND REMEDIATION MEASURES IN GERMANY
Annegret Biegel-Engler1, Joerg Frauenstein1, Thomas Held2, Michael Reinhard2
1German Environment Agency, Woerlitzer Platz 1, 06846 Dessau, GERMANY
2Arcadis Germany GmbH, Europaplatz 3, 64293 Darmstadt, GERMANY [email protected]
INTRODUCTION Per-and polyfluorinated alkyl substances (PFASs) are ubiquitously present in the environment. PFASs are characterized by special properties, e.g. chemical and thermal stability. Releases into the environment occur during manufacturing of PFASs itself, their use phase as well as during use and disposal of articles treated with PFASs. PFASs contamination of soils are mainly caused by application of sewage sludge, fertilizers, plant protection products and the use of firefighting foams. Deposition via air also contributes to the ubiquitous presence of PFASs in soils. PFASs in soils can be taken up by plants and/or leach into groundwater. Long chain PFASs (such as PFOS) need years to percolate from top soil layers into the groundwater or into surface water. Short chain PFASs (such as PFHxA) however reach ground water resources much faster due to their high mobility in soil (Vierke, 2014; Gellrich, 2012), . In Germany the number of known PFAS contamination in soil and groundwater is growing continuously mainly on airports, former fire training sites, and on agricultural land. Moreover, PFASs have been used in many household products and industrial processes due to their unique features like water and oil repellence as well as chemical and thermal stability. Especially the thermal stability enables these compounds to be used in fire extinguishing foams as AFFF (aqueous foam forming films). That is the reason why today PFAS are found as contaminants in many places. Furthermore PFAS contaminated soil or material has been brought out on agricultural land or while earthworks causing wide-spread sources of approximately 5 km² at the biggest site. If the contamination of the soil is in the range of square kilometres we talk about wide-spread contaminations. Those contaminations already caused closed drinking water wells. METHODS Remediation is costly and long lasting. However, there are no binding threshold levels for soil and groundwater available in Germany. Therefore, the German Federal States developed diverse strategies how to assess PFAS-contaminations in soil and groundwater. Assessment requirements An overall assessment of existing data of PFAS-contamination in soil and groundwater confessed a scattered situation among the 16 German Laender. Many of them complained at missing values and standardized analytical methods. Thereupon, the Conference of German Environmental Ministers (UMK) claimed for values and assessment criteria. Within a nation-wide expert group a guidance was elaborated. Now, a harmonised guidance for assessing and managing soils and groundwater contaminated with PFASs is available to deliver support for administrative implementation. However, the still existing level of uncertainty on many substances and their lacking toxicological assessment require a ongoing follow-up of the guidance under the perspective of new research results from around the world. We always see the need for an comprehensive national research programme and to strengthen precautionary principles.
M31e
Copyright © CRC CARE Pty. Ltd., 2019
CleanUp Conference 2019Adelaide, Australia8 –12 September 2019 126
Table of Contentsfor this manuscript

Remediation Managment Both Hot Spots as well as wide-spread sources represent a great challenge for the management of the remediation. It is obvious that due to costs and size conventional remediation approaches are not applicable to extended contaminated sites. The management of these sites require low cost strategies like in-situ-soil flushing, barrier technologies or in the simplest way only point of use decontamination (e.g. within drinking water facilities). Furthermore, if is still unclear how the extended contaminated land can be used in future. Preliminary investigations revealed that some arable crops show only a minor accumulation of PFAS. Since the extent of PFAS accumulation is different in various parts of the plan, it is important that not only for the food used parts of the plant do not accumulate PFAS but that the entire plant doesn’t accumulate. Otherwise this may result in a diffuse spread of the contamination. Remediation Technologies Currently the remediation technologies are mainly limited to Pump-and-Treat (P&T) with sorption of the PFAS on granular activated carbon (GAC) and soil exchange with subsequent disposal on specialized landfills or high-temperature thermal decontamination. On the other hand, in recent years several new technologies have appeared, some of them currently ready for the market like for instance PerfluorAd (PFAS precipitate for the treatment of the water phase) or Rembind® and comparable products (for PFAS immobilization mainly within the soil). Others are still in the phase of lab scale investigation or pilot scale but lacking full-scale experience. Since the sorption capacity of GAC for PFAS is low, especially for the short-chained compounds, intensive research is invested in the improvement of the GAC sorption capacity or in finding alternative sorbents. The PFAS loaded GAC is thermally regenerated (> 600 °C) and the evaporated PFAS are destroyed thermally after another increase of the temperature to > 1.000 °C. Hence, for sustainability reasons a sorbent showing higher sorption capacity and milder conditions for the subsequent contaminant desorption are highly desirable. Many destructive PFAS technologies require treatment times of several hours which make them prohibitive to be used for continuous treatment of pumped contaminated groundwater. They may, however, be used to decontaminate concentrates which arise e.g. after sorbent desorption. The moderate to high solubility of the PFAS and their low sorption capacity on soil are the reasons why PFAS cause long contaminant plumes in the aquifer. So far such extended aquifer contaminations cannot remediated cost-effectively with in-situ technologies. This holds also true for conventional contaminants. Hence, besides P&T, barrier technologies are requested. PRB-systems (permeable reactive barrier) using GAC do not seem to be the answer. Whether downhole foam fractionation system which concentrate the PFAS dissolved in the groundwater within specialized wells in a foam are the answer will show the future. The specialized wells work in form of groundwater circulation wells. CONCLUSIONS This presentation will give an overview on the proposed harmonized criteria to assess soil and groundwater contaminations. Moreover, a German approach how to treat and handle contaminated soils, materials, groundwater and PFAS's contaminated waste will be given. ACKNOWLEDGEMENTS The work has been performed within the Environmental Research Plan of the Federal Ministry for the Environment, Natural Conservation and Nuclear Safety, Research number 3717 76 231 0: Remediation management for local and extended PFAS contaminations. REFERENCES Vierke L, Möller A, Klitzke S (2014) Environmental Pollution 186: pp.7-13. Gellrich V. Stahl T, Knepper TP (2012) Chemosphere 87: pp.1052-1056.
127
Table of Contentsfor this manuscript

PER- AND POLYFLUOROALKYL SUBSTANCES AND IN SITU MICROBIAL POPULATIONS INTERACTIONS AT A
LEGACY FIREFIGHTING TRAINING AREA?
Denis M. O’Carroll1, Thomas C. Jeffries2, Matthew Lee1, Song Thao Le1, Anna Yeung1, Sarah Wallace3, Nick Battye3, Michael J. Manefield1, Kela P. Weber3
1Water Research Centre, School of Civil and Environmental Engineering, UNSW Sydney
AUSTRALIA 2Western Sydney University, AUSTRALIA
3Environmental Sciences Group, Royal Military College of Canada, CANADA [email protected]
PFAS compounds have exceptional interfacial properties and, as such, they have been widely used since the 1960s for a range of applications, including in aqueous film forming foam (AFFF). These foams are designed to be naturally resistant to degradation meaning that they have a very high environmental persistence. Their unique properties mean that each individual PFAS compound may impact insitu microbial communities to differing extents or may be degraded by insitu microbial communities to differing extents, if at all. Furthermore, PFAS may have unexpected impacts on specific microbial functional groups (aerobic heterotrophic bacteria, nitrate reducing bacteria, sulphate reducing bacteria, iron reducing bacteria, organohalide respiring bacteria, methanogenic archaea) and that these effects may prove diagnostic for PFAS impacted areas. Given their unique chemical structures PFAS are highly surface active further complicating an assessment of their environmental fate and impact to insitu microbial communities. In this study we collected over 80 water samples from a PFAS impacted site in Canada. Using these samples we conducted an in depth assessment of the impact of PFAS to insitu microbial communities. Specifically, insitu microbial communities were characterized using next generation sequencing to obtain the entire microbiological profile of microbes in sampled aquifers. Data is analysed in conjunction with available site data (e.g., subsurface stratigraphy), monitoring well data (e.g., pH, ORP, inorganic species) and soil data (e.g., soil type, organic carbon). This data provides important insights into these interactions. Although PFAS constituents did not impact community structure the relative abundance of a number of individual genera were significantly associated with PFAS chemistry. For example lineages within the Oxalobacteraceae family (some classified within the Janthinobacterium genus) have the strongest correlations with PFAS chemicals. Out of all the significant correlations between microbial lineages and firefighting foam chemistry, Oxalobacteraceae have the strongest correlation with total PFAS and components PFBS, PFHpA, PFHxS and PFOA. Additional correlations, their possible causes and implications will be discussed.
M32a
Copyright © CRC CARE Pty. Ltd., 2019
CleanUp Conference 2019Adelaide, Australia8 –12 September 2019 128
Table of Contentsfor this manuscript

BIOTRANSFORMATION OF PER- AND POLY-FLUOROALKYL SUBSTANCES IN
SOIL USING ENHANCED BIOREMEDIATION METHODS
John Stevanoni1,2
1School of Civil and Environmental Engineering, Faculty of Engineering and Information Technologies, University of Technology Sydney, PO Box 123 Broadway NSW 2007
AUSTRALIA 2Liberty Industrial, 95-99 Bridge Road, Glebe NSW, 2037, AUSTRALIA
INTRODUCTION The study used soil spiked with a PFAS containing AFFF 3M Light Water™ and practitioner-based bioremediation methods which involved the addition of brown wastes, nutrients and soil ameliorants, with pouty manure as the microbial source using laboratory-scale in-vessel bioreactors. Based on available literature, the experimental setup was designed to preferentially grow fungi as it is understood that the degradation of these persistent PFASs occurs though enzyme-catalysed oxidative humification or oxidative coupling reactions (ECOHR & ECOC), which have also been shown to preferentially achieve biotransformation of the precursors PFASs into less toxic substances (Colosi et al., 2009, Kucharzyk et al., 2017, Luo, 2015, Lang et al., 1998) METHODS Two soil types were collected for the two experiment streams with soil for the (A) stream assessed as sandy clay, with soil for the (B) stream assessed as clay. Incubation was performed in 4 x 1.5 L Pyrex incubators. Two of these containers were used for the (A) stream that examined the degradation of soil spiked with the AFFF at a starting concentration of ~106 mg/kg (sum of PFOS/PFHxS), with the remaining two containers used to test degradation of ~8 mg/kg in soil B. All the containers had water saturated air pumped through the mixture to limit drying and provide oxygen to as shown in Figure 1
Fig 1 - Experiential Setup
The experimental duration was 41 days. The soil ameliorant prepared was equal weights of straw, woodchips and poultry manure and mixed into the soils at an approximate 40% w/w (wet weight). Browns mulches and straw were used over green mulches to prove a nitrogen limiting environment, as well as providing a low pH, high oxygen environment in an attempt to preferential growth of fungi over bacteria. RESULTS AND DISCUSSION Samples were collected at day 0, 7, 12, 21, 27, 34, 41 and analysed at Eurofins Brisbane Laboratory via the USEPA Method EPA-821-R-11-007. White rot fungi hyphae were observed at various times throughout the experiment. With the (A) stream all PFSAs and PFCAs, initially showed an increase attributed to bacterial precursor transformations, and then a decrease, with this then repeated with all the compounds, which then showed a decrease from the peak value originating at day 7 to 27.
M32b
Copyright © CRC CARE Pty. Ltd., 2019
CleanUp Conference 2019Adelaide, Australia
8 –12 September 2019129
Table of Contentsfor this manuscript

The initial increase varied 48% to 188% with a mean value of 111%. The following decrease from the peak varied from 18% to 57%, with a mean value of 38%. Of the more studies PFSAs and PFCAs, PFOA and PFOS, these had an increase of 67% and 116% and then a decrease of 53% and 57% respectively. With the (B) stream the trend appeared to generally increase throughout the 41 days with only 3 of the 10 compounds, PFHpS, PFHxS, and PFOS showing steady decreases initiating between day 12 and 27. The initial increase varied 66% to 792% with a mean value of 362%. The following decrease from the peak for the three compounds varied from 9% to 18%, with a mean value of 15%. Of the more studied PFSAs and PCFAs, PFOA and PFOS, these had an increase of 66% and 357%, and decrease of 17% for PFOA. In explaining the differences between the results of the (A) and (B) stream it was believed that this can be attributed to two main reasons. Firstly, differing soil types effected the supply of oxygen and sorption of enzymes onto soil. The (B) stream with the clayey sand did not allow sufficient oxygen for sufficient fungal activity, allowing bacteria to become dominant, with this small variance having large effect. The release of these enzymes is also quite complex and is instigated by complex environmental factors such as reduction in available nitrogen levels, oxygen content and the life cycle of the fungi Secondly the (A) stream had a number of times higher PFAS concentrations, and hence had PFCAs and PFSAs which were more bioavailable. CONCLUSION In investigating the potential of enhanced bioremediation as a viable treatment technology for PFAS contaminated soils, it what was found that significant degradation of the most recalcitrant and toxic PFAS occurred using cost effective and practical techniques, by what is believed to be mycoremediation, based on visual observations and the literature review, however success varied, suggesting it has potential as a treatment technology, though methods may need to be amended and further research undertaken to improve its success. While a board and largely unknown consortium of microorganisms were used in this study, this had mixed results by way of ensuring fungi were dominant, which may suggest that the method may need to be amended to include inoculation of selected stains noting that this could be practical technique considering techniques used for commercial fungi production and stimulation. To further mycoremediation and the bioremediation of PFAS, it is suggested that further research be conducted into competition strategies for strains that are known to degrade PFAS and to ensure that they are practical and cost effective to introduce and propagate in soil systems. REFERENCES Colosi, L. M., Pinto, R. A., Huang, Q. & Weber, W. J., JR. 2009. Peroxidase-mediated
degradation of perfluorooctanoic acid. Environ Toxicol Chem, 28, 264-71. Kucharzyk, K. H., Darlington, R., Benotti, M., Deeb, R. & Hawley, E. 2017. Novel treatment
technologies for PFAS compounds: A critical review. J Environ Manage, 204, 757-764. Lang, E., Nerud, F. & Zadrazil, F. 1998. Production of ligninolytic enzymes by Pleurotussp.
andDichomitus squalensin soil and lignocellulose substrate as influenced by soil microorganisms. FEMS Microbiology Letters, 167, 239-244.
Luo, Q. 2015. Degradation of Perfluoroalkyl Acids by Enzyme Catalyzed Oxidative Humification Reactions. Doctor of Philosophy Degradation of Perfluoroalkyl Acids by Enzyme Catalyzed Oxidative Humification Reactions, University of Georgia.
130
Table of Contentsfor this manuscript

EVALUATING THE POTENTIAL USE OF Fluoro-Sorb® 100 FOR PFAS IN-SITU CONTAINMENT: A LABORATORY SCALE STUDY
Antonios E. Alvertos1, Michael S. Donovan2, John M. Allen3, Ash McCartney4,
Chadi S. El Mohtar1
1Department of Civil, Architectural and Environmental Engineering, The University of Texas at Austin, 301 E Dean Keeton St., Austin, TX 78712, USA 2Minerals Technologies Inc., 2870 Forbes Ave., Hoffman Estates, IL 60192, USA 3CETCO Environmental Products, 35 Highland Ave., Bethlehem, PA 18017, USA
4CETCO Environmental Products, 101/434 St. Kilda Rd., Melbourne, VIC 3004, AUSTRALIA [email protected]
INTRODUCTION In U.S.A., PFAS in the environment are now considered Contaminants of Emerging Concern, and the U.S. Environmental Protection Agency (EPA) has already begun a regulatory development process for listing them as Hazardous Substances. Available technologies for soil and sediment remediation of PFAS include: thermal treatment with incineration, excavation and disposal in landfills, in-situ solidification/ stabilization (ISS) with activated carbon and modified minerals, in-situ capping, and a suite of destructive techniques with few published data, such as ball milling, and advanced oxidation/ reduction (Ross et al., 2018). Among those, ISS is highly promising for field-scale exploitation due to its relatively low total cost, practicality, and elimination of the need for ex-situ PFAS-treatment. However, PFAS-leaching on such a large scale has not been researched in-depth, and there are only few published studies on the laboratory-scale performance of sorptive media with soil (Hale et al., 2017; Das et al., 2013; Kupryianchyk et al., 2016). This paper presents the results from a laboratory-scale study to assess the effectiveness of the ISS technology in reducing the leaching potential of PFAS. An Aqueous Film Forming Foam (AFFF)-contaminated soil, obtained from a hotspot at a former U.S. military installation, was treated with Ordinary Portland Cement (OPC) and Fluoro-Sorb® 100 (a modified clay) to evaluate their effectiveness in minimizing leaching of PFAS compounds. METHODS Sandy soil was sampled from a heavily PFAS-impacted (initial available leaching content for the sum of 32 PFASs analyzed was around 45,000 ng/ L [ppt]) Fire Fighting Training Area (FTA) from a decommissioned Air Force Base (AFB) in the U.S. The soil was treated with 14 different design mixtures, comprised of a binder, namely OPC at dosages spanning 1-10 % wbinder/ wsoil-dry, for solidification purposes, and a sorptive media, namely Fluoro-Sorb® 100 at dosages spanning 0-8 % wsorbent/ wsoil-dry, for the PFAS immobilization, and tested with three methods of the U.S. EPA Leaching Environmental Assessment Framework (LEAF). A control group with soil treated with OPC alone at dosages 3%, 5%, and 10 % w/w was used to determine whether a PFAS-related ISS approach based only on OPC could be efficient. 2 in. x 4 in. cylindrical specimens were molded in triplicates per design mixture, and left to cure for 28 days under controlled humidity. Two specimens were used for U.S. EPA Methods 1313 and 1316, which provide an estimate of the available leaching content (ngPFAS(s)/ gmix(s)) of immobilized PFAS over a pH (Method 1313) and liquid-to-solids ratio (L/S; Method 1316) range, for near equilibrium solid-to-liquid partitioning conditions. The specimens were first ground and sieved through a sieve No. 10, and 40.0 g-dry were added in HDPE extraction vessels containing reagent grade water (RGW) at their natural pH, and at L/S-levels of 2, 5, and 10, and agitated in an end-over-end fashion at 28 rpm for 48 hours. One intact specimen was then allotted for U.S. EPA Method 1315, which is used to determine the diffusion-driven rate of mass transport from monolithic materials, by immersing it in an RGW-bath, and periodically (after 2 hours, 1 day, 2 days, 7 days, 14 days, 28 days, 42 days, 49 days, and 63 days cumulative time) transferring it to a fresh bath.
M32c
Copyright © CRC CARE Pty. Ltd., 2019
CleanUp Conference 2019Adelaide, Australia
8 –12 September 2019131
Table of Contentsfor this manuscript
RESULTS AND DISCUSSION A suite of 32 PFAS was analyzed with Liquid Chromatography/ Mass Spectrometry (LCMSMS) for the eluate of each specimen. As opposed to the near neutral pH of soil-alone (pH = 7.63), the pH of the design-mixture eluates ranged from 10.79 to 12.67, regardless of the presence or not, of Fluoro-Sorb® 100, which is attributed to the production of the highly alkaline Ca(OH)2 upon reaction of OPC with water. PFAS-concentrations from U.S. EPA Methods 1313 and 1316 were comparable for all three L/S values, suggesting that leaching was insensitive to the L/S parameter, therefore the data of both methods were combined. Without Fluoro-Sorb® 100, the available leaching content in the mixtures was at the same order of magnitude of untreated soil. For treatment with 3% w/w OPC-alone, the leachable content increased by a factor of 1.7, suggesting that the use of OPC, without any sorptive media, for PFAS-related ISS is unfavorable, which is attributed to the increase of PFAS mobility in alkaline environments. Some PFAS were more efficiently stabilized than others with different mixtures. For instance, Perfluoroalkyl Carboxylic Acids (PFCAs) were reduced to near non-detection concentrations for all mixtures containing Fluoro-Sorb® 100, regardless of OPC content, while some Perfluoroalkyl Sulfonic Acids (PFSAs), such as PFHxS and PFOS leached out at 10-40 ppt concentrations. Treatment with 5% w/w Fluoro-Sorb® 100 yielded the least leaching, with an average value for all 32 PFAS of 46 ppt, along with an OPC-independent behavior. In terms of diffusion-driven leaching, the average cumulative mass release of all 32 PFAS at the end of the leaching period, for the OPC-only design mixtures was around 4,000,000 ng/ m2, compared to an average value of 100,000 ng/ m2 for the design mixtures containing at least 1% Fluoro-Sorb® 100. The mixture with 5% w/w Fluoro-Sorb® 100 and 8% w/w cement had the best performance, with 58,500 ng/ m2 cumulative mass release over 63 days, suggesting that the adverse effect of OPC in destabilizing the PFAS was less prominent, when leaching was diffusion-governed, rather than a near equilibrium solid-to-liquid partitioning phenomenon. CONCLUSIONS The combined use of OPC and a modified clay was very effective in minimizing the U.S. EPA Methods 1313 and 1316-relevant available leaching content of PFAS in soil by up to 1,000 times, reducing it for 6 out of the 14 mixtures tested below the U.S. EPA Health Advisory Level (HAL) of 70 ppt. While significant reduction in leaching potential was achieved with just 1% w/w Fluoro-Sorb® 100 for all OPC-levels, using OPC alone was not effective in PFAS immobilization. The addition of OPC altered the pH levels in the soil, which in turn mobilized PFAS analytes that were not leachable under natural pH levels. When a diffusion-driven leaching process was simulated, which is more relevant to ISS field-scale scenarios, with the overly conservative U.S. EPA Method 1315, we concluded that addition of Fluoro-Sorb® 100 (even the lowest dosage of 1% w/w) had a significant long-term stabilization impact, similar to that observed in U.S. EPA Methods 1313 and 1316, with the PFAS-mobilizing effect of OPC-alone being less highlighted in this case. REFERENCES Das, P., Arias E., V., A., Kambala, V., Mallavarapu, M., and Naidu, R. (2013) Remediation of
Perfluorooctance Sulfonate in Contaminated Soils by Modified Clay Adsorbent-A Risk-Based Approach. Water Air and Soil Pollution. 224: 714-1728.
Hale, S., E., Arp, H., P., H., Slinde, G., A., Wade, E., J., Bjørseth, K., Breedveld, G., D., Straith, B., F., Moe, K., G., Jartun, M., and Høisæter, Å. (2017) Sorbent Amendment as a Remediation Strategy to Reduce PFAS Mobility and Leaching in a Contaminated Sandy Soil from a Norwegian Firefighting Training Facility. Chemosphere. 171: 9-18.
Kupryianchyk, D., Hale, S., E., Breedveld, G., D., and Cornelissen, G. (2016) Treatment of Sites Contaminated with Perfluorinated Compounds Using Biochar Amendment. Chemosphere. 142: 35-40.
Ross, I., McDonough, J., Miles, J., Storch, P., Kochunarayanan, P., T., Kalve, E., Hurst, J., Dasgupta, S., S., and Burdick, J. (2018) A Review of Emerging Technologies for Remediation of PFASs. Remediation. 28: 101-126.
132
Table of Contentsfor this manuscript

A LOW-WASTE ELECTROCHEMICAL PROCESS FOR REMOVING PFAS FROM WATER TO NON-DETECT LEVELS
Brent Davey1, Abbas Alghurabi2, Elliott Lewis2
1LogiCamms Consulting Pty Ltd, Level 1, 17 Cotham Rd, Kew, 3101, AUSTRALIA
2ECOtek Water Systems, 3264 Old Princes Hwy, Monarto, 5254, AUSTRALIA [email protected]
INTRODUCTION Per- and poly-fluorinated alkyl substances (PFAS) are now widely recognized as significant and ubiquitous contaminants, due to their chemical stability and environmental mobility. Typically released to the environment as constituents of aqueous film-forming foams (AFFF) used for fighting liquid fuel fires, perhaps 2000 different congeners may be present. However, the health and ecological effects of only a handful of the most common PFAS species are currently known, and remain controversial. Current technologies for removing PFAS from water, typically based on adsorption to activated carbon, struggle to remove all species, and produce a large amount of PFAS-contaminated solid waste requiring destruction. LogiCamms and ECOtek have been collaborating since mid-2016 to develop a process for removing all PFAS species from water, such as fire training ground runoff and groundwater, while producing a minimum volume of highly-concentrated PFAS waste. Our objective has been to develop a treatment technology that
• can remove any and all species of PFAS from water to non-detect levels • can accommodate the widest range of input PFAS concentrations and water
parameters, including iTDS, electrical conductivity and organic matter • produces minimal volumes of wastes • produces treated water at a cost of cents per kiloliter rather than cents per litre.
METHODS We have conducted successful large-volume bench-scale batch trials of a process that makes reverse osmosis (RO) an acceptable method for treating PFAS, by dramatically reducing the volume of PFAS-containing material for disposal. To do this, we have used a proprietary electrochemical technology (called ELADO) to strip PFAS from the RO rejectate. This process capitalizes on the affinity for the fluorocarbon moiety of most if not all PFAS species of hydrated metal oxy-hydroxide complexes generated in situ. The evolved gases from the electrolysis also contribute by physically sweeping the PFAS-hydroxide complexes out of the treated water. Our trial data (Table 1) indicates that there are a wide variety of variables that contribute to separation efficiency and in turn to the overall cost of the process. Importantly, our trials suggest that the process could be powered by a solar PV array, and that the configuration of the electrochemical treatment cell is critical to process efficiency. We are currently developing a containerized pilot plant to run industrial-scale treatment trials in the field and expect to commission this plant in late August 2019. One of the major variables to be addressed with this pilot plant is concentration of the PFAS waste, which we expect to be reduced to as little as a few grams of dry material per kilolitre treated. Initially, this solid waste will be consigned for thermal destruction by an accredited facility, but our process has the potential to include an on-site destruction unit. RESULTS AND DISCUSSION Our electrochemical technology has been shown and verified to reduce total PFAS from input levels exceeding 11 mg/L total PFAS (28 species) to less than 100 ng/L in our large-scale laboratory system.
M32d
Copyright © CRC CARE Pty. Ltd., 2019
CleanUp Conference 2019Adelaide, Australia
8 –12 September 2019133
Table of Contentsfor this manuscript

Table 1. Selected analytical results from bench trials T
rial
Num
ber
Tim
e (m
in)
Proc
ess
pre-
set
(ele
ctro
de c
onfi
g &
po
wer
)
Tim
e (m
in)
Proc
ess
pre-
set
(ele
ctro
de c
onfi
g &
po
wer
)
[PFA
S] s
tart
(m
g/L)
[PFA
S] f
inis
h (
mg/
L)
% P
FAS
rem
aini
ng
% r
educ
tion
in P
FAS
[TO
F] s
tart
(m
g/L)
[TO
F] f
inis
h (
mg/
L)
% T
OF
rem
aini
ng
% r
educ
tion
in T
OF
PFA
S /
TO
F
1 10.8 15.0 0.72310 11.1 15.0 0.739
2 60 1 10.8 8.7 80% 20% 15.0 8.7 58% 42% 1.0023 30 2 30 1 10.8 8.2 76% 24% 15.0 8.0 53% 47% 1.0248 60 3 10.8 12.6 116% -16%9 120 3 10.8 5.8 53% 47%11 15 4 11.1 9.4 85% 15% 15.0 16 107% -7% 0.58612 30 4 11.1 8.1 73% 27% 15.0 10 67% 33% 0.81413 60 4 11.1 6.1 55% 45% 15.0 7.3 49% 51% 0.83016 15 4 15 1 11.1 5.9 53% 47% 15.0 8.5 57% 43% 0.69518 60 4 60 1 11.1 4.2 38% 62% 15.0 3.2 21% 79% 1.31320 180 4 180 1 11.1 6.7 61% 39% 15.0 6.5 43% 57% 1.03321 15 3 11.1 8.6 78% 22% 15.0 16 107% -7% 0.54023 60 3 11.1 5.4 49% 51% 15.0 5.8 39% 61% 0.93324 105 3 11.1 5.8 52% 48% 15.0 4.1 27% 73% 1.40626 20 5 11.1 5.5 50% 50% 15.0 3.7 25% 75% 1.48627 40 5 11.1 3.9 35% 65% 15.0 1.4 9% 91% 2.78628 60 5 11.1 5.0 45% 55% 15.0 3.2 21% 79% 1.55229 80 5 11.1 4.4 40% 60% 15.0 4.6 31% 69% 0.957
30 8.54 0.003 0.034% 99.966%
30 8.54 35.13 411% 411%
Total [PFAS] (28 species) Total Organic FluorineTreatment 1 Treatment 2
UNTREATED (PFAS-contaminated) WATER:
ELADO PROCESS STAGE:
REVERSE OSMOSIS STAGE - FILTRATE
REVERSE OSMOSIS STAGE - REJECTATE
CONCLUSIONS Our trialling to date confirms that a combination of Reverse Osmosis with our ELADO technology will remove PFAS from water to very low levels, producing very small volumes of waste while requiring no addition of chemicals. The industrial pilot plant will improve on these results, largely as a consequence of predicted improvements arising from the scale-up, based on current data. Our full-scale trials are designed to provide data for optimising clean water output and PFAS removal in our process train and to quantitate the energy inputs and waste stream outputs –results available at the time of presentation will be presented in detail.
134
Table of Contentsfor this manuscript

LARGE SCALE PFAS REMEDIATION PROGRESS AT RAAF BASE WILLIAMTOWN, NSW, AUSTRALIA
Luke McLeod1, Paul McCabe2
1PFAS Investigation & Management Branch, Infrastructure Division,
Department of Defence, Canberra , ACT, AUSTRALIA 2AECOM Australia Pty Ltd, PO Box 410, QVB PO Sydney 1230, AUSTRALIA
[email protected], [email protected]
OVERVIEW This paper summarises progress in what is among the world’s largest and most complex PFAS remediation projects. RAAF Base Williamtown is a major 900 ha military and civilian airbase located north of Newcastle in NSW. The site is located on a sandy coastal plain with shallow groundwater and complex interactions between surface water runoff and groundwater. Aqueous film forming foam containing PFAS had been intensively used in firefighting training and emergency response with over decades between mid 1970s and early 2000s. Large scale on and off-base PFAS contamination was first reported at RAAF Base Williamtown in Late 2015. Subsequent investigations have confirmed at least 7 primary and secondary PFAS source areas with extensive migration via surface water and groundwater pathways. PFAS has been detected in a groundwater plume covering more than 25km2 and in a wide range of media including soil, sediment, surface water, and a range of biota. A 50km2 management area includes private homes, farms, industrial facilities and fisheries. Management and remediation has been underway since 2015 and involved multiple risk-based initiatives including: RECEPTOR MANAGEMENT Testing of 240+ private water supply bores; provision of alternate water supplies including connection to reticulated water; Health advisories re avoiding groundwater consumption and surface water exposure, moderating consumption of fish, eggs, beef, home grown produce; ongoing community engagement. PATHWAY MANAGEMENT Treatment of surface water runoff in 2 major drains via granular activated carbon and ionic resin filtration plants; impacted sediments have been excavated from kilometres of drains and a groundwater pump and treat system using ionic resin filtration is in development south of the base and off-base drainage modification is underway. SOURCE MANAGEMENT Soil stabilization trials; excavation of soils from a former fire training area and storage in an on-site landfill cell, in conjunction with groundwater plume capture via pumping and treatment with ionic resin. RESULTS/LESSONS LEARNED The paper summarises some of the key progress being made and the relative performance of the range of strategies implemented, including progress with reducing groundwater plume extent and mass flux.
M32e
Copyright © CRC CARE Pty. Ltd., 2019
CleanUp Conference 2019Adelaide, Australia
8 –12 September 2019135
Table of Contentsfor this manuscript

VEG TECHNOLOGY FOR EX-SITU THERMAL DESORPTION OF POLY- AND PERFLUOROALKYL SUBSTANCES
Mehrdad Javaherian
Endpoint Consulting, Inc., 5 S. Linden Ave., Suite 2, South San Francisco, CA 94080, USA
INTRODUCTION Since 2013, Endpoint’s Patented Vapor Energy Generator (VEG) Technology has been successfully applied for thermal treatment of the full suite of organic compounds and select metals in soils, and for thermally enhanced LNAPL recovery. Both in-situ and ex-situ applications of this highly mobile and cost-efficient technology have consistently achieved soil remediation standards meeting unrestricted land use for petroleum hydrocarbons, chlorinated solvents, pesticides, PCBs and dioxins, munitions constituents and chemical warfare agents, arsenic, and mercury. The technology has received special recognition performance and health and safety awards from the US Army Corps of Engineers (USACE), and has been the subject of multiple articles and publications. The ex-situ component of the VEG Technology has been expanded to treat poly- and perfluoroalkyl substances (PFAS) in soil, liquid wastes, and spent absorbent media (e.g., granulated activated carbon [GAC]), with multiple successful applications that have proven far more effective and cost-efficient relative to offsite disposal and incineration options, and in-situ methods targeting immobilization, chemical oxidation, or bioremediation. Treatment of PFAS using the VEG Technology has achieved complete desorption of the full suite of PFAS compounds utilizing steam temperatures on the order of 1500 F and at soil temperatures ranging from 750 F to 950 F, with complete destruction, via thermal oxidation, of the desorbed PFAS at temperatures occurring at temperatures on the order of 1,800 F to 2,000 F. The VEG’s filtration system has further removed all remaining thermal oxidation and filtration by products, including hydrogen fluoride (HF) gases, thereby eliminating emissions of PFAS compounds via the technology’s patented closed-loop system. The VEG’s filtration system further converts all available carbon within the desorbed waste stream into a renewable source of fuel, with the resulting syngas used in part to fuel treatment operations. METHODS Treatment of PFAS using the VEG Technology has been successfully implemented in three independent treatment configurations; 1) An initial 2016 bench-scale treatment study performed in continuous-feed mode within a scale-modified, fully-enclosed, truck-mounted treatment chamber, where treatment temperatures ranging from 900 F to 1750 F were tested on a partial list of PFAS compounds; 2) 2018/2019 pilot and full-scale studies performed in batch-feed mode, where ex-situ treatment of soil, soil IDW, and GAC was performed within configured stockpiles (i.e., in-pile treatment) isolated from the atmosphere and ground surface via a temperature-resistant vapor cap, wherein optimal treatment temperatures for the heat source (steam at 1,500 F), treatment material (soil/GAC at 750 to 950 F), and thermal oxidation (1,800 to 2,000 F oxidation temperature) were identified as necessary to achieve target unrestricted reuse remediation goals and full destruction of PFAS and capture of associated HF gases; and 3) 2018/2019 full-scale treatment of soil IDW performed within 55-gallon drums, eliminating the need for disposal of the IDW. RESULTS AND DISCUSSION (a) The 2016 bench-scale study established the preliminary proof of concept that PFAS
compounds can be thermally desorbed from sandy, low-moisture content soils, resulting in post-treatment concentrations of key PFAS compounds to below laboratory detection
M32f
Copyright © CRC CARE Pty. Ltd., 2019
CleanUp Conference 2019Adelaide, Australia8 –12 September 2019 136
Table of Contentsfor this manuscript

limits. The upper limit of the material temperature resulting in complete desorption of key PFAS compounds was further established at 1,750 F.
(b) Subsequent studies in 2018/2019 targeted finer-grained and higher moisture-content soils, replicated the findings of the 2016 bench-scale study relative to achieving complete desorption relative to the full suite of PFAS compounds per the modified USEPA Method 537. These studies further identified optimal treatment temperatures and durations (see Table 1), estimates of fuel consumption, and the number of VEG thermal units required to treat multiple 50 to 100-cubic yard soils simultaneously, allowing for estimation of full-scale remediation costs which remain well below other alternatives. Lastly, the 2018/2019 batch-feed in-pile treatment studies further confirmed the temperatures required to thermally oxidize PFAS concentrations at a 99% treatment efficiency, and confirmed that potassium hydroxide is the preferred caustic soda for scrubbing of HF gases resulting from the PFAS oxidation process.
(c) In-drum IDW treatment studies in 2018 and 2019 confirmed that liquid IDW containing PFAS may be transformed into steam, which after scrubbing of HF gases may be used as the heat source to thermally desorb PFAS-laden IDW housed within 55-gallon drums.
Table 1. Application of the VEG Technology for Thermal Treatment of PFAS in Soils
VEG
Technology Mode
Volume of Soil
Treated
Soil Type
Pre-Treatment PFAS
Concentration (ug/kg)
Soil Temperature
Yielding Optimal
Treatment Results
(F)
Treatment Duration
Number of PFAS
Compounds Analysed
Post-Treatment PFAS
Concentrations
Continuous Feed Bench-
Scale Test (2016)
3 cubic yards
Sand (8% moisture)
56,000 to 87,000
1,750 30 minutes 10 <0.1
Batch-Feed In-Pile Pilot
Tests (2018/2019)
250 cubic
yards (Five 50-cubic
yard piles)
Sandy/ Clayey
Silts (18% moisture)
2,380
850
55-76 hours
39
<0.3
Batch-Feed IDW Drum Treatment
(2018/2019)
Thirty-eight 55-gallon
drums
Mixed
Sediments (25%
moisture)
540
750
20 minutes
39
<0.3
CONCLUSIONS Thermal desorption is a viable alternative for removal of the full suite of PFAS compounds from soils, with similar applications to spent absorbent media and drummed IDW. With a proven track record of applications on a wide range of other contaminants in soil, the VEG Technology has been adapted to offer several solutions for ex-situ treatment of PFAS in soils at fraction of the costs of alternatives such as offsite disposal and incineration, allowing for unrestricted reuse of soils while fully treating, and where applicable, recycling the resulting vapor stream into the treatment process. The technology is highly mobile and particularly applicable to remote sites with significant space and access limitations, and further employs a filtration process which yields a negligible volume of a typically benign, non-hazardous liquid solution as its sole by-product.
137
Table of Contentsfor this manuscript
METHANE DETECTION EQUIVALENCY AND WHY METHANE MATTERS IN THE REMEDIATION FIELD: GUIDANCE FOR
REGULATORS AND THE REGULATED COMMUNITY
Ona Papageorgiou, Marie Barnes, Nathan Putnam, Suzanne Hagell
New York State Department of Environmental Conservation, 625 Broadway, Albany NY 12233 USA
INTRODUCTION Methane venting and leaks have come into sharp focus in multiple disciplines including the field of remediation. While methane has not traditionally been the focus for remediation experts, it has come into the scope of work. As such, it has become more important that remediation personnel find tools and develop methodologies for methane detection. Once tools are utilized and a methodology is developed, the detection and remediation of leaks may be addressed quickly which is valuable in the overall management of a site. METHODS Methane emissions are currently estimated using a variety of tools and emission factors including those provided in LandGEM, USEPA and regional tools. From those tools and estimations, emission inventories are created which drive regulation. There are currently only two main technologies accepted by the United States Environmental Protection Agency for leak detection: USEPA Method 21 (Method 21) and optical gas imaging (OGI), with each offering advantages and disadvantages. In October 2018, the US Intrastate Technology and Regulatory Council (ITRC) issued a Technology Document, Innovative Methane Detection Technologies, which may be used as a tool to develop a methodology to select the most appropriate methane detection technology. The ITRC methodology was developed by integrative teams of federal/state regulators, academia, industry, and technology vendors with a goal to develop technical and regulatory documents to inform on key new technologies and methodologies. RESULTS AND DISCUSSION Methane emissions are calculated either by an engineering calculation multiplying a throughput by a known emission factor. Emission factors are often based on measured results using methane detection technology. It is important to incorporate recent and validated methane detection to upgrade emission factors resulting in better inventories. Measuring or identifying methane leaks or venting requires the use of appropriate technology dependent on the type of methane vent or leak presented. Utilizing the ITRC document enables users to evaluate, compare, and select suitable technologies to detect/quantify methane emissions from segments of the oil and gas (O&G) supply chain to comply with existing and forthcoming leak regulations, assist with inventory monitoring and reporting, and enhance safety. To clarify the system objectives, the following must be clarified.
• The ultimate objective of the leak detection system • The typical size and complexity of target sites • The spatial distribution of target sites • The environmental and meteorological challenges that apply • Data and system requirements • Regulatory requirements or barriers
M33a
Copyright © CRC CARE Pty. Ltd., 2019
CleanUp Conference 2019Adelaide, Australia8 –12 September 2019 138
Table of Contentsfor this manuscript

Regulations sometimes mandate the use of a specific technology for environmental compliance despite other appropriate technology availability. In order to promote innovation, regulations may include a process for permitting the use of alternative technologies. Typically, operators or technology developers are required to submit data that prove the alternative technology is equivalent or better than the default technology at achieving target metrics such as detecting leaks of a certain emission rate or reducing site-level emissions. Equivalency determinations can be classified into two groups: 1) equivalent assessment of individual emission sources, and 2) equivalent reduction of aggregate emissions. CONCLUSIONS • Innovative methane detection and quantification technologies should be evaluated with a
technology-neutral process that clearly defines the objectives of the system with testable metrics.
• Objectives can be based on concentration, emission sources, or emission reductions. • Other objectives may include equivalency to other technologies and work practices,
which also can be defined at the concentration, source, or reduction level. • For many technologies, emission source detection limit and response time is a complex
function of many parameters such as wind direction that can be determined with empirical testing and/or physics-based modeling.
• For reduction-based objectives, computer modeling can be used to predict emission reductions at the site or population level based on the technology’s probability of detection and parameters related to emission mitigation work practices.
• A combination of scientifically rigorous empirical testing and modeling can fairly assess the ability of diverse technologies and approaches to meet stakeholder objectives.
REFERENCES ITRC (2018). Innovative Methane Detection Technology. METHANE-1. Washington, D.C.:
Interstate Technology & Regulatory Council. www.itrcweb.org.
139
Table of Contentsfor this manuscript

SOIL GAS DATA UTILIZATION: ITALIAN GUIDELINES AND THE RISK-NET 3.1 PRO HHRA SOFTWARE
A. Girelli1, R. Baciocchi2, I. Verginelli2
1Industria Ambiente srl, Genoa, ITALY
2University of Rome Tor Vergata, Rome, ITALY [email protected]
INTRODUCTION Soil gas data have become a key information in the development of Human Health Risk Assessment (HHRA) at sites contaminated by Volatile Organic Compounds (VOC). Despite the data provided refer to a matrix “closer” to the receptor than the effective source of contamination (soil or groundwater), still the soil gas data need to be managed in order to get the expected concentration in either indoor or outdoor environment to which the receptor is exposed. This can be done using the diffusive model solutions outlined in the ASTM E-2081-00 Standard Guide for Risk-Based Corrective Action and ASTM E-1739-95 Standard Guide for Risk-Based Corrective Action Applied at Petroleum Release Sites. Recently, the US EPA introduced screening attenuation factors between soil gas and ambient air concentrations, estimated relying on an extensive database built upon US case studies. Recently, also the Italian environmental agency issued a guideline for the use of soil gas data, following a similar approach, although with a more conservative choice of the screening attenuation factor and in a completely different national framework for remediation of contaminated sites (ISPRA 2018). The Risk-net software was designed to perform the calculations required for the Risk-Based Corrective Action (RBCA) planning process, as defined in the Italian national guidelines for risk assessment that are based on the ASTM E-2081-00 Standard Guide for Risk-Based Corrective Action and ASTM E-1739-95 Standard Guide for Risk-Based Corrective Action Applied at Petroleum Release Sites. The software can also handle soil gas data and provide two options for the user: one relying on the ASTM approach and another relying on the use of default attenuation factors proposed by the Italian environmental agency. In this work we will first discuss the main issues and novelty of the Italian guidelines on the soil gas measurement, with special interest on the implication that these guidelines have in terms of the use of these data within the HHRA framework. Then, we will briefly discuss the Risk-net 3.1 Pro software, with specific interest on the section dealing with soil gas data. The impact of using either the ASTM approach or the screening attenuation factor proposed by the national environmental agency will be shown through a series of case studies and examples. MODEL DESCRIPTION Risk-net 3.1 Pro allows the user to apply the risk assessment procedure both in forward and backward mode, thus evaluating the risk or the clean-up levels for a contaminated site. Namely for each exposure pathway activated by the user, Risk-net calculates, through the Fate and Transport models described in the ISPRA guidelines (2008), the maximum steady-state concentrations expected at the point of exposure. Afterward, on the basis of exposure parameters defined by the user, the daily dose assumed by each receptor considered is calculated. These doses combined with the corresponding toxicological parameters are used for the calculation of risk and clean-up levels for each contaminant and active route. Finally the effects related to the presence of multiple routes of exposure and multi-component contamination are calculated. The results are returned in terms of risk (for human health and groundwater resource protection) and clean-up levels. Intermediate outputs are also displayed allowing the user to evaluate more critically the obtained results.
M33b
Copyright © CRC CARE Pty. Ltd., 2019
CleanUp Conference 2019Adelaide, Australia8 –12 September 2019 140
Table of Contentsfor this manuscript

The software uses a simple and user-friendly graphical interface through which the user can define the different input parameters. To accelerate the compiling process, according to the conceptual model of the site defined by the user, only the data used in the calculation is required. The key features of Risk-net 3.1 Pro include:
• Risk-Based Cleanup Level Calculations: Risk-net completes all calculations required for Tier 1 and Tier 2 RBCA evaluations, including risk-based exposure limits and attenuation factor derived from simple fate and transport models.
• Fate and Transport Models: Validated analytical models for air, groundwater and soil exposure pathways, including all models used in the ISPRA (2008) standard.
• Chemical and Toxicological Database: Integrated toxicological and chemical parameter library preloaded (national Italian database). The database is customizable by the user, including import features for management of external database.
• User-Friendly Interface: Point-and-click graphical user interface with on-line help and Load/Save capability.
RESULTS The ambient air concentration (indoor and outdoor) estimated using the Risk-net 3.1 Pro software with the ISPRA default attenuation factor (0.1), if compared with the concentration estimated using the ASTM models for outdoor volatilization and vapour intrusion, showed that clearly the approach proposed by ISPRA leads to values of several orders of magnitude higher. This has a direct and proportional effect on inhalation risks for exposed receptors. Using the ISPRA default attenuation factor, unacceptable risks are found also for sites characterized by concentration below the SSTL or even the RBSL concentration, whereas using the ASTM model this paradox was never found. CONCLUSIONS The Risk-net Pro 3.1 was tested at different contaminated sites for assessing inhalation risks estimated from soil gas data. The tool can be used following completely the ASTM approach or selecting other options foreseen by ISPRA (2008,2018). The choice done was shown to severely affect the outcome of the HHRA procedure. Risk-net can be downloaded for free from the website of the Reconnet network (Italian Network on the Management and Remediation of Contaminated Sites) at www.reconnet.net. REFERENCES ASTM (1995). Standard Guide for Risk- Based Corrective Action Applied at Petroleum
Release Sites. American Society for Testing and Materials, West Conshohocken, PA, E 1739–95 (1995, Re-approved 2002).
ASTM (2000). Standard Guide for Risk-Based Corrective Action. American Society for Testing and Materials. Standard E2081-00. West Conshohocken, PA.
ISPRA (2008). Methodological Criteria for Absolute Risk Analysis Application at Contaminated Sites. Italian Environmental Protection Agency and Technical Services. Available at: www.isprambiente.it. (in Italian)
ISPRA (2018). Linee Guida SNPA 17/2018 Operating procedure for the evaluation and use of data from interstitial gas measurements within human health risk assessment at contaminated sites. Available at: www.isprambiente.it. (in Italian)
141
Table of Contentsfor this manuscript

DIAGNOSTIC TOOL FOR METHANE SOIL GAS EMISSION AT AGED HYDROCARBON FUEL CONTAMINATED SITES
Dawit Bekele1,2, Yanju Liu1, Mezbaul Bahar1, Sreenivasulu Chadalavada2, Ravi Naidu1,2
1Global Centre for Environmental Remediation (GCER), The University of Newcastle,
Callaghan NSW 2308, AUSTRALIA 2CRC CARE Pty Ltd, ATC Building, The University of Newcastle, Callaghan NSW 2308,
AUSTRALIA [email protected]
INTRODUCTION Contamination of petroleum hydrocarbons (TPH) is currently regarded as one of the most predominant environmental contaminants due to the widespread production and use in our day-to-day activities. Methane soil gas (CH4) formation at TPH contaminated sites and its transport toward the ground surface are important to understand its health risk and safety hazard. The co-presence of CH4 and other volatile organic compounds (VOCs) in soil gas near overlaying built structure may have undesirable consequences exacerbating vapour intrusion (VI) risk. In addition, the production of CH4 at TPH contaminated sites may pose difficulties in selecting appropriate remedial measures and factors in environmental liability. Vapour intrusion from VOCs such as TPH and chlorinated solvents at contaminated sites is relatively well established. However, the evaluation of CH4 at VI impacted sites is fundamentally different from the evaluation of VOCs and requires a different conceptual site model. Unlike VOCs, there is no fixed starting mass of CH4 at a site that results in a hazard as CH4 can be generated in situ over time when subsurface environments are conducive. Unlike VOCs, the CH4 hazard is acute rather than chronic. With VOCs, the focus is almost always on chronic exposure and therefore VI evaluations address long-term average concentrations. In contrast, with CH4 the worst-case short-term conditions are of most concern. The relative importance of diffusive versus advective transport is also a key difference between methane vapor intrusion (MVI) and VI from VOCs (Bart, 2010). It has been proposed that MVI sites are fundamentally different and require a unique set of evaluation criteria (Sepich, 2008). Eight sites impacted by diesel groundwater contamination comprising relatively variable geochemistry were evaluated in this study. The research findings presented here with detailed statistical analysis of subsurface monitoring data could be used to develop a screening tool in decision making to evaluate the potential CH4 production at TPH contaminated sites. METHODS In this study, the potential CH4 production in the vicinity of eight long-term diesel-contaminated unconfined aquifer was investigated at the site in Western Australia. An extensive soil gas CH4 assessment was conducted across the contaminated sites using groundwater wells as well as soil gas wells across the site. Groundwater sample and unsaturated soil samples (i.e., soil sample during the soil gas well installation) were collected at approximately 1 m above the groundwater table and analysed for the microbial community for both methanogenic and methanotrophic organisms. Soil microbial diversity analysis was conducted by the Australian Genome Research Facility (AGRF). The locations of soil vapour monitoring wells were within and outside the inferred extent of TPH groundwater plume. Consequently nested soil gas well i.e., deep well (~1 m above the water table), intermediate soil gas well, sub-slab soil gas well at the selected building and/or shallow soil gas well underneath a large paved structure at the investigation area were installed near selected groundwater. Samples were analyzed for VOCs using TO-15 canister system (U.S. EPA, 1997) and bulk gases (CH4, CO2, He, N2, and O2) was undertaken by GEM 2000 landfill gas analyzer calibrated in accordance with the manufacturer’s guidelines. Concurrent
M33c
Copyright © CRC CARE Pty. Ltd., 2019
CleanUp Conference 2019Adelaide, Australia8 –12 September 2019 142
Table of Contentsfor this manuscript

assessment of groundwater samples from the nearby existing groundwater well was conducted at the time of soil gas sampling. RESULTS AND DISCUSSION The groundwater quality monitoring data were evaluated to assess the conditions which initiate the biodegradation of TPH and the mangrove mud aquifer under anaerobic and therefore reducing aquifer system. Among the eight sites investigated, the results showed that CH4 concentrations ranged from below detection limits to a maximum of 90.1%, which was reported for the Site -1 (well # NP SV014) and 87.5% at other locations within the site (GW_168, located at TCB#1). The CH4 production at the study sites has been complicated due to the presence of mangrove mud aquifer (i.e., highly organic sediments) resulting in compounding CH4 sources. The comprehensive and contemporaneous field data collected were conducted both vertically and spatially across the plume. Subslab, vadose zone and indoor air soil gas wells, soils, and groundwater samples, were analysed for geochemistry, soil gas concentrations, and microbial community and other parameters to determine the relative contributions from different possible sources. The method was developed for identifying the driving factors for CH4 source at TPH contaminated sites and source separation at the site using statistical categorisation of the data, analysis of CH4 values and soil gas profiling (refer to figure below). CH4 emission at the site was found to be linked with microbial degradation of TPH contaminated aquifers as well as emission from the naturally occurring mangrove mud aquifer. Therefore, the formulated method is useful in decision making for detailed contamination assessments and management and remediation measures. The extensive contemporaneous field data could be used to develop and/or validate a screening and decision support tool to evaluate the potential CH4 production at TPH contaminated sites. The tool can be used as decision support for environmental managers to make effective decisions, which will save time and resources.
REFERENCES Bart, E., 2010. Proposed Regulatory Framework for Evaluating the Methane Hazard Due to
Vapor Intrusion. Presented at the AWMA Vapor Intrusion Conference; 2010, September 29–30; Chicago, IL. http://events.awma.org/education/Final%20Papers/1-Eklund.pdf.
Sepich, J., 2008. Hazard Assessment by Methane CVP (Concentration, Volume, Pressure). Presented at the Sixth Annual Battelle Conference, Monterrey, California. May 19 to 22, 2008.
143
Table of Contentsfor this manuscript

APPROACHES TO MODELLING VAPOUR INTRUSION IN WET BASEMENT CONSTRUCTION SCENARIOS
Victoria Lazenby
Arcadis Australia Pacific Pty Ltd, 32/140 William Street, Melbourne, 3000, AUSTRALIA
[email protected] INTRODUCTION When modelling vapour intrusion into a proposed below ground structure, a variety of methods are currently in use within Australia. These methods include the adaptation of various models such as the WATER9 model (US EPA, 2001), Johnson & Ettinger model (1991), or others. The appropriateness of these models can be questionable, as many of the assumptions are not relevant to the assessment of water seepage through concrete into a basement structure and volatilisation of chemicals from the seepage water into the basement air. This is particularly evident for the use of modelling methods which do not conceptually relate to a barrier seepage scenario. METHODS An overview of the ‘wet basement’ models currently in use in vapour intrusion risk assessment has been undertaken. The review has focused on the conceptual basis upon which they were developed, and the key assumptions behind the calculations. An alternative method for modelling vapour intrusion from seepage water in a basement or similar structure has been developed. This simplified ‘first principals’ approach will be presented as an alternative to the current methods, which are reliant on adapted models which were developed for assessment of different scenarios. RESULTS AND DISCUSSION Models such as WATER9 were developed for assessing emissions from large outdoor water storage ponds, to support the assessment and management of wastewater treatment facilities. The WATER9 model predicts concentrations of volatile chemicals above quiescent wastewater ponds using the following equation: E = KACL
Where E, the air emissions rate from the surface (g/s) is a factor of the overall mass transfer coefficient (K), liquid surface area (A), and concentration in the liquid phase (CL). The overall mass transfer coefficient is derived using a range of calculations to estimate liquid phase and gas phase mass transfer coefficients:
Where factors such as the liquid phase mass transfer coefficient (kl) and gas phase mass transfer coefficient (kG) are calculated based on parameters such as depth of water column, wind speed above the ‘quiescent surface’, and the volumetric flow rate of water in m3/s. The volumetric flow rate value is often calculated based on aquifer properties and does not account for a barrier to flow, such as concrete slabs or walls. Other methods, such as Johnson & Ettinger, are based on the concept that vapours volatilise from soil or groundwater impacts in the vadose zone, from where they migrate through a concrete barrier into an enclosed space. This scenario is also a poor conceptual model for estimating vapour concentrations from water seepage into a basement. An alternative method is possible, whereby a predicted seepage rate of groundwater through concrete and into a sub-surface structure can be calculated, in units of ml/m2/hr. This value can be derived with consideration of conceptually relevant parameters, including concrete
1 = 1 + 1×
M33d
Copyright © CRC CARE Pty. Ltd., 2019
CleanUp Conference 2019Adelaide, Australia8 –12 September 2019 144
Table of Contentsfor this manuscript

porosity and the concrete permeability coefficient. By using this calculated seepage rate, in combination with known groundwater concentrations and a simple mass flux volatilisation approach, an indoor air concentration can be calculated. Comparisons were conducted between models, assuming consistent building parameters (as permitted by the models) and consistent sources of vapours. The comparison of modelled air concentrations indicated a range of up to 6 orders of magnitude variability between estimated basement air concentrations. Johnson and Ettinger estimated the highest air concentrations by a significant margin and is indicative of the issues with using this model for water seepage scenarios. The comparison between approaches indicates that the concrete seepage approach developed by the author provides a reliable, robust and conceptually sound approach to modelling vapour intrusion into a wet basement structure. REFERENCES Johnson, PC and Ettinger RA (1991) Heuristic model for predicting the intrusion rate of
contaminant vapors into buildings. Environ. Sci. Technology. 25:1445-1452. USEPA (2001) Users Guide for WATER9 Software, Office of Air Quality Planning and
Standards, US EPA, February 2001.
145
Table of Contentsfor this manuscript

MULTI-DIMENSIONAL VAPOUR MODELING FOR ASSESSING VAPOUR RISK AT HYDROCARBON CONTAMINATED SITES
Aravind Unnithan1, Dawit Bekele1,2, Sreenivasulu Chadalavada1,2, Ravi Naidu1,2
1Global Centre for Environmental Remediation, The University of Newcastle, University Dr,
Callaghan NSW 2308, AUSTRALIA 2CRC CARE, ATC Building, The University of Newcastle, University Dr, Callaghan NSW
2308, AUSTRALIA [email protected]
INTRODUCTION Vapour Intrusion (VI) is the phenomenon by which volatile organic compounds (VOCs) migrate from the subsurface source through the soil and enter into the overlying buildings affecting the indoor air quality ultimately causing health hazards to the occupants (Yao et al., 2013, Bekele et al., 2013). Health risks associated with hydrocarbon contaminated sites and recommendations of site closure are often made by quantifying the VI risks using mathematical models known as ‘vapour intrusion models’ (VIM). In order to predict the health risk, various factors such as the physical condition of the subsurface, environmental conditions, building operational conditions etc. are commonly evaluated using one dimensional model overlooking the role of preferential pathways like utility lines which act as the path of least resistance for vapour transport thereby increasing the vapour intrusion risks. The extensive networks of utility lines and sanitary sewer systems in the urban areas can significantly exacerbate the uncertainty vapour intrusion investigations especially when it is close to the contaminant source. The backfill soils like sand and gravel surrounding the utility lines can allow the vapours to pass through with relative ease due to its high porosity compared to natural formations. Hence, the lack of appreciation of the role of preferential pathways on the fate and transport of VOC in the vadose zone can result in inaccurate predictions of indoor air vapour concentrations, potential risks and as a consequence wrong clean up approaches. Therefore the present study focusses on the development of a two-dimensional model for predicting the indoor air concentration by considering the effect of preferential pathways on the fate and transport of the contaminant vapours. METHODS The proposed two-dimensional model simulates the fate and transport of chlorinated hydrocarbons in the vadose zone in the presence of a preferential pathway which acts as a path of least resistance for the soil gas flow. The model will be developed considering a site conceptual model (CSM) scenario with a sanitary sewer line running through the vadose zone surrounded by sandy backfill soil which acts as the preferential pathway, as given in Figure 1. The methodology for the model development involves i) A user-specified nodal mesh generation for each discrete layer ii) calculation of effective diffusion in the vadose zone soil and contaminant flux in the preferential pathways in each scenario iii) adjusting chemical and physical parameters at each nodal point iv) simulation of the fate of CHCs. The contaminants are assumed to volatilize from the source to receptor by molecular diffusion and the governing equation for the contaminant mass flux (E) in the soil is given by the Laplace equation as given in equation (1) , (1)
where C = contaminant vapour concentration (g/cm3); (x,y) = the co-ordinates in lateral and vertical direction, LT= Distance from the contamination source to the foundation (cm); DT
eff = Effective diffusion coefficient (cm2/s)
M33e
Copyright © CRC CARE Pty. Ltd., 2019
CleanUp Conference 2019Adelaide, Australia8 –12 September 2019 146
Table of Contentsfor this manuscript

Figure 1: The CSM scenario considered for model development.
HYPOTHESIS The soil gas concentration will be maximum near the source and likely to reduce as it migrates upwards towards the surface due to attenuation of TCE by the soil organic matter until it reaches the backfill soil around the utility line which acts as the preferential pathway. The soil gas concentration around the utility line increases as the rate of vapour transport increases due to the high porosity of the backfill soil. As a consequence, an increase in soil gas concentration in the indoor air more than than expected. The concentration profile of the soil vapour during its transport from source to the receptor is expected to be obtained as in figure 2.
Figure 2: The soil gas concentration profile due to the preferential pathway REFERENCES Bekele, D. N., Naidu, R., Bowman, M. & Chadalavada, S. 2013. Vapor intrusion models for
petroleum and chlorinated volatile organic compounds: Opportunities for future improvements. Vadose Zone Journal, 12.
Yao, Y., Pennel, K. G. & Suuberg, E. M. 2013. Simulating the effect of slab features on vapor intrusion of crack entry. Build Environ, 59, 417-425.
147
Table of Contentsfor this manuscript

RECENT INNOVATIONS FOR IN-SITU AND EX-SITU REMEDIATION
Dan Bryant
Woodard & Curran, 50 Millstone Road, Building 400, Suite 201, East Windsor, New Jersey 08520, USA
[email protected] INTRODUCTION The environmental remediation community continues to benefit from innovations that help practitioners design and implement more effective remedies, overcome challenging geological conditions, address recalcitrant compounds, and improve the performance of existing technologies. Examples of such innovations outlined further below include reagent delivery methods that are optimized for low-permeability aquifer matrices, biogeochemical reactors that provide a flexible option for a wide range of contaminants, treatment technologies for 1,4-dioxane, and the benefits of sulfidation on the reactivity of zero valent iron. Many of these innovations apply to both in-situ and ex-situ remedial designs. This is not a complete summary of all recent innovations in remediation technologies but is instead intended to highlight several examples anticipated to have wide interest. Per- and polyfluoroalkyl substances (PFAS) are not included in this summary because of the detail and interest anticipated in other presentations. HYDRAULIC FRACTURING IN LOW-PERMEABILITY MEDIA Low-permeability silt and clay formations pose a challenge for in-situ remediation. The common approach of injecting an aqueous solution of an oxidant or bioremediation amendment commonly fails due to ineffective amendment distribution. A more recent innovation gaining acceptance for reagent distribution in low-permeability formations is hydraulic fracturing. Dense, viscous solutions of solid reagents can be injected with reliable and predictable distribution. Examples of reagents include zero valent iron, potassium permanganate, and potassium persulfate. The remedy occurs via both deflection of groundwater transport into the injected reagent zone, and (for slightly soluble reagents) by diffusion into the surrounding soil matrix. Case study examples will include both oxidants (potassium permanganate) and reductants (zero valent iron), but many other solid reagents can be injected with this approach. SUBGRADE BIOGEOCHEMICAL REACTORS Subgrade biogeochemical reactors (SBGRs) are groundwater extraction and treatment systems that are generally relatively lower cost and more sustainable than traditional extraction and treatment systems. SBGRs are constructed by excavating a cell, filling the cell with a reactive medium (or media), and passing contaminated groundwater through the cell to infiltrate the underlying formation. In one design the SBGR is constructed over a source area and filled with a treatment amendment; extracted groundwater is passed through the amendment (entraining the amendment into the water and/or directly removing contaminants from the water) and infiltrates into the underlying source area, forming a recirculating treatment cell. The amendment filling the SBGR may include bioremediation amendments, oxidants, or other media. The advantages of SBGRs include lower waste disposal costs, improved water resource management (returning water to the aquifer in lieu of discharge to a sewer or surface water body), and design flexibility. Case study examples will include bioremediation amendments, but the concept is extremely flexible thus many other options are possible. 1,4-DIOXANE Although natural degradation of 1,4-dioxane has been recognized in several studies via multiple lines of evidence, stimulation of 1,4-dioxane degradation by bioremediation has
M35a
Copyright © CRC CARE Pty. Ltd., 2019
CleanUp Conference 2019Adelaide, Australia8 –12 September 2019 148
Table of Contentsfor this manuscript

proven to be challenging. There are relatively few bacteria capable of direct metabolic respiration of 1,4-dioxane, and those known are strictly aerobic, generally very sensitive to common co-contaminants such as 1,1-dichloroethene and may not flourish at typical groundwater 1,4-dioxane concentrations. Cometabolic pathways, which can be stimulated with linear alkanes such as butane, propane, and other amendments, have been recognized for some time but field implementation has proven challenging. The first successful full-scale application of cometabolism for 1,4-dioxane degradation was recently reported (Chu et al., 2017), in which extracted groundwater was amended with propane and oxygen and then reinjected to create an in-situ recirculating treatment cell. The remedy has achieved 92-99% reduction in 1,4-dioxane concentrations SULFIDATED ZERO VALENT IRON “Sulfidation” generally refers to modification of a metallic-based substrate by reaction with sulfur compounds. Sulfidated zero valent iron (SZVI) has gained attention recently due to the much higher sorptive capacity of SZVI with metals (including mercury, chromium, lead, and cadmium), higher reactivity towards chlorinated organic compounds such as trichloroethene, and higher selectivity by suppressing reduction of water with associated reagent inefficiency and hydrogen production. Bench test case studies will be presented to demonstrate the effectiveness of SZVI. SZVI has only recently become commercially available, thus full-scale field results are not yet published. CONCLUSIONS In-situ and ex-situ remediation industry has benefitted from numerous recent technological advances. Examples summarized here include hydraulic fracture emplacement of solids in low-permeability formations, subgrade biogeochemical reactors, 1,4-dioxane degradation, and sulfidated zero valent iron (PFAS were not included as they are subject to numerous other presentations). This is not a complete summary of recent advances but is intended to highlight a few that may be of very broad interest. REFERENCES Chu, M-Y.J., Bennett, P., and Einarson, M. 2017. Successful bioremediation of 1,4-dioxane
and 1,2-dichloroethane in a dilute plume. 2017 Groundwater Resource Association Conf-erence, October 3-4, Sacramento, California (https://www.grac.org/files/1161/download/; accessed 24 May, 2019).
149
Table of Contentsfor this manuscript

HOW COMPOUNDS BECOME IDENTIFIED AS EMERGING/NEW CONTAMINANTS, AND THE IMPLICATIONS FOR STAKEHOLDERS
Nanda Hermes1, Jennifer Byrd2, Paulo Valle3, Ken Kiefer4, Lyn Denison5
1ERM, Posthoflei 5 B6, 2600 Antwerp, BELGIUM
2ERM, 5000 Meridian Boulevard, Suite 300 Franklin, Tennessee, USA 3ERM, Cantersteen 47, 1000 Brussels, BELGIUM
4ERM, Locked Bag 3012 Australia Square, NSW 1215, AUSTRALIA 5ERM, PO Box 266, South Melbourne, VIC 3205, AUSTRALIA
INTRODUCTION Emerging contaminants can be defined as synthetic or naturally occurring chemicals that are not commonly monitored in the environment but which have the potential to enter the environment and cause known or suspected adverse ecological and (or) human health effects. With new chemical compounds constantly being developed and science continuously improving its understanding of current and past contaminants, developing effective regulations and guidance for emerging contaminants has presented challenges in many countries. METHODS In Australia, emergence of new contaminants for regulation often follows industry and regulatory activity in the European Union (EU) and the United States (US). In the EU and the US various ways have been developed for screening compounds and prioritizing its potential hazards. A review was conducted on the following regulatory frameworks evaluating emerging contaminants:
• US Safe Drinking Water Act • US Toxic Substances Control Act • EU NORMAN network • Netherlands Substances of High Concern list • Germany PMT substances list
The review highlights the different ways of identifying emerging contaminants and describes the regulatory and technical challenges that may surface during the range of international regulatory frameworks and processes. RESULTS AND DISCUSSION In the United States, the Safe Drinking Water Act (SDWA) requires the Environmental Protection Agency (EPA) to issue a Contaminant Candidate List (CCL) containing contaminants that are not currently subject to drinking water regulations, but are known or anticipated to occur in public water systems. In addition, the Toxic Substances Control Act (TSCA) provides EPA with authority to require reporting and impose restrictions relating to the production, importation, use, and disposal of chemical substances. In the EU the NORMAN network, which is a collaboration between reference laboratories, research centers and related organizations for the monitoring and biomonitoring of emerging environmental substances, has identified a list of the currently most frequently discussed emerging substances and pollutants. A similar effort is underway in the Netherlands, where the RIVM (National Institute for Public Health and the Environment) has compiled a list of what is called ‘Zeer zorgwekkende stoffen’ (Substances of High Concern) to guide Dutch policies focused on prevention or minimizing emissions of such substances to the environment. And recently Germany has started compiling a list of substances that are persistent in the environment, mobile in the aquatic environment and toxic may be critical for the quality of raw waters.
M35b
Copyright © CRC CARE Pty. Ltd., 2019
CleanUp Conference 2019Adelaide, Australia8 –12 September 2019 150
Table of Contentsfor this manuscript

Three common factors are key to identifying emerging compounds: • Exposure - There needs to be a risk for exposure either to the public or the
environment (ecological risk) • Toxicity – The compound must be harmful to either human health or the environment • Public Outrage – There has to be a reason to drive change
Common challenges in the process to identify and develop regulation are: • Collecting (Sufficient) Data
o To understand the risk associated with a compound requires data related to toxicology and potential exposure that may not be readily available
• How to balance the benefit of a compound versus the environmental/human impact? o Many of these compounds were developed to serve a purpose and designed to
benefit humanity (e.g. pharmaceuticals, PFAS) • Technical issues
o Need for consistent sampling & lab methodologies to ensure meaningful results for decision makers
o New methods needed for assessing risks of exposure to mixtures o New treatment techniques may be needed
• Regulatory o How to keep lists up to date and relevant o How to balance public reaction
CONCLUSIONS The lessons learned and its potential implications to regulatory agencies, consulting companies and industries include:
• Current chemical-specific risk assessment approach seems neither feasible nor cost-effective for prioritizing and managing the vast majority of emerging contaminants
• Need for policy & treatment technology for source control/removal and product stewardship to avoid or minimize emerging contaminants with known or suspected risk
• Science on emerging contaminants is constantly evolving; The regulatory framework must follow the pace
• Managing proactively communication with stakeholders is key to avoid that sentiment, rather than science, is driving decisions
151
Table of Contentsfor this manuscript

1
1,4-DIOXANE REMEDIATION IN GROUNDWATER-TECHNOLOGY SURVEY AT WORLDWIDE SITES
William “Gary” Smith1,2
1AECOM, 7389 Florida Blvd, Suite 300, Baton Rouge, LA 70806, USA
2Previously AECOM Australia, Melbourne, VIC, AUSTRALIA [email protected]
INTRODUCTION – EMERGING CONTAMINANT CONCERNS 1,4-Dioxane (DXA) is a likely human carcinogen and has been found in groundwater at sites throughout the United States (US) and worldwide. The physical and chemical properties and behaviour of DXA create challenges for characterization and treatment in the environment. It is highly mobile, does not readily biodegrade, and is completely miscible in water. It is unstable at elevated temperatures and pressures and may form explosive mixtures with prolonged exposure to light or air. DXA is a likely contaminant at many sites contaminated with chlorinated solvents because of its widespread use historically as a stabilizer for those compounds (particularly 1,1,1-trichloroethane [TCA]). DXA is a by-product present in many goods, including paint strippers, dyes, greases, antifreeze and aircraft deicing fluids, and in some consumer products (deodorants, shampoos and cosmetics), and as a purifying agent in manufacture of pharmaceuticals. It is a by-product in the manufacture of polyethylene terephthalate (PET) plastic. Traces may be present in some food supplements, food residues from packaging adhesives, or on DXA-containing pesticides applied to food crops.[1] DXA is considered an emerging organic contaminant in the environment due to the above widespread uses, and investigative difficulty in detecting low DXA concentrations in groundwater plumes. It is typically found at low ppm or ppb concentrations in groundwater, but may be found at high ppm concentrations at DXA manufacturing sites. One of the last US manufacturers of DXA is shutting down in 2019 and moving production to European operations due to increasing regulatory scrutiny and perceived environmental risk.[2] DXA remediation has become a priority at many sites in the USA due to status as a likely human carcinogen. As of 2016, DXA had been identified at more than 34 USEPA National Priorities List (NPL) sites; it is likely present at many other USA governmental and industrial sites.[3] Remediation focus on DXA is typically on groundwater that may be used as a potable source, and ongoing risk assessments by federal and state agencies have increasingly lowered the acceptable risk level to low ppb concentrations (typically <5 ug/L).[1,4] This presents an issue for both remediation technology efficiency, and the ability to detect DXA at allowable groundwater concentrations in groundwater. DXA does not bind to soils and migrates preferably to groundwater pore spaces where it may migrate much more rapidly than co-contaminants such as chlorinated solvents. Thus it is often found at the leading edge of groundwater plumes that exhibit multiple co-contaminants.[3,4] This presentation summarizes the state of the art in DXA remediation of contaminated groundwater, including references to a number of ongoing successful remedial sites around the world. REMEDIATION METHODS FOR DXA DXA remediation in groundwater may be designed for either ex situ or in situ practice. In practice, in situ methods are typically designed to transport contaminated groundwater to the location of remedial technologies that are more typically used ex situ, such as funnel & gate. With several US DXA remedial projects operating for years as of 2019, effective remedial technologies have increasingly been narrowed to those capable of completely destroying DXA either chemically or thermally.
M35c
Copyright © CRC CARE Pty. Ltd., 2019
CleanUp Conference 2019Adelaide, Australia8 –12 September 2019 152
Table of Contentsfor this manuscript

2
Currently effective remedial technologies applied for DXA in the USA include 1) Advanced Oxidation Processes (AOP), 2) use of effective adsorption or ion exchange (IEX) materials (e.g., AmbersorbTM) in combination with thermal regeneration of granular activated carbon (GAC), and 3) often in combination with treated groundwater reinjection or residual treatment in Wastewater Treatment Plants (WWTP) prior to surface water discharge. DXA REMEDIATION EFFECTIVENESS AOP methods include proprietary technologies developed specifically for DXA and similar contaminants that must be treated to essentially non-detect concentrations (<1 ug/L). These include peroxide/ozone oxidation (licensed as HiPOxTM technology by APTWater[5]) and photocatalytic oxidation (licensed as PhotoCatTM technology by Purifics[6]). These technologies have been proven to be effective for DXA remediation at multiple sites to low ppb or ppt levels, even from initial high ppm-level (>100 mg/L) groundwater contaminant levels. These technologies are typically used ex situ by pumping and recovery of DXA-contaminated groundwater, and typically treated groundwater can be reinjected to improve hydraulic transport and recovery efficiency. Filtration or membrane technologies may be used ahead of AOP methods to avoid solids issues with AOP equipment when necessary. IEX methods for DXA remediation using AmbersorbTM or similar resins typically operate at lower contaminated groundwater influent concentrations (<1 mg/L), but can achieve non-detect levels (<1 ug/L) on a continuous basis. These methods depend on IEX regeneration methods, typically aligned with a second phase of DXA adsorption on GAC followed by GAC thermal regeneration that results in total DXA destruction.[7] Residual low ppb levels of DXA after remedial treatment can be either reinjected with treated groundwater to assist in contaminated groundwater transport and recovery, or discharged to WWTP that achieve residual destruction by biochemical or physical/chemical methods. RESULTS AND CONCLUSIONS Worldwide concern about DXA in potable groundwater aquifers has resulted in a high priority selection of remedial sites, based on risk status as an emerging likely human carcinogen. Based on increasing remedial applications for DXA at a multitude of worldwide sites, the following can be generalised as the recommended methods for DXA remediation of contaminated groundwater in the current, and likely future, risk environment:
• Traditional UV/peroxide technology is not likely to be effective in a DXA low ppb or non-detect remedial setting
• DXA destructive methods are increasingly required for remedial site endpoints: o AOP technologies (e.g., HiPOxTM; PhotoCatTM, etc) o IEX/GAC technologies (e.g., ECT2 AmbersorbTM/GAC/GAC Regeneration
• Residual levels of DXA in treated groundwater can be further treated in WWTP and discharged safely to surface waters, or treated groundwater can be reinjected.
REFERENCES [1] US Environmental Protection Agency (USEPA), Office of Land and Emergency
Management (Nov 2017) Technical Fact Sheet – 1,4-Dioxane, EPA 505-F-17-011, 8 p. [2] Editorial Staff, WAFB Television Baton Rouge Louisiana Video News (15 January 2019)
BASF Chemical Plant in Zachary, LA to Shut Down in April 2019, TV Video. [3] Agency for Toxic Substances and Disease Registry (ATSDR) (2012. “Toxicological Profile
for 1,4-Dioxane.” www.atsdr.cdc.gov/toxprofiles [4] USEPA (2006) Treatment Technologies for 1,4-Dioxane: Fundamentals and Field
Applications, EPA 542-R-06-009, web address: clu-in.org/download/542r06009/pdf. [5] APTWater, Long Beach, CA (2009) HiPOx Case Study: US Air Force Plant 44, 2 p. [6] Purifics, London, ON, Canada (2013) Groundwater Remediation Case History: Chemical
Free 1,4-Dioxane Purification, Sarasota Florida, 2 p. [7] Woodard, S., ECT2, Whittier, CA (2016) Optimized Treatment of 1,4-Dioxane in Extracted
Groundwater With Reinjection for Aquifer Replenishment, 2016 Emerging Contaminants Conference, Westminster, CO, PPT presentation, 21 p.
153
Table of Contentsfor this manuscript

DIOXINS IN THE SEDIMENTS OF SYDNEY HARBOUR: POTENTIAL FOR BIOREMEDIATION
Keith Osborne1, Casey O’Farrell2, Gan Liang3, Matthew Lee3, Mike Manefield3,4
1Environment Protection Science, NSW Office of Environment and Heritage,
480 Weeroona Road, Lidcombe, NSW 2141, AUSTRALIA 2Coffey, Level 1 436 Johnston Street, Abbotsford, VIC 3067, AUSTRALIA
3School of Civil and Environmental Engineering, University of New South Wales, Sydney, NSW 2052, AUSTRALIA
4School of Chemical Engineering, University of New South Wales, Sydney, NSW 2052, AUSTRALIA
INTRODUCTION Homebush Bay on the Parramatta River is located upstream of Sydney Harbour, Australia. Between 1949 and 1976, Union Carbide manufactured the herbicides 2,4,5-trichlorophenoxyacetic acid (2,4,5-T) and 2,4-dichlorophenoxyacetic acid (2,4- D), two ingredients in Agent Orange which was used as a defoliant during the Vietnam War. Production of 2,4,5-T is typically characterised by elevated levels of 2,3,7,8-tetrachlorodibenzodioxin (TCDD), the most toxic dioxin congener. Prior to 1970, chemical manufacturing waste containing dioxins from Union Carbide was disposed at a landfill in Homebush. Contaminated soils were also used during several stages of land reclamation in Homebush Bay. Dioxins entered the water and sediments of Homebush Bay via overflow during reclamation, and in stormwater and factory wastewater. Initial remediation efforts at Rhodes peninsula included integrating the sediments into soil treatment, where sediment ‘hot spots’ were excavated and blended into the soil feed of the soil remediation process. While this decreased the source load in the sediments to some extent, it has not greatly affected the load of dioxins already established in the harbor sediments. This study investigates the potential for in-situ bioremediation of dioxins remaining in the sediments of Homebush Bay. METHODS Dioxin-contaminated sediment samples were taken at four locations off the Rhodes Peninsula at Homebush Bay (HBB) and at six other locations downstream in Parramatta River (Figure 1). Sampling location 4 is adjacent to the former Union Carbide facility.
Figure 1. Sediment sample locations in Homebush Bay and Parramatta River.
At each location 50 cm sediment core samples were taken and then divided into 25 cm upper and lower fractions. Each sample was subject to 1) Analysis to quantify the concentration and composition of dioxins; 2) DNA extraction, sequencing and bioinformatic analysis; and 3)
M35d
Copyright © CRC CARE Pty. Ltd., 2019
CleanUp Conference 2019Adelaide, Australia8 –12 September 2019 154
Table of Contentsfor this manuscript

inoculation into laboratory microcosms, incubation and monitoring for reductive dechlorination of dioxins by gas chromatography. RESULTS AND DISCUSSION • Analysis to quantify the concentration and composition of dioxins
The total dioxin concentrations (pg/g) at the ten sample locations are shown in Figure 2.
Figure 2. Total dioxin concentration in upper and lower sediments. Octachlorodibenzodioxin (OCDD) was the most abundant dioxin congener by mass. However when World Health Organisation toxicity equivalency factors (WHO TEFs) for dioxins were allowed for, levels of 2,3,7,8 TCDD also became important.
• DNA extraction, sequencing and bioinformatic analysis
The sediment samples contained an average of 5.6 x 10⁸ bacterial cells per gram of wet weight sediment (cells/gram) across the 20 samples, indicating abundant microbial life despite the presence of dioxins. DNA profiling showed a high level of microbial diversity evenly spread across approximately 500 bacterial genera. Bacteria of the genera Dehalococcoides, Dehalogenimonas and Dehalobacter are capable of respiring organohalide compounds. All three genera were present in sediment samples, with Dehalogenimonas the most abundant at an average of 0.8-0.9% of the total bacterial population.
• Inoculation into laboratory microcosms, incubation and monitoring for reductive
dechlorination of dioxins Enrichment for organohalide respiring bacteria was attempted using anaerobic cultures, prepared from Homebush Bay sediments spiked with either 2,3,7,8 TCDD or OCDD. Aerobic cultures were also set up, spiked with 2,3,7,8 TCDD only. To date (6-12 months monitoring), none of these cultures have showed dioxin degrading activity. Anaerobic cultures were also prepared with perchloroethene (PCE), as well as 1,2,3- and 1,2,4-trichlorobenzene (TCB). Both TCBs were reductively dechlorinated to chlorobenzene (CB), and PCE was reductively dechlorinated to cis- and trans-dichloroethene (DCE).
CONCLUSIONS The presence of known organohalide respiring bacteria represents the potential for microbial reductive dechlorination in the sediments, with metabolic activity confirmed through the dechlorination of TCBs and PCE. However, the sediment microbial community does not appear capable of reductive dechlorination of dioxins (2,3,7,8 TCDD or OCDD). Current studies include investigating the potential for bioaugmentation of sediments using known dioxin degrading bacterial isolates.
155
Table of Contentsfor this manuscript

PRIORITISING EMERGING CONTAMINANTS — HUNTER WATER’S RESEARCH AND DEVELOPMENT STRATEGY
Anna Lundmark, Zoe Rogers, Abigail Morrow, Megan Priestley
Hunter Water Corporation, Newcastle, NSW, Australia
INTRODUCTION Hunter Water is a state owned corporation (SOC) providing drinking water, wastewater, recycled water and some stormwater services to a population approaching 600,000 people in homes and businesses across the Lower Hunter, NSW. Hunter Water’s research and development (R&D) strategy sets the direction and focus areas, and provides structure through a framework for the R&D program. It supports a program that identifies critical knowledge gaps, provides the right knowledge to improve decision making, takes advantage of new opportunities, and addresses emerging challenges. One of Hunter Water’s R&D priorities is emerging contaminants (ECs). This paper outlines Hunter Water’s methods for prioritising ECs and associated research projects, and provides a discussion around the current list of priority ECs. METHODS Prioritisation in relation to ECs has two stages; firstly, a list of the priority ECs needs to be established. Secondly, research topics and project need to be prioritised. The below sections outlines the methodologies used at Hunter Water. Establishing Priority Emerging Contaminants The Global Water Research Coalition (GWRC) framework (based on a Bayesian network model) for prioritisation of ECs was recently released for trialling by water utilities and is currently trialled by Hunter Water. However, the model requires a list of relevant ECs as an input. To stay abreast of relevant ECs to be included on the list, Hunter Water is actively involvement in national collaborations such as Water Services Association of Australia (WSAA) groups and networks, Water Research Australia’s committees and events, Australasian Land and Groundwater Association (ALGA), and industry conferences. Resources are allocated through a dedicated Science and Innovation Team, who are also actively seeking information through literature review, research projects, and studies in our systems. . Prioritising Emerging Contaminants Research Projects As part of the go / no go process when receiving project proposals, Hunter Water has established principles to assess the potential value of R&D projects, which assists in prioritisation decisions on R&D investment. The value assessment is based on three key assessment principles:
• Alignment: How well the project aligns with the R&D focus and priority areas. Collaboration, in particular with key partners, feeds into this principle.
• Impact: The level of impact the project has on Hunter Water, in particular directly relating to taking opportunities or reducing risks to our operation. This assessment principle also includes impacts to the community we serve, relationships and reputation with stakeholders including regulators, and potentially national / and international challenges.
• Project risk: The level of risk around the execution of the project; clarity of project purpose, availability of resources and capability, schedule within the relevant timeframes for Hunter Water, and likelihood of success (complexity) of project.
M35e
Copyright © CRC CARE Pty. Ltd., 2019
CleanUp Conference 2019Adelaide, Australia8 –12 September 2019 156
Table of Contentsfor this manuscript

In order to maximise the value achieved by use of our R&D funds, Hunter Water targets a leverage funding ratio of at least 1:5, achieved through partnerships, collaboration, grant application, and the R&D tax incentive. Consideration is also given to the level of activity considered suitable for the issue or opportunity prioritised, allowing for a better targeted R&D project portfolio. The level of activity is classified as follows:
• Driving Hunter Water specific research • Supporting research organisations with relevant projects • Joining larger collaborative research efforts • Trial emerging technologies • Keep watching brief only
OUTCOME AND DISCUSSION Priority ECs and research topics are reassessed as needed and at least annually. The current priority ECs are presented in the below sections. Priority ECs in Wastewater A range of physical, chemical and biological contaminants in raw and treated wastewater, recycled water and biosolids are emerging globally as potential risks to human and environmental health. EC removal efficiency by Waste Water Treatment Works (WWTW) varies significantly depending on the treatment processes used. Five groups of contaminants are considered the current priority ECs in waste water by Hunter Water:
• Per- and poly-fluoroalkyl substances (PFAS) • Microplastics • Engineered nanomaterial (ENMs) • Pharmaceuticals and personal care products (PPCPs) • Antibiotic resistant bacteria (ARB)
Priority ECs in Drinking Water Unlike most major cities around the world, the water supplies of coastal Australian urban settlements, including the Lower Hunter region, are negligibly impacted by upstream wastewater discharges. Therefore the loads of wastewater-borne contaminants is comparatively less than in other regions. However, the ECs considered a priority in waste water are still considered of concern in drinking water based on the link between the systems:
• PFAS • Microplastics • ENMs • PPCPs • ARB
Additional to those priority ECs for drinking water are disinfection by-products (DBP), which are formed by the reaction of chlorine with natural organic materials present in source waters, and emerging pathogens (Legionella species, Naegleria fowleri, Nontuberculous mycobacteria, Pseudomonas aeruginosa, Acanthamoeba species, and Burkholderia pseudomallei) CONCLUSIONS One of Hunter Water’s focus areas in the R&D Strategy is ECs. Methods to ensure that the list of relevant ECs is up to date, to prioritise the relevant research projects, and establish collaborations to leverage funding and knowledge are key to maximising the value from the R&D program. Whilst this paper outlines our main strategic elements implemented to do so, it is recognised that keeping abreast of the EC field of work requires an agile mindset with frequent reconsideration of such methods.
157
Table of Contentsfor this manuscript

1,4-DIOXANE AS CO-CONTAMINANT WITH CHLORINATED SOLVENTS, CONSIDERATION OF
CHEMICAL PROPERTIES AND EFFECTIVE REMEDIAL SOLUTIONS
Wijnand Gemson1, Ken Kiefer2, Brendan Brodie2, Paulo Valle3, Olga Vounaki3
1ERM, Level 18, 140 St Georges Street, Perth, 6000, AUSTRALIA 2ERM, Level 15, Lumley House, 309 Kent Street, Sydney, 2000, AUSTRALIA
3ERM, Cantersteen 47, Brussels, 1000, BELGIUM [email protected]
INTRODUCTION 1,4-Dioxane is a water soluble compound classified by the United States Environmental Protection Agency (US EPA) as a probable human carcinogen (Wilbur et al., 2012). It’s co-occurrence with chlorinated solvents has primarily been associated with its use as a stabilizer for 1,1,1-trichloroethane (TCA), with historical TCA formulations typically including 2-8% 1,4-dioxane by volume (Mohr, 2001). While the co-occurrence of 1,4-dioxane with chlorinated solvents (and specifically TCA) in groundwater plumes is well documented, there still appears to be a lack of awareness in industry with 1,4-dioxane often simply not being tested for. Given the differing chemical properties of 1,4-dioxane and chlorinated compounds such as TCA, early identification of 1,4-dioxane would facilitate appropriate site assessment including plume delineation, and the development of effective remediation strategies where clean up is required. METHODS Relevant literature focussing on studies reporting the co-occurrence of 1,4-dioxane with chlorinated solvents were reviewed. In addition, pooled data from sites in Australia and Belgium that the authors have access to were collated to assess the co-occurrence of 1,4-dioxane and chlorinated solvents in groundwater plumes. Learnings from the aforementioned review and data assessment are outlined in the abstract and will be described in the presentation. Remedial considerations will further be discussed, with a specific focus on the different chemical properties of 1,4-dioxane and the chlorinated solvents that are typically the primary (and often only) contaminants of concern being addressed by remediation at these sites. RESULTS AND DISCUSSION A white paper published by Mohr (2001) on 1,4-dioxane and other solvent stabilisers was pivotal in raising awareness of the potential of 1,4-dioxane as a co-contaminant associated with chlorinated solvents. This paper led to a number of studies in the USA, including the San Francisco Bay Water Board requesting 1,4-dioxane analyses at 15 sites in the Silicon Valley known to have used and released TCA. 1,4-Dioxane was detected at 12 of the 15 sites, mostly at relatively low concentrations, but with some groundwater samples exceeding concentrations of 1 000 µg/L (Mohr, 2010). Following the early assessment works, a large scale study was undertaken in the USA (assessing data from > 2 000 sites) which demonstrated that where 1,4-dioxane had been analyzed and detected, it co-occurred with TCA 76% of the time (Adamson et al., 2014). In a study undertaken for US Naval sites approximately 64% of 1,4-dioxane detections were associated with trichloroethene (TCE) independently (Anderson et al., 2012). In comparison to the work undertaken in the USA, there is still a paucity of 1,4-dioxane data in relation to TCA groundwater impacts in other parts of the world. Recent studies performed in Belgium at sites with known TCA impact identified 1,4-dioxane above the WHO drinking water guideline of 50 µg/L in 13 out of 16 sites. Test work undertaken at a known TCA affected site in Australia returned 1,4-dioxane concentrations above the laboratory limit of
M35f
Copyright © CRC CARE Pty. Ltd., 2019
CleanUp Conference 2019Adelaide, Australia8 –12 September 2019 158
Table of Contentsfor this manuscript

reporting in all 15 groundwater samples tested, with reported concentrations ranging between 49.4 µg/L and 86 600 µg/L. While the data from Australia and Belgium are still relatively limited, it does suggest the likely widespread co-occurrence of 1,4-dioxane with TCA. Multiple case studies with groundwater remediation systems treating chlorinated solvent plumes have been considered. These involve treatment plants utilized air stripping technology (prior to identifying the presence of 1,4-dioxane), which while effective for the chlorinated solvents targeted, led to post-treatment 1,4-dioxane impacted water being re-injected into the environment. For a case in the USA, this created a large scale dilute 1,4-dioxane plume leading to the shutdown of municipal and several private drinking water wells. Such occurrences can be avoided with early identification of 1,4-dioxane impact allowing for the timely incorporation of appropriate mitigation measures. CONCLUSIONS There is a building set of evidence documenting 1,4-dioxane co-occurrence with chlorinated solvents (specifically TCA) in groundwater. Due to the differing chemical properties of 1,4-dioxane and the chlorinated solvents, plume extents may differ, and remedial solutions focussed on the chlorinated solvent impact may not be effective for 1,4-dioxane remediation. Early identification of 1,4-dioxane at such sites will facilitate the appropriate assessment, remediation and management of key risks. REFERENCES Adamson, D. T., Mahendra, S., Walker, K.L., Rauch, S.R., Sengupta, S. & Newell, C. J.
(2014) A multisite survey to identify the scale of the 1,4-dioxane problem at contaminated groundwater sites. Environmental Science & Technology Letters.
Anderson, R. H., Anderson, J.K. & Bower P.A. (2012) Co-occurrence of 1,4-dioxane with trichloroethylene in chlorinated solvent groundwater plumes at US Air Force installations: Fact or fiction. Integrated Environmental Assessment and Management.
Mohr, T.K.G. (2001) 1,4-Dioxane and other Solvent Stabilisers. White Paper, Santa Clara Valley Water District, USA.
Mohr, T.K.G. (2010) Environmental Investigation and Remediation: 1,4-Dioxane and other Solvent Stabilizers. CRC Press, USA.
Moyer, E. (2008) 1,4-Dioxane: Regulatory Developments, Uses, Properties, Assessment, and Remediation. Conference Paper, Petroleum Hydrocarbons and Organic Chemicals in Ground Water Forum 2008.
Wilbur S., Jones D., Risher J.F. (2012) Toxicological Profile for 1,4-Dioxane, Agency for Toxic Substances and Disease Registry, USA. https://www.ncbi.nlm.nih.gov/books/NBK153666/
159
Table of Contentsfor this manuscript

EXPLORING FRACTURED ROCK CLEANUP USING DATA MINING AND A NEW REMEDIATION MODEL
Charles J. Newell, Shahla K. Farhat, Travis M. McGuire
GSI Environmental, Inc., 2211 Norfolk, Suite 1000, Houston Texas, 77098, USA
INTRODUCTION There has been increasing recognition that matrix diffusion, where groundwater contaminants first diffuse into and then subsequently out of low permeability geologic media over decades, is a key impediment to complete remediation of contaminated sites. While much of the basic and applied matrix diffusion research has focused on unconsolidated media, many fractured rock sites are also vulnerable to the pernicious effects of matrix diffusion. METHODS Three different tools were employed to evaluate the effects of matrix diffusion on remediation of fractured rock sites. First, general geologic framework presented in the SERDP “Management of Contaminants Stored in Low Permeability Zones, A State-of-the-Science Review” (Sale et al., 2014) was used to qualitatively compare the impacts of matrix diffusion on different fractured rock hydrogeologic settings. Next, an ESTCP data mining study (McGuire et al., with remediation performance data (i.e., reduction in groundwater concentrations) from over 200 in-situ remediation projects at chlorinated solvent source zones was evaluated to compare remediation at unconsolidated sites (n=204) vs. fractured rock sites (n=13). Finally, a recently released semi-analytical groundwater remediation model, REMChlor-MD (Falta et al., 2018; Farhat et al., 2018) was applied to a fractured rock site described by Lipson et al. (2005) to explore the impacts of modelling remediation with and without matrix diffusion effects. RESULTS AND DISCUSSION Results from the three tools applied to understanding matrix diffusion at fractured rock sites are described below: General Geologic Framework Two different classes of fractured rock settings have dramatically different potential for matrix diffusion compromising in-site remediation performance:
• Sedimentary deposits such as sandstone, carbonate rock, and shales are porous with enough interconnected pores to store and then release contaminants via matrix diffusion and therefore interfere with remediation projects.
• Crystalline rocks such as granite, schist, and basalt often have little if any interconnected pore spaces and therefore the impact of matrix diffusion is muted or unimportant.
Remediation Data Mining Study The remediation data mining study observed that “One well-accepted design rule for in-situ remediation projects is that treatment is easier (and performance supposedly better) for sites with more permeability and homogeneity, and that treatment of fractured rock sites is significantly more difficult than unconsolidated sites.” Surprisingly, the data mining study determined that the in-situ remediation projects at the 13 fractured rock sites exhibited slightly better performance than the 204 unconsolidated sites. This effect was not statistically significant however (p=0.24) and did not consider the difficulty in implementing
M36a
Copyright © CRC CARE Pty. Ltd., 2019
CleanUp Conference 2019Adelaide, Australia8 –12 September 2019 160
Table of Contentsfor this manuscript

the remediation project (i.e., only the reduction in source zones concentrations were evaluated, not cost or time of the remediation project). REMChlor-MD Model Applied to Fractured Rock Site When the REMChlor-MD remediation model was applied to a fractured rock site, two very different modelling outcomes were observed depending on whether matrix diffusion processes were simulated (Farhat et al., 2018):
REMChlor-MD runs without matrix diffusion erroneously showed dramatically higher plume concentrations before remediation (because matrix diffusion removes contaminants from the fractures) and much lower plume concentrations 20 years after remediation (because there is no back diffusion adding contaminant to the fractures). For this fractured rock site with fractures in a sedimentary matrix, matrix diffusion is a key process in understanding the impact of source remediation on downgradient plume concentrations and on how quickly the plume will clean up after source remediation.
CONCLUSIONS Three different tools, a generalized geologic framework, remediation performance data mining study, and a new remediation modelling tool (REMChlor-MD) all show that matrix diffusion processes are likely to be important processes at sedimentary fractured rock sites (e.g., sandstones, carbonate rocks, and shales). The REMChlor-MD remediation model showed matrix diffusion reduces early-stage concentrations significantly (because matrix diffusion removes contaminants from the fractures) and dramatically increases late-stage concentrations (because of back diffusion). However, the data mining study showed that remediation projects at fractured rock sites exhibited slightly better performance than remediation projects at unconsolidated geology sites. Only the before-and-after reduction of concentration was compared for this study, however, and the implementation of remediation at fractured rock sites may be more difficult than unconsolidated sites. REFERENCES Falta R.W., Farhat, S.K., C.J. Newell, and K. Lynch (2018) REMChlor-MD, developed for the
Environmental Security Technology Certification Program (ESTCP) by Clemson University, Clemson, South Carolina and GSI Environmental Inc., Houston, Texas.
Farhat, S.K., C.J. Newell, R.W. Falta, and K. Lynch (2018) REMChlor-MD User’s Manual, developed for the Environmental Security Technology Certification Program (ESTCP) by GSI Environmental Inc., Houston, Texas and Clemson University, Clemson, South Carolina.
Lipson, D.S., B.H. Kueper, and M.J. Gefell, 2005. Matrix Diffusion-Derived Plume Attenuation in Fractured Rock, Ground Water 43(1): 30-39.
McGuire, T.M., Adamson, D.T., Newell, C.J., Kulkarni, P.R. (2016) Final Report: Development of an Expanded, High-Reliability Cost and Performance Database for In-Situ Remediation Technologies. ESTCP Project ER-201120. March 2016.
Sale, T., B. Parker, C. Newell, J.F. Devlin, D. Adamson, S. Chapman, K. Saller. (2014) Management of Contaminants Stored in Low Permeability Zones, A State-of-the-Science Review. SERDP Project ER-1740, Strategic Environmental Research and Development Program, Arlington, Virginia. https://www.serdp-estcp.org/Program-Areas/Environmental-Restoration/Contaminated-Groundwater/Persistent-Contamination/ER-1740
161
Table of Contentsfor this manuscript

ADVANCES IN THE USE OF LNAPL TRACER DYES FOR REMEDIATION CHARACTERISATION IN FRACTURED BASALT
Keith Maxfield
AECOM, Collins Square, Level 10, Tower Two 727 Collins Street, Melbourne, VIC 3008, AUSTRALIA
[email protected] INTRODUCTION: LNAPL tracer dye testing is an invaluable technique to directly measure LNAPL flux from a well into the surrounding aquifer to appraise LNAPL mobility and recoverability. However, LNAPL tracer dyes have had relatively limited use to-date as an LNAPL characterisation tool. LNAPL tracer testing involves adding a measured quantity of fluorescent oil-soluble dye into the LNAPL within a well (aka the dose well) and measuring the decline in LNAPL fluorescence over time, which is a direct measure of LNAPL flux out of the well. As part of an EPA Victoria Auditor-endorsed remediation program, our study required measurement of LNAPL connectivity and mobility within a fractured basalt aquifer, which necessitated the use of LNAPL tracer dyes to directly measure LNAPL flow in the aquifer. This application advanced the state of the science through identification of additional LNAPL tracer dyes, use of multiple dyes concurrently, and in quantifying pumping-induced flow via the rate of dye dilution in the dose well and also dye breakthrough at an LNAPL extraction well. The study site comprised a large plume (>5ha) which had been subject to LNAPL recovery for many years. The aquifer comprised Newer Volcanics basalt, and LNAPL recovery rates varied across the plume extent. The complexity of LNAPL flow pathways within the fractured basalt aquifer presented a challenge in characterising the LNAPL capture zones associated with the recovery wells, and optimising placement of additional recovery wells. In order to further understand the LNAPL flow pathways and recoverability, characterisation of the LNAPL flow pathways in the aquifer was necessary. OBJECTIVES AND SCOPE: The objectives and scope of the LNAPL tracer dye study were to:
• Verify that pumping-induced LNAPL flow was occurring in the aquifer via locally-connected fractures, at multiple test wells throughout the plume.
• Characterise the heterogeneity in fracture connectivity and LNAPL flow rates in different orientations surrounding each test well.
• Test multiple wells throughout the plume to measure the variability in LNAPL connectivity and flow conditions across the plume extent.
• Gather multiple lines of secondary data to correlate against the tracer dye data to appraise indicators of LNAPL connectivity, the capture zones induced by pumping, and obstacles and opportunities to optimise LNAPL recovery across the plume.
METHODOLOGY: LNAPL tracer dyes were utilised to trace and quantify the rate of LNAPL flow occurring through wells in proximity to the extraction well and identify the rate of breakthrough at the extraction well. Fluorescence is measured using an optical spectrometer and a fibre-optic cable to transmit a UV light down the well into the dyed-LNAPL and measure the fluorescence response. The study methodology comprised the following:
• To reduce the dye test duration, multiple dyes needed to be used concurrently. The absence of any similar works in the literature necessitated a research effort to identify additional dyes and verify their properties and suitability for injecting into the aquifer.
M36b
Copyright © CRC CARE Pty. Ltd., 2019
CleanUp Conference 2019Adelaide, Australia8 –12 September 2019 162
Table of Contentsfor this manuscript

• Nine dyes were then subject to a ‘Dose Conditioning’ program to test the suitability and fluorescence response of each dye for the LNAPL conditions at the site.
• The tracer dye study was undertaken at four LNAPL extraction wells, each with wells installed in close proximity at differing orientations. The study comprised dosing dye in LNAPL in surrounding wells sequentially, and measuring the rate of dye dilution in the dose well (demonstrating LNAPL flow out of the well) and breakthrough of dyed-LNAPL at the extraction well.
RESULTS/ DISCUSSION: The study successfully demonstrated that dyed-LNAPL was traced flowing between multiple dose wells to the extraction wells through the fractured basalt aquifer in response to pumping, and measuring the variability in LNAPL flow rates between different wells and at differing orientations. Dye dilution rates varied from complete dilution occurring within a few days, to partial dilution occurring over 200 days. Dye breakthrough also demonstrated a correlating profile of occurring within a few days to after 140 days. Results showed the different dyes were readily distinguishable and hence LNAPL flow rates from separate wells could be measured. Use of multiple dyes allowed the study duration to be significantly reduced i.e. without compromising data quality associated with distinguishing where each dye originated. These dyes also accommodated for the differing rates of LNAPL flow, meaning that peak dye breakthrough from each well was staggered, hence the dilution and breakthrough profile could also be used as a distinguishing factor. The results demonstrated significant variability in lateral LNAPL flow conditions, as expected for fractured basalt. The dye results verified that LNAPL flow pathways were not exclusive to discrete and unpredictable pathways, and instead often demonstrated lateral continuity via high-flow fractures or low-flow fractures. Flow boundaries were also identified, and the dye results demonstrated where LNAPL was not connected, or in some cases present as discrete, isolated LNAPL bodies. The dyed-LNAPL dilution also demonstrated a stratification profile within the LNAPL, which correlated with individual fractures identified in the core log. This allowed the route of LNAPL to be traced via individual fractures through the aquifer, providing direct evidence of the degree of lateral fracture interconnectivity at the near-water-table elevation. The dye results enabled analysis and correlations to be drawn against the secondary datasets including fracture analysis of the rock core, transmissivity results, discharge vs drawdown plots and diagnostic gauge plots. These correlations facilitated further inferences to be made regarding LNAPL continuity beyond the test wells. CONCLUSIONS The use of LNAPL tracer dyes was essential in generating direct empirical evidence of LNAPL flow rates and connectivity through the fractured basalt aquifer, and characterised flow properties to evaluate the efficacy of the recovery program and generate a rationale for siting further recovery wells to optimise plume mass removal. The use of multiple tracer dyes allowed numerous tests to be undertaken concurrently within a relatively short duration. The measurement of both dye dilution and dye breakthrough provided greater certainty and rationale for optimising the LNAPL recovery program.
163
Table of Contentsfor this manuscript

THE FATE OF COAL TAR IN THE HAWKESBURY SANDSTONE — IMPLICATIONS FOR REMEDIATION AND VALIDATION OF
GASWORKS SITES
Sarah Eccleshall1, Emmylou Cooke1, John Hunt2
1GHD Pty Ltd, Level 15, 133 Castlereagh Street, Sydney, NSW 2000, AUSTRALIA 2Ventia Tower 1/4/495 Victoria Ave, Chatswood, NSW 2067, AUSTRALIA
INTRODUCTION Coal tar is a dense non-aqueous phase liquid (DNAPL) by-product of the production of coke and coal gas from coal, and therefore it is prevalent at former gasworks sites. When remediating former gasworks sites the different ways in which coal tar behaves in soil, sediment and bedrock can pose a number of challenges. COAL TAR MIGRATION The movement of DNAPL varies according to substrate. Fill is often highly permeable and DNAPL can migrate downwards rapidly, unless barriers are present, with minimal lateral diffusion. Soil permeability varies from very permeable (sand) to highly impermeable (clay), can be continuous to discontinuous and homogeneous to heterogeneous. DNAPL generally tends to migrate downwards until a less permeable layer is encountered, upon which migration becomes lateral in a down-gradient direction determined by the geology. Within a stratigraphic sequence some layers may act as secondary reservoirs or sources, such as in sand or peat layers with surrounding impermeable clay. Within soils, including those that are highly impermeable, biogenic structures such as roots, rootlets and infaunal burrows can act as migration pathways. Clays, while frequently impermeable, may also seasonally crack in the zone of ground water fluctuation, allowing incremental seasonal infiltration by DNAPL. Soil may also be locally absent due to erosional events creating migration pathway windows in otherwise impermeable geology. In rock, the following characteristics control the migration pathways of coal tar (Hatheway, 2012):
• Porosity and permeability • Irregular fracturing in weathered or altered rock • Fracturing, jointing, bedding, foliations, shear zones and faulting.
Porosity may be primary or secondary and is controlled by depositional processes (eg channel lags and coarse sand at channel bases in sandstone), or cavernous porosity may be present in limestone caused by dissolution from either natural or industrial causes. Rocks may also be intruded by volcanic dykes creating zones of fractured heat altered rock that are migration pathways. These may have additional fracture and joint sets associated with regional or local stress fields. The variability of bedrock characteristics within a geological formation poses a number of challenges due to the irregular and unpredictable nature in which coal tar can seek pathways in the rock. THE HAWKESBURY SANDSTONE The Sydney region is underlain by the Hawkesbury Sandstone, a Middle Triassic quartz sandstone formation up to 250 m thick. The geological formation is dominated by cross- and tabular-bedded quartz-rich sandstone deposited in a high-energy fluvial environment with some finer grained texturally massive sandstone facies and minor mudstone (Conaghan, 1980). The Hawkesbury Sandstone has also been intruded with a number of dolerite dykes, including the eponymous Pittman LIV Dyke. The variation in sandstone facies gives
M36c
Copyright © CRC CARE Pty. Ltd., 2019
CleanUp Conference 2019Adelaide, Australia8 –12 September 2019 164
Table of Contentsfor this manuscript

scenarios where migration is highly likely (sheet facies) and where migration is more unlikely (massive facies), resulting in DNAPL behaviour varying on a site by site basis. CASE STUDIES — IMPLICATIONS FOR REMEDIATION AND VALIDATION Here we investigate gasworks remediation in the Sydney region and how the geological variations within the Hawkesbury Sandstone and site specific bedrock and soil characteristics have implications for coal tar mobility and remediation approaches. The key case study is the ongoing remediation of the Millers Point Gasworks at Barangaroo, Sydney where the gasworks was built on, and the tar tanks excavated into, the Hawkesbury Sandstone. Using the remediation of the Millers Point Gasworks, we explore how the structure and properties of the Hawkesbury Sandstone have influenced how coal tar has migrated within bedrock and the implications this has for the choice of remediation method and validation. At the Millers Point site the nature of the DNAPL contamination is variable across the site. Remediation options for coal tar impacted rock at this site include washing, grouting and grinding. The choice of these methods depends greatly on how the tar has moved through the rock and each instance of coal tar contamination has had to be addressed on an individual basis. At the Millers Point site coal tar has been observed to migrate along fractures, crush zones and bedding planes in the rock as well as in the pore spaces formed at deposition. Due to the many bedding planes, joints and fractures in the rock, coal tar observed in the walls of excavations has migrated significant distances vertically and laterally from likely primary sources, and the pathways cannot always be clearly identified. This not only has implications for remediation but also for waste classification. In addition, removal of impacted material is not always possible on a site within a densely built and populated area. We further examine how behaviour of the coal tar at the Millers Point site differs from other gasworks sites, including Mortlake Gasworks, Newstead Gasworks, Platypus Gasworks and Macdonaldtown Gasworks, which are all situated in the Hawkesbury Sandstone. We address the variable characteristics of the bedrock and soil and how this has affected coal tar mobility and the implications this has for remediation in terms of methodology and cost. In exploring the variable behaviour of coal tar in the Hawkesbury Sandstone it is apparent that remediation of gasworks sites requires a site specific approach in terms of remediation methodology and validation approach even where the underlying geology is the same, as highlighted by the variety of approaches utilised at the different sites across Sydney, and even the variation within a single site. It is clear that investigation of bedrock is always required as the numerous migration pathways into and through bedrock mean one cannot assume bedrock is uncontaminated across an entire site, even where localised evidence of ‘clean’ rock is found. REFERENCES Conaghan P.J (1980) The Hawkesbury Sandstone: gross characteristics and depositional
environment. In: Herbert C, Helby R (Eds.) A Guide to the Sydney Basin. Bulletin No. 26. Maitland, Australia: Geological Survey of New South Wales, pp. 188–253.
Hatheway, A.W (2011) Remediation of former manufactured gas plants and other coal tar sites. CRC Press.
165
Table of Contentsfor this manuscript

USING MULTIPLE LINES OF EVIDENCE TO CHARACTERISE DNAPL IMPACTS IN A FRACTURED BASALT,
FORMER FITZROY GASWORKS REMEDIATION PROJECT
Claire Miller1, Adam Bradley2
1Golder Associates Pty Ltd, Melbourne, Victoria, AUSTRALIA 2Department of Treasury and Finance, Victoria State Government, Melbourne, AUSTRALIA
INTRODUCTION Understanding the distribution and migration of dense non-aqueous phase liquids (DNAPL) in the subsurface is a challenge. This becomes even more problematic when the DNAPL has been released in a fractured rock system such as the Newer Volcanics basalt of the northern suburbs of Melbourne. This paper presents a number of simple concepts that were used to characterise DNAPL impacts in the fractured basalt aquifer at the former Fitzroy gasworks (the site). This work indicated that the DNAPL was limited in a southerly extent (likely controlled by the fracture network of the basalt), constrained to the upper shallow aquifer, was of a high viscosity and variably distributed across the rock profile. This resulted in a re-evaluation of the practicability of the selected remediation approaches, questioning the need to deploy aggressive source reduction measures. These works, which have been undertaken in response to an Environment Protection Authority (EPA) Victoria issued Clean Up Notice, have been part funded from the Victorian Department of Environment, Land, Water and Planning (DELWP) administered Sustainability Fund. Main Sources of Release The site was used for the production of gas between 1861 and 1927 with the main sources of release associated with three former gasholders located along the southern boundary of the site. Following 1927, two of the three gas holders continued to store gas and one was converted into a tar store, with operations ceasing in the 1960s. Groundwater investigations have identified coal tar DNAPL and dissolved phase contamination in groundwater both on- and offsite. Hydrogeological Conceptual Site Model The Newer Volcanics basalt is the water table aquifer in the southern part of the site. The basalt is a variably fractured rock formed by solidified lava that infilled an old valley carved in the Silurian siltstone. The edge of this palaeovalley runs along the south of the site, causing the siltstone to slope steeply to the south (i.e. below the basalt) resulting in an increase in basalt thickness in a southerly direction offsite. There is evidence that the coal tar has penetrated the underlying Newer Volcanics basalt aquifer, and the very top portion of the underlying weathered siltstone along the southern boundary of the site. It is likely that the following provided a preferential pathway for the vertical migration of coal tar:
• the former gasholders, which were excavated to the top of the rock; • the edge of the basalt flow, which is typically marked by more intense fracturing.
The current conceptual understanding is that the presence of more massive basalt towards the centre of the infilled valley exerts a structural control on the progressive southerly (downgradient) migration of coal tar. The weathered portion of the underlying siltstone (silt) is also thought to provide a barrier to the downward migration of the coal tar to the deeper siltstone aquifer.
M36d
Copyright © CRC CARE Pty. Ltd., 2019
CleanUp Conference 2019Adelaide, Australia8 –12 September 2019 166
Table of Contentsfor this manuscript
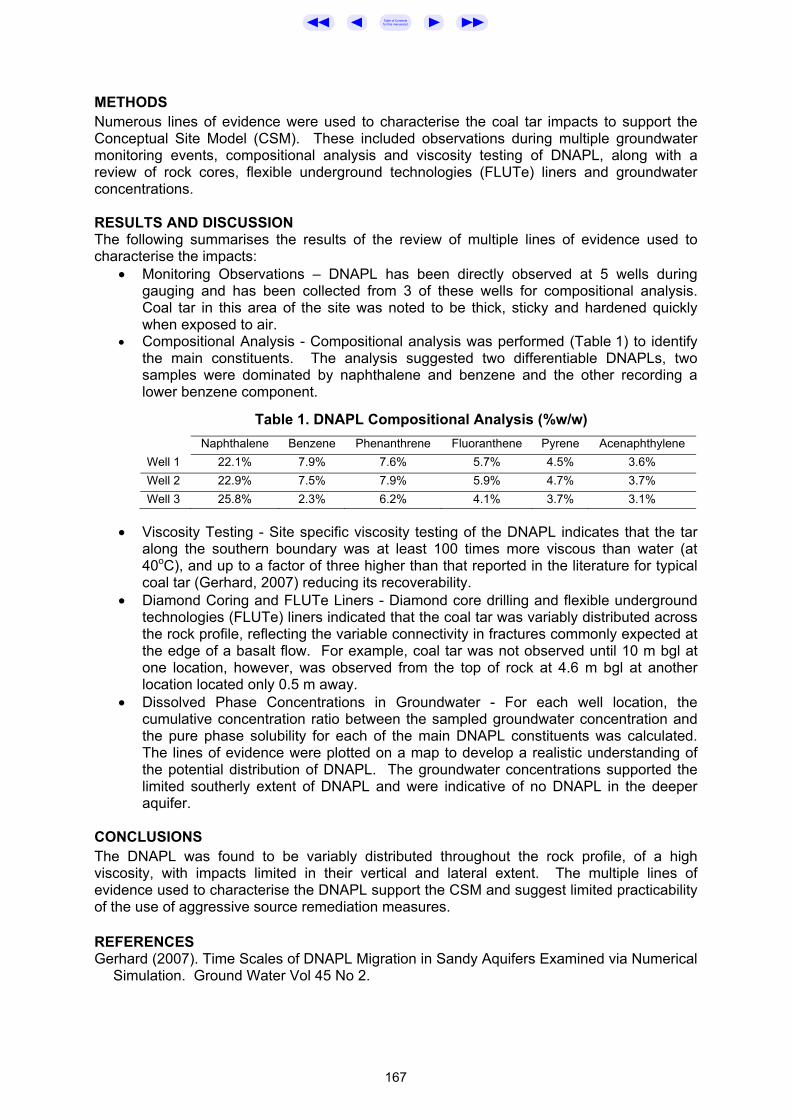
METHODS Numerous lines of evidence were used to characterise the coal tar impacts to support the Conceptual Site Model (CSM). These included observations during multiple groundwater monitoring events, compositional analysis and viscosity testing of DNAPL, along with a review of rock cores, flexible underground technologies (FLUTe) liners and groundwater concentrations. RESULTS AND DISCUSSION The following summarises the results of the review of multiple lines of evidence used to characterise the impacts:
• Monitoring Observations – DNAPL has been directly observed at 5 wells during gauging and has been collected from 3 of these wells for compositional analysis. Coal tar in this area of the site was noted to be thick, sticky and hardened quickly when exposed to air.
• Compositional Analysis - Compositional analysis was performed (Table 1) to identify the main constituents. The analysis suggested two differentiable DNAPLs, two samples were dominated by naphthalene and benzene and the other recording a lower benzene component.
Table 1. DNAPL Compositional Analysis (%w/w)
Naphthalene Benzene Phenanthrene Fluoranthene Pyrene Acenaphthylene Well 1 22.1% 7.9% 7.6% 5.7% 4.5% 3.6% Well 2 22.9% 7.5% 7.9% 5.9% 4.7% 3.7% Well 3 25.8% 2.3% 6.2% 4.1% 3.7% 3.1%
• Viscosity Testing - Site specific viscosity testing of the DNAPL indicates that the tar along the southern boundary was at least 100 times more viscous than water (at 40oC), and up to a factor of three higher than that reported in the literature for typical coal tar (Gerhard, 2007) reducing its recoverability.
• Diamond Coring and FLUTe Liners - Diamond core drilling and flexible underground technologies (FLUTe) liners indicated that the coal tar was variably distributed across the rock profile, reflecting the variable connectivity in fractures commonly expected at the edge of a basalt flow. For example, coal tar was not observed until 10 m bgl at one location, however, was observed from the top of rock at 4.6 m bgl at another location located only 0.5 m away.
• Dissolved Phase Concentrations in Groundwater - For each well location, the cumulative concentration ratio between the sampled groundwater concentration and the pure phase solubility for each of the main DNAPL constituents was calculated. The lines of evidence were plotted on a map to develop a realistic understanding of the potential distribution of DNAPL. The groundwater concentrations supported the limited southerly extent of DNAPL and were indicative of no DNAPL in the deeper aquifer.
CONCLUSIONS The DNAPL was found to be variably distributed throughout the rock profile, of a high viscosity, with impacts limited in their vertical and lateral extent. The multiple lines of evidence used to characterise the DNAPL support the CSM and suggest limited practicability of the use of aggressive source remediation measures. REFERENCES Gerhard (2007). Time Scales of DNAPL Migration in Sandy Aquifers Examined via Numerical
Simulation. Ground Water Vol 45 No 2.
167
Table of Contentsfor this manuscript

PERMEABLE REACTIVE BARRIER IN A FRACTURED ROCK AQUIFER — HYDRAULIC INTERACTIONS AND
INFLUENCE OF CONSTRUCTION METHODOLOGY Dana Windle1, Andrew Gray1, Tamie Weaver1, Darren Reedy1, Andrew Hunt1, Akke Ward1,
Camillo Coladonato2
1ERM, Level 6, 99 King Street, Melbourne, Victoria, 3000, AUSTRALIA 2Dow Chemical (Australia) Pty Ltd, 541-583 Kororoit Creek Road, Altona, Victoria, 3018,
AUSTRALIA [email protected]
INTRODUCTION A field-scale, trial permeable reactive barrier (PRB) was constructed in late-2017 and early-2018 at an operating chemical manufacturing plant in Victoria. The PRB was constructed to remediate dissolved phase volatile organic compounds (VOCs) in groundwater within a fractured basalt aquifer. The fractured basalt presents unique challenges for PRB construction and ultimately resulted in adoption of two different construction techniques. Construction generally involved secant pile excavation (with a piling rig) to create a PRB trench measuring 10 metres long, by 1 metre wide, and 22 metres deep. The groundwater table is approximately 7 metres below ground level (m bgl). The geology of the western portion of the PRB allowed drilling and backfilling of the PRB without additional techniques to support the open boreholes. However, greater weathering and less competent basalt in the eastern portion led to borehole collapse during drilling. This was mitigated by the addition of a biodegradable drilling fluid (consisting of xanthan and guar gums) mixed with potable water into the open boreholes. The two halves of the PRB were divided by a temporary sheet pile wall. This paper presents the results of groundwater monitoring 12 months post-PRB construction, focusing on hydraulic interactions of the PRB and the influence of the different construction methodology adopted for the eastern and western portions of the PRB. HYDROGEOLOGICAL EVALUATION Following PRB installation, periodic monitoring of groundwater wells installed up-gradient, within and down-gradient of the PRB has been undertaken. The groundwater monitoring network comprises wells installed at three different depth intervals i.e.
• A series wells - installed just below the groundwater table (nominally 9 – 10m bgl) • B series wells - installed at the mid-point of the aquifer (nominally 14 – 15m bgl) • C series wells - installed at the base of the aquifer (nominally 19 – 20m bgl)
Measurement of groundwater levels has been undertaken on an approximately monthly basis between May 2018 and March 2019. During this time, six rounds of groundwater sampling and laboratory analysis for major ions, total dissolved solids (TDS), volatile fatty acids (VFAs) and VOCs has been undertaken. Viscosity analysis was undertaken for water from the eastern portion of the PRB in April 2018 and September 2018. A program of aquifer testing (slug testing) was also undertaken in October 2018 to assess variations in hydraulic conductivity. Rising and falling head tests were completed in wells within, up-gradient and down-gradient of the PRB. The wells tested were located in the eastern and western portions of the PRB at both the A and C series depth intervals. RESULTS AND DISCUSSION Groundwater elevations outside the PRB are highest in the up-gradient wells and lowest in the down-gradient wells, suggesting groundwater flow through the PRB in the western portion. The groundwater levels within the eastern portion are typically higher than the western portion of the PRB, resulting in an inferred residual “groundwater mound” within the
M36f
Copyright © CRC CARE Pty. Ltd., 2019
CleanUp Conference 2019Adelaide, Australia8 –12 September 2019 168
Table of Contentsfor this manuscript
eastern portion of the PRB. This was inferred to reflect the use of drilling fluids in the eastern portion of the PRB. Overtime, the mounding has dissipated and groundwater levels in the eastern and western portions of the PRB are slowly converging. The groundwater levels within the PRB are almost identical for all depth intervals i.e. the groundwater elevation is the same in the A, B and C series wells. This suggests “averaging out” of the groundwater levels within the PRB due to the homogenous nature of the PRB and induced hydraulic connection. Outside the PRB, there is variation in the groundwater elevation between the depth intervals, likely reflecting the variably fractured, weathered, and heterogeneous nature, and potentially the larger scale sub-surface geometry, of the basalt. Total Dissolved Solids and Major Ions Groundwater outside the PRB (up-gradient and down-gradient wells) is similar in composition, with some variation reflecting the heterogeneous nature of the fractured basalt aquifer. The native groundwater is typified by higher TDS and a major anion composition that is strongly dominated by chloride. Water within the PRB initially reported lower TDS concentrations and elevated proportions of carbonate compared to outside the PRB. Increasing TDS concentrations in the western portion of the PRB indicate inflow of regional groundwater and stabilisation of the western portion of the PRB. Water from the eastern portion of the PRB remains characterised by lower TDS concentrations and higher proportions of carbonate. Combined with the groundwater mounding in this eastern portion, this is inferred to represent slower stabilisation and the presence of remnant potable water from the drilling process. Hydraulic Conductivity and Fluid Viscosity Hydraulic conductivities outside the PRB are approximately one order of magnitude lower than inside the PRB, indicating that the PRB is not acting as a barrier to groundwater flow. Hydraulic conductivities are similar within the PRB, although recent sampling observations suggest a potential reduction in hydraulic conductivity in the eastern portion of the PRB. Higher concentrations of VFAs support the likelihood of higher biological activity in the eastern portion of the PRB. These observations are inferred to reflect the degradation of drilling fluids, resulting in biomass or degradation products, which are subsequently limiting the interaction of the eastern portion of the PRB with the western portion of the PRB, and the basalt aquifer. Fluid viscosities of water from the eastern portion of the PRB show that the lower hydraulic conductivity is not due to the presence of remnant drilling fluids. CONCLUSIONS There are multiple lines of evidence for flow through the western portion of the PRB from up-gradient to down-gradient wells, including an approximately order of magnitude reduction in dissolved phase VOC concentrations downgradient of the PRB overtime. Interaction of the eastern portion of the PRB with the western portion and regional groundwater appears to be more limited. This is inferred to be due to the naturally lower hydraulic conductivities of the basalt aquifer in this area, as well as the introduction and subsequent degradation of drilling fluids leading to potential biofouling in the eastern portion of the PRB. The western portion of the PRB, and its associated construction methodology, is more successful at reducing off-site migration of VOCs.
169
Table of Contentsfor this manuscript

EVOLVING CSMs IN FRACTURED ROCK: A CASE STUDY OF WHAT WE KNOW (AND WHAT WE THINK WE KNOW)
Jonathan Ho
AECOM Australia Pty Ltd, 420 George St, Sydney, 2000, AUSTRALIA
INTRODUCTION Characterisation and remediation in fractured rock settings has been recognised as technically challenging because fate and transport is complex (as compared to better understood fate and transport in typical soil and groundwater systems). Documented struggles to meet clean-up objectives and goals have meant that sites with fractured bedrock are often considered too difficult to successfully remediate.1 This abstract examines the conceptual site model (CSM) evolution that occurred over an approximate 8 year period (2011-2018) at a former aerosols manufacturing facility located above a fractured rock aquifer impacted by chlorinated volatile organic compounds. The site assessment and remediation challenges were evidenced by the iterative investigations carried out between 1992 and up to 2016 by various environmental consultants to address multiple uncertainties in the CSM. The CSM continued to be further refined between 2016 and 2018 during remediation works and also during site validation in 2019, indicative of the complex nature of the geological and hydrogeological setting. WHAT WE KNOW The physical site characteristics can be summarised as follows:
• Sandstone outcrops are present in several areas of the site and generally present between 2 and 6 metres below ground surface (mbgs).
• Perched water sits within the overburden sandy clay and near surface interbedded shale and sandstone at approximately 3 mbgs.
• The clay and shale act as an aquitard reducing the downward movement of groundwater.
• The underlying sandstone comprises a series of sub aquifers, having different hydrostatic heads at different depths within it up to the limit of investigation (20 mbgs)
• Decreases in fracturing of the sandstone with depth and the predominance of horizontal or sub-horizontal fracturing (as opposed to vertical joints/fractures) suggested that impacts were likely to exist within the near surface rock strata
• Primary impacts were associated with 1,1,2-trichloroethane (TCA) and its breakdown products (1,1-dichloroethane [DCA], 1,1- dichloroethene [DCE], vinyl chloride [VC])
CHARACTERISATION METHODS While historical investigations initially focussed on underground storage tanks (USTs) across the 14 Ha site, petroleum related impacts relating to the former Aerosols factory were identified as early as 1998. Chlorinated impacts associated with the manufacture of aerosol products were subsequently identified in by AECOM in 2012. The highest concentrations (by an order of magnitude) of chlorinated volatile organic compounds (CVOCs) were initially identified off-site (in the adjacent downgradient property). A subsequent data gap investigation in 2014 identified a dissolved phase CVOC plume emanating from a likely above ground source. A sandstone characterisation assessment was carried out in 2015 to better delineate the vertical mass distribution of contamination three areas (up to 20 m) using a flexible liner underground technology (FLUTe) and activated carbon fibre technique (FLUTe/FACT) system. AECOM prepared a Remedial Action Plan (RAP) for excavation, 1 Interstate Technology Regulatory Council (2017). Characterisation and Remediation in Fractured Rock Guidance Document (ITRC FracRx-1), December 2017
M36g
Copyright © CRC CARE Pty. Ltd., 2019
CleanUp Conference 2019Adelaide, Australia8 –12 September 2019 170
Table of Contentsfor this manuscript

treatment, and validation works in 2015 based on the available information at the time. The RAP was subsequently revised based on information obtained from a series of supplemental pre-validation assessments carried out in 2016 in advance of the planned remedial action. These supplemental assessments focussed on characterisation of groundwater in the overburden, shallow sandstone, and deeper sandstone profiles using short screen intervals to pre-validate groundwater conditions outside the proposed remediation footprint prior to the commencement of remediation in 2017. WHAT WE THOUGHT WE KNEW Until 2015 (at the time of the initial RAP), the CVOC plume was considered to have been suitably characterised to allow remediation to progress. The soil and bedrock excavation was designed around the profuse shallow impacts and impacts identified in deeper groundwater monitoring wells, with excavation planned to a maximum depth of approximately 12 metres. The remediation planning was based on the following assumptions:
• Delineation of soil impacts (primary hydrocarbon related) and planned excavation of 14,000 m3 in the shallow horizon.
• Delineation of bedrock impacts (primarily CVOC related) to 13 mbgs and planned cutting/excavation of 7,000 m3 in the deeper horizons based on groundwater monitoring results (very limited soil impact identified).
• Groundwater sub aquifers are continuous and hydraulically connected • Required dewatering of up to 0.9 L/sec or 78 m3/day from the excavation based on
predicted groundwater inflow calculations. WHAT WE THINK WE KNOW Review of information obtained during the pre-validation assessments and during actual remediation was used to further supplement the CSM, with the following refinements made:
• Treatment of excavated soil and crushed bedrock was driven by hydrocarbon impacts associated with paraffin (low toxicity) compounds which are ubiquitous across the remediation area.
• Further characterisation of bedrock impacts (in rock, vapour from crushed sandstone, and groundwater) identified a more extensive deep excavation was required (larger footprint and up to 13.5 mbgs).
• Sandstone is very dense with few fractures (slightly dipping to SW) and low porosity (limited dewatering was required as excavation was dry up to 11 mbgs)
• Perched water was intermittent discontinuous from the underlying deeper aquifer. • Groundwater flow is anisotropic and dominated by matrix diffusion and fracture flow
dynamics. LESSONS LEARNT AND WHAT WE STILL DON’T KNOW While recent validation has shown a decreasing profile of dissolved phase impact in the source zone, elevated residual concentrations remain at depths greater than 15 mbgs. Despite the installation of over 160 monitoring wells targeting various strata throughout the assessment, remediation, and validation stages of the project, the CSM for this project continues to evolve. With each iterative stage of investigation, the three dimensional picture becomes somewhat clearer; however, it is evident that uncertainties in the CSM will never be completely eliminated. Therefore, decisions on remedial strategy are often necessarily based on somewhat limited data; however, a balance between additional investment in site characterisation and probability in successful remediation must be carefully considered for fractured rock sites.
171
Table of Contentsfor this manuscript

DYNAMIC AND STATIC FLUX CHAMBERS FOR DIFFERENT APPLICATIONS AT CONTAMINATED SITES
Iason Verginelli, Renato Baciocchi
University of Rome Tor Vergata, Rome (Italy)
INTRODUCTION The occurrence of aerobic biodegradation in the subsurface by ubiquitous soil microbes has been shown to reduce and in some in cases eliminate the impacts of petroleum hydrocarbon vapours from contaminated soil or groundwater on indoor and outdoor air quality. Specifically, under oxygen rich conditions petroleum vapor concentration can be attenuated by orders of magnitude within few meters. Despite this, due to the too conservative character of the screening models generally used in the risk analysis framework, vapour intrusion still results a critical pathway in several petroleum-contaminated sites. To overcome this limitation, either more detailed models accounting for biodegradation need to be used or proper monitoring of soil gas composition needs to be carried out. METHODS To evaluate the significance of aerobic biodegradation, field investigations are usually carried out by employing multi-level soil-gas nested probes to evaluate the vertical profiles of vapours and oxygen in the subsurface and hence to evaluate the attenuation factors in terms of reduction of soil-gas concentrations. In this work, we will discuss an alternative approach for measuring natural attenuation rates occurring in the subsurface, which relies on the combined use of static (accumulation) chambers and dynamic flux chambers. The first ones are static chambers fitted with a recirculation pump and usually equipped with PID/FID (and IR) detector, which can be used to perform a fast screening of the overall VOC (and CO2) flux, thus allowing to identify the areas of a site characterized by higher VOC fluxes, while comparing this information with the CO2 flux. Based on the outcome of this preliminary screening step, dynamic flux chambers can be then deployed; this type of chamber is characterized by a constant flow of an inert gas, so that a steady state concentration within the chamber is achieved. This concentration can be measured by means of a canister connected to this chamber, and the flux of individual VOCs can be estimated by coupling this information with the inert gas flow rate and geometric properties of the chamber. RESULTS AND DISCUSSION In this work, we will analyse the results obtained at different contaminated sites, relying on the approach outlined above. As an example, we here below summarize the results, already reported more in detail elsewhere (Verginelli et al., 2018), collected at a contaminated site in Italy. In this case study, the flux of volatile organic compounds (VOCs) from the subsurface was estimated using 14 “dynamic” chambers, by measuring with a canister the concentration of vapours collected over a period of approximately 6 hours. Before starting the measurement, the achievement of steady-state conditions inside the chamber was assured by purging at least 3 to 4 chamber volumes of an inert gas. The measurements in the 14 sampling points were repeated in 3 seasonal campaigns. The fluxes measured in the different campaigns were quite similar, leading always to acceptable risks from vapour inhalation and showing that in the investigated site the seasonal effects on VOCs emission were quite limited. The measured fluxes were compared with those predicted using a non-reactive model, starting from the source concentrations, showing that, in line with other recent studies, this model can overestimate the expected outdoor concentration of petroleum hydrocarbons in some cases up to 4 orders of magnitude. On the other hand, by coupling the measured data with the fluxes estimated with the diffusive non-reactive model, it was possible to perform a mass balance to evaluate the natural attenuation loss rates of
M37a
Copyright © CRC CARE Pty. Ltd., 2019
CleanUp Conference 2019Adelaide, Australia8 –12 September 2019 172
Table of Contentsfor this manuscript

petroleum hydrocarbons during the migration from the source to ground level. Specifically, the loss rate of petroleum hydrocarbons was estimated as the difference between the diffusive flux estimated with the non-reactive model from the contamination present in the source underlying the flux chamber and the flux effectively measured at the surface. Based on this comparison, the estimated BTEX loss rates were up to 0.5 kg/year/m2. These rates are in line with the values reported in the recent literature for natural source zone depletion and are not far from the rates reported for some active remediation options. In short, the method presented in this work can represent an easy-to-use and cost-effective option that can provide a fast and reliable line of evidence of natural attenuation rates expected at contaminated sites. CONCLUSIONS The measurement of VOC flux with dynamic chambers can be a useful approach to evaluate the effective risks due to vapour inhalation at contaminated sites and to assess the actual attenuation of VOC vapors in the vadose zone. The combined use of static was found to be useful at many contaminated sites, characterized by important VOC flux heterogeneity, as it served to select the more significant location for the dynamic flux chambers. Besides being useful in providing support for HHRA, the data collected from both static and dynamic flux chambers can provide a further line of evidence also for Natural Source Zone Depletion studies, if the VOC data are properly coupled with CO2 flux data. REFERENCES Verginelli I., Pecoraro R., Baciocchi R. (2018) Using dynamic flux chambers to estimate the
natural attenuation rates in the subsurface at petroleum contaminated sites, Sci. Total Environ. 619-620: 470-479.
173
Table of Contentsfor this manuscript

IN-SITU CHEMICAL OXIDATION; IMPROVING THE STATE OF PRACTICE FROM VARIOUS SITE EXPERIENCES
Brendan M. Brodie1, Tim Pac2
1ERM, Level 15, 309 Kent Street, Sydney NSW AUSTRALIA
2ERM, 15 Park West Row, Providence, Rhode Island, USA [email protected]
INTRODUCTION Since implementation of the first In-Situ Chemical Oxidation (ISCO) projects in the mid 1990’s, ISCO has evolved into a mature technology here in Australia and across the globe. Since then, a number of technical advances and lessons learnt have been made through experience, though not generally discussed. (Pac, Baldock J, Brodie B, et al, 2019, p. 75-91). ISCO places injected reactive material (an oxidant) into the subsurface to obtain contact with the target compounds; typically petroleum hydrocarbons or chlorinated solvents. Facilitated contact allows the oxidant to react with (degrade) the target compounds by chemical reaction, producing daughter products that may be more amenable to natural attenuation or have little to no consequence to groundwater or soil conditions. Contact and reaction may be facilitated by a variety of induced and natural groundwater mechanisms—displacement, advection, dispersion and diffusion during and following injection. While contact does not guarantee full degradation will occur, the inability to provide and maintain contact will inhibit ISCO effectiveness. “Effective delivery of amendment, however, remains the single most important aspect of successful remediation, particularly given the range of potentially applicable delivery methods and site complexities” (Pac, Lewis, & Gyles, 2014, p. 71). METHODS This presentation will explore a selection of advances leading to success and lessons learned during the completion of multiple projects both locally in Australia and globally. It will present a variety of topical areas pertaining to safety, technical and commercial application of ISCO at a variety of sites. ISCO remediation advancements and application trends over time will also be discussed. However, the presentation’s key focus will highlight the importance of increasing the ability for uniform and thorough contact with the target compounds. Two primary case studies include: Case study 1 is an active retail service station site in south-east Queensland, multiple site conditions such as shallow groundwater, potential acid sulphate soils and a residential property within close proximity to the hydrocarbon source area provided technical and non-technical limitations to our remedial choices. Case study 2 is a former Petroleum storage facility north of Sydney. Although excavations have removed the majority of the heavy end hydrocarbon impacts, areas between the site boundary and a water channel need remediation to prevent ongoing impacts to the waterway. RESULTS AND DISCUSSION ISCO was first applied for environmental remediation in North America in the 1990’s. Since that time, ISCO has become widely used in a variety of manifestations using different distribution mechanisms to remediate contaminated sites in differing geologies. While the benefits of “correct” remedial application are widely known (e.g. cost effectiveness, speed of application, permanence of treatment), the applications have also provided a variety of “incorrect” applications (e.g., unintended flow paths, overpromised performance, incomplete contact) that are less known. These applications provide an opportunity to highlight the technological improvements through enhanced site-understanding and delivery methods (e.g., conceptual site model, detailed characterization, indirect tools, pore dilation, in-situ
M37b
Copyright © CRC CARE Pty. Ltd., 2019
CleanUp Conference 2019Adelaide, Australia8 –12 September 2019 174
Table of Contentsfor this manuscript

mixing), as well as several recurring themes in performance (e.g., incorrect technology selection, incomplete site understanding). While the technology basis has not changed significantly, methods of characterization, application and measurement of performance have resulted in innovation, creative experience and global collaboration leading to reductions in energy, cost and time while providing ever safer and successful implementation. CONCLUSIONS It is expected that ISCO will continue to be an ever more important component of the remediation of sites for the foreseeable future, as is needed to address the large and complex sites that necessitate flexible coupled remedies. This success however, requires an objective understanding of both the benefits and the limitations of the technology. REFERENCES Pac TJ, Baldock J, Brodie B, et al. In situ chemical oxidation: Lessons learned at multiple
sites. Remediation. 2019;29:75–91. Pac, T. J., Lewis R. W., & Gyles, E. C. (2014). Constant head injection for enhanced in situ
chemical oxidation, Remediation, 25(1), 71–83.
175
Table of Contentsfor this manuscript

CHLORINATED HYDROCARBON SOURCE INVESTIGATIONS BY SOIL VAPOUR SCREENING — A CASE STUDY
Meredith Rasch1, Rory Lane2
1Renewal SA, GPO Box 698, Adelaide, 5001, AUSTRALIA
2BlueSphere Environmental, 438 Goodwood Road, Cumberland Park, 5041, AUSTRALIA [email protected]
INTRODUCTION A portion of the Tonsley Innovation Precinct in southern Adelaide (formerly the Mitsubishi Motors car manufacturing facility) is subject of a Voluntary Site Contamination Assessment Proposal (VSCAP) with a site contamination auditor appointed. All the environmental investigations for this have been undertaken by BlueSphere Environmental. A number of volatile chlorinated hydrocarbon (VCH) groundwater plumes have been identified beneath and in the vicinity of the Precinct. However, despite undertaking comprehensive site histories, soil and soil vapour investigations and iterations of the conceptual site model in accordance with the NEPM, the historical sources of some of these plumes had not been identified. As part of the VSCAP investigations it was necessary to determine whether any unsaturated zone VCH sources were present in the area of interest. As the area to be investigated was large (approximately 7 hectares), traditional soil and soil vapour sampling techniques were financially impracticable and hence a scientifically robust but cost effective investigation methodology that maximised the coverage of the site and the information returned was required. METHODS BlueSphere developed a staged approach comprising an initial broad scale soil vapour survey of the site which was then used to focus other more expensive techniques that were used to verify the results to the auditor’s satisfaction. Stage 1 — Soil Vapour Survey A preliminary screening technique using a photo-ionisation detector (PID) was undertaken. A total of 527 temporary soil vapour bores were installed over four weeks to a depth of 1.2 m bgl on an approximate 12 m x 12 m grid across the site using a temporary soil vapour probe driven by a small hydraulic direct push drill rig. These were all monitored using a PID and a landfill gas meter providing real-time screening data. Using this method more than 50 locations could be investigated per day. Confirmatory summa sampling and laboratory analysis was undertaken at 13 locations to provide validation samples for comparison to the results obtained from the PID. Stage 2 — Membrane Interface Probe and Hydraulic Profiling Tool (MiHPT) Investigation MiHPT was considered to be the most effective way of identifying VCH impacted unsaturated zone soils following the soil vapour screening. A total of 54 MiHPT boreholes were subsequently drilled over a 3 week period, targeting areas identified from the soil vapour screening as having a high probability of containing a source zone. Stage 3 — Confirmatory Drilling A total of 39 locations were then selected for confirmatory soil bore drilling to verify the existence of any VCH source zones at areas identified by the soil vapour screening and MiHPT investigations as being of interest. Push tube drilling was undertaken over a 2 week period with soil sampling targeting depths at which spikes were reported in the MiPHT
M37c
Copyright © CRC CARE Pty. Ltd., 2019
CleanUp Conference 2019Adelaide, Australia8 –12 September 2019 176
Table of Contentsfor this manuscript

investigation. Soil samples were then submitted for analysis for ultra-trace VCH and selected samples for total recoverable hydrocarbons (TRH). RESULTS AND DISCUSSION The results of the PID vapour screening were used to determine areas with a low (< 2 ppm), moderate (2 to 20 ppm) or high (> 20 ppm) probability of containing an unsaturated zone soil VCH or petroleum hydrocarbon source. (The PID did not discern between petroleum and chlorinated hydrocarbons). Verification of the screening results was undertaken by comparison of the PID results with the laboratory analytical results. The results showed that the PID vapour screening correlated well with total volatile vapour analytical results (refer Table 1) and therefore potential sources of VCH or hydrocarbon in the unsaturated zone could be identified.
Table 1. PID Vapour Screening compared to TCE laboratory analytical results. Sample PID
(ppm) Total VCH
(ppm) Other analytes affecting PID
S3_F6 1.8 <5.1 S3_J8 15 14.2
S4_D3A 5 0.015 C6-C14 S4_O3 0.2 0.004
M12_A6A 46 0.046 Monoterpenes M12_F1 2 1.84 AOI_D11 9 0.076 Monoterpenes AOI_D3 0.15 0.07 RA_F13 26.7 17 RA_I14 0.3 0.07 SA_E2 100 <5.4 C10-C16
SA_G14 0.4 0.02
As the vapour screening methodology had been demonstrated to reflect elevated hydrocarbon impacts, MiHPT was then used to target the “high probability” areas to identify depth of VCH impacts (indicated by the halogen specific detector (XSD) response) and petroleum hydrocarbons (indicated by the flame ionisation detector (FID) and/or PID response). The subsequent soil boring and sampling targeted those depths and locations identified in the MiHPT, with 16 drilling locations able to be cross correlated with the MiHPT data. (Given that the location of MiHPT holes and soil bores cannot be in exactly the same location some variation was expected).
• Three locations showed no significant XSD spikes and reported VCH concentrations <LOR.
• Ten locations showed XSD spikes and reported VCH concentrations >LOR. • Three locations showed XSD spikes but did not report VCH concentrations (possibly
due to the soil bore sampling missing minor localised impacts) All VCH concentrations reported in the unsaturated zone soils were low (< 1 mg/kg). All samples analysed for petroleum hydrocarbons reported analytical results < LOR indicating that it was unlikely that any areas of gross petroleum hydrocarbon were present in this area. CONCLUSIONS The soil vapour screening technique was a cost-effective method that allowed for a large area (7 Ha) to be surveyed in a short period of time, providing real-time screening data at more than 50 locations per day. The method was effective in identifying low concentrations of VCHs in the soil profile and enabled subsequent MiHPT and soil boring investigations to be effectively targeted at potential source areas. The staged approach allowed for the impact to site occupants and users to be managed and minimised, while providing multiple lines of evidence to satisfy the site contamination auditor’s requirements.
REFERENCES BlueSphere Environmental (2018) Tonsley VSCAP Investigation: Source Investigations
February 2017 to April 2018
177
Table of Contentsfor this manuscript

BACKGROUND VOC CONCENTRATIONS IN INDOOR AND OUTDOOR AMBIENT AIR IN AUSTRALIA - INFORMATION TO
EVALUATE AND INTERPRET VAPOUR INTRUSION RISKS
Adrian Heggie1, Bianca Shnaiderman2, Matthew Miklos3
1WSP Australia, 680 George Street, Sydney, NSW 2000, AUSTRALIA
2WSP Australia, 900 Ann Street, Fortitude Valley, QLD 4006, AUSTRALIA 3WSP Australia, 680 George Street, Sydney, NSW 2000, AUSTRALIA
Adrian.heggie, Bianca.shnaiderman, [email protected]
INTRODUCTION Accurate assessments of vapour intrusion risks require reliable information on background concentrations of contaminants of concern in ambient indoor and outdoor air. Data on ambient indoor and outdoor air concentrations of common contaminant VOCs at 25 locations in Australian cities and towns have been compiled and are presented here to describe the range of typical ambient background air concentrations and to characterise typical backgrounds. METHODS The database comprised paired indoor and outdoor ambient air measurements at 12 service station and 13 other commercial properties. Measurements were made by Radiello SD 130 sorbent tubes over sampling durations of 5 to 10 days resulting in detection limits of less than 0.1 µg/m3. A suite of 30 petroleum based and 16 chlorinated solvent VOCs were analysed by GC/MS. At each location testing was conducted for vapour intrusion risk assessments, however the data were subsequently collectively used to characterise ambient air background concentrations at Australian sites. Results were compared to backgrounds reported in the Californian Air Resources Board (CARB) data base. At service station locations, the data allowed an assessment of between indoor and outdoor air concentrations – the data being used to assist in the identification of vapour intrusion or indoor sources. The global atmospheric background persistent VOC, Carbon Tetrachloride (CT), was used as a data quality control indicator and as a tool to aid in the interpretation of indoor/outdoor differences in VOC concentrations. RESULTS AND DISCUSSION Results showed the following distinctive features characteristic of indoor and outdoor ambient air concentrations.
• VOC concentrations of petroleum hydrocarbons were typically higher in indoor air than in outdoor air at service stations – even when vapour intrusion was not occurring, and indoor sources were absent (Table 1).
• Mean background petroleum VOCs were higher at service stations than at other commercial sites (Table 2) – reflecting strong service station refuelling sources.
• Means and typical values of benzene exceeded the health based criterion in both indoor and outdoor settings.
• Excluding commercial and industrial sites where chlorinated solvents existed as sub-surface contaminants or were being used, mean background ambient air concentrations of chlorinated VOCs were typically very low (<0.1 µg/m3). Exceptions, where detections were common, were tetrachloroethene and carbon tetrachloride (CT). Background ambient concentrations of trichloromethane (chloroform) were also detected at some sites.
• CT was present at all sites at a consistent concentration of 0.2 to 0.4 µg/m3 (overall mean for all sites, 0.37 µg/m3). CT is a persistent global atmospheric background VOC.
M37d
Copyright © CRC CARE Pty. Ltd., 2019
CleanUp Conference 2019Adelaide, Australia8 –12 September 2019 178
Table of Contentsfor this manuscript

• Radiello SD130 sampling tubes gave outstanding precision, even at sub-microgram concentrations, as illustrated by relative percent differences (RPDs) for duplicate samples.
• Comparison of the Australian data with the CARB data base for carbon tetrachloride shows a lower background in Australia compared to California (0.37 µg/m3 vs 0.64 µg/m3,respectively)
Table 1..Mean BTEX concentrations (µg/m3) at Australian service stations – indoor & outdoor ambient air
Benzene Toluene Ethyl-benzene Xylene
indoor outdoor indoor outdoor indoor outdoor indoor outdoor
All SStn sites 7.4 3.7 48.3 20.5 7.3 3.6 40.6 18.0
Non VI sites# 5.4 3.7 32.8 21.5 4.6 3.8 22.2 19.7 # Sites where vapour intrusion was not occurring and indoor sources of VOCs were not present Table 2..Mean background ambient air concentrations (µg/m3) at Australian service stations vs other commercial sites
Benzene Toluene Ethylbenzene Xylene Carbon tet. Service Stations 3.7 20.5 3.6 18.0 0.33
Other commercial 0.66 3.6 0.67 2.66 0.38 Table 3..Example of RPDs for duplicate samples of Radiello SD130 solvent tubes showing high measurement precision [example is Keswick SA, March 2016]
Benzene Toluene Ethyl-b o-xylene TCE PCE Carbon tet. Sample AA1 1.5 22 1.1 1.1 2.1 0.31 0.52
Sample AA1 dup 1.4 20 1.1 1.0 1.9 0.28 0.48 RPD 7% 10% 0% 10% 10% 10% 8%
CONCLUSIONS Concentrations of BTEX compounds were typically higher in indoor air at service stations than outdoor ambient air. The probable cause is the greater dispersion outdoors on the forecourt. This pattern of higher indoor air concentrations was independent of indoor BTEX sources and vapour intrusion impacts which were found to be not occurring at the majority of sites. An understanding of the pattern of higher indoor air concentrations of VOCs at service stations is crucial in vapour intrusion risk assessment. The lower, but still significant, mean background benzene concentration in ambient air at other commercial (non-fuel) sites has been measured at 0.66 µg/m3 which must also be considered in risk assessments. Radiello SD 130 sorbent tubes have been shown to produce reliable and highly precise measurements – capable of identifying low level background concentrations of VOCs. Low level background concentrations were identified and quantified for PCE, chloroform and carbon tetrachloride, while TCE backgrounds were typically less than 0.04 µg/m3. The global background of persistent CT can be used as a tool to evaluate data quality as it has a global background level within a small range. REFERENCES Californian Air Resources Board (CARB) data base National Environment Protection (Air Toxics) Measure, 2004. National Environment
Protection Council
179
Table of Contentsfor this manuscript

ENHANCED REDUCTIVE DECHLORINATION FOR A CHLORINATED HYDROCARBONS IMPACTED ACTIVE SITE
Lorenzo Sacchetti, Jordi Aragones
Carus Europe S.L., C/Rosal 4, Oviedo 33099, SPAIN
INTRODUCTION Historical Chemicals production sites present a variety of contamination mainly due to production residuals management bad practices. Considering that most of the environmental laws have been enforced in the 1970’s it is clear that for decades industrial wastes have been mishandled and dispersed in the subsurface. This presentation will show a consistent approach based on detailed High Resolution assessment by Membrane Interface Probe (MIP) to detect subsurface contaminants distribution and to use such data for a targeted In Situ Enhanced Reductive Dechlorination (ERD) treatment. The site is located few hundred meters from the sea and it is included in a still active chemical plant where production activities started at the beginning of XX century. METHODS After few traditional characterisation steps with soil borings (soil sampling) and monitoring wells installation (groundwater monitoring), it was selected an impacted area free of structures for an In Situ pilot treatment. Carus was selected as provider of remediation reagents due to wide range of products available and an High Resolution characterisation (MIP) was carried out to better understand contamination distribution to target reagents injections reducing amount and cost for the field works. Over 22 MIP points have been installed in a 50x50m area to a depth of 32 m. A 3-D model was used to visualize and calculate the impacted soil volume so that the ERD reagent quantity was properly calculated. The ABC+ ERD Reagent (blend of Carbon Substrate ABC and microscale Zero Valent Iron) was injected in 10 locations by direct push technology with a total volume of 120 m3 of injection fluit @ 205 ABC+. RESULTS AND DISCUSSION After the injection a strong increase of Chlorinated Hydrocarbons was observed due to mechanical mobilisation from product jnection, in addition one of the constituents if a natural cosolvent helping to transfer contamination from adsorbed to dissolved phase where biotic and abiotic degradation reaction occurs. During the second monitoring round chloromethanes, chloroethanes and chloroethenes concentrations decreased with chloroethenes still at high concentrations. CONCLUSIONS ERD treatment of Chlorinted Hydorcarbons was supported by detailed MIP investigation to address sources of contaminations. Current field data show effectiveness in reducing concetrations but next monitoring rounds will allow to understand the overall effectiveness of the treatment.
M37e
Copyright © CRC CARE Pty. Ltd., 2019
CleanUp Conference 2019Adelaide, Australia8 –12 September 2019 180
Table of Contentsfor this manuscript

PFAS OCCURRENCE IN VERMONT — A SUMMARY OF RESULTS FOR VERMONT’S
COMPREHENSIVE MULTI-MEDIA SAMPLING PROGRAM
Richard Spiese
Vermont Department of Environmental Conservation, Montpelier, Vermont, USA [email protected]
Vermont is a small State in the United States of America with a population of approximately 630,000 people located in a region called New England in the northeastern part of the country. Vermont is a non-industrial state with its primary industry being agriculture and tourism. In February of 2016 the Department of Environmental Conservation (DEC) discovered perfluoroalkyl substances (PFAS) (primarily perfluorooctanoic acid (PFOA)) from a former Teflon coating factory in the village of North Bennington in the southwestern part of Vermont. In response to the discovery of PFAS, the Vermont DEC undertook investigation of numerous potential sources of PFAS using a strategic sampling strategy that is updated and adapted based on the latest scientific research. This presentation will provide an overview of the findings of this work and provide a look into potential future additional work. It will also present the findings of additional basic research into sampling methods, analytical approaches, and background shallow surface soil PFAS concentrations. The initial part of this presentation will be an update the most recent activities at the North Bennington Teflon coating factory site (known as Chemfab). The Vermont DEC entered into two legal agreements with the Potentially Responsible Party (RP) (Settling Defendant) at this site, the first in 2017 and the most recent one in April of 2019. The major conditions in this agreement include extending approximately 10 miles (16 kilometers) of municipal water lines to homes affected above Vermont’s Drinking Water Standard (DWS) for the sum of 5 PFAS; PFOA, PFOS, PFHxS, PFNA, and PFHpA. Additionally, the Settling Defendant will attempt to drill replacement wells at the homes that are affected above Vermont’s DWS and when not possible to maintain a point-of-entry-treatment (POET) system, including sampling. The Settling Defendant will also continue to sample all homes with wells in the site area (approximately 15 sq. mi. (40 sq. km)); currently about 165 wells, until groundwater standards are met in these water supply wells and assigned compliance points (former drinking water wells and monitoring wells) throughout the site. Lastly the Settling Defendant agreed to reimburse the DEC for all costs incurred by the State; approximately $3M US, and reimburse the State future oversight costs. In addition to this update, the presentation will present the findings of Vermont’s statewide sampling effort on the following industries and facilities: Wire coating facilities, semi-conductor facilities, battery manufacturing facilities, fire-fighting foam locations, groundwater at landfills, landfill leachate, waste water treatment plants and tanneries. As part of this effort, samples were also collected from surface water, sediment and fish, biosolids, exiting monitoring wells, private and public drinking water supplies. For a link to the report showing the findings of this work, go to https://dec.vermont.gov/content/pfas-sampling-report. Lastly, the presentation will present the findings of limited researched performed by the state on issues including test methods, field QA/QC, and background levels of PFAS in shallow surface soils throughout Vermont.
M41a
Copyright © CRC CARE Pty. Ltd., 2019
CleanUp Conference 2019Adelaide, Australia
8 –12 September 2019181
Table of Contentsfor this manuscript

AFFF — METHODS FOR PRODUCT SAMPLING
Matthew Colthorpe1, Kathryn East2, Peter Lavelle3, Ken Kiefer4
1ERM, PO Box 803, Newcastle, 2300, AUSTRALIA 2ERM, PO Box 1400, Brisbane, 4004, AUSTRALIA 3ERM, PO Box 4160, Canberra, 2604, AUSTRALIA
4ERM, Locked Bag 3012 Australia Square NSW 1215, AUSTRALIA [email protected]
INTRODUCTION With increased regulator and industry focus on transitioning to non-fluorinated or short-chain fluorinated aqueous film-forming foams (AFFF), there are a number of challenges to be met relating to characterisation of AFFF in terms of transitioning to compliant AFFF and for appropriate disposal of legacy AFFF. Whilst there is guidance on appropriate methodologies for environmental sampling, little guidance or practical information on technically sound and safe methodologies for sampling AFFF products for the purposes of detailed characterisation (both physical and chemical properties) is available. ERM recently conducted a project with the Australian Department of Defence (Defence) focusing on assessment of legacy AFFF products, in which this challenge was identified and overcome. The challenges for sampling were identified as:
• collection of representative samples of AFFF products from a variety of vessels ranging in size from 20 litres (L) to 15,000 L, taking into consideration the potential for fractionation / heterogeneity in larger vessels that do not have a mixing mechanism;
• introduction of PFAS sources from clothing, PPE and sampling equipment; • potential effects that the sampling process may have on the product itself, i.e.
compositional change. METHODS The process to determine the most practical methods for sampling product incorporated a review of relevant guidelines for sampling other products (such as petroleum or oil products), as well as a review of current sampling guidance for PFAS compounds in the environment (i.e. soil, sediments and groundwater) and engaging with project stakeholders (i.e. laboratories) that may have insights into methods that may be more practical and applicable. Considering the relevant information it was determined that the primary sampling methodologies, depending on vessel size, would be either a disposable hand-operated polyethylene bellows action siphon pump (small vessels <200 L) or a peristaltic pump and HDPE tubing (larger vessels >200 L). In instances were the primary sampling methods were adopted and were found to be unsuccessful in the retrieval of a representative sample, than a list of alternative sampling methods had been pre-determined, these alternatives included:
• hand priming siphon pump; • disposable self-priming/jiggle siphon pump; • composite liquid waste sampler (COLIWASA) tube sampling (positively sealing tube
with finger to retain sample in tube); • tubing and syringe, induce flow through tubing with the syringe to obtain sample; and • grab sample (sampling arm and container).
To confirm that no outside sources of potential PFAS cross contamination occurred from sampling equipment, rinsate and rinsate blanks from field equipment were collected in the field and sent to the laboratory for analysis. To assess the potential for stratification and allow for identification of possible variations, product samples were obtained from different depths from vessels >200 L without a mixing mechanism. A portion of the discrete samples was composited by the laboratory, with the remainder retained for individual analysis.
M41b
Copyright © CRC CARE Pty. Ltd., 2019
CleanUp Conference 2019Adelaide, Australia8 –12 September 2019 182
Table of Contentsfor this manuscript

FINDINGS The collection of AFFF product samples via the primary methods for vessels of various volumes was generally successful with key benefits for each sampling methodology summarised as follows: • Disposable hand-operated polyethylene bellows action siphon pump (vessels
<200 L): o economical piece of sampling equipment for single use sample methods; o the differing viscosities of the products did not affect the ability of the equipment to
collect a representative sample; o quick sampling time (sample obtained after only 3 – 5 primes of the bellow); o the prescribed sampling method (which included mixing the product within the vessel
prior to sampling) could be completed with one piece of equipment which reduced the potential for cross contamination between samples; and
o Minimal foaming of the product during sample collection. • Peristaltic pump and HDPE tubing (vessels >200L):
o allowed for collection of discrete samples from accurate depths within the profile of the tank;
o minimal opportunity for cross contamination between vessels (given that the tubing was only used once);
o allowed for the assessment of potential stratification within the tank as it caused minimal disruption of the product;
o relatively quick sample time, given samples could be obtained from different depths after initial set up; and
o minimal foaming of the product during sample collection. However, in one instance when sampling a vessel >200 L, a sample could not be retrieved using a peristaltic pump and tubing. In this instance, it was observed that by the time the product had made its way through the sampling chain the product had foamed up and a representative sample could not be collected. Other prescribed methods were subsequently attempted; however, similar outcomes (ie producing foam) were observed with all prescribed methods. In this instance the sampling method reverted to lowering a sample jar attached to a sampling arm into the tank to retrieve a sample. CONCLUSIONS It was considered that the most practical methodologies for sampling AFFF products were:
• disposable hand-operated polyethylene bellows action siphon pump for smaller vessels where only single samples are required; and
• peristaltic pump and HDPE tubing where the need arises to sample large vessels or where a targeted sample depth is required.
Results from rinsate and rinsate blank samples confirmed that the sampling equipment used did not introduce any outside sources of PFAS into the samples collected. REFERENCES Heads of Environmental Protection Agencies (HEPA) (January 2018) PFAS National
Environmental Management Plan Western Australian Department of Water and Environmental Regulation (WA DER)
(February 2016) Interim Guideline on the Assessment and Management of Perfluoroalkyl and Polyfluoroalkyl Substances (PFAS) – Contaminated Site Guidelines
Dyne Technologies LLC (2014) Dyne Compliance Testing – A Few Things to Consider when Sampling Foam
ASTM E300-03 (2017) – Standard Practice for Sampling Industrial Chemicals
183
Table of Contentsfor this manuscript

SOIL INJECTION OF LIQUID BIOSOLIDS: TRACKING THE PFAS THREAT IN GROUNDWATER, SOIL AND FORAGE SORGHUM
Aravind Surapaneni1,3, Balaji Seshadri2,3, James Hampton1,3, Graeme Short1,3, Peter Uren1,
Chris Hetherington4, Megharaj Mallavarapu2,3
1South East Water, Frankston, 3199, AUSTRALIA
2Global Centre for Environmental Remediation, University of Newcastle, AUSTRALIA 3Cooperative Research Centre for High Performance Soils, Callaghan, NSW, AUSTRALIA
4Cleanaway Organics, South Nowra, 2541, AUSTRALIA [email protected]
INTRODUCTION Per- and poly-fluoroalkyl substances (PFAS) are a class of manufactured organic contaminants of emerging concern. They are mainly used in the production of firefighting foams, water repellents and to resist stain and grease. Among the range of PFAS chemicals, perfluorooctane sulfonic acid (PFOS), perfluorooctanoic acid (PFOA), and perfluorohexane sulfonate (PFHxS) are three of the key chemicals of concern. Although the approach to determine safe limits for PFAS contamination in biosolids are well established, more scientific information and risk assessments are required to predict safe limits for PFAS to protect both human and environmental health. The national survey conducted by the Australia New Zealand Biosolids Partnership (ANZBP) on PFOS and PFOA showed median values of 0.003 and 0.002 mg/kg, respectively, with maximum values of 0.386 and 0.05 mg/kg, respectively (Hopewell and Darvodelsky, 2017). The ANZBP reported that PFOA represents a comparatively lower risk compared to PFOS in biosolids. They recommended the limits for unrestricted and agricultural use of PFOS in biosolids at 0.3 and 4.2 mg/kg, respectively. However, the PFAS National Environment Management Plan (NEMP) Version 2.0 recommend a conservative soil (residential) human health screening level (HSL) of 0.01 mg/kg for the sum of PFOS and PFHxS, and 0.3 mg/kg for PFOA (HEPA, 2019), which potentially has a significant impact on the beneficial use of biosolids. South East Water obtained approval from the Victorian EPA through their Research, Development and Demonstration (RD&D) pathway to trial the soil injection of liquid biosolids as an alternative application method in agriculture. Currently, there is limited information on PFAS in liquid biosolids and the fate of PFAS after land application of liquid biosolids. The aim of this research is to investigate any potential impacts of soil injection of liquid biosolids on PFAS contamination in groundwater, soil and herbage. METHODS Site location The liquid injection trial was conducted at South East Water’s Longwarry Water Recycling Plant (WRP) 83 km southeast of Melbourne. The WRP consists of a facultative lagoon system with a capacity of 900 kL/day and a sludge storage facility (Fig. 1). Around 20 ha are under dry land farming and there is no history of biosolids application at this site. Sludge treatment, soil injection and crop establishment The raw sludge (prescribed industrial waste) from Facultative Lagoon 1 (Fig. 1) was transferred (by dredging and pumping) to two sludge storages (Fig. 1) and digested at ambient temperature for >60 days to achieve a 1 log reduction of Salmonella species and enteric viruses based on the EPA Victoria requirements and to achieve a T3 grade biosolids by alternative processes. Prior to soil injection, the liquid biosolids from the sludge storages were mixed using a silenced canopy pump to ensure homogeneity and analysed for physico-chemical and biological properties. The biosolids were then pumped directly into a Soil Injection Vehicle (SIV), “Terragator“. The SIV transported the homogenous biosolids to the
M41c
Copyright © CRC CARE Pty. Ltd., 2019
CleanUp Conference 2019Adelaide, Australia8 –12 September 2019 184
Table of Contentsfor this manuscript

trial site and injected the product directly into the subsoil (20-30 cm depth at an application rate of 311 wet tonnes/ha). A total of 13.80 ha of land was divided into five treatment paddocks (T1-T5), and an additional 3.53 ha served as control (C1) and no-treatment areas (NT1-NT5) (Fig.1). A dryland forage sorghum crop was established under standard agronomic management practices.
Fig. 1.Trial site map showing facultative lagoons, sludge storages, liquid injected paddocks (T1-T5), control (C1) and buffer (NT1-NT5) areas, and Piezo locations (PZ1-PZ5). Sampling and analysis Raw sludge samples collected from Facultative Lagoon 1 before treatment, and treated sludge (T3 grade liquid biosolids) samples collected from sludge storages prior to soil injection were analysed for PFAS. The biosolids contaminant concentrations (BCC) were calculated for PFOS, PFOA and PFHxS, using Eq.1 below (EPA Victoria, 2004). Groundwater samples from Piezos (PZ1-PZ5) were collected once prior to injection and monthly after injection. Whole plant and soil samples were collected during harvest (May 2019). All the samples were analysed for PFAS.
BCC = m + (y * s) (1) where, m = mean of samples; s = standard deviation; y = coefficient based on number of samples. RESULTS AND DISCUSSION The raw sludge from Facultative Lagoon 1 and the treated sludge in the sludge lagoons showed detectable levels of PFOS, PFOA and PFHxS (detection limit <0.0002 mg/kg). The BCC values in the raw sludge samples showed that PFOA was within the PFAS NEMP (2.0) guidelines (HEPA, 2018) for residential use (0.3 mg/kg), while PFOS+PFHxS exceeded the guideline value of 0.01 mg/kg. PFOS, PFHxS and PFOA in the T3 grade liquid biosolids that were injected in the soil were within these guideline limits (Fig. 2). PFAS in the groundwater and soil were below the detection limit with the exception of PFOS in the soil at both treatment and no-treatment areas. The soil PFOS values ranged from 0.0002 to 0.0004 mg/kg, which are below the PFAS NEMP (2.0) guidelines. Perfluorobutanoic acid (PFBA) was found in the plant samples (Fig.3) despite the fact that it was not detected in the liquid biosolids, groundwater and soil samples, while all other PFAS compounds were below detection limits. CONCLUSIONS The tracking of PFAS compounds as a result of soil injection of liquid biosolids revealed that the presence of PFAS in the soil was limited to PFOS only, although PFOS did not move vertically to the groundwater. In the plant samples, PFBA was the only PFAS detected, which needs further investigation on the possible reasons for detection.
185
Table of Contentsfor this manuscript

Fig. 2. BCC of PFAS in liquid biosolids
Fig. 3. Detected PFBA levels in sorghum
ACKNOWLEDGEMENTS The work has been supported by the Cooperative Research Centre for High Performance Soils whose activities are funded by the Australian Government's Cooperative Research Centre Program (Soil CRC Scoping Study 3.3.01). REFERENCES HEPA (2019). PFAS National Environmental Management Plan Version 2. Heads of EPAs
Australia and New Zealand (HEPA), April 2019, p. 102. Hopewell, K., Darvodelsky, P. (2017). Assessment of Emergent Contaminants in Biosolids.
Australia and New Zealand Biosolids Partnership, p. 47. EPA Victoria (2004). Biosolids Land Application. Publication 943, EPA Victoria p. 88.
186
Table of Contentsfor this manuscript

WHAT IS REALLY IN AQUEOUS FILM FORMING FOAM AND DOES IT MATTER?
Mike Nicklesen1, Steve Woodard2
1ECT2, 200 Town Centre Drive #2, Rochester, 14623, USA
2 ECT2, 75 Washington Avenue, Portland, 04101-2617, USA [email protected]
INTRODUCTION Per- and polyfluoroalkyl substances (PFAS) contamination as a result of historical uses of aqueous film forming foam (AFFF) is a significant concern for military, aviation, fire authorities, bulk fuel storage owners and other similar entities. The primary triggers to manage PFAS contamination in water are perfluorooctane sulfonate (PFOS), perfluorooctanoic acid (PFOA) and perfluorohexane sulfonic acid (PFHxS) as these are the PFAS compounds most commonly found in legacy AFFFs that were used prior to the change in training, storage and use practices in the early to mid-2000s. These historical PFAS compounds have been replaced with shorter or longer chain compounds, or with modified structures, including ether linkages. These new compounds may result in unanticipated PFAS contamination, especially given that their toxicological impacts are not yet well understood. This is a concern particularly when managing waste water from current fire training activities, hangar foam tests or unintended releases and other similar activities. APPROACH As a result of requests to manage waste water from activities using a variety of foam products, ECT2 has undertaken laboratory research into the makeup of these foams to determine the PFAS compounds that can be identified, and the precursors which may degrade into PFAS of concern. The foam products were procured from manufacturers and mixed in accordance with their instructions for use; generally, 1%, 3% or 6%. The mix was then analysed using LC-MS-MS, with further dilution occurring to enable accurate analysis where necessary. The foam/water mix was also trialled in a variety of column tests using ion exchange (IX) resins to determine whether the same treatment process used when targeting only the 3 primary PFAS of concern was appropriate to meet required guidelines and criteria. The column test also focused on determining the most effective empty bed contact times (EBCT) to treat this highly concentrated water to meet necessary guidelines and criteria. RESULTS AND DISCUSSION Initial analysis of foam concentrates identified a range of precursors which degrade to PFAS compounds of primary concern, as well as a number of long and short chain compounds which were not able to be identified. The columns tests demonstrated that the IX resin systems required for management of waste water from fire training activities, hangar foam tests and the like require EBCTs far in excess of those needed to manage the relatively dilute concentrations normally found in surface and ground water. These extended EBCTs point to the need for high-capacity absorbent media to reduce the need for treatment plants requiring large footprints and the associated high capital and O&M costs. CONCLUSIONS Caution is required when making assumptions about the content of the “newer” foams currently in use. It is not always accurate to assume that these foams do not include PFOS, PFHxS and PFOA, as active ingredients include compounds which may degrade into these compounds if not managed appropriately. Sustainable onsite treatment processes are available, and if appropriate research is conducted, will manage waste water from foam training activities is a manner which is effective, efficient and economical.
M41d
Copyright © CRC CARE Pty. Ltd., 2019
CleanUp Conference 2019Adelaide, Australia
8 –12 September 2019187
Table of Contentsfor this manuscript

PFAS COMPOSITION IN SURFACE WATER ECOLOGIES ARISING FROM LEGACY USE OF AFFF FIREFIGHTING FOAMS
Andrew S. Mitchell, Karl C. Bowles
RPS AAP Consulting Pty Ltd, 255 Pitt St, Sydney, NSW, AUSTRALIA
INTRODUCTION Environmental contamination with per- and polyfluorinated alkyl substances (PFAS) has received increasing interest in the early 21st century, since identification of PFAS in human blood and animal tissues globally. The use of PFAS in aqueous film forming foams (AFFF) for training and fighting hydrocarbon fires has received particular attention, as this has proved an important route to environment in Australia and abroad. Many studies have focussed on PFAS concentrations in aquatic biota, but these have generally involved a relatedly small number of samples. The Australian Department of Defence has conducted environmental investigations following identification of PFAS contamination from legacy AFFF use at more than twenty sites across Australia. For some of these investigations, perfluoroalkyl acid (PFAA) concentrations were measured in surface water, sediments and a range of aquatic invertebrate and vertebrate species. While the studies were not specifically designed for developing understanding of PFAA fate and transport or trophic transfer, the resulting data set is nevertheless a unique and highly valuable source of information. This presentation investigates the change in composition of PFAS contamination in surface water ecologies with increasing distance from source areas and considers the relevance and connection between different media associated with surface water networks. METHODS Samples were collected opportunistically from at or near 19 Defence bases in 2017 and 2018 by environmental consultants with experience in collecting samples for investigations under Australian Guidance for contaminated sites. Biota, such as riparian or aquatic vegetation, fish or crustaceans, were sampled and analysed for both ecological and human health risk assessment at sites where a likely exposure pathway was identified. Concentrations of key PFAS compounds and relative composition of total PFAS was considered. Handling procedures were designed to avoid contamination consistent with guidance in the PFAS National Environmental Management Plan. PFAS were analysed by liquid chromatography tandem mass spectrometry (LC-MSMS) by commercial laboratories with NATA accreditation for relevant samples matrices, where available, with quantitation of 28 compounds including n:2 fluorotelomer sulfonic acids, perfluoroalkyl carboxylic acids, perfluoroalkyl sulfonic acids and perfluoroalkyl sulfonamido substances. One-dimensional geospatial models were constructed for six surface water systems at four bases and each sample was referenced to the relevant model through calculation of the distance along the river or creek. The data were aggregated through calculation of summed short and long chain perfluorosulfonic acids and perfluorocarboxylic acids, and PFAA precursors. These PFAS fractions were then averaged over 1000 m lengths in wet and dry weather and for different species of biota in order to create charts of how PFAS compositions changed with distance through each surface water system. Data from Defence investigations are publicly available in reports published on the Defence website.
M41e
Copyright © CRC CARE Pty. Ltd., 2019
CleanUp Conference 2019Adelaide, Australia8 –12 September 2019 188
Table of Contentsfor this manuscript

RESULTS AND DISCUSSION The models showed that PFOS and PFHxS were the two PFAS detected most consistently and at the greatest distance from source areas. A marked difference between wet and dry weather results was observed, arising from combined factors of flushing, dilution and groundwater-surface water interactions. This highlighted the need for well-developed conceptual site models to aid in meaningful interpretation of sampling data. Over lengths of river up to 40 km, comparisons were made between PFAS fractions in water, sediments and biota. This showed how some media can yield highly variable results and need to be considered in the context of other media and the conceptual site model. Certain PFAS fractions reduced significantly at a short distance from source areas while other fractions (dominated by PFOS and PFHxS) showed significant persistence. Different patterns of PFAS accumulation were observed in fish compared with shellfish, promoting questions for future consideration on how differences in the physiology, diet and behaviour of aquatic biota influence bioaccumulation. CONCLUSIONS The following observations were made:
• PFOS is highly persistent and travels long distances in surface water • Sediment sampling by itself is of limited value; or conversely, improvements are
required to sediment sampling methods to properly identify PFAS contamination • A good conceptual site model is critical for interpretation of monitoring data • PFAS levels in environmental media are highly variable over time and space • Wet and dry weather monitoring is necessary to understand contaminant flux • Biota monitoring is challenging and requires multiple samples per event, and
repeated events • The calculation of bioaccumulation factors from field data is fraught with issues
relating to sample variability and the management of non-detects
189
Table of Contentsfor this manuscript

TRANSPORT AND REMEDIATION OF PER- AND POLYFLUOROALKYL SUBSTANCES (PFAS) IN THE SUBSURFACE
Kurt Pennell1, Jed Costanza1, Chen Lui1, Masoud Arshadi2, Changwoo Kim3, Jason Hnatko2,
Natalie Capiro3, John Fortner4, Linda Abriola2
1School of Engineering, Brown University, USA 2Department of Civil and Environmental Engineering, Tufts University, USA
Department of Civil Engineering, Auburn University, USA 4Department of Chemical and Environmental Engineering, Yale University, USA
INTRODUCTION Per- and polyfluoroalkyl substances (PFAS) represent a broad class of compounds consisting of a partially or fully fluorinated carbon chain and a hydrophilic head group, including sulfanate, carboxylate, sulfonamide, or alcohol. This unique chemical structure imparts amphiphilic molecular properties, which led to the use of PFAS as surface coating agents in numerous commercial products and as components of aqueous film forming fluids (AFFF). Due to their widespread use and persistence in the environment, monitoring studies have reported the ubiquitous detection of PFAS in drinking water supplies, soil, wildlife and humans (e.g., Boone et al., 2019; Buck et al., 2011; Giesy and Kannan, 2001). Despite their prevalence, only limited data are available regarding processes influencing PFAS transport and fate in the environment, and very few options are available for in situ remediation of PFAS-impacted groundwater. The research presented here addresses: (a) the accumulation of PFAS at air-water and organic-water interfaces, (b) impacts of PFAS on microbial reductive dechlorination, and (c) development and testing of highly sorptive materials for in situ sequestration of PFAS from groundwater. Support for this work was provided by the Strategic Environmental Research and Development Program (SERDP), Project ER18-1149 “Development and Laboratory Validation of Mathematical Modeling Tools for Prediction of PFAS Transformation, Transport, and Retention in AFFF Source Areas” and Project ER-2714 “Development of Coupled Physicochemical and Biological Systems for In Situ Remediation of Perfluorinated Chemical and Chlorinated Solvent Groundwater Plumes”. METHODS Materials Perfluorooctanoic acid (PFOA), perfluorooctanesulfonic acid (PFOS), perfluoro-n-[1,2,3,4-13C4]-octanoic acid, and sodium perfluoro-1-[1,2,3,4-13C4]-octanesulfonate were purchased from Wellington Laboratories as calibration and internal standards. PFOA (96% purity) and PFOS potassium salt (98% purity) were purchased from Sigma-Aldrich for use in stock and working solutions. For sorption studies, polydiallyldimethylammonium chloride (polyDADMAC, 40% active ingredient, molecular weight ~240,000 Da) was purchased from Accepta (Manchester, United Kingdom), while powdered activated carbon (PAC) (DARCO® 100 mesh) was purchased from Sigma-Aldrich. Experimental Procedures The surface tension of the aqueous PFAS solutions (0 to 1,000 mg/L) were determined using a Sigma 700 precision force tensiometer (Biolin Scientific) equipped with a micro roughened surface platinum Wilhelmy plate. For the biological studies, five sets of batch reactors were prepared in 160 mL glass serum bottles, where the aqueous phase consisted of a low-salts anaerobic growth medium with 5mM lactate, 6.3 mg/L tetrachloroethene (PCE), and 23.6 mg/L trichloroethene (TCE). Reactors were spiked with total PFAS concentrations ranging from 1 to 145 mg/L. For the in situ sequestration studies, stable aqueous suspensions were prepared by combining 1,000 mg/L of PAC with 5,000 mg/L of polyDADMAC, followed by sonication for 24 h. Borosilicate glass columns (2.5 cm i.d. × 10 cm length were packed with air-dry Ottawa sand (40-50 mesh), flushed with CO2 gas, and then completely saturated with
M42a
Copyright © CRC CARE Pty. Ltd., 2019
CleanUp Conference 2019Adelaide, Australia8 –12 September 2019 190
Table of Contentsfor this manuscript

water by flushing with 10 pore volumes (PV) of de-aired background electrolyte (10 mM NaCl). Approximately 3.5 PV of a PAC suspension was injected and then the column was flushed with background solution (10 mM NaCl) to remove unretained PAC and polyDADMAC. A pulse of aqueous solution containing either PFOS (50 ug/L), PFOA (50 ug/L), or a mixture of 6 PFAS (50 μg/L each) in 10 mM NaCl was injected into separate columns, followed by flushing with 10 mM NaCl and effluent samples were collected continuously. Analytical Methods Concentrations of PFAS in aqueous solutions were determined using a Waters Acquity H-Class ultra-performance liquid chromatograph (UPLC) equipped with a Waters BEH C-18 column with an eluent gradient of ammonium acetate in water or methanol connected to a Waters Xevo TQ-S micro mass spectrometer (MS/MS). The Waters Xevo TQ-S micro was operated in negative electrospray ionization using multiple reaction monitoring mode tuned to unit mass resolution to isolate precursor and product ions for quantitation. RESULTS AND DISCUSSION Accumulation of PFAS at Interfaces
• The surface tensions of solutions containing dissolved solids were lower than those for ultrapure water, indicating an increase in the surface excess of PFOA and PFOS in the presence of dissolved solids.
• An equation for the variation of surface excess of PFOA and PFOS with total dissolved solids (TDS) was developed by fitting the measured surface tension values, which ranged from 72.0 to 16.7 mN/m, to the Szyszkowski equation.
• Based on mass distribution calculations for a representative unsaturated, fine-grained soil, up to 78% of the PFOA and PFOS mass will accumulate at the air-water interface, with the remaining mass associated with water and solid phases.
Impact of PFAS on Microbial Reductive Dechlorination • All concentrations of PFAS studied exhibited negative impacts on microbial reductive
dechlorination by delaying the complete transformation of PCE and TCE to cis-1,2-dichloroethene (cis-DCE).
• At the lowest total PFAS concentration tested (22 mg/L), Dhc growth was not impeded in comparison to the control reactor; however, the composition of the population was altered, with bvcA-harboring Dhc strains superseding vcrA-harboring strains as the key contributors to ethene production.
• These findings indicate the concentration of individual PFAS compounds may inhibit reductive dechlorination even if the total PFAS concentration is less than the total concentration shown to cause inhibition.
In-Situ Sequestration of PFAS • PolyDADMAC-stabilized powdered activated carbon (S-PAC) suspensions can be
directly injected into porous media to create an in situ treatment zone. • Columns pre-treated with S-PAC exhibited sorption capacities of 6,370 ug PFOA and
9,430 ug PFOS, compared to 3.58 ug PFOA and 4.65 ug PFOS in control columns with no S-PAC, respectively.
• For a continuous injection of 100 µg/L PFOA or PFOS into S-PAC treated columns, capacity would be reached after ca. 3,600 and 5,000 PVs, respectively.
REFERENCES Boone, J.S., Vigo, C., Boone, T., Byrne, C., Ferrario, J., Benson, R., Donohue, J., Simmons,
J.E., Kolpine, D.W., Furlong, E.T., Glassmeyer, S.T. (2019) Per- and polyfluoroalkyl substances in source and treated drinking waters of the United States, Sci. Total Env., 653: 359-369.
Buck, R.C., Franklin, J., Berger, U., Conder, J.M., Cousins, I.T., de Voogt, P., Jensen, A.A., Kannan, K., Mabury, S.A. and van Leeuwen, S.P. (2011) Perfluoroalkyl and polyfluoroalkyl substances in the environment: terminology, classification, and origins. Integr. Environ. Assess. Manag., 7:513-541.
Giesy, J.P. and Kannan, K. (2001) Global distribution of perfluorooctane sulfonate in wildlife. Environ. Sci. Technol., 35:1339-1342.
191
Table of Contentsfor this manuscript

ASSESSING A NOVEL MEDIA FOR REDUCING PFAS MIGRATION VIA STORMWATER SYSTEMS
Nick Marquez, Rebecca Valkan
Beca, Level 11, 44 Market Street, Sydney, NSW 2000, AUSTRALIA
[email protected] INTRODUCTION Airservices Australia is pursuing a research and development program to identify methods for treating surface water from sites impacted with legacy contamination of per- and poly-fluorinated alkyl substances (PFAS). Beca Consultants Pty Ltd (Beca) was engaged to independently assess the feasibility of a novel adsorption technology to mitigate the migration of PFAS via typical stormwater drainage systems at an airport. The product is composed of 4-7mm diameter local aggregate coated with a mixed powdered adsorbent that has been previously shown to adsorb PFAS in powder form. In this format, the media may suitable to feasibly deploy in existing stormwater systems with some modification. The first stage of this investigation aimed to assess the physical and sorptive properties of the product at a lab scale, providing a preliminary proof of concept and inform the design of subsequent scaled-up stages of the trial. This paper present data from the first two stages of the lab-scale trials consisting of tests for permeability, adsorption capacity and adsorption kinetics. The trials then intend to proceed to column tests and, if successful, field trials. METHODS The bench-scale trials consisted of two main components:
• Permeability test to determine the hydraulic conductivity of the media • Jar tests to understand the sorption characteristics of the media
The permeability test was conducted using a constant head method in line with Australian standard AS1289.6.7.1. For the jar tests, three stock waters were prepared: reagent water spiked with Perfluorooctane sulfonate (PFOS), another spiked with perfluorooctanoic acid (PFOA) and a third collected from a live airport stormwater swale known to be contaminated with PFAS. Testing for sorption capacity was performed by dosing varying quantities of the product constituents to stock water aliquots and stirred for 24hrs to reach equilibrium. The sorption kinetics was tested by dosing stock water aliquots with fixed quantities of the product constituents, which were removed by filtration in several time intervals. RESULTS AND DISCUSSION The hydraulic conductivity of the media was determined to be 3.8 x 10⁻⁴m/sec. This is consistent with typical media used in flow-through filter systems such as granular activated carbon or compacted zeolite. The treatment capabilities determined for the product showed promise. The product was able to reduce PFAS contaminants in the raw stormwater sample to levels below drinking water and 95% species protection guidelines (HEPA, 2018), as shown in Table 1. Sorption isotherms (Figure 1) were fitted with a Langmuir curve and comparisons between spiked recovery water and actual stormwater suggested that PFAS sorption capacities were affected by co-contaminants and/or competing PFASs. The kinetic tests results showed that 99.6% of sum of PFAS was adsorbed during the first 5min of contact time, rising to 99.9% after 10min.
M42b
Copyright © CRC CARE Pty. Ltd., 2019
CleanUp Conference 2019Adelaide, Australia8 –12 September 2019 192
Table of Contentsfor this manuscript

Table 1. Residual concentration of select and total PFASs in stormwater after a dose of 1g active ingredient per L, measured after 24hrs contact time.
Sample/Reference PFOS
(µg/L) PFOS/PFHxS
(µg/L) PFOA (µg/L)
Sum of PFAS(µg/L)
Raw Stormwater 23.2 29.3 0.574 34.8 Treated Stormwater 0.013 0.021 <0.002 0.862
Drinking water1 0.07 0.56 99% Species
Protection, Freshwater1 0.13 220
Note 1: Source - NEMP 2018
Fig. 1. Sorption isotherms for Sum of PFAS, PFOS, and PFOA generated using raw stormwater stock.
CONCLUSIONS Based on initial bench-scale tests, the sorption media in this format appears to be feasible for use as a static in-situ barrier or filter. It was recommended that the trials progress to test other aspects in a column format to obtain data for bed depth and longevity. REFERENCES The Heads of EPAs Australia and New Zealand (HEPA). (2018) PFAS National
Environmental Management Plan. pp.13-16. Oren, A.H and Ozdamar, T. (2013) Hydraulic conductivity of compacted zeolites. Waste
Management and Research. 31(6):634-40
193
Table of Contentsfor this manuscript

FIREFIGHTING FOAM TRANSITION TO FLUORINE FREE — IS IT PLUG AND PLAY?
Peter Storch1, Ian Ross2, Justin Morris3, Tom Statham1
1Arcadis Australia Pacific, 140 William St, Melbourne, VIC 3000, AUSTRALIA
2Arcadis UK, 3 Piccadilly Place Manchester M1 3BN, UK 3Wormald Australia, 350 Parramatta Road, Homebush West, NSW 2140, AUSTRALIA
[email protected] INTRODUCTION Fluorosurfactants have been used effectively in firefighting foams since the 1960’s. However, the increased concern by regulators and the public over the impact of the per- & polyfluoroalkyl substances (PFASs), to human health and the environment is changing the way firefighting foams are managed and regulated. Queensland environmental authority have restricted fluorosurfactant content of foams, and a ban has been imposed on the use of all PFAS-containing firefighting foams in South Australia and Washington State in the USA. Newly developed foams known as C6 foams, are proposed as ‘environmentally improved’ replacements, yet these replacements still contain significant amounts of short-chain PFASs, six perfluorinated carbons and less, chemicals that are currently regulated in eight countries including Sweden, Denmark, Germany, Italy, Belgium, Switzerland, Canada, and at least 12 U.S. states. FLUORINE-FREE ALTERNATIVES Protecting human health and safety through effective fire suppression is the foremost priority of every fire fighting foam system. However, a balance between minimising the environmental impact, liabilities and the long-term harm caused by use of PFASs in firefighting foams should be considered to manage the overall risk of fire protection. Over the last few years, foam users have been turning to fluorine free foams (F3) to maintain effective fire protection while better managing environmental liabilities, reputational risk, and possible 3rd party litigation. The increased extinguishment performance of the new generation F3 have made them viable alternatives to fluorosurfactants for many applications and are currently in use as training foams, aviation applications in hangars and helipads, and chemical and bulk fuel storage systems. Recent independent tests evaluating the performance of F3 foams by LASTFIRE to extinguish increasingly larger diameter fires have been very successful Europe in 2017 and more recently at the Dallas Fort Worth Airport in the US in 2018. FOAM TRANSITION Foam transition however is not always easy, and rarely a remove-plug-and-play scenario. Successful foam transition takes a well-developed, site-specific strategy prepared by a qualified team of fire engineers, environmental engineers/ scientists, technology providers, equipment specialists and operations contractors. Some of the considerations associated with foam transition include:
• Maintaining compliance with fire protection regulations and insurance accreditation; • Competent foam selection based on independent certifications, performance testing,
and analytical testing for composition; • Maintaining a functional fire suppression system to protect human health and assets; • Understanding of the design basis and operational knowledge of existing equipment; • Compatibility assessment of system components with new foam; • Eective decontamination of existing equipment to remove residual PFAS in contact
and prevent cross-contamination of new foam; • Proper planning for containment and disposal of waste generated during transition;
M42c
Copyright © CRC CARE Pty. Ltd., 2019
CleanUp Conference 2019Adelaide, Australia8 –12 September 2019 194
Table of Contentsfor this manuscript

• Eective secondary containment, and inspection and maintenance procedures are required;
• Proportioning testing to establish performance of new foam. CASE STUDIES FOR FOAM TRANSITION Observations, results, data, and lessons learned from foam transition projects will be presented for various fire protection applications ranging from aviation hangars, to bulk fuel storage, and chemical manufacturing. From an environmental perspective, effective cleanout of residual PFAS from previous AFFF usage is critical for a successful transition. Contamination of new foam from residual can render it no longer PFAS-free, creating future liabilities. While every system is different and requires assessment, water rinses alone have often been found to be ineffective. Biodegradable, nontoxic solvents have been developed and applied to piping and tank systems to achieve greater PFAS removal. As shown in the figure below, the use of solvent greatly improved the mass removal of PFAS from a stainless-steel tank over that of water alone. Total Oxidisable Precursors (TOP) Assay was used to test flush water for PFAS content which highlights the limitations of using only the standard PFAS analysis on foam-impacted fluids.
195
Table of Contentsfor this manuscript
PFAS REMOVAL FROM A DRINKING WATER SUPPLY
Dale Wynkoop1, Skefos Tsoukalis2
1ECT2, 655 Metro Place South, Dublin, 43017, USA 2Northern Territory Power and Water Corporation, Winnellie, 0821, AUSTRALIA
INTRODUCTION Per- and polyfluoroalkyl substances (PFAS) have historically been used in a broad range of consumer and commercial products and in the manufacturing of aqueous film-forming foams (AFFF). Due to their water solubility PFAS, unlike many other persistent organic chemicals, end up in ground and surface waters and can require treatment. The historical use of AFFF at RAAF Base Tindal has resulted in groundwater contamination of the Tindall aquifer, which is used to supply the Northern Territory Power and Water Corporation’s (PWC) Katherine Water Treatment Plant. Groundwater is used to supplement the total water supply of which up to 90% is drawn from the Katherine River. Although limited groundwater is used in the water supply to the Katherine community, contamination of the groundwater potentially impacts the safety of the drinking water supply, which services a population of approximately 11,000 people. Following identification of PFAS contamination in the groundwater source, it was determined that a treatment solution was required for both the immediate and the long term. APPROACH The Australian Department of Defence (Defence) had previously contracted Emerging Compounds Treatment Technologies (ECT2) to provide its proven ion exchange (IX) resin technology at two of its properties on the East Coast of Australia. Following the identification of PFAS contamination in the Tindall aquifer, Defence revised its treatment objectives for one of the treatment systems and requested that ECT2 complete any necessary modifications and accelerate fabrication to deploy the treatment system to Katherine as a priority. A 12.5 litre per second (Lps) turnkey, modular system was provided that treats groundwater prior to it going to the PWC water treatment plant for blending with water drawn from the river system. The PFAS treatment system includes pre-treatment filtration and IX resin to remove solids and other fouling agents, and proprietary IX resins for PFAS removal. The treatment system produces treated water with PFAS concentrations below the limit of reporting (LOR), exceeding the Food and Safety Australia and New Zealand (FSANZ) Health Based Guidance Values of 0.07ug/L for the sum of PFHxS and PFOS, and 0.56ug/l for PFOA. As part of its precautionary approach to ensuring the protection of human health for its consumers, PWC monitors approximately 34 PFAS compounds using ultra trace laboratory analysis. To ensure the long-term water supply to the Katherine community, PWC has requested that ECT2 design a treatment system with the capacity to process 10 megalitres of water per day and have capacity to increase that volume if necessary. PWC and ECT2 continue to work together to ensure the PFAS treatment system design provides capacity to manage variable flow rates and to address other PFAS compounds, in the event the evolving scientific research findings results in additional compounds being regulated in the future. RESULTS AND DISCUSSION The current PFAS treatment system went online in late October 2017, with influent total PFAS concentrations averaging 310 ng/l. It has consistently met all treatment criteria, including LOR at ultra trace laboratory analysis. Close communication has been maintained between ECT2 and the PWC team that manages its water treatment system for the supply of water to the community. This communication has been conducted seamlessly, with PFAS treatment system operators adjusting flows to meet PWC demand, especially during the changing seasons and variable capacity to draw from the River.
M42d
Copyright © CRC CARE Pty. Ltd., 2019
CleanUp Conference 2019Adelaide, Australia8 –12 September 2019 196
Table of Contentsfor this manuscript

The primary lesson learned has been the requirement to manage the potential precipitation of calcium carbonate and associated resin fouling, as the groundwater is pumped from a karst formation, containing elevated levels of calcium and bicarbonate alkalinity. This challenge has been successfully controlled through the addition of 1 to 2 ppm of sequestering agent at the head of the treatment system. CONCLUSIONS The IX resin-based treatment system has consistently met the project goals, including achieving treated PFAS concentrations less than the limit of reporting (LOR), even for the short chains. The system has proven its ability to be agile, enabling it to effectively respond to changing water demand requirements and changes in untreated background water chemistry. Communication and collaboration between ECT2 and PWC has played an important role in this success. The results of more than 18 months of treatment, coupled with lessons learned, are now being incorporated into the design and construction of a full-scale IX resin system to treat approximately ten times the capacity of the existing system.
197
Table of Contentsfor this manuscript

DEVELOPMENT OF ADVANCED CHEMICAL TREATMENT FOR PFAS IN CO-CONTAMINATED GROUNDWATER
Scott A. Grieco1, Jessica H. Person2, Laura Cook3, Doug Gustafson4
1Jacobs, 430 East Genesee Street, Syracuse, New York, 13166, USA
2Jacobs, Whitefish, Montana, USA 3Jacobs, Virginal Beach, Virginia, USA
4APTWater, Sacramento, California, USA [email protected]
INTRODUCTION Per and polyfluoroalkyl substances (PFAS) are increasingly being identified in groundwater and potable water supplies at concentrations exceeding guidance values and standards. Currently, only transfer technologies such as adsorption or fractionation are being utilized for pump and treat applications. Similarly, stabilization techniques, such as sequestering or binding which do not provide degradation of PFAS, are being promoted for in situ remediation. Destructive PFAS remediation technologies need to be advanced to scale for both pump-and-treat and in-situ destructive applications. Previous work has shown significant rates of degradation of PFOA and PFOS (>85%) via hydrogen peroxide catalysed ozonation under alkaline conditions (Lin, et. al, 2012). For this work, methods similar to those employed in the Lin study were employed using a commercially available system. METHODS Groundwater samples were collected from the most impacted portion of the PFAS groundwater plume at the subject sites. A screening matrix was developed to evaluate performance variables. Based on this screening matrix, bench-scale testing was conducted to assess application methodology, pH, and oxidant dosage on the destruction efficiency of PFAS using site groundwater impacted by a co-mingled plume containing concentrations of both PFAS and other organics (chlorinated volatile organic compounds [VOCs]). RESULTS AND DISCUSSION The results of the screening matrix were used to select optimum conditions to establish destruction dose-response curves for targeted contaminants and identify the optimal conditions needed to translate the bench-scale results into a field-scale pilot study. The testing considered 14 PFAS constituents included in USEPA Method 537 Revision 1.1, chlorinated VOCs, and petroleum-related constituents. This study is the first of its kind to translate previous academic testing into a potentially field-worthy application using commercially available advanced oxidation equipment. Impacts of process variables will be analysed and discussed. The field pilot implementation plan will also be presented. CONCLUSIONS This study is the first of its kind to translate previous academic testing into a potentially field-worthy application using commercially available advanced oxidation equipment. Impacts of process variables will be analysed and discussed. The field pilot implementation plan will also be presented. REFERENCES Lin, A.Y.C., Panchangam, S.C., Chang, C.Y., Hong, P.A. and Hsueh, H.F., 2012. Removal of
perfluorooctanoic acid and perfluorooctane sulfonate via ozonation under alkaline condition. Journal of hazardous materials, 243, pp.272-277.
M42e
Copyright © CRC CARE Pty. Ltd., 2019
CleanUp Conference 2019Adelaide, Australia8 –12 September 2019 198
Table of Contentsfor this manuscript

SOURCE REMOVAL COMBINED WITH DRINKING WATER TREATMENT ON A PFAS-CONTAMINATED GROUNDWATER
Steve Woodard, Marilyn Sinnett
ECT2, 75 Washington Avenue, Portland, 04101-2617, USA
INTRODUCTION The United States Air Force Civil Engineering Center (AFCEC) has conducted response activities to remove and remediate groundwater impacted by poly- and perfluoroalkyl substances (PFAS) at the former Pease Air Force Base in New Hampshire. The two primary PFAS compounds found at the source area, a former fire training area (FTA), were perfluorooctanoic acid (PFOA) and perfluorooctane sulfonate (PFOS) at combined concentrations (PFOA+PFOS) above the United States Environmental Protection Agency’s (USEPA) Health Advisory Level (HAL) of 0.07 micrograms per liter (µg/l). AFCEC responded by contracting with Wood Group PLC to conduct a side-by-side pilot test in 2016, comparing the performance of Emerging Compound Treatment Technology’s (ECT2) regenerable ion exchange (IX) resin and bituminous granular activated carbon (GAC). The regenerable resin system was selected for full-scale application, based on system performance and a lower overall lifecycle cost than GAC. Similar work was conducted in parallel on drinking water supply wells for the City of Portsmouth, New Hampshire which are also affected by contamination from the Pease Air Force Base. The City wanted to run long-term PFAS treatability testing on the heavily contaminated Haven Well but were not able to run the tests at full scale. A side-by-side pilot test was conducted to compare the effectiveness of ECT2’s single-use SORBIX LC1 IX resin versus Calgon’s F400 GAC. The objectives of the test were to: (1) compare the ability of ECT’s Sorbix LC1 IX resin and Calgon’s F400 GAC to remove PFAS from the Haven well; (2) compare system sizing and design parameters to be used in the preparation of the full-scale treatment system technology evaluation; and select the best PFAS-removal technology for full-scale implementation, based on lifecycle cost comparison and risk considerations. APPROACH A 12.5-litres per second (Lps) system was provided at the FTA source area to meet the primary project objective of producing treated water to below the 70 ng/l HAL. The full-scale IX resin system was installed from fall 2017 through spring 2018. The PFAS removal system includes bag filters to remove suspended solids, back-washable GAC pretreatment filtration to remove iron, two parallel trains of lead-lag regenerable IX resin vessels for PFAS removal, an in-vessel regeneration system to strip PFAS from the IX resin, a distillation system to recover and reuse the regenerant solution, a PFAS super-loading system to further reduce PFAS waste volume, and two parallel, single-use IX resin vessels for PFAS polishing. The polish vessels contain a blend of IX resins, tailored to the general water chemistry and PFAS species and their relative concentrations. For the drinking water system, the pilot system was designed and fabricated to pump directly from the Haven Well using a peristaltic pump. The skid was double sided, supporting resin columns on one side and GAC columns on the other. Each of the two sides had four columns in series, each with a 2.5-minute empty bed contact time (EBCT). This setup facilitated the comparison of four different EBCTs; 2.5, 5, 7.5 and 10 minutes. Samples were routinely taken from the raw influent and from each column effluent, and analyses were performed for 23 PFAS compounds. Breakthrough curves were then plotted to compare the effectiveness of GAC versus IX resin for PFAS removal. RESULTS AND DISCUSSION The full-scale FTA source area remediation system began operation in April 2018. The effluent quality from the IX resin system has been consistently non-detect for all 13
M42f
Copyright © CRC CARE Pty. Ltd., 2019
CleanUp Conference 2019Adelaide, Australia
8 –12 September 2019199
Table of Contentsfor this manuscript

monitored PFAS compounds, including the short-chain species, readily achieving compliance with the 70 ng/l HAL target. Five successful resin regenerations had been performed by late April 2019. Operational modifications have been made to address and correct minor challenges with the distillation system, and regenerant recovery and super-loading processes have proven successful. The original super-loading media is still operational, having removed and concentrated greater than 99.99 percent of the recovered PFAS mass, and therefore no PFAS waste has needed to be hauled off site. For the drinking water system, the influent total PFAS concentration averaged 3.5 ug/l over the course of the year-long pilot test. The IX resin substantially out-performed the GAC on all 12 PFAS that were present at detectable levels. The GAC column was operated until PFOA + PFOS breakthrough reached 0.07 ug/l at the 10-minute EBCT. This occurred at approximately 13,000 bed volumes (BVs). By contrast, the IX resin effluent from the shortest (2.5-minute) EBCT column remained well below the 0.07 ug/l HAL, even after treating more than 171,000 BVs. These results clearly demonstrated the appreciably higher treatment capacity and faster kinetics associated with the LC1 IX resin, compared to F400 GAC. Based on the results of the comparative pilot test and the associated lifecycle cost comparison, the City selected LC1 IX resin for full-scale implementation to remove PFAS from the Haven water supply. CONCLUSIONS Both the full-scale FTA source area remediation system and the drinking water pilot treatment system have effectively used IX resin to remove PFAS from groundwater. The source area system has utilised a regenerable IX resin system to maintain consistent compliance with the 0.07 ug/l HAL, while minimising waste generation. The drinking water pilot system demonstrated the superior PFAS-removal performance of single-use IX resin compared to GAC.
200
Table of Contentsfor this manuscript

A BIO-PHYTOREMEDIATION TRIAL OF SURGE BASIN SLUDGE FROM A VICTORIAN PAPER MILL
Philip Mulvey1, Candan Desem1, Tien Ngo2, Esmaeil Shahsavari2, Andrew S Ball2
1Environmental Earth Sciences, 98 Maribyrnong Street, Footscray, VIC 3011, AUSTRALIA
2RMIT University, School of Biosciences and Food Technology, GPO Box 2476, Melbourne, VIC 3001, AUSTRALIA
INTRODUCTION The effective management of waste in the form of sludge, at facilities such as paper mills and sewage works, is an ongoing challenge in the waste handling industry. This paper presents the innovative research into joint bio-phytoremediation as a long-term and sustainable strategy for the management of sludge at Australian Paper’s (AP) Maryvale Paper Mill in Victoria by Environmental Earth Sciences in collaboration with RMIT University. BACKGROUND The Surge Basin at the Maryvale Paper Mill was established in 1974 from former lagoons of the LaTrobe River. Seven cells make up the Surge basin which are connected via pipes or channels, amounting to a total volume of 65,000 m3. During construction, befitting the time, these cells had a compacted clay base and there is a concern about seepage. Making the waste difficult to desludge by traditional means is the fact that the waste is alkaline, with a high TDS and being organic waste produces a large amount of hydrogen sulfide (H2S). H2S released during disturbance exceeded WorkSafe Australia Guidelines. Thus, the objective of this research is to assess the feasibility of the bio-phytoremediation of sludge within the Surge Basin as a method for full scale management. METHODS Laboratory based bio-phytoremediation trials at Environmental Earth Science’s warehouse began following a review of previous sludge characteristics and chemistry assessments done by others. Sludge from AP’s Surge Basin was collected and used for the trials. Initial testing did not measure pH or salinity but concentrated on presence of contaminants. Based on the initial testing an initial pot trial (Trial 1) was conducted in which the pots were set up in a horticultural tent with a growth lamp (to mimic daylight hours) and an extractor fan. Seeds from vetiver (Chrysopogon zizanioides), Phragmites australis and three types of summer grasses were planted to the surface of tubes. In Trial 2, urea, surface mulch (hay) and different seeds were added with fresh water every day to promote germination. In Trial 3, six juvenile mangrove plants were planted with hay into existing pots. Both fresh and salt water were added. Measurements of soil temperature, plant height (cm), H2S and VOC (ppm) were documented. To monitor the H2S of the sludge, 3 smaller pots were prepared, filled with sludge, hay and calix. These pots were covered in plastic and measured for their Lower Explosive Limit (LEL) for H2S and VOC (ppm) levels. In addition, microbial trials were undertaken using soil with bio-char added compared with a control in dewatered sludge. Willow grass was used for rhizosphere development. Willow grass is tolerant to salinity and high alkalinity. RESULTS AND DISCUSSION Hothouse Trial 1 In Trial 1, all seeds failed to germinate. Sludge temperature during the monitoring time increased, soil became increasingly dry around the plant shoots and salt growth was observed. A H2S measurement of 0.9 ppm was recorded at sample T12 during the first week
M43a
Copyright © CRC CARE Pty. Ltd., 2019
CleanUp Conference 2019Adelaide, Australia
8 –12 September 2019201
Table of Contentsfor this manuscript

and was the only positive result from all samples throughout the trial. Plants died at three weeks into the trial. Hothouse Trial 2 In Trial 2, all seeds also failed to germinate. Odour decreased, and minor insect presence was noted around the tubes. Hothouse Trial 3 Juvenile mangroves lasted two months before dying. No mangrove plant sample was measured with any H2S. Plant death may have been associated with poor climate control. H2S measurements H2S readings of 1.5 ppm were recorded when containers of sludge were opened for preparation of the trials. Subsequently, H2S was not detected for 9 weeks and the trial was discontinued. Readings of VOCs increased to 9.1 ppm, major spikes were observed in the last two weeks of this trial. This was not associated with disturbance of the column prior to taking the reading. Lab Trials Recent trials by RMIT have provided promising results with regard to treatment of sludge with biochar prior to planting. The addition of biochar after removal of free water proved successful in the germination and growth of willow grass. Though willow grass grew poorly in the control, vigour and root length was much greater in the trial with biochar. Microbial community was greater and different with biochar compared to the controls (No plants, No biochar, and willow grass without biochar). CONCLUSIONS The unexpected high salinity in the trials promote further investigations using salt tolerant plant species as a bio-phytoremediation tool. While the mangroves were ultimately unsuccessful, their tolerance over the other seeds planted suggest that further work involving mangroves may be worthwhile. The Lab Trials involving the dewatering of sludge prior to planting, in conjunction with the addition of biochar provide promising management strategies for the Surge Basin. This work encourages further research into finding optimal conditions in which bio-phytoremediation can be used as a natural and sustainable remediation strategy for facilities of this type. Though whether bio-phytoremediation management strategy may provide a long-term passive and sustainable approach to remediation over other engineered remediation solutions is still being investigated, it is currently apparent that bio-phytoremediation can prevent the release of H2S. REFERENCES Abrol, I.P., Yadav, J.S.P. and Massoud, F.I., 1988. Salt-affected soils and their management
(No. 39). Food & Agricultural Org. Appelo, C.A.J., and Postma, D (2005). Geochemistry, groundwater and pollution. 2nd Edition.
CRC Press. Kanjanarong, J., Giri, B.S., Jaisi, D.P., Oliveira, F.R., Boonsawang, P., Chaiprapat, S., Singh,
R.S., Balakrishna, A. and Khanal, S.K. (2016). Removal of hydrogen sulfide generated during anaerobic treatment of sulfate-laden wastewater using biochar: Evaluation of efficiency and mechanisms. Bioresource Technology, 234:115-121.
Shashavari, E., Adetutu, E.M., and Ball, A.S. (2015). Phytoremediation and Necrophytoremediation of Petrogenic Hydrocarbon- Contaminated Soils. Phytoremediation: Management of Environmental Contaminants, 2:321-333.
202
Table of Contentsfor this manuscript

REUSE OF SOIL CONTAMINATED FROM A TYRE FIRE
Lyn Denison1, Keisuke Nakayama2, Eugenia Balanova1, Lisa Thomson1
1ERM Australia, Level 6, 99 King St, Melbourne, VIC 3000; AUSTRALIA 2Austral Bricks, 1 Brick Makers Dr, Wollert, VIC 3750, AUSTRALIA
INTRODUCTION A tyre fire at an industrial site in Melbourne resulted in the contamination of stockpiles of clay used in the manufacture of bricks. A 130A approval was obtained from EPA Victoria to undertake a trial to assess the viability of the use of the contaminated soil in the brick making process and to evaluate the potential impacts on the quality of the final product. The contaminants in the contaminated soil included metals and PAHs. The trial included testing of air emissions arising from the firing of the bricks and subsequent air dispersion modelling, and leaching of key contaminants from the final product including PFAS. The trial blended contaminated soil with raw clay material on the site for use within the brick making process. METHODS The aim of the trial was to assess the impact of incorporating the contaminated soil into the clay mix on the quality of the final product and any potential impacts on the environment. The trial was undertaken in two parts:
• Part A involved a small batch test of 2% contaminated soil mixed with the clay and shale to produce 30,000 bricks. The quality of the bricks was then assessed against Australian Standards and other industry standards;
• Part B assessed potential environmental impacts from the brick making process using a trial of 270,000 bricks. Stack testing of contaminants of concern was undertaken to assess the release of pollutants against the current EPA licence for the site and the requirements of the State Environment Protection Policy (Air Quality Management) [SEPP(AQM)].
The trial blend was tested to assess the level of contaminants prior to the trial being undertaken. The blend was also tested for leaching of contaminants including PAHs, metals, TRH and PFAS. During the trial, bricks made with clean clay and those made with 2% contaminated soil were fired. Materials both pre- and post-firing were analysed for a range of contaminants to assess whether the addition of the contaminated soil altered the composition of the final brick product. Air dispersion modelling was undertaken to determine compliance with the design criteria in the SEPP (AQM) and whether there was any risk posed to human health or the environment through the use of the contaminated soil in the bricks. RESULTS AND DISCUSSION The analysis indicated that the concentrations of contaminants analysed were of the same order of magnitude for the bricks made with the clean clay and those made from the trial mix and were below the relevant screening criteria. The pre-fired mix and fired bricks made from the composite trial mix were also tested for a range of polyfluorinated compounds including fluorotelomer sulfonic acids (FTSAs), poly- and perfluoroalkyl substances (PFAS) and perfluoroalkyl carboxylic acids (PFCAs) which were allbelow the levels of reporting. The test bricks made with the trial composite were tested for potential leaching. The analytes, including PFAS and PAHs, within the leached material were reported at concentrations below the limits of reporting, with the exception of copper and zinc which
1 A 30A approval may be granted by EPA Victoria for a discharge of waste to the environment or management of waste to meet a temporary emergency, which would otherwise result in a breach of the Environment Protection Act or non-compliance with an EPA licence
M43b
Copyright © CRC CARE Pty. Ltd., 2019
CleanUp Conference 2019Adelaide, Australia
8 –12 September 2019203
Table of Contentsfor this manuscript

were below the Leachate Guidelines in EPA Publication 621 - Soil Hazard Categorisation and Management Upper limits for ASLP Category C. Testing of emissions to air during the firing of the bricks showed that the resulting ground level concentrations complied with the design criteria in SEPP (AQM) at all sensitive receptors. A screening health risk assessment against relevant OHS standards showed that the predicted ground level concentrations were well below the relevant standard and would not pose a risk to the health of workers. For pollutants covered by the EPA Licence for the site, emissions measured were well below the licence limits. Testing of the fired bricks made with the trial composite mix was undertaken to test whether the quality of the bricks was affected by the addition of soil from the contaminated stockpiles and to ensure that they met the requirements and specifications required. The test methods used were the Australian Standard AS/NZ 4456 methods. The results of the testing showed that the bricks made with the composite mix containing 2% contaminated soil met all specifications and the addition of the contaminated soil did not affect the quality of the final product. A screening human health risk assessment was conducted on the final brick product. To conduct the risk assessment, the pathways for exposure considered:
• Direct exposure, through dermal and ingestion pathways, to leached material from the bricks during rain events;
• Direct exposure, through dermal and ingestion pathways, to surface of the bricks; • Direct exposure, through inhalation pathways, to brick dust during cutting. • The potential receptors for the bricks are: • Children and adults as residents with the contaminated bricks within the structure; • Construction and maintenance workers working with the contaminated bricks during
construction. The levels of copper and zinc in the leachate from the fired product containing the contaminated soil were 3 – 4 orders of magnitude below the Leachate Guidelines in EPA Publication 621 - Soil Hazard Categorisation and Management Upper limits for ASLP Category C. For the other contaminants analysed the concentrations were below the limits of reporting. Given the very low concentrations of copper and zinc in the leachate and the absence of other contaminants including PFAS, the risk to human health from contact with leached material from the bricks would be negligible for both residents as well as construction workers that may come into contact with the leachate. For the other compounds analysed the concentrations within the final brick product were well below the LOR or National Environment Protection Measure (Assessment Site Contamination) Health Investigation Level (HIL A) for residential use and would not pose a risk to human health through contact with the brick. CONCLUSIONS The trial conducted has shown that the stockpiles of contaminated soils can be blended with clean clay in the brick making process without adverse impact on human health and the environment. This case study has shown that reuse of the contaminated soil provides a positive benefit to the environment by reducing the amount of waste going to landfill. The blending of the soil with the clay and shale also results in a reduction in the use of natural resources.
204
Table of Contentsfor this manuscript

RISK-BASED DECISION MAKING TO AVOID WASTE, SAVE PUBLIC MONEY AND
ALLOW BENEFICIAL USE OF WATER TREATMENT RESIDUALS
Graeme Miller1, Dainis Skabe2
1Senversa Pty Ltd, 190 Flinders Street, Adelaide, 5000, AUSTRALIA 2SA Water Corporation, 250 Victoria Square/Tarntanyangga, Adelaide, 5000, AUSTRALIA
INTRODUCTION Water treatment residuals (WTRs) comprise fine-grained organic and inorganic matter that is removed from suspension during drinking water treatment operations. SA Water Corporation (SA Water), like many other water authorities and corporations in Australia, has traditionally managed WTRs as a waste – disposing of the material to landfill at significant cost to the corporation and water users (annually in the order of $ 2 million dollars). Disposal of WTRs to landfill has been prompted by the impact of treatment chemicals, including copper sulphate, aluminium-based coagulants and nutrient-based flocculants, as well as prescribed impurities in these chemicals, on WTR chemical composition. This paper describes the scope and outcomes of a detailed risk-based investigation and site contamination audit (audit) commissioned by SA Water Corporation (SA Water), which is now allowing some of the WTR to be diverted from landfill to beneficial reuse in the rehabilitation of corporation-owned land. METHODS In South Australia, the Standard for the production and use of Waste Derived Fill (SA EPA, updated October 2013) (the WDF Standard) provides a mechanism for waste soil, industrial residues and construction and demolition waste containing relatively low concentrations of chemical contaminants to be diverted from landfill for beneficial reuse. Approximately seven years ago, SA Water commissioned an investigation to determine whether WTRs (representing industrial residues) could be beneficially reused under the provisions of the WDF Standard. As required by the WDF Standard, an audit was also commissioned to
• Assess the potential risks associated with WTR reuse and identify suitable end uses and environmental controls (during and following placement).
• Form the basis for the development of a Code of Practice and/or Product Specification for wider application across the Corporation.
The investigations and audit assessed WTRs produced at the Happy Valley, Mt. Pleasant and Myponga water treatment plants, and the environmental setting and condition of a former quartzite quarry located in the Adelaide Hills. The former quarry is owned by SA Water and requires rehabilitation (filling and landscaping). The assessments included the following:
• Detailed chemical and geotechnical characterisation of the WTRs, including: o Total chemical concentrations and leachability using pH neutral reagents (to
simulate rainfall infiltration). o Determining the effects of aging or weathering on WTR geotechnical
characteristics and chemical leaching potential. • Soil and groundwater condition and quality assessments at the former quarry. • Geological and geotechnical investigations at the former quarry, including a detailed
assessment of vadose zone and aquifer geological conditions to support subsequent seepage and solute transport modelling.
• Hydraulic and solute transport modelling, which consisted of HELP and solute transport modelling modelling software. An infinite source with dilution as the only
M43c
Copyright © CRC CARE Pty. Ltd., 2019
CleanUp Conference 2019Adelaide, Australia
8 –12 September 2019205
Table of Contentsfor this manuscript
attenuation mechanism used to conservatively assess (under the site-specific conditions): o The potential infiltration rates for surface water passing through WTRs placed at
the quarry. o The potential flux of water and dissolved contaminants from the placed WTR to
groundwater. o Possible impacts on groundwater quality under and surrounding the site.
• Geotechnical (slope stability) modelling and testing for placing the WTR and capping material at the site.
RESULTS AND DISCUSSION The key results of the investigations are summarised as follows:
• The WTRs are impacted to varying degrees by aluminium, copper, manganese and nitrogen species. The variation in material quality appears to be related to treatment requirements – with higher copper concentrations associated with periodic dosing of reservoirs to address algal issues and higher aluminium and nitrogen species associated with treatment (coagulation, flocculation, pH correction, disinfection and filtration) for removal of suspended matter and dissolved iron and manganese from surface waters.
• Infiltration modelling (the outcomes of which were supported by literature) and solute transport modelling indicated that some of the WTRs - if capped to limit infiltration – can be placed at the quarry and will not adversely impact on quality and environmental values of groundwater under and surrounding the site.
• Geotechnical modelling and testing determined that the WTRs and capping materials can be compacted and safely placed at the quarry.
• The results of the assessments and modelling have been used to: o Specify chemical (total and leachable concentrations) and geotechnical
acceptance criteria for the WTR and capping material, and o Design an evapotranspiration capping system to mitigate surface water infiltration
- which if applied and constructed appropriately will allow WTRs to be placed at the quarry without adversely impacting on land use and groundwater quality.
The first stage of WTR placement and capping has commenced, with a post-construction management plan and validation process (including a lysimeter to monitor infiltration rates and settlement monitoring) to be implemented on completion. The outcomes of the first stage will be used to support continued rehabilitation of the quarry with WTRs, and the possible development of a code of practice that may enable broader beneficial reuse across SA Water’s operations. CONCLUSIONS Water authorities and corporations across Australia dispose of WTRs to landfill, an expensive waste management option that is not deemed sustainable in the long term and contributes to increased costs of water supply service provision to their customers. The detailed risk-based investigation and audit commissioned by SA Water Corporation (SA Water) is now allowing some of this waste to be diverted from landfill and beneficially reused, enhancing environmental performance (waste and land management) and reducing the financial impact of water treatment operations on SA Water;s customers and the community.
206
Table of Contentsfor this manuscript

MICROALGAE-BACTERIA CONSORTIA FOR NUTRIENTS REMOVAL IN WASTEWATER
Isiri A. Perera1, Suresh R. Subashchandrabose1,2, Ravi Naidu1,2, Megharaj Mallavarapu1,2
1Global Centre for Environmental Remediation (GCER), Faculty of Science, ATC Building,
The University of Newcastle, Callaghan, NSW 2308, AUSTRALIA 2Cooperative Research Centre for Contamination Assessment and Remediation of Environment (CRC CARE), The University of Newcastle, ATC Building, Callaghan,
NSW 2308, AUSTRALIA [email protected]
INTRODUCTION The generation of wastewater has immensely increased in the past few decades due to many anthropogenic activities. Consequently, there is an urgent need to treat the wastewater to its highest purity before discharging into the environment or for recycling. However, due to the drawbacks such as high cost, high energy and excessive sludge generation associated with conventional wastewater treatment methods, current research studies are focused on using microalgae and bacteria consortia for wastewater treatment (Wang et al., 2015).). Photosynthetic microalgae and bacteria are generally present together as consortia in the real environmental conditions. Recently, these consortia are gaining considerable attention towards their application for wastewater treatment due to higher oxygenation, environmentally friendly and increased nutrient recovery compared to other treatment processes (Perera et al., 2019, Subashchandrabose et al., 2011). Further, this interaction aids in higher microalgae growth, which directly impacts several biotechnological applications like lipid, pigments and other valuables production (de-Bashan et al., 2002). Consortia also plays a key ecological role in the survival of desert vegetation (Perera et al., 2018). This study evaluates the efficiency of nutrient removal by microalgae-bacteria consortia compared to their counterparts and how these wastewaters-consortia interaction aids in the increased microalgal biomass production. METHODS Artificial wastewater with following composition was prepared (gL-1): Glucose, 0.4125; NaNO3, 0.25; KH2PO4, 0.0175; MgSO4.7H2O, 0.015; CaCl2.2H2O, 0.025; ZnSO4.7H2O, 0.00882; MnCl2.4H2O, 0.00144; MoO3, 0.00071; CuSO4.5H2O, 0.00157; Co(NO3)2.6H2O, 0.00049; H3BO3, 0.01142; Na2EDTA, 0.05; KOH, 0.031; FeSO4.7H2O, 0.00498, pH,6.8. Aliquots (100mL) of artificial wastewater, contained in 250mL flasks were inoculated with log-phase Chlorella sorokiniana with initial cell density of 8x10⁵ cells ml-1, Variovorax paradoxus with initial cell density of 8x10⁶ CFU ml-1 and the mixture of both microalgae and bacteria with the same concentrations. All the flasks (5 replicates) were incubated on an orbital shaker (100 rpm) with continuous illumination (60μmol m−2 s−1) at 23 ± 1 °C for 4 days. Samples were withdrawn from each replicate at 24 hr intervals up to 4 days. Microalgae growth was measured in terms of chlorophyll content via measuring autofluorescence; excitation (440nm) and emission (683nm) by the use of microplate reader. Nitrate nitrogen (NO3-N), Phosphate phosphorus (PO4-P) and chemical oxygen demand (COD) in each flask were measured throughout the incubation at 24 hr intervals. RESULTS AND DISCUSSION A higher specific growth rate of microalgae (1.6d-1) was achieved via microalgae bacteria consortia compared to their individual organism (1.1d-1). Lower doubling time (5.0hr) was observed when C. sorokiniana forming consortia with V. paradoxus, than that of individual microalgae (14.7hr).
M43d
Copyright © CRC CARE Pty. Ltd., 2019
CleanUp Conference 2019Adelaide, Australia
8 –12 September 2019207
Table of Contentsfor this manuscript

A consortium of C. sorokiniana with V. paradoxus removed higher percentages of PO4-P (85.0%), NO3-N (90.0%) and COD (83.7%) compared to their individual microalgae (Fig. 1).
Fig. 1. Removal of nitrogen, phosphorus and carbon from the wastewater by microalgae, microalgae-bacteria consortia and bacteria CONCLUSIONS Consortia of microalgae-bacteria achieve higher efficiency of nitrogen, phosphorus and carbon removal from wastewater when compared to their individual organisms. This interaction provides a cost-effective, efficient method not only for bioremediation of wastewater but also for algae biomass production resulting in lower doubling time. REFERENCES De-Bashan, L. E., Bashan, Y., Moreno, M., Lebsky, V. K. & Bustillos, J. J. (2002) Increased
pigment and lipid content, lipid variety, and cell and population size of the microalgae Chlorella spp. when co-immobilized in alginate beads with the microalgae-growth-promoting bacterium Azospirillum brasilense. Can. J. Microbiol. 48, 514-521.
Perera, I., Subashchandrabose, S. R., Venkateswarlu, K., Naidu, R. & Megharaj, M. (2018) Consortia of cyanobacteria/microalgae and bacteria in desert soils: an underexplored microbiota. Appl. Microbiol. and Biotechnol.102,7351-7363.
Perera, I. A., Abinandan, S., Subashchandrabose, S. R., Venkateswarlu, K., Naidu, R. & Megharaj, M. (2019) Advances in the technologies for studying consortia of bacteria and cyanobacteria/microalgae in wastewaters. Crit. Rev. Biotechnol. 1-23.
Subashchandrabose, S. R., Ramakrishnan, B., Megharaj, M. & Naidu, R. (2011) Consortia of cyanobacteria/microalgae and bacteria: Biotechnological potential. Biotechnol. Adv. 29, 896-907.
Wang, M., Yang, H., Ergas, S. J. & Van Der Steen, P. (2015) A novel shortcut nitrogen removal process using an algal-bacterial consortium in a photo-sequencing batch reactor (PSBR). Water Res. 87, 38-48.
208
Table of Contentsfor this manuscript

EFFECT OF LIQUID INJECTION OF BIOSOLIDS ON GROUNDWATER AND SOIL PROPERTIES
Balaji Seshadri1,2, Aravind Surapaneni2,3, James Hampton2,3, Graeme Short2,3, Peter Uren3,
Chris Hetherington4, Matthew Currell5
1Global Centre for Environmental Remediation, University of Newcastle, AUSTRALIA 2Cooperative Research Centre for High Performance Soils, Callaghan, AUSTRALIA
3South East Water, Frankston, 3199, AUSTRALIA 4Cleanaway Organics, South Nowra, 2541, AUSTRALIA
5School of Engineering, RMIT University, Melbourne, 3000, AUSTRALIA [email protected]
INTRODUCTION Biosolids produced in Australia at wastewater treatment plants are managed in accordance with the pertinent state and territory guidelines. In the Victorian context (EPA Victoria, 2004), biosolids are classified by treatment (pathogen reduction/stabilisation) grades (T1, T2 and T3) and contaminant grades (C1 and C2). The treatment grades are based on the process used to stabilise, dry the sludge, and seek to protect human health and the environment from a microbiological contamination perspective. In Victoria, T1C2 grade is commonly used in agriculture. Current regulation is to surface broadcast biosolids (solids) followed by shallow incorporation. Finding innovative use of biosolids in agriculture is always challenging. South East Water recently obtained an approval from Victorian EPA via their Research, Development and Demonstration (RD&D) pathway to trial soil injection of liquid biosolids (T3C2 grade) for improving soil structure, fertility and function at the Longwarry Water Recycling Plant in Victoria. The research objective was to inject a T3C2 grade liquid biosolid into the subsoil and assess the impacts on and the environment. METHODS Site location The trial site was at South East Water’s Longwarry Water Recycling Plant (WRP) located 83 km southeast of Melbourne (Fig. 1). Longwarry WRP is a facultative lagoon system that treats a median flow of 500 kL/day and a maximum flow of 900 kL/day of raw sewage. Around 20 ha at the site are under dry land farming and there is no history of biosolids application at this trial site.
Fig. 1. Trial site map showing facultative lagoons, sludge storages, liquid injected paddocks (T1—T5), control (C1) and buffer (NT1-NT5) areas, and Piezo locations (PZ1-PZ5).
M43f
Copyright © CRC CARE Pty. Ltd., 2019
CleanUp Conference 2019Adelaide, Australia
8 –12 September 2019209
Table of Contentsfor this manuscript

Soil injection and crop establishment Prior to injection, the EPA-approved T3C2 grade liquid biosolids was mixed using a silenced canopy pump to ensure homogeneity and analysed for physico-chemical and biological properties. The biosolids were then pumped directly from sludge storages into a Soil Injection Vehicle (SIV), “Terragator“. The SIV transported the homogenous biosolids to the trial paddocks and injected the product directly into the subsoil (20-30 cm depth at 734 wet tonnes/ha). A total of 13.80 ha of area was divided into five treatment paddocks (T1-T5), and 3.53 ha served as a control paddock (C1) and no-treatment buffer areas (NT1-NT5) (Fig.1), which were not injected with liquid biosolids, while C1 paddock received fertiliser treatment. A forage sorghum crop was established across the control, no-treatment and treatment paddocks, as a dryland crop, under standard agronomic management practices. Sampling and analysis Potential environmental impacts including changes in soil and groundwater quality were assessed and compared to control and no-treatment buffer areas. Groundwater (PZ1-PZ5 piezo bores in Fig. 1) and soil monitoring were carried out before and after biosolids injection, at monthly and quarterly frequencies, respectively. At the end of the summer cropping season, the sorghum was harvested (May 2019) for silage. Groundwater and soil samples were analysed for various physico-chemical properties. This paper presents only groundwater and soil data. RESULTS AND DISCUSSION The biosolids used in this research was analysed for nine heavy metals in accordance with EPA Victoria (2004) and was graded C2 due to levels of Cd, Cu and Zn only. According to EPA Victoria, (2004) C2 products are suitable for a range of beneficial uses, including agricultural use. After the soil injection of T3C2 grade biosolids, groundwater showed minimal change except for some local effect on standing water level (SWL) and nitrate N concentrations (Fig. 2). This is attributed to a heavy rainfall event (23.5 mm on 16 December 2018) immediately after the soil injection of biosolids. The groundwater data is presented based on pre-injection and monthly post injection monitoring events. The total concentration of phosphorus and some heavy metals (Pb, Hg, Zn) marginally increased in post injection samples.
Standing water level (SWL) Nitrate-N
Fig. 2. Groundwater SWL (m below ground level) and nitrate N before and after injection of liquid biosolids
Soil properties before and after injection of liquid biosolids (Fig. 3) showed marginal decreases in some characteristics (e.g. pH, CEC, Olsen P, and total N) and marginal increases in other properties (e.g. EC, NOx, Cd, Cu and Zn).
210
Table of Contentsfor this manuscript

pH Cadmium Copper Zinc
Fig. 3. Selected properties of soil before and after the injection of liquid biosolids CONCLUSIONS The results from pre- and post-injection groundwater and soil monitoring indicate minimal accumulation of nutrients and other contaminants in the vicinity of the trial site. However, a localised area near the trial site and other treatment infrastructure exhibited increases in nutrient levels and other characteristics, which warrant further investigation. ACKNOWLEDGEMENTS The work has been supported by the Cooperative Research Centre for High Performance Soils whose activities are funded by the Australian Government's Cooperative Research Centre Program (Soil CRC Scoping Study 3.3.01). REFERENCE EPA Victoria (2004). Biosolids Land Application, Publication 943, EPA Victoria p. 88.
211
Table of Contentsfor this manuscript
BIOMASS HIGH TEMPERATURE AND HIGH EFFICIENCY COMBUSTION TECHNOLOGY
Bo Xiao, Jinbo Wang, Jiakuan Yang, Jianfen Li, Xun Wang, Dabin Guo
School of Environmental Science & Engineering,
Huazhong University of Science & Technology, Wuhan 430074, CHINA [email protected]
INTRODUCTION Fire is the origin of civilization. The high-temperature carbon energy source is the origin of industrial civilization. The lack of high-temperature fossil fuels and pollution constitute an irreconcilable contradiction between the world economy, energy and the environment. Fossil hydrocarbon energy provides three major industrial materials and three major power fuels for today's industrial society. Biomass is an annual renewable hydrocarbon resource. Biomass is the only energy source, which can be developed to replace the fossil fuels. However, biomass has a low calorific value. Technical barriers, which presence in the conversion process of biomass into high quality fuels with low-cost, are still remain. Thus, biomass is not be widely used as an industrial energy. Improving the combustion temperature and efficiency of biomass has become an important scientific mission for the sustainable development of world industry. Humans have been working hard on the conversion of biomass into industrial energy. Once long ago biomass was converted carbon by the pyrolysis method. And then the high combustion temperature of carbon (above 1400 °C,) was reached. The carbon derived from biomass pyrolysis become the first industrial fuel, which has made the ceramic and iron ages. Later, it was replaced by coal due to low yield and high cost. In 1880, the biomass briquette was invented in the United States. However, biomass briquette has a lower burning rate and temperature, around 700~950 °C, which does not meet the temperature required for large-scale industrial activities. Low-cost and high-temperature combustion technology of biomass is a bottleneck problem for thousands of years. The low calorific value is a natural characteristic of biomass. Based on combustion theory, the only way to reach the high combustion temperature is to enhance the burning rate biomass. The best way to increase burning rate of biomass is to prepare a biomass micron fuel (BMF), which has a low particle diameter (< 250 μm) and a high surface area. Thus, the heat and mass transfer process is enhanced during the biomass combustion process. It is worth noting that the efficient preparation of BMF from flexible biomass feedstock has become a new challenge. METHODS In this study, we have been investigated the microstructure of biomass. Based on the mechanical principle, we have successfully developed a biomass crusher and solved the problem of efficient preparation of BMF. We invented a biomass furnace and the BMF combustion in furnace is near-single-phase combustion. RESULTS AND DISCUSSION As shown in Fig.1, the BMF of wt.86% exhibited a particle size is less than 250 microns. When the biomass particle size is less than 250 microns, the air can freely fill the inside of the porous structure. The BMF becomes a physical oxygen-containing fuel. In our study, we obtain the preparation method of pre-mixed oxygenated biomass fuel. The solid BMF is converted into a gas fuel in furnace. The BMF combustion in furnace is near-single-phase combustion.
M43g
Copyright © CRC CARE Pty. Ltd., 2019
CleanUp Conference 2019Adelaide, Australia8 –12 September 2019 212
Table of Contentsfor this manuscript

0 200 400 600 800 1000
0
20
40
60
80
100
Cum
ulat
ive
mas
s fra
ctio
n(%)
Particle diameter(μm)
BMF
Fig. 1 The particle size distribution of BMF
200
250
300
350
400
450
500
550
600
0 20 40 60 80 100 120200
400
600
800
1000
1200
1400
1600
BMF
feed
ing
rate
(kg/
h)
BMF feeding rate
Temperature
Tem
pera
ture
(°C
)
Time(min) Fig. 2 The effect of BMF feeding rate on the combustion temperature.
Fig. 2 depicted the effect of BMF feeding rate on the combustion temperature in BMF furnace. The grate firing characteristics of typical biomass was changed to advanced suspension combustion in BMF furnace. The combustion temperature of BMF is remarkable increased with the increasing BMF feeding rate. When the temperature above 1200°C, the combustion temperature of BMF exhibited a slow growth trend with the increasing BMF feeding rate. The maximum combustion temperature of BMF reached 1450 °C in BMF furnace. The tar and carbon are burned out at this temperature. The inorganic constituents (namely ash) in biomass are instantly melted and aggregated into a glassy state at room temperature. Biomass can be used as the third kind of industrial energy source after carbon and coal. The industrial activities has gradually shed its dependence on fossil hydrocarbon energy in future. REFERENCES Demirbas A. (2004) Combustion characteristics of different biomass fuels. PROG ENERG
COMBUST.; 30:219-230.
213
Table of Contentsfor this manuscript

PFAS IMPACTS ON SOLIDS WASTE LANDFILLS
Scott A. Grieco
Jacobs, 430 East Genesee Street, Syracuse, New York, 13166, USA [email protected]
INTRODUCTION An increase of concern regarding PFAS introduction to the environment has expanded from drinking water as a primary media of concern and is including evaluation of landfill leachate contributions to public wastewater treatment plants and ground water near unlined landfills. Australia’s National PFAS management plan has identified landfills as a source of PFAS to be addressed. The US National PFAS management plan is anticipated to also address landfills. A considerable focus of PFAS transfer to the environment is through historical use of Aqueous Fire Fighting Foam (AFFF). However, prior to 2003 only 3% of annual PFAS production supported AFFF; approximately 86% was used for textile (carpet, fabrics) and paper/packaging coatings, most of which end up disposed of in municipal solid waste landfills (Schultz, 2003). Landfill leachate PFAS concentrations are in the ranges of several hundreds of ng/L, which are tens of times higher than those in wastewater treatment plant (WWTP) effluents (Lang et al., 2017; Sinclair and Kannan, 2006). As more inland landfill leachates are discharged to WWTPs, high levels of PFASs in landfill leachate may make WWTPs hesitant to accept landfill leachate for co-treatment, especially if increased regulations on PFAS become effective in the future. It is necessary to develop a treatment strategy to remove PFAS from landfill leachate. RESULTS AND DISCUSSION This presentation presents:
• Summary of PFAS concentrations measured in landfill leachate. • Results of study that quantified PFAS released from materials disposed in solid waste
landfills. • Discussion of oxidizable precursors and how they impact landfill leachate PFAS
concentrations. • Understanding fate of PFAS within biological leachate and municipal treatment
systems (both liquid and solid phases). • Potential treatment technologies for PFAS and impacts as applied to landfill leachate. • Data from recent technology evaluation for treatment of PFAS from within landfill
leachate. REFERENCES Lang, J.R., Allred, B.M., Field, J.A., Levis, J.W. and Barlaz, M.A., 2017. National estimate of
per-and polyfluoroalkyl substance (PFAS) release to US municipal landfill leachate. Environmental science & technology, 51(4), pp.2197-2205.
Schultz, M.M., Barofsky, D.F. and Field, J.A., 2003. Fluorinated alkyl surfactants. Environmental Engineering Science, 20(5), pp.487-501.
Sinclair, E. and Kannan, K., 2006. Mass loading and fate of perfluoroalkyl surfactants in wastewater treatment plants. Environmental science & technology, 40(5), pp.1408-1414.
M44a
Copyright © CRC CARE Pty. Ltd., 2019
CleanUp Conference 2019Adelaide, Australia8 –12 September 2019 214
Table of Contentsfor this manuscript

JOHN MATHWIN RESERVE, KAURI PARADE, SEACLIFF PARK, SA ― AUDITING TRANSFORMATION FROM LANDFILL TO COMMUNITY
AND SPORTING PRECINCT
Adrian Hall, Dilara Valiff
GHD, Level 4, 211 Victoria Square, Adelaide, SA 5000, AUSTRALIA [email protected]
INTRODUCTION Over the past 5 years, the City of Holdfast Bay has redeveloped the former Brighton Council municipal landfill into a $15M Community and Sporting Precinct. Adrian Hall’s involvement as Site Contamination Auditor for the project began in 2010, while he was undertaking an audit of an adjacent industrial site. Environmental investigations undertaken as part of that audit identified methane concentrations above the lower explosive limit in soil vapour wells on John Mathwin Reserve, which were considered to originate from putrescible wastes buried beneath the site. A significant hazardous circumstance notification was issued, and the EPA undertook monitoring for landfill gases in the surrounding residential areas. Further site assessments have included investigation of the lateral extent of gas migration. With recent redevelopment of the site as a major Community and Sporting Precinct, the audit has involved reviews of concept and detailed designs of the new tennis courts, club house building and hockey pitch, and regular site inspections, to ensure the adequacy of proposed landfill gas protective measures. DEVELOPMENT WORKS Development of the site has included the following works:
• Construction of southern tennis courts (on piled foundations) • Construction of the new three-storey Kauri Community and Sports Centre Building
(on piled foundations) • Upgrade of northern hockey pitch and associated infrastructure • Demolition of old club house building and construction of new car park • Upgrade of hockey warm-up area • Landscaping of areas surrounding these facilities.
The consultant, Tonkin has conducted soil, groundwater and landfill gas (LFG) assessments across the site. Based on the assessed site conditions and available development plans, the consultant provided guidance for the required earthworks and developed LFG protection measures for the above components of the development. Tonkin also acted as the Principal's Environmental Monitor (PEM) during the construction works to ensure the works were undertaken in accordance with environmental design and Auditor requirements. COMPONENTS OF AUDIT DOCUMENTATION Audit documentation is currently being prepared, and is anticipated to include the following documentation: Site Environmental Completion Report This report will include:
• Collation and review of design documentation, construction and environmental specifications and CEMPs (prepared for construction phase)
• Collation and review of soil management plans, soil classification reports and tracking records (for on-site won and imported soil materials)
• Review of contractor’s records, including available as-constructed documentation provided by the contractors such as plans and survey files.
M44b
Copyright © CRC CARE Pty. Ltd., 2019
CleanUp Conference 2019Adelaide, Australia
8 –12 September 2019215
Table of Contentsfor this manuscript

The report will provide assurance to the Auditor that earthworks were undertaken in accordance with the CEMPs, specifications and soil management plans, and that the installation of LFG control works was completed in accordance with the design intent. Landfill Gas (LFG) Control Measures and Monitoring LFG monitoring has been conducted at:
• All installed LFG monitoring wells across and around the site • Ground surfaces across the site (by surface emissions walkover) • Gas venting systems under tennis courts and club house building • Ground floor habitable spaces of club house building and other enclosed structures • Utility services enclosures and stormwater pits.
LFG data collated between 2014 and 2019 will be reviewed, to prepare concentration trend data for CH4 and CO2, to assess the impact of the development on sub-surface conditions and to assess the performance of implemented protection measures. A high level qualitative review of the key LFG risks will be undertaken. Groundwater Assessment Works to be undertaken include:
• Installation of three (3) additional groundwater monitoring wells • Collection of groundwater samples from the wells and two surface water samples
from specified locations for laboratory analysis for contaminants of concern • Preparation of a groundwater and surface water report outlining findings and
potential impacts to potential receptors. Community Engagement Council will undertake the required community engagement in accordance with Council procedures. It is envisaged that this task will be undertaken prior to or during the preparation of the Site Management and Monitoring Plan (SMMP); the outcomes of the community engagement process will be incorporated into the updated SMMP. SITE CONTAMINATION AUDIT PROCESS AND OUTCOMES A site contamination audit is a review by an Auditor to independently verify the consultant’s conclusions as to the contamination status of the site and suitability for its proposed use. A key component of the review is to ensure that the work undertaken is of appropriate standard to enable the Auditor to draw conclusions on the contamination status of the site. For this site, numerous reports have been prepared by various consultants over several years, including soil, groundwater and LFG investigations, together with targeted site investigations associated with the design of the Community and Sporting Precinct. Generally, a Site Contamination Audit Report (SCAR) and Statement (SCAS) can be prepared once the nature, extent and risks of contamination have been determined by the consultant, and after all necessary remediation works have been satisfactorily completed. In addition to these deliverables, the Auditor generally provides independent advice on key site contamination issues throughout the audit process. For this audit, the deliverables to date have included the provision of detailed Auditor comments on the various investigation reports and design documents (either in tabular form or by email), inputs to design meetings, and attendance at site inspections and meetings during the construction phase, with provision of review comments and advice on critical site contamination issues. The Auditor has taken a pragmatic and proactive approach to site remediation, with the majority of contaminated materials remaining on site, under protective capping layers.
216
Table of Contentsfor this manuscript

ASSESSMENT OF OPTIONS FOR REUSE OR DISPOSAL OF SOILS CONTAMINATED WITH PFAS — AN EVALUATION OF THE
AUSTRALIAN STANDARD LEACHING PROCEDURE (ASLP)
Andrew S. Mitchell, Karl C. Bowles
RPS AAP Consulting Pty Ltd, 255 Pitt St, Sydney, NSW, AUSTRALIA
INTRODUCTION Environmental contamination with per- and polyfluorinated alkyl substances (PFAS) has received increasing interest in the early 21st century, since identification of PFAS in human blood and animal tissues globally. The use of PFAS in aqueous film forming foams (AFFF) for training and fighting hydrocarbon fires has received particular attention, as this has proved an important route to environment in Australia and abroad. The redevelopment of industrial land typically generates excess soils. If these soils are contaminated beyond levels allowing re-use, they must be managed on-site or disposed to landfill. State regulators provide guidance for testing and classifying waste soils prior to disposal to landfill in order to mitigate long-term environmental risks at landfills. Soils with higher concentrations of contamination must be disposed at more secure landfills, such as those with leachate collection systems, or may require treatment prior to landfilling. Where soils are to be reused on-site this may be subject to the requirements of the regulator or an accredited Site Auditor. Several methods are used in Australia for assessing waste soils. These include laboratory methods such as measuring total concentration and measuring the leachable concentration by either the Toxicity Characteristics Leaching Procedure (TCLP) or the Australian Standard Leaching Procedure (ASLP). Statistical methods are also used to apply laboratory results to stockpiles, truckloads or in-situ soils. TCLP was designed to simulate mobility of metals in soils. Subsequently TCLP and ASLP have been applied to a range of inorganic and organic contaminants and the difference in physicochemical properties of these other contaminants compared to metals may have implications for interpreting the results. For example, it has been widely accepted in the contaminated land industry that low pH extractions designed to maximise metal mobility may under estimate mobility of anionic PFAS. The surfactant properties of PFAS may further complicate interpretation of results. This presentation assesses the results of more than 1900 ASLP tests for PFAS in soils on the Defence Estate and draws conclusions on the applicability of this method for making comparisons with criteria within the PFAS National Environmental Management Plan (NEMP) and waste guidance issued by state environmental regulators. METHODS Samples were collected at 23 Defence bases in 2016 to 2019 by environmental consultants with experience in collecting samples for investigations under the National Environment Protection (Assessment of Site Contamination) Measure. Samples were collected either for detailed site investigations or for development projects in order to determine soil reuse and disposal options. Handling procedures were designed to avoid contamination, consistent with guidance in the PFAS NEMP. Measurable PFAS in soil extracts (‘soil PFAS’) were determined by liquid chromatography tandem mass spectrometry (LC-MSMS), with quantitation of 28 compounds including n:2 fluorotelomer sulfonic acids, perfluoroalkyl carboxylic acids, perfluoroalkyl sulfonic acids and perfluoroalkyl sulfonamido substances. Each soil sample was also leached using ASLP and the leach water analysed for PFAS using LC-MSMS (‘ASLP PFAS’). All analyses were conducted by commercial laboratories with NATA accreditation.
M44c
Copyright © CRC CARE Pty. Ltd., 2019
CleanUp Conference 2019Adelaide, Australia
8 –12 September 2019217
Table of Contentsfor this manuscript

Data from Defence PFAS contamination investigations are publicly available in reports published on the Defence website. The mass of specific PFAS in the ASLP leachates were compared with the mass calculated from the soil PFAS results, to derive leachable fractions. Samples were categorised and grouped, and then linear regression and correlation models were run for key PFAS to identify relationships between soil concentration and the leachable fraction. The results were compared with state and national guidance on soils reuse and disposal. Results were further interpreted considering the degree of groundwater and surface water contamination in the source areas. RESULTS AND DISCUSSION The analysis shows that in most applications the ASLP PFAS does not provide additional information to differentiate soil samples beyond the soil PFAS. In these cases, ASLP PFAS can be estimated within a factor of 2 based on solely the soil concentration. Consideration of ASLP results in comparison with the long-term retention of PFAS in soils at contaminated sites, suggests that the ASLP is likely to be too aggressive a procedure for most situations. This is likely explained by emerging information suggesting factors such as air-liquid partitioning are relevant for surfactants and such properties are not well simulated during the ASLP leach. In the minority of situations, PFAS within the soil is significantly less leachable than would be predicted. In these cases, the ASLP test provides value. It is not clear from the current analysis what causes the difference in leachability, as data for key parameters such as soil pH, organic matter, clay content, etc, are not consistently available. The waste guidelines within the NEMP indicate that untreated soils can be disposed in a double composite lined landfill where the PFOS+ PFHxS concentration is less than 50 mg/kg. However, in practice, this analysis suggests a total soil concentration of PFOS + PFHxS of less than 0.3 mg/kg will be required to meet the ASLP leachable concentration requirement in the NEMP. Soils treated with a stabilising agent may have a total concentration of a multiple of this, depending on the efficacy of the stabilising agent. ASLP has been shown to be useful for determining the relative mobility of PFAS from soils before and after amendment with stabilising agents. CONCLUSIONS The following observations were made:
• The ASLP method may be too aggressive for providing additional meaningful data to assess disposal and reuse suitability assessments for untreated soils in most circumstances.
• In cases where soils are treated with a stabilisation agent to reduce leachability, the ASLP test is useful to validate the stabilisation.
• Another test that better accounts for the surfactant properties of PFAS would facilitate an improvement in risk-based soil management options analysis.
218
Table of Contentsfor this manuscript

RESIDENTIAL DEVELOPMENT ON A LANDFILL — A WESTERN AUSTRALIAN CASE STUDY
Stuart Thurlow, Charlie Barber
Australian Environmental Auditors, Suite 21/ 1 Ricketts Road, Mount Waverley, 3149,
AUSTRALIA [email protected]
INTRODUCTION Australian Environmental Auditors (AEA) was engaged in 2014 to undertake a contaminated site audit of the last remaining undeveloped section of a former Class I inert landfill, located in a suburb near Freemantle, WA. The site was the remaining strip of land of the filled portion of a former quarry and has a steep batter to the unfilled portion of the former quarry. The rest of the former landfill area had previously been extensively developed for residential use, none of which was subject to an audit. The site was part of a former limestone quarry c.1947-1980’s which had been backfilled with inert waste (C&D waste, crushed limestone, sand etc.) between ~1992 and 2001. It was reportedly capped with clean fill in 2004. Initially it was not developed as part of the rest of the development due to the steep batter to the west into the unfilled portion of the former quarry. The site was classified as ‘possibly contaminated – investigation required’ by Western Australian Department of Water and Environmental Regulation (WA DWER) and required for further soil and landfill gas investigations and assessments, including human health and environmental risk assessment, before the site could be reclassified with an end use classification. The site was purchased by AEA’s client in 2013 following the previous owner going bankrupt after completing the development of the remainder of the filled portion of the former quarry. The site was proposed to be subdivided into 33 low density residential lots. PREVIOUS INVESTIGATIONS The site was subject to soil and groundwater investigation between 1999 and 2003, with initial remediation and validation works completed in 2003, largely involving excavation and off-site disposal of impacted soils, after which the site was understood to be covered by 0.7m of clean imported sand. The site remained vacant while the balance of the estate (former landfill) was developed. No known landfill gas investigations or protection measures are in place or were completed on this part of the estate. The site was classified by WA DWER as ‘remediated for restricted use’ in November 2008. However, initial landfill gas assessment and further soil assessment at the site was undertaken in 2012. The results detected landfill gas and soil impacts which resulted in the site again being re-classified by WA DWER in 2013 ‘as possibly contaminated – investigation required’. SITE ASSESSMENT The audit site assessment required the investigation and remediation of soil and landfill gas. Soil impacts were restricted to capping soils and undertaken by test pitting across the site. Collected samples for analysis’s impacts were found to be restricted to asbestos and were managed by hand picking, clearance and the removal of some of the impacted capping soil from site. The entire site was then capped with imported clean sand. Landfill gas investigations comprised installation of bores across the site along with soil analysis for TOC to assess landfill gas generation potential. The bores were monitored over a six-month period and risk classified in accordance with CIRIA C665 methodologies to be CS3 - moderate risk. However, portable landfill gas analyser readings confirmed by lab
M44d
Copyright © CRC CARE Pty. Ltd., 2019
CleanUp Conference 2019Adelaide, Australia
8 –12 September 2019219
Table of Contentsfor this manuscript

analysis showed exceptionally high hydrogen sulphide concentrations in a small number of bores in a limited portion of the site. Hydrogen sulphide risk became the focus of the investigation. Multi-level cluster bores were installed in the area of concern and monitored in combination with surface flux monitoring to demonstrate that, while present, hydrogen sulphide generation was very low and restricted to at depth and the risk to end users was acceptable. SITE MANAGEMENT PLAN AND GAS PROTECTION MEASURES An overarching Environmental Management Plan (EMP) was developed by the consultant. The EMP called for restrictions on groundwater use, restriction to use of the top surface of the site only to prevent contact with asbestos, and gas protection measures comprising both a barrier and passive ventilation underneath the barrier, to be installed and maintained on each building across the entire site. REGULATOR AND ASSESSOR ISSUES Due to the emerging nature in Australia of ground/landfill gas affected sites at various key points, the lack of knowledge and understanding of this risk and mitigation within the industry, created confusion and difficulty in concluding the audit with an appropriate level of risk mitigation. This resulted in a slow laborious process, requiring extensive input from the auditor and his expert support, along with international expert support providing peer review of conclusions on residual risk from ground/landfill gas and the appropriate level of mitigation required. OUTCOMES The site was successfully reclassified as ‘remediated – restricted use’ and subdivided into 33 low density residential lots, each of which has sold and over 90% are now developed and occupied by individual residences. To date, the wider part of the former landfill previously developed has had no landfill gas assessment and the risks remain unknown. The presentation will detail the outline of the site and its history, the investigation and assessment works completed. The site management plan and the gas mitigation measures required for each of the properties. The presentation will provide key lessons learnt and recommendations for other working on similar projects. REFERENCES Department of Environment Regulation (2014) Assessment and Management of
Contaminated Sites, Contaminated Sites Guidelines, December 2014, Perth, Western Australia.
Department of Environment Regulation (2016) Requirements for Mandatory Auditor’s Reports, Contaminated Sites Guidelines, November 2016, Perth, Western Australia.
Government of Western Australia, Contaminated Sites Act 2003. National Environmental Protection Council (1999) National Environmental Protection
(Assessment of Site Contamination) Measure (ASC NEPM) (as amended 2013). Wilson S et al (2007) Assessing Risks Posed by Hazardous Ground Gases to Buildings,
CIRIA Report C665.
220
Table of Contentsfor this manuscript

LANDFILL MINING TO TRANSFORM A FORMER DUMP INTO USABLE LAND. GROUND-BREAKING GAS VAPOUR
INVESTIGATION, REMEDIATION & VALIDATION.
Martin Kelly1, Chris Sordy2, Nick Cowman1
1Enviropacific Services Pty Ltd, Level 5, 123 Epping Road, Macquarie Park, NSW 2113,
AUSTRALIA 2EI Australia, Suite 6.01, 55 Miller Street, Pyrmont, NSW 2009, AUSTRALIA [email protected], [email protected]
INTRODUCTION The Narellan community in Western Sydney is undergoing significant urban renewal and expansion. The Elyard Gardens site will one day be a new vibrant place in the local community. Yet before it can be revitalised, it’s less than vibrant history which included an extractive quarry, a brick pit and an uncontrolled landfill must first be managed. Following nearly 2 years of remediation a further year of landfill gas monitoring, the site is nearing a successful site audit statement. FOCUS OF PRESENTATION In favouring on-site remediation methods to best manage the legacy of the past, significant on-site treatment of the excavated, uncontrolled landfill material was undertaken. This included a multi-stage screening process. Focused on removing the deleterious material, which prohibited future use of the site. Yet the question remained, did the removal of uncontrolled materials, including methane generating organics subsequently remove the residual landfill vapour gas risk in the soils? Gas Vapour As it has been seen on numerous occurrences where landfill remediation projects have failed, a site’s suitability is is reliant on future gas future gas vapour generation mitigation. At the Elyard Gardens site the initial investigations reported that the site was classified as a CS6 (highest possible) ranked gas vapour risk. The site had hazardous levels of methane, as high as 88.1%. This pre-remediation risk rating was exacerbated by the high gas flow rates of 318L/hr-1 due to the high porosity of uncontrolled material. The remediation target was to re-classify the site as a maximum gas characteristic situation CS4, with a stretch target of CS2. Global Desktop Study A global desktop literature study revealed little information to support the argument that through the removal of organic, deleterious and other foreign material that the gas risk would also be removed. So, to provide environmental certainty, the project team was required to collaboratively embark on a ground-breaking challenge. The team designed a study that would prove right or wrong; that the through the removal of degradable materials, the gas risk would too be removed. This trial would prove to be one of the first; globally significant examples, proudly located in Western Sydney, Australia. Remediation Techniques As previously stated, the desired method was to retain as much suitable soil materials on-site for future re-instatement and use. The project achieved a 92% resource recovery rate for materials that were considered suitable. Hazardous materials including PCB and asbestos contaminated soils were not retained on-site and as such required disposal to licensed waste facilities. On-site the mechanical and manual screening process removed all degradable materials, down to even the smallest of fractions, requiring hand-removal. The treated soil
M44e
Copyright © CRC CARE Pty. Ltd., 2019
CleanUp Conference 2019Adelaide, Australia
8 –12 September 2019221
Table of Contentsfor this manuscript

was assessed for Ground Gas Generation Potential using TOC analysis (in line with methodology in CL:AIRE RB17) – with unsuitable materials removed. Yet with over 90,000m3 of treated soils to be re-instated and compacted (to 98% standard compaction) how could such future generation potential be determined? It was not considered appropriate to leave the potential for failure to chance. In response the team designed and built multiple ‘gas trial bays’. These bays were constructed on-site and were formed in concrete bays, on concrete hard stand. They included the moisture conditioning and compaction of approximately 50m3 of treated soils. The trial bays simulated the full-scale soil re-instatement in the now excavated quarry pit. At highly frequent intervals the trial bays were sampled for the presence and characteristics of gas. This provided a second line of evidence for prediction and modelling of the engineered fill performance in terms of ground gas generation. Results The results of the gas trial bays showed a substantial reduction in gas presence upon construction and subsequently 1,2,3,4 months into the trial. The evidence provided the team with the confidence to recommend full-scale re-instatement of the treated materials. The team were also confident in forming an evidence-based argument to present to the NSW EPA accredited auditor as demonstration. Following successful site remediation and complete materials reinstatement, a further 55 gas wells were installed, occupying over 75% of the site footprint. The post-works monitoring program commenced in May 2018 and is due to be completed in late May 2019. The results to date have shown the highest methane gas reading to be a mere 4.7%, compared with an initial maximum of 88%. This represents an impressive near 100% reduction in gas levels. The compaction process and engineered fill has also resulted in a negative air flow movement, no greater than -6l/hr-1. This enabled the reclassification of the of the maximum characteristic gas situation to be CS2. A great result by the team in achieving the stretch target. CONCLUSIONS This represents an astonishingly successful remediation and gas mitigation project, which managed to divert 92% of suitable soil material from otherwise wastefully being disposed to landfill. Importantly, in a ground-breaking field trial, coupled with post-remediation gas monitoring, it also proved that a CS2 gas characteristic could be achieved. The engineered fill profile proved that the modification of the soil characteristics, after the removal of degradable material will enable the Elyard Gardens site to be a central place of community in the future. The site audit statement is expected to be prepared and issued by September 2019. This is the final milestone to an already successful, ground-breaking landfill Australian remediation project.
222
Table of Contentsfor this manuscript

RELATIVE PERFORMANCE OF COMPOSITE LINERS (HDPE + GCL) IN CONTAINING LANDFILL LEACHATE
Patrick Ndere
GHD, Level 4, 211 Victoria Square, Adelaide, SA 5000, AUSTRALIA
INTRODUCTION Composite landfill liners which normally consist of a combination of a Geomembrane (GM) and a Geosythetic Clay Liner (GCL) are designed to contain leachate from migrating into the subsurface. Irrespective of good Construction Quality Assurance (CQA), some leakage will still occur due to diffusion and permeation of leachate through the liner system. Field studies indicate that composite liners involving a geomembrane over a geosynthetic clay liner have a substantially less leakage than those involving a compacted clay liner. According to Rowe (2005), the observed leakage through composite liners can be explained by the holes in, or adjacent to, wrinkles/waves in the geomembrane, and this leakage can be calculated using simple equations. POLLUTEv7 is a computer program that implements a solution to the one-dimensional dispersion-advection equation for a layered deposit of finite or infinite extent. Using this solution POLLUTEv7 calculates the concentrations of a contaminant at user specified times and depths. Detailed theory on the how the model works is provided in POLLUTEv7 Reference Guide (Rowe and Booker, 2004). METHODS POLLUTEv7 model was used to assess the leakage performance of a composite liner system by comparing transit times for nitrate, cadmium and benzene. Due to differences in the diffusion and partitioning of these chemicals through GM, GCLs and subgrade materials, their breakthrough times through the liner system are different. Understanding breakthrough times of chemicals in leachate is important in assessing fate and transport of hazardous pollutants from landfills. REFERENCES Rowe, R.K. (2005), “Long-term performance of contaminant barrier systems”, Geotechnique
55, No. 9, 631-678. Rowe, R.K. and J.R. Booker (2004), “POLLUTEv7 Version 7 Reference Guide”, GAEA
Technologies Ltd., Canada.
M44f
Copyright © CRC CARE Pty. Ltd., 2019
CleanUp Conference 2019Adelaide, Australia
8 –12 September 2019223
Table of Contentsfor this manuscript

ECOTOXICITY OF PARTICULATE PLASTICS IN TERRESTRIAL AND AQUATIC ECOSYSTEMS
Nanthi Bolan1, Lauren Bradney1, Hasintha Wijesekara1,2
1Global Centre for Environmental Remediation, The University of Newcastle,
Callaghan, 2308, NSW, AUSTRALIA 2Department of Natural Resources, Faculty of Applied Sciences,
Sabaragamuwa University of Sri Lanka, Belihuloya, 70140, SRI LANKA
INTRODUCTION Particulate plastics that are less than 5 mm (i.e., microplastics or microbeads; 0.05 – 5 mm) and less than 5 um (i.e., nanoplastics or nanobeads; 0.05 – 5 um) in size pose a potential threat to both terrestrial and aquatic ecosystems (Wijesekara et al., 2018). Particulate plastics may enter the environment through a variety of routes; however, this research focuses on two key pathways: wastewater treatment plants and direct routes. Renewed interest surrounding the application of biosolids for the improvement of soil health has inadvertently increased the risk of particulate plastics entering terrestrial environments. Once in the ecosystem, particulate plastics may have the potential to cause toxicity. MATERIALS AND METHODS This research firstly quantified the amount of microbeads in biosolids samples. The study also monitored the changes in particulate plastics (i.e., microbeads) surface characteristics when exposed to different media (biosolids, sediment, and soil) and chemicals (Polycyclic aromatic hydrocarbons (PAH) and copper). Biosolids, soil and sediment samples were spiked with ‘Pristine’ (Polyethylene) microbeads. Spiked microbeads were extracted after two weeks of incubation. It was hypothesised that the microbeads’ surface would change depending on their exposure to media. This hypothesis was tested through visual observation, elemental analysis, FTIR and SEM-EDX analysis. The ecotoxicity of microbeads in terrestrial and aquatic ecosystems was examined using soil respiration tests, earthworm toxicity test and Daphnia motility test. It was hypothesised that microbeads would have an adverse effect on these organisms through a decrease in microbial respiration (microorganisms), weight (earthworms), and motility (daphnids). RESULTS AND DISCUSSION The results indicated that a number of elements including copper (Cu), titanium (Ti), manganese (Mn), iron (Fe), aluminium (Al), and silicon (Si) were retained by microbeads when they were exposed to biosolids, sand and sediment samples. The elemental data suggest that surface characteristics can change depending on their pathways, and microbeads may therefore act as chemical vectors. Microbeads in soil resulted in indirect toxicity as measured by soil microbial respiration, especially when microbeads were exposed to Cu solution. Earthworms showed no observable effect when exposed to microbeads. Microbeads caused immobilisation of Daphnids, caused by both indirect toxicity when exposed to Cu solution and direct toxicity when exposed to pristine, soil and sediment conditions. CONCLUSIONS Overall, these results suggest that microbeads act as chemical vectors and may cause direct and indirect toxicity, but only within specific organisms, highlighting the need for further research. REFERENCES Wijesekara, H., Bolan, N.S., Bradney, L., Obadamudalige, N., Kunhikrishnan, A.,
Dharmarajan, R., Ok, Y.S., Rinklebe, J., Kirkham, M.B., Vithanage, M., (2018). Trace element dynamics of biosolids-derived microbeads. Chemosphere, 199, 331-339.
M45a
Copyright © CRC CARE Pty. Ltd., 2019
CleanUp Conference 2019Adelaide, Australia8 –12 September 2019 224
Table of Contentsfor this manuscript

POLYMER AND POLYMER WASTE MANAGEMENT
Kenneth S. Sajwan
Savannah State University, Savannah, GA 31404, USA [email protected]
INTRODUCTION The term “polymer” is commonly used today in the plastics and composites industry, and it is often used as a synonym for “plastic” or “resin.” In actuality, polymers include a range of materials with a variety of unique properties. Plastics found in common household goods, in clothing and toys, in construction materials and insulation, and in numerous other products. There is a serious problem of plastic waste production and its mismanagement worldwide. Top countries for mismanaged plastic waste include China, Bangladesh, Thailand Vietnam, Philippines, Malaysia, Indonesia, Sri Lanka, Egypt, and Nigeria. Most of the developed countries are managing plastic pollution by recycling. Oceans and rivers has become the sink of plastic and micro-plastic pollution. The Problem with Plastics, from the tiniest plankton to the largest whales, plastics impact nearly 700 species in our oceans. Plastics has been found in more than 60% of all seabirds and in 100% of sea turtles species that mistake plastic for food. When animals ingest plastic, it can cause life-threatening problems, including reduced fitness, nutrient uptake, and feeding efficiency—all vital for survival. Worldwide every year, 8 million metric tons of plastics enter our ocean on top of the estimated 150 million metric tons that currently circulate our marine environments. Whether by errant plastic bags or plastic straws winding their way into gutters or large amounts of mismanaged plastic waste streaming from rapidly growing economies, that’s like dumping one New York City garbage truck full of plastic into the ocean every minute of every day for an entire year! and that much plastic is bound to have an impact on ocean ecosystems. Therefore, the plastic waste need be properly managed and recycled. BENEFITS OF PLASTICS During the oil crisis in the 70’s, automakers found that plastics made cars more energy efficient by reducing weight. Plastics began finding their way into automobile components (bumpers, fenders, doors, etc.). Plastics were also used for their durability, corrosion resistance, toughness, resiliency, and lightweight. Plastics reduced the weight of the average passenger car built in 1988 by 66 Kgs. That saves millions of gallons of fuel each year and will save the energy equivalent of 21 million barrels (2428 million liters) of oil over the average lifetime of those cars. Other advantages includes: Its cheap and easy to buy, hard plastics can be used in making chairs, toys etc., can be putted in to other materials and strengthens them, easy to clean and hard to break, you can use it to store food and water, can be used in all type of seasons and weather even its summer or raining, can be recycled to another products, can be used in surgeries etc. POLYMER/PLASTIC/MICROPLASTIC WASTE MANAGEMENT AND RECYCLING An effort has been made to perform recycling of waste plastic/polymer with reinforcement of metal powder by controlling the melt flow index (MFI). Currently, there is lot of problem of micro-plastics When micro-plastics wash down a drain, they are not filtered by wastewater treatment. They spread far across and throughout the ocean. Major sources of micro-plastics include: aquaculture, cruise ships, ocean dumping, stormwater, the shipping and fishing industries, urban runoff, waste management. Micro-plastics are now found everywhere in the ocean and coastal waters, shorelines, ocean seabed, and sea surface. Some of plastic’s ingredients or toxic chemicals absorbed by plastics are harmful, including: Persistent organic pollutants (POPs), Polybrominated diphenyl ethers (PBDEs), Polychlorinated biphenyls (PCBs), Polycyclic aromatic hydrocarbons (PAHs).
M45b
Copyright © CRC CARE Pty. Ltd., 2019
CleanUp Conference 2019Adelaide, Australia
8 –12 September 2019225
Table of Contentsfor this manuscript

This statistic displays the compound growth rate of the plastic resin production in the United States from 1977 to 2017. Between 1977 and 2017, the compound growth rate of the U.S. plastic resin production was 3.1 percent.
Employment in the U.S. plastics industry grew by one percent in 2016, from 954,000 workers to 965,000. The U.S. plastics industry accounted for $404.4 billion worth of shipments in 2016—representing a three-percent decline from 2015. This was driven primarily by lower material costs and low oil and natural gas prices. Regardless of the decline in shipments, the report states the domestic plastics industry remains historically strong, and well-positioned for continued growth. REFERENCES Geyer, Roland, et al. “Production, Use, and Fate of All Plastics Ever Made.” Science
Advances, vol. 3, no. 7, 19 July 2017, doi:10.1126/sciadv.1700782. Plastic Pollution Primer and Action Toolkit, Earth Day Network 2018.
226
Table of Contentsfor this manuscript

MICROPLASTICS: AN ANALYTICAL PERSPECTIVE
Bob Symons1, Edward Nagul2, Darren Robey3
1Eurofins Environment Testing Australia, Unit 7.03 - Parkview Building, 16 Mars Road, Lane Cove West, NSW 2066, AUSTRALIA
2Eurofins Environment Testing Australia, 6 Monterey Road, Dandenong South, VIC 3175, AUSTRALIA
3Agilent Technologies, Inc., 679 Springvale Rd, Mulgrave VIC 3170, AUSTRALIA [email protected]
INTRODUCTION Microplastics (MPs) have been recognised as an emerging contaminant that may have a direct adverse impact on aquatic organisms as well as humans and recent research (Sivan, A., 2011., Barnes, D.K.A., 2009.) has indicated that a range of persistent organic pollutants (POPs) may be adsorbed on the MPs and then accumulated by the receiving organism(s) (Teuten, E.L., 2007, Ashton, K., 2010). In October 2108, scientists at the Austrian Environment Agency and the Medical University of Vienna analysed stool samples of people from eight countries and found every one contained microplastics (Schwabl, P. 2018). The stools were tested at the Environment Agency Austria for 10 types of plastics following a newly developed analytical procedure using Fourier Transformed Infra-Red (FTIR) spectroscopy. Up to nine different plastics, sized between 50 and 500 micrometres, were found, with polypropylene (PP) and polyethylene terephthalate (PET) being the most common. On average, the researchers found 20 microplastic particles per 10g of stool. While this study was the first to determine MPs in humans so far, the study has neither been published nor peer-reviewed. This highlights the need to standardise our approach for the analytical determination of MPs in human and environmental samples as currently there are no standardised methods for extraction, purification nor identification approaches making the increasing numbers of MP studies, hardly, if at all comparable. METHODS Conventional sequential, spatial measurement of FTIR spectra has been successfully applied for microplastics identification (Levin and Bhargava 2005) but is extremely time-consuming when there are several thousand spectra to process and can take countless hours to finish this data interpretation. Clarity® software combined the quick acquisition time of the laser direct infra-red (LDIR) chemical imaging system can reduce the time to interrogate several thousand IR spectra to hours rather than days. At the heart of the LDIR is a mid-IR quantum cascade laser and MCT (mercury cadmium telluride) detector that results in rapid comprehensive sample analysis and identification of plastics such as Polyethylene terephthalate (PET), High density polyethylene (HDPE), Polyacrylamide, Polyvinyl chloride (PVC), Polyvinyl chloride (PVC), carboxylated, Low density polyethylene (LDPE), Polypropylene (expanded or non-expanded) (PP), Polystyrene (expanded or non-expanded)(PS), Polyamide (PA), Polymethylene methacrylate (PMMA), Polyacrylic esters and Polycaprolactone. LDIR particle size goes down to the diffraction limit that is typically in this region having a spatial resolution between 5-10 µm. The visible high-magnification camera spatial resolution goes down to 1 µm that places this technique in the same region as Raman spectroscopy. The typical workflow for microplastics analytical determination in environmental samples is presented in Figure 1 with the clean-up or pre-treatment step tailored to each matrix viz drinking water, sewage influent, biosolids, fish & shellfish and marine sediments with the critical element being to remove as much biogenic material as possible before analysis by LDIR to eliminate false positives and reduce false negatives. As an example drinking water is filtered through a 0.1µm filter and then transferred to a low emissivity microscope slides using 70% ethanol and requires no other preparation whereas sewage influent is pumped
M45c
Copyright © CRC CARE Pty. Ltd., 2019
CleanUp Conference 2019Adelaide, Australia
8 –12 September 2019227
Table of Contentsfor this manuscript

RESULTS AND DISCUSSION
CONCLUSIONS The results show that MPs are present in the samples analysed. LDIR is a new technique for the determination of the size distribution and identification of MPs in a variety of different environmental samples. Furthermore, this study contributed to improving the analytical methodologies for the analysis of MPs.
0
2
4
6
8
10
12
14
16
18
20
<10 µm >10-20 µm >20-50 µm >50-100 µm
Polycaprolactone
Polyacrylic esters
Cellulose
Polymethylene methacrylate(PMMA).
Polyamide (PA)
Polystyrene (expanded or non-expanded), (PS)
Polypropylene (expanded or non-expanded) (PP)
Low density polyethylene (LDPE)
REFERENCES Ashton, K., Holmes, L., Turner, A., 2010. Association of metals with plastic production pellets
in the marine environment. Marine Pollution Bulletin 60, 2050–2055 Barnes, D.K.A., Galgani, F., Thompson, R.C., Barlaz, M., 2009. Accumulation and
fragmentation of plastic debris in global environments. Philosophical Transactions of the Royal Society B: Biological Sciences 364, 1985–1998.
Schwabl, P. et al (2018), Assessment of microplastic concentrations in human stool - Prelim-inary results of a prospective study, Presented at UEG Week 2018 Vienna, October 24, 2018.
Sivan, A., 2011. New perspectives in plastic biodegradation. Current Opinion in Biotechnology 22, 422–426
Teuten, E.L., Rowland, S.J., Galloway, T.S., Thompson, R.C., 2007. Potential for plastics to transport hydrophobic contaminants. Environmental Science & Technology 41, 7759–7764.
Ziajahromi et al., 2017 S. Ziajahromi, P.A. Neale, L. Rintoul, F.D.L. Leusch Wastewater treat-ment plants as a pathway for microplastics: Development of a new approach to sample wastewater-based microplastics Water Res., 112 (2017), pp. 93-99
Figure 1: Analytical workflow for the analysis of microplastics
Figure 2: Size distribution and polymer identific-ation of a wastewater sample.
through stacked sieves of 500 µm, 190 µm, 100 µm and 25 µm at max flow rate of 10 L/min (Ziajahromi et al., 2017). Hydrogen peroxide with heating to no greater than 60oC is used to remove organic material and the digestate transferred to slides prior to LDIR analysis. Other digestion methods must be conducted under conditions that do not affect the morphology of the microplastics. For biota, potassium hydroxide (KOH) combined with hydrogen peroxide plus heating or enzymatic digestion has been demonstrated to be acceptable in degrading the high levels of organic matter without impacting on the morphology of the respective polymers.
Figure 2 shows the size distribution and polymer type of a wastewater sample. Nine different MPs were detected and were grouped in four sizes <10 µm, >10-20 µm, >20-50 µm, >50-100 µm with the majority of MPs being in the >10-20 µm fraction and PA being the most common across all sizes. Results for biota (fish guts & oysters) along with biosolids will be presented.
228
Table of Contentsfor this manuscript

MICRO-PLASTIC DETECTION, IDENTIFICATION AND VISUALISATION
Cheng Fang1,2, Megharaj Mallavarapu1,2, Ravi Naidu1,2
1Cooperative Research Centre for Contamination Assessment and Remediation of the Environment (CRC CARE), University of Newcastle, Callaghan, NSW 2308, AUSTRALIA
2Global Centre for Environmental Remediation (GCER), University of Newcastle, Callaghan, NSW 2308, AUSTRALIA
INTRODUCTION Recently, microplastics (MP) have emerged as global contaminants of serious concern to human and ecological health. However, identification and visualisation of MP are still a challenge, whether from wastewater, oceans, sediment or soil. Particularly when MP are mapped to visualise their distribution, the background signal from sediment and soil might be high and shield the MP signal from the analysis. Raman has recently received increasing attention, as the complementary spectrum of infrared (IR), because it can overcome the drawbacks of IR analysis including water interference, low lateral resolution and a complex spectrum. Here we show that Raman can identify and visualise MP from a soil / sand background, with almost no sample preparation, no dye, no destruction of the sample and no interference from water / organic matter / fluorescence background signals as well. By mapping image via their characteristic and fingerprint peaks, MP including polystyrene (PS), polyethylene terephthalate (PET), polyethylene (PE), polyvinyl chloride (PVC) and polypropylene (PP) can be individually identified and visualised. The lateral resolution along the focal plane is 1 μm / pixel to catch small MP down to 1 μm.
PE?
PVC?
PE
PVCPE
PVC
In general, we successfully employed Raman mapping to identify and visualise MP as small as 1 μm from sand backgrounds. So far, the smallest particle that has been detected by Raman is a 1 µm polyamide (PA) in bottled mineral water, which was reported by Oßmann et al. Oßmann, Sarau, Holtmannspötter, Pischetsrieder, Christiansen and Dicke [1]. However, in the current study, we can visualise and identify 5 different MP, simultaneously rather than individually. REFERENCES [1] B.E. Oßmann, G. Sarau, H. Holtmannspötter, M. Pischetsrieder, S.H. Christiansen, W.
Dicke, Small-sized microplastics and pigmented particles in bottled mineral water, Water Research, 141 (2018) 307-316.
[2] Zahra Sobhani, Md. Al Amin, Ravi Naidu, Mallavarapu Megharaj, Cheng Fang, Identification and visualisation of microplastics by Raman mapping, Anal. Chim. Acta, accepted.
M45d
Copyright © CRC CARE Pty. Ltd., 2019
CleanUp Conference 2019Adelaide, Australia
8 –12 September 2019229
Table of Contentsfor this manuscript

THE TOXICITY EFFECT OF MICROPLASTIC VECTOR FOR PFOS AND PFOA ON EARTHWORM
Zahra Sobhani1, Cheng Fang1,2
, Megharaj Mallavarapu1,2
1Global Centre for Environmental Remediation (GCER), University of Newcastle, Callaghan
NSW 2308, AUSTRALIA 2Cooperative Research Centre for Contamination Assessment and Remediation of the Environment (CRC CARE), University of Newcastle, Callaghan NSW 2308, AUSTRALIA
[email protected] INTRODUCTION Microplastics (< 5mm) are widely used in several industrial and commercial applications throughout the world. However, their, improper and indiscriminate disposal led to serious pollution of soil and aquatic environments. Because of their large ratio of surface area to volume, plastics have a significant ability to accumulate a range of hydrophobic persistent organic pollutants (POP) from the surrounding environment (Ogata et al., 2009). The ingestion of plastic derived contaminants by the organisms can result in their bioaccumulation by several orders of magnitude greater than that without plastic (Browne et al., 2013; Zhang et al., 2015). Sorption of POPs by MPs showed toxic effect on benthic marine (Besseling et al., 2012) and terrestrial organisms (Browne et al., 2013). Perfluorooctane sulfonate (PFOS) and perfluorooctanoic acid (PFOA) are known as two emerging POPs due to their extreme persistence, and toxic properties (Milinovic et al., 2015). Previous results by Llorca et al. (2018) and (Wang et al., 2015) showed that the sorption of PFOS and PFOA to microplastics can enhance the risk of their accumulation in animal bodies and food chain. This study was aimed to investigate the effect of PVC microplastic as a vector for PFOS and PFOA on the survival and reproduction of earthworms. METHODS The air-dried and sieved (2 mm mesh size) soil was spiked with different concentrations of PVC powder with and without 10 mg kg-1 PFOA or PFOS and their mixture (5 mg kg-1 PFOA plus 5 mg kg-1 PFOS). The earthworm toxicity test was carried out according to the OECD guideline (OECD, 2004). The Mortality and reproduction effects of worms were studied after 28 and 56 days of exposure. RESULTS AND DISCUSSION In all the treated groups, no acute toxicity effect was observed in terms of mortality and growth after 4 weeks. The effect of treatment on reproduction of earthworms in terms of juvenile production was recorded after 8 weeks. Table 1 shows the effect of different concentrations of PVC with or without PFOA and PFOS on earthworms’ reproduction. There was no significant effect on the number of juveniles due to the exposure to PVC up to 500 mg kg-1 soil. Whereas the number of juveniles were declined (about 28 %) in 1000 mg kg-1 PVC treated soil. Also, no obvious changes were observed in the earthworms exposed to soils that were amended with PFOS/PFOA in addition to PVC up to 0-100 mg kg-1. The addition of PFOS/PFOA or their mixture to 500 and 1000 mg kg-1 PVC-contaminated soil exhibited a significant decline in juvenile production.
M45e
Copyright © CRC CARE Pty. Ltd., 2019
CleanUp Conference 2019Adelaide, Australia8 –12 September 2019 230
Table of Contentsfor this manuscript

Table 1. Effect of PVC, PFOA and PFOS on earthworms’ reproduction. Data in the same column with different letters are significantly different (P<0.05; Tukey B)
Treatment No added
PFAS 10 mg kg-1
PFOS 10 mg kg-1
PFOA 5 mg kg-1
PFOS/PFOA PVC Concentration (mg kg-1 soil)
Number of juveniles
0 32.0 ± 0.0a 34.0 ± 2.8a 32.5 ± 0.7a 33.5 ± 0.7a 0.1 33.5 ± 6.4a 36.0 ± 1.4a 31.0 ± 1.4a 33.5 ± 2.1a 1 37.0 ± 1.4a 34.5 ± 2.1a 33.0 ± 1.4a 36.0 ± 1.4a 10 32.5 ± 0.7a 33.5 ± 0.7a 34.0 ± 2.8a 35.0 ± 0.0a 100 34.0 ± 1.4a 28.0 ± 2.8a 32.0 ± 2.8a 36.0 ± 2.8a 500 30.0 ± 1.4ab 15.0 ± 1.4b 18.0 ± 1.4b 16.50 ± 2.1b 1000 21.5 + 0.7b 14.0 ± 2.8b 16.50 ± 0.7b 16.0 ± 2.8b
CONCLUSIONS This study demonstrates that microplastics can serve as vectors for persistent organic pollutants such as PFOS/PFOA and thereby enhance the toxicity to earthworms. REFERENCES Besseling, E., Wegner, A., Foekema, E. M., Van Den Heuvel-Greve, M. J., & Koelmans, A.
A. (2012). Effects of microplastic on fitness and PCB bioaccumulation by the lugworm Arenicola marina (L.). Environmental Science & Technology, 47(1), 593-600.
Browne, Mark A., Niven, Stewart J., Galloway, Tamara S., Rowland, Steve J., & Thompson, Richard C. (2013). Microplastic Moves Pollutants and Additives to Worms, Reducing Functions Linked to Health and Biodiversity. Current Biology, 23(23), 2388-2392. doi:https://doi.org/10.1016/j.cub.2013.10.012
Llorca, M., Schirinzi, G., Martínez, M., Barceló, D., & Farré, M. (2018). Adsorption of perfluoroalkyl substances on microplastics under environmental conditions. Environmental Pollution, 235, 680-691. doi:https://doi.org/10.1016/j.envpol.2017.12.075
OECD. (2004). Test No. 222: Earthworm Reproduction Test (Eisenia fetida/Eisenia andrei). Ogata, Y., Takada, H., Mizukawa, K., Hirai, H., Iwasa, S., Endo, S., Mato, Y., Saha, M.,
Okuda, K., Nakashima, A., Murakami, M., Zurcher, N., Booyatumanondo, R., Zakaria, M. P., Dung, L. Q., Gordon, M., Miguez, C., Suzuki, S., Moore, C., Karapanagioti, H. K., Weerts, S., McClurg, T., Burres, E., Smith, W., Velkenburg, M. V., Lang, J. S., Lang, R. C., Laursen, D., Danner, B., Stewardson, N., & Thompson, R. C. (2009). International Pellet Watch: Global monitoring of persistent organic pollutants (POPs) in coastal waters. 1. Initial phase data on PCBs, DDTs, and HCHs. Marine Pollution Bulletin, 58(10), 1437-1446. doi:https://doi.org/10.1016/j.marpolbul.2009.06.014
Wang, F., Shih, K. M., & Li, X. Y. (2015). The partition behavior of perfluorooctanesulfonate (PFOS) and perfluorooctanesulfonamide (FOSA) on microplastics. Chemosphere, 119, 841-847. doi:https://doi.org/10.1016/j.chemosphere.2014.08.047
Zhang, W., Ma, X., Zhang, Z., Wang, Y., Wang, J., Wang, J., & Ma, D. (2015). Persistent organic pollutants carried on plastic resin pellets from two beaches in China. Marine Pollution Bulletin, 99(1), 28-34. doi:https://doi.org/10.1016/j.marpolbul.2015.08.002
231
Table of Contentsfor this manuscript

ECOTOXICITY AND BIOAVAILABILITY OF MIX CONTAMINANTS: IMPLICATIONS TO BIOREMEDIATION
Megharaj Mallavarapu, Ravi Naidu
Global Centre for Environmental Remediation (GCER), Faculty of Science, The University of
Newcastle, Callaghan, NSW 2308, AUSTRALIA and Cooperative Research Centre for Contamination Assessment and Remediation of the Environment (CRCCARE), ATC
Building, University of Newcastle, Callaghan, NSW2308, AUSTRALIA [email protected]
INTRODUCTION Global industrialisation coupled with modern agriculture has resulted in the production and emissions of various xenobiotic compounds into the environment. Soil, the ultimate repository/sink for most contaminants is generally encountered not with single pollutant, but with mixtures of several contaminants [organic-organic (pesticides plus their metabolites), organic-inorganic (DDT-As; PAH-metals), inorganic-inorganic (sewage sludge containing several heavy metals)]. Often the parent chemicals exist simultaneously with their degradation products. Contaminated sites are widespread and are of common occurrence in most countries, industrial countries in particular. Adverse impacts of contaminants on biological systems are primarily governed by their bioavailability which is often a major factor determining the success or failure of bioremediation. However, its success depends on several factors related to the biological agent used, soil, environmental and contaminant characteristics. Risk based remediation is currently gaining importance as an attractive option for remediation of contaminated environments. Bioavailability and toxicity are the key parameters that need to be adequately understood prior to estimating the risk posed by the contamination or any remedial activity to be undertaken. GCER and CRC CARE are therefore conducting research to examine the factors affecting bioavailability of contaminants in relation to ecotoxicity and bioremediation. A few case studies from our research on the toxicity of mixed contaminants (eg. DDT and its metabolites, petroleum hydrocarbons, Copper, cadmium - atrazine, arsenic-DDT etc) in long-term contaminated sites and the associated challenges to remediation will be discussed. SELECTED CASE STUDIES Degradation products may be more toxic than parent chemicals (Eg. DDT and metabolites) The impact of long-term DDT pollution of soil was investigated using different criteria such as chemical analysis of DDT residues (DDT, DDE and DDD) and microbial parameters (Megharaj et al 2000a). The chemical analysis of contaminated soils revealed DDT as the predominant compound followed by its degradation products, DDE (19-27 % of total DDT residues) and DDD (3-13 % of total DDT residues) in all the 3 levels of contaminated soils. DDD was found only in minor amounts in low level contaminated soil compared to medium and high level contaminated soils. A greater toxicity was observed in the medium and high polluted soils where DDD is present as significant portion of the DDT residues suggesting an additive interaction among the DDT residues. The observed higher toxicity in medium and high polluted soils could be ascribed to the presence of DDD given the fact that DDD is reported to be more toxic than DDE and DDT (Megharaj et al., 1999). Toxicity at a longterm petroleum hydrocarbon contaminated site The toxicity of a long-term petroleum hydrocarbon contaminated site was evaluated using chemical and biological analysis (Megharaj et al., 2000b). Microbial biomass, soil enzyme activity, and microalgae declined in medium to high-level (5,200–21,430 mg kg1 soil) TPH-polluted soils, whereas low-level (2,120 mg kg1 soil) pollution stimulated the algal
M46a
Copyright © CRC CARE Pty. Ltd., 2019
CleanUp Conference 2019Adelaide, Australia8 –12 September 2019 232
Table of Contentsfor this manuscript

populations and showed no effect on microbial biomass and enzymes. However, inhibition of all the tested parameters was more severe in soil considered to have medium-level pollution than soils that were highly polluted. This result could not be explained by chemical analysis alone. Of particular interest was an observed shift in the species composition of algae in polluted soils with elimination of sensitive species in the medium to high polluted soils. Toxicity of organic (atrazine) and inorganic (Copper) combination to soil biota The results of our study on the toxicity and bioavailability of atrazine and copper combinations to soil biota showed a greater toxicity to microbial biomass carbon (5 mg atrazine kg-1 and 50 mg Cu kg-1) and lesser algal species diversity than the contaminants present alone. Application of copper at 10 mg kg-1 soil had no effect on the persistence of atrazine (at 2 mg kg-1 soil) in terms of its half-life in soil (30 days). However, copper at 50 mg kg-1 soil increased the half-life of atrazine (spiked at 2 mg kg-1 soil) to 110 days. This clearly demonstrates that elevated levels of copper are detrimental to organic degrading bacteria resulting in prolonged persistence of the organic chemical. In an another experiment where pore waters from 3 soils and algal growth medium were spiked with various combinations of copper and atrazine and subjected to algal growth bioassay using Chlorococcum sp. soil pore waters exhibited antagonistic interaction, but not in algal growth medium. The predominant form of copper in soil pore waters was found to be Cu-DOM complex whereas in growth medium copper existed as free ion. This clearly suggests that the toxicity observed by conducting the tests using defined laboratory growth media may differ from the real environmental toxicity and caution is required in extrapolating these results to real soil conditions. Toxicity of Cd, Zn and Pb in binary and tertiary combinations to earthworm The effect of Cd, Zn and Pb in binary and tertiary combinations on earthworm survival and reproduction in 3 contrasting soils was assessed (Wijayawardena et al., 2017).The Zn-Cd combination showed greater toxicity to earthworms in acidic soil than neutral and alkaline soil. Further in Zn-Pb binary mixture spiked acidic soil exhibited 60% mortality in earthworms even the Zn and Pb concentrations are below the guide line values. CONCLUSIONS The presence of heavy metals has been shown to be inhibitory to biodegradation of organic chemicals by exerting toxicity to organic degrading microorganisms. Although considerable literature exists on the toxicity of heavy metals to soil microorganisms studies on toxicity of metals to organic biodegradation are limited. More studies are required on the interaction mechanisms of inorganic-organic co-contaminants. Antagonistic or synergistic toxic effects caused by complex pollutant mixtures such as TPHs, and pesticide combinations (Arsenic and DDT as in the cattle dip sites), are difficult to predict by analytical chemistry alone. Results suggested the use of chemical analysis in conjunction with bioassays is necessary for toxicity testing. Therefore, risk-based remediation, particularly in long-term contaminated sites, should be based on toxicological assays in conjunction with chemical assays. REFERENCES Megharaj, M., Boul, L.H. and Thiele, J.H. (1999) Persistence and toxicity of DDT and its
metabolites toward native algal populations and enzymatic activities in soil. Biol. Fert. Soils 29:130-134.
Megharaj, M., Kantachote, D., Singleton, I. and Naidu, R. (2000a). Effects of long-term contamination of DDT on soil microflora with special reference to soil algae and algal metabolism of DDT. Environ. Pollut. 109:35-42.
Megharaj, M., Singleton, I., McClure, N.C. and Naidu, R. (2000b) Influence of petroleum hydrocarbon contamination on microalgae and microbial activities in a long-term contaminated soil. Arch. Environ. Contam. Toxicol. 38:439-445.
Wijayawardena, M.A.A., Megharaj, M., Naidu, R., and Stojanovski, E. (2017) Chronic and reproductive and reproductive toxicity of cadmium, zinc, and lead in binary and tertiary mixtures to the earthworm (Eisenia fetida). J. Soils Sed. 17:1064-1072.
233
Table of Contentsfor this manuscript

MIXED CONTAMINATION (INCLUDING PFAS) ASSESSMENT AND MANAGEMENT AT A ZINC GALVANISING PLANT
Alice Walker1, Andre Smit1, Joshua Nolan2, Faraz Alam2
1GHD Pty Ltd, 133 Castlereagh Street, Lonsdale Street, Sydney, NSW 2000, AUSTRALIA
2Nepean Building Infrastructure (NBI), 117-153 Rookwood Road, Sydney, NSW 2199, AUSTRALIA
INTRODUCTION Galvanising operations and the fabrication of steel products have been occurring in Sydney (NSW, Australia) since the 1960s. Environmental investigations at a galvanising site in Sydney indicated the presence of metals, ammonia and acid above background in groundwater. In January 2005, the site was deemed a ‘Significant Risk of Harm’ (SRoH) as listed in S9 (1) of the Contaminated Land Management Act 1997. Since 2005, the objectives of the site assessment program and subsequent remedial/mitigation options have evolved based on the groundwater monitoring results, the developments in understanding of the prevalence and significance of per- and polyfluorinated alkyl substances (PFAS) in the metal coating industry, and in response to EPA requirements. APPROACH AND RESULTS Periodic quarterly groundwater monitoring was initiated by GHD in 2006, and was initially intended to monitor the natural attenuation of identified contaminant loadings in groundwater, in response to the apparent removal of the likely source. In response to groundwater impacts migrating off-site, a groundwater extraction system (hydraulic control) was installed in 2014. Since this time, contaminated groundwater has been demonstrated to be hydraulically restricted from migrating off-site. In addition, improvements to off-site groundwater quality have been demonstrated through regular monitoring. In 2018, PFAS assessment was included in the periodic groundwater analytical suite for the first time. PFAS was confirmed in groundwater, and following subsequent investigations, PFAS was also confirmed in storm water from the site. However, PFAS was not known to be in use on the site. GHD therefore carried out a series of investigations to assess possible sources and potential transport mechanisms of PFAS compounds on site, applying a risk framework to assess the significance of these compounds. Results from products used on site and dust from the bag house (collection area for aerially dispersed dust) confirmed the presence of PFAS on site in liquids used in the galvanising process and in solids on the facility roof and in the baghouse. CONCLUSIONS / LESSONS LEARNT The potential for groundwater flow off-site immediately down hydraulic gradient of the source zone is considered to be mitigated by ongoing groundwater extraction as part of the remedial works program. However, the presence of contaminants of concern in stormwater indicates that off-site migration from identified source zones is likely to be occurring. Despite this, groundwater and surface water monitoring to date have indicated that the site is likely to pose a low risk to surrounding off-site receptors. The investigations carried out by GHD and NBI were able to confirm the source of PFAS contamination in the process, thus facilitating management decisions to phase out PFAS containing products where possible. Due to the low risk posed to off-site receptors, PFAS was removed from the periodic groundwater analytical suite with the support of the EPA.
M46b
Copyright © CRC CARE Pty. Ltd., 2019
CleanUp Conference 2019Adelaide, Australia8 –12 September 2019 234
Table of Contentsfor this manuscript

Proactive engagement with the EPA has contributed to the successful out comes of this project to date. The presence of contaminants on the roof and in the baghouse dust provides strong evidence to suggest that these contaminants have the potential to become airborne during the galvanising process as vapour, particulate matter or as particles on water vapour. The propensity for migration of PFAS via an aerial deposition pathway is relatively poorly understood in an Australian context. This project is therefore moving to a phase of ambient air monitoring of PFAS (and other contaminants of concern such as chromium (VI)) to assess the potential risks via this pathway, and these results will be discussed in the presentation. Additionally, mitigation measures focusing on controlling contaminants of concern entering the stormwater system are being implemented in a staged approach with further surface water monitoring to assess the effectiveness of implementation.
235
Table of Contentsfor this manuscript

VALIDATING BIOACCESSIBILITY TESTS FOR ASSESSING CONTAMINANTS IN MIXED CONTAMINATED SOILS
M.A.Ayanka Wijayawardena1,2, Kaihong Yan1,2, Yanju Liu1,2, Ravi Naidu1,2
1Global Centre for Environmental Remediation (GCER), ATC Building, University of
Newcastle, Callaghan, NSW 2308, AUSTRALIA 2Cooperative Research Centre for Contamination Assessment and Remediation of the
Environment (CRC CARE), University of Newcastle, Callaghan, NSW 2308, AUSTRALIA [email protected]
INTRODUCTION Heavy metal(loid)s are widely used in day-to-day life and can be found abundantly in the environment around us. Commonly, heavy metal(loid)s are present as mixtures in the environment (Wijayawardena, Megharaj, & Naidu, 2016). For example arsenic (As) and lead (Pb) co-occur in mining, smelting, agricultural and many other soils. Among these heavy metal(loid)s Pb has attracted much public concern for decades due to its adverse effects on young children and pregnant mothers (Li & Naidu, 2005) and As have attracted public attention due to it’s ability to cause numerous cancers and kidney diseases (Naidu, Smith, Owens, & Bhattacharya, 2006) . However majority of the current bioavailability data on Pb and As have arisen from experiments on single metal contaminated soils. Even concerning, the current regulatory guidelines worldwide, with the exception of Australia do not account for the bioavailability of metal(loid)s let alone bioavailability of mixed metal(loid)s. This approach of assuming that total metal(loid) concentration in soil to be 100% bioavailable leads to many unnecessary cleanup events (Naidu et al., 2003). Such events lead to waste of resources such as man power and money which might have been used for some other development program. METHODS In this study, fifteen soils were used to investigate whether the existing single metal(loid) validated bioaccessibility method using UBM (Unified BARGE method) and relative bioavailability (RBA) of Pb and As could be predicted when the are present in mixtures. In vivo RBA of Pb and As was determined using mice models. The biological responses to oral administration of Pb and As in aqueous phase or as spiked soils were compared to mice tissue Pb and As concentrations. RESULTS AND DISCUSSIONS Arsenic and Pb bioavailability may be predicted using the gastric phase of the UBM (Unified BARGE method) using the following equations when they are present in mixtures in soil; Arsenic RBA (%) = 1291.7e-0.772*UBM gastric (%)
Lead RBA (%) = 0.88*UBMgastric (%)+19.53 UBM models were significantly (P< 0.01) correlated with RBA values, with slopes between 0.8-1.2, intercepts different from 0. This meets the benchmark criteria suggested by Wragg et al. (2011) CONCLUSION UBM gastric phase bioaccessibility test was able to better predict As and Pb bioavailability (R2=0.67 and R2=0.57 respectively) when these metal(loid)s are present as mixtures in soils. Although the UBM intestinal phase was able to predict the As in the mixed metal(loid) contaminated soils it was unable to predict Pb bioavailability in mice in mixed metal contaminated soils. This may have been the result of Pb making complexes in higher pH
M46c
Copyright © CRC CARE Pty. Ltd., 2019
CleanUp Conference 2019Adelaide, Australia8 –12 September 2019 236
Table of Contentsfor this manuscript

values of intestinal phase resulting in precipitation and therefore making it difficult to predict bioavailability of Pb in the mixed contaminated soils. These above mentioned equations can help predict potentially available As and Pb in contaminated soils. These bioavailability prediction models that use the Bioaccessiblity values will provide a reliable and cost effective way of assessing the human health risk posed by mixed metal(loid) contaminated soils and help save children’s health and help better manage contaminated lands. REFERENCES Li, J., & Naidu, R. (2005). Risk assessment of heavy metal contaminated soil in the vicinity of
a lead/zinc mine. Journal of Environmental Sciences, 17(6), 881-885. Naidu, R., Rogers, S., Gupta, V., Kookana, R. S., Bolan, N. S., & Adriano, D. (2003).
Bioavailability of metals in the soil plant environment and its potential role in risk assessment. Paper presented at the Bioavailability, toxicity and risk relationships in ecosystems. 4th International Symposium on the Biogeochemistry of Trace Elements, Berkeley, California, USA, 23-26 June 1997.
Naidu, R., Smith, E., Owens, G., & Bhattacharya, P. (2006). Managing arsenic in the environment: from soil to human health: CSIRO publishing.
Wijayawardena, M. A., Megharaj, M., & Naidu, R. (2016). Exposure, Toxicity, Health Impacts, and Bioavailability of Heavy Metal Mixtures. Advances in Agronomy.
Wragg, J., Cave, M., Basta, N., Brandon, E., Casteel, S., Denys, S., . . . Tack, K. (2011). An inter-laboratory trial of the unified BARGE bioaccessibility method for arsenic, cadmium and lead in soil. Science of the Total Environment, 409(19), 4016-4030.
237
Table of Contentsfor this manuscript

ECOTOXICITY MODELLING: COMPETITIVE, MULTI-SPECIES AND OTHER MODELS FOR TERRESTRIAL ENVIRONMENTS
D.T. Lamb1,2, L. Wang1,2, S. Abbasi1, P. Sanderson1,2, M. Kader2, M. Mallavarapu1,2,
R. Naidu1,2
1GCER, The University of Newcastle, NSW 2287, AUSTRALIA 2CRC CARE, The University of Newcastle, NSW 2287, AUSTRALIA
INTRODUCTION Toxicity of inorganic toxicants to terrestrial receptors is known to be dependent on several soil pore-water properties. Risks are posed in soils by a range of metals (e.g. Cu, Pb) and metalloids (e.g. As (V), Cr (VI)), yet there are few coherent platforms for assessing the impacts in terrestrial environments. Several factors influence this absence, including diverse modelling approaches, limited soil environments considered (e.g. a wide pH range), inadequate application to terrestrial environments, absence of data on several inorganic contaminants and a lack of validation of developed models. In general, the toxicity of a given ion may be ameliorated to a degree by the presence of competitive ions. Cations which consistently show a competitive influence on other cations at the surfaces of organisms include calcium, magnesium and hydronium. The importance of accounting for solution pH is heightened in terrestrial systems, since the variation in pH between soils is more marked than that observed between aquatic systems. A number of models have been reported to account for the variation observed in toxic response from cations, including the Windermere humic acid model (WHAM), NICA- Donnan, Gouy-Chapman-Stern (GCS) electrostatic models, and the commonly known biotic ligand model (BLM). Models for neutral and negatively charged metallic anions are few or non-existent. This presentation outlines the conceptualisation of cationic and anionic toxicity models and reports examples of their form with application to metal-metalloid mixture datasets. METHODS Methods for the study have previously been reported by Lamb et al. (2016) and Kader et al. (2017; 2018). In short, 10 soils were spiked with anionic contaminants (As(V) Cr(VI)) and cationic contaminants (Cu (II) and Zn(II)) at concentrations sufficient to induce a full dose response curve. Soils were incubated for approximately 8-12 weeks. Cucumis sativa L seeds were germinated directly to soils and grown for 28-d. Plants were harvested, dried at 65-70°C and dry-weights recorded. Soil pore-water was extracted and analysed as previously reported (Lamb et al., 2016). Speciation of Cr and As in soil-pore water was determined using liquid chromatography inductively coupled plasma mass spectrometry (LC-ICP-MS) (Chen et al., 2007; Lamb et al., 2016). Derivation of model parameters for the competitive ion interaction model (IIM) was performed as previously reported. The fraction of active sites in the multi-species model, including primary metal(loid) species (Mp) and secondary metal(loid) species (Ms), can be expressed as:
(1)
Where i are ions which ‘compete’ or mitigate metal(loid) toxicity to the organism. In this study, this is restricted to ions involved in pH changes at the root-solution interface (H+, OH- and carbonates). Assessment of the fitted data was performed by calculating the root mean square error (RMSE). The individual developed models were applied to independent datasets from mixtures of As and Zn (Kader et al., 2017; Kader et al., 2018).
M46d
Copyright © CRC CARE Pty. Ltd., 2019
CleanUp Conference 2019Adelaide, Australia8 –12 September 2019 238
Table of Contentsfor this manuscript

RESULTS AND CONCLUSIONS Soil pore-water based toxicity data showed that arsenate, chromate, copper and zinc each was dependent on pH either directly or indirectly. Data on arsenate have been previously reported (Lamb et al. 2016). The results showed that there was no clear interaction between sulphate or phosphate with chromate toxicity. However, there was a clear interaction between OH- and HCO3
-. Therefore, we successfully developed an IIM for chromate which
was a function of OH- and HCO3- activities (a root mean square error of 19.4%). The nature
of the interaction between chromate and OH-/HCO3- has implications for interpretation of
ecotoxicology models, particularly relating to other metallic anions. The pH related impacts in principle could be related to changes in speciation of As(V) (e.g. AsO4
3-, H2AsO4-) and Cr(VI)
(e.g. HCrO4-, CrO4
2-). However, in this study the mutli-species model could not improve the relationship. In contrast, the multi-species models for Cu and Zn provided excellent fits to the toxicity data (RMSE<18). Application of the model to As-Zn mixtures (e.g. Fig.1) demonstrated that across 5 contrasting soils, the independent models developed for As and Zn provided significant improvement compared to statistical-based models (Fig.1.). The models will be compared to recently reported toxicity models (e.g. Wang et al. (2011)).
1E-09 1E-08 1E-07 1E-06 1E-05 0.0001 0.001 0.01
pore-water As (M)
0
20
40
60
80
100
120
140
% R
G
As-Zn mixture
-4 -2 0 2
pore-water As (M)
0
20
40
60
80
100
120
140
% R
GAs-Zn mixtures
fmix As-Zn
R2 =0.55RMSE = 25%
Fig. 1. Comparison of results from the As and Zn EC10. From left to right: statistical description of data (Kader et al. 2018); relative growth as a function of As data in pore-water; relative growth as a function of fmix. REFERENCES Chen, Z., Megharaj, M. and Naidu, R. (2007) Removal of interferences in the speciation of
chromium using an octopole reaction system in ion chromatography with inductively coupled plasma mass spectrometry. Talanta 73, 948-952.
Kader, M., Lamb, D.T., Wang, L., Megharaj, M. and Naidu, R. (2017) Zinc-arsenic interactions in soil: Solubility, toxicity and uptake. Chemosphere 187, 357-367.
Kader, M., Lamb, D.T., Wang, L., Megharaj, M. and Naidu, R. (2018) Copper interactions on arsenic bioavailability and phytotoxicity in soil. Ecotoxicology and environmental safety 148, 738-746.
Lamb, D.T., Kader, M., Wang, L., Choppala, G., Rahman, M.M., Megharaj, M. and Naidu, R. (2016) Pore-Water Carbonate and Phosphate As Predictors of Arsenate Toxicity in Soil. Environmental Science & Technology 50, 13062-13069.
Wang, P., Kinraide, T.B., Zhou, D., Kopittke, P.M. and Peijnenburg, W.J.G.M. (2011) Plasma Membrane Surface Potential: Dual Effects upon Ion Uptake and Toxicity. Plant Physiology 155, 808-820.
239
Table of Contentsfor this manuscript

PILOT SCALE THERMAL REMEDIATION OF DIFFERENT MERCURY SPECIES AND A MIX OF PESTICIDES
Niels Ploug, Søren Eriksen, Jesper Holm, Jacob Brix
Krüger A/S, Gladsaxevej 363, Soeborg, 2860, DENMARK
INTRODUCTION Back in the 60’s and 70’s waste was deposited in the sandy dunes on the West Coast of Denmark in a location now known as the Groyne 42. Contaminants were mercury, thio phosphate ester pesticides – parathion, methyl parathion, malathion and sulfotep – as well as waste from production – mixed (thio) phosphate esters, elemental sulphur, and solvents. The contaminated soil volume of the site is 27000 m3 containing 100 tons of contamination including 67 tons of parathion and 7 tons of mercury.1 High remediation efficiencies of well over 99% are required due to high concentrations of contaminants. Complete removal of pesticides and an 85% reduction of mercury to a level of 6 mg/kg was reported in previous thermal desorption laboratory testing at 300⁰C. 2 Krüger together with the Danish EPA sponsored a laboratory and following a pilot scale thermal remedy to prove concept of remediating the soil using thermal desorption. METHODS Contaminated material excavated for testing had 366 mg/kg total mercury and 1400 mg/kg combined pesticides, primarily parathion. Mercury speciation by five step sequential selective extraction analysis suggests that 71 % is mercury sulfide and 24% is elemental mercury. The proposed method of remediation was to heat the soil while moderately aerated.The air flow serves two purposes: Carrying evaporated contaminants out of the soil and oxidizing mercury sulfide to volatilize the mercury in line with processes for winning mercury by roasting sulfide ore. Deciding the target temperature of 350⁰C was based on the limited removal rate reported at 300⁰C 2 as well as thermodynamic equilibrium calculations to enable a mercury vapor pressure of at least 10 mbar over mercury oxide in air. Safety considerations include: Toxic compounds, exothermic reactions, evolution of flammable gasses from pesticide decomposition, concentration of flammable vapors of solvents, sulphur, phenols. Lab scale testing Before heating any appreciable amount of soil thermo gravimetric analysis (TGA) including differential thermal analysis (DTA) was applied to soil samples to test for exothermic reactions and to get a correlation between temperature and loss of mass (evaporation). The lab scale testing was conducted with soil in a heated glass column fitted with a condenser and a peristaltic pump to generate air flow. Condensate and mercury vapor were collected to follow contaminants and establish mass balances. Pilot scale testing Based on results from lab scale testing removing all contaminants at 350⁰C a pilot scale test was designed. The pilot set up for thermal treatment of 40 tons soil is a 2.4 x 2.4 x 6.0 m steel box fitted with 6-off 5 kW electrical insertions heaters and off gas treatment plant consisting of water injection, condenser, mist separator, activated carbon filters and blower. During the pilot test, the soil volume was slowly heated while aerated at a moderate flow of 10m3/h.
M46e
Copyright © CRC CARE Pty. Ltd., 2019
CleanUp Conference 2019Adelaide, Australia8 –12 September 2019 240
Table of Contentsfor this manuscript

Simulation of chemical reactions and evaporation rates has been used to find safe heating rates keeping concentrations of flammable gasses well below the lower explosion limit. Concentrations of mercury, pesticides and solvents was monitored at the box outlet as well as the treatment plant outlet. Treatment temperature was monitored in 18 points along the soil treatment box’s mid plane. RESULTS AND DISCUSSION Lab scale testing TGA/DTA show a gradual mass loss with increasing temperature and no pronounced exothermic reactions. The largest change is the evaporation of water at 100⁰C losing quite some mass and requiring heat. Lab scale testing show that treating the soil at 350⁰C for 2-4 days was sufficient to reduce Hg concentration to <1 mg/kg. Pesticides where non detect after heating. Pilot scale testing The soil temperature reached 350 to 500⁰C during the pilot scale test. Mercury concentrations of the treated soil is in the range 0.4 to 4.8 mg/kg (dry basis) with an average concentration 1.8 mg/kg (dry basis). 50% of the mercury is recovered as pure metal, 10% is dissolved in condensate or trapped in activated carbon exhaust filters and remaining 40% is mixed with condensed solids and sludges. All organic compounds: phosphate ester pesticides, phosphate ester intermediates and solvents are non detectable in the treated soil. The pesticides were non detect already at a mid point sampling at 200⁰C. Parathion analysis of inlet to treatment plant (air sample) is up to 0.6 mg/m3, water condensed holds up to 1.9 mg/L. Concentrations of other pesticides are lower. The mass balance shows over 99.9% in situ destruction of the phosphate ester pesticides. CONCLUSIONS High temperature thermal conductive heating remediation is found to be an efficient and safe approach to the complex mixed contamination for at the Danish Groyne 42 site containing highly toxic pesticides mixed with mercury bound as mercury sulfide and a number of other contaminants. The phosphate ester pesticides parathion, methyl parathion, sulfotep and malathion are remediated at 200 °C to below the detection limit. During heating a 99.9% in-situ destruction rate is achieved. Remediation of mercury sulfide requires higher temperature, at 350-500 °C. 99.5% of the mercury is remediated – even though the dominating species was mercury sulfide. REFERENCES Høfde 42, Afgrænsning af nedsivningsområdet, Rambøll/Kogsgaard/Geosyntec/Cowi, 2013,
p.18 - http://www.northpestclean.dk/siteassets/northpestclean/publikationer/npc/2013/ 2013-12-06-hofde-42-afgransning-af-nedsivningsomrade-1.pdf
Steffen Griepke Nielsen et al.: Termisk assisteret oprensning af høfdedepotet, Høfde 42, Harboøre Tange, Miljøprojekt Nr. 1193, Miljøstyrrelsen, 2007, p. 70 - https://www2.mst.dk/ Udgiv/publikationer/2007/978-87-7052-604-3/pdf/978-87-7052-605-0.pdf
241
Table of Contentsfor this manuscript

IMMOBILIZATION OF Cd AND As BY APATITE CONVERTED FROM MICROBIAL INDUCED CALCIUM CARBONATE
Shijun Wu1, Maolin Wang1,2, Fanrong Chen1, Yongqiang Yang1
1Guangzhou Institute of Geochemistry, Chinese Academy of Sciences,
No. 511 Kehua Street, Guangzhou, 510640, CHINA 2University of Chinese Academy of Sciences,
No. 19(A) Yuquan Road, Beijing, 100049, CHINA [email protected]
INTRODUCTION Microbial induced calcium carbonate precipitation (MICP) is regarded as a potential biochemical technology for the remediation of heavy metals (HMs) contaminated soil. However, carbonate bounded HMs might release to the environment due to the dissolution of carbonate minerals. Meanwhile, it is well known that calcite will spontaneously convert to hydroxyapatite (HAP) once phosphate fertilizer application in calcareous soil, due to the lower solubility of HAP comparing to calcium carbonate. Currently, it is not clear that the fate of carbonate bounded heavy metals during the conversion of calcium carbonate to HAP. METHODS Microbial induced CaCO3 in the presence/absence of Cd and As was prepared and converted to HAP under hydrothermal condition in situ. Once Cd/As was absent during the precipitation of CaCO3, it was induced into the system before the conversion. The solid was characterized using XRD, FT-IR, SEM-EDS, while the chemical composition of the solution and solid (after digestion) was measured using ICP-OES/MS. Afterwards, dissolution experiments were performed using typical Cd/As containing solid to evaluate the stability of Cd/As in calcite and HAP. RESULTS AND DISCUSSION The results showed that the microbial induced CaCO3 can rapidly converted into carbonate-bearing hydroxyapatite under mild hydrothermal condition. During the conversion of Cd-bearing CaCO3 (Cd-CaCO3), no Cd released into solution. After conversion, aqueous Cd concentration further decreased up to 29.6% due to the formation of Cd-bearing HAP (Cd-HAP). Once Cd was introduced after the precipitation of CaCO3, up to 99.3% of Cd removal efficiency can be achieved. The SEM elemental mapping of the selected polished Cd-HAP from pure calcite converting in Cd solution showed that Cd was enriched in the near-surface of the crystal, suggesting aqueous Cd was mostly immobilized by the HAP formed in the initial stage of reaction. In the case of As, the immobilization of As was influenced by its valence and initial aqueous concentration. For example, pure calcite and vaterite precipitated in the presence of 2000 ml/L As(III) and As(V), respectively. After conversion, up to 88.2% of As in As-CaCO3 released into the solution resulting in the increase of aqueous As up to 17.5%. The SEM elemental mapping of the selected polished As-HAP converted from As-vaterite after 36 h showed that As was enriched in the core of the crystal, further indicating the release of As during the conversion of As-CaCO3 to As-HAP. On the contrary, As was uniformly distributed in As-HAP converted from pure calcite in As solution, suggesting that aqueous As was immobilized together with phosphate. The dissolution data showed that the conversion of Cd/As-CaCO3 to Cd/As-HAP remarkably reduced the release risk of immobilized Cd/As. In summary, this study demonstrated that the conversion of CaCO3 to HAP is useful to retard the release of immobilized HMs and therefore can reduce its bioavailability. Therefore, the combination of MICP and mineral conversion developed in this study can potentially be used to remediate HMs contaminated soils.
M46f
Copyright © CRC CARE Pty. Ltd., 2019
CleanUp Conference 2019Adelaide, Australia8 –12 September 2019 242
Table of Contentsfor this manuscript

CASE STUDY: REMEDIATION IN THE BIG CITY. BARANGAROO AND THE CHALLENGES
Jessica Hannaford
GHD Pty Ltd, Level 15, 133 Castlereagh Street, Sydney, NSW 2000, AUSTRALIA
BACKGROUND The Barangaroo site is approximately 22 hectares and is located in Sydney’s central business district, NSW. Barangaroo is a former industrial site and there remains contamination from the former Millers Point Gasworks and from landfilling. In 2009, the NSW EPA declared portions of the Barangaroo site as significantly contaminated land under the Contaminated Land Management Act 1997, and are currently subject to a NSW EPA Management Order (the Declaration Area). The Declaration Area represents the main contamination source at the Barangaroo site and is approximately 2.4 hectares. The Declaration Area was occupied by the former Millers Point gasworks between the 1830s and 1920s with multiple occurrences of filling occurring from the 1830s to 1988. Known gasworks infrastructure within the Declaration Area included retort house, gas holders, tar tank, engine house, purifier beds and remnants of abandoned gas holders and tar tanks. Soil and groundwater contamination, including separate phase tar, is known to exist due to the historical filling and the gasworks operations. From mid 1920s, above ground and underground structures were demolished, removed or backfilled (gasholder tanks), and the land backfilled for conversion into wharfs and jetties . From the late 2000s to early 2010s, surface structures were demolished in preparation for future redevelopment. The proposed redevelopment will include mixed land uses, including high-density residential, commercial, and public recreational areas. INTRODUCTION GHD is currently engaged by two remediation contractors to provide remediation and validation consultancy services for the remediation of the Declaration Area at the Barangaroo site. Jessica Hannaford is the GHD project director providing the remediation and validation consultancy to both remediation contractors. OBJECTIVES The key remediation objective is to remediate the Declaration Area so it is suitable for the proposed mixed use development, and to enable the NSW EPA’s declaration/management order to be revoked. APPROACH Investigations identified soil and groundwater contamination including separate phase gasworks waste and tar (SPGWT) due to historical filling and former gasworks operations. The contaminants of concern nominated in RAP (2013) are; SPGWT, lead, TPH, BTEX, PAHs, sulphate and asbestos (in soils) and heavy metals, BTEX, naphthalene, PAHs, phenol, ammonia and SPGWT (in groundwater). The remedial approach has involved the removal/remediation of separate phase gasworks waste and tar to the extent practicable and the removal/remediation of identified confirmed impacted material, to the extent practicable, which is considered to be the source of groundwater contamination. The remediation requires the removal/remediation of contaminated fill material, such that contaminant mass is reduced (on average) by 90% to the extent practicable.
M47a
Copyright © CRC CARE Pty. Ltd., 2019
CleanUp Conference 2019Adelaide, Australia
8 –12 September 2019243
Table of Contentsfor this manuscript

As the remediation and validation consultant, to successfully deliver the works, we recognised a flexible and adaptive approach would be required in order to respond to the dynamic nature of such a complex remediation and redevelopment plan. RESULTS AND DISCUSSION Remediation began in 2017, and while the project is ongoing (completion date 2020), the results so far have indicated the remedial works have met remediation and validation requirements including those defined in the project Remedial Action Plan and Validation Sampling Management Plan. To achieve these successful project outcomes the importance of providing timely and proactive advice to meet the challenges have been paramount for this iconic project. CHALLENGES During the course of delivery, number of both technical and non-technical challenges have been evident. In summary, these have included:
• Involvement of multiple stakeholders and breakdown in communication along formal communication lines.
• Logistics of staged approach with multiple contractors/stakeholders • Impact of project spanning several years. Including;
o managing team fatigue and change of personnel (all stakeholders) o maintaining technical and non-technical consistency.
• Recognition from stakeholders that delays in provision of technical advice can have consequences to the overall development progress.
• Competing stakeholder priorities and timelines. • Complex data management. Project specific database to manage information, view
project data and produce reports, particularly for waste streams. • Remediation and validation scenarios not anticipated in the Remedial Action Plan and
Validation Sampling Management Plan
SUCCESSES During the course of delivery, there have been many successes/wins. In summary, these have been attributed to:
• Committed project teams • Relationships built on trust and transparency between contractors, consultants,
principal and auditor have allowed quick resolution of issues • Proactive approach to challenges faced. Having technically proficient teams who
understanding how to prioritise. • Result of these successes?
o Deliverables on time o Relationships maintained and flourished o Quality maintained (field teams and deliverables)
LESSONS LEARNED The process of remediation is unique for every site. While the remediation and validation process for the Declaration Area has had its challenges, during the presentation we will explore the following lessons learnt:
• The process of remediation is unique for every stage, every portion and every site. • Don‘t underestimate headache of logistics of staging, stakeholder management and
resourcing • Look after your team and stakeholders (and they will look after you) • Foster open communication and transparent knowledge sharing • Remedial approaches (and validation objectives) need consider not only site specific
conditions, but broader influences such as social and political pressures
244
Table of Contentsfor this manuscript

LEGACY CONTAMINATION TO REMEDIATION — MANAGING APPROVALS AND EXPECTATIONS ON A
FORMER GASWORKS SITE
Jarrod Irving
Jemena, 99 Walker Street, North Sydney, NSW, AUSTRALIA [email protected]
INTRODUCTION Former gasworks sites require years of investigation to identify, delineate and determine the best approach to remediate. It is often a long journey from initial investigation phase, through development of a remediation action plan (RAP) to implementation of the selected remedial approach. To facilitate the remediation of the former Goulburn Gasworks in New South Wales, the project team undertook significant engagement and advocacy with a range of government and public stakeholders to successfully achieve the development approval of one of the largest regional remediation projects of 2019. Our experience of the approval process proved drawn-out, and difficult, with complicated and delicate stakeholder management required to facilitate a successful project approval. DISCUSSION Following the finalisation and endorsement of the remedial strategy and approach by the NSW EPA and Site Auditor, a Statement of Environmental Effects (SEE) was developed to support the remediation development application (DA). The DA for the remediation works was required under multiple NSW planning instruments and considerations. Through these, it was interpreted that the local Council would be the determining authority and a reasonable timeframe of a 40 day assessment for DA approval could be assumed. Significant, focussed stakeholder engagement was undertaken to ensure all stakeholders supported and understood both the objectives and methodology required to remediate the project site successfully. The effectiveness of the stakeholder engagement process was confirmed when no objections to the application were made at the completion of the public exhibition. Despite this, the timeline for the approval dragged on for eleven months. This delayed approval was in part due to interpretation of wording within the NSW Environmental Planning and Assessment Act, 1979 (EP&A Act). Following DA submission, the project team was notified that the determining authority for the remediation would be the Southern Joint Regional Planning Panel (JRPP), as the Council had determined that “the development had a council related Capital Investment Value (CIV) over $5 million” – due to the remediation works on the Council owned foreshore. Throughout the stakeholder engagement process it was identified that crucial to the projects approval was providing detailed understanding of the objectives and methodology required to remediate the site. This engagement, however, could not be extended to JRPP, the project team could not directly discuss, contact, co-ordinate, or meet with at any time during the determination process due to NSW Planning Regulations. Without the ability to engage and inform personnel involved in the process, it became evident that parties determining the project would not adequately understand or be confident in the particulars of the application. This became evident when a decision on the development was deferred by the JRPP on the following basis “The Panel are not satisfied that the degree of vegetation loss and the degree of hard surface have been adequately justified by the applicant”; both of which are crucial parts of the works to facilitate the treatment of contaminated soil and the objectives of the long term management of the site.
M47b
Copyright © CRC CARE Pty. Ltd., 2019
CleanUp Conference 2019Adelaide, Australia
8 –12 September 2019245
Table of Contentsfor this manuscript

CONCLUSIONS Given the overall environmental benefit of the project and confidence in the remedial and long term management approach from the NSW EPA and appointed Site Auditor the approval process for the remediation of the former Goulburn Gasworks should have been completed within a reasonable timeframe. However, this project was affected by unintended consequences of the NSW Planning Scheme, whereby, an inability to engage, inform and educate stakeholders, specifically the JRPP, in understanding both the objectives and methodology of the remediation increased the approval process from a standard 40 days to over eleven months. It is critical to manage expectations and understanding of large scale remediation projects, the DA process undertaken for this project has demonstrated that complex projects require engagement to inform and educate stakeholders in order to reduce potential bottlenecks getting from investigation to remediation
246
Table of Contentsfor this manuscript

REMEDIATION OF PAHS CONTAMINATION IN AN AGED GASWORKS SITE SOIL USING SURFACTANT AND OXIDANTS
Monica Esposito1, Luchun Duan1,2, Cheng Fang1, Dawit Bekele1,2, Ravi Naidu1,2
1Global Centre for Environmental Remediation (GCER) and
2CRC for Contamination Assessment and Remediation of the Environment (CRC CARE) ATC Building, the University of Newcastle, NSW 2308
INTRODUCTION Polyaromatic hydrocarbons (PAHs) comprise a group of over 100 different chemicals that are produced during the incomplete burning of fuels, garbage or other organic substances such as tobacco, plant material or meats. PAHs contaminated sites are of global concern since they are toxic, mutagenic and carcinogenic. These contaminants may be strongly sorbed to soil organic matter and hardly degrade. Former gasworks sites are often considered as principle PAHs hotspots compared to all other industrial sites. There are many gasworks sites worldwide, potentially posing risks to human health and environment (Kuppusamy, 2017). In situ chemical oxidation (ISCO) for PAHs can be a fast and cost-effective approach for remediation of such contaminated sites. Nonetheless, efficacy of this technology may be constrained by PAH solubility since oxidation reactions primarily occur in aqueous phase (Wang, 2013). Therefore, including surfactant in ISCO (surfactant-enhanced chemical oxidation, ISCO-S) may overcome this limitation and improve the remediation performance (Dugan, 2010). However, certain studies suggest that additional surfactant may consume extra oxidant hence reduce the efficacy of PAH removal (Miguel, 2018). This study evaluated the efficacy of both ISCO and (ISCO-S), in which different oxidants and dose rate were tested for remediation of PAHs in an aged gasworks site soil. METHODS Experiments were conducted in a batch study. Each treatment was performed using 3g soil and a 10mL oxidant/activator solution in duplicate. In ISCO-S, 15g/L plant oil-based surfactant was included in the system. For both ISCO and (ISCO-S) approaches, four oxidant treatments were investigated – Fenton’s reagent, potassium permanganate, sodium persulfate with activation (by ferrous sulfate) and without activation. Three oxidant doses (stoichiometric molar requirement) were tested based on complete oxidation demand for the total organic carbon (TOC) in the soil slurry system to change into CO2 and H2O. PAHs in soils before and after the treatment were extracted by Accelerated Solvent Extraction (ASE) using acetone/dichloromethane (1:1, v/v) and quantified by gas chromatography and mass spectrometry (GC-MS). RESULTS AND DISCUSSION
Table 1. Basic properties and total PAH content of the gasworks site soil. Parameters Results
Soil texture Sandy Loam TOC content 6.4 %
Natural Iron content 10.4 % Total PAH 3,079 mg/kg
Desorption rate by water (control) 0.4% Desorption rate by surfactant (control) 10%
PAHs removal rate was positively correlated with an increase in oxidant dose (Data not shown). The best performance was achieved using potassium permanganate in the absence of surfactant (ISCO). Figure 1 showed total PAHs removal rate by ISCO and ISCO-S using different oxidants at the same oxidant dose that is equivalent to 50%
M47c
Copyright © CRC CARE Pty. Ltd., 2019
CleanUp Conference 2019Adelaide, Australia
8 –12 September 2019247
Table of Contentsfor this manuscript

degradation of TOC (TOC/2). Except for potassium permanganate, addition of the surfactant had little effect on the efficacy of PAH remediation. The highest PAH removal rate was about 91.6% in ISCO and 78.1% in ISCO-S, respectively, when potassium permanganate was used. PAH removal by sodium persulfate without activation was equal or similar to its activated systems, at approximately 60% dose TOC/2 (for both ISCO and ISCO-S systems with and without activation). This indicates that the addition of ferrous sulfate was not critical in this specific soil. XRF elemental composition shows the presence of about 10% iron which may be the reason why additional activator was not needed. The PAH removal rate using Fenton’s reagent treatment was limited (maximum at 22% in ISCO and 25% in ISCO-S, at the highest oxidant dose =TOC/2). This might be due to it is highly reactive and constraint to react with dissolved organic carbon as the soil containing high TOC and PAHs mainly sorbed to the solid phase.
22.0 24.6
91.6
78.1
57.060.956.7 58.4
0.0
20.0
40.0
60.0
80.0
100.0
FR PP ASP SP FR PP ASP SP
Tota
l PA
HS
Rem
oval
Rat
e (%
) by
ISC
O a
nd IS
CO
-S
(ISCO) (ISCO-S)
Fenton's Reagent (FR) Potassium Permanganate (PP)Activated Sodium Persulfate (ASP) Unactivated Sodium Persulfate (SP)
Fig. 1. Total PAHs removal rate by ISCO and ISCO-S using different oxidants at a same oxidant dose that equivalent to degrade 50% of TOC (TOC/2). CONCLUSIONS PAHs removal rate was positively correlated with increase in the oxidant dose in the soil-slurry system. The most effective remediation approach was using potassium permanganate without surfactant (ISCO) – PAH removal rate at 91.6%. While in the systems with surfactant (ISCO-S), the PAH removal rate was reduced dramatically to 78.1%. Except for potassium permanganate, degradation efficiencies between the two systems were similar for the remaining oxidants. Activation of sodium persulfate by ferrous sulfate treatments is not needed as the soil contains large amount of iron. PAH removal rate for sodium persulfate was up to 60%. The PAH removal rate of Fenton’s reagent was limited (up to 25% for both ISCO and ISCO-S approaches). This could be due to its strong and rapid reaction with the soil containing high TOC. REFERENCES Kuppusamy, S., Thavamani, P., Venkateswarlu, K., Lee, Y. B., Naidu, R. & Megharaj, M.
(2017). Remediation approaches for polycyclic aromatic hydrocarbons (PAHs) contaminated soils: Technological constraints, emerging trends and future directions. Chemosphere, 168, 944-968.
Wang, W. H., Hoag, G. E., Collins, J. B. & Naidu, R. (2013). Evaluation of Surfactant-Enhanced in Situ Chemical Oxidation (S-ISCO) in Contaminated Soil. Water, Air, & Soil Pollution, 224, 1713.
Dugan, P. J., Siegrist, R. L. & Crimi, M. L. (2010). Coupling surfactants/cosolvents with oxidants for enhanced DNAPL removal: A review. Remediation Journal, 20, 27-49.
Miguel, L., David, L., Arturo, R. & Aurora, S. (2018). Remediation of soil contaminated by PAHs and TPH using alkaline activated persulfate enhanced by surfactant addition at flow conditions. Journal of Chemical Technology & Biotechnology, 93, 1270-1278.
248
Table of Contentsfor this manuscript

TREATMENT OF HEAVILY IMPACTED GROUNDWATER FROM FORMER MILLERS POINT GASWORKS
Sagar Adhikari, Nick Cowman
Enviropacific Services Pty Ltd, Level 5, 123 Epping Rd., Macquarie Park, NSW, AUSTRALIA
[email protected], [email protected]
INTRODUCTION Up to 2 million litres of heavily impacted groundwater was treated and released to the harbour each day throughout the remediation of the former Millers Point Gasworks. Extensive multi-phase physio-chemical treatment and verification was undertaken to comply with the strictest, modified ANZECC criteria. Such that permissible treated water discharge concentrations were below that of the Sydney drinking-water quality and global WHO drinking water standards. This has been the ensuing reality during the remediation of the Former Millers Point gasworks, located on the western peninsula of the Sydney Central Business District (CBD). The remediation and revitalisation of the peninsula now known as Barangaroo is arguably the largest remediation undertaking in Sydney since the Rhodes Peninsula redevelopment some 15 years ago. FOCUS OF PRESENTATION The reality of managing and treating groundwater inflows in a basement and remediation excavation project extending to 25m below ground, to a depth of -22 reduced level (RL) Australian Height Datum (AHD) immediately adjoining Sydney Harbour. The extensive process undertaken to design, assess, guarantee, construct, operate and maintain a water treatment plant treating up to 90m3/ hour of contaminated gasworks, sediment laiden construction waters. The results, the learnings and achievements by the collective project team with many vested stakeholders including a state-government development authority, in making it a successful project. THE CHALLENGE The Former Millers Point gasworks has been extensively investigated for more than 10 years. With over 1,500 soil and water samples having been collected there was a large dataset to formulate the treatment plant design baseline. Described as a cocktail of contaminants, the groundwater results indicated contaminants for treatment included ammonia, cyanide, varying hydrocarbons including PAHs and VOCs, very high suspended solids, salinity, wide ranging metals, free phase oils and many other impurities. On-site the need for the plant to have no less than 98% run time, have all but 100% in-built system redundancy and situated within in a small footprint all complicated the design process. Commercially the client required project and delivery certainty, limiting the project commercial structure, mandating the system guarantee or warrant its process and effectiveness. THE SYSTEM DESIGN Using a physio-chemical process the system was designed, independently reviewed, extensively risk assessed, verified and third-party certified during the process prior to the global procurement of the plant and assembly on-site. The system had a 1 million litre (ML) storage capacity or flow balance tank. This would alleviate the potential volume surges associated with the nature of remediation excavations being undertaken. Given the location of the site within the Sydney CBD, all plant gases and condensate generated during the process were captured, treated with via activated carbon beds and discharged through a licensed, real-time monitored outlet. The whole water and air treatment process will be presented in full. The removed solids/ sludges, highly concentrated with both organic and in-
M47d
Copyright © CRC CARE Pty. Ltd., 2019
CleanUp Conference 2019Adelaide, Australia
8 –12 September 2019249
Table of Contentsfor this manuscript

organic contamination were pressed, dried and managed on-site prior to licensed disposal. The smart-technology invested into the plant was that of a highly engineered system. With the ability for full-time remote operation, real-time water quality monitoring and automated programmed logic system shutdowns the plant could self-protect the environment and project users from harm. THE PROJECT EXECUTION Even the slightest impurity would trigger a non-compliant discharge. With discharge limits lower than supplied Sydney drinking water, this would pose a challenge for trace level discharge compliance. This was further complicated by using supplied drinking water for treatment dilution purposes. Construction and operation within a 6 day-week construction environment meant even Sunday was not a day for rest. In a congested environment surrounded by many other construction contractors effective site logistics was a daily must. Yet through robust design and engineering the plant and team exceeded expectations and delivered as expected. THE ENVIRONMENTAL OUTCOMES In operation for over 2 years the plant has protected the delicate ecosystem of Sydney Harbour from chemical damage and harmful destruction. The plant has protected the atmosphere from volatile gases generated during the treatment process. The plant has also maintained its reporting requirements for not only the Barangaroo development team, but the NSW EPA as the regulating authority. THE REALITIES DISCOVERED There were many! Albeit some typical construction challenges, others more educational and specific to the site conditions experienced. Due to the complex nature of the project, the unknowns associated with remediation meant many were unforeseeable. Design and process governance were key mitigators in ensuring the plant achieved its objectives. CLOSING A position and perspective have been formed thanks to the ability to interrogate the project outcomes and analyse the data collected over the last 2 years. It enables industry to learn further about semi-permanent water treatment design in a fast-paced construction landscape. The Barangaroo development is already being enjoyed by many users, oblivious to the continuous dewatering of the 20m + deep adjoining harbourside excavation and remediation project. A true indicator of the projects ability to protect both humans and the environment.
250
Table of Contentsfor this manuscript

CAN THE GASTROINTESTINAL MOBILISATION OF PAH NONEXTRACTABLE RESIDUES FROM SOILS RESULT IN
UNACCEPTABLE CANCER RISKS?
Anthony C. Umeh1,2, Luchun Duan1,2, Monica Esposito1,2, Ravi Naidu1,2, Kirk T. Semple3
1Global Centre for Environmental Remediation (GCER), University of Newcastle, Callaghan, NSW 2308, AUSTRALIA
2Cooperative Research Centre for Contamination Assessment and Remediation of the Environment (CRC CARE), University of Newcastle, Callaghan, NSW 2308, AUSTRALIA
3Lancaster Environment Centre, Lancaster University, Lancaster, LA1 4YQ, UK [email protected]
INTRODUCTION Information on the release of soil-borne nonextractable residues (NERs) of polycyclic aromatic hydrocarbons (PAHs) in the human gut fluid is sparse. Studies that directly investigate the gastrointestinal mobilisation of PAH NERs and associated health are important, as they help to minimise the uncertainties associated with the risk assessment of soil-borne PAH NERs in soils, following exposure by humans. In addition, such studies will provide critical experimental data that supports decision-making for risk-based approaches to contaminated land management, particularly during human health risk assessments. Here, we studied the gastrointestinal mobilisation of 6 carcinogenic PAHs (Carc.PAHs) from manufactured gas plant (MGP) site soils containing only PAH NERs, and estimated the associated incremental lifetime cancer risks. METHODS Four MGP soils collected from Australia were air-dried and sieved to pass through a 250 µm stainless steel sieve. The soils, Bl, F, G, and ML were sandy-clay-loam (29% clay and 4% total organic carbon), sandy-clay (37 and 39% clay, and 1 and 2% total organic carbon), and sandy-loam (0.6% clay and 6% total organic carbon), respectively (USDA textural classification). Aliquots (n = 3) of the soils were first subjected to a physiologically based extraction test (PBET) incorporating a silicone-rod (Si-Org-PBET) as a sink for PAHs. To assess the release of PAH NERs by the in vitro gut fluid, another aliquot (n = 3) of soils was exhaustively extracted with dichloromethane/acetone (1:1, v/v) to obtain soils containing only NERs, prior to Si-Org-PBET which was conducted before and after re-equilibration of the pre-extracted soils. The extracts were cleaned up through a column packed with silica gel (5% deactivated), alumina (5% deactivated), and sodium sulphate, prior to GC-MS analysis. RESULTS AND DISCUSSION The total-extractable concentrations of the individual Carc.PAHs ranged from 0.7 ± 0.2 – 277.8 ± 20.7 mg/kg depending on soil-PAH physicochemical properties (Fig. 1A – D), with BaP constituting approximately 31 to 39% of ∑6Carc.PAHs. The ∑6Carc.PAHs concentration before BaP toxic equivalence quotient (TEQ) conversion ranged from 43.2 ± 6.3 – 706.0 ± 92.8 mg/kg (Fig. 1A – D), and ranged from approximately 17 – 348 mg/kg based on BaPTEQ (Fig. 1A – D). This BaPTEQ range was approximately 6 – 116 times greater than the Australian health investigation levels (HIL) of 3 mg/kg. The amounts of each Carc.PAHs that were mobilized by Si-Org-PBET were generally smaller than the total-extractable amounts. Only approximately 24 – 36% of the total-extractable BaPTEQ were orally bioaccessible (approximately 4 – 127 mg/kg). While this corresponds to a BaPTEQ decrease of approximately 64 to 76%, BaP HIL was still exceeded, particularly for the highly contaminated soil Ml. An oral bioaccessibility of 6 – 55% for kindergarten soil and wood soot has also been reported (Gouliarmou et al., 2013). In contrast, the amounts of BaPTEQ mobilized from the PAH NERs did not generally exceed the BaP HIL (Fig. 1E – H).Overall,
M47e
Copyright © CRC CARE Pty. Ltd., 2019
CleanUp Conference 2019Adelaide, Australia
8 –12 September 2019251
Table of Contentsfor this manuscript

associated cancer risks from the mobilised PAH NERs were within acceptable range (≥ 10-6) (Figure 2).
Figure 1. Total-extractable and Si-Org-PBET mobilized PAHs and PAH nonextractable residues from MGP soils. The red horizontal line indicate BaP HIL (3 mg/kg) in Australia.
Figure 2. Acceptable levels of incremental lifetime cancer risks from the incidental ingestion of MGP soils containing PAH nonextractable residues. CONCLUSION Gastrointestinal mobilisation of ingested PAH nonextractable residues in long-term PAH-contaminated soils is unlikely to exert unacceptable levels of cancer risks, as the residues are highly sequestered, and do not need to be considered in human health risk assessments. REFERENCES Gouliarmou, V., Collins, C.D., Christiansen, E. and Mayer, P. (2013). Sorptive physiologically
based extraction of contaminated solid matrices: Incorporating silicone rod as absorption sink for hydrophobic organic contaminants Environ. Sci. Technol. 47:941-948.
0.0
15.0
30.0
45.0
60.0Sandy-clay-loam soil Bl
PAH
Con
cent
ratio
n (m
g/kg
)
A
--
0.0
15.0
30.0
45.0
60.0B
Total-extractable Si-Org-PBET extractable
Sandy-clay soil F
--
0.0
15.0
30.0
45.0
60.0C Sandy-clay soil G
--
0.0
150.0
300.0
450.0
600.0
750.0D Sandy-loam soil Ml
--
BaA ChrBbkFBaP DbAIcdP ∑6 BTEQ BaA ChrBbkFBaP DbAIcdP ∑6 BTEQ
0.0
1.0
2.0
3.0
4.0 E Sandy-clay-loam soil Bl
--
0.0
1.0
2.0
3.0
4.0 F Sandy-clay soil F
Si-Org-PBET extractable (before REQ) Si-Org-PBET extractable (after REQ)
--
BaA Chr BbkFBaP DbAIcdP ∑6 BTEQ0.0
1.0
2.0
3.0
4.0 G Sandy-clay soil G--
BaA Chr BbkFBaP DbAIcdP ∑6 BTEQ0.0
5.0
10.0
15.0H Sandy-loam soil Ml
--
252
Table of Contentsfor this manuscript

REMEDIATION BY PERMANGANATE IN SITU CHEMICAL OXIDATION OF A MANUFACTURED GAS PLANT SITE IMPACTED
BY POLY AROMATIC HYDROCARBONS (PAHs)
Lorenzo Sacchetti, Jordi Aragones
Carus Europe S.L., C/Rosal 4, Oviedo 33099 SPAIN [email protected]
INTRODUCTION During the 1800s, towns and cities across the world made their own fuel for lighting and heating. The fuel was produced at a manufactured gas plant (MGP). This fuel was used for heating purposes and to light the home, business and street lamps. To manufacture the fuel, coal and other ingredients were heated in large brick ovens. As the coal was heated, it produced a gas. The gas was filtered from the ovens and stored in tanks. The gas was then used as fuel throughout a community. Coal was discovered early in the colonisation of Australia and Sydney inaugurated Australian manufactured gas in 1836 followed by Melbourne in 1856. The major Australian cities received their gas plants by the mid-1860s. Hobart Tasmania began generating coal gas in 1857. New Zealand was producing manufactured gas in 1862. Many MGPs were abandoned when use of natural gas was cheaper and eventually demolished. However, waste and contamination from MGPs still pose an environmental and public health concern. Why be concerned about wastes from an MGP? Manufacturing gas from coal generated a lot of waste. Typically, the coal waste was dumped in nearby ravines, ditches or used as fill for construction projects. Today much of the waste is found to be hazardous. The waste includes cyanides, metals, solvents and oily tars. The oily tars are made of organic chemicals called polycyclic aromatic hydrocarbons (PAHs). PAHs commonly found at MGP wastes are may also cause cancer in humans. We will present an ISCO case study of an European MGP including laboratory trails and full scale treatment. METHODS Soil and groundwater samples were collected from the site by continuous coring and conventional groundwater sampling. Three ISCO reagents (non-activated persulfate, activated persulfate and RemOx® S remediation grade potassium permanganate) with different doses have been used to test samples for: Natural Oxidant Demand (NOD), Contaminants of Concerns (CoCs: TPH, PAH, Aromatics, Heavy metals) and CoCs oxidation. Trials were carried out in microcosm for a period of 28 days. Figure 1 shows treatment results for TPH C12-C16. On the basis of the results the final ISCO reagent has been selected and used for full scale treatment. Site closure still ongoing. RESULTS AND DISCUSSION Laboratory trials identified groundwater impact by TPHs (10,000-60,000 μg/l), TPHs (3,000-5,500 μg/l) and PAHs (3,000-11,000 μg/l mainly Naphtalene and 2-Methylnaphthalene). The lower NOD level was obtained for RemOx® S remediation grade potassium permanganate with values ranging from 2.45 to 23.01 g /kg soil depending on RemOx® S dose. Best CoCs treatment effectiveness was observed for RemOx® S with removal effectiveness ranging from 80 to 99.99% with no or minor rebound. Activated persulfate systems showed significative rebound after 8-10 days (in particular for TPHs C>10, and PAHs), this rebound was less important for non-activated persulfate systems. In particular RemOx® S was able to treat all aromatics including Benzene (radicals formation?), all TPHs in less than 4 days with reduction from 4,000 to >10 µg/l and all PAHs.
M47f
Copyright © CRC CARE Pty. Ltd., 2019
CleanUp Conference 2019Adelaide, Australia
8 –12 September 2019253
Table of Contentsfor this manuscript

Fig. 1. Laboratory treatment results for TPH C12-C16
Results have been used for full scale design of a RemOx® S ISCO project in an area of about 25,000 m3 with treatment thickness of 11 m. In the area RemOx® S was dissolved in water and ISCO solution was injected by a group of 2 to 6 direct push machines. All fieldworks have been completed in a 12 month timeframe with the injection of a volume of over 3,000 m3 of 3% RemOx® S solution. Concentrations of PAHs in groundwater dropped below detection limit (1 µg/l) in most monitoring wells and risk based residual concentration have been achieved. Monitoring is still ongoing and site closure is expected by July 2019. CONCLUSIONS Laboratory trials and full scale works clearly demonstrated that Potassium Permanganate can be successfully used for the treatment of abandoned MGP sites. In particular RemOx® S remediation grade potassium permanganate has been able to:
• Treat TPHs and PAHs down to site specific risk based limits with over 99% concentration reduction in short timefrme (less than 5 days according to laboratory data)
• Treat Aromatics including Benzene with possible radicals formation • Avoid long term rebound due to persistence (much higher than activated or non-
activated persulfate systems) • Increase site safety (permanganate is less aggressive than persulfate).
REFERENCES Siegrist R, et al. (2011) ISCO Handbook. Springer New York, NY. 678p. Castegnaro, M.; Coombs, M.; Phillipson, M. A.; Bourgade, M. C.; Michelon, J. (1983) The
use of potassium permanganate for the detoxification of some PAH contaminated wastes. Int. Agency Res. Cancer, Lyon, Fr. Editor(s): Cooke, Marcus; Dennis, Anthony J. Polynucl. Aromat. Hydrocarbons, Int. Symp. 257-68. Publisher: Battelle Press, Columbus, Ohio
254
Table of Contentsfor this manuscript

A NOVEL FRAMEWORK TO IDENTIFY, PREDICT AND IMPROVE THE EFFICIENCY OF BIOREMEDIATION
Ramesha H. Jayaramaiah1, Eleonora Egidi1,2, Catriona A. Macdonald1, Thomas C. Jeffries2,3,
Megharaj Mallavarapu4, Brajesh K. Singh1,2
1Hawkesbury Institute for the Environment, Western Sydney University, Penrith, AUSTRALIA 2Global Centre for Land-based Innovation, Western Sydney University, Penrith, AUSTRALIA
3School of Science, Western Sydney University, Penrith, AUSTRALIA 4GCER, University of Newcastle, Callaghan AUSTRALIA
INTRODUCTION Chemical contamination of natural and agricultural habitats is an increasing global concern and a major threat to the sustainability and human wellbeing (Jeffries et al., 2018). Intensive industrialization, inadequate disposal, and leaks of organic compounds have resulted in long- term persistent sources of contamination of soil and groundwater (Rayu et al., 2012). Currently, an efficient approach to remediate polycyclic aromatic hydrocarbons (PAHs) is lacking but bioremediation (use of plant and soil microbes) is considered technically feasible and cost-effective. However, to successfully implement bioremediation, a better understanding is needed to identify the most appropriate bioremediation approach (e.g. bioaugmentation or biostimulation), and to predict their efficiency with or without external (organic or inorganics) inputs. This study aims to quantify the relative importance of microbial diversity, growth of native plants, and common soil amendments in increasing the efficiency of PAHs remediation in low nutrient Australian soils. METHODS A mesocosm experiment was designed to investigate the ability of two contrasting soil nutrient amendments (organic and inorganic fertilizers), and two Australian widespread native C3 (Rhytidosperma sp., winter growing) and C4 (Dichanthium sp. summer growing) grasses with known phytoremediation abilities (Sivaram et al., 2018a, 2018b), to facilitate the PAHs removal rate from soil. RESULTS AND DISCUSSION Preliminary results suggest that a strong pyrene effect on plant growth on both C3 and C4 plants (one-way ANOVA, F=5.938), with an overall growth reduction of 25 and 35%, respectively, between treated and non-treated soils (Fig. 1). The overall pyrene degradation after 4 weeks showed similar rates of degradation between low and high diversity soils (26.4 and 26.5%, respectively) (Fig. 2). While the presence of plants slightly increased the average degradation rate (27% in soils with plants vs 25% in soils without plants). Interestingly, among the treatments, the organic fertilizer application showed the highest average rate of degradation (31%, vs 25% and 26% in inorganic fertilizer and untreated soils, respectively (Fig. 2); indicating an overall positive effect of organic inputs on the bioremediation process. CONCLUSIONS The present study shows the effects of pyrene stress on plants and the influence of plants on pyrene degradation rate. Overall, this work allows us for the identification of key predictors of the bioremediation efficiency and novel approaches to improve the degradation rates. REFERENCES Jeffries, T.C., Rayu, S., Nielsen, U.N., Lai, K., Ijaz, A., Nazaries, L., Singh, B.K. (2018)
Metagenomic functional potential predicts degradation rates of a model organophosphorus xenobiotic in pesticide contaminated soils. Front. Microbiol. 9:147.
M47g
Copyright © CRC CARE Pty. Ltd., 2019
CleanUp Conference 2019Adelaide, Australia
8 –12 September 2019255
Table of Contentsfor this manuscript

Rayu, S., Karpouzas, D.G., Singh, B.K. (2012) Emerging technologies in bioremediation: constraints and opportunities. Biodegradation 23:917–926.
Sivaram, A.K., Logeshwaran, P., Lockington, R., Naidu, R., Megharaj, M., 2018a. Impact of plant photosystems in the remediation of benzo[a]pyrene and pyrene spiked soils. Chemosphere 193:625–634.
Sivaram, A.K., Logeshwaran, P., Subashchandrabose, S.R., Lockington, R., Naidu, R., Megharaj, M., 2018b. Comparison of plants with C3 and C4 carbon fixation pathways for remediation of polycyclic aromatic hydrocarbon contaminated soils. Sci. Rep. 8:2100.
Fig. 1. Boxplot showing average plant height for both C3 and C4 plants across treatments and soil type. Error bars indicate SE. HDS= high diversity soil, LDS= low diversity soil.
Fig. 2. Boxplot showing average pyrene degradation rate across treatments, plants, and soil type. Error bars indicate SE. HDS= high diversity soil, LDS= low diversity soil, U = no pyrene; P= pyrene, F = inorganic fertilizer, C= organic fertilizer, UU= no plant and no pyrene.
256
Table of Contentsfor this manuscript

INFLUENCE OF SOIL PROPERTIES AND PLANT SPECIES ON PFASs BIOACCUMULATION
Siyuan Liu, Luchun Duan, Ravi Naidu
Global Centre for Environmental Remediation (GCER) and
CRC-Contamination Assessment and Remediation of Environment (CRC CARE), ATC Building, the University of Newcastle, NSW 2308, AUSTRALIA
INTRODUCTION Perfluorinated compounds (PFCs), especially the poly- and perfluorinated alkyl substances (PFASs), have drawn a lot attention due to their wide detection in the environment, wildlife, humans (Buck, 2011) and community outrage. PFASs are a family of chemical compounds composed of a carbon chain that can be linear or branched, and fully or partially fluorinated. They show high thermal, chemical and biochemical stability due to the strength of the carbon-fluorine bond (Renner, 2003). The characteristics that low aqueous surface tension and amphiphilic behaviour lead to their extensive use in surfactants, fire-fighting foams, food packing paper, textile, carpet and leather crafts since 1950s (Ghisi, 2018). Due to their sustainability and potential to be bioaccumulated in biota, recent research has focused intensively on their toxicity. It is also recognised that environmental background concentrations of PFASs, that influence the degree of contamination in food and water are the major source of human intake (Bizkarguenaga, 2016). As good is one of the major pathways of human exposure, the proposed study and this paper focusses on the influence of soil properties on PFASs bioaccumulation to different edible plant species. Bioconcentration factor (BAF) of three main PFCs (PFOS, PFOA and PFHxS) in the edible parts of three different plant species (spinach, lettuce and tomato) will be investigated using long-term field contaminated soils from six PFCs contaminated site. The relationship between soil properties, PFAS intensity and quantity factor would be examined using statistical analyses. THE APPROACH TO THE STUDY The following figure presents a conceptual model of the proposed study that examines three components: (i) contaminated soil including PFAS intensity and quantity factor; (ii) plant growth and (iii) analyses of root, tops and shoot. Plant species under study include: spinach (Spinacia oleracea L.), lettuce (Lactuca sativa Linn.) and tomato (Lycopersicon esculentum Mill.)) using six field PFCs contaminated soils.
Fig.1 Conceptual Model of experiment design
M51-P1
Copyright © CRC CARE Pty. Ltd., 2019
CleanUp Conference 2019Adelaide, Australia
8 –12 September 2019257
Table of Contentsfor this manuscript
RESULTS Literature shows bioaccumulation of PFAS by plants although there are limited studies focussing on common vegetables, the present study aims to address this gap. EXPECTATED OUTCOME BASED ON HYPOTHESES BEING TESTED
• Soil TOC content may have a negative impact on plant BCF due to the protein-philia of PFOA and PFOS.
• CEC is expected to have a negative correlation with plant BCF. • Spinach may have a higher BCF for PFOS than other PFASs. • PFOS mainly presented in roots while PFOA distribution depended on plant species. • Tomato is likely to have a lower BCF for long chain PFASs while lettuce heart may
have a higher BCF than leaves.
REFERENCES BUCK, R. C., FRANKLIN, J., BERGER, U., CONDER, J. M., COUSINS, I. T., DE VOOGT,
P., JENSEN, A. A., KANNAN, K., MABURY, S. A., VAN LEEUWEN, S. P. J. I. E. A. & MANAGEMENT 2011. Perfluoroalkyl and polyfluoroalkyl substances in the environment: terminology, classification, and origins. 7, 513-541.
RENNER, R. 2003. Concerns over common perfluorinated surfactant. ACS Publications. GHISI, R., VAMERALI, T. & MANZETTI, S. J. E. R. 2018. Accumulation of perfluorinated
alkyl substances (PFAS) in agricultural plants: A review. BIZKARGUENAGA, E., ZABALETA, I., MIJANGOS, L., IPARRAGUIRRE, A., FERNANDEZ,
L., PRIETO, A. & ZULOAGA, O. J. S. O. T. T. E. 2016. Uptake of perfluorooctanoic acid, perfluorooctane sulfonate and perfluorooctane sulfonamide by carrot and lettuce from compost amended soil. 571, 444-451
258
Table of Contentsfor this manuscript

BIOCHAR APPLICATION EFFECTS ON SOME MAIZE GROWING SOILS OF BIHAR
Anshuman Kohli, Yanendra K. Singh, Jajati Mandal, Swati Kumari, Kumar R. Raj
Department of Soil Science and Agricultural Chemistry, Bihar Agricultural University, Sabour,
Bhagalpur, Bihar 813210, INDIA [email protected]
INTRODUCTION Maize is being extensively cultivated in Bihar and the fact that it is a nutrient exhaustive crop cannot be ignored. The use is of recalcitrant char (biochar) is advocated for application to soil in order to enhance soil fertility and sequestering carbon. Biochar differs from other soil organic carbon pools in respect of very slow decomposition in soil but physio-chemically provides soil services similar to organic matter like stable aggregate formation, water and nutrient retention (Atkinson et al., 2010; Downie et al., 2009). As a result, once applied to soil, biochar may directly supply plant available nutrients (Gaskin et al., 2007). But still it is uncertain that nutrients are released over time or instantly (Sohi et al., 2010). As an initiative, laboratory incubation study of 45, 90 and 135 days was conducted on three different soils treated @10 and 20 t ha-1 biochar with the objective to evaluate the effect of biochar application on soil properties and leaching of nutrients. METHODS Laboratory incubation studies were conducted to evaluate the effect of biochar application on soil properties and leaching of nutrients. Biochar produced by low temperature pyrolysis (250-300oC) of maize stones was added to three maize growing soils varying in texture and organic carbon @ 10 t ha-1 and 20 t ha-1 and incubated for a period of 45, 90 and 135 days along with a control. Each column was leached with an equivalent of 1000 mm water on a pro-rata basis for a period of four and half months at weekly intervals. RESULTS AND DISCUSSION The characteristics of the biochar used in the study are presented in table 1. Biochar application @ 20 t ha-1 had better effect on nutrient availability and retention than biochar application @ 10 t ha-1. The pH and EC of the soil increased with the addition of biochar. The cation exchange capacity (CEC) of biochar amended soil increased with incubation period in all the soils. Top soil retained greater amounts of P, K and Zn up to 45 and 90 days of incubation than the sub soil upon treatment with biochar. The concentration of other micronutrients Fe, Mn and Cu was lower in top soil than the sub soil. The organic carbon (OC) content of soil increased initially with added biochar but a decrease in OC was also found with incubation. Table-1: Characteristics of maize stone biochar produced by low temperature pyrolisys.
Properties Value (± SD) pH (1:5) 5.23 Electrical Conductivity (1:5) 2.01dS m-1 Available N 11 ppm Available P2O5 537.7 ppm Available K2O 2311 ppm DTPA extractable Fe 51.12 ppm DTPA extractable Cu 0.76 ppm DTPA extractable Mn 14.68 ppm DTPA extractable Zn 4.96 ppm Cation exchange Capacity (CEC) 63.42 meq/100g Maximum water holding capacity 19.1%
M51-P2
Copyright © CRC CARE Pty. Ltd., 2019
CleanUp Conference 2019Adelaide, Australia
8 –12 September 2019259
Table of Contentsfor this manuscript

CONCLUSIONS Biochar produced at low temperature significantly improved the soil chemical properties. The ability of biochar to increase the pH of soil can be used to amend the maize growing soils which are developing acidity due to use of nitrogenous fertilizer. The enhanced cation exchange capacity of soil with addition of biochar can be useful in retaining nutrients added through fertilizer application. Compared to control, the biochar treated soil retained more macro and micronutrients. The content of P, K and Zn in the top soil was greater than the sub soil indicating higher nutrient retention capacity of biochar. The micronutrient content of the soil increased with the addition of biochar but the effect of soil biochar interaction on micronutrient availability requires further investigations. Biochar was found to positively affect the chemical properties of maize growing soils and the change in pH due to biochar addition influenced the nutrient availability of these soils. REFERENCES Atkinson, C. J., Fitzgerald, J. D. and Hipps, N. A. (2010). Potential mechanisms for achieving
agricultural benefits from biochar application to temperate soils: a review. Plant Soi., 337: 1-18. DOI 10.1007/s11104-010-0464-5.
Downie, A., Crosky, A., Munroe, P. (2009). Physical properties of biochar. Chapter 2. In: Lehmann J, Joseph S (eds) Biochar for environmental management science and technology. Earthscan, London, pp: 13-32.
Gaskin, J.W., Speir, A., Morris, L.M., Ogden, L., Harris, K., Lee, D., Das, K.C. (2007). Potential for Pyrolysis Char to Affect Soil Moisture and Nutrient Status of a Loamy Sand Soil. Georgia Water Resources Institute. pp: 67-78.
Sohi, S.P., Krull, E., Lopez-Capel, E. and Bol, R. (2010). A review of biochar and its use and function in soil. Adv. Agron. 105: 47-82.
260
Table of Contentsfor this manuscript
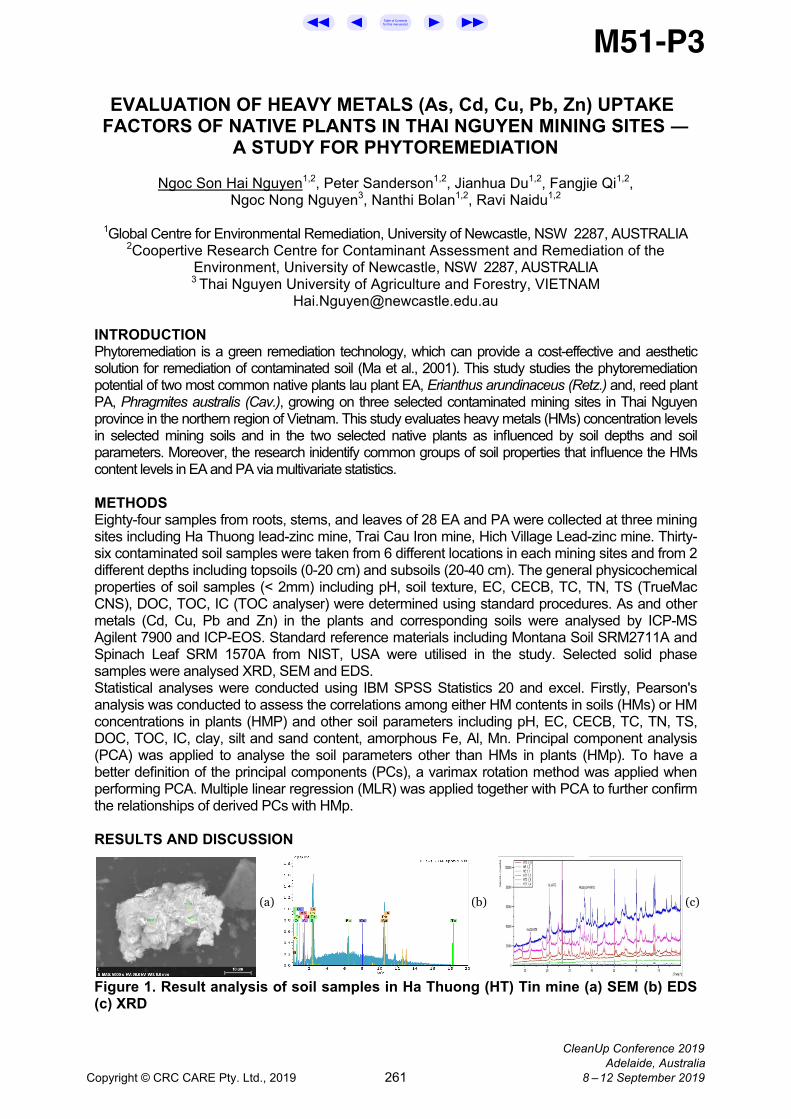
EVALUATION OF HEAVY METALS (As, Cd, Cu, Pb, Zn) UPTAKE FACTORS OF NATIVE PLANTS IN THAI NGUYEN MINING SITES ―
A STUDY FOR PHYTOREMEDIATION
Ngoc Son Hai Nguyen1,2, Peter Sanderson1,2, Jianhua Du1,2, Fangjie Qi1,2, Ngoc Nong Nguyen3, Nanthi Bolan1,2, Ravi Naidu1,2
1Global Centre for Environmental Remediation, University of Newcastle, NSW 2287, AUSTRALIA
2Coopertive Research Centre for Contaminant Assessment and Remediation of the Environment, University of Newcastle, NSW 2287, AUSTRALIA 3 Thai Nguyen University of Agriculture and Forestry, VIETNAM
INTRODUCTION Phytoremediation is a green remediation technology, which can provide a cost-effective and aesthetic solution for remediation of contaminated soil (Ma et al., 2001). This study studies the phytoremediation potential of two most common native plants lau plant EA, Erianthus arundinaceus (Retz.) and, reed plant PA, Phragmites australis (Cav.), growing on three selected contaminated mining sites in Thai Nguyen province in the northern region of Vietnam. This study evaluates heavy metals (HMs) concentration levels in selected mining soils and in the two selected native plants as influenced by soil depths and soil parameters. Moreover, the research inidentify common groups of soil properties that influence the HMs content levels in EA and PA via multivariate statistics. METHODS Eighty-four samples from roots, stems, and leaves of 28 EA and PA were collected at three mining sites including Ha Thuong lead-zinc mine, Trai Cau Iron mine, Hich Village Lead-zinc mine. Thirty-six contaminated soil samples were taken from 6 different locations in each mining sites and from 2 different depths including topsoils (0-20 cm) and subsoils (20-40 cm). The general physicochemical properties of soil samples (< 2mm) including pH, soil texture, EC, CECB, TC, TN, TS (TrueMac CNS), DOC, TOC, IC (TOC analyser) were determined using standard procedures. As and other metals (Cd, Cu, Pb and Zn) in the plants and corresponding soils were analysed by ICP-MS Agilent 7900 and ICP-EOS. Standard reference materials including Montana Soil SRM2711A and Spinach Leaf SRM 1570A from NIST, USA were utilised in the study. Selected solid phase samples were analysed XRD, SEM and EDS. Statistical analyses were conducted using IBM SPSS Statistics 20 and excel. Firstly, Pearson's analysis was conducted to assess the correlations among either HM contents in soils (HMs) or HM concentrations in plants (HMP) and other soil parameters including pH, EC, CECB, TC, TN, TS, DOC, TOC, IC, clay, silt and sand content, amorphous Fe, Al, Mn. Principal component analysis (PCA) was applied to analyse the soil parameters other than HMs in plants (HMp). To have a better definition of the principal components (PCs), a varimax rotation method was applied when performing PCA. Multiple linear regression (MLR) was applied together with PCA to further confirm the relationships of derived PCs with HMp. RESULTS AND DISCUSSION
Figure 1. Result analysis of soil samples in Ha Thuong (HT) Tin mine (a) SEM (b) EDS (c) XRD
(a) (c) (b)
M51-P3
Copyright © CRC CARE Pty. Ltd., 2019
CleanUp Conference 2019Adelaide, Australia
8 –12 September 2019261
Table of Contentsfor this manuscript

The soil samples in the three selected mining sites were analysed XRD, SEM and EDS. Soil minerals affect soil pH and HMs concentration in soils.
Figure 2. Ha Thuong Tine mine soils composed of mainly Kaolinite (H4 Al2 O9 Si2), Quartz (O2 Si1), Arsenopyrite (As1 Fe1 S1), Franklinite (ZnFe3+2O4). Arsenopyrite, Franklinite made HT soil low (pH=5.0) and high As, Zn and Fe especially in acid soil environment. Only EA has the ability to naturally survive, grow and generate high biomass in the presence of extremely high concentrations of multiple HMs together in soils especially As (up to 2605 mg kg-1), Cd (up to 124 mg kg-1) Cu (up to 603 mg kg-1), Pb (up to 5008 mg kg-1), Zn (up to 31789 mg kg-1) while those in the plant ranged from 0.02 to 300, 0.1 to 33, 3 to 111, 1.19 to 982, and 27 to 1346 mg kg-1, respectively. EA has threshold values for multiple HMs much higher compared with PA. EA has high bioconcentration factor (BCF = 6.45), low translocation factor (TF = 0.74) and high enrichment factor (EF = 4.76) is considered to be ideal HM stabilizers for Cd (Sagiroglu et al., 2006).
Table 1. Rotated component matrix of PCA analysis Component
1 2 3 4 % of variance
28.59 21.93 19.29 11.95
TC_CNS 0.863 -0.418 0.001 0.050 TOC_CNS 0.850 -0.440 -0.010 0.020 pHSoil 0.813 0.107 -0.326 0.190 ECSoil 0.519 0.410 -0.162 0.502 CECSoil 0.041 0.886 -0.069 -0.164 SoilSilt -0.249 0.831 0.361 -0.154 SoilClay -0.405 0.715 0.009 0.089 FeOxa 0.245 -0.069 0.872 -0.138 Aloxa -0.621 0.141 0.719 -0.063 MnOxa -0.410 0.120 0.672 0.072 IC_TOC 0.436 -0.115 -0.561 0.453 DOC_TOC 0.027 -0.211 -0.058 0.922 Bold signifies good correlations (>0.5) Extraction Method: Principal Component Analysis. Rotation Method: Varimax with Kaiser Normalization. a. Rotation converged in 13 iterations.
CONCLUSIONS This is the first intensive research about accumulation of the native EA in Vietnam and in the world. The results showed very high concentration of HMs (As. Cd, Cu, Pb and Zn) in most soil samples. PC2 (CEC, silt and clay) and PC4 (DOC) explained 21.93% and 11.95% total variance of investigated soil parameters. Soil minerals affect soil pH and HMs concentration in soils. High levels of Cu concentration in PA root were positively affects by percent of silt-sized and clay-sized minerals, and CECB. DOC affects positive to concentration of Pb in EA root. This study represents EA has higher threshold values for HMs concentration and the HMs accumulations by EA much higher than PA especially As. EA has the potential for phytoremediation of contaminated sites as a Cd phytostabilizer especially in extremely high concentrations of mixed contaminants (As, Cd, Cu, Pb, Zn). Their larger biomass results in much greater total accumulation of HM, indicating these plants can be used efficiently to decontaminate and rehabilitate multi-heavy contaminated mine soil.
PA Cu Root = 8.444 + 6.070 * Factor Score 2 PC2 including CEC, silt and clay. PC2 explained 21.93% total variance of all variables investigated. EA Pb Root = 154.12 + 144.63 * Factor Score 4 PC4 consist DOC soil. PC4 explained 11.95% total variance of all variables investigated. PC2 consisted of silt, clay content and CECB that represented the cation exchange capacity of soils. CEC could greatly impact the bioavailable part of heavy metals especially Cu in PA root. High levels of Cu concentration in PA root were positively related to percent of silt-sized and clay-sized minerals and CECB by Pearson correlation analysis.
REFERENCES Ma, L. Q., Komar, K. M., Tu, C., Zhang, W., Cai, Y., & Kennelley, E. D. (2001). A fern that
hyperaccumulates arsenic. Nature, 409(6820), 579-579. Sagiroglu, A., Sasmaz, A., & Sen, O. (2006). Hyperaccumulator plants of the Keban mining district and
their possible impact on the environment. Polish Journal of Environmental Studies, 15(2), 317-325.
262
Table of Contentsfor this manuscript

PFAS CLEARANCE IN CATTLE
Tarah Hagen1, Roger Drew1, David Champness2, Amelie Sellier3
1ToxConsult Pty Ltd, PO Box 316, Darling South, 3145, AUSTRALIA 2Agriculture Victoria, Private Bag 105, Hamilton, 3300, AUSTRALIA
3AsureQuality Limited, PO Box 31242, Lower Hutt 5040, Wellington, NEW ZEALAND [email protected]
INTRODUCTION Cattle on properties located in areas affected by per- and polyfluorinated alkylated substances (PFAS) are reported to have accumulated these substances. However there is limited literature information available to facilitate management of PFAS impacted farms or the animals. This study takes advantage of cattle that have acquired PFAS from their environment. The objective was to gather robust information on serum clearance (half-life) of different PFAS. METHODS A small herd of beef cattle were exposed to PFAS in water for 2+ years.
• All had access to the same water and the PFAS concentration was constant. There was no other water source.
• All animals were bred on property, or brought on at young age. • There was no, or de minimus PFAS exposure via soil or grass. • No breeding occurred for 19 months prior to study initiation. Therefore there was no
PFAS loss to placenta, foetus, via lactation or additional intake from placentophagy. • All animals were at steady state when the investigation was initiated. • All serum and tissue PFAS analysis (full suite) was done by the same commercial
laboratory. Animal ethics approval was deemed not necessary by the appropriate authority since the study was motivated as a chemical contamination investigation and for food safety reasons. Animals were managed by qualified veterinarians and all procedures were routine veterinary practice. Animals were transferred to a clean research farm and 19 days later (to ensure PFAS in gastric contents had passed) blood (tail vein) obtained for serum PFAS analysis. Five were chosen for longitudinal repeat blood sampling out to day 215, other animals were euthanised at day 63 for blood and tissue collection. In addition to the standard QA/QC analytical procedures, an aliquot of pooled PFAS positive serum and a blind duplicate sample from a randomly selected animal were analysed for each sampling time. RESULTS AND DISCUSSION From the longitudinal clearance study and serum data at days 19 and 63 serum PFAS half-lives were determined. The following was found:
• There was no statistical difference in clearance between that determined from the longitudinal study to 215 days (n = 5) or from just the d19 and d63 time points (n = 11).
• Contrary to literature information from short term exposure of dairy cattle to PFAS contaminated feed (Kowalczyk et al. 2013) and single dose PFOS administration to beef cattle (Lupton et al. 2015), there was no delay in serum depuration and no fluctuation in serum concentrations early in depuration.
• The half-life of total PFOS (linear plus branched) was 74 ± 13 days (n = 15), a statistical outlier of 173 days from the two point data set is not included.
• For other PFAS half-life of linear perfluorooctanesulfonate (lPFOS) = monomethyl PFOS (mPFOS) > perfluorheptanesulfonate (PFHpS) = dimethyl PFOS (di-PFOS) >> perfluorohexansulfonate (PFHxS).
M51-P4
Copyright © CRC CARE Pty. Ltd., 2019
CleanUp Conference 2019Adelaide, Australia
8 –12 September 2019263
Table of Contentsfor this manuscript

• For the carboxylic acids that were measureable in serum; half-life of perfluorodecanoic acid (PFDA) > perfluorononanoic acid (PFNA).
• There was statistically no difference in PFAS half-lives between heifers and steers. Hence data were combined.
Table 1. PFAS serum half-life in cattle (days), n=16
PFOS PFHpS PFHxS PFNA PFDA
(n=4) lPFOSd
m-PFOSd di-PFOS
Mean ± SD 69 ± 12 a
88 ± 19 a
30 ± 5.8 b
46 ± 9.4 b
9.3 ± 1.3 c
12.3 ± 3.2 c
60 ± 10 a, b
Range 53 - 87 53 - 116 20 - 36 33 - 63 7.4 - 12 7.4 - 19 50 - 69
REFERENCES Kowalczyk, J., Ehlers, S., Oberhausen, A., Tuscher, M., Fuerst, P., Schafft, H. and Lahrssen-
Wiederholt, M. (2013). Absorption, distribution and milk secretion of the perfluoroalkyl acids PFBS, PFHxS, PFOS, and PFOA by dairy cows fed naturally contaminated feed. Journal of Agricultural and Food Chemistry. 61: 2903-2912.
Lupton, S. J., Dearfield, K. L., Johnston, J. J., Wagner, S. and Huwe, J. K. (2015). Perfluorooctane sulfonate plasma half-life determination and long-term tissue distribution in beef cattle (Bos taurus). Journal of Agricultural and Food Chemistry. 63: 10988-10994.
SD = Standard deviation a,b,c Values with the same letter are not significantly different from each other. All other values are significant at p<0.05. Kruskal-Wallis test, followed by multiple pairwise comparisons using Dunn’s procedure. d Outlier for lPFOS and m-PFOS not included.
264
Table of Contentsfor this manuscript

A SOIL CONTAMINATION RECORD MANAGEMENT SYSTEM IN REPUBLIC OF KOREA
Jung-Auk Park1, Na-ri Oh1, Hoe-Jung Noh2
1Korea Environment Corporation, Seo-gu, Incheon, 22689, REPUBLIC OF KOREA
2National Institute of Environmental Research, Seo-gu, Incheon, 22689, REPUBLIC OF KOREA
INTRODUCTION Since the enactment of the Soil Environment Conservation Act (SECA) of 1995, Republic of Korea (hereafter, Korea) has focused on managing large oil storage facilities more than other types of soil contamination sources. The past practice results in inconsistency in forms used to acquire information about contamination sources other than large oil storage facilities. Forms include records of management entities and methods such as location of various contamination sources and result of soil contamination before/after remediation. Inconsistency in forms makes it hard to correlate and analyze data to derive information for soil environment policies. In addition, consistency in forms is important in Korea to prevent loss of soil contamination data over time because the statutory requirement for keeping records is 5 years while job rotation of government officials in charge happens less than 5 years. MERHODS The Ministry of Environment in Korea (MOE) established a long-term plan to manage the information of soil contamination sources and soil contamination history data. Since 2012, the Korea Environment Corporation (KECO) has collected the information of 27 types of potential soil and groundwater contamination sources such as oil and hazardous chemical storage facilities, petroleum product pipelines, abandoned mine areas, waste storage facilities, wastewater discharge facilities, sites of contaminated and remediated soil, etc. Throughout this effort, KECO acquired about 1.46 million records in its database at the end of 2018. In addition, with the introduction of the Soil Contamination History Data Management System in the SECA of 2018, we are developing and implementing a plan to build a database management system via our Intranet and the Internet for inventories of major soil contamination sources, soil background concentrations, and site information for each land parcel, survey results of soil contamination and remediation. RESULTS AND DISCUSSION In 2017, a pilot project was conducted to build a beta version of the soil contamination record management system through collaboration among the central government and local government (Figure 1). The system was designed to provide comprehensive information by integrating results of nationwide soil quality monitoring, various soil contamination surveys, soil contamination remediation completion areas, and key soil contamination source information for each land parcel. Soil contamination records are classified into three information categories: basic information, soil contamination information, and soil contamination probability information.
(a) The basic information is composed of spatial information such as land parcel code, land use, size of land parcel, and background concentrations of soil contaminants.
(b) Soil contamination information is a collection of data directly related to soil contamination such as results of soil monitoring, soil contamination survey, remediation history, etc.
(c) Soil contamination probability information includes information about facilities that may cause soil contamination (e.g. large oil and hazardous chemical storage facilities) such as installation history and specifications of soil contamination sources.
M51-P5
Copyright © CRC CARE Pty. Ltd., 2019
CleanUp Conference 2019Adelaide, Australia
8 –12 September 2019265
Table of Contentsfor this manuscript

The structure of soil contamination record was designed to include detailed soil contamination information as well as to add reference data such as various reports, blueprints, permits, other administrative documents.
Fig. 1. Soil contamination record management system
CONCLUSIONS MOE, KECO, and National Institute of Environmental Research of Korea have been building a database of soil contamination records at the national level since 2018. We plan to develop two versions of soil contamination record management systems - a version accessible via its intranet and the other version via the Internet for the next four years starting from 2019. The soil contamination record management system divides users into a public sector (the central government, local governments, and public institutions) and a private sector (parties involved in land transactions, appraisers, insurance companies, general public, etc.). We will implement information services by setting the access right based on user and data types (Table 1). With the management of soil contamination records, we expect a paradigm shift of soil management in Korea from the previous management that is regulation-oriented to the autonomous soil contamination management system as well as changes in perception of general public.
Table 1. Utilization plan for soil contamination record management system
Utilization area Utilization Target information
Public Sector
(Intranet)
Central Government
-Trend analysis for soil quality to develop soil conservation policy All countryInformation-Selection of sites for a national priority list
-Development of national soil management plan
Local Government
-Utilization as fundamental data to identify causes of contaminationand responsible parties for remediation All
jurisdictioninformation
-Analysis of relationships between site conditions and soilcontamination accidents -Trend analysis for contamination sources
Private Sector
(Internet)
Parties to a land
transaction
-Evaluation of land value with soil contamination information -Promotion of transparent land transactions and resolution ofdisputes through disclosure of historical information
Target area(Site owner
pre-approvalrequired) overall
statistical information
General citizens
-Enhancement of autonomous soil contamination management forlandowners by raising awareness of soil contamination -Reduction of public concerns about soil contamination throughtransparent disclosure of information
REFERENCES Soil Environment Conservation Ac in Korea
266
Table of Contentsfor this manuscript

INVESTIGATION OF PFAS CONTAMINATION FROM LAND-APPLIED INDUSTRIAL COMPOST AND AFFF SOURCES
Ian Ross1, Jeffrey McDonough2, Jake Hurst1, Jonathan Miles1, Danielle Toase3,
Jason Lagowski3, Peter Storch4
1Arcadis, 1 Whitehall Riverside, Leeds, LS1 4BN, UK 2Arcadis, 10 Friends Lane, Newtown, PA 18940, USA
3Arcadis, Level 16/580 George St, Sydney, NSW 2000, AUSTRALIA 4Arcadis, 32/140 William St, Melbourne, VIC 3000, AUSTRALIA
INTRODUCTION A large area of PFAS impacted soil was discovered as a result of composting activities some ten years ago. Industrial sludge was blended with composted soil and applied to agricultural land as fertilizer to a depth of 30 cm, resulting in PFAS contamination over 3.7 km². The fertilizer comprised mainly polyalkylyphosphates (PAPs) and some fluorinated polymers. PAPs were not able to measured as no commercial analyses are currently available. Soil and groundwater contained high concentrations of perfluoroalkyl carboxylic and sulfonic acids, suggesting that the original contamination has already undergone biotransformation to the persistent perfluoroalkyl acids (PFAAs), but the concentrations of the remaining residual precursors were not estimated. Hence, the TOP (total oxidizable precursor) analysis was used to investigate the soil. The composted soil contamination is overlain in certain areas by a second PFAS contamination originating from the usage of aqueous film forming foams (AFFF). In this area, the PFAS distribution differs from the industrial sludge-related contamination.
METHODS The results of the TOP assay analysis of the PaPs impacted soils showed that substantial amounts of precursors still remained in the soil, but the groundwater was nearly free of precursors. These results were confirmed by the AOF (adsorbable organic fluorine) analysis. In the AFFF impacted area significant concentrations of precursors were detected in groundwater and it is hypothesized that hydrocarbon surfactants also occurring in AFFF created a strongly reducing biogeochemical environment, conserving the aerobically transformable precursors, whereas in the rest on the area, oxidizing conditions allowed a fast and nearly complete biotransformation of the precursors to PFAAs immediately after transport into groundwater.
RESULTS AND DISCUSSION The remediation of PFAS contaminated soil is only needed to the extent that rainwater infiltration of the low contaminated soil left in place will not cause an exceedance of the intervention values for groundwater set by regulators. Since the extent of the contaminated area soil is large infiltration will lead to a PFAS accumulation in groundwater passing the contaminated area. Nevertheless, in the beginning of the project it was not known at what rates and over what time the PFAS would be transported from soil to groundwater and at what rates the precursors would be biotransformed to the persistent PFAAs. Hence, a study was initiated to determine site specific sorption coefficients. These sorption coefficients were used in a contaminant transport model to calculate the plume extension and to predict the influence of future soil remediation measures. For the site a provisional feasibility study was conducted to investigate treatment alternatives, including effective proven technologies and also innovative but not yet mature remediation technologies. In order to finalize the feasibility study, a research and development project was initiated to develop a better model that predicts PFAS sorption and release and determines the rate of the microbial production of PFAAs from precursor contaminated soil.
M51-P6
Copyright © CRC CARE Pty. Ltd., 2019
CleanUp Conference 2019Adelaide, Australia
8 –12 September 2019267
Table of Contentsfor this manuscript

STANDARDIZED APPROACHES FOR RISK RANKING PORTFOLIO OF SITES IMPACTED WITH PFAS
Ian Ross1, Jeffrey McDonough2, Jake Hurst1, Jonathan Miles1, Danielle Toase3,
Jason Lagowski3, Peter Storch4
1Arcadis, 1 Whitehall Riverside, Leeds, LS1 4BN, UK 2Arcadis, 10 Friends Lane, Newtown, PA 18940, USA
3Arcadis, Level 16/580 George St, Sydney, NSW 2000, AUSTRALIA 4Arcadis, 32/140 William St, Melbourne, VIC 3000, AUSTRALIA
INTRODUCTION Assessing portfolios of sites which have been used for fire training has become an important issue as drinking water supplies across North America are increasingly being found to be impacted by poly- and perfluoroalkyl substances (PFASs) which may have emanated from fire training activities. The risks posed to drinking water supplies by PFASs are becoming apparent as these contaminants are extremely persistent, very mobile in aquifers, and are regulated to parts per trillion levels as a result of their toxicological properties, potentially amplified by bioaccumulation. The plumes emanating from s source zones containing PFASs have the potential to travel some distance from a point source release, such as a fire training area (FTA) where large releases of PFAS foam occurred consistently for decades at the same location. To rationalize how to investigate a portfolio of FTAs and identify which may be most likely to pose harm to human health, a strategy has been developed, specific to PFAS, which evaluates the environmental site sensitivity of each FTA to develop an initial outline for a conceptual site model (CSM). The process of developing multiple PFAS specific outline CSMs as a Phase 1 desk study exercise, with subsequent risk ranking, is described. METHODS The outline CSM were developed based on the following criteria: 1) Site geology and an adequate understanding of lithological units potentially exposed to PFAS; 2) Site hydrology and hydrogeology and an understanding of the potential for PFAS retardation factors; 3) Direction of groundwater flow and geochemical status given local conditions (i.e., available analytical data from existing wells located in the vicinity of the sites); 4) Length of time the site has been releasing PFAS foams; 5) Location of receptors, such as surface water, drinking water, and agricultural receptors (e.g. crop spray irrigation). This information is combined in an outline format to determine if a length of time that PFAS foams have been released, coupled with an understating of the local hydrogeology, indicates a potential PFAS travel distance. Combining this information with the identified location of potential receptors and the likely groundwater flow direction then enables site prioritization. The initial list of sites is then evaluated using a further set of criteria, evaluating uncertainties, to prioritize the sites that are most likely to be impacting specific receptors, such as drinking water wells. The uncertainties in each stage are catalogued such that less reliable input data results in higher site prioritization. This risk ranked list of sites is generated prior to field mobilization to collect soil and groundwater samples to focus intrusive investigations to higher priority source areas RESULTS AND DISCUSSION The presentation will describe application of this risk ranking process using a number of international portfolios of sites. The process of prioritization and management of inherent uncertainties will be described in detail with reference to application of this approach in multiple countries, with lessons learned as a result of implementing the process.
M51-P7
Copyright © CRC CARE Pty. Ltd., 2019
CleanUp Conference 2019Adelaide, Australia8 –12 September 2019 268
Table of Contentsfor this manuscript

NITRATE, PHOSPHATE AND SULPHATE CONCENTRATIONS IN EFFLUENT WATERS FROM NINE WASTEWATER TREATMENT
PLANTS IN SAVANNAH, GEORGIA
Liz Ortiz, Skyla Bailey, Micheala Goodwin, Sasha Mays, Brooklynn West, Zarion Hurston, Kenneth Sajwan
Savannah State University, Savannah, GA 31404, USA
ABSTRACT Treated effluent waters were collected from nine wastewater treatment plants in Savannah, Georgia. Results of this study indicated that there were significant differences in the nitrate, phosphate, and sulfate levels in effluent waters collected from various Wastewater Treatment Plants. Our study suggests that one has to be careful in reusing the treated water for land application to avoid cross contamination of heavy metals from these sources. INTRODUCTION The application of bio-solids on agricultural land is a common practice around the world, including the USA. Bio-solids characteristically contains high levels of the major plant nutrients, N and P, and is enriched in organic matter (Naylor and R.C. Loehr, 1982). However, potential hazards associated with certain bio-solids-borne constituents may cause concerns about their extensive use of bio-solids on cropland (Chaney et al., 1976). Metropolitan Savannah and its suburbs all together have a population of over 450,000. There are nine wastewater treatment plants in Savannah that serve this population for their domestic wastewater treatment every day. These plants include President Street, Wilshire, Georgetown, Cross Roads, Tybee Island, Port Wentworth, Pooler, Richmond Hill, and Garden City. Savannah storm water drainage systems are very well connected with the wastewater lines. All these plants have capacity to accommodate additional storm runoff waters. The objective of this study was to compare the elemental composition of various effluent waters from nine wastewater treatment plants in Savannah, GA. MATERIALS AND METHODS Treated effluent samples were collected from nine wastewater facilities that use chlorine, ultra-violet (UV) light, and biological processes to treat the incoming (influent) water. The facilities include President Street Wastewater Treatment Plant (receives about 27 million gallons of influent), Wilshire Wastewater Treatment Plant (receives about 4.50 million gallons of influent), Georgetown Wastewater Treatment Plant (receives about 2.45 million gallons of influent), Cross Road Wastewater Treatment Plant (receives about 1.50 million gallon of influent), Pooler Wastewater Treatment Plant (receives about 2.40 million gallons of influent) , Richmond Hill Wastewater Treatment Plant (receives 1.2 million gallons of influent), Garden City Wastewater Treatment Plant, Port Wentworth Wastewater Plant (receives 1 million gallons of influent), and Tybee Island Wastewater Treatment Plant (receives about 1.5 million gallons of influent). Effluent samples were brought to the laboratory and analyzed for Nitrate, phosphate, sulfate, and trace elementals. Both influent and bio-solids samples were also collected from each wastewater treatment facilities, brought to the laboratory and analyzed for Nitrate, phosphate, sulfate and trace elements. The analysis of influent, bio-solids, and effluent waters was done using Dionex 400 Ion Chromatography and Perkin-Elmer Inductively Coupled Plasma Optical Emission Spectroscopy (ICP-OES). Other measurement for the temperature, pH, salinity, and dissolved oxygen in effluent waters are done using the YSI Dissolved Oxygen Meter.
M51-P8
Copyright © CRC CARE Pty. Ltd., 2019
CleanUp Conference 2019Adelaide, Australia
8 –12 September 2019269
Table of Contentsfor this manuscript

RESULT AND DISCUSSION Table 1: Elemental composition in effluent waters from nine wastewater treatment plants.
Based on results, it was observed that in the effluent, NO3 levels were found higher in Tybee, Cross Roads and Garden City wastewater treatment facilities. For PO4 it was concluded that Tybee Island, Georgetown and Cross Roads wastewater treatment facilities had the highest levels. The SO4 levels were found to be higher in Tybee Island, Cross Roads, and Pooler wastewater treatment facility. Other nutrient such as Al, Mn, Mo, Fe, Cu, and Ni were found below the detection limits. In all the wastewater treatment plants significant amount of Ca, K, Mg, Na, Cl, and F were detected in all the wastewater treatment plants. Though, several places in the United States treated effluent waste waters are being used for agriculture, recreational and golf courses. However, one has to be careful using these effluent waters in crop plants to avoid cross contamination. SUMMARY AND CONCLUSION This study indicated that there were significant differences in the elemental composition of biosolids, influent, and effluent waters collected from various wastewater treatment plants. Therefore, one has to be careful in reusing the treated biosolids and/or treated effluent. REFERENCES Chaney, R.L., S.B. Hornik, and P.W. Simon. 1976. Heavy metal relationship during land
utilization of sewage sludges in the Northeast. In: Proc. 1976 Cornell Waste Management Conference.
Naylor, L.M., R.C. Loehr. 1982. Priority pollutants in municipal sewage sludge. A perspective on the potential health risks of land application. Biocycle. 23 (4): 18-22.
270
Table of Contentsfor this manuscript
INVESTIGATION, RISK ASSESSMENT AND REMEDIATION OF MULTIPLE PFAS SOURCE ZONES AT AN AIRPORT TO
SAFEGUARD A WATER SUPPLY
Ian Ross1, Jeffrey McDonough2, Jake Hurst1, Jonathan Miles1, Danielle Toase3, Jason Lagowski3, Peter Storch4
1Arcadis, 1 Whitehall Riverside, Leeds, LS1 4BN, UK 2Arcadis, 10 Friends Lane, Newtown, PA 18940, USA
3Arcadis, Level 16/580 George St, Sydney, NSW 2000, AUSTRALIA 4Arcadis, 32/140 William St, Melbourne, VIC 3000, AUSTRALIA
INTRODUCTION Guernsey, a British Crown Dependency, is located in the English Channel between England and France and represents one of the Channel Islands. In 2008 concentrations of PFAS were detected in the surface waters which are used to source drinking water supply for the Island’s population. The affected catchment area, which includes one of the Island’s principle water supply reservoirs, collects surface water and groundwater from within the vicinity of the islands airport. The airport was identified as a potential source for the PFAS contamination detected. The objectives of the project were to investigate: the extent of PFAS impacts within the airport and the surrounding environment; whether the existing conditions were likely to deteriorate further; and, ultimately to identify an appropriate solution protected to safeguard the Island’s water supply into the future. METHODS The following phases of work were performed on Guernsey from 2008 onwards:
• Desk based review and preliminary risk assessment • Soil, groundwater and surface water investigation, sampling and assessment • Fate a transport modelling • Interim emergency response measures • Development of a water treatment solution • Implementation of phased remediation strategies for soil and groundwater.
As an immediate step, a detailed desk based review and preliminary risk assessment was completed, looking at historic uses of AFFF foam at the airport through records of aircraft accidents, training procedures, and material storage. The outcome of this study identified eleven potential source locations which required further assessment. Site investigations followed, including extensive soil, groundwater and surface water sampling, which identified PFAS impacts at 7 of these locations. To assess fate and transport processes of identified PFOS concentrations a numerical model termed the calculating attenuation linkage model (CALM) was compiled with the primary interlinking elements:
• PFOS within soils beneath the airport, leaching into groundwater and migrating into surface water
• PFOS within the surface water system, mixing and diluting as it flows to the reservoir • PFOS within the reservoir, entering, mixing and diluting via the streams and being
abstracted Following the detailed fate and transport modelling 4 of the 7 location were considered to require remedial action. All investigation works were undertaken on an active airport without disruption to operations. On completion of the investigation activities a bespoke water treatment system was designed, which incorporated the installation of two below ground capture trenches across the airfield to intercept PFAS impacted groundwater. The water treatment system also
M51-P9
Copyright © CRC CARE Pty. Ltd., 2019
CleanUp Conference 2019Adelaide, Australia
8 –12 September 2019271
Table of Contentsfor this manuscript

collects and treats impacted surface water. With a capacity to treat up to 20 litres of water per second, the system is ensuring that concentrations of the PFAS are below drinking water criteria, prior to discharge into the wider catchment area. Following the installation of the water treatment system, soils identified to be contaminated with PFAS in the four source zones across the airport were excavated and contained within a purpose built soil bund. The soils are encapsulated so as to isolate them entirely from the local environment, whilst also acting an acoustic barrier to mitigate noise pollution from the airfield operations. RESULTS AND DISCUSSION The project highlighted the requirement to understand the history of AFFF use at airports and airfields as multiple sources zones are typical. The treatment solution reduced PFAS concentrations in the drinking water supply whilst also removing the risk of further leaching from the main source areas by isolating the contaminated material as part of wider redevelopment scheme. Following the interim remedial measures applied by Ian and the Arcadis team, after multiple rounds of iterative site investigation risk assessment and targeted remediation over the preceding years the BBC News reported “PFOS levels in Guernsey drinking water safe, finds report” on 12th June 2013. Drinking water has remained below compliance concentrations, in the drinking water reservoir since 2009. Ian continues to support the Arcadis team and interact with the client and regulators as permanent solution for PFASs impacted is developed, following the successful implementation of the interim remedial measures.
272
Table of Contentsfor this manuscript

THE EVOLUTION AND APPLICATION OF FLUORINE FREE FOAMS FOR EFFECTIVE EXTINGUISHMENT OF CLASS B FIRES
Ian Ross1, Jonathan Miles1, Niall Ramsden2, Peter Storch3
1Arcadis, 1 Whitehall Riverside, Leeds, LS1 4BN, UK
2ENRg Consultants, The Old Rectory, Mill Lane, Monks Risborough, Princes Risborough, Buckinghamshire, HP27 9LG, UK
3Arcadis, 32/140 William St, Melbourne, VIC 3000, AUSTRALIA [email protected]
INTRODUCTION The rapid extinguishment of hydrocarbon based fuel fires is crucial to maximize incident survivability and firefighter safety. The current performance requirements for firefighting foams used by the United States (U.S.) military (MIL-PRF-24385F) mandates the use of fluorosurfactants known as per- and polyfluoroalkyl substances (PFASs) as significant components of the concentrate mixture. The widespread use of aqueous film forming foams (AFFF) at incidents and during firefighter training has led to the contamination of both groundwater aquifers and surface waters; and consequently the impact on numerous public and private drinking water supplies. An increasing number PFASs are being identified as posing a potential human health and environmental risk. Although the use of some PFAS such as perfluorooctane sulphonate (PFOS) and perflorooctanic acid (PFOA) in AFFF has already been phased out the replacement fluorosurfactants based on “short chain” C6 fluorotelomer chemistry. These fluorotelomers otransforms represent a group of persistent PFASs in the environment called perfluoroalkyl acids (PFAA); a class of compounds to which both PFOS and PFOA belong. Recently these short chain PFAA have increasingly being linked with bioaccumulation in crops, and higher organisms. Furthermore short chain the PFAA have been demonstrated to have similar extreme persistence in the environment to PFOS and PFOA and increased solubility and mobility in water, making there removal from potable water supplies costly and challenging [Appleman 2014]. The US Navy stated in February 2017 that “there is a definite need to eliminate the fluorocarbon surfactants from AFFF formulations to address their environmental impact while maintaining the high firefighting performance required by the Mil-Spec” (Hinnant et al., 2017). There is therefore considerable interest in in alternatives to PFAS containing AFFF. A large number of mature fluorine free firefighting foams (F3) products are commercially available but none currently meet the requirements of MILPRF-24385F due to the mandatory use of fluorosurfactants. Thus in the U.S, fluorine free firefighting (F3) foams cannot be used by the military or by civil airports, despite their widespread use and certification outside the US by bodies such as the International Civil Aviation Organization (ICAO). The mandatory requirement within MILPRF-24385 to use fluorosurfactants means this performance standard is not suitable to assess many of the modern F3 foams currently commercially available. There is therefore a pressing requirement to review the scope of the specification to allow F3 foams to be assessed in order to identify if they can perform effectively, and without reduction in performance against AFFF in a military relevant environment. The review needs to be independent and non-biased towards either F3 or AFFF Alongside the firefighting performance assessment there is the requirement to include environmental criteria within the specification to allow the environmental consequences of using F3 and AFFF to be directly compared. Several parameters need to be considered to evaluate the potential harm to human health and environmental receptors after a fire, training, or release incident. Parameters used to test products, such as biodegradability
M51-P10
Copyright © CRC CARE Pty. Ltd., 2019
CleanUp Conference 2019Adelaide, Australia
8 –12 September 2019273
Table of Contentsfor this manuscript

(persistence), toxicity to various species and potential for bioaccumulation all need to be considered. METHODS The latest F3 foams are a fairly new technology to enter the commercial market by comparison to AFFF. However, the technology maturity has advanced such that F3 foams have achieved certification under various firefighting foam certification programs (e.g., Underwriters Lab, LASTFIRE and International Organization for Standardization [ISO]). As is the case with AFFF, there is a wide range of formulations and associated differences in performance. As such, the technology continues to be improved upon through investments by interested stakeholders such as the international oil and civil aviation industry. The presentation will describe the independent extinguishment trial done at increasing scale to prove that F3 foams are effective for extinguishment of real world fires. Tests using F3 and PFAS based fluorotelomer foams were done in Hungary and France in 2017. During 2018 tests at Dallas Fort Worth Airport were performed, with a 40m long fire successfully extinguished using a F3 foam. The use of compressed air foam (CAF) delivery systems was found to have significant advantages. The results from the trials will be described. From an environmental perspective, if all the organic components of the foams are determined to be readily biodegradable they should rapidly detoxify, as they are metabolized by soil micro-organisms. Such that blanket statement regarding ready biodegradability of F3 foams can be used to determine the environmental risks posed by F3 foam products. Discussion regarding the criteria by which to determine that F3 foams are environmentally safe will be presented with ready biodegradability forming a key component of the conceptual site model when considering foam release. RESULTS AND DISCUSSION The results from the recent testing of new generation F3 foams indicates that they have excellent fire extinguishment performance. Considering that the F3 foams are readily biodegradable and that there are significant emerging concerns regarding the fluorotelomers in C6 PFAS foams used to replace foam which contained PFOS and PFOA. The balance between fire safety and environmental considerations has now moved to the point where for the vast majority of fires AFFF and PFASs are no longer required to provide adequate fire protection.
274
Table of Contentsfor this manuscript

UNDERSTANDING FATE AND TRANSPORT OF PFASs TO DEVELOP EFFECTIVE CONCEPTUAL SITE MODELS
Ian Ross1, Jeffrey McDonough2, Jake Hurst1, Jonathan Miles1, Danielle Toase3,
Jason Lagowski3, Peter Storch4
1Arcadis, 1 Whitehall Riverside, Leeds, LS1 4BN, UK 2Arcadis, 10 Friends Lane, Newtown, PA 18940, USA
3Arcadis, Level 16/580 George St, Sydney, NSW 2000, AUSTRLIA 4Arcadis, 32/140 William St, Melbourne, VIC 3000, AUSTRLIA
INTRODUCTION Poly- and Perfluoroalkyl substances (PFAS) are used in a wide range of industrial applications and commercial products due to their unique surface tension and levelling properties. PFAS are also major components of firefighting foams such as Aqueous Film Forming Foam (AFFF) and fluoroprotein foams (including FP and FFFP). The PFAS group of compounds consists of both perfluorinated compounds or perfluoroalkyl acids (PFAAs), where all carbons are saturated with F atoms, and polyfluorinated compounds, where both fluorine saturated carbons and carbons with hydrogen bonds are present. Polyfluorinated “precursor” compounds biotransform to produce PFAAs as dead end extremely persistent daughter products. The understanding of the fate and transport of these compounds in the environment is complex and challenging and will be discussed. The concepts of in situ generation of perfluroalkyl acids (PFAAs) via precursor biotransformation will be used to explain how significant PFAS mass remains hidden in source areas in an analogous manner to NAPL residuals for hydrocarbon or chlorinated solvents. METHODS PFAA precursors are so named because they transform slowly over time through abiotic and biological processes to the PFAAs. There is a natural “biological funneling” in which a whole host of PFAA precursor compounds containing a range of perfluorinated alkyl chain lengths and functional groups, aerobically biotransform to persistent PFAA products. Fire-fighting foam formulations and many fluorochemicals used across multiple industries are composed of many PFAS that are PFAA precursors. Unlike the PFAAs, these species are not strictly anionic, as some contain multiple charges (zwitterionic) and some are positively charged (cationic). These zwitterionic and cationic PFAA precursors are currently undetected by conventional analytical tools but can be quantified using more advanced approaches such as the Total Oxidizeable Precursor (TOP) assay. A significant mass of PFAA precursors in addition to the PFAAs have been detected in both fire-fighting foam-impacted soil and groundwater. A conceptual site model describing PFAS fate and transport at a firefighter training area is hypothesized and will be presented, as described below. Cationic and zwitterionic precursors will be retained in the soils at the source zone via strongly binding ion exchange processes. The source zones will be anaerobic as a result of the presence of residual hydrocarbons used in firefighter training, so these strongly sorbing cationic precursors will biotransform very slowly to simpler, anionic PFAA precursors and PFAAs under these redox conditions. Anionic PFAAs and PFAA precursors will migrate away from the source as they enter the redox recharge zone where conditions become increasingly aerobic thus promoting in situ generation of detectable PFAAs from the hidden anionic PFAA precursors. PFAAs will not break down further, and will continue to migrate as a plume with shorter chain PFAAs generally migrating further.
M51-P11
Copyright © CRC CARE Pty. Ltd., 2019
CleanUp Conference 2019Adelaide, Australia
8 –12 September 2019275
Table of Contentsfor this manuscript

RESULTS AND DISCUSSION The concepts of “biological funnelling” show that PFAS behave significantly differently to other contaminants and existing conceptual site models (CSM) need to be adapted to adequately understand the fate and transport of these contaminants. Examples of CSMs from AFFF impacted sites will be presented. The common breakdown products from PFAS in other sources, such as landfills and waste water treatment plants will be described.
276
Table of Contentsfor this manuscript

PFAS TISSUE DISTRIBUTION IN CATTLE
Roger Drew1, Tarah Hagen1, David Champness2, Amelie Sellier3
1ToxConsult Pty Ltd, PO Box 316, Darling South, 3145, AUSTRALIA 2Agriculture Victoria, Private Bag 105, Hamilton, 3300, AUSTRALIA
3AsureQuality Limited Wellington Laboratory, PO Box 31242, Lower Hutt 5040, NEW ZEALAND
INTRODUCTION Stock animals can accumulate per- and polyfluorinated alkylated substances (PFAS) if their water or feed are contaminated (Kowalczyk et al. 2013). There is however insufficient tissue distribution information in the literature to confidently assist a risk assessment directed to whether the extent of PFAS accumulation in the animals may result in a consumer of beef exceeding the tolerable daily intake (TDI). This study reports the tissue distribution and tissue partition coefficients for several PFAS in beef cattle. The cattle are the same as described in an accompanying presentation to this Clean Up meeting (Hagen et al. 2019). METHODS Animal characteristics are as described in Hagen et al. (2019). After taking blood from the tail vein, a veterinarian euthanised the animals which were hung and allowed to bleed out as is normal abattoir practice. Paired muscle, liver and kidney samples were taken from most animals. In a subset of animals bile, gastrointestinal content (at 3 sites), urine and saliva samples were also obtained. For tissue PFAS analysis similar analytical QA/QC procedures were followed as for serum (Hagen et al. 2019) and all data met the quality requirements. RESULTS AND DISCUSSION The following was found:
• Partition coefficients for muscle; linear perfluoroctanesulfonate (lPFOS) > monomethyl PFOS (mPFOS) = dimethyl PFOS (diPFOS) = perfluorheptanesulfonate (PFHpS) = perfluorohexansulfonate (PFHxS). Muscle partition coefficients were not dependent on serum concentration.
• lPFOS and PFHxS partitioning into kidney is significantly different compared to other PFAS.
• Partitioning of PFOS into fat (only collected at day 215) was significantly lower than all other tissues.
• There was a different PFAS profile in urine compared with kidney. Suggesting preferential re-absorption of lPFOS from urine, or perhaps differential competitive inhibition(s) of organic anion transporters (OAT) by lPFOS thereby decreasing renal reabsorption of other PFAS.
• Partition coefficients for liver are different to other tissues, but PFAS profile is similar. For the first time PFAS secretion into saliva is described.
• Saliva has a different PFAS profile to serum but is similar to urine. There appears to be preferential salivary secretion of mPFOS and PFHxS.
• There is marked recirculation from serum to saliva to rumen and back into serum. The daily flux of PFOS through saliva is a large fraction of the daily intake. This is due to the volume of saliva produced (50+ L/d per animal).
PFAS measurements down the GIT (liver, bile, duodenum distal to bile duct entry, mid-jejunum, and mid spiral colon) show:
• Liver partition coefficients are different to other tissues. This may be the result of the strong enterohepatic recirculation of PFAS.
• PFAS profiles are similar down the GIT suggesting no preferential secretion or reabsorption.
M51-P12
Copyright © CRC CARE Pty. Ltd., 2019
CleanUp Conference 2019Adelaide, Australia
8 –12 September 2019277
Table of Contentsfor this manuscript

• PFOS (l-, m- & di-) concentrations (ng/g) in liver are similar to bile, but PFHpS & PFHxS are much higher in liver suggesting they are not readily transferred to bile.
• Data is consistent with approximately 90% PFOS absorption from GIT. REFERENCES Hagen,T., Drew,R., Champness, D. and Sellier, A. (2019). PFAS clearance in cattle. Clean
Up, September 2019. Kowalczyk, J., Ehlers, S., Oberhausen, A., Tuscher, M., Fuerst, P., Schafft, H. and Lahrssen-
Wiederholt, M. (2013). Absorption, distribution and milk secretion of the perfluoroalkyl acids PFBS, PFHxS, PFOS, and PFOA by dairy cows fed naturally contaminated feed. Journal of Agricultural and Food Chemistry. 61: 2903-2912.
278
Table of Contentsfor this manuscript

N. Tantemsapya1, W. Wirojanagud2, V. Thathong3
1School of Environmental Engineering, Suranaree University of Technology.
Nakhornrachsrima, 30000, THAILAND 2 Research Center for Environmental and Hazardous Substance Management,
Khon Kaen University, Khon Kaen 40002, THAILAND 3 Department of Environmental Science, Loei Rajbhat University, Loei, 42000, THAILAND
INTRODUCTION During 1967- 1997, lead mining and ore dressing plant had been operating in the remote area of Kanchanaburi Province, Thailand. The activities caused lead contamination covered area approximately 1,000 x 1,000 m2. Mine tailing was released into Klity creek located near the plant causing contamination approximately 27 km down steam. The contamination effect about 200 tribal villagers who lives 11 km down steam. In 1998, the Department of Mineral Resources ordered the closure of the company. After closure, monitoring results indicated that lead contamination in the creek was higher than standard. Authorities have advised villagers to stop consuming water, fish, and aquatic animals from the creek while letting the creek naturally rehabilitate. Villagers claimed that they suffered from the symptoms of chronic lead poisoning and some children have birth defects and mental disability. These villagers have filed lawsuits against the mining company and the government. In 2013, court ordered Thailand’s Pollution Control Department (PCD) to develop rehabilitation plan and clean up the creek. This study is part of the remediation project. The objective is to assess lead contamination and develop the remediation plan of old ore dressing plant area. METHODS The method comprises of site assessment and evaluation of remediation measure. Details is shown in Figure 1. • Study Area: Study area is an old ore dressing plant located in Thung Yai Naresuan
wildlife sanctuary in Kanchanaburi Province. It is an UNESCO World Heritage Site. The site is now a habitat for tribal whom had worked in mine and ore dressing plant in the past.
Site survey- Topography- Existing Infrastructure
Historical activity review
Soil Sampling
Lead Contamination Map
Proposed Remediation
optionsSite survey: Land use
Public Hearing
Site Assessment
Remediation Measure
Background concentration
Risk Evaluation
Figure 1. Methods • Site Assessment: Site assessment was done with survey map, historical information
and soil sampling. Grid soil sampling at 30 and 60 cm depth were performed @10x10 m in the old ore dressing plant and @100x100 m in 1 km radius around the plant. Lead in soil was analysed by portable XRF in PCD’s Laboratory. ArcGIS 10.1 was used to generate the map.
SITE ASSESSMENT AND REMEDIATION PLAN FOR LEAD CONTAMINATION FROM
MINING ACTIVITY; KLITY, KANCHANABURI, THAILAND
M51-P13
Copyright © CRC CARE Pty. Ltd., 2019
CleanUp Conference 2019Adelaide, Australia
8 –12 September 2019279
Table of Contentsfor this manuscript

• Evaluation of Remediation Measure: Results from site assessment, background concentration and land use were used to performed risk evaluation. Then, remediation options were developed. Options were compared and proposed for public hearing and the remediation measure plan were made.
RESULTS AND DISCUSSION • Site Assessment: Spatial distribution of lead were shown in Figure 2. Lead level was up
to 180,000 mg/kg. Background concentration was 821.00 mg/kg (n=14 @95 percentile). Lead concentration was higher in top soil and highest around old ore pile decreasing with the distance from the pile. From the interview, we found that, during the operation, ore tailings were dumped and used as soil filler around the site. Thus, high concentration of lead was found in spots outside the ore processing plant area.
a. 30 cm depth b. 60 cm depth Figure 2. Spatial Distribution of Lead
• Evaluation of Remediation Measure: Risk analysis were performed and remediation plan was developed as shown in Table1.
Table 1. Remediation plan Area Characters Remediation
Mine tailing pond Pond that located in the ore processing plants is close to residential area with high concentration of lead. It is considered as high risk area. Pond that located in the forest with area 16,000 m2 was considered as middle risk area.
Capping
Mine tailing dump site
The contamination was found on top soil. Contamination found in small area (less than 16 m2). It is considered as middle risk area.
Excavation
Old ore pile High lead concentration (Highest 118,690 mg/kg) were found on top soil with large area, 17,200 m2). It is considered as high-risk area.
Capping
Area that use mine tailing as soil filling
High lead concentration (Highest 137,560 mg/kg) were found. A house was built on the contamination soil. It is considered as high-risk area.
Capping
Mine tailing excavated from Klity creek
The residue was found scattering along the bank with high concentration (119,720 mg/kg) mostly on to soil. It is considered as low-risk area.
MNR
CONCLUSIONS The site investigation for lead contamination were performed. Remediation options which are capping, excavation, and Monitored Natural Recovery (MNR) we proposed base on site assessment and risk analysis.
REFERENCES Ashraf, M.A., Maah, M.J. and Yusoff, I., 2014. Soil contamination, risk assessment and
remediation. In Environmental Risk Assessment of Soil Contamination. IntechOpen.
Lead Concentration
800 180,000
Lead Concentration
800 180,000
280
Table of Contentsfor this manuscript

IRON PLAQUE FORMATION AND ITS EFFECT ON CADMIUM ACCUMULATION BY RICE SEEDLINGS
Abu Bakkar Siddique1,2,3
, Mohammad Mahmudur Rahman1,2, Md Rafiqul Islam4, Ravi Naidu1,2
1GCER, University of Newcastle, AUSTRALIA 2CRC CARE, University of Newcastle, AUSTRALIA
3Department of Agriculture, Noakhali Science and Technology University, BANGLADESH 4Department of Soil Science, Bangladesh Agricultural University, BANGLADESH
INTRODUCTION Cadmium (Cd) is one of most mobile and potentially bioavailable soil elements that poses risk to humans even in low concentration (Benavides et al., 2005; Takahashi et al., 2011). The world’s first documented incidence of mass poisoning by Cd, the Itai-Itai disease in Japan, brought global public attention to the problem of Cd-contaminated rice in the 1950s (Nogawa & Kido, 1993). For this reason, bioaccumulation of Cd in rice grain is a major agricultural concern, particularly in Asian countries where people ingest rice two to three times per day. Iron plaque is commonly formed on the root surface in a number of aquatic plants such as Oryza sativa, Typha latifolia L., and Phragmites australis Trin (Taylor and Crowder, 1998; Liu et al., 2004). The oxygen released from the aerenchyma oxidises Fe2+ to Fe3+ and the oxide containing Fe3+ precipitates on the surface of the roots as iron plaque (Sebastian and Prasad, 2015).The presence of Fe plaques on the root surface of aquatic plants may provide a means of attenuation and external exclusion of metals (Hansel et al., 2002). It was found that the increased amount of Fe plaque formation promotes the deposition of metals onto the root surface, thereby limiting the uptake and transfer of Cd in rice tissues (Dong et al., 2016). Some reports have been shown that iron plaque may be a barrier to the uptake of heavy metals such as Cu, Ni, Mn and Cd (Taylor and Crowder, 1998; Otte et al.,1989). In rice plants, iron plaque can be formed and iron plaque has been shown to alleviate Cu, Ni and Zn toxicities (Zhang et al., 1998) and to change the uptake and translocation of P and As (Liu et al., 2004) in solution culture experiments. However, very few studies have been conducted on the effects of iron plaque on Cd absorption on the roots and its uptake and translocation in rice seedlings. Thus the aim of this study was to investigate the potential role of iron plaque on Cd uptake and translocation and to understand the interaction of Fe and Cd in paddy rice plant. MATERIALS AND METHODS
In this study 2 Australian rice cultivars (Vandana and Opus) were used to determine their capability of forming iron plaque. The hydroponic experiment was conducted in the Biology glasshouse with a controlled condition (day 28ºC/night 22ºC; relative humidity 75-85%) with cultures solutions. Rice seeds were surface sterilized in 1% NaOCl for 30 min and washed five times with deionized water. The seeds were germinated for 5 days at 30ºC on paper towel soaked with deionized water in controlled temperature room. After germination, uniform seedlings were selected and transferred into plastic pot. Each pot received 2 L nutrient solutions. The pH of the nutrient was adjusted to 5.5 with M NaOH and M HCl. Nutrient solution was renewed every 3 days. Three levels of Fe comprising 0, 50 and 100 mg L-1 were added as FeSO4.7H2O at 21 days after transferring the seedlings into hydroponic culture. Afterwards seedlings were grown in deionized water for 1 day and in nutrient solution for 2 days. Then the seedlings were subjected to three levels of Cd (0, 0.5 and 1 mg L-1). After 3 days of Cd treatment, seedlings were harvested, separated into root and shoot materials and thoroughly washed using MilliQ water. Iron plaque on root surfaces was extracted following dithionite-citrate-bicarbonate (DCB) extraction procedure (Taylor and Crowder 1998; Otte et al 1989). Root and shoot materials drying, grinding and digestion were done utilizing the techniques described by Rahman et al., 2009. The concentrations of Cd and Fe in root and shoot samples were determined by ICP-MS and ICP-OES, respectively.
M51-P14
Copyright © CRC CARE Pty. Ltd., 2019
CleanUp Conference 2019Adelaide, Australia
8 –12 September 2019281
Table of Contentsfor this manuscript

RESULTS AND DISCUSSION
CONCLUSION From this study, we found that addition of iron can minimize the Cd accumulation in rice seedling varied among the rice cultivars. REFERENCES Benavides, M. P., Gallego, S. M., & Tomaro, M. L. (2005). Cadmium toxicity in plants.
Brazilian Journal of Plant Physiology, 17, 21-34. Dong, M. F., Feng, R. W., Wang, R. G., Sun, Y., Ding, Y. Z., Xu, Y. M., ….Guo, J. K. (2016).
Inoculation of Fe/Mn-oxidizing bacteria enhances Fe/Mn plaque formation and reduces Cd and As accumulation in Rice Plant tissues. Plant and Soil, 404(1-2), 75-83. doi:10.1007/s11104-016-2829-x
Liu, W.-J., Zhu, Y.-G., Smith, F. A., & Smith, S. E. (2004). Do iron plaque and genotypes affect arsenate uptake and translocation by rice seedlings (Oryza sativa L.) grown in solution culture? Journal of Experimental Botany, 55(403), 1707-1713. doi:10.1093/jxb/erh205
Nogawa, K., & Kido, T. (1993). Biological monitoring of cadmium exposure in itai-itai disease epidemiology. International Archives of Occupational and Environmental Health, 65(1), S43-S46. doi:10.1007/BF00381306
Otte, M. L., Rozema, J., Haarsma, M.S., & Broekman, R. A. (1989). Iron plaques on roots of Aster tripolium L. : Interaction with zinc uptake. New Phytol 111: 309-317
Rahman, M. M., Owens, G., & Naidu, R. (2009). Arsenic levels in rice grain and assessment of daily dietary intake of arsenic from rice in arsenic-contaminated regions of Bangladesh—implications to groundwater irrigation. Environmental Geochemistry and Health, 31(1), 179-187. doi:10.1007/s10653-008-9238-x
Sebastian, A., & Prasad, M. N. V. (2015). Trace Element Management in Rice. Agronomy-Basel, 5(3), 374-404. doi:10.3390/agronomy5030374
Takahashi, R., Ishimaru, Y., Senoura, T., Shimo, H., Ishikawa, S., Arao, T. Nishizawa, N. K. (2011). The OsNRAMP1 iron transporter is involved in Cd accumulation in rice. J Exp Bot, 62(14), 4843-4850. doi:10.1093/jxb/err136
Taylor, G. J., & Crowder, A. A. (1998). Use of the DCB technique for extraction of hydrous iron oxides from roots of wetland plant. Am. J. Bot., 3, 611-617.
Zhang, X., Zhang, F., & Mao, D. (1998). Effect of iron plaque outside roots on nutrient uptake by rice (Oryza sativa L.). Zinc uptake by Fe-deficient rice. Plant and Soil, 202(1), 33-39. doi:10.1023/a:1004322130940
Figure 1 demonstrates that the Cd concentration in rice seedlings was influenced by Fe supply in the nutrient solution. The Cd concentration in shoot was 3.42 mg kg-1 and 6.80 mg kg-1, respectively, for Opus and 5.95 mg kg-1 and 12.43 mg kg-1, respectively, for Vandana with addition of 50 mg kg-1 Fe whereas 4.72 mg kg-1 and 5.26 mg kg-1 for 100 mg kg-1 Fe addition. The Cd concentration in rice shoot was decreased with addition of Fe supply as compared to control which were 49% and 29% for Opus and 38 % and 2% for Vandana with 50 mg kg-1 Fe addition whereas 30% and 45% for Opus and 23% and 21 % for Vandana with100 mg kg-1 Fe addition to culture solution. The results also showed that the Cd concentration in shoot of Vandana was higher than Opus, which indicated that Vandana is more susceptible to Cd.
Fig. 1. Cadmium concentration in shoots of rice seedlings
0.00
2.00
4.00
6.00
8.00
10.00
12.00
14.00
Cd in
sho
ots
(mg
kg-1
)
Vandana Opus
282
Table of Contentsfor this manuscript

COMPARING GROUNDWATER LEVEL FLUCTUATION UNDER DIFFERENT LAND USE SCENARIOS:
IMPLICATIONS TO REMEDIATION TREATMENT
Adnan Mohammed1, Dawit Bekele1, Sreenivasulu Chadalavada2, Scott Warner3, Ravi Naidu1,2
1Global Centre for Environmental Remediation (GCER) University of Newcastle, Callaghan
NSW, 2308, AUSTRALIA 2CRC Care Pty Ltd, ATC Building, the University of Newcastle Callaghan NSW, 2308
AUSTRALIA 3Ramboll Group, California USA
INTRODUCTION The selection and design of an appropriate remediation technology for contaminated groundwater must consider both short and long-term fluctuations the hydraulic head conditions of the impacted groundwater systems. Assessment of groundwater elevation (for an unconfined system), pressure head (for a confined system) and the three-dimensional hydraulic gradient characteristics are critical for selecting and designing effective and resilient remedies, in particular where climatic variability and change, or seasonal variables can affect these conditions. Scientific study and accumulated data is showing that long-term changes to climatic patterns can influence the groundwater hydrological system(Green, 2016) as well as the biogeochemical properties of groundwater (Panwar and Chakrapani, 2013). However, substantially less study has focused on evaluating how these long-term trends in groundwater level (whether due to climatic change, local land use influence, or other factors) affect the potential remediation of contaminated groundwater. As a first step in performing a comprehensive evaluation on the relationship between water level fluctuation and groundwater remediation approaches, we first compared groundwater level measurements for two project sites to consider how land use may affect groundwater hydraulic conditions. This evaluation also considers climatic influence to better understand the primary influence on long-term groundwater head patterns. METHODS Data sets for two specific areas in New South Wales (NSW) – the Condobolin area and Wee Waa area - selected and analysed by using a Pro UCL environmental analysis tool. . Data from 1969-2012 was analysed to study the groundwater level of two areas with 20 stations (10 each) of monitoring wells. The time period of analysis – 1969-2011 - as well as the areas of study and wells monitoring were selected to make a comparison between land use presence and no land use occurrence. A comparison between Condobolin and Wee Waa in NSW illustrated and analysed in regards to its groundwater level (the slopes of equation trends for 240 figures which we selected as a value for comparison because of huge amount of data and an obvious indictor of differences between GWL in trend). Groundwater levels were analysed for trends along with precipitation data acquired for the same approximate time period. Data analysis considered seasonal patterns and an analysis was made to evaluate estimated recharge conditions during both wet and dry period. RESULTS AND DISCUSSION Results show that the GWL was fluctuated differently through seasons along this period of time. As a huge amount of data we consider a slop of the equation’ trend as an indicator of comparison between those area and seasons. In terms of GWL fluctuation in land use area, Condobolin has more significant trend in land use area than wee Waa. However the fluctuation of GWL in Wee Waa with no land use area is less than the trend in Condobolin
M51-P15
Copyright © CRC CARE Pty. Ltd., 2019
CleanUp Conference 2019Adelaide, Australia
8 –12 September 2019283
Table of Contentsfor this manuscript

(Fig-2). In terms of seasonal fluctuation, it can be clearly seen that Condobolin in land use area has significant fluctuation in winter and spring according to groundwater extraction, while in no land use area a significant statically fluctuation on summer, autumn and winter can be shown. On the other hand, no significant statistical fluctuation can be recorded in Wee Waa in terms of land use area has, while on summer, autumn, winter, spring a fluctuated might be significantly seen . Using the slope of equation’ trend as an indicator because it is very obvious that as much as this slope value is dropdown or become negative the groundwater has recharged more (higher GWL) and vice versa (fig 1). A details of 240 graphs for this period of time have been analyzed and created which interpreted the relationship between recharge and groundwater level), Where less recharge will decrease GWL. In general these results show that significant increase in groundwater level can be recorded in the area of no land use, while significant decrease in groundwater level in the area of land use occurs. These results provide possible easy indicator about the inputs information on groundwater level fluctuation especially with paying attention to long-term trend of GWL and can inferred the changing climate as a recent and undoubted phenomenon.
Fig. 1. Comparison of GWL trend’s slopes on two locations in NSW seasonally since 1969.
Fig. 2. A comparison of slope value in equation ‘trend’.
CONCLUSIONS Investigating the groundwater level seasonally, where precipitation contribute for groundwater recharging. The variability of precipitation cause groundwater fluctuation which can influences the hydrological properties of groundwater system. Monitoring the groundwater level behaviour can be very crucial for further studying especially in regards to Applying of any remediation technology needs to consider the climate change factors and actions as a recent crucial impacts. Results have been found that area with land use occurs have more GWL fluctuation, Condobolin area has more GWL stability and recharge than Wee Waa, and finally autumn and winter have the higher recharge in both areas. REFERENCES GREEN, T. R. 2016. Linking climate change and groundwater. Intigrated groundwater
managment. Springer, Cham. PANWAR, S. & CHAKRAPANI, G. J. 2013. Climate change and its influence on groundwater
resources. Current Science, 37.
284
Table of Contentsfor this manuscript

PFAS BACKGROUND CONSIDERATIONS — SIGNIFICANT OR NOT?
Kathleen Prohasky1, Gaelle Ng1, Darren Reedy1, Ken Kiefer2
1ERM, PO Box 266, South Melbourne, VIC 3205, AUSTRALIA 2ERM, Locked Bag 3012 Australia Square NSW 1215, AUSTRALIA
INTRODUCTION It is well known that many materials can potentially contain Per- and poly-fluoroalkyl substances (PFAS). Materials that may include PFAS include new clothing (fabric treatments), stain and water resistant products, sunscreen, cosmetics, fast food wrappers, Teflon©, sampling containers with Teflon©-lined lids, foil, sticky notes, permanent markers, waterproof papers, drilling fluids, decontamination solutions and reusable freezer blocks. Numerous sources recommend taking a conservative approach for field sampling by eliminating these potential PFAS sources from the environmental sampling area (HEPA, 2018 and ITRC, 2018), however there is limited published research or guidance on how certain materials used by field staff affect sample results. Some testing of material found on PFAS sampling material exclusion lists (clothing exposed to commonly used insect repellents and submersible low-density polyethylene (LDPE) sampling equipment) did not detect PFAS above the LOR (2.5 ng/L). These results support the value of testing of sampling and field equipment to reduce the complexity of field sampling programs as a opposed to following generic guidance. Permanent markers, which are commonly used to label sample containers, are recommended to avoid during a soil sampling investigation with preference for ball point pen used instead. However, using ball point pens to label sample containers can introduce sample integrity issues such as faded or illegible sample information. This presentation presents the assessment of the potential for PFAS contamination between using ball point pens and permanent markers. METHODS To assess the potential effect from using stationary in the field a total of six soil samples (3 intra-laboratory duplicates and 3 inter-laboratory duplicates) were included to assess the magnitude of the effect (if any) of using a permanent marker instead of a ball-point pen. RESULTS AND DISCUSSION The PFAS analytical results between soil samples labelled using a pen and those using a permanent marker were generally higher in the samples collected using a permanent marker. There was a strong linear correlation between the intra-laboratory samples and primary samples. Greater variability was identified between inter-laboratory samples and primary samples. The results from the investigation were below the HEPA (2018) screening criteria for industrial soils by at least two orders of magnitude, therefore it is considered that the use of a permanent marker for labelling sample containers insignificant for the investigation.
M51-P16
Copyright © CRC CARE Pty. Ltd., 2019
CleanUp Conference 2019Adelaide, Australia
8 –12 September 2019285
Table of Contentsfor this manuscript

Fig. 1. PFAS constituent concentrations from soil samples collected using a ball-point pen and permanent marker. CONCLUSIONS The results indicated that the concentration variability between the samples collected with PFAS containing stationary and those that were not, was insignificant for the investigation and that the differences can be attributed to soil heterogeneity. REFERENCES Bartlett, S.A. and Davis K.L. (2018) Evaluating PFAS Cross Contamination Issues.
Remediation. 28:53–57. Heads of EPAs Australia and New Zealand (HEPA) (2018) PFAS National Environmental
Management Plan. Interstate Technology Regulatory Council (ITRC) (2018) Site Characterization
Considerations, Sampling Precautions, and Laboratory Analytical Methods for Per- and Polyfluoroalkyl Substances (PFAS).
286
Table of Contentsfor this manuscript

EFFECT OF AMENDMENTS ON WATER USE EFFICIENCY IN RICE WHEAT CROPPING SYSTEM UNDER LIGHT TEXTURE SOIL
Yanendra K. Singh, Rajendra Prasad
Department of Soil Science and Agricultural Chemistry, Bihar Agricultural University, Sabour,
Bhagalpur, Bihar 813210, INDIA [email protected]
INTRODUCTION North Bihar is dominated by light textured calcareous soils known to have poor soil water relations, high infiltration rate and hydraulic conductivity along with the low water use efficiency resulting from low total porosity. Poor soil water relations are exhibited due to lower proportion of fine fractions of soil separates resulting in poor soil physical condition. Low moisture and moisture induced nutrient stress gives poor crop yield and low water use efficiency. METHODS The effect of various amendments on water use efficiency under rice-wheat cropping system was evaluated in a field experiment with three replications in a split plot design with un-irrigated and irrigated main plots split to include a control, sulphitation press mud @ 10 t/ha, fly ash @ 10 t/ha, sulphitation press mud @ 10 t/ha + fly ash @ 10 t/ha and clay soil @ 50 t/ha in sub plots. RESULTS AND DISCUSSION The water use efficiency of rice crop was statistically similar in irrigated and unirrigated conditions. Water use efficiency was statistically greater with application of sulphitation press mud @ 10 t/ha + fly ash @ 10 t/ha in comparison to other treatments. This was followed by sulphitation press mud @ 10 t/ha, fly ash @ 10 t/ha, clay soil @ 50 t/ha and minimum in control. Application of fly ash and organic fertilizers has also been reported to have the best effect on the water use efficiency and yield (Wang et al., 2018). However, the water use efficiency of wheat crop increased significantly in irrigated as compared to unmitigated condition. The residual effect of amendments applied to the rice crop was found to be significant with maximum value of water use efficiency (Kg/ha mm) resulting from application of sulphitation press mud @ 10 t/ha + fly ash @ 10 t/ha followed by sulphitation press mud application @ 10 t/ha, fly ash applicatioin @ 10 t/ha, clay soil application @ 50 t/ha and minimum in control. Singh et al. (2002) had also reported that application of fly ash treated soil increased the water use efficiency in comparison to un-treated soil. Soil physical properties along with soil water relations were significantly influenced by the application of amendments over the two year duration of the study. Application of fly ash to a sandy soil has been reported to effectively reduced infiltration rate and increase soil water retention (Zhao et al., 2009). These interventions have the potential to reduce the intermittent water stress in rice wheat rotation resulting in higher yield and higher water use efficiency. The effect of irrigation in rabi season is more prominent. CONCLUSIONS Application of amendments improved soil water relations along with physical properties of soil resulting in increased in crop growth , grain and straw yield. This ultimately resulted in higher water use efficiency. The sequence of favorable effects were found in SMP+FA > SPM>FA> Clay soil > Control in both un-irrigated and irrigated soil.
M51-P17
Copyright © CRC CARE Pty. Ltd., 2019
CleanUp Conference 2019Adelaide, Australia
8 –12 September 2019287
Table of Contentsfor this manuscript

REFERENCES Singh, C.B.; Oswal, M.C. and Grewal, K.S. (2002) Impact of fly ash application on
consumptive and water use efficiency in wheat under different soil. Indian Journal of Agricultural Sciences. 72(7)396-399.
Wang, Q. Pang, Z. and Wei, Y. (2018) Effect of fly ash and organic fertilizer on the water use efficiency. IOP Conf. series; Materials science and Engineering 394 (2018) 032072 doi: 10.1088/1757-899X/394/3/032072.
Zho, L., Tang, Z. and Liu, F. (2009) Laboratory test of fly ash use as a Sandy soil amendments and its effect on soil water. (2009) Huanjing Kexue Xuebao/Acta Scientiae circumstantiae 29 (a): 1951-57.
288
Table of Contentsfor this manuscript

SCREENING OF AUSTRALIAN NATIVE PLANT SPECIES FOR RHIZOREMEDIATION OF PETROLEUM HYDROCARBON
CONTAMINATED SOILS
Anh Hoang1, Dane Lamb1, Balaji Seshadri1, Binoy Sarkar2, Liang Wang1, Ying Cheng1, Nanthi Bolan1
1Global Centre for Environmental Remediation, The University of Newcastle, Callaghan,
NSW 2308, AUSTRALIA 2Department of Animal and Plant Sciences, the University of Sheffield, UK
INTRODUCTION Rhizoremedation is the use of plants and their associated microorganisms for the breakdown of contaminants in soils. It has been gained increasing public acceptance and is suggested to be the primary mechanism responsible for hydrocarbon degradation in plant-assisted bioremediation efforts (Gaskin et al., 2010). The objective of this study was to screen different Australian native plants for their ability to enhance the removal of aliphatic hydrocarbons mainly petroleum hydrocarbons in soils, for further investigation of their rhizoremediation potential. The provision of suitable candidates for this remediation technology would offer an economically feasible and environmentally sustainable option for the rehabilitation of petroleum hydrocarbon contaminated sites in Australia. MATERIAL AND METHODS Time-course pot experiments were conducted under greenhouse conditions with eight native plant species (Acacia inequilateral, Acacia pyrifolia, Acacia stellaticeps, Banksia seminuda, Chloris truncata, Hakea prostrata, Hardenbergia violacea, and Triodia wiseana) with soils artificially contaminated with a 50:50 diesel:oil mixture at 0, 0.5, and 1% (w/w) concentrations. Plants were cultivated for 150 days and at the end of the experiment, plant growth performance, soil respiration, soil dehydrogenase activity (DHA), and residual total petroleum hydrocarbon (TPH) concentration in soils were evaluated. Results were compared to unplanted control treatments. RESULTS AND DISCUSSION The results indicated that plant growth was stunted in the contaminated soils compared to the uncontaminated soils; however, differences among plant species for relative growth performance demonstrated that they varied in their tolerance to the petroleum hydrocarbon contaminated soils (Figure 1). In addition, there was a higher soil respiration in all planted soils than unplanted soils, possibly due to rhizosphere effect. From our data, TPH contaminated soil stimulated the development of cluster root in members of the Proteacea family, suggesting a possible mechanism for TPH tolerance.
Figure 1. Relative Growth Performance of eight plant species in TPH contaminated soils
M51-P18
Copyright © CRC CARE Pty. Ltd., 2019
CleanUp Conference 2019Adelaide, Australia
8 –12 September 2019289
Table of Contentsfor this manuscript

CONCLUSIONS Overall, these results suggest that some Australian native plants can be tolerant to petroleum hydrocarbon-contaminated soils. However, to maximize their rhizoremediation potential, further investigations need to be conducted. REFERENCES Gaskin, S. E., and Bentham, R. H. (2010). Rhizoremediation of hydrocarbon contaminated
soil using Australian native grasses. Science of the Total Environment 408, 3683-3688.
290
Table of Contentsfor this manuscript

ASBESTOS: ENVIRONMENTAL HEALTH INEQUALITIES BETWEEN DEVELOPED AND DEVELOPING NATIONS
Getachew D. Gebreeyessus1,2, Meron Worku3, Belina Terfassa4, Dawit N. Bekele2,5
1Dept of Urban Environmental Management, Kotebe Metropolitan University, ETHIOPIA
2YEKA Environmental Solution Pty Ltd, Addis Ababa, ETHIOPIA 3College of Health and Medical Sciences, Kotebe Metropolitan University, ETHIOPIA
4Department of Chemistry, Kotebe Metropolitan University, ETHIOPIA 5GCER, University of Newcastle, Callaghan NSW 2308, AUSTRALIA
INTRODUCTION Global consumption of asbestos is estimated to be about 2 million tons in 2009 (Frank and Joshi, 2014). Every 20 tons of asbestos produced and consumed kills a person somewhere in the world (Furuya et al., 2018). Asbestos-caused cancer was identified in the late 1930s but despite today’s overwhelming evidence of the strong carcinogenicity of all asbestos types, it is still widely used globally. Over the past few decades, there has been a significant decline in cancers attributable to environmental and occupational carcinogens of asbestos in high-income countries. However for low- to middle-income countries, these exposures are likely to increase as industrialization expands and populations grow (Hashim, 2014). In addition to non-occupational factors, such as tobacco smoking, malnutrition, and infectious diseases, less-developed countries face occupational and environmental carcinogens that significantly contribute to cancer incidence and mortality burden. Asbestos use is banned in 55 countries. However, the reality shows that following the ban of new productions and uses of asbestos-containing materials (ACM) in a developed nation, a significant surge of imported ACM is reported in the developing nations. Alarmingly, asbestos products are still popular in developing countries include those construction products such as roofing corrugated asbestos-cement sheet and shingles, thermal insulation, asbestos cement pipe and fittings, vinyl carpets and brake shoe and clutch linings, etc (Harris and Kahwa, 2003). Non-occupational exposure to ACM and asbestos-related diseases (ARDs) have been a global concern for decades. However, ACM usage is increasing in developing countries while no regulation is in place and the assessment of health impact remains obscure. Despite the ban for its use in a number of countries particularly developed nations, rates of asbestos use are rising in developing countries where it meets immediate demands for housing, building materials, and employment. In spite of the severe health warnings and considerable hazards, asbestos is still widely used in many developing countries for constructions of schools, residential and office buildings, especially within the African Region. This is primarily due to the lack of comprehensive legislation and enforcement policies, nonexistence of public awareness and health priority matters. Therefore, Identifying asbestos uses and epidemiological studies accounting for socio-cultural and economic analyses in pursuit of establishing reliably policy that protect the health effects of ACM in developing countries such as Ethiopia is an important research endeavor with broad relevance to science and public health. METHODS An integrative review which includes thematic analysis, site, and institutional survey and discussion has been applied in this study for case in Ethiopia. Field observation for the case study was conducted at randomly selected ACM constructed buildings in Addis Ababa and elsewhere in the country. Meeting and questionnaire survey was used to evaluate the current legislation and awareness of relevant government stakeholders. In addition to field survey, a quantitative assessment from relevant government ministries and offices to assess the extent of the problem i.e., asbestos productions in Ethiopia, the quantity of ACM import and current state of regulation in Ethiopia.
M51-P19
Copyright © CRC CARE Pty. Ltd., 2019
CleanUp Conference 2019Adelaide, Australia
8 –12 September 2019291
Table of Contentsfor this manuscript

RESULTS AND DISCUSSION In Ethiopia, asbestos has been used as a construction material for over five decades or longer. It is still being imported in millions of tons every year in its different forms. However, there is no policy and regulations on the type of ACM imported and how it is used with no public awareness on the health impact. Hence, ACM crushing, indiscriminately discarding and reusing are common practices in Ethiopia if not in most developing countries’ communities (refer to figure below). Zimbabwe remains the leading African country in this regard ascribed to its asbestos mineral occurrence and ban export.
Figure 1 Asbestos material indiscriminate discharge in Ethiopia
CONCLUSION It is apparent from the above, environmental health inequities related to ARD require a broad socio-economic analysis, including issues outside the health domain at the international and local scale (e.g., international trade regulation, economic relationships between asbestos exporting/importing countries). Sharing knowledge concerning ARD and policies and capacity building to developing nations and literacy. ARD can and should be prevented, the most efficient way is promoting capacity building and creating awareness targeted to developing countries such as that of the initiative by globalCARE Alliance – CRC CARE. REFERENCE Frank, A.L. and Joshi, T.K., 2014. The Global Spread of Asbestos. Annals of Global Health,
80(4): 257-262. Furuya, S., Chimed-Ochir, O., Takahashi, K., David, A. and Takala, J., 2018. Global
Asbestos Disaster. International journal of environmental research and public health, 15(5): 1000.
Harris, L.V. and Kahwa, I.A., 2003. Asbestos: old foe in 21st century developing countries. Elsevier.
Hashim, D.a.B., P.,, 2014. Occupational and Environmental Exposures and Cancers in Developing Countries. Annals of Global Health, 80(5), pp.393–411. DOI: http://doi.org/10.1016/j.aogh.2014.10.002.
292
Table of Contentsfor this manuscript

DYNAMIC BIOPILES AS A METHOD OF ENHANCED BIOREMEDIATION OF GASWORKS POLYCYCLIC AROMATIC
HYDROCARBON IMPACTED SOIL
Mark Stuckey1, Temma Carruthers-Taylor2, Susan C. Wilson3, Philip Mulvey2
1Environmental Earth Sciences, 3/1 Ross Street, Newstead, Brisbane, 4006, AUSTRALIA
2Environmental Earth Sciences, 98, Maribyrnong Street, Melbourne, 3011, AUSTRALIA 3School of Environmental and Rural Science, University of New England, Armidale, 2351,
AUSTRALIA [email protected]
INTRODUCTION Polycyclic Aromatic Hydrocarbons (PAHs) are the product of incomplete combustion of organic material and their extensive environmental contamination is a significant international concern. PAHs occur in the environment in primarily two forms. An available form which exists in solution, sorbed to particles or organic matter and normally applied to the solid matrix in liquid form normally (condensate). PAHs also are the degradation products of Black Carbon including activated carbon, soot, char and ash. Black Carbon PAHs are non-bioavailable due to the strength of the black carbon bond. Thus, different origins of PAHs results in different availability and different toxicity outcomes. Confirming that bioremediation is “the most important process determining the fate of PAHs in soil” (Chekol, 2005), and is critical to successfully remediation of soil. This case study discusses results from the Wagga Wagga Tarcutta Street, Yass, Cootamundra and Molong gasworks using the innovative process of Dynamic Biopiles. Removal of primary gas condensates was performed by utilising detailed PAH characterisation, stimulation of the indigenous soil microbes, and knowledge of chemistry. METHODS All soil from the four gasworks followed a similar protocol. As an example, 9000 tonnes of soil from Wagga Wagga Tarcutta Street gasworks (Oct 2013-Feb 2015) was separated into seven biopiles. The indigenous soil microbes were stimulated by applying soil nutrients and ameliorants/ organic material. Low solubility was overcome using our surfactant (EESI-Solv 18). Remediated soil concentrations were compared to conservative site-specific criteria (partially developed as a human health and ecological risk assessment) for TPH and PAH concentrations, using statistical analysis (e.g. correlation coefficients and 95% UCL). A four lines of evidence approach was used for verification of remediation:
• Degradation studies over time, using in-depth TPH and PAH analysis. In particular, PAH fingerprinting (determining source, toxicity and bioavailability in soil) was used throughout the project following methods described by Mulvey and McKay (2006).
• PAH bioavailability, derived from availability, concentration and exposure pathways, using a very conservative oral bioavailability of 0.1 (NEPC, 2013, Schedule B7);
• Leachability using a toxicity characteristics leachate procedure (TCLP) multi-extraction procedure (MEP);
• Phytotoxicity (lucerne) germination and earthworm test, done in four replicates in randomised design.
RESULTS AND DISCUSSION For Wagga Wagga soil the sum of PAH was initially 49,429 mg/kg and extremely odorous and was reduced to a mean of 833 mg/kg with no to little odour, with a mean concentration reduction of 98.3% (Table 1). Through the four lines of evidence approach it was demonstrated that the primary gas condensates (coal tar, naphtha oil, creosote, ammoniacal liquor) found in the soils were predominately easily degradable, while the pyrogenic residues
M51-P20
Copyright © CRC CARE Pty. Ltd., 2019
CleanUp Conference 2019Adelaide, Australia
8 –12 September 2019293
Table of Contentsfor this manuscript

or black carbon component (coke, ash, clinker, charcoal) were non-leachable and did not impact legume or earthworm health. Table 1. The mean concentration reduction of TPH with different ring structures and total PAHs after dynamic biopile remediation was applied, n= 7. Compound type 2-ring 3-ring 4-ring 5-ring 6-ring Total PAHs Reduction after remediation (%)
99.8 98.3 95.8 94.3 94.1 98.3
Degradation At the completion of remediation PAH fingerprinting clearly demonstrated that the abundance of PAH remaining in the stockpiles was pyrogenic residue (coke and ash), which were demonstrated to have a low bioavailability. All gas condensates were removed from the soil as part of the bioremediation process. Bioavailability and leachability The TCLP MEP leachate results indicated that only naphthalene, acenaphthylene and acenaphthene were detectable, with low calculated bioavailability factors (≤0.023%). This indicated that all remaining higher molecular weight PAH compounds (fluorene to benzo(g,h,i)perylene) were non-leachable. Phytotoxicity and earthworm test Lucerne phytotoxicity trial results showed no significant difference in germination rates between the control and soil from stockpiles. The earthworm tests found that there was no difference between the survival of worms in a control of uncontaminated soil and two remediated soils from stockpiles, allowing the soil to be used off-site. Other Gas Works Other gas works remediated in NSW at a similar time all showed similar success to Wagga Wagga Material for the same time duration (data presented in oral presentation). CONCLUSIONS This technique found over 95% destruction of total PAHs by a highly active microbial community. A very effective treatment process resulted in complete reduction in odour emissions and hazardous leachate; and no detectable increase in phytotoxcity or earthworm mortality within the treatment stockpiles. This technique demonstrates remediation of PAH and TPH compounds is technical and commercial viable and has now been applied to gas works at over 20 different sites including these 4 sites in southwestern NSW. Detailed site knowledge of PAHs, specifically their source, concentration, toxicity and bioavailability in soil, at the commencement of a bioremediation program allowed for a design that delivers successful destruction of hazardous PAHs. REFERENCES Chekol, T., 2005. Remediation of persistent organic pollutants (POPs) in two different soils.
Remediation Journal: The Journal of Environmental Cleanup Costs, Technologies & Techniques, 16(1), pp.117-139.
Mulvey, P. and McKay, C. 2006, A method of PAH source identification and bioavailability assessment. International Symposium and Exhibition on the Redevelopment of Manufactured Gas Plant Sites. Reading, UK.
National Environment Protection Council (NEPC), 2013, National Environment Protection (Assessment of Site Contamination) Amendment Measure (NEPAM 2013).
294
Table of Contentsfor this manuscript

PERFLUOROOCTANOIC ACID (PFOA) INDUCED BEHAVIORAL IMPACTS IN C. ELEGANS
Tanmoy Sana, Manjurul Islam Chowdhury, Logeshwaran Panneerselvan,
Rajarathnam Dharmarajan, Megharaj Mallavarapu
Global Centre for Environmental Remediation (GCER), Faculty of Science and Information Technology, The University of Newcastle, Callaghan, NSW 2308, AUSTRALIA
INTRODUCTION Perfluorocarboxylic Acids (PFCAs) are a group of man-made chemicals that are highly persistent in the environment. PFCAs have been widely detected in the soil and water environments due to their manufacture and usage in several commercial and industrial applications (Paul et al., 2009). Numerous publications have reported on the occurrence of perfluorinated chemicals in the work environment as well as in the nature (Giesy and Kannan, 2001, Kissa, 2001). Industrial and urban areas are the hot spots of PFAS uses (Hekster et al., 2003). Among the PFAAs, Perfluorooctanoic acid (PFOA) is extensively found in the environmental samples, fauna, and humans all over the globe. PFOA is one of the most studied perfluorinated compounds which is considered to be moderately toxic to mammals (U.S.EPA., 2002), bio-accumulative (Houde et al., 2006), and resistant to abiotic and biotic degradation (Brendel et al., 2018). Several researchers recommended that Caenorhabditis elegans (C. elegans) is an excellent toxicity model for its predictability of results in higher eukaryotes. In this study, C. elegans was exposed to different concentrations of PFOA to observe the toxic effects. MATERIALS AND METHODS PFOA (≥ 98% purity) was purchased from Sigma-Aldrich. The stock solution was diluted in K-medium. Wild-type N2 C. elegans were cultured at 20 C in nematode growth medium (NGM) and fed with Escherichia coli strain OP50 (Stiernagle, 2006). The synchronized nematodes were cultured for 40 h to L4 stage, then all the exposure experiments were performed with PFOA (0.001, 0.01, 0.1, 0.5, 1, and 2 μM). To measure the LC50, synchronized C. elegans (L4 larvae) were exposed to various concentrations of PFOA (13 different concentrations from 0.25 to 500 μM) (Yu et al., 2017). K-medium was utilized as a control. Dead nematodes, identified through the external stimulation, were counted after 48 h. To measure generation time, the time from P0 egg to the F1 egg time was counted through inspection. For assessing brood size, nematodes were monitored and transferred to a new well every 1.5 days. Egg and larvae at all stages were counted and recorded. Growth was assessed by the body length of nematodes using TCapture software. For life span assay, the exposed and progeny animals were picked onto the assay plates and the time was recorded as t=0. About 20 animals were placed into a single plate and adult animals were transferred every 2 days to fresh plates during the brood period. To determine the head thrashing and body bending, animals were washed with the double-distilled water, followed by washing with K medium. After a 1- min recovery period, the head thrashes were counted for 1 min. Body bending frequencies were scored for the number of body bends in an interval of 20 s. Fifteen animals were examined per treatment. Three replicates were performed for each experiment. RESULTS AND DISCUSSION In this study, C. elegans had been used to assess its behavioural response towards PFOA exposure. LC50 value of PFOA was found to be 4.5 μM. Locomotion behaviour was measured through body bending and head thrashing of nematodes. There was a significant reduction of head thrashing (p < 0.001) but in case of body bending, significant reduction (p<0.05) were found only at higher concentrations of PFOA. A reduction in growth patterns
M51-P21
Copyright © CRC CARE Pty. Ltd., 2019
CleanUp Conference 2019Adelaide, Australia
8 –12 September 2019295
Table of Contentsfor this manuscript

were observed with the increase in concentrations of PFOA. Brood size was significantly reduced (p<0.001) at higher concentrations. In this study life span of exposed nematodes were examined and no significant association was observed with PFOA concentration. No significant relationship was found between generation time and PFOA exposure in C. elegans.
CONCLUSION The present study demonstrated that PFOA exposure caused a reduction in locomotor behaviour and decline in brood size in C. elegans. However, no significant alterations were noted in the case of generation time, growth and life span of C. elegans. REFERENCES BRENDEL, S., FETTER, É., STAUDE, C., VIERKE, L. & BIEGEL-ENGLER, A. 2018. Short-
chain perfluoroalkyl acids: environmental concerns and a regulatory strategy under REACH. Environmental Sciences Europe, 30, 9.
GIESY, J. P. & KANNAN, K. 2001. Global distribution of perfluorooctane sulfonate in wildlife. Environmental science & technology, 35, 1339-1342.
HEKSTER, F. M., LAANE, R. W. & DE VOOGT, P. 2003. Environmental and toxicity effects of perfluoroalkylated substances. Reviews of Environmental Contamination and Toxicology. Springer.
HOUDE, M., MARTIN, J. W., LETCHER, R. J., SOLOMON, K. R. & MUIR, D. C. 2006. Biological monitoring of polyfluoroalkyl substances: a review. Environmental science & technology, 40, 3463-3473.
KISSA, E. 2001. Fluorinated surfactants and repellents, CRC Press. PAUL, A. G., JONES, K. C. & SWEETMAN, A. J. 2009. A first global production, emission,
and environmental inventory for perfluorooctane sulfonate. Environ Sci Technol, 43, 386-92.
STIERNAGLE, T. 2006. Maintenance of C. elegans (February 11, 2006), WormBook, ed. The C. elegans Research Community, WormBook, doi/10.1895/wormbook. 1.101. 1.
U.S.EPA. 2002. Revised draft hazard assessment of perfluorooctanoic acid and its salts. USA: Environmental Protection Agency,Office of Pollution Prevention and Toxics, Risk Assessment Division.
YU, Z., SUN, G., LIU, Y., YIN, D. & ZHANG, J. 2017. Trans-generational influences of sulfamethoxazole on lifespan, reproduction and population growth of Caenorhabditis elegans. Ecotoxicology and environmental safety, 135, 312-318.
Figure: (A) Locomotion behaviour & (B) Brood size assay after 48 hours of PFOA exposure. *P < 0.05, ** P < 0.001
296
Table of Contentsfor this manuscript

LIMITING MIGRATION OF PFAS ― GROUNDWATER AND SURFACE WATER: APPLICATION OF MATERIALS AND METHODS
FOR IN-SITU PERMEABLE REACTIVE BARRIERS (PRB)
John A. Collins, John Hull
AquaBlok, Ltd., 175 Woodland Ave., Swanton, OH 43558, USA [email protected]
BACKGROUND When contamination in soil impacts surface water or groundwater and this reaches sensitive receptors in water bodies (i.e. lakes or rivers), the impact, cost and level of complexity for remediation typically increases dramatically. To date, pump and treat systems have been the primary approach used to limit the groundwater migration and attempt to reduce contaminant concentrations. However, these systems are expensive to operate/maintain and do not address surface water run-off. Many pump and treat systems for other contaminants have been running for decades without meeting goals or regulatory requirements. As a result, a number of projects have looked at alternative passive approaches to reduce costs, minimize or prevent the potential transfer of contamination to receiving water bodies. Control of PFAS impacted groundwater and surface water, particularly in areas adjacent to rivers or other bodies of water is an important capability that can reduce impacts on water sources and habitat. Permeable reactive barriers (PRB) have been demonstrated to be effective at intercepting and limiting the migration of a range of contaminants. In particular, examples include petroleum related facilities including pipelines, storage and distribution facilities and sites where PFAS contamination is present. Such an approach will protect sensitive ecological areas (including wetlands and stream crossings) in a manner that minimizes the potential impact to the existing habitat. APPROACHES/ACTIVITIES Materials and construction methods with respect to the design of a PRB to address PFAS in surface water and groundwater involve the use of best available technology. Materials include the application of an aggregate coated with adsorptive or reactive materials These materials, known commercially as AquaGate, have been applied in a range of PRB applications to address groundwater to surface water discharge of petroleum and PAHs. The design and treatment approach can incorporate the use of a funnel & gate design to include re-direction of groundwater to a permeable barrier and/or the use of these adsorptive materials to address contamination in surface water drains. RESULTS/LESSONS LEARNED Case studies and data establish an overview of materials that have been applied to both isolate (low-permeability) and treat (via adsorptive amendments). Examples include the use of AquaGate to deliver powdered activated carbon (PAC), organoclays, and other proprietary adsorptive materials focus on both petroleum and PFAS related sites and applications. Compared to the high cost of excavation and off-site disposal of contaminated soils, a PRB design can provide a cost-effective, in-situ, passive alternative to pump-and-treat that can minimize the potential movement and impact of petroleum and PFAS contamination from upland areas into surface water.
M51-P22
Copyright © CRC CARE Pty. Ltd., 2019
CleanUp Conference 2019Adelaide, Australia
8 –12 September 2019297
Table of Contentsfor this manuscript

BIOAVAILABILITY REDUCTION OF CADMIUM IN BIOSOLIDS BLENDED WITH LIMESTONE IN AGRICULTURAL UTILIZATION
Thammared Chuasavathi1,2, Sireepron Kamsopa1, Balaji Seshadri3, Nanthi S. Bolan3
1Department of Soil Science and Environment, Faculty of Agriculture, Khon Kaen University,
Khon Kaen, 40002, THAILAND 2Research Center for Environmental and Hazardous Substance Management, Khon Kaen
University, Khon Kaen, 40002, THAILAND 3Global Centre for Environmental Remediation, University of Newcastle,
Callaghan, NSW 2308, AUSTRALIA
INTRODUCTION At present, millions of biosolids are annually generated globally and their production is likely to rise due to the increasing population and expansion of sewage treatment plants in many countries. One reasonable and economical way to dispose of biosolids is to use them on land, especially agricultural area. This practice is becoming increasingly important in many countries because, biosolids are potentially a valuable resource containing 40-60% organic matter, macronutrients and micronutrients essential for plant growth (Chuasavathi et al., 2014; Bolan et al., 2003). However, the major problem in using biosolids for land application is that they can act as a source of metal input on land and form soluble metal complexes that are subject to leaching (Chuasavathi et al., 2014; Bolan et al., 2008). One suitable way to overcome this problem before applying them on land is to compost biosolids with other materials such as limestone. These materials can enhance metal immobilization. The co-composted biosolids product can be safely used as a source of carbon and nutrients having a minimal impact on the bioavailability of heavy metals. Therefore, this study aims to investigate the bioavailability reduction of cadmium in biosolids blended with different concentration of limestone. METHODS The biosolids sample used in this experiment was collected from the Wastewater Treatment Plant in Bangkok, Thailand (Table 1). Similarly, limestone was obtained from The Lime Stone Company in Bangkok, Thailand. The biosolids sample was air dried and sieved to < 2 mm using stainless steel sieve and then mixed with a concrete mixer to make a homogenized sample. Incubation experiments were conducted to examine the effect of lime stone on the redistribution of cadmium in the biosolids. The experimental treatments consisted of control (only biosolids without limestone), addition of limestone (10, 20 and 30% w/w basis). All treatments were in triplicate and incubated for five months under aerobic condition at 70% field capacity and room temperature. When biosolids incubation study was completed, biosolids samples were analyzed for the NH4NO3 extractable Cd in the sequential extraction using ICP-OES. RESULTS AND DISCUSSION The materials used in the study had contrasting pH (Table 1); limestone was mainly used as an alkalizing agent to reduce the bioavailability of Cd in biosolids.
Table 1 Some chemical characteristics of biosolids and limestone
Material pH EC Total N Total P Total K Cd (mS/cm) (%) (%) (%) (ppm)
Biosolids 4.90 6.62 5.50 0.55 0.02 1.19 Limestone 8.94 0.04 - - - 0.02
M51-P23
Copyright © CRC CARE Pty. Ltd., 2019
CleanUp Conference 2019Adelaide, Australia8 –12 September 2019 298
Table of Contentsfor this manuscript

The addition of limestone significantly reduced the bioavailable (NH4NO3 extractable) Cd in biosolids (Figure 1). However, the increase in the rate of limestone addition did not affect the reduction in bioavailability. The relationship between pH and bioavailable Cd was significant with an R2 value of 0.9935 (Figure 2).
Figure 1 Effect of lime stone (10, 20, 30 % w/w basis) on the NH4NO3 extractable Cd in biosolids at the end of the incubation period
Figure 2. Relationship between pH and cadmium bioavailability as affected by limestone addition CONCLUSIONS The results found that limestone addition has reduced the bioavailability of Cd. The rate of addition of limestone needs to be increased two folds to achieve better results. REFERENCES Chuasavathi, T., N.S. Bolan, R. Naidu and B. Seshadri. 2014. Biosolids-Based Co-
Composts Reduce the Bioavailability of Heavy Metals. ISHS Acta Horticulturae 1018: I International Symposium on Organic Matter Management and Compost Use in Horticulture (published : DOI : 10.17660/ActaHortic.2014.1018.72)
Bolan, N.S., Adriano, D.C., Duraisamy, P. and Mani, A. 2003. Immobilization and phytoavailability of cadmium in variable charge soils. III: Effect of biosolids compost addition. Plant and Soil. 256, 231-241.
Bolan, N.S., Ko, B.G., Anderson, C.W.N., Vogeler, I., Mahimairaja, S. and Naidu, R. 2008. Manipulating bioavailability to manage remediation of metal-contaminated soils. Developments in Soil Science. 32, 657-678.
299
Table of Contentsfor this manuscript

FLYASH — ATTRIBUTES, UTILIZATION AND MITIGATION STRATEGIES FOR ECO-FRIENDLY MANAGEMENT
Sudha J. Kohli, Dinesh Goyal2
1Department of Biotechnology, Tilkamanjhi Bhagalpur University, Bhagalpur, Bihar 812001,
INDIA 2Department of Biotechnology, Thapar University, Patiala, Punjab 147004, INDIA
INTRODUCTION One of the most critical reasons for loss of soil and its quality has been the pressure of anthropogenic activities. Deforestation, pollution, increasing percentage of degraded lands and wastelands, dumping of industrial waste in landfills etc. has resulted in loss of soil biodiversity, productivity, fertility, disturbance in biogeochemical and nutrient cycles, respectively. In this context, the disposal and utilization of coal-based industrial waste such as fly ash, in an environment- friendly manner, has assumed an epic significance needing immediate redressal in the form of mitigation strategies. FLY ASH UTILIZATION STATISTICS Fly ash is a heterogenous ferroaluminosilicate waste generated in large quantities upon combustion of coal in thermal power plants. In India coal-based power generation is almost 90 % in 85 thermal power plants and approximately more than 235 mt per annum of fly ash is generated and this figure is expected to exceed 1000 mt by 2031-32 (Yadav and Fulekar, 2018). Globally the increase in coal-based electricity generation is expected to exceed 46% by 2030 (Gajić, 2018) which is an indicator of the proportion of expected fly ash generation.
FLY ASH IMPACT ON SOIL - AN INCLUSIVE AND COMPREHENSIVE PERSPECTIVE Fly ash has a heterogenous architecture based on its geothermal origin and can be used as a soil ameliorant for reclamation of wastelands in combination with organic manure, lime, gypsum, compost, made into granulated material or into potassium silicate fertilisers (Jala and Goyal, 2006). Fly ash has enhancing properties based on its acid neutralization and buffering capacity which has been reported to remediate metal-contaminated soil (Diatta et al. 2017), presence of essential plant nutrients, fine particles which improve water holding capacity of soil and decreases bulk density thus facilitating nutrient uptake by plants and growth of different microbial identified from soil amended with fly ash at optimum dose (Nayak et al, 2015). Fly ash is made of very fine particles and crystalline and amorphous phases have been observed with X- Ray diffraction (Long et al., 2019). The dominance of silt-sized particles renders the characteristic of bulk density reduction and increase in water holding capacity in fly ash amended soil (Jala and Goyal, 2006). Fly ash is predominantly composed of essential and trace elements which make a versatile soil ameliorant in terms of it buffering and neutralization capabilities. In addition it can help in enhancing availability of elements S, Bo and Mo in soil for the benefit of plants (Panda and Biswal, 2018) by positively influencing soil redox potential, temperature etc. (Wang et al. 2018). Several studies have reported the synergistic benefits of fly ash at an appropriate dose and a co-ameliorant such as sewage sludge or compost on microbial health, based on increased CEC and soil aggregation thus immobilizing heavy metals . Fly ash added at optimum dose of 10 % has been reported to benefit bacterial population, enzyme activity and microbial biomass (Kohli and Goyal, 2010). Soil dehydrogenase activity and rate of carbon-dioxide evolution have been studied as a function of substrate availability in fly ash amended soil supplemented with glucose as carbon source (Kohli and Goyal, 2014). Addition of fly ash at an optimum dose of 5-10% in soil in combination with a suitable co-ameliorant such as glucose can benefit soil microbial activity (Kohli and Goyal, 2014; Noyce et al. 2017).
M51-P24
Copyright © CRC CARE Pty. Ltd., 2019
CleanUp Conference 2019Adelaide, Australia8 –12 September 2019 300
Table of Contentsfor this manuscript

CONCLUSIONS One of the most significant aspect of the fly ash based soil remediation can be exploring ecological potential of plants and forestry species (Acacia, Eucalyptus, Poplar etc.) for environmental clean-up in fly ash landfills or dumping grounds (Gajić and Pavlović 2018). Recyling programmes have been designed in which fly ash has been used as building material, in brick manufacturing, for dyke raising, as a backfill for road costruction and pavements, as a soil stabilisation agent,for zeolite synthesis etc (Gajić et. al. 2018).Fly ash from different geotthermal origins can be used as a soil ameliorant after careful assessment of its properties and scientific substantiation. The utilization of fly ash in remediation programmes for mining sites, waste lands, in agriculture and forestry projects in optimum doses, in addition to it being utilized in conjunction with other soil ameliorants, can be a holistic approach in solid waste management. The physico-chemical properties of fly ash and its effect on soil microbial health when used alone, and in combination with other soil ameliorants, such as manure, sewage sludge, fertilizers etc. is a significant area of study in terms of its effect on plant biomass and microbial diversity. REFERENCES Jala S.J. and Goyal D. (2010) Effect of fly ash application on some physical properties and
microbial activities. Acta Agrophys. 16: 327-335. Jala S.J. and Goyal D. (2006) Fly ash as a soil ameliorant for improving crop production - a
review. Bioresour. Technol. 97 : 1136-1147. Jala S.J. and Goyal D. (2014) Multiparametric influence of fly ash as a soil ameliorant and its
influence on soil microbial properties - A review . J. Soil and Water Conserv. 13 : 155-163.
Yadav V.K. and Fulekar M.H. (2018) The current scenario of thermal power plants and fly ash : production and utilization with a focus in India. Intl. J. Adv. Eng. and Res. Dev. 5: 768-777.
Gajic, G., Djurdjevic L., Kostic, O., Jaric, S., Mitrovic M. and Pavlovic, P. (2018) Ecological potential of plants for phytoremediation and ecorestoration of fly ash deposits and mine wastes. Front. Environ. Science. 13.
Gajic G. and Pavlovic P. (2018) The role of vascular plants in phytoremediation of fly ash deposits in Phytoremediation : Methods, Management and Assessment: Matichenkov, V. (Ed.) (New York, NY: Nova Science Publishers, Inc.). pp 151-236.
Wang, Q., Pang, Z. and Yang, W. (2018) Effects of fly ash and organic fertilizers on water use efficiency. IOP Conf. Ser. Mater. Sci. Eng. 394032072.
Diatta, J., Fojcik, E., Drobek, L., Spizewski, T. and Krezesinski , W. (2017) Assessment of heavy metal inactivation in contaminated soil by coal fly ash and bottom ashes. Mineralo. 48 : 127-143.
Panda R.B. and Biswal T. (2018) Impact of fly ash on soil properties and productivity. Intl. J. of Agr. Env. and Biotech. 11: 275-283.
Noyce, G.L., Jones, T., Fulthorpe, R. and Basiliko, N. (2017) Phosphorous uptake and and availibility and short term seedling growth in three Ontario soils amended with ash and biochar. Canadian J. of Soil Sci. 97: 678-691.
Nayak, A.K ., Raja, R., Rao, K.S., Shukla, A.K., Mohanty, S., Shahid, M., Tripathi, R., Panda, B.B., Bhattacharya, P., Kumar, A., Lal, B., Sethi , S.K., Puri, C., Nayak, D., and Swain, C.K. (2015) Effect of fly ash application on soil microbial response and heavy metal accumulation in soil and rice plant. Ecotoxicol. Environ. Saf. 114 : 257-262.
Matsuda, A., Maruyama, I., Meawad, A., Pareek, S. and Araki, Y. (2019) Reaction, Phases and Microstructure of fly ash based alkali activated materials. J. of Adv. Conc. Tech. 17: 93-101.
301
Table of Contentsfor this manuscript

ALUMINOSILICATE NANO-SKELETON TO FIRM THE STRUCTURE AND PROPERTIES OF NANO-HERBICIDE FORMULATIONS
Santosh Kumar Paul1,2,3, Md Nuruzzaman1,2, Tanya C. Correa1,2, Ravi Naidu1,2
1Global Centre for Environmental Remediation (GCER), ATC Building, University of
Newcastle, Callaghan, NSW 2308, AUSTRALIA 2Cooperative Research Centre for Contamination Assessment and Remediation of the
Environment (CRC CARE), ATC Building, University of Newcastle, Callaghan, NSW 2308, AUSTRALIA
3Agronomy Division, Bangladesh Agricultural Research Institute (BARI), Joydebpur, GAZIPUR 1701, BANGLADESH [email protected]
INTRODUCTION Weed management is always an important aspect in crop production to ensure the quality as well as higher production (Chauhan et al., 2017). However, weed management is a complex and continuous process within agricultural systems. Successful weed management practices tend to prevent yield loss owing to weed competition in the short term as well as avoid the addition of weed seed/vegetative propagules to the soil seed bank, to reduce weed densities in subsequent years. As a result, utilization of herbicide become a dominant tool in weed management over the other practices such as physical, mechanical, cultural, biological etc. However, the over and indiscriminate use of herbicides results herbicide-resistant (HR) weed population as well as causes contamination of the surrounding environment through water movement. To this context, development of new plant protection formulations is highly desired and has long been a very active field of research so that the problems associated with commercial herbicide could be overcome. Now a days, nanotechnology has emerged as a potential technology and plays an important role in modern agriculture in various aspect including pesticide delivery (Nuruzzaman et al., 2016). In pesticide delivery, the potential application of this technology have been explored to formulate the pesticide (e.g., insecticide, fungicide, herbicide etc.) formulations providing support with nano-carrier materials. While the active ingredients (AIs) of pesticide are loaded into these nano-carriers through entrapment, adsorption, encapsulation and ligand-mediated attachment (Ghormade et al., 2011). Therefore, the nano-carrier materials not only firm the structure of the nanopesticide formulations but also improve their efficacy and properties (e.g, slow release, protection against premature degradation). So far, polymers-based nanomaterials, lipid-based nanomaterials, porous inorganic nanomaterials and clay-based nanomaterials are the most widely used carriers for pesticide delivery. Of the various nano-carriers, clays are considered as a suitable carrier material and ready to go for commercial production of nanopesticide such as nano-herbicide formulations because of their natural source, availability, eco-friendly, non-toxicity and economically viable characteristics. However, it is important to understand the interactions between the clays and AIs as well as different ways for the efficient preparation of nanopesticide formulations. ALUMINOSILICATE BASED NANO-HERBICIDE FORMULATIONS Clays consist of hydrous aluminosilicate phyllosilicate layers that underpins current research for the preparation of nano-herbicide formulations. In clays, the thickness of the phyllosilicate layers belong to nano-scale stacked together leaving an interlayer space known as gallery. Generally, the active ingredient of herbicides are loaded to this interlayer space via either cation exchange process or through adsorption establishing different interactions like ion-dipole interaction, hydrogen bonds, van der Waals forces, co-ordination bonds, charge transfer, acid-base interaction etc. among AIs and phyllosilicate layers (Lagaly, 2001). Thus, aluminosilicate phyllosilicate layers act as nano-skeleton to support the herbicide molecules whereas the interlayer space perform as storehouse. However, modifications of clays are
M51-P25
Copyright © CRC CARE Pty. Ltd., 2019
CleanUp Conference 2019Adelaide, Australia8 –12 September 2019 302
Table of Contentsfor this manuscript

needed to enhance herbicide-loading capacity as well as to control the releasing behaviour of AIs on demand. Clays modified as organoclay by replacing the interlayer inorganic exchangeable cations with organic quaternary ammonium (R4N+X–) containing alkyl, phenyl, benzyl, and pyridyl groups held prominent position. With this process, the surface behaviour of clays change from hydrophilic to hydrophobic that enhances herbicide loading through hydrophobic interaction. The organic cations could be arranged in various ways (Fig. 1a) with this playing a vital role in herbicide adsorption process. Due to expanded layer structure, such clays could also be termed as nanoclay.
Fig.1. Preparation of surface modified clays using a. organic cationic surfactants and b. polymer Furthermore, polymer-clay nanocomposites are also potential carriers for herbicide delivery. In a polymer-clay nanocomposite, the polymers either intercalate to clay layers or completely exfoliates them (Fig 1b). The main purpose of utilization of clays in polymer nanocomposite to ensure significant delay in releasing behaviour of AIs. Nonetheless, for the preparation of polymer-clay nanocomposite biopolymers are known to be an eco-friendly alternative to conventional polymers (Nuruzzaman et al., 2019). CONCLUSIONS Preparation of nano-herbicide formulations using clays are expected to be eco-friendly option compare to the commercial pesticides. The utilization of clays in herbicide formulations unveiled as a potential tool due to their aluminosilicate layered structure that not only increase the stability of the formulations but also enhance the efficacy and sustainability of the herbicide formulations. However, more investigation is required to understand the compatibility among a wide range of herbicides and clay-based nanocarriers so that the herbicide could be delivered in a smart way. REFERENCES Chauhan, B. S., Matloob, A., Mahajan, G., Aslam, F., Florentine, S. K., and Jha, P. (2017).
Emerging Challenges and Opportunities for Education and Research in Weed Science. Frontiers in Plant Science 8:1537.
Ghormade, V., Deshpande, M. V., and Paknikar, K. M. (2011). Perspectives for nano-biotechnology enabled protection and nutrition of plants. Biotechnology Advances 29, 792-803.
Lagaly, G. (2001). Pesticide–clay interactions and formulations. Applied Clay Science 18, 205-209.
Nuruzzaman, M., Liu, Y., Rahman, M. M., Dharmarajan, R., Duan, L., Uddin, A. F. M. J., and Naidu, R. (2019). Chapter 4 - Nanobiopesticides: Composition and preparation methods. In "Nano-Biopesticides Today and Future Perspectives" (O. Koul, ed.), pp. 69-131. Academic Press.
Nuruzzaman, M., Rahman, M. M., Liu, Y., and Naidu, R. (2016). Nanoencapsulation, Nano-guard for Pesticides: A New Window for Safe Application. Journal of Agricultural and Food Chemistry 64, 1447-1483.
303
Table of Contentsfor this manuscript

OPTIMIZING THE PFAS PUZZLE: PIECING TOGETHER A HOLISTIC PFAS RESTORATION STRATEGY
Ian Ross1, Jeffrey McDonough2, Jake Hurst1, Jonathan Miles1, Danielle Toase3,
Jason Lagowski3, Peter Storch4
1Arcadis, 1 Whitehall Riverside, Leeds, LS1 4BN, UK 2Arcadis, 10 Friends Lane, Newtown, PA 18940, USA
3Arcadis, Level 16/580 George St, Sydney, NSW 2000, AUSTRALIA 4Arcadis, 32/140 William St, Melbourne, VIC 3000, AUSTRALIA
INTRODUCTION Per- and polyfluoro alkyl substances (PFAS) comprise a diverse class of contaminants, which include a range of perfluoroalkyl acids (PFAAs) with varying perfluoroalkyl chain lengths; most notably PFOA (perfluorooctanoic acid) and PFOS (perfluorooctane sulfonate) and PFHxS (Perfluorhexane sulfonate). PFHxS and PFOS have gained significant attention in the Australia because of the FSANZ Health Based Guidance Values (HBGVs) released 31 December 2016 which derive drinking water of 70 nanograms per liter (ng/L). The PFAAs (including PFOA, PFHxS and PFOS) are the “dead-end” daughter products resulting from biotransformation of thousands of polyfluorinated precursor compounds, which are present in many commercial products such as Class B firefighting foams. The transformation of precursors to PFAAs further complicate the remediation challenges as precursors are not quantified using standard analytical laboratory methods (USEPA method 537); resulting in underestimation of the PFAS mass when using standard analysis. Further, the aerobic biotransformation of precursors to PFAAs creates an ongoing source of PFAAs. As some precursors are cationic (or cation dominated zwitterions), they are less mobile in fine-grained aquifer systems with primarily negatively charged surfaces, and have the potential to remain in the source area. However, these precursors will eventually biotransform over time forming PFAAs as dead-end daughter products, which seem likely to remain in the ecosystem for thousands of years. METHODS The current state of the practice of available PFAS remediation technologies will be discussed. Innovative and emerging remediation solutions for PFAS include many types of technologies to address highly concentrated source zones, mitigate mass flux of impacts to aquifers, or address PFAS in extracted water. These emerging solutions will be compared against the “de facto” interim remedial action of granular activated carbon (GAC). GAC is currently being used to effectively remove a portion of PFAS from water sources; however, the questionable precursor removal, the less effective removal of short chain PFAAs, and perpetual operation and maintenance (O&M) cost concerns demand alternative solutions and optimization measures. More comprehensive PFAS treatment of impacted water sources typically requires the use of technologies such as reverse osmosis or nano-filtration, but new sorbent media are being developed to remove both long and short chain PFAS. There are new precipitation technologies, sonolytic reactors, foam fractionation technologies, and ion exchange media being developed and optimized for water treatment. RESULTS AND DISCUSSION The principles underlying the mechanisms by which multiple technologies act will be summarized with comment on where they could be applied or combined to effectively manage PFAS impacted aquifers and drinking water sources. Additionally, optimization strategies to reduce O&M costs associated with GAC will be discussed as the practicality of more innovative remedial technologies are vetted through academic research. For water, 1) data will be presented on easily reactivated engineered sorbent media showing initial
M51-P26
Copyright © CRC CARE Pty. Ltd., 2019
CleanUp Conference 2019Adelaide, Australia8 –12 September 2019 304
Table of Contentsfor this manuscript

promise at removing both long and short chain PFAS, including PFBA (perfluorobutanoic acid), which is characterized by low adsorption potential; 2) initial field-scale data on PFAS removal using ozofractionation and destruction with sonolysis will be reviewed; 3) the viability and potential limitations of electrochemical treatment will be discussed. The state of the practice currently requires treatment train implementation, with opportunities to offset one technology’s weakness with another technology’s strength.
305
Table of Contentsfor this manuscript

1,4-DIOXANE INDUCES CHROMOSOMAL ABERRATIONS IN ALLIUM CEPA
Sadhvika Chandrasekar1, Suresh Subashchandrabose1,2, Anithadevi Kenday Sivaram1,2, Logeshwaran Panneerselvan1,2, Rajendran Selvakumar3, Sreenivasulu Chadalavada1,2,
Ravi Naidu1,2, Megharaj Mallavarapu1,2
1Global Centre for Environmental Remediation (GCER), Faculty of Science, ATC Building,
The University of Newcastle, Callaghan, NSW 2308, AUSTRALIA 2Cooperative Research Centre for Contamination Assessment and Remediation of
Environment (CRC CARE), The University of Newcastle, ATC Building, Callaghan, NSW 2308, AUSTRALIA
3Tissue Engineering Laboratory, PSG Institute of Advanced Studies, Peelamedu, Coimbatore 641004, INDIA
INTRODUCTION 1,4-Dioxane is a ether and a heterocyclic organic compound which commonly exists in a liquid state without any prominent colour, with a sweet odour similar to diethyl ether (Mahendra and Alvarez-Cohen, 2006). Dioxane is used as a solvent for inks, adhesives, paints, and dyes; In some cases, it is used in place of tetrahydrofuran (THF) owing to its higher boiling point of 101 °C, as opposed to the 66 °C of THF (Derosa et al., 1996). Dioxane has been found to be highly toxic, a proven irritant to the respiratory system and eyes. Studies in rats have shown that Dioxane is most dangerous when inhaled in pure form as a vapour (Chiang et al., 2012). It is also known to damage the nervous system, liver, and kidneys on continuous exposure (Wilbur et al., 2012). The National Toxicology Program classifies Dioxane as a Group 2B carcinogen: its carcinogenicity in other animals making it a possible human carcinogen. Dioxane usually leaches into the groundwater and has been detected at concentrations of 1 μg/L in areas close to solid-landfills. However, the solubility of Dioxane in water and the inability to bind with soil render its remediation difficult (Kinne et al., 2009). This study evaluates the cytotoxic potential of Dioxane to Allium cepa. Due to its quick growth rate, reliability, and the ease of visibility of the mitotic stages of the cells under a microscope, A. cepa was used in this study (Kusumaningrum et al., 2012) METHODS The roots were exposed to different concentrations of 1,4-Dioxane (1, 10, 25, 50 and 100 mg L-1) along with the positive (BaP @1 mg L-1) and negative control (distilled water) and incubated for 24 h in triplicates. Assessment of cytotoxicity of 1,4-Dioxane to A. cepa was conducted as described previously (Sivaram et al., 2018). The student’s t-test was performed to obtain the statistical significance of variables using IBM SPSS 24. RESULTS AND DISCUSSION The mitotic index (MI) is considered as an important indicator for assessing the cytotoxicity level of several compounds that are present in the environment ( Leme and Marin-Morales, 2009). In this study, the untreated onion root tips (negative control) exhibited negligible chromosomal aberration (CAs) with the MI value of 68.6% (Fig.1). A significant reduction in the MI was observed in the onion root tip cells treated with 50 and 100 mg L-1 of 1,4-Dioxane. The reduction in the MI at higher concentrations indicate that the cytotoxicity of Dioxane. In addition, CAs, which includes anaphase bridges, vagrants, laggards, and bivacuolar cells, was also observed at higher concentration of 1,4-Dioxane (Fig.1). The most frequent CAs of anaphase observed in this study was due to the irregular separations of chromosomes, which remained as acentric fragments and formed laggards or anaphase bridges or vagrant chromosomes (Türkoğlu, 2007). However, at the lower 1,4-Dioxane concentration, no significant aberrants were observed.
M51-P27
Copyright © CRC CARE Pty. Ltd., 2019
CleanUp Conference 2019Adelaide, Australia8 –12 September 2019 306
Table of Contentsfor this manuscript

*- Statistically significant based on Student’s t test at P = 0.05, **- P = 0.01
Fig. 1. Mitotic index (%) and total chromosomal aberrations (%) of Dioxane to A.cepa root cells. CONCLUSIONS The ecotoxicity of 1,4-Dioxane is proportional to its concentration and is subsequently displayed in the form of chromosomal aberrations in the mitotic stages of the onion root tip cells at higher concentrations. It can be seen from the results of this study that it is minimally toxic to plant life unless prolonged or heavy exposure. REFERENCES Chiang, S.Y.D., Mora, R., Diguiseppi, W. H., Davis, G., Sublette, K., Gedalanga, P.,
Mahendra, S. (2012) Characterizing the intrinsic bioremediation potential of 1,4-dioxane and trichloroethene using innovative environmental diagnostic tools. J. Environ. Monit. 14: 2317-2326.
Derosa, C. T., Wilbur, S., Holler, J., Richter, P., Stevens, Y. W. (1996) Health evaluation of 1,4-Dioxane. Toxicol.Ind.Health. 12: 1-43.
Kinne, M., Poraj- Kobielska, M., Ralph, Salph, S. A., Ullirich, R., Hofrich, M., Hammel, K. E., (2009) Oxidative cleavage of diverse ethers by an extracellular fungal peroxygenase. J. Biol.Chem. 284: 29343-29349.
Kusumaningrum, H., Tri Lunggani, A., Amal Nurhakim, M. (2012) Chromosomes and Mitotic Cell Division Phase In Onion Roots After 24 Hours Acetoorcein Soaking Time.
Leme, D. M., Marin-Morales, M. A. (2009) Allium cepa test in environmental monitoring: a review on its application. Mutat. Res-Rev. Mutat. Res., 682: 71-81.
Mahendra,S., Alvarez-Cohen, L. (2006) Kinetics of 1,4-Dioxane Biodegradation by Monooxygenase-Expressing Bacteria. Environ. Sci. Technol. 40: 5435-5442.
Türkoğlu, Ş.(2007) Genotoxicity of five food preservatives tested on root tips of Allium cepa L. Mutat. Res.Genet. Toxicol. Environ. Mutagen., 626: 4-14.
Wilbur, S., Jones, D., Risher, J.F. (2012) Toxicological Profile for 1,4-Dioxane. Atlanta (GA): Agency for Toxic Substances and Disease Registry (US)
307
Table of Contentsfor this manuscript

HEAVY METAL EXPOSURE RISK OF COMMERCIALLY GROWN VEGETABLES IN SRI LANKA
M.R.D.L. Kulathunga1,2, M.A. Ayanka Wijayawardena1,3, Ravi Naidu1,3
1Global Centre for Environmental Remediation, The University of Newcastle, AUSTRALIA
2Fruit Research and Development Institute, Kananwila, Horana, SRI LANKA 3Cooperative Research Centre for Contamination Assessment and Remediation of the
Environment (CRC CARE), University of Newcastle, Callaghan, NSW 2308, AUSTRALIA [email protected]
INTRODUCTION In the past two decades there has been a substantial increase in agricultural inputs to enhance the crop productivity in Sri Lanka. Farmers are utilizing chemical fertilizers (Premarathna et al., 2010) in order to attain higher production in commercial vegetable cultivation. It is evident that phosphorous fertilizers, in particular, have contributed to a significant build-up of hazardous toxic metals including cadmium (Cd), lead (Pd) and arsenic (As) (Jayasumana et al., 2015) in cultivated farmland soils. Heavy metals introduced in soil could subsequently enter into living beings via food chain. Thus, in the long term commercially grown vegetables may pose significant risk to people consuming these vegetables. Only a limited number of studies have evaluated heavy metal content in vegetables (Kananke et al., 2014, Jayatilake et al., 2013) and reported the heavy metal content to be higher than allowable limit set by international organization (CODEX, 1995). Furthermore, detailed analyses of heavy metals in commercially cultivated vegetables focusing on human health risk investigation through vegetable intake is even few and far between. Hence, the aim of this study was to determine the heavy metals exposure from commercially grown vegetables in Sri Lanka sold in a major dedicated economic centre.
Table 1 Concentration of Cd, Pb and As in vegetables in Dambulla market Vegetables Pb mg/kg Cd mg/kg As mg/kg Beans 0.32 0.01 0.01 Beet root 0.27 0.07 0.06 Bitter Gourd 0.97 0.01 0.02 B'Onion 0.21 0.03 0.03 Brinjal 1.06 0.08 0.01 Cabbage 0.69 0.05 0.02 Capsicum 0.47 0.10 0.04 Carrot 1.19 0.11 0.07 Cucumber 0.88 0.03 0.07 Green Chili 1.05 0.06 0.07 Knol Khol 0.31 0.03 0.10 Leeks 0.55 0.06 0.14 Lettuce 1.26 0.22 0.25 Okra 0.34 0.05 0.06 Potato 0.39 0.13 0.05 Pumpkin 0.13 0.01 0.04 Radish 0.39 0.05 0.07 Ridge Gourd 0.19 0.03 0.04 String Beans 0.30 0.00 0.06 Sweet potato 0.33 0.00 0.01 Tomato 0.36 0.08 0.04 Vegetable Onion 0.42 0.02 0.02 Wing bean 0.33 0.05 0.06
M51-P28
Copyright © CRC CARE Pty. Ltd., 2019
CleanUp Conference 2019Adelaide, Australia8 –12 September 2019 308
Table of Contentsfor this manuscript

METHODS Dambulla whole sale market is the largest vegetable distribution point in Sri Lanka. The harvest from major vegetable cultivation areas are brought in to this market and distributed to the rest of the country. Altogether 23 common vegetable samples were collected including tuber and root crops like potato, sweet potato, carrot and beet root from three outlets in the market. Samples were first washed with tap water several times to remove soil and debris and then washed with deionized water. Portion of edible parts of samples were cut into small pieces and oven dried at 100 0C. Then dried samples were ground using a blender and passed through a 2- mm sieve. Samples were digested using trace metal grad concentrated HNO3 in a block digestion as per procedure (Rahman et al., 2009) and heavy metal(loid)s were analysed using ICP-MS (PerkinElmer, Avio 200). RESULTS AND DISCUSSION Table 1 showed the heavy metal concentration of Cd, Pb and As in mg/kg dry weight basis for different vegetables collected from Dambulla market (n=.69, SD=Pb-0.35, Cd-0.05, As-0.05). The standards for allowable limits for Cd and As is set at 0.1 mg/kg in many types of vegetables, Pb for fruiting vegetable was 0.1 mg/kg, root and tuber vegetables was 0.3 mg/kg (CODEX, 1995). According to these safety limits, lettuce, potato, carrot and capsicum have exceeded the permissible Cd limit. Leeks and lettuce had higher As content than the allowable safety limit. About 80 % (n=19) of vegetables studied showed greater Pb content than 0.3 mg/kg. Heavy metals in lettuce were higher than the other vegetables and this may be due to frequent application of pesticides and foliar fertilizers. CONCLUSIONS The results of this study demonstrated that Pb content in all vegetables in this study and Cd and As in some vegetables are higher than the permissible levels. This can lead to adverse health risks. Hence long term consumption of these vegetables could pose a chronic adverse health effect due to bio accumulation of heavy metals, unless the amount ingested is within the TDI levels. Therefore, sources of contaminant needed to be assess to prevent adverse health impact. And also more research should be done and steps should be taken to propose the portion sizes (how many serves) of these vegetables that can be safely consumed per day without any major chronic health effects for the benefit of general public. REFERENCES CODEX, S (1995). STAN 193-195: Codex General Standard for Contaminants and Toxins in
Food and Feed. Adopted. Jayasumana, C., Fonseka, S., Fernando, A., Jayalath, K., Amarasinghe, M., Siribaddana, S.,
Gunatilake, S., Paranagama, P. (2015). Phosphate fertilizer is a main source of arsenic in areas affected with chronic kidney disease of unknown etiology in Sri Lanka. SpringerPlus, 4,90.
Jayatilake, N., Mendis, S., Maheepala, P., Mehta, F.R. (2013). Chronic kidney disease of uncertain aetiology: prevalence and causative factors in developing country. BMC Nephrology, 14, 180.
Kananke, T., Wansapala, J. Gunaratne, A (2014). Heavy metal contamination in green leafy vegetables collected from selected market sites of Piliyandala area, Colombo District, Sri Lanka. American journal of food science and technology, 2, 139-144.
Premarathna, H., Indraratne, S., Hettiarachchi, G. (2010). Heavy metal concentration in crops and soils collected from intensively cultivated areas of Sri Lanka. Proceedings of the 19th World Congress of Soil Science: Soil solutions for a changing world, Brisbane, Australia, 1-6 August 2010. Symposium 3.5.1 Heavy metal contaminated soils. International Union of Soil Sciencs (IUSS).
Rahman, M.M., Ng, J.C., Naidu, R (2009). Chronic exposure of arsenic via drinking water and its adverse health impacts on humans. Environmental Geochemistry and Health, 31, 189-200
309
Table of Contentsfor this manuscript

CYTOTOXICITY OF PERFLUOROALKYL AND POLYFLUOROALKYL SUBSTANCES AND THEIR MIXTURES IN HEPG2 CELL
Atinuke F. Ojo, Cheng Peng, Jack C. Ng
Queensland Alliance for Environmental Health Sciences (QAEHS), The University of Queensland, 20 Cornwall Street, Woolloongabba, Brisbane, QLD 4102, AUSTRALIA
INTRODUCTION Perfluoroalkyl and polyflouroalkyl substances (PFASs) are man-made compounds that have been widely used since the 1950s in numerous industrial and commercial products due to their unique physicical/chemical properties. These compounds are of great concern and have generated public interest on an international scale due to their persistence in the environment, potential for bioaccumulation, and toxicity in laboratory animals and humans (Giesy and Kannan, 2002). Among PFASs, perfluorooctane sulfonate (PFOS) and perfluorooctanoic acid (PFOA) are most commonly studied, even though several other members of this group of compounds have been detected in the environment and in humans. In addition, multiple PFASs co-exist in the same environment, yet only a very few studies have reported their mixture effects. Considering that liver is the target organ for these compounds, it is important to evaluate how these compounds jointly affects human liver. Such investigations may be useful for proper health risk assessment of these compounds. Therefore, the objectives of this present study are to evaluate: the individual and combined toxicities of different PFASs on the viability of human hepatoma cell line HepG2, and the nature of toxicological interactions of PFOS and/or PFOA with other PFASs in binary, ternary and multicomponent mixtures using the Combination Index (CI)-isobologram equation method. METHODS Cytotoxicity Assay Perfluorodecanoic acid (PFDA), Heptadecafluorooctanesulfonic acid potassium salt (PFOS), Perfluorononanoic acid (PFNA), Perfluorooctanoic acid (PFOA), Tridecafluorohexane-1-sulfonic acid potassium salt (PFHxS) and Perfluoroheptanoic acid (PFHpA) were all purchased from Sigma-Aldrich, St Louis, USA. All the six compounds were prepared in dimethyl sulfoxide (DMSO, CAS number: 67-68-5). Cytotoxicity of individual PFASs and their mixtures were determined using the Promega CellTiter 96® Aqueous One Solution Cell Proliferation (MTS) Assay Kit (G3581). The assay was carried out according to the manufacturer’s instructions with slight modification. Briefly, HepG2 cells were seeded at a density of 1 × 10⁴ cells per well in a 96-well plate and cultured for 24 h before treatment. The cells were treated with serial dilutions of each compound individually and with a fixed constant ratio (1:1) based on the individual EC50 values, in their binary and ternary combinations for 24 hrs. Control groups were treated with DMSO only. At the end of the exposure period, the cells were washed twice with phosphate buffered saline (PBS) followed by addition of 120 μL medium containing 20 μL of MTS and further incubated for 2 h. The absorbance of the treated and untreated cells were recorded at 490nm using a microplate reader (SPECTROstar Nano by BMG Labtech, Offenburg, Germany). Each experiment was performed in six replicates and repeated independently three times. The cell viability was calculated as percentage relative to the control groups. Data analysis Computer program CompuSyn developed by Chou and Martin, 2005 (CompuSyn Inc, USA) was used for predict the mixture toxicity and interactions of PFASs.
M51-P29
Copyright © CRC CARE Pty. Ltd., 2019
CleanUp Conference 2019Adelaide, Australia8 –12 September 2019 310
Table of Contentsfor this manuscript

RESULTS AND DISCUSSION • The cytotoxicity of respective PFASs increased with increasing carbon chain lengths and
is in the order of PFHpA > PFHxS > PFOA > PFNA > PFOS > PFDA. • The toxicological interaction of PFOS and PFOA with other PFASs clearly showed a
different pattern of combined toxicity in HepG2 Cells. o The binary and ternary combinations of PFOS with PFOA, PFNA, PFDA, PFHxS, and
PFHpA displayed synergistic interactions for almost all inhibitory effect (cytotoxicity) levels tested (Fig. 1a and c), whereas, either synergistic or antagonistic effect was observed in mixtures with PFOA (Fig 1b and d).
o The pattern of interactions of PFASs mixtures is mostly predominated by synergism.
Fig. 1. Combination index plot (fa–CI plot) for binary and ternary mixtures of PFOS and PFOA with other PFASs in HepG2 cells. CI values are plotted as a function of cytotoxicity (fa) by computer simulation (CompuSyn) from fa = 0.05 to 0.97. CI < 1, =1 and >1 indicates synergism, additive effect and antagonism, respectively. The vertical bars indicate 95% confidence intervals for CI values based on SDA (sequential deletion analysis). CONCLUSIONS Cytotoxicity of individual PFASs in HepG2 cells increased with increasing carbon chain lengths and is in the order of PFHpA > PFHxS > PFOA > PFNA > PFOS > PFDA. The pattern of interactions of PFASs mixtures is clearly predominated by synergism, especially at low to medium effect levels; the exceptions to this were the antagonistic interactions found in mixtures of PFOA, PFHxS and PFHpA. REFERENCES Chou, T.C. and Martin, N. (2005) CompuSyn for drug combinations: PC software and user’s
guide: a computer program for quantitation of synergism and antagonism in drug combinations, and the determination of IC50 and ED50 and LD50 values, ComboSyn Inc, Paramus, (NJ).
Giesy, J.P. and Kannan, K. (2002) Peer reviewed: perfluorochemical surfactants in the environment. Environmental Science & Technology, vol. 36, issue 7, pp. 146A-152A
Fraction affected, fa
0.0 0.2 0.4 0.6 0.8 1.0
Com
bina
tion
inde
x, C
I
0.0
0.5
1.0
1.5
2.0
PFNA + PFDAPFOS + PFNAPFOS + PFDAPFOS + PFNA + PFDAAdditivity Line
a
Fraction affected, fa
0.0 0.2 0.4 0.6 0.8 1.0
Com
bina
tion
inde
x, C
I
0.0
0.5
1.0
1.5
2.0PFNA + PFDAPFOA + PFNAPFOA + PFDAPFOA + PFNA + PFDAAdditivity Line
b
Fraction affected, fa
0.0 0.2 0.4 0.6 0.8 1.0
Com
bina
tion
inde
x, C
I
0
2
4
6
8
10
12
14
16
PFHxS + PFHpAPFOS + PFHxSPFOS + PFHpAPFOS + PFHxS + PFHpAAdditivity Line
c
Fraction affected, fa
0.0 0.2 0.4 0.6 0.8 1.0
Com
bina
tion
inde
x, C
I
0
2
4
6
8
10
12
14
16PFHxS + PFHpAPFOA + PFHxSPFOA + PFHpAPFOA + PFHxS + PFHpAAdditivity Line
d
311
Table of Contentsfor this manuscript

LNAPL RECOVERABILITY IN FRACTURED BASALT — FINDINGS FROM SEVERAL MULTI-TIERED REMEDIATION CASE STUDIES
Keith Maxfield
AECOM, Collins Square, Level 10, Tower Two 727 Collins Street,
Melbourne, VIC 3008, AUSTRALIA [email protected]
INTRODUCTION Light nonaqueous phase liquid (LNAPL) remediation in fractured basalt bedrock is complex and presents challenges in achieving significant levels of mass recovery within a reasonable timeframe. Experience has demonstrated significant variability in the relative success of several remedial techniques and the properties of the basalt aquifer. This uncertainty can increase remediation costs and durations, and presents challenges in the willingness to undertake remediation and in reaching a satisfactory remedial end-point. Basalt aquifers can conceptually be considered as a complex 3D network of fractures of variable sizes and connectivity. This variability and the presence of air, water and LNAPL limits the ability to sustain a remedial influence through the LNAPL-impacted zone. OBJECTIVE AND METHODOLOGY This abstract presents key findings of LNAPL and fractured bedrock characterisation and remediation applied at several sites in Victoria underlain by the Newer Volcanics basalt. RESULTS / DISCUSSION Often the first step in developing the LNAPL CSM and appraising fracture abundance and basalt permeability is to characterise the lava sequence. Fractures will often occur more abundantly at the top, base and peripheries of lava flows, and fracture connectivity can be greater horizontally compared to vertically. Where present, vertical fractures play a key role in facilitating LNAPL driving heads and enabling flow. The varying fracture properties with depth change the basalt permeability by orders of magnitude; hence properties at the near-water-table elevation where LNAPL resides present a key focus for investigation. Rock cores are therefore important to identify the lava sequence, fracture sets and fracture conditions. Changes in water table elevation significantly alter LNAPL permeability at the near-water-table elevation, which affects LNAPL recoverability and transmissivity. A rise in the water table via rainfall and barometric change can cause groundwater to occlude LNAPL-saturated fractures resulting in intermittent LNAPL flow. Frequent fluctuations can also cause LNAPL to be ‘pumped’ laterally, resulting in LNAPL migration in directions controlled by the fracture network geometry rather than the hydraulic gradient. Given this influence on LNAPL characterisation, data are needed on the range and frequency of water table fluctuation. The route of ancient lava flow sheets may often be independent of the current groundwater gradient, leading to high-flow zones at the lava sheet boundaries causing non-linear or unexpected plume flow directions. This may be observed as high LNAPL recovery rates in wells distal to the release point, and non-linear plume migration which, in one instance, was observed to change the plume direction by 70 degrees to the hydraulic gradient. Baildown transmissivity (Tn) tests usually generate useful data on recoverability, although the inherent assumptions regarding aquifer flow are stretched. Robust appraisal of the recovery profile, discharge vs drawdown plots and overlay of the core log can inform LNAPL flow characteristics local to the well. Manual recovery Tn tests may overcome some of these limitations and better represent sustainable LNAPL recovery. Experience has also shown that diagnostic gauge plots may be misleading, as these assume LNAPL can readily flow between the well and aquifer as the water table changes, which is often not the case.
M51-P30
Copyright © CRC CARE Pty. Ltd., 2019
CleanUp Conference 2019Adelaide, Australia8 –12 September 2019 312
Table of Contentsfor this manuscript

Remediation Hydraulic recovery techniques have generally shown limited results and recovery rates can rapidly decrease as LNAPL saturation decreases. Residual saturation can be high in basalt due to unfavourable fracture orientation and capillary retention pressures. Successes have occurred generally where drawdown exposed more fractured basalt via which submerged LNAPL could readily drain. However, excessive drawdown can increase LNAPL smearing, thus reducing its recoverability. Limitations have also been experienced with long well screens, whereby hydraulic influence is lost to deeper high-flow zones below the LNAPL. Vapour extraction can be effective for volatile LNAPL where vapour flow can be sustained through the vadose zone. An absence of fracture connectivity at and above the water table presents a notable obstacle, hence a greater thickness of unsaturated basalt is required to sustain practicable flow, albeit at relatively low rates. Overlapping extractive influence zones can be necessary to sustain flow via variably connected high-flow and low-flow fractures. High vacuum multiphase extraction (MPVE) can overcome some of the issues of variable fracture flow pathways by drawing down groundwater and enabling vapour flow through the exposed smear zone. Although this comes at a greater installation and operating cost. Vacuum extraction in basalt will typically experience a groundwater upwelling response. This presents a major obstacle as upwelling will occlude flow pathways and drive LNAPL away from the well, hence concurrent fluid extraction or use of low vacuums may be necessary. A promising technique is the use of Venting Enhanced Vapour Recovery (VEVR) to enable atmospheric air to ingress directly into the vadose zone. Vent wells are designed to increase vapour flow through the vadose zone and enable flow from vent well to extraction well. The weathered basaltic clay cap often restricts air from entering the basalt aquifer, hence venting can facilitate vapour flow in seemingly ‘tight’ formations, and mitigate hydraulic upwelling effects. Pressurised air injection is a further enhancement to increase vapour flow via both a push-and-pull influence, although requires caution to avoid driving vapours outside the capture zone. Aquifer venting also achieves synergistic LNAPL depletion via in situ aerobic biodegradation, i.e. Bioventing. Aerating the smear zone via venting increases volatilisation and subsequent aerobic biodegradation of vapours, essentially representing enhanced NSZD. Basalt typically has low NSZD rates due to limited air exchanges hence, in oxygen-limited aquifers, venting the vadose zone can significantly increase this. This approach offers a treatment train of mass depletion via advective and diffusive vapour recovery, and in situ volatilisation and aerobic biodegradation as pore-gas exchange is sustained. VEVR and Bioventing represent a lower-intensity technique, though must be sustained over time to exploit the successive remedial processes. These will only affect the unsaturated zone; hence further efforts are required to treat the saturated zone. Biosparging techniques can be adopted for this purpose to access submerged LNAPL and aerate groundwater. SUMMARY AND CONCLUSIONS Given the fracture complexity, a well-researched LNAPL CSM via multiple sets of data is key to presenting a robust understanding of the fractured basalt permeability and LNAPL recoverability. Understanding the available fracture sets at the near-water-table elevation can assist identifying where the remaining LNAPL is located and how this may be accessed. In summary, higher intensity remedial techniques have typically been required to reach and surpass residual LNAPL saturation. Bespoke remedial solutions which involve both push-and-pull extractive mechanisms in the saturated and vadose zone may achieve greater successes due to their more intense application via the variably connected fracture set. Furthermore, those which utilise both extractive and in situ processes are likely to have the greatest remedial impact via a combination of advective and diffusive recovery mechanisms as well as enhancing in situ NSZD processes.
313
Table of Contentsfor this manuscript

NATURAL SOURCE ARSENIC CONTAMINATION MANAGEMENT STRATEGIES IN TAIWAN — CONTAMINATION STATUS,
NOVEL SCREENING TOOL AND PRECAUTIONS
Bing-Nan Wang1,2, Yu-Chen Su2, Sheng-Wei Wang2, Han-Yu Chang3, Hao-Chun Hung4, Yi-Ning Yang4, Shyh-Wei Chen4
1Department of Environmental Engineering, National Chang Kung University,
No.1, University Road, Tainan City, 701, Taiwan, REPUBLIC OF CHINA 2Sinotech Environmental Technology, LTD., No. 351, Sanzhong Rd., Kaohsiung City, 815,
Taiwan, REPUBLIC OF CHINA 3ACCUSENSING Technology Co., LTD, No. 251, Guozhong Rd.,Taichung City 412,
Taiwan, REPUBLIC OF CHINA 4Environmetnal Protection Administration, No. 83, Zhonghua Rd. Sec. 1, Taipei City 10042,
Taiwan, REPUBLIC OF CHINA [email protected]
INTRODUCTION Naturally occurring arsenic (As) released from the geological materials into groundwater has drawn attention around the world. In 1960s, Blackfoot disease caused by the use of high As groundwater broke out in the middle of Taiwan island and led to numerous arsenic related studies. After extensive investigation and monitoring, Taiwan Environmental Protection Administration (Taiwan EPA) constructed the contour of high arsenic contamination potential area of groundwater and paddy soil in 2018. Results showed that four regions that used groundwater primarily for irrigation were threaten by natural arsenic with elevated-As concentration in the groundwater. Although untreated As-contained groundwater is no longer ingested as domestic water at present, it is still a most important water source of irrigation in Taiwan and may cause As toxicity accumulation via food chain. To reduce the hazardous risk for farmers and probability of As accumulation in soil, a systematic management strategies for natural source arsenic contamination was proposed by Taiwan EPA, which included a source identification procedure, subsequent administrative management, a real-time screening method, and modules for groundwater pre-treatment before irrigation. METHODS Natural source identification procedure In order to distinguish the origins of arsenic, an identification procedure was developed and applied. It began with historical records and environmental information survey, which was followed by groundwater, nearby precipitates and sediments sampling. Samples were analysed for As concentrations and minerals morphology. The concentrations, chemical species and morphologies of iron, manganese and As in the soil core samples from different depths were also examined. Through the analysis and comparison process, the probable source of As can be identified. Application of a novel real-time screening tool Arsenic analysis typically relies on inductively coupled plasma (ICP) or atomic absorption spectrometry (AA), which are expensive and time-consuming. On the other hand, an electrochemical method, anodic stripping voltammetry (ASV), for heavy metals quantification was proposed and well developed in the 1960s. In this study, a novel screen print electrode (SPE) and electrochemical analysis device based on ASV was used for on-site groundwater As quantification. With acidified groundwater samples, As(III) levels can be measured through alternating current on the reversible redox system within 5 minutes. More than 200 groundwater samples from As-affected area were collected and analysed both on-site and off-site for comparison.
M51-P31
Copyright © CRC CARE Pty. Ltd., 2019
CleanUp Conference 2019Adelaide, Australia8 –12 September 2019 314
Table of Contentsfor this manuscript

Pilot study of groundwater pre-treatment systems In order to prevent further As contamination in the irrigation channels and farmlands, four pre-treatment methods were tested for As removal, including aeration, coagulation and precipitation, adsorption by different materials and ion exchange. Two pilot pre-treatment modules were designed for process optimization and cost-benefit analysis. RESULTS AND DISCUSSION In this study, based on the source identification procedure, the natural source arsenic contamination potential area was re-evaluated in 2018. The risk-map provided local Environmental Protection Bureau (EPB) a good reference to regulate the groundwater usage. For areas with high contamination potential, using groundwater for drinking and irrigation without pre-treatment were prohibited. Results from on-site samples analysis correlated nicely with samples analysed in the laboratory. With further modification of the coating materials on SPE, high regression coefficients (r= 0.9818) between on-site and off-site analysis were achieved. These results suggested that the novel on-site device can be a useful tool for real-time As analysis. Based on the bench tests of different pre-treatment processes, adsorption and coagulation and precipitation showed higher arsenic removal efficiencies. The arsenic removal efficiency of aeration was not stable, possibly due to different compositions of groundwater. Nevertheless, for coagulation and precipitation, more physical space and budget for chemicals were needed when compared with other methods. The pilot-scale studies also showed that low effluent arsenic concentrations (<50 µg/L, which is the regulatory limit for As in irrigation water) can be achieved after aeration or ZVI adsorption pre-treatments. However, the cost of ZVI adsorption was much higher than the one of aeration. CONCLUSIONS In this study, a source identification procedure for anthropogenic or naturally occurring As was developed and used to re-evaluate the potential natural source contamination area in Taiwan. The risk-map provided preliminary information for groundwater regulation. A novel portable, real-time, simple, cheap and reliable method for As analysis was demonstrated. This method is expected to help local EPBs to monitor more than 30,000 groundwater wells in considerably shorter time frame and to implement necessary regulatory strategies for those wells with As concentrations above the irrigation water standard. Results from bench-top and pilot pre-treatment tests also provided economically feasible methods for farmers to reduce As concentration before use.
315
Table of Contentsfor this manuscript

TREATMENT OF PFAS IMPACTED WASTEWATER USING OZOFRACTIONATION AND SONOLYSIS WITH TREATMENT
VALIDATION USING TOP ASSAY
Ian Ross1, Jonathan Miles1, Danielle Toase2, Jason Lagowski2, Michael Dickson3, Peter Storch4
1Arcadis, 1 Whitehall Riverside, Leeds, LS1 4BN, UK
2Arcadis, Level 16/580 George St, Sydney NSW 2000, AUSTRALIA 3EVOCRA, 1 Waterfront Drive, Riverside, Tasmania 7250, AUSTRALIA
4Arcadis, 32/140 William St, Melbourne VIC 3000, AUSTRALIA [email protected]
INTRODUCTION Loss of a concentrated aqueous film-forming foam resulted in PFAS impact to nearby surface water and infrastructure including a domestic/industrial sewer and stormwater system which serviced numerous industrial facilities. The sewer and stormwater systems were isolated to prevent further impact to the environment. Approximately 6 million litres (ML) of wastewater and 6 ML of stormwater were collected and contained in 20 kL tanks. The objective of the project was to treat collected water to a concentration of less than 0.25 μg/L Sum of PFASs (28 compounds) as measured by total oxidizable precursor (TOP) assay. This project was the first example of ozofractionation for PFASs treatment with performance validated by TOP assay. Samples of PFASs concentrated in the foam fraction were treated using sonolysis to cause their complete destruction. Efficient removal of PFASs via partitioning with air bubbles has been demonstrated in the peer-reviewed literature (Lee et al. 2017; Meng et al. 2018), and PFASs affinity for the air water interface is central to their functionality in AFFF. OCRA is a patented process (that includes a series of chambers in which ozone micro-nano-bubbles (MNB) are sparged through PFAS-impacted water to facilitate gas-liquid interface partitioning of dissolved PFASs into a foam fraction which is collected as a PFAS concentrate. The concentrate can then be destroyed via destructive processes such as sonolysis, The limiting factor for removal of PFASs is available gas-liquid interfacial surface area. Ozone is the ideal gas for removal of PFASs from water relative to other gases such as air, because of its propensity to form stable bubble emulsions, as a result of bubble repulsion from increased zeta potential (Liu, Wang et al. 2012). This effect maximizes the interfacial surface area and bubble longevity, resulting in very effective collection and concentration of PFASs (Ross et al., 2017). Sparging ozone gas through OCRA columns while PFAS-impacted water passes through creates a PFAS-enriched foam fraction that can be collected. Depending on co-contaminants and initial PFAS levels, this creates a volume of ~0.5-5% PFAS-concentrated foam fraction and 95-99.5% treated water, with >99.9% removal of long-chain PFASs and >99% removal concentrations of short-chain PFASs (Horst et al., 2018). OCRA systems have treated PFASs ranging in concentration from <1 μg/L to > 5,000 μg/L total PFAS, as measured by the Total Oxidizable Precursor (TOP) Assay. Sonolysis (the use of ultrasonic waves to break down a substance) utilises ultrasound’s unique quasi-adiabatic bubble collapse that results in localised temperatures >5,000 K and pressures ~1000 atm, within bubbles, whilst the bulk solution can remain at ambient temperature. Sound waves at frequencies generally between 20 kHz to 1,100 kHz are able to generate cavitation in water. Simply defined, cavitation is the creation of microbubbles in a fluid due to negative pressures. As sound waves move through water, there are oscillating cycles of rarefaction and compression, which causes cavitation and allows bubble growth. When the microbubbles are collapsed during compression cycles, significant energy is released in the form of point sources of extreme heat, light and plasma-like conditions. High
M51-P32
Copyright © CRC CARE Pty. Ltd., 2019
CleanUp Conference 2019Adelaide, Australia8 –12 September 2019 316
Table of Contentsfor this manuscript

frequency ultrasound is reported to destroy a wide range of PFASs, including both long-chain and short-chain molecules (Ross et al 2018; Merino et al 2016). METHODS The combination of high organic load and foam concentrate in the collected water created a complex treatment challenge. Arcadis and EVOCRA teamed to design and install an innovative ozofractionation treatment process. Ozofractionation utilizes ozone to create bubbles that separate and concentrate PFASs in an aqueous solution. The high surface area created by ozone MNBs allowed effective removal of PFASs to the foam fraction. The ozone provided oxidation capacity to break down the organic load of the sewage. The process also efficiently handled and separated suspended solids. The primary waste generated from the process was a concentrated aqueous PFASs stream. The system was designed for a treatment capacity of 5,000 L/h, and given the urgent nature of the application, a full-scale system, as shown in Figure 1, was designed, installed and commissioned within six weeks. The waste foam fraction was used to test high frequency sonolysis which caused destruction of the PFASs in the complex high organic foam following a pretreatment stage. RESULTS AND DISCUSSION The EVOCRA ozofractionation process demonstrated the ability to treat high PFAS concentrations up to 9580 µg/L as well as handle the high organic load and other co-contaminants of the mixture of raw domestic and industrial sewage. A reduction of greater than 99.9% as measured by sum of PFASs (28), TOP assay, was routinely achieved. The system reliably removed long-chain and short-chain PFASs to below 2 μg/L. To reach the final treatment objective, a membrane filtration system was installed to reduce concentrations reliably below 0.25 μg/L TOP assay. Complete destruction of PFASs using sonolysis was demonstrated in the foam fraction. REFERENCES Horst, J., McDonough, J., Ross I., Dickson M., Miles J., Hurst, J., and Storch, P. 2018. Water
Treatment Technologies for PFAS: The Next Generation. Groundwater Monitoring and Remediation, 38, No2. https://doi.org/10.1111/gwmr.12281
Lee, Y.-C., Wang, P.-Y., Lo, S.-L., Huang, C.P. 2017. Recovery of perfluorooctane sulfonate (PFOS) and perfluorooctanoate (PFOA) from dilute water solution by foam flotation. Separ. Purif. Technol. 173, 280-285.
Liu, S., Q. Wang, T. Sun, C. Wu and Y. Shi (2012). "The effect of different types of micro-bubbles on the performance of the coagulation flotation process for coke waste-water." Journal of Chemical Technology & Biotechnology 87(2): 206-215.Meng, P., Deng, S., Maimaiti, A., Wang, B., Huang, J., Wang, Y., Cousins, I.T. and Yu, G. 2018. Efficient removal of perfluorooctane sulfonate from aqueous film-forming foam solution by aeration-foam collection. Chemosphere, 203, pp.263-270.
Merino, N., et al., Degradation and Removal Methods for Perfluoroalkyl and Polyfluoroalkyl Substances in Water. Environmental Engineering Science, 2016 33, 9, 1-35
Ross, I., Hurst, J., Miles, J., Houtz, E., McDonough, J., & Burdick, J. 2017. Remediation of poly- and perfluoro alkyl substances: Developing remediation technologies for emerging challenges. Proceedings of the Fourth International Symposium on Bioremediation and Sustainable Environmental Technologies, Battelle, Miami, May 22–25, 2017.
Ross, I.; McDonough, J.; Miles, J.; Storch, P.; Thelakkat Kochunarayanan, P.; Kalve, E.; Hurst, J.; S. Dasgupta, S.; Burdick, J., A review of emerging technologies for remediation of PFASs. Remediation Journal 2018a, 28, (2), 101-126. 6.
317
Table of Contentsfor this manuscript

ELECTROCHEMICAL OXIDATION OF 2,4-Dichlorophenoxyacetic ACID (2,4-D)
Young Hwan Hyun, Jiyeon Choi, Jin Peel Kim, Won Sik Shin
Kyungpook National University, School of Architectural, Civil, Environmental and Energy
Engineering, 80 Daehak-Ro, Bukgu, Daegu 41566, KOREA [email protected]
INTRODUCTION Chemical warfare agents (CWAs) are chemical weapons that deliberately use the toxicity of chemical substances to cause death or fatal harm and classified as weapons of mass destruction (WMD) and cause temporary incapacitation, injury or death. Practically CWAs are difficult to use in experiments due to toxicity and instability of the substances, as well as the fact that they are strongly prohibited to purchase or use. The CWA simulant is often used to mimic the physicochemical characteristics of the target chemical substance and to use the chemical with little or no toxicity. Many CWAs have the same mechanism as organophosphorus pesticides (OPs), and thus 2,4-D(2,4-dichlorophenoxyacetic acid) and other OPs, can be used as a simulant of CWAs. Although adsorption, cleaning, diluting, advanced oxidation, photocatalytic reactions, ozone and microbes were studied as technologies for the decontamination of CWAs, the electrochemical oxidation (ECO) technology was not fully investigated previously. In this study, the applicability ECO on the decompose 2,4-D was investigated. METHODS Chemicals and reagent 2,4-D (C8H6Cl2O3, 98%) was purchased from Sigma-Aldrich (USA). Potassium persulfate (K2S2O8, 95%), ferrous sulfate heptahydrate (FeSO4·7H2O, 98%), sodium sulfate (Na2SO4, 99%), sodium chloride (NaCl, 99%), sodium bicarbonate (NaHCO3, 99.5%) and acetic acid (99%) were purchased from Duksan Chemical Co. (Korea). Acetonitrile and water with HPLC grade water were provided from Merck Company (Germany). Electrochemical oxidation experiments Electrochemical oxidation experiments were carried out using 1-L beaker at room temperature. A carbon electrode (5 x 10 x 0.1 cm, Toyo Tanso, Japan) was used as anode and cathode. 500 mL of 2,4-D solution was introduced to the 1-L beaker. In all experiments, the 2,4-D concentration was fixed at 1 mM. 10 mM Na2SO4 and 20 mM NaCl were applied as supporting electrolytes. 10 mM persulfate and 5 mM Fe2+ were used for oxidant and activator, respectively. In order to apply electrical current, a digital MK power (8 mA) was used. The mutual distance of 8 cm between the anode and the cathode was maintained. The solution was mixed by a mechanical stirrer (Daihan Scientific Co., Ltd., HT-120DX). The subsamples were taken from the solution at predetermined time intervals for 2,4-D analysis. All experiments were conducted in triplicate and the average of them was used as representives of data. Analytical method 2,4-D concentration was measured by a high-performance liquid chromatography (HPLC) (Waters 2695, USA) equipped with a C18 column (5 μm, 6 mm x 250 mm, Waters, Sunfire®) and a Waters 2487 ultraviolet (UV) detector at 280nm wavelength as the maximum absorption of 2,4-D. The mobile phase was a mixture or acetonitrile, water and acetic acid with a ratio of 75:25:1(v/v%). The flow rate of mobile phase was 0.7 mL/min. The temperature of column was set at 30ºC. Analysis time was continued up to 10.0 min whereas the retention time was 3.4-3.7 min for 2,4-D peak.
M51-P33
Copyright © CRC CARE Pty. Ltd., 2019
CleanUp Conference 2019Adelaide, Australia8 –12 September 2019 318
Table of Contentsfor this manuscript

RESULTS AND DISCUSSION To determine optimum current density and electrolytes concentrations, the 2,4-D concentration was fixed at 1 mM, while electrolytes concentrations were adjusted to 5, 10, 15, 20, 50, 70 and 100 mM, respectively, and the current density was tested at 2, 4, 6, 8, 10 mA/cm2 for each electrolytes. Optimum electrolyte and current density were obtained at 10 mM and 8 mA/cm2, respectively, achieving the degradation efficiency of 34.9%. To determine optimum PS concentration, the PS concentration was adjusted to 5, 10, 15 and 20 mM. The optimum PS concentration was 10 mM and 2,4-D degradation efficiency increased from 34.9% to 47.2%. The Fe2+ concentration was adjusting to 1, 2.5, 5, 10, 15 and 20 mM respectively, to determine the optimum Fe2+ concentration. The optimum Fe2+ concentration was 5 mM, and the degradation efficiency increased from 47.2% to 90.5%.
Fig. 1. Removal of 2,4-D by electrolyte : 10mM Na2SO4, 20 mM NaCl, 20 mM NaHCO3, 10mM PS, 5mM Fe2+, current density (8mA/cm2) CONCLUSIONS In the electrochemical oxidation, the degradation efficiency of 2,4-D increased as Fe2+ was injected to the PS, the addition of Fe2+ effectively promoted activation of PS. The degradation efficiency was increasing to 16.16%, 34.9%, 47.2% and 90.5% respectively when adding electrolytes, adding PS and injecting iron than when only electricity was first supplied. In the presence of anions, the degradation efficiency was in order of SO4
2-, > Cl- > HCO3-. The
degradation efficiency is 91.15% at 10 mM Na2SO4, 88.70% at 20 mM NaCl and 73.99% at 20 mM NaHCO3. REFERENCES Nematollah, J., Ghanbari, F. and Zahedi, A. (2018) Coupling electrooxidation and Oxone for
degradation of 2,4-Dichlorophenoxyacetic acid (2,4-D) from aqueous solutions, Journal of Water Process Engineering, 22:203-209.
Cai, J., Zhou, M., Yang, W., Pan, Y., Lu, X. and Serrano, K.G. (2018) Degradation and mechanism of 2,4-dichlorophenoxyacetic acid (2,4-D) by thermally activated persulfate oxidation, Chemosphere, 212:784-793.
Bu, L., Zhu, S. and Zhou, S. (2018) Degradation of atrazine by electrochemically activated persulfate using BDD anode: Role of radicals and influencing factors, Chemosphere, 195:236-244.
319
Table of Contentsfor this manuscript

POTENTIAL OF ACID TOLERANT MICROALGAE FOR IRON RECOVERY VIA UPTAKE FROM ACID MINE DRAINAGE
Abinandan Sudharsanam1, Suresh R. Subashchandrabose1,2, Megharaj Mallavarapu1,2
1Global Centre for Environmental Remediation (GCER), Faculty of Science, ATC Building,
The University of Newcastle, Callaghan, NSW 2308, AUSTRALIA 2Cooperative Research Centre for Contamination Assessment and Remediation of
Environment (CRC CARE), The University of Newcastle, ATC Building, Callaghan, NSW 2308 AUSTRALIA
INTRODUCTION Acid mine drainage is a natural process that occurs through oxidation and weathering of pyrite (FeS2) during mining activities (Abinandan et al., 2018). The presence of metals in copious amounts such as iron, zinc, cadmium, aluminum, nickel, and manganese with extremely low pH (2-3.5) pose a severe threat to the biota due to their higher bioavailability (Abinandan et al., 2019). Chemical and membrane treatment requires capital investment and generates sludge leading to environmental burden. Acidophilic microbes especially microalgae that survive in AMDs have certainly developed tolerance to the extreme conditions but their remediation or metal recovery potential is yet to be studied in more detail. Non-acidophilic microalgae (NAMs) upon adaptation to low pH can help in remediating AMD is the hypothesis of the present study. Two strains of viz., Desmodesmus sp. MAS1 and Heterochlorella sp. MAS3 showed good tolerance to acid pH 3 at a minimum survivable cell density of 50×104 Cells mL–1 (Abinandan et al., 2019). These two strains were adapted in acid pH 3.5 for 100 generations and were screened for iron tolerance in synthetic acid mine drainage. Further, the ability of these microalgae to remove iron from real AMD samples was investigated. METHODS AMD was collected from local mining site and the metal analysis was carried out using ICP-MS analysis (Abinandan et al., 2019). Synthetic acid mine drainage (SAMD) samples were prepared by supplementing metals found in AMD with increasing iron concentrations of 50-800 mg L–1 to evaluate the tolerance of microalgae. Biomass concentration of 2 g L–1 and 3.5 g L–1 were used to evaluate for iron removal capacity from real AMD. Microalgal growth was meased in terms of chlorophyll fluorescence (Abinandan et al., 2019). RESULTS AND DISCUSSION
• Iron was found to be predominant in collected AMD sample (Table 1) and the algal strains were subjected to iron tolerance studies in SAMD.
• The strains Demsodesmus sp. MAS1 and Heterochlorella sp. MAS3 exhibited EC50 values for Fe content up to 200 mg L-1 in synthetic AMD solution at pH 3.5 (Fig 1a).
• Subsequently, both the strains showed Fe accumulation (34-36%) in real AMD solution with low cell density. Upon increasing the cell density, both the strains exhibited >40-70% Fe removal from real AMD solution within 96 h.
• From microscopic observation, the cells were agglomerated with Fe with MAS 3 attained enlarged cell morphology than MAS 1 as indicated from flow cytometry (Fig 1b).
M51-P34
Copyright © CRC CARE Pty. Ltd., 2019
CleanUp Conference 2019Adelaide, Australia8 –12 September 2019 320
Table of Contentsfor this manuscript

Table 1. AMD Characteristics
(b)
(a)
Fig. 1. (a)Toxicity studies in SAMD (b) Morphological changes observed by flow cytometry and microscopic image of strains MAS1 and MAS 3
CONCLUSIONS These two strains were tested for their Fe toxicity implying its tolerance potential in synthetic AMD solution. Our study suggests that adapted acid tolerant microalgae have great potential as candidates for Fe recovery from AMD with high cell density or biomass production. REFERENCES Abinandan, S., Subashchandrabose, S.R., Venkateswarlu, K. and Megharaj, M.(2018)
Microalgae–bacteria biofilms: a sustainable synergistic approach in remediation of acid mine drainage. Appl. Microbiol. Biotechnol. 102, 1131-1144.
Abinandan, S., Subashchandrabose, S.R., Cole, N., Dharmarajan, R., Venkateswarlu, K. and Megharaj, M. 2019 Sustainable production of biomass and biodiesel by acclimation of non-acidophilic microalgae to acidic conditions. Bioresour.Technol. 271,316-324.
Abinandan, S., Subashchandrabose, S.R., Panneerselvan, L., Venkateswarlu, K. and Megharaj, M., 2019. Potential of acid-tolerant microalgae, Desmodesmus sp. MAS1 and Heterochlorella sp. MAS3, in heavy metal removal and biodiesel production at acidic pH. Bioresour. Technol. 278, pp.9-16.
Metal Conc.
(mg L–1 ) Fe 150.2 Mn 16.9 Al 0.3 Cd 0.5 Cu 0.4 Co 0.1
321
Table of Contentsfor this manuscript

SORPTION OF FENAMIPHOS IN SOILS FROM TEMPERATE AND TROPICAL REGIONS
Tanya Cáceres1, Megharaj Mallavarapu1,2, Ravi Naidu1,2, Kadiyala Vekateswarlu3
1GCER, University of Newcastle, University Drive, Newcastle, NSW 2308, AUSTRALIA
2CRC CARE, University of Newcastle ATC Building, Newcastle, NSW 2308, AUSTRALIA 3 Formerly Department of Microbiology, Sri Krishnadevaraya, University,
Anantapur 515055, INDIA [email protected]
INTRODUCTION Organophosphorus (OP) pesticides have been widely used in agriculture and public health for the past 50 years. Fenamiphos (O-ethyl-O-(3-methyl-4-methylthiophenyl)-isopropylamido-phosphate) is a systemic OP insecticide and nematicide registered for its use in more than 60 countries including several tropical regions. Fenamiphos is applied on a variety of plants such as tobacco, turf, bananas, pineapples, citrus and other fruit vines, some vegetables, and grains (Extoxnet, 1994). In tropical regions such as Brazil and Ecuador the pesticide has been used extensively in tomato crops, melon and banana (Cáceres et al.2008; Cáceres and Vekateswarlu 2018). In Australia its use is under review but it is still registered as nematicide-insecticide and it is used in banana, aloe vera, citrus and sugar cane. The compound has a high solubility in water corresponding to 0,4 g/L. From data available for other regions the pesticide has a moderate sorption to soils and therefore could move outside the sites of application by run off or leaching processes and could contaminate water bodies and affect the aquatic ecosystem. There are few data available on the sorption of fenamiphos to soils from the Latin America and Caribbean region as well as temperate regions in Australia. The main objective of this study was to provide information on sorption of 14C-labelled fenamiphos as well as cold fenamiphos to selected Ecuadorean and Brazilian tropical soils as well as some Australian temperate soils. Another important point was to evaluate the mobility of this pesticide in these soils and its potential in contaminating surface water as well as groundwater. METHODS Soil Collection and preparation A total of ten surface soils were collected from the top 15 cm from different regions in Ecuador (Coast, Andes and jungle), three soils were collected from the Sao Paulo State in Brazil and three soils were collected from South Australia State in Australia. The soils were sieved at 2 mesh and the organic matter content as well as the texture (sand, silt and clay content) was determined. Sorption tests Sorption of fenamiphos in the selected soils from Brazil was measured following a standard protocol (OECD 2000) at room temperature by a batch equilibration method. Five grams of soil samples was taken in glass tubes, and 5 ml of aqueous solution of 14C-fenamiphos was added. Five different concentrations of fenamiphos equivalent to 0.015, 0.036, 0.072, 0.149, and 0.288 mg/ L with the corresponding activity of 2090, 5128, 10062, 20771, and 40081 dpm /mL were used. To determine the sorption of fenamiphos in the soils from Ecuador and Australia a single concentration corresponding to 4 mg/L of cold fenamiphos was used. Blanks without soils indicated no significant sorption loss on tube walls. The soil solutions were equilibrated in a mechanical shaker for 24 h. The tubes were then centrifuged at 12100×g for 10 min. In the case of 14C- fenamiphos, aliquots (triplicates) of 1 mL of the supernatant were transferred to 10 mL of scintillation solution. The radioactivity in the
M51-P35
Copyright © CRC CARE Pty. Ltd., 2019
CleanUp Conference 2019Adelaide, Australia8 –12 September 2019 322
Table of Contentsfor this manuscript

samples was measured in a liquid scintillation counter. In the case of cold fenamiphos 1 ml of the supernatant (triplicate) was transferred into vials and analysed by HPLC (UV) according to (Cáceres et al.2008; Cáceres and Vekateswarlu 2018) Determination of sorption coefficient The sorption coefficient (Kd) was determined using the ratio of pesticide sorbed by the soil samples (mg/ Kg) to the equilibrium solution concentration (mg/ L), and was normalized on the basis of organic carbon content to obtain Koc (Koc = Kd/fraction of organic carbon). RESULTS AND DISCUSSION The Kd values determined to the different soils are summarised in Table 1. The Kd values varied from 2.3 to 14.9 L/Kg. The soils presented a wide range of organic carbon (1.5- 6.86%) and clay content (1.9- 66%) and it was determined that the sorption of fenamiphos was linked not only to the organic matter content but also to the clay content and its mineralogy.
CONCLUSIONS Fenamiphos presented a low to medium sorption in soils from tropical regions (Ecuador and Brazil) and temperate regions (Australia). The sorption was linked to the organic matter content and type and quantity of clay. ACKNOWLEDGEMENT This research was supported by the Australian Government through an IPRS Scholarship in collaboration with UniSA and CRCCARE. REFERENCES Cáceres, TP., Megharaj, M., Naidu, R. (2008) Sorption of fenamiphos to different soils: The
influence of soil properties. J Environ Sci Health B 43, 605–610. Cáceres, TP.,Venkateswarlu, K. (2018) Sorption and mobility of 14C-fenamiphos in Brazilian
soils. Environ Monit Assess (2018) 190: 109. Extoxnet. (1994) Fenamiphos. Accessed on 7 May 2019
http://pmep.cce.cornell.edu/profiles/extoxnet/dienochlor-glyphosate/fenamiphos-ext.html Organisation for Economic Co-operation and Development (OECD). (2000). Adsorption-
desorption using a batch equilibrium method (45 pp). Guideline for testing chemicals: OECD.
Table 1. Soil characteristics and sorption coefficients on tropical and temperate soils Region Soil Kd (L/Kg) Koc
Australia M. Lakes 4.5 236 Kersbrook 5.9 203 Kulpara 3.2 188 Ecuador S. Domingo 13.3 289 Valencia 8.32 218 Flavio Alfaro 11.3 753 San Vicente 2.4 141 Chone 14.9 425 Alluriquin 14.1 266 Salasaca 4.07 101 Pilahuin 12.57 208 Riobamba 8.95 288 Agoyan 11.5 230 Brazil PV 3.86 167 LVd 3.91 93 LVdf 2.33 111.5
Adapted from Cáceres et al, 2008; Cáceres and Vekateswarlu 2018
323
Table of Contentsfor this manuscript

PFAS SOURCE ZONE REMEDIATION USING FLUIDISATION AND FRACTIONATION
David Burns1, Robert K. Niven2, Nasser Khalili3, Richard Pashley4, Mark Taylor5,
Vladimir Strezov5, Scott Wilson5, Peter Murphy1
1OPEC Systems Pty Ltd, 48-50, 7 Narabang Way, Belrose NSW, 2085, AUSTRALIA 2School of Engineering and Information Technology, The University of New South Wales,
Northcott Drive, Canberra ACT 2600, AUSTRALIA 3School of Civil and Environmental Engineering, The University of New South Wales, Sydney
NSW 2052, AUSTRALIA 4School of Sciences, The University of New South Wales, Northcott Drive, Canberra ACT
2600, AUSTRALIA 5Department of Environmental Sciences, Macquarie University, Balaclava Road, North Ryde
NSW, 2109, AUSTRALIA [email protected]
INTRODUCTION PFAS source zone remediation by foam fractionation and in situ-fluidisation. This project aims to develop two methods for the in-situ remediation of per- and poly-fluroalkyl substances (PFAS) contamination, downhole foam fractionation for in-situ groundwater treatment, and in-situ fluidisation for soil treatment, both separately and in combination. Using these methods, PFASs will be removed in the form of a foam, which will be extracted at the surface as a liquid concentrate. These techniques could enable PFAS removal efficiencies of greater than 90%, providing entirely new methods for the aggressive removal of PFAS from contaminated source zones. This project will enable rapid removal of bulk PFAS from soils and groundwater and reduce the potential for further spreading. Note: The Australian Research Council (ARC) awarded AUD $900,000 grant funding for this project. An additional AUD $160,000 contribution from OPEC Systems is provided as part of the grant funding arrangement. Date of funding was 1 July 2019. METHODS The project team proposes to develop two methods for the removal of PFAS in soil source zones: foam fractionation and in-situ fluidisation, both separately and in combination. Technical Approach Three technical themes are proposed: (1) refinement of OPEC’s Surface Active Foam Fractionation (SAFF) process to support the removal of PFAS and the management of high sediment loads in process waters from soil washing activities; (2) testing of in-situ foam fractionation and in-situ fluidisation for removal of PFAS from soil and the development of appropriate design configurations for field applications. Includes ecological risk assessment; and (3) the synthesis of in-situ techniques to achieve a combined treatment train for improved in-situ soil and groundwater remediation. Note on Design Configurations Remediation within an on-site containment cell may require design specifications capable of withstanding abrasive forces, heat and/or pressure expected from future remediation/ destruction technologies currently being researched/ developed.
M51-P36
Copyright © CRC CARE Pty. Ltd., 2019
CleanUp Conference 2019Adelaide, Australia8 –12 September 2019 324
Table of Contentsfor this manuscript

RESULTS AND DISCUSSION Pilot-scale testing of OPEC Systems SAFF technology 2016-2018 (Fig.2) demonstrated that foam fractionation (without chemical amendments) was able to:
• Rapidly remove greater than 99% priority PFAS and precursors • Rapidly remove greater than 86% of total detectable PFAS
o Waste is less than 0.001% of original volume (no secondary waste) Soil liquefaction previously reported by Niven et al for remediation of diesel in soils:
• Applicable to depths of up to 2.5m BGL • Hydraulic lance jets can accommodate gas/ liquid mixture in uniform and clay soils • Effective mechanical separation is achieved
Fig. 1. Visual concept of soil liquefaction and fractionation.
Fig.2. Pilot trial results for PFAS removal using SAFF process.
CONCLUSIONS Further research and bench-scale testing shall assess this interesting remediation concept for removal of PFAS in soil source zones and attempt to address current data gaps (1) limited in-situ appreciation of PFAS remediation; (2) efficacy of PFAS removal using liquefaction; (3) zones of influence; and (4) impact of high sediment load in process waters. REFERENCES Australian Research Council, PFAS Remediation Research Program. Niven, R.K. and Khalili, N. (1998) NRC Canada. In-situ Multiphase Fluidization (“upflow
washing”) for the Remediation of Hydrocarbon Contaminated Sands. Can. Geotech. J. 35: 938-960.
325
Table of Contentsfor this manuscript

CHRONIC EXPOSURE TO PERFLUOROOCTANE SULFONATE (PFOS) HAMPERS REPRODUCTION CAPACITY AND LOCOMOTION
IN CAENORHABDITIS ELEGANS
Manjurul Islam Chowdhury, Tanmoy Sana, Logeshwaran Panneerselvan, Raja Dharmarajan, Megharaj Mallavarapu
Global Centre for Environmental Remediation, the University of Newcastle, ATC Building,
University Drive, Callaghan-2308, AUSTRALIA [email protected]
INTRODUCTION PFOS is one of the predominant members of the family of anthropogenic perfluoroalkyl substances (PFASs), which has been extensively used in different industries for more than 50 years (Liu et al., 2011, Picó et al., 2011). PFOS is a surfactant which is toxic, bioaccumulative and highly persistent in the environment (Lau et al., 2004). Due to these properties, PFOS and its salts have been included in the Stockholm convention’s POP’s list (Faniband et al., 2014). Given the widespread distribution of PFOS in the environment, it is important to establish its potential risk to the non-target biota and the environment. C. elegans is one of the free-living model animals that thrives in soil and sediments and highly suitable as a test organism for risk assessment of contaminants. C. elegans has almost 60-80% of its genes share similarity with humans (Kaletta and Hengartner, 2006). The neurotransmitter systems of C. elegans are similar to higher eukaryotic animals such as vertebrates (Avila et al., 2012). All these systems are important for reproduction, locomotion, metabolism and life cycle of C. elegans in its normal life. Hence, we studied the major behavioral responses of C. elegans exposed to PFOS under standard laboratory conditions. METHODS Like any other free-living animals – growth, reproduction, locomotion, and lifespans are the fundamental physiological processes of C. elegans. We also determined the LC50 to understand the intensity of PFOS toxicity on C. elegans species. Briefly, to determine these behavioral factors C. elegans were cultured in Nematode growth medium (NGM) with proper bacterial food source. Then synchronized L4 stage larva were exposed to different concentrations of PFOS (0.25, 0.5, 1.0, 2.0, 4.0, 8.0, 10, 15, 15, 31.25, 62.5, 125, 250, 500 uM) diluted in K medium and 1% DMSO for 48 hours with bacteria as food source. The K medium and 1% DMSO without PFOS served as control in these experiments. Based on the LC50 value, six different concentrations (0.001 uM, 0.01 uM, 0.1 uM, 0.5 uM, 1.0 uM and 2.0 uM) were selected for further studies. After 48 hours exposure, animals were withdrawn from chemical exposure by centrifugation and washed three times with M9 buffer. For locomotion behavior study, head thrashing per minutes and number of body bending per 20 seconds were observed. On the other hand, total number of eggs laid by a single animal in its whole life were counted to understand the reproduction behavior. Generation time was also determined to understand the reproduction duration of animal where time is counted between births of an animal to first egg lying. The total survival days of animal were counted for both exposed and unexposed animals. Survival rate of total animals exposed to PFOS and the individual animal lifespan were calculated in this study. For all these experiments, around ten animals per replicate in triplicates were performed. RESULTS AND DISCUSSION The concentration-response relationship for behavioural toxicity in C. elegans exposed to PFOS was evaluated in this study. LC50 value of PFOS for C. elegans was found to be 5.5 uM. A significant effect of PFOS was observed on locomotion behavior of C. elegans. Number of head thrashing were highly reduced in presence of all the six concentrations of
M51-P37
Copyright © CRC CARE Pty. Ltd., 2019
CleanUp Conference 2019Adelaide, Australia8 –12 September 2019 326
Table of Contentsfor this manuscript
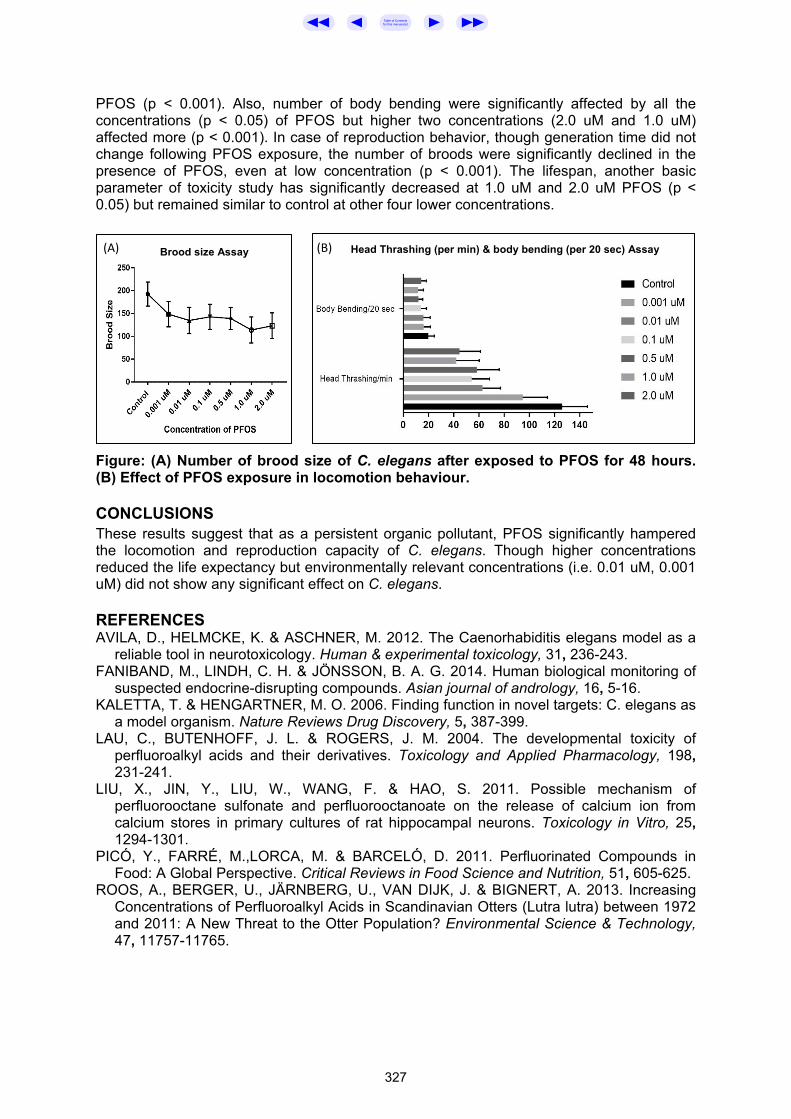
PFOS (p < 0.001). Also, number of body bending were significantly affected by all the concentrations (p < 0.05) of PFOS but higher two concentrations (2.0 uM and 1.0 uM) affected more (p < 0.001). In case of reproduction behavior, though generation time did not change following PFOS exposure, the number of broods were significantly declined in the presence of PFOS, even at low concentration (p < 0.001). The lifespan, another basic parameter of toxicity study has significantly decreased at 1.0 uM and 2.0 uM PFOS (p < 0.05) but remained similar to control at other four lower concentrations.
Figure: (A) Number of brood size of C. elegans after exposed to PFOS for 48 hours. (B) Effect of PFOS exposure in locomotion behaviour. CONCLUSIONS These results suggest that as a persistent organic pollutant, PFOS significantly hampered the locomotion and reproduction capacity of C. elegans. Though higher concentrations reduced the life expectancy but environmentally relevant concentrations (i.e. 0.01 uM, 0.001 uM) did not show any significant effect on C. elegans. REFERENCES AVILA, D., HELMCKE, K. & ASCHNER, M. 2012. The Caenorhabiditis elegans model as a
reliable tool in neurotoxicology. Human & experimental toxicology, 31, 236-243. FANIBAND, M., LINDH, C. H. & JÖNSSON, B. A. G. 2014. Human biological monitoring of
suspected endocrine-disrupting compounds. Asian journal of andrology, 16, 5-16. KALETTA, T. & HENGARTNER, M. O. 2006. Finding function in novel targets: C. elegans as
a model organism. Nature Reviews Drug Discovery, 5, 387-399. LAU, C., BUTENHOFF, J. L. & ROGERS, J. M. 2004. The developmental toxicity of
perfluoroalkyl acids and their derivatives. Toxicology and Applied Pharmacology, 198, 231-241.
LIU, X., JIN, Y., LIU, W., WANG, F. & HAO, S. 2011. Possible mechanism of perfluorooctane sulfonate and perfluorooctanoate on the release of calcium ion from calcium stores in primary cultures of rat hippocampal neurons. Toxicology in Vitro, 25, 1294-1301.
PICÓ, Y., FARRÉ, M.,LORCA, M. & BARCELÓ, D. 2011. Perfluorinated Compounds in Food: A Global Perspective. Critical Reviews in Food Science and Nutrition, 51, 605-625.
ROOS, A., BERGER, U., JÄRNBERG, U., VAN DIJK, J. & BIGNERT, A. 2013. Increasing Concentrations of Perfluoroalkyl Acids in Scandinavian Otters (Lutra lutra) between 1972 and 2011: A New Threat to the Otter Population? Environmental Science & Technology, 47, 11757-11765.
(A) Brood size Assay (B) Head Thrashing (per min) & body bending (per 20 sec) Assay
327
Table of Contentsfor this manuscript

PROGRESS AND CHALLENGES FOR SUBSURFACE REMEDIATION TECHNOLOGIES FOR TPHs
Anish Saini1,2, Dawit Bekele1,2, Sreenivasulu Chadalavada1,2, Cheng Fang1,2, Ravi Naidu1,2
1 Global Centre for Environmental Remediation, University of Newcastle, NSW, AUSTRALIA
2 Cooperative Research Centre for Contamination Assessment and Remediation of the Environment (CRC CARE), University of Newcastle, NSW, AUSTRALIA
INTRODUCTION Although contamination has been recognized as an issue for over 70 years, hardly a tenth of such sites have been remediated (Naidu, 2013). This may be attributed to the complex and challenging nature of contamination that varies from site to site and to high costs of clean-up (Mulligan et al., 2001, Gavrilescu et al., 2009, Naidu, 2013). Petroleum hydrocarbon (TPH) contaminated surface and subsurface soils are currently treated using chemical, physical or biological processes. Most commonly contaminated soils are, disposed to a landfill or incinerated. Both these processes are expensive, not very efficient and are generally unsustainable (Ting et al., 1999). Biological treatments, including natural bioremediation and/or enhanced bioremediation involve decomposing contaminants to nontoxic products by microbiological processes (Riser-Roberts, 1998). Bioremediation of TPH contaminated soils has been investigated since the late 1940s. It can have limited effectiveness due to several factors including sites generally contaminated with a mixture of contaminants, high concentrations of contaminants being inhibitory or lethal to bacteria, contaminants binding to soil, decreasing their bioavailability, etc. EK is a green technology that can be applied in-situ and hence is inexpensive and non-disruptive. Another practical and important reason for the use of this technology is its efficiency in low-permeability soils. The applied electrical field can readily reach contaminants embedded deep in the subsurface, which other technologies are incapable of reaching (Schnarr et al., 1998, Reddy and Saichek, 2003). Bioremediation of contaminated soils is limited by the bioavailabity of contaminants, especially in clayey soil (Wick et al., 2004). Electrokinetics (EK) is a technique that can be used to overcome these kinds of limitations to bioremediation. EK augments bioremediation by making nutrients, electron acceptors (EAs) and electron donors (EDs) more bioavailable to catabolically active microorganisms (LUKAs, 2009). METHODS Two experiments have been performed to see the effectiveness of electrokinetically enhanced bioremediation of TPH contaminated soils. The first experiment was carried out for a period of 7 days and the second one for 30 days. The configuration of electrodes for experiment one was 5 parallel anode and cathode. For the second experiment it was changed to just four electrodes, one on each corner of the set-up. 1mA current was passed through the set-up continuously and soil pH, moisture, temperature and electro-conductivity (EC) measurements were taken on regular intervals. RESULTS AND DISCUSSION Experiment 1 provided a good background knowledge of the changes that occur during EK enhanced remediation. The pH which is a main limiting factor for bioremediation changes within three days of running the set-up, which also causes minimal changes in the moisture content of soil and the EC. Experiment 2 further confirmed the results from experiment 1 and showed that even after the regular changes in the soil pH, EC and moisture the set-up works well. GC-MS results for
M51-P38
Copyright © CRC CARE Pty. Ltd., 2019
CleanUp Conference 2019Adelaide, Australia8 –12 September 2019 328
Table of Contentsfor this manuscript

both the experiments showed reduction in the TPH content of soil. Those results are currently being studied to present them for this poster and further publication.
Fig. 1. Schematic representation of the different Electrokinetic phenomenon
CONCLUSIONS It is evident that despite the development of technology and nearly 75 years of remedial work, that remediation of subsurface contaminated media has been challenging and often difficult. As a consequence, < 5 to 10% of contaminated sites have been remediated (Naidu, 2013). Every contaminated site has differing soil characteristics, and as most of the technologies are not one-size-fits all remediation techniques, they cannot be successfully applied at any particular site. For effective remediation of TPH the existing technologies needs be enhanced above currently available mechanical or microbial processes (Huang et al., 2005). Hence, there is an urgent need to develop an efficient and cheap in situ remediation technology, which could perform the subsurface remediation at any contaminated site with minimal disturbance or destruction to the natural environment at the site. The results from the experiments carried out are promising, but further experimentation is required before they can be transferred for field trials. REFERENCES NAIDU, R. 2013. Recent advances in contaminated site remediation. Water, Air, & Soil
Pollution, 224, 1-11. MULLIGAN, C., YONG, R. & GIBBS, B. 2001. Remediation technologies for metal-
contaminated soils and groundwater: an evaluation. Engineering geology, 60, 193-207. GAVRILESCU, M., PAVEL, L. V. & CRETESCU, I. 2009. Characterization and remediation
of soils contaminated with uranium. Journal of Hazardous Materials, 163, 475-510. TING, Y., HU, H. & TAN, H. 1999. Bioremediation of petroleum hydrocarbons in soil
microcosms. RISER-ROBERTS, E. 1998. Remediation of petroleum contaminated soils: biological,
physical, and chemical processes, CRC Press. WICK, L. Y., MATTLE, P. A., WATTIAU, P. & HARMS, H. 2004. Electrokinetic transport of
PAH-degrading bacteria in model aquifers and soil. Environmental science & technology, 38, 4596-4602.
LUKAS, Y. 2009. Coupling electrokinetics to the bioremediation of organic contaminants: principles and fundamental interactions. Electrochemical Remediation Technologies for Polluted Soils, Sediments and Groundwater, 369.
329
Table of Contentsfor this manuscript

PARTICLE-SIZE DISTRIBUTION OF TRACE ELEMENTS IN LEGACY MINE SITE SOILS, NSW, AUSTRALIA
A.S.M. Fazle Bari1,2, Mohammad Mahmudur Rahman1, Dane Lamb1, Nanthi Bolan1,
Balaji Seshadri1, Ravi Naidu1
1GCER, The University of Newcastle, AUSTRALIA
2Department of Soil Science, Sher-e-Bangla Agricultural University, BANGLADESH [email protected]
INTRODUCTION Contamination of trace metals and metalloids in soils is a major concern worldwide. Due to their toxic nature, they can pose significant threats to human and other living organisms. Anthropogenic activities such as mining, smelting and electroplating generally increased trace element concentration in soils (Ghozikali et al., 2015, Huber et al., 2016). Thus, it is important to determine how the physiochemical properties and particle size fractions can influence the concentrations of elements in soils as it can provide significant information for the remediation of soil. Several studies have been conducted to determine the trace elements in different particle size fractions but most of them were focused on arable soil, garden soil, urban soil, dust and sediment. However, data about the distribution of trace elements in various particle size fractions from mine site soils, especially in Australian context is rare. Different soil particle size fractions have different properties and composition, which influence the behaviour of pollutants in the soil environment (Acosta et al., 2011). Generally, fine particles retain more trace elements due to their high specific surface area (Wang et al., 2006). The objective of this study was to evaluate the effect of particle size fractions and physiochemical properties on the distribution of the concentrations of trace elements in mine site soils, NSW, Australia. METHODS In this study, 7 soil samples were collected from different abandoned legacy mine sites of NSW, Australia. Of these, four samples were collected from Mole River mine, two samples were from Webbs Consols mine, and one sample from Halls Peak mine. Soils were air-dried at room temperature and dry-sieved to get following six particle size fractions: 4-2 mm, 2-1 mm, 1-0.25 mm, 0.25-0.125 mm, 0.125-0.053 mm and < 0.053 mm. The primary physio-chemical properties of soils were determined using standard protocols (Rayment and Higginson, 1992). Elemental concentrations were analysed by using both inductively coupled plasma mass spectrometry and inductively coupled plasma-atomic emission spectrometry following aqua regia-microwave digestion according to the USEPA method: USEPA 3051. RESULTS AND DISCUSSION The highest mean value of pH (5.89) of mine site soil was found in coarse particle size fractions (4-2 mm) and the lowest mean value of pH (5.32) was found in fine particle size fractions (< 0.053 mm) although the difference was not significant. As the particle size decreases, the EC values decrease at first and then subsequently increased. In respect of distribution of particles, the content of TOC and CEC increased with the decrease of particle sizes, and the finest particle fraction (< 0.053 mm) contained highest organic carbon (5.06 %) and CEC (3.03 cmol/kg) (Table 1). Generally trace element concentration increased with decrease of particle size (Fig. 1) and highest concentrations of Pb (32,324 mg/kg), Sb (1006 mg/kg) and Zn (1108 mg/kg) were observed in particle size fractions less than 0.053 mm. But, highest concentration of As (107,842 mg/kg) was found in coarse particle fraction (2-1 mm) followed by 4-2 mm fraction (104,143mg/kg) in one of the sample from Mole River mine. This can be due to the ore treatment process, where bigger particles remain enriched with the trace metal containing minerals. All fractions of this mine site soil sample showed the higher values of As indicating a lower recovery of the metals during the treatment of ore (Martínez-Martínez et al., 2010).
M51-P39
Copyright © CRC CARE Pty. Ltd., 2019
CleanUp Conference 2019Adelaide, Australia8 –12 September 2019 330
Table of Contentsfor this manuscript

Fig. 1. Distribution of As and Pb according to particle size.
Table 1.Physio-chemical properties and trace metals concentration according to particle size of mine site soils (n=7)
CONCLUSIONS These mine site soils are highly polluted with trace metals/metalloids such as As, Pb, Sb and Zn. Generally, elemental concentration increased with decrease of particle size fraction. This research showed that both finest and coarsest particle may contain higher concentration of elements due to higher surface area of fine particles and ore treatment processes. REFERENCES ACOSTA, J. A., FAZ, Á., KALBITZ, K., JANSEN, B. & MARTÍNEZ-MARTÍNEZ, S. 2011.
Heavy metal concentrations in particle size fractions from street dust of Murcia (Spain) as the basis for risk assessment. Journal of Environmental Monitoring, 13, 3087-3096.
GHOZIKALI, M. G., MOSAFERI, M., SAFARI, G. H. & JAAFARI, J. 2015. Effect of exposure to O 3, NO 2, and SO 2 on chronic obstructive pulmonary disease hospitalizations in Tabriz, Iran. Environmental Science and Pollution Research, 22, 2817-2823.
HUBER, M., WELKER, A. & HELMREICH, B. 2016. Critical review of heavy metal pollution of traffic area runoff: Occurrence, influencing factors, and partitioning. Science of the Total Environment, 541, 895-919.
MARTÍNEZ-MARTÍNEZ, S., FAZ, Á., ACOSTA, J. A., CARMONA, D. M., ZORNOZA, R., BÜYÜKKILIÇ, A. & KABAS, S. Heavy metals distribution in soil particle size fractions from a mining area in the southeast of Spain. Proceedings of the 19th World Congress of Soil Science: Soil solutions for a changing world, Brisbane, Australia, 1-6 August 2010. Symposium 3.5. 2 Risk assessment and risk based remediation, 2010. International Union of Soil Sciences (IUSS), c/o Institut für Bodenforschung, 30-33.
RAYMENT, G. & HIGGINSON, F. R. 1992. Australian laboratory handbook of soil and water chemical methods, Inkata Press Pty Ltd.
WANG, X.-S., QIN, Y. & CHEN, Y.-K. 2006. Heavy meals in urban roadside soils, part 1: effect of particle size fractions on heavy metals partitioning. Environmental Geology, 50, 1061-1066.
Particle size fraction (mm)
pH EC (µS/cm)
CEC (cmol/kg)
TOC (%)
As (mg/kg)
Pb (mg/kg)
Sb (mg/kg)
Zn (mg/kg)
4-2 5.89 91.51 2.13 1.25 17435 5515 35 328 2-1 5.79 79.93 2.17 1.63 18459 5985 38 314 1-0.25 5.51 75.43 2.20 1.78 16251 5688 42 291 0.25-0.125 5.41 83.66 2.20 2.38 19495 6725 54 331 0.125-0.053 5.33 106.31 2.61 2.48 17858 7747 122 340 <0.053 5.32 117.56 2.63 2.90 13454 8725 161 364
331
Table of Contentsfor this manuscript

OHS&E Planning of PFAS Investigation Programs: WEIGHING THE RISKS OF VECTOR BORNE INFECTIOUS DISEASES?
F. Amon, A. Mikkonen, J. Frangos, C. Wallis
CDM Smith 1/30 Wangaratta Street, Richmond VIC 3121, AUSTRALIA
INTRODUCTION While vector borne disease from mosquitos and ticks are generally something that is associated with international travel to tropical or developing countries, cases of Ross River Barmah forest, Dengue fever, Rickettsial infections and Q fever amongst others are found within and are being transmitted within Australia (Van Den Hurk, 2010, Graves, 2017). Other rarer infections, allergic reactions, paralysis, autoimmune disease and post-infection fatigue (Graves, 2017) can be harder to determine causation, whereas general pain, itching and discomfort associated with mosquito and tick bites is best avoided. Contaminated land practitioners undertaking fieldwork, especially in tropical or remote rural areas near bodies of water or within bushland need to use insect repellents, long sleeved clothing and mosquito nets to protect themselves from insect bites and vector borne disease during site assessments. Employees have a responsibility to ensure a safe workplace for their employees. However, many international guidance documents that have been relied upon prior to the PFAS National Environmental Management Plan (PFAS NEMP 2.0, HEPA 2019) specify that only products including insect repellents that have been tested and confirmed to be PFAS free should be used. MDEQ, 2018 and NHDES, 2016 provide a list of ‘allowable’ insect repellents, although most of these are not readily available within Australia. The PFAS NEMP does not specify insect repellents as potentially containing PFAS, although does recommend that items such as sunscreens and other personal care should not be worn or used during any stage of sampling (at site, during transport etc.) where sample contamination could affect analytical results (HEPA 2019). The contaminated land industry needs to remember that staff health, safety and wellbeing is paramount and more guidance documents, such as international PFAS sampling guidance need to be implemented with caution and with common sense and practicality. This poster provides the results from recent testing of insect repellents by CDM Smith and collates other recent insect repellent testing undertaken by others in Australia to add to the body of knowledge and help contaminated land practitioners make informed decisions about their health and safety practices when sampling for PFAS. APPROACH/METHODS In seeking to reduce the risk of insect bites and vector borne infectious disease to field staff especially when undertaking fieldwork in remote and rural, tropical or bushland areas, CDM Smith and other concerned employers (Cooke and Ewing 2018) have undertaken independent analysis of 28 PFAS compounds in insect repellents in Australia using two independent laboratories (Leeder Analytical and ALS respectively). CDM Smith tested seven insect repellents including four common off the shelf personal repellents (DEET and Picaridin), one ‘natural’ product (essential oils) and two permethrin clothing treatment products. Cooke and Ewing (2018) tested four insect repellents in 2018 RESULTS No PFAS was detected (LOR of <2.5 ug/kg) in any of the products tested. A list of repellents tested is provided in Table 1 along with Cooke and Ewing 2018 results.
M51-P40
Copyright © CRC CARE Pty. Ltd., 2019
CleanUp Conference 2019Adelaide, Australia8 –12 September 2019 332
Table of Contentsfor this manuscript

Table 1. Insect Repellents PFAS Testing Results Brand Name CDM Smith
(2018) (Leeder)
GHD (2018) (ALS)
PFAS identified above the LOR?
Aerogard Odourless protection No2
Tropical Strength pump spray No1
Bushman Person insect repellent No2
Plus person insect repellent No2 20% Deet rollon No1
OFF Tropical Strength pump spray No1
RID Tropical Strength pump spray No1
Equip Equip Debugger No1
Sawyer Insect repellent No1 Thursday Plantation Walkabout Insect Repellent No1
Moov Insect repellent spray No2 1 LOR 2.5 ug/kg 2 LOR range of 0.2-0.5 ug/kg DISCUSSION/CONCLUSIONS Insect repellents re key PPE for personal comfort and safety for many field programs, especially tropical or remote rural areas near bodies of water or within bushland. No detectable PFAS was identified in any of the insect repellents tested, including personal repellents and clothing repellents, similar to those results reported in other recent studies (Cooke E and Ewing J 2018). Therefore, these products are considered appropriate to use during PFAS site assessments. In addition, standard, practical and thorough cross contamination techniques during field investigations is standard practice, in particular for any investigation targeting a common contaminant or using low limits of detection. Therefore, should we be risking mosquito or tick-borne infectious disease and their serious consequences for an unlikely source of cross contamination? REFERENCES Cooke E. and Ewing J. (2018). PFAS in Sunscreens. Poster presentation at EcoForum 2018. HEPA (2019), PFAS National Environmental Management Plan 2.0 Graves et al, 2017, Tick-borne infectious diseases in Australia, Med J Aust 2017; 206 (7), 17
April 2017 MDEQ, 2018, General PFAS Sampling Guidance, Michigan Department of Environmental
Quality 16/10/2018 NHDES, 2016, PerFluorinated Compound (PFC) Sample Collection Guidance, NHDES,
November 2016 Van Den Hurk et al, 2010, Emerging tropical diseases in Australia. Part 4. Mosquito-borne
disease, Annals of Tropical Medicine and Parasitology / Vol. 104, No. 8, pp.623-640
333
Table of Contentsfor this manuscript

MULTIPLE TREATMENT SYSTEMS COMBINE TO ENHANCE REMOVAL OF PER- AND POLY-FLUOROALKYL SUBSTANCES
FROM CONTAMINATED WATER AT RAAF BASE WILLIAMTOWN, NSW AUSTRALIA
Steve Woodard1, Charlie Gordon2
1ECT2, 75 Washington Avenue, Portland, 04101-2617, USA
2ECT2, 28 Sydney Avenue, Forrest, 2603, AUSTRALIA [email protected]
INTRODUCTION Between approximately 2014 and 2018, the Defence conducted a comprehensive site investigation at RAAF Base Williamtown to determine the impacts from the historical use of aqueous film forming foam (AFFF), containing per- and poly-fluoroalkyl substances (PFAS) (including perfluorooctane sulfonate (PFOS), perfluorohexane sulfonic acid (PFHxS) and perfluorooctanoic acid (PFOA)). While Defence no longer uses AFFF containing PFOS, PFHxS and PFOA, legacy contamination occurred from historical use, storage and training activities at the property. By early 2016, Defence had determined that management of water flowing from the site in drains and beneath the site in groundwater would need to be managed. An important consideration when removing PFAS from the water on the site was not only ensuring the selected technology met the performance standards, but that it did so in an environmentally sustainable way, minimising waste generation. Emerging Compounds Treatment Technologies (ECT2) were engaged to supply, install and operate water treatment systems at Moors Drain and the former Fire Training Area (FTA) and were subsequently contracted to provide treatment of the PFAS plume identified in the Southern Area. APPROACH Regenerable ion exchange (IX) resin treatment systems were selected as the best solution for this application. Through the installation and use of a central regeneration system to service all three treatment systems on the site, minimal waste is generated, primarily because the spent resin is regenerated onsite. Additionally, the programmable logic control systems installed on these treatments systems allow for seamless transition between extraction wells and treated water discharge methods, ensuring maximum reduction in groundwater contamination while operating 24/7. Multiple treatment systems were installed to ensure the primary issue in each of the areas could be managed without impacting overall operations on the property. Moors Drain The Moors Drain system was installed in July 2017 to treat stormwater flowing off base. It consisted of sand filtration to remove solids and turbidity, pretreatment resin to remove colloidal and dissolved TOC and iron, regenerable IX resin to remove PFOS, PFHxS and PFOA, and single-use IX resin to polish shorter-chain PFAS. The system initially treated flows of up to 3.2 litres per second (Lps). Following 12 months of successful operation, when it was clear that the treatment approach was addressing an important concern for the community, the system was upgraded to manage higher flow rates up to 8Lps. Former Fire Training Area The former FTA treatment system is targeting the most significant source area on the property through a network of 15 extraction wells. Groundwater is extracted from a quarter to a third of the wells at any one time and treated prior to reinjection via irrigation. The extraction wellfield is actively managed to draw groundwater from the most contaminated
M51-P41
Copyright © CRC CARE Pty. Ltd., 2019
CleanUp Conference 2019Adelaide, Australia8 –12 September 2019 334
Table of Contentsfor this manuscript

wells, which tend to shift as remediation of the source area progresses. The treatment system manages flows of up to 12.5Lps, reflecting the capacity of aquifer for both extraction and reinjection. This system has been operating since July 2018 and incorporates the same basic process equipment employed at Moors Drain for both pretreatment and PFAS removal. Southern Area Plume An area known as the Southern Area plume expands off the Defence property to the south and has been identified as a significant secondary source of PFAS-contaminated groundwater. A similarly sized treatment system to that at the former FTA was installed to cut off the plume as it leaves the base, with a primary goal to facilitate the lifting of water use restrictions in the area as soon as possible. The system currently draws contaminated groundwater from a line of extraction wells along the boundary of the Defence property to capture and treat the water before it moves beneath private properties. Approval is being sought to install additional wells on private properties, so that contaminated groundwater can also be captured in the locations of highest PFAS concentrations within the offsite portion of the plume. Central Regeneration System A single IX resin regeneration system was installed on the Williamtown base in 2018 to serve all three PFAS water treatment systems. Vessels containing spent resin are temporarily removed from service and transported to the central regeneration system. The resin remains in the vessel as a regenerant solution is pumped through the vessel, stripping the PFAS from the resin beads. The regenerant solution is then reclaimed for reuse through distillation and a process called super-loading, which also ultra-concentrates the PFAS compounds into a small volume of solid waste. RESULTS AND DISCUSSION By April 2019, over 382 million litres of water had been treated on site, removing eight kilograms of PFAS and generating less than 3,600 kgs of total waste, including that waste generated by the pretreatment systems. All three treatment systems have consistently met the project objectives, including compliance with Australia’s health-based guidance values (HBGVs) and other PFAS removal goals set forth by Defence. A multi-layered approach to addressing water contamination flowing from and beneath the property has provideed the greatest opportunity to remove PFAS contamination quickly, while ensuring the aquifer is not adversely affected through excessive extraction and reinjection. The monitoring results to date demonstrate a substantial reduction in overall contamination in all extraction areas, including a 65 percent decrease in average PFAS concentration in the former FTA source area extraction wells. While it is possible that contamination levels in some areas will rebound, the overall remediation approach is to efficiently manage the rebound and continue to reduce the overall PFAS concentrations through sustained mass source removal. CONCLUSIONS Installing multiple IX water treatment systems, along with a central regeneration facility, has proven to be an effective, efficient, sustainable approach to removing PFAS and achieving consistent compliance with Australia’s HBGVs and other project objectives. The combination of treatment systems is already having a measurable impact on source area PFAS concentrations. Regenerating the resin on site, rather than disposing of spent resin, has resulted in minimal PFAS waste generation. The considerable reduction in waste generation, storage and thermal destruction has had a positive impact on the environment. The lessons learned to date have been largely around optimization of the pretreatment processes and resin regeneration system.
335
Table of Contentsfor this manuscript

PILOT TEST VERIFICATION OF THERMAL DESORPTION OF PFAS FROM SOIL
Scott A. Grieco1, Ross Edwards2
1Jacobs, 430 East Genesee Street, Syracuse, New York, 13166, USA
2Jacobs, Melbourne, Victoria, AUSTRALIA [email protected]
INTRODUCTION Use of aqueous film forming foam (AFFF) in the military, aviation, oil & gas, and other industries from the 1970’s until recently has resulted in impacts to soil and groundwater in many locations. AFFF contains per- and polyfluoroalkyl substances (PFAS), which have been identified as compounds of interest and are considered emerging contaminants. Recent studies indicate that PFAS are relatively common in association not only with fire training areas, as would be expected, but in proximity to aviation hangars, municipal fire stations, wastewater treatment plants, landfills, industrial facilities, and transportation crash sites. Across the world, increasing regulatory scrutiny and public awareness has resulted in numerous jurisdictions issuing screening levels, guidance levels, or mandated clean-up standards in soil and groundwater. Some of these promulgated standards address PFAS migration from soil to groundwater and are therefore extremely low and result in almost universal exceedances where samples are collected at facilities where AFFF was used. Given the likelihood of encountering PFAS-impacted soil, which would serve as an ongoing source to groundwater plumes, consideration of a remedial strategy is important. Demonstrated soil treatment technologies, such as stabilization with amendments or soil washing have plusses and minuses. Thermal desorption of PFAS from soils is a promising technology, which offers on-site destruction and elimination of long-term liability. RESULTS AND DISCUSSION This presentation provides:
• A summary of current and anticipated regulatory values for PFAS-impacted soil. • A review of pros and cons of available soil treatment technologies. • A summary of test methods and results from multiple soil thermal treatment bench
tests. • Details of a field-scale pilot test funded by the US Department of Defence Strategic
Environmental Research and Development Program (SERDP), including: approach/methods, analytical and observational results, and lessons learned applicable to full-scale implementation of this technology.
• Implications for application of these technologies in the Australian context, taking into account the nuances including national and state regulation, local geology and geochemistry.
• General cost information / competitiveness with the limited existing soil treatment technologies will also be provided.
M51-P42
Copyright © CRC CARE Pty. Ltd., 2019
CleanUp Conference 2019Adelaide, Australia8 –12 September 2019 336
Table of Contentsfor this manuscript

ARSENIC PHYTOTOXICITY IN SOIL: THE IMPACT OF RESIDENCE TIME
Sedigheh Abbasi1, D.T. Lamb1,2, M. Kader2, R. Naidu1,2, M. Mallavarapu1,2
1Global Centre for Environmental Remediation (GCER), The University of Newcastle,
AUSTRALIA 2Cooperative Research Centre for Contamination Assessment and Remediation of the
Environment (CRC CARE), The University of Newcastle, AUSTRALIA [email protected]
INTRODUCTION Arsenic contamination of terrestrial environments has occurred globally as a result of anthropogenic activities. Remediation of heavy metal contaminated soil is an expensive process, and awareness of different factors controlling the levels of risk is needed to improve risk assessments and inform remediation efforts. The residence time of contaminants (e.g. metals and metalloids) in soil or ‘ageing’ is a factor which generally influences the bioavailability and toxicity of soil-borne contaminants. Substantial research has been reported on the role of ageing on metals such as Cu and Zn on ecotoxcity. Indeed, ageing factors have been derived in the latter two examples for incorporation into regulatory guidance (see Warne et al. (2008)). Despite As being an important terrestrial contaminant, the effect of As ageing on phytotoxicity has received relatively little research. Given the critical role of Fe oxyhydroxides on As partitioning and the potential for mineralogical transformations of Fe minerals, As ageing in soils is likely to be significantly influenced by soil characteristics. Previous investigation on the impact on As ageing in soil with the use of barley with root elongation has been reported. In this study, Song et al. (2006) reported significant changes in As toxicity from 1 week to 12 weeks. However, this period of ageing and limited selection of soils provides limited information on the importance of (1) influence of ageing on As phyto-availability and (2) the interaction between time and key soil properties (e.g. soil pH and Fe oxyhydroxide content). Therefore, further research using a greater array of soils and more realistic time frames, to the knowledge of the authors, has not been reported. In the present work, soils were incubated for 0.25 and 5 yr across 10 contrasting soils to probe the influence of ageing and soil types simultaneously. To assess the influence of ageing on As phytotoxicity, a standard test was conducted to compare the growth rate of Cucumis sativus L. (cucumber). The role of soil properties on ageing was also investigated. METHODS Ten different soils with different characteristics were collected from different states of Australia. Soils were spiked with different concentrations of As to generate a dose-response curve. Soils were incubated under aerobic conditions for 0.25 yr (Kader et al., 2016) and 5 yr. Cucumber (Cucumis sativa L.) was seeded in soils and exposed for 28 days. Shoot relative growth (dry weight) was used to calculate effective As concentration that inhibited cucumber growth by 10, 20% and 50%. The effect of ageing period on As phytotoxicity was assessed by F test (SPSS, version 24) to compare data sets from the two experiments (Motulsky and Ransnas, 1987). To explore the factors controlling As ageing on phytotoxcity data, an Ageing Factor was calculated as: EC10 5 yr/ EC10 0.25 yr. This factor was related to soil properties, which were determined as reported previously (Kader et al., 2016). The Freundlich constant (Kf) was estimated from sorption studies in a NaNO3 background electrolyte (Smith et al., 1999). RESULTS AND DISCUSSION The effective As concentration that inhibits cucumber growth by 10%, 20% and 50% were compared to calculate the impact of ageing on As phytotoxicity. Little to no difference was
M51-P43
Copyright © CRC CARE Pty. Ltd., 2019
CleanUp Conference 2019Adelaide, Australia
8 –12 September 2019337
Table of Contentsfor this manuscript

observed in 7 out of 10 soils. Ageing of As from 0.25 to 5yr significantly increased As ECx values in three soils (P<0.05). In one soil there was no increase in EC50 values from ageing from 0.25 to 5 yr. For the dataset as a whole, ageing from between 0.25 and 5 yr increased the EC50 values by 1.6 fold. The relatively limited influence of ageing between the two periods of the current study may indicate that the first three months are most influential for the ageing of soil-borne As, especially in soil with low sorption potential for As. The Ageing Factor was related to soil pH (R2=0.46) and the Freundlich Partition coefficient. The Kf parameter was more strongly related to the ageing factor (R2 =0.86) (Fig. 1). The Kf parameter incorporates many factors controlling sorption in soil systems, including pH and the presence of important binding phases. In this study, the largest Ageing Factors were related to the two soils with greatest abundance of ‘amorphous’ Fe and Al oxyhydroxides. Soils with low sorption (typically high soil pH) showed low Ageing Factors. By contrast, soils with a relatively high amorphous Fe and Al oxyhydroxide content showed greater sorption and the greatest impact by As residence time in the soil. The 5 yr period of ageing would allow transformation of Fe and Al oxyhydroxdes, potentially allowing occlusion into the mineral structure in these soils.
Fig.1 Relationship between the ageing factor and the Freundlich partition coefficient. CONCLUSIONS Ageing of As and its impact on As bioavailability and phytotoxicity in soil appears to largely occur within 0.25 yr. Ageing of As more than 0.25 yr may not change risk of As toxicity to plants in all soils. Ageing was less important in alkaline and low sorbing soils. The role of Fe oxyhydroxide transformations over long-time frames demands further attention. REFERENCES Kader, M., Lamb, D.T., Megharaj, M. and Naidu, R. (2016) Sorption parameters as a
predictor of arsenic phytotoxicity in Australian soils. Geoderma 265, 103-110. Motulsky, H.J. and Ransnas, L.A. (1987) Fitting curves to data using nonlinear regression: a
practical and nonmathematical review. The FASEB Journal 1, 365-374. Smith, E., Naidu, R. and Alston, A.M. (1999) Chemistry of Arsenic in Soils: I. Sorption of
Arsenate and Arsenite by Four Australian Soils. J. Environ. Qual. 28, 1719-1726. Song, J., Zhao, F.J., McGrath, S.P. and Luo, Y.M. (2006) Influence of soil properties and
aging on arsenic phytotoxicity. Environmental Toxicology and Chemistry 25, 1663-1670. Warne, M.S.J., Heemsbergen, D., McLaughlin, M., Bell, M., Broos, K., Whatmuff, M., Barry,
G., Nash, D., Pritchard, D. and Penney, N. (2008) Models for the field-based toxicity of copper and zinc salts to wheat in 11 Australian soils and comparison to laboratory-based models. Environmental Pollution 156, 707-714.
338
Table of Contentsfor this manuscript

IN SITU FORMATION OF MAGNETITE NANOPARTICLES ON HALLOYSITE NANOTUBE: SYNTHESIS AND CHARACTERISATION
Amal Kanti Deb1, Mohammad Mahmudur Rahman1,2, Bhabananda Biswas2,3, Ravi Naidu1,2
1GCER, The University of Newcastle, University Drive, NSW 2308, AUSTRALIA
2CRC CARE, The University of Newcastle, NSW 2308, AUSTRALIA 3Future Industries Institute, University of South Australia, SA 5095, AUSTRALIA
E-mail: [email protected]
INTRODUCTION Among the nanoclays, the tubular nanoclays such as halloysite nanotube (HNT) is most emerging and attractive due to its versatile exfoliatable structure, availability and biocompatibility. HNT is a phyllosilicate clay mineral under the kaolinite group and an unique and useful nanomaterial composed of double layer of aluminium, silicon, hydrogen and oxygen (Schaefer, 2008). It constitutes a 1:1 aluminosilicate with the formula of Al2(OH)4Si2O5.nH2O and appearances in hydrated form (Tharmavaram et al., 2018). HNT have layers of exterior and interior sheets of siloxane (Si-O-Si) and Al-(OH)3, respectively and the rolling of these layers create exterior, interlayer and lumen surfaces (Tan et al., 2016) (Fig. 1a). Therefore, HNT can act as a nano container/matrix to load many nanoparticles (NPs) on its outer and inner surfaces to increase its performance in adsorption and/or catalytic reactions (Liu, 2016). The surface characteristics of HNT creates an avenue for its multipurpose applications such as in drug delivery, biological science, tissue engineering, electronic component, cosmetic and personal care products and environmental remediation (Lazzara et al., 2018). However, the functionalisation of outer and inner surfaces of HNT is necessary to enhance its utility in various fields and the magnetic NPs have emerging applications due to their super magnetic properties, easy separation and reusability. Therefore, loading of magnetite (Fe3O4) NPs on the HNT surfaces can be a novel approach. In this work, we present the development of Fe3O4 NPs on the surfaces of HNT (HNT-Fe3O4) by a simple sono-vacuum assisted co-precipitation method. The nanocomposite (NC) was characterised using multiple techniques. METHODS Materials and equipment. HNT, ACS grade of FeCl3.6H2O, FeSO4.7H2O, NaBH4, H2SO4, (98.5%) were obtained from Sigma Aldrich. MilliQ (MQ) water was used throughout the experimental process. Transmission electron microscope (TEM, JEM-2100, JEOL, Japan) was used for imaging magnetite-lumen structure. Elemental composition was carried out with energy dispersive X-ray spectroscopy (EDX, JEM-2100, JEOL, Japan). An X-ray diffractometer (XRD, XPert MPD, Philips) was used to analyse the crystallinity and spacing of HNT-Fe3O4 NC. To explore the functional groups on NC, the sample was characterised by Fourier transform infrared spectroscopy (FTIR, Agilent CARY series 600). Synthesis of HNT-Fe3O4 HNT was pre-treated with acid (Abdullayev et al., 2012). Briefly, HNT (1 g) was mixed with 2M H2SO4 (100 ml) and heated at 60 ºC under severe stirring for 2 h. HNT was then separated by centrifugation, washed three times, freeze-dried and powdered using agate mortar and pestle. Next, FeCl3.6H2O (0.6 g) and 0.4 g of FeSO4.7 H2O were dissolved in 50 ml MQ water. Then, treated HNT (AHNT) (0.85 g) was dispersed into the iron solution with severe stirring for 30 min followed by 45 min sonication. After that, the mixture was transferred into a vacuum jar for evacuation of air from the lumen of HNT. Afterwards, the mixture was heated at 65 ºC under N2 gas, 1M NaBH4 (20 ml) was added dropwise (10 drops per min) and the reaction was continued for 30 min. The HNT-Fe3O4 NC was then separated by centrifugation at 5000
M51-P44
Copyright © CRC CARE Pty. Ltd., 2019
CleanUp Conference 2019Adelaide, Australia
8 –12 September 2019339
Table of Contentsfor this manuscript

rpm for 15 min and washed three times using MQ water. Finally, the sample was freeze dried for 24 h and finely powdered. RESULTS AND DISCUSSION Fig.1 a, b, and c represent the TEM images of AHNT and HNT-Fe3O4 NC, and EDX spectra of HNT-Fe3O4 NC, respectively. Acid preferably attacked on Al-OH layer and consequently, lumen size increased from10-15 nm to 15-33 nm (Fig.1a). As shown in Fig.1b, Fe3O4 NPs with the average size of 9-14 nm were formed mostly on the outer surface of HNT. A few Fe3O4 NPs were loaded into the lumen of HNT. The EDX spectra (Fig.1c) ensures the presence of Fe element into the NC and the standard quantitative analysis exhibits that the Fe content is 6.17 wt.%, which is much more than literature (1.2 wt.%) (Duan et al., 2012). FTIR analysis shows all characteristic peaks of HNT and Fe3O4. The characteristic peak of Fe3O4 at around 585 cm-1 may overlap with the peak at 442 cm-1 of AHNT (Xie et al., 2011). XRD spectra exhibits diffraction peaks at 2θ values of around 12.12º, 20.15º, 24.55º, and 35.02º for AHNT and 30.21º, 35.68º, 43.37º, 57.14º, and 62.65º for Fe3O4, which further confirmed the formation of Fe3O4 NPs on HNT.
CONCLUSION Fe3O4 NPs were loaded mostly at outer surfaces and a few into the lumen of HNT by a simple sono-vacuum assisted co-precipitation method. TEM, EDX, XRD and FTIR analyses confirmed the formation of magnetic Fe3O4 NPs on HNT. As both HNT and Fe3O4 are considered as biocompatible and nontoxic, the synthesised materials can be potential for many applications, especially for environmental remediation. Further research should follow the application of this NC, its reusability and the environmental compliance of the residual materials. REFERENCES ABDULLAYEV, E., JOSHI, A., WEI, W., ZHAO, Y. & LVOV, Y. 2012. Enlargement of
halloysite clay nanotube lumen by selective etching of aluminum oxide. ACS nano, 6, 7216-7226.
DUAN, J., LIU, R., CHEN, T., ZHANG, B. & LIU, J. 2012. Halloysite nanotube-Fe3O4 composite for removal of methyl violet from aqueous solutions. Desalination, 293, 46-52.
LAZZARA, G., CAVALLARO, G., PANCHAL, A., FAKHRULLIN, R., STAVITSKAYA, A., VINOKUROV, V. & LVOV, Y. 2018. An assembly of organic-inorganic composites using halloysite clay nanotubes. Current Opinion in Colloid & Interface Science, 35, 42-50.
LIU, J. 2016. Catalysis by supported single metal atoms. Acs Catalysis, 7, 34-59. SCHAEFER, K. 2008. Cosmetics and Toiletries Special Delivery: Clay Nanotubes for skin.
2008. TAN, D., YUAN, P., LIU, D. & DU, P. 2016. Surface Modifications of Halloysite. In: YUAN, P.,
THILL, A. & BERGAYA, F. (eds.) Developments in Clay Science. Elsevier. THARMAVARAM, M., PANDEY, G. & RAWTANI, D. 2018. Surface modified halloysite
nanotubes: A flexible interface for biological, environmental and catalytic applications. Adv Colloid Interface Sci, 261, 82-101.
Fig.1: (a) TEM image of AHNT, (b) TEM image of HNT-Fe3O4, (c) EDX spectra of HNT-Fe3O4.
XIE, Y., QIAN, D., WU, D. & MA, X. 2011. Magnetic halloysite nanotubes/iron oxide composites for the adsorption of dyes. Chemical Engineering Journal, 168, 959-963.
340
Table of Contentsfor this manuscript

APPLICATION OF DECISION UNIT MULTI-INCREMENT SAMPLING (DUMIS) IN CONFIRMATION SAMPLING AT A
NICKEL CONTAMINATED SITE IN CHINA
J. Song1,2, R. Brewer3, W. Tang1, G.Y. Xu1,2, X. Gao1,2, J. Mao1, Y. Qian1
1Institute of Soil Science, Chinese Academy of Sciences, 210008, Nanjing, CHINA 2 University of Chinese Academy of Sciences, 100045, Beijing, CHINA
3Hawaii Department of Health, USA [email protected]
INTRODUCTION In recent years, brownfield sites have become an important source of land for urban redevelopment in major Chinese cities. According to Chinese laws, contaminated sites have to be cleaned up before land transaction and redevelopment. National and regional technical guidelines are available to evaluate the performance of remediation. However, current guidelines are based on discrete sampling method. Due to the inherent heterogeneity of pollutant distribution, the representativeness of discrete samples has been proven questionable. In addition, relevant Chinese sampling guidance does not properly evaluate sampling error, which is the major source of error for soil environmental monitoring data. To improve sample representativeness and confidence in analytical data, decision unit multi increment sampling (DUMIS) has been proposed and successfully used for expediting investigation of contaminated sites in the US, Canada and Denmark etc. Yet, it has never been demonstrated in China. The objectives of the present study is to explore the suitability of modified DUMIS in confirmation sampling at a Ni contaminated site in China. METHODS The demonstration site was a former inorganic salts producer, located in Shandong province, China. Environmental investigation showed that industrial activities and illegal burial of hazardous waste have caused soil contamination of Ni at the site. Ex-situ immobilization was proposed as the remedy. Contaminated soil was excavated and mixed with immobilizing agent using ALLU sieving and mixing equipment. Treated soil was then piled up for curing followed by confirmation sampling. In compliance with existing Chinese remediation verification guidance, the decision unit (DU) size was set as one DU per 400m2 (for excavation pits) or 500m3 soil (for stockpiles). For each DU, a multi increment sample was taken with a hand auger from top 0-20 cm and composed of 50 increments (subsampling points) evenly distributed within the DU. To evaluate the total (field sampling plus laboratory) sampling error, triplicates were taken from 10% of DUs. In a randomly selected DU (P4’), two sets of triplicates were taken, one contains 50 increments and the other contains 9 increments. DU Samples (2-3 kg each) were air dried, sieved through 0.15mm mesh and subsampled using the same method as in the field for analysis of total Ni.
M51-P45
Copyright © CRC CARE Pty. Ltd., 2019
CleanUp Conference 2019Adelaide, Australia
8 –12 September 2019341
Table of Contentsfor this manuscript
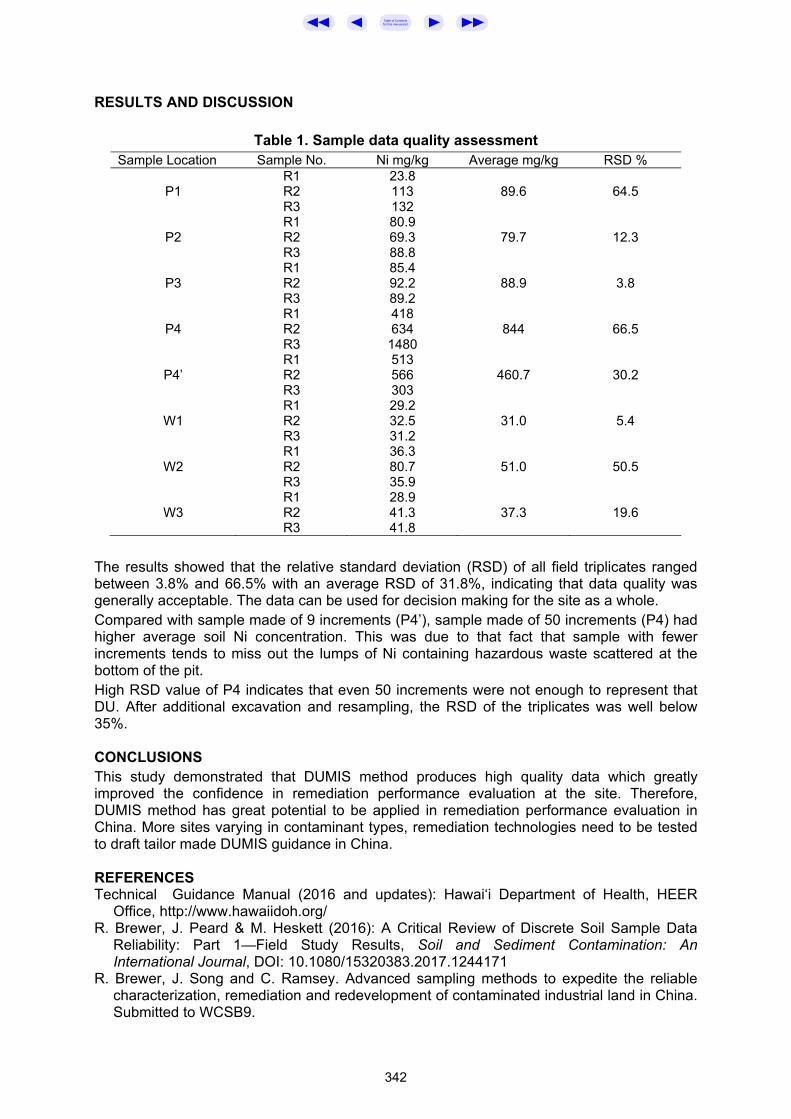
RESULTS AND DISCUSSION
Table 1. Sample data quality assessment Sample Location Sample No. Ni mg/kg Average mg/kg RSD %
R1 23.8 P1 R2 113 89.6 64.5
R3 132 R1 80.9
P2 R2 69.3 79.7 12.3 R3 88.8 R1 85.4
P3 R2 92.2 88.9 3.8 R3 89.2 R1 418
P4 R2 634 844 66.5 R3 1480 R1 513
P4’ R2 566 460.7 30.2 R3 303 R1 29.2
W1 R2 32.5 31.0 5.4 R3 31.2 R1 36.3
W2 R2 80.7 51.0 50.5 R3 35.9 R1 28.9
W3 R2 41.3 37.3 19.6 R3 41.8
The results showed that the relative standard deviation (RSD) of all field triplicates ranged between 3.8% and 66.5% with an average RSD of 31.8%, indicating that data quality was generally acceptable. The data can be used for decision making for the site as a whole. Compared with sample made of 9 increments (P4’), sample made of 50 increments (P4) had higher average soil Ni concentration. This was due to that fact that sample with fewer increments tends to miss out the lumps of Ni containing hazardous waste scattered at the bottom of the pit. High RSD value of P4 indicates that even 50 increments were not enough to represent that DU. After additional excavation and resampling, the RSD of the triplicates was well below 35%. CONCLUSIONS This study demonstrated that DUMIS method produces high quality data which greatly improved the confidence in remediation performance evaluation at the site. Therefore, DUMIS method has great potential to be applied in remediation performance evaluation in China. More sites varying in contaminant types, remediation technologies need to be tested to draft tailor made DUMIS guidance in China. REFERENCES Technical Guidance Manual (2016 and updates): Hawai‘i Department of Health, HEER
Office, http://www.hawaiidoh.org/ R. Brewer, J. Peard & M. Heskett (2016): A Critical Review of Discrete Soil Sample Data
Reliability: Part 1—Field Study Results, Soil and Sediment Contamination: An International Journal, DOI: 10.1080/15320383.2017.1244171
R. Brewer, J. Song and C. Ramsey. Advanced sampling methods to expedite the reliable characterization, remediation and redevelopment of contaminated industrial land in China. Submitted to WCSB9.
342
Table of Contentsfor this manuscript

ROOT BEHAVIOUR AND NUTRIENT MEDIUM’s pH, EC AND Cd LEVEL OF WHEAT GRASSES (ANTHOSACHNE SCABRA) UNDER
CADMIUM STRESS
M A Halim1,3, Mohammad Mahmudur Rahman1,2, Megharaj Mallavarapu1,2, Ravi Naidu1,2
1GCER, University of Newcastle, AUSTRALIA
2CRC CARE, University of Newcastle, AUSTRALIA 3Department of Biotechnology, Sher-e-Bangla Agricultural University, BANGLADESH
INTRODUCTION Pasture land is under heavy contamination threat with the advancement of industrialization. Among them, cadmium (Cd) is detrimental for plants which reaches to the plant edible parts from different polluted sources. Plant roots and rhizosphere play a vital role for accumulation of Cd into plants (Javed et al., 2019). Wheat grass (Anthosachne scabra) which is used as pasture(Crabbe et al., 2019), root system is crucial for maintaining the Cd availability in rhizosphere system as it produce both primary and seminal roots. There is no study was conducted on wheat grass roots exudation into nutrient medium physiochemical properties under different leaf stages. So, root architecture and nutrient mediums physiochemical study has been open an new window for Cd accumulation in plant parts.The present study was conducted to critically examine the wheat grasses root behavior and nutrient mediums characteristics at various level of Cd stresses. MATERIALS AND METHODS Hydroponics culture with ¼th strength Hoagland medium modified with ten levels of Cd (0, 1, 2, 3, 4, 5, 6, 7, 8, 9 and 10 mg/l) was used for germination test. Germination percentages were counted at 3, 5 and 7 days after plating wheat grass seeds. No germination was recorded until 7 days beyond 5 mg/l Cd. Hydroponics culture with ¼th strength Hoagland medium modified six levels of Cd (0, 1, 2, 3, 4, and 5 mg/l) with 4 replications were used to study the root number, root length, root fresh weight, root dry weight at 2nd, 4th and 8th leaf stages of wheat grass. Nutrients medium was changed, collected and replaced with new ¼th strength Hoagland medium modified six levels of Cd (0, 1, 2, 3, 4, and 5 mg/l) at 2nd, 4th and 8th leaf stages of wheat grass. The collected nutrient medium was analyzed for pH, electric conductivity (EC) and Cd. Cd contents measured by inductively coupled plasma mass spectrometry (ICP-MS). Below detection limit (BDL) of ICP-MS was 0.5 µg/l in solution matrix. Data were statistically analyzed at 5% level of significance with SPSS version25.00 software. RESULTS AND DISCUSSION Wheat grass accumulate Cd significantly as it is revealed that high concentration found at 2 leaf stages (295.12 µg/kg) whereas less than BDL was detected at 8 leaf sages and pH and EC dS/cm) were reduced with increasing number of leaves (Table.1.) in nutrient medium analysis. In case of germination it was found that Cd drastically hamper the germination (Figure.1). The results showed that the root number, root length, root fresh weight and root dry weight was reduced with increasing level of Cd and it is supported by different study(Javed et al., 2019). In case of root length it’s showed that decreasing pattern but root number, fresh weight and dry weight represent differently at the data recorded leaf stages. Highest number of root number (8.5, 15, 20.25); root fresh weight (mg/plant) (169.3, 211.11, 230.9); and root dry weight (mg/plant) (122, 161 and 185) were observed at 2, 4 and 8 leaf stages at 3ppm level of Cd, respectively compared to control. Root number 5, 9, 12.2; root fresh weight (mg/plant) 66.9, 140.5, 171.4 mg/; and dry weight (mg/plant) 48.2, 100.5, 124.08 at 2, 4 and 8 leaf stages respectively were recorded in cadmium.That means root architecture become bushy as long as plant can tolerate Cd stress(Griffin-Nolan et al., 2019).
M51-P46
Copyright © CRC CARE Pty. Ltd., 2019
CleanUp Conference 2019Adelaide, Australia
8 –12 September 2019343
Table of Contentsfor this manuscript

Figure.1.Effect of different level of Cd on germination of wheat grass
CONCLUSION Root is the ultimate pathway of Cd entry into the plant unless it can tolerate. The current study can specify that root and root secreted metabolites in has Cd mobilizing properties in pore water. It was revealed that all the parameters showing significant mean differences except the Cd contents at 2 and 4 leaves stages. So, this study is referred that further study will be needed regarding metabolomics, cytological and genetic point of view to clarify the linkage among the root exudates and wheat growth parameters. REFERENCES CRABBE, R. A., LAMB, D. W. & EDWARDS, C. 2019. Discriminating between C3, C4, and
Mixed C3/C4 Pasture Grasses of a Grazed Landscape Using Multi-Temporal Sentinel-1a Data. Remote Sensing, 11, 253.
GRIFFIN-NOLAN, R. J., OCHELTREE, T. W., MUELLER, K. E., BLUMENTHAL, D. M., KRAY, J. A. & KNAPP, A. K. 2019. Extending the osmometer method for assessing drought tolerance in herbaceous species. Oecologia, 189, 353-363.
JAVED, M. T., TANWIR, K., AKRAM, M. S., SHAHID, M., NIAZI, N. K. & LINDBERG, S. 2019. Phytoremediation of Cadmium-Polluted Water/Sediment by Aquatic Macrophytes: Role of Plant-Induced pH Changes. Cadmium Toxicity and Tolerance in Plants. Elsevier.
Table.1. Nutrients medium pH, EC and Cd contents at different leaf stages of wheat grass
344
Table of Contentsfor this manuscript

1,4-DIOXANE INDUCES OXIDATIVE STRESS IN RAPHIDOCELIS SUBCAPITATA
Nucharee Juntarachot1,3, Abinandan Sudharsanam1, Suresh R. Subashchandrabose1,2,
Sreenivasulu Chadalavada2, Ravi Naidu1,2, Megharaj Mallavarapu1,2, Chaiyavat Chaiyasut3
1Global Centre for Environmental Remediation (GCER), Faculty of Science, ATC Building, The University of Newcastle, Callaghan, NSW 2308, AUSTRALIA
2Cooperative Research Centre for Contamination Assessment and Remediation of Environment (CRC CARE), The University of Newcastle, ATC Building, Callaghan, NSW
2308 AUSTRALIA 3Innovation Center for Holistic Health, Nutraceuticals and Cosmeceuticals, Faculty of
Pharmacy, Chiang Mai University, Chiang Mai 50200, THAILAND [email protected]
INTRODUCTION 1,4 dioxane is human carcinogen and is used in many sources that include solvents, stabilizing agents, polyester and other industrial waste streams (Zenker et al., 2003). The mechanism of volatilization and sorption are not considered as significant attenuation process due to it physical and chemical properties. Contamination of 1,4 dioxane in ground water is associated with release of trichloroethane (TCA) (Mahendra et al., 2006). Leachates from municipal landfill sites are often reported to contain alarming levels of 1,4 dioxane and contaminated 37% ground water samples near army creek (Zenker et al., 2003). Reports suggest that 1,4 dixaone is resistant to biodegradation and hydrolysis is negligible under normal environmental conditions (Li et al., 2018). The availability and risk of 1,4 dioxane to the phytoplankton communities is very limited and suggest the lack of information on sensitivity to biota. Microalgae are important sensitive indicators and are also primary source for other life forms in aquatic and terrestrial environment. In this study, microalgae Raphidocelis subcapitata was exposed to various concentration of 1,4 dioxane and its responses is recorded. METHODS 1,4 dioxane was spiked to bolds basal medium (Sigma Aldrich, USA) spiked to attain various final concentrations 10,25,50,100,200,400,600,800,1000 mg L−1. The microalgae Raphidocelis subcapitata was inoculated in a 40mL closed glass vials containing 1,4 dioxane with various concentration with initial cell density of 5×10⁴ cells mL−1. Triplicate samples were withdrawn at 96 hr and growth was measured in terms of chlorophyll content via measuring autofluorescence; excitation (440nm) and emission (683nm) by the use of microplate reader. Determination of oxidative stress and lipids at two concentrations that are imposing less toxicity and high toxicity were performed using flow cytometery technique as mentioned in the literature (Abinandan et al., 2019). RESULTS AND DISCUSSION • Chlorophyll analysis indicated that algae could able to survive in 1,4 dioxane up to 1000
mg L by showing less toxic potential as indicated in Fig 1. • Despite, 1,4 dioxane increased oxidative stress that inturn trigged the accumulation of
lipid in Raphidocelis subcapitata compared with control. • Oxidative stress profile exhibited 3 fold increase in microalgae upon exposure to dioxane
while, slight increase was observed in lipids.
M51-P47
Copyright © CRC CARE Pty. Ltd., 2019
CleanUp Conference 2019Adelaide, Australia
8 –12 September 2019345
Table of Contentsfor this manuscript

Fig. 1. Chlorophyll profile of Raphidocelis subcapitata to 1,4 dioxane
Table 1 Oxidative stress and neutral lipids of Raphidocelis subcapitata in response to 1,4 dioxane
Treatments Neutral lipids Oxidative stress Data Average Data Average
Control R1 320 342.5 121 114 R2 365 107
Low R1 381 375.5 273 338.5 R2 370 404
High R1 364 384.5 293 378.5 R2 405 464
CONCLUSIONS The study demonstrates that oxidative stress was induced in Raphidocelis subcapitata due to dixaone exposure while the chlorophyll doesn’t appeared to affected necessitating to compare other indicators as stress response markers. REFERENCES Zenker, M.J., Borden, R.C. and Barlaz, M.A. (2003) Occurrence and treatment of 1, 4-
dioxane in aqueous environments. Environ Eng Sci. 20(5),.423-432. Li, W., Xu, E., Schlenk, D. and Liu, H.,(2018) Cyto-and geno-toxicity of 1, 4-dioxane and its
transformation products during ultraviolet-driven advanced oxidation processes. Environ. Sci. Water. Res. Technol. 4(9), 1213-1218.
Mahendra, S. and Alvarez-Cohen, L. (2006) Kinetics of 1, 4-dioxane biodegradation by monooxygenase-expressing bacteria. Environ Sci Technol. 40(17), 5435-5442.
Abinandan, S., Subashchandrabose, S.R., Cole, N., Dharmarajan, R., Venkateswarlu, K. and Megharaj, M. 2019 Sustainable production of biomass and biodiesel by acclimation of non-acidophilic microalgae to acidic conditions. Bioresour.Technol. 271,316-324.
346
Table of Contentsfor this manuscript

COMPUTATIONAL AND EVOLUTIONARY ANALYSIS OF LYTIC POLYSACCHARIDE MONOOXYGENASES (LPMOs)
Kaniz Fatema1, Suresh Subashchandrabose1, Logeshwaran Panneerselvan1,2,
Megharaj Mallavarapu1,2
1Global Centre for Environmental Remediation (GCER), Faculty of Science,
The University of Newcastle, Callaghan, 2308 NSW, AUSTRALIA 2Cooperative Research Centre for Contamination Assessment and Remediation of
Environment (CRC CARE), The University of Newcastle, ATC Building, Callaghan, 2308 NSW, AUSTRALIA
INTRODUCTION LPMOs are potent oxidative enzymes that are involved in the breakdown the glycosidic chain of several recalcitrant polysaccharide molecules. It is also a cost-effective and environmentally friendly biotechnological product. Some microorganisms such as fungi, bacteria, virus and arthropods have the ability to produce copper-dependent oxidative enzyme. A portfolio of these enzymes are available in the CAZy database (www.cazy.org), where they have been assigned to the auxiliary activity (AA) families 9, 10, 11, 13, 14 and 15 (Leggio et al., 2015). LPMOs intensely broadens the latitude of oxidative processes in biomass degradation and biorefining. Biomass is the most promising and abundant primary source of renewable and sustainable energy. Lignocellulosic biomasses such as agricultural, industrial and forest biomass residuals are a potential resource for biofuels because they are abundant, inexpensive and environmentally friendly. Use of bioethanol as a biofuel is both sustainable and cost-intensive. In Australia, biodiesel and bioethanol currently being produced, approximately at 250 million mL of ethanol and 40 million mL of biodiesel respectively. In addition, biomass covers approximately 10% of the world energy supply. The objective of this study is to investigate the evolutionary relationship of different LPMOs from diverse organisms including their physicochemical properties. This work will help to design novel primers for isolation and characterization of novel LPMOs from different organisms. MATERIALS AND METHODS Eight different LPMO protein sequences representing bacterial, fungal, viral and insect were retrieved from NCBI ‘protein’ database. These sequences were analyzed on Geneious prime 2019.1.3 for the multiple sequences alignment. The phylogenetic analysis was carried out via the neighbour- joining method (Saitou and Nei, 1987) using the MEGA6 program (Tamura et al., 2011). Diverse properties including number of amino acids, molecular weight, theoretical isoelectric point (pI), amino acid composition (%), number of positively (Arg+ Lys) and negatively charged (Asp+ Glu) residues, extinction coefficient, instability index, aliphatic index and Gran Average of Hydropathicity (GRAVY) were calculated using ExPASy’s PortParam tool (Gasteiger et al., 2005). RESULTS AND DISCUSSION The evolutionary history was inferred using the Neighbor-Joining method (Saitou and Nei, 1987). The total sum of the optimal tree branch length showed six. The tree was drawn according to scale with the lengths of the branches in the same units as those of the evolutionary distances (Fig 1). Isoelectric point (pI) is a pH in which net charge of protein is zero. pI of NcLPMO9C, TdAA15B and ACV034 were observed to lie in the acidic range, while the TfAA10A proteins occur in alkaline range. From the study of instability index, it was found that all proteins were in stable. As instability index value, less than 40 indicates stability of a protein (Table-1). The first 60 amino acids in the alignment are shown in the figure 1.
M51-P48
Copyright © CRC CARE Pty. Ltd., 2019
CleanUp Conference 2019Adelaide, Australia
8 –12 September 2019347
Table of Contentsfor this manuscript

Figure1: Phylogenetic relationship and multiple sequence alignment different species LPMOs
Table 1. Physicochemical parameters of four proteins of different sp. of LPMOs Protein name
No. of Amino
acid
Molecular wt.
Theoretical pI
‘-’ charged residues
(Asp+Glu)
‘+’ charged residues
(Arg+ Lys)
Instability Index
Aliphatic Index
TfAA10A 222 25372.35 7.20 16 16 31.58, Stable 62.84
NcLPMO9C
238 24704.96 6.89 15 15 28.77, Stable 79.08
TdAA15B 212 23593.25 4.95 20 12 22.63, Stable 63.02
ACV034 373 43267.42
5.57 40 33 38.05, Stable 64.53
CONCLUSION Phylogenetic analysis reveals the diversity among the different LPMOs. Whereas the physico chemical analysis revealed the stability of LPMOs under different temperatures, an important criterion needed for their biotechnological application. REFERENCES GASTEIGER, E., HOOGLAND, C., GATTIKER, A., WILKINS, M. R., APPEL, R. D. &
BAIROCH, A. 2005. Protein identification and analysis tools on the ExPASy server. The proteomics protocols handbook. Springer.
LEGGIO, L. L., SIMMONS, T. J., POULSEN, J.-C. N., FRANDSEN, K. E., HEMSWORTH, G. R., STRINGER, M. A., VON FREIESLEBEN, P., TOVBORG, M., JOHANSEN, K. S. & DE MARIA, L. 2015. Structure and boosting activity of a starch-degrading lytic polysaccharide monooxygenase. Nature communications, 6, 5961.
SAITOU, N. & NEI, M. 1987. The neighbor-joining method: a new method for reconstructing phylogenetic trees. Molecular biology and evolution, 4, 406-425.
TAMURA, K., PETERSON, D., PETERSON, N., STECHER, G., NEI, M. & KUMAR, S. 2011. MEGA5: molecular evolutionary genetics analysis using maximum likelihood, evolutionary distance, and maximum parsimony methods. Molecular biology and evolution, 28, 2731-2739.
348
Table of Contentsfor this manuscript
EMERGING ISSUES IN DEALING WITH CONTAMINATED SITES IN AUSTRALIA
Peter Nadebaum
GHD Pty Ltd, 180 Lonsdale Street, Melbourne, 3000, AUSTRALIA
An industry has evolved over past 25 years to respond to the contamination of soil, groundwater and surface water that has resulted from past industrial practices, and which can now pose a risk to human health and the environment. A complex system of Acts, Regulations, Standards and guidance has been set up, and the industry works within this framework. At first sight we might think this is a mature and stable situation, with sites methodically being identified and appropriately and efficiently responded to. However, this is far from the case, and the industry is in a constant state of evolution, responding to shocks resulting from new knowledge and problems that were not realised and are only now becoming apparent. The costs and disruption caused can be very large: with potentially billions of dollars expenditure if the problems are to be fully dealt with as our current regulations, guidance and community expectations would indicate to be necessary.
The critical matter is for our industry to be flexible, innovative, science-based, and accepting of sustainable risk-based solutions to the problems that arise. While seemingly simple, many issues emerge. This paper seeks to identify the key emerging issues and disrupters, how the industry has evolved and responded to similar problems with particular reference to the role of the regulatory authorities and CRC CARE, and how this evolution needs to continue. Suggestions will be provided on possible responses and changes that we might consider to achieve a well-balanced and sustainable outcome. This can include adapting and drawing on regulatory approaches and guidance that are applied in other fields and jurisdictions, particularly international jurisdictions, and applying and adapting new methods and technologies.
Looking back at the evolution of the Australian industry over the past 15 years, it becomes apparent that the state regulatory authorities have considered problems as they have arisen, and have developed a broader and more solid foundation of advice and regulation, building on the foundation of the 1999 NEPM with the 2013 update, and guidance to auditors and supporting publications. Generally the overall policy framework has remained much the same, although in the last few years there has been a gradual move towards seeking responses to contamination that are more sustainable. However, this has been set back by community outrage inflamed by media and legal proceedings, encouraging a more precautionary stance.
Looking at the body of work carried out by our regulatory agencies and our research agencies, particularly CRC CARE, it becomes apparent that the regulatory agencies tend towards simpler policy guidance (such as the NEPM), whereas the research agencies provide more detailed analysis and guidance on how approaches can be applied. Examples of work undertaken by the research agencies include the detailed assessments that underpin aspects of the NEPM such as the Hydrocarbon Health Screening Values and Ecological Investigation Levels, the body of work that CRC CARE has prepared relating to the assessment and management of hydrocarbons including LNAPL and B(a)P, and other guidance such as that on MNA and most recently on NSZD. Importantly, in this work there has been collaboration between the regulatory agencies and the research agencies, particularly CRC CARE, and this has been critical in formulating guidance that accords with regulatory policy, and that practitioners can refer to in their work. There can be a tension in this work, with CRC CARE’s work often having first a focus on achieving pragmatic and workable outcomes and explaining how these can fit regulatory policy, while the regulatory
T11b
Copyright © CRC CARE Pty. Ltd., 2019
CleanUp Conference 2019Adelaide, Australia
8 –12 September 2019349
Table of Contentsfor this manuscript

agencies focusing first on outlining established policy requirements with less guidance on how these can practicably be achieved.
If we consider what we would be missing if CRC CARE was absent, it can be seen that our industry would be much poorer. This is recognised internationally, where there is often admiration for the arrangement that exists in Australia with the regulatory agencies being able to draw on and be supported by the work of the research agencies and industry.
Returning to the emerging issues, some of the key issues that need to be considered include:
• The increasing capability of our analytical laboratories, being able to detect trace and ultratrace levels of an increasing range of contaminants, including the ability to quantify contaminant concentrations at the ug/kg level in soil and sub ng/L level in waters. Despite this increasing capability, it recognised that many thousands of chemicals can be present, but we are only measuring a subset of these.
• The increasing sensitivity of our test methods for identifying the potential for effects of contaminants on human health and aquatic biota, and on dependent aquatic and terrestrial ecosystems. We are now using multi-generational studies, and these can be particularly sensitive for some contaminants.
• Our use of prediction rather than relying on direct observation of effects, extrapolating from high concentrations where effects are observed to require much lower concentrations where we can be confident that there is an appropriate level of safety. In the case of carcinogenic chemicals, this includes setting the acceptable level of risk to be far below the level at which effects will be seen in small exposed populations.
• The importance of applying the precautionary principle: ie where effect is possible but is uncertain, adopt a precautionary position. This extends to considering a wide range of possible effects; this in turn leads to increased uncertainty as to whether some effect is occurring, and the outcome that very low concentration limits should be mandated to avoid any such effects. This can include making the assumption, for many chemicals, that the chemical will be fully bioavailable, which will often not be the case for aged and weathered chemicals in soils.
• The growing availability of digital historical records of past land use, coupled with the past practice of filling low lying land, which can suggest that many tens of thousands of potentially contaminated sites now being used for schools and residences remain unidentified in our cities. If we apply the sensitive analytical methods and the precautionary criteria noted above, many of these sites will not meet the acceptance criteria. This raises the question of what our duty of care is in such situations.
• Our approach to assigning liability to the owner/occupier, extending to off site, even where the past practices now found to be polluting were lawful and in some cases mandatory
• The fear of our community regarding exposure to hazardous waste, accentuated by the business model of the media and investment companies seeking to profit from the, outrage and liability associated with contamination and the possibility that some adverse effect may occur.
In terms of responding to these various issues, this presentation will consider the current and evolving methods of regulation, investigation, remediation and management that can be applied, and where our future efforts may be best directed in terms of reduction in risk, environmental benefit, economic benefit, and social benefit. This will include considering options available to us that occur through better understanding:
• The effect and cost of contamination to our community and ecological systems, particularly from a regional and national perspective, drawing on our increasing understanding of the numbers of contaminated sites and the contamination on these sites
350
Table of Contentsfor this manuscript

• The options available for regulatory and policy change, including concepts and approaches applied in other jurisdictions and some being introduced in Victoria; this includes introducing the concept of coupling ecosystem services and remediation and management to achieve more sustainable solutions
• The nature and extent of contamination, both in terms of sites (drawing on historical records of potential sites), the costs of particular policy and regulatory responses, and where significant savings may be made and whether these will lead to a significantly increased risk
• The significance of the effects of climate change on contaminant dynamics, particularly the hydrogeological perturbations that will occur and the risks that this might pose
• Toxicity and uncertainty, including the severity of effect and the likelihood that this effect will occur, and the significance of this in individual, regional and national terms (human health) and in localised area and population terms (terrestrial and aquatic systems), and whether we can draw on approaches used in other jurisdictions and technical fields including the concepts of using multiple lines of evidence to reach a conclusion when individual lines of evidence are uncertain and insufficient
• Whether we can better understand and control toxicity and factors such as bioavailability, such as occur through natural means (eg weathering) or through control (eg stabilisation)
• How we can address the large numbers of ill-defined chemicals and mixtures of chemicals with ill-defined toxicity and uncertain potential for effect, and whether our current reliance on indicator chemicals is sufficient
• The extent to which comingled plumes of contaminants such as PFAS and LNAPL occur, and understanding the factors that determine the residual risk and thus the requirements for remediation
• Community and media response to contamination compared with our technical understanding, and whether and how these might be better aligned
• The increasing potential for litigation, and how this might be avoided • Contaminant sources and migration from these sources (mass and mass flux) and
how remediation and management efforts can best be targeted for maximum return; and whether we should be applying the concepts of high resolution site characterisation and flux quantification more widely in Australia
• Whether it is possible to use very rapid and relatively low cost airborne systems (including magnetometer, spectrophotometer and Lidar systems) to better map source locations and migration
• The circumstances under which containment and institutional controls can offer acceptable solutions, taking into account the risk of failure of the containment or management system
• The potential to apply more sustainable and lower cost and energy approaches, including containment, in-situ methods of treatment, natural degradation and enhanced natural degradation, and coupling these methods, such as are being developed and applied internationally (but only to a limited extent in Australia)
• The significance of time in our deliberations, including the fact that chemical releases are generally no longer occurring and there is a natural reduction in contaminant concentration and effect over time, the occurrence and significance of short term variations in concentration (such as occur in groundwater and in vapour), and how we can enhance reductions over time to more easily achieve an acceptable endpoint
• The potential to use rapid exploratory field investigative methods to better target where more detailed attention should be directed, and whether methods that provide large amounts of data offer advantage and should be encouraged
• Application of advanced methods of in-situ treatment including destruction and stabilization
351
Table of Contentsfor this manuscript

• The potential for application of horizontal rather than vertical well systems to provide advantages in groundwater containment and treatment, such as are being used internationally
• Better understanding the risks posed by biodegradable and less biodegradable vapours, carbon dioxide, and explosive gases such as methane, and the applicability of international advances to Australia.
• How we might systematically search for useful advances occurring internationally and apply these locally, and achieve rapid uptake of new technology and methods
The field is driven by regulatory policy, and ultimately the key objective is to provide information that will enable our regulatory agencies to prepare policy that is pragmatic and workable, and achieves sustainable outcomes, and then to determine how we can most efficiently satisfy this regulatory policy.
It becomes apparent from this analysis that it is critical to have broadly based collaborative and well-funded research organisations that can undertake the detailed work necessary to solve these problems. In particular, CRC CARE, in providing a collaborative partnership between researchers, regulators and industry, can look for solutions. This is something that our regulatory agencies are not well positioned to do.
Looking back at the past body of work and where helpful solutions have evolved, we can see that CRC CARE’s work is particularly helpful in providing guidance and disseminating information, together with industry associations such as the Australasian Land and Groundwater Association (ALGA) and the Australian Contaminated Land Consultants Association (ACLCA) also being important in disseminating information. In addition, many of the new technologies and methods enter Australia via consultants and contractors drawing on international knowhow, particularly from North America.
If we have the objective that Australia should be at the forefront of the world in addressing contaminated site problems, and we are able to respond to these difficult emerging issues, we need to be more efficient and focused. We need to reinvent and re-fund CRC CARE.
While the basic collaborative model of a Cooperative Research Centre is sound, I suggest: • The focus should be on establishing a management structure that is able to examine
and determine where solutions to the emerging issues are most likely to be found, and then to assemble and direct the collaborative teams to undertake this work.
• Whereas the current CRC structure mandates a full research program set out at the outset (and it is this that is funded), this does not reflect what is needed to address the emerging issues. Instead, close examination of the alternatives strategies and solutions is needed – without a commitment in advance on what these solutions are and the work that is to be done. So rather than pre-ordaining research, the critical thing is to set up a governance and management structure that ensures work is best formulated and directed, and will efficiently lead to solutions.
• Each emerging issue should first be the subject of an analysis to determine what critical key information/method/technology is most likely to solve or significantly held in dealing with the issue. This should be funded. Leading minds in our industry should carry out this analysis – not just researchers, but with contributions from the chief scientists of our regulatory agencies, auditors, consultants, industry technologists, and technology providers. Often a key piece of information will solve a particular problem – perhaps providing a strategy to understand the circumstances in which it is or is not a concern, and how to resolve this. Examples will be provided to illustrate this. Depending on the nature of the issue, there could well be advantage in enlisting the support of our industry associations, such as ALGA, to discuss the issue more broadly in the industry and to hear different views, and to commence the process of consultation. This would need to distil the key elements of the proposed strategy and issues into a form that is more easily able to be assimilated – as the broader community will only have limited time.
352
Table of Contentsfor this manuscript

• Once the strategy and approach is decided, then the team that is most likely to succeed in this endeavor should be formed, and the detailed program formulated. Consideration could be given to having two different teams running in parallel, with a view to deciding which is most likely to achieve success in the time desired and with the funds available.
• As the research program is undertaken, it be subject to continuing review by experienced practitioners, such chief scientists and auditors, with the responsibility of ensuring that issues are considered and dealt with, and the research direction continues to be sound and likely to result in success.
These are initial thoughts – they key would be to set up a process and involving persons with the capacity for innovative independent thought and analysis, and able to carry this out quickly without getting bogged down or captured by vested interests.
In summary, I see that it is essential that we: • Maintain our Cooperative Research Center (CRC CARE) • Reinvent this CRC so that it can better respond to emerging issues, with a focus on
seeking solutions to these issues. This sits alongside and can be seen to support the regulatory agencies with their policy focus, and support the industry with providing pragmatic and practical solutions to the problems that they face.
• Encourage a collaborative arrangement, seeking to involve and obtain contributions from owners and developers of sites, regulators, the community, researchers, consultants, contractors, legal practitioners, and service providers such as laboratories, equipment and technology suppliers. ALGA involves these diverse groups, and there would be merit in the CRC and ALGA more closely working together to address the issues that our industry faces.
353
Table of Contentsfor this manuscript

TOXICOLOGY, RISK ASSESSMENT, AND RISK MANAGEMENT OF PFAS: STATE OF THE SCIENCE
Jason Conder1, Jennifer Arblaster1, Emily Larson2
1Geosyntec Consultants, 2100 Main St., Ste. 150, Huntington Beach, CA 92677, USA
2Geosyntec Consultants, 1376 Miner’s Drive, Ste. 108, Lafayette, CO 80026, USA
INTRODUCTION Many scientific and regulatory data gaps are currently associated with the assessment and management of per and polyfluoroalkyl substances (PFAS) in the environment. PFAS associated with aqueous film-forming foam (AFFF), used in the fighting of Class B hydrocarbon fires, as well as other industrial and consumer uses, can include hundreds to thousands of compounds with varying mobility and toxicity. These mixtures routinely exceed risk-based screening thresholds at their point of release, and also have the potential to impact downgradient aquatic resources such as aquifer and aquatic ecosystems. Understanding the key ecological and human health exposure pathways and receptors at risk from exposure to PFAS will help prioritize site-specific assessments and potential mitigation of risks. METHODS This overview will highlight current ongoing approaches to evaluating PFAS exposures for the purposes of assessing and managing risks. The work will focus primarily our own risk modeling work in understanding potential human health and ecological PFAS exposures in aquatic and terrestrial ecosystems. For ecological receptors, potential risks to aquatic life and aquatic-dependent birds and mammals were evaluated at five PFAS impacted aquatic sites to understand relative exposures from multiple PFAS, as detailed recently in Larson et al. (2018). We developed and applied an empirical based bioaccumulation model for seven PFAS to evaluate the key exposure pathways of concern for wildlife. Aquatic species sensitivity distributions were used to characterize the potential for direct aquatic toxicity from exposure to perfluorooctane sulfonate (PFOS), a key bioaccumulative PFAS found at high levels in many products. For human health exposure pathways, comparisons of direct contact exposures and consumption of fish and shellfish were evaluated for relative risks from PFOS and perfluorooctanoate (PFOA) at each of the five sites included in the bioaccumulation model, and compared to other pathways, such as drinking water ingestion and uptake of PFAS by homegrown produce. Risk-based threshold concentrations were developed as where toxicity values were available. RESULTS AND DISCUSSION The evaluation of relative risks indicated that bioaccumulation of PFAS in the aquatic food web may result in adverse effects to aquatic-life dependent birds and mammals at lower concentrations than those that indicate a potential risk to aquatic invertebrates and fish. Avian and mammalian species with higher benthic invertebrate and incidental sediment ingestion components to their diets indicated the highest exposures. PFOS was the predominant PFAS for avian exposure, and is a primary risk driver in aquatic systems. Direct toxicity values for aquatic life indicate adverse effects to birds and mammals are likely at lower concentrations of PFOS in sediment and water than those causing direct effects to aquatic or benthic community health. Concentrations of PFOS in sediments and surface water that are associated with the potential for risk via consumption of fish are lower than concentrations of PFOS associated with acceptable risk via drinking water or recreational uses. Based on this evaluation, impacted sites with aquatic habitats where exposure pathways for avian, mammalian and human receptors are complete, human health fish consumption exposures are likely to drive risk management decisions, followed by aquatic dependent wildlife and then aquatic life. For terrestrial concerns, potential risks associated
T21a
Copyright © CRC CARE Pty. Ltd., 2019
CleanUp Conference 2019Adelaide, Australia8 –12 September 2019 354
Table of Contentsfor this manuscript

with PFAS accumulation in homegrown produce may occur at lower concentrations in soil and/or irrigation water, compared to screening levels associated with incidental exposure to soil and consumption of drinking water. CONCLUSIONS It is clear that human health risks associated with PFAS extend beyond those associated typical drinking water and soil exposures. Additional research and strategies for understanding consumption of PFAS in seafood/fish and homegrown produce is critical. For ecological risks, exposures to invertebrate- and fish-eating wildlife are key are and likely to represent the critical exposure routes to address, particularly for PFOS. REFERENCES Larson, E.S., Conder, J.M., Arblaster, J.A. 2018. Modeling avian exposures to perfluoroalkyl
substances in aquatic habitats impacted by historical aqueous film forming foam releases. Chemosphere 201:335-341.
355
Table of Contentsfor this manuscript

PFAS — THE FOREVER CHEMICAL GLOBAL RISK AND EMERGING CONCERNS
Jimmy Seow
Pumps United Pty Ltd, 26 Bulbey Street, Bellevue, WA 6056, Australia
INTRODUCTION There is now much awareness of PFAS impact upon the environment and human health in Australia and many countries and PFAS is now mainstream knowledge especially in Australia, the US, Canada, UK and the EU. Perfluoroalkyl substances (PFASs) are a group of human-made organofluorine compounds that have been manufactured since the 1950s. The best-known being perfluorooctane sulfonate (PFOS), perfluorooctanoic acid (PFOA) and perfluorohexane sulfonate (PFHxS). There are other PFASs such as fluorotelomers (e.g. 6:2 FTS, 8:2 FTS etc) as used in new formulated firefighting foams. PFASs have unique properties of excellent heat, chemical and thermal stability, stain, water and dirt repellence and wetting and surfactant properties. Hence it is used in many and wide variety of consumer products and industrial processes from treatment of carpets, clothes and furnishing, non-stick cookware, paper and food packaging, pesticides to industrial uses such as firefighting foams, metal plating, electronic circuit board manufacture. FOREVER CHEMICAL PFAS is persistent in the environment and human body. In the environment the half-life of two commonly used PFASs, PFOS and PFOA, are 41 and 90 years respectively, and in human its half-life are 2.4 to 21.7 years and 2.3 to 3.8 years. As a result, PFAS is now called the Forever Chemical. It is now well documented that PFAS have wide impact upon the environment. In human it is strongly associated with a number of health concerns from Increasing the chance of high blood pressure in pregnant women, thyroid disease, high cholesterol levels, changing immune response to chance of kidney and testicular cancers. WHAT WE KNOW, DON’T KNOW AND SHOULD KNOW ABOUT PFAS The paper looks at What We Know So Far, What We Don’t know and What Else We Should Know about PFAS. What We Know So Far of PFASs as stated above was also discussed from a perspective of:
• Environmental and human health impact • Current policy and regulation from a global perspective • Current PFAS removal and treatment technology and methodology
And What We Don’t know and What We Should Know from a perspective of Human Health, Global Policy and Regulation changes and directions, PFAS Firefighting Foams and Emergency PFAS classes of concerns to the environment and human health, international regulation and policy and legal and class actions taken so far upon manufacturers and users of PFASs. PFASs are a concern to the environment and human health due to its persistent, bioaccumulation, toxicity (PBT), mutagenic and carcinogenic properties and its reproduction adverse effects. Scientists are still learning about the human health effects of exposures to mixtures of PFAS, casual association to various human health impact from endocrine disruption, immunological interferences, cancer causation, toxicological pathways and mechanism for human health effects and human health adverse risk levels (such as human PFOS and PFOA blood level risk values), toxicity of other PFAS classes besides PFOS,
T21b
Copyright © CRC CARE Pty. Ltd., 2019
CleanUp Conference 2019Adelaide, Australia8 –12 September 2019 356
Table of Contentsfor this manuscript

PFOA and PFHxS, co-factors and synergistic effects of other toxicants and by products of PFAS breakdown and chronic health impact. PFAS firefighting foams environmental impact upon soil, surface water and ground water contamination are now widespread, well recognised and documented. Those PFAS foams are still been manufactured and used all over the world including Australia. However, the composition of PFAS surfactants used to formulate those PFAS firefighting foams is still regarded as commercial and trade secret thereby making it difficult and less efficient to manage and remediate soil, surface water and groundwater contaminated by PFAS foams. Whilst regulators, organisations and companies put in places regulation, policies and measures to remove and destroy PFASs in contaminated soil, surface water and ground water, emerging PFASs of concerns are been manufactured and used such as GEN-X (replacement for PFOA), F-53B (replacement for PFOS), ether PFAS, ADONA and various other PFASs. Those PFASs are now found in the environment causing much concern to both the environment and human health. Regulators and policy makers are playing catch up to regulate, restrict and control the use of PFASs focusing currently on PFOS, PFOA and PFHxS and have yet to address long chain PFASs, fluorotelomers and the above mentioned emerging PFAS of concerns. The last few years there has been an increased in legal and class actions against manufacturers and uses of PFASs in particular in the US and Australia. CONCLUSION Even though there is much work now been done to document the environmental and human impact in Australia and many other countries in particular the US, Canada, UK and the EU and PFAS impacts are now known amongst government, regulators, the public, media and politicians there are still much more work and research to be done for PFAS in regard to human health impact, use of PFAS firefighting foams and products with PFAS, regulatory and legal policy and impact of emerging PFAS of concerns and other PFASs other than PFOS, PFOA and PFHxS.
357
Table of Contentsfor this manuscript

ASSESSING EXPOSURE TO PFAS PRECURSORS
Victoria Lazenby
Arcadis Australia Pacific Pty Ltd, 32/140 William Street, Melbourne, 3000, AUSTRALIA [email protected]
INTRODUCTION With information increasing on the thousands of per- and poly- fluoroalkyl substances (PFAS) known to exist, it is important that any assessment of risks ensure that total PFAS exposures have been considered. As standard laboratory methods currently only quantify 20 to 30 of the approximately 4,700 identified PFAS compounds, there is potentially a significant data gap when assessing PFAS exposure using standard analyses. This is of particular relevance to risk assessment, as the contribution of polyfluorinated precursor compounds to total exposure needs to be understood. METHODS Using empirical data collected from sites internationally and within Australia, a review was undertaken to assess whether ‘standard’ PFAS results are appropriate for use in assessing total potential exposures to PFAS, or whether further assessment was required to consider precursors. The review compared results for ‘standard’ PFAS against precursor analytical data, to assess mass of precursors relative to that of ‘standard’ PFAS. By identifying the proportion of precursors relative to the total PFAS mass, it is possible to assess whether precursors may represent a significant source of exposure to human or ecological receptors. By compiling data from international and Australian sources, any trends which may occur in precursor distribution may be identified. Consideration of factors such as distance from source, nature of the source, and bioaccumulation pathways have been included. This assessment will aim to provide an understanding of whether precursors may contribute significantly to total PFAS exposures under different exposure settings. RESULTS AND DISCUSSION The proportion of precursors in PFAS mixes have changed over time, with some increases in relative precursor mass occurring in the twenty first century as known PFAS such as PFOS were phased out of use. AFFF concentrates analysed by TOP Assay have been reported to be comprised of approximately 40-100% precursors (Houtz et al, 2013; Dauchy et al, 2017). Precursors in sludges from wastewater treatment plants have been reported as being up to approximately 30-60% of total molar PFAS (Houtz et al, 2016; Eriksson et al, 2017). Recent analyses of PFAS in precipitation off the China coast impacted by manufacturing sources indicated precursors comprised up to approximately 50% of total molar mass of PFAS (Chen et al, 2019). A number of assessments of PFAS in the environment have reported precursors as contributing more than 50% of the total mass of PFAS in soils and groundwater within fire training areas, with similar proportions reported up to several hundred metres down-gradient (Houtz et al, 2013; Weber et al, 2017). Precursors have also been detected at significant distance from potential sources, with precursors detected in the livers of arctic mammals such as seals and polar bears (Boisvert, 2016). There is generally very little assessment for precursors being undertaken in the many Australian PFAS site investigations that are publicly available. Limited data from small datasets indicates that precursors have been detected in biota in proximity to source areas, however the lack of measurement or assessment of precursors represents an ongoing data gap in Australian PFAS investigations.
T21c
Copyright © CRC CARE Pty. Ltd., 2019
CleanUp Conference 2019Adelaide, Australia8 –12 September 2019 358
Table of Contentsfor this manuscript

International studies have found that precursors do bioaccumulate and have been widely detected within unprocessed food products such as meat, fish, milk and eggs (Gebbink et al, 2015). Although widespread in biota, the mass of precursors as a proportion of total PFAS in unprocessed dietary sources has been reported as less than 20% for PFOA precursors and less than 4% for PFOS precursors (Gebbink et al, 2015). CONCLUSIONS Given the normal range of uncertainty and conservatism inherent in risk assessment, some uncertainty in the assessment of total intake is acceptable within reasonable bounds. Normal laboratory analytical uncertainty can be up to 30 to 50%, and toxicological values generally incorporate uncertainty factors of two to four orders of magnitude. Such uncertainties in risk assessment are addressed by adoption of conservative assumptions. An underestimate of PFAS mass of approximately 10-20% is unlikely to represent a significant issue for risk assessment outcomes, assuming equivalent toxicity, however there is a lack of data in current assessments to confirm this proportion in Australian settings. Available data does indicate that precursor mass may require consideration when assessing risks to on-site workers or other receptors within the source zone. REFERENCES Boisvert, G. (2016) Perfluoroalkyl Substances in Arctic Polar Bear and Ringed Seal From
East Greenland and Hudson Bay: Comparisons of Adipose and Liver Levels and Patterns, and In Vitro Depletion and Metabolite Formation of PFAS Precursors. Carleton University, Ottawa, Ontario.
Chen, H., Zhang, L., Li, M., Yao, Y., Zhao, Z., Munoz, G., and Sun, H. (2019) Per- and polyfluoroalkyl substances (PFASs) in precipitation from mainland China: Contributions of unknown precursors and short-chain (C2-C3) perfluoroalkyl carboxylic acids. Water Research 153:169-177.
Douchy, X., Boiteux, V., Bach, C., Rosin, C. and Munoz, J-F. (2017) Per- and polyfluoroalkyl substances in firefighting foam concentrates and water samples collected near sites impacted by the use of these foams. Chemosphere 183:53-61.
Eriksson, U., Haglund, P. and Karman, A. (2017) Contribution of precursor compounds to the release of per- and polyfluoroalkyl substances (PFASs) from waste water treatment plants (WWTPs). Journal of Environmental Science (China) 61:80-90.
Gebbink, W.A., Glynn, A., Darnerud, P.O. and Berger, U. (2015) Perfluoroalkyl acids and their precursors in Swedish food: The relative importance of direct and indirect dietary exposure. Environmental Pollution 198:108-115.
Houtz, E., Sutton, R., Park, J-S. and Sedlak, M. (2016) Poly- and perfluoroalkyl substances in wastewater: Significance of unknown precursors, manufacturing shifts, and likely AFFF impacts. Water Research, 95:142-149.
Weber, A.K., Barber, L.B., LeBlanc, D.R., Sunderland, E.M. and Veciti, C.D. (2017) Geochemical and Hydrologic Factors Controlling Subsurface Transport of Poly- and Perfluoroalkyl Substances, Cape Cod, Massachusetts. Environ. Sci. Technol. 2017-51, 8:4269-4279.
359
Table of Contentsfor this manuscript

FATE AND TRANSPORT OF PFAS IN AN ARID SETTING
Alice Walker1, Mark Clough2, Peter Nadebaum2, Jacqui Hallchurch1
1GHD Pty Ltd, 133 Castlereagh Street, Lonsdale Street, Sydney, NSW 2000, AUSTRALIA 2GHD Pty Ltd, 180 Lonsdale Street, Melbourne, 3000, AUSTRALIA
BACKGROUND Since the industry has become aware of potential issues associated with products containing per- and polyfluorinated alkyl substance (PFAS), understanding of their fate and transport in the environment has evolved. Numerous studies have led to a greater understanding of how PFAS migrates, what attenuation mechanisms may be important, and how field investigations should be directed. Developing a strong Conceptual Site Model (CSM) for each site based on PFAS properties and empirical observations is critical. However, CSMs are not necessarily transferable from one site to another. Differences in climatic setting and geology can strongly influence the development of soils and migration mechanisms. GHD carried out a large field program to assess the risks posed by PFAS at three Defence bases near Exmouth in the north-west of Western Australia. This work led to the development of a CSM for each site. Interestingly, despite their close proximity, each CSM was different and had unique characteristics that defined PFAS fate and transport and the risk posed at each base, and was critical in determining the appropriate response that was indicated for each base. APPROACH/ACTIVITIES A significant field investigation was carried out for each base, involving a detailed evaluation of the site history, and extensive sampling and analysis of soil, sediment, drainage water, surface water, groundwater, and biota. Many thousands of samples were taken and analysed. The groundwater investigations included the installation of multi-level wells to assess the vertical migration of PFAS in groundwater, and seepage samples long nearby beaches to identify the discharge of PFAS to the marine environment. Estimates were developed of the mass of PFAS remaining in soil and groundwater in source areas, and the mass flux and discharge to the surface water environments. The data obtained were used to develop base-specific CSMs that summarised the unique geological, hydrogeological and hydrological setting for each base. The physical and chemical setting of each source, pathway and receptor was examined to assess risk to human health and the environment. Because of the complexity of assessing risks to ecological systems, an ecological risk assessment was undertaken to determine the level of risk to local terrestrial, aquatic and avian ecosystems and the potential for organisms. Of particular concern was the ecology of the nearby Exmouth Gulf and the World Heritage Listed Ningaloo Reef. RESULTS The assessment of the results of the field investigations indicated that there had been usage of PFAS at each base, and that the current migration of PFAS from soil and in groundwater that discharges to the receiving environment is complex and differs from base to base. The usage of fire fighting foam containing types of PFAS at the bases ceased a number of years ago. It was found that generally surface soils are now quite depleted in PFAS, and that PFAS that might have been present in surface soils have now leached to groundwater. An analysis of the residual mass of PFAS and flux found that surface water transport constitutes the main flux of PFAS to the receiving environment, and that groundwater transport is relatively much less.
T21d
Copyright © CRC CARE Pty. Ltd., 2019
CleanUp Conference 2019Adelaide, Australia8 –12 September 2019 360
Table of Contentsfor this manuscript

At these bases, the low and intermittent rainfall coupled with a high rate of evaporation was a controlling factor for transport in both surface drainage, and in groundwater. The intermittent rainfall resulted in ephemeral local surface water, with occasional significant drainage flows occurring only during infrequent higher rainfall and cyclonic events. While groundwater flows were inferred to be to Exmouth Gulf to the east of the bases, in practice the low rainfall led to very low groundwater gradients, and these did not always extend to the coast. Groundwater source areas were found to be localised and static, and were not in the form of significant migrating plumes. It was found that evaporation of shallow groundwater and evaporative pumping led to hypersaline salt pan areas upgradient of the coastal dunes, and the net PFAS flux to the Gulf waters was very small and restricted to some localised areas, such as in the vicinity of surface drainage points, in some cases did not occur. Because of this, it was determined that risks to the receiving aquatic Exmouth Gulf aquatic environment and in particular the sensitive Ningaloo Reef were low. This conclusion was supported by biota sampling that did not find detectable concentrations of PFAS in fish or crustaceans. The risk posed by PFAS in the salt pan areas upgradient of the coastal dunes was a particular matter that was assessed, and an Ecological Risk Assessment was undertaken to determine the risk posed by the generally very low PFAS concentrations in surface water and sediment in an ephemeral surface water environment. While screening criteria were exceeded (in particular the aquatic ecosystem criterion published in the PFAS NEMP), the ecological risk assessment determined that the risks to aquatic ecosystems through toxicity, and the risks to avian predators and human health through bioaccumulation in the food chain were low. CONCLUSIONS This body of work indicates that it is essential to develop a Conceptual Site Model that correctly accounts for the fate and transport of PFAS in surface water drainage and groundwater at PFAS sites. This work found that:
• Discharges of PFAS in groundwater that might have been intuitively inferred to occur to Exmouth Gulf did not in fact occur
• Surface water drainage, although constituting a greater mass flux than that through groundwater, was also intermittent and restricted to large rainfall events, and did not constitute a risk to the ecosystems of the Gulf waters.
• The main focus of the assessment was the ephemeral salt pans upgradient of the coastal dunes; the concentrations of PFAS present in this environment were found to be low, and an ecological assessment determined that the risk posed to various receptors was low.
The outcome of the investigation was to recommend ongoing monitoring to confirm the Conceptual Site Model at each base, and to confirm that the risks continue to be low as determined from the investigation and assessment.
361
Table of Contentsfor this manuscript

WHISK ASSESSMENT: PFAS STOCK WATERING SCREENING LEVELS TO PROTECT PEOPLE CONSUMING HOME PRODUCED
CHICKEN EGGS
Katie Richardson, Kristi Hanson, Michael Rehfisch
1Senversa Pty Ltd, L6, 15 William Street, Melbourne, AUSTRALIA [email protected]
INTRODUCTION AND BACKGROUND In urban catchments, groundwater may be abstracted for a range of uses. One potential use of groundwater which commonly requires assessment is stock watering. A wide range of stock watering uses are unlikely in urban catchments, or even prohibited, for example through council restrictions on the keeping of certain stock animal types. People do, however, keep backyard chickens in urban areas, and the watering of these chickens with abstracted groundwater may be a plausible use requiring assessment. In line with ANZECC & ARMCANZ (2000) guidance, drinking water criteria are often adopted as conservative, default screening levels for stock watering, on the basis that if the screening levels offer protection to human health, they will also offer a high level of protection to animal health. However, for contaminants which bioaccumulate, drinking water criteria do not necessarily offer protection to consumers of animal products. Specifically for PFAS, a pathway of human consumption of chicken eggs may be of particular concern given the potential for PFAS to bind to protein, and the evidence egg formation is a key excretion pathway for PFAS in chickens. We present a case study detailing the development of stock watering screening levels for PFAS which consider a pathway of PFAS uptake into chicken eggs, in addition to protection of chicken health. Two possible methodologies for deriving screening levels are compared. To provide an understanding of the scale of potential impacts to this beneficial use, these screening levels have been compared to available data regarding ambient concentrations of PFAS in groundwater within urban environments. APPROACH USEPA, 2005 presents a methodology for estimating concentrations in chicken eggs, based on estimating contaminant intake from the measured concentrations in their diet (grain, water, and incidental soil ingestion), and applying a transfer factor which represents the proportion of intake which passes into the egg. Rather than estimating the egg concentration from a given water concentration, this general methodology was used to back calculate a stock watering screening level which will not result in unacceptable concentrations within eggs. The trigger values for poultry eggs provided in FSANZ, 2017 were adopted as the acceptable concentration in eggs. Trigger values are defined as the maximum concentration level of these chemicals that could be present in individual foods or food groups so where even at high consumption levels, consumers of these foods would not have dietary exposures exceeding the relevant health based guidance value; the trigger values are conservative screening levels for comparison with the estimated concentrations. A key factor in the derivation is estimation of the transfer factor (TF), which represents the proportion of intake which passes into the egg. A lab-based study completed by Scolexia (Scolexia, 2017) was previously undertaken with the purpose of defining egg transfer factors for laying hens watered with PFAS impacted water. The Scolexia study presents transfer factors for a range of PFAS compounds. Based on review of the Scolexia study, a number of uncertainties were identified in some of the transfer factors derived by Scolexia. For example, the data manipulation methods adopted in the study resulted in significant data censorship for some of the treatment groups (i.e. data was excluded from the transfer factor calculations), resulting in an overestimate of
T21e
Copyright © CRC CARE Pty. Ltd., 2019
CleanUp Conference 2019Adelaide, Australia8 –12 September 2019 362
Table of Contentsfor this manuscript

the transfer rates for some PFAS compounds. We present refined transfer factors as an outcome of this detailed review, together with screening levels developed on the basis of these refined transfer factors. An alternate approach for developing stock watering screening levels is also presented. This approach also utilises the data from the Scolexia study. However, instead of estimating a transfer factor (i.e. the portion of intake which passes into the egg), and then developing screening levels based on this transfer factor other parameters for chickens (e.g. drinking water rates, egg laying rates), an empirical approach has been adopted, whereby water concentrations are compared directly with egg concentrations measured in the study in order to estimate the drinking water concentration which would result in the FSANZ trigger values. The two approaches are compared in order to assess which method provides the most representative stock watering screening levels. A key aspect of this assessment is analysis of the available data to assess whether egg concentrations are likely to be directly proportional to drinking water concentrations (with limited dependency on other factors such as chicken weight, egg laying rates and water intake), or if estimation of intake and transfer rates is necessary to predict concentrations in eggs. Further assessment will also be presented which demonstrates that the screening levels derived (by either of these methodologies) for the protection of human consumers of chicken eggs will also be protective of chicken health. DISCUSSION AND CONCLUSIONS Stock watering screening levels for PFAS are presented which consider a pathway of PFAS uptake into chicken eggs, in addition to protection of chicken health. Two possible methodologies for deriving screening levels are compared and representative screening levels presented. These screening levels are of value in delineating areas within urban catchments where abstraction of water for watering chickens could potentially result in unacceptable risks. In such catchments, other groundwater uses may be unlikely, so this pathway may represent the key exposure pathway requiring assessment (and for which, no adequate screening levels are currently available). These screening levels have been compared to available data regarding ambient concentrations of PFAS in groundwater within urban environments to provide an understanding of the scale of potential impacts to this beneficial use and whether general, precautionary consumption advisory notices may be required to be developed by the regulators to manage this potential health risk. REFERENCES Food Standards Australia New Zealand (FSANZ), 2017. Perfluorinated Chemicals in food. Scolexia, 2017. Evaluation of Residues in Hen Eggs after Exposure of Laying Hens to Water
Containing Per and Poly-Fluoroalkyl Substances
363
Table of Contentsfor this manuscript

ASSESSING CONFIRMED PFAS EXPOSURE PATHWAYS TO INFORM MITIGATION
Julian Howard1, Krystle Mitchell2
1GHD Australia Pty Ltd, Level 4 211 Victoria Square, Adelaide, 5000, AUSTRALIA 2South Australian Metropolitan Fire Service, 99 Wakefield Street, Adelaide, 5000,
AUSTRALIA [email protected]
INTRODUCTION The investigation presented in this paper was initiated as a response to a population of firefighters, located at the Largs North Fire Station, who reported comparatively high PFAS blood levels with reference to the wider South Australian Metropolitan Fire Service (SA MFS) population. The elevated PFAS blood concentrations of SA MFS personnel from the Largs North Fire Station were considered likely to represent a realised source receptor pathway linkage opposed to general occupational exposure. The presence of a likely source pathway linkage and an affected population required an approach; which not only aimed to confirm the significant contributing source of PFAS to blood; but to also provided the affected stakeholders with sufficient comfort that the source or sources were identified to inform effective mitigation measures to break the source receptor pathway linkage. The investigation comprised; significant stakeholder engagement; comprehensive sampling of different media at the fire station; and a PFAS exposure assessment, to provide quantification of different contributing PFAS sources to blood. AIM OF THE WORK UNDERTAKEN The aim of the work undertaken was to inform site mitigation measures to break the source pathway receptor linkage and provide the SA MFS and its stakeholders with an acceptable level of confidence that ongoing occupation and operation of the fire station would not result in further exposure to PFAS. INVESTIGATION SUMMARY The investigation was completed in number of stages. The first stage involved a stakeholder engagement session with affected firefighters. In this session firefighters were interviewed to assess potential exposure pathways and a preliminary sampling plan was developed, in consultation with the stakeholders, to assess the site. The investigation included sampling of all media which may have represented a potential source of PFAS. The media sampled included soil, groundwater, dust, fruit, non-fruiting plants, vegetables, herbs, eggs, paver dust, firefighting appliances and mulch. Ongoing stakeholder engagement was undertaken throughout the investigation and included firefighters from the Largs North Fire Station, their families, union representatives and SA MFS management. RESULTS The investigation identified elevated concentrations of PFAS in all media tested, with concentrations exceeding published criteria in groundwater, fruit and eggs. Consistently elevated concentrations of PFAS in all plants within the site, were attributed to the root zone of the plants interacting with shallow PFAS impacted groundwater. Fruiting plants on the site provided a complete source pathway receptor linkage via consumption of fruit. Fruiting and non-fruiting plants also provided a transport mechanism, moving PFAS from groundwater to the site surface through deposition of vegetation. This was evident in elevated PFAS concentrations in chicken eggs, which was attributed to the chickens being
T21f
Copyright © CRC CARE Pty. Ltd., 2019
CleanUp Conference 2019Adelaide, Australia8 –12 September 2019 364
Table of Contentsfor this manuscript

exposed to PFAS in both vegetation litter and soil. Consumption of eggs also provided a complete source pathway receptor linkage. The groundwater investigation identified a regional PFAS issue to be present on the Le Fever Peninsula, however the Largs North Fire Station was confirmed to be the primary contributor to localised elevated PFAS at the site. CONCLUSIONS The investigation concluded that the main contributors of PFAS in blood were associated with consumption of eggs and fruit grown on the fire station. Dust at the fire station was identified to be minor contributors of PFAS in blood. The contaminant mass exposure associated with dust was assessed to be negligible, however dust remained a concern for affected firefighters. The firefighting vessel was identified to be potentially significant contributors to PFAS in blood. Mitigation measure implemented at the fire station included; immediately ceasing consumption of fruit and eggs, which was implemented at the initial stakeholder meeting; removal of chickens and all vegetation; cleaning of the fire station to remove dust, laying of geotextile fabric and mulch over exposed soils; and decontamination of the gallantry fire vessel. REFERENCES Head of Environment Protection Authorities. (2018) PFAS National Environment
Management Plan.
365
Table of Contentsfor this manuscript

LESSONS LEARNT IN ENVIRONMENTAL AUDITING
Jean-Paul Pearce
Australian Environmental Auditors, 2/181 Halifax Street, Adelaide, SA 5000, AUSTRALIA [email protected]
This presentation will provide lessons learnt from audits of single residential dwellings to auditing aspects of multi-billion dollar infrastructure projects and contaminated sites ranging from residential developments next to landfills, high density residential developments on service stations, PFAS impacted sediments and everything in between. A particular focus will be placed on the following:
• When to engage the auditor and challenges with auditing sites already under construction;
• Determining site suitability (current and future) when the source of the contamination is off site and poorly assessed;
• Unique challenges with vapour intrusion risks for basements extending into groundwater with chlorinated and petroleum hydrocarbon contamination;
• When the consultant (and client) understand the contamination issues better than the auditor; and
• Dealing with PFAS impacted acid sulfate sediment.
T22a
Copyright © CRC CARE Pty. Ltd., 2019
CleanUp Conference 2019Adelaide, Australia8 –12 September 2019 366
Table of Contentsfor this manuscript

CONSULTANT LIABILITY — THE TRUTH ABOUT BEING SUED
Sarah Mansfield
Norton Rose Fulbright, Level 18, 225 George Street, Sydney, NSW, 2000, AUSTRALIA [email protected]
INTRODUCTION Understandably, very few professionals will openly discuss why they have been sued, what they wished they had done differently or the practicalities of the process. This talk will cover all of these issues, and discuss the best systems and tools for reducing your exposure to liability. SOURCES OF LIABILITY Claims against environmental consultants are typically based on all three of the following causes of actions:
• Breach of contract • Negligence • Misleading or deceptive conduct
This talk will cover what you need know about these causes of action, including by answering the following key questions:
• Who can sue you? • To what standard do I need to perform the services? • To what extent will contractual terms and conditions protect me from liability?
WAR STORIES In addition to some anecdotes based on personal experience, this talk will cover the lessons to be learnt from the key cases on consultant liability, including:
• What makes a misleading and deceptive report?: Charben Haulage Pty Ltd v Environmental & Earth Sciences Pty Ltd
• But I relied on the information provided to me by the client!: Coffey LPM Pty Ltd v The Contaminated Site Committee
• Delivering on those big promises you made in your tender submission: United Petroleum Pty Ltd v Bonnie View Petroleum Pty Ltd & Thiess Services Pty Ltd v Mirvac Queensland Pty Limited
YOU’VE BEEN SERVED — WHAT’S IT LIKE AND WHAT TO DO NEXT? This talk will cover how the process commences, what you should do next and the first steps in the litigation. REDUCING YOUR EXPOSURE The talk will conclude with some practical tips for reducing your exposure to liability, including:
• The key facts to check every time • Drafting a tender response which will not set you up for failure • Maximising the effectiveness of your terms and conditions
T22b
Copyright © CRC CARE Pty. Ltd., 2019
CleanUp Conference 2019Adelaide, Australia
8 –12 September 2019367
Table of Contentsfor this manuscript

BY THE LETTER OF THE LAW — PREPARING FOR WHEN CONSULTING GOES TO COURT
Emmylou Cooke, Andre Smit
GHD Pty Ltd, 133 Castlereagh Street, Sydney, 2000, AUSTRALIA
[email protected], [email protected] INTRODUCTION As evidenced by the extradition, prosecution, and incarceration of ‘notorious waste dumper Dib Hanna’ (Gerathy, 2018), the stakes for waste consulting have become much higher. With illegal dumping a priority for environmental protection authorities, the environmental consultant is increasingly required to undertake work that may wind up as technical advice in criminal proceedings – and potentially under cross-examination by litigators. In addition, the judgment in New South Wales Environmental Protection Authority v Grafil Pty Ltd (2018) set out that waste offences must be proven beyond reasonable doubt, requiring watertight investigations and reporting in strict accordance with the legislation. AIM The aim of the case studies used as illustrative examples in this presentation, were, in general, to characterise soil material alleged to have been illegally deposited at a number of sites across NSW in accordance with the Waste Classification Guidelines (NSW EPA, 2014). An additional requirement at a number of the sites was to determine retrospectively whether the material would have met the requirements of the Excavated Natural Material Order 2014, and thus legally allowed to be transported to and applied to the sites. DISCUSSION Undertaking site investigations and preparing waste classification reports is the bread-and-butter for an environmental consultant. However, when designing an investigation with the understanding that the investigation design, methodology and reporting may become the subject of legal scrutiny, the stakes are somewhat higher and the requirements more rigorous. Using illustrative examples from a number of recent case studies, the challenges of this type of engagement will be discussed including the following: Ambiguity in, or lack of, guidelines and sampling density The challenges encountered during the investigation design phase included lack of guidance within the Waste Classification Guidelines (NSW EPA, 2014) around sampling density or frequency, with information around the testing frequency being descriptive rather than prescriptive. As such, guidance was sought from other sources to provide defensible sampling plans, with preference given to guidance documents published in NSW but reference made to other jurisdictions where none existed. Flow of information obscuring investigation requirements Prior to waste classification the source or type of the waste is generally understood, which enables planning for OHS requirements (e.g. for friable asbestos), and also selection of the expected contaminants of concern for laboratory analysis. In these case studies however, we were not able to be provided with information that could reduce our impartiality or objectivity, and as such, OHS planning was for worst case scenario and laboratory analysis was for full waste classification suites (approximately $500 per sample), leading to increased costs to the client. Safety of staff The considerations for staff safety during sampling events usually includes generic risks such as exposure to contaminants, manual handling, driving etc. With the site owner or contact
T22c
Copyright © CRC CARE Pty. Ltd., 2019
CleanUp Conference 2019Adelaide, Australia8 –12 September 2019 368
Table of Contentsfor this manuscript

potentially being associated with or responsible for criminal activity, and the investigation areas often in rural or remote areas, means that more stringent communication protocols are required, with fieldwork undertaken by a two person team at minimum. Timelines: rapid deployment vs long reporting timeline Often the waste located at a site was transient or temporary and required rapid mobilisation to undertake sampling. On occasion, the volume and nature of the waste at a site changed between the initial site inspection and subsequent sampling, and investigation plans required adaptation to the changed site conditions. In addition, once samples were collected and analysed (to comply with holding times), preparation of the associated waste classification report was, on occasion, not required for 6-12 months subsequent to sampling, requiring field notes and photographs to be comprehensive and more detailed than may be required for a regular reporting timeframe. Legal privilege Communication between client and consultant usually is not usually expected to fall under scrutiny during legal proceedings. An understanding of the proper communication channels required (i.e. directly between the consultant and the legal representative) is required to enable the exercising of legal privilege. Asbestos waste and segregation of waste types While the definition of asbestos waste in the Waste Classification Guidelines (NSW EPA, 2014) clearly states that asbestos waste means any waste that contains asbestos, however the NSW EPA vs Grafil Pty Ltd ruling found that a stockpile containing ~600 grams of asbestos containing material did not constitute asbestos waste. This places onus on the NSW EPA (and by extension, the consultant) to prove in court beyond reasonable doubt that the waste is asbestos waste. In addition, there is often a requirement by the client to identify discrete waste types within a stockpile for separate classification which, due to the heterogenous nature of the material, may not be an accurate representation or reflect the practicalities associated with physical segregation of the material. CONCLUSIONS While the legal precedents and case studies forming the basis of this presentation are NSW centric, we will explore other jurisdictional approaches, including definitions of asbestos waste and guideline approaches, and provide commentary. The purpose of the discussion is to enable collaborative information sharing by presenting a summary of learnings to others engaged in investigating and reporting for the purpose of legal proceedings. REFERENCES Environment Protection Authority v Grafil Pty Ltd (New South Wales Land and Environment
Court 2018). Gerathy, S. (2018, June 1). Notorious waste dumper Dib Hanna jailed, made to pay for
newspaper ads publicising his crime. Retrieved from ABC News: https://www.abc.net.au/news/2018-05-31/sydney-asbestos-dumper-jailed-and-has-to-buy-newspaper-ads/9820842
NSW EPA. (2014). Waste Classification Guidelines.
369
Table of Contentsfor this manuscript

THE EFFECT ON MARKET VALUE OF CONTAMINATION: THE 2019 ALEXANDRIA LANDFILL DECISION AND THE
ROLE OF EXPERTS AND CONSULTANTS IN VALUING CONTAMINATED LAND
Anneliese Korber
Norton Rose Fulbright, Level 18, Grosvenor Place, 225 George Street, Sydney, AUSTRALIA
The impact and stigma that contamination can have on land value is a complex question. Contamination is an intrinsic consideration in an increasing number of matters coming before the Courts including in relation to compensation and valuation claims. In NSW, the Land and Environment Court recently decided one of the largest compensation claims in that states history for a parcel of heavily contaminated land as part of the controversial WestConnex Motorway Project in Sydney. The decision, Alexandria Landfill Pty Limited v Roads and Maritime Services (No. 6) 2019 NSWLEC 19 (ALF) was years in the making and involved a claim of over $500 million by companies in the Dial A Dump Group – a claim said to be the largest claim for compensation following the acquisition of land in NSW history. The site was a former brick shale quarry. Once the brick works finished, the site became a council landfill before eventually being sold to the relevant owners and used as a larger landfill and waste recycling operation. It was the subject of regulation by the EPA and had been issued with a number of remediation orders, with clean- up costs in the tens of millions. So how did the Court (and the parties) go about valuing this extremely complicated parcel of land? With the assistance of contaminated site experts and site auditors, experts in waste operations and management, landfills, geotechnical engineers, planners and valuers, the Court undertook a step by step analysis to determine the inputs for a model for deriving value. This model relied on the detailed and specialist presentation of evidence in manner which could be converted into a dollar amount. In a context of an estimated 200,000 contaminated sites across Australia and increasing matters coming before the Court, experts and consultants will only be called up more often to assess the impacts of contamination on land value, both in resolving compensation and rating disputes. The Alexandria Landfill case provides key guidance for valuing contaminated land and also for experts and consultants when assisting in this task.
T22d
Copyright © CRC CARE Pty. Ltd., 2019
CleanUp Conference 2019Adelaide, Australia8 –12 September 2019 370
Table of Contentsfor this manuscript

PRINCIPLE-BASED REGULATION IN VICTORIA — IMPLICATIONS OF THE ENVIRONMENT PROTECTION AMENDMENT ACT 2018 FOR
THE REGULATION AND CLEAN UP OF CONTAMINATED SITES
Mark Beaufoy
King & Wood Mallesons, Melbourne, Victoria, AUSTRALIA [email protected]
INTRODUCTION In August 2018 the Victorian Parliament passed the Environment Protection Amendment Act 2018 (Amending Act) which will replace the Environment Protection Act 1970. The Amending Act is expected to commence operation in July 2020.1 In July 2019 the Regulations supporting the Amending Act and a Regulatory Impact Statement is due to be released for industry and public comment.2 The Amending Act has been described as a ‘once in a generation reform’ and ‘world leading’ and, certainly, represents a transformation of Victoria’s environment protection legislation. The reforms change the focus of the current Act from managing the consequences of pollution to prevention and reducing the risk of harm. The reforms are all intended to encourage a preventative approach modelled on occupational health and safety legislation and provide EPA Victoria with the regulatory tools and powers to become a strategic and proactive modern regulator. The reforms in the Amending Act seek to implement the recommendations of the Independent Inquiry into EPA Victoria (May 2016) and the Government response (January 2017) which supported most of the Inquiry’s 48 recommendations. In some areas, the Amending Act goes further than was anticipated including the introduction of mandatory reporting obligations in relation to contaminated land and third party rights to bring civil proceedings to restrain environmental breaches. The comprehensive set of reforms in the Amending Act will have major implications for the regulation and clean-up of contaminated sites in Victoria. This includes changes to permissions (licences, permits and registrations), waste management, pollution incident notification and mandatory reporting of contaminated sites, the new public register (‘Victoria unearthed’) and the new set of regulatory tools and powers that will be available to the EPA (including a new range of notice and orders). However, the most significant reform, which has the potential to create significant new challenges for industry and for the EPA in effectively enforcing the legislation, is the ‘general environmental duty’ (GED) (s.25) and the ‘duty to manage contaminated land’ (contaminated land duty) (s.39). What will be expected of industry and site owners under the GED and the contaminated land duty in relation to the management and clean-up of contaminated sites? Will these duties result in the ‘unearthing’ of more contaminated sites, who will be responsible for dealing with those sites and who will be liable? Does the polluter-pays principle still apply? GED AND CONTAMINATED LAND DUTY The GED and the contaminated land duty both require a proactive focus on identification and management of risks to human health and the environment, from pollution and waste (in the case of the GED) and from contaminated land (in the case of the contaminated land duty).
1 The Amending Act is part of a package of reforms including the Environment Protection Act 2017 which was passed and received Royal Assent on 24 October 2017. The new Act provides for a new governance structure for EPA and introduces a new objective for EPA ‘to protect human health and the environment by reducing the harmful effects of pollution and waste’. This Act commenced on 1 July 2018. 2 An analysis of the assessment of the Regulations relevant to the GED, the duty to notify contaminated land, and the contaminated land duty will be included in this paper when presented at the Conference as the Regulations will be available in July 2019 prior to the CRC CARE International Clean Up Conference, 8-12 September 2019.
T22e
Copyright © CRC CARE Pty. Ltd., 2019
CleanUp Conference 2019Adelaide, Australia
8 –12 September 2019371
Table of Contentsfor this manuscript

The contaminated land duty not only requires identification of contamination that a person ‘knows or ought reasonably know of’, but also investigation and assessment of the contamination and provision of reasonably practicable measures to minimise risks to human health and the environment (including undertaking clean-up activities), and provision of information to persons who may be affected by the contamination. The Amending Act places this obligation on the ‘person in management and control of contaminated land’ and then provides a right to recover against the polluter in court of the cost of complying with the duty. Instead of the ‘command and control’ model of regulation under the current Act, with the EPA requiring investigation and clean up contaminated sites by issuing a clean-up notice or pollution abatement notice setting out requirements of what investigation and remediation is required, this ‘principle-based’ form of regulation, puts the onus on the person in management and control (the occupier or owner of the land, who may not be the polluter), to identify, investigate and remediate the site and then attempt to recover its losses from the polluter. Under the current regime, there is at least provision for EPA to attempt to identify the polluter and issue them with a remedial notice, before placing the obligation on the occupier or owner of the land. Although the Amending Act includes the polluter pays principle’ (s.17), the contaminated land duty is imposed on owners and occupiers. Much turns on the definition of ‘contaminated land’ and what the EPA’s expectations are of when a person ‘knows or ought reasonably know of’ the presence of contamination. The ultimate formulation of the definition of ‘notifiable contamination’ in the regulations and the duty to notify contaminated land will also be significant (s.40).3 The definition of ‘contaminated land’ (s.35) relates to chemical substances present on or under land at a concentration above background level and that creates a risk to human health or the environment. Although breach of the contaminated land duty is not an offence or subject to a civil penalty, it can be enforced by the EPA through the range of new remedial notices available under the Amending Act, and where contamination presents a risk of harm to human health or the environment, the failure to comply with the contaminated land duty may also give rise to a contravention of the GED.4 CONCLUSIONS The GED combined with the contaminated land duty will require a renewed focus on contaminated land and a clear strategy by owners and occupiers of potentially contaminated land on the identification, management and notification of that contamination (and the recovery if costs from the polluter). As considerable time has now passed since many of the historical contamination legacies in Victoria were caused, in many cases, identifying and attributing liability to the polluter is increasingly difficult. The GED and contaminated land duty clearly shifts the responsibility to owners and occupiers of contaminated land.
3 It is understood that the definition of ‘notifiable contamination’ will be further refined in the Regulations from the current formulation in s.37 of the Amending Act. This definition is important as officers of corporations can be personally liable for failure to exercise due diligence in relation to compliance with the duty to notify contaminated land (s.349). 4 The GED is subject to maximum criminal and civil penalties of $1.6M for a corporation or $360,000 for an individual.
372
Table of Contentsfor this manuscript

WHY SITE CHARACTERISATION IS IMPORTANT — CASE STUDY OF AN
AUSTRALIAN LEGACY LOW LEVEL RADIOACTIVE WASTE SITE
Timothy E. Payne
Australian Nuclear Science and Technology Organisation, Locked Bag 2001, Kirrawee DC, NSW 2232, AUSTRALIA
Shallow burial has been a commonly used method for disposal of low-level radioactive wastes, and numerous legacy disposal sites exist worldwide. The effective management and potential remediation of these sites are important issues in many countries. One example is the Little Forest Legacy Site (LFLS) on the southern periphery of Sydney, Australia. At this site, low-level radioactive wastes were disposed by burial in closely-spaced unlined trenches between 1960 and 1968. The wastes included various radioactive materials, contaminated equipment, beryllium contaminated items, and fissile isotopes in gram quantities (plutonium, 233U and 235U). As with other similar sites worldwide, the decision-making strategy for selecting the appropriate remedial option for the LFLS relies on adequate characterisation of the site. In recent years, a major research project has been undertaken at the LFLS. The results, including geochemical, hydrological, radiochemical and microbiological aspects, have been published in a series of papers. A process known as the ‘bath-tub’ effect was implicated in the mobilisation and dispersion of actinides in surface soils following intense rainfall events (Payne et al. 2013). An experimental trench facility in the vicinity of the legacy trenches has recently been constructed, and offers the potential for comprehensive tests of the geochemical behaviour and hydrology of the legacy trenches. The evolving understanding of the LFLS site will help inform management decisions and contributes to the fundamental knowledge of the mobility of anthropogenic radionuclides in the environment. REFERENCES Payne, T.E., Harrison, J.J., Hughes, C.E., Johansen, M.P., Thiruvoth, S., Wilsher, K.L.,
Cendon, D.I., Hankin, S.I., Rowling, B.R., and Zawadzki, A. (2013). Environmental Science & Technology 47: 13284-13293.
T23a
Copyright © CRC CARE Pty. Ltd., 2019
CleanUp Conference 2019Adelaide, Australia
8 –12 September 2019373
Table of Contentsfor this manuscript

ASSESSMENT, REMEDIATION AND MANAGEMENT OF LEAD TAILINGS AT NORTHAMPTON WESTERN AUSTRALIA —
A LEGACY OF MINING
Peter Beck1, Jon Cramer2
1GHD Pty. Ltd, Level 8, 180 Lonsdale Street, Melbourne, 3000, AUSTRALIA 2GHD Pty. Ltd, Level 10, 999 High Street, Perth, 6000, AUSTRALIA
[email protected] INTRODUCTION Mining has been an integral part of the Australian economy for almost two centuries, but environmental regulation and associated environmental management has only been initiated within the last couple of decades. The Minerals Policy Institute estimates that this gap in regulation has resulted in over 100,000 legacy and abandoned mines across Australia. Northampton in Western Australia is one area affected by lead and copper mining from the late 19th century until the latter part of the 20th century resulted in legacies. Most of the mine sites were small, low volume operations with limited processing of the ore. The Government of Western Australia established a lead ore processing facility (Battery) in Northampton, adjacent to an ephemeral watercourse, approximately 1.5 km for the town centre in the 1950’s to provide small scale mining operators with access to more efficient processing options. The Battery operated until the 1980’s before being abandoned and over the period of operation accumulated some 50,000 m3 of tailings in un-bunded stockpiles. Erosion processes transported tailings off-site and dispersed these into the adjacent ephemeral watercourse. Tailings were also removed from the site and used for structural fill within the township by local contractors and residents. Unbeknown to the WA Government and the users of the tailings material, the processing was very crude and material retained significantly elevated lead concentrations up to 30%. In response to the legacy impacts, the Department of Water and Environment Regulation classified the Battery facility in 2006, requiring remediation of that site. Following the safe securement of the tailings source in 2009, the WA Government’s focus moved to investigation the extent of potential contamination, and subsequent human health impacts, within the township of Northampton. The Northampton Lead Tailings Project, managed by the Department of Planning, Lands and Heritage, as part of coordinated Government approach with the support of the Shire of Northampton Council, since 2011 has implemented a systematic investigation and remediation approach to the issue whereby properties where tailings were present were remediated and/or managed appropriately to remove the risk on those properties. APPROACH The WA Government adopted a systematic and holistic approach to the Lead Tailings Project, comprising the following key elements: • Eliminate the primary source of tailings by assessing and remediating the battery site
(largely completed in 2009); • Identify which of the 759 properties in the township were at risk of having tailings present
by a multiple lines of evidence approach including extensive community consultation /engagement process;
• Develop robust un-intrusive methods for efficiently and effectively identifying presence of tailings on a property, including decision making protocols for distinguishing between lead impacts from imported tailings, elevated lead associated with mineralised zones and residual soil endemic throughout the township and other anthropogenic sources of lead such as use of lead paint;
• Develop efficient and cost effective approaches to remediation and management of lead tailings on properties where present; and
T23b
Copyright © CRC CARE Pty. Ltd., 2019
CleanUp Conference 2019Adelaide, Australia8 –12 September 2019 374
Table of Contentsfor this manuscript

• Develop appropriate regulatory approaches including a critical and independent review that leads to closure for sites that were remediated/managed and notification and management of sites not assessed but suspected of containing tailings.
OUTCOMES The outcomes following implementation of the approach included: • Remediating the battery site by demolishing structures, removing and preserving
(uncontaminated) heritage items and remediating the tailings and impacted soils through the construction of a lined encapsulation cell;
• Implement extensive community consultation to encourage property owners to participate in the voluntary investigation program. The initial uptake of participation was 701 properties (92%) reaching 98% by the end of the project;
• Properties included in the program were assessed using an extended Phase 1 assessment that included sampling and analysis in the field using portable XRF verified by laboratory analysis. The field analysis method developed facilitated the collection of over 30,000 concentration measurements during the program. At the completion of the extended Phase 1 assessment, 128 properties were identified as being at risk of having tailings present, with the total volume of tailings present in the township estimated at around 11,500 m3. Additional properties participated after Phase 1 was completed, with the final number of properties remediated and managed coming to 144;
• After the Phase 1 investigation the project moved directly into the remediation and management phase as completion of a detailed investigation phase, at each of the 128 suspected properties, was considered an unnecessary cost and involved potentially unnecessary disturbance to private landowners. The associated financial resources were perceived to provide greater value by being devoted to remediation and management of the properties
• Remediation and management measures adopted included removal of all accessible tailings (where practical) and placing these into a temporary containment cell at a nearby abandoned mine site. Tailings that could not be accessed or safely removed were managed through implementation of a cap and contain strategy tailored to the individual property nuances. Removed tailings are to be permanently stored in the a purpose engineered containment cell to be constructed for remediation of the abandoned mine site that will host the containment cell; and
• The program development and implementation was guided by a steering committee that comprised State Government authorities, Northampton Shire Council, Consultant and Auditor. Program quality assurance included critical and independent review by an accredited auditor who was involved with project from its commencement in 2006. The committee developed a closure process that resulted in sites not being classified when complete tailings removal was achieved and being classified as remediated for restricted use where residual tailings remained under a cap and contain strategy with and an appropriate Site Management Plan.
CONCLUSIONS Mining has been an integral part of the Australian economy over the past two centuries. Environmental management in and regulation of the mining industry has only occurred in recent decades, which has led a large under of legacy sites that continue to adversely impact the environment. To address these legacies a holistic and risk-based approach is necessary to effectively manage these sites. The township of Northampton in Western Australia is one such legacy where adverse environmental and human health impacts resulted from historical lead mining activities. These legacy impacts have been addressed through a coordinated, integrated, interdepartmental, systematic and calculated approach that resulted in the remediation and management of the source site, the affected sites in the township and one of the larger abandoned mine sites where the ore originated.
375
Table of Contentsfor this manuscript
IN THE CROSS HAIRS: A REGULATOR’S PERSPECTIVE OF SHOOTING RANGE CONTAMINATION
Matt Baronio, Scott Jones, Julia Caluzzi
EPA Victoria, GPO Box 4395, Melbourne, VIC 3001, AUSTRALIA
INTRODUCTION EPA Victoria’s (EPAV) investigation and regulation of contamination on and from the Wangaratta Clay Target Club (WCTC) has revealed a suite of technical and regulatory challenges. This has required a broader whole-of-government approach to ensure that shooting sports continue to be undertaken without posing an unacceptable risk to our environment and human health. EPAV’s investigation into contamination at the WCTC and areas adjacent to it raised key issues about land-use planning & zoning, the practicability of clean-up, the efficacy of ongoing management and the need for improved education and communication about environmental risk and risk management to community sporting groups. METHODS EPAV does not license shooting ranges under the Environment Protection (Scheduled Premises and Exemptions) Regulations 2006. Victoria Police regulates shooting ranges under the Firearms Act 1996 and local councils regulate them under the Planning and Environment Act 1987 (i.e. zoning). Shooting ranges (shotgun ranges, rifle ranges, pistol ranges) can in some instances cause lead (from lead shot) and polyaromatic hydrocarbons (PAHs – chemicals found in some types of clay targets) to contaminate land, surface water and groundwater. EPAV’s investigation into the potential environmental and human health risks posed by outdoor shooting ranges across Victoria began following the discovery of lead contamination at the North Wangaratta Recreation Reserve in May 2016. EPAV recognised the need to engage more broadly across government and with the sports shooting community, to understand and manage the risks from shooting range activities. As part of its regulatory response, EPAV worked (and continues to work) with representatives of the sporting shooting associations, as well as with other government agencies including Victoria Police, Department of Health, Department of Environment, Land, Water and Planning, Sports and Recreation Victoria, WorkSafe, Department of Economic Development, Jobs, Transport and Resources and the Victorian Planning Authority. In approaching this issue, EPAV had numerous technical discussions with land and groundwater specialists, both in-house and from within the environmental consulting sector, to better understand the limitations of current clean-up approaches for shooting range contamination. From these discussions it became apparent that there remains uncertainty around the mobility of lead contamination and the ability of current technologies to remediate soil in-situ. While EPAV’s investigation of the WCTC was in line with its pollution response approach about stopping the source, mitigating risk and seeking restoration of the environment, it also involved the challenges of community sporting groups who initially did not acknowledge the issue, have limited technical experience in environmental contamination and the financial inability to respond to the pollution. As such, the clubs needed more support and guidance from EPAV about the environmental and human health issue, the regulatory expectations and the process and remediation of contaminated sites. The regulation of this issue continues. While the areas of public access adjacent to the WCTC have been remediated, EPAV is currently assessing clean-up approaches and long-
T23c
Copyright © CRC CARE Pty. Ltd., 2019
CleanUp Conference 2019Adelaide, Australia8 –12 September 2019 376
Table of Contentsfor this manuscript

term administrative controls for the WCTC to enable the sporting activity to continue and ensure risk management for future land users. In January 2019 EPAV released the “Guide for managing contamination at shooting ranges’ (publication 1710) to assist the sporting shooting community to assess and manage its potential environmental risk/s. EPAV has also released a document on its website about engaging consultants, to assist non-technical duty holders in this work. Furthermore, EPAV is seeking to work proactively with planners to provide advice on the siting and management of new shooting ranges. RESULTS AND DISCUSSION EPAV work on shooting ranges has highlighted the following:
• Shooting range operators typically have limited technical knowledge of the environmental and human health risks posed by their activities. The clubs typically have limited financial capacity to deal with responding to contamination;
• Shooting ranges are often co-located on sensitive land uses, including public use zones where other sporting facilities are situated;
• More work needs to be done to demonstrate the efficiency and practicability of current clean up technologies, including use of lime and “sieving” of Pb from soil to protect beneficial uses of the land;
• The potential and mechanism for mobilisation of Pb and contamination of groundwater, particularly, is not well understood.
• Continue to work across government to reduce environmental risks from shooting ranges in the future through planning and use of planning tools,
• There has been strong community interest in this issue. Community groups that use areas impacted by the contamination have been frustrated by the length of time that it has taken to resolve the issue and have displayed a scepticism as to the risk of harm from contamination.
CONCLUSIONS Contamination from shooting range activities is a complex issue due to the nature of the contamination, location of clubs, shooting range operators limited knowledge and financial inability to address contamination from its activities, and limitations of the regulatory system including planning and licensing. The management of such contamination should be conducted via a broader whole-of-government approach and include the sports shooting community, researchers and the environmental consulting sector.
377
Table of Contentsfor this manuscript

ARSENATE IN PHOSPHORUS SENSITIVE PLANTS
Sepide Abbasi1, D.T. Lamb1,2, Z. Sobhani1, A. Rahman1, R. Naidu1,2, M. Mallavarapu2
1Global Centre for Environmental Remediation (GCER), The University of Newcastle,
AUSTRALIA 2Cooperative Research Centre for Contamination Assessment and Remediation of the
Environment (CRC CARE), AUSTRALIA [email protected]
INTRODUCTION Arsenic (As) is well known for its toxicity impact on plants and humans and it has been categorized as carcinogenic. Discovery of acute impact of arsenic on human health has resulted in wide ranging research on As toxicity. The results of previous studies show that both, organic (mono/dimethylarsonic acid, trimethylarsine oxide, arsenobetaine, etc.) and inorganic compounds of As (arsenite and arsenate) can be found in the environment. The most toxic form of As which is dominant in anaerobic condition is arsenite (As (III)) with 10 and 70 times higher toxicity than arsenate and organic As, respectively. Arsenate, As (V), is dominant As compound in aerobic condition and soil. Arsenate is a phosphate analogue and use the same transport system to enter to the plants (Meharg and Hartley-Whitaker, 2002). Australian native plants have the ability to grow and develop very well in soil with very low nutrient content. Physiological and morphological adaptations of native plants to impoverished soil of Australia resulted in P sensitivity in some native Australian plants such as Hakea prostrata (Lambers et al., 2012, Shane et al., 2004a, Shane et al., 2004b). Shared transport system for uptake of As (V) and Pi may therefore infer unique responses from P-sensitive plant species to As(V). Despite extensive investigation on As behaviour and impact in the environment and significant evidence of As contamination in Australian soil (Smith et al., 2003), to date, no study has been conducted to assess the response of P-sensitive Australian native plants to elevated level of As. The aim of this study was to examine the response of P-sensitive Australian plants to As. Hakea prostrata with high sensitivity to P and Banksia seminuda with moderate sensitivity to P (both native Australian plants) and Cucumis sativus (cucumber) were selected to investigate their response to As(V). METHODS Two native Australian plants with high (Hakea prostrata R.Br.) and moderate sensitivity (Banksia seminuda A.S. George) to P and one crop plant (Cucumis sativa L.) (assumed not to be P sensitive) were grown in nutrient solution (Asher and Loneragan, 1967) with increasing concentrations of As to generate a dose-response curve. The sensitivity to P was determined in previous experiments. The P concentration in the nutrient solution of this study was 10 µM. All plants were germinated in Petri dishes in the dark at 25 °C. Seedlings were transferred to greenhouse 2-3 days after germination. Seedlings were exposed to 10 different As concentrations for 4 weeks (cucumber) and 10 weeks (H. prostrata and B. seminuda). Harvested plants were dried at 65 °C and their dry weights were recorded. Plants were acid digested (HNO3) and Inductivity Coupled Plasma-Mass Spectrometry (ICP-MS) was used to analyse plants As, P and mineral content. Grapher version 9.6.1001 was used to plot dose response curve of [As] in solution and also in tissue with tissue dry matter. Spearman’s correlation test was used to measure correlation between variables (As, Fe, Mn, Zn, Ca, P) (IBM SPSS version 24). RESULTS AND DISCUSION The exogenous concentration of As (µM) that inhibited the growth of H. prostrata, B. seminuda and cucumber by 50% was used to compare As phytotoxicity on plant growth. Both H. prostrata and B. seminuda showed a high degree of sensitivity to As(V) in
T23d
Copyright © CRC CARE Pty. Ltd., 2019
CleanUp Conference 2019Adelaide, Australia8 –12 September 2019 378
Table of Contentsfor this manuscript

comparison to cucumber. Despite the greater sensitivity of P(V) observed in H.prostrata, the response of both native species to external As(V) exposure was very similar in terms of both root and shoot response. Moreover, both wild species of plant were more susceptible to As(V) than cucumber. The EC50 values of cucumber roots were 2.88 and 2.66 times higher than that for H. prostrata and B.seminuda, respectively. Similar to roots, cucumber shoot EC50s were 1.92 and 1.44 higher than H. prostrata and B. seminuda, respectively. The highly P-sensitive H. prostrata showed the highest accumulation of As in the shoots relative to B.seminuda and cucumber. Accumulation of As in the shoots of H.prostrata was related to a decrease of the Ca, Zn and Mn content in the shoot, whilst there was an increase in P concentrations (P<0.05). These results parallel those previously reported during P-toxicity in H.prostrata (Shane et al. 2004a; 2004b). Similarly, cucumber showed a negative relationship between As, Ca, Zn and Mn but with a concomitant decline in P translocation. One of the key expected differences between H. prostrata and most plant species is the inability to down regulate the P transport system in response to P, and potentially, As(V). CONCLUSION The weathering of the Australian landscape and depletion of available P in soil has resulted in a relatively high incidence of P-sensitive plant species. Whilst P-sensitive species are observed globally, the higher proportion on the Australian continent makes the response of As(V) to this group of plant important to understanding As impacts. Both P-sensitive plants in this study showed greater sensitivity to As(V) and also increased accumulation in the shoots. The more P-sensitive species, H. prostrata, accumulated As at the highest rate in shoots. REFERENCES Asher, C. & Loneragan, J. 1967. Response of plants to phosphate concentration in solution
culture: I. Growth and phosphorus content. Soil science, 103, 225-233. Lambers, H., Cawthray, G. R., Giavalisco, P., Kuo, J., Laliberte, E., Pearse, S. J., Scheible,
W. R., Stitt, M., Teste, F. & Turner, B. L. 2012. Proteaceae from severely phosphorus-impoverished soils extensively replace phospholipids with galactolipids and sulfolipids during leaf development to achieve a high photosynthetic phosphorus-use-efficiency. New Phytol, 196, 1098-108.
Meharg, A. A. & Hartley-Whitaker, J. 2002. Arsenic uptake and metabolism in arsenic resistant and nonresistant plant species. New Phytologist, 154, 29-43.
Shane, M. W., Mccully, M. E. & Lambers, H. 2004a. Tissue and cellular phosphorus storage during development of phosphorus toxicity in Hakea prostrata (Proteaceae). J Exp Bot, 55, 1033-44.
Shane, M. W., Szota, C. & Lambers, H. 2004b. A root trait accounting for the extreme phosphorus sensitivity of Hakea prostrata (Proteaceae). Plant, Cell and Environment, 27, 991-1004.
Smith, E., Smith, J., Smith, L., Biswas, T., Correll, R. & Naidu, R. 2003. Arsenic in Australian environment: An overview. Journal of Environmental Science and Health - Part A Toxic/Hazardous Substances and Environmental Engineering, 38, 223-239.
379
Table of Contentsfor this manuscript

ORICA BOTANY — MERCURY CONTAINMENT BY CUT-OFF WALL USING CSM EQUIPMENT
Russell Denny1, Lech Wypych2, Peter O Dea3
1Wagstaff Piling Pty Ltd, PO Box117, Ashgrove, 4060, AUSTRALIA
2Wagstaff Piling Pty Ltd, PO Box966, Kings Langley, 2148, AUSTRALIA 3Orica, 16-20 Beauchamp Road, Matraville, 2036, AUSTRALIA
INTRODUCTION The former chlor-alkali plant at Botany, NSW, which operated from 1945 until 2002, used mercury cell technology and brine solution to manufacture chlorine, caustic soda, hydrochloric acid, sodium hypochlorite and ferric chloride. Mercury contamination is present in the permeable alluvial soil profile beneath the site. The mercury is present in the form of elemental and inorganic mercury, together with dissolved methyl mercury in the groundwater and soil profile beneath the site and also down-gradient of the site, to depths of up to 25m. Residual clay and sandstone bedrock at approximately 25m depth are relatively impermeable and limit the contamination plume. A remediation action plan was prepared, recommending a cap and contain approach involving a subsurface containment wall, or cut-off wall, to restrict groundwater ingress and egress, and lateral subsurface vapour migration. The cut-off wall is situated on the perimeter of the site, with a total length of 430m and passing through alluvial Botany Sands, with a nominal key into the underlying residual clay or sandstone at 20m to 25m depth. METHODS Deep soil mixing technology was used for construction of the cut-off wall, and this paper focuses on the technical aspects of the cut-off wall, and in particular the Cutter Soil Mix (CSM) technique. The cut-off wall was required to act as a hydraulic barrier as well as a gas permeable barrier, and the risk of mercury vapour escape was considered paramount. Cutter Soil Mixing (CSM) was proposed and accepted for the cut-off wall construction, using cement and bentonite mixed with the insitu soil. The CSM technique was preferred after consideration of other techniques, including replacement techniques such as Bentonite-Cement and Soil-Bentonite. Compared to the full replacement alternative cut-off wall systems, the CSM benefits were considered to be as follows;
• Lower fluid permeability could be achieved • Lower gas permeability could be achieved, therefore eliminating the idea of an HDPE
insert • Lower spoil volumes would reduce waste disposal issues • In situ mixing, characterised by a single pass of the mixing equipment for each panel,
compared to continuous passing of trench grab equipment, would result in lower likelihood of mercury contamination being transmitted into the atmosphere.
Worker and community health aspects during construction would be better served RESULTS AND DISCUSSION The construction work was completed through 2015, following extensive laboratory trials and field trials on a nearby site. Features of the work were as follows;
• Early lab mixing and sampling revealed the difficulty to replicate site conditions. Importantly the sampling and testing techniques are critical in how lab results relate to insitu properties of the soil/cement.
• Cement content – Cement content was progressively addressed during the trials, and the adopted dosage was verified during the ongoing deep mixing works.
T23e
Copyright © CRC CARE Pty. Ltd., 2019
CleanUp Conference 2019Adelaide, Australia8 –12 September 2019 380
Table of Contentsfor this manuscript

• Bentonite content – The bentonite content was difficult to increase beyond a peak or saturation level, and this is because of the highly reactive nature of bentonite in water.
• Co-efficient of Variation – High variation and scatter of results was a feature of the early testing work, and the methods adopted progressively reduced scatter and led on to more confidence in the final material properties.
CONCLUSIONS The Cutter Soil Mixing work was executed successfully and in general met expectations, verifying the decision to use insitu mixing for the remediation work. Valuable technical data was gained in regards to this relatively new insitu mixing method. The CSM technique, as a remediation technique, has a promising future in regards to deep subsurface soil remediation applications. REFERENCES Golder Associates, (2012) Reference Specification FCAP Cut-off Wall, Doc. No. 117623084-
008-R-Rev E. Golder Associates, (2012) Remediation Action Plan Doc. No. 117623084-006-Rev2-Block G-
Final.
381
Table of Contentsfor this manuscript

RICE GROWTH AND SOIL ENZYME ACTIVITIES IN CADMIUM (Cd) CONTAMINATED INCEPTISOL
Manoj Shrivastava, Ashish Khandewal, Akansha Srivastav, S.D. Singh
Centre for Environment Science and Climate Resilient Agriculture,
Indian Agricultural Research Institute, Pusa Campus, New Delhi, 110012, INDIA [email protected]
INTRODUCTION Rice (Oryza sativa L.), an important cereal crop in global agriculture, is second (more than 150 million ha) after wheat in terms of the planting area of cereal crops (Shrivastava et al., 2018). Soil contamination with heavy metals and food safety problems occur in many countries as a result of numerous human activities, particularly wastewater and solid waste disposal, mining, smelting, and processing of ores agricultural practices and atmospheric deposition (Adriano, 2003). High Cd concentrations in rice grains grown in contaminated area can present potential health and economic problems for consumers and farmers. Different physical, chemical, and biological processes acting on soil media control the fate of heavy metals in soil. Naturally occurring cadmium (Cd) levels are extremely low. Cd is the metal of most concern because this poses human or animal health risks at plant tissue concentrations that are not generally phytotoxic (Peijnenburg, et al. 2000). Apart from crop growth soil enzyme activity are greatly affected by the Cd contamination. METHODS The field experiments were conducted at the research farm of the Indian Agricultural Research Institute, New Delhi, India during summer-kharif/rainy-seasons of 2018 on a sandy clay-loam soil (typic Ustochrept) to assess the effect of cadmium on rice crop. Soil was spiked with 25 mg kg-1 cadmium and incubated at field capacity for 4 weeks with repeated four wet and dry cycles to establish equilibrium with metal and soil. Seeds of rice cv. Pusa Basmati 1121 were grown in a field nursery for a month and then transplanted in experimental site in flooded condition. The experimental soil an Inceptisol (US Taxonomy) was sandy clay-loam in texture, pH(1:2.5) 8.2, EC(1:2.5) 0.406 dSm-1, organic carbon 3.9 g kg-1, CEC 17.5 cmol (p+) kg-1 soil, available P 30.5 kg ha-1, and available Cd not detected. The experiment was laid out in RBD. A no-Cd control treatment was also included. There were 5 replications. Soil in each plot (4x3 m) flooded and puddled properly and 1 month old seedlings (2 seedlings per hill) were transplanted at 20 x 10 cm in each plot. The level of standing water was maintained at a height of 2.5±0.5 cm above the soil surface. Soil samples were collected at 90 days after transplanting from each plot in submerged condition from the rhizosphere region for soil enzyme analysis. Soil enzymes were anaylyse following the method of Margesin (2005). Rice plants were harvested at the maturity. Rice plants were cut separately into root, shoot, and grain and oven dried at 60 °C for constant weight. After complete drying, dry matter yield of root, shoot and grain were recorded. Plants samples were digested in a mixture of concentrated HNO3 and HClO4 in a 5:1 ratio at 100 °C on a hot plate in a fume hood. The concentration of Cd in the digested solution was measured by AAS (Shimadzu’s Atomic Absorption Spectrophotometer AA-7000) at 213 nm wavelength. After harvesting the crop the soil sample were collected, air-dried, and passed through a 2-mm sieve. For sequential extraction of Cd a sequential extraction scheme proposed by Soltani et al. (2015) et al. was applied. RESULTS AND DISCUSSION Results show that distribution of Cd in different parts of rice plant was found in order: roots>stems>grains. In general rice plant growth was not significantly affected in cadmium contaminated soil as compared to uncontaminated soil. Rice grain yield in Cd contaminated soil found to be at par with uncontaminated soil. In general, catalase, super oxide dismutase
T23f
Copyright © CRC CARE Pty. Ltd., 2019
CleanUp Conference 2019Adelaide, Australia8 –12 September 2019 382
Table of Contentsfor this manuscript

(SOD) and ascorbate peroxidase activities in rice shoot and panicle significantly reduced in Cd contaminated soil as compared to uncontaminated soil, whereas activities of catalase, SOD and ascorbate peroxidase in root found to be higher in Cd contaminated soil. Lipase esterase enzyme activity in soil was found to be more in Cd contaminated soil as compared to uncontaminated soil. However, urease, fluorescein diacetate (FDA) and dehydrogenase activities were decreased in cadmium contaminated soil (Table 1).
Table 1. Soil enzyme activities in Cd contaminated soil Treatment Dehydrogenase
(µg INTF g-1 dry soil 2h-1)
Urease activity (mg Urea
g-1 dry soil h-1)
Fluorescein diacetate (FDA) hydrolysis µg Fluorescein g-1 dry soil 2h-1
Lipase-Esterase Activityµg pNP g-1 dry soil
10 min-1
Control (no Cd) 10.5±2.30 7.75±1.70 51.05±8.90 23.60±4.72
Cd contaminated
soil 2.4±1.12 6.95±1.58 47.03±8.65 33.04±6.45
CONCLUSIONS This study showed that though yield is not affected by Cd contamination, however enzymatic activities in soil and rice plant were significantly affected. REFERENCES Adriano, D.C. (2003) Trace elements in terrestrial environments: biogeochemistry,
bioavailability and risks of metals. Springer, New York (2nd edition) Margesin, R. (2005) Determination of enzyme activities in contaminated soil. In: Margesin,
R., Schinner, F. (Eds.) Manual for soil analysis-Monitoring and Assessing Soil Bioremediation. Springer Berlin Heidelberg New York. pp. 309-320.
Peijnenburg W., Baerselman R., de Groot A., Leenders J.D., Posthuma L., ven Veen R. (2000) Quantification of metal bioavailability for lettuce (Lactuca sativa L.) in field soils. Arch. Environ. Contam. Toxicol. 39:420–430
Shrivastava, Manoj; Mina, U.; Thaplial, S.; Srivastav, A.; Khuant, M.; Singh, S.D. (2018) Rice Crop Growth and Rhizospheric Microbial Dynamics in Heavy Metals Contaminated Inceptisol.In: Singh, V.P., Yadav, S., Yadava, R.N. (Eds.) Water Quality Management. Springer Nature Singapore. pp. 281-297.
383
Table of Contentsfor this manuscript

HEALTH IMPLICATIONS OF FOOD CONTAMINANTS: GEOCHEMICAL AND ENVIRONMENTAL POLLUTANTS
Ming Hung Wong
Consortium of Health, Environment, Education and Research (CHEER), The Education
University of Hong Kong, Hong Kong, CHINA [email protected]
INTRODUCTION Chemical food safety is currently one of the major public health issues in the world, especially in developing countries, which have taken a more rapid pace in development than developed countries. The overall aim of this paper is to review the major geochemical and environmental pollutants found in our food items, citing examples related to the Pearl River Delta region, which has undergone a rapid socio-economic change during the past 40 years. 1. Chemical Food Safety “Chemical food safety” is a key global food safety concern, and we should ensure food is safe, in the entire food chain (FAO, 2013). This article will focus on the geochemical cycles and health impacts of (1). Geochemical pollutants that crops absorb from soil: As and F; (2). Environmental pollutants including trace metals: Hg and Pb; POPs: PCB and PCDD/Fs; and (3) Emerging chemicals of concern: PBDE, bisphenol A and phthalates (related to PVC). 2. Persistent Toxic Substances Generated in Densely Populated Areas The PRD has been transformed to the world center for electronic/electrical, textile and pharmaceutical productions, in addition to the active mining and agricultural industries. Chemicals emitted can be found in different environmental media. Wastewater and (drinking) water treatment processes are not always efficient in removing these chemicals. Flame retardants can be even transformed to more potent congeners, after they have gone through the waste treatment processes (Chow et al, 2017). These chemicals may eventually enter our food production systems, leading to rather high concentrations of Hg and DDT detected in local food items and blood plasma of HK residents (Qin et al, 2011). 3. Exposure, Monitoring and Assessment of PTS In general, oral intake is the predominant exposure pathway for most of PTS found in food, than inhalation and dermal contact. Toxicity or potency of chemical food contaminants will depend on the types of chemicals, their concentrations, and the consumption rates; which may impose short-term (at high dosage, may be fatal) and long-term (at low dosage, may cause cancers and histological damages) health impacts. It is therefore important to set safety limits of pollutant concentrations in food. Tracing the sources and fates of PTS, especially their speciation, bioavailability and bioaccessbility would be of high priority in order to deter their entry into our food production systems. Bioassay tests, genotoxicity and mutagenicity tests can be used to test the toxicity and potency of these food contaminants, and biomarkers to provide a rapid warning system. 4. Health Impacts and Economic Loss: Action for Policy Makers Common health problems such as cancers (caused by As, asbestos, PCDD), neurological damage and lower IQ (As, Hg, Pb), kidney disease (Cd, Hg, Pb), and skeletal and bone diseases (F, Cd, Pb) are serious issues. The recent rise in colorectal cancer may reflect the seriousness of food contamination in HK (HK Hospital Authority, 2016). https://www3.ha.org.hk/cancereg/topten.html The extremely high concentrations of Pb and PBDE emitted through uncontrolled recycling of e-waste (at Guiyu) is linked with severe environmental contamination (including food). This explained the reason why high body loadings (placenta, blood, milk, hair) of these PTS are
T24a
Copyright © CRC CARE Pty. Ltd., 2019
CleanUp Conference 2019Adelaide, Australia8 –12 September 2019 384
Table of Contentsfor this manuscript

detected in the workers and local residents. The epidemiological data has further shown that the local population is at risk, with an increasing morbidity of major diseases such as digestive system and malignant tumour (Chan et al, 2007). This example is related to health impacts of short-term exposures, at high doses of PTS. Nevertheless, longer-term exposures with comparatively lower dosages of PTS seem to be a recent public health concern (Wong, 2017). Certain PTS like Hg could be bioaccumulated and biomagnified in food chains, leading to extremely high concentrations in top carnivores: tuna and shark. The use of trash fish and low quality commercial feeds for fish farming led to high concentrations of Hg and DDTs detected in cultured fish (Liang et al, 2011). The HK Center for Food Safety (2013) indicated that dietary exposure to methyl Hg is a health concern to 11% of women aged 20-49. This is linked with autism developed in children, accompanied with a lower learning capability, and a lower IQ (Ye et al, 2017). In fact, IQ is a well-established endpoint in cost-benefit and economic analyses (Swain et al, 2007). Policy makers are more alert when they are informed that human health and economy are adversely affected. 5. Chemical Management Issues A number of criteria has been used to identify chemical management issues in developing countries and countries with economies in transition, in a survey sponsored by UNEP, e.g. transboundary issues, and impact to human environment. Results indicated that out of the 23 types of toxic chemicals investigated, the top 5 which needed more attention are heavy metals, PAHs, mixture effects, opening burning, and endocrine disrupters (Bowman et al, 2011). In order to have a better control, a regional list of PTS, with a focus on their sources, fates and environmental and health effects; should be established (Wong et al, 2012). Although HKEPD has strengthened its monitoring program, but there is still a severe data gap concerning certain emerging chemicals of concern, notably plastics, microplastics and associated toxic chemicals in the region. CONCLUSION In addition to the above suggestions, it is necessary to have a closer collaboration among Guangdong Province, Macau and HK, in combating the same environmental problem the region is facing. This is especially true, with the recent call for building the region into “a role model of high-quality development”. REFERENCES Bouwman H, Wong MH, Barra R (2012). GEF Guidance on Emerging Chemicals
Management Issues. UNEP/GEF. Chan JKY,.... Wong MH (2007). Body loadings and health risk assessment of PCDD/Fs at
an intensive e-waste recycling site in China. Environ Sci Technol 41: 7668-74. Chow KL, Man YB,…Wong MH (2017). Removal of BDE-209 using a combined system
involving TiO2 photocatalysis and wetland plants. J Hazard Mater 322: 263-9. FAO (2013). From farm to table: A global approach to food safety. FAO. Hong Kong Center for Food Safety (2013). 1st HK Total Diet Study Report on MeHg. HKG. Liang P,…Wong MH (2011). The influence of mariculture on Hg distribution in sediments and
fish around HK and adjacent mainland China waters. Chemosphere 82: 1038-43. Qin YY,… Wong MH (2011). Halogenated POPs and PAHs in blood plasma of Hong Kong
residents. Environ Sci Technol 45: 1630-7. Swain WB, Veiga M, Spiegel S, Lupi F, Jakus P, Pacyna J, Penn A (2007). Socioeconomic
consequences of mercury use and pollution. AMBIO 36: 45-61. Wong MH (2017). Chemical pollution and seafood safety, with a focus on mercury: The case
of Pearl River Delta, South China. Environ Technol Innov 7:63-76. Wong MH, MA Armour, R Naidu, M Man (2012). Persistent toxic substances: sources, fates
and effects. Rev Environ Health 27: 207-13. Ye BS, Leung AOW, Wong MH (2017). The association of environmental toxicants and
autism spectrum disorders in children. Environ Pollut 227: 234-42.
385
Table of Contentsfor this manuscript

APPLICATION OF RISK ASSESSMENT TO MANAGE PETROLEUM HYDROCARBON IMPACTS AT AN OPERATING TERMINAL
Atul M. Salhotra
RAM Group, 5110 Pine Street, Bellaire, TX 77401, USA
The gasoline and diesel storage and distribution terminal was built in 1960. The original owner operated it until 1993 when it was sold. However, the original owner retained the liability for regulatory closure of a significant spill that occurred at the site in 1986. Specifically, a loss of 12,000 gallons of loss of diesel, identified as a part of inventory reconciliation, triggered several investigations. These investigations resulted in:
• Installation and sampling of 49 monitoring wells; • Collection of 52 soil gas samples; • Installation and operation of pump and treat, air sparge, soil vapor extraction system,
and light non-aqueous phase liquid (LNAPL) removal; and • Soil sampling.
Despite these multiple remediation activities, the concentrations were above the “screening levels” and the Site was “stuck in perpetual monitoring.” The possibility of a “new” spill resulting in a co-mingled plume was a concern for the original owner as it could potentially increase their liability. The Site is located in a state where the regulators do not have a robust risk based corrective action program in place. Hence a key part of the project included the “education” of the regulators on the use of risk assessment. The paper will present the case study and will include a step by step discussion of the tasks required to plan and implement a risk assessment and the application of the results to make risk management decisions. Specifically, the paper will present (i) evaluation and compilation of all available relevant data in a user friendly and easy to understand manner; (ii) development of a site conceptual model (SCM), (iii) development of an exposure model (EM), (iv) Identification of any data gaps, (v) collection of data to fill in the data gaps; (vi) estimation of chemical and pathway specific representative concentrations, (vii) estimation of human and ecological risk including sensitivity analysis; and (viii) preparation and implementation of a risk management plan. For this site, statistical analysis of groundwater data and the indicated that the plume was declining. Except for the construction worker, the risk assessment was acceptable. Based on the results, risk management plan was developed that included institutional controls and limited additional monitoring. The risk management plan was approved by the regulators resulting in a win-win for all the stakeholders (original owner, new owner, regulators and neighbour).
T24b
Copyright © CRC CARE Pty. Ltd., 2019
CleanUp Conference 2019Adelaide, Australia8 –12 September 2019 386
Table of Contentsfor this manuscript

CHRONIC EFFECTS OF ZnO NANOPARTICLES TO EARTHWORM, EISENIA FETIDA
Chamila Samarasinghe Vidane Arachchige1,2,4, Kannan Krishnan3,
Robert John Aitken4, Ravi Naidu1,2, Megharaj Mallavarapu1,2
1Global Centre for Environmental Remediation, Faculty of Science, University of Newcastle,
Callaghan, NSW 2308, AUSTRALIA 2Cooperative Research Centre for Contamination Assessment and Remediation of the
Environment (CRC-CARE), University of Newcastle, NSW 2308, AUSTRALIA 3Global Innovative Centre for Advanced Nanomaterials, Faculty of Engineering and Built
Environment, University of Newcastle, Callaghan, NSW 2308, AUSTRALIA 4Priority Research Centre for Reproductive Science, School of Environmental and Life
Sciences, Faculty of Science, University of Newcastle, Callaghan, NSW 2308, AUSTRALIA [email protected]
INTRODUCTION Nanoparticles are increasingly used in many different industries. ZnO nanoparticles are one of the commonly used nanoparticle types in sunscreens, cosmetics, foods, pharmaceuticals and environmental remediation1,2. Following the heavy usage, greater quantities of nanoparticles are released into the environment. However, realistic environmental concentrations of ZnO nanoparticles are not yet established due to their complex behaviour. The studies performed using different modelling approaches suggest an annual increase of ZnO nanoparticles within the range of 26 ng Kg-1 – 56 µg Kg-1
in soil, sludge-treated soil and sediment. Therefore, increasing levels of ZnO nanoparticles in the terrestrial environment can be expected in the future. Published data on nanotoxicity of ZnO particles have performed using high concentrations. It would be equally important to assess the toxic potential of these nanoparticles at very low levels as well as at high concentrations until the realistic concentrations are established. This understanding will enable faster regulatory decisions. The high reactivity of the nanostructure and the continuous addition of nanoparticles into the environment pose a threat to the living organisms. Hence, toxicological risk assessment of nanoparticles towards the non-target beneficial biota and the ecosystem is essential. METHODS In this study, earthworm chronic toxicity assay was performed according to the OECD guidelines (2004) to assess the toxic effects of ZnO nanoparticles. Soil used in the study was collected from Callaghan, New South Wales, Australia. Soil was air-dried, sieved (2 mm sieve) and spiked with 0.1 - 1000 mg Kg-1 of ZnO nanoparticles. This dose range was selected in order to compare with the existing data, and to cover a wide range of concentrations, including the present/ future realistic levels. Adult, mature earthworms (E. fetida) were added to ZnO nanoparticle spiked soil. Unamended soil was used as control. After 28 days of exposure, earthworms were removed from the soil, counted and weighed. Depurated earthworms were acid digested using concentrated HNO3. The resultant solution was diluted and analysed for Zn content using ICP-MS. The number of cocoons in soil was counted at this stage, and cocoons were incubated for further 28 days to hatch. After this incubation period, the number of juveniles hatched from the cocoons was counted.
T24c
Copyright © CRC CARE Pty. Ltd., 2019
CleanUp Conference 2019Adelaide, Australia
8 –12 September 2019387
Table of Contentsfor this manuscript

RESULTS AND DISCUSSION Physical and chemical characteristics of the soil used in this study are presented in Table 1.
Table 1. Physico-chemical characteristics of the soil used in this study. pH Sand (%) Slit (%) Clay (%)
Texture Total
Carbon (%) Background Zn
(mg Kg-1) 6.5 38 33 28 Clay loam 4.99 106.79 ± 3.20
Reproduction is considered to be more sensitive endpoint than other endpoints in earthworm toxicity assays3. In our study, both cocoon and juvenile production of the earthworms was significantly inhibited at high doses of ZnO nanoparticles (500 and 1000 mg Kg-1) (Figure 1).
Fig. 1. Reproductive responses of E. fetida to ZnO nanoparticles in soil.
No significant effects were observed on survival and growth of earthworms exposed to the ZnO nanoparticle-spiked soils when compared to the control soils. No considerable tissue accumulation of Zn metal was observed in the body tissues of earthworms exposed to ZnO nanoparticle spiked soil (data not shown). CONCLUSIONS Our results show that ZnO nanoparticles may adversely affect the reproduction of E. fetida at high concentrations upon 28 days exposure to ZnO nanoparticles in the soil used in this study. However, earthworm survival and growth were not affected. REFERENCES Sávoly, Z., Hrács, K., Pemmer, B., Streli, C., Záray, G., and Nagy, P. I. (2016) Uptake and
toxicity of nano-ZnO in the plant-feeding nematode, Xiphinema vuittenezi: the role of dissolved zinc and nanoparticle-specific effects. Environmental Science and Pollution Research, 23(10):9669-9678.
Kamat, P. V., and Meisel, D. (2003) Nanoscience opportunities in environmental remediation. Comptes Rendus Chimie, 6(8-10);999-1007.
Heggelund, L.R., Diez-Ortiz, M., Lofts, S., Lahive, E., Jurkscat, K., Wojnarowicz, J., Cedergreen, N., Spurgeon, D. and Svendsen, C. (2014) Soil pH effects on the comparative toxicity of dissolved zinc, non-nano and nano-ZnO to the earthworm Eisenia fetida. Nanotoxicology 8:559-572.
0
10
20
30
40
0 0.1 1 10 100 500 1000
Coun
t
ZnO Treatment (mg Kg-1)
Cocoons
Juveniles***
**
**
***
388
Table of Contentsfor this manuscript

TOWARDS THE DEVELOPMENT OF AN AUSTRALIAN HUMAN-HEALTH SCREENING CRITERIA FOR TCE IN GROUNDWATER
Anand P. Chandra1, Robert P. DeMott2
1Ramboll Australia Pty Ltd, PO Box 560, North Sydney, NSW 2060, AUSTRALIA
2Ramboll US, 10150 Highland Manor Dr., Tampa, FL 33610 USA [email protected]
INTRODUCTION Trichloroethylene (TCE, CAS 79-01-6) is a chlorinated solvent used extensively as a degreaser in metal-fabricating industry. It was manufactured in Australia until the early 1980s, however its current use is dependant entirely on imports. TCE is common in groundwater at chlorinated-solvent contaminated sites around Australia and can persist in the ground depending on groundwater conditions. NEPC (2013) provides groundwater investigation levels (GILs) for screening level (tier 1) risk assessment. GILs relevant for human-health are based on the Australian Drinking Water Guidelines (ADWG 2011) and recreational guidelines (NHMRC 2008). Recreational guideline values (GVs) for chemicals are usually 10-times the GVs specified in ADWG (2011). For TCE, no GV is specified by the ADWG (2011) and therefore no locally relevant GIL is available for screening assessments. In the absence of an Australian GIL, values derived internationally have previously been used. However, in these cases, a challenge is ensuring consistency with the Australian framework. The objective of this paper is to develop a draft TCE GIL that is consistent with ADWG (2011) and determine if formalisation of an Australian TCE GIL is warranted. TOXICITY ASSESSMENT Since ADWG assessment in 1996, TCE has been reclassified from IARC group 3 to group 1, carcinogenic to humans in 2014 (IARC 2014). NPT (2016) has also recently reclassified TCE as known to be a human carcinogen. Reclassifications were due to growing evidence of relationships between TCE exposure and development of cancers both in human and animal studies. TCE effects can occur through threshold-dependent mechanisms and cancer dose-response modelling was determined by some agencies be insufficiently conclusive to exclude the default, non-threshold assumption (IARC 2014; NTP 2016). EXPOSURE ASSESSMENT TCE volatilises readily from contaminated drinking water and therefore inhalation can be a substantial route of exposure during showering (NTP 2016). TCE volatilisation from contaminated tap water can increase bath air concentration by >160% in <30 mins (ATSDR 2014). Furthermore, dermal intake while showering and bathing also contributes approximately equally towards total TCE intake, including oral ingestion and inhalation (Weisel and Jo 1996). Health Canada (2005) considered that multi-route exposures were present for TCE-contaminated drinking water and derived equivalent exposure amounts of 1.7 L water per day to account for inhalation and 0.7 L water per day to account from dermal adsorption while bathing and showering. INTERNATIONAL GUIDELINES The ADWG (2011) provides a hierarchical list of international guidance documents to be consulted for contaminants that do not have an Australian GV. This list along with GVs and reference values are provided in Table 1. The WHO GV is provisional and does not incorporate multi-route exposure, as allowed by Health Canada and California EPA GVs. The 4 L/d intake rate used by Health Canada (2005) includes 1.5 L/d for oral ingestion, 1.7 L/d for inhalation and 0.7 for dermal contact. Health Canada (2005) adopted the lower of the threshold and non-threshold calculated value. The USEPA has historically used an enacted standard based on older achievable LOR considerations and more recently established risk-based GVs (termed Regional Screening Levels, RSL) using newer toxicity values.
T24d
Copyright © CRC CARE Pty. Ltd., 2019
CleanUp Conference 2019Adelaide, Australia
8 –12 September 2019389
Table of Contentsfor this manuscript

Table 1: International drinking water guidelines and reference values for TCE
Organisation Drinking water GV (µg/L)
Threshold (TDI – µg/kg-d)
Cancer (CSF (µg/kg-day) -1) Other factors
WHO (2017) 20* 1.46 - 50% of TDI, 60 kg, UF100, 2 L/d
NZ MoH (2018) 20* - - Adopted WHO GV Health Canada (2005) 5 1.46 8.11 x 10⁻⁷ 20% of TDI, 70 kg
adult, UF – 100, 4 L/d USEPA (2019 RSL table – 0.49 ug/L) 0.5 0.5** 4.6 x 10⁻⁵** Based on LOR
California EPA (2009) 1.7 500 5.9 x 10⁻⁶ 20% of TDI, 70 kg,
UF100, 7.1 L/d *provisional value. **value from USEPA IRIS database calculated 2011. TDI = tolerable daily intake. CSF = cancer slope factor. UF = uncertainty factor for intraspecies & interspecies variability. LOR = limit-of-reporting
DRAFT GIL A draft GIL for chronic exposure to TCE in groundwater (and surface waters) was derived using toxicity reference values from USEPA (IRIS; used most recent data) and approach used by ADWG (2011). Given the volatility and lipid solubility of TCE a multi-route exposure is considered appropriate for Australian conditions. The 4.4 L/d intake used below includes intake via ingestion (2 L/day) + inhalation (1.7 L/d) + dermal absorption (0.7 L/d).
Non-threshold approach 0.3 µg/L 70 kg body weight 10 excess lifetime risk4.4 L/d 4.6 10 µg/kg day CSF Threshold approach 0.8 µg/L 0.5 g/kg day 70 kg body weight 0.1 % from drinking water4.4 L/d
CONCLUSION The draft GIL was calculated for the protection of non-threshold effects (0.3 µg/L) and for non-cancer threshold effects (0.8 µg/L). The non-threshold value is lower than the USEPA RSL due to the use of specific intake amounts for inhalation and dermal exposures. The non-threshold value is the lowest GV and reflects the latest toxicological data, therefore a revision of current ADWG for TCE may be considered. The use of such a low GV may be complicated by limits on achievable LOR and the Health Canada value, which is the source furthest up the specified hierarchy that incorporates updated toxicity information may be the practical interim value. Site investigations should aim to lower LOR to better define risks during screening assessments for this carcinogenic contaminant. REFERENCES ADWG (2011) Australian Drinking Water Guidelines 6 National Water Quality Management
Strategy. Commonwealth of Australia, Canberra. Updated August 2018. ATSDR (2014) Draft toxicological profile for trichloroethylene. U.S. Department of Health and
Human Services. Public Health Service. Health Canada (2005) Guidelines for Canadian Drinking Water Quality: Supporting
Documentation — Trichloroethylene. Water Quality and Health Bureau, Ottawa, Ontario IARC (2014) IARC monographs on the evaluation of carcinogenic risks to humans. Volume 6
International Agency for Research on Cancer, WHO. Lyon, France. NTP (2016) Report on Carcinogens, Fourteenth Edition. National Toxicology Program.
Research Triangle Park, NC: U.S. Department of Health and Human Services. NZ Ministry of Health (2018) Drinking-water Standards for New Zealand 2005 (revised 2018) USEPA 2019. Regional Screening Level Tables (10-6, HQ=1) for Drinking Water. Weisel CP, Jo WK. 1996. Ingestion, inhalation, and dermal exposures to chloroform and
trichloroethene from tap water. Environ Health Perspect 104(1): 48-51 WHO (2017) Guidelines for drinking-water quality: fourth edition incorporating the first
addendum. Geneva: World Health Organization; 2017. Licence: CC BY-NC-SA 3.0 IGO
390
Table of Contentsfor this manuscript

AUSTRALIA’S RISK-BASED APPROACH
Joytishna Jit1,2, Bruce Kennedy1, Ravi Naidu1,3
1 Cooperative Research Centre for Contamination Assessment and Remediation of the Environment (CRC CARE), Newcastle NSW 2308, AUSTRALIA
2Future Industries Institute, University of South Australia, Adelaide, SA 5095, AUSTRALIA 3Global Centre for Environmental Remediation (GCER), University of Newcastle, Newcastle
NSW 2308, AUSTRALIA [email protected]
INTRODUCTION Legislation and policies should ensure that risk assessments are undertaken as necessary to protect human and environmental health, and that appropriate action is undertaken to mitigate the issues. These allow decision-makers to undertake risk-based decisions which minimise environmental and public health implications and to promote economic development and social wellbeing. Australia has a national legislative instrument for the assessment of site contamination – the National Environment Protection (Assessment of Site Contamination) Measure 2013 (NEPM) (NEPC, 2013). The National Remediation Framework (NRF) being developed by the Cooperative Research Centre for Contamination Assessment and Remediation of the Environment (CRC CARE) will complement the NEPM. Combined, the NEPM and NRF provide a nationally consistent risk-based approach for remediation and management of contaminated sites. This paper will focus on one of Australia’s risk-based approach. The use of concentration-based criteria provides a widely accepted and objective basis to determine whether the remediation has achieved the objective of protecting relevant environmental values. In accordance with NEPM 1999, three options for determining concentration-based criteria or other acceptable conditions can be considered:
• Tier 1 criteria - Generic screening levels, if they are relevant for the site, and the environmental setting of the site. These are concentration-based;
• Tier 2 site-specific risk-based criteria. These are concentration-based; • Tier 3 approaches; and • International criteria may be considered if applicable to the site-specific exposure
setting (e.g. in the absence of Tier 1-3 criteria) in specific circumstances and where agreed with the relevant regulator.
The tiered approach is intended to ‘provide a process for addressing site contamination methodically, with the level of complexity and cost proportional to the significance of the risk’ (ASC NEPM Sch B4, p14). The NRF builds on the risk assessment approach in the context of remediation (CRCCARE 2019). In particular, remediation objectives for a site provide a clear indication of what remediation needs to achieve:
• To address unacceptable risks to environmental values from contamination; and • For the remediation to be considered complete.
The remediation objectives are generally stated in qualitative terms (restoration of a particular land use or use of groundwater for non-potable purposes, for example) and may be aspirational targets. They typically include specific and measurable end-points for each stage of the remediation activity, which serve as practical targets to be achieved by the remedial activities and, when met, signify the end of these activities. Together these endpoints must be sufficient to achieve the remediation objectives. The remediation objectives need to incorporate the primary intention that unacceptable risks to environmental values both on-site and off-site (as well as residual risks) will be eliminated or controlled.
T24e
Copyright © CRC CARE Pty. Ltd., 2019
CleanUp Conference 2019Adelaide, Australia
8 –12 September 2019391
Table of Contentsfor this manuscript

When setting remedial objectives, stakeholders are encouraged to consider wider environmental principles such as the precautionary approach, prevention, proportionality principle, options/ waste hierarchy, risk management and sustainability. REFERENCES CRCCARE 2019 National Remediation Framework, CRC for Contamination Assessment and
Remediation of the Environment, Adelaide, Australia. Available: https://www.crccare.com/knowledge-sharing/national-remediation-framework
NEPC 2013. National Environmental Protection (Assessment of Site Contamination) Amendment Measure 2013 (No. 1). National Environment Protection Council, April 2013.
392
Table of Contentsfor this manuscript

APPLICATION OF RAPID RISK ASSESSMENT TO DRIVE INTERIM CLEAN-UP FOR ABANDONED MINE SITES
Christian Wallis1, John Frangos1, Hannah Mikkonen1, Russell Merz2, Antti Mikkonen1
1CDM Smith, 1/30 Wangaratta Street, Richmond. VIC 3121, AUSTRALIA 2CDM Smith, 4/51 Alfred Street, Fortitude Valley. QLD 4006, AUSTRALIA
INTRODUCTION Mining has historically provided immense value to the Australian economy through the extraction of our vast resources from largely dry, hot and remote locations. The unfortunate results of this scale of extraction are legacy/abandoned mine sites. The Australian Institute report estimated there to be over 60,000 of these across Australia (ABC, 2017). Acid rock issues are commonly identified at abandoned mines. The materials once disturbed can oxidise and generate acid and metalliferous drainage (AMD). The AMD can then adversely impact on vegetation along drainage lines of site catchment(s). The contaminated drainage can cause low pH levels (acidic conditions) and elevated metal concentrations in the waterways downstream of the site; noting that the ambient water quality conditions can also be influenced by the geogenic attributes of the region. To increase the rigor and oversight of remediation works, environmental auditors can be appointed to review and oversee the process and sign off on agreed clean-up objectives. This presentation focuses on the application of rapid risk assessment for abandoned mine sites for evaluating the potential for acute risks to offsite surface water ecosystems, and thereby drive more timely and focused clean-up actions. REFERENCES ABC (2017). Mining report finds 60,000 abandoned sites, lack of rehabilitation and unreliable
data. https://www.abc.net.au/news/2017-02-15/australia-institute-report-raises-concerns-on-mine-rehab/8270558
ASC NEPM (1999). National Environment Protection (Assessment of Site Contamination) Measure 1999 (refer section 1 of the Measure http://www.comlaw.gov.au/Details/F2013 C00288).
T24f
Copyright © CRC CARE Pty. Ltd., 2019
CleanUp Conference 2019Adelaide, Australia
8 –12 September 2019393
Table of Contentsfor this manuscript

ASSESSMENT AND SELECTION OF VARIOUS TECHNICAL GRADES ZERO VALENT IRONS FOR REMEDIATION OF
CHLORINATED ETHENES FOR VALIDATING THE EFFICACY OF RHEINE SITE PERMEABLE REACTIVE BARRIER, GERMANY
Volker Birke1, Rahul Singh2, Lothar Vigelahn3, Sumedha Chakma2, Christine Schuett4,
Harald Burmeier5 1 Mechanical Engineering / Process Engineering and Environmental Engineering,
Hochschule Wismar – University of Applied Sciences, Technology, Business and Deign Philipp-Müller-Str. 14, 23966 Wismar, GERMANY
2Department of Civil Engineering, Indian Institute of Technology (IIT) Delhi, Hauz Khas, New Delhi – 110016, INDIA
3German Federal Environmental Agency, Wörlitzer Platz 1, 06844 Dessau-Roßlau, GERMANY
4Ostfalia University of Applied Sciences, Braunschweig, Wolfenbuettel, GERMANY 5University of Lueneburg, Suderburg, GERMANY
[email protected], Rahul.Singh, [email protected], [email protected]
INTRODUCTION Permeable Reactive Barriers (PRBs) loaded with Zero Valent Iron (ZVI) reactive material have been applied at many contaminated sites for remediating groundwater contaminated by chlorinated volatile organic compounds (cVOCs) and/or certain heavy metals. Most of the applied ZVIs brands and production batches are of technical grades, especially regarding PRBs, which, very often, are made from scrap metals of different origins and compositions. Therefore, their reactivity regarding the reductive potential of cVOCs in groundwater can vary significantly. In this study, long term efficiency of various technical ZVI brands, i.e. Iron Sponge and Gotthart-Maier Iron Powder (GGG) and its mixture with fine and coarse gravels, has been analysed for the reductive dechlorination of cVOCs from the artificially produced and original groundwater from the contaminated site of Rheine, Germany. Thirteen large scale column experiments, of similar shape and size, were carried out under the effect of dynamic flow conditions in order to study the efficacy of Rheine PRB, with different ZVI brands as the reactive material, considering the effect of various operational parameters such as pore volume, retention time and spatial distribution of contaminant plume in the column. The experiments were conducted with both artificially produced and originally collected groundwater from the site of cleaning wall in Rheine PRB site in Germany what was erected as a pilot scale Continuous Reactive Barrier (CRB) in 1998. All the column tests ran at a constant flow rate that is about 2.5 times more compared to the actual groundwater velocity in the field in order to create a homogeneous and meaningful flow situation. RESULTS AND DISCUSSIONS / CONCLUSIONS The results showed that there was no significant difference in reactivity at different production batches of the same iron brands, however, the reactivity varied significantly with the different ZVI used in the dehalogenation process. GGG is clearly, even in dilution with coarse gravel, superior to Iron Sponge during lab experiments, however, in Rheine site, iron sponge showed better results than the GGG ZVI. Further, the results showed that the degradation of tetrachloroethene (PCE) led to the significant increase of trichloroethene (TCE) and cis-dichloroethene (cis-DCE) in the intermediate process. The degradation of PCE was higher at lower pore volume, whereas, most of the intermediate chlorinated compounds form at high pore volume during the column experiment. Furthermore, in columns without PCE-loadings, no development of hydrocarbons could be detected, however, shortly after exposure to PCE, significantly slowed PCE degradation was observed. It clearly shows that cVOCs do not form from the irons and iron loses solely by the anaerobic corrosion with non-contaminated groundwater of reactivity.
T25a
Copyright © CRC CARE Pty. Ltd., 2019
CleanUp Conference 2019Adelaide, Australia8 –12 September 2019 394
Table of Contentsfor this manuscript

Fig 1. Schematic diagram of column experiment setup in laboratory.
Fig 2. Significant improvement in PCE degradation with time is reported with both the ZVI material (a) Iron Sponge, and (b) Gotthart Maier at lower pore volume (V/V0) compare to the higher pore volume. However, Gotthart Maier shows early and better degradation at all pore volumes compared to Iron sponge at the lab scale experiments. REFERENCES Naidu, R. and Birke, V. (2014). Permeable Reactive Barrier: Sustainable Groundwater
Remediation, CRC Press, Boca Raton, U.S.A., 333 p. ISBN 9781482224474.
395
Table of Contentsfor this manuscript

ZVI HORIZONTAL PERMEABLE REACTIVE BARRIERS FOR THE TREATMENT OF CHLORINATED SOLVENTS VAPORS
Daniela Zingaretti, Iason Verginelli, Renato Baciocchi
University of Rome Tor Vergata, Rome, ITALY
INTRODUCTION The intrusion of vapors from the subsurface to overlying buildings is one of the major concerns for human health of residents at sites contaminated by chlorinated solvents. Due to their massive use in industry, chlorinated compounds such as Tetrachloroethylene (PCE) or Trichloroethylene (TCE) are widely present in urban settings. Besides, because of the low biodegradability of these compounds that makes natural attenuation in most cases not significant, even relatively low contamination by chlorinated solvents in the subsurface can pose potential long-term risks for human health, especially related to the vapour intrusion pathway or more in general to inhalation of vapors. Over recent years, a vapor mitigation system was proposed, that involves the use of solid potassium permanganate to create a horizontal permeable reactive barrier (HPRB) aimed at treating upward volatile organic compounds (VOCs). One of the possible drawbacks related to the use of soluble oxidants such potassium permanganate, is the progressive dissolution and leaching of the reactive material by infiltrating water that can lead to a depletion of the barrier and consequently to possible subsidence issues (Verginelli et al., 2017). This issue can be overcome using a less soluble reactive material. For instance, the use of zero-valent iron as a fillermaterial of HPRBs can represent an attractive alternative from both the leaching behavior and reactivity point of view. In this work , we report the results of some experimental tests aimed at assessing the feasibility of using granular iron to treat TCE vapors as filling material of HPRB. In particular, the reduction of TCE in gas phase by different types of zero-valent iron was examined in anaerobic batch systems performed at room temperature. Concentrations of TCE and byproducts were determined at discrete time intervals by analysis of the headspace vapors (Zingaretti et al., 2019). METHODS Three types of iron powder called Ferblast MT, Ferelet MT and Ferelet RI, obtained with different manufacturing processes, were used. The iron Ferblast MT and Ferelet MT were attained by water atomization and sieving and is characterized by a controlled content of oxides, S and C. The iron Ferelet RI is similar to Ferelet MT but with added processing of annealing (H2 furnace) to reduce the content of oxides. For the iron powders MT, two different particle size were used: iron powder with particle size lower than 850 μm (Ferblast MT 850) and lower than 425 μm (Ferelet MT 425). For the Ferelet RI, an iron powder with particle size lower than 425 μm (Ferelet RI 425) was used. To obtain an oxide-free Fe0 surface, in one set of experiments the Ferelet MT 425 was preliminarily washed with HCl 0.1 M for 30 min, then rinsed with N2-purged water and dried in a N2 atmosphere. TCE (99 + %) used in the experiments was purchased from Sigma-Aldrich. The four type of iron powders (Ferblast MT 850, Ferelet MT 425, Ferelet RI 425, FereletMT 425-HCl) used in this study were characterized in order to investigate the microstructure, the specific surface area, and the reactivity by H2-TPR. All TCE removal experiments were carried out at room temperature (20±2 °C) in 20 mL transparent glass. Before each test, 1 g of Fe0 was put inside the vial. Then the vials were purged for few minutes with N2 to promote an anaerobic environment. The establishment of an anaerobic environment was aimed at avoiding oxygen dissolution from the headspace of the vial that could promote the formation of a corrosion by-product layer, thus limiting the mass transfer of TCE to the Fe0 surface and potentially reducing the TCE degradation rate. To wet the granular iron placed in the vial, 100 μL of distilled water were added with a syringe, to ensure a moisture content of 10% by weight. Some
T25b
Copyright © CRC CARE Pty. Ltd., 2019
CleanUp Conference 2019Adelaide, Australia8 –12 September 2019 396
Table of Contentsfor this manuscript

experiments were also performed using 500 μL of distilled water (50% by weight) to evaluate the effects of the water content on the reaction. Then, 5 μL of pure TCE was injectedwith a glass syringe into 1mL glass tubes previously placed on the bottom of the vial to avoid a direct contact of the pure TCE with Fe0 and immediately after the vials were sealed with Teflon-faced butyl septa and aluminum caps. 5 μL of TCE (approximately 7.3 mg considering a density of the TCE equal to 1.46 mg/μL) in 20 mL vials correspond to a concentration in the gas phase of approximately 365 mg/L-air, i.e. slightly lower than the saturation concentration of TCE in the gas phase. For each experiment, different batches were prepared to evaluate the TCE removal by Fe0 after 8, 21 and 42 days. For each time interval, control experiments were also performed without Fe0 to evaluate the leakage of TCE over the course of the experiments. All the experiments were carried out in duplicate. The concentration of TCE was measured in the headspace of the reactors by gas chromatography (GC) with a flame ionization detector (FID). The identification of TCE degradation byproducts detected in the GCFID chromatograms was performed by carrying out GC–MS analysis on selected samples, using the same GC-FID settings. RESULTS AND DISCUSSION Depending on the type of iron used, a reduction of TCE gas concentration from 30% up to 99% was observed for 6 weeks treatments. In line with other experimental studies performed with aqueous solution, we found that the particle size plays a key role in the reactivity of the iron. Namely, an increase of the TCE removal up to almost 3 times was found using iron powders with particle size lower than 425 μm compared to the results obtained using iron powders with particle size lower than 850 μm. The manufacturing process of the iron powder was instead found to play only a limited role. Namely, no significant differences were observed in the TCE reduction by zero-valent iron obtained using an iron powder attained by water atomization and sieving compared to the removal achieved using an iron powder subjected to a further annealing processes to reduce the content of oxides. The pretreatment of the iron powder with HCl was found to enhance the reactivity of the iron. In particular, by washing the iron powder of 425 μm with HCl 0.1 M the reduction of TCE after 6 weeks of treatment was found to increase from approximately 85% for the as received material to N99% for the pretreated iron powder. In all the experiments, the main byproducts of the reactions were C4–C6 alkenes and alkanes which can be attributed to a hydrogenation of the C-Cl bond. CONCLUSIONS Overall, these results, although preliminary, showed that the realization of horizontal permeable barriers containing granular zero-valent iron as a filler material represent an attractive option for the treatment of TCE vapors from contaminated soils and groundwater. Certainly, for a proper evaluation of the effective feasibility of using Fe0 in HPRBs, future efforts should be made to evaluate the long-term performance expected in the field. REFERENCES Verginelli, I., Capobianco, O., Hartog, N., Baciocchi, R., 2017. Analytical model for the design
of in situ horizontal permeable reactive barriers (HPRBs) for the mitigation of chlorinated solvent vapors in the unsaturated zone. J. Contam. Hydrol. 197, 50–61.
Zingaretti D., Verginelli I., Baciocchi R., Dehalogenation of trichloroethylene vapors by partially saturated zero-valent iron. Sci. total Environ 647, 682-689, 2019.
397
Table of Contentsfor this manuscript
PERFORMANCE OF A ZVI-BASED PERMEABLE REACTIVE BARRIER FOR ABIOTIC DEGRADATION OF
CHLORINATED HYDROCARBONS IN GROUNDWATER
Andrew Gray1, Andrew Hunt1, Akke Ward1, Dana Windle1, Darren Reedy1, Camillo Coladonato2
1ERM, Level 6, 99 King Street, Melbourne, VIC 3000, AUSTRALIA 2Dow Chemical (Australia) Pty Ltd, 541–583 Kororoit Creek Road,
Altona, VIC 3018 AUSTRALIA [email protected]
INTRODUCTION A field-scale, permeable reactive barrier (PRB) was designed and constructed at an operating chemical manufacturing plant (Site) in Victoria. The reactive media in the PRB is zero valent iron (ZVI). This paper presents the operational performance of the PRB, including contaminant degradation, by-product production, and reduction in mass flux across the PRB. BACKGROUND AND OBJECTIVES Groundwater at the Site has been impacted with chlorinated volatile organic compounds (CVOCs), including chloroethanes, chlorethenes and chloromethanes. The concentrations of total dissolved VOCs in groundwater range from 100-200 mg/L. The groundwater plume is present within fractured basalt, which presents a challenging media for remediation. A field-scale, ZVI-based PRB was constructed in late-2017 and early-2018, and has been fully operational since March 2019. The objective of the PRB is to reduce VOC concentrations by one order of magnitude (90%) as the groundwater flows through the PRB. PRB DESIGN The PRB treatment zone was constructed using blend of 80% zero valent iron by weight, and 20% clean sand. Based on the volume of the PRB, 392 tonnes of ZVI and 98 tonnes of sand were blended and placed in the PRB. The PRB trench is oriented approximately perpendicular to groundwater flow along the southern (down-gradient) boundary of the site. The PRB measures 10 metres long and 22 metres deep, with a nominal width of 1 metre. The design width was based on the reaction time required for the most recalcitrant compounds to have sufficient residence time to react with the ZVI. The depth of the PRB was based on the aquifer thickness, and the need to remediate the full thickness of the aquifer, with a focus on the deeper groundwater that has not been affected by the operating enhanced in situ bioremediation (EISB) system at the site. PRB PERFORMANCE CVOC Concentrations across the PRB Dissolved phase CVOCs have been analysed as part of routine groundwater monitoring, including collection of groundwater samples from wells located up-gradient, within, and down-gradient of the PRB. Based on the sampling and analytical results, CVOC concentrations within the PRB are consistently lower than concentrations both up- and down-gradient of the PRB. Specifically, concentrations of 1,1,2,2-TeCA, PCE, 1,1,2-TCA, TCE, cis-1,2-DCE and trans-1,2-DCE have been low to non-detect within the PRB, suggesting that these compounds are undergoing reductive dechlorination in the presence of the ZVI. This dechlorination is occurring throughout the full thickness of the PRB, as shown in Figure 1.
T25c
Copyright © CRC CARE Pty. Ltd., 2019
CleanUp Conference 2019Adelaide, Australia8 –12 September 2019 398
Table of Contentsfor this manuscript

Fig. 1. Total CVOC Concentrations across the PRB.
Selected compounds, including 1,2-DCA and 1,1-DCE, are minimally affected by the ZVI within the PRB. This is consistent with previous studies which have calculated longer half-lives for these compounds, and is supported by the data. CVOC Concentrations Down-Gradient of the PRB A key measure of overall PRB performance is the decrease in total CVOC mass down-gradient of the PRB. Figure 2 below presents the changes in total mass of the nine primary CVOCs in the six down-gradient wells during five groundwater monitoring events (GMEs) performed during the first year of PRB operation.
Fig. 2. VOC Concentrations Down-Gradient of PRB.
The concentrations of total VOCs down-gradient of the PRB, as measured in the PRB_9 and PRB_10 wells, are decreasing over time, particularly in the deeper B and C zones. This, combined with other groundwater composition data, indicates that the treated water within the PRB is migrating down-gradient (south) from the PRB, and that groundwater across the full thickness of the water-bearing zone is being treated by the PRB. CONCLUSIONS The field-scale, ZVI-based PRB has been successful at reducing the off-site migration of CVOCs across the full thickness of the aquifer. Specifically, CVOC concentrations and mass flux have been reduced by greater than one order of magnitude.
399
Table of Contentsfor this manuscript

FIELD TRIAL FOR SOIL MIX PERMEABLE REACTIVE BARRIER IN LAND REMEDIATION: EXECUTION AND EARLY AGE MONITORING
Ziyad Abunada1, Abir Al-Tabbaa2
1Central Queensland University, Department of Engineering, AUSTRALIA
2University of Cambridge, Department of Engineering, UK [email protected]
INTRODUCTION Contaminated land remediation using soil mix technology (SMT) is a relatively recent development proved to be a cost effective and versatile system with numerous environmental advantages. SMT generates minimum to no waste materials, reduces off-site disposal, and minimizes the carbon footprint (Al-Tabbaa & Evans 2003). SMT was considered for permeable reactive barrier (PRB) construction for the current study took place at Yorkshire, UK. The current work presents early age monitoring of a real field study through the project SMiRT (Soil Mix Remediation Technology). The main aim of project SMiRT was field validation, testing and assessment to provide stakeholder confidence in SMT and increase its uptake for land remediation. PRB arrangement was such that 6 separate PRB walls were constructed to form a hexagon (Figure 1) with each contains materials of modified calys. Six longer low permeability walls were installed to form an outer larger hexagon to hydraulically isolate the area and separated the 6 PRBs. Each PRB wall was ~ 5.6m long and extended down to 8 m and keyed into the sandstone layer with 0.55 m thickness. The groundwater showed sever organic contamination with chlorobenzene and toluene.
a) b) Figure 1: a) Arrangement of the PRB hexagon, b) schematic represents the hexagon set up with the inner walls representing the PRB (Liska & Al-Tabbaa 2011) METHODS Two sets of PRB assessment were carried out to evaluate the PRB installation. The first was conducted couple of months after the complete installation of the PRB system in July 2011. It included retrieving window samples of 85 mm diameter and 1.0 m long using direct-push coring machine from the different PRB walls. In-situ dynamic probe super heavy (DPSH) testing was performed to investigate the quality of the SMT PRB technology.
Figure 2: Retrieved site cores from within PRB walls a 34months after PRB installation
The test involves fall of 63.5 kg (±0.5 kg) mass with a 50 mm (±0.5 mm) diameter driving head over a length of 760 mm (±20 mm), with the number of blows required for each 100 mm
T25d
Copyright © CRC CARE Pty. Ltd., 2019
CleanUp Conference 2019Adelaide, Australia8 –12 September 2019 400
Table of Contentsfor this manuscript

depth increment recorded as a N100 value (BS1377: Part 9). Second assessment took place 34 months after the PRB installation (2014) and was viewed as a long-term investigation. Following an intensive groundwater pumping through the different PRB walls, window samples were retrieved down to the bed rock layer (~8.0 m) whenever possible. RESULTS AND DISCUSSION
PRB martials contains various synthesized organoclays, inorganoclay and zeolites and were mixed with the site soil through the direct us of triple auger to maintain a soil mix treatment Site cores density was measured in the laboratory in order to account for the homogeneity of the materials mixing. The density of the site cores was calculated by simple mass to volume ratio. A constant volume of ~400 cm3 was extracted from the different core sections. Density results for both samples from 2011 and 2014 cores showed slight to no density variation over time. Figure 3 indicated that no significant density variation over the core lengths down to ~4.0m which may reflect the quality of soil mixing. The core materials showed also minimum density variation over the different candidate materials with average value of 1.68 gcm-3 was noticed. IOB1 has higher density values (1.97gm/cm3). XRD analysis was used to study the mineralogy of core materials at different depths compared to a control core material retrieved from outside the hexagon during the second coring phase in 2014. Results showed the differences in mineralogy between PRB core materials and the control external soil. The diffractogram peak size of the quartz in the control soil at 2θ= 26o degrees showed greater intensity all the time compared with the peaks resulted from the core materials. This suggests the substitution of binder materials to the site soil and assumes the existence of new materials during the mixing of the reactive materials with the site soil (Phillips et al. 2010). However, the peak size was greater for core materials retrieved from lower depths where the quartz peak size was much greater in the case of IOB2 and other materials. In conclusion, the SMT proved valid technique for PRB construction and provided sufficient treatment for the contaminated groundwater. REFERENCES Al-Tabbaa, A. and Evans, C.W., 2003. Deep Soil Mixing in the UK: Geoenvironmental
Research and Recent Applications. Journal of Land Contaminated and Reclamation, 11(1), pp.1–14.
Phillips, D.H., Van Nooten, T., Bastiaens, L., Russell, M.I., Dickson, K., Plant, S., Ahad, J.M.E., Newton, T., Elliot, T. and Kalin, R.M., 2010. Ten Year Performance Evaluation of a Field-Scale Zero-Valent Iron Permeable Reactive Barrier Installed to Remediate Trichloroethene Contaminated Groundwater. Environmental science & technology, 44(10), pp.3861–9.
Figure 3: density profile for core materials retrieved from with PRB walls a) couple of months and b) three years after PRB installation
401
Table of Contentsfor this manuscript

ISOTOPIC ANALYSIS TO DIFFERENTIATE GROUND-GAS SOURCES ON A CONTAMINATED SITE
Nicholas Grbich
EI Australia, Suite 6.01, 55 Miller Street, Pyrmont NSW, Sydney, 2021, AUSTRALIA
INTRODUCTION Ground gas was identified on a site in Sydney within the Parramatta River catchment area at levels of 85% v/v and flow rates of up to 20 l/h. The NSW EPA Ground Gas Guidelines (EPA 2012) defines this as a Characteristic Gas Situation (CS) of CS5 (the highest level being CS6), requiring protections to be employed for any development on the land. The study of how geochemical processes affect the distribution of isotopes in methane is a mature field in the energy sector and the academic fields of hydrology and paleoclimatology. In contaminated land assessment, we typically look at gas composition alone; however, in this investigation, the use of isotopic data provided greater resolution for determination of the origin and age of the gas. Based on the preliminary conceptual site model (CSM), the existing data, the close proximity of potential sources, and the investigation options, methane isotopic composition, including carbon (12C, 13C and 14C) and hydrogen (protium and deuterium), was used to determine the age and origin of gas in order to differentiate between petroleum impacted fill soils, natural alluvial sediments, and landfill sources. METHODS Ground gas and groundwater was sampled from two available and pre-existing ground gas monitoring wells located along the southern boundary of the site. For isotopic analysis, ground gas and groundwater was sampled using proprietary gas sampling bags (IsoBags) and groundwater sample containers (IsoFlask) and analysed by IsoTech Laboratories, Champaign, Illinois USA. Laboratory analysis Ground gas and dissolved gasses in groundwater were analysed for:
• Mass spectrometry determination of δ13C of CH4 and δD of CH4; and • 14C in CH4 by accelerator mass spectrometry (AMS).
RESULTS AND DISCUSSION Stable Methane Isotope Fingerprinting Results from isotope testing were plotted onto a Scholl/Whitticar plot (Whitticar 1999) shown on Fig.1. below to demonstrate different regions of isotopic fractionation to assist in source determination. Results in the dissolved phase and gas phase from both sampled locations (LGW1 and LGW6) were similar, indicating that both gas and groundwater phases of methane are likely from the same source. The slight variation in each locations isotopic ratio can be explained by the kinetic isotope effect (KIE), in that, release of methane from dissolved phase into the gaseous phase occurs preferentially to lighter isotopes.
T26b
Copyright © CRC CARE Pty. Ltd., 2019
CleanUp Conference 2019Adelaide, Australia8 –12 September 2019 402
Table of Contentsfor this manuscript

Fig. 1. Stable methane isotope fingerprinting results.
Methane Carbon-14 Dating Methane in the gaseous and dissolved phase was tested for the unstable isotope 14C in methane. The results are summarised in Table 1 below. Carbon dating of gasses suggested a younger substrate to be the source of methane. The half-life of 14C is 5,720 years. A substrate that consists of petroleum hydrocarbons would therefore present a methane sample that was depleted in 14C as petroleum hydrocarbons are manufactured from organic material deposited millions of years ago. By using the percent of modern carbon (pMC) from Table 1 and a half-life of 5,720 years, the methane source is calculated to have a theoretical maximum age of between 420 and 470 years old. This age range assumes no mixing with other methane sources. Above ground testing of nuclear devices in the 1950s and 1960s has resulted in organic material grown post 1960 with a 14C signature above 100% pMC (Grimm 2008). Table 1. Stable isotope fingerprinting of methane and unstable isotope concentrations.
Sample ID δ13C (‰)
δDC1 (‰)
14C1 (pMC)
LGW-1 (Gas) -63.3 -269.2 95.1 LGW-1 (Dissolved) -60.86 -269.3 94.5
LGW-6 (Gas) -64.25 -234.9 - LGW-6 (Dissolved) -63.12 -241.8 -
CONCLUSIONS Results of stable isotopic fingerprinting proved inconclusive as they did not clearly lie within any of the predefined gas source zones. Unstable isotope results were sufficient to eliminate the landfill and petroleum hydrocarbons as sources of the measured ground gas. Further investigation is required to target and validate the in-situ natural soils as the probable source. The use of isotopic analysis provided a valuable tool in directing the next step of site investigations and thus in refining the CSM. REFERENCES Grimm, D. (2008). The Mushroom Cloud’s Silver Lining. Science 321(5895), pp. 1434--1437. NSW EPA (2012). Guidelines for the Assessment and Management of Sites Impacted by
Hazardous Ground Gases. Whiticar, M.J. (1999). Carbon and hydrogen isotope systematics of bacterial formation and
oxidation of methane. Chemical Geology 161(1-3), pp.291--314.
403
Table of Contentsfor this manuscript

REDEVELOPING LANDFILL POTENTIALLY IMPACTED BY MIXED CONTAMINATION, ACACIA RIDGE, BRISBANE
Emma Cornish, Andrew Howes, Greg Whitmore
Golder Associates Pty Ltd, PO Box 1734, Milton, Brisbane, QLD 4064, AUSTRALIA
INTRODUCTION Golder was engaged to undertake a contamination assessment of a former quarry and landfill over approximately 8 hectares at Acacia Ridge, Brisbane, Queensland (the site). The land is included on the Queensland Department of Environment and Science Environmental Management Register (EMR) for the notifiable activity “disposing of waste excluding inert construction and demolition waste”. Management of contamination issues have historically been addressed by a Site Management Plan (SMP) that has been in effect since 2013. The current contamination assessment was required to support redevelopment and subdivision of the site for commercial and industrial land use by future owners. The site is currently vacant, lies within an industrial precinct, and is adjacent to a green corridor along Oxley Creek. Historical activities on the site and adjacent areas has resulted in several potential contamination sources. This project highlights the contamination assessment undertaken to facilitate redevelopment of landfill potentially impacted by mixed contamination. METHODS The overall objective for this project was to assess the extent of potential contamination in soil, ground gas, groundwater and surface water across the site and potentially migrating off site. Investigation of the site was completed in 2018 and 2019 using the guidance in NEPM (2013) and the PFAS NEMP (2018). Potential sources of contamination include imported fill, putrescible waste, demolition waste, imported and naturally occurring acid sulfate soil (ASS), potentially contaminated sediments in former drains, and impacts from offsite activities within the adjacent industrial properties including bitumen deposits, a speedway track and an airport. Previous assessment of the site by third parties was supported by detailed site investigation including analytical testing of 380 soil samples collected from fill material, natural soils and material stockpiled on site. A network of 11 groundwater and 11 gas monitoring wells were installed for multiple rounds of monitoring. Surface water sampling and analysis was also undertaken from 6 ponds adjacent to the site and from 6 locations along Oxley Creek. RESULTS AND DISCUSSION The subsurface conditions at the site comprised 2 m to 6 m of variable fill materials overlying natural river deposits. The fill material included construction and demolition waste with abundant concrete, bricks, wood, steel and some plastic. The upper 2 m of fill has been removed, made geotechnically suitable through sorting and sieving, and replaced and compacted under supervision. Clean corridors were also created for installation of underground services. The site investigation identified relatively limited soil contamination. However, fibrous asbestos and asbestos fines were identified and remediated. In addition, ground gas monitoring measured high concentrations of methane and carbon dioxide in conjunction with depleted oxygen and negligible flow rates. Gas protection measures were identified for construction of commercial buildings based on a semi-qualitative risk assessment. The conceptual site model (Figure 1) and results from groundwater and surface water monitoring suggest that elevated nutrients, metals and PFAS in groundwater is migrating offsite, but is not connected to Oxley Creek. Groundwater modelling also supports this
T26c
Copyright © CRC CARE Pty. Ltd., 2019
CleanUp Conference 2019Adelaide, Australia8 –12 September 2019 404
Table of Contentsfor this manuscript

finding with concentrations of contaminants of potential concern below the adopted screening values at a compliance point 100 m down hydraulic gradient from the site.
Fig. 1. Schematic Conceptual Site Model.
CONCLUSIONS Investigation and risk assessment of a former landfill has identified that asbestos, ground gas, nutrients, metals and PFAS represent contaminants of potential concern. Reclamation of surface soil has been completed and groundwater modelling has identified that the potential contaminants in soil and groundwater will not present an unacceptable risk to human health or the environment. Based on the available data and subject to a SMP, the site is considered suitable for the proposed commercial land use and construction activities are expected to commence in the near future. REFERENCES NEMP 2018, PFAS National Environment Management Plan. HEPA (Heads of EPA’s
Australia and New Zealand and the Australian Government Department of the Environment and Energy).
NEPM 1999, National Environment Protection (Assessment of Site Contamination) Measure (NEPM), as amended 11 April 2013. NEPC (National Environment Protection Council Australia).
405
Table of Contentsfor this manuscript

INSTALLATION AND VALIDATION OF CRAWL SPACE VENTILATION AND SUB SLAB DEPRESSURIZATION SYSTEMS
FOR MITIGATION OF TCE VAPOUR INTRUSION
David Butterfield1, Rory Lane1, Paul Nicholson2
1BlueSphere Environmental, 438 Goodwood Road, Cumberland Park, 5041, AUSTRALIA 2Geosyntec, 130 Stone Road West, Guelph, ON, N1G3Z2, CANADA
INTRODUCTION The widespread presence of chlorinated solvent, principally Trichloroethene (TCE) contamination across the old industrial areas of Adelaide has recently come very much to the fore, both within the contaminated land consulting industry and for the wider public. Given the age of many of these solvent releases, and dispersed nature of the resulting impacts, it is clear that in many cases traditional remediation / source removal is not a viable option. Consequently, the inclusion of engineered vapour mitigation systems within buildings located over the affected land is often the only viable means of bringing TCE impacted buildings back into productive use. Vapour intrusion can occur when the vapour phase of these volatile chlorinated solvents migrates from a subsurface source into buildings or other structures. The South Australian Environment Protection Authority (SA EPA) conducted indoor air sampling at a private residence in Adelaide, South Australia, due to the potential for TCE vapour intrusion. The maximum indoor air TCE concentration identified by the SA EPA at the property was 100 micrograms per cubic meter (µg/m³) as measured in the front bedroom. The maximum crawlspace TCE concentration was 730 µg/m³ under the living room. BlueSphere Environmental partnering with Geosyntec, was commissioned to mitigate the indoor vapour intrusion risk for this property with the following objectives:
• Design and install a vapour intrusion mitigation system to consistently reduce concentrations of TCE in indoor air to less than 2 μg/m³
• Validate the mitigation system post installation to ensure concentrations of TCE are consistently less than 2 μg/m³
Mitigation works involved the design and installation of a Vapour Mitigation System (VMS) to inhibit the migration of TCE into indoor air from beneath the house. The mitigation system accomplishes this by removing VOCs from the crawl space (i.e., mass flux) and discharging them to the atmosphere above the roof line of the building. During validation sampling, low concentrations of TCE were detected in indoor air at the rear of the property. Analysis of the results indicated that the system was working as designed. However, the concentrations were not responding as expected. Subsequent investigations identified a preferential pathway for vapour intrusion emitting from an old open sump hidden below a cupboard in a portion of the property with a concrete slab floor. A second VMS was installed to draw air from beneath the slab area through the sump by depressurising the subslab area and discharging it above the roof via a secondary electric fan installed in the attic. Experiences in installation and commissioning of the two vapour intrusion mitigation systems (sub-slab ventilation and sub-slab depressurisation) and the methodologies that were utilised to achieve the objectives will be discussed. This will include a summary of installation issues and pitfalls and troubleshooting techniques regarding the previously unidentified sump. The design principles of the system and an illustration of the construction and commissioning process will be explained via a series of photographs taken during the process.
T26d
Copyright © CRC CARE Pty. Ltd., 2019
CleanUp Conference 2019Adelaide, Australia8 –12 September 2019 406
Table of Contentsfor this manuscript

METHODS The VMS system was installed over two property mobilisations, the first consisting of mitigation of the crawlspace areas and the second consisting of mitigation of the sub-slab areas through the existing sump. The sump was not discovered until after installation of the crawlspace mitigation following low level detections of TCE in portions of the indoor air samples following installation of the first fan. The sump was discovered upon removal of a washing machine and associated shelving unit behind the wall of the bathroom. The crawlspace VMS installation consists of a series of pipes installed into the crawlspace of the house that draw air from this space to ventilate it above the roof via an exterior electric fan, while exterior air is drawn into the crawlspace through existing vents. The secondary portion of the system draws air from beneath the slab area through a sump by depressurising the sub slab area and discharges it above the roof via a secondary electric fan installed in the attic. The system operation was verified post installation by multiple methods including:
• Measurement of the air flow velocity and differential pressure in the pipes using a hot wire anemometer and a differential pressure manometer,
• Measurement of the concentration of volatile organic compounds (VOCs) in the exhaust gases using a photoionisation detector; and
• Measurement of the differential pressure between crawlspace/ concrete slab and outdoor air.
• Utilisation of a smoke pen was to observe outdoor air entering the crawl space. Verification of the indoor air post VMS installation involved multiple rounds of sampling utilising both Summa canister and passive Radiello sampling methodologies. RESULTS AND DISCUSSION The sampling rounds conducted following installation of the second extraction system within the slab portion of the house indicated that the two-component system was successfully achieving the target TCE concentrations. The analytical data showed that the reported TCE concentrations were less than the target concentration of 2 µg/m³ throughout the property (for both canister and Radiello samples). CONCLUSIONS The following conclusions were drawn from the installation and validation testing of the VMS:
• Multiple rounds of validation testing via indoor air sampling and laboratory analysis conducted after the second (slab area) vapour extraction system was installed indicated that the VMS was working effectively and meeting the project objectives across both winter and spring/ summer conditions
• Real-time physical validation testing including smoke testing, flow velocity measurements and mass-flux measurements were used to supplement laboratory analytical testing demonstrated effective operation of the VMS
• VMS was demonstrated to be a viable solution to manage sub surface vapour intrusion in existing residential properties.
407
Table of Contentsfor this manuscript

ARE MICROBES FUSSY EATERS WITH SOPHISTICATED PALATES – OR IS THERE A CASE FOR NATURAL SOURCE ZONE DEPLETION
AT DENSE NON-AQUEOUS PHASE LIQUID IMPACTED SITES?
Matthew Russ
GHD Pty Ltd, Contamination Assessment and Remediation Business Group, Level 8, 180 Lonsdale Street, Melbourne, 3000, AUSTRALIA
INTRODUCTION The contaminated land industry and its regulators in Australia and internationally are increasingly looking at the potential for natural source zone depletion (NSZD) to be implemented as a passive long-term management strategy at sites impacted by light non-aqueous phase liquids (LNAPL). However, very little evidence is available to support the applicability of the NSZD of dense non-aqueous phase liquids (DNAPL). Decades of environmental investigations have been undertaken at one particular former gasworks in Victoria, which identified both LNAPL and DNAPL (coal tar) plumes. With the impending changes to the legislative landscape in Victoria, and armed with a network of existing groundwater monitoring wells, an inexpensive and non-invasive preliminary NSZD field screening program was developed to investigate the applicability of NSZD as an approach to the long term management of the former gasworks. METHODS NSZD ‘describes the collective, naturally occurring process of dissolution, volatilization and biodegradation that results in mass losses of LNAPL petroleum hydrocarbon constituents from the subsurface’ (CRC CARE 2018). Typical environmental investigations completed at sites impacted by free phase hydrocarbons investigate and measure the processes of dissolution and volatilisation, and the resulting degradation of products of these processes. However, less commonly investigated is the direct mass loss of free phase product due to biodegradation. The processes of the biodegradation of free phase product includes methanogenesis by microbes, which occurs in both the saturated and unsaturated zone, and an exothermic oxidation reaction of methane (CH4), which occurs due to outgassing of the CH4 and the ingress of atmospheric oxygen (O2 ) within the unsaturated zone. The preliminary field screening program completed at the former gasworks (the ‘site’) was developed to investigate whether the site exhibited subsurface gas expressions that would typically be expressed though methanogenesis and the resulting oxidation reaction. The field methodology adopted was similar to the methodology adopted during the assessment of an LNAPL impacted site in Utah, United States (Sweeney et al 2017). That is, the existing network of groundwater monitoring wells at the former gasworks, which variably screened the capillary fringe and unsaturated zone, were utilised to measure the subsurface gas expression immediately above the DNAPL and LNAPL plumes. RESULTS Concentrations of methane were elevated above the LNAPL and DNAPL plumes. In one particular groundwater monitoring well where DNAPL was reported, CH4 concentrations were recorded at 1.2% (or approximately 12,000 ppm) immediately above the standing water level (SWL). In the same well, O2 concentrations rapidly depleted while carbon dioxide (CO2) concentrations rapidly increased between distinct depth intervals within the unsaturated zone. Gas monitoring completed at groundwater monitoring wells which were impacted by LNAPL also exhibited similar gas expression as those within the DNAPL plume. Using the data collected, a NSZD rate was estimated using the gradient method which uses the O2 flux within the subsurface and the stoichiometric relationship between O2 and the
T26e
Copyright © CRC CARE Pty. Ltd., 2019
CleanUp Conference 2019Adelaide, Australia8 –12 September 2019 408
Table of Contentsfor this manuscript

hydrocarbon mass represented by the biodegradation reaction. The NSZD rate in a groundwater monitoring well impacted by DNAPL was estimate to be 0.2 L of C8H18 per hectare per day. CONCLUSIONS The field program completed represented an inexpensive, non-intrusive preliminary field-screening program that can easily be tailored for other sites impacted by LNAPL and DNAPL, and can be used as a decision tool for the further assessment, remediation and ongoing management of any site. Furthermore, based on the results of the preliminary NSZD field screening program completed at the site, there are lines of evidence to suggest that NSZD is occurring, and moreover, suggest that microbes at the site are not opposed to the consumption of DNAPL. REFERENCES American Petroleum Institute (API), 2017– Qualification of Vapour Phase-related Natural
Source Zone Depletion Processes. Publication 4784 Cooperative Research Center for Contamination Assessment and Remediation of the
Environment (CRC CARE), (2018), Technical measurement guidance for LNAPL natural source zone depletion, CRC CARE Technical Report no. 44. CRC for Contamination Assessment and Remediation of the Environment, Newcastle, Australia
Garg, S., Newell, CJ., Kulkarni, PR., King, DC., Adamson, DT., Irianni Rnno, M. & Sale, T. (2017) Overview of Natural Source Zone Depletion: Processes, Controlling Factors, and Composition Change. Groundwater Monitoring & remediation, vol. 37, iss. 3, pp. 62-81.
Sweeney, R., Ririe, GT. (2017) Small purge method to sample vapour from groundwater monitoring wells screened across the water table. Groundwater Monitoring & remediation, vol. 37, iss. 4.
The Interstate Technology and Regulatory Council (ITRC), (2009) Evaluating Natural Source Zone Depletion at Sites with LNAPL. LNAPL-1. Washington, DC.: Interstate Technology & Regulatory Council, LNAPLs Team
409
Table of Contentsfor this manuscript

A CASE STUDY IN THE TRANSFER OF SITE LEASEHOLDERS AND THE IMPACTS OF CONFLICTING REGULATORY FRAMEWORKS ON
CONTAMINATED SITES INVESTIGATION
Dylan Pritchard
AECOM, Level 6, 3 Forrest Place, Perth 6000, AUSTRALIA [email protected]
INTRODUCTION Prior to the implementation of the Contaminated Sites Act 2003 (WA) (CS Act), contamination at mine sites were managed solely under direction from Ministerial Statements (MS) and advice from the WA Environmental Protection Authority (EPA). The CS Act sought to manage legacy contamination and aimed to complement the pre-existing Environmental Protection Act 1986 (WA). In addition to this, the update of the Mining Act 1978 [amendment 2010] (WA) allowed for the inclusion of mine sites (present and decommissioned) to be classified under the CS Act as contaminated sites to be managed and remediated. As impacted sites are often investigated over several years and in many cases decades, the potential exists for conflicting guidance from governmental correspondence, agreements and/or legislation over time. Firstly, there is uncertainty about what exact contamination exists on certain areas of potential concern (AOPC) under former and current uses. Source-pathway-receptor linkages are defined under current regulatory frameworks that can lead to risks to human and ecological health. Potential pathways of exposure to a contaminant and Tier 1 risk criteria associated with human and ecological health have been defined from the regulator, the former Department of Environmental Regulation (DER, now Department of Water and Environmental Regulation, DWER) and Department of Health (DoH). The regulator can form an opinion about pathways to receptors from contamination sources due to previous investigation however current potential pathways may not be updated to reflect site conditions due to contemporary site use and provides conflicting opinions about contaminated sites’ management. Secondly, uncertainty regarding the responsible party for remediation of contaminated areas at mine sites can arise. Agreements with the EPA, Ministerial Statements, and the CS Act can conflict with one another across different government agencies due to the different objectives of the agency. In some instances, these conflicts particularly in relation to legislated responsibilities defined in CS Act, can conflict with agreements struck during the approvals process. According to the CS Act, liability can lie across several entities but primarily under the “polluter pays” principle. However, there are additional provisions in the CS Act for the current leaseholder to be found liable for any contamination on their lease. Disentangling these conflicts in liability for contamination is essential if remediation of these contaminated sites is to be undertaken effectively. METHODS & OBJECTIVES This project involved undertaking a qualitative risk assessment approach to a case study evaluating actual risks due to known historical contamination and aim to identify all liabilities due to contamination across the site. A desktop study reviewed historical information to identify potentially contaminating historical events and potential issues of liability arising from the transfer of a mine to a new leaseholder. Through the desktop study, an assessment of altered current site conditions aimed to identify plausible pathways that may exist between sources of contamination and receptors such as human and/or ecological health. Approvals provided by the EPA and enacted through Ministerial Statements for the management of that contamination limited the liability of the incoming leaseholder to remediate pre-existing contaminated areas that would be disturbed by proposed mining
T26f
Copyright © CRC CARE Pty. Ltd., 2019
CleanUp Conference 2019Adelaide, Australia8 –12 September 2019 410
Table of Contentsfor this manuscript

activities. The investigation was used to identify potential issues arising from the difference in legal liabilities under the EPA/MS approval process and legislative CS Act requirements. This case study provided an example of where conflicting requirements for contaminated sites in the form of governmental correspondence, agreements and legislation exists over the long history of the site. The paper also examined the ongoing relevance of supporting documents such as DoH guidance in contaminated sites assessment, and then considers the apportioning of responsibility for remediation activities at the site in the current legislative and regulatory landscape for the current leaseholder. FINDINGS This paper found that various supplementary information was not always complementary to one another and how they are interpreted by regulators at DWER when dealing with contaminated sites. One example relates to the use of the DoH “Guidelines for the Assessment, Remediation and Management of Asbestos” which states a minimum of three metres of clean fill over an asbestos-contaminated area could deem the site not contaminated by asbestos with no requirement for a Moratorium on Title (DoH, 2009). However, there have been instances where regulators have not progressed these sites to ‘Decontaminated’ status under the CS Act 2003 but rather ‘Remediated for Restricted Use’ which requires an ongoing management plan as stated in DER 2014 guidance (DER, 2014). Changes at the site due to contemporary mining has also limited direct contact or vapour intrusion risks from volatile contaminants of potential concern (CoPC). Operation of the mine has updated the risk profile of the site at some AOPCs, but these are still listed as potential problems by DWER in their Basic Summary of Records, which summarises contamination issues at the site. This project allowed for an updated understanding of where potential risks arising from contamination may currently exist and can assist regulators assessing the status of the site under the CS Act.
CONCLUSIONS Identifying actual risk posed from contamination at the site proved difficult and did not match the understanding of the site by the regulator. Statements within the CS Act have conflicted with guidance from mining approvals and leads to different understandings of liability of contamination at the case study site. A specific update provided in the form of legislation or guidance from DWER would likely be helpful for future conflicts arising due to contamination from previous leaseholders, excluding current leaseholders from liability. REFERENCES Contaminated Sites Act 2003 (Western Australia) Department of Health (2009) Guidelines for the Assessment, Remediation and Manage-
ment of Asbestos-Contaminated Sites in Western Australia, pp. 24-47. Available from: https://ww2.health.wa.gov.au/~/media/Files/Corporate/general%20documents/Asbestos/PDF/Guidelines-Asbestos-Contaminated%20Sites-May2009.pdf
Department of Water and Environmental Regulation (2014) Assessment and management of contaminated sites, Contaminated sites guidelines, pp.8-69. Available from: https://www.der.wa.gov.au/images/documents/your-environment/contaminated-sites/guide lines/Assessment_and_management_of_contaminated_sites.pdf
Environmental Protection Act 1986 (Western Australia) Mining Act 1978 (Western Australia) [Amended 2010]
411
Table of Contentsfor this manuscript

EXPOSURE PATHWAYS FOR PFASs AND OTHER PERSISTENT CHEMICALS IN BIOTA
Rainer Lohmann
Graduate School of Oceanography, University of Rhode Island Bay Campus,
South Ferry Road, Narragansett, RI 02882, USA [email protected]
INTRODUCTION The presence of organic contaminants in the environment has been of concern due to the potential for ecological and human exposure. Traditionally, there has been a focus on aquatic foodwebs which often possess many trophic levels, leading to strong bioaccumulation and biomagnification for persistent, bioaccumulative and toxic (PBT) compounds. There is ample evidence for the strong biomagnification of several key classes of hydrophobic organic contaminants (HOCs), including PCBs, dioxins/furans and DDTs, resulting in enhanced exposure of top predators, including humans. The more recent focus on per- and polyfluorinated alkyl substances (PFASs) has brought some of the same concerns for legacy compounds, such as PFOS, PFHxS and PFOA. These again show strong bioaccumulation in aquatic foodwebs, leading to their listing or consideration as persistent organic pollutants under the Stockholm Convention. Yet there are important differences for the class of PFASs relative to HOCs. First, as PFASs contain a hydrophilic functional group the compounds are more water-soluble, leading to different exposure pathways from drinking contaminated water to their enrichment in plants. Second, there are polyfluorinated precursor compounds that can be transformed into the persistent perfluorinated compounds, meaning that a wider group of compounds has to be observed and targeted for elimination. METHODS The presentation is based on a review of pertinent literature to identify key studies that demonstrate established and novel exposure pathways for HOCs and legacy and novel PFASs, covering both the aquatic foodweb, but also their enrichment in plants and terrestrial animals. Contrasting PFASs to legacy HOCs helps understand key transfer pathways, and establish current knowledge gaps. RESULTS AND DISCUSSION Advances in environmental sampling tools, in particular passive samplers, has been crucial to better assessing the bioaccumulation and sources of HOCs in the environment. For example, in our work in the Passaic River, we could assess the relative source contributions of sediment, porewater, river water and diet in higher trophic level fish (Khairy et al. 2014). A comparison with PFASs concentrations shows that an organic carbon-based partitioning approach from sediment is a good proxy for correlating their concentrations in top predators (Khairy et al. 2019). Current knowledge would imply that environmental concentrations of black carbon should reduce the in situ availability of PFASs. For air-breathing animals, there is good evidence for an additional exposure pathway to PFOA precursors in the environment (Dassuncao et al. 2017). There might be other precursors that are not yet regularly monitored. A wide range of novel PFAS chemistries has recently been discovered both in the US and Europe, linked to the use of GenX and Nafion production (Strynar et al. 2015; Sun et al. 2016). Several of these structures are likely to be strong bioaccumulative, too. In the terrestrial environment, there are fewer studies available to assess the pathways for the bioaccumulation of PFASs. Key studies showed the potential of PFASs being taken up from contaminated soil and groundwater leading to their accumulation in plants. The more
T31a
Copyright © CRC CARE Pty. Ltd., 2019
CleanUp Conference 2019Adelaide, Australia8 –12 September 2019 412
Table of Contentsfor this manuscript

hydrophilic PFASs are then preferentially translocated in the leaves, with the less hydrophobic ones more prevalent in roots and stems (Blaine et al. 2013; Blaine et al. 2014). More recently has established the transfer of PFASs from contaminated soil into cow’s milk and even into deer. As perfectly stable chemicals, perfluorinated compounds thus manage to be important both dissolved in water and, in land-based plants, animals and in aquatic top predators. CONCLUSIONS The presence of legacy contaminants in aquatic foodwebs continues to pose serious problems to human and ecological health. PFASs not only exacerbate this problem through their accumulation in aquatic foodwebs, but pose additional problems through their contamination of surface and groundwaters and their ensuing presence in edible biota. The presence of both reactive PFAS precursors and the advent of novel PFAS chemistries makes a better assessment of processes and pathways of these chemicals challenging and urgent. REFERENCES Blaine, A.C. et al., 2014. Perfluoroalkyl Acid Distribution in Various Plant Compartments of
Edible Crops Grown in Biosolids-Amended soils. Environ Sci Technol, 48, p.7858−7865. Blaine, A.C. et al., 2013. Uptake of Perfluoroalkyl Acids into Edible Crops via Land Applied
Biosolids: Field and Greenhouse Studies. Environ Sci Technol, 47, p.14062−14069. Dassuncao, C. et al., 2017. Temporal Shifts in Poly- and Perfluoroalkyl Substances (PFASs)
in North Atlantic Pilot Whales Indicate Large Contribution of Atmospheric Precursors. Environ Sci Technol, 51(4512−4521).
Khairy, M.A., Noonan, G.O. & Loh, 2019. Contrasting Uptake and Bioaccumulation of legacy and emerging contaminants in the Aquatic Food Web of the Lower Passaic River: OCPs, PBDEs and PFAAs. Environ. Toxicol. Chem., p.in press.
Khairy, M.A., Weinstein, M.P. & Lohmann, R., 2014. Trophodynamic behavior of hydrophobic organic contaminants in the aquatic food web of a tidal river. Environmental Science and Technology, 48(21).
Strynar, M. et al., 2015. Identification of Novel Perfluoroalkyl Ether Carboxylic Acids (PFECAs) and Sulfonic Acids (PFESAs) in Natural Waters Using Accurate Mass Time-of-Flight Mass Spectrometry (TOFMS). Environmental Science & Technology, 49(19), pp.11622–11630. Available at: https://doi.org/10.1021/acs.est.5b01215.
Sun, M. et al., 2016. Legacy and Emerging Perfluoroalkyl Substances Are Important Drinking Water Contaminants in the Cape Fear River Watershed of North Carolina. Environmental Science & Technology Letters, 3(12), pp.415–419. Available at: https://doi.org/10.1021/acs.estlett.6b00398.
413
Table of Contentsfor this manuscript

APPLICATION OF SOIL AMENDMENTS FOR REDUCING PFAS EXPOSURE AND BIOAVAILABILITY
Albert L. Juhasz1, Richard Stewart2
1Future Industries Institute, University of South Australia, Adelaide, SA, 5095, AUSTRALIA
2Ziltek Pty Ltd, PO Box 373, Kent Town, Adelaide, 5071, AUSTRALIA [email protected]
INTRODUCTION Per- and polyfluoroalkyl substances (PFAS) are highly persistent, man-made chemicals most commonly associated with historic Aqueous Film Forming Foam (AFFF) use. PFAS contamination has been found on a number of Commonwealth owned or leased sites at concentrations that may adversely impact ecosystem and human health. Although there are numerous data gaps on the toxicological effect of PFAS exposure, little information is available on the extent of PFAS absorption following exposure to contaminated matrices (i.e. PFAS bioavailability) including physicochemical / biological factors influencing bioavailability from contaminated soil. The underlying assumption in quantifying contaminant intake from contaminated soil is that all of the PFAS measured by total analysis (liquid chromatography coupled to tandem mass spectrometry [LC-MS-MS]) is related to the absorbed dose. For an adverse health effect to be realized, the toxicant must be solubilised for absorption to occur across the intestinal epithelium (i.e. ingestion pathway). As bioavailability influences the dose available to exert a toxicological effect, understanding bioavailability is critical for assessing the risk of exposure to PFAS (Rostami and Juhasz, 2011). In this study, the bioavailability of PFAS in contaminated soil was assessed using an in vivo mouse model as a surrogate for human exposure. In addition, the influence of soil amendments for reducing PFAS bioavailability and mitigating exposure was investigated. METHODS PFAS-contaminated soil (representing sand, loam and clay soil textures) was collected from a number of airports across Australia. Following processing (drying and sieving), soils were characterised (TOC, inorganic constituents, total oxidisable precursors) with PFAS concentration determined using LC-MS-MS according to USEPA method 537 / ASTM D7979-17. RemBind® was used to amend soils at application rates ranging up to 5% w/w. RemBind® is a commercial adsorbent comprising aluminium hydroxide, kaolinite and carbon that has been shown in independent studies to reduce the leachability of PFAS in soil (Lath et al., 2018; Sorengard et al., 2019). Following a prescribed reaction period, both treated and untreated soil was assessed for PFAS bioavailability using female C57 BL/6 mice, aged between 4-6 weeks. Ethical and experimental approval was provided by the SA Pathology / South Australian Health and Medical Research Institute Animal Ethics Committees (application number SAM73). PFAS reference compounds, untreated or RemBind® treated soil were administered to mice following addition to AIN93G mouse chow which was supplied ad libitum for 9 days. On the 10th day, PFAS bioavailability was assessed by determining PFAS accumulation in target organs (liver and kidney) with PFAS relative bioavailability calculated by comparing PFAS accumulation from soil (treated and untreated) to reference compounds (following dose normalisation). RESULTS AND DISCUSSION 28 PFAS in contaminated soil (Z2, Z3, Z4) ranged from 2.3 to 25.4 mg kg-1 with PFOS being the major perfluorinated constituent (1.2-21.5 mg kg-1). TOP assessment identified the potential of higher concentrations of perfluoralkyl carboxylic acids following the oxidation of precursor compounds. Following determination of the linearity of PFAS accumulation in target organs (i.e. dose-response study undertaken with reference compounds at 0.01, 0.1,
T31b
Copyright © CRC CARE Pty. Ltd., 2019
CleanUp Conference 2019Adelaide, Australia8 –12 September 2019 414
Table of Contentsfor this manuscript

1.0, 2.5 mg kg-1), PFAS relative bioavailability was assessed in untreated and RemBind® treated soil (Figure 1).
Fig. 1. PFOS and PFOA relative bioavailability (RBA) in PFAS-contaminated soil with and without RemBind® amendment (5% w/w). PFAS RBA was calculated by comparing PFAS accumulation in target organs following consumption of soil to that of PFAS spiked AIN93G mouse chow (following dose normalization).
PFOS relative bioavailability in contaminated soil ranged from 58-100%. Differences were attributed to variability in soil physicochemical properties which may influence electrostatic and hydrophobic interactions. PFOA relative bioavailability in contaminated soil was >100% (up to 130%) presumably due to transformation of soil-borne precursor compounds to PFOA in vivo. The potential for higher concentrations of PFOA from precursor compounds following oxidation of soil was confirmed using the TOP assay. Both PFOS (18.4-26.1%) and PFOA (16.1-25.2%) relative bioavailability was reduced when contaminated soil was amended with 5% w/w Rembind®. CONCLUSIONS PFAS relative bioavailability studies with contaminated soil highlighted that PFOA dose may be underestimated based on LC-MS-MS analysis due to the influence of precursor compounds. Understanding the impact of precursor contribution on dose and bioavailability is essential for human health risk assessment. Contaminated soil studies also illustrated the impact of physicochemical properties on PFAS relative bioavailability and the potential of soil amendments for reducing exposure via the incidental soil ingestion pathway. Treatment of 3 different soil types with 5% RemBind® resulted in a significant reduction in the bioavailability of PFOS and PFOA in mice. REFERENCES Lath, S., Navarro, D.A., Losic, D., Kumar, A., McLaughlin, M.J. (2018) Sorptive remediation
of perfluorooctanoic acid (PSOA) using mixed mineral and graphene / carbon-based materials. Environ. Chem. https://doi.org/10.1071/EN18156
Rostami, I., Juhasz, A.L. (2011) Assessment of Persistent Organic Pollutant (POP) Bioavailability and bioaccessibility for human health exposure assessment: A critical review. Crit. Rev. Environ. Sci. Technol. 41: 623-656.
Sorengard, M., Kleja, D.B., Ahrens, L. (2019) Stabilization and solidification remediation of soil contaminated with poly- and perfluoroalkyl substances (PFAS). J. Hazard. Mat. 367: 639-646.
415
Table of Contentsfor this manuscript

SITE-SPECIFIC INVESTIGATION LEVELS FOR PFOS AND PFOA IN SOIL
S. Wood1, K. Kiefer1, K. Dodd2
1ERM, Locked Bag 3012 Australia Square NSW 1215, AUSTRALIA
2GHD, 220 Summer St, Orange NSW 2800, AUSTRALIA [email protected]
INTRODUCTION The per- and polyfluoroalkyl substances (PFAS) National Environmental Management Plan (NEMP) provides nationally agreed environmental guideline values for use in site investigations. Leaching, groundwater transport and the contamination of surface water and/or groundwater are key indirect exposure pathways for PFAS. To address these issues, the NEMP designates a perfluorooctane sulfonate (PFOS) soil guideline of 0.14 mg/kg. Environment and Climate Change Canada (ECCC) (2017) derived this guideline using a hydrogeological model. For the development of generic screening levels, the ECCC hydrogeological model incorporates a variety of default input assumptions. The of use of generic screening levels may inaccurately estimate PFAS exposure risks and affect site-specific PFAS management decisions, depending upon the hydrogeologic setting and environmental and human exposure scenarios applicable to an individual area of PFAS contaminated soil. This presentation details the development of site-specific investigation levels (SSILs) for PFOS and perfluorooctanoic acid (PFOA) in soils for a portfolio of land. The SSILs provide a refined site-specific assessment of indirect PFAS risks compared to the NEMP guideline. The aim of the SSILs is to assist the site owner in making more efficient and robust site-specific management decisions of PFAS contaminated soils, by making immediately available the soil concentrations of PFAS that require no further risk assessment or management, no matter where on site the soils are located. METHODOLOGY Aerial imagery, government geo-spatial datasites and site-specific reports were used to identify the potential environmental and human PFAS exposure scenarios applicable to each site. Hydrogeological and geological input parameters specific to each site were then used in conjunction with the ECCC hydrogeological model to derive SSILs for a range of source-receptor separation distances. The SSILs for each site were plotted into geo-referenced zones, relative to the location of the identified environmental and human receptors. The other potentially important migration and exposure pathways for PFAS contaminated soils were also evaluated for each site, including PFAS migration via surface water runoff and direct contact PFAS exposures. RESULTS AND DISCUSSION SSILs have been developed for sites distributed across Australia. A range of distinct environmental and human exposure scenarios and hydrogeological and geological settings characterize these sites. The SSILs derived ranged from <0.005 mg/kg to >20 mg/kg. Table 1 presents comparisons between the key ECCC (2017) default input assumptions and those applied to the study sites. As a group, the SSILs illustrate the scenarios where the NEMP PFOS soil guideline of 0.14 mg/kg is most likely to overestimate PFAS exposure risks and quantify the potential magnitude of this inaccuracy. The process of deriving SSILs has also highlighted some of the gaps in the site-specific environmental datasets and the scientific literature, with the greatest potential to influence the risk profile for PFAS contamination at a site. This presentation provides case study examples, demonstrating the SSILs applicable under a variety of hydrogeologic, environmental and human exposure settings that support robust
T31c
Copyright © CRC CARE Pty. Ltd., 2019
CleanUp Conference 2019Adelaide, Australia8 –12 September 2019 416
Table of Contentsfor this manuscript

site-specific management decisions related to PFAS contaminated soils. It is intended to review and revise this work in response to changes in relevant guideline values anticipated during 2019.
Table 1: Comparison between the input assumptions adopted in the ECCC (2017) hydrogeological model and those applicable to Study sites.
Parameter Unit ECCC (2017) Default Inputs
Range of Inputs Applicable Across the Study Sites
Target concentration at the receptor µg/L
6.8 (aquatic environments)
0.00023/ 0.13 (aquatic environments); 0.07 (drinking water); 0.7 (recreational water
use)
Source-Receptor separation distance m 10 10 – 8,000
Hydraulic conductivity m/yr 320 10 - 8,760 Hydraulic gradient - 0.028 0.005 - 0.02 Soil organic carbon content % 0.2 0.2 – 1.5 Aquifer organic carbon content % 0.2 0.2 – 0.3 Depth to groundwater m 3 0.4 - 10 Effective porosity - 0.3 0.05 – 0.3 Organic carbon-water partition coefficient
L/kg 1145 372
PFOS Investigation Level mg/k 0.14 <0.005 - >20 mg/kg
REFERENCES Australian and New Zealand Environment Conservation Council (ANZECC) and Agriculture
and Resources Management Council of Australia and New Zealand (ARMCANZ) (2000) Australian and New Zealand Guidelines for Fresh and Marine Water Quality, National Water Quality Management Strategy Paper No. 4.
Australian Government Department of Health (2017) Health based guidance values for PFAS for use in site investigations in Australia.
Danish Ministry of the Environment Environmental Protection Agency (DEPA) (2015) Perfluoroalkylated substances: PFOA, PFOS and PFOSA Evaluation of health hazards and proposal of a health based quality criterion for drinking water, soil and ground water, Environmental project No. 1665, 2015
Heads of EPAs Australia and New Zealand (HEPA) and Australian Government Department of the Environment and Energy (DoEE) (2018) PFAS National Environmental Management Plan (NEMP).
Environment and Climate Change Canada (2017) Federal Environmental Quality Guidelines: Perfluorooctane Sulfonate (PFOS)
European Food Safety Authority (EFSA) (2008) Perfluorooctane sulfonate (PFOS), perfluorooctanoic acid (PFOA) and their salts Scientific Opinion of the Panel on Contaminants in the Food chain. The EFSA Journal: 653, 1-131
Franz, T (2012) Modelling of perfluorooctane sulfonate (PFOS) fate and transport from soil to groundwater, Final report. Prepared for Health Canada, Contaminated Sites Division
Li, Y., Oliver, D., Kookana, R. (2018) A critical analysis of published data to discern the role of soil and sediment properties in determining sorption of per and polyfluoroalkyl substances (PFAS), Science of the Total Environment. 628-629:110-120.
United States Environmental Protection Agency (USEPA) (2016) Drinking Water Health Advisory for Perfluorooctane Sulfonate (PFOS), Office of Water. EPA Document Number: 822-R-16-004
417
Table of Contentsfor this manuscript

WHAT DOES EXCEEDENCE OF A TOXICITY REFERENCE VALUE REALLY MEAN? CASE STUDY: PFOS
Tarah Hagen, Giorgio De Nola, Anthony Lane
SLR Consulting, Suite 2, 2 Domville Avenue, Hawthorn 3121, AUSTRALIA
INTRODUCTION The standard approach for undertaking Tier 2 or Tier 3 health risk assessments involves comparing estimated chemical exposures to a toxicity reference value (TRV) by calculating a hazard quotient (HQ) or hazard index (HI). A HQ/HI below one, i.e. when the estimated exposure is below the TRV, is deemed not to be of concern. However, when the estimated exposure exceeds the TRV, risk communication becomes more difficult as the likelihood of harm occurring is not well understood. We have illustrated, with the help of perfluorooctane sulfonic acid (PFOS) as a case study, complementary risk assessment tools which can render this type of communication more effective.
METHODS The background documentation underpinning the basis of PFOS TRVs from various jurisdictions was examined and their derivation summarised and compared. With the help of examples where these tools have been effective, suggestions for complementary risk assessment approaches are provided.
RESULTS AND DISCUSSION Toxicity Reference Value Comparison PFOS TRVs derived by various jurisdictions, along with the toxicological point of departure and uncertainty factor underpinning their derivation, are summarised in Figure 1. It was found:
• Most TRVs are based on hepatotoxicity or developmental effects in animal studies. • Uncertainty factors are primarily responsible for observed differences in TRVs. • Most recent TRVs are based on a human equivalent No Observed Adverse Effect
Level for decreased weight gain in pups.
Figure 1. Toxicity Reference Values from Various Agencies since 2005
T31d
Copyright © CRC CARE Pty. Ltd., 2019
CleanUp Conference 2019Adelaide, Australia8 –12 September 2019 418
Table of Contentsfor this manuscript

Complementary approaches for risk assessments Margin of Exposure (MoE) When the toxicological endpoint (e.g. a human equivalent NOAEL or an effect level in animal studies) is compared directly with an exposure estimate (i.e. POD ÷ exposure estimate), the result is called the MoE (enHealth 2012). The advantages of a MoE assessment are:
• MoE can be more easily understood and communicated than a HQ/HI >1. • Allows flexibility in selecting a ‘target’ MoE specific for a particular situation. • Can also use effect levels to show how far away the estimated exposure is from that
which caused effects in toxicological studies. For example, if the estimated PFOS exposure is twice the Australian TRV, a HQ of 2 may be deemed unacceptable by stakeholders. The risk assessor may conclude that there ‘is a potential risk’ and recommend management actions which takes the form of reducing exposure. This can elicit community concerns and anxiety regarding the potential risk to peoples’ health. However, when expressed as a MoE, this essentially means the uncertainty/safety factor incorporated into the derivation of the TRV is somewhat eroded; the estimated exposure is still 20 times lower than the dose which is not expected to cause harm in humans. This provides context for exceedances of a TRV. An example where this approach has been used effectively for PFOS is in ToxConsult (2014). Blood serum concentrations For PFOS, internal body burden is a good comparator to serum no effect and low effect levels in toxicological studies (Roberts 2016, USEPA 2016), because it eliminates uncertainty associated with kinetic differences between species. Thus, the MoE approach can also be used directly with blood serum concentrations. Similarly, internal blood serum concentrations for a human population of interest can also be compared with background serum or serum no effect concentrations in exposed cohorts. An example where this approach has been used effectively for PFOS is in ToxConsult (2016). CONCLUSIONS Standard quantitative risk assessment approaches, on their own, may render risk communication ineffective where estimated exposures exceed the TRV. Classic HQs/HIs do not provide information regarding the significance of an exceedance, and the likelihood of harm. Complementary assessments utilising MoE and blood serum data have been used effectively to communicate potential risk from PFOS exposure. REFERENCES Roberts, M. (2016). A critical review of pharmacokinetic modelling of PFOS and PFOA to
assist in establishing HGBVs for these chemicals. Therapeutics Research Centre, University of Queensland. Prepared for Food Standards Australia New Zealand. https://www.health.gov.au/internet/main/publishing.nsf/Content/2200FE086D480353CA2580C900817CDC/$File/7.Critical-Review-Pharmacokinetic-Modelling.pdf
Toxconsult (2014). Health impact assessment from consumption of fish from Lake Fiskville. ToxConsult document ToxCR061113-RF2, 1st April 2014. ToxConsult Pty Ltd.
ToxConsult (2016). HHRA for the Army Aviation Centre Oakey using PFAS Serum Concentrations. ToxConsult document ToxCR230616-TF2, 19th August 2016. ToxConsult Pty Ltd.
US EPA (2016). Health effects support document for perfluorooctane sulfonate (PFOS). United States Environmental Protection Agency, Office of Water. EPA 822-R-16-002. https://www.epa.gov/sites/production/files/2016-05/documents/hesd_pfos_final-plain.pdf
419
Table of Contentsfor this manuscript

REMEDIATION OF PFAS IMPACTED WATER AT FIRE FIGHTING TRAINING SITE USING OCRA TECHNOLOGY
David M. Hunter1, Thava Palanisami2, Michael Dickson1, Richard Bush2, Geoffrey Evans2
1 Evocra Pty Ltd., AUSTRALIA
2The University of Newcastle, Callaghan NSW 2308, AUSTRALIA [email protected]
INTRODUCTION Poly- and Per-Fluoralkyl Substances (PFASs), are a group of over 4,600 compounds, generally of synthetic origin, that have historically been used in aqueous film forming foams (AFFFs), industrial surface coatings and other household products. The widespread use of PFASs coupled with their chemical persistence and high mobility has led to a global contamination crisis. Currently, PFOS, PFOA and PFHxS are the primary species of concern to human health, however, there is growing concern over the potential toxicity of many other PFAS compounds (Ross, et al., 2018). A number of techniques exist for remediation of PFAS contaminated water. These include adsorption onto media such as granular activated carbon (GAC) or ion exchange (IX) resin, and foam fractionation. While adsorption techniques are effective at removing most PFASs, the adsorption media itself, once spent, requires remediation which can be difficult and expensive to achieve (Ross et al., 2018). Foam fractionation also utilises adsorption, but rather than PFASs adsorbing to a solid media, they collect at the surface of gas bubbles rising through a fluid. The Ozofractionative Catalysed Reagent Addition (OCRA) process, developed and patented by Evocra, is a foam fractionation process that utilises bubbles of ozone gas to concentrate PFAS into a low-volume foam fraction. Recently, Evocra has conducted a field trial of this technology at an active fire-fighting training ground in Australia, where the OCRA technology, coupled with a reverse osmosis (RO) polish has consistently achieved non-detect for all PFAS species assayed as standard by analytical laboratories. METHODS Evocra’s field plant consisted of two stages of OCRA followed by reverse osmosis (RO). The permeate stream from the RO system formed the treated water from the process while the reject stream was sent to a third OCRA stage. The output water from the third OCRA stage was passed through an IX process before being recycled to the start of the process. The plant has been operational for two days a week since mid-2018 with composite samples taken for each 10 kL batch and assayed for PFAS by an external and independent laboratory service. RESULTS Table 1 shows averaged results over a period of 6 months for raw water, output from second OCRA stage (2°) and final treated water (RO permeate). It can be seen that the two-stage OCRA process alone was able to consistently achieve treatment levels to below the USA EPA drinking water standards of <0.07 µg/L for PFOS and PFOA (US EPA, 2016). Combining OCRA with an RO polishing unit, reduced the total PFAS from 52 µg/L to <0.01 µg/L in the final treated water giving a removal of >99.98%. On average, the foam fraction or PFAS concentrate produced by the process represented only 1.4% of the input volume to the process giving a water recovery of 98.6%. This concentrate is planned to be further concentrated by being passed through a fit-for-purpose OCRA system providing an even greater improvement on water recovery and further reduction in concentrate volume.
T31e
Copyright © CRC CARE Pty. Ltd., 2019
CleanUp Conference 2019Adelaide, Australia8 –12 September 2019 420
Table of Contentsfor this manuscript

Table 1. Assay results from field trial averaged over a 6 months field trial period.
Species Raw Water 2° OCRA Output Water
Final Treated Water
Drinking water specifications
Aus* USA+ (-) (µg/L) (µg/L) (µg/L) (µg/L) (µg/L)
PFBS 1.16 1.12 <0.02 - - PFHxS 4.14 0.13 <0.02 0.07 - PFOS 28.73 <0.01 <0.01 0.07 0.07 PFBA 1.80 1.59 <0.1 - -
PFHxA 0.90 <0.02 <0.02 - - PFOA 1.51 <0.01 <0.01 0.56 0.07
∑ of PFAS 52.67 8.31 <0.01 - - * (NHMRC, 2018) + (US EPA, 2016)
CONCLUSION A field trial of Evocra’s patented OCRA technology has demonstrated that the OCRA process is capable of removing PFAS compounds to below US EPA drinking water standards, and coupled with a polishing system such as IX or RO can effectively remove PFAS to below detectable limits by standard analysis. The OCRA process is an effective and versatile solution for remediation of PFAS impacted water sources which produces a PFAS concentrate that is easily manageable, can be further concentrated and is cheaper to destroy than spent solids from GAC or IX processes. ACKNOWLEDGEMENT The Evocra R&D Team would like to thank the Newcastle Institute for Energy and Resources (NIER) and Air Services Australia (ASA) for their support in this project. REFERENCES NHMRC (2018). Australian Drinking Water Guidelines 6, 2011 – ver 3.4 Updated August
2018. Available at: https://www.nhmrc.gov.au/sites/default/files/documents/NHMRC%20A DWG%206%20-%20Version%203.5%20-%20Proof%203.pdf (Accessed: 1 June 2019)
Ross, I., McDonough, J., Miles, J., Storch, P., Kochunarayanana, P.T., Kalve, E., Hurst, J., Dasgupta, S.S. and Burdick, J. (2018). A review of emerging technologies for remediation of PFASs. Remediation, 28; pp. 101-126.
US EPA, 2016. FACT SHEET PFOA & PFOS Drinking Water Health Advisories. Available at: https://www.epa.gov/sites/production/files/2016-06/documents/drinkingwaterhealthadvisori es_pfoa_pfos_updated_5.31.16.pdf (Accessed: 1 June 2019)
421
Table of Contentsfor this manuscript

EFFICIENT SORPTIVE REMOVAL OF PFOS BY LAYERED DOUBLE HYDROXIDES: KINETIC AND ISOTHERM STUDY
Xin Song, Zhihao Hu
Key Laboratory of Soil Environment and Pollution Remediation, Institute of Soil Science,
Chinese Academy of Sciences, 71 East Beijing Road, Nanjing, 210008, CHINA [email protected]
INTRODUCTION Perfluorooctane sulfonate (PFOS) is defined as an emerging contaminant and listed in Annex B of the Stockholm Convention on Persistent Organic Pollutants (Wang et al., 2009). And it is ubiquitously detected in aquatic environments (Paul et al., 2009), posing a significant threat to ecosystems and human health. Therefore, developing effective PFOS remediation methods is essential. However, PFOS is reported resistant to biodegradation and chemical oxidation, and only degraded under some harsh conditions (Kucharzyk et al., 2017). Sorption is a mild and cost-effective technique that holds great promise for field remediation technologies, but most reported PFOS sorbents require hours to reach sorption equilibrium and/or have poor sorption capacities. Layered double hydroxides (LDHs) are a class of anionic clays that consist of positively charged host layers and intercalated anions. With a low pKa value of -3.27, PFOS in water usually exists in an anion form. Thus, there is the potential for LDHs to remove PFOS in aqueous solution. Herein, we explored the efficient sorptive removal of PFOS by three types of LDHs (NO3
-, CO32-, and Cl--LDHs).
METHODS NO3
-, CO32-, and Cl--LDHs were synthesized by coprecipitation method. The kinetics study
was conducted within a timeframe of 1 h, and sacrificial samples were extracted at designated time intervals. The isotherm study was performed at the initial PFOS concentration from 50 to 500 mg/L, and an equilibrium time of 48 h was used. All the experiments were conducted in triplicate. PFOS was analyzed by HPLC-MS/MS. RESULTS AND DISCUSSION • Sorption kinetics
o The sorption equilibrium was reached within 10 min for all LDHs, with an initial concentration of 1 mg/L PFOS (Fig. 1A), which was higher than many other reported PFOS sorbents (Du et al., 2014).
o The PFOS removal rates were 95.5%, 90.6%, and 50.3% for the NO3-, CO3
2-, and Cl--LDH, respectively, with an initial concentration of 1 mg/L PFOS (Fig. 1A).
o For the initial concentrations of 25, 50, 75, and 100 mg/L, PFOS was almost completely removed by the NO3
--LDH with a removal rate of 99.7%. The equilibration time slightly increased as the initial concentration increased from 25 to 100 mg/L (Fig. 1B).
• Sorption isotherms (Fig. 2) o The Langmuir isotherms better fitted the data of all LDHs compared to the Freundlich
isotherms, indicating monolayer sorption of PFOS by the LDHs. o The sorption capacity obtained from the Langmuir equations decreased as follows:
NO3--LDH > CO3
2--LDH > Cl--LDH. o The maximum sorption capacity of the NO3
--LDH was 865 mg/g, which was much higher than many other reported PFOS sorbents (Du et al., 2014).
T31f
Copyright © CRC CARE Pty. Ltd., 2019
CleanUp Conference 2019Adelaide, Australia8 –12 September 2019 422
Table of Contentsfor this manuscript

Fig. 1. (A) PFOS sorption kinetics by NO3
-, CO32-, and Cl--LDHs with an initial
concentration of 1 mg/L. (B) Effect of initial concentration on the sorption kinetics of PFOS by NO3
--LDH.
Fig. 2. PFOS sorption isotherms of NO3
-, CO32-, and Cl--LDHs at 25 °C.
CONCLUSIONS NO3
-, CO32-, and Cl--LDH could remove PFOS from water in a few minutes. The sorption
isotherms for the three LDHs were better fitted by Langmuir isotherms, suggesting a monolayer sorption of PFOS by the LDHs, and NO3
--LDH showed the highest sorption capacity of 865 mg/g. The three LDHs exhibited an advance against most reported PFOS sorbents in the sorption rate and capacity, showing great promise in PFOS remediation. In addition, it was found that he initial pH, background electrolyte concentration and coexisting ions influenced the sorption by the LDHs. It was concluded both surface adsorption and anion exchange were involved in the PFOS sorption onto the LDHs. REFERENCES Du, Z., Deng, S., Bei, Y., Huang, Q., Wang, B., Huang, J. and Yu, G. (2014) Adsorption
behavior and mechanism of perfluorinated compounds on various adsorbents—A review. J. Hazard. Mater. 274:443-454.
Kucharzyk, K.H., Darlington, R., Benotti, M., Deeb, R. and Hawley, E. (2017) Novel treatment technologies for PFAS compounds: A critical review. J. Environ. Manage. 204:757-764.
Paul, A.G., Jones, K.C. and Sweetman, A.J. (2009) A first global production, emission, and environmental inventory for perfluorooctane sulfonate. Environ. Sci. Technol. 43:386-392.
Wang, T., Wang, Y., Liao, C., Cai, Y. and Jiang, G. (2009) Perspectives on the inclusion of perfluorooctane sulfonate into the Stockholm convention on persistent organic pollutants. Environ. Sci. Technol. 43:5171-5175.
423
Table of Contentsfor this manuscript

FATE AND TRANSPORT OF NANO ZERO-VALENT IRON FOR ARSENIC REMEDIATION IN SUBSURFACE ENVIRONMENT AND ITS
POTENTIAL ENVIRONMENTAL RISKS
Zhigang Yu1, Irene M.C. Lo1,2
1Department of Civil and Environmental Engineering, Hong Kong University of Science and Technology, Hong Kong, CHINA
2Institute for Advanced Study, Hong Kong University of Science and Technology, Hong Kong, CHINA
Nano zero-valent iron (nZVI) is widely used in the arsenic (As) remediation of groundwater. During the remediation, nZVI reacts with As and then forms As-loaded nZVI. Unfortunately, some concerns occur regarding the release of As-loaded nZVI particles and their subsequent transport in aquatic environments, as well as the As release from As-loaded nZVI. This study investigated the fate and transport of the three types of As-loaded nZVI (As-loaded pristine, chitosan-modified and polyaniline-modified nZVI) at two levels of As loadings (low and high), under conditions related to practical groundwater remediation by both batch and column study. Although surface modification and high As loading enhance the mobility of As-loaded nZVI particles, the calculated transport distances of the three types of As-loaded nZVI particles in sand column are less than 60 cm, indicating that the mobility of As-loaded nZVI particles is limited. The transport mechanisms are the ripening and sedimentation. This study is the first time to systematically investigate the fate and transport of As-loaded nZVI in groundwater system. The findings could assess the potential risk caused by the As released from the As-loaded nZVI under different geochemical conditions and also provide guidelines for the selections of surface modification as well as the nZVI dosage regarding the As release in groundwater.
T32a
Copyright © CRC CARE Pty. Ltd., 2019
CleanUp Conference 2019Adelaide, Australia8 –12 September 2019 424
Table of Contentsfor this manuscript

ADSORPTIVE REMOVAL OF OXYTETRACYCLINE ANTIBIOTIC IN AQUEOUS MEDIA USING HALLOYSITE NANOCLAY
Sammani Ramanayaka1, Meththika Vithanage1, Binoy Sarkar2, Yong Sik Ok3
1Ecosphere Resilience Research Center, Faculty of Applied Sciences,
University of Sri Jayewardenepura, Nugegoda, SRI LANKA 2Department of Animal and Plant Sciences, The University of Sheffield, Sheffield, UK
3Korea Biochar Research Center, O-Jeong Eco-Resilience Institute (OJERI) & Division of Environmental Science and Ecological Engineering, Korea University, KOREA
INTRODUCTION Development of antibiotic resistance has become an upcoming threat around the world due to the extensive use by humans and veterinary industry. Among top pharmaceutical contaminants, commonly used antibiotics, such as oxytetracyclines have been detected in elevated concentrations in both ground and surface water (Ding et al. 2012). Oxytetracycline (OTC) is a broad-spectrum veterinary drug and can be used against both gram-positive and gram-negative bacteria in regularly. It is a hydrophilic molecule which consists of four fused benzene rings and speciation of OTC molecule occurs with the protonation and deprotonation of ionizable functional groups, in different solution pH values. Therefore, OTC shows zwitterionic form in the range of solution pH from 3.5 to 7.5. Cationic form and the anionic form of OTC is predominant at pH less than 3.5 and higher than 7.5, respectively (Chopra and Roberts 2001). Natural nanoclays such as halloysite (HNC), have been used in the removal of toxic elements from aquatic environments. However, the potential of Halloysite nanoclay for removal antibiotics or OTC has not been studied in detail compared to the other engineered nanoclays such as montmorillonite, etc. Therefore, the objectives of this study are to assess the OTC removal potential of HNC from aquatic environments under different environmental conditions and postulate mechanisms behind adsorption. METHODS Halloysite nanoclay and oxytetracycline were purchased from Sigma-Aldrich Co. Ltd. (United States). The microstructure and the chemical composition of the pristine halloysite nanoclay and OTC loaded nanoclay was assessed by Field Emission Scanning Electron Microscope (FE-SEM), Hitachi SU6600 Analytical Variable Pressure FE-SEM (Japan) and Powder X-ray Diffraction (PXRD) patterns from Rigaku, Ultima IV X-ray Diffractometer (Japan) using Cu Kβ radiation at a wavelength of 1.54056 Å at scanning range of 10-60° (2θ) with a scanning speed of 2 degrees/min. Surface functional groups were determined by Fourier Transform Infrared Spectrometer (FTIR) (Thermo Scientific Nicolet iS10, USA) in the wavelength range of 4000-550 cm-1 and Solution pH values were measured with a pH meter (Adwa AD1030, Romania). Experimental pH edge was investigated in the range of 3.0 – 9.0 pH at different ionic strengths (0.1, 0.01 and 0.001 M NaNO3). Adsorption isotherm experiments were conducted at the best pH of 4.75 and the least ionic strength value (0.001 M) OTC concentrations were maintained in the range of 10 – 500 mg/L for experiments at 1g/L adsorbent dosage, after 4 hrs of hydration and the contact time of 12 hrs, to reach equilibrium. Kinetic and isotherm experimental data modeling was carried out by non-linear least square fit with the software, Origin 6.0. RESULTS AND DISCUSSION Solution pH is crucial for the surface complexation of OTC on HNC and therefore, adsorption pattern and capacity were investigated at different pH levels. In the pH range of 2.5 to 8.5,
T32b
Copyright © CRC CARE Pty. Ltd., 2019
CleanUp Conference 2019Adelaide, Australia
8 –12 September 2019425
Table of Contentsfor this manuscript

selective adsorption of anionic tricarbonylamide in zwitterion with the positively charged Al2O3 in the inner lumen (Almasri et al. 2019). Vice versa may happen with the negatively charged SiO2 in the inner lumen positively with the positively charged dimethylamine group of zwitterion and this is suggested as the monodentate chemisorption. Adsorption isotherm experiments exhibited high retention induced by high availability of HNC surface sites at low initial OTC concentrations. The adsorption capacity 52.4 mg/g was calculated by isotherm modeling. Experimental data were best fitted to the Hill equation, out of Freundlich, Temkin and Langmuir models, giving the highest correlation coefficient (R2) of 0.913 and hypothesizes different binding sites on the same adsorbent macromolecule, which indicates a cooperative phenomenon.
Fig. 1. (a) Effect of pH on the adsorption amount of OTC at different ionic strengths (NaNO3 0.1, 0.01, 0.001 M) in aqueous media. Initial OTC concentration was kept at 25 mg/L. (b) Initial OTC concentration vs. adsorption amount at the pH of 4. Symbols represent experimental data where lines indicate modeled data using non-linear least square fit of Langmuir, Freundlich, Hills and Temkin equations. CONCLUSIONS In this study, removal of oxytetracycline antibiotic from aqueous media by using halloysite nanoclay has been reported. The calculated maximum adsorption capacity of HNC was given as 52.4 mg/g and more than 50% of OTC was adsorbed in the first 30 mins. Kinetic results indicate chemisorption and intraparticle diffusion as the adsorption process whereas isotherm data were fitted best with Hill equation describing cooperative adsorption of OTC to halloysite. REFERENCES Almasri, D. A., Saleh, N. B., Atieh, M. A., Mckay, G. and Ahzi, S. (2019) Adsorption of
Phosphate on Iron Oxide Doped Halloysite Nanotubes. Sci. Rep. 9(1): 280-288 Chopra, I., and Marilyn, R., (2001) Tetracycline Antibiotics: Mode of Action, Applications,
Molecular Biology, and Epidemiology of Bacterial Resistance. Microbiol. Mol. Biol. Rev. 65(2): 232–60.
Ding, R., Pengfei, Z., Mykola, S., and Teresa, J. B., (2012) Removal of Antibiotics from Water Using Sewage Sludge- and Waste Oil Sludge-Derived Adsorbents. Water Res. 46(13): 4081–90.
426
Table of Contentsfor this manuscript

INTERACTIONS BETWEEN NANOPARTICLES AND FLAME RETARDANTS IN WASTEWATER TREATMENT AGGREGATES
Anwar Ul Haq Khan1,2, Yanju Liu1,2, Ravi Naidu1,2, Raja Dharmarajan1,2, Cheng Fang1,2
1Global Centre for Environmental Remediation (GCER), Faculty of Science, The University
of Newcastle, Callaghan, NSW 2308, AUSTRALIA 2Cooperative Research Centre for Contamination Assessment and Remediation of the
Environment (CRC CARE), ATC Building, The University of Newcastle, Callaghan, NSW 2308, AUSTRALIA
INTRODUCTION Emerging contaminants (ECs) (a heterogeneous group of chemicals) are “of natural origin or synthetically produced” chemicals that have been recently investigated in the environment and are posing inauspicious effects to the ecosystem. There are many different sources of ECs, including industrial wastes, municipal (domestic) wastewater, agricultural, hospital or laboratory wastewaters. Some of these contaminants include pesticides, food additives, pharmaceuticals, industrial by-products, dyes, paint, pigments, personal care products (PCPs), endocrine disrupting chemicals (EDCs), veterinary products (VPs), flame retardants (FRs) and engineered nanoparticles (ENPs). The presence of emerging contamination in the aquatic environment, soil and sediments, landfills and surface water is mainly due to the disposal of effluents from wastewater treatment plants (WWTPs) [1-2]. Brominated flame retardants (BFRs), are the chemicals added as additives in electrical and electronic equipment (EEE), upholstered furniture, building insulation, textile and plastic products to achieve fire safety standards and to provide fire protection [3]. Most of them are persistent, bioaccumulative and toxic (PBT). They are widely detected in WWTPs together with engineered nanoparticles (ENPs) such as TiO2, ZnO, Fe and Ag which have been employed in numerous applications like UV filters, cosmetics, paints, textiles, surgical equipment [4]. As the co-occurrence of BFRs and ENPs, it is necessary to understand their interaction mechanisms in WWTPs apart from investigating their individual fate and behavior. Such information is currently lacking in the literature. In this study, we conducted a comprehensive review on the interaction mechanisms of ENPs with BFRs during the dissolution, adsorption, aggregation, sedimentation and transformation processes in a WWTP. The released pathways of the ENPs and BRFs from consumer’s end use to aquatic environments were summarized. Emission phenomenon of semi volatile organic compound (BFRs) based on mass transfer modelling concepts has also been discussed. The interactions between ENPs and BFRs could influence their fate in WWTPs which is discussed in the review. This review aims to shed light on this knowledge gap and provide further insights in understanding the fate of ENPs in WWTPs. METHODS In this review, we reviewed publications focusing on BRFs and ENPs (in particular the aggregates) in WWTPs and research articles investigating the interactions of BRFs with ENPs in laboratory conditions to reveal the potential interactions between BRFs and ENPs in WWTPs as well as in environmental conditions. We also reviewed articles for alternation of toxicity when these contaminants co-occurrence in environments. We reviewed around 250 articles and summarized relevant information in this study. RESULTS AND DISCUSSION Figure 1, demonstrates the possible interaction mechanisms (chemical and physical) such as hydrogen bonding, cation bridge, ligand exchange, surface precipitation, wan der Waals
T32c
Copyright © CRC CARE Pty. Ltd., 2019
CleanUp Conference 2019Adelaide, Australia
8 –12 September 2019427
Table of Contentsfor this manuscript

force, electrostatic interaction, polymer bridge, hydrophobic interaction and magnetic attraction occur between the released ENPs and BFRs in wastewaters and finally generates more complex structures.
Fig.1. Chemical and physical interaction mechanisms involved in ENPs and BFRs [5]. CONCLUSIONS Generally, there is increasing interest in the end-of-life fate of ENPs in the wastewater treatment aggregates, and BFRs play significant roles in the transport and generation of complex structures in the aqueous systems. Further intensive studies and thorough characterizations are required to obtain insights in highly complex interactions between BFRs and ENPs in wastewater systems prior to recycling and reuse. REFERENCES [1] K.E. Murray, S.M. Thomas, A.A. Bodour. (2010), Prioritizing research for trace pollutants
and emerging contaminants in the freshwater environment, Environ. Pollut. 158:3462–3471.
[2] F. Part, N. Berge, P. Baran, A. Stringfellow, W. Sun, S. Bartelt-Hunt, D. Mitrano, L. Li, P. Hennebert, P. Quicker, S.C. Bolyard, M. Huber-Humer.(2018), A review of the fate of engineered nanomaterials in municipal solid waste streams. Waste Manag. 75:427–449.
[3] S.L. Waaijers, J.R. Parsons.(2016), Biodegradation of brominated and organophosphorus flame retardants, Curr. Opin. Biotechnol. 38:14–23.
[4] S.S. Bhattacharya, S. Kumar, K.-H. Kim, A. Deep, P. Das, A.A. Adelodun, L. Goswami (2017), Engineered nano particles: Nature, behavior, and effect on the environment, J. Environ. Manage. 196:297–315.
[5] X. Huangfu, Y. Xu, C. Liu, Q. He, J. Ma, C. Ma, R. Huang, (2019) A review on the interactions between engineered nanoparticles with extracellular and intracellular polymeric substances from wastewater treatment aggregates, Chemosphere. 219:766–783.
428
Table of Contentsfor this manuscript

SMECTITE-SUPPORTED NANO ZERO VALENT IRON FOR ARSENIC REMOVAL FROM WATER: KINETICS AND EFFECT OF pH
Kh Ashraf Uz-Zaman1,2, Bhabananda Biswas3,2, Mohammad Mahmudur Rahman1,2,
Ravi Naidu1,2
1Global Centre for Environmental Remediation (GCER), Faculty of Science, The University of Newcastle, Callaghan, NSW 2308, AUSTRALIA
2Cooperative Research Centre for Contamination Assessment and Remediation of the Environment (CRC CARE), The University of Newcastle, Callaghan, NSW 2308,
AUSTRALIA 3Future Industries Institute, University of South Australia, Mawson Lakes, SA 5095,
AUSTRALIA [email protected]
INTRODUCTION Constituting a severe hazard to public health and whole ecosystems, Arsenic (As) pollution in water has become a worldwide issue. Arsenic is predominately mobilized to groundwater via release from arsenic bearing minerals, especially reduction of iron oxyhydroxide is the main mechanism for such mobilization. A number of anthropogenic activities such as mining, industrial wastewater discharge, arsenical based herbicides and pesticides are responsible for the release of As in the environment. Globally, about 200 million people are potentially exposed to arsenic via drinking water (Minatel et al., 2018). Consequently, the remediation of As contaminated water has become an urgent issue where people rely on groundwater to meet up the requirement of potable and irrigation water. Amongst organic and inorganic species, trivalent (AsIII) and pentavalent (AsV) ones are the main available forms observed in groundwater. For the convenient removal of total arsenic from water, pre-oxidation process is mostly utilized to convert AsIII to AsV by various oxidants; subsequently different removal processes such as adsorption and precipitation must be involved for the removal of AsV. From the literature, it was observed that nano scale zero valent iron (Fe0) supported on clay minerals can be effective for the removal of As from contaminated water because of high affinity of As to Fe as well as its oxides and hydroxides (Tandon et al., 2013). The oxidative properties of nano zero valent iron (nZVI) is able to convert AsIII to AsV, while the clays, act as a low-cost support material to prevent aggregation of iron nanoparticles. Smectite-iron nanoparticle composites have been explored for As decontamination(Bhowmick et al., 2014), and researchers exceedingly are looking for high-performance and environmentally friendly adsorbents, which do not pose additional risk to the environment. METHODS In a continuous N2 flow, smectite-supported nano zero valent iron (Smec-nZVI) was synthesized by reducing Fe(II) with NaBH4 in presence of smectite as a supporting material with some modifications in the procedure used by previous study(Üzüm et al., 2009). During synthesis, NaBH4 was used almost twice of the amount of iron to ensure complete reduction of Fe(II). In a similar protocol, the nZVI was also prepared only by skipping the addition of smectite clay. After the synthesis, Smec-nZVI and nZVI were dried in freeze dryer and stored under N2 atmosphere prior to use in experiment. After taking SEM and TEM images of the synthesized composite, elemental mapping by EDX was done to observe the distribution of iron nanoparticles on smectite clay. Arsenic adsorption experiments by Smec-nZVI A series of batch adsorption experiments were carried out at room temperature, and sorption performance of the Smec-nZVI was investigated by altering contact time, initial solution pH, and As concentration. The uptake kinetic experiments were also performed. The pH of the initial solution was adjusted to the desired value with diluted HCl/NaOH solution (0.1 M).
T32d
Copyright © CRC CARE Pty. Ltd., 2019
CleanUp Conference 2019Adelaide, Australia
8 –12 September 2019429
Table of Contentsfor this manuscript

After different durations, part of the supernatant was extracted, and the residual As concentration was determined by the ICP-OES analyses. RESULTS AND DISCUSSION In elemental mapping, it was observed that iron nanoparticles are well dispersed on smectite clay template. The time-dependent As adsorption kinetics are presented in Figure 1a, in which the concentration of As solution is 10 mg/L at a fixed adsorbent dosage of 0.3 g/L. The initial sorption rates for both As(III) and As(V) species are faster and then gradually reach an equilibrium within 6 h. In addition, the obtained kinetics data (plots of t/Qt versus t) can be evaluated well using the pseudo-second-order kinetic model with high correlation coefficients (R2> 0.99, Figure 1b). With the purpose of assessing the influence of initial pH value on sorption capacity, the adsorption experiments were conducted using 10 mg/L of arsenic solution with varying initial pH values (2−10). Arsenic uptake capacities on the Smec-nZVI slightly decrease with the increase in pH, indicating a pH-dependent process. This adsorption behaviour can be explained by different surface charges of adsorbents and variation in As species under various pH values (Bhowmick et al., 2014).
Fig. 1. Arsenic adsorption kinetic data (a) and corresponding fitting curves on Smec-nZVI via pseudo-second-order kinetic model(b), (where Ci - initial As conc., Ct - As conc. after time t, Qt - quantity of As absorbed after time t). CONCLUSIONS In summary, the synthesized smec-nZVI, in which the iron nanoparticles were in less aggregation state, provided higher surface area and reactive sites for As adsorption. Smec-nZVI showed quite good sorption capacities for both AsIII and AsV within 6 h. Even in a wide range of pH, the material was able to remove substantial amount of As. REFERENCES BHOWMICK, S., CHAKRABORTY, S., MONDAL, P., VAN RENTERGHEM, W., VAN DEN
BERGHE, S., ROMAN-ROSS, G., CHATTERJEE, D. & IGLESIAS, M. 2014. Montmorillonite-supported nanoscale zero-valent iron for removal of arsenic from aqueous solution: Kinetics and mechanism. Chemical Engineering Journal, 243, 14-23.
MINATEL, B. C., SAGE, A. P., ANDERSON, C., HUBAUX, R., MARSHALL, E. A., LAM, W. L. & MARTINEZ, V. D. 2018. Environmental arsenic exposure: From genetic susceptibility to pathogenesis. Environment International, 112, 183-197.
TANDON, P. K., SHUKLA, R. C. & SINGH, S. B. 2013. Removal of Arsenic(III) from Water with Clay-Supported Zerovalent Iron Nanoparticles Synthesized with the Help of Tea Liquor. Industrial & Engineering Chemistry Research, 52, 10052-10058.
ÜZÜM, Ç., SHAHWAN, T., EROĞLU, A. E., HALLAM, K. R., SCOTT, T. B. & LIEBERWIRTH, I. 2009. Synthesis and characterization of kaolinite-supported zero-valent iron nanoparticles and their application for the removal of aqueous Cu2+ and Co2+ ions. Applied Clay Science, 43, 172-181.
430
Table of Contentsfor this manuscript

INTERACTIONS OF SURFACE ACTIVATED HALLOYSITE NANOTUBE WITH IMIDACLOPRID
Md Nuruzzaman1,2,3, Yanju Liu1,2,3, Ravi Naidu1,2
1Global Centre for Environmental Remediation (GCER), ATC Building, University of
Newcastle, Callaghan, NSW 2308, AUSTRALIA 2Coopertive Research Centre for Contamination Assessment and Remediation of the
Environment (CRC CARE), ATC Building, University of Newcastle, Callaghan, NSW 2308, AUSTRALIA
3Coopertive Research Centre for High Performance Soils (Soil CRC), IDC Building, University of Newcastle, Callaghan, NSW 2308, AUSTRALIA
INTRODUCTION Halloysite nanoclay is considered as natural wonder and true representative of nature-based nanomaterial because of its tubular structure having an external diameter within nano-range (<100nm). The tubular structure is built by coiling of a 1:1 type aluminosilicate layer leaving an inner core or free void space known as lumen (Fig. 1). Thus, this clay is also termed as halloysite nanotube (HNT) (Yuan et al., 2015). The chemical structure of HNT is Al2SiO5(OH)4.nH2O where ‘n’ indicates the presence or absence of water. Due to coiled structure, HNT possess two distinct positively charged inner and negatively charged outer surfaces which consists of mainly aluminol group (Al−OH) and siloxane group (Si−O−Si) respectively. The versatile structure, surface properties, natural sources and abundance made HNT a superior nanocarrier for delivery of a wide range of chemicals and bioactive agents (Lvov et al., 2016) including pesticide (Scarfato et al., 2016; Tan et al., 2015). To make the delivery system sustainable for organics such as pesticide, it is important to ensure high loading capacity as well as controlled releasing ability of the loaded active ingredients (AIs). So far, various processes have been investigated to increase the loading capacity of active molecules into HNT such as enlargement of lumen diameter, enlargement of interlayer space, surface functionalization, surface modification, thermal treatment and so on. In an earlier study, it was observed that with acid treatment lumen diameter enlarged because the siloxane group present at the outer surface remained unreactive with acid. It is expected that though HNTs contain a very low amount of organic matter, acid treatment is likely to increase surface functional group (-OH). As a result, along with entrapment, the pesticide will be loaded to HNT via adsorption that will control the release of AIs more effectively. Hence, this study was carried out to investigate the possible interactions of a model pesticide namely, imidacloprid (C9H10ClN5O2) with surface activated HNT. METHODS Surface activation The pristine HNT used in this experiment were purchased from Sigma Aldrich, Australia and was denoted as H0. To enlarge the lumen structure and surface activation, HNT was etched with sulphuric acid by dealumination process with a little modification (Abdullayev et al., 2012). The dealumination process takes place in three steps as diffusion of hydrogen ions into the inner tube, chemical reaction with alumina and transport of the reaction products out of the lumen (Abdullayev et al., 2012). In brief, a certain amount of HNT was dispersed in 40 mL of 1.0 M sulphuric acid. The suspension was magnetically stirred on a hot plate for a certain period (optimized earlier) to obtain surface activated HNT that was denoted as Hac. The resulting mixtures were washed with Milli-Q (MQ) water properly and was dried in an oven at 60°C. Finally, the samples represented a white solid that was easily crushed into powder using mortar.
T32e
Copyright © CRC CARE Pty. Ltd., 2019
CleanUp Conference 2019Adelaide, Australia
8 –12 September 2019431
Table of Contentsfor this manuscript

Interactions of imidacloprid with surface activated HNT The interactions of imidacloprid with surface activated HNT was evaluated by sorption capacity of H0 and Hac using batch experiments. RESULTS AND DISCUSSION
• The enlargement of lumen structure was observed in TEM images of H0 and Hac (Fig. 1b) which was further confirmed by surface area and pore size analysis. Due to acid treatment, the surface area increased from 49.24 m2g-1 to 70.51 m2g-1.
• From the batch experiment, it was observed that imidacloprid sorption capacity of Hac increased to double compared to H0 at mild alkanine condition (at pH 8.0-8.5).
• FTIR analysis shows significant changes in characteristic peaks belongs to structural –OH groups as well as stretching vibration of Si-O that indicated structural deformation resulting from transformation of Si-O to Si-OH (Fig 1c).
• The physicochemical properties of imidacloprid indicated its hydrogen bonding potential; hence, sorption capacity of imidacloprid to Hac was increased.
Fig.1. showing a. SEM image pristine HNT, b. TEM images of H0 and Hac and c. FTIR spectra of H0 and Hac CONCLUSIONS The dealumination process significantly enhanced structural changes and functional groups that influenced on enlargement of lumen structure as well as formation of silanol (Si-OH) groups. Therefore, acid treated HNT could be a potential carrier for imidacloprid delivery where a sustained releasing behaviour will be observed due to the hydrogen bonding interaction between structural-OH of Hac and imidacloprid. REFERENCES Abdullayev, E., Joshi, A., Wei, W., Zhao, Y., and Lvov, Y. (2012). Enlargement of Halloysite
Clay Nanotube Lumen by Selective Etching of Aluminum Oxide. ACS Nano 6, 7216-7226. Lvov, Y., Wang, W., Zhang, L., and Fakhrullin, R. (2016). Halloysite Clay Nanotubes for
Loading and Sustained Release of Functional Compounds. Advanced Materials 28, 1227-1250.
Scarfato, P., Avallone, E., Incarnato, L., and Di Maio, L. (2016). Development and evaluation of halloysite nanotube-based carrier for biocide activity in construction materials protection. Applied Clay Science.
Tan, D., Yuan, P., Annabi-Bergaya, F., Dong, F., Liu, D., and He, H. (2015). A comparative study of tubular halloysite and platy kaolinite as carriers for the loading and release of the herbicide amitrole. Applied Clay Science 114, 190-196.
Yuan, P., Tan, D., and Annabi-Bergaya, F. (2015). Properties and applications of halloysite nanotubes: recent research advances and future prospects. Applied Clay Science 112–113, 75-93.
432
Table of Contentsfor this manuscript

REMOVAL OF PERFLUOROOCTANOIC ACID (PFOA) FROM CONTAMINATED WATER BY COBALT ZINC FERRITES
(Co0.5Zn0.5Fe2O4) NANOCRYSTALS
Sudeep Shukla1, Prem Gupta2, Deepika Pandey1, Shruti Dutta1, Preeti Thakur3, Atul Thakur4
1Amity School of Earth and Environmental Sciences, Amity University Haryana, Gurgaon, 122413, INDIA
2Diagno Lab, 138 Pace City-1, Sector 1, Gurgaon, 122001, INDIA 3Amity School of Applied Sciences, Amity University Haryana, Gurgaon, 122413, INDIA 4Amity Center of Nanotechnology, Amity University Haryana, Gurgaon, 122413, INDIA
INTRODUCTION Perfluoroalkyl and polyfluoroalkyl substances (PFASs) (Stockholm convention, 2009) have been identified as a class of ubiquitous, non-degradable, persistent organic pollutants (Kaboré et al., 2018). Once introduced to surface water and groundwater, PFASs pose a serious threat to human health. Compounds such as PFOA and PFOS have an adverse health impact on kidney, liver, immune system, thyroid gland and may also induce cancer. It is also reported that PFASs (such as PFOS and PFOA) exposure results in its accumulation in liver and serum, causing serious hepatotoxicity that may lead to the formation of adenomas in the liver and thyroid tissue. Several reports also highlight the induction of neoplasm of male reproductive system and bladder (Banzhaf et al., 2017). In the present study, batch studies were carried out to estimate the remedial potential of synthesised nanocrystals against a spiked aqueous solution of PFOA. Remedial efficiency of synthesised material was investigated at various pH, dose and temperature condition to find the optimum remedial efficiency. METHODS
Synthesis of nanocrystals The cobalt zinc ferrites were prepared by wet chemical citrate precursor method in the presence of oxygen and citric acid used as a chelating agent (Rana et al. 2015). The high purity analytical grade of reagents procured from Merck, India were used as raw materials for the synthesis. The chemicals were weighed in the required stoichiometric ratio. The clear solution of the metal nitrates was obtained in separate beakers in triple distilled water and then mixed together. In another beaker citric acid was dissolve and added slowly to the metal nitrates solution under constant stirring. The obtained citrate complex of metal nitrates was placed under constant heating at 40°C and constant stirring. The process was carried out until a brownish residue of ferrite metal oxide was obtained.
Characterization of nanocrystals Synthesized nanocrystals were characterized by Transmission electron microscopy (TEM), Scanning electron microscopy (SEM) and X-ray powder diffraction (XRD). TEM image was taken at 300000 X , operating at 10kV. SEM image has been taken 1, 20,000 X direct magnification, to understand the surface morphological features of the synthesised material. Panalytical X-Pert Pro Diffractometer with CuKα (λ =1.54 Å) radiations was used for the identification of phase formation.
Batch studies A series of batch adsorption studies were conducted. A known concentration of PFOA 100 µg/L solution was prepared with adding PFOA salt (Sigma) in MiliQ grade water. The studies were conducted at variable pH, temperature and nanocrystals dose condition The test was conducted in 50 ml polypropylene vials under anoxic conditions. Samples were withdrawn from 50 ml vial at a fixed time interval. These extracted samples were further subjected to external magnetic field. The concentration of PFOA in the filtrate was analysed
T32f
Copyright © CRC CARE Pty. Ltd., 2019
CleanUp Conference 2019Adelaide, Australia
8 –12 September 2019433
Table of Contentsfor this manuscript

by Liquid chromatography tandem-mass spectrometry (Agilent 1100 LC system (Agilent Technologies) coupled to an API 4000 mass spectrometer (AB Sciex)). The removal efficiency of the synthesised nanocrystals of calculated by using following equation:
Where C1= Initial PFOA concentration (in solution) C2= Final PFOA concentration (in solution)
RESULTS AND DISCUSSION TEM image of Co0.5Zn0.5Fe2O4 nanocrystals in Figure 1 shows the average crystallite size of nanocrystal is 15-25 nm. The topographical features reveal the cubic spinel symmetry of synthesized nanocrystals. Fig 2 shows the SEM micrograph of Co0.5Zn0.5Fe2O4 nanocrystals confirming the homogeneous formation of cubic spinel morphology of the cobalt zinc ferrite with porous region. Figure 3 shows the X-Ray Diffractometer pattern of as-prepared Co0.5Zn0.5Fe2O4 revealing the formation of cubic spinel phase with most prominent peaks at (220), (311), (400), (422), (511), (440) showing consistency with JCPDS card number 22-1086 (CoFe2O4) and 22- 1012 (ZnFe2O4). Batch studies clearly indicate that the concentration of PFOA kept reducing with time with an equilibrium time of optimum absorption was observed to be at 90 minutes. The batch studies also indicate that with the increase in the dose of nanoparticle, adsorption efficiency increases.
CONCLUSIONS The cobalt zinc ferrites nanocrystals were prepared by wet chemical citrate precursor method. Synthesised nanocrystals were found to be colloidal stable at various pH conditions. The synthesized nanocrystals effectively adsorbed PFOA compounds within a short time span (90 minutes). The adsorbed aggregate could be segregated from the contaminate aquatic system under the influence of the magnetic field. REFERENCES Kaboré, H.A., Duy, S.V., Munoz, G., Méité, L., Desrosiers, M., Liu, J., Sory, T.K. and Sauvé,
S. (2018) Worldwide drinking water occurrence and levels of newly-identified perfluoroalkyl and polyfluoroalkyl substances. Science of the Total Environment, 616, pp.1089-1100.
Banzhaf, S., Filipovic, M., Lewis, J., Sparrenbom, C.J. and Barthel, R. (2017) A review of contamination of surface-, ground-, and drinking water in Sweden by perfluoroalkyl and polyfluoroalkyl substances (PFASs). Ambio, 46(3), pp.335-346.
Rana, K., Thakur, P., Sharma, P., Tomar, M., Gupta, V. and Thakur, A. (2015) Improved structural and magnetic properties of cobalt nanoferrites: influence of sintering temperature. Ceramics International, 41(3), pp.4492-4497.
Figure1. TEM image of synthesised cobalt zinc ferrites
Figure2. SEM image of synthesised cobalt zinc ferrites
Figure 3. SEM image of synthesised cobalt zinc ferrites
ff e 1 21
434
Table of Contentsfor this manuscript

MANAGING LNAPL SITES WITH NATURAL SOURCE ZONE DEPLETION — WHEN IS IT THE RIGHT PATH?
Andre Smit1, Matt Rousseau2, Peter Nadebaum3, Therese Hammond3
1GHD Pty Ltd, 15/133 Castlereagh Street, Sydney, 2000, AUSTRALIA
2GHD Ltd, 1880 Assumption Street, Unit 200, Windsor, Ontario N8Y 1C4, CANADA 3GHD Pty Ltd, 180 Lonsdale Street, Melbourne, 3000, AUSTRALIA
INTRODUCTION CRC CARE has been preparing guidance on the use of Natural Source Zone Depletion (NSZD) as a sustainable management response to light non-aqueous phase hydrocarbon (LNAPL) contamination in the subsurface, where appropriate. CRC CARE has previously prepared guidance on the assessment and management of LNAPL, and is now extending this suite of guidance to include NSZD. Technical guidance on the practical aspects of the measurement of NSZD has been prepared (CRC CARE Technical Report No 44), and guidance is now in the course of preparation relating to the applicability of NSZD at different points in an LNAPL site management process, including as a practical endpoint in the LNAPL remediation process. The guidance is in late draft and is currently being updated following consultation with regulators and industry, with a view to publication late 2019. While the requirements for remediation of soil and groundwater contamination are determined by the relevant State regulatory environmental agency, there is a generally common approach in Australia to assessment and remediation. Guidance on this is in the process of being formalised with the development of a “National Remediation Framework” (NRF), which is being developed by a regulator-industry working group coordinated by CRC CARE. The NRF provides guidance on the decision basis for determining the remedial approach, and the principles that apply. These include taking a risk-based approach, identifying and assessing technology options taking into account a hierarchy of alternative approaches, and sustainability. In terms of groundwater contamination, a preferred approach is to apply natural attenuation, if the risk and temporal aspects are acceptable. AIMS In this context, the aim of the draft NSZD guidance is to present a review of information on important aspects relating to LNAPL management and remediation, including migration and plume stability, recoverability, the residual LNAPL that will remain, the relative rate and role of NSZD in depleting residual LNAPL, the risk posed by the residual, and when it can be concluded that NSZD can be the adopted approach for dealing with residual LNAPL at a site. Australian case study information is also considered for assessing the degradation rates of LNAPL in a variety Australian conditions, relative to rates of LNAPL recovery using conventional active methods such as skimming and vacuum extraction. FINDINGS NSZD acts on all LNAPL including the residual fraction that will not be significantly affected by conventional LNAPL recovery/remedial techniques. NSZD LNAPL depletion rates can also rival or exceed what can be achieved through conventional means without the associated costs in terms of financial expenditure, environmental footprint or remedial risk. NSZD rates observed in Australia are comparable to or higher than what are considered typical in North America where NSZD has been studied longer. Based on this understanding, it is considered that the application of NSZD can be considered at different stages of LNAPL site management, including:
• During LNAPL Conceptual Site Model (LCSM) development as a baseline evaluation of LNAPL degradation, and to better understand and support conclusions regarding LNAPL stability.
T33a
Copyright © CRC CARE Pty. Ltd., 2019
CleanUp Conference 2019Adelaide, Australia
8 –12 September 2019435
Table of Contentsfor this manuscript

• During remedial options assessment as a component of a remedial/management strategy, and to better understand the incremental benefits of active LNAPL recovery compared with the NSZD.
• During remediation/management as a primary LNAPL management technique; as a secondary approach following active recovery methods; and/or as a consideration when determining whether an acceptable end-point to active remediation has been reached.
• At sites where LNAPL bodies and dissolved plumes have stabilised and there are no unacceptable exposure/risk scenarios, NSZD can constitute an important part of a holistic, sustainable approach to LNAPL site management.
436
Table of Contentsfor this manuscript

NATURAL SOURCE ZONE DEPLETION (NSZD) ASSESSMENT OF A COMPLEX SITE USING CO2 EFFLUX METHOD
G. Cozens1, J. Duran1, I. Hers1, J. Rayner2, M. Donn2
1Golder Associates PO Box 6079, Hawthorn West, 3122, AUSTRALIA
2CSIRO Land and Water, Private Bag No. 5, PO Wembley, 6193, AUSTRALIA [email protected]
INTRODUCTION A baseline Natural Source Zone Depletion (NSZD) assessment was undertaken for Light Non-Aqueous Phase Liquid (LNAPL) plumes, prior to active remediation, at a site located in Melbourne, Victoria. From a NSZD perspective the site is considered to be complex as the underlying aquifer is comprised of fractured volcanic rock (basalt) and the surface is largely paved. As such it poses challenges for deriving NSZD rates using most methods. The depth to groundwater ranges between approximately 7 to 9 metres below ground surface, and the groundwater at the site is impacted with petroleum hydrocarbons, with the largest LNAPL plumes extending over an area of approximately 4 Ha. NSZD is of significance because it occupies a position in the spectrum both site characterisation and as a management measure that can be used as a basis for comparing the practicability and relative benefit of active remediation options. This study measured CO2 efflux which can be converted to an estimate of petroleum hydrocarbon losses by using appropriate stoichiometric ratios and an understanding of background (naturally occurring) CO2 efflux. METHODS A staged approach was adopted to evaluate the application of the CO2 efflux measurements at the site. Initial screening was undertaken at existing openings in the paved surface (such cracks and joins in concrete) to confirm CO2 efflux could be measured. Screening was carried out with a relatively inexpensive CO2 meter placed within a chamber sealed over the pavement opening. The second stage involved development and trial of an innovative approach that could be replicated across the site with minimal impact to the paved surface, while also alleviating the potential for bias from CO2 channelling (“chimney effect”). This was done by coring 25 holes in the paved surface on a 5x5 grid and measuring CO2 at each cored location. The final stage scaled up this approach but using a more robust measurement technique with a dynamic closed chamber (DCC). The DCC was deployed at 14 locations (including both paved and unpaved areas), with 12 of these over the inferred LNAPL plume and two at background locations. Some of the paved locations were completed as a single core hole to compare to results from the 5x5 core grids. RESULTS AND DISCUSSION The screening with a CO2 meter confirmed that efflux could be recorded at the site. An example of a data plot from this meter is presented in Figure 1. The CO2 concentration verses time plots can be used to estimate CO2 flux through the surface opening, however, with the accuracy of this meter it was only considered as a semi-quantitative result. Data from the DCC was processed and results screened against data quality objectives (example output from the DCC presented in Figure 1). Background readings were subtracted from primary results (i.e. locations over plumes) to estimate efflux from hydrocarbon degradation. Results from the 5x5 grids were in similar flux range for each point in the grid (refer example in Figure 2), with no discernible evidence of edge effects (i.e. potential channelling of flux from the surrounding sealed surface); therefore, overall flux from these locations was taken as mean of all grid points. A clear bias was observed from the single pavement core locations, with the average flux from these locations nearly 10 times that of the grid locations.
T33b
Copyright © CRC CARE Pty. Ltd., 2019
CleanUp Conference 2019Adelaide, Australia
8 –12 September 2019437
Table of Contentsfor this manuscript
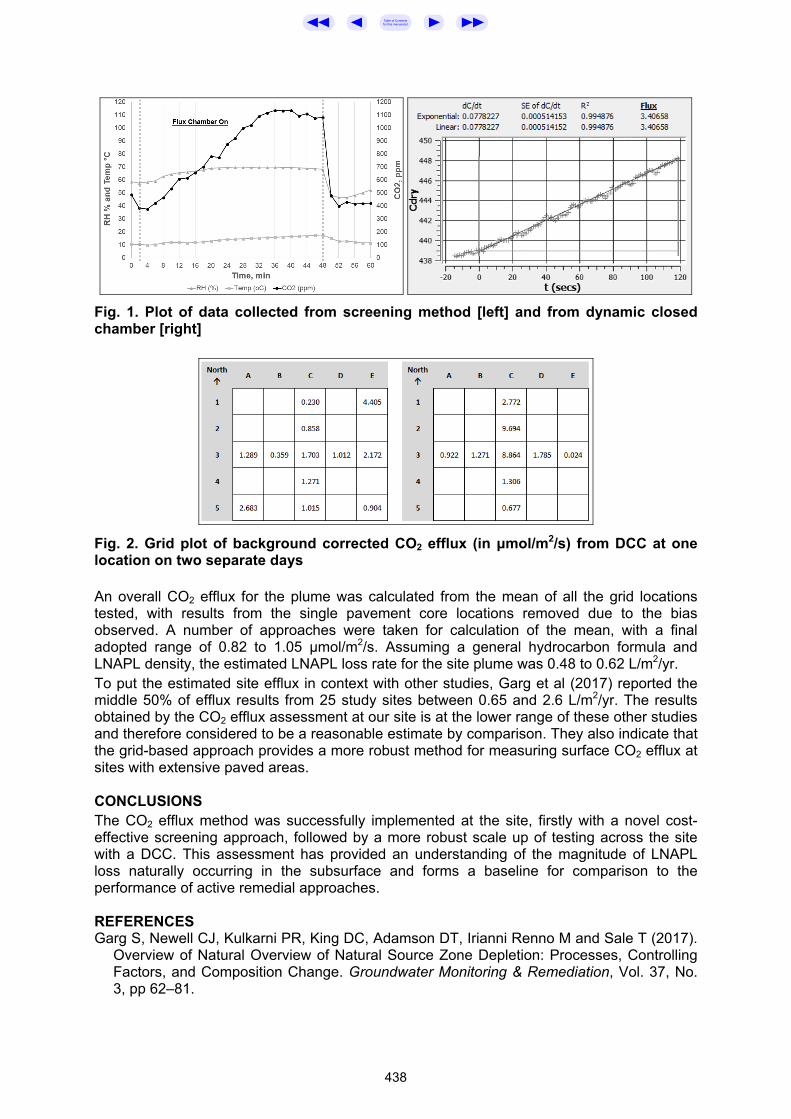
Fig. 1. Plot of data collected from screening method [left] and from dynamic closed chamber [right]
Fig. 2. Grid plot of background corrected CO2 efflux (in μmol/m2/s) from DCC at one location on two separate days An overall CO2 efflux for the plume was calculated from the mean of all the grid locations tested, with results from the single pavement core locations removed due to the bias observed. A number of approaches were taken for calculation of the mean, with a final adopted range of 0.82 to 1.05 μmol/m2/s. Assuming a general hydrocarbon formula and LNAPL density, the estimated LNAPL loss rate for the site plume was 0.48 to 0.62 L/m2/yr. To put the estimated site efflux in context with other studies, Garg et al (2017) reported the middle 50% of efflux results from 25 study sites between 0.65 and 2.6 L/m2/yr. The results obtained by the CO2 efflux assessment at our site is at the lower range of these other studies and therefore considered to be a reasonable estimate by comparison. They also indicate that the grid-based approach provides a more robust method for measuring surface CO2 efflux at sites with extensive paved areas. CONCLUSIONS The CO2 efflux method was successfully implemented at the site, firstly with a novel cost-effective screening approach, followed by a more robust scale up of testing across the site with a DCC. This assessment has provided an understanding of the magnitude of LNAPL loss naturally occurring in the subsurface and forms a baseline for comparison to the performance of active remedial approaches. REFERENCES Garg S, Newell CJ, Kulkarni PR, King DC, Adamson DT, Irianni Renno M and Sale T (2017).
Overview of Natural Overview of Natural Source Zone Depletion: Processes, Controlling Factors, and Composition Change. Groundwater Monitoring & Remediation, Vol. 37, No. 3, pp 62–81.
438
Table of Contentsfor this manuscript

WHAT LIES BENEATH? HIGH RESOLUTION SITE CHARACTERISATION TOOLS USED TO
DEVELOP LNAPL CONCEPTUAL SITE MODELS
Scott Robinson, Daniel Der Tateossian, Chris Arends
AECOM, Level 21, 420 George Street, Sydney, 2000, AUSTRALIA [email protected]
INTRODUCTION The relationships between observing light non-aqueous phase liquid (LNAPL) in a well and then understanding the amount of LNAPL in the ground, the ability of the LNAPL to migrate, and the potential risks presented to receptors are often complex and mis-understood. Unfortunately, often the default assumptions to LNAPL observations are to overestimate the amount in the formation, its mobility, and the potential risk it presents. High resolution site characterisation (HRSC) tools are designed to collect environmental data at the appropriate scale where heterogeneities in the subsurface control the migration and distribution of contaminants. HRSC is not just tools to collect field data but also involves interpretation, strategies, methodologies, and management/field practices. HRSC was used to develop robust LNAPL conceptual site models (LCSMs) at three sites.
• Site 1 is an active service station site with multi-walled tanks and HDPE lines. It has a central tank farm. No active leak was identified but LNAPL was observed in a monitoring well during the bi-annual monitoring of Underground Petroleum Storage System (UPSS). Limited sub-surface information from the existing four monitoring wells was available.
• Site 2 was a 7,200 m2 fuel depot decommissioned in 2003. The site had seven underground storage tanks (USTs), three aboveground storage tanks (ASTs), fill gantry, interceptor unit, pipe work, fuel bowsers, fill points, and there was an adjacent fuel depot on the cross-gradient boundary. Previous site assessment works had been undertaken with the installation of 16 monitoring wells.
• Site 3 was a release from a fuel pipeline. The area of investigation was 21,330 m2 which included a car park, recreational facilities, and a creek. There was no monitoring well network and no historical sub-surface investigations to inform the investigation.
METHODS A combination of HRSC tools was used during fieldworks at the three sites:
• Hydraulic Profiling Tool (HPT) measures changes in the required pore entry pressure of the stratum. This correlates with media permeability and allows for vertical profiling of hydrostratigraphic information to better understand the stratigraphy and migration pathways.
• Membrane Interface Probe (MIP) is an in-situ sampling device that can be used to vertically delineate the distribution of sorbed, vapour, and dissolved phase Volatile Organic Compounds (VOCs).
• Laser Induced Fluorescence (LIF), also known as Ultra Violet Optical Screening Tool (UVOST), utilizes in-situ fluorescence spectroscopy to locate LNAPL.
At all three sites, the results of the HRSC tools were used to inform the installation of new monitoring wells locations and these bores were logged for comparison to the HRSC tool results. LNAPL samples were analysed for chromatogram identification, viscosity, and density. Baildown tests were undertaken to determine the LNAPL transmissivity (Tn). Hydrostratigraphs were used to assess the hydrodynamics of the LNAPL. This data assessment allowed for an understanding of how the LCSM could change over time due to changes in groundwater levels.
T33c
Copyright © CRC CARE Pty. Ltd., 2019
CleanUp Conference 2019Adelaide, Australia
8 –12 September 2019439
Table of Contentsfor this manuscript

RESULTS AND DISCUSSION Site 1 — Service Station Groundwater was observed to be confined in the more permeable sand layers in the clay aquifer. The predominant clay geology limited the rate and extent of LNAPL migration. The clay layer hosts sand and gravel stringers which appeared to be acting as a preferential pathways as indicated by the LIF and HPT data. The LNAPL was identified as weathered unleaded petrol using LIF, viscosity, density, and chromatograms. The LNAPL near fuel lines of the site appeared to be mobile and recoverable. Based on HRSC inputs, a skimming system was set up to recover LNAPL and impede further migration. The LCSM showed that changes in groundwater levels had the ability to greatly affect the localised mobility/recoverability of LNAPL. Currently the LNAPL Tn values are low and the system is off to assess for potential rebound effects. Site 2 — Former Depot LNAPL was observed in 10 of 16 wells at thicknesses up to 2 m. LIF identified impacts near the former USTs and ASTs that were perched at 2 m on a Clay layer and perched at 6 m in a gravelly Clay layer overlying sandy Clay. LIF did not identify impacts at 10 m depth where groundwater was observed. Hydrostratigraphs confirmed the perched nature of the LNAPL; therefore, the in-well thickness was exaggerated compared to formation thickness. Low Tn values also supported the low potential for mobility/recoverability. Based on the updated LCSM, no active remediation was required, and the EPA ceased regulation. Site 3 — Fuel Pipeline Two water bearing units were observed. Shallow perched water was reported discontinuously in Fill at an average depth of 2.4 m. The fill was underlain by sandy gravelly Clay. Deeper confined groundwater was encountered within siltstone/shale below 7.5 m depth. Three locations had jet fuel identified by LIF. LNAPL was not observed during drilling or suggested based on the soil and dissolved phase analytical data. It is likely that this LNAPL was residual, and was trapped in the vadose zone pore spaces. The bulk of the fuel impacts appeared to have been constrained within the more permeable backfill of the pipeline trench and was subsequently removed during excavation and repairs. There appeared to be places where jet fuel impacts migrated along the permeable backfill of intersecting service trenches. The initial pressure head during the leak would have driven impact migration through these more permeable pathways but now with the primary, and much of the secondary source removed, any remaining jet fuel was likely to be residual in pore spaces and unable to migrate. Impacts do not appear to have migrated vertically into the deeper confined groundwater aquifer. Further LNAPL recovery was not required based on the LCSM. CONCLUSIONS The use of HRSC tools during field works allowed for real time data assessment and adjustment of field sample locations. The outputs provided an in-depth understanding of whether LNAPL was residual, entrapped, or potentially mobile and recoverable. Development of a robust LCSM from the HRSC process allowed for timely risk based assessments on whether targeted remediation was required. HRSC provided sustainability benefits through reduced mobilisations, decreased exposure to health and safety risks at active sites, reduced number of wells required, targeted wells on known impacts, less temporal data needed to establish conclusions, and less futile efforts at LNAPL removal based on an informed LCSM. ACKNOWLEDGMENTS Thanks to Viva Energy Australia Pty Ltd for supporting this presentation of data from their sites.
440
Table of Contentsfor this manuscript
NATURAL SOURCE ZONE DEPLETION ASSESSMENT USING SOIL FLUX DATA —
PASSIVE FLUX TRAP VERSUS STATIC FLUX BOX METHODS
Bobby Wang, Danny McDonald
Cardno Victoria Pty Ltd, 501 Swanston St, Melbourne, VIC 3000, AUSTRALIA
INTRODUCTION Natural Source Zone Depletion (NSZD) is a term used to describe the collective, naturally occurring processes of dissolution, volatilisation, and biodegradation that result in mass losses of LNAPL petroleum hydrocarbon constituents from the subsurface (CRC CARE, 2018). Biodegradation of LNAPL in the vadose-zone can account for more than 90% of the overall NSZD that is occurring within any given petroleum hydrocarbon source-zone. Use of the passive flux trap method (i.e. E-Flux) is a well-documented method of NSZD assessment via measurement of the rate of carbon dioxide efflux at the ground surface (CRC CARE, 2018). However, this method has some key constraints, including not being able to measure any surface efflux of volatile organic compounds (VOCs) or methane, has a long turn-around time for results, and is expensive. Cardno has adapted the static flux box method commonly used in the landfill gas assessment industry (per EA UK 2010 guidance) for the purpose of NSZD assessment based on the principle that NSZD can be quantified by the efflux rate of key gases (carbon dioxide, VOCs and methane) at the ground surface. To evaluate the accuracy, precision and general benefits of this method, Cardno has undertaken a study at a petroleum hydrocarbon impacted site where the two methods are used side-by-side to quantify the rate of NSZD. METHODS Seven assessment locations were selected across the source-zone to provide representative coverage. Each location was assessed using one flux trap and one flux box. The flux trap was deployed for two weeks, whilst the flux box consisted of three monitoring rounds, each lasting up to two hours in duration, undertaken over three consecutive days. For the flux boxes, a Non-Dispersive Infrared (NDIR) sensor was used to log the build-up of carbon dioxide gas within the closed chamber at 10 second intervals. NDIR sensors are ideal for such monitoring systems as they do not change the concentration or destroy the gas of interest. The rate of carbon dioxide build-up within the closed chamber of known volume can then be stoichiometrically equated to a NSZD rate. A photo ionisation detector and GA5000 were used to measure initial and final VOCs and methane concentrations within the box, respectively, during each monitoring round. Multiple readings of ambient temperature and barometric pressure were also taken throughout each day of flux box monitoring. Two background locations were also selected for the flux box method as this method needs to account for background soil respiration. The flux trap method does not require background locations as it uses isotope (14C) analysis to correct for background respiration. RESULTS AND DISCUSSION A comparison of flux trap and flux box results is presented in Table 1. The NSZD rate estimated by the two methods are within one order of magnitude of each other, with the flux trap method generally reporting a higher result than the flux box method. It is understood that NSZD measurement results from different methods at the same location rarely match due to the inherent assumptions and potential biases arising from equipment and ambient factors (CRC CARE, 2018).
T33d
Copyright © CRC CARE Pty. Ltd., 2019
CleanUp Conference 2019Adelaide, Australia
8 –12 September 2019441
Table of Contentsfor this manuscript
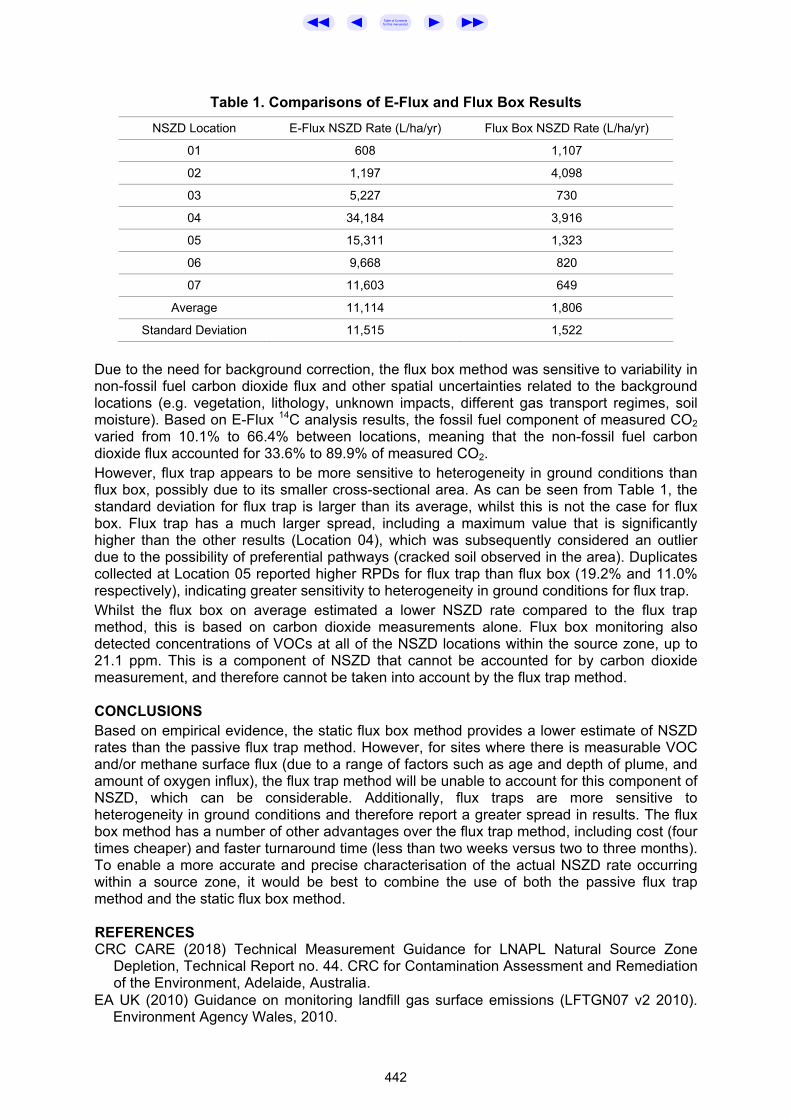
Table 1. Comparisons of E-Flux and Flux Box Results NSZD Location E-Flux NSZD Rate (L/ha/yr) Flux Box NSZD Rate (L/ha/yr)
01 608 1,107
02 1,197 4,098
03 5,227 730
04 34,184 3,916
05 15,311 1,323
06 9,668 820
07 11,603 649
Average 11,114 1,806
Standard Deviation 11,515 1,522 Due to the need for background correction, the flux box method was sensitive to variability in non-fossil fuel carbon dioxide flux and other spatial uncertainties related to the background locations (e.g. vegetation, lithology, unknown impacts, different gas transport regimes, soil moisture). Based on E-Flux 14C analysis results, the fossil fuel component of measured CO2 varied from 10.1% to 66.4% between locations, meaning that the non-fossil fuel carbon dioxide flux accounted for 33.6% to 89.9% of measured CO2. However, flux trap appears to be more sensitive to heterogeneity in ground conditions than flux box, possibly due to its smaller cross-sectional area. As can be seen from Table 1, the standard deviation for flux trap is larger than its average, whilst this is not the case for flux box. Flux trap has a much larger spread, including a maximum value that is significantly higher than the other results (Location 04), which was subsequently considered an outlier due to the possibility of preferential pathways (cracked soil observed in the area). Duplicates collected at Location 05 reported higher RPDs for flux trap than flux box (19.2% and 11.0% respectively), indicating greater sensitivity to heterogeneity in ground conditions for flux trap. Whilst the flux box on average estimated a lower NSZD rate compared to the flux trap method, this is based on carbon dioxide measurements alone. Flux box monitoring also detected concentrations of VOCs at all of the NSZD locations within the source zone, up to 21.1 ppm. This is a component of NSZD that cannot be accounted for by carbon dioxide measurement, and therefore cannot be taken into account by the flux trap method. CONCLUSIONS Based on empirical evidence, the static flux box method provides a lower estimate of NSZD rates than the passive flux trap method. However, for sites where there is measurable VOC and/or methane surface flux (due to a range of factors such as age and depth of plume, and amount of oxygen influx), the flux trap method will be unable to account for this component of NSZD, which can be considerable. Additionally, flux traps are more sensitive to heterogeneity in ground conditions and therefore report a greater spread in results. The flux box method has a number of other advantages over the flux trap method, including cost (four times cheaper) and faster turnaround time (less than two weeks versus two to three months). To enable a more accurate and precise characterisation of the actual NSZD rate occurring within a source zone, it would be best to combine the use of both the passive flux trap method and the static flux box method. REFERENCES CRC CARE (2018) Technical Measurement Guidance for LNAPL Natural Source Zone
Depletion, Technical Report no. 44. CRC for Contamination Assessment and Remediation of the Environment, Adelaide, Australia.
EA UK (2010) Guidance on monitoring landfill gas surface emissions (LFTGN07 v2 2010). Environment Agency Wales, 2010.
442
Table of Contentsfor this manuscript

THE USE OF NATURAL SOURCE ZONE DEPLETION (NSZD) AS A VALID APPROACH TO ACHIEVE CLOSURE OF AN
ACTIVE LNAPL RECOVERY SYSTEM
Ruben Espinosa1, David Alcalde2
1AECOM Australia Pty Ltd, 3 Forrest Place, Perth, WA, 6000, AUSTRALIA 2AECOM Spain, Alfonso XII 62, Madrid, 28014, SPAIN
INTRODUCTION The concept of Natural Source Zone Depletion (NSZD) has been gaining acceptance within regulatory agencies and industry as a useful tool to understand natural attenuation of Light Non-aqueous Phase Liquids (LNAPL) bodies. NSZD can be incorporated as an additional metric in the evaluation of endpoints for active remediation systems or even constitute a viable remedial option by itself. This case study presents the approach followed to address various diesel historical spill events at a refinery in the northern coast of Spain. Preliminary site’s corrective action plan considered a plume cut-off barrier with a liner of high-density polyethylene (HDPE) and a series of LNAPL recovery wells installed along the containment infrastructure. This approach was selected to protect an adjacent river and was mainly driven by the presence of important LNAPL thicknesses in the monitoring well network (> 1.5 m) and a poor understanding of the LNAPL conceptual site model (LCSM). AECOM applied well-established concepts of current LNAPL science to re-evaluate the site and further develop the LCSM by implementing limited additional investigation aimed at re-assessing the NAPL distribution and saturation profiles throughout the site, determine the NAPL transmissivity values and assess ‘real’ as opposed to ‘perceived’ NAPL migration risks. A revised Remedial Action Plan (RAP) was developed focusing on targeted LNAPL removal through active and passive skimming at selected hot spots, achieving important cost saving for the overall program and incorporating NSZD as an important component of the remedial strategy. METHODS The project started with the re-evaluation of existing available information and the implementation of targeted site characterisation activities, comprising:
• A critical review of existing environmental dataset and implementation of a detailed study of the tidal cycle and its influence on groundwater flow dynamics
• Re-evaluation of site’s risk profile involving both, NAPL migration and human health risks and dissolved phase discharge to the adjacent river by: o The determination of LNAPL distribution and saturation profiles and NAPL
transmissivity via additional soil sampling and bail down tests o The implementation of additional slug tests to better assess hydraulic conductivity
throughout the site o The better understanding of the relationship between observed LNAPL
thicknesses in the wells and the tide cycle • Design and implementation of an appropriate LNAPL recovery remedial system to
address potential issues based on the results of the additional works • Definition of revised performance metrics and pragmatic remedial end-points based
on a cost / benefit analysis • Assessment of NSZD rates at the site by the implementation of six (6) CO2 flux traps
throughout the LNAPL plume and the application of 14C analyses to differentiate petroleum hydrocarbon-derived CO2 from modern CO2
T33e
Copyright © CRC CARE Pty. Ltd., 2019
CleanUp Conference 2019Adelaide, Australia
8 –12 September 2019443
Table of Contentsfor this manuscript

• Incorporation of NSZD results and other lines of evidence to inform the decision process and guide the active remediation project to closure.
RESULTS AND DISCUSSION Additional site characterisation activities showed that the main LNAPL body was located between 1.5 and 2.5 meters above sea level (m.a.s.l). The average NAPL saturation was estimated at 13%, with low transmissivity values in the range of 0.02 to 0.05 m2/d, indicative of very low LNAPL mobility and recoverability. The thickness of LNAPL in the wells were found to be heavily influenced by the tidal cycle, being maximum at low tide when LNAPL present above the water table is subjected to gravitational forces that cause LNAPL to drain from the pore space and flow into the well. The revised LNAPL skimming system was implemented in the areas of higher NAPL saturation in early 2016 and was operated for approximately 18 months (Feb 2016 to mid 2017) before the NSZD study was undertaken. Total LNAPL volume recovered during this period was approximately 3,700 litres (3.7 m3) with recovery rates during the optimal operational stage ranging between 5 and 15 l/d, which showed a steep decline in the final months of treatment, to rates between 1.7 – 3 l/d. Site’s measured NSZD rates by the CO2 flux traps technology were estimated in 6.6 l/d (2,400 l/year for the complete source area), significantly outperforming the active recovery rates during last stages of treatment. The results of the NSZD study and the decrease in transmissivity values throughout the treatment phase were used as lines of evidence to shut down the system in 2018. LNAPL end-of-treatment transmissivity values were determined to be as low as 0.007 m2/d, an order of magnitude lower than initial values, and below the ‘not recovery’ transmissivity values published by the US Interstate Technology & Regulatory Council - ITRC. CONCLUSIONS This case study constitutes a good example of targeted site characterisation activities, LCSM development and the optimisation of the remedial process, including the incorporation of NSZD as a performance metric to achieve project closure. In light of the declining recovery rates of the LNAPL recovery system, a series of pragmatic endpoints were proposed to shut down the active remediation system:
• Asymptotic trends, defined as recovery rates lower that 0.5 l/d per extraction well • Demonstration of the progressive decrease in NAPL transmissivity values • Demonstration that NSZD outperformed LNAPL extraction rates.
These lines of evidences were successfully used to closure the active remediation stage and progress the site towards a post-remedial monitoring program focused on a selected set of downgradient sentinel wells. To the best knowledge of the authors, this project has been the first case in Spain of regulatory acceptance of NSZD as a ‘passive’ remediation technology and provides valuable insights on how NSZD is being implemented in certain European countries to achieve active remediation project closure. REFERENCES “Evaluating Natural Source Zone Depletion at Sites with LNAPL”. ITRC 2009. “Quantification of Vapor Phase-related Natural Source Zone Depletion Processes”, API
publication 4784, May 2017. “Light Non-Aqueous Phase Liquid (LNAPL) Site Management: LCSM Evolution, Decision
Process and Remedial Technologies (LNAPL-3)”, ITRC, Web Based, 2018. “Technical Report # 44. Technical measurement guidance for LNAPL natural source zone
depletion”, CRC CARE, 2018.
444
Table of Contentsfor this manuscript
BENEFITS OF A MULTIPLE LINES OF EVIDENCE APPROACH FOR NSZD
Steven Gaito1, Jonathon Smith2, Brad Koons3
1AECOM, 10 Orms Street, Suite 400, Providence, 02904, USA
2AECOM, 27777 Franklin Road, Suite 2000, Southfield, 48034, USA 3AECOM, 800 LaSalle Ave, Suite 500, Minneapolis, 55402, USA
steven.gaito, Jonathon.smith, [email protected]
INTRODUCTION The observation of natural source zone depletion (NSZD) rates on the order of hundreds to thousands of gallons per acre, per year (Garg et al. 2017) has elevated the role of NSZD in LNAPL conceptual site model (LCSM) development and site management decision making. NSZD measurements are more frequently utilized to achieve a variety of objectives, from establishing a baseline for evaluating the relative benefit of active remediation to mapping LNAPL distribution (API 2017) and demonstrating LNAPL stability (Mahler et al., 2012). The increased reliance on NSZD data reflects the importance for accurate measurements to support informed management decisions. Processes responsible for NSZD as well as site characteristics and natural background processes that may affect NSZD measurements can be complex. While several methods have been developed to evaluate bulk NSZD rates (API 2017, ITRC 2018), each of the methods rely on simplifying assumptions, and are subject to interferences when implemented under non-ideal conditions. The approach presented highlights the value of incorporating multiple lines of evidence for NSZD assessments to identify the effects of non-ideal conditions on different measurement methods and build confidence in the assessment results among stakeholders. METHODS NSZD assessments were completed at several sites with variable geologic and ground surface cover conditions, including fractured basalt, using multiple lines of evidence, i.e. multiple measurement methods. The project team employed screening methods utilizing existing wells that included a modified gradient method using slow purge of soil gas (Sweeney and Ririe 2017, ITRC 2018), snapshot temperature measurements, and carbon dioxide efflux with dynamic closed chambers (DCC) and passive traps. Results of co-located measurements in space and time were used to identify site attributes that do not conform to the simplifying assumptions of one or more of the methods utilized in the assessment. Additionally, an evaluation of temporal variability for a subset of sites where NSZD measurements were recorded continuously or on a periodic/seasonal basis to highlight potential biases that may arise when relying on measurements made at a single point in time. RESULTS AND DISCUSSION Table 1 provides the estimated NSZD rates at a site with variable thickness of fill and interbedded sands, silts, and clays based on three NSZD methods. The variability of the subsurface resulted in challenging interpretations of soil gas concentration gradients and carbon dioxide flux. Carbon dioxide flux from passive traps underestimated the NSZD rate because shallow fine-grained soils inhibited vertical flux of soil gas. Temperature data was used to establish the aerobic/anaerobic horizon to estimate NSZD rates using soil gas concentration gradients (Sweeney & Ririe, 2014).
T33f
Copyright © CRC CARE Pty. Ltd., 2019
CleanUp Conference 2019Adelaide, Australia
8 –12 September 2019445
Table of Contentsfor this manuscript

Table 1. NSZD rates by Method
NSZD Method Rate (litres/hectare/year)
Snapshot Temperature Profile 5,980
Oxygen Gradient 4,950
Carbon Dioxide Passive Trap 710
CONCLUSIONS Use of multiple lines of evidence for NSZD assessments can help to identify effects of non-ideal conditions and mitigate errors in interpretation that may occur when relying on a single measurement technique. Screening approaches such as temperature profiling and soil gas screening using existing wells (Sweeney and Ririe, 2014; Sweeney and Ririe, 2017), and/or carbon dioxide efflux surveys using a dynamic closed chamber (DCC) can often be completed over the course of a few days. When combined with longer-term averaging techniques such as carbon dioxide traps or thermal monitoring, this approach builds confidence in results, decreases the likelihood of remobilization to collect additional data when results of a single NSZD measurement method are suspect, and provides a basis for selecting a method that is best-suited for longer-term NSZD monitoring, where necessary. REFERENCES American Petroleum Institute, (2017) Quantification of Vapor Phase-Related NSZD
Processes. API Publication 4784, API Regulatory and Scientific Affairs Department Garg, S., Newell, C. J., Kulkarni, P. R., King, D. C., Adamson, D. T., Renno, M. I. and Sale,
T. (2017), Overview of Natural Source Zone Depletion: Processes, Controlling Factors, and Composition Change. Groundwater Monitoring and Remediation. doi:10.1111/gwmr.12219
ITRC (Interstate Technology & Regulatory Council). 2018. LNAPL Site Management: LCSM Evolution, Decision Process, and Remedial Technologies. LNAPL-3. Washington, D.C.: Interstate Technology & Regulatory Council. LNAPL Update Team. https://lnapl-3.itrcweb.org.
Mahler, N., T. Sale and M. Lyverse (2012) A Mass Balance Approach to Resolving LNAPL Stability. Journal of Ground Water. Vol 50, No. 6, pp 861-871.
Sweeney, R.E, and G.T. Ririe. (2014) Temperature as a Tool to Evaluate Aerobic Biodegradation in Hydrocarbon Contaminated Soil. Groundwater Monitoring and Remediation. 34 (3), 41–50.
Sweeney, R.E, and G.T. Ririe. (2017). Small Purge Method to Sample Vapor from Groundwater Monitoring Wells Screened Across the Water Table. Groundwater Monitoring and Remediation. doi:10.1111/gwmr.12230
446
Table of Contentsfor this manuscript

RISK COMMUNICATION — AN EMPIRICAL CANON
Paul Nathanail
LQM, The Sir Colin Campbell Building, Triumph Road, Nottingham NG7 2TU, UK [email protected]
INTRODUCTION Risk based contaminated land management is applied across the globe. The science of chemistry, geology, toxicology transcends cultures and knows no boundaries. The drilling rig, GC/MS and thermal desorption unit will behave in the same way in Adelaide as in Larnaca, or Nottingham. Policy and the law will vary with jurisdiction and scenario. However the challenge of sharing intentions, findings and conclusions with those who will be most affected by the aftermath of managing land affected, or suspected of being affected, by contamination requires a degree of cultural and social awareness and sensitivity that is hard to acquire and rare to deploy correctly. METHODS Presidents have spokespersons, companies have public relations departments but risk assessors are often called upon to share their findings with the local community living on the land that has been investigated. It may therefore at first sight seem unfair to expect the risk assessor or remediation engineer to be able to communicate their findings in a robust yet accessible, accurate yet not alarmist manner. But there is more. Communication is a two way process. The land contamination practitioner needs to listen as well as proclaim. Listening can yield useful insights into site history, undocumented working practices and local habits. Listening can help highlight what the real concerns are. Listening can help confirm that the message received was the same as that transmitted. Listening can foster trust, engender confidence and provide succour. It can reassure, calm and help a community make decisions on a more robust and sound basis than would otherwise have been the case. PROVIDING AN INDEPENDENT OPINION A basic tenant of risk communication is empowerment not instruction; informing not ordering. Where trust has been lost and dread reigns, an independent reviewer can restore confidence and ground concerns in facts not fear. A sound, critical review of the site investigation and remediation findings to establish their soundness and effectiveness in managing risks is a pre requisite. Only then can the reviewer share their insight in a way that a community can hear and respond to by shaking off its distress and returning to rational decision making. DEALING WITH ENQUIRIES DURING AN ONGOING INVESTIGATION Protective suit – check; safety boots – check; nitrile gloves – check; safety signs and perimeter barriers up – check. Good to go on the site investigation. “Mister, are you digging our new swimming pool?” Clients often place what are in effect temporary gagging orders forbidding consultants from discussing what they are doing with the public. This can place the consultant on site in a difficult situation. However there is a fine line that can be trod between breaching confidentiality and maintaining a silence that can speak – unhelpful – volumes to a community. STEPPING INTO A CAULDRON The possibility of soil contamination has hit the mainstream media (MSM); senior politicians have responded; a public meeting is called. With 72 hours’ notice, an independent soil
T34a
Copyright © CRC CARE Pty. Ltd., 2019
CleanUp Conference 2019Adelaide, Australia
8 –12 September 2019447
Table of Contentsfor this manuscript

expert is invited to join a panel. Hundreds attend, a handful get the chance to ask their questions. Virtually none are satisfied with the public authorities’ answers. The independent expert cuts across an answer that is adding to public anxiety. A technically correct but, being honest, virtually incomprehensible explanation is immediately followed up by an accessible analogy. The meeting ends and the independent is approached by several members of the public – and thanked for his honest answers. CONCLUSIONS Land contamination consultants are often expected to present their findings. Findings based on subtle and often complex aspects of multi-disciplinary science coupled with legal niceties. The following rules of thumb have been developed and found to be helpful:
• Do the technical work correctly • Describe the technical work accurately • Demystify the technical aspects, even at the cost of precision • Demolish physical and emotional barriers between speakers and listeners • Demonstrate genuine concern for those whose lives are affected by land
contamination • Do take time to understand causes of anxiety, reasons for lost trust in officialdom and
hopes for specific outcomes. The contaminated land consultant ultimately has a mere supporting role in the entire process. In a democracy, it is the elected representatives who will have the authority and power to decide courses of action, and the accountability to the electorate for the consequences.
448
Table of Contentsfor this manuscript

GUIDANCE FOR ASSESSING THE ECOLOGICAL RISKS OF THREATENED AND ENDANGERED SPECIES AT
AQUEOUS FILM FORMING FOAM (AFFF)-IMPACTED SITES
Jason Conder1, Jennifer Arblaster1, Emily Larson2, Juliane Brown3, Chris Higgins3
1Geosyntec Consultants, 2100 Main St., Ste. 150, Huntington Beach, CA 92677, USA 2Geosyntec Consultants, 1376 Miner’s Drive, Ste. 108, Lafayette, CO 80026, USA
3Colorado School of Mines, Civil & Environmental Engineering, Golden, CO 80401, USA
INTRODUCTION Perfluoroalkyl and Polyfluoroalkyl Substances (PFAS) have been widely used in numerous applications since the 1950s, including aqueous film forming foams (AFFFs) used for fire suppression at airports, firefighting training facilities, and other industrial locations. Many AFFF sites host ecological habitat, or, due to the offsite transport potential for PFAS, PFAS-impacted AFFF sites may affect nearby and downgradient habitats. Ecological Risk Assessments (ERAs) may needed at these sites to facilitate decision making; however, standard approaches and strategic guidances are unavailable. METHODS As part of a United States Department of Defense Strategic Environmental Research and Development Program (SERDP) project, a guidance document was developed to provide a current state-of-the-practice overview of methods, practices, and key data gaps for assessing the potential for risks from exposure to PFAS for threatened and endangered (T&E) species at AFFF-impacted sites. The guidance is intended to provide clear guidance to quantitatively evaluate ecological risks and enable site managers to make defensible, risk-based management decisions using the best available information and approaches. The key objectives are: 1) to provide a framework for the evaluation of T&E species during ERAs at AFFF-impacted sites; 2) to provide the reader with an understanding of the specific T&E species or general feeding guilds typically expected to be considered most at risk at AFFF-impacted DoD sites; 3) to provide the reader with recommended parameters (exposure factors, toxicity reference values [TRVs], uptake factors) to perform a food web model-based ERA for wildlife T&E species; and 5) to provide the reader with an understanding of key data gaps and uncertainties when evaluating T&E species at AFFF-impacted sites. Several hundred toxicity values and over 1000 bioaccumulation parameters were assessed in the guidance review effort, resulting in 150 recommended values for use in ERAs. RESULTS AND DISCUSSION The guidance (Conder et al., 2019) presents a generalized conceptual site model for terrestrial and aquatic ecosystems potentially impacted by AFFF (Figure 1), which can be used for prioritizing analytical approaches, determining which environmental media (e.g., surface water, sediment, soil, groundwater, biota) to sample, and understanding potential exposure routes for ecological receptors. The guidance provides a review of the available literature and offers recommendations for ERA parameters for use in ERAs for 18 target PFAS, primarily the environmentally-stable perfluoroalkyl acids (PFAAs): 1) 82 bioaccumulation values for predicting uptake by aquatic biota; 2) 35 bioaccumulation values for predicting uptake by terrestrial biota; 3) 23 Wildlife TRVs; 4) 6 Aquatic Life Criteria; and 5) 4 plant/invertebrate soil effects criteria. Using the approach and recommended parameters in the guidance, ERAs can be completed using a phased approach for data collection and analysis, with a focus on collecting abiotic sample and evaluating potential risks using modeling approaches, followed by (or alternately, in conjunction with) targeted sampling of biota and/or ecological and ecotoxicological studies to evaluate potential adverse effects.
T34b
Copyright © CRC CARE Pty. Ltd., 2019
CleanUp Conference 2019Adelaide, Australia
8 –12 September 2019449
Table of Contentsfor this manuscript

The guidance also identifies high-priority data gaps for the research and regulatory communities to address, such as: 1) toxicity of PFAS to benthic invertebrates; 2) toxicity of PFAS to birds, aside from perfluorobutanesulfonic acid (PFBS) and perfluorooctanesulfonic acid (PFOS); 3) toxicity of PFAS to terrestrial plants and terrestrial invertebrates, aside from PFOS and perfluorooctanoic acid (PFOA); 4) additional consideration for ecological risk modeling refinement for terrestrial ecosystems; 5) a better understanding of exposure to PFAS precursors, which may be present in diet items or exposure media and which may ultimately degrade to PFAAs, particularly for aquatic and terrestrial invertebrates; 6) further understanding of driving mechanisms for oxidation of PFAA precursors in abiotic media and biological species; 7) consideration of a mechanistic model to better predict food-web modeling in higher trophic levels; and 8) development of additional bioaccumulation factors to fill data gaps in higher trophic levels transfer (prey to predator).
Fig. 1. Conceptual Site Model for Empirical Bioaccumulation Modeling of PFAS in an Aquatic or Terrestrial System. CONCLUSIONS The guidance reaches the following key conclusions: 1) ERAs for AFFF sites are feasible; 2) off-site habitats are most at risk; 3) aquatic habitats are critical to address; 4) terrestrial habitats may be important at some sites; 5) risks from PFAS mixtures is uncertain; and 6) the exposures and effects of many PFAS-constituents in AFFF are unknown. The guidance is on schedule to become publicly-available in 2019 (Conder et al., 2019), and several training events for ecological risk assessors in 2019-2020 are under consideration. REFERENCES Conder, J., Arblaster, J., Larson, E., Brown, J., Higgins, C. 2019. Guidance for Assessing
the Ecological Risks of PFAS to Threatened and Endangered Species at Aqueous Film Forming Foam-Impacted Sites, SERDP Project ER18-1614: https://www.serdp-estcp.org/Program-Areas/Environmental-Restoration/ER18-1614. April 19.
450
Table of Contentsfor this manuscript

COMMUNICATION PITFALLS IN LARGE SCALE PROJECTS
Shandel Coleman1, Charlie Barber2
1Australian Environmental Auditors, Unit 7, 80 Colin Street, West Perth, 6005, AUSTRALIA 2Australian Environmental Auditors, Suite 21, 1 Ricketts Road, Mount Waverley, 3149,
AUSTRALIA [email protected]
INTRODUCTION In 2014, AEA were engaged to undertake a contaminated site audit of a former Rehabilitation Hospital site, located in a Perth suburb in WA. In 1893, the site was developed as an isolation tent hospital during a smallpox outbreak, then for other serious infectious diseases in the early 1900s. Later, the site became a major rehabilitation hospital for polio patients following the 1948‐1956 epidemic. Prior to closure it was used for long term care and rehabilitation. At closure, the site comprised over 23 buildings constructed at various times since the early 1900s. The 15.8 hectare site is being redeveloped for mixed residential, commercial and public open space. Residential options range from single residential lots to large apartment developments, incorporating a minimum of 1,100 dwellings. The redevelopment is to also incorporate two heritage listed buildings; all other buildings were demolished. AUDIT PROCESS The audit included the review of a Preliminary Site Investigations, Detailed Site Investigation, Ecological Risk Assessment, multiple Site Management Plans and Site Remediation and Validation Reports. As some areas of potential concern could not be accessed while the buildings were in place, additional assessment was required during the demolition works. Based on results, remediation of 15 building footprint areas was required. Remediation was by excavation of soil and disposal offsite. To suit demolition and remediation progress, the site was split into two audit areas resulting in two separate Site Remediation and Validation Reports. At the conclusion of the audit, the auditor prepared a Mandatory Auditors Report (Department of Environment Regulation, 2016), confirming the site was suitable for the proposed development. Construction of new residences is now underway. The audit was conducted by Charlie Barber, assisted by Shandel Coleman of AEA. PRE DEMOLITION SITE ASSESSMENT The Preliminary Site Investigation was performed in 2015. The site history identified 19 areas of potential environmental concern, including: asbestos associated with buildings, piping and dump areas; underground storage tanks (petroleum hydrocarbons); and sub slab spraying of pesticides for termites. POST DEMOLITION SITE ASSESSMENT AND REMEDIATION An overarching Contaminated Site Management Plan (CSMP) was developed by the primary consultant, supplemented by a number of detailed management plans prepared by the contractor and their subcontractors. During footprint sampling it was recognised that significant remediation of organochlorine pesticide (OCP) impacts would be required. This remediation was undertaken on an ad hoc basis, without the auditor being advised and with no Remediation Action Plan. MULTIPLE STAKEHOLDERS AND COMMUNICATION ISSUES Owing to the size of the site, multiple contractors, project managers and consultants were involved. Most investigations and remediation works were performed directly for the proponent, but, a different consultant was engaged by and provided contaminated site works
T34c
Copyright © CRC CARE Pty. Ltd., 2019
CleanUp Conference 2019Adelaide, Australia
8 –12 September 2019451
Table of Contentsfor this manuscript

directly to the contractor. The flow of information and understanding of responsibility between the two consultants was poor, creating confusion and difficulty in the tracking of specific assessment and validation works. This resulted in the omission and/or doubling up of areas with consequential resampling and additional remediation. This then made the data rich reporting (hundreds of samples) overly complex, poorly explained and difficult to follow. Reporting was also on occasions not in full accordance with the guidelines (Department of Environment Regulation, 2014). SUMMARY The site history and investigations determined a relatively simple contamination story, with three main aspects: asbestos (associated with buildings, piping and dump areas); underground fuel storage tanks (petroleum hydrocarbons); and sub slab spraying of pesticides for termites. Although there was an initial broad understanding regarding the roles of the contractors and consultants, the system failed due to poor communication as different companies had different agendas. The presentation details the outline of the site itself, the proponent and various contractors and consultants with their own agendas, how work was doubled up or missed and introduces some methods for avoiding such issues on large scale projects. REFERENCES Department of Environment Regulation (2014) Assessment and Management of
Contaminated Sites, Contaminated Sites Guidelines, December 2014, Perth, Western Australia.
Department of Environment Regulation (2016) Requirements for Mandatory Auditor’s Reports, Contaminated Sites Guidelines, November 2016, Perth, Western Australia.
Government of Western Australia, Contaminated Sites Act 2003 National Environmental Protection Council (1999) National Environmental Protection
(Assessment of Site Contamination) Measure (ASC NEPM) (as amended 2013).
452
Table of Contentsfor this manuscript

A RISK BASED APPROACH FOR THE MANAGEMENT OF DISUSED RAILWAY SLEEPERS
Dawit Bekele1,2, Zhaomin Dong1,3, Yanju Liu1, Jianhua Du1, Mezbaul Bahar1,
Prashant Srivastava2, Ravi Naidu1,2
1Global Centre for Environmental Remediation (GCER), The University of Newcastle, Callaghan NSW 2308, AUSTRALIA
2CRC CARE Pty Ltd, ATC Building, The University of Newcastle, Callaghan NSW 2308, AUSTRALIA
3School of Space and Environment, Beihang University, CHINA [email protected]
INTRODUCTION Harwood timber sleepers have traditionally been used in Australia and throughout the world due to their dependability, affordability and availability. However, the widespread deterioration of most timber sleepers and the declining supply of quality timber for replacement sleepers resulted in many railway industries relying on alternative materials such as pre-stressed concrete sleeper (Manalo et al. 2010). The timber sleepers used for the railway tracks had been treated with a multitude of chemical preservatives, such as organochlorine pesticides (OCPs), total petroleum hydrocarbons (TPH) and polycyclic aromatic hydrocarbons (PAHs) to protect against decay and wood ingesting insects. Some of the OCPs (aldrin and dieldrin) and PAHs are classified as probable human carcinogens (USEPA 2011). Generally, the wood treatment process binds the toxic chemicals of potential concern (CoPC) into the wood fibres. However, some of these chemicals do not get fixed properly and therefore remain free on the surface of the treated wood. Consequently, the chemicals are released into the environment as the wood decomposes over time. During the service life, storage and disposal of timber sleepers, the chemicals may leach into the environment (i.e., soil, surface water and groundwater). Therefore, it is important to determine the potential risks result from the leachate to sensitive receptors through different exposure pathways around the sleeper stockpiles and the surrounding environment. The leachate from mulch can impact the soil and groundwater as well. This study aimed at characterizing the disused railway sleepers to evaluate the potential risks to environment and human health and propose risk-based management approach. METHODS Disused railway sleepers were collected from the stockpiles located in Western Australia and cut into brick size blocks. Five representative stockpile samples were selected for this study. The sleeper samples and one untreated pine post (control sample) were shredded and sieved through a 2 mm sieve. Soil samples collected from nearby the sleeper stockpiles were also analyzed. All samples were sent to NATA accredited laboratories for the chemical analysis. Large scale column study were used to evaluate the long-term leaching experiment using block-sleepers as such (4 to 8 kg), shredded sleepers (4 kg), and shredded pine-wood (as control). The simulated rainwater were applied using drip irrigation system at 250 ml/h for 2 h/day for 10 weeks. The leachates from the sleeper columns were subsequently percolated through soil columns underneath. Samples from two different points of the leaching process (i.e., leachates from sleeper columns and soil columns) were collected and analyzed. The quantitative environmental and health risks were conducted for three possible exposure scenarios: reuse of sleepers in residential areas and community facilities, reuse by the industry onsite, and contain the stockpiles onsite. Health risks were evaluated for non-carcinogenic and cancer effects. The impact of CoPC with carcinogenic chemicals was assessed by combining chemical-specific estimates of doses and toxicity values (slope factors) and comparing the estimated risks to specified risk levels. The exposure parameters
T34d
Copyright © CRC CARE Pty. Ltd., 2019
CleanUp Conference 2019Adelaide, Australia
8 –12 September 2019453
Table of Contentsfor this manuscript

were extracted from the Australian Exposure Factor Guidance (enHealth 2012), for three specific age groups (0-6 yrs, 6-18 yrs, and >18 yrs). The non-cancer risk (nr) and carcinogenic risk (cr) were calculated as the sum of risk from each chemical. RESULTS AND DISCUSSION The results indicated that the presence of many CoPC in the sleeper samples. The chemicals include PAHs, OCPs and TPH (Figure 1). Total PAHs concentration ranged from 2,516 to 5,742 mg/kg in the sleeper samples.
Figure 1 Concentration (mg/kg) of PAHs, OCPs and TPH in sleeper samples. The values indicate the mean of 5 samples. Error bars indicate +/– 1 standard deviation. The concentrations of most of the CoPC in the block-sleeper column and soil leachate samples were below the limit of reporting (LOR). However, the concentrations of CoPC from the shredded-sleeper columns were found higher than that from the block-sleeper columns. The large surface area shredded-sleeper got in contact with water, which dissolved the soluble CoPC and carried by the water phase, thus producing higher concentrations. The hazard index from non-carcinogenic compounds for all exposure scenarios were predicted within the acceptable level for the identified exposure pathways. On the other hand, unacceptable health risks from carcinogenic chemicals in the sleepers were predicted for the maximum cancer risk of 1.4*10–3, which is above the guideline health risk screening value of 1*10–4. This risk assessment assumes that all the leachate concentration attains the groundwater table. Chemicals generally degrade as they infiltrate in the vadose zone. Consequently, it was determined that the cancer risk is at an unacceptable level if less than 25% of the compound is degraded as it infiltrates to the groundwater and this degradation depends on the depth of the groundwater table. The potential risks on human health from the stockpiled sleepers on-site due to occasional fire are limited. Although the risk resulting from the reuse of the sleepers in the community was estimated to be low, the risk can be high if the sleeper is used as firewood. REFERENCES enHealth (2012). Australian exposure factor guidance: Guidelines for assessing human
health risks from environmental hazards. Manalo, A., Aravinthan, T., Karunasena, W., & Ticoalu, A. (2010). A review of alternative
materials for replacing existing timber sleepers. Composite Structures, 92(3), 603-611. USEPA (2011). Integreated Risk Information System (IRIS). Available at
http://www.epa.gov/iris/
454
Table of Contentsfor this manuscript

INHALATION BIOACCESSIBILITY OF METAL(LOID)S IN DUST FROM MINE IMPACTED SOIL
Peter Sanderson1,2, Dane Lamb1,2, Ravi Naidu1,2
1Global Centre for Environmental Remediation (GCER), University of Newcastle, University
Drive, Callaghan, 2308, AUSTRALIA 2Cooperative Research Centre for Contamination Assessment and Remediation of the
Environment (CRC CARE), AUSTRALIA [email protected]
INTRODUCTION Soils in mining areas contain naturally elevated concentrations of metals. Mine impacted soils may also be enriched with metals from mining activities, particularly the fine soil fraction. This fraction may be subject to suspension in the air as fine particulate dust, thus representing a potential exposure pathway of contaminants to humans through inhalation (Kim et al. 2014). The respirable fraction referred to as PM10 is that which may penetrate the upper respiratory tract and reach the lungs. Further the soluble portion of metals has been implicated in eliciting toxicity in the lung (Chen and Lippmann, 2009). Recent research has developed simulated lung fluids (SLF) to examine the bioaccessible portion of metal(loid)s in the lung, which can be used to gain insight into the risk from dusts from mine impacted soils. METHODS Samples were collected from various mining impacted soils including from former Gold (Au), Lead (Pb) and Silver (Ag), Arsenic (As) and an active Chromium (Cr) mine. Soil samples were collected from the surface soils of different parts of the mined areas. This included processing areas, mine shafts and background samples. The PM10 fraction was obtained by the sedimentation method of Boisa et al. (2014). Inhalation bioaccessibility was determined by the simulated lung fluid (Julien et al. 2011) conducted using solid solution ratio of 1:500 and extraction time of 24 hours. RESULTS AND DISCUSSION The metal concentration in mining soils were elevated across the mine sites, particularly in processing areas (Table 1). The bioaccessibility of the metals in the SLF such as As, Pb was generally relatively low as a proportion of the total in soil. The bioaccessibility of Zn and Mn was higher, particular Zn from the gold mine soil (median 343.1 mg/kg). The variable solubility of the different metals evident, most likely due to mineralogy.
Table 1. Mean concentration of selected metals (mg/kg) in topsoil of mine sites Site Pb As Zn Cu Mn Cr
Gold 45.6 582 38.1 53.6 751 102.28 Lead/Silver 3965.3 8965 1307 216.93 348.23 92.67
Arsenic 39.1 2,560 97.1 37.78 368 - Chromium 5.59 - 16.11 15.89 571.2 817.2
T34e
Copyright © CRC CARE Pty. Ltd., 2019
CleanUp Conference 2019Adelaide, Australia
8 –12 September 2019455
Table of Contentsfor this manuscript

Fig. 1. Box plot (log scale) of SLF metal bioavailability (mg/kg) in PM10 fraction of soil from a former gold mine CONCLUSIONS Fugitive dusts are known to be a significant contributor to ambient PM and dusts from mining areas may contain elevated concentrations of metals. Metals have been shown to elicit toxic response in the lungs. Therefore, elevated metals in dusts represent a concern for human health. The use of simulated lung fluids can give insight into potential risk from metals in dusts. REFERENCES Boisa, N., Elom, N., Dean, J.R., Deary, M.E., Bird, G. and Entwistle, J.A., 2014. Develop-
ment and application of an inhalation bioaccessibility method (IBM) for lead in the PM10 size fraction of soil. Environment international, 70, pp.132-142.
Chen, L.C. and Lippmann, M., 2009. Effects of metals within ambient air particulate matter (PM) on human health. Inhalation toxicology, 21(1), pp.1-31.
Julien, C., Esperanza, P., Bruno, M. and Alleman, L.Y., 2011. Development of an in vitro method to estimate lung bioaccessibility of metals from atmospheric particles. Journal of Environmental Monitoring, 13(3), pp.621-630.
Kim, C.S., Anthony, T.L., Goldstein, D. and Rytuba, J.J., 2014. Windborne transport and sur-face enrichment of arsenic in semi-arid mining regions: Examples from the Mojave Desert, California. Aeolian Research, 14, pp.85-96.
456
Table of Contentsfor this manuscript

BERYLLIUM SORPTION TO SANDY SOIL AT A LEGACY WASTE SITE
Md. Rashidul Islam1, Peter Sanderson1, Ravi Naidu1, Mathew P. Johansen2,
Timothy E. Payne2
1GCER and CRC CARE, The University of Newcastle (UoN), NSW 2308, AUSTRALIA 2ANSTO, NSW 2234, AUSTRALIA
INTRODUCTION Beryllium (Be) is utilized in various science and technology applications including aerospace, defence, electronics and nuclear energy (USGS, 2018). Beryllium and its compounds are highly toxic and considered carcinogenic to humans (IARC, 2001). In soil, Be is highly reactive, amphoteric, hydrates readily and reacts with different organic and inorganic elements due to its high charge to size ratio (Alderighi et al., 2000, Boschi and Willenbring, 2016, Rudolph et al., 2009, Edmunds, 2011). The sorption mechanism strongly depends on soil physicochemical properties like pH, cation exchange capacity (CEC), soil texture, soil organic matter (SOM) content, and the presence of sulphur, nitrogen, phosphorous, aluminium etc. (Sutton et al., 2012, Boschi and Willenbring, 2016). Of these, pH is a strong controller of Be sorption, with chemisorption increasing substantially from pH 4 to 6 with precipitation being the predominant mechanism between pH 6-12 (Boschi and Willenbring, 2016). This study examined the sorption of Be in surface soils of a legacy waste site that contains Be and low-level radioactive wastes disposed in shallow trenches to determine how Be may be retained in the surface soil if it is mobilised from the wastes. The sorption of Be with respect to physiochemical properties and the applicability of the Langmuir, Freundlich and Temkin sorption models was examined. METHODS Surface soils (0-10 cm depth) were collected from a legacy low-level radioactive waste site in NSW, Australia, well described by the following article (Payne et al., 2013). The physicochemical parameters of the soil (pH, EC, CEC, SOM, soil texture) were determined by standard methods. Elemental analysis was by microwave acid digestion followed by ICP-MS/OES analysis. Functional groups were determined by FTIR and minerals by XRD. Batch adsorption studies with Be (Be concentration 0.5-10 mg/L, pH 5, 1:30/ solid-liquid ratio (S:L), 23±2°C, 24h, end-over-end shaker, 40 rpm) were conducted with and without background electrolyte (0.01M NaNO3) according to the literature (Desta, 2013). RESULT AND DISCUSSION Physicochemical properties of soils varied considerably: pH 4-5 (CaCl2) or 5-6 (water), EC 40-70 µS/cm, CEC 4.50-6.0, STC 4-5%, nitrogen 0.2-0.3%, sulphur 0.01-0.02%, SOC 3-5%, SOM 6.0-8.5%, sand 60-65%, silt 23-27%, clay 11.0-12.5% and Al, Fe, Mg up to 22.1±1.90, 17.0±1.79, 0.873±0.05 g/kg respectively. The concentration of anions was chloride (14-40 mg/kg), nitrate (26 mg/kg), sulphate ions (8-89 mg/kg). Beryllium in the soil was 0.1-0.4 mg/kg. The slightly acidic pH and relatively low CEC of the sandy soil may favour mobility of Be (Alderighi et al., 2000). However, sorption studies show very high adsorption efficiency (AE) and distribution coefficient (Kd) values (up to 99.5% and 6624 l/kg). The high sorption may be due to the soil having high SOM, inorganic ligands (phosphorus and sulphur), cation exchange and a suitable pH range for chemisorption (Müller and Buchner, 2018, Alderighi et al., 2000, Rudolph et al., 2009). The XRD analysis confirmed that the soil contained mainly quartz minerals and chlorite, kaolinite, and hematite. Beryllium has been reported to have a strong affinity to minerals
T34f
Copyright © CRC CARE Pty. Ltd., 2019
CleanUp Conference 2019Adelaide, Australia
8 –12 September 2019457
Table of Contentsfor this manuscript

such as kaolinite, illite, montmorillonite and goethite (Boschi and Willenbring, 2016). FTIR analysis after sorption of Be indicated peak shift in functional groups including O-H, -CHO, -NH2, Al-O-H, C=O and C-N, -COOH, also Si-O-Si, Si-O-C, C-O, suggesting these functional groups were involved in Be sorption. Adsorption of Be on soil slightly declined (AE and Kd up to 97% and 3346 l/kg) in experiments with the electrolyte background solution which could result from competition of Be with Na ions. Adsorption modelling demonstrated the linear Langmuir adsorption model best fits the data in absence of background electrolyte and the Freundlich model with background electrolyte. Figure. 1. Linear sorption model of (A) Freundlich; (B) Langmuir; (C) Temkin isotherm and (D-S1) adsorption efficiency of soil CONCLUSION Be available in the wastes of the legacy has the possibility to increase in adjacent soils over time. However, the site soils demonstrated high adsorption efficiency with physiochemical properties, particularly pH, clay and SOM, that were important for the sorption of Be. The result suggest low influence on adsorption (<10% reduction) from competing Be and Na ions in some solutions that may present in the wastes. REFERENCES ALDERIGHI, L., GANS, P., MIDOLLINI, S. & VACCA, A. 2000. Aqueous solution chemistry
of beryllium. Advances in Inorganic Chemistry, 50, 109-172. BOSCHI, V. & WILLENBRING, J. K. 2016. The effect of pH, organic ligand chemistry and
mineralogy on the sorption of beryllium over time. Environmental Chemistry, 13, 711-722. DESTA, M. B. 2013. Batch sorption experiments: Langmuir and Freundlich isotherm studies
for the adsorption of textile metal ions onto teff straw (Eragrostis tef) agricultural waste. Journal of thermodynamics, 2013.
EDMUNDS, W. 2011. Beryllium: environmental geochemistry and health effects. MÜLLER, M. & BUCHNER, M. R. 2018. Beryllium complexes with bio‐relevant functional
groups: coordination geometries and binding affinities. Angewandte Chemie International Edition.
PAYNE, T. E., HARRISON, J. J., HUGHES, C. E., JOHANSEN, M. P., THIRUVOTH, S., WILSHER, K. L., CENDÓN, D. I., HANKIN, S. I., ROWLING, B. & ZAWADZKI, A. 2013. Trench ‘bathtubbing’and surface plutonium contamination at a legacy radioactive waste site. Environmental science & technology, 47, 13284-13293.
RUDOLPH, W. W., FISCHER, D., IRMER, G. & PYE, C. C. 2009. Hydration of beryllium (II) in aqueous solutions of common inorganic salts. A combined vibrational spectroscopic and ab initio molecular orbital study. Dalton Transactions, 6513-6527.
SUTTON, M., BIBBY, R. K., EPPICH, G. R., LEE, S., LINDVALL, R. E., WILSON, K. & ESSER, B. K. 2012. Evaluation of historical beryllium abundance in soils, airborne particulates and facilities at Lawrence Livermore National Laboratory. Science of the Total Environment, 437, 373-383.
USGS 2018. Mineral commodity summaries U.S. Geological Survay: U.S.A.
R² = 0.935
R² = 0.98830
5
10
-6 -4 -2 0 2
Ln (q
e)
Ln (Ce)
ANon-ElectrolyteElectrolyte R² = 0.9995
R² = 0.97220
0.005
0.01
0 0.5 1 1.5 2 2.5
Ce/
qe
Ce
B
R² = 0.9888
R² = 0.9202-50
150
350
-6 -4 -2 0 2
qe (m
g/kg
)
Ln (Ce)
C
020406080
100120140
0.53 1.09 2.13 5.43 10.13
AE
(%)
Total Be (mg/kg)
D-S1 Non-ElectrolyteElectrolyte
458
Table of Contentsfor this manuscript

OVERVIEW OF ENVIRONMENTAL CONTAMINATION ISSUES IN AFRICA: FROM POLICY, RISK AND REMEDIATION PERSPECTIVES
Lucian Obinnaya Chukwu
Ecosystem Health and Pollution Management Unit,
Department of Marine Sciences, Faculty of Science, University of Lagos, NIGERIA [email protected]
ABSTRACT Environmental contamination largely acknowledged as a growing problem by virtually every nation of the world is receiving serious attention in many regions, particularly the developed countries. Consequently, the issue of environmental contamination and accompanying problems is timely, particularly in the African context as many countries in the continent are undergoing socioeconomic and industrial development at a greater pace and scale. With increasing population, less stringent environmental regulations, ineffective policies, poor funding, inappropriate technology and lack of political will and expertise, environmental degradation and associated health risk have become a growing concern. Notably, land based contamination poses a serious threat to the environmental quality, food production, and food safety in these regions. Despite attention from the media, researchers, non-governmental and international organisations most contaminated sites are yet to be cleaned up decades after incidence. This paper presents an overview of emerging and re-emerging environmental issues in Africa, existing policies, approaches and strategies aimed at addressing the challenges with a case study of the environmental issues in Nigeria, highlighting the gap between the reality and practice. INTRODUCTION Africa is the second largest and the second most populated continent in the world. The continent has five regions: North Africa, South Africa, Central Africa, East Africa and West Africa (Fayiga et al., 2017), 54 states and a wide variety of natural diversity. Over the years, this continent has been plagued with diverse environmental, socioeconomic and public health issues. The exploitation of the rich natural and mineral resources as well as population growth and urbanization due to developments has led to extreme contamination of the environment in various regions. These issues have become a serious concern; not only in the continent but also for the entire world. A number of articles reporting on environmental contamination issues in specific African countries emphasises on land degradation from mining and exploitation of mineral resources (Fayiga et al., 2017; Zabbey et al., 2017; Zamxaka, et al., 2010). However, no systemic review has yet critically and holistically analysed or highlights environmental contamination in the entire African continent to date. Such knowledge gaps and other challenges have implications for the development of novel appropriate interventions that would help minimize associated ecological and public health risks in the affected regions. METHODOLOGY Literature on environmental contamination, policies and remediation in Africa and many African were retrieved from scholarly databases. Some important keywords were chosen to find the appropriate studies investigating the topic. Out of these, papers reporting environmental degradation, policies, risk and remediation strategies were examined alongside other complementary reports from other parts of the world. RESULTS AND FINDINGS Indiscriminate and open waste dumps, fossil fuel use and mining of natural resources have been identified as key environmental issues. The complex nature and chemical constituents
T35a
Copyright © CRC CARE Pty. Ltd., 2019
CleanUp Conference 2019Adelaide, Australia
8 –12 September 2019459
Table of Contentsfor this manuscript
of seepage and leachate from open waste dumpsites has resulted in severe contamination of receiving ecosystems with adverse effects on aquatic organisms and human consumers (Igbo et al., 2018). In oil-rich African countries such as Nigeria and Angola, oil and gas exploration and contamination by crude oil is a major challenge with variable impacts on the total environment and exposed populations. Similarly, inappropriate and illegal mining of mineral resources has left some areas in many parts of Africa bare and unproductive. More recently, e-waste recycling has become a major problem particularly in Nigeria and Ghana due to the lack of technical expertise and infrastructure. Available literature reports progressive developments in the control of environmental contamination, clear legislative framework for the prevention and clean up of environmental contamination in most African countries (Papu-Zamxaka, et al., 2010). Specific agencies have also been created in countries like South Africa and Nigeria, to provide more focussed attention to some specific environmental problems (Zabbey, 2017; Zamxaka, et al., 2010). Despite these efforts, environmental challenges in the region are on the increase, giving a general sense of limited regulatory framework, rudimentary or ineffective policies. Lack of political will to formulate and implement good policies is also major drawback to addressing environmental contamination. An overview of some of the environmental policies, especially in Sub-Saharan Africa shows they lack evaluation of outcomes of the challenges they are to address. In addition, erroneous operational conclusions and the adoption of incompatible and ineffective approaches for the complex and dynamic environments have resulted in failed remediation attempts continuously. Other challenges include perennial conflicts, poor regulatory oversights and incoherent standards (Zabbey et al. 2017). However, scaled up local and international pressures has led to consideration of urgent clean-up and restoration of degraded bio-resource rich environments using novel and trend setting technologies by most regional governments. CONCLUSIONS This review reveals that environmental contamination is expanding significantly in many African countries. Also, holistic analysis and information about the problem is relatively limited or rare in Africa. Funding, risk based approach to assessing environmental contamination and novel remediation strategies is urgently required. Furthermore, effective communication of risk and involvement of all stakeholders would increase awareness and ensure policy makers develop regulations intended to reduce exposures and to prevent similar exposures from occurring in the future. However, there is need for a collaborative effort by local, regional, inter-provincial and inter-sectoral stakeholders in order to review the legal, financial, and environmental aspects of contaminated sites in Africa. REFERENCES Fayiga, A. O., Ipinmoroti, M. O., & Chirenje, T. (2018). Environmental pollution in
Africa. Environment, development and sustainability, 20(1), 41-73 Igbo, J. K., Chukwu, L. O., & Oyewo, E. O. (2018). Assessment of Polychlorinated Biphenyls
(PCBs) in water, sediments and biota from e-waste dumpsites in Lagos and Osun States, South-West, Nigeria. Journal of Applied Sciences and Environmental Management, 22(4), 459-464.
Papu-Zamxaka, V., Harpham, T., & Mathee, A. (2010). Environmental legislation and contamination: The gap between theory and reality in South Africa. Journal of environmental management, 91(11), 2275-2280
UNEP, 2011. Environmental Assessment of Ogoniland. UNEP, Switzerland. Zabbey, N., Sam, K., & Onyebuchi, A. T. (2017). Remediation of contaminated lands in the
Niger Delta, Nigeria: Prospects and challenges. Science of the Total Environment, 586, 952-965.
460
Table of Contentsfor this manuscript

INDIAN APPROACH TO MANAGING CONTAMINATED ENVIRONMENTS
Sudeep Shukla, Shruti Dutta, Deepika Pandey
Department of Earth & Environmental Sciences, Amity University Haryana,
Gurugram 122413, Haryana, INDIA [email protected]
INTRODUCTION India, the seventh largest country in the world extends over an area of 3,287,263 square kilometers and situated between 8°04' to 37°06' north latitude and 68°07' to 97°25' east longitude. With a diverse physiographic set up and rich biodiversity, it is one of the most rapidly developing countries of the world. With a huge population base, India has been witnessing a consistent upsurge in the human population over the large century. The rapid increase is more noticeable post liberalization era, coupled with growing need of urbanization coherent with trade and industrial growth, subsequently leading to the deterioration of the environment. India, as a developing country has witnessed an unprecedented growth in industrial sector in the last five decades. It is also evident that although international trades primarily intends to put apart the hindrances related to export and import policies, it certainly led to unwanted advent of numerous associated pollutants. It is needless to state that in spite of the tall claims of the trade policies, to ensure the concerned countries to be responsible and impose restriction for the harmful chemicals or pollutants, still these policies have a wide gap in the implication of environmental protection measures (Chopra, 2016). The exponential growth of population has led to widespread urbanization which in turn has given way to emergence of pollutants. The concentration of major industries along the proliferating urban centres lead to heavy pollution, noticeable among them are aluminium (Al) and zinc (Zn) smelter industries, cement, chlorine (Cl), copper (Cu) smelters, fertiliser, iron and steel industries, distillery industries, oil refineries, pharmaceuticals and petrochemicals, and pulp and paper industries (Chopra, 2016). MANAGEMENT OF CONTAMINATED SITE It is customary in the global perspective to describe contaminated sites as areas in which toxic and hazardous substances exist at levels and in conditions which pose existing or imminent threats to human health or to the surrounding environment. The existence of contaminated sites is very extensive, and includes production areas, landfills, dumps, waste storage and treatment sites, mine tailings sites, spill sites, chemical waste handler and storage sites. These sites may be located in the vicinity of residential, commercial, agricultural, recreational, industrial, rural, urban, or wilderness areas (Datta, 2016). It is well recognized that these sites have a plethora of related health and environmental hazards, thus exposing and impacting the population to various toxic substances and thereafter causing morbidity and mortality in Indian sub-continent (Garima, 2016; Kumar, 2011). Management of contaminated environments: Indian Approach The Constitution of India clearly defines the protection of environment in its 42nd amendment as a prime responsibility of the state under its Directive Principles of State Policy and Fundamental Duties. The National Environmental Policy, 2006, was the first initiative to frame policy of environmental protection by considering the factors responsible for land degradation and recommending counteractive measures subsequently. The Indian Government, with a determined perspective towards sustainability, has made sincere efforts by categorizing the policies as sector based policies as well as overall environmental management. The widespread awareness and protection of the environment is conceptualized through The Environment (Protection) Act in 1986, which is umbrella legislation to protect and improve the environment and to regulate the management and
T35b
Copyright © CRC CARE Pty. Ltd., 2019
CleanUp Conference 2019Adelaide, Australia
8 –12 September 2019461
Table of Contentsfor this manuscript
handling of hazardous substances and chemicals (EPA, 1986). There is consistent monitoring from the state and central government agencies to review the implementation status of Environmental Laws and Regulations. Hazardous Waste management is presently regulated by the Hazardous Waste (Management and Handling) Rules of 1989 (January 2000 amendment and 2008 amendment), Manufacture, Storage and Import of Hazardous Chemicals Rules of 1989, Rules for the Manufacture, Use, Import, Export and Storage of Hazardous Chemicals and Genetically Engineered Organisms or Cells, 1989. Additionally, the Forest (Conservation) Act of 1918, The Indian Forest act of 1927, National Forest Policy of 1988, National Conservation Strategy and Policy Statement on Environment and Development 1992, Policy Statement on Abatement of Pollution 1992, National Water Policy 2002, The Factories Act of 1950, the Indian Penal Code of 1960 and The Public Liability Act 1991 are to be followed if applicable (Liu, 2018; Sarkar, 2014). Another significant initiative conceived was the National Program for Rehabilitation of Polluted Sites (NPRPS), to scale up and follow the clean up and rehabilitation of polluted sites. It facilitates the reduction of environmental and health risks associated with the endowment of polluted sites (Tandon, 2016). CONCLUSION To sustain the rapid industrialization followed by rapid urbanization, India as a growing economy, needs to formulate a comprehensive and holistic approach for the remediation of contaminated sites along with its policies of development and environmental protection. Although, India is equipped with a strong legislative and policy framework, however, implementation and enforcement at root level has emerged as a challenge, posing as barrier towards India’s aspiration for a sustainable economy. REFERENCES Chopra R, 2016. Environmental degradation in India: causes and consequences.
International Journal of Applied Environmental Sciences, 11(6), pp.1593-1601. Datta Manoj, and Amit Kumar. "Waste dumps and contaminated sites in India—status and
framework for remediation and control." In Geo-Chicago 2016, pp. 664-673. 2016. Garima T. and Singh S.P., 2016. Application of bioremediation on solid waste management:
a review. Solid Waste Management: Policy and Planning for a Sustainable Society, p.143. Kumar A, Bisht BS, Joshi VD and Dhewa T, 2011. Review on bioremediation of polluted
environment: A management tool. International journal of environmental sciences, 1(6), p.1079.
Liu L, Li W, Song W and Guo M, 2018. Remediation techniques for heavy metal-contaminated soils: principles and applicability. Science of the Total Environment, 633, pp. 206-219.
Sarkar DN, 2014. Environmental Policies in India, ARSS Vol.3 No.2. pp. 17-20. Tandon A and Jyotsna K, 2016. Modeling the effects of environmental pollution intensified by
urbanization on human population. International Journal of Modeling, Simulation, and Scientific Computing, 7(03), p.1650013.
462
Table of Contentsfor this manuscript

ENVIRONMENTAL POLLUTION AND REMEDIATION STRATEGIES IN PAKISTAN
Hafiz Naeem Asghar, Zahir Ahmad Zahir, Muhammad Javed Akhtar
Institute of Soil & Environmental Sciences, University of Agriculture Faisalabad, PAKISTAN
INTRODUCTION Pollution is a worldwide problem and the situation is becoming more worst due to increase in population and climate change. Among different types of pollutions, air, soil and water pollution are more significant. Use of inefficient energy sources, increase in number of vehicles and industrial activities without or with inefficient air emission system and burning of solid waste are significantly contributing in the deterioration of air quality. Similarly, water pollution is caused by industrial effluents and sewage water. Runoff consists of harmful, contaminants and substances which interferes with water sources to infect and ultimately destroy the water bodies. When untreated industrial effluents and urban sewage is mixed with irrigation water and used for agricultural purposes, pollutants not only cause stress to crop but also get entry into the food chain. Fruits and vegetables grown on contaminated soil may uptake organic and inorganic chemical having mutagenic and carcinogenic effects. Such food causes impairment in the biological functions along with different other health related issues. CONTAMINATION ISSUES AND REMEDIATION OPTIONS IN PAKISTAN An estimate shows that about 92% of all pollution linked deaths are in developing countries. This puts extra stress on economy. The annual cost of environmental degradation in Pakistan is roughly 4.3% of the GDP. According to an estimate by 2025, there will be very little or no clean water available in the country and about 80% of the population may have no option but to drink polluted water. In Pakistan from 16 major cites annually domestic waste water discharge exceeds 4 MAF. Whereas, from different sources, about twenty million tons solid waste is produced annually, which is growing annually by 2.4%. Most of them is either burnt or dumped in to low lying areas and become hazard for soil ecology and human health. Currently the municipal solid waste is buried in the outskirts of the cities and in few cases remains unattended on the surface or burnt. However, some portion of organic waste is converted into useful products through composting/bioremediation and recycling process. Biological/hospital waste is mostly incinerated or autoclaved. In the era of fast communication, awareness in the community is increasing and treatment plants for industrial effluents and city sewage are being installed. GOVERNMENT POLICIES ON PREVENTION AND CONTROL OF POLLUTION Keeping in view future challenges regarding environment and to cope with them in Pakistan Environmental Protection Agency (EPA) was established. EPA is working under the Ministry of Climate Change is responsible to implement Pakistan Environmental Protection Act, 1997. The act ensures protection, conservation, rehabilitation and improvement of environment. Act ensures prevention of pollution and promotion of sustainable development. Pakistan EPA also provides technical support to the Ministry of Climate Change. Powers have been further delegated to the provinces and each province has Environmental Protection Agency at provincial level. Currently, different agencies in Pakistan are taking care of environmental issues, by following the National Environmental Quality Standards (NEQS) established under the Environmental Protection Act, 1997, like Environmental Protection Department, Punjab, Pakistan, Space and Upper Atmosphere Research Commission (SUPARCO). The Government has also constituted Environmental Tribunals to hear cases relating to Pakistan Environmental Protection Act, 1997. Environmental protection agencies/departments monitor and take necessary action against violators on non-compliance of the laws and impose
T35c
Copyright © CRC CARE Pty. Ltd., 2019
CleanUp Conference 2019Adelaide, Australia
8 –12 September 2019463
Table of Contentsfor this manuscript

penalties and punishments; their cases are referred to the Environmental Protection Tribunal. Besides the government agencies/departments, some NGOs are also actively participating in remediation of environment. In addition, Pakistan is a member of several international organizations, established to safeguard regional and global environment and government (Ministry of Climate Change) collaborates with international environment protection agencies to create more conducive and safer environment. Overall scenario demands awareness among the community and more focus of the government agencies for handling and remediation of different kinds of pollutants to save the environment, ecology and human health. REFERENCES Ashraf, M. (2016). Managing Water Scarcity in Pakistan: Moving Beyond Rhetoric.
Proceedings of AASSA-PAS Regional workshop on Challenges in Water Security to Meet the Growing Food Requirement. Pakistan Academy of Sciences, Islamabad. pp.3-14.
Pakistan Space and Upper Atmosphere Research Commission (SUPARCO). http://www.suparco.gov.pk/pages/environmental-pollution.asp. Accessed July 16, 2019.
Shukla, V. (2018). Pakistan’s Alarming Water Crisis: Country to run out of clean water by 2025. Politics. https://www.valuewalk.com/2018/05/pakistan-water-crisis-clean-water-2025/. Accessed July 16, 2019.
Ejaz, N., N. Akhtar, H. Hashmi and U.A. Naeem. (2010). Environmental impacts of improper solid waste management in developing countries: A case study of Rawalpindi city. The sustainable world, 142, pp. 379-387.
GoP (Government of Pakistan), 1997. Pakistan Environmental Protection Act 1997.
464
Table of Contentsfor this manuscript

PRESENCE OF MULTIPLE POLLUTANTS IN THE ENVIRONMENT: BANGLADESH PERSPECTIVES
Mohammad Mahmudur Rahman1,2, Ravi Naidu1,2
1 Global Centre for Environmental Remediation, University of Newcastle, NSW, AUSTRALIA
2 Cooperative Research Centre for Contamination Assessment and Remediation of the Environment (CRC CARE), University of Newcastle, NSW, AUSTRALIA
INTRODUCTION Bangladesh is a densely populated country in South Asia. It is a developing country and is known as land of rivers. Contamination with multiple emerging contaminants due to inadvertent industrial development and urbanization is a major concern in the country. Currently, the country faces several environmental issues, both from natural occurring issues such as flooding, cyclones due to adverse climate change as well as anthropogenic issues such as drinking water contamination with trace metal/loids, salinity etc. Food crops grown in contaminated lands and water used for irrigation also play a significant role for such contamination. Anthropogenic activities targeting enhanced crop productivity coupled with the lack of appropriate monitoring and usage of various kinds of agrochemicals in agriculture and other chemicals in industrial sectors, soils as well as the fresh water bodies are contaminated with pollutants such as heavy metals, chlorinated hydrocarbons (e.g. DDT, aldrin, dieldrin, endrin, etc.), mirex, dioxins, polychlorinated biphenyls (PCBs), polychlorinated dibenzodioxins (PCDDs), polychlorinated dibenzofurans, polybrominated diphenyl ethers (PBDEs), perfluorinated compounds (PFCs), and hexachlorobenzene (HCB) (Islam et al. 2018). CONCENTRATION OF CONTAMINANTS Contamination of trace elements is also increasing. For an example, elevated levels of arsenic (As) is detected in the groundwater of Bangladesh, posing risk to 30 million people throughout the country. Arsenic concentration in groundwater reached up to 4,700 µg/L, which was 470 times higher than the guideline value (10 µg/L) of arsenic in drinking water set by the World Health Organization. Various types of symptoms have been observed in people exposed to arsenic chronically and several thousand people are diagnosed with cancers at skin and other internal organs such as lung, bladder, kidney etc. In Bangladesh, drinking water and food safety are two major health concern. Most of the food crops are contaminated with trace metal/loids, especially arsenic, cadmium and lead. Arsenic levels up to 1800 µg/kg has been reported from a staple food rice, which is cultivated in the flooding conditions. There were evidences of the presence of both DDTs and PCBs in soils and house dust in Bangladesh (Anderson et al. 2000; Al Mahmud et al. 2015; Haque et al. 2017). Recently harmful antibiotics are also detected in milk, which may cause another catastrophe in future, if proper care is not taken immediately (https://www.dhakatribune.com/bangladesh/ dhaka/2019/07/13/fresh-du-study-again-finds-antibiotics-in-milk-samples). PROPOSED STRATEGIES TO MITIGATE MIXED CONTAMINANTS Although the government officials are aware of co-existence of different contaminants in soils and water of Bangladesh posing considerable health hazard to people, effective mitigation measures are yet to be fully developed to combat the dangerous effects of these contaminants. Given the extensive contamination, there is a need to educate Bangladeshi’s about the consequences of exposure to these contaminants and how to prevent such contamination. Awareness campaign program should be launched about the detrimental effects of pollutants. Government should implement policies and regulations to protect the environment. Proper and efficient waste management should be developed by the local governmental authorities. There should be regular monitoring of contaminants and measures should be taken to control the human and environmental exposure of emerging
T35d
Copyright © CRC CARE Pty. Ltd., 2019
CleanUp Conference 2019Adelaide, Australia
8 –12 September 2019465
Table of Contentsfor this manuscript

contaminants. Very limited research have been conducted on emerging contaminants such as antibiotics and PFCs in Bangladeshi landscape and these two contaminants should be the future research priorities to safeguard people from the dangerous effects of pollutants. REFERENCES Al Mahmud, M., Khalil, F., Rahman, M.M., Mamun, M., Shoeb, M., El-Aty, A.A., Park, J.-H.,
Shin, H.-C., Nahar, N., Shim, J.-H., 2015. Analysis of DDT and its metabolites in soil and water samples obtained in the vicinity of a closed-down factory in Bangladesh using various extraction methods. Environ. Monitor. Assess. 187 (12), 743.
Anderson, A., Bjornbom, E., Sverud, T., 2000. Decommissioning of ships, environmental standards, ship-breaking practicies, on-site assessment: Bangladesh–Chittagong. Environ. Advisory Serv. Rep.
Haque, R., Inaoka, T., Fujimura, M., Ahmad, A.S., Ueno, D., 2017. Intake of DDT and its metabolites through food items among reproductive age women in Bangladesh. Chemosphere 189, 744–751.
Islam, R., Kumar, S., Karmoker, J., Kamruzzaman, M., Rahman, M., Biswas, N., Tran, T.K.A. and Rahman, M.M., 2018. Bioaccumulation and adverse effects of persistent organic pollutants (POPs) on ecosystems and human exposure: A review study on Bangladesh perspectives. Environmental technology & innovation, 12, 115-131.
Rahman, M.M., Asaduzzaman M. & Naidu R. 2013. Consumption of arsenic and other elements from vegetables and drinking water from an arsenic-contaminated area of Bangladesh. Journal of Hazardous Materials 262, 1056– 1063.
466
Table of Contentsfor this manuscript

SRI LANKA’S APPROACH ON MANAGING THE CONTAMINATED ENVIRONMENTS
Meththika Vithanage1,2
1Ecosphere Resilience Research Center, Faculty of Applied Sciences,
University of Sri Jayewardenepura, Nugegoda 10250, SRI LANKA 2National Institute of Fundamental Studies, Hantana Road, Kandy 20000, SRI LANKA
INTRODUCTION Sri Lanka is a tropical island that belongs to the Indian subcontinent and located at the southern tip of India. The total land extent of the country is 6,570,134 ha, which consists of central highlands with an altitude more than 2,500 m. The mountain ranges are surrounded by broad lowland plains which include both dry and wet climates. The country’s Exclusive Economic Zone (EEZ) extends 200 nautical miles beyond the coastline and coincides with the pollution prevention zone. For scientific purposes, the island has been divided into 46 agro-ecological zones. The population of the country is more than 20 million, and the percent growth has been declined from 1–1.3 during the last decade. Sri Lanka is an agricultural country. However, few industrial zones are catering country’s economy, contributes to environmental pollution. ENVIRONMENTAL POLLUTION IN SRI LANKA With urbanization and industrialization, many environmental issues have been raised in the country. Three different environmental compartments, air, soil and water in Sri Lanka are threatened due to the anthropogenic activities such as haphazard waste disposal, extensive use of agrochemicals, vehicle, and power plant emissions.
Air pollution Ambient air pollution in Sri Lanka is restricted to urban environments, arises from a spectrum of different sources, where the main source is suggested as vehicular emissions, which contributes to over 60% of total emissions in Colombo metropolitan area and Kandy (Weerasundara et al 2018). High concentrations of gaseous emissions are reported from coal and diesel power plants specifically due to the uncontrolled emission. As an example, two-decade ago study reports emissions from the Sapugaskanda are 13,331 metric tons of Sulfur Dioxide, 1,070,608 metric tons of Carbon Dioxide, 17,166 metric tons of Nitrogen Dioxide and 323 metric tons Particulate per annum (Jasinghe 2000). However, not many studies have conducted on air quality in Sri Lanka. Few studies have assessed atmospheric deposition for heavy metals, and Polycyclic Aromatic Hydrocarbons (PAHs) indicated that the heavy metalscould cause risk for children (Weerasundara et al 2018). Recent attention is focused on asbestos roofing materials used in the majority of households in Sri Lanka.
Soil pollution and land degradation Soil pollution in Sri Lanka is mainly due to the excessive use of agrochemicals, specifically pesticides and herbicides, haphazard dumping of municipal solid waste (MSW) and wastewater disposal. Land degradation is common due to land clearance, disorganized constructions, and cultivation at high elevation lands lead to soil erosion and landslides. Soil contamination study at an MSW open dump reported that the heavy metal concentrations in soils were higher than that of the leachate and showed a decreasing trend with increasing distance from the landfill. The highest content of Cd, Mn and Cu were 21,173 and 2493 mg kg-1, respectively at the landfill whereas highest content of Zn, Ni, Pb and Cr (1619, 76, 1003 and 239 mg kg-1, respectively) was found within 1 m distance from the dumpsite (Wijesekara et al 2014). It has been observed that the application of pesticides and herbicides are far above the recommended level (Padmajani et al 2014). Manure rich in antibiotics are applied in vegetable fields may produce antibiotic-resistant microbes (ARM) (Herath et al 2016).
T35e
Copyright © CRC CARE Pty. Ltd., 2019
CleanUp Conference 2019Adelaide, Australia
8 –12 September 2019467
Table of Contentsfor this manuscript

However, no reports are available for pesticide/herbicides/pharmaceuticals in soils in Sri Lanka due to the lack of instrumentation.
Water pollution Contamination of water with various pollutants including heavy metals, pharmaceuticals, and nutrients is frequently reported in Sri Lanka due to various anthropogenic activities. In terms of agriculture, intensive fertilization release nutrients to water sources in high concentrations and hence, algal blooms are frequent in surface water reservoirs. Furthermore, MSW open dump sites discharge leachate, which is rich in nutrients, heavy metals, and other toxic organics, directly to waters without any treatment pollutes water (Wijesekara et al 2014). At the same time, hospital wastewaters that release to environmental waters may high in antibiotics may lead to the development of ARM. High microplastic levels, phthalates and perfluorinated alkyl substances (PFAS/PFOS) may be persisting in Sri Lankan waters due to high usage of plastics, packaging materials, etc and their haphazard disposal.
Related health risks Sri Lanka has high levels of cancer occurrences and chronic kidney disease of unknown etiology (CKDu), which may be due to emerging contaminants in the environment. Lichens and mosses showed high concentrations of heavy metals from the atmospheric deposition acts as ecological receptors in the urban environments in Sri Lanka. Leafy vegetables have shown high heavy metal, and pesticide concentrations indicate the existence of environmental pollution. ENVIRONMENTAL GOVERNANCE Sri Lanka has various policies for environmental conservation and protection, the National Environment Act (1980) setup the Central Environmental Authority, which is the main regulatory arm and coordinating agency of all protection and management of the environment. A separate ministry for caring the environment was established in 1991, and with that many environment-related institutions were clustered to this central body. Wide institutional fragmentation in Sri Lanka leads to lack of collaboration, coordination, and inefficiencies. Although legal provisions are existing, implementation is lacking due to political involvement. CONCLUSIONS Environmental pollution exists in Sri Lanka in three environmental compartments, air, soil, and water due to human activities. Contamination may have led to high cancer rates and bioaccumulation in plants and fish. Implementation of law for the protection of the environment is a must in Sri Lanka to sojourn further degradation. REFERENCES Weerasundara, L.; Magana-Arachchi, D.N.; Ziyath, A.M.; Goonetilleke, A.; Vithanage, M.
2018. Health risk assessment of heavy metals in atmospheric deposition in a congested city environment in a developing country: Kandy City, Sri Lanka. Journal of Environmental Management, 220:198-206
Wijesekara, S.S.R.M.D.H.R.; Mayakaduwa, S.S.; Siriwardana, A.R.; de Silva, N.; Basnayake, B.F.A.; Kawamoto, K.; Vithanage, M. 2014. Fate and transport of pollutants through a municipal solid waste landfill leachate in Sri Lanka. Environmental Earth Sciences, 72:1707-1719
Jasinghe, S.R.; Emission inventory for Sapugaskanda industrial area. 2000. B.Sc. Thesis. University of Moratuwa, Sri Lanka
Padmajani, M.T.; Aheeyar, M.M.M.; Bandara, M.A.C.S. 2014. Assessment of pesticide usage in up-country vegetable farming in Sri Lanka. Research Report 164. Hector Kobbekaduwa Agrarian Research and Training Institute, Colombo
Herath, E.M.; Palansooriya, A.G.K.N.; Dandeniya, W.S.; Jinadasa, R.N. 2016. An assessment of antibiotic resistant bacteria in poultry litter and agricultural soils in Kandy district, Sri Lanka. Tropical Agricultural Research Vol. 27 (4): 389– 398
468
Table of Contentsfor this manuscript

THE IMPORTANCE OF BIOACCESSIBILITY TESTING FOR METAL(LOIDS) IN SOIL AT CONTAMINATED SITES
Mark Cave1, M.A. Ayanka Wijayawardena2, Ravi Naidu2
1British Geological Survey, Keyworth, Nottingham, NG12 3NX , UK
2Cooperative Research Centre for Contamination Assessment and Remediation of the Environment, ATC Building, University of Newcastle, Callaghan NSW 2308, AUSTRALIA
INTRODUCTION Potentially harmful elements (PHE) such as arsenic (As), cadmium (Cd) and (Pb) are distributed through the environment as a result of anthropogenic activities (e.g. mining or smelting) and through natural occurrence. Once released into the environment, soils often serve as a sink for these PHEs and the question of human exposure to such elements must then be addressed as they constitute a potential risk to human health e.g.(ATSDR, 2007). It has been shown that soil ingestion is a key exposure pathway (Swartjes, 2011) and, in risk assessments using exposure models, it is often assumed that inorganic contaminants ingested via soil are absorbed to the same extent as the available form that was used using toxicological assessment. Thus assuming that the rate of absorption of ingested metal(loid) is independent of the matrix in which it is included and of its chemical form (speciation). However, the binding of inorganic contaminants to solid phases in soils may render them unavailable for absorption. The purpose of this presentation is to:-
• Give an overview of the research which shows how bioavailability of metals in soils (most often measured conservatively as bioaccessibility) varies in different soil types and for different elements;
• Show how confidence in methods for quantifying the bioaccessible fraction have developed; and
• Make recommendations how and when bioaccessibility testing should be used in contaminated land risk assessment.
METHODS The methods discussed will consist of:- those related to examining the relationship between soil properties and the mobility of the metal or metal mixtures which controls the bioaccessibility of the metal(loid) in question; The development of bioaccessibility testing methods and their associated quality assurance; and when and how bioaccessibility measurements should be used in risk assessment. Metal mobility A key point in understanding the bioavailability of metal(loid)s from soil is to understand their chemical form and solid phase speciation in the soil. This provides an important context and supporting evidence for a risk assessment. This has been addressed by techniques such as solid phase spectroscopy e.g. (Sahai et al., 2007) and through sequential extraction schemes e.g. (Cave et al., 2015, Wijayawardena et al., 2015b, Yan et al., 2019) Bioaccessibility tests There have been many studies into the development of in-vitro bioaccessibility testing methodologies and their validation against in-vivo measurements e.g. (Denys et al., 2012, Juhasz et al., 2009, Wijayawardena et al., 2015a). Indeed, confidence in the ability of these tests to give suitable data for risk assessments has resulted in the production of reference materials, quality assurance guidance and formal standardisation (Hamilton et al., 2015, ISO, 2018, Wragg, 2009)
T36a
Copyright © CRC CARE Pty. Ltd., 2019
CleanUp Conference 2019Adelaide, Australia
8 –12 September 2019469
Table of Contentsfor this manuscript
Bioaccessibility use in risk assessment As a result of the confidence in the testing methodology bioaccessibility should now be used as a standard measurement alongside total concentration data and augmented with data concerning the solid phase fractionation of the metal(loid) contaminant in the soil. Recommendations on when, where and how much bioaccessibility testing should be done will be addressed with respect to the following questions:
• Is the contaminant concentration slightly above the guidance values for the soil under consideration?
• Is the remediation likely to be very expensive, unsustainable or not technically feasible?
• Is there an adverse environmental risk associated with remediation? • Is there in-vivo validation and quality assurance data on the bioaccessibility test
used? REFERENCES ATSDR 2007. Toxicological Profile for Lead. Agency for Toxic Substances and Disease
Registry. CAVE, M., WRAGG, J., GOWING, C. & GARDNER, A. 2015. Measuring the solid-phase
fractionation of lead in urban and rural soils using a combination of geochemical survey data and chemical extractions. Environmental Geochemistry and Health, 37, 779-790.
DENYS, S., CABOCHE, J., TACK, K., RYCHEN, G., WRAGG, J., CAVE, M., JONDREVILLE, C. & FEIDT, C. 2012. In Vivo Validation of the Unified BARGE Method to Assess the Bioaccessibility of Arsenic, Antimony, Cadmium, and Lead in Soils. Environmental Science & Technology, 46, 6252-6260.
HAMILTON, E. M., BARLOW, T. S., GOWING, C. J. B. & WATTS, M. J. 2015. Bioaccessibility performance data for fifty-seven elements in guidance material BGS 102. Microchemical Journal, 123, 131-138.
ISO 2018. Assessment of human exposure from ingestion of soil and soil material -- Procedure for the estimation of the human bioaccessibility/bioavailability of metals in soil. Soil quality
JUHASZ, A. L., WEBER, J., SMITH, E., NAIDU, R., MARSCHNER, B., REES, M., ROFE, A., KUCHEL, T. & SANSOM, L. 2009. Evaluation of SBRC-Gastric and SBRC-Intestinal Methods for the Prediction of In Vivo Relative Lead Bioavailability in Contaminated Soils. Environmental Science & Technology, 43, 4503-4509.
SAHAI, N., LEE, Y. J., XU, H. F., CIARDELLI, M. & GAILLARD, J. F. 2007. Role of Fe(II) and phosphate in arsenic uptake by coprecipitation. Geochimica Et Cosmochimica Acta, 71, 3193-3210.
SWARTJES, A. 2011. Dealing with Contaminated Sites: From Theory towards Practical Application, London, Springer.
WIJAYAWARDENA, M. A., NAIDU, R., MEGHARAJ, M., LAMB, D., THAVAMANI, P. & KUCHEL, T. 2015a. Influence of ageing on lead bioavailability in soils: a swine study. Environmental Science and Pollution Research, 22, 8979-8988.
WIJAYAWARDENA, M. A., NAIDU, R., MEGHARAJ, M., LAMB, D., THAVAMANI, P. & KUCHEL, T. 2015b. Using soil properties to predict in vivo bioavailability of lead in soils. Chemosphere, 138, 422-428.
WRAGG, J. 2009. BGS Guidance Material 102, Ironstone Soil, Certificate of Analysis. British Geological Survey
YAN, K., DONG, Z., WIJAYAWARDENA, M. A., LIU, Y., LI, Y. & NAIDU, R. 2019. The source of lead determines the relationship between soil properties and lead bioaccessibility. Environmental Pollution, 246, 53-59.
470
Table of Contentsfor this manuscript

CHALLENGES ASSOCIATED WITH ASSESSING THE RELATIVE ORAL BIOAVAILABILITY OF ORGANIC CHEMICALS FOR
USE IN HUMAN HEALTH RISK ASSESSMENT
Yvette W. Lowney1, Luchun Duan2, Ravi Naidu2
1Alloy, LLC. 506 Arapahoe Avenue, Boulder, CO 80302, USA 2Global Centre for Environmental Remediation (GCER) and
CRC for Contamination Assessment and Remediation of the Environment (CRC CARE), ATC Building, the University of Newcastle, NSW 2308, AUSTRALIA
INTRODUCTION Decades of research clearly establish that soil-chemical interactions can result in the binding of chemicals to soil in a manner that limits their subsequent solubility and bioavailability. Assessment of human exposures to contaminants in soil (and associated health risks) can be made more accurate by including consideration of the reduced bioavailability of chemicals in soil, and regulatory structures for assessing potential risk accommodate bioavailability adjustments. Bioavailability of chemicals in soil can be measured directly with studies that ingestion of soil by animals under controlled conditions, followed by assessment (by any of a variety of means) of the systemically-absorbed fraction. To overcome the difficulty and expense associated with animal studies, significant research efforts have been directed toward developing in vitro methods to predict RBA on a site-specific basis. Regulatory agencies around the world (e.g., U.S. EPA, Health Canada, UK Environment Agency, BARGE (Europe), RIVM (the Netherlands)) have approved in vivo and in vitro methods for assessing the bioavailability of chemicals in soil for use in human health risk assessment. Under other regulatory environments, research is advancing incorporation of bioavailability adjustments into both human health and ecological risk assessment (e.g., CSIRO and CRC Care, Australia). To date, most of the approved methods focus on metals such as lead and arsenic, which are supported by the extensive database on the bioavailability of these chemicals from soil. Regulatory approval for bioavailability adjustments for organic chemicals has lagged behind inorganics, largely due to the complexities associated with studying organic chemicals, both in vivo and in vitro. Currently there is little consensus on animal or in vitro models for estimating the bioavailability of organic chemicals from soil, but promising approaches are beginning to appear in the literature. This presentation describes the nature of organic chemicals in the soil environment, and the challenges in the methodologies associated with estimating their bioavailability and bioaccessibility from soil. Nature of soil organic contaminants in the environment Of the 5 million potentially contaminated sites, nearly 60% include organic contaminants that may range from typical petroleum hydrocarbons, polycyclic aromatic hydrocarbons, solvents plus more complex and challenging organics such as PFAS, etc. In this presentation we focus on select few organic contaminants. This presentation will focus on several key issues in study design, and discuss the challenges and implications for assessing the bioavailability of organic chemicals from soil, such as: In vivo Methods Investigated to Date This section will provide a list of recent studies on the methods used to assess bioavailability of organic chemicals from soil, and then address key limitations in the available database.
T36b
Copyright © CRC CARE Pty. Ltd., 2019
CleanUp Conference 2019Adelaide, Australia
8 –12 September 2019471
Table of Contentsfor this manuscript

The evaluation will not undertake a detailed review of each study conducted to date, but will use the availability studies to illustrate research challenges including:
• Animal species • Metabolism, • Measurement Endpoints • Detection Limits (soil concentrations) • Importance of Other Exposure Pathways
In vitro Methods for Predicting Bioavailability from Soil Many different in vitro (benchtop) methods have been developed to attempt to predict the bioavailability of organic chemicals from soil. The presentation will also provide a brief survey of the methods used to date, and discuss”
• Complexity • Important components • Solid Phase • In Vitro to In Vivo Comparisons (IVIVC) • Quality control considerations
CONCLUSION Although this presentation will not provide new data from a particular study, it will use real-world examples to illustrate key study design components, and invite assessment and discussion of the implications of each, particularly with regard to potential for bias to over- or under-estimate bioavailability. Along with work published on conventional organic contaminants, the presentation will include an emergent contaminant PFAS- challenges confronted by EPAs and practitioners with the assessment and management of sites contaminated with PFAS- the need for standard operating procedure for organic contaminants is further emphasised. REFERENCES Bridges, T., Geiger, S., Greenberg, M., Griffin, S., Lanno R., Leeson, A., Lowney, Y., Luthy,
R., Menzie, C., Reible, D., Roberts, S., Ruby, M., Speicher, J., Stroo, H., Thompson T., Under, M., vonStackelberg, K. (2008). SERDP & ESTCP Expert Panel Workshop on Research & Development Needs for Understanding & Assessing the Bioavailability of Contaminants in Soils & Sediments. SERDP/ESTCP, Alexandria, Va.
Interstate Technology Regulatory Council (ITRC) 2017. Bioavailability of contaminants in soil. https://bcs-1.itrcweb.org/
Duan, L., Naidu, R., Liu, Y., Dong, Z., Mallavarapu, M., Herde, P., Kuchel, T. & Semple, K. T. 2016. Comparison of oral bioavailability of benzo[a]pyrene in soils using rat and swine and the implications for human health risk assessment. Environment International, 94, 95-102.
Duan, L., Palanisami, T., Liu, Y., Dong, Z., Mallavarapu, M., Kuchel, T., Semple, K. T. & Naidu, R. 2014. Effects of ageing and soil properties on the oral bioavailability of benzo[a]pyrene using a swine model. Environ Int, 70, 192-202.
James, K., Peters, R. E., Cave, M. R., Wickstrom, M. & Siciliano, S. D. 2018. In vitro prediction of polycyclic aromatic hydrocarbon bioavailability of 14 different incidentally ingested soils in juvenile swine. Science of The Total Environment, 618, 682-689.
Stephen M. Roberts, John W. Munson, Michael V. Ruby, and Yvette Lowney. Effects of Source and Concentration on Relative Oral Bioavailability of Benzo(a)pyrene from Soil. Environ. Sci. Technol. 2016, 50, 11274−11281.
Ruby, M. V.; Gomez-Eyles, J. L.; Ghosh, U.; Roberts, S. M.; Tomlinson, P.; Menzie, C.; Kissel, J. C.; Bunge, A. L.; Lowney, Y. W. Oral bioavailability and dermal absorption of PAHs from soil – State of the science. Environ. Sci. Technol. 2016, 50 (5), 2151−2164.
Xia, H.; Gomez-Eyles, J.; Ghosh, U. Effect of PAH source materials and soil components on partitioning. Environ. Sci. Technol. 2016, 50 (7), 3444−3452.
472
Table of Contentsfor this manuscript

INFLUENCE OF SOIL CARBON AND CARBONACEOUS AMENDMENTS ON THE BIOAVAILABILITY OF
BENZO[A]PYRENE IN SOILS
Luchun Duan, Ravi Naidu
Global Centre for Environmental Remediation (GCER) and
CRC for Contamination Assessment and Remediation of the Environment (CRC CARE) ATC Building, the University of Newcastle, NSW 2308, AUSTRALIA
INTRODUCTION Hydrophobic organic contaminants (HOCs) tend to adsorb to organic carbon in soil and sediment. However, for human health risk assessment (HHRA), our previous work estimated oral bioavailability of benzo[a]pyrene (B[a]P, in 8 soils spiked at 50 mg/kg) using a juvenile swine model, reporting a positive correlation with the total soil carbon content (TOC) (Duan, et al, 2014). This further highlights the influence of TOC on HOC sorption in soils. However, the quality of the organic carbon in soil maybe more critical than its quantity as regards to HOC sorption and bioavailability. This study investigated the pyrogenic carbon content (Pry C, %) in these soils using a thermogravimetric analysis (TGA) method, and then compared this against TOC and the previous relative bioavailability data of B[a]P (RB) in soil. Besides that, two commercially available carbonaceous materials: 1) a biochar (BC), which was used as low-cost sorbent as well as nutrient addition in soil, and 2) a pulverized activated carbon (PAC), which was used for water purification were tested for their efficacy in reducing B[a]P oral bioavailability in a sandy soil that showed a constant high RB over 90 days (~100% bioavailability compared to silica sand). The amendment addition rate was chosen based on a maximum practical rate at 10% and 4% for BC and PAC respectively on dry weight basis. METHODS Swine study: Details of animal study was described in Duan, et al, (2014). The oral bioavailability of B[a]P was determined by the area under the B[a]P plasma curve (AUC) over 12 hours post dosing. Thermogravimetric analysis of Pry C in soil: Pry C in soil was determined using TGA based on weight loss between 375 ~590°C and total dry weight loss.
RESULTS AND DISCUSSION Pry C showed a strong significant negative correlation with TOC (Figure 1 a) and a strong nearly significant negative correlation with RB when two outlier soils were excluded (Figure 1 b). Soil N (red point) is an outlier of the fitting. The empty square point was also excluded in the fitting as it greatly improved the R2, but it still fell within the 95% confidential interval.
Fig. 1. Correlation between Pry C and (a) TOC and (b) RB
(a) (b)
N
T36c
Copyright © CRC CARE Pty. Ltd., 2019
CleanUp Conference 2019Adelaide, Australia
8 –12 September 2019473
Table of Contentsfor this manuscript

Table 1. Amendments characterisation
Soil BET surface area (m2/g) Pore volume (cm3/g) Pore diameter
(Å) BC 8.24 0.018 94.4
PAC 892 0.325 30.5 Soil N was prepared again for the animal study. Where the spike concentration was adjusted to compensate the dilution by adding extra amendment and maintained a final concentration of 50 mg/kg B[a]P on dry weight basis. After 50 days of ageing under moisturised condition (~60% of the soil’s water holding capacity), they were air-dried to enhance B[a]P sequestration for another 6 weeks before being tested for B[a]P oral bioavailability.
Fig. 2. Dose-responses (AUC) of B[a]P in soil N and bioavailability in soil N with amendments.
Figure 2 shows the oral bioavailability of B[a]P expressed as AUC in soil N at three doses, each in duplicate (n = 2×3, baseline set at AUC = 0) and bioavailability of B[a]P in the two amended soils (both in triplicate). Bioavailability of B[a]P in soil N aged under moisturised condition for 90 days (N-D90, n = 3) expressed as AUC was also presented for comparison. Both amendments (10% BC and 4% PAC) significantly reduced B[a]P oral bioavailability in swine. The relative bioavailability of B[a]P in N+BC and N+PAC was 48% and 16% compared to soil N, respectively. Ageing under air-dried condition for 6 weeks also significantly reduced B[a]P bioavailability. Bioavailability of B[a]P was about 1.6 times more in moisturised soil N than the air-dried soil N. CONCLUSIONS Addition of biochar (BC) and pulverised activated carbon (PAC) have great potential in the immobilization of hydrophobic organic contaminants in soil. However, the efficacy for B[a]P oral bioavailability was much more effective using PAC. Air-dried condition also significantly reduced B[a]P oral bioavailability. REFERENCE Duan, L., T. Palanisami, Y. Liu, Z. Dong, M. Mallavarapu, T. Kuchel, K. T. Semple and R.
Naidu (2014). "Effects of ageing and soil properties on the oral bioavailability of benzo[a]pyrene using a swine model." Environ Int 70(0): 192-202.
474
Table of Contentsfor this manuscript

USING ARSENIC SITE-SPECIFIC BIOACCESSIBILITY IN SOILS TO REFINE REMEDIAL TARGETS
Kathleen Prohasky1, Lyn Denison1, Ken Kiefer2
1ERM, PO Box 266, South Melbourne, VIC, 3205, AUSTRALIA
2ERM, Locked Bag 3012 Australia Square NSW 1215, AUSTRALIA [email protected]
INTRODUCTION Bioavailability refers to the amount of a contaminant that is absorbed into the body following exposure via dermal contact, oral ingestion or inhalation. The NEPM (1999) HIL derivation methodology includes the conservative assumption that arsenic is 100% bioavailable. In reality, the actual bioavailability of arsenic is soil to humans can be significantly less. Forms of arsenic can bind strongly to soil, which results in a decrease in the bioavailability over time (Ng et al. 2010). Available data from Bendigo in Victoria suggests that the bioavailability of arsenic in soil derived from mine tailings in this region commonly ranges from 10 to 20% and is generally less than 30% (NEPM (1999) Schedule B7 Appendix A1). An assessment of bioavailability enables the development of a more realistic site-specific remediation criterion. In vitro oral bioaccessibility testing for arsenic in soil is well accepted (Ng et al., 2009; Interstate Technology & Regulatory Council, 2017) method to refine arsenic risk assessment assumptions of bioavailability. Bioaccessibility is the fraction of arsenic that is soluble in the gastrointestinal tract and therefore available for absorption. Acceptable in-vitro tests have been identified for arsenic based on the successful validation to in vivo studies. For arsenic, the CRC Care recommended in-vitro method is the Solubility Bioaccessibility Research Consortium (SBRC) method. This presentation presents the process adopted to develop site specific remediation targets for arsenic in soils impacted with legacy mine tailings. METHODS Three soil samples were collected from the near ground surface using a hand trowel in areas where previous x-ray fluorescence data collected in the field indicated elevated arsenic concentrations. The samples were analysed for the SBRC bioaccessibility test using EPA method 9200.1-86, to support the development of a site specific target level (SSTL). The SSTL was calculated using the NEPM HIL calculator using the defaults for HIL-A with the only change being the bioavailability input. RESULTS AND DISCUSSION The arsenic bioaccessibility results were consistent with other sites with soil derived from mine tailings. The measured bioaccessibility ranged from 4.0% to 8.2%. Using the NEPM (1999) HIL methodology reducing the bioaccessibility from 100% to as low as 0% has the potential increase a SSTL a value to 700 mg/kg (Fig. 1). Using the site specific bioaccessibility data, the SSTL calculated to be 530 mg/kg. CONCLUSIONS The development of a SSTL using site specific bioaccessibility data was a valuable addition to the assessment. Using a site-specific bioaccessibility testing for arsenic in mine tailings could reduce the amount of remediation required if not eliminate the need for remediation. It should be considered to reduce unnecessary removal of soil from the sites and reducing the environmental footprint required to remediate soil.
T36d
Copyright © CRC CARE Pty. Ltd., 2019
CleanUp Conference 2019Adelaide, Australia
8 –12 September 2019475
Table of Contentsfor this manuscript

Fig. 1. Effect of arsenic bioaccessibility on the arsenic SSTL.
REFERENCES Interstate Technology & Regulatory Council (ITRC) (2017). Bioavailability of Contaminants in
Soil: Considerations for Human Health Risk Assessment. BSC-1. Washington D.C.: Interstate Technology & Regulatory Council, Bioavailability in Contaminated Soil Team.
National Environmental Protection (Assessment of Site Contamination) Measure 1999 (amended 2013) (‘the NEPM’), ASC NEPM Toolbox – Health Investigation Level Calculator.
National Environmental Protection (Assessment of Site Contamination) Measure 1999 (amended 2013) (‘the NEPM’), Schedule B7 Appendix A1 – The Derivation of HILs for Metals and Inorganics.
Ng, J, Juhasz, A.L, Smith, E and Naidu, R. (2009) Contaminant Bioavailability and Bioaccessibility. Part 2: Guidance for Industry. CRC CARE Technical Report no. 14, CRC for Contamination Assessment and Remediation of the Environment, Adelaide, Australia.
476
Table of Contentsfor this manuscript

ELEMENT MOBILIZATION AND BIOAVAILABILITY DURING WEATHERING AND SOIL FORMATION
Deepika Pandey
Amity School of Earth and Environmental Sciences, Amity University Haryana, Gurugram,
122413, Haryana, INDIA INTRODUCTION Weathering releases elements in the form of ions, solution and complexes in the environment. The weathering products released in an area, in soluble and non-soluble forms, determine the chemistry of the water bodies and sediments derived from that region. Secondary minerals get transported as sediments are deposited elsewhere and determine the fertility of farmland areas. Mobility of elements and their partitioning into various geochemical phases as a result of weathering, play an important role in determining the geochemistry of the farmland and surface and ground water quality of the area (Zhang et al, 2014). In this way, the chemical properties of all the geological components of the earth are directly or indirectly affected by the weathering of the rocks. The bioavailability of elements such as plant nutrients or mobility of toxic elements is determined during the natural course of soil formation through weathering process and get added to different geological settings such as ground water, river water or sediments (Chon et al, 1996). METHODS The partitioning of elements in different phases during weathering is studied in weathering profiles of Amphibolite rocks. Sequential extraction procedure (Leleyter and Probst, 1999) was adopted to separate 7 different fractions formed during the process of weathering- water soluble, exchangeable, carbonate bound, bound to Mn-oxide, Amorphous and crystalline Fe bound and bound to organic matter. The elemental analysis in these separated fractions was done on ICP-AES. The results were reproducible and repeat sequential extraction procedure was highly significant up to last step. RESULTS AND DISCUSSION The results show that the behaviour of these elements is a function of their chemical properties. The elements bound with Fe and Mn oxides appeared to be the least mobile elements while mobile elements got associated with exchangeable, organic or to some extent carbonate forms. The mobility of plant nutrients such as Ca, Mg, K are also explained by their behaviour in weathering profiles. These plant nutrients were present mostly in exchangeable fraction or in organic fraction which is sensitive to temperature and pH changes. Na was not found in high concentration in the profile as it is the first element to leave the system due to its small size and highly available chemical species. Similarly, Fe, Mn, Al show less mobility in the weathering profile. The toxicity of heavy metals such as Cr, Cd, As, Pb can be found naturally in the ground water and sediments due to their natural mobilisation through the process of weathering and sediment formation (Jain and Ali, 2000). CONCLUSIONS The elements get partitioned in different chemical forms during the process of weathering, which determine their mobility, retention, transport, bioavailability and toxicity. If the natural geochemical process of their speciation under available environmental conditions is understood, the movement and toxicity of the pollutants and bioavailability of plant nutrients due to bedrock can be understood in a better way and help us to determine the fertility of a farmland by the natural process.
T36e
Copyright © CRC CARE Pty. Ltd., 2019
CleanUp Conference 2019Adelaide, Australia
8 –12 September 2019477
Table of Contentsfor this manuscript

REFERENCES Zhang C., Yu Z., Zeng G., Jiang M., Yang Z., Cui F., Zhu, M., Shen L., Hu L. 2014. Effects of
sediment geochemical properties on heavy metal bioavailability. Environment International, Volume 73, December 2014, Pages 270-281
Jain, C.K. and Ali, I. 2000. Arsenic: occurrence, toxicity and speciation techniques. Water Research, Volume 34, Issue 17, December 2000, Pages 4304-4312
Chon, H-T, Cho, C_H, Kim, K-W, Moon, H-S. 1996. Applied Geochemistry, Volume 11, Issues 1–2, January–March 1996, Pages 69-76.
Leleyter and Probst. 1999. A new sequential extraction procedure for the speciation of particulate trace elements in river sediments. Inter. J. Environ. Anal. Chem.Vol 73(2), 109-128
478
Table of Contentsfor this manuscript

ADVERSE HEALTH EFFECTS OF PER- AND POLYFLUOROALKYL SUBSTANCES (PFAS)
Christopher Lau
Developmental Toxicology Branch, Toxicity Assessment Division, National Health and
Environmental Effects Laboratory, Research Triangle Park, NC 27711, USA [email protected]
INTRODUCTION Per- and polyfluoroalkyl substances (PFAS) are a class of anthropogenic chemicals with wide industrial and consumer applications that have been in use for the past seven decades. These commercial compounds consist of a variety of precursors that can be terminally degraded to perfluoroalkyl acids (PFAA), which are composed of a fully fluorinated carbon backbone of various chain lengths (~4-14), and a functional group primarily of sulfonate or carboxylate, or to a lesser extent, phosphonate/phosphinate. In recent years, the 8-carbon PFAA (perfluorooctane sulfonate, PFOS and perfluorooctanoate, PFOA) have been withdrawn from production in U.S., and alternatives of diverse chemical structures have emerged in their place. The carbon backbone of many of these replacements contains an ether linkage(s) and is partially fluorinated, with the usual sulfonate or carboxylate functional head (polyfluoroalkyl substances). PFAS are stable, non-reactive chemicals, and their hydrophobic and oleophobic properties render them ideal surfactants for commercial uses. However, their stability also makes them practically non-degradable and persistent in the environment. They are globally distributed, and detectable in all environmental media, humans and wildlife. During the past two decades, intense scrutiny of these chemicals has revealed properties of toxicity in laboratory animals, and to a lesser extent in wildlife. Epidemiological surveys also reported associations between PFAS exposure and some adverse health outcomes, particularly among populations where chemical contamination has been detected. In the past few years, various regulatory bodies worldwide have begun to conduct human health risk assessment of PFAS exposure (primarily through drinking water and food intake), and some advisory values became available. This presentation will provide a brief overview of the current understanding of PFAS toxicology and associated issues. DETERMINANTS OF PFAS TOXICITY A great majority of PFAS toxicological research to date involves PFAA and information concerning the replacement chemicals has only emerged recently. Hence, this section primarily covers the properties of the legacy compounds. Three salient features should be considered in describing the toxic potentials of PFAA: (1) their pharmacokinetic disposition; (2) their relative potency (based on a common mechanism of action); and (3) their interactions as mixtures within the class of chemicals. Pharmacokinetics and tissue distribution. PFAA are well absorbed upon ingestion, distributed mostly to serum, liver, kidney and lung with very little to brain and fat, and cross the placental barrier readily. Urinary excretion is the predominant route of elimination. However, the rate of elimination varies greatly between species and among PFAA of different carbon-chain lengths. In general, the serum half-life estimates are longest in humans (compared to monkeys and rodents), and as chain length increases (from C4 to C10). Comparative potency. Based on a biochemical mechanism of action common to all PFAA evaluated, activation of the peroxisome proliferator-activated receptor-alpha (PPARα), a potency ranking can be derived, with long-chain PFAA > short-chain congeners, carboxylates > sulfonates, and rodents > humans. Mixture interaction. A few in vitro studies focusing on binary mixtures of PFAA commonly detected in humans suggested that these chemicals act additively. However, the mixture issue in vivo is complex and should be evaluated only when body burden of these chemicals reaches steady state level, due to their vastly different rates of clearance.
T41a
Copyright © CRC CARE Pty. Ltd., 2019
CleanUp Conference 2019Adelaide, Australia
8 –12 September 2019479
Table of Contentsfor this manuscript

TOXICITY PROFILES OF PFAS Reports of adverse effects of PFAA (and some replacements) are almost exclusively based on animal studies at experimental doses, with only a few findings (associations) derived from epidemiological surveys. In general, the following types of toxicity have been described.
• Hepatoxicity is perhaps a hallmark response of PFAS, which includes hepatomegaly, induction of hepatosteatosis, and inflammation.
• Developmental toxicity including neonatal mortality has been reported at high-dose exposure with several long-chain PFAA; at lower doses, growth deficits and delays or persistent alterations of maturation were observed.
• Immunotoxicity of long-chain PFAA is indicated by suppression of adaptive and innate immune responses in animal models; these findings are consistent with limited epidemiological observations in a children cohort.
• Induction of tumors (liver, pancreas and testes) associated with activation of PPARα-signalling pathway has been reported with long-chain PFAA and GenX (one of the alternative PFAS) in rodent models. Increased incidence of kidney and testicular tumors was linked to elevated serum PFOA in a population at contaminated site.
• Endocrine disruption by PFAA mostly involving thyroid hormones (hypothyroxinemia) has been shown in rodents; in vitro studies also reported weak estrogenic responses.
• Neurotoxicity of some PFAA (mostly PFOS) has been characterized by a few neuronal cell culture, neurobehavioral and neurochemical studies.
• Obesogenicity of PFAA was indicated primarily by in vitro studies; results from in vivo and epidemiological investigations are inconsistent.
POSSIBLE MECHANISMS OF ACTION The mechanisms of PFAS toxicity are not well defined, with a possible exception of PPAR involvement. However, the following biological processes have been suggested.
• Activation of PPARα signals that regulate fatty acid transport and metabolism has been implicated in PFAS hepatic effects; while PPARγ signals that regulate lipid synthesis and storage, and glucose metabolism, as well as actions mediated by other nuclear receptors such as CAR and PXR may also be involved. On the other hand, PPARα-independent mechanisms may be linked to other adverse effects of PFAS.
• Inhibition of gap junction at cell membrane to disrupt cell-cell communication. • Interference of protein binding. • Partition into cellular lipid bilayers. • Induction of mitochondrial dysfunction. • Production of oxidative stress. • Inappropriate actions of cellular and molecular signals that regulate cell functions.
SUMMARY Laboratory studies have indicated several adverse outcomes of PFAS exposure, but modes of action are ill-defined. A few of these adverse effects are also observed in wildlife species. Significance of these toxicological effects for human health risks is under active investigation. DISCLAIMER This abstract does not necessarily reflect U.S. EPA policy.
480
Table of Contentsfor this manuscript

IN-SITU LOCK DOWN OF PFAS — CASE STUDY: SCIENCE UNDERPINNING SUSTAINABLE RISK-BASED MANAGEMENT
Ravi Naidu, Kaihong Yan, Sreenivasulu Chadalavada, Dawit Bekele, Luchun Duan,
Yanju Liu
Global Centre for Environmental Remediation (GCER) and CRC-Contamination Assessment and Remediation of Environment (CRC CARE),
University of Newcastle, NSW 2308, AUSTRALIA [email protected]
INTRODUCTION Soil contaminated with per- and poly-fluoroalkyl substances (PFAS) is a significant burden to site owners, regulators, and communities throughout large parts of Australia due to the risks now posed to human health and ecosystems. This threat increases further as PFAS migrate towards ground or surface water sources. Although the recovery or destruction of PFAS is desirable it is prohibitively expensive (soil incineration) or unfeasible for in situ application. In contrast, in situ “lock down” of PFAS by the application of material-based adsorbents has the potential to minimise exposure to soil PFAS. Such a solution is consistent with the National Environmental Protection (Assessment of Site Contamination) Measure (1999) (ASC NEPM) which promotes a risk-based approach to managing site contamination to ensure that remediation is both effective and economically viable. The ASC NEPM sets out a preferred hierarchy of options for site clean-up and/or management and lists ‘on-site treatment of the contamination so that it is destroyed or the associated risk is reduced to an acceptable level’ as the highest preference. In this case, the unsolved major challenges are to: (i) ensure eco-safety of the adsorbents and the long-term immobilisation of PFAS in complex soil systems and associated geochemical processes, and (ii) understand the risk threshold of the immobilised PFASs for human exposure and ecological components. This paper presents data from one of our long-term PFAS immobilisation study including more recent study assessing bioavailability of PFAS immobilised soils using animal models. SITE INFORMATION The aqueous film forming foam (AFFF) was used at the site for fire training and emergency response since approximately 1976, which contained a range of PFAS compounds, including perfluorooctane sulfonate (PFOS), Perfluorohexanesulfonate (PFHxS) and perfluorooctanoic acid (PFOA). However, when the immobilisation study was first initiated in 2009, only PFOS and PFOA were the focus of AFFF contaminated medium. For this reason, early study conducted in 2010, included PFOA and PFOS as the contaminants of concern. The more recent study includes PFOA, PFOS and PFHxS as well. METHODS AFFF contaminated soils that were stockpiled was the focus of the study in 2010 while the more recent study focussed on Richmond RAAF Base PFAS contaminated soils. Following initial characterisaiton of the soils, immobilisation agents were added to soils and mixed thoroughly. The 2010 study included field based immobilisation of the impacted soils while the more recent study focussed on benchtop immobilisation. Following immobilisation, the soils were subjected to bioavaiability assessments using in vitro studies (long-term stockpiled soils) and both in vitro and in vivo studies using the recently matCARETM aged soils. Ameliorants used: matCARETM that has been developed by CRC CARE to effectively remove PFASs from surface water and groundwater. MatCARE™ was used a novel immobilising material formulated by surface modification of mineral palygorskite, for specific adsorption of PFASs including fluorosurfactants. That is, the natural clay base (molecular structure) has been modified towards high binding capacity of PFAS. The matCARE™ material is available as a granular and powdered product. In this case, PFASs are irreversibly loaded to the
T41b
Copyright © CRC CARE Pty. Ltd., 2019
CleanUp Conference 2019Adelaide, Australia
8 –12 September 2019481
Table of Contentsfor this manuscript

adsorbent matrix for in-situ treatment and removal. However, they are inert and persistent to the natural degradation. RESULTS AND DISCUSSION PFAS in study soils: The total concentration of PFOS and PFOA in the stockpiled soils ranged from1.83 to 75 mg kg-1 with the aqeous phase concentration ranging from 0.26 to 10. 6 mg kg-1. In contrast to these soils, the concentration of PFAS in Richmond RAAF Base PFAS contaminated soils was 20 mg kg-1. Sustainable Risk based land management (SRBLM) takes into consideration economic, environment and social issues and stresses the importance of integrative sustainable solutions which are needed to restore usability and economic value of the land with this being characterised by three key parameters:
• Risk reduction; • Environment Protection; • Reduction of aftercare.
The first two parameters describe the environmental goals in relation to land use and function as well as soil and ground water protection, including the spatial planning aspects while the third describes the way these goals should be approached. This definition of SRBLM further demonstrates that remediation is not about risk elimination by removing total contaminants from the media of concern rather reduction of unacceptable risks to man, animals and the environment to acceptable levels. Given that risk is a function of duration of exposure and toxicity which is in turn a function of contaminant bioavailability, the most economic means of reducing risk is via a reduction in contaminant bioavailabilty with this being sustainable over very long periods.
. .
This paper demonstrates risk reduction via long-term lock down of PFAS using matCARETM as shown in Figures 1 and 2 below.. In this paper,data from both in vitro and in vivo studies are included as evidence of risk reduction.
Figure 2. Time depenedent desorption of PFOS treated with matCARE
Figure 1. Bioavailability reduction follow-ing treatment with matCARE in four con-taminated soils
482
Table of Contentsfor this manuscript

TOWARDS UNDERSTANDING THE RELATIONSHIP BETWEEN PFAS SORPTION-DESORPTION AND SOIL PROPERTIES
Anthony C. Umeh1,2, Sonia Shilpi1,2, Ravi Naidu1,2, Sreenivasulu Chadalavada2,
Dane Lamb1,2, Luchun Duan1,2, Yanju Liu1,2, Dawit Bekele1,2
1GCER, University of Newcastle, AUSTRALIA 2CRC CARE, University of Newcastle, AUSTRALIA
INTRODUCTION Fluorinated surfactants such as perfluorooctane sulfonate (PFOS), perfluorooctanoic acid (PFOA), and perfluorohexanesulphonate (PFHxS) are among the emerging per- and poly-fluoroalkyl substances (PFASs) that are routinely detected in soils and sediments, surface and groundwater. Due to their wide ranging physicochemical properties, such as hydrophilic and hydrophobic characteristics, PFAS may persist in soils and be retained to varying degrees. Previous studies have indicated the potential influences of pertinent soil properties, such as total organic carbon (TOC) content, pH, and clay content of soils, on PFAS sorption in soils (Li et al. 2019; Milinovic et al. 2015; Higgins and Luthy, 2006). In these studies, hydrophobic and electrostatic interactions are suggested as the key mechanisms controlling sorption of PFAS in soils. All previous studies have used only a small number of soils (< 10 soils) to directly investigate PFAS sorption, to the best of our knowledge. Importantly, sorbed PFAS will need to be desorbed from the soil to pose risks to human and environmental health. However, PFAS desorption is often not the focus of previous studies, even while being one of the crucial components of risk driving processes. There is a need for detailed investigation into sorption and desorption of PFASs in soils, for effective contaminated land risk assessment and remediation. This study aims to directly investigate PFAS sorption and desorption using over 100 soils varying in physicochemical properties and mineralogy. Thereafter, models developed from multiple linear regression and machine learning will be used to understand the relationships between soil properties and PFAS sorption and desorption, and attempts will be made to predict PFAS sorption and desorption in soils. The focus of this study is PFOS, PFOA, and PFHxS, with the objective being to present data on work done thus far. METHODS Over 100 soils collected from different parts of Australia were air-dried and sieved to pass through a 2 mm stainless steel sieve. Soils were characterised for pertinent soil properties. Soils (2 g, n = 2) were transferred into pre-weighed polypropylene (PP) centrifuge tubes and mixed with 19.95 mL of 0.01 M NaNO3 containing 200 mg/L NaN3 to minimise potential microbial activities in the soils. The tubes were equilibrated on an end-to-end shaker for 24 h and pH was measured. Equimolar aqueous concentrations (10 – 1000 nM) of PFOS, PFOA, and PFHxS were attained after spiking 50 µL of stock concentrations (4 – 400 µM) of each PFAS. The tubes were shaken on an end-to end shaker for 24 h, and centrifuged at 3500 g for 15 min. Aliquots of unfiltered extracts were transferred and mixed with appropriate volumes of methanol in a 2 mL PP vials, and the remaining extract were kept for pH determinations. The weights of the tube + residual soil were measured, prior to transferring fresh 0.01 M NaNO3 (20 mL) into the tubes to study PFAS desorption. The tubes were then shaken on an end-to-end shaker and other subsequent procedures were followed as previously described. As part of quality assurance and quality control, individual tubes (n = 2) containing only unspiked soils, 0.01 M NaNO3 spiked with PFAS, and unspiked 0.01 M NaNO3 were subjected to similar procedures to obtain information on desorbable background PFAS concentrations, potential losses of PFAs to tube walls, and background electrolyte contamination, respectively. Also, the total background concentration of the investigated PFAS in each soil (n = 2) was determined after extraction with methanol and ethyl acetate
T41c
Copyright © CRC CARE Pty. Ltd., 2019
CleanUp Conference 2019Adelaide, Australia
8 –12 September 2019483
Table of Contentsfor this manuscript

(1:1, v/v) solution containing 7% phosphoric acid. The concentrations of the investigated PFAS in the extracts were analysed by HPLC-MS/MS in a National Association of Testing Authorities, Australia (NATA) certified analytical laboratory, following an internal standard quantitation procedure with 8 point calibration. Sorption and desorption isotherms were modelled, and the relationship between soil properties and equilibrium partitioning coefficients were studied. RESULTS AND DISCUSSION The pH of the studied soils ranged from 3.0 to 7.9, with texture ranging from sandy to strongly clayey soils. Clay content of the soils ranged from 1.2 to 51.7%. Clay mineralogy of the soils varied considerably depending on the soil type with the soils from Southern Australia containing largely less weathered minerals that are relatively low in sesquioxides compared to soils from NSW in which the layered silicate minerals were largely dominated by strongly weathered mineral kaolin and moderate to elevated levels of sesquioxides made up of iron and aluminium oxides. Along with these widely different mineral contents, the organic carbon content of soils ranged from low (< 0.4%) in strongly weathered soils to moderately high (<8.5%) in soils from Southern Australia. Cation exchange capacities of soils range from approximately 2.2 to 48.7 µS/cm. Given the widely different soil physico-chemical properties, the surface chemical properties of soils also varied considerably, with those in the southern Australia being net negatively charged while those in the north being both net negatively and positively charged, although the magnitude of net negative charges were much lower than in the soils from the south. Sorption and desorption studies conducted thus far show widely different sorption and desorption maxima depending on the soil type and to some extent surface chemical properties and organic carbon content of soils. Typical sorption isotherms are presented in Fig 1.
Figure 1. Typical PFOS sorption isotherms in soils varying in physicochemical properties. CONCLUSION The complex nature of the sorption and desorption behaviour of hydrophobic and hydrophilic surfactants, such as PFAS, in soils indicate that soil properties other than total organic carbon content of soils, will need to be considered towards predicting PFAS retention and release, as well as their overall fate in soils. Extensive investigations of sorption and desorption of the studied PFASs using a wider range of contrasting soils are ongoing, as well as detailed characterisation of soil properties, and the development of a predictive model for PFAS sorption-desorption in soils. REFERENCES Li, F., Fang, X., Zhou, Z., Liao, X., Zou, J., Yuan, B. and Sun, W. (2019). Adsorption of
perfluorinated acids onto soils: Kinetics, isotherms, and influences of soil properties Sci. Total Environ. 649:504-514.
Milinovic, J., Lacorte, S., Vidal, M. and Rigol, A. (2006). Sorption behaviour of perfluoroalkyl substances in soils Sci. Total Environ. 511:63-71.
Higgins, C.P. and Luthy, R.G. (2006). Sorption of perfluorinated surfactants on sediments Environ. Sci. Technol. 40 (23):7251-7256.
484
Table of Contentsfor this manuscript

PROGRESSING THE PRACTICE OF EVALUATING AMBIENT BACKGROUND PFAS
H. Mikkonen1, A. Mikkonen1, C. Wallis1, S.-Y. Chiang2
1CDM Smith, 1/30 Wangaratta Street, Richmond, VIC 3121, AUSTRALIA 2CDM Smith, 200 Windy Hill Road Suite 210 West, Atlanta, GA 30339, USA
INTRODUCTION Evaluation of whether an activity, within a defined site, is the source of Per- and Polyfluoroalkyl Substances (PFAS) contamination requires a critical evaluation of ambient background PFAS concentrations both spatially and temporally for relevant developed environment. However, the current industry practice for ambient background PFAS level determination has been constrained by inconsistent application of regulatory ‘background’ definition(s) and the lack of published robust assessment programs. This presentation provides a review and discussion of the practices that can be applied to provide a more rigorous evaluation of ambient background PFAS levels for developed environments. METHODS Guidance on the definition and assessment of ambient background PFAS in soils, surface water and or groundwater was reviewed. Case studies from the United States and Australia were reviewed to support discussion of current approaches, inconsistencies and advances in methods for assessing ambient background PFAS concentrations. RESULTS AND DISCUSSION Defining ambient background: Environmental guidance refer to “ambient” concentrations of contaminants as the concentration in a specified locality that is the sum of the naturally occurring background level and the contaminant levels that have been introduced from diffuse or non-point anthropogenic sources (NEPC 2013). Whereas, the definition of “background” in guidance is namely used regarding assessment of elements that can be naturally present in the environment (i.e. metals or salts). PFAS do not exist naturally in the environment, as such there is no geogenic contribution of PFAS. PFAS contamination on a developed site is likely to include both a small amount of ambient (diffuse) PFAS and added PFAS contamination from a single or multiple on and off-site point sources (example shown in Fig. 1). The typical concentration of PFAS in these environments (where point sources are present but not distinguishable) may be considered “baseline” rather than background for that specific site/area.
Fig. 1. Conceptual model of contributing sources of PFAS to measured PFAS concentration
T41d
Copyright © CRC CARE Pty. Ltd., 2019
CleanUp Conference 2019Adelaide, Australia
8 –12 September 2019485
Table of Contentsfor this manuscript

Assessment of ambient background: Review of multiple case studies identified several issues that must be considered when determining ambient background:
• A consistent protocol for sample collection and outlier evaluation is required, as adopted for Victorian Background Soil Database (Mikkonen et al 2018).
• Ambient PFAS concentrations in water may change with time; long chain PFAS in surface waters in Germany have decreased since the phase out of these chemicals, whilst short chain PFAS concentrations have increased (Janousek et al 2018).
• Ambient PFAS concentrations may be influenced by accumulation of diffuse PFAS in the environment due to pH, salinity and clay content.
• Ambient PFAS contamination should not correlate with distance within a site. Ambient data (from a single domain) should (ideally) be normally distributed. Statistical hotspots are unlikely representative of diffuse impacts.
• Information of off-site PFAS contamination should be collated and shared. Development of a searchable and interactive spatial database should be considered, for example the Victorian background soil database (Mikkonen et al 2018).
• There is no strong evidence indicating ambient background PFAS concentrations would not pose a risk to human health and the environment.
Identification of point source PFAS: An evidence based approach should be used to support claims of off or onsite sources. Source identification for PFAS may be supported by other elemental concentrations. For example studies in Melbourne, Australia have shown correlation between PFHxA with typical landfill leachate indicators including ammonia-N and bicarbonate (Hepburn et al 2019). PFAS forensics, including comparison of concentration ratios of different PFAS constituents (e.g., PFOS:PFOA ~ 90/10 for 3M ECF foam), ratios of branched vs linear PFAS constituents (e.g., ~70/30 of branch-/linear PFAS for 3M ECF foam or 0/100 of branched/ linear PFSA for fluorotelomer (FT) -based foam) can support evidence of association with known point aqueous film-forming foam sources. When electrochemical fluorination and FT foams were used together, enrichment of linear perfluorinated carboxylates (PFCAs)(<70/30) may be evident due to conversion of FT foam constituents into linear PFCAs. CONCLUSIONS Manmade PFAS are ubiquitous in the environment due to their uses for nearly seven decades and their nonbiodegradable nature. Fate and transport of PFAS in relationship to ages of releases, their compositions, and migration pathways in the environmental media have not been fully understood, the development of ambient background PFAS can easily introduce uncertainties and errors. Development of local and site-specific ambient levels should consider the uses of available on-site and off-site forensic information and proper statistical methods applicable for ambient level determination. However, even an ambient level is determined for a site, there is no evidence that such ambient level is protective of human health and the environment. REFERENCES Hepburn, E, Northway, A, Bekele, D, Currell, M, 2019, Incorporating perfluoroalkyl acids
(PFAA) into a geochemical index for improved delineation of legacy landfill impacts on groundwater, Science of The Total Environment, 666,1198-1208
Janousek, R, Mayer, J, Knepper, T ,2019, Is the phase-out of long-chain PFASs measurable as fingerprint in a defined area? Comparison of global PFAS concentrations and a monitoring study performed in Hesse, Germany from 2014 to 2018, TrAC Trends in Analytical Chemistry.
Mikkonen, H.G., Bentley, P.D., Barker, A.O., Dasika, R., Wallis, C.J., Clarke, B.O., Reichman, S.M., 2018. Victorian Background Soil Database, Version 1.0. RMIT University, Melbourne, Australia.http://doi.org/10.4225/61/5a3ae6d48570c
NEPC, 2013. National Environmental Protection (Assessment of Site Contamination) Measure. National Environment Protection Council, Adelaide, Australia.
486
Table of Contentsfor this manuscript

INVESTIGATING FATE AND TRANSPORT OF PFAS’ MIXTURES IN THE VADOSE ZONE AT CONTAMINATED SITE
Dawit Bekele1,2, Yanju Liu1,2, Anthony Umeh1,2, Jianhua Du1,2, Sreenivasulu Chadalavada1,2,
Mark Donaghey2, Ravi Naidu1,2
1Global Centre for Environmental Remediation, University of Newcastle, Callaghan Campus, NSW 2308, AUSTRALIA
2CRC-Contamination Assessment and Remediation of Environment (CRC CARE) ATC Building, University of Newcastle, NSW 2308, AUSTRALIA
Yanju.liu, [email protected]
INTRODUCTION Perfluoroalkyl and polyfluoroalkyl substance (PFAS) are emerging contaminants that have been increasingly reported for adverse effects on ecological systems and human health (Melzer, D., et al., 2010). It is mainly released from fire training sites with the application of aqueous film forming (AFFF), industrial sites, landfills, and wastewater treatment plants/biosolids. Among them, the usage of AFFF during fire-related emergencies and fire-training activities have caused contamination in groundwater, soil and surface water, in particular, there are concerns on the groundwater impact. The vadose zone contamination could be a potential source of long-term PFAS influx to the groundwater. Thus, it is critical to attain improved insight into the fundamental fate and transport processes that control PFAS fate and transport as it migrates from surface soil to groundwater (Andrea K. W., et al., 2017). This problem is exacerbated when sites are contaminated with complex mixtures such as the fluorinated-organic compounds present in AFFF. The failure to fully understand the fate and transport mechanism in the subsurface has implications on the development of remedial solutions to address all forms of contamination present. In this study, we investigated the depthwisedistribution of PFAS compounds in one particular site and provided insights on their fate and transport. Site information The site is located in New South Wales (NSW) and is established air force base. The aqueous film forming foam (AFFF) was used at the site for fire training and emergency response since approximately 1976, which contained a range of PFAS compounds, including perfluorooctane sulfonate (PFOS), Perfluorohexanesulfonate (PFHxS) and perfluorooctanoic acid (PFOA). The detailed site investigation has been conducted and in this investigation, we focus on the spatial and vertical distribution of PFAS compounds in vadose zone soils, groundwater and the correlation between soil types and distribution of PFAS. METHODS Soil samples and groundwater samples were collected from 7 monitoring wells on site. The soil samples were collected from each bore along with the soil profile to the bottom of well depth at the discrete interval of 1m and/or changing soil lithology is observed. The Comacchio GEO 405 drilling rig and split core sampler were used for collecting soil sampling. The groundwater was collected using low-flow sampling technique. The samples were extracted using method similar to (Houtz et al., 2013) and analysed using LC-MS-MS (Agilent 1260 infinity, Agilent Triple Quad 6470). RESULTS AND DISCUSSION The concentration of PFAS detected was plotted against the soil depth below the ground surface (bgs) for seven soil bores up to 17 m bgs. For example, Figure 1 illustrates the depthwise concentration of PFAS for vadose zone soils for bore well location 06. For this location, PFHxS was heavily concentrated in the surface zone showing a sharp decline from 19.3 ng/g to 0.9 ng/g at 3 m below which it remained reasonably constant. While the other
T41e
Copyright © CRC CARE Pty. Ltd., 2019
CleanUp Conference 2019Adelaide, Australia
8 –12 September 2019487
Table of Contentsfor this manuscript

compounds showed similar trend, the decrease in concentration from surface to subsurface was less marked for all but PFOS which increased to 10.3 ng/g at 3 m below which it showed a significant decline in concentration. In most locations, the more predominate concentration of PFAS has been found in near-surface soils (<50 cm) and decreased with depth, e.g. bore well location 02, 05, 06. However, the concentration of 6:2 FTS fraction in most of bore well locations were showed little change with depth. Borewell 04 showed increased total PFAS concentration with depth. The concentrations were correlated with the USC (Unified Soil Classification) soil type classification to demonstrate the influence of soil properties. Detailed soil characterisation and its correlated PFAS concentration results have been studied.
Fig. 1. The PFAS concentration for monitoring well location 06
The proposed research will improve strategies for the management of PFAS contaminants in soils and groundwater by: (i) developing an improved understanding of the fundamental fate and transport properties that impact the mobility of PFAS in the vadose zone matrices; (ii) allowing accurate evaluations of environmental and human health risks. CONCLUSIONS The case study site investigated in this study is contaminated by PFAS compounds, in particular, PFOS, PFOA, L-PFBS, PFHxS, 6:2 FTS factions. The separations of these compounds as they migrate along the vadose zone significant correlations with the soil properties in lithology of soils properties. The PAFS distribution along the soil profile could be influenced by both geochemical and hydrogeological parameters of the site. The details on the influence of soil types will be discussed in the presentation. REFERENCES Melzer, D.; Rice, N.; Depledge, M. H.; Henley, W. E.; Galloway, T. S. Association between
serum perfluorooctanoic acid (PFOA) and thyroid disease in the U.S. National Health and Nutrition Examination Survey. Environ. Health Perspect. 2010, 118 (5), 686−692.
Weber, Andrea K., et al. Geochemical and hydrologic factors controlling subsurface transport of poly-and perfluoroalkyl substances, Cape Cod, Massachusetts. 2017, Environmental science & technology 51.8: 4269-4279.
HOUTZ, E. F., HIGGINS, C. P., FIELD, J. A. & SEDLAK, D. L. 2013. Persistence of Perfluoroalkyl Acid Precursors in AFFF-Impacted Groundwater and Soil. Environmental Science & Technology, 47, 8187-8195.
488
Table of Contentsfor this manuscript

DATA DERIVED EXTRAPOLATION FACTORS FOR DEVELOPMENTAL TOXICITY: A PRELIMINARY RESEARCH CASE
STUDY WITH PERFLUOROOCTANOATE (PFOA)
Michael L. Dourson, Bernard Gadagbui, Chijioke Onyema, Patricia M. McGinnis, Raymond G. York
Toxicology Excellence For Risk Assessment,
1250 Ohio Pike, Suite #197, Cincinnati, OH 45102-1239, USA [email protected]
INTRODUCTION Guidelines of the United States Environmental Protection Agency (EPA, 1991) and the International Programme on Chemical Safety (IPCS, 2005) suggest two different default positions for dosimetric extrapolation from experimental animals to humans when the dosimetry of the critical effect is not known. The default position of EPA (1991) for developmental toxicity is to use peak concentration (or Cmax) for this dosimetric extrapolation. In contrast, IPCS (2005, page 39) states its default position for dosimetric choice in the absence of data is to use the area under the curve (or AUC). The choice of the appropriate dosimeter is important in the development of either a Chemical Specific Adjustment Factor (CSAF) of IPCS (2005) or a Data Derived Extrapolation Factor (DDEF) of EPA (2014). METHODS Based on extensive discussions and scientific debates, both IPCS (2005) and EPA (2014) have established minimum requirements in the review and evaluation of data for the development of CSAFs or DDEFs. Specific EPA (2014) guidance includes a series of questions that we followed, specifically:
• What is/are the critical effect(s) and POD being used for this assessment? • Has the toxicologically active chemical moiety been identified? • What is the MOA, Adverse Outcome Pathway (AOP), or mechanism for that toxicity?
Have the key events been identified and quantified? Do these key events identify important metabolic steps?
• Are the processes of absorption, distribution, metabolism and elimination (i.e., ADME) of the chemical well characterized? If dose-response data are from an animal model, do animals and humans metabolize the chemical(s) in a similar way (qualitatively and quantitatively)?
• Are there data in human populations describing variation in important kinetic parameter values for this chemical(s)? Have sensitive populations and/or life stages been identified? Are the data for these sensitive populations adequate for quantitative analyses?
RESULTS AND DISCUSSION This research shows the derivation of a DDEF for developmental toxicity for perfluorooctanoate (PFOA), a chemical of current interest. Here, identification of the appropriate dosimetric adjustment from a review of developmental effects identified by EPA (2016) is attempted. Although some of these effects appear to be related to Cmax, most appear to be related to the average concentration or its AUC, but only during the critical period of development for a particular effect. A comparison was made of kinetic data from PFOA exposure in mice with newly available and carefully monitored kinetic data in humans after up to 36 weeks of PFOA exposure in a phase 1 clinical trial by Elcombe et al. (2013). Using the average concentration during the various exposure windows of concern, the DDEF for PFOA was determined to be 1.3 or 14. These values are significantly different than
T41f
Copyright © CRC CARE Pty. Ltd., 2019
CleanUp Conference 2019Adelaide, Australia
8 –12 September 2019489
Table of Contentsfor this manuscript

comparable extrapolations by several other authorities based on differences in PFOA half-life among species. Although current population exposures to PFOA are generally much lower than both the experimental animal data and the clinical human study, the development of these DDEFs is consistent with current guidelines of both EPA (2014) and IPCS (2005). CONCLUSIONS A Data Derived Extrapolation Factor (DDEF) for kinetic differences between mice and humans for PFOA is 14. The safe dose assessment for PFOA and related compounds needs to consider the recent kinetic findings in humans from a clinical study. REFERENCES Elcombe, C.R., Wolf, C.R., Westwood, A.L. (2013). US Patent Application Publication, Pub.
No.: US 2013/0029928. EPA (United States Environmental Protection Agency). (1991). Guidelines for
Developmental Toxicity Risk Assessment. Fed. Reg. 56 (234), 63798–63826. EPA (United States Environmental Protection Agency). (2014). Guidance for Applying
Quantitative Data to Develop Data-Derived Extrapolation Factors for Interspecies and Intraspecies Extrapolation. EPA/100/R-14/002F. September.
IPCS (International Programme on Chemical Safety). (2005). Chemical-specific adjustment factors for Interspecies differences and human variability: Guidance document for use of data in dose/concentration-response assessment. Geneva Switzerland.
490
Table of Contentsfor this manuscript

CONFIRMING IN SITU BENZENE BIODEGRADATION UNDER ANAEROBIC CONDITIONS USING STABLE ISOTOPE PROBING
Dora Taggart, Kate Clark, Karen Hebbard
Microbial Insights Australia Pty Ltd., 10515 Research Drive, Knoxville, TN 37931 USA
INTRODUCTION Biodegradation is an important mechanism for contaminant destruction at monitored natural attenuation sites. However, obtaining evidence of in situ biodegradation can be difficult for some contaminants if their metabolites are transient in the environment and/or little is known about the microorganisms and degradation pathways involved. Although many pathways for aerobic benzene biodegradation are well-documented, comparatively less is known about anaerobic benzene biodegradation. Hydroxylation, methylation, and carboxylation have been proposed as potential anaerobic pathways, but many of the genes involved have yet to be identified (Abu Laban et al, 2010). Stable isotope probing (SIP) is a versatile molecular biological tool that can be used to provide conclusive proof of in situ biodegradation without requiring prior knowledge of the microorganisms or pathways involved (Busch-Harris et al, 2008). The current study includes statistical analysis of SIP results from over 300 field samples collected from benzene sites around the world, including the United States, Australia, Canada, China, Saudi Arabia, and the United Kingdom. METHODS The samples included in the current analysis were Bio-Traps amended with a specially synthesized form of benzene containing carbon-13 (13C). Since 13C is rare, carbon originating from labelled contaminant can be readily distinguished from carbon from other sources (predominantly carbon-12). Following in-well deployment, the Bio-Traps were analysed for 13C enrichment in dissolved inorganic carbon (DIC) and microbial phospholipid fatty acids (PLFA). 13C incorporation into DIC conclusively demonstrates benzene mineralization during the deployment period. PLFA are a main component of cell membranes, and 13C-enriched PLFA indicate that benzene was metabolized and incorporated into microbial biomass under current field conditions. Furthermore, 13C incorporation into specific fatty acids associated with anaerobic microbial groups indicates that anaerobes were actively involved in the degradation of the 13C-labeled benzene or one of its metabolites RESULTS AND DISCUSSION Biodegradation of benzene was documented in 92% of samples analysed, and average δ13C values in the PLFA and DIC will be presented. Over a third of the samples (136 of 309) showed high levels of 13C incorporation (δ13C > 1,000‰) in either the DIC or PLFA, and 29 samples had δ13C values exceeding 1,000‰ in both. These results suggest that the capability for benzene biodegradation by indigenous microorganisms is relatively widespread. Additionally, PLFA associated with anaerobic microorganisms were 13C-enriched in 55% (169 of 309) of samples, suggesting that anaerobic microorganisms may play a larger role in benzene degradation than has previously been able to be documented in the field. SIP is a powerful molecular biological tool that can be applied to confirm in situ biodegradation of other persistent contaminants as well, including methyl tert-butyl ether, tert-butyl alcohol, chlorobenzene, 1,4-dioxane, toluene, and naphthalene among others.
T42a
Copyright © CRC CARE Pty. Ltd., 2019
CleanUp Conference 2019Adelaide, Australia
8 –12 September 2019491
Table of Contentsfor this manuscript

REFERENCES Abu Laban, N., Selesi, D., Rattei, T., Tischler, P. and Meckenstock, R.U. (2010) Identification
of enzymes involved in anaerobic benzene degradation by a strictly anaerobic iron-reducing enrichment culture. Environmental Microbiology 12:2783-2796.
Busch-Harris, J., Sublette, K., Roberts, K.P., Landrum, C., Peacock, A.D., Davis, G., Ogles, D., Holmes, W.E., Harris, D., Ota, C., Yang, X. and Kolhatkar, A. (2008) Bio-Traps Coupled with Molecular Biological Methods and Stable Isotope Probing Demonstrate the In Situ Biodegradation Potential of MTBE and TBA in Gasoline-Contaminated Aquifers. Ground Water Monitoring & Remediation. 28:47-62.
492
Table of Contentsfor this manuscript

ARE YOU DRINKING BENZENE? IMPACT ON POTABLE WATER PIPES IN SOLVENT-CONTAMINATED SITES
Jean Meaklim
Greencap Pty Ltd, 1/677 High St, Kew East, Victoria, 3102 AUSTRALIA
INTRODUCTION Many former industrial sites have been identified with solvent contamination in the sub-surface (soil, groundwater and/or soil vapour). Concern was raised about the potential impact of sub-surface solvent contamination on the quality of the potable water supply and in particular, about the potential for solvents to permeate high density polyethylene (HDPE) pipes (typically being used in newer constructions) resulting in solvent concentrations exceeding drinking water guidelines. Current literature shows that polyethylene (PE) is susceptible to permeation by gasoline and solvents and that PE water pipes may be impacted if these contaminants are in subsurface environments in contact with the pipes. Of particular interest was the potential risk if a building is unoccupied for a period of time and the water stagnates within pipes, and whether that may pose a risk to site users when the building is re-occupied. A desktop assessment was undertaken to examine the potential impact on water pipes and potable water quality on a proposed development site, as well as field measurements. METHODS A potable water risk assessment was undertaken to consider the potential for contaminated soil vapours to permeate through HDPE pipes and dissolve in the water within the pipes, impacting on the potable water quality supplied to residents. The biggest impact was considered most likely to be in small diameter pipes which connect the mains to the houses, as they would have the biggest surface area (compared to large mains pipes) to allow infiltration, and have the smallest volumes of water (i.e. less dilution), as well as less internal turbulence to dissipate the vapour. These factors would generally provide more favourable conditions to allow vapour to dissolve into the drinking water. These first principle findings are consistent with research conducted to date. A case study site was selected with a range of residual chemicals (petroleum-based and chlorinated solvents, including benzene and trichloroethylene (TCE)) in soil vapour as a result of historical activities. The site had been assessed for potential vapour intrusion risk into future housing and was assessed as having an inhalation health risk within the “acceptable risk” range. Factors Included In The Risk Assessment Several factors were considered in assessing subsurface solvent impacts on potable water, with one of the most significant being permeation. Water mains and fittings in the vadose zone are susceptible to permeation by contaminants in soil or groundwater. (DWI 1992).
Permeation Permeation is a physicochemical mass transfer phenomenon involving diffusion of a solute through a porous medium. The driving force is the presence of an activity/concentration gradient of the solute. The permeation rate can be generalized as shown in Equation 1.
N = UA x (∆a) (1) where: N = Mass Permeation Rate U = Overall Mass Transfer Coefficient A = Transfer Area a = Solute Activity
T42b
Copyright © CRC CARE Pty. Ltd., 2019
CleanUp Conference 2019Adelaide, Australia
8 –12 September 2019493
Table of Contentsfor this manuscript

The overall mass transfer coefficient (U) is a complex function of the following variables: • Solute properties (composition, phase); • Medium properties (composition, pore structure, swollenness); • Solute-medium interaction (equilibrium partitioning, diffusion coefficient); • Pipe flow hydrodynamics; • Transfer geometry (medium thickness); and • Environmental conditions (especially temperature).
This assessment considered the site factors influencing water pipe permeation including characteristics of the contaminants of potential concern (COPC), soil, vapour migration, water pipe construction and temperature. RESULTS AND DISCUSSION The following scenario was considered:
• Benzene in soil vapour concentrations of ten times the Health Screening Level for residential land (HSL A/B) (Friebel and Nadebaum 2011); and
• Small diameter HDPE connector pipes in contact with soil vapour; and • House unoccupied for a month or more, i.e. no water turbulence or turnover.
Sample results are shown in Table 1.
Table 1. Benzene concentrations in soil vapour and in potable water pipes COPC Soil Vapour
(mg/m3) Pipe Water Concentration
(mg/L) ADWG 2011
(mg/L) Calculated Measured
Benzene 25 0.009 ^ <0.001 0.001
^ This concentration was transient and was predicted to return to base levels within a day. Due to the short exposure duration, the change in lifetime cancer was considered negligible.
CONCLUSIONS The results of the desktop assessment scenarios indicated no significant change in water quality or health risk to residents from drinking water delivered by HDPE pipes in contact with soil vapour in the scenarios considered. The theoretical lifetime cancer risk did not increase above background. REFERENCES ADWG (2011) Australian Drinking Water Guidelines, v3.5 (updated 2018), National Health
and Medical Research Council, National Resource Management Ministerial Council, Commonwealth of Australia, Canberra.
DWI 1992. Effects of Organic Chemicals in Contaminated Land on Buried Services. Final Report to UK Department of the Environment, Drinking Water Inspectorate, May 1992.
Friebel, E. and Nadebaum, P. (2011) Health screening levels for petroleum hydrocarbons in soil and groundwater. CRC CARE Technical Report No. 10. CRC for Contamination Assessment and Remediation of the Environment, Adelaide, Australia.
494
Table of Contentsfor this manuscript

MORE FROM LESS? CAN MISSING DATA BE EXTRAPOLATED TO OVERCOME DATA GAPS IN PLUME STABILITY ASSESSMENTS?
Scott Robinson, Daniel Der Tateossian
AECOM, Level 21, 420 George Street, Sydney, 2000, AUSTRALIA
[email protected] INTRODUCTION An evaluation of dissolved phase plume stability is a key line of evidence in determining if remediation is required and in assessing the potential for the risk profile to change in the future. Rather than focussing on concentration trends for individual wells, a preferred approach to evaluate plume stability is to evaluate trends for whole plume parameters (i.e. plume area, plume mass, average plume concentration, and centre of mass). A difficulty with the whole plume assessment method is ensuring that you have delineated a closed plume shape that can be evaluated over time. Monitoring well networks historically develop over time through several mobilisations as the dissolved phase impacts are progressively delineated away from the source(s). This process can lead to spatial data gaps during some sampling events that prevent assessment of the whole plume over time. METHODS GWSDAT (Shell Global Solutions) was used to model plumes and calculate whole plume parameters at three sites. GWSDAT is an application that can be used to analyse the historical trends (in both space and time) of groundwater analyte concentrations. Benzene was used as an indicator of the extent of the plume as it tends to migrate the fastest and is usually the main risk driver. The plume delineation contour was selected to represent the lowest concentration that allowed continuous delineation of the plume over the largest number of events. Due to spatial and/or temporal data gaps, the Conceptual Site Model (CSM) for each site was used to extrapolate missing monitoring well data as follows: Site 1 — Down-gradient Data Missing The monitoring well network consisted of twenty-three wells with groundwater monitoring event (GME) data from 2009 to 2016. Extrapolated data of less than the laboratory limits of reporting (<LOR) was added in for the furthest down-gradient well for GMEs in 2015 and 2016. This data was based on the previous groundwater monitoring event in 2014 which reported <LOR concentrations along with reduced concentrations in the plume centre in 2015 and 2016. Site 2 — Up-gradient Data Missing The monitoring well network consisted of twenty-five wells with data from 2011 to 2016. For the 2013 GME, <LOR data was extrapolated for four up- to cross-gradient wells based on the 2012 to 2016 data from six other plume boundary wells located cross- to down-gradient. Site 2 — Plume Centre Data Missing The monitoring well network consisted of eighteen wells with data from 2006 to 2015. At this site, data was missing from two onsite wells which were destroyed during tank replacement works and from five offsite wells due to road works. Two scenarios were simulated: 1) standard scenario used all of the available data for all wells. It was thought that this scenario may artificially show a decrease in plume mass over time due to the loss of key wells, and 2) conservative scenario with the assumptions for destroyed wells: LNAPL was assumed to remain in the primary source area, destroyed locations down-gradient along the plume centreline used concentration from the next up-gradient well, and destroyed locations on the plume margin used the same concentration as the last sample event.
T42c
Copyright © CRC CARE Pty. Ltd., 2019
CleanUp Conference 2019Adelaide, Australia
8 –12 September 2019495
Table of Contentsfor this manuscript

RESULTS AND DISCUSSION Site 1 — Down-gradient Data Missing Statistical analysis returned decreasing trends for all three whole plume parameters. The calculated biodegradation capacity was shown to have the ability to continue to degrade the remaining petroleum hydrocarbon impacts primarily through sulphate reduction and also by nitrate reduction and methanogenesis. The EPA assessed the site as not significant enough to warrant regulation. Site 2 — Up-gradient Data Missing Whole plume parameters were seen to be decreasing until 2016 when a new release occurred. The results of this assessment were able to give confidence that despite the new release, the extent of migration of contamination would likely be limited. A high biodegradation capacity and low gradient allow impacts to degrade before they migrate very far from the site. Sulphate reduction is the primary biodegradation reaction followed by methanogenesis and then iron reduction. Site 3 — Missing Wells from the Plume Centre Statistical analysis of the whole plume parameters for the standard scenario returned decreasing trends for all three whole plume parameters. For the conservative scenario the plume area and plume mass had decreasing trends while the average plume concentration was stable. The plume maps are shown below in Figure 1. A high biodegradation capacity was calculated, and biodegradation was shown to primarily be occurring through sulphate reduction. These results enabled a conclusion to cease monitoring.
Fig. 1. Shows the plume based on the standard scenario versus the conservative scenario. CONCLUSIONS Using a robust CSM, missing monitoring well data can be extrapolated for missing locations to allow for definition of a closed plume boundary over time. Use of whole plume parameters for plume stability assessments are preferred over assessing trends for individual wells. ACKNOWLEDGMENTS Thanks to Viva Energy Australia Pty Ltd and others for supporting this presentation of data from their sites. REFERENCES Shell Global Solutions and The University of Glasglow, GWSDAT, http://gwsdat.net/
496
Table of Contentsfor this manuscript

INSIGHTS INTO THE OXIDATION KINETICS AND MECHANISM OF DIESEL HYDROCARBONS BY
ULTRASOUND ACTIVATED PERSULFATE IN A SOIL SYSTEM
Yongjia Lei1,2, Yu Tian2, Cheng Fang1, Ravi Naidu1
1Global Centre for Environmental Remediation (GCER), University of Newcastle, Newcastle, 2308, AUSTRALIA
2State Key Laboratory of Urban Water Resource and Environment (SKLUWRE), School of Environment, Harbin Institute of Technology, Harbin, 150090, CHINA
INTRODUCTION Soil contamination caused by petroleum often discovered in oilfields, among which, more than 20% are diesel hydrocarbons (DHC, C12-C22). However, the low volatility and solubility, high sorption capacity and hydrophobicity of DHC make remediation more difficult. Recently, lots of studies have demonstrated the promising ability of Ultrasonic (US)/ persulfate (PS) process on degrading organic contaminants from aqueous solution. So far, however, only few researches applying US/PS process to soil remediation have been studied. Even though coupling US with PS for degradation of polychlorinated biphenyls and phenanthrene in soil were indicated to be effective, it is worth noting that evaluating the feasibility of utilizing US/PS for degradation of other refractory and hydrophobic organic contaminants in soil should be further studied. Nevertheless, this coupled process that have been widely utilized in water treatment were not evaluated for remediation of DHC-contaminated soil. The main objectives of this research were herein to (1) evaluate the effectiveness of coupling US with PS for enhancing DHC removal from soil, (2) explore the effects of reaction parameters, including DHC level, PS concentration, US power intensity, operating temperature and pH, as well as humic acid (HA) and inorganic anions on DHC oxidation, and (3) investigate the reaction kinetic orders and mechanisms of the coupling process for remediation of DHC contaminated soil. METHODS In each test, 7.0 g contamitaed soil sample were added to a 50 mL glass beaker (reactor), thereafter 35 mL PS solution of designated concentration were added as well. A 20 kHz-sonicator (Sonics VCX-130, power intensity range was 13-130 W) with a titanium probe (3 mm in diameter) of direct immersion was used to generate US. The US probe was immersed below the solution surface about 2.0 cm (about the reactor centre). The sonicator was set to designated power intensity with a pulse mode (3 s ‘‘on’’ and 2 s ‘‘off’’). At most of this study stage, the experiments were conducted without temperature control, except for that in the study of temperature effect utilizing a circulatory water bath to keep a designated temperature. A digital thermometer was used to measure the slurry temperature. And the magnetic stirrer (100 rpm) was used to maintain sufficient mixing of sample and uniform US effect.
RESULTS AND DISCUSSION • The kinetic parameters were investigated using a demisemi-lives method, and the
investigation results indicated that the DHC degradation efficiency could be expressed through this rate equation r =1.4 L g-1 min-1 [DHC]0[PS] within the limiting test condition.
• Various factors would affect the oxidation of DHC have been evaluated including DHC and PS concentration, US power intensity, operating temperature and pH, as well as inorganic anions and humic acid (HA). Increasing the content of DHC, Cl−, CHO and HA would inhibited the removal of DHC, acid condition and high US power could facilitated the degradation rate in this study.
T42d
Copyright © CRC CARE Pty. Ltd., 2019
CleanUp Conference 2019Adelaide, Australia
8 –12 September 2019497
Table of Contentsfor this manuscript

• Moreover, fractional analysis of DHC degradation demonstrated the oxidation sequence of DHC: phenanthrene < naphthalene < long chain aliphatic hydrocarbons < short chain aliphatic hydrocarbons.
• Finally, the mechanism involving DHC degradation in this study was discussed using radical quenching and ESR experiments, which was that the SO. generated through the heat induced by US was the predominant oxidizing species in this study.
Fig. 1. Proposed mechanism of DHC degradation in this study. CONCLUSIONS This study demonstrated that the coupling process was effective for enhancing DHC removal from soil. Kinetic studies indicated that the DHC oxidation follows pseudo-zero and first order kinetics in regard to DHC and PS content, respectively. Interestingly, neither the US nor the temperate alone was responsible for the activation of PS, but the heat generated by US played a crucial role in effectively activating PS. Moreover, the component of DHC was another factor affecting DHC degradability, and aromatic compounds were more recalcitrant than aliphatic, shorter chain aliphatic hydrocarbons were faster eliminated and phenanthrene were more recalcitrant than naphthalene as for aromatic compounds. Finally, radical quenching and ESR experiments showed that both SO. and OH . were important to DHC destruction whereas SO. was the predominant oxidizing species in this study. Overall, this study indicated that the US/PS process may provide a promising approach for ex or in situ remediation of DHC contaminated soil. REFERENCES Yen, C.H., Chen, K.F., Kao, C.M., Liang, S.H., & Chen, T.Y. (2011). Application of persulfate
to remediate petroleum hydrocarbon-contaminated soil: Feasibility and comparison with common oxidants. J. Hazard. Mater. 186(2-3), 2097-2102.
Do, S.H., Jo, J.H., Jo, Y.H., Lee, H.K., & Kong, S.H. (2009). Application of a peroxymonosulfate/cobalt (PMS/Co (II)) system to treat diesel-contaminated soil. Chemosphere. 77(8), 1127-1131.
Deng, D.Y., Lin, X.T., Ou, J.M., Wang, Z., Li, S.T., Deng, M.L., & Shu, Y.H. (2015). Efficient chemical oxidation of high levels of soil-sorbed phenanthrene by ultrasound induced, thermally activated persulfate. Chem. Eng. J. 265, 176-183.
498
Table of Contentsfor this manuscript

A UNIVERSAL CALIBRATION MODEL FOR IN-FIELD FTIR MEASUREMENT OF PETROLEUM CONTAMINATED SOIL
Sean Manning, Tao Zhang, Andrew Toop, Richard Stewart
Ziltek Pty. Ltd., 2 Ann Nelson Drive, Thebarton, 5031, AUSTRALIA
[email protected] INTRODUCTION Ziltek is the leader in hand-held FTIR measurement systems for determining total petroleum hydrocarbons (TPH) contamination levels in soil (Fig. 1). To date Ziltek’s instruments have required site specific calibration models and for users of the instrument to have knowledge of which site they are remediating so they can use the correct calibration model. Ziltek is developing a universal calibration model that utilises its vast database of contaminated soil spectra along with various machine learning and multivariate statistical approaches. This universal calibration will provide our customers with an easy to use screening tool that requires minimal user expertise and negates the costly and time-consuming task of developing site-specific models. We report on recent progress and provide a preview of the systems capabilities.
Fig. 1. Ziltek’s RemScan instrument being used in the field.
METHODS Ziltek, in collaboration with CSIRO, has accumulated a soil database by sampling geologically diverse regions in Victoria, Australia. This sampling procedure has provided Ziltek with a soil database covering a range of soil texture classes from high sand content through to high clay content. Soils from the database were used to prepare dilution series by spiking with diesel from 0 mg/kg to 100,000 mg/kg. The dilution series samples were then scanned with the RemScan providing Ziltek with greater than 10,000 individual spectra covering a vast range of soil types and contamination levels. We construct the model by mathematically assigning the spectra to clusters of like-spectra and each cluster is then used to build a partial least squares (PLS) calibration model as illustrated in Fig. 2. Predictions on new spectra are performed by first using an outlier rejection algorithm to determine if the new spectrum has representative spectra in the database. Once a spectrum is deemed to belong to the database it is assigned to the appropriate PLS model using a classification algorithm.
T42e
Copyright © CRC CARE Pty. Ltd., 2019
CleanUp Conference 2019Adelaide, Australia
8 –12 September 2019499
Table of Contentsfor this manuscript

Fig. 2. Soils sampled from across Victoria, Australia (left). Sampled soils mapped onto the soil texture plot demonstrating a wide variety of soil types (centre). Spectra are clustered mathematically with a PLS calibration model for each cluster (right). PRELIMINARY RESULTS Approximately 20% of the dataset was set aside from the model building process for validating each of the key steps in the model: outlier rejection, classification accuracy and TPH prediction accuracy. Validation results obtained show promising results for all steps in the algorithm (see Table 1.) Table 1. Performance of processing steps for Universal Site Calibration Model
Processing Step Performance Outlier Rejection Rate >99% Classification Accuracy >99%
TPH prediction Accuracy ±10% CONCLUSIONS & FUTURE WORK Current work is focussed on further assessing the robustness of the model with additional validation data, fine tuning model parameters and development of a user interface. Ziltek will be releasing a trial version of the software to select customers by Q3 2019. REFERENCES Ziltek 2019, RemScan, Ziltek, viewed 30 April 2019, https://ziltek.com/remscan/ Khudur, L.S. and Ball, A.S., 2018. RemScan: A tool for monitoring the bioremediation of
Total Petroleum Hydrocarbons in contaminated soil. MethodsX, 5, pp.705-709. Ng, W., Malone, B.P. and Minasny, B., 2017. Rapid assessment of petroleum-contaminated
soils with infrared spectroscopy. Geoderma, 289, pp.150-160. Webster, G.T., Soriano-Disla, J.M., Kirk, J., Janik, L.J., Forrester, S.T., McLaughlin, M.J. and
Stewart, R.J., 2016. Rapid prediction of total petroleum hydrocarbons in soil using a hand-held mid-infrared field instrument. Talanta, 160, pp.410-416.
500
Table of Contentsfor this manuscript

POLAR METABOLITES IN PETROLEUM HYDROCARBON CONTAMINATED GROUNDWATER:
ALLIUM CEPA CYTO- & GENOTOXICITY ASSAY
Logeshwaran Panneerselvan1,2, Megharaj Mallavarapu1,2, Sreenivasulu Chadalavada1, Ravi Naidu1,2
1Global Centre for Environmental Remediation, University of Newcastle, AUSTRALIA
2CRC CARE, University of Newcastle, AUSTRALIA [email protected]
INTRODUCTION Fossil fuels, especially petroleum-based products such as gasoline, diesel, or lubricants, contribute as the major source of energy for industries and everyday life around the world (Logeshwaran et al. 2018). Through accidents, leaks, and spills occurring during fuel exploration, production, transport, and storage petroleum-based products are released into the environment resulting in pollution of the environment (Das & Chandran, 2011). In crude oil, >17000 compounds are present at a varying concentration (Fingas, 2011), which makes it a xenobiotic contaminant of serious concern worldwide. In addition to hydrocarbons, polar compounds with polar functional groups (e.g., keto, hydroxy, thiol, nitro, and amino groups) are also dominating the contaminated sediments and groundwater. Among the hydrocarbons, polycyclic aromatic hydrocarbons (PAHs) found in crude oil are highly toxic, carcinogenic, and mutagenic (Aina et al. 2006). This study was aimed at characterizing the chemical composition petroleum hydrocarbon (PHs) contaminated groundwater and their toxicity using the Allium cepa cyto- & genotoxicity assay. METHODS The groundwater samples (from PHs contaminated wells) B123, SS05, W17, W18, and W22, were collected from Williamtown RAAF base, Newcastle and analyzed for PHs concentration as per USEPA procedures. Qualitative analysis of unknown compounds was done in GC-Ms (Lubcke-von varel et al. 2011) with slight modifications. Cyto- & genotoxicity assay was carried out as described in Panneerselvan et al. (2016). RESULTS AND DISCUSSION The TPH concentrations from groundwater samples from B123 (21700 µg/l), SS05 (1900 µg/l) and W18 (1040 µg/l) wells exceeded Dutch intervention limit of 600 µg/l. On the other hand, groundwater samples from W22 and W17 showed lower TPH concentrations (<50 µg/l). The identified polar and non-polar compounds in the groundwater are presented in Table 1. The cytotoxic effects of the TPH contaminated groundwater followed the order of B123>SS05>W18>W22=W17=(-ve) control. A significant decrease in the Mitotic Index (10.58%) was obtained in the positive control and the treatments B123 (44.21%) and SS05 (59.62%) (Fig 1). The chromosomal aberrations (CAs) were observed in B123, SS05, and W18 in both 24 and 48 h (Fig 2). The chromosomal breakages (CAs) were due to clastogenic effects induced by chemicals (Yi & Meng, 2003). CONCLUSIONS this study suggests that the TPH contaminated groundwater can present mutagenic effects to A. cepa. The chemical analysis of groundwater revealed polar and non-polar compounds which might have contributed to the toxic effects. Chemical analysis, in conjunction with toxicity assays, is necessary to ensure there is no risk following remediation as part of risk-based remediation approach.
T42f
Copyright © CRC CARE Pty. Ltd., 2019
CleanUp Conference 2019Adelaide, Australia
8 –12 September 2019501
Table of Contentsfor this manuscript

Table 1. Qualitative analysis of unknown compounds from groundwater samples Sample Compounds
W17 n-alkanes, L-glutamic acid, 2,4-Di-tert-butylphenol, Phenol-d6, 2-Chlorophenol, 2,4,6-Tribromophenol, 2-fluorobiphenyl, Anthracene-d10, 4-Terphenyl-d14, 1,2 Dichloroethane, Toluene, 4-bromofluorobenzene
SS05 n-alkanes, Naphthalene, 1-nitronaphthalene, Anthraquinone, Barrigenol R1, Quinine 1,1-dioxide, Tetracontane, Rhodopin, Octadecane, Tertradecanoic acid, L-proline, Tetratetracontane, Decanoic acid, 2,6-bis (1,1-dimethylethyl)-phenol, 2,4,6-Tribromophenol, 2-fluorobiphenyl, Anthracene-d10, 4-Terphenyl-d14, 1,2 Dichloroethane, Toluene, 4-bromofluorobenzene
B123 n-alkanes, Naphthalene, Phenylnaphthalene, 7,10,13-Eicosatrienoic acid (methyl ester), Octadecane, Pphorbol 12,13-dihexanoate, Cyclopropane, Tetracosane, Acetic acid, L-α Terpineol, Haematoporphyrin, 9-hexadecanoic acid, Tetratetracontane, Anodendroside E2, Cholestone, 2,4,di-tert-butylphenol, Rhodoxanthin, 2,4,6-Tribromophenol, 2-fluorobiphenyl, Anthracene-d10, 4-Terphenyl-d14, 1,2 Dichloroethane, Toluene, 4-bromofluorobenzene
W18 n-alkanes, naphthalene, Octadecanoic acid, 2,4-Di-tert-butylphenol, 2,4,6-Tribromophenol, 2-fluorobiphenyl, Anthracene-d10, 4-Terphenyl-d14, 1,2 Dichloroethane, Toluene, 4-bromofluorobenzene
W22 n-alkanes, Octadecanoic acid, Barrigenol R1, 2,4-Di-tert-butylphenol, 2,4,6-Tribromophenol, 2-fluorobiphenyl, Anthracene-d10, 4-Terphenyl-d14, 1,2 Dichloroethane, Toluene, 4-bromofluorobenzene
REFERENCES Aina, R., Palin, L., and Citterio, S (2006) Molecular evidence for benzo [a] pyrene and
naphthalene genotoxicity in Trifolium repens L. Chemosphere 65(4): 666-673. Das, N. and Chandran, P (2011) Microbial degradation of petroleum hydrocarbon
contaminants: an overview. Biotechnol. Res. Int. 1-13. Fingas, M. Introduction to oil chemistry and properties (2011) In M. Fingas (Ed.), Oil Spill
Science and Technology, Elsevier Publisher, New York, pp. 51–59. Logeshwaran, P., Megharaj, M., Chadalavada, S., Bowman, M. and Naidu, R (2018)
Petroleum hydrocarbons (PH) in groundwater aquifers: An overview of environmental fate, toxicity, microbial degradation, and risk-based remediation approaches. Environ. Technol. Innov. 10: 175-193.
Panneerselvan, L., Sivaram, A.K., Mallavarapu, M. and Naidu, R., 2016. Evaluation of cyto-and genotoxic effects of Class B firefighting foam products: Tridol-S 3% AFFF and Tridol-S 6% AFFF to Allium cepa. Environmental Technology & Innovation, 6, pp.185-194.
Lubcke-von Varel, U., Machala, M., Ciganek, M., Neca, J., Pencikova, K., Palkova, L., Vondracek, J., Loffler, I., Streck, G., Reifferscheid, G. and Fluckiger-Isler, S. (2011) Polar compounds dominate in vitro effects of sediment extracts. Environ. Sci. Technol. 45(6): 2384-2390.
Yi, H. and Meng, Z. (2003) Genotoxicity of hydrated sulfur dioxide on root tips of Allium sativum and Vicia faba. Mutat. Res. 537: 109–114.
502
Table of Contentsfor this manuscript

THE USE OF ADAPTIVE MANAGEMENT AND HIGH-RESOLUTION SITE CHARACTERIZATION TO ADVANCE CLOSURE OF
SITES WITH LARGE, DILUTE PLUMES
Ryan A. Wymore1, Nathan Smith1, Michael B. Smith2, Tamzen Macbeth3
1CDM Smith, 555 17th St Suite 500, Denver, CO 80202, USA 2Vermont Department of Environmental Conservation, Montpelier, VT 05620, USA
3CDM Smith, 50 West 14th Street Suite 200, Helena, MT 59601, USA wymorera, smithnt, [email protected], [email protected]
INTRODUCTION Adaptive Management principles can be used throughout the entire life cycle of remediation projects, from initial site characterization, through remedial design (RD), and throughout remedial action (RA) implementation. Specifically, adaptive management can leverage outputs from recently developed High Resolution Site Characterization (HRSC) technologies. These strategies and technologies can be especially useful at large, dilute chlorinated solvent plumes. This presentation will discuss how adaptive management principles can take advantage of HRSC technologies to advance site closure by providing two in-depth cases studies. BOUNTIFUL, UT SITE The first site to be discussed is the Bountiful/Woods Cross Operable Unit 1 site, which is contaminated with trichloroethene and its daughter products. The site includes a source area with solvent concentrations approaching 100 mg/L and a diffuse plume that stretches nearly one mile downgradient through a mixed residential, commercial, and industrial area. The contamination is present within the shallow aquifer [down to approximately 80 ft below ground surface (bgs)], consisting of interbedded sands, silts, clays, and gravels. The ROD-selected remedy was chemical and/or biological in situ treatment along with monitored natural attenuation (MNA), but it allowed for flexibility in design and implementation based on observed site conditions. The original remedy concept was in situ bioremediation (ISB) with emulsified oil injections using a grid pattern of wells in the source area, and three biobarriers in the downgradient plume. Extensive HRSC was performed starting in 2008 using membrane interface probe and direct push soil and groundwater sampling was conducted to refine placement of injection wells and screened intervals. The findings from these activities were invaluable, as it was determined that contamination extended more than 30 ft deeper than expected based on the original conceptual site model (CSM). Furthermore, whereas the highest concentrations were thought to be 2-3 mg/L, the deeper zone had concentrations approaching 100 mg/L, and concentrations of 2-3 mg/L extended a significant distance downgradient. Based on these findings and in keeping with an adaptive approach, the remedy for this site was updated to address this previously undiscovered deeper contamination. The injection well network was extended to a deeper portion of the aquifer in order to treat the newly-found areas of contamination in the DNAPL source area, and biobarriers were significantly expanded to treat the dilute portion of this plume. COMMERCE ST PLUME SITE The second site to be discussed is the Commerce Street Plume Superfund Site in Williston, VT. This site is contaminated with TCE and daughter products beneath a mixed-use area. The ROD-selected remedy for this site features in situ chemical oxidation for TCE concentrations greater than 50,000 μg/L, ISB where TCE is greater than 500 μg/L but less than 50,000 μg/L, and MNA where TCE is less than 500 μg/L. A comprehensive pre-design characterization program was implemented using the latest in HRSC technologies
T43a
Copyright © CRC CARE Pty. Ltd., 2019
CleanUp Conference 2019Adelaide, Australia
8 –12 September 2019503
Table of Contentsfor this manuscript

[specifically the membrane interface probe/hydraulic profiling tool (MiHPT) and Waterloo Advanced Profiling System (APS)], vertically discrete soil/groundwater sampling, and onsite laboratory analysis. This intensive pre-RD characterization program was coupled with 3-D visualization to update the CSM in real time to guide subsequent portions of the investigation. This pre-Remedial Design characterization has provided a detailed understanding of site lithologies and hydraulic properties, the overall extent of contamination, and the architecture of the source area. Specifically, 3-D visualization of the site lithologies, as derived from the hydraulic profiling tools, revealed that lower permeability silts are directly impacting contaminant transport in some areas of the site. This helped explain why TCE was not being detected at significant concentrations in areas of the site where the plume was thought to be migrating. In areas of the site where high concentrations remained, the hydraulic profiling revealed the presence of previously unidentified silt layers interbedded within the sand unit, which could have a significant impact on the ability to uniformly distribute ISB amendments. Importantly, the characterization program showed that the 50,000 μg/L hotspot is no longer present. This implies that the entire ISCO remedy component is no longer needed, and that the entire site can be treated with ISB and MNA. Elimination of ISCO could represent up to a $3 million savings over the life-cycle of the remedy. Based on the results of the characterization program, the pilot study was significantly modified from its original design. Because ISCO was eliminated, the pilot study focused on implementation of ISB in two distinct configurations – one for source area treatment, and one for downgradient treatment using biobarriers. The pilot study results form the basis for the RD at this site, which features injection wells for the DNAPL source area and biobarriers/trenches to treat dilute portion of the plume. CONCLUSIONS Overall, the use of near real-time data generated during HRSC activities to refine the CSM at both of these sites has been invaluable in guiding the RD and implementation of full-scale remedies. In some cases, the adaptations are simply adjustments to the layout of the previously planned technologies. In other cases, the adaptations are wholesale changes in technologies that are more appropriate for the refined understanding of site conditions. Overall, the use of adaptive management and HRSC has improved remedial decision making at both sites while minimizing the need for time consuming changes to the decision documents.
504
Table of Contentsfor this manuscript

ADVANCING SITE CHARACTERISATION BY ASSEMBLING MULTIPLE CONTEMPORARY AND HISTORICAL DATA SOURCES
John Lee, Peter A. Rodgers, Howard D. Waldron
Lotsearch Pty. Ltd., Level 3, 68 Alfred Street South, Milsons Point, 2061, AUSTRALIA
INTRODUCTION Responsible and ethical site characterisation relies on the analysis of numerous sources of reliable and accurate data such as environmental, geological, ecological, and development plan/zoning data. One such key aspect is the identification of existing or historical hazardous land use activities that may have led to contamination either on or in proximity to the site that may pose substantial adverse impacts. Contamination is a significant problem in most urban areas of the world, particularly around former industrial land uses that were active when environmental protection measures were poorly regulated. One method of identifying historical land use activities is through the research of historical business/trade directories where companies or individuals were listed with their business activity, address, and phone number and were published in Australia since the early-mid 20th century. However, this is a tedious and painstaking process that involves manually combing through numerous volumes/editions of directory books, and beginning a search can be onerous without prior knowledge of the identity of the organisation/individual or their past business activity. Therefore, historical business directories spanning multiple decades and from several Australian states/territories were digitised and mapped spatially to expedite the delineation of historical land uses and potential pollution risks. Other key historical datasets such as aerial imagery and maps, as well as contaminated sites and licences published by state or federal government bodies were aggregated to serve as additional lines of evidence to corroborate on past, and potentially contaminative, land uses. These were then combined with contemporary datasets such as topography, geology, hydrology, ecology, contours, soils, mining, natural hazards, planning & development controls, and heritage sites to enable for a complete characterisation of a site. METHODS
Data Collation and Pre-Processing Prior to any data being incorporated into the database, Lotsearch first ensured that any necessary licences and/or permissions were obtained. Present-day datasets were obtained from state or federal level authorities as geographical information system (GIS) shapefiles or geodatabases under Creative Commons Licences. Historical aerial imagery and maps from the 19th and 20th centuries were sourced from the relevant local, state, or federal bodies and efforts were made to ensure that they were scanned at the highest available scan quality as lossless raster image files. Universal Business Directory and Sands & McDougall directories (minimum one edition per every available decade in the 20th century) from Australian Capital Territory, New South Wales, Queensland, South Australia, and Victoria were scanned page by page and each scanned page was fed through optical character recognition (OCR) software to produce digital text copies of each historical business record. The historical records were loaded into a geocoding software that recognised the addresses and produced latitude and longitude coordinates. Published current contamination data were downloaded from the relevant state or federal authority’s websites either as shapefile or spreadsheet formats.
Mapping All mapping was conducted using ESRI ArcMap version 10 software. Due to the widespread availability and use of various types of map projections and transformations, all spatial format data were exported to the Geocentric Datum of Australia 1994 (GDA94) coordinate reference system for consistency. Raster image files for aerial images and historical maps were imported and georeferenced in ArcMap using first-order transformation with a minimum
T43b
Copyright © CRC CARE Pty. Ltd., 2019
CleanUp Conference 2019Adelaide, Australia
8 –12 September 2019505
Table of Contentsfor this manuscript

of three control points to a target satellite image, basemap, or cadastre. Historical business directory records were imported as latitude and longitude coordinates and exported as point shapefiles using the appropriate eastings and northings coordinates pertaining to each state/territory. All historical records were manually verified to ensure a high level of accuracy, and when a record's location was in doubt, other sources of evidence were sought. Government issued contamination datasets were mapped as polygon shapefiles and the boundary of a site was captured using either the supplied address or legal property identifiers. RESULTS AND DISCUSSION Over 45,000 historical aerial imagery frames and over 10,000 historical maps were sourced. Over 3 million former businesses were mapped at greater than 90% accuracy to the premises in urban centres and included over 180,000 former motor garages/services stations and over 25,000 former dry-cleaning operations. The number of government contamination records, including PFAS investigation sites, and issued licences/authorisations are outlined in Table 1.
Table 1. Approximate counts of government-sourced contamination and licence dataset records.
State Contaminated Sites Licences/Authorisations ACT >200 >1200 NSW >4600 >5900 QLD >500 >11000 SA >5600 >4300 VIC >12000 >1200 WA >6000 >1600
However, the collection and digitisation of the various datasets has been fraught with several unique and interesting challenges. Firstly, spatial data files downloaded from government sources were at times inconsistent and contained artefacts or corrupted features and these errors were notified to their sources for correction. Secondly, historical maps were mostly hand-drawn and thus posed a considerable challenge as they frequently did not align appropriately to known modern features or boundaries. Moreover, georeferencing historical aerials images to undulating topography was difficult and required higher order georeferencing transformations resulting in the unavoidable, but necessary, warping of raster images. Thirdly, converting historical business records from printed text to digital format led to a few issues such as typographical errors and sometimes a failure to produce acceptable lat/long coordinates. Additionally, complications arose when the addresses on a street were historically renumbered, or the entire street/suburb was renamed. Finally, contaminated sites published by government authorities occasionally referred to addresses or legal property identifiers that were difficult to locate or the full extent of their premises appeared inconclusive. These matters were queried with the relevant authorities for further information. CONCLUSIONS The aggregation and digitisation of the various datasets has been largely successful and has built a unique, proprietary land use database across Australia. The coupling of both modern and historical datasets in a GIS environment paints a rich and detailed picture of Australia's contemporary and historical land uses that allows for a thorough characterisation of a site to be conducted both spatially and temporally. REFERENCES Sands & McDougall (1896-1974) Sands & McDougall’s Directory, Sands & McDougall (Aust.)
Pty. Ltd., NSW, QLD, SA, VIC. Universal Business Directory (1941-1991) UBD Business & Street Directory, Universal
Business Directories (Aust.) Pty. Ltd., NSW, QLD, SA, VIC.
506
Table of Contentsfor this manuscript
CASE STUDY: REAL TIME ASSESSMENT OF REMOTE MULTI-SENSITIVE SITES USING
PORTABLE XRF AND MOBILE DATA CAPTURE TECHNOLOGIES
Freya Amon, Christian Wallis, Andrew Barker
CDM Smith, 1/30 Wangaratta St, Richmond, Melbourne, 3220, AUSTRALIA
INTRODUCTION Advances in technology associated with real time assessment and mobile technology, has stimulated the spread of mobile applications in the field of contaminated site assessment and remediation planning. The combination of these technologies has transformed the design and execution of multi-site studies in Australia through lower cost cloud computing to support real time data capture, processing and analysis. This multi-site case study involved a suitability assessment of multiple sensitive residential properties located throughout rural Victoria. Due to the remote nature of the properties, the variable land sizes, and sensitive residential use(s), a range of technologies were adopted to minimise the frequency of interruption to residents, including portable X-ray fluorescence (XRF) and mobile data capture. The combination of technologies minimised the need for multiple site-mobilisations and provided the opportunity to define risk and/or remediation actions in a more timely and responsive manner that minimised costs and impact to key stakeholders and site tenants. METHODS Preliminary Screening Preliminary screening of a portfolio of over 50 residential properties included:
• Capture of observed potential sources, pathways and receptors to build site conceptual models (CSM) in real time using a bespoke mobile data capture form; and
• Sampling of accessible soils. The preliminary screening identified that properties were suitable for continued residential use or required further assessment, a human health risk assessment or management. To ensure the cloud computing and mobile technologies were adequately applied to the case study, the data management life-cycle for the entire project was designed before mobilising to the field. The benefits of this approach extend to the ability for teams across multiple sites to access, collect and review information simultaneously using a single dataset, while office based staff were able to track progress and review records as they were collected. The main efficiency gains and quality improvements that were achieved were associated with the data collection, collation, and analysis stages. Further Assessment Properties that were selected for further assessment required either additional lead in soil data to understand total exposure of an area or delineation of identified lead impacts. Further assessment of identified lead impacts in soil was undertaken using an Olympus Delta Handheld XRF Analyser in general accordance with USEPA SW-846 Test Method 6200 (US EPA 2007, Kalnicky, 2001) including collection of soil samples in snap lock bags, homogenisation and hand compaction prior to analysis with the XRF. Between three and five XRF readings were collected from each sample. All soil samples exceeding the adopted residential criteria (NEPM HIL A) and delineation samples (next horizontal or vertical sample after an exceedance) were then analysed in a NATA accredited laboratory. This high proportion of samples analysed in the laboratory was undertaken due to wet ground
T43c
Copyright © CRC CARE Pty. Ltd., 2019
CleanUp Conference 2019Adelaide, Australia
8 –12 September 2019507
Table of Contentsfor this manuscript

conditions during the field XRF assessment, which has the potential to interfere and dilute the XRF results. RESULTS AND DISCUSSION The XRF was used in the field as a screening tool to assist in identifying and delineating lead impacts onsite and assist in decision making in the field. A brief comparison of the field XRF screening results against the laboratory results was undertaken as summarised below and in Figure 1. In general, the XRF field screening:
• Identified common built environment contaminants in residential settings, primarily lead, likely to be associated with poorly maintained weathered buildings and sheds painted with lead based paints resulting in localised soil impacts;
• The highly variable nature of lead impacts over short spatial distances and depths; • Enabled delineation in the field by identifying areas of lead above criteria; • The XRF identified exceedances of the lead criteria approximately 95% of the time
(compared to laboratory data); and • The XRF provided reasonable correlation at the relatively lower concentrations (up
to and exceeding the criteria of 300 mg/kg), with higher variability observed between the XRF and laboratory results at concentrations greater than 1,000 mg/kg. This observation may be due to variability within the soil matrix.
Fig. 1. Lead portable XRF and Lead Laboratory Results comparison This case study demonstrated the benefits of utilising real time assessment and mobile computing to extend the ability for teams across multiple sites to access, collect and review information simultaneously using a single dataset, while office-based staff were able to track progress and review as they were collected. The main efficiency gains and quality improvements were associated with the data collection, collation, and analysis. CONCLUSIONS Portable XRF is a powerful screening tool as part of contaminated land assessments and allows for the cost-effective collection of large and real time data sets to allow for quick, efficient issue identification and decision making, while mobile data capture technologies can be tailored to provide fast and simple collection of site-specific data requirements, reduce manual handling and provide an efficient means to collect and interrogate large datasets. REFERENCES USEPA. (2007) Method 6200: Field Portable X-Ray Fluorescence Spectrometry For The
Determination Of Elemental Concentrations In Soil And Sediment, USEPA. Kalnicky, D., and Singhvi, R. (2001) Field portable XRF analysis of environmental samples,
Journal of Hazardous Materials, 83:93-122.
508
Table of Contentsfor this manuscript

ONE DIMENSIONAL GROUNDWATER ELEVATION PREDICTION MODEL
Stefan Charteris
GHD Pty Ltd, L15, 133 Castlereagh Street, Sydney, 2000, AUSTRALIA
INTRODUCTION A groundwater plume of dissolved phase petroleum was identified to have potential to migrate into a down gradient peripheral drain. The drain was designed to limit the potential for unimpacted surface water to enter a building complex. As part of understanding the potential for the impacted groundwater to rise to elevations where it flowed into the drain and then on to sensitive down gradient surface water systems, a one dimensional groundwater elevation model was developed. METHOD The groundwater elevation model was developed in an Excel spreadsheet and was based on a simple box model with groundwater levels in the box increasing with rainfall and net storage decreasing with no rainfall. The modelling focused on developing input equations that simulated groundwater level response rather than relying on a rigid set of hydrogeological parameters (storage and hydraulic conductivity). This provided more freedom in the variability of input parameters to simulate groundwater elevations. The equation inputs were varied to achieve a best-fit simulation of a two month groundwater elevation dataset that had a number of significant rainfall events. Uncertainty analysis was completed by stressing the rainfall recharge component to higher and lower levels and then re-calibrating the model while maintaining goodness of fit. RESULTS AND DISCUSSION There was a high degree of fit between simulated and actual groundwater elevations. Figure 1 provides the simulated and observed groundwater elevations. Figure 2 provides the goodness of fit between observed and simulated groundwater elevations. Due to the good fit, the model was used to predict groundwater changes over a long term rainfall dataset. Figure 3 provides the long term predicted groundwater elevation. This modelling was developed to simulate groundwater response in a shallow unconfined and unconsolidated aquifer. Further testing will be completed to validate the model for use on other lithologies and aquifer types. This will potentially result in the development of a model with direct applicability to a range of assessments where understanding long-term groundwater elevations using short-term high frequency groundwater elevation data is required.
T43d
Copyright © CRC CARE Pty. Ltd., 2019
CleanUp Conference 2019Adelaide, Australia
8 –12 September 2019509
Table of Contentsfor this manuscript

Fig. 1. Simulated and observed groundwater elevations (m AHD)
Fig. 2. Goodness of fit between observed and simulated groundwater elevations
Fig. 3. Predicted long term groundwater elevation
510
Table of Contentsfor this manuscript

CHANGES IN LAND USE PATTERN USING REMOTE SENSING IN AND AROUND FARIDABAD DISTRICT,
HARYANA, INDIA OVER LAST FOUR DECADES
Shruti Dutta, Koorapati Kirtana
Department of Earth & Environmental Sciences, Amity University Haryana, Gurugram 122413, INDIA [email protected]
INTRODUCTION India perceived to be a country of villages and rural dominance has now sprawled exorbitantly into urban panoramic perspective. Urban growth can thus be defined as the process in which the population of a region undergoes a radial proliferation and expansion into its rural areas. The pattern and extent of this process can often variable be between regions. However, in the present scenario these sprawling centers have gradually become interconnected denoting a dendritic look (Carlson and Arthur 2000). Urbanization is associated with demographic and economic dynamics process in a society; however, at the same time it can also be defined as a phenomenon that transforms ecological environment at local as well as global scales. Thus, the study of growth pattern becomes very significant from the viewpoint of urban planning. A chaotic urban sprawl supplemented with rapid population may lead to changes in urban land use and land cover; loss of productive agricultural land and open green spaces; loss of surface water bodies; depletion of ground water; deterioration of infrastructure facilities; micro climate change; air, water, and noise pollution; and an increase inpublic health hazards (Rahman, 2007). Remote sensing technology and Geographical Information System provide efficient methods for analysis of land use, land cover issues and tools for land use planning and modelling which may thus help us observing the growth in the transformation of any area/city/state in general. The use of remote sensing and geographical information system thus, plays a vital role in observing the changes in the land use/ land cover for suitable arrangement and utilization of the resources and their administration. The purpose of the study of land use/ land cover change can be seen as a case study to learn about the rising global change in the pattern of the vegetation, settlements, population and the change in the features which can be used for a sustainable development. The conventional methods such as census, collection of demographic data samples etc. are inadequate for complex studies and may also show an error manually leading to insufficient data analysis hence, sometimes providing deficient figures. The present study aims to investigate the land use land cover estimation and change detection in the region in and around Faridabad and Delhi, on a decadal basis through remote sensing techniques. Since the urban developmental and growth centers are mainly concentrated around the capital territories of any state, the region of Delhi National Capital Region (NCR) is kept in focus. METHODS A change detection was carried out using the satellite remote sensing techniques to assess the land use land cover pattern in and around Faridabad district of Haryana and South Delhi. The satellite images was downloaded freely from the website of USGS (https://earthexplorer.usgs.gov) for the year 1980, 1992, 2000 and ISRO geoportal bhuvan (https://bhuvan.nrsc.gov.in/bhuvan_links.php) for the year 2000, 2016. The satellite images are selected so that there is minimal cloud cover and the landscape is exposed to a maximum. Using the image enhancement techniques, the spectral signatures of the land features were utilized to identify the various features like settlement, vegetation etc. The LULC map was prepared using unsupervised classification for the land use class viz. Water bodies,
T43e
Copyright © CRC CARE Pty. Ltd., 2019
CleanUp Conference 2019Adelaide, Australia
8 –12 September 2019511
Table of Contentsfor this manuscript

Settlements, Natural Vegetation, Farm lands and Barren Lands for the above mentioned classes for the year 1980, 1992, 2000 and 2016. Using the software Arc GIS.8.1 A change detection analysis was carried out using the temporal images to estimate the areal changes within these classes in the above mentioned years. The said land features such as water bodies, settlements, natural vegetation, farm lands and barren lands were divided into classes on the basis of visual interpretation as observed with respect to time period. Hence, land cover/ land use maps for the years 2000, 2015 and 2016 were created accordingly. RESULTS AND DISCUSSION Using the unsupervised classification for land use land cover mapping, there has been a significant change observed in the Faridabad district of Haryana and South Delhi region. The settlement has been estimated to increase from 32343 acres to 62831.8 (94.3%); Water bodies decreased from 3982 acres to 1508.01 acres (62.1%); and the Natural vegetation decreased from 44114.7 acres to 19262 acres (56.3%). Moreover, the study shows a change in Farmland/non – natural vegetation with a decrease from 2080 acres to 546.641 acres (73.7%) and a decrease in areal extent of Barren lands from 21951 acres to 13040.9 acres (40.6%).The study further reveals that the rate of change has been exaggerated with respect to the last two decades.
Figure 1: LULC Map - March 2016
The rapid increase in population and industrialisation has led to a growth in urbanization. Saying this, the National Capital Region of Delhi in particular has witnessed an exorbitant growth in the settlements in and around the region of NCR and the industrial hub locations leading to an urban sprawl in the last four decades. These settlements may be classified under the authorised or unauthorised slums according to the Government of India. This two-fold increase in the settlements has led to the degradation of environment.
512
Table of Contentsfor this manuscript

CONCLUSIONS So, as observed from the statistics above, the growth in urbanization has led to the significant change in the land use and land cover of Faridabad and South Delhi region, India. Since, urbanization is inevitable and keeping in mind the increasing number of population and hence the growth, the monitoring pattern of the growth of urbanization should be kept in check and be planned in an efficient way so as to keep it in accordance with the environment. Thus, Remote Sensing and Geographic Information Systems can be defined as an excellent tool to assess and estimate the Land Use / Land Cover changes and be defined as an excellent model for monitoring the policy changes and the environmental impact. REFERENCES Carlson TN, Arthur ST (2000) The impact of land use-land cover changes due to
urbanization on surface microclimate and hydrology: a satellite perspective. Global and Planetary Change 25:49-65
Kumar, S and Sangwan R.S., 2013: Urban Growth, Land Use Changes and its Impact on Cityscape in Sonipat City Using Remote Sensing and GIS Techniques, Haryana, India , International Journal of Advanced Remote Sensing and GIS 2013, Volume 2, Issue 1, pp. 326-332, Article ID Tech-157 ISSN 2320 – 0243
Madan Mohan , 2005: Urban Land Cover/Land Use Change Detection in National Capital Region (NCR) Delhi: A Study of Faridabad District From Pharaohs to Geoinformatics FIG Working Week 2005 and GSDI-8 Cairo, Egypt, April 16-21, 2005 TS 24 – Planning for Rural and Urban Communities Madan Mohan TS24.5 Urban Land Cover/Land Use Change Detection in National Capital Region (NCR) Delhi: A Study of Faridabad District
Rahman A. (2007) Application of Remote Sensing and GIS Technique for Urban Environmental Management and Sustainable Development of Delhi, India. In: Netzband M., Stefanov W.L., Redman C. (eds) Applied Remote Sensing for Urban Planning, Governance and Sustainability. Springer, Berlin, Heidelberg
Rawat, JS, Kumar Manish 2015: Monitoring land use/ land cover change using remote sensing and GIS techniques: A case study of Hawalbagh block, district Almora, Uttarakhand, India –The Egyptian Journal of Remote Sensing and Space ScienceVolume 18, Issue 1, June 2015: Pages 77-84
Sharma, R, Joshi PK , 2013: Mapping environmental impacts of rapid urbanization in the National Capital Region of India using remote sensing inputs ,Journal of the Indian Society of Remote Sensing 41 (3), 641-650
Vij S., Narain V. 2016: Land, water & power: The demise of common property resources in periurban Gurgaon, India Land Use Policy 50 (2016) 59–66
513
Table of Contentsfor this manuscript

DRINKING WATER QUALITY FROM AN ARSENIC CONTAMINATED DISTRICT, BANGLADESH: HUMAN HEALTH RISK
Md. Aminur Rahman1,2, Dane Lamb1, Mahmudur Rahman1, Peter Sanderson1,
Mezbaul Bahar1, Ravi Naidu1
1GCER, University of Newcastle, AUSTRALIA
2Department of Public Health Engineering (DPHE), Zonal Lab, Khulna 9100, BANGLADESH [email protected]
INTRODUCTION The population of Bangladesh rely on groundwater for drinking, industrial, agricultural and domestic use. Unfortunately, arsenic (As), a class I toxic and carcinogenic element has been detected in the groundwater of Bangladesh where more than 150 million people are exposed to As contaminated water above 10 µg/L (the guideline value of As in drinking water by the World Health Organization, WHO). However, quality of groundwater resources varies from place to place, sometimes depending on seasonal changes, the types of soils, rocks and surfaces through which it flows. Pesticides and fertilizers applied to lawns and crops can coagulate and migrate to the water tables which are affecting both the physical, chemical and bacteriological quality of water. This study investigated the quality of water from an As contaminated area (Kushtia, Bangladesh) for human potability concerning their physicochemical and bacteriological contaminants and possible impact on human health. METHODS The physicochemical water quality of 32 randomly selected tube wells (TWs) were measured in terms of pH, Electrical Conductivity (EC), Total Dissolved Solids (TDS), Chloride, Total Hardness, As, Iron (Fe) and Manganese (Mn). The pH and Electrical Conductivity (EC) of water were determined on-site while collecting the samples using a multimeter (Model HQ 40d, HACH, USA) whereas TDS was measured by the use of a multimeter, Sension-156, HACH, USA. Elements such as As, Fe and Mn in groundwater were analyzed by the Atomic Absorption Spectrophotometric (AAS) method (SpectrAA220, Varian, Australia). For quality control, certified reference material of As, Fe and Mn solution were used. Water samples were analyzed immediately after collection (within 4 h), for the presence of fecal coliform (FC) and total coliform (TC) using membrane filtration method followed by 0.45 µm pore size filter papers. The filters were placed on mFC agar (for FC) and mENDO agar (for TC); and plates were incubated aerobically at 45 °C and 37 °C respectively for 21 ± 3 h. APHA (2012) standard analytical methods were applied for analyses of the physicochemical and bacteriological parameters of the water samples. RESULTS AND DISCUSSION The investigated parameters of water samples were found to have pH ranging from 6.81-8.12, EC 520-1995 µS/cm, TDS 357.8-1372.6 mg/L, chloride 10-615 mg/L, Total Hardness 285-810 mg/L, As 1-98 µg/L, Fe 0.04-1.45 mg/L, Mn 0.01-6.32 mg/L (Table 1). The pH of the water in the study area could be classified as suitable for drinking purposes according to WHO (2011) and Bangladesh drinking standards (ECR’97). The highest EC (1995 µS/cm) may be due to high concentration of ionic constituents present in the groundwater. A lot of salts, especially NaCl is present in dissolved state in groundwater for the tube well whose chloride level founds 615 mg/L. WHO (2011) categorized water as soft, moderately hard, hard, and very hard when its hardness levels are 0–60 mg/L, 61–120 mg/L, 121–180 mg/L, and >180 mg/L, respectively. In our study, no samples are soft, moderately soft, or hard on the basis of total hardness. All of the samples were very hard, reflecting the geological composition of the area. Hardness of water is primarily due to the presence of salts of calcium and magnesium and also increases the boiling point of the water. It is suggested that deeper aquifer tube wells will not be generally sustainable in this area (Kushtia
T43f
Copyright © CRC CARE Pty. Ltd., 2019
CleanUp Conference 2019Adelaide, Australia8 –12 September 2019 514
Table of Contentsfor this manuscript

previously belongs to Nadia, West Bengal, India) due to absence of a thick clay barrier separating the As-affected aquifer and the deep aquifer (PHED, 2006). Reduction of Fe-oxyhydroxides is also responsible for mechanism of As contamination in the studied area. The presence of Fe in underground drinking water could be due to its percolation from granitic and metamorphosed rocks into groundwater, i.e., water-rock interaction. The health effects of Fe in drinking water may include warding off fatigue and anemia. Like Fe, it is suggested that Mn is most probably produced from different ores that erode and soluble in groundwater sources. The central nervous system is the chief target of Mn toxicity especially causes neurological disorders in children (ATSDR 2000).
Table 1. Physicochemical parameter and trace metals in drinking water (n= 32) Parameter pH EC
(µS/cm) TDS
(mg/L) Cl
(mg/L) Hardness
(mg/L) As
(µg/L) Fe
(mg/L) Mn
(mg/L) Mean 7.65 841 579 84 433 15 0.25 0.99
Median 7.11 612 626.1 30 395 24 0.09 0.01 Range 6.81-8.12 520-1995 358-1373 10-615 285-810 1-98 0.04-1.45 0.01-6.32
WHO (2011) 6.5-8.5 - - 250 200 10 0.3 0.4 BDS (ECR’1997) 6.5-8.5 - 1000 600 500 50 1.0 0.1
The contamination of FC and TC in our investigated drinking water sources and type of risk is shown in the Table 2. About 56.25% tube wells were highly contaminated with fecal coliform and 68.75% were found to have contaminated with total coliform. From our study, it was found that FC and TC may enter the water sources mainly due to the distance of latrine and TWs. Latrines are sometime very close the TWs. Moreover, few TWs are dug close by the sewerage line or kacca drain and contamination of FC and TC may come to pass from it. It is also seen all the TWs are unprotected from excreta of birds, like crow, sparrow, Magpie, Martin etc. So, the contamination of FC and TC is mostly affected by location of latrine, dustbin, drain, sewerage line, conditions of platform, i.e., broken, unhealthy, apron constructions of the TWs.
Table 2. Level of risk and tube wells contaminated with FC and TC (n=32) Category
*cfu/100mL No. of TWs % Type of Risk
Fecal Coliform Total Coliform Fecal Coliform Total Coliform
<1 14 10 43.75 31.25 Safe 1-10 13 7 40.62 21.88 Low 11-50 5 11 15.63 34.37 Intermediate 51-100 - 3 - 9.37 High >100 - 1 - 3.13 Very High
*Cfu=colony forming unit.
CONCLUSIONS The concentrations of water quality parameters are much high as compared to WHO (2011) and BDS standards (ECR’97). The level of As, Mn, Hardness and fecal coliform may cause violent public health risks and is unsuitable for direct human consumption without any treatment. REFERENCE American Public Health Association (APHA), (2012). Standard Methods for the Examination
of Water and Wastewater, Washington: American Public Health Association Environment Conservation Rules (ECR), 1997. E.C.R.-Schedule-3. Department of
Environment & Forest Ministry, Bangladesh, pp. 205 World Health Organization (WHO), 2011. Guidelines for Drinking Water Quality, 4th edn.
WHO Press, Geneva ATSDR, 2000. Toxicological Profile for Manganese, Atlanta, GA, United States Department
Of Health and Human Services, Public Health Service, Agency for Toxic Substances and Disease Registry.
PHED, 2006. Master Plan to Tackle Arsenic Contamination of Groundwater in West Bengal. Government of West Bengal. p. 14.
515
Table of Contentsfor this manuscript

A REGULATORS PERSPECTIVE ON PREVENTATIVE BASED CLEAN UP
Kristin Wasley, Barbara Schulz
Environment Protection Authority Victoria, 200 Victoria Street, Carlton, 3053, AUSTRALIA
[email protected], [email protected]
INTRODUCTION The regulatory framework in Victoria is currently under the biggest reform since the commencement of the Environment Protection Act 1970. On the 1 July 2020 Victoria will see the commencement of a new Environment Protection Amendment Act 2018 (EP Act 2018). This presentation will discuss key elements of management of contaminated land (including groundwater clean-up) under the current Victorian regulatory process, and the following three duties to be considered once the new regulatory process takes effect:
• The General Environmental Duty (GED) will address land and groundwater pollution issues where an activity is currently being undertaken to disturb contaminated land by driving improvements in management oversight of risks (which will occur through means of enhanced environmental management systems and control measures to prevent pollution).
• The duty to manage contaminated land will require land owners and occupiers to assess and manage risks to human health and the environment arising from their land. This duty applies when there is contamination but not necessarily an activity being undertaken and applies to legacy contamination.
• The duty to notify EPA about identified contaminated land. This duty intends to improve management of land contamination across Victoria and a raise awareness in the community.
The objective of the EP Act 2018 is to protect human health and the environment by reducing the harmful effects of pollution and waste. That objective is linked directly to the General Environmental Duty (GED) throughout the EP Act 2018. METHODS With the new legislation taking effect the main driver for clean-up is moving from a reactive to a proactive approach. To illustrate the application of the new regulatory process in Victoria, a range of case studies and examples from the current legislative system and models showing future case examples for the new system will be discussed. The presentation will discuss the current triggers for clean-up being majority re-development of land for a sensitive use, resulting in only a small portion of contaminated sites being assessed, and discuss how this trigger will change with the introduction of the general environmental duty. Statistical data on number of Clean-up to Extent Practicable (CUTEP) submissions for groundwater will be presented with an evaluation of what triggers have influenced the statistics over the years. The principles in the EP Act 2018 should be integrated in all decisions. The presentation will also discuss the key changes of the principles from the EP Act 1970 to the EP Act 2018 and how this applies to clean-up plans in Victoria. The presentation will explain the links between the GED, the duty to manage contaminated land, the duty to notify contaminated land and the implementation of a robust risk-based audit system, which are key parts of the reformed contaminated land framework. Other supporting elements include an introduction to the new instruments Site Management Order (SMO), Better Environment Plan (BEP) and other notices such as Notice to investigate, Information gathering Notice, Improvement Notice and Environment Action Notice. There will also be information on these instruments and planning matters such as the role of land use, the planning system and land titles.
T44a
Copyright © CRC CARE Pty. Ltd., 2019
CleanUp Conference 2019Adelaide, Australia8 –12 September 2019 516
Table of Contentsfor this manuscript

RESULTS AND DISCUSSION The EP Act 2018 has a focus on reducing risks to human health and the environment and a new set of tools to achieve this. Remedial triggers under the current EP Act 1970 occurs as a response to pollution and mainly by two streams:
• The environmental audit system: In most cases triggered by the planning system with a goal to investigate contamination and how this may impact on a proposed site use(s). Remediation of soil and groundwater is aimed at restoring all beneficial uses. For groundwater the Clean-up to Extent Practicable process which looks at available technologies and cost benefit analysis of these to select the preferred approach.
• Through Pollution reports to EPA and Remedial Notices issued by Authorised Officers within EPA: These are site specific and may, in some cases, relate directly to an affected area of a premises, pollution event or other contamination matter that EPA becomes aware of.
Remedial triggers under the new EP Act 2018 will be in response to the General Environmental Duty (GED) and a Duty to Manage contamination risks. Tools available under the new EP Act 2018 allow several streams that lead to remediation. The following examples have been selected from the EP Act 2018;
• A reformed audit system with a targeted scalable risk-based audit system. • Better Environment plans will support flexible management and remediation outside
of the audit. • Environment Action notice and Notice to investigate • Site Management orders (SMO): For long term management of contaminated sites
post clean-up. • Circumstances where the Authority may exercise clean-up powers.
CONCLUSIONS The application of the new regulatory framework will include a new set of duties to consider when implementing your groundwater and land remediation. The presentation will conclude with key items to consider which includes remedial objectives, management of trigger levels, technology evaluation, emerging contaminants, site management during remediation and management plans post remediation. REFERENCES Environment Protection Act 1970 Environment Protection Amendment Act 2018 EPA. 2016. The cleanup and management of polluted groundwater. Publication 840.2. EPA
Victoria. Victorian Government. 2018. State Environment Protection Policy (Waters). Victorian
Government Gazette No. S 493. Government Printer, Melbourne. October 2018. Victorian Government. 1997. State Environment Protection Policy (Prevention and
Management of Contamination of Land). Victorian Government Gazette No. S95. Government Printer, Melbourne. June 2002.
Victorian Government. 2013. Variation to State Environment Protection Policy (Prevention and Management of Contamination of Land). Victorian Government Gazette No. G39. Government Printer, Melbourne. October 2013.
517
Table of Contentsfor this manuscript

A NEW ENVIRONMENT PROTECTION ACT FOR VICTORIA — IMPLICATIONS
Robyn Madsen, Peter Nadebaum
GHD Pty Ltd, 180 Lonsdale Street, Melbourne, 3000, AUSTRALIA
The Environment Protection Amendment Act 2018 (the Act) passed through the Victorian Parliament in 2018 and is due to take effect from 1 July 2020. The cornerstone of the Act is the general environmental duty that requires people to undertake reasonably practicable measures to eliminate, or otherwise reduce risks of harm to human health and the environment from pollution and waste. This differs from the current Environment Protection Act which is based on the actual occurrence of pollution and the setting of penalties that are applied where pollution has occurred. In essence, this changes the emphasis from responding to an actual pollution event, to confirming that management processes reflect good practice and are sufficient to avoid pollution. This approach is similar to legislation adopted in other fields, such as occupational health and safety, and in the management of drinking water quality. Other duties in the new Act specifically relating to contaminated land require owners and / or occupiers to identify and manage contamination, and notify EPA in the event that contamination is identified. This is similar to the requirements in other States of Australia. In terms of the principles that underpin the new Act, these are similar, but a new principle has been added that the response to minimising harm or the risk of harm to human health and the environment, should be proportionate to the harm or risk of harm. This applies the principles of ISO 31000 (Risk Management), which has been applied widely in industry in avoiding pollution and risks to human health, but infrequently in the field of contaminated land. The new Act also introduces a “Preliminary Risk Screening (PRS) tool”, that will use the available information pertaining to a site (such as the site history) to determine the risk posed by contamination, and whether the risk posed is low and does not warrant further assessment, or whether the risk is such that a targeted (or a full) assessment is required. This is to take into account the sensitivity of the current and proposed land use. This presentation will discuss the implications of the changed requirements for site owners, consultants and contractors, and will refer to draft regulations, codes of practice and information bulletins that have been issued by EPA in preparation for the commencement of the new Act. Discussion will particularly include:
• The role of Environmental Management Systems to manage the risks posed by contamination, and how these may be integrated with other management systems (such as for OHS), and can draw on the systems available and proven in other fields, such as the management of drinking water quality. The role of auditing in confirming the adequacy of a management system will also be discussed, and the liabilities that arise for auditors, consultants undertaking assessments and developing remediation action plans, and contractors undertaking remediation.
• The role of Preliminary Risk Screening, the role of an auditor in undertaking the Screening process, the uncertainty inherent in the process, and the potential for liability, depending on what statement the auditor is to make regarding the status of the site.
T44b
Copyright © CRC CARE Pty. Ltd., 2019
CleanUp Conference 2019Adelaide, Australia8 –12 September 2019 518
Table of Contentsfor this manuscript

• The implications of adopting a “proportionate response”, rather than the existing approach that deems any contamination in excess of a (conservative) assessment or risk is unacceptable and requires a response to eliminate the risk.
• The new development of a new digitised State-wide database that can assist in identifying historical potentially polluting activities, and the implications of this more detailed and much more readily available body of information on the responsibilities of EPA, Councils, site owners and their consultants.
Overall, the new Victorian Environment Protection Act strengthens the risk-based approach to identifying, avoiding and managing pollution. Potentially it can encourage sensible and practicable solutions to contaminated sites, but it can also introduce new liabilities and methods that owners and their consultants and contractors need to recognise.
519
Table of Contentsfor this manuscript

THE IMPACT OF CLIMATE EVOLUTION ON CONTAMINATED GROUNDWATER RESOURCES: SOLVING A SOLVABLE HUMAN
AND ECOLOGICAL HEALTH CRISIS IN THE MAKING
Scott D. Warner
Ramboll, 2200 Powell Street, Suite 700, Emeryville, California 94608, USA [email protected]
INTRODUCTION The manifestation of evolving and rapidly changing climatic conditions will negatively impact communities in developing nations much more than conventional wisdom recognizes. The environmental and economic health of many global communities is linked to the security of fresh water resources and the implementation of reliable and protective groundwater restoration and water resource protection measures. With the continued progress of climatic shifts that manifest into extreme hydrologic events, the stress on existing groundwater and surface water protection measures, and the ability to design new protection and clean up approaches, particularly in communities that do not have the economic or political means to implement technology, will continue to increase dramatically. The continued stress and inability to protect fresh water resources from contamination could dramatically increase likelihood that extreme health degradation may occur. As the United Nations (UN) most appropriately surmises, water is critical for socio-economic development, food production and human survival itself. It also is the crucial link between society and the environment and thus is at the heart of impact from climatic change (United Nations, 2019). From UN reporting, with over 2 billion people lacking access to safely managed drinking water infrastructure, and 4.5 billion people lacking safely managed modern sanitation, the likelihood of even greater distress from a lack of clean water due to extreme climatic events (drought and flood) will no doubt increase. Even now, the economic distress due to massive health issues related to water resource limitations may not be fully captured; an increase in this condition could cause further economic and health impacts that lead to instability of communities and governments. Contamination from industrial sites, landfills, and even natural conditions where extreme erosion can increase sediment loading to surface water bodies could become exacerbated due to extreme climatic events. Erosion and degradation of protective soil and vegetation covers at closed landfills and former mine locations could lead to additional contaminant loading to water and ecological receptors; floods can overwhelm surface-based holding tanks and ponds containing harmful chemicals; and, extended drought can create conditions where only contaminated water is accessible, where groundwater depths increase dramatically such that saline water replaces fresh water. Additionally, the related shifts in subsurface hydrologic conditions may also render groundwater treatment systems – including passive systems that rely solely on advective groundwater flow to route contaminated groundwater into the treatment system; and active systems that are designed to hydraulically control contaminated groundwater – potentially ineffective, or at least severely degraded in performance - if changes in hydraulic gradient direction and velocity are outside the performance design metrics of the installed remediation system. DISCUSSION Recognition that both short and long-term climate impacts are important to remediation design has not necessarily been a common theme in the nearly 40 years since the oft acknowledged beginning to the remediation practice – the enaction of the Comprehensive Environmental Response, Compensation, and Liability Act (CERCLA), which commonly is known as the Superfund legislation in the United States. Remediation programs had typically been implemented to focus on current hydrologic conditions with the primary topic of longevity tied only to the typical 30-year fiscal calculation typical of engineering design.
T44c
Copyright © CRC CARE Pty. Ltd., 2019
CleanUp Conference 2019Adelaide, Australia8 –12 September 2019 520
Table of Contentsfor this manuscript

However, with the recognition and now acceptance that extreme events (e.g., extreme floods, extreme droughts, more rain than snow) will hit much of the globe, including Australia (e.g., Cleugh et al, 2011) the historical approach to consider that tomorrow’s climate will be like yesterday’s may be problematic for remediation design New methods and tools for designing groundwater and soil contamination clean-up measures that are adaptable to the short and long-term hydrologic perturbations caused by climate change will help protect millions of people who otherwise would be subject to the exacerbated occurrence of chemically-impacted water resources. The foundation for this work combines remediation design methods with predicted changes in climatic/hydrologic conditions for specific locations to identify methods and approaches that would be robust given the suite of specific site conditions. The approach also considers cost and the ecological benefit that such remedies would impart to these challenged areas (Rowe, et al. 2017). We may not be able to stem the climatic evolution quickly, but we can implement protective measures effectively providing that government agencies and funding resources are coordinated and provide initiative and the means to implement adaptive and resilient protective measures for impacted water resources. A first step is to comprehensively map communities and their access to clean fresh water. With an overlay showing potential influence of hydrologic perturbations on the fresh water resources (i.e., mapping the potential for river floods, drought conditions, landfill breaches, dam failures and erosion/landslide impact to those resources), a better accounting and thus prioritization can be developed. Through this quantification of potential disruption to freshwater resources, decision-making parties (governments and non-government organizations) can better plan for resource protection and initiate fund generation strategies. Regarding engineering solutions, this data can be compared to geological information to allow designers to create robust and flexible designs for protecting (or limiting damage to) water resources (such as well fields) from dramatic and sometimes catastrophic climatic events. CLOSING We are at the initial stages of designing long-term robust remediation approaches that will stand up to climatic extremes. This discussion will introduce these concepts and provide a longer-range vision by which research and development of these approaches will promote protection from contaminant occurrence in water resources for both developed and less-developed communities. REFERENCES Cleugh, H., Smith, M.S., Battaglia, M., and Graham, P. (eds) (2011) Climate Change:
Science and Solutions for Australia, CSIRO Science and Solutions for Australia Series, Sydney, 168 pp.
Rowe, D., Greene, G., Warner, S., and Gimre, K. (2017) Remediation and water resource protection under changing climatic conditions. Environ. Tech. & Innovation. 8:291-298.
United Nations (2019). UN Water https://www.un.org/en/sections/issues-depth/water/
521
Table of Contentsfor this manuscript

USE OF ENVIRONMENTAL CONTROL ENCLOSURES TO MANAGE VOC EMISSIONS FOR REMEDIATION PROJECTS —
WHAT IS BEST PRACTICE?
John Hunt, Mark Bennett, Adam Fletcher, Campbell McNiven, Ryan Morrish, William Taggart
Ventia Utility Services Pty Ltd, 1 Homebush Bay Drive, Rhodes, NSW 2138, AUSTRALIA [email protected]
INTRODUCTION Remediation projects that involve excavation and treatment of contaminated soil may release dust, odour and volatile Organic Compounds (VOCs) during a range of remediation activities. Emissions to air must meet standards to protect human health and the environment. Both Victoria and NSW clean air legislation includes a list of Principal Toxic Air Pollutants (PTAPs) such as benzene, BaP, EDC, TCE and dioxins and furans, which site require the application of “best practice” methods to minimise emissions to air to the extent practicable. That is above and beyond what would be required to meet ambient air impact standards. This presentation explores the concept of best practice for air emissions based on remediation practice in Australia. Best practice in a regulatory context is based on the philosophy of minimising emissions to the maximum extent achievable through the application of best practice design and/or emission controls, having regard to technical, logistical and financial considerations. METHOD A number of small to large remediation projects undertaken in Australian since the late 1990s have been analysed to identify changing practice in the management of air emissions, for projects that include PTAPs in soil. The remediation projects analysed include mainly gasworks sites and chemical sites. The PTAPs include VOCs such as benzene, EDC and TCE and non-volatile compounds such as BaP and dioxins and furans . RESULTS AND DISCUSSION Release of dust, odour and VOCs can occur during a range of activities including
• Excavation, loading, transport, unloading and stockpiling; • Pre-treatment including screening, blending, mixings handling and stockpiling; and • Treatment if undertaken onsite.
Projects undertaken in the 1990s were mainly of gasworks sites with the use of “field methods” such as the rate and timing of excavation, wetting down, application of mulch, foam and soil cover, surface binders, spray grassing and fabric and plastic covers to minimise emissions. In the late 90s the first Environmental Control Enclosure (ECE) was used to excavate a former gasworks site in a residential area in Adelaide with offsite treatment. Since then many projects have been undertaken with ECEs sometimes for excavation within the ECE, but always for pre-treatment of excavated materials (prior to onsite treatment). In most cases due to the proximity to sensitive receivers, the ECE’s have used Emission Control Systems (ECSs). The ECEs have used an induced draft to extract ECE air through pre-heaters, dust filters and carbon beds and can reduce emissions to air by 99% or more when properly designed and operated. Onsite treatment processes may be undertaken within the ECE, or in plant or systems (eg biopiles) with independent ECSs, which can reduce air emission by 99.99% or more in the case of thermal plants.
T44d
Copyright © CRC CARE Pty. Ltd., 2019
CleanUp Conference 2019Adelaide, Australia8 –12 September 2019 522
Table of Contentsfor this manuscript

CONCLUSIONS Best practice air emission controls for remediation projects involving PTAPs varies according to project scale and anticipated activities, and the consideration of the site logistics and cost of controls. . Projects involving large excavation areas (>1 Ha) have typically used field controls for excavation, with emission reduction factors of 50% or more, due to practicability, cost and time considerations. Projects with small excavation areas (<1 Ha) have typically been undertaken using ECEs, with emission reduction factors of >99%. Onsite pre-treatment and treatment, when the most intense emissions of dust, odour and VOCs can occur have always been undertaken in ECEs and / or treatment plants fitted with ECSs capable of achieving >99% reduction in emissions. This is particularly pertinent when considering the appropriateness of onsite stabilisation of VOCs if not undertaken in an ECE.
523
Table of Contentsfor this manuscript

A COMPARISON OF TREATMENT METHODS FOR PFAS IMPACTED CONCRETE: RESULTS FROM LABORATORY AND FIELD TRIALS
Danielle Toase, Jason Lagowski, Ian Ross, Peter Storch, Tom Statham
Arcadis Australia Pacific, 580 George Street, Sydney, 2000, AUSTRALIA
INTRODUCTION Per- and poly-fluoroalkyl substances (PFAS) are synthetically produced highly-fluorinated organic compounds. PFAS are lipid and water repellent, highly stable and are effective surface-active agents in high temperature environments. These unique physio-chemical characteristics account for their widespread use in Aqueous Film Forming Foams (AFFF), household products, semiconductors, hydraulic fluids, photolithography and the textiles industry. As PFAS are naturally resistant to degradation by hydrolysis, biotransformation and abiotic reduction, the management of complex contaminated waste streams such as concrete infrastructure is challenging. In addition, the transformation of precursor compounds such as fluorotelomer substances, perfluoroalkane sulphonamides (FASAs) and perfluoroalkane sulfonamide substances (FASEs and FASAAs) into terminal PFAAs such as PFOS, PFHxS and PFOA over-time may further complicate management efforts. PFAS impacted concrete infrastructure can present a diffuse, secondary source of PFAS contamination and facilitate the migration of PFAS from source zones into the environment. The replacement of PFAS impacted infrastructure is expensive, logistically challenging and subject to case-specific regulatory approval in most Australian states and territories. Therefore, treatment methods that can prevent the migration of PFAS from impacted infrastructure to enable on-site reuse are preferable. Treatment methods may also be used to reduce the volume of waste intended for off-site disposal. Various sealants and concrete treatment products can be applied to manage the exposure risks associated with PFAS impacted concrete. However, there are few commercially available technologies which can be applied to concrete to enable lawful disposal at EPA licenced landfills. In addition, sealants may be prone to long-term degradation associated with prolonged exposure to UV, weather, complex chemical interactions and heat. METHOD Arcadis have recently completed a field and laboratory trial using two different concrete treatment methods. Specifically, a laboratory trial was undertaken to a compare the performance of a concrete sealant technology and a proprietary solvent and concrete treatment product which operates by penetrating into a concrete matrix to fill the void pore spaces within concrete capillary tracks to reduce the potential for PFAS to leach from impacted concrete infrastructure. Additionally, a full-scale field trial was undertaken to assess the proprietary solvent and concrete treatment product at full-scale under real world conditions. This presentation will report the pre- and post-treatment results and discuss the results in context of the implications for on-site reuse, long-term performance and regulatory considerations. Treatment performance was assessed using an extensive range of standard and novel analytical approaches including the Toxicity Characteristic Leaching Procedure (TCLP), Australian Standard Leaching Procedure (ASLP), a modified LEAF procedure. RESULTS AND CONCLUSIONS The trial results demonstrate significant reductions in the leachable concentration of PFAS following treatment. However, one technology presented significant potential for the long-term management of PFAS impacted concrete. Ongoing validation efforts are required to demonstrate long-term performance and will be discussed in the context of future research.
T44e
Copyright © CRC CARE Pty. Ltd., 2019
CleanUp Conference 2019Adelaide, Australia8 –12 September 2019 524
Table of Contentsfor this manuscript

FATE AND TRANSPORT OF PFASs IN SURFACE WATERS AND SEDIMENTS: POTENTIAL FOR LONG RANGE TRANSPORT?
Ian Ross1, Jonathan Miles1, Danielle Toase2, Peter Storch3
1Arcadis, 1 Whitehall Riverside, Leeds, LS1 4BN, UK
2Arcadis, Level 16/580 George St, Sydney NSW 2000, AUSTRALIA 3Arcadis, 32/140 William St, Melbourne VIC 3000, AUSTRALIA
INTRODUCTION Poly- and perfluoroalkyl substances (PFASs) comprise a large group of several thousand xenobiotics, with varying fate and transport characteristics. Many PFASs can exhibit long range transport in water bodies, but some are significantly less mobile and may constitute a long term, more localised ongoing source. The differing sources of PFASs, such as from coatings or firefighting foams can play a very significant role in their fate and transport characteristics. The current Australian regulatory focus is on three “long chain” perfluoroalkyl acids (PFAAs), perfluorooctanesulfonic acid (PFOS), perfluorohexanesulfonic acid (PFHxS) and perflurooctanoic acid (PFOA). However, there are also multiple chain length PFAAs including “short chain” PFAAs and polyfluoroalkly substances which are increasingly being regulated by differing US states and internationally. There are thousands of polyfluoroalkly substances which tend to biotransform aerobically to create the perfluoroalkyl substances as ultra-persistent “dead end” daughter products, Hence, the polyfluoroalky substances are termed “PFAA precursors” as they represent a source of the persistent PFAAs. Some polyfluoroalkyl substances are more mobile than the PFAAs they create or conversely can also be much less mobile. The long and short chain PFAAs have differing motilities and partitioning properties to soils and sediments, with shorter chain PFAAs being potentially more water soluble and mobile than the more amphiphilic longer chain compounds. The polyfluoroalkly substances may exhibit a wide range of differing fate and transport properties as a result of potentially containing anionic, cationic, zwitterionic or non-polar functional groups. Environmental conditions such as pH, ionic strength (e.g.salinity), aqueous biogeochemistry, presence of dissolved natural organic matter (NOM) and the aquifer or sediment fraction of organic carbon (foc) can also play a significant role in fate and transport of PFASs. The widespread use of PFASs has led to background concentrations in soils, surface waters, groundwater, rainwater, snow and thus biota. So confirming the PFASs detected in multiple matrices do not comprise background will be essential. To develop an effective conceptual site model (CSM) to evaluate the risks PFASs may pose to identified site-specific receptors an understanding of the nature and location of the dominant PFASs present on each site seems essential. METHODS This initial aims to provide a general review fate and transport properties of PFASs considering differing broad groups of compounds within the class and relate this to site specific environmental conditions. Then site specific examples of long and short chain PFASs partitioning to sediments from surface waters will be presented. The detection of high concentrations of polyfluorinated precursors to short chain PFAAs in surficial soils using advanced analytical tools, will also be described. A review of background concentrations of PFASs in multiple matrices will provide some pragmatism for assessment of PFASs. An overview of the biotransformation characteristics of the two main classes of PFAA precursors will aim to assess their relative importance when developing site-specific conceptual models, with examples of precursor concentrations in surface waters from recent spills of firefighting foams versus more weathered and attenuated sources and plumes.
T45a
Copyright © CRC CARE Pty. Ltd., 2019
CleanUp Conference 2019Adelaide, Australia
8 –12 September 2019525
Table of Contentsfor this manuscript

RESULTS AND DISCUSSION Some PFASs are commonly detected in surface waters as a result of their mobility and extreme persistence, but low level detections may sometimes be considered as a background concentrations and may not originate at the local site under investigation. Atmospheric long range transport of PFASs needs to be considered when investigating sites impacted with PFASs. From some site investigation it is clear that the “long chain” amphiphilic PFAAs demonstrate far greater sorption to sediments and NOM than their shorter chain analogs. Some PFAA precursors are suggested to be more mobile than the PFAAs they form, but they may also suffer biotransformation to PFAAs whilst moving through aerobic surface and groundwater. Results from recent site investigations shows some classes of precursors are less mobile and constitute a long term source of PFAAs. Recent losses of some products dominated by precursors do not contain significant PFAAs and advanced analytical tools seem necessary. Differing sources of PFASs products can play an important role in defining site specific conceptual site models. Fate and transport characteristics of differing PFAAs and their polyfluorinated precursors can influence CSM development and where to focus the remedy.
526
Table of Contentsfor this manuscript

DERIVATION OF WATER QUALITY GUIDELINE VALUE FOR MARINE DISCHARGE OF MONOETHYLENE GLYCOL
Vida Maulina1, Lisa Thomson2, Ken Kiefer2
1ERM, PO Box 266, South Melbourne, VIC, 3205, AUSTRALIA
2ERM, Locked Bag 3012 Australia Square, NSW 1215, AUSTRALIA [email protected]
INTRODUCTION The Australian and New Zealand Guidelines for Fresh and Marine Water Quality (Warne, 2018) were published based on a Revised Method for Deriving Australian and New Zealand Water Quality Guideline Values for Toxicants (Warne et al., 2018). A number of changes were made to the method for deriving water quality guideline values for toxicants in freshwater and marine environments. The updated methodology retains the preference and provides clarification of the use of the Species Sensitivity Distribution (“SSD”) method, compared to the previous Assessment Factor (“AF”) method. Regardless, limited data available results in laboratory effects data from single-toxicant and single-species toxicity tests underpinning many of the derived toxicant water quality guideline values for Australia and New Zealand. A case study derivation of the fresh water ecotoxicology guideline value for monoethylene glycol was undertaken using the revised derivation method (Warne et al., 2018). Monoethylene glycol (MEG) is a synthetic liquid that is used in a number of applications including antifreeze and hydraulic brake fluids. The ANZG (2018) provides a freshwater guideline trigger value of unknown reliability of 330 ug/L derived in the 2000 superseded guidance. The guideline value was calculated using an assessment factor method with an assessment factor of 1,000. Within the superseded guidance (ANZECC, 2000) it was considered that there was insufficient data to derive a guideline trigger value and a low reliability trigger value was calculated. In comparison, a review of available aquatic toxicity data for MEG identified sufficient data to derive a freshwater trigger level using the SSD method using the Warne et al (2018) methodology. METHODS Ecotoxicology data for monoethylene glycol was obtained by searching from databases approved by ANZG (2018), including USEPA ECOTOX 4.0 Database (USEPA, 2019), ECHA REACH Database (ECHA, 2019), and relevant scientific journals including Aquatic Toxicology, Environmental Toxicology and Chemistry, Environmental Contamination and Toxicology, Toxicology and Applied Pharmacology, and others. The initial data collation identified 101 individual lines of ecotoxicology data. These were assessed in accordance with the steps outlined within Warne et al (2018) including:
• Exclusion for data which were not sourced from publicly available documents, no earlier than 1980, and data based on chemical testing from a relatively pure form of the chemical (>80%).
• Consideration of acute and chronic nature of the studies; • Scoring of the studies based on experimental design and available information and
removal of studies without sufficient information available. The remaining studies consisted of 24 lines of data representing 6 species and 4 taxonomic groups. These were considered to represent the minimum data set required to perform the SSD method. The data was converted to a single ecotoxicity value for each species, was applied within the Burrlioz (CSIRO, 2000) software in accordance with Warne et al (2018).
T45b
Copyright © CRC CARE Pty. Ltd., 2019
CleanUp Conference 2019Adelaide, Australia
8 –12 September 2019527
Table of Contentsfor this manuscript

RESULTS AND DISCUSSION The derived freshwater guideline values for monoethylene glycol are outlined in Table 1.
Table 1. Summary of derived using freshwater Trigger Values
Trigger Value (mg/L)
Level of Species
Protection 744 99%
1557 95% 2175 90% 3126 80%
CONCLUSIONS The derived guideline values were higher than those outlined within the ANZG, 2018 and the derived Trigger Value using the assessment approach based on the limited dataset. This assessment highlights the value of having additional data available to make a derivation using the SSD method (Warne et al, 2018) rather than a conservative assessment factor approach. The results indicate that there is benefit to re-assessing guideline values of unknown reliability within ANZG, 2018 as:
• additional information may be available and there may be sufficient data to conduct a SSD analysis; and
• the rigorous nature of the screening provides confidence in the quality of the guideline values obtained.
REFERENCES ANZECC, 2000. National Water Quality Management Strategy, Canberra: Australian and
New Zealand Environment and Conservation Council. Australian and New Zealand Guidelines for Fresh and Marine Water Quality, 2018. Search
for toxicant default guideline values, Canberra: Australiana and New Zealand Governments and Australian State and Territory Governments.
CSIRO, 2000. BurrliOz Software, s.l.: s.n. Dobson, D. S., 2000. Ethylene Glycol: Environmental Aspects, Geneva: World Health
Organisation. ECHA, 2019. Registration Dossier, s.l.: European Chemical Agency. USEPA, 2019. Ecotox Database., s.l.: s.n. Warne, M. et al., 2018. Revised Method for Deriving Australian and New Zealand Water
Quality Guideline Values for Toxicants -- update of 2015 version., Canberra: Australian and New Zealand Governments and Australian State and Territory Governments.
528
Table of Contentsfor this manuscript

ADSORPTION OF Pb(II) IN WASTEWATER BY MODIFIED IRON ORE TAILINGS
Yongliang Chen1,2, Jinyang Du2, Yanju Liu1, Ravi Naidu1
1Global Centre for Environmental Remediation (GCER), University of Newcastle, Newcastle,
2308, AUSTRALIA 2College of Resources and Environmental Engineering, Wuhan University of Science and
Technology, Wuhan 430081, CHINA [email protected]
INTRODUCTION Iron ore tailings (IOTs) refer to the by-product of beneficiation during iron extraction. With the rapid development of society, the demand for iron and steel has been continuously increasing, and a large amount of IOTs have been generated in recent years. However, these IOTs are generally stacked in tailings dams and rarely reused, the reuse rate of IOTs is less than 10% in China. Few recycle and large stockpile of tailings have resulted in adverse impacts on environment and the safety problem of the tailings dams.In order to alleviate environmental pressures and improve economic benefits, integrated utilization of IOTs has been receiving worldwide attention, for instance, recovery of valuable elements from tailings, reused as filling materials for mining shafts, as raw materials to prepare soil conditioners or building materials, etc. Nevertheless, hardly any research about using IOTs to produce adsorbent has been reported.Lead and lead compounds are non-degradable, highly toxic and carcinogenic environmental pollutants, its accumulation in the body can cause great harm to the human body and affect the normal development of children. The study deals with using IOTs to prepare a new adsorbent by acid-base two steps modification, investigated the adsorption capacity and process for Pb2+ in wastewater, which not only can effectively utilizes IOTs, but also develop a new adsorbent, is a promising approach for IOTs s recovery. METHODS Synthesis of Modified iron ore tailings The IOTs were taken from the tailings pond of the iron ore dressing plant. IOTs (200 mesh) were prepared by grinding and sieving. In order to prepare modified IOTs, 5g of IOTs and 20ml solution containing 2mol/L of HNO3 were loaded in a beaker, and the sealed beaker was placed in a water bath and stirred at 85°C for 2h.Then, 50ml solution containing 2mol/L of NaOH was added into the mixture and stirred for 0.5h. Finally, the mixed solution was subjected to suction filtration, rinsing, grinding and sieving treatment. Pb(II) Adsorption Experiment 0.05g of the modified IOTs and 100ml of Pb(NO3)2 solution containing different concentrations of Pb2+ were loaded in several conical flasks. The conical flasks were capped and placed on a water bath oscillator at 25 and 200rpm for 24h to ensure adsorption equilibrium. The concentration of Pb2+ in the solution was detected by an atomic absorption spectrometer.With a similar procedure, the effect of pH was examined in a series of experiments that used the same initial Pb2+concentration (200mg/L) while maintaining pH at different values between 2 and 7. The effect of adsorbent concentration was examined in a series of experiments that used the same initial Pb2+concentration (200mg/L) while maintaining adsorbent concentration at different values between 0.25g/L and 1.75g/L.
T45c
Copyright © CRC CARE Pty. Ltd., 2019
CleanUp Conference 2019Adelaide, Australia
8 –12 September 2019529
Table of Contentsfor this manuscript

RESULTS AND DISCUSSION • It can be clearly seen from Fig.1 that the adsorption rate of the modified IOTs decreases
with the increase of the initial concentration, while the adsorption capacity is reversed.The maximum Pb2+ adsorption capacity of modified IOTs is 277.5mg/g.
• The correlation coefficients (R2) of Langmuir model is 0.9867,so the adsorption of Pb2+ by modified IOTs is mainly the chemical adsorption of monolayers.
• With the increase of pH, the Pb2+ adsorption rate of the material increases gradually. When pH>5.5, Pb(OH)2 white precipitate began to appear in the solution, and the adsorption rate began to increase greatly.
• With the increase of the concentration of the adsorbent, the adsorption rate tended to increase, and when the concentration of adsorbent was greater than 1g/L, the adsorption rate tended to 100%.
Fig. 1.Effect of the initial concentration on the sorption of Pb(II) to MIOTs and Langmuir model CONCLUSIONS The modified IOTs prepared by acid-base two steps modification method has a good adsorption ability to Pb2+ in wastewater, and the Langmuir isotherm adsorption model can describe the adsorption process well.The maximum Pb2+ adsorption capacity of modified IOTs can reach 277.5mg/g. Moreover, Pb(OH)2 white precipitate began to appear in the solution when pH>5.5. Finally, under the above experimental conditions, when the concentration of adsorbent was greater than 1g/L, the adsorption rate tended to 100%. This study provides a new approach towards the conversion of solid waste to an adsorbent material. REFERENCES Zhang, S., Xue, X., Liu, X., Duan, P., Yang, H.,& Jiang, T. (2006). Current situation and
comprehensive utilization of iron ore tailing resources. J. Min. Sci. 42(4), 403-408. Du, E., Yu, S., Zuo, L., Zhang, J., Huang, X., & Wang, Y. (2011). Pb(II) sorption on molecular
sieve analogues of mcm-41 synthesized from kaolinite and montmorillonite. Appl. Clay Sci. 51, 94-101.
Schulz, J. H.,Millspaugh, J.J.,Bermudez, A. J., & Gao, X.M. (2006). Acute lead toxicosis in mourning doves. J. Wildlife Manage. 70(2), 413-421.
0 200 400 600 800
20
40
60
80
100
The initial concentration( mg·L-1)
Ads
orpt
ion
rate(
)%
100
150
200
250
300 Adsorption rate Adsorption capacity
Ads
orpt
ion
capa
city(
mg·
g-1)
-100 0 100 200 300 400 500 600 700
0.0
0.5
1.0
1.5
2.0
2.5
(C
e/Q
eg·
L-1)
(Ce mg·L-1)
530
Table of Contentsfor this manuscript

ADSORPTION AND CO-PRECIPITATION OF COBALT ON BIOMASS MANGANESE OXIDE
James O’Connor1, Kato Tomoaki2, Toshihiko Ohnuki2
1The University of Melbourne, Parkville, City, 3010, AUSTRALIA
2Tokyo Institute of Technology, 2-12-1 Ookayama, Meguroku, Tokyo, 152-8550, JAPAN [email protected]
INTRODUCTION The 2011 tsunami that caused a nuclear meltdown at Fukushima Daiichi in Japan left the area heavily contaminated with radioactive heavy metals. An exclusion zone is currently enforced which prevents people from inhabiting the contaminated area. The exclusion zone is gradually being reduced by natural attenuation in addition to remediation efforts being made to remove and isolate contamination. This report aims to further develop these efforts by analysing the adsorption of radioactive cobalt onto manganese oxides with the aim to reduce radioactive contamination in seawater. Radioactive heavy metals are known to strongly adsorb to biomass manganese oxides (Yu et al., 2013)., which are produced by contacting permanganate (KMnO4) and bacteria in solution. Permanganate is currently used in water treatment processes to eliminate bacteria and pathogen contamination. Therefore, its use for heavy metal removal could be an efficient and cost-effective method for environmental remediation. Among the heavy metals, the adsorption mechanism of cobalt is under academic debate due to the possibility of the oxidation of cobalt by manganese oxide proposed below (Tomoaki Kato, 2017) (Murray and Dillard, 1979) .
This experiment used permanganate to produce manganese oxides and remove radioactive heavy metals from seawater. This report will analyse the adsorption of cobalt to manganese oxides by two methods. Firstly, using simple adsorption of pre-formed manganese oxides and secondly by co-precipitation of manganese oxides in the presence of cobalt as the manganese oxides form. This work will provide a direct comparison between adsorption and co-precipitation as a means of cobalt removal from contaminated water. Additionally, cobalt adsorption will be compared to the adsorption of zinc and lanthanum in separate solutions. In this experiment, Co (II) is analogous to Zn (II) and Co (III) is analogous to La (III) in terms of atomic radii and electronegativity and therefore by comparing the adsorption of Co, Zn and La the report aims to determine the possibility and extent of Co (II) oxidation. Additionally, the report will explore the competitive effects that zinc and lanthanum cations have on the adsorption of cobalt as well as their effect on the structure of manganese oxides. This work will provide a quantitative assessment of the effects of divalent (Zn (II)) and trivalent (La (III)) cations on both the structure of manganese oxides and their competitive effect on cobalt adsorption. METHODS Forty millilitre test tubes of a bacteria-containing solution with various metals at various concentrations were created. Permanganate was added to the solution allowing manganese oxides (MnO2) to form incorporating the Co and Zn into its structure. The progression of adsorption was evaluated for the samples at 0.5, 2, 4, 6 ,8, and 24 hours. One millilitre samples were filtered using 0.25 um filters, and any remaining permanganate was neutralised with 100 uL of 0.5 M hydroxylamine hydrochloride (HAHC) solution and 3.9 ml of 2% HNO3 solution to produce a diluted sample of 5 ml.
2 ( ) + 2 + 2 + → 2 ( ) + 3 + ( )
T45d
Copyright © CRC CARE Pty. Ltd., 2019
CleanUp Conference 2019Adelaide, Australia
8 –12 September 2019531
Table of Contentsfor this manuscript
This sample was then analysed using inductively coupled plasma atomic emission spectroscopy (ICPE-AES) and cobalt, manganese, zinc and lanthanum concentrations were determined. RESULTS AND DISCUSSION Experiments demonstrated that heavy metal removal was in the order Zn<Co<La. Yet interestingly, the presence of cobalt caused the greatest rise in Mn (II) concentration, thought to be due to both ion exchange and to the oxidation of cobalt. Based on assumptions discussed in the report, it was estimated that 15.82 mg of manganese oxide was produced both in the adsorption and co-precipitation experiments due to the reduction of permanganate. Of the 15.82 mg, it was estimated that 0.602 mg of manganese oxide reacted with Co (II) to produce Co (III) and Mn (II) in the adsorption experiment. Co-precipitation experiments showed a superior removal of metals compared with adsorption in all cases. Metal concentration was significantly reduced in the first 4 hours after which the respective metal concentrations increased slightly. This increase was attributed to the dissolution of the manganese oxide precipitate. From experiments using cobalt-zinc and cobalt-lanthanum solutions, it was found that lanthanum has a greater competitive effect on the adsorption of cobalt than that of zinc. In the presence of lanthanum, cobalt adsorption was greatly reduced compared with when zinc was in solution. Contrary to what was expected, the presence of zinc had a negligible effect on the adsorption of cobalt. These data support the possibility of an oxidation reaction that produces Co (III) since the trivalent cation is analogous to La (III) which may adsorb to the manganese oxide via a similar mechanism, therefore, competing strongly with La (III). CONCLUSIONS
• The adsorption of cobalt compared with zinc suggests there is preferential adsorption of cobalt over zinc.
• Increasing the concentration of competitive cation Zn does not affect cobalt adsorption but increasing La concentration hinders cobalt removal.
• Further XAFS and SEM analysis of precipitates are required to confirm reaction and adsorption mechanisms.
These findings provide a better understanding of the adsorption mechanism of cobalt on manganese oxide which will help to improve the performance of permanganate treatment and reduce radioactivity in contaminated seawater at Fukushima. REFERENCES MURRAY, J. W. & DILLARD, J. G. 1979. The oxidation of cobalt (II) adsorbed on
manganese dioxide. Geochimica et Cosmochimica Acta, 43, 781-787. TOMOAKI KATO, K. T., NAOFUMI KOZAI, TAKUMI SAITO, QUIQUIAN YU, TOSHIHIKO
OHNUKI 2017. Reduction Behaviours of Permanganate by Microbial cells and Concomitant Accumulation of Divalent Cations of Mg2+, Zn2+ and Co2+. Tokyo Institute of Technology.
YU, Q., SASAKI, K., TANAKA, K., OHNUKI, T. & HIRAJIMA, T. 2013. Zinc Sorption During Bio-oxidation and Precipitation of Manganese Modifies the Layer Stacking of Biogenic Birnessite. Geomicrobiology Journal, 30, 829-839.
532
Table of Contentsfor this manuscript

ASSESSMENT OF PHYSICO-CHEMICAL PROPERTIES OF SOIL AND GROUNDWATER POLLUTION WITH
POST METHANATED DISTILLERY EFFLUENT IRRIGATION IN WESTERN UTTAR PRADESH OF INDIA
Uday Pratap Shahi, Ashok Kumar, B.P. Dhyani
Department of Soil Science, College of Agriculture, Sardar Vallabhbhai Patel University of
Agriculture and Technology, Meerut-250110, Uttar Pradesh, INDIA [email protected]
INTRODUCTION Water is becoming limiting factor among the natural resources. Rice and sugarcane are the two important crops of the region and their water requirement is quite high. Farmers apply the water unscientifically and injudicious and over exploitation of ground water in such condition is leading the decline of ground water level. Water availability for the agriculture is reducing and in such condition other options are to be explored. In India substantial amount of waste water is available which can be used to supplement for agricultural demand with certain precautions. In India there are more than 397distilleries producing 3.25x10⁹L of alcohol and generating 40.40x10¹⁰L of waste water annually. An average molasses based distillery generates15Lof spent wash per lit of alcohol produced. The wastewater, commonly known as post methanated distillery effluent (PMDE), has high chemical oxygen demand (COD 45,000-50,000 mg L-1) and biochemical oxygen demand (BOD 5,000-8,000 mg L-1) (Joshi etal. 1996), and is frequently disposed of injudiciously in the surrounding farmlands. Since PMDE also contains appreciable amount of macro- and micro-nutrients such as K, N, Fe, Cu, Zn and Mn, which are essential for plant growth, judicious use of PMDE in agriculture for manuring or irrigation purposes helps in improving crop growth and physico-chemical and biological properties of soil (Joshi et al. 1996, Pathak et al. 1999,). Conversely injudicious use of PMDE could also adversely affect crop growth and create soil salinity problems (Jagdale and Sawant 1979). The present study was aimed at assessing the impact of application of PMDE (to supplement the irrigation water) on groundwater and soil quality. METHODS The study was undertaken at village Kinauni in the district of Meerut, Uttar Pradesh, India, where a distillery with spent wash generation capacity of 1280 kL d-1from molasses has been in operation since February 2006. The soil of study area was sandy loam to clay loam with a pH of 8.2 and EC of 0.156 dS m-1, bulk density of 1.4-1.6 g cc-1and infiltration rate of 0.4-1.7 cm h-1. PMDE @ 50 m3acre-1d-1with 1:3 dilution was used for irrigation 20 days before sowing in the command area once a year. Groundwater samples from hand pump and tube-well in the PMDE-treated as well as PMDE-untreated fields of farmers were collected in 150 mL sterilized plastic bottles and stored at 40°C until further analysis. Samples were analysed for their physico-chemical properties such as pH, EC, Na+, K+, bicarbonates, Ca2+, Mg2+, NO3-, Cu2+, Fe2+, Mn2+, Zn2+, Pb2+and Cd2+as per the standard methods. The groundwater samples were drawn from different depths due to different depths of hand pump (36m) and tube well (18m). RESULTS AND DISCUSSION Alkalinity of groundwater in both hand pump and tube well increased due to continuous application of PMDE (Table). Higher salinity was recorded in groundwater collected from tube well as compared to that from hand pump indicating that soluble salts could not possibly leach in appreciable amount down to lower aquifer. Bicarbonates, sodium and potassium buildup was observed in groundwater collected from PMDE treated areas, which might have increased the pH of groundwater. The level of nitrate nitrogen, responsible for eutrophication,
T45e
Copyright © CRC CARE Pty. Ltd., 2019
CleanUp Conference 2019Adelaide, Australia
8 –12 September 2019533
Table of Contentsfor this manuscript

was also found to buildup substantially with PMDE application. Soil physical properties such as infiltration rate and permeability declined due to PMDE treatment. Presence of higher sodium resulted in poor aggregation due to PMDE application and thereby causing poor infiltration. As sodium concentrations increase, the electrophoretic mobility of the clay platelets increases resulting in swelling dispersion of the clay particles thus impacting on soil permeability. Higher bicarbonate, pH, salinity and cations in groundwater from tube well as compared to hand pump water in PMDE treated condition was well expected due to restricted movement of salts to lower aquifer (Jain et al., 2005).
Table1. Chemical properties of groundwater of the study area
CONCLUSIONS With the forcing scarcity of water in future and substantial manurial value of PMDE it can be used for pre sown irrigation with desired level of dilution. Timely monitoring of ground water quality and soil properties with the treatment of PMDE is equally essential to ensure sustainable ecosystem REFERENCES Jagdale HN, Sawant NK (1997) Influence-of added spent wash (Distillery waste) on growth &
chemical composition of immature sugarcane (Saccharum officinarum L) cultivar CO-740. Indian Sugar 29, 433-440.
Joshi HC, Pathak N, Chaudhary R, Pathak H, Chaudhary A, Singh NN (1996) Agrocycling-A pollution control strategy for distilleries in India. Botanica 46, 170-176.
Pathak H, Joshi HC, Chaudhary A, Chaudhery R, Kalara N, Dwivedi MK (1999) Soil amendment with distillery effluent for wheat and rice cultivation. Water Air and Soil Pollution 113, 133-140.
Parameters PMDE PMDE treated ground
water PMDE untreated ground
water Hand Pump Tube well Hand Pump Tube well
pH 7.6 8.24 8.3 7.76 7.90 EC (dS/m) 3.7 0.590 0.685 0.284 0.366 Na+ (me/l) - 0.108 1.56 0.104 0.465 K+ (me/l) 512 0.110 0.153 0.064 0.082 Bicarbonates (me/l) - 6.05 8.25 4.40 4.95 (Ca2++Mg2+) (me/l) - 4.99 5.769 3.269 4.230 Cu (mg/l) 2.1 0.033 0.033 0.019 0.031 Fe (mg/l) 11 0.91 1.34 0.40 0.50 Mn (mg/l) 4.8 1.08 0.28 1.02 0.15 Zn (mg/l) 12.4 0.92 1.12 0.62 0.70 Pb (mg/l) 1.8 0.10 0.13 0.06 0.08 Cd (mg/l) - 0.016 0.019 0.014 0.016 NO3 (mg/l) - 18.0 28.0 6.0 8.0
534
Table of Contentsfor this manuscript

UST’S CATCH BASIN INSERTS — A REVOLUTION IN “AT SOURCE” STORMWATER QUALITY IMPROVEMENT
Craig Rothleitner1, Robert Humphries2
1UST, 22C Hines Road, O’Connor, 6164, AUSTRALIA
2Strategic Environmental Solutions, PO Box 448 south Perth, 6951, AUSTRALIA [email protected]
INTRODUCTION Poor stormwater quality is a major issue world-wide. Contamination of urban runoff by particulate and dissolved pollutants impedes the beneficial reuse of stormwater, degrades the quality shallow groundwater recharged by stormwater and harms the ecology of waterways receiving untreated storm runoff. UST Pty. Ltd. has developed and patented an innovative, cost-effective device called the Catch Basin Insert (CBI) that dramatically improves the quality of stormwater entering urban or industrial drainage systems by effectively treating it at source, without causing flooding or other problems for stormwater system operators. The CBIs also efficiently collect material blown into drain entry structures by the wind. METHODS CBIs are custom-made to fit the stormwater entry points into the drainage system. Each unit consists of a patented geotextile filtration basket and stainless steel support frame that is ‘dropped in’ to the existing drain entry structure without any need to modify the drain pit itself. Each CBI is serviced by UST or its licenced partners so that guaranteed performance is delivered to clients. The geotextile filtration baskets used in CBIs are designed to be back-flushed, so they can be re-used many times, thus reducing both waste and cost. The CBI’s filtration basket is designed to bypass water when it becomes filled with waste – this effectively prevents backflow and flooding, and the regular servicing of CBIs prevents blockage of the drains by accumulated wastes. CBIs have no effect on the hydraulic performance of the drain. The long-term performance of UST’s Catch Basin Inserts has been rigorously tested by an independent PhD study at Curtin University in Perth, Western Australia. These studies show that CBIs reliably remove particulates down to at least 150 μm, preventing contamination and clogging of drain entry pit floors and therefore the retention of contaminated water (Alam et. al., 2017). RESULTS AND DISCUSSION CBIs are superior to other stormwater treatment devices such as Gross Pollutant Traps (GPTs) because the placement of the CBI in the drain entry pit means the device will drain all of the filtered water into the drain pit after rainfall while retaining the waste in the filter basket. This means that the CBI prevents the decomposition of the material that would otherwise enter the drain entry pit. This is not the case in GPTs, where the captured waste sits in an underground tank in water, where it decomposes under anaerobic conditions. Fine particles and soluble contaminants released from the trapped wastes are then washed from the GPT into the receiving waterway in subsequent storms. CBIs provide effective interception of the vast majority of particulate wastes ‘at source’, before they enter the drainage system , thus providing a much higher level of protection compared with the majority of stormwater treatment devices in the market. Street sweeping does not effectively reduce particulate loads to drains under Australian conditions (Walker and Wong, 1999), allowing wastes carried by wind or stormwater to enter drains causing many problems, including:
T45f
Copyright © CRC CARE Pty. Ltd., 2019
CleanUp Conference 2019Adelaide, Australia
8 –12 September 2019535
Table of Contentsfor this manuscript

• In sandy or porous soils, preventing infiltration of stormwater into the shallow aquifer; • Allowing the decomposition of organic matter and the release of soluble nutrients and
other contaminants in the residual water trapped in drain entry pits; • Providing a safe habitat for mosquito breeding in the organically-enriched water
trapped in the drainage pits. This will become a major health issue, rather than just a nuisance as the world warms and tropical mosquito-borne diseases such as Dengue Fever and others move south;
• Allowing sediments, leaves, trash and other particulate matter to block drainage pits and pipework, causing flooding in large storms.
CONCLUSIONS UST’s Catch Basin Inserts provide a significant advance in the cost-effective and sustainable treatment of urban stormwater for reuse, as well as providing a greater degree of environmental protection for sensitive waterways. They also reduce the complexity of drainage management for asset owners by reducing the need for street sweeping, and mostly eliminating the need for drain pit eduction. In addition, UST’s CBIs will in fact compliment the increase use of stormwater treatment trains involving rain gardens, wetland treatment, WSUD systems and other options because most contaminants are removed at source, and the performance of properly maintained UST CBIs does not degrade with time. REFERENCES Alam, Md Zahanggir, Anwar, A.H.M.F, Sarker, D.C., Heitz, A., Rothleitner, C. 2017.
Characterising stormwater gross pollutants captured in catch basin inserts. Science of the Total Environment 586 (2017) 76-86.
Walker, T.A, Wong, T.H.F. 1999. Effectiveness of Street Sweeping for Stormwater Pollution Control. Technical Report 99/8. Cooperative Research Centre for Catchment Hydrology
536
Table of Contentsfor this manuscript

ARSENIC IN RICE FROM BANGLADESH: GEOGRAPHICAL VARIATION, POTENTIAL CANCER RISK AND MITIGATION OPTIONS
Mohammad Mahmudur Rahman1,2, Shofiqul Islam1,2,3
, Ravi Naidu1,2
1GCER, The University of Newcastle, NSW, AUSTRALIA
2CRC CARE, The University of Newcastle, NSW, AUSTRALIA 3Department of Soil Science, Bangladesh Agricultural University, BANGLADESH
INTRODUCTION Arsenic (As) is recognized as a toxic element and has been classified as a human carcinogen (group I) causing skin and lungs and bladder cancers (NRC 2001). Globally groundwater from 107 countries are affected by As contamination released from predominantly geological sources, posing a serious health hazard to an estimated >200 million people worldwide (Naujokas et al. 2013). Arsenic exposure to humans mainly occurs via drinking As-contaminated water and food crops either grown in As-contaminated areas or using As contaminated water for irrigation. Besides drinking water, groundwater is also used for irrigating crops during the dry season, particularly for paddy rice (Oryza sativa). Rice and vegetables are the main foods of population in Bengal delta (Bangladesh and West Bengal state of India). Transfer of As from groundwater into crops has been well documented (Rahman et al. 2009). The presence of As in rice is of major concern to about 3 billion people around the world who consume rice as staple food. In this study, we investigated the geographical variation, potential cancer risks for adults due to the consumption of rice and strategies that could be used to reduce As from paddy rice using water management options. METHODS For geographical variation, estimating dietary exposure of As form rice and evaluating the cancer risk, we analyzed 965 polished rice samples collected from a range of locations through household surveys from 20 districts of Bangladesh during April 2014. For water management experiment, three sites (Faridpur, Rajshahi and Mymensingh) were selected from Bangladesh. Two water management options such as continuous flooding (CF) and alternative wet and dry (AWD) were tested to determine variation of As accumulation in rice grain. Digestion of the rice samples for total As analysis was carried out employing the method used by Rahman et al. (2009). A 7500ce series inductively coupled plasma mass spectrometer (ICP-MS) (Agilent Technologies, Tokyo, Japan), was used to determine the amount of total As. For As speciation, a liquid chromatography system (model 1100, Agilent Technologies, Tokyo, Japan) equipped with a guard and Hamilton PRP-X100 separation column, coupled with ICP-MS was used. During the analysis of total As and speciation, SRM1568b rice flour [National Institute of Standard and Technology (NIST), USA] was used to validate the total and speciated As concentrations in rice. RESULTS AND DISCUSSION The analytical results showed that As concentration in rice grain varied from 3-680 µg/kg (dry weight). Arsenic levels in rice are determined by the location and variety. Daily intake of inorganic As from rice ranged between 0.38 and 1.92 μg/kg BW. Females are more susceptible than males while the 2–5 and 6–10 age groups are supposed to be more exposed to As from rice consumption (Islam et al. 2017a). Fig. 1 shows inorganic As from rice in different districts with incremental lifetime cancer risk and HQ values. The average ILCR value of inorganic As for consumers in Narayanganj district was 2.88 × 10⁻³, 288 times higher than the acceptable limit, indicating higher carcinogenic risk (Islam et al. 2017a).
T46a
Copyright © CRC CARE Pty. Ltd., 2019
CleanUp Conference 2019Adelaide, Australia
8 –12 September 2019537
Table of Contentsfor this manuscript

The results from water management study showed that significant yield difference among the cultivars under CF and AWD irrigation. The AWD irrigation significantly increased grain yields for around 38% over CF. The variety with the highest yield was Binadhan-8 (7.0 t/ha) followed by Binadhan-6 and BRRI dhan58 (6.8 t/ha). The As levels in rice grains under AWD and CF irrigation conditions ranged from 147–348 µg/kg and 182-431 µg/kg, respectively. Overall, 9 to 39% difference in grain As concentration between the CF and AWD practices among the rice cultivars (Islam et al. 2017b). Speciation of grain As were found not to differ among the varieties in respect to inorganic As around 88 to 99%.
Fig. 1. The average ILCR value of inorganic As for consumers in different districts. CONCLUSIONS Dietary exposure to inorganic As from As-contaminated rice poses potential serious carcinogenic and non-carcinogenic risks to human. It is evident from this study that local populations need to reduce their inorganic As intake from rice. The AWD water management techniques prove to be highly effective in combating the problem of excessive bioaccumulation of As in rice grains.
REFERENCES Islam, S., Rahman, M.M., Islam, M.R. and Naidu, R., 2017. Effect of irrigation and genotypes
towards reduction in arsenic load in rice. Science of The Total Environment, 609, pp.311-318.
Islam, S., Rahman, M.M., Islam, M.R. and Naidu, R., 2017. Geographical variation and age-related dietary exposure to arsenic in rice from Bangladesh. Science of the Total Environment, 601, pp.122-131.
Naujokas, M.F., Anderson, B., Ahsan, H., Aposhian, H.V., Graziano, J.H., Thompson, C. and Suk, W.A., 2013. The broad scope of health effects from chronic arsenic exposure: update on a worldwide public health problem. Environmental health perspectives, 121(3), pp.295-302.
NRC (National Research Council). (2001). Arsenic in drinking water. Washignton DC: National Academy Press.
Rahman, M.M., Owens, G. and Naidu, R., 2009. Arsenic levels in rice grain and assessment of daily dietary intake of arsenic from rice in arsenic-contaminated regions of Bangladesh—implications to groundwater irrigation. Environmental Geochemistry and Health, 31(1), pp.179-187.
538
Table of Contentsfor this manuscript

EFFECT OF ZINC AND CADMIUM ON HYDROPONICALLY GROWN MUNGBEAN VARIETIES
Md Harunur Rashid, Mohammad Mahmudur Rahman, Ravi Naidu
Global Centre for Environmental Remediation and Cooperative Research Centre for
Contamination Assessment and Remediation of the Environment (CRC CARE), University of Newcastle, Callaghan, Newcastle, 2308, AUSTRALIA
INTRODUCTION Contaminant toxicity in the environment and micronutrient malnutrition or hidden hunger in humans have been major concerns globally. Cadmium has been ranked seventh among the top toxins in the environment and is considered as phytotoxic. Zinc (Zn) plays an important role in the synthesis of many enzymes, responsible for plant and human reproductive systems etc. Growth and development hinders due to Zn deficiency in foods and soils. Many countries particularly the developing nations critically suffer from Zn related malnutrition because of the low Zn status in their soil. These Zn deficiency accelerates cadmium (Cd) uptake by plants. Literature demonstrated that Zn deficiency and Cd toxicity can be reduced by applying Zn fertilizers to soil. Remediation of Cd with Zn fertilizer application to soil has attracted great attention to the scientific community due to its potential to minimise Cd phytoavailability and enrich edible parts of crops simultaneously. Many researchers investigated Zn-Cd interactions using cereal crops and limited studies have been conducted on leguminous crops. Legumes (Fabaceae or Leguminosae) are second only to cereals (Gramineae) because of their significance as human foods. Legumes are important crop in crop rotation due to their ability to fix nitrogen resulting positive impact on soil fertility and crop productivity. They are also good source of micronutrients, including iron, zinc, calcium and vitamins. Mung bean is very sensitive to Cd stress. Therefore, the present study has been chalked out to investigate the interaction of Cd with Zn fertilizer application in two mung bean genotypes. METHODS The hydroponic study was conducted in glasshouse of the University of Newcastle, Australia with two Mung bean varieties (Jade, Celero) incorporating five Zn levels (0, 1, 2, 4 and 8 µM) and three Cd levels (0, 0.5 and 1 µM). Half strength Hoagland nutrient solution was used (Spomer et al., 1997). Mungbean seeds were collected from the Australian Mungbean Association (AMA). Chlorophyll concentration (mg/g fw) was determined by DMSO method (Manolopoulou et al., 2016) following formula (Barnes et al., 1992). Statistical analysis was done by CropStat 7.2.3 software. RESULTS AND DISCUSSION No significant variation was observed in the number of leaves/plant, root length and total chlorophyll content (Fig. 1) between the varieties but significant variation were observed in shoot length (p<0.01), shoot dry weight (p<0.05), root dry weight (p<0.05). Variation in chlorophyll a (p<0.05) and chlorophyll b (p<0.05) were also significant (Fig. 2) between the varieties. Zinc showed no significant influence on agronomic parameters, such as leaves/plant, shoot length, root length, shoot dry weight, root dry weight (Fig. 3). Chlorophyll a (p<0.01), chlorophyll b (p<0.01) and total chlorophyll (p<0.05) were significantly increased by Zn (Fig. 4) which was supported by Khalil et al. (1998). All agronomic properties were significantly varied (p<0.01) due to Cd except leaves/plant and shoot length (Fig. 5). Significant reduction of chlorophyll a (p<0.01), chlorophyll b (p<0.01) were obtained due to Cd supply (Fig. 6) and Chunchun and Zhenguo (2001) observed similar findings in mung bean. Due to variety-Zn interaction shoot length, shoot dry weight and total chlorophyll were significantly (p<0.05) affected and other parameters were insignificant. Among the agronomic
T46b
Copyright © CRC CARE Pty. Ltd., 2019
CleanUp Conference 2019Adelaide, Australia
8 –12 September 2019539
Table of Contentsfor this manuscript

parameters, root length and shoot dry weight were statistically significant (p<0.01) and chlorophyll contents were not significantly varied due to interaction of variety and cadmium. No agronomic properties were significantly affected due to Zn-Cd interaction whereas chlorophyll a and b concentrations were significantly influenced (p<0.01).
CONCLUSIONS Two varieties of mung bean showed distinct variation in agronomic properties and chlorophyll contents. Zinc application did not demonstrate any significant change in agronomic attributes but chlorophyll contents were significantly increased. Cadmium affected significantly on agronomic properties as well as chlorophyll contents. Interaction of Zn and Cd did not affect significantly on agronomic parameters but their effect were significant on chlorophyll content. REFERENCES BARNES, J., BALAGUER, L., MANRIQUE, E., ELVIRA, S. & DAVISON, A. 1992. A
reappraisal of the use of DMSO for the extraction and determination of chlorophylls a and b in lichens and higher plants. Environmental and Experimental botany, 32, 85-100.
CHUNCHUN, W. & ZHENGUO, S. 2001. Uptake of Cd by three species of plants and responses of mung bean to Cd toxicity. JOURNAL-NANJING AGRICULTURAL UNIVERSITY, 24, 9-13.
KHALIL, I., VARANINI, Z. & PINTON, R. 1998. Chloroplast pigments in bean seedlings as influenced by zinc deficiency. J. Sci. Tech. Univ. Peshawar, 49-51.
MANOLOPOULOU, E., VARZAKAS, T. & PETSALAKI, A. 2016. Chlorophyll Determination in Green Pepper Using two Different Extraction Methods. Current Research in Nutrition and Food Science Journal, 4, 52-60.
SPOMER, L. A., BERRY, W. L. & TIBBITTS, T. W. 1997. Plant culture in solid media. Plant growth chamber handbook’.(Eds RW Langhans, TW Tibbitts) pp, 105-118.
540
Table of Contentsfor this manuscript

ARE ROOT ELONGATION ASSAYS SUITABLE FOR ESTABLISHING METALLIC ANION ECOTOXICITY THRESHOLDS?
Marjana Yeasmin1, D.Lamb1,2, M.M. Rahman1, R. Naidu1,2
1Global Centre for Environmental Remediation (GCER), Faculty of Science, The University of
Newcastle, Callaghan, NSW 2300, AUSTRALIA 2Cooperative Research Centre for Contamination Assessment and Remediation of the
Environment, Australia (CRC CARE), The University of Newcastle, Callaghan, NSW 2300, AUSTRALIA
INTRODUCTION Metallic anions (e.g. arsenate (AsV), chromate (CrVI), selenate (SeVI), and molybdate (MoVI)) are important in the terrestrial environment due to their role in human and ecological health. Selenium and Mo are both essential trace elements in humans, and Mo is also essential for plant growth. However, excessive doses of these chemical species is harmful for plant and human health. Chromate and As are both non-essential elements, acutely toxic and carcinogenic in humans. It is essential that appropriate assays are used for derivation of toxicity models and guidance values, and to assess potential impacts on a site specific basis. Root elongation is a simple and quick method for assessment of metal toxicity in soil and solution culture (Wang et al., 2001). Short term root elongation studies are typically very short ranging from 48 to 168-h in length, depending on the procedure and plant species. The toxicity of metal (loid)s is varied with plant age, and different methodologies may produce different phytotoxicological end-point values (De koe et al.1992). However, root elongation assays have principally been established using rhizotoxic metals and may not be suitable for other contaminants which don’t strongly interact with cell development in the elongation zones. This experiment presents result from 96-h root elongation and 28-day nutrient culture assays as it relates to AsV, CrVI, MoVI and SeVI toxicity. MATERIALS AND METHODS Seeds of cucumber (Cucumis sativus L.) were treated with 1% NaOCl solution for 10 min and rinsed with water thoroughly before germination. After 4 d at 25 °C, plant roots were carefully measured and then transferred into pots containing contaminated solutions. After 96 h, roots were separated and lengths were measured. For the nutrient culture study, the same procedure was followed for germination, except seedlings were transferred to complete nutrient culture (Asher and Lonergan, 1967). In the latter study, plants were grown with constant aeration and harvested after 28 days exposure. Each pot contained 3 seedlings and replicated 3 times. Solutions were replaced regularly. After harvesting, plant shoots and roots were separated and roots were washed with tap water and rinsed several times with Milli-Q water. Washed root samples were dried at 65 °C for 72 h. Dry weight were measured. Exposure concentrations for assays ranged from 0 or nutrient concentrations to 200 µM. RESULTS AND DISCUSSION Fig.1 shows examples of the dose response of root elongation and 28-d nutrient culture for cucumber. Root elongation was inhibited with increasing concentration of Cr and Se, however, even at 200 µM there was limited impact on root elongation. In contrast, in the 28-day assays, close to 100% growth inhibition occurred between 5 and 40 µM for CrVI, MoVI and SeVI. Fig. 2 compares the root elongation data with the 28-day assays. The sensitivity of the root elongation assay (based on the ratio between 96-h: 28-day) was between 25 and 92 times less sensitive than the 28-d assay for CrVI, MoVI and SeVI. Based on soil total concentrations, As was only 2 fold different across the different soils (Kader et al. 2016).
T46c
Copyright © CRC CARE Pty. Ltd., 2019
CleanUp Conference 2019Adelaide, Australia
8 –12 September 2019541
Table of Contentsfor this manuscript

These results indicate that, unlike cationic metals (e.g. CuII), root elongation assays applied to metallic anions may not be suitable. The contrast between cationic and metallic anions potentially indicates a different mode of toxicity, as metallic anions are unlikely to be ‘rhizotoxic’.
Fig. 1. Examples of dose response to metallic anions ( CrVI and SeVI) in 96- h and 28- day assays. Concentrations expressed as log10.
Fig 2. Relationship between root elongation and shoot growth for CrVI, MoVI, SeVI and AsV, Right figure shows As data for 7 soils previously reported on an mg/kg basis (Kader et al. 2016). CONCLUSIONS Root elongation assays (96-h exposure) in this study were between 2 and 92 times less sensitive than 28-d exposure periods. Based on the data, it would appear that root elongation assays are not suitable for AsV, CrVI, MoVI and SeVI toxicity studies. This has significant implications for application to mixture toxicity studies and derivation of safe soil guidance values involving metallic anions. If short term assays are to be used for toxicity assays, it is impingent on future studies to demonstrate the sensitivity of the assays applied to metallic anions. Indeed, this also applies to other contaminants. REFERENCES Asher, C. and Loneragan, J. (1967) Response of plants to phosphate concentration in
solution culture: I. Growth and phosphorus content. Soil science 103, 225-233. De Koe, T., Geldmeyer, K. and Jaques, N.M.M., 1992. Measuring maximum root growth
instead of longest root elongation in metal tolerance tests for grasses (Agrostis capillaris, Agrostis delicatula and Agrostis castellana). Plant and soil, 144(2), pp.305-308.
Kader, M., Lamb, D.T., Megharaj, M. and Naidu, R., 2016. Sorption parameters as a predictor of arsenic phytotoxicity in Australian soils. Geoderma, 265, pp.103-110.
Wang, X., Sun, C., Gao, S., Wang, L. and Shuokui, H., 2001. Validation of germination rate and root elongation as indicator to assess phytotoxicity with Cucumis sativus. Chemosphere 44(8), pp.1711-1721.
542
Table of Contentsfor this manuscript

APPLICATION OF DATA-DRIVEN PREDICTION MODELS FOR MODELING SEAWATER INTRUSION IN AQUIFERS
Alvin Lal, Bithin Datta
Discipline of Civil Engineering, College of Science & Engineering, James Cook University,
Townsville, 4811, AUSTRALIA [email protected], [email protected]
INTRODUCTION Contamination of coastal groundwater resources due to groundwater salinization is a major environmental problem, which threatens the livelihood of groundwater dependent coastal dwellers. Researchers and policy-makers have utilized coupled simulation-optimization (S/O) models for developing optimal yet sustainable coastal groundwater management strategies (Dhar and Datta, 2009, Sreekanth and Datta, 2010, Lal and Datta, 2019). Employing a variable flow and salt transport numerical simulation model in the coupled S/O model have proven computationally expensive, infeasible and a time consuming process. Therefore, data-driven mathematical models have been used in the S/O models as approximate simulators. In this study, Group Method of Data Handling (GMDH) and Gaussian Process regression (GPR) algorithms are utilized to develop prediction models capable of approximating the responses of a numerical simulation model. The developed GMDH and GPR models are compared to establish a better performing model. The main goal of this investigation is to present a superior seawater intrusion modeling algorithm, which can be used as approximate simulators in the coupled S/O models for developing optimal management strategies. METHODS The data-driven GMDH and GPR mathematical models were used to predict salinity concentration in an illustrative coastal aquifer system. A finite element based coupled flow and transport numerical simulation model of the study area was developed using the FEMWATER computer code (Fig. 1). The aquifer was 60 m in depth and was divided into 3 equal layers. The sea side boundary (Boundary A) was about 2.1 km in length. Boundaries B and C were 2.0 and 2.7 km in length, respectively. The aquifer contained 8 groundwater pumping wells (G1, G2, G3, G4, G5, G6, G7 and G8), which were employed to extract groundwater for beneficial use. In addition, a set of 5 barrier wells (B1, B2, B3, B4 and B5) were installed into the aquifer to extract saline water (acted as hydraulic barrier). Salinity concentration was monitored at selected monitoring wells (M1, M2 and M3). The sea side boundary was specified as a constant head i.e., 0 m at both ends and constant concentration i.e., 35 kg/m3 boundary. Boundaries B and C were treated as no flow boundaries. A constant groundwater recharge of 0.00054 m/d was distributed uniformly over the entire model domain. The hydraulic conductivity of the aquifer was specified as 15 m/d, 7.5 m/d and 1.5 m/d in the x, y and z direction, respectively. The porosity of the aquifer material was specified as 0.4. Thirteen pumping wells with different yearly pumping values for the 4 year simulation period resulted in 52 decision variables. A total of 800 sets of randomized input pumping patterns were obtained using the Latin Hypercube Sampling method. Each time a pumping pattern is implemented into the numerical model, concentration outputs at M1, M2 and M3 were recorded. Out of the 800 datasets collected, 700 datasets (termed as development set) were used to develop (train and test) the models, while 100 datasets (termed as independent dataset) were used to assess the developed models. GMDH and GPR models were developed using the GMDH Shell and MATLAB 2017a platform, respectively. Three prediction models using of the data-driven modeling algorithms were developed for predicting salinity concentration at M1, M2 and M3. For easy classification, GMDH and GPR prediction models responsible for predicting concentrations
T46d
Copyright © CRC CARE Pty. Ltd., 2019
CleanUp Conference 2019Adelaide, Australia
8 –12 September 2019543
Table of Contentsfor this manuscript

at M1, M2 and M3 were labeled as GMDH1, GMDH2 GMDH3, and GPR1, GPR2, GPR3, respectively. After model development, the independent set was fed into each of the models to measure their true prediction proficiencies. Standard mathematical indices such as root mean square error (RMSE), coefficient of determination (R2) and Nash-Sutcliffe Efficiency (NE) coefficient were used to assess the performances of the prediction models.
Fig. 1. The 3D numerical simulation model domain with pumping well locations. RESULTS AND DISCUSSION The performance evaluation results are presented in Table 1. As per the results, it could be established that both the GMDH and GPR models could predict salinity concentration in the aquifer with reasonable accuracy. However, the performance of GMDH outperformed GPR models.
Table 1. Models performance evaluation results during the prediction stage. Indices M1 M2 M3
GMDH1 GPR1 GMDH2 GPR2 GMDH3 GPR3 RMSE 0.379 0.625 0.243 0.431 0.458 0.489
R2 99.61 99.59 99.73 99.62 99.66 99.58 NE 1 1 1 1 1 1
CONCLUSIONS In this study, data driven GMDH and GPR prediction models were used to predict salinity concentration in a coastal aquifer system by approximating the responses of the variable flow and salt transport numerical simulation model. It was observed that both the model types had accurate prediction capabilities. However, in caparison, the prediction performance of GMDH models outperformed the performance of the GPR models in terms of accuracy. REFERENCES Dhar, A. and Datta, B. (2009) Saltwater intrusion management of coastal aquifers. I: Linked
simulation-optimization. Journal of Hydrologic Engineering, 14, 1263-1272. Lal, A. and Datta, B. (2019) Multi-objective groundwater management strategy under
uncertainties for sustainable control of saltwater intrusion: Solution for an island country in the South Pacific. Journal of environmental management, 234, 115-130.
Sreekanth, J. and Datta, B. (2010) Multi-objective management of saltwater intrusion in coastal aquifers using genetic programming and modular neural network based surrogate models. Journal of Hydrology, 393, 245-256.
544
Table of Contentsfor this manuscript

GEOGRAPHICAL VARIATION OF CADMIUM DISTRIBUTION IN RICE FROM BANGLADESH: A MARKET BASKET SURVEY
Syfullah Shahriar1,2,3, Mohammad Mahmudur Rahman1,2, Ravi Naidu1,2
1Global Centre for Environmental Remediation (GCER), Faculty of Science,
The University of Newcastle, Callaghan, NSW 2308, AUSTRALIA 2Cooperative Research Centre for Contamination Assessment and Remediation of the
Environment (CRC CARE), The University of Newcastle, Callaghan, NSW 2308, AUSTRALIA
3Department of Soil Science, Sher-e-Bangla Agricultural University, Dhaka-1207, BANGLADESH
INTRODUCTION Cadmium (Cd) is regarded as one of the most toxic and widespread elements in the environment (Du et al., 2013). Food is considered as the main source of Cd exposure to humans (Uraguchi et al., 2009). It was reported that rice plants take Cd from soil by roots and translocated to grains through shoots (Song et al., 2015). Rice grown on Cd contaminated soils affect both quantity and quality of food (Ke et al., 2015). Therefore, Cd minimization in rice is time demanding for the agro environmental sustainability of world rice production and food safety. Cadmium mobility and bioavailability is higher than many other elements of soil though it is not essential for plant growth or biological system. Rice has tendency of accumulation of Cd more than other cereals and it is the major food source of Cd for rice eating population (Meharg et al., 2013). As Cd is a toxic heavy metal and can cause carcinogenicity, human exposure of Cd can create kidney damage and at the same time cause adverse impact on pulmonary, cardiovascular and musculoskeletal systems (USDHHS, 2012). So health risk associated with consumption of Cd contaminated rice is a matter of concern for the regions and population depending on rice for caloric intake (Meharg et al., 2013). Therefore, it is crucial to determine the Cd concentration in rice, variation of Cd distribution among various locations and the dietary exposure of Cd from rice consumption. In this study, we report the concentration of Cd in polished rice, dietary exposure of Cd from rice and the geographical variation of Cd distribution in rice based on our study in Bangladesh. METHODOLOGY In this study, rice grain was collected from the local markets of 16 selected districts (Bagerhat, Bandarban, Bhola, Chattogram, Cumilla, Dhaka, Jhenaidah, Khagrachari, Kushtia, Madaripur, Manikganj, Mymensingh, Naogaon, Narsingdi, Rangamati, satkhira) of Bangladesh. All together 144 rice samples were collected. The samples were stored in plastic Zip-lock bags after drying and grinding and transported to Australia through proper quarantine procedures. Upon return to the laboratory, the samples were stored in cool dry place at room temperature. Samples were digested with concentrated nitric acid. Finally Cd concentration was measured by the ICP-MS. RESULTS AND DISCUSSION The mean, median and range of Cd in rice grain collected from different districts of Bangladesh is presented in Table 1. Overall, the range of Cd in rice grain varied from 1 to 180 µg/kg (dry wt). The highest Cd level was detected in Mymensingh district and the lowest was from Chittagong. Among districts, Cd concentrations varied considerably. A huge variation of Cd level in rice was reported in literature. The average Cd concentration (44 µg/kg) was almost similar to the levels found in Pakistan, Thailand and USA. The mean value of Cd was higher than few studies reported from Australia, Indonesia, Korea and Saudi
T46e
Copyright © CRC CARE Pty. Ltd., 2019
CleanUp Conference 2019Adelaide, Australia
8 –12 September 2019545
Table of Contentsfor this manuscript

Arabia whereas higher Cd concentrations were observed in China (149-189 µg/kg) and Japan (76 µg/kg). In a study, very high level of Cd (1300 µg/kg) in rice was reported from Bangladesh, which was much higher than other studies reported in literature. Our data shows that the Cd levels was influenced by the geographical regions and the type of rice. Usually rice from difference farmer fields was mixed before marketing and due to this the concentration of Cd was reduced by mixing. As the rice was obtained from markets for this study, wide variation in Cd levels was observed
Table 1: Cadmium content in rice collected from different districts of Bangladesh District n Mean (µg/kg) Median (µg/kg) Range (µg/kg) Bagerhat 7 13 ± 5 10 9-23 Bandarban 14 42 ± 25 38 6-102 Bhola 6 23 ± 13 23 4-40 Chottogram 5 27 ± 22 20 1-59 Cumilla 10 47 ± 25 40 23-93 Dhaka 10 34 ± 20 31 9-70 Jhenaidah 5 18 ± 12 11 9-35 Khagrachari 7 49 ± 19 41 25-76 Kushtia 12 39 ± 26 38 8-85 Madaripur 9 66 ± 48 52 17-155 Manikganj 12 30 ± 14 26 9-60 Mymensingh 15 80 ± 41 73 28-180 Naogaon 8 36 ± 18 36 15-72 Narsingdi 5 29 ± 5 28 23-35 Rangamati 12 79 ± 36 81 12-128 Satkhira 7 20 ± 6 22 11-27 Total 144 44 34 1-180
CONCLUSION The Cd content in rice grain collected from various regions of Bangladesh showed wide variation with the maximum level was observed as 180 µg/kg in Mymensingh district. Future studies should include the dietary exposure of Cd form rice and the health implication from the consumption of paddy rice and how to reduce the Cd exposure from rice to the human. REFERENCES DU, Y., HU, X. F., WU, X. H., SHU, Y., JIANG, Y. & YAN, X. J. 2013. Affects of mining
activities on Cd pollution to the paddy soils and rice grain in Hunan province, Central South China. Environ Monit Assess, 185, 9843-56.
KE, S., CHENG, X. Y., ZHANG, N., HU, H. G., YAN, Q., HOU, L. L., SUN, X. & CHEN, Z. N. 2015. Cadmium contamination of rice from various polluted areas of China and its potential risks to human health. Environ Monit Assess, 187, 408.
MEHARG, A. A., NORTON, G., DEACON, C., WILLIAMS, P., ADOMAKO, E. E., PRICE, A., ZHU, Y., LI, G., ZHAO, F. J., MCGRATH, S., VILLADA, A., SOMMELLA, A., DE SILVA, P. M., BRAMMER, H., DASGUPTA, T. & ISLAM, M. R. 2013. Variation in rice cadmium related to human exposure. Environ Sci Technol, 47, 5613-8.
SONG, W.-E., CHEN, S.-B., LIU, J.-F., CHEN, L., SONG, N.-N., LI, N. & LIU, B. 2015. Variation of Cd concentration in various rice cultivars and derivation of cadmium toxicity thresholds for paddy soil by species-sensitivity distribution. Journal of Integrative Agriculture, 14, 1845-1854.
URAGUCHI, S., MORI, S., KURAMATA, M., KAWASAKI, A., ARAO, T. & ISHIKAWA, S. 2009. Root-to-shoot Cd translocation via the xylem is the major process determining shoot and grain cadmium accumulation in rice. J Exp Bot, 60, 2677-88.
USDHHS 2012. In: SERVICES, U. S. D. O. H. A. H. (ed.).
546
Table of Contentsfor this manuscript

ADDITION OF ORGANIC MATTER CAN REDUCE ARSENIC UPTAKE IN WHEAT
Jajati Mandal, Anshuman Kohli, Akanksha, Preety Bala Kumari
Department of Agricultural Chemistry and Soil Science, Bihar Agricultural University, Sabour,
Bhagalpur, Bihar, 813210, INDIA [email protected]
INTRODUCTION The countries with the highest daily intake of total arsenic (t-As) are Spain and Japan followed by India and France. The world's two most significant cases of As contamination where the population suffers the most are located in Asia, particularly in Bangladesh and West Bengal in India (Rahaman et al., 2013). The first is represented by Spain (but could also be represented by Japan), where seafood is the main source of As in the diet. The second is represented by Chile, where drinking water is the main source although vegetables also contribute to the daily intake. The third example is West Bengal (India) and Bangladesh, where cooked rice plays an important role together with drinking water. The most important source for As exposure to human is through drinking water, whereas other pathways like soil-crop-food transfer also subsidizes to As poisoning. Organic matter as produced by the decomposition of biomass is made up of simple aliphatic acids, sugar acids, amino acids and phenols. According to (Stevenson, 1994) SOM consist of water soluble fractions of varying molecular weight and chemical configuration of humic and fluvic acids bearing functional groups with a variety of properties. Soil organic matter (SOM) act as adsorption sites of As and thus reducing its mobility in the soil solution (Sinha et al., 2011). With this background, an attempt has been made (i) to study properties of humic and fulvic substances and As-HA/FA complexation equilibria. (ii) to study the efficacy of the organic amendments in reducing the As content in grain. METHODS Fulvic acid (FA) and Humic acid (HA) were extracted from farm yard manure (FYM), vermicompost (VC), sugarcane bagasse (SB) and surface soil Alkaline extraction was done with 0.5 (M) Na2CO3 followed by subsequent precipitation of HA and FA at pH 2.0-3.4 (with HCl) and 8.0 (with BaCl2) respectively. The stability constant (logK) was determined by the standard method as outlined by Schintzer and Skinner (1966). Equilibration of HA and FA suspension was done with As concentration of 25 mg L-1 and 2 mL of As-HA/FA equilibrated complex were taken in centrifuge tubes and increasing concentrations of each electrolyte (phosphate, sulphate and nitrate) were added. After overnight equilibration at pH 5.0 the contents were centrifuged at 4,193×g, and the amount of released As was determined by the AAS. Based on the above findings, a pot experiment was conducted with 4 levels of As (10, 20, 30 and 40 ppm) and 4 levels of amendments (No amendment, FYM, VC and SB @ 10 t ha-1 each). RESULTS AND DISCUSSION The stability constant (logK) values were found to be pretty stable as can be visualised from the Figure 1. In presence of competing ions the displacement of As from the complexes was in the following order phosphate>sulphate>nitrate. The geometrical alignment of the adsorbate at the adsorbent surface is governed by two types of surface complexes. The inner-sphere complex having the presence of the hydration sphere and the outer-sphere complex devoid of the hydration sphere. In case of As, having the two-phase exchange the initial exchange is from the loosely held sites of the outer-sphere complexation site and subsequently from relatively strongly bonded inner sphere complexation sites. SB having a higher binding capacity than other traditional organic amendments is mainly due to the chemical composition of bagasse. The results of the pot experiment revealed that the organic
T46f
Copyright © CRC CARE Pty. Ltd., 2019
CleanUp Conference 2019Adelaide, Australia
8 –12 September 2019547
Table of Contentsfor this manuscript

amendments significantly reduced the As content of grain irrespective of the different levels of As being added to the soil. The efficacy of organic amendments followed the order SB>FYM>VC. The results of the pot experiment supported the findings of equilibrium studies regarding the complexing ability of the HA and FA produced from the organic amendments. As the organic matter contains humified matter in large amounts it decreases the bioavailability of metals through the formation of stable complexes.
Figure 1. Efficiency of organo-As complex on retention-release of As CONCLUSIONS From the above study it can be concluded that the HA and FA extracted from the organic amendments are polyprotic in nature and FA have a higher aliphatic-aromatic balance than the HA. The complexation of As with FA is higher than HA and organic fractions from sugarcane bagasse can be a potential complexing agent of As. From the pot experiment it can be concluded that the organic amendments reduced the uptake of As and the order of efficacy is as follows: SB>FYM>VC and it can be a viable option for mitigation of As contamination. REFERENCES Rahaman, S., Sinha, A. C., Pati, R., Mukhopadhyay, D. 2013. Arsenic contamination: a
potential hazard to the affected areas of West Bengal, India. Environ Geochem Health 35, 119–132.
Stevenson, F.J. 1994. Humus chemistry — genesis, composition, reactions. Wiley, New York Sinha, B., Bhattacharyya, K., Giri, P. K., and Sarkar, S. 2011. Arsenic contamination in
sesame and possible mitigation through organic interventions in the lower Gangetic Plain of West Bengal, India. J Sci Food Agri 91, 2762-2767.
Schnitzer, M., and Skinner, SIM.1966. Organo-metallic interactions in soils: 5. Stability constants of Cu+2, Fe 2+ and Zn2+ fulvic acid complexes. Soil Sci 102, 361–365
548
Table of Contentsfor this manuscript

EFFECT OF ARBUSCULAR MYCORRHIZAL FUNGI ON NUTRIENT CONTENT OF FINGER MILLET UNDER ZINC CONTAMINATION
Deeksha Krishna, H.K. Sachan
Department of Soil Science & Agricultural Engineering,
College of Agriculture, Fisheries and Forestry, Fiji National University, FIJI [email protected]
INTRODUCTION Millets have an incredible nutritional value and could be considered crops for food security as they outperform other cereals under harsh environmental conditions and are economical to produce. These cereal crops have their significance as a staple food in semi-arid tropical regions of Asia and Africa. Heavy metals are occurring naturally in the environment, but they are not the main cause of threat; relatively the industrial processing of these elements and their deposition into the environment due to this process (Tchounwou, PB, et al 2012). Mycoremediation (fungal remediation) is an evolutionary approach that can provide environmental benefits in addition to a cost-efficient alternative to other remediation This study aims to examine the physiological role of arbuscular mycorrhizal inoculation on the plant growth and nutrient content of finger millet as influenced by zinc addition. METHODS The pot experiment was carried out in a complete randomized design with 4 replicates. Four treatments were considered: Control plants or non-mycorrhizal (NM), plants inoculated with Gigaspora ACP-1 (M1), Glomus ACP-2 (M2) and Scutellospora ACP-2 (M3). Seeds were planted into a hole in substrate where the inoculum (5 g per seed) had been previously added (Khaosaad et al., 2006) was sown after surface sterilization of finger millet seeds with 0.5 % sodium hydrochloride for 15 minutes four replications per 16 treatments were established. Pots were placed in a glasshouse and plants were watered with distilled water during the experiment. Growth and yield parameters Root colonization of AM fungi was observed at the time of harvesting. At 60 days after sowing, growth attributes e.g. plant height, fresh and dry shoot and root weight was recorded finger millet. Experiment was ended, after 150 days’ growth, the plants were harvested and the plant growth parameters such as plant height and fresh and dry matter contents of plants were again determined and nutrient content in grain was also determined. Statistical analysis The analysis of variance technique (ANOVA) was performed by using statistical software Statistix 8.1 for finger millet. The values were compared for the significance of the difference between the treatments through Least Significant Difference (LSD) test. RESULTS AND DISCUSSION Effects of the zinc applications on root colonization: Highest percentage of AM fungal root colonization was found in finger millet inoculated with Glomus ACP-2 (M2) (58.66%), followed by Scutellospora ACP-2 M3(49.16 %) and Gigaspora ACP-1 (M1) (48.80 %), respectively. The results are shown in Table 1. In this study, non AM inoculated finger millet had no root colonization and no soil hyphae. In the inoculated plants, roots colonized by Gigaspora ACP-1 (M1) varied from roots colonized by 13.40% to 48.80 %, Glomus ACP-2 (M2) AM fungi colonization varied from 15.60% to 58.66% and Scutellospora ACP-2 (M3) AM fungi colonization varied from 14.36% to 49.16%.
T46g
Copyright © CRC CARE Pty. Ltd., 2019
CleanUp Conference 2019Adelaide, Australia
8 –12 September 2019549
Table of Contentsfor this manuscript

High levels of colonization by AM fungi were observed both in mine spoils heavily polluted with metals by Shetty(1994). This leads to the conclusion that metal tolerance has developed naturally in the soil microorganisms. The present study also provides evidence of tolerance to Zn contamination by the AM fungal strain. Even when the Zn addition level was as high as 450 mgkg-1, the mycorrhizal infection rate did not decrease compared to the control receiving no Zn. This may imply that Zn has no or little effect on spore germination and AM colonization. Table 1. Effect of AM fungi and Zn addition on root colonization
Treatments Root colonization % Zn0
Zn150
Zn300
Zn450
Mean
Uninoculated control 0.0 0.00 0.00 0.00 0.00 M1 Gigaspora ACP-1 48.80 18.90 17.36 13.40 24.61
M2 Glomus ACP-2 58.66 22.60 19.26 15.60 29.03 M3 Scutellospora ACP-2 49.16 19.56 19.13 14.36 25.05
Mean 39.0 15.0 14.00 11.00 M Zn MxZn
SEM ± 0.33 0.33 0.66 Cd(p=0.05) 0.96 0.96 1.92
Inoculation with Glomus ACP-2 (M2) followed by Gigaspora ACP-1(M1) and Scutellospora ACP-3(M3) significantly increased nutrients concentration in grain as compared to respective control as Zn addition increased (Table 2). AM fungal inoculation significantly increased the percentage of nitrogen, phosphorus and potassium in grain of finger millet as measured after harvesting. Allen et al. (1981) reported that AM fungal root colonization improved the phosphorus uptake, phosphorus transfer, phosphorus activity and the use of available phosphorus in plants, which enhanced plant growth and biomass.
Zinc (mg kg-1) Treatment N% grain-1 P% grain-1 K%grain -1 0 Uninoculated control 1.34 0.175 0.50
M1 1.45 0.184 0.69 M2 1.55 0.250 0.75 M3 1.47 0.183 0.72
150
Uninoculated control 1.28 0.170 0.48 M1 1.47 0.178 0.73 M2 1.47 0.245 0.71 M3 1.48 0.177 0.69
300 Uninoculated control 1.25 0.170 0.45 M1 1.44 0.175 0.68 M2 1.48 0.240 0.65 M3 1.46 0.176 0.63
450 Uninoculated control 1.26 0.165 0.42 M1 1.43 0.172 0.63 M2 1.45 0.235 0.66 M3 1.43 0.174 0.61
SEM ± Zn 0.008 0.019 0.012 AMF 0.008 0.019 0.012
Zn AMF 0.001 0.0038 0.025
Table 2. Effect of AM fungi and Zn addition on nutrient concentration in grain of finger millet
CONCLUSIONS In conclusion one species of AM fungi viz., Glomus ACP-2 (M2) was the most effective species and significantly influenced mineral nutrition of finger millet followed by followed by Gigaspora ACP-1(M1) and Scutellospora ACP-3(M3). Authors recommend that future experiments should be conducted in the field using Glomus ACP-2 (M2) inoculation to enhance finger millet growth, nutrient uptake and grain production
x
550
Table of Contentsfor this manuscript

REFERENCES M.F. Allen, J.C. Sexton, T.S. Moore, M. Christensen 1981.Influence of phosphate source on
vesicular arbuscular mycorrhizae of Bouteloua gracilis.New Phytol., 87 (1981), pp. 687-691
Shetty, K.G., B.A.D. Hetrick, D.A.H. Figge and A.P. Schwab, 1994. Effects of mycorrhizae and other soil microbes on revegetation of heavy metal contaminated mine spoil. Environ. Pollut., 86: 181-188.
Tchounwou, PB, et al 2012 Tchounwou, P.B, Yedjou C.G, Patlolla AK, Sutton DJ.(2012) Heavy Metals Toxicity and the Environment. EXS. 2012; 101: 133–164. pmid:22945569
551
Table of Contentsfor this manuscript

NATURE BASED SOLUTIONS TO CLIMATE CHANGE: EVIDENCE FROM AFRICA AND ASIA
Pushpam Kumar
UN Environment, P.O. Box 30522, Nairobi 0010, KENYA
Nature-based solutions (NBS) help protect, sustainably manage and restore ecosystems for effective climate change mitigation and adaptation. It is corner stone to manage climate change. They are primarily focusing on scaling up preservation and restoration of forests, land and marine ecosystems, conservation and restoration of wetlands, comprehensive treatment of soil erosion, Climate compatible agriculture and food systems, Regenerating ecosystems of the ocean and natural reserve systems with national parks as the mainstay and Eco-corridors and protection of biodiversity. While these goals and activities are beyond any debate, decision makers would like to understand the economic efficiency of such intervention. This will help in resolving the trade-offs and competing resource for the decisions.
Land degradation and desertification are some of the world’s greatest environmental challenges in the light of a rapidly growing world population and increasing demand for food, fibre, and biomass energy. This problem is more acute in the countries of Asia and Africa. The target set in the SDG 15.3 for a land degradation neutral world by 2030 would not only will depend upon the success of the countries of Africa and Asia but would be critically determined by their success to achieve them. Countries, UN agencies, and the scientific community have been in continuous and increasing discourse on identifying and generating empirical and scientific methods for monitoring, assessing and reporting progresses towards SDG 15.3 and other relevant and related targets and commitments.
With a total land area of 4.3 billion ha, Asia is the largest and most populated continent in the world. Degraded areas on the continent include expanding deserts in China mainland, India, Iran, Mongolia, and Pakistan, the sand dunes of Central Asia, the steeply eroded mountain slopes of Nepal, and the deforested and overgrazed highlands of the Lao People ‘s Democratic Republic. Asia holds almost 60 per cent of the world’s population. Of this, nearly 70 per cent live in rural areas depending directly on land and land-based ecosystem services. As a result, Asia is the continent most severely affected by land degradation, desertification and drought in terms of the number of people affected.
Asia is the largest and most populated continent in the world, covering around 30 per cent of the global land. More than 4 billion people are currently living in Asia, which can be divided into five sub regions, namely Central Asia, East Asia, South Asia, Southeast Asia and Western Asia, often referred to as the Middle East. Due to the size of the continent, it encompasses various climatic conditions, from the arid climates of Western and Central Asia to the tropical, humid climates of the equatorial region. As a result, Asia shows a great biological and cultural diversity. Each region has seen a different social, economic and political development over the centuries. Consequently, each part of Asia faces different challenges regarding climate change, loss of biodiversity and land degradation as addressed by SDG 15.
African countries where the situation is alarming and demands immediate intervention to combat land degradation and desertification. The first aspiration of Africa’s Agenda 2063 states creating a prosperous Africa based on inclusive growth and sustainable development (African Union Commission, 2015). For African countries achieving the sustainable development goals (SDGs) that the world has set targets for 2030 are in line with the aspirations of Africa’s Agenda 2063. On the 6th Special Session on African Ministerial Conference on Environment (AMCEN), African Environmental Ministers decided to welcome
W11b
Copyright © CRC CARE Pty. Ltd., 2019
CleanUp Conference 2019Adelaide, Australia8 –12 September 2019 552
Table of Contentsfor this manuscript

“The report - ELD Initiative & UNEP, 2015- and use its outcomes as a vehicle for creating new data and generation of policy relevant information that links the biophysical aspects of land degradation with the economic drivers of change”. This is stated in number 5 of "Decision 4/SS6: Action for combating desertification, drought, floods and restoring degraded land to achieve a land-degradation-neutral world”. In Africa, every year, about 12 million hectares of land – about the size of Bulgaria or Benin – is lost, and along with it the potential to produce 20 million tons of grain (UNCCD, 2012). Socio-economic consequences of land degradation are Food insecurity, poverty, social tension, reduced availability of clean water and increased vulnerability of affected areas.
The scientific data and economic analysis indicate that in addition to achieving SDG 15.3, which aims at achieving an LDN world, investment in SLM on agricultural lands in the next decade (2018-2030) would enable most Asian countries covered in this study to achieve a number of other related SDGs. These include economic growth and employment creation (SDG 8.1 and 8.5), eradicating extreme poverty and reduction of poverty (SDG 1.1 and 1.2), achieving food security through doubling agricultural productivity and income as well as ensuring sustainable food production systems (SDG 2.3 and 2.4). Moreover, the results of this study have an important contribution in providing the methods, indicators, and results for measuring and reporting SDG target 15.3 and for integrating particularly the value of soil as a natural capital in the nations’ social accounting matrices.
553
Table of Contentsfor this manuscript

ANALYSIS OF EMERGING PFAS CONTAMINANTS USING HIGH RESOLUTION ACCURATE MASS SPECTROMETRY
Bob Symons1, Jonathon Angell2, Jack Thompson2,3
1Eurofins Environment Testing Australia, Unit 7.03 - Parkview Building, 16 Mars Road, Lane
Cove West, NSW 2066, AUSTRALIA 2Eurofins Environment Testing Australia, 1/21 Smallwood Pl, Murarrie QLD 4172,
AUSTRALIA 3Queensland Alliance for Environmental Health Sciences (QAEHS), University of
Queensland, Cornwall St, Woolloongabba QLD 4102, AUSTRALIA [email protected]
INTRODUCTION Characteristics of emerging contaminants are that they all have in common much uncertainty about them, which leads to the absence of a strategy and policy. The following observations about emerging contaminants are:
• More than 2100 scientific studies have shown that they pose a potential risk to humans, plants and / or animals. However, there’s a lack of knowledge of the practical implications;
• The emerging contaminants are not examined in regular environmental investigations. This leads to a lack of data;
• As a result of a lack of data, little is known about the practical situation and risks in the soil, sediment and groundwater systems;
• Appropriate strategies and technologies to control existing contaminants are not in development;
• Uncertainty about legal and financial consequences of (potential) contamination will hamper an efficient approach.
The National Environment Protection (Assessment of Site Contamination) Measure 1999 (NEPM) as updated in 2013 sets out in Table 1A(1) Health investigation levels for soil contaminants of Schedule B 1 - Guideline on Investigation Levels for Soil and Groundwater a list of compounds that should be targeted in site investigations and for which there are optimised methods to analyse these “known knowns”. In some instances, suspect screening analyses using GC-MS scans are used to look for a broader range of chemicals or “known unknowns”. What is now becoming of major interest to environment regulators and water authorities is to look further for compounds that might be unknown in current databases, emerging new contaminants “Unknown Unknowns”. High-resolution accurate mass LC-QToF-MS has been used for the identification of PFAS precursors and the determination of non-targeted analytes in AFFF legacy foams as well as contaminated sites where AFFF have been used. While LC-QToF-MS is a great technique for the anionic, cationic and zwitterionic PFAS compounds LC-QToF-MS has limited capability for the analysis of neutral PFAS compounds. GC-QToF-MS is ideally suited to analysing these neutral PFAS compounds such as fluorotelomer alcohols (FTOHs) that are applied in a variety of products such as textiles, clothing, carpets and furniture being released into the environment intentionally or accidentally during the production, use and disposal of these fluorotelomer-derived products. FTOHs unlike their ionic counterparts are volatile and are therefore widely distributed through the air and are subject to long-range atmospheric transport (Zhenlan Xu 2017). Additionally, FTOHs have been shown to yield through aerobic biodegradation perfluoroalkyl carboxylic acids (PFCAs)(Mabury 2004).
W21a
Copyright © CRC CARE Pty. Ltd., 2019
CleanUp Conference 2019Adelaide, Australia8 –12 September 2019 554
Table of Contentsfor this manuscript

METHODS A generic extraction and clean-up of samples to cover the broadest possible range of compound groups as listed in the above figure. Two different extraction and clean-up methods were applied with the initial method optimised for non-polar and very lipophilic compounds like PCBs, PAHs, PBDEs and other classical POPs plus neutral PFAS compounds such as FTOHs, and the second is optimised for polar compounds like pharmaceuticals including drugs of abuse, modern pesticides and biocides, PFAS, alkylphenol ethoxylates(APEO) are nonylphenol surfactants and bisphenols. Prior to extraction, samples are spiked with a number of isotopically labelled surrogate standards. The final extracts are then analysed by GC-QToF-MS and LC-QToF-MS in the different ionisation modes to cover all possibilities of detecting these emerging contaminants. The following quality criteria were normally used to ensure correct identification and quantification of the target compound:
• The retention times should match those of the standard compounds within ± 0.1 min. • The signal-noise ratios are greater than 3:1. • Mass error <5ppm. • MS (/MS) spectra matches up MS (/MS) spectra of pure analytical standards. • Use of internal standards for measurement of recovery in each single sample and
calibration standards for calculation of targeted analyte concentrations. • For each sample type laboratory blanks followed the sample preparation and
quantification procedure as the regular samples to assess background interferences and possible contamination of the samples.
Quantification of target compounds is based on comparison of the compound’s peak area to a calibration curve, which is generated in separate runs by injection of calibration solutions of a pure analytical standard of this compound. An internal standard is added in a known amount to the sample and the calibration standards. This standard is used for calibration by calculating the ratio of the signals of the analyte to the internal standard. With this approach loss of the analyte during sample preparation and injection is automatically compensated. The internal standard is a compound that is very similar, but not completely identical to the analyte in the samples, and it is presumed that the internal standard(s) behave like the analyte(s). For isotopically labelled internal standards this presumption is normally valid, but also other analytical standards can fulfil this requirement. RESULTS AND DISCUSSION Samples from a site where a loss of containment of AFFF occurred were analysed by targeted LC-MS/MS however mass balance were not being observed through the use of
555
Table of Contentsfor this manuscript

TOP assay and TOF analyses. LC-QToF-MS analysis gave the probable structure identification together with previously reported MS/MS spectra and fragmentations to be 6:2 Fluorotelomer Thioether Amido Sulfonate (6:2 FTSAS).
CONCLUSIONS The results show that LC-QToF-MS can be used to identify unknown PFAS compounds through assignment of structural identification via high-resolution accurate mass spectrometry. Furthermore, this study contributed to improving the analytical methodologies for the analysis of emerging contaminants. REFERENCES Mabury, S.A. et al., 2004 Fluorotelomer Alcohol Biodegradation Yields Poly- and
Perfluorinated Acids, Environ. Sci. Technol. 38, 2857-2864 OECD 2018, ENV/JM/MONO(2018)7 Summary Report on Updating the OECD 2007 List of
Per- and Polyfluoroalkyl Substances (PFASs) Yi. S., et al., 2018 Biotransformation of AFFF Component 6:2 Fluorotelomer Thioether Amido
Sulfonate Generates 6:2 Fluorotelomer Thioether Carboxylate under Sulfate-Reducing Conditions., Environ Sci. Technol. Lett. 2018 May 8; 5(5): 283–28
Xu., Z, et al., 2017, Occurrence of fluorotelomer alcohols at two Alpine summits: sources, transport and temporal trends., Environ. Chem., 14, 215–223
556
Table of Contentsfor this manuscript

PFAS TOP ASSAY INTERLABORATORY STUDY — SUPPORTING ANALYTICAL LABORATORIES
Raluca Iavetz1, Mark Lewin1, Geoff Morschel1, Danny Slee1, Cheryl Lim1, Annette Nolan2,
Charles Grimison3, Marc Centner4, Steven McGrath4, Bob Symons5
1National Measurement Institute, 105 Delhi Road, North Ryde, NSW 2113, AUSTRALIA 2Australasian Land and Groundwater Association, 40 Hoddle St, Robertson, NSW 2577,
AUSTRALIA 3Ventia Utility Services, 1 Homebush Bay Drive, Rhodes, NSW 2138, AUSTRALIA 4ALS Environmental, 277-289 Woodpark Rd, Smithfield, NSW 2164, AUSTRALIA
5Eurofins Environment Testing, 16 Mars Rd, Lane Cove West, NSW 2066, AUSTRALIA
INTRODUCTION A PFAS total oxidisable precursor (TOP) assay interlaboratory study was organised by NMI as part of the Australasian Land and Groundwater Association (ALGA) Research and Development Grant and involved three participant laboratories. The aim of the project was to compare and assess the participating laboratories’ accuracy in the measurement of PFAS in aqueous samples spiked with a commercial AFFF and other per- and polyfluorinated compounds both before and after application of a TOP assay oxidative pre-treatment. All PFAS compounds that are converted to perfluoroalkyl acids (PFAAs) during oxidation pre-treatment are considered precursors. Some precursors cannot be analysed using current analytical methodology. The purpose of the oxidative pre-treatment is to convert precursors into stable, target PFAAs that can be quantified and therefore provide a better understanding of the overall PFAS contamination present in a sample. METHODS Four test samples were prepared by spiking milli-Q water and a water high in natural organic matter with a fluorotelomer foam and other precursors. Homogeneity of the test samples was assessed for both pre- and post-TOP assay and judged sufficiently homogeneous for the use in this study. Participants were asked to analyse each sample for the PFAS ‘standard suite’, perform an oxidative sample pre-treatment method in order to convert untargeted precursors into target PFAAs and then reanalyse the samples. The laboratories analysed the samples using their routine test methods and submitted three results and uncertainty estimates for each sample, along with their answers to a questionnaire about analytical methodology. RESULTS AND DISCUSSION Laboratory results for oxidation products were generally within expectation and no oxidation occurred for control analytes (PFAS compounds that do not convert during pre-oxidation treatment). A high variability between participants’ results was observed for some PFAS in the post- oxidation pre-treatment samples (CV of 27-67%). Due to the limited amount of data and the fact that each participant laboratory used a different methodology for oxidation no significant trend was observed. An example of between and within laboratory variation for analysis of PFHpA in Sample S4 post-TOP assay is presented in Figure 1.
W21b
Copyright © CRC CARE Pty. Ltd., 2019
CleanUp Conference 2019Adelaide, Australia
8 –12 September 2019557
Table of Contentsfor this manuscript

Fig. 1. Results for PFHpA in Sample S4 POST TOP assay
All laboratories performed the oxidative pre-treatment based on Houtz and Sedlak paper with some modifications. In all cases, participants used extra doses of oxidant and/or different oxidation times in order to meet HEPA (2018) NEMP ratio test for aqueous samples. Even with using modified Houtz and Sedlak methodology, only laboratory 2 fully converted the observable precursors. This may be due to the fact that laboratory 2 diluted the sample prior to oxidation therefore reducing the organic load and perhaps improving of the oxidation process. A test for acceptability of oxidation step as per HEPA NEMP (2018) is presented in Table 1.
Table 1. Test for acceptability of the oxidation step as per HEPA (2018) NEMP. Sum of observable
precursors post-oxidation
µg/L
Sum of Total PFAS µg/L
Ratio (%) SumPFAA/SumTotal PFAS
µg/L
TEST* Ratio <5%
Lab 1
Lab 2 Lab 3 Lab 1 Lab
2 Lab
3 Lab
1 Lab
2 Lab 3 Lab 1
Lab 2 Lab 3
Sample S1 POST 1.3 ND 1.9 63 89 74 2.1 0 2.6 Pass Pass Pass
Sample S3 POST 4.6 ND 0.08 70 83 95 6.6 0 0.1 Fail Pass Pass
Sample S4 POST 3.4 ND 0.50 160 141 144 2.1 0 0.3 Pass Pass Pass
*HEPA (2018) NEMP section 19.2. ND = not detected
For samples S1, S3 and S4, PFOS was not an expected oxidation product however two laboratories 1 and 3 reported low concentrations of PFOS. A possible explanation is that PFOS was formed during the oxidation process of PFOSA. Laboratory 2 did not report any PFOS, but they diluted the sample before oxidation pre-treatment. No conclusion could be drawn due to the added variable introduced by laboratory 2. CONCLUSIONS Interlaboratory study is a useful tool for laboratories and decision makers to assess analytical data and identify any problems with current methodologies. A major finding of this study is that applying Houtz and Sedlak method without modification will yield results that do not comply with NEMP criteria where samples contain high concentration of precursors or high organic content. NMI intends to conduct another interlaboratory study open to Australian and international participants for assessment of in-house TOP assay methods.
REFERENCES [1] Houtz, F.E. and Sedlak, L.D. (2012) Oxidative Conversion as a Means of Detecting
Precursors to Perfluoroalkyl Acids in Urban Runoff Enviornmental Science& Technology 46:9342-9349.
[2] PFAS National Environmental Management Plan. (2018) EPA Victoria, https://www.epa.vic.gov.au/PFAS_NMP (January 2019).
558
Table of Contentsfor this manuscript

IMPROVING MEASUREMENT RELIABILITY OF THE PFAS TOP ASSAY Annette Nolan1,2, Charles Grimison3, Raluca Iavetz4, Danny Slee4, Cheryl Lim4,
Marc Centner5, Steven McGrath5, Bob Symons6, Karl Bowles7
1Australasian Land and Groundwater Association, 40 Hoddle St, Robertson, NSW 2577, AUSTRALIA
2Ramboll Australia, 50 Glebe Road, The Junction, NSW 2291, AUSTRALIA 3Ventia Utility Services, 1 Homebush Bay Drive, Rhodes, NSW 2138, AUSTRALIA
4National Measurement Institute, 105 Delhi Rd, North Ryde, NSW 2113, AUSTRALIA 5ALS Environmental, 277-289 Woodpark Rd, Smithfield, NSW 2164, AUSTRALIA
6Eurofins Environment Testing, 16 Mars Rd, Lane Cove West, NSW 2066, AUSTRALIA 7RPS, Level 13, 255 Pitt Street, Sydney, NSW 2000, AUSTRALIA
INTRODUCTION This project involved an interlaboratory assessment of the per- and poly-fluoroalkyl substances (PFAS) total oxidisable precursor (TOP) assay conducted collaboratively by the project team – National Measurement Institute (NMI), Australian Laboratory Services (ALS), Eurofins and Ventia Utility Services (Ventia). The project received funding from the inaugural Australasian Land and Groundwater Association (ALGA) Research and Development Grant in addition to in-kind contributions from the three laboratories. The PFAS TOP assay is an oxidative sample pre-treatment based on modification of the Houtz and Sedlek (2012) method. It is aimed at converting per- and poly-fluorinated non-target PFAS (perfluoroalkyl acid precursors) within a sample into stable target perfluoroalkyl acids (PFAAs) that can be quantified by conventional Liquid Chromatography-Mass Spectrometry-Mass Spectrometry (LC-MS-MS) analytical techniques, thereby providing a better understanding of the extent of overall PFAS contamination present within a sample. Quantifying precursors is important to better understand ongoing sources of PFAAs, including PFOS and PFOA, both at contaminated sites and in the waste industry (sewage treatment effluents, biosolids, landfill leachates). Without the ability to reliably quantify (or semi-quantify) precursors, uncertainties in the long-term potential for PFAA formation hinders effective regulation, management and remediation. Currently the TOP assay, although useful as a semi-quantitative tool, is not regarded as sufficiently robust by many regulators to allow quantitative consideration of precursors in environmental regulation. Testing by commercial laboratories and Government has shown that the current methodology for the TOP assay is challenged when applied to foam products, environmental samples with high levels of precursors or elevated levels of total organic carbon (TOC) in aqueous samples to which this project addressed. Under the standard conditions of the assay, exhaustion of the oxidant is possible unless samples are prediluted, or the initial oxidant dose is increased. Incomplete oxidation may significantly underestimate the post-assay PFAS concentrations when substantial concentrations of precursor compounds are present. Also important is ensuring that the pH is strongly alkaline and maintained during the oxidation within a range that promotes effective formation of hydroxyl radicals (the oxidant species) and avoids potential perfluorinated alkyl chain shortening. Shortening of the alkyl chain to <C4 generates compounds currently outside the suite offered by laboratories and means a portion of the PFAS mass post-oxidation is unaccounted for. Shortening of alkyl chains also has the potential to distort the PFAA profile, which could have implications for risk assessment. The project produced recommendations to be applied to the TOP assay and reported to end users to provide improved confidence in the assay. The project also referenced proposed performance criteria in the PFAS National Environmental Management Plan (NEMP, 2018) and provided recommendations on the relevance of this criteria, where relevant.
METHODS An interlaboratory study was designed and conducted to evaluate the laboratories’ methods
W21c
Copyright © CRC CARE Pty. Ltd., 2019
CleanUp Conference 2019Adelaide, Australia
8 –12 September 2019559
Table of Contentsfor this manuscript
for TOP assay oxidative pre-treatment for aqueous samples spiked with a commercial AFFF (Aqueous Film Forming Foam) plus other precursors. The participating laboratories’ accuracy in the measurement of PFAS was compared and assessed before and after application of the TOP assay. Details of the interlaboratory study results will be discussed by NMI in a separate paper. This paper discusses the recommendations developed for the assessment and application of TOP assay data, based on the interlaboratory study results, as well as recommendations developed for performance criteria within the PFAS NEMP. RESULTS AND DISCUSSION Based on the interlaboratory study results, discussion and/or recommended amendments were provided on each of the Quality Assurance measures provided in the current NEMP for the TOP Assay:
• Validation of the method’s oxidation using detectable oxidisable precursors (e.g. labelled internal standards) is undertaken and reported (not straightforward in practice), and dilutions are recorded and reported.
• [Total PFAS] post-TOPA should be ≥ [Total PFAS] pre-TOPA - this is dependent on what PFAA precursors are present and in what proportions. In conversion to PFAAs, mass is lost, because compounds are being degraded into smaller compounds. Conversion to PFAAs with chain lengths <C4 will be unaccounted for by LC-MS-MS.
• The [sum of PFCAs] post-TOPA should be ≥ than the [sum of PFCAs] pre-TOPA – this signifies any precursors present being converted to PFCA products (a more appropriate measure than the preceding criterion).
• The [sum of PFSAs] post-TOPA should approximate the [sum of PFSAs] pre-TOPA - this signifies that precursors did not convert to PFSA products. This assumes that no PFSA will be produced from precursors, which is not always the case (e.g. fabric treatments based on acrylic polymers with perfluoroalkyl sulfonamide side branches). Therefore, the ≥ criterion specified for PFCAs would also be applicable for PFSAs.
• For full oxidation, no PFAA precursors (e.g. 6:2 FtS, FOSA) are detectable post oxidation, signifying complete oxidation.
• Where a near complete oxidation is acceptable, minimal PFAA precursors are detectable post oxidation signified by: o for aqueous samples, sum of [measured PFAA precursors] divided by sum of
[Total PFAAs] <5% o for soil samples, sum of [measured PFAA precursors] divided by sum of
[Total PFAAs] <10% (except where PFAS are detected ≤ 10 times LOR). CONCLUSIONS
• Whilst the TOP assay has some limitations, it can still provide useful information. • Laboratories need to report on QA/QC based on appropriate guidance. • Consultants need to review QA/QC data and provide assurance to their clients that
results are fit for purpose. • Consultants and clients need to consider that the TOP assay is often complex -
o Multiple oxidations and/or dilutions may be required. o LORs and turnaround times may be impacted.
• Consultants, clients and regulators should be aware that TOP assay results have greater uncertainty than conventional LC-MS-MS analyses but are still useful as a semi-quantitative indication.
REFERENCES [1] Houtz, F.E. and Sedlak, L.D. (2012) Oxidative Conversion as a Means of Detecting
Precursors to Perfluoroalkyl Acids in Urban Runoff. Environmental Science & Technology, 46, 9342-9349.
[2] PFAS National Environmental Management Plan (2018) EPA Victoria, https://www.epa.vic.gov.au/PFAS_NMP (January 2018).
560
Table of Contentsfor this manuscript

FACT CHECK: DO LABORATORY METHODS REALLY AFFECT THE QUALITY OF PFAS DATA?
Giorgio De Nola, Tarah Hagen, Anthony Lane
SLR Consulting, Suite 2, 2 Domville Avenue, Hawthorn 3121, AUSTRALIA
INTRODUCTION A universally agreed test method for the analysis of per and polyfluoroalkyl substances (PFAS) has not been specified in Australia. It is therefore unsurprising that commercial laboratories have different in-house PFAS test methods and data reporting conventions. SLR has explored whether these differences have the potential to affect data quality in environmental investigations.
METHODS Analytical certificates of analysis (COAs) for water analysis were examined from three commercial laboratories who undertook PFAS analysis for environmental investigations between 2014 and 2018; literature information was also consulted. The investigation was guided by the following questions:
• COAs – Was sufficient information provided on COAs to give confidence regarding method used and quality control?
• Analytical Method and Clean-up – Did they affect reproducibility and quality assurance/quality control (QA/QC)?
• Branched Versus Linear PFOS – Was this reported on COAs and does this matter?
RESULTS AND DISCUSSION Was Sufficient Information Provided on COA? Table 1 provides a summary of information provided on commercial laboratory COAs. The three laboratories used different PFAS analytical methods and sample clean-up procedures and not all used QA/QC tests. The type of analytical method used by a particular lab was not always specified on the COA however labs were forthcoming in discussing their test methods. Nevertheless, the information provided on the COA and through correspondence with the labs was, at times, inconsistent making interpretations difficult.
Table 1. Information Provided on COAs by Commercial Laboratories. Information Type Lab A Lab B1 Lab B2 Lab C The analytical test method (IS or IDQ) - (IS) - (IS) IDQ - (IDQ) Sample clean-up used - (DI) - (?) - (SPE) - (SPE) In-house laboratory test method name Yes Yes Yes Yes Internal standard used - - Surrogate Surrogate Reported results corrected for recoveries - (No) - (No) Yes Yes Mixed linear/branched standards used Yes - (Yes) - (Yes) Yes Branched concentrations reported No No No Yes/No Lab QA/QC (blanks, duplicates and spikes) Yes Yes Yes No Lab B changed analytical method during environmental investigations hence Lab B1 and Lab B2; ‘-‘ = Information not provided on CoA, answer in brackets based on discussion with relevant commercial laboratory and inferred from COA; ‘?’ = Unknown; IS = Internal Standard Method; IDQ = Internal Dilution Quantitation Method; DI = Direct injection; SPE = Solid Phase Extraction; QA/QC = Quality Assurance/Quality Control
It is concluded the type of information provided on COAs from 2014 to 2018 was insufficient to easily identify the PFAS method used. COAs reviewed did not comply with guidance provided in the National Environment Management Plan for PFAS (HEPA 2018) however, for some commercial laboratories, they have improved over time. An environmental consultant
W21d
Copyright © CRC CARE Pty. Ltd., 2019
CleanUp Conference 2019Adelaide, Australia
8 –12 September 2019561
Table of Contentsfor this manuscript

would require detailed knowledge of analytical chemistry and commercial laboratory practices to extract and evaluate relevant information from COAs for evaluating QA/QC. It is unreasonable to expect environmental consultants to have the necessary level of detailed knowledge to interpret the COAs reviewed. Did Analytical Methods and Clean-up Affect Reproducibility? PFAS proficiency testing, undertaken to evaluate the performance of up to twenty-nine (29) laboratories, has tested the accuracy of PFAS measurement in various media (NMI 2016, NMI 2017). During this review it was considered that the analytical method used, and sample clean-up were the most likely to affect reproducibility of results. Based on visual observations and annotations (added by SLR) on En-score figures reproduced from proficiency test reports (refer to Figure 1), it is concluded PFAS results from laboratories utilising the Isotope Dilution Quantitation (IDQ) method were more likely to be consistent with the expected PFAS result. An additional observation of the review undertaken was that Relative Percentage Differences (RPD) were consistently being reported outside the acceptable range. This may also be partly a result of laboratory methods adopted by commercial laboratories.
Figure 1. En-Score Data from Proficiency Testing: a) NMI (2016) and b) NMI (2017)
Branched PFOS – Was this Reported on COAs and does it Matter in Assessments? None of the labs included in this investigation consistently reported branched PFOS concentrations on COAs. This information can be important for future health risk assessments. For example, Drew et al. (2019) have shown differential distribution of linear and branched PFOS isomers into cattle tissues. Thus, if environmental media PFOS concentrations were to be used to predict PFOS burden in cattle tissues potentially eaten by humans, this would require knowledge of both branched and linear PFOS concentrations. CONCLUSIONS It is concluded laboratory methods do affect the quality of PFAS data. Environmental consultants are unlikely to have been provided with sufficient information on COAs to make an informed decision on data quality. REFERENCES Drew R, Hagen T, Champness D and Sellier A (2019). PFAS Tissue Distribution in Cattle.
Poster presentation at CleanUp 2019, Adelaide. HEPA (2018). PFAS National Environmental Management Plan. January 2018. Heads of
Environmental Protection Authorities Australia and New Zealand. NMI (2016). Proficiency Test Report AQA 16-06 PFOS/PFOA in Fish, Soil and Water.
November 2016. National Measurement Institute. NMI (2017). Proficiency Test Report AQA 17-08 PFAS in Soil, Water and Fish. November
2017. National Measurement Institute.
562
Table of Contentsfor this manuscript

APPLICATION AND CONFIRMATION OF TOTAL OXIDIZABLE PRECURSORS ASSAY (TOPA) TO
MONITOR PFAS WITH A PORTABLE READING KIT
Md. Al Amin1, Zahra Sobhani1, Yanju Liu1,2, Rajarathnam Dharmarajan1,2, Ravi Naidu1,2, Cheng Fang1,2
1Global Centre for Environmental Remediation (GCER), University of Newcastle, Callaghan, NSW 2308, AUSTRALIA
2Cooperative Research Centre for Contamination Assessment and Remediation of the Environment (CRC CARE), University of Newcastle, Callaghan, NSW 2308, AUSTRALIA
INTRODUCTION Due to the extraordinary properties like strong C-F bond, adhesive characteristics, hydrophobicity and oleophobicity of per and-poly fluorinated substances (PFAS), make them applicable for the uses of different activities. It has been reported that almost 3,000 to 4,730 PFAS have been chemically synthesized and most of them are precursors (Wang, DeWitt, Higgins, & Cousins, 2017), hence a huge number of PFAS are enter into the environment while producing, releasing and emitting. As a result, the aquatic channel of our environment has a great possibility to get contaminated by the frequent uses of PFAS and its precursors. Different analytical techniques such as LC-MS/MS, GC-MS/MS, CE and so on have been introduced for PFAS analysis, but most of them are incapable for identifying their precursors. Therefore, total oxidized precursors assay (TOPA) have been applied for the determination of PFAS precursors in different environmental sources of aquatic, solid and consumable matrices (Houtz & Sedlak, 2012; Ye et al., 2014). In this study, we have introduced TOPA in aquatic sample to analysis PFAS precursors by estimating the amount of concentration, present in the analysed samples under thermolysis process. In addition to confirm and validate the developed assay, an apps based smartphone have been used to check their concentration before and after oxidation.
METHODS Sample Collection Perfluorooctanoic acid (PFOA), phosphate buffer saline (PBS), K2S2O8, NaOH, HCl, EtOAc, acetone and ethyl violet (EV) dye were procured from Sigma-Aldrich (Australia). Water is collected from University of Newcastle, Callaghan campus, Australia. All the experiment was conducted with polypropylene tube and pipette tips. However, Milli-Q water (18.2 MΩ·cm) was used for dilution and cleaning purposes. Dual-Liquid Phase Extraction PFOA was prepared in PBS solution and spiked at three different concentration (200, 100 and 50 ppb) in three different water sample containing tubes, later LPE was conducted according to Fang et al., 2018. The tube was then shacked and kept static for a while, then the top layer in between non aqueous phase have been transferred to another astkCARE reagent containing new tube. After that, results was read with an app based smartphone device. Total Oxidized Precursors Assay (TOPA) TOPA was used in water sample according to Houtz et al., 2012. Briefly, an appropriate amount of K2S208 (66 mM) and NaOH (125 mM) was added to the PFOA spiked water sample. Then, samples were kept at 85ºC for 6h under oxidative reaction. Before adding any astkCARE reagents pH was adjusted in all samples with concentrated HCl and the analysis was done under the reading kit with smartphone.
RESULTS AND DISCUSSION Liquid Phase Extraction (LPE) Extraction method need to apply in order to remove background interference in water sample, which is usually generated from inorganic salt or ion (Fang et al., 2018). Therefore,
W21e
Copyright © CRC CARE Pty. Ltd., 2019
CleanUp Conference 2019Adelaide, Australia
8 –12 September 2019563
Table of Contentsfor this manuscript

we used dual-LPE in PFOA contaminating solution, thus an ion pair interaction was formed by the reaction of cationic dye of ethyl violet and anionic surfactant of PFOA. The result of 200, 100 and 50 ppb of spiked PFOA in water sample and control was obtained from the top layer of ion pair interaction from the non-aqueous phase. Therefore, Figure 1, shows the obtained result from dual-LPE method, which confirm that target compounds are adsorbed, spiked properly and no inorganic interference are present there. Precursors Analysis by TOPA TOPA is used for the quantification of PFAS precursors as any other analytical techniques could not capable to detect them (Ye et al., 2014). Consequently, we have applied TOPA to check the precursors in PFOA spiked water solution. To develop this method, K2S208 and NaOH was added to above concentration of PFOA and the sample was then heated on hot plate for 6h at 85ºC. The samples were neutralized with very small amount of concentrated HCl, after cooling at room temperature. Afterwards, an adjustable amount of astkCARE reagents was added for app test in quantifying PFAS precursors. Different concentration of PFOA including control are observed in water sample before and after oxidative treatment (Figure 1). However, the significance change of concentration is disappeared because no precursors was spiked in the analysed sample, which confirms that PFAS was not converted to PFSAs and PFCAs during the oxidative process (Houtz & Sedlak, 2012). Besides, PFOA containing control (Figure 1) (before and after oxidation) exposed that the perfluoroalkyl acids was stable under this condition. Therefore, our group trying to develop the selectivity test of PFAS in different matrices by the implication of TOPA concept.
Fig. 1. TOPA in water samples spike with different concentration of PFOA before (graph line 1-200 ppb, 2-100 ppb, 3-50 ppb & control) and after oxidation, respectively.
CONCLUSIONS In conclusion, we did not find any significant amount of concentration increases before and after oxidation, which mean no precursors, or the amount of precursors are not high enough compared to the spiked PFOA, in the analysed sample. Hence, TOPA combined with dual-LPE method, which can be performed easily to check precursors through a portable device. In future, it will be applied for selectivity analysis in connection with miniature reading kit in PFAS related research area, because of its simplicity and ease of performance.
REFERENCES Fang, C., Zhang, X., Dong, Z., Wang, L., Megharaj, M., & Naidu, R. (2018). Smartphone app-
based/portable sensor for the detection of fluoro-surfactant PFOA. Chemosphere, 191, 381-388.
Houtz, E. F., & Sedlak, D. L. (2012). Oxidative conversion as a means of detecting precursors to perfluoroalkyl acids in urban runoff. Environmental science & technology, 46(17), 9342-9349.
Wang, Z., DeWitt, J. C., Higgins, C. P., & Cousins, I. T. (2017). A never-ending story of per-and polyfluoroalkyl substances (PFASs)? In: ACS Publications.
Ye, F., Tokumura, M., Islam, M. S., Zushi, Y., Oh, J., & Masunaga, S. (2014). Spatial distribution and importance of potential perfluoroalkyl acid precursors in urban rivers and sewage treatment plant effluent–Case study of Tama River, Japan. Water research, 67, 77-85.
564
Table of Contentsfor this manuscript

BALANCING REGULATORY PFAS QUANTIFICATION WITH EMERGING PFAS IDENTIFICATION USING
LC-MS/MS AND LC-Q/TOF
Tarun Anumol, James Pyke, Hui Zhao, Jerry Zweigenbaum
Agilent Technologies, Stevens Creek Blvd, Santa Clara, 95051, USA [email protected]
INTRODUCTION Per/Polyfluoroalkyl substances (PFAS), are substances that have uniquely desirable properties for use in various industries. However, their wide-ranging use leads to emission into the environment, and as PFAS are persistent and bio-accumulative in the environment and wildlife, they are contaminants of concern. METHODS Traditionally, methods such as USEPA 537 and ASTM 7979 are designed to monitor a small and discrete number of PFAS compounds, thought to be end-products of degradation processes occurring in environmental systems. These methods strive to analyze PFAs at low ng/L levels but can be laborious, time-consuming and limited in scope. However, the total fluorinated compounds in a sample may be underestimated by not monitoring the precursor compounds of which these compounds are formed from. Sample preparation techniques such as the Total Oxidizable Precursor (TOP) Assay attempt to measure the total fluorinated compounds by forcing degradation of precursors into measurable end-products. However, this technique is time consuming and may not degrade all precursors into measurable end-products. Additionally, some countries decided to phase out specific classes of PFAS manufacturing and use, which has led manufactures to find alternative classes of PFAS, leading to new precursors and degradation products being found in environmental samples. RESULTS AND DISCUSSION Identifying PFAS precursors present in an environmental sample may impact decisions in treatment processes at remediation sites and help deduce possible degradation products that could exist in the environment. Consequently, scientists are contributing PFAS to various publicly available databases: growing the list of precursors and degradation by-products, some listing more than 4000 entries. Traditional instruments, such as LC-MS/MS technology, are targeted to quantify commonly monitored PFAS end-products. Without standards, adding more compounds to a LC-MS/MS assay is restrictive and it would be logistically difficult to monitor all possible precursors.LC-Q/TOF technology allows the simultaneous quantification of commonly monitored PFAS whilst acquiring untargeted data that can be screened for suspected PFAS precursors. The nature of the data acquired also allows for retrospective detection of new PFAS as the scientific community learns more about these emerging contaminants. CONCLUSIONS This presentation highlights the use of LC-MS/MS for very low level quantification of regulatory PFAS and untargeted LC-Q/TOF technology used to screen new PFAS without compromised typical targeted analytical requirements such as precision, sensitivity, linear dynamic range and robustness.
W21f
Copyright © CRC CARE Pty. Ltd., 2019
CleanUp Conference 2019Adelaide, Australia
8 –12 September 2019565
Table of Contentsfor this manuscript

BENCH-SCALE EVALUATION OF FLOCCULANT TECHNOLOGY FOR TREATING PFAS-CONTAMINATED WATER
Kent Sorenson1, Charles Schaefer1, Dung Nguyen1, Christopher Higgins2, Sarah Mass2,
Andrew Maizel2, Youn Jeong Choi2
1CDM Smith, Inc., 555 17th Street, Suite 500, Denver, CO 80202, USA 2Department of Civil and Environmental Engineering, Colorado School of Mines,
1500 Illinois St., Golden, CO 80401, USA [email protected]
INTRODUCTION The two most widely used technologies for treatment of per- and polyfluorinated alkyl substances (PFAS) in water are granular activated carbon (GAC) and anion ion exchange resins (AER). While these technologies are reliable for many applications, they become inefficient at high PFAS concentrations, or in complex contaminant mixtures where the lack of specificity of GAC and AER toward PFAS can become problematic. A promising technology developed in Germany for these applications is flocculation and filtration using a patented, biodegradable flocculant called PerfluorAd™. METHODS An independent evaluation of PerfluorAd™ was performed in the U.S. by documenting its performance for PFAS removal at the bench scale for three different contaminated water samples:
• Aqueous film-forming foam (AFFF)-impacted groundwater sample from a U.S. Air Force site
• A landfill leachate sample • A sample of diluted 3M AFFF in water
Each of these samples was subjected to PerfluorAd™ treatment at different doses, with and without ferric chloride to measure removal efficiency. All PFAS analysis was performed at Colorado School of Mines in Dr. Chris Higgins’ laboratory. Target analytes included short- and long-chained perfluoroalkyl acids, and fluorotelomer sulfonates. In addition, several classes of likely precursor compounds were semi-quantitatively assessed as suspect analytes using developed analytical libraries. RESULTS AND DISCUSSION PerfluorAd™ was highly effective for treating PFOS and PFOA (e.g., Figure 1), removing greater than 99% of these from contaminated groundwater and diluted AFFF samples in most cases (the landfill leachate data were not available at the time of abstract submittal, but will be presented). It generally showed greater effectiveness with ferric chloride addition, although ferric chloride by itself showed virtually no PFAS removal. Starting concentrations of PFOS and PFOA were 5,050 μg/L and 428 μg/L, respectively, in the diluted AFFF. In contrast, using an AER at a 100 mg/L dose provide zero statistical removal of PFOS and PFOA from the diluted 3M AFFF sample. This was presumably due to the high loading of AFFF constituents generating a colloids that block or reduce PFAS contact with the AER. It is presumed this phenomenon would inhibit GAC to some extent as well. Treatment of suspect analytes was more variable. PerfluorAd™ was fairly effective for removal of sulfonamides from the contaminated groundwater sample, with concentration decreases ranging from about 65% to greater than 95%. The removal of many of the suspect analytes from the diluted 3M AFFF sample was in a similar range, although in some of these cases, ferric chloride alone provided significant removal as well. Removal of anionic compounds was greater than that of cationic or zwitterionic compounds.
W22a
Copyright © CRC CARE Pty. Ltd., 2019
CleanUp Conference 2019Adelaide, Australia8 –12 September 2019 566
Table of Contentsfor this manuscript

(a) (b)
Fig. 1. PerfluorAd™ and AER removal of PFOA (a) and PFOS (b) from the 3M AFFF-spiked water samples. CONCLUSIONS An independent evaluation of the performance of PerfluorAd™ for removal of PFAS at high concentrations from multiple water types via flocculation and filtration demonstrated high removal efficiency, consistent with previous demonstrations in Europe. This technology appears promising for applications involving high concentrations of PFAS in water, or in water contaminated by a complex mixture of contaminants that reduces the efficiency of GAC or AER. An analysis of the relative cost-effectiveness of PerfluorAd™ to GAC and AER is currently underway based on these and other data, and an overview of that analysis will be presented.
0
0.2
0.4
0.6
0.8
1
1.2
0/150 100/150 500/150 1000/0 1000/150 AER
PFO
A C
once
ntra
tion
in W
ater
(C
/C0)
PerfluorAd Dose/ Ferric Iron Dose (mg/L)
0.01
0.1
1
10
0/150 100/150 500/150 1000/0 1000/150 AER
PFO
S Co
ncen
trat
ion
in W
ater
(C
/C0)
PerfluorAd Dose/ Ferric Iron Dose (mg/L)
567
Table of Contentsfor this manuscript
QUICK & DIRTY? MOBILITY OF PFAS IN GROUND AND SURFACE WATER — A FOUR SITE CASE STUDY
Christopher Sandiford1, Bradly Clarke2
1Senversa Pty Ltd, L6, 15 William Street, Melbourne, AUSTRALIA
2RMIT University, AUSTRALIA [email protected], [email protected]
INTRODUCTION AND BACKGROUND Per‐ and polyfluoroalkyl substances (PFAS) are fluorinated compounds and the active ingredient in aqueous film‐forming foam (AFFF) used across a range of industries and activities. Due to composition of AFFF formulations changing over the years, together with different preferences based on military specifications or product availability, a highly variable cocktail of PFAS have been identified at sites across Australia. The draft PFAS National Environmental Management Plan (NEMP) 2.0 has provided human health criteria for PFOS, PFOA and to a lesser extent PFHxS, together with criteria protective of ecosystems for PFOS and PFOA. However, assessment of risk to human health and the environment of the estimated thousands of other identified PFAS is limited. Part of the assessment of risk posed by PFAS relates to their mobility and persistence in the environment. The most common PFAS (perfluoroalkyl acids; PFAAs) are composed of a fully fluorinated carbon chains (Per-) with an acidic functional group, such as carboxylic acid (PFCAs) or sulfonates (PFSAs). PFAAs display both hydrophobic and hydrophilic properties and while a variety of environmental parameters will affect the fate of PFAAs (such as pH), the most significant driver is hydrophobic interactions between the fluorinated tail and the organic matter present in soil and water. The strength of the interactions will increase with increasing fluorinated chain length and PFSAs will bind more strongly compared to the similar chain length PFCA. METHOD In this study the mobility characteristics of 28 PFAS analytes from three chemical classes (PFCAs, PFSA, FTS) were assessed in groundwater and surface water at four sites where PFAS contamination associated with AFFF use had been identified. The methodology involved the collection of soil, sediment, groundwater and surface water samples from known PFAS primary source areas and then at measured distances (up to 3km) down-hydraulic gradient from the primary source. Samples were collected in line with guidance provided in the PFAS NEMP 2.0 and were then analysed using standard PFAS analytical methods at NATA accredited laboratories. In order to assess a range of PFAS cocktails in different environments, samples were collected from four different industrial sites: an airport; an energy generating site; a defence force base; and a fire training facility. The sites consisted of four different geologies, aquifer systems with variable groundwater discharge zones and included both natural and man-made surface water migration pathways. All sites are discussed in general terms to protect their identity. Following review of the analytical results, percentage ratios of the 28 PFAS against the total sum of PFAS were calculated at the primary source zone (source zone PFAS ratio) and at measured distances away from the primary source zone. The change in ratio vs distance from the primary source zone was then plotted on a scatter graph for each of the 28 PFAS. Lines of best fit and r2 values were then derived for the 28 PFAS to ascertain whether the relative mobility of each PFAS analyte was consistently higher or lower than the mean PFAS mobility.
W22b
Copyright © CRC CARE Pty. Ltd., 2019
CleanUp Conference 2019Adelaide, Australia8 –12 September 2019 568
Table of Contentsfor this manuscript

RESULTS & DISCUSSION Consistently increasing ratios with increased distance away from the source zone across the varying geologies and AFFF sources were identified for multiple PFAS analytes. This suggests that the chemical properties of PFAS has impacted their mobility. PFAS that were identified to have a consistently higher relative mobility included shorter chain (C6) PFAS (PFHxS and Perfluorohexanoic acid (PFHxA)). PFOS was found to have significantly lower a relative mobility in groundwater and to a lesser extent in surface water than all other PFAS, while the mobility of PFOA was found to be relatively consistent with the mean of the 28 PFAS assessed. The available organic carbon content of the geological unit the PFAS was moving through (within ground or surface water) also appeared to significantly affect the mobility of PFAS and at times magnified the differences in the relative mobility of the 28 PFAS. CONCLUSIONS The relative mobility of PFHxS was found to be greater than the average PFAS and significantly greater that PFOS, which was found to have a relatively low mobility when compared to other PFAS. Due to this increased relatively mobility, further conservatism should be considered when assessing risk to receptors and determining remediation criteria for shorter chain (C6) PFAS like PFHxS. In some jurisdictions PFHxS is reported to have similar toxicity to PFOS and should be scrutinised further. This study demonstrates that PFHxS will migrate off-site from contaminated areas quicker and further than PFOS and therefore may pose a greater risk to human health and environmental receptors. The site specific mobility and relatively abundance of individual PFAS should be incorporated into a sites conceptual site model to ensure the risk posed by PFAS can be more accurately estimated.
569
Table of Contentsfor this manuscript

LOGISTICAL CHALLENGES TRANSPORTING PFAS IMPACTED SOILS FROM A
REMOTE LOCATION TO VICTORIA FOR THERMAL TREATMENT
Andrew Thomas
Enviropacific Services Pty Ltd, 1392 Kingsford Smith Drive, Pinkenba, Brisbane, 4008, AUSTRALIA
INTRODUCTION Enviropacific Services Pty Ltd (Enviropacific) are in the process of being awarded the management of a large volume of PFAS impacted soils from a site in a remote location and transporting it to our thermal treatment facility (SOLVE) in Altona, Victoria for destruction. Various transport options are currently being considered and will be confirmed in the coming month or so. FOCUS OF PRESENTATION Our presentation will aim to focus on a range of issues as outlined briefly below. Project Drivers The presentation will commence on outlining what the key project drivers were which informed the approach taken. Transport Options Assessment The presentation will then cover the various transport options considered, the pros and cons of each, then describe the final solution in detail. Logistical Challenges and Minimising Risk Establishing Raw Water Quality The presentation will focus on the actual logistical challenges encountered with the selected option and measures undertaken to reduce overall risk to the client and the surrounding environment. Treatment Performance We will then summarise the treatment performance overall, average throughputs and variables that impacted on throughput, final PFAS concentrations in the soil, air emissions and the end uses of the soil product. Stakeholder Engagement We will also focus on stakeholder engagement and relationship building undertaken throughout the project. CONCLUSIONS Summary of What Worked and Considerations for Future Projects This will aim to summarise the issues outlined in the above sections and the associated lessons learnt and solutions found on this project that may be worth considering for future projects involving thermal treatment of PFAS soils and also associated transport logistics.
W22c
Copyright © CRC CARE Pty. Ltd., 2019
CleanUp Conference 2019Adelaide, Australia8 –12 September 2019 570
Table of Contentsfor this manuscript

A NOVEL APPROACH TO PRIORITISING PFAS SOURCE ZONES FOR REMEDIAL ACTION USING A
BROAD SCALE MASS CONTRIBUTION ASSESSMENT
Gemma Wakefield, Rachael Wall, Jonathan Medd, Ken De Greene
Golder Associates Pty Ltd, Building 7, Botanicca Corporate Park 570-588 Swan St, Richmond, 3121, AUSTRALIA
INTRODUCTION At an increasing number of per- and poly-fluoroalkyl substances (PFAS) investigation sites, the migration of PFAS via surface water runoff is being considered the key contamination transport mechanism driving risk. On large sites with multiple source areas, traditional approaches to characterising sources such as extensive soil and sediment sampling programs can be timely, disruptive to site operations and costly, and do not provide a direct measure of the impact that each source is contributing to surface water. As such, there is a need to develop cost effective and timely approaches to characterise PFAS sources to stormwater runoff. We present a risk based strategic approach that considers the mass contribution of sources to surface water, allowing for remediation and management actions to be focused on areas that will have the most potential for source reduction. Specific results have not been provided due to the sensitivity of the project. THE STRATEGIC APPROACH The approach included: • Source Mass Contribution
Site interviews and a review of site history was undertaken to understand the events and locations where PFAS containing foams were released. A detailed review of the site surface water drainage system was performed to characterise the drainage catchments and optimise the sampling locations. Based on this, a surface water sampling approach was designed where over 80 hydrasleeve™ surface water samplers were installed in the surface water drainage network (box drains, pits and swale drains) to capture the first flush of rainfall runoff from each of the site catchments and potential source zones within catchments. The concentration of PFAS from the surface water samples was converted to a relative annual mass contribution based the estimation of volume released during a fire training event or the estimation of annual rainfall runoff.
• Source Mitigation Prioritisation The catchments and fire training events where PFAS was released into the environment were prioritised using a risk based approach, taking into consideration the significance of the source, based on the PFAS mass contribution per annum and the likelihood of risk, based on the potential for exposure to workers at the site or the environment beyond the site boundary.
• Detailed Source Characterisation The sources identified as moderate - high priority were further characterised to enhance the resolution of the source area and inform remediation decision making. This detailed investigation included the analysis of concrete soil, sediment and surface water samples.
RESULTS Samples were retrieved following a 7 mm rainfall event. 80% of hydrasleeve™ surface water samplers filled with rainfall runoff. A schematic demonstrating the estimated mass contribution of each catchment is presented in Figure 1. This exercise provided an indication of which sources and catchments had a significant mass contribution to surface water impacts and identified new source areas where foam concentrate tanks had not been cleaned adequately and foam had been released outside of known fire training areas. A risk-
W22d
Copyright © CRC CARE Pty. Ltd., 2019
CleanUp Conference 2019Adelaide, Australia
8 –12 September 2019571
Table of Contentsfor this manuscript

prioritised list of sources was then developed taking into consideration the human health and environmental exposure and the mass contribution of the source zones to surface water.
Fig. 1. Source Mass Contribution Schematic (note this is a schematic illustration and does not represent the actual site)
CONCLUSION A mass contribution sampling method coupled with a risk-based source prioritisation approach has been presented. This approach has been effective in assessing sources to optimise remediation on complex PFAS investigation sites with multiple source areas, without having to undertake lengthy soil sampling programs. With repeated source contribution sampling programmes performed throughout the remediation process, this approach can be used to support the communication of progress, performance and approach to clean-up to stakeholders.
7
2
4
4
1
3
5
4
6
Sub-catchment Drainage line Sample point
1 Wastewater Pond 2 Tank Farm
3 Foam Tank 4 Tank
5 Fire Truck Training Area 6 Fire Training Area
Relative mass contribution (g/year)
<10 10-100 100-1000 1000-10,000 >10,000
Legend
7 Historic Fire
Features
572
Table of Contentsfor this manuscript

DERIVATION AND SELECTION OF AQUATIC PFOS SCREENING LEVELS FOR SITE INVESTIGATIONS
Heather A Lanza, Kylie Dodd, Peter Nadebaum, Jill Woodworth
GHD Pty Ltd, 180 Lonsdale Street, Melbourne, 3000, AUSTRALIA
Australia has been at the forefront of per- and poly-fluoroalkyl substances (PFAS) investigations over the last several years, setting an example for future investigations both nationally and internationally. The regulatory atmosphere has continued to evolve, with the PFAS National Environmental Management Plan (NEMP) 2.0 under consultation. Of particular contention in Australia is the derivation and recommendations associated with the screening levels protective of aquatic ecological receptors. For the purposes of this presentation, focus has been given to perfluorooctane sulfonate (PFOS) as it is the most well understood PFAS from a toxicological perspective, is the most frequently encountered PFAS in Australian environmental samples, and represents the predominant risk driver in environmental investigations (in relation to perfluorooctanoic acid [PFOA], for example). The screening levels have been derived via a species sensitivity distribution (SSD) approach. However, uncertainties and inconsistencies reported in laboratory trials (such as limited dose-response effects and potential for confounding factors) means that statistical power is reduced at very low concentrations, and this results in a high level of uncertainty in the values derived for 95% and particularly the 99% species protection levels. At the 99% species protection level, effectively any detection of PFOS represents an exceedance of the screening level, and the ubiquitous nature of PFOS is such that detections are often observed irrespective of whether they are the result of defined sources, or more likely, are associated with ambient ill-defined background concentrations. This issue extends to the marine environment, where current guidance recommends use of the derived freshwater values, despite PFOS being less soluble, and therefore less bioavailable and less likely to accumulate in marine aquatic receptors. This presentation will provide an overview of the derivation of PFOS screening levels applicable to the aquatic environment (as of July 2019), the limited toxicity information currently available, and the uncertainties and limitations that apply in the use of such values. Commentary will be provided on the practical use of these levels in view of the uncertainties inherent in their derivation, and how decisions can be made as to the level of risk that measured PFOS concentrations pose using a multiple lines of evidence approach. In particular, consideration will be given to the level of protection that is afforded when PFOS is present at detectable concentrations (and hence exceed the screening levels), the potential for distinguishable effects, the nature of these effects, and the potential for and significance of bioaccumulation. Other issues that can be relevant in practical field situations will also be considered, such as temporal and spatial variability in the measured concentrations, the significance of detections in ephemeral surface waters, the extent of dilution and mixing zones, the assumptions inherent in assessing dietary exposure of predators, the nature of effects and the potential for these effects to occur. Often the outcome of such assessments will be some residual uncertainty, and discussion will be provided as to whether there should be further more detailed sampling and analysis of waters and biota followed by an ecological risk assessment, or whether uncertainty can be effectively managed by a simpler ongoing monitoring program.
W22e
Copyright © CRC CARE Pty. Ltd., 2019
CleanUp Conference 2019Adelaide, Australia
8 –12 September 2019573
Table of Contentsfor this manuscript

DOES AGRICULTURAL LAND CONTAMINATED BY PFAS NEED MANAGEMENT?
Antti Mikkonen1, Jen Martin2, Robert McKenzie2, Roger Drew3, Clare Death4,
David Champness4, Michael Roberts1
1University of South Australia, School of Pharmacy and Medical Science, City East Campus, North Terrace, Playford Building, Adelaide SA, 5000, AUSTRALIA
2Environment Protection Authority Victoria, 200 Victoria St., Carlton VIC 3053, AUSTRALIA 3ToxConsult Pty Ltd, Darling South, VIC 3145, AUSTRALIA
4Agriculture Victoria, 475 Mickleham Road, Attwood, VIC 3049, AUSTRALIA [email protected]
INTRODUCTION Some land uses, such as agriculture, may be precluded by the presence of contamination. Typically, land use suitability is assessed in combination with risk assessment and comparison of pollutant concentrations to trigger levels or tolerable daily intakes. However, this type of assessment can be difficult for substances with bioaccumulation potential, as is the case for per- and polyfluoroalkyl substances (PFAS), as predictions do not correspond with measured concentrations. The discrepancies between estimated and measured concentrations have posed challenges in balancing the assessment and management of risk to consumers of livestock produce with proportionate environmental interventions on farming land. This is a problem for regulators around the world. One of the reasons why PFAS residue predictions for cattle are difficult is that there is very little research on PFAS-exposed livestock. Recognising this, Environment Protection Authority Victoria (EPA), in partnership with Agriculture Victoria, and the Victorian Department of Health and Human Services, have provided support and funding for research on PFAS-exposed livestock. This presentation relates to one of the projects funded by EPA and coordinated by the University of South Australia (with input from US FDA and Australian experts): the development of residue distribution and elimination models for cattle. This project aims to address some of the existing data-gaps to facilitate human health risk assessment and aid in the development of practical management frameworks for food production animals and land/water resources contaminated with PFAS. This presentation will discuss:
• Why food production animals need more consideration as a source for human PFAS exposure
• What are some of the challenges in estimating residue accumulation in food production animals
• How we might be able to improve upon current estimation methods. APPROACH Data review Due to their physical and chemical properties (highly stable and mobile), PFAS are continually redistributed in the environment (Sepulvado et al. 2011; Vedagiri et al. 2018; Szabo et al. 2018). This is evidenced by the measurement of perfluorooctanesulfonic acid (PFOS) and perfluorooctanoic acid (PFOA) in Australian waste water treatment facilities in both influent streams and effluents (including biosolids) over a decade after their phase out (Gallen et al. 2018). The persistence and mobility of PFAS also facilitates their entry into the food chain. Meat, dairy and egg products were listed as important contributors to chronic PFAS human exposure in the European Commission’s (EFSA 2018) dietary exposure assessment of over 20,000 analytical results. In Victoria, PFAS contamination in rural
W22f
Copyright © CRC CARE Pty. Ltd., 2019
CleanUp Conference 2019Adelaide, Australia8 –12 September 2019 574
Table of Contentsfor this manuscript

agricultural areas has been largely associated with fire training activities at fire authority facilities, Department of Defence sites and airports. Livestock have been assessed at a number of sites across Victoria where PFAS contamination has been identified in stock water, soil and grass. The current dataset consists of >100 head of cattle and >70 sheep. This dataset will be used to investigate whether trends exist between the exposed animals, environmental variables and contaminants. Model review The risk assessment models currently used to estimate PFAS bioaccumulation in the food chain are static, only providing a result for one point in time (for a defined intake and set of animal parameters). As such, it is difficult to validate these types of risk assessment models with data. In reality, PFAS residues accumulate over time, based on a varied intake depending on stock rotation and environmental variability. The available information on PFAS half-lives would suggest that cattle continue to accumulate certain residues like PFOS over months and (potentially) years. Some of the questions this research seeks to clarify is: how long it takes to reach steady state; if different compounds reach a steady state at a different rate; and how to model accumulation over time. Another limitation of modelling PFAS residues in cattle is the lack of biological and behavioural data. This collaborative research program seeks to clarify which animal behaviours need further consideration and how to best address these in modelling terms. Other related studies in progress As part of this project further studies are underway to:
• Determine critical biological parameters needed to model PFAS distribution and elimination
• Review animal behaviour and rotation patterns which could be incorporated for stochastic exposure modelling
• Develop pharmacokinetic models for residue distribution and elimination. DISCUSSION This presentation will provide insights into:
• How consumer risk assessments might be improved for meat products derived from PFAS exposed livestock.
• What the biomonitoring dataset tells us • Trends shown by pairing environmental data with the biomonitoring dataset • PFAS residue elimination model development.
REFERENCES Gallen, Eaglesham, Drage, Nguyen, and Mueller (2018). A Mass Estimate of Perfluoroalkyl
Substance (PFAS) Release from Australian Wastewater Treatment Plants. Chemosphere 208 (2018): 975–83.
EFSA (2018). Risk to human health related to the presence of perfluorooctane sulfonic acid and perfluorooctanoic acid in food. EFSA Panel on Contaminants in the Food Chain (CONTAM). doi: 10.2903/j.efsa.2018.5194
Sepulvado JG et al (2011) Occurrence and fate of perfluorochemicals in soil following the land application of municipal biosolids. Environmental Science & Technology, 45(19), 8106–8112.
Szabo, Coggan, Robson, Currell, and Clarke (2018). "Investigating Recycled Water Use as a Diffuse Source of Per- and Polyfluoroalkyl Substances (PFASs) to Groundwater in Melbourne, Australia." Science of the Total Environment 644 (2018): 1409–417.
Vedagiri, Usha K., Richard H. Anderson, Heather M. Loso, and Catherine M. Schwach (2018). "Ambient Levels of PFOS and PFOA in Multiple Environmental Media." Remediation Journal 28.2 (2018): 9–51.
575
Table of Contentsfor this manuscript

OPTIMISATION OF INTEGRATED AND ADAPTIVE REMEDIATION DESIGN AND OPERATIONS SCHEDULING
Larry M. Deschaine, Metin Ozbek
HydroGeoLogic, Inc., 11107 Sunset Hills Road, Suite 400, Reston, VA 20190, USA
INTRODUCTION Those responsible for managing or remediating chemical or radionuclide impacted sediments, soils, surface or groundwater including designing remedial solutions and operation projects benefit from tools that help them find acceptable, efficient and effective solutions to complex and multi-faceted planning challenges at efficient cost points. However, the more challenging sites remain resistant to efficient and effective remediation. These are precisely the environmental problems that remain as persistent fiscal and technological challenges as the success of the heuristic trial-and-error approach or using simplified conceptual site models is underpowered in this problem arena. The tools herein enable formal, physically consistent and robust analysis of optimal remedial designs for environmental contamination problems using groundwater pump and treat and in-situ bioremediation technologies of any level of complexity including formal evaluation of uncertainty in design performance. Moreover, these tools automatically adapt the remediation system and its operations to the plume as it undergoes the remediation processes. During remediation the plumes change in shape and intensity, hence optimal and automated adaptive application of the remediation processes over time allows for improved fiscal and resource planning when considering and comparing costs, benefits and implementability between differing feasible approaches for achieving site clean-up. METHODS This paper discusses and demonstrates a technology used for optimally designing and managing environmental remediation projects and programs by optimizing the remediation design and its implementation from initiation to remedy complete. This is accomplished by automatically and intelligently designing and adapting the remediation system to the shrinking plume as its being remediated and hence, changing in shape and intensity. This unified and universal optimisation algorithm is deployed (Deschaine, 2003, 2014) in the Physics-based Management Optimization PBMOTM system (Deschaine, 2016). This optimization algorithm is successfully deployed on environmental and radionuclide impacted sites across a variety of computational environments including the high-performance elastic Cloud-based computing platforms and has received multiple awards from the American Academy of Environmental Engineers and Scientists (AAEES, 2017a, b). To develop an optimal project design involves the selection of the appropriate combination of technology solution options, including the ability for mixing and matching various remedial approaches (Deschaine, et. al., 2013). To implement the analysis, one defines:
• Physics-based model: Select proper descriptive model or model set that adequately describes the system to be optimized
• Management objectives: Select optimization objective (e.g. minimize time or cost, maximize mass removal or destruction) and constraints such as remediation goals, operational parameters of the candidate remediation technologies, maximum total and annual funding limits, management and stakeholder input.
• Optimisation: Select the applicable optimisation method(s) for the problem type. Optimisation is accomplished by running 100s or thousands of candidate solutions models using the massively parallel and scalable optimal search strategy. This newly extended method for adaptively scaling the remediation approach to the shrinking plume size combined with the computational power provide scalable and unsurpassed speed for determining optimal solutions. Hence, the integrated parallel simulation and optimization
W23a
Copyright © CRC CARE Pty. Ltd., 2019
CleanUp Conference 2019Adelaide, Australia8 –12 September 2019 576
Table of Contentsfor this manuscript

methods use the breadth and depth search approach; iteratively producing sets of candidate solutions evaluated concurrently instead of the previous and widely used sequential approach (i.e. one model evaluation at a time). Globally optimal solutions are regularly found 100 to 1,000 times or more (wall-clock time) faster than other currently available methods. This optimisation approach has also solved highly mixed-integer non-linear problems (MINLP) with over 4,000 decision variables and over 2 million constraints. The process also formally integrates the stakeholder input into the analysis and provides not only the mathematical "optimal solution" but also "what-if" capability that includes management override control on remedial design analysis. This approach integrates these elements into a single decision framework that is tractable, traceable, and defensible. This solution methodology represents a significant improvement over the non-optimal and labour-intensive heuristic “trial and error” approaches to developing environmental response(s). RESULTS AND DISCUSSION The technology is discussed first followed by four real-world examples. These are provided to demonstrate the robustness, effectiveness of the optimization method by documenting the ability to provide an optimal solution that is 1) better and faster than previous methods, 2) ability to solve problems with thousands of decision variables and millions of constraints and 3) to solve highly non-linear flow systems with deep drawdown due to mine dewatering. Example 1: Automated Adaptive Remediation Design Optimisation Technology Technology discussion of technologies including the physically based process models, methods to generate simulation models from data, global optimization methods, automated method to adapt remediation operations over time to match shrinking plume configurations, and massively parallel Cloud based deployments. Remediation technologies discussed include groundwater extraction and treatment (GETS) and in-situ bioremediation (ISB), which are generally applicable to many remediation challenges. Example 2: Fort Ord, CA Fort Ord is a former U.S. Army base encompassing more than 28,000 acres in Monterey County, California. Closed by Congress in 1994, the base has been undergoing clean-up with oversight by federal and state regulatory agencies. In December 2003, HGL was contracted by the U.S. Army Corps of Engineers to conduct a Performance-Based Remediation with the objective of Site Closure at Operable Unit (OU)-1. HGL's optimized site exit strategy achieved remedial-action completion in 2014 and obtained regulatory concurrence in 2016, ahead of schedule and below estimated cost. Example 3: Superfund Site, NE Optimal remedy design for a large chlorinated solvent plume. The problem involved minimizing total life cycle costs, including those for the initial remedy installation, operation and maintenance, and sampling. This problem was enormous and complex, with 4,514 decision variables and over 2 million constraints. A flow and transport model with over one million grid cells described the contaminant migration through a complex aquifer system. Example 4: Iron Ore Mine, Western Australia Dewatering strategy design for two adjacent iron-ore lenses at an open- pit mine in Australia. The problem was complex, with 113 decision variables and 178 constraints. Additionally, the model used was a non-linear variably saturated flow model with over 200,000 grid cells. CONCLUSIONS The PBMOTM methodology with intelligent design and adaptive operations optimization is peer-reviewed, awarded, tested, verified, validated and documented using a broad range of industrial projects, with three examples shown. Results indicate that it meets or exceeds the
577
Table of Contentsfor this manuscript

best available solution either in use, proposed by the subject matter experts, or developed by other optimization methods. Managers can inform the remediation program analysts regarding ranges for installation and annual operating costs as well as desired remediation time frames and PBMOTM will provide a set of solutions that meet these objectives, if feasible. If no solution that is feasible can be founds, since PBMOTM provides the information on all the candidates tested, the solutions that are closest to the remediation goals are presented. This new intelligent, adaptive method now allows for the optimization of remedial designs for the more complicated problems which include thousands of decision variables and millions of constraints and when the operations need to adapt to changing site conditions. These are precisely the environmental problems that remain in the environmental contamination site portfolio as persistent challenges. The optimal design and implementation of environmental challenge response are now computationally tractable, practical and viable. REFERENCES American Academy of Environmental Engineers and Scientists (AAEES, 2017a). 2017
Excellence in Environmental Engineering and Scienceâ„¢ Competition Winner " E3S Grand Prize in Research. Physics-Based Management Optimization Technology for Supporting Environmental and Water Resource Management. Deschaine LM and Guvanasen V. http://www.aaees.org/e3scompetition-winners-2017gp-research.php
(AAEES, 2017b) __ibid. Innovative Approach for Implementing Performance-Based Remediation Projects (http://www.aaees.org/e3scompetition-winners-2017gp-smallprojects.php
Deschaine, L. M. (2016) Numerical Simulation and Optimization of Environmental Treatment Design Using Parallel Computational Methods: Theory and Application. AIChE Annual Meeting, November 13 - 18, San Francisco. https://aiche.confex.com/aiche/2016/web program/Paper471994.html
Deschaine, L. M. (2014). Decision support for complex planning challenges. Ph.D. Dissertation, Chalmers University of Technology, Göteborg, Sweden. 233p.
Deschaine, L. M., Lillys, T. P., & Pintér, J. D. (2013). Groundwater remediation design using physics-based flow, transport, and optimization technologies. Environmental Systems Research, 2(1), 1-21. http://www.environmentalsystemsresearch.com/content/pdf/2193-2697-2-6.pdf
Deschaine LM. (2003) Simulation and Optimization of Large Scale Subsurface Environmental Impacts; Investigations, Remedial Design, and Long-Term Monitoring. Journal of Mathematical Machines and Systems, Kiev. Number 3,4. Pages 201-218
578
Table of Contentsfor this manuscript

ADVANCES IN HORIZONTAL REMEDIATION WELLS: THE HRX WELL
Dan Ombalski1, Michael Lubrecht1, Craig Divine2
1Ellingson-DTD, 100 Rolling Ridge Drive, Bellefonte, PA 16823 USA
2Arcadis, 320 Commerce, Suite 200, Irvine, CA, 92692 USA [email protected]
INTRODUCTION Horizontal directional drilling has been used for the installation of “horizontal” wells for environmental remediation in the United States since the late 1980s. In general, if a specific type of remediation has been implemented using vertical wells, there is an analog using horizontal wells. Examples can be found for injection, extraction, thermal remediation, and in-situ chemical oxidation or reduction. The fundamental difference between most horizontal and vertical remediation wells is the length of well screen. This can be an advantage as the significantly greater amount of screen in a horizontal well allows for:
• Greater contact with the contaminant zone since most plumes are more laterally extensive than they are thick
• Continuous communication through the contaminant zone in the horizontal plane Since many contaminant plumes tend to be long and thin extending in the direction of groundwater flow, it is tempting to orient horizontal wells along the long axis of the plume. However, by placing a horizontal well parallel with the direction of groundwater flow, a preferential pathway is created that can accelerate the migration of the contaminant from the beginning of the plume where groundwater elevations are highest, directly to the end of the plume, where groundwater levels are lower. It was the evaluation of this accelerated groundwater flow that led to the theory, testing, and installation of the Horizontal Reactive Media Treatment Well (HRX Well®) concept, a Green and Sustainable Remediation (GSR) method to treat groundwater contamination. THE HRX WELL The Horizontal Reactive Media Treatment Well (HRX Well®) utilizes directionally drilled horizontal wells filled with reactive media to passively treat contaminated groundwater in-situ. The relatively large-diameter horizontal wells are installed parallel to the direction of groundwater flow. The well has two screened sections connected by a length of casing, one screen at the start of the horizontally oriented section, and one at the end. Groundwater enters the well through the initial screen section, travels through the cased section, and exits the well through the ending screen section – driven by the difference in groundwater elevation at the starting and ending screens. The section of HRX well casing that connects the entry and exit screens is filled with reactive media specifically engineered to: 1) treat the groundwater contamination by approprieate reagent and residence time selection, and 2) maintain a hydraulic conductivity higher than the surrounding soils. Many different types of solid reactive media are already available (e.g., zero valent iron [ZVI], granular activated carbon (GAC), biodegradable particulate organic matter, chiton, ion exchange resins, zeolite, apatite, etc. Unique media cartridges have been designed to allow placement and removal of media into the cased section of the wells. Therefore, this concept can be used to address a wide range of reactive media and contaminants. The HRX Well requires no above-ground treatment, or footprint, consumes no electricity, and requires limited ongoing maintenance.
W23b
Copyright © CRC CARE Pty. Ltd., 2019
CleanUp Conference 2019Adelaide, Australia
8 –12 September 2019579
Table of Contentsfor this manuscript

TESTING Laboratory and computer modeling demonstrated that with enough contrast in hydraulic conductivity between the well and the ambient aquifer, there is passive capture, treatment, and discharge back to the aquifer of proportionally large volumes of groundwater. The testing indicated capture and treatment widths of up to tens of feet can be achieved for many aquifer settings, and reductions in down-gradient concentrations and contaminant mass flux are nearly immediate. Pilot-scale tests in a controlled setting further supported the concept. A focused feasibility evaluation and alternatives analysis has shown the potential cost and sustainability advantages of the HRX Well compared to groundwater extraction and treatment systems (GETS) or funnel and gate permeable reactive barrier (PRB) technologies for long-term plume treatment. IMPLEMENTATION The first full scale installation of an HRX Well was completed during the summer of 2018 at Vandenburg Air Force Base in coastal California. The directionally drilled well was 172 m in length, installed approximately 6-7 m below ground, and has screen and casing diameter of 30 cm. The well trends beneath a road and along the axis of a groundwater contaminant plume. The installation of the well was completed on August 3, 2018 and the reactive media cartridges were placed by August 11, 2018. Attached to either end of the media cartridges are a set of monitoring cartridges that contain Point Velocity Probes (PVPs). These probes are used to measure the groundwater velocity as it moves through the cartridges. Additional pump testing of the well and aquifer was completed in April of 2019. RESULTS AND DISCUSSION Performance data collected during the fall of 2018 indicated effective remedial treatment of captured water, however, the capture zone for the well was not as wide as anticipated from modelling. Analysis of the as-built design revealed that, although the media cartridges were capturing nearly all flow through the well, some groundwater was likely bypassing the in-situ PVP monitoring cartridges. The April 2019 field testing indicated multiple things:
• There was bypass of the PVPs • The treatment zone of the HRX Well could be increased by increasing the local
hydraulic gradient by pumping captured groundwater through the cartridges and to the downgradient end of the well.
• A modification to the seals on the monitoring cartridges resulted in measurement of the full groundwater velocity through the well.
The results of performance monitoring indicate the HRX well is capturing contaminated groundwater from a zone estimated at over 21 m wide in passive mode (with no pumping) and exceeding 33 m when flow is augmented by low flow pumping CONCLUSIONS The HRX Well is an effective use of directionally drilled well geometry that allows the passive treatment of groundwater contamination. There are two equally important parts to the successful design and installation of an HRX well, the site selection and the well design.
580
Table of Contentsfor this manuscript

ISCO IN AUSTRALIA: WHAT IS THE STATE OF THE ART?
Denton Mauldin
Kleinfelder Australia Pty Ltd, Sydney, AUSTRALIA [email protected]
INTRODUCTION In-situ chemical oxidation (ISCO) has been widely used in Australia for the last decade. ISCO can be an effective remediation technology for the destruction of organic contamination in the aqueous phase. The use of ISCO has become more mainstream as the technology has gained more popularity and the risks of implementation have become better understood. More and more companies are implementing ISCO but is the technology being applied effectively? This presentation provides an update of the use of ISCO in Australia and demonstrates how state-of-the-art application approaches can be used to effectively remediate organic contamination in both soil and groundwater. PRINCIPALS OF ISCO The presentation will demonstrate the importance of understanding the basics of designing and implementing ISCO and how incomplete design considerations can negatively affect the outcome of this approach. The following concepts will be explored:
• Patents and intellectual property (IP) – Many ISCO technologies and of certain chemicals are governed by patents and/or royalty requirements. For example, the use of sodium persulfate for the purpose of soil and groundwater remediation requires that the practitioner purchase sodium persulfate from Peroxychem or it’s agent. There are cases of practitioners not knowing about the patent issues, which violates international agreements and puts the practitioner at an unfair advantage compared to law-abiding practitioners. Other IP issues are related to the use of proprietary equipment, application approaches, and the use of solubilizing substrates;
• Bench- and Pilot-Trials – There is a wide variety of practices for developing a full-scale remedial approach. Bench studies can be performed to develop site-specific dosing requirements to minimise chemical costs and to create the most effective application. Pilot studies can help the practitioner better understand hydrogeologic properties of the site which creates a better understanding of the application rates and radius of influence of a remediation well. Both steps provide an optimized application of the technology and a greater opportunity for success;
• State of contaminant mass – In the case of petroleum hydrocarbons (and to a lesser extent chlorinated hydrocarbons) a significant quantity of mass exists sorbed to the soil, such that an equilibrium between sorbed mass concentrations and dissolved phase concentrations exist in the subsurface with a majority of the mass sorbed to the soil. If sorbed mass is not removed or reduced, then practitioners will create the need to re-inject to account for the newly created dissolved contamination caused by the restoration of the equilibrium between the sorbed and dissolved phases. A practitioner cannot simply add more oxidant to address sorbed mass because non-aqueous mass is dielectric and cannot be oxidised but will remain a source of dissolved concentrations;
• Oxidant estimates – Some practitioners rely on chemical manufacturers to develop chemical quantities, which can grossly over-estimate chemical costs. In the case of sodium persulfate, an upper concentration limit exists where application above the limit creates unused oxidant; and
• Activation and re-activation of oxidants – In the cases of catalysed hydrogen peroxide (CHP) and sodium persulfate, proper activation plays a key role in the implementation of ISCO. A lack of understanding about activation of the oxidant leads to less than
W23c
Copyright © CRC CARE Pty. Ltd., 2019
CleanUp Conference 2019Adelaide, Australia
8 –12 September 2019581
Table of Contentsfor this manuscript

optimum oxidation and ultimately a waste of money. By not clearly understanding the basic implementation parameters above, an ISCO project may require re-activation.
ISCO ENHANCEMENTS The presentation will address the following enhancements:
• Vapour recovery (to address off-gassing) – The use of vapour recovery systems is important when solvents are not used to liberate sorbed contaminant mass, which removes a future source of groundwater contamination. Also, off-gassing is a by-product of ISCO application in the case of CHP. Hydrogen peroxide dissolved in water will expand at a volume ratio of 200 to 1 (meaning that 1 litre of hydrogen peroxide solution will off-gas 200 litres of oxygen);
• Injection pressure limits – ISCO practitioners typically “feel the pressure” of completing a project and succumb to the perceived advantage of increasing injection pressures to increase injection rates. However, overburden pressures can be overcome by as little as 60 kilopascals. When the overburden pressure is exceeded the formation is in-effect blocked. A careful monitoring program will ensure that the injection event is successful; and
• Surfactants/Solvents – The use of surfactants and solvents have gained popularity by the marketing and patenting of the technology that relies on the use of these chemicals in conjunction with ISCO. The use of surfactants is required to be administered by the patent holder or by a company with prior art rights to use the technology. An additional challenge with the use of surfactants and solvents is that chemicals can become polymerised which creates highly viscous material in the formation. Polymerisation is avoided by limiting the concentration of active ingredients or by performing bench-scale studies to develop an optimum, site-specific application dose.
CASE STUDIES A number of case studies will be presented that demonstrate the effectiveness of ISCO when it is applied by a knowledgeable and experienced remediation practitioner. Case studies will be used from the implementation of ISCO in NSW, VIC and QLD using hydrogen peroxide-activated sodium persulfate and solvent. Also, information will be presented to demonstrate how common misconceptions have led to client dissatisfaction, the need to re-inject and general failure. CONCLUSIONS ISCO is an effective remediation technology when applied with a level of rigor and experience. Improper design and/or implementation can lead to re-injection and cost over-runs. A level of understanding about the common misconceptions can improve how ISCO is implemented in Australia.
582
Table of Contentsfor this manuscript

RADIO FREQUENCY HEATING FOR IN SITU THERMAL TREATMENT OF ETHYLENE DICHLORIDE AND 1,1,2-TRICHLOROETHANE IN
GROUNDWATER
Andrew Gray1, Andrew Hunt1, Joe Fiacco1, Darren Reedy1, Cole Pearson1, Camillo Coladonato2, Jeb Rong3, Ray Kasevich3, John McTigue3
1ERM, Level 6, 99 King Street, Melbourne, VIC 3000, AUSTRALIA 2Dow Chemical (Australia) Pty Ltd, 541–583 Kororoit Creek Road,
Altona, VIC 3018 AUSTRALIA 3JR Technologies, 964 Main Street, Great Barrington, MA 01230, USA
INTRODUCTION A field-scale trial of in situ radio frequency heating (RFH) began in January 2019 at an operating chemical plant in Victoria, Australia. The objective of the field trial is to assess the feasibility and effectiveness of using RFH to heat groundwater resulting in enhanced dissolution of dense non-aqueous phase liquids (DNAPLs) and abiotic degradation of volatile organic compounds (VOCs), including ethylene dichloride (EDC) and 1,1,2-trichloroethane (TCA) via hydrolysis. Hydrolysis Reactions Hydrolysis is the chemical breakdown of a compound due to reactions with water. Hydrolysis reaction rates are temperature dependent, in accordance with the Arrhenius equation, and vary significantly for different VOCs. In general, chlorinated ethanes and chlorinated methanes are most readily degraded via hydrolysis reaction, while most chlorinated ethenes, with the exception of vinyl chloride, are not readily degraded via hydrolysis reactions. Radio Frequency Heating Radio waves are a type of electromagnetic radiation capable of propagating through solid, liquid, and gas, and are not limited by structural features, permeability, or the heterogeneity of the host media, e.g. fractured basalt. RFH is generated by the transmitting radio waves at frequencies between 30 and 300 megahertz (MHz). RFH operates like a microwave oven, but in a lower frequency range and with a longer wavelength, creating molecular vibration to preferentially excite polar molecules. This excitation heats the groundwater and results in increased hydrolysis rates for select dissolved phase VOCs. RFH EQUIPMENT The RF equipment used in the field trial consists of a Generator and an Antenna, each of which is described below. RF Generator The radio waves are generated by a 24 kW RF Generator operating at a frequency of 13.56 MHz. The radio waves produced by the Generator are connected through an impedance matching network which electronically regulates the efficiency of power transfer from the Generator to the Antenna. RF Antenna and RF Antenna Well The radio waves are transmitted into the formation by a dipole Antenna. The Antenna tructure, including the well casing and the dielectric properties of the surrounding formation, are fundamental design parameters required to achieve high efficiency of power transfer to the formation. The specially designed, 5 metre long, aluminium Antenna has been installed in
W23d
Copyright © CRC CARE Pty. Ltd., 2019
CleanUp Conference 2019Adelaide, Australia
8 –12 September 2019583
Table of Contentsfor this manuscript

a dry well located within the groundwater plume. The well is constructed of radio frequency-rated fibreglass which does not absorb RF energy. RESULTS AND DISCUSSION System Monitoring System performance monitoring includes (1) measurements of groundwater temperatures in monitoring wells around the Antenna, (2) measurements of ground level emissions of RF energy, and (3) sampling and analysis of groundwater samples for dissolved phase VOCs. Groundwater Heating The target temperature range for hydrolysis of dissolved phase EDC and TCA in groundwater is 60-80°C. Based on numerical simulations, a target temperature of 80°C at a distance of 1.5 metres from the Antenna was specified to (1) maximise the thermal radius of influence of the RF energy, (2) enhance the dissolution of DNAPL, and (3) maximise abiotic hydrolysis of EDC and TCA. Within 7 weeks of commencement of operation at less than 70% of the full power of the Generator, groundwater temperatures within 3 metres of the Antenna have increased to greater than 50°C, with a maximum temperature of 70°C measured at a distance of 1.5 metres from the Antenna.
Fig. 1. Groundwater Thermal Plume around RF Antenna.
VOC Degradation and By-Product Formation Baseline concentrations of EDC and TCA in the eight monitoring wells surrounding the Antenna were as high as 1,320 mg/L and 10.9 mg/L, respectively, indicating the likely presence of DNAPL. In the monitoring wells immediately surrounding the Antenna, where groundwater temperatures have increased to over 60°C, EDC concentrations have decreased by 68 percent (from 116 mg/L to 37.1 mg/L) and 41 percent (91 mg/L to 53.3 mg/L). Concurrently, concentrations of ethylene glycol, the primary degradation by-product of EDC, have increased from non-detect to 236 ug/L and 557 ug/L, respectively, indicating the commencement of hydrolysis reactions. CONCLUSIONS RFH has been demonstrated to be effective at heating groundwater in the vicinity of the specially designed RFH Antenna, and thereby increasing the hydrolysis rates for EDC and TCA, and the subsequent dissolution of DNAPL.
584
Table of Contentsfor this manuscript
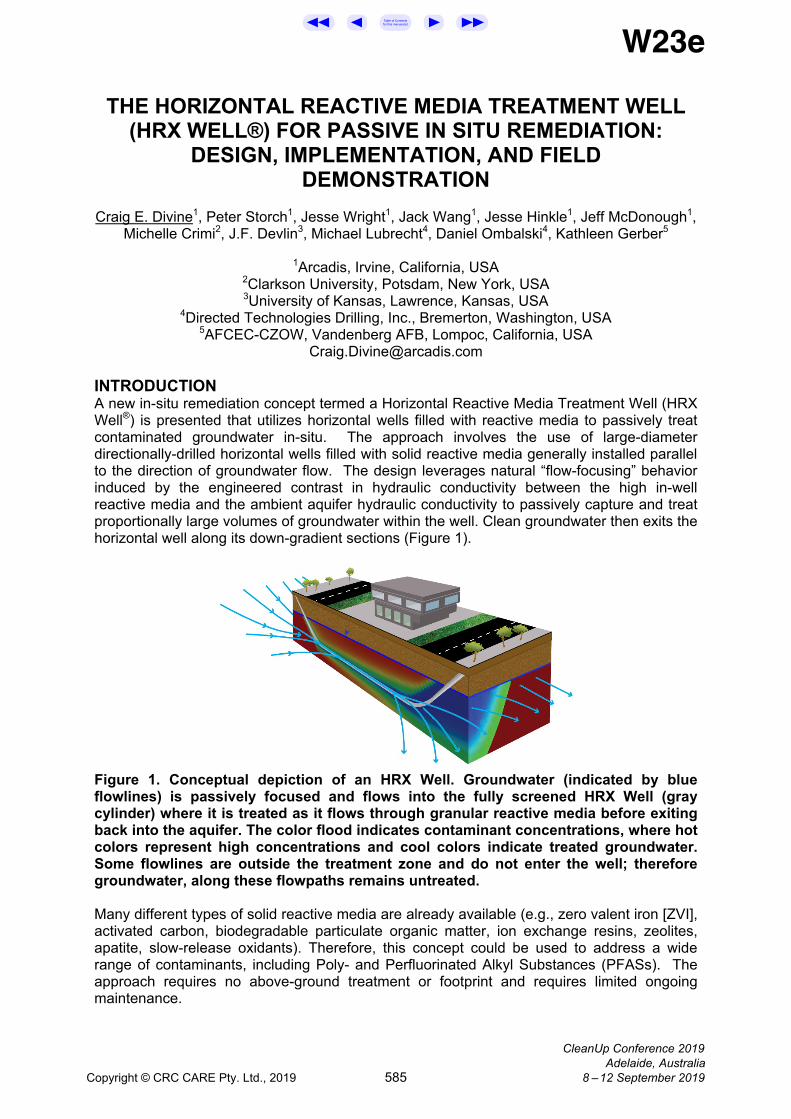
THE HORIZONTAL REACTIVE MEDIA TREATMENT WELL (HRX WELL®) FOR PASSIVE IN SITU REMEDIATION:
DESIGN, IMPLEMENTATION, AND FIELD DEMONSTRATION
Craig E. Divine1, Peter Storch1, Jesse Wright1, Jack Wang1, Jesse Hinkle1, Jeff McDonough1,
Michelle Crimi2, J.F. Devlin3, Michael Lubrecht4, Daniel Ombalski4, Kathleen Gerber5
1Arcadis, Irvine, California, USA
2Clarkson University, Potsdam, New York, USA 3University of Kansas, Lawrence, Kansas, USA
4Directed Technologies Drilling, Inc., Bremerton, Washington, USA 5AFCEC-CZOW, Vandenberg AFB, Lompoc, California, USA
INTRODUCTION A new in-situ remediation concept termed a Horizontal Reactive Media Treatment Well (HRX Well®) is presented that utilizes horizontal wells filled with reactive media to passively treat contaminated groundwater in-situ. The approach involves the use of large-diameter directionally-drilled horizontal wells filled with solid reactive media generally installed parallel to the direction of groundwater flow. The design leverages natural “flow-focusing” behavior induced by the engineered contrast in hydraulic conductivity between the high in-well reactive media and the ambient aquifer hydraulic conductivity to passively capture and treat proportionally large volumes of groundwater within the well. Clean groundwater then exits the horizontal well along its down-gradient sections (Figure 1).
Figure 1. Conceptual depiction of an HRX Well. Groundwater (indicated by blue flowlines) is passively focused and flows into the fully screened HRX Well (gray cylinder) where it is treated as it flows through granular reactive media before exiting back into the aquifer. The color flood indicates contaminant concentrations, where hot colors represent high concentrations and cool colors indicate treated groundwater. Some flowlines are outside the treatment zone and do not enter the well; therefore groundwater, along these flowpaths remains untreated. Many different types of solid reactive media are already available (e.g., zero valent iron [ZVI], activated carbon, biodegradable particulate organic matter, ion exchange resins, zeolites, apatite, slow-release oxidants). Therefore, this concept could be used to address a wide range of contaminants, including Poly- and Perfluorinated Alkyl Substances (PFASs). The approach requires no above-ground treatment or footprint and requires limited ongoing maintenance.
W23e
Copyright © CRC CARE Pty. Ltd., 2019
CleanUp Conference 2019Adelaide, Australia
8 –12 September 2019585
Table of Contentsfor this manuscript

METHODS Three-dimensional flow and transport simulations were completed to assess the general hydraulic performance, capture zones, residence times, effects of aquifer heterogeneity, and treatment effectiveness of the HRX Well concept. Based on these results, a series of three-dimensional laboratory- and meso-scale physical tests (i.e., tank tests) were completed where high-resolution head, flow velocity, and water quality data were collected utilizing manometers, sampling ports, and tracers. The results of these tests further demonstrated the concept, quantified ZVI reactivity and the required residence times, confirmed model predictions, and provided the basis for the field design. The first full-scale field HRX Well concept was installed to treat part-per-million level chlorinated volatile organic constituents at Vandenberg Air Force Base (California, USA) in August 2018. RESULTS Post-installation performance monitoring results from point velocity probes (PVPs) and tracer testing demonstrate that groundwater flow within the HRX Well was greatly enhanced, with in-well velocities of nearly 3 meters per day (compared to less than a few centimeters per day in the surrounding aquifer formation). This flow focusing results in capture and treatment width of more than 10 meters by a single well under passive operation. Contaminant reductions immediately down-gradient of the HRX well were reduced by more than 98% within a few months. Long-term monitoring will document treatment in more distant downgradient monitoring wells. CONCLUSIONS Modeling and field results confirm that the HRX Well concept addresses many of the challenges/limitations inherent to remediation, including: (1) costs and time requirements associated with hydraulic containment; (2) delivery of injected reagent-based strategies in complex hydrostratigraphy; and (3) up-front costs and long-term hydraulics in flow-through permeable reactive barrier (PRB) treatment schemes. For many sites, it is increasingly recognized that contaminant mass flux and discharge may represent the most appropriate measure of plume strength and potential migration risk, and therefore remedial objectives and technologies focusing primarily on long-term mass discharge reduction will be increasingly favored. The HRX Well concept is particularly well-suited for sites where long-term mass discharge control is a primary performance objective.
586
Table of Contentsfor this manuscript
USE OF SUB-SLAB SOIL VAPOR CONCENTRATIONS TO ESTIMATE INDOOR AIR INHALATION RISK USING THE VAPOR CLOUD MODEL
Atul M. Salhotra
RAM Group, 5110 Pine Street, Bellaire, TX 77401, USA [email protected]
The estimation of risk due to indoor vapor intrusion (IVI) pathway requires either the direct measurement or the estimation of representative indoor air concentration. Several US state regulatory agencies, USEPA, and other organizations such as American Society for testing and Materials (ASTM), Interstate State technology and Regulatory Council (ITRC), and American Petroleum Institute (API) have developed guidance documents for the evaluation of this pathway. These documents suggest the use of multiple lines of evidence that includes the collection and analysis of soil vapor samples, either immediately below the slab (sub-slab samples), or adjacent to the building, possibly at multiple depths. These documents present detailed guidance for the installation, collection, and analysis of the data. Few documents explain the evaluation of data to estimate the risk and to determine the extent of vapor intrusion.
Several documents suggest the use of a default attenuation factor to estimate the indoor air concentration using the following:
Indoor Air Concentration = Soil vapor concentration X Attenuation Factor
The indoor air concentration can then be used to estimate the risk due to indoor air inhalation.
Based on the above, a key component of the risk calculation is the estimate of the attenuation factor. Many guidance documents suggest the use of a default attenuation factor such as 0.1, 0.003, or 0.001. Depending on site-specific conditions, the use of a default attenuation factor may overestimate or underestimate the risk. The former may result in unnecessary risk management activities and the latter is obviously not acceptable.
This paper will discuss in detail the attenuation factor method to estimate risk and the factors that affect the attenuation factor. It will present a mass balance analytical model, The Vapor Cloud Model, to estimate indoor air concentrations based on sub-slab concentrations. The mathematical formulation of the model, the underlying assumptions will be presented. Application of the model, with site-specific data, for a residential and an industrial building will be presented. A schematic of the model is presented on next page. REFERENCES API. (2005) A practical strategy for assessing the subsurface vapor-to-indoor air migration
pathway at petroleum hydrocarbon sites. American Petroleum Institute. Publication number 4741.
ASTM. (2015) Standard guide for risk-based corrective action. American Society for Testing and Materials (ASTM) E2081-00.
ITRC. (2017). Technical and regulatory guidance. Vapor intrusion pathway: a practical guideline. Prepared by Interstate Technology & Regulatory Council Vapor Intrusion Team.
USEPA. (2015) OSWER technical guide for assessing and mitigating the vapor intrusion pathway from subsurface vapor sources to indoor air. Office of Solid Waste and Emergency Response Publication 9200.2-154. United States Environmental Protection Agency.
W24a
Copyright © CRC CARE Pty. Ltd., 2019
CleanUp Conference 2019Adelaide, Australia
8 –12 September 2019587
Table of Contentsfor this manuscript

Assumed impermeable Wall
CrackSlab
Soil
Impacted Groundwater
“Vapor Cloud”
Vapors d w
Length [L]
Width [W]
Cv
Height [H]
Cair [µg/m3]
Assumed impermeable
[µg/m3]
588
Table of Contentsfor this manuscript

EFFICIENT VAPOR INTRUSION INVESTIGATIONS IN LARGE MANUFACTURING BUILDINGS
Heather V. Rectanus1, Todd Creamer2
1Geosyntec Consultants, Columbia, MD, USA
2Geosyntec Consultants, Portsmouth, NH, USA [email protected]
INTRODUCTION Vapor intrusion (VI) investigations in large buildings can be expensive and disruptive using traditional investigation and sampling methods. For example, a sampling sub-slab soil gas frequency of 1 sample per 1000-1500 square feet is achievable for small buildings but can become unworkable for large buildings. Also, with wider spacing between samples, the odds of missing a significant source of contamination is increased. As a result, two common trends have emerged from vapor intrusion site assessments that complicate evaluation of this exposure pathway and mitigation system effectiveness: (1) a high degree of temporal and spatial data variability and (2) uncertainty in distinguishing vapor intrusion from background sources. Despite the industry’s heavy reliance on discrete, whole-gas sampling using stainless steel canisters, a diverse suite of complimentary tools is now available to vapor intrusion investigators to manage key variables including temporal and spatial variability, short assessment timelines, and areas of buildings that are difficult to access. Furthermore, a conceptual site model (CSM), when properly constructed, can be used to guide and limit the scope of both a VI and groundwater investigation. This toolbox of diverse investigation and sampling methods can reduce invasiveness and cost while improving data quality, representativeness and outcomes. This presentation covers new and innovative VI investigation and sampling methods within the context of a case study and discuss how these tools can translate into improving remedial strategies. CASE STUDY BACKGROUND AND APPROACH At a confidential site, trichloroethylene (TCE) was identified in down-gradient groundwater monitoring wells from a large, manufacturing building which covers nearly 1 million square feet. A variety of tools were used through the investigation and early phases of mitigation at the building, including High Volume Sampling (HVS) of sub-slab soil gas, forensic background source evaluation, deploying carbon filters, sealing foundation cracks and modifying HVAC operation. HVS is an innovative investigation technique where sub-slab soil gas is extracted and screened over the approximately 2 hours, reaching a radius of influence between 25-75 feet in a single test. At this site, the HVS technique was used to test the vapor intrusion CSM across most of the building in just 6 days of field work. These efforts have set the stage for stakeholder coordination through the more invasive construction work to come. RESULTS AND DISCUSSION Data from investigations offered significant insights into source geometry based on measured TCE concentrations in soil gas, supported by Henry’s Law partitioning modelling. Concentrations of cis-1,2-dichloroethene in soil gas and indoor air also provided strong evidence for areas where groundwater sources were more significant than soil sources. Also, targeted screening by field photoionization detector revealed TCE migration paths in selected block walls and other constructed floor features. CONCLUSIONS Through indoor field investigation, the site owner refined the CSM and found that less than 10% of the building overlies sources of TCE in vadose zone soil and shallow groundwater.
W24b
Copyright © CRC CARE Pty. Ltd., 2019
CleanUp Conference 2019Adelaide, Australia
8 –12 September 2019589
Table of Contentsfor this manuscript

This update to the CSM added significant depth to the overall picture of subsurface nature and extent, ruled out the VI pathway across most of the investigation area with high confidence, and reduced the overall cost of the remedial strategy. The responsible party elected to mitigate both the VI pathway and the subsurface TCE sources beneath active manufacturing and office space using a combination of targeted sub-slab venting, and soil and groundwater treatment. However, it should be noted that implementing and optimizing these mitigation measures also requires navigating complex stakeholder relationships, manufacturing schedules, and security constraints. In addition, the size and constructed complexity of the building added multiple challenges beyond the classical 1-D VI CSM for a single-family home. Currently at this site, predesign investigations are complete, and future efforts include treatability studies and pilot testing sub-slab venting, soil vapor extraction (SVE), in situ chemical oxidation and bioremediation. Conceptualizing soil gas source geometry (e.g., TCE in shallow soils vs. at the water table) and pathway entry points (e.g., soil gas migration through block walls, foundation cracks or preferential pathways) were critical to scoping the predesign investigation and will be used to design the systems and minimize disturbance to manufacturing.
590
Table of Contentsfor this manuscript

AN ALGORITHM FOR CREATING REASONABLE WORST CASE EXPOSURE MAPS FOR VAPOUR INTRUSION SCREENING
R.A. Evans, I.M. Delaere, K. Babina
Department of Health and Wellbeing, Adelaide, 5000, AUSTRALIA
[email protected] INTRODUCTION Well publicised site assessments in metropolitan Adelaide (e.g. Evans et al. 2010) and elsewhere now provide researchers with substantial open data sets that allow generation of new insights and investigative tools for practitioners. There are significant challenges in converting these long term time series environmental data into valuable information for human health vapour risk assessments and include but are not limited to:
• The groundwater and soil vapour plume may remain undelineated and therefore the nature and extent of the contamination is not characterised.
• There may be one or many ‘point-in-time’ sampling events, therefore it may not be possible to reliably comment on the magnitude, variation, or uncertainty of the dataset nor conduct a sensitivity analysis on these data.
• Certain parameters most useful for vapour intrusion risk assessment such as a measured relationship between soil vapour and indoor concentration are not initially available.
This paper proposes a novel algorithmic approach to the processing and analysis of all soil vapour, groundwater (and indoor air data if available) collected in region over time, to create what is described as a ‘realistic worst case ‘consensus’ soil vapour and groundwater dataset. This general approach could provide practitioners with a data driven, conservative and highly accessible regional perspective of predicted exposure to populations in the region over time. This algorithm offers potential to provide objective criteria for interpretation of indoor-air testing data in the context of hypothesis testing, further assessment and as a basis for broader epidemiological studies. METHODS Data for analysis was collated from publicly available site assessment reports for a site in Adelaide, South Australia. Where data was not available in electronic form it was transcribed from printed documentation into electronic spreadsheet form for processing. Non-detects were managed by multiplying the relevant lower limit of quantitation in each specific case (typically consistent within a sampling round). The data then used as model input was simply spatial Coordinates of sampling location and concentration of the contaminant in the specific environmental medium. This data was then filtered to identify the highest concentration observed (during all sampling campaigns) for each spatial location to create a ‘reasonable worst case consensus’ volatile chlorinated hydrocarbon (VCH) soil vapour and groundwater data sets. RESULTS AND DISCUSSION The consensus datasets for soil vapour and groundwater VCH concentration were used to model indoor air concentration at each sampling locality by multiplication with the attenuation factor distribution relevant to the medium specified in Table 1.
W24c
Copyright © CRC CARE Pty. Ltd., 2019
CleanUp Conference 2019Adelaide, Australia
8 –12 September 2019591
Table of Contentsfor this manuscript

Table 1: Descriptive statistics summarizing attenuation factor distributions for groundwater, exterior soil gas, subslab soil gas and crawlspace vapour. (Taken from OSWER 2012).
The descriptive statistics in this reference summarize attenuation factor distributions for groundwater, exterior and interior soil gas after applying database filters ‘considered most effective at minimizing the influence of background sources on indoor air concentrations. A series of isocline surface maps were created corresponding to the range of statistics available in the data base. For the purposes of this presentation the 95th percentile surface map has most relevance from a public health perspective (reasonable worst case). However the approach can be applied at any of the percentiles for contextualising the predictions. The boundary of these maps at the reference concentration can be used to delineate the extent of an investigation area. For example where houses in an area are assumed to have indoor air concentrations above reference concentration at the 95%tile level further investigations would be recommended. Refinements of the model include a 30m buffer distance applied parallel to this exterior 95%tile reference concentration isopleth to address issues associated with preferential pathways. CONCLUSIONS The maps generated using this algorithm provide a simple visual tool for further analysis and also provide a risk based, data driven reasonable worst case modelling approach that is straightforward to understand and can be applied generally. REFERENCES U.S.EPA (2015) EPA’s Vapour Intrusion Database: Evaluation and Characterization of
Attenuation Factors for Chlorinated Volatile Organic Compounds and Residential Buildings. Office of Solid Waste and Emergency Response (OSWER) Publication EPA-R-10-002.
Evans, R., Delaere, I., Babina, K. Simon, D. and Nitschke, M. (2010). Vapour intrusion in suburban dwellings. Public Health Bulletin of South Australia. 7(1): pp. 48-52.
592
Table of Contentsfor this manuscript
VOLATILE CHLORINATED HYDROCARBON VAPOUR INTRUSION — ESTABLISHING A BASIS FOR
PUBLIC HEALTH ACTION FOR TRICHLOROETHENE
Ian M. Delaere, David L. Simon, Richard A. Evans, Kateryna Babina, Chris Lease
Department of Health and Wellbeing, Public Health Services, Adelaide, 5000, AUSTRALIA [email protected]
INTRODUCTION Vapour intrusion is the migration of volatile chemical vapours and gases from sub-surface sources through soils and into the indoor air spaces of overlying or nearby buildings. These vapours and gases may pose acute hazards in terms of fire and explosion while also presenting potential health risks to occupants of affected buildings, both on the basis of short-term and long-term exposure. The Assessment of Site Contamination National Environment Protection Measure 1999 Variation 2013 (NEPM 1999) has limited information with respect to the public health risk assessment and management of vapour intrusion. More broadly, there are significant gaps in current Australian technical guidance on public health assessment and management of volatile chlorinated hydrocarbons (associated with groundwater and soil contamination) across residential areas. In Australia, environment regulators, who have legislated carriage for the management of environmental contamination, have preferred to investigate health-based issues associated with vapour intrusion using environmental characterisation tools. From time to time environment regulators have engaged with health departments particularly when pronounced vapour intrusion events have been investigated to occur in residential areas. In these circumstances environmental regulators seek guidance from health departments on the development of risk based screening and action levels for particular classes of chemical contaminants. A starting point for developing risk based screening and action levels that can be uniformly applied by a regulator is to have an agreed set of qualitative risk descriptors that can assist the community contextualise risk posed by exposure to contaminants of concern. This paper describes the qualitative descriptors of health risk used to establish action and screening levels for the management of the 2014 (SA EPA 2014) trichloroethene vapour intrusion issue in Clovelly Park and Mitchell Park South Australia (Delaere et al 2012). METHODS The use of an excess life-time increased cancer risk of 1 x 10⁻⁵ or higher can be used as a threshold for determining if a vapour action level for indoor air has been reached or exceeded. The use of an excess life-time cancer risk of 1 x 10⁻⁴ or higher can be used as a threshold for implementing mitigation measures. Broad action classes were linked to qualitative descriptors for each risk ratio decade to be used in conjunction with measured or predicted exposure levels. RESULTS AND DISCUSSION Increased cancer risks were estimated by using site-specific information on exposure levels for the contaminant of concern and interpreting them using cancer potency estimates derived for that contaminant. Table 1 presents qualitative risk descriptors for cancer risk ratio decades and are ranked from very low to very high. For example, if the qualitative descriptor was "low," then the excess lifetime cancer risk from that exposure is in the range of greater than one per hundred thousand to less than one per ten thousand. Appropriate actions aligned qualitative risk descriptors with assigned cancer risk ratio decades.
W24d
Copyright © CRC CARE Pty. Ltd., 2019
CleanUp Conference 2019Adelaide, Australia
8 –12 September 2019593
Table of Contentsfor this manuscript

Table 1 Qualitative descriptors of excess lifetime cancer risk (adapted from NYS DOH)
Risk ratio Qualitative Descriptor Action Equal to or less than 1 x 10⁻⁵ Very Low No action
Greater than 1 x 10⁻⁵ and less than 1 x 10⁻⁴
Low Investigate
Greater than 1 x 10⁻⁴ and less than 1 x 10⁻³
Moderate Mitigate
Greater than 1 x 10⁻³ and less than 1 x10⁻¹
High Mitigate and consider relocate
Equal to or greater than 1 x 10⁻¹
Very High Mitigate and consider evacuate
An estimated increased excess lifetime cancer risk is not a specific estimate of expected cancers. Rather, it is a plausible upper-bound estimate of the probability that a person may develop cancer sometime in his or her lifetime following exposure to that contaminant. There is general consensus among the scientific and regulatory communities on what level of estimated excess cancer risk may be judged acceptable. An increased lifetime cancer risk of one in one million or less is generally considered negligible and not a public health concern. The level of risk is typically used as a "target level," "screening level," or "goal", which when exceeded does not necessarily imply that risk reduction measures should be pursued but will trigger more careful evaluation of the situation. The Assessment of Site Contamination NEPM Variation 2013 (the NEPM) states that a one in one hundred thousand (10-5) risk level is used as a starting point for analysis of remedial alternatives, all other things being equal, associated with site contamination in Australia. While not stated in international guidance documents cancer risks greater than one in ten thousand (10-4), typically trigger actions to lower exposures. Therefore when cancer risk estimates are between one in one hundred thousand (10-5) and one in ten thousand (10-4), a risk management decision should be made on a case-by case basis whether or not to pursue risk reduction measures. CONCLUSIONS Experience has shown that the development process for the application of qualitative risk descriptor matrices to establish action and screening levels for the management of contaminated sites provides a valuable opportunity to discuss a range of issues including the strength of evidence on which the actions are based and the risk tolerance of authorities. Moreover, the use of qualitative risk descriptors provide an excellent basis on which to discuss risk with affected communities and how actions will be taken once the results of the investigation are received. REFERENCES Delaere, I., Evans, R., Babina, K. (2012). “Report on the Site Contamination Investigations
Conducted by the Department for Health and Ageing in Clovelly Park, South Australia (2008 – 2011). eA768188
NEPM (1999). “National Environment Protection (Assessment of Site Contamination) Measure, Variation 2013”. https://www.legislation.gov.au/Details/F2013C00288
SA EPA (2014). “Clovelly Park Mitchell Park Environmental Management Project. Report summary: Clovelly Park Mitchell Park Environmental Assessment.” https://www.epa.sa.gov.au/files/10972_cpmp_summary_rpt.pdf
594
Table of Contentsfor this manuscript

FIELD PILOT STUDIES FOR INSITU STABILISATION/SOLIDIFICATION (ISS) OF HYDROCARBON CONTAMINATED SEDIMENTS IN
KENDALL BAY, SYDNEY, NEW SOUTH WALES (NSW), AUSTRALIA
Matthew Clutterham, Nathan Sparke, Phil Hutson, Christopher Robb, Dogus Meric
Ventia Pty Limited, PO Box 3451, Rhodes, 2138, AUSTRALIA [email protected]
INTRODUCTION Hydrocarbon contamination comprising polycyclic aromatic hydrocarbons [PAHs] and total recoverable hydrocarbons [TRH] is present in sediment from Kendall Bay in Sydney Harbour. The contamination originated from operation of the former Mortlake gasworks on the shore of Kendall Bay. The gasworks itself was remediated between 1999 to 2002 and subsequently developed for high density residential land use. A Voluntary Management Proposal (VMP) has been agreed with the NSW Environmental Protection Agency (EPA) for remediation of the sediments within certain portions of Kendall Bay. This presents a challenge to develop a remediation methodology for the contaminated sediments that minimises potential impacts on the adjacent residents. For this reason, insitu stabilisation/solidification (ISS) has been selected as the preferred remediation technology. Insitu treatment will significantly reduce the number of truck movements that would be required to transport contaminated material for off-site treatment and disposal. Additionally, ISS reduces the potential for odour emissions associated with traditional dredging approaches given water cover is maintained above the sediments during insitu treatment. METHODOLOGY A Phase 1 ISS laboratory treatability study for the project identified the optimal additive mix designs required to meet the project performance criteria including unconfined compressive strength [UCS], contaminant leachability and hydraulic conductivity. The laboratory trials also determined that UCS could be used as the sole validation criteria to demonstrate the achievement of all project performance criteria. Following the laboratory treatability study, Phase 2 and 3 field pilot studies were undertaken using the optimal additive mix designs identified during the laboratory study. Phase 2 of the pilot study works took place at a location in Kendall Bay outside of the areas identified as requiring remediation. The location was selected based on similar physical sediment properties and low levels of contamination compared with the identified remediation areas. The rationale for selecting this location was to test the equipment in a “clean commissioning area” to ensure the equipment and environmental controls were performing successfully prior to moving to a known contaminated area. During Phase 2 the mix injection was undertaken using equipment and procedures like those proposed for the full-scale remediation works, to best simulate their performance under project conditions. Following the Phase 2 works, the final phase of the pilot study was reviewed and refined. The Phase 3 works involved construction of a 1.5-metre-thick ISS raft to remediate contaminated sediments and 8 deeper ISS columns for structural support and constructability of the raft within one of the remediation areas. Results were validated through wet grab sample collection. Samples were screened in the field for pH, temperature and moisture content to confirm the cement hydration reaction has commenced. Insitu cores of ISS material were also collected to visually assess the mixing homogeneity. The cores were also prepared and sent to the project laboratory for UCS testing. Telemetry and GPS information from the mixing equipment was used as the final line of evidence to assess the successful delivery of the ISS mix.
W25a
Copyright © CRC CARE Pty. Ltd., 2019
CleanUp Conference 2019Adelaide, Australia
8 –12 September 2019595
Table of Contentsfor this manuscript

RESULTS This section presents a discussion of results using a multiple lines of evidence approach and findings of field screening, construction quality assurance (CQA), and homogeneity of the ISS treatment process for the Phase 2 and 3 field trials. Field screening including pH, temperature and moisture content testing was undertaken on wet grab samples of the ISS material. Increased pH, temperature and decreased moisture content compared to that of the untreated native sediments demonstrated that cementitious reactions were occurring following ISS treatment. Laboratory analysis of insitu cores of the ISS material was also conducted. Results revealed that the representative ISS samples collected and tested achieved the project performance criteria for UCS, hydraulic conductivity and contaminant leachability (using LEAF 1315 and 1316 results to assess a greater than 90% reduction in leachability of ISS sediments compared to untreated sediments). ISS core samples were visually inspected, and this confirmed the homogeneity of mixing achieved during construction of columns and the raft slabs during the Phase 2 and Phase 3 field trials. The mixing contractor’s operation logs and telemetry data recorded by the on-board Jean Lutz™ Dialog control and data acquisition system and processed using Jean Lutz™ DXDEV software was also used to confirm that as-built ISS conditions were representative of the design requirements. CONCLUSION The trials demonstrated, using multiple lines of evidence, the successful application of ISS for the remediation of contaminated sediments in Kendall Bay, which has been confirmed by the project site auditor. The project will now progress to full-scale remediation of contaminated sediments. REFERENCES ASTM International (2017) ASTM D4643 - Standard Test Method for Determination of Water
Content of Soil and Rock by Microwave Oven Heating. ASTM International (2013) ASTM D2166/2166M - Standard Test Method for Unconfined
Compressive Strength of Cohesive Soil. https://www.seatemperature.org/australia-pacific/australia/canada-bay.htm (2018)
Sea Temperatures, Canada Bay, New South Wales Sea Temperatures. Last accessed on October 2, 2018.
596
Table of Contentsfor this manuscript

PHOTOLYTIC DEGRADATION OF BETRIXABAN IN AQUEOUS SOLUTIONS
Tahereh Jasemi Zad, Lokesh P. Padhye
Department of Civil and Environmental Engineering, The University of Auckland, Private Bag 92019, Auckland 1142, NEW ZEALAND
[email protected] INTRODUCTION Betrixaban, approved recently by the FDA as an oral anticoagulant, is used on patients who are at risk of thromboembolic events. Environmental fate and toxicity of betrixaban are still unknown and unexplored. However, due to its potential to form nitrogenous disinfection by-products (N-DBPs), it is important to explore effective treatment processes for the removal of betrixaban from aqueous solution. This study focuses on betrixaban degradation by Advanced Oxidation Processes (AOPs) including photolysis with/without hydrogen peroxide (H2O2). It is the first time that betrixaban has been analysed to study its fate in engineered systems. METHODS The betrixaban samples (1 µM) were diluted in deionised water from the stock solution. Adjustment of pH was done using phosphate buffer (pH= 7.5). Reactions for irradiation were carried out from 2 min to 1 h. H2O2 solutions (10 mM) were daily prepared. Sodium sulfite was added at the end of the reaction to quench the residual H2O2. All experiments were conducted in duplicates. Quantification was performed with a liquid chromatography tandem mass spectrometer (LC-MS/MS) (Shimadzu, Japan). The separation was done on a 10 cm × 2.1 mm, 3 µm, Ascentis RP-Amide SUPELCO column. The eluents consisted of 95% of 5 mM ammonium formate in water with 5% acetonitrile (A) and 100% acetonitrile (B). All the irradiation experiments were carried out in a UV chamber (Opsytec Dr Grobel, Germany) equipped with eight 15-W low-pressure lamps (Philips Co., Japan) that emit light primarily at 254 nm (UVC), 313 (UVB) and 352 (UVA). For UV/H2O2 process, H2O2 was added before irradiation. The sample solutions (10 mL) in beaker were continuously mixed with a magnetic stirrer during photolysis experiments in the presence of H2O2. RESULTS AND DISCUSSION As can be seen from Table 1, betrixaban cannot be efficiently degraded by photolysis alone. Its degradation significantly enhanced with the addition of H2O2 for all types of irradiation; especially for the UV-C/H2O2 process. This can be explained due to the higher intensity of UV-C which makes it the most powerful light for the degradation of organic compounds. Furthermore, by increasing the H2O2 dosages from 0.005 to 0.5 mM, the degradation increased from about 29% to 56% in UV-C/H2O2 process, whereas the rate of decay slightly increased in the absence of UV light (Figure 1). It can be seen from Figure 2 that by increasing the UV-C intensity in the UV/H2O2 process, the degradation increased. Similar results have been reported for the degradation of different organic compounds by this process (Liao et al., 2016). Furthermore, the degradation increased from about 19% to 67% and 17% to 32% by increasing the time from 2 to 60 min in UV-C/H2O2 process and H2O2 alone, respectively. Moreover, the presence of 0.1 mM scavengers including tert-Butyl alcohol (TBA), potassium iodide (KI), and potassium dichromate (K2Cr2O7) in UV-C/H2O2 process showed that the photodegradation was hindered by the addition of these scavengers. The kinetic studies also revealed that the degradation of betrixaban in UV-C/H2O2 process followed pseudo-first-order reaction kinetics, which was consistent with similar studies on many other pharmaceuticals (Ao and Liu, 2017).
W25b
Copyright © CRC CARE Pty. Ltd., 2019
CleanUp Conference 2019Adelaide, Australia
8 –12 September 2019597
Table of Contentsfor this manuscript

Table 1. Effect of photolysis with/without H2O2 ([H2O2]0= 0.5 mM, Intensity for Visible light= 8, UV-A= 13.60, UV-B= 16.80, UV-C= 20 mW/cm2, contact time= 30 min).
Treatment process Degradation (%)
Visible UV-A UV-B UV-C
Photolysis alone 2.7 2.7 3.3 9.7
Photolysis/H2O2 17.2 15.7 31.5 57.3
Fig. 1. Effect of different H2O2 dosages (UV-C= 20 mW/cm2, contact time= 30 min).
Fig. 2. Effect of UV intensity in UV-C/H2O2 process ([H2O2]0= 0.5 mM, contact time= 30 min). CONCLUSIONS This is the first study reporting treatment efficiency of betrixaban by advanced water/wastewater treatment. In summary, photolysis alone was not found to be effective, but when combined with H2O2, photocatalysis was found to significantly enhance betrixaban degradation. Hydroxyl radicals were found to play a critical role in the degradation of this recalcitrant compound. Results obtained from this study will be helpful for treatment utilities in the understanding of the fate of betrixaban through their treatment units. REFERENCES Liao, Q.-N., Ji, F., Li, J.-C., Zhan, X. and Hu, Z.-H. (2016) Decomposition and mineralization
of sulfaquinoxaline sodium during UV/H2O2 oxidation processes. Chemical Engineering. 284: 494-502.
Ao, X., Liu, W. (2017) Degradation of sulfamethoxazole by medium pressure UV and oxidants: Peroxymonosulfate, persulfate, and hydrogen peroxide. Chemical Engineering. 313: 629-637.
598
Table of Contentsfor this manuscript

OHS&E PLANNING OF PFAS INVESTIGATION PROGRAMS: ARE ALL SUNSCREENS THE SAME? ARE WE MISSING SOMETHING?
A. Mikkonen, F. Amon, R. Poole, H. Mikkonen, J. Frangos, C. Wallis
CDM Smith 1/30 Wangaratta Street, Richmond VIC 3121, AUSTRALIA
INTRODUCTION Despite being almost entirely preventable, Australians have the highest rate of skin cancer in the world (Cancer Council VIC 2007). According to the latest Cancer Council estimates, skin cancer affects two out of three Australians in their lifetime (Cancer Council Australia 2018). This is why under Australian occupational health and safety legislation, employers are encouraged to seek to reduce this risk and protect employees from ongoing exposure to solar radiation (SWA 2013). When the ultraviolet (UV) radiation index levels reach three or higher, Safe Work Australia (SWA 2013) and the World Health Organisation (WHO) both recommend the use of a combination of control measures including sun protective clothing, hat, sunglasses, sunscreen and shade to reduce exposure to solar UVR, so far as is reasonably practicable. To put this into context, the average annual noon (clear sky) UV index ranges from 6 to 12 across mainland Australia (slightly lower in Tasmania) (BOM 2008) which would suggest that sunscreens should be worn almost every day when working outdoors. However, the PFAS National Environmental Management Plan (PFAS NEMP 2.0; HEPA 2019) recommends that items such as sunscreen should not be worn or used during any stage of sampling (at site, during transport etc.) where sample contamination could affect analytical results (HEPA 2019). Why? Is this based on out-dated publications and how do we make a decision between sample integrity and health and safety? This paper is intended to provide a brief review of recent publications with regard to PFAS analysis in sunscreens and other cosmetics to help contaminated land practitioners make informed decisions about their health and safety practices when sampling for PFAS. APPROACH/METHODS Literature Review In 2013 Fujii et al. reported that 8 out of 10 sunscreens tested had concentrations of perfluorinated carboxylic acids above trace levels (ranging from 1.2-19 µg/g total PFCAs). However, since the global phase out of perfluorooctanesulfonic acid (PFOS) and perfluorooctanoic acid (PFOA), manufacturers have largely reformulated their products to avoid these substances. However, when products are reformulated, ingredients are typically replaced by similar ones to maintain whatever desirable property that chemical adds to the formulation. From patent filings and chemical registries alone, researchers have tallied some 4,700 PFAS-related structures which have either been or may currently be in commercial use (OECD 2018). In a recent study released by the Danish Environmental Protection Agency (2018), at least 78 cosmetic products were identified (on the market) which contained fluoroalkyl substances and other fluorinated compounds. Polytetrafluoroethylene (PTFE) was the most commonly found fluorinated compound identified (13 product types) followed by C9-15 fluorophosphate (found in four different product types). Independent Testing In seeking to reduce the risk sun exposure to field staff, CDM Smith and other concerned employers (Cooke and Ewing 2018) have undertaken independent analysis of PFAS in sunscreens using two independent laboratories (ALS and Leeder Analytical). CDM Smith tested four of the most common sunscreens used by staff and found no detectable PFAS (LOR of <2.5 ug/kg) in any of the products. It is noted one product had detectable PFOA which when retested (by the same laboratory and a secondary laboratory) came back with
W25c
Copyright © CRC CARE Pty. Ltd., 2019
CleanUp Conference 2019Adelaide, Australia
8 –12 September 2019599
Table of Contentsfor this manuscript

non-detect levels. Cooke and Ewing (2018) tested 10 sunscreens with no detectable PFAS (LOR of <0.2-0.5 ug/kg) in the product tested. A list of sunscreens tested will be provided in the presentation (with permission from other authors).
Brand Name CMD Smith (2018) (Leeder
Analytical; ALS)
GHD (2018) (ALS)
PFAS > LOR?
Reported Concentration
Bananaboat Everyday Faces No3 <LOR
Dry Balance No1 <LOR
Sport No2 <LOR
Sport No2 <LOR
Coles Everyday No2 <LOR
Cancer Council Work Sunscreen 50+ No1 <LOR
Sport No2 <LOR
Natural Instinct Natural Sunscreen No2 <LOR
Nivea Sun protect and moisture
No1,2 <LOR
Sun ultra beach No2 <LOR
Neutrogena Ultra sheer face and body
No2 <LOR
Ultra sheer face and body mist
No2 <LOR
Wotnot Natural Sunscreen No2 <LOR 1 LOR - 2.5 ug/kg 2 LOR range 0.2 - 0.5 ug/kg 3 Initial sample showed detectable levels of PFOA, follow up testing using a different bottle (of the same batch) as well as same bottle tested at a secondary laboratory found no detectable PFOA (or other PFAS).
DISCUSSION/CONCLUSIONS Although sunscreen formulations in the past have contained relatively high levels (microgram per gram range) of some of the PFAS, there is little evidence to suggest that these contaminants are still present in recently manufactured sunscreens. The Danish EPA (2018) showed that although PFAS are still present in cosmetics they are typically not the PFASs of interest on environmental investigation sites. In conclusion we should not be risking sun exposure (and its associated consequences) to avoid cross contamination from what is an unlikely source in the first place. REFERENCES BOM (2008). Average solar ultraviolet (UV) Index. Bureau of Meteorology Cancer Council VIC (2007). Skin Cancer and Outdoor Work: A Guide for Employers. First published January 2007 by The Cancer Council Victoria, ISBN: 0947283900 Cancer Council Australia (2018). Understanding Skin Cancer. ISBN 9781925651119 Cooke E. and Ewing J. (2018). PFAS in Sunscreens. Poster presentation at EcoForum 2018. The Danish Environmental Protection Agency (2018). Risk assessment of fluorinated
substances in cosmetic products. Survey of chemical substances in consumer products No. 169, October 2018, ISBN: 978-87-93710-94-8
HEPA (2019), PFAS National Environmental Management Plan 2.0 Fujii Y., Harada KH., Koizumi A. (2013). Occurrence of perfluorinated carboxylic acids
(PFCAs) in personal care products and compounding agents. Chemosphere 93, 538-544 OECD (2018). Toward a New Comprehensive Global Database of Per- and Polyfluoroalkyl
Substances (PFASs). OECD Series on Risk Management No. 39. ENV/JM/MONO(2018)7 SWA (2013). Guide on Exposure to Solar Ultraviolet Radiation (UVR). Safe Work Australia
(SWA). ISBN 978-1-74361-134-0
600
Table of Contentsfor this manuscript

TAMING THE SHREW: REFINING PFAS REHABILITATION GOALS BY UNDERSTANDING YOUR IMPACTS AND YOUR ECOSYSTEM
Katie Richardson, Michael Rehfisch, Phoebe Hopkins
Senversa Pty Ltd, L6, 15 William Street, Melbourne, AUSTRALIA
INTRODUCTION AND BACKGROUND We present a case study for a former fire fighter training campus with widespread PFAS impacts. A management response is currently underway at the site, including the scraping and excavation of areas of elevated PFAS concentrations, with these soils to be managed on-site. Complete ‘source’ removal is recognised to be impracticable for the site given the scale of the site and the widespread (>150 ha) low-level impacts. In order to provide an efficient and achievable response, it was necessary to assess excavation extent which would effectively manage potential risks. On this basis, rehabilitation goals have been developed for the site which are less stringent than the PFAS National Environmental Management Plan (NEMP), but which have been assessed (on a holistic, whole-of-site basis) to offer an appropriate level of protection to receptors associated with the site. A key objective for the site considered in the rehabilitation goals is the management of risks to on-site terrestrial ecological receptors. A site-specific review was undertaken to better understand the receptors on-site requiring protection, allowing refined screening levels to be selected. A preliminary risk assessment was then undertaken, considering the predicted final site condition (depth and extent of residual PFAS impacts) to estimate potential risks to terrestrial ecological receptors post-rehabilitation. APPROACH For assessing risks to terrestrial ecosystems from PFAS soil impacts, the driving default screening level on most sites is the interim soil screening level for ecological indirect exposure (0.01 mg/kg PFOS) provided in the PFAS National Environmental Management Plan (NEMP) (HEPA, 2018). This screening level is sourced from Canada (CCME, 2017) and offers protection to terrestrial ecological receptors via a pathway of PFAS accumulation in their diet. The draft NEMP 2.0 clarifies that this conservative screening level is applicable for all land uses. Specifically, this screening level considers a small, invertebrate eating mammal; this is the receptor group for which the risks are highest, given the high potential for PFAS to accumulate in invertebrates, and the high food intake to body weight (FI/BW) ratio for this receptor group. CCME also presents a range of screening levels for the protection of other receptor groups (e.g. herbivorous mammals, and omnivorous birds): Table 1: PFOS screening levels for the protection of different ecological receptors
Receptor Group
Screening level (mg/kg)
Soil contact Vascular plants and soil invertebrates 11 Primary consumer Herbivorous mammal 2.2
Herbivorous bird 5.1 Secondary consumer Insectivorous mammal 0.01
Omnivorous mammal 0.17 Omnivorous bird 0.33
Tertiary consumer Carnivorous mammal 2.6 Omnivorous mammal 0.63
W25d
Copyright © CRC CARE Pty. Ltd., 2019
CleanUp Conference 2019Adelaide, Australia
8 –12 September 2019601
Table of Contentsfor this manuscript

An ecological review was undertaken which indicated very low potential for the most sensitive receptors (small, invertebrate-eating [insectivorous] mammals) to be present at the site. This allowed the risk assessment to focus on other, less sensitive, receptors. Rehabilitation plans have been developed on a practicable basis, and provide details of the proposed depth and extent of rehabilitation. Based on these proposed plans, and previously collected analytical data, the final site condition (e.g. extent and depth of residual concentrations) was predicted. Exposure concentrations to each of the potential receptor groups was estimated based on the final depth and extent of the residual impacts. To estimate exposure concentrations for different receptors, consideration was given to a range of factors, including:
• Statistical assessment to estimate the residual concentrations at depth; • Assessment of the portion of the diet of each receptor which could be sourced from
the depths at which residual impacts will be present; and • Consideration of whether the extent of the residual impacts is sufficient such that a
receptor could source a significant proportion of its diet from this area (relative to its home range), and sufficient to support a significant population (in the context of the regional ecosystem.
DISCUSSION AND CONCLUSIONS On the basis of the assessment, it was concluded that the risks to terrestrial ecological receptors post-rehabilitation are likely to be low and acceptable. This approach provided confidence to the auditor that the proposed rehabilitation plans (developed with practicability constraints) will be successful in managing the potential risks to terrestrial ecological receptors. Overall, the approach of refined screening assessment, and comprehensive consideration of site conditions allowed rehabilitation works to proceed without the cost and delays associated with more detailed ecological assessment (e.g. biota sampling, surveys and detailed food-web analysis), and allowed the rehabilitation works to be restricted to a practicable and achievable area. REFERENCES HEPA, 2018. PFAS National Environmental Management Plan CCME, 2017. Scientific Criteria Document for the Development of the Canadian Soil and
Groundwater Quality Guidelines for Perfluorooctane Sulfonate (PFOS)
602
Table of Contentsfor this manuscript

OCCURRENCE AND DISTRIBUTION OF OXYGENATED POLYCYCLIC AROMATIC HYDROCARBONS (OXY-PAHS) IN
SOILS OF AN AUSTRALIAN INDUSTRIAL CITY
Oluyoye Idowu1, Kirk T. Semple2, Thavamani Palanisami1
1Global Centre for Environmental Remediation (GCER), University of Newcastle, Callaghan, NSW 2308, AUSTRALIA
2 Lancaster Environment Centre, Lancaster University, Lancaster LA1 4YQ, UK [email protected]
INTRODUCTION Oxygenated polycyclic aromatic hydrocarbons (oxy-PAHs) are ubiquitously occurring and relatively more toxic and polar derivatives of PAHs. They can also be co-emitted with PAHs as a result of various pyrogenic and petrogenic processes. Polar PAHs, and particularly oxy-PAHs have been described as immediate acting mutagens and carcinogens with cancer causing potency often higher than their homocyclic forms(Benigni and Bossa, 2011). Oxygenated PAHs could exert greater toxic effects, such as oxidative stress, at much lower concentrations, relative to the parent PAHs. However, they are not being considered in contaminant risk assessment and polluted sites remediation. For environmental and human health risk assessment of PAHs and risk abatement, a comprehensive assessment of parent PAHs, oxy-PAHs and other derivatives are required. This study therefore investigated the PAHs and oxy-PAHs concentration levels of soils from different parts of Newcastle city, New South Wales, Australia. METHODS Study Site Newcastle city has an impressive history of coal mining as well as other industrial activities which dates back to the 1800s.However, there has not been any holistic investigation of the contaminant status of the city’s soil. This study, therefore, aimed at investigating the PAH and oxy-PAH concentration status of residential, recreational, designated smoking areas and industrial soils of Newcastle city. Target Parent and oxy-PAHs The following were analysed in sampled soils: Parent PAHs: acenaphthylene (ACENY), acenaphthene (ACEN), fluorene (FLU), phenanthrene (PHEN), anthracene (ANTH), fluoranthene (FLUA), pyrene (PYR), benz[a] anthracene (B(A)A), chrysene (CHRY), benzo (b/k) fluoranthene (B(B/K)F, benzo[a] pyrene (B(A)P), dibenz[a,h]anthracene (D(AH)A), indeno[1,2,3-cd]pyrene (I(CD)P); oxy-PAHs: 1,4-naphthoquinone (1,4-NQ) 9-fluorenone (9-FLO), 2-methyl anthraquinone (2-MAQ), 2-ethylanthraquinone (2-EAQ), 9,10-anthraquinone (9,10-ANQ), 2,3-dimethylanthraquinone (2,3-DMAQ), 7H-benz[d,e]anthracene-7-one (7H-BANT) Sample Extraction The Dionex ASE 350 Accelerated Solvent Extractor was employed for the exhaustive extraction of soil samples. Automatic solvent extraction (ASE) was preformed using the following instrumental parameters- temperature: 100 °C, heating time: 6 min, pressure: 1500psi; static extraction time: 5 min; flush volume: 60%; purging time: 240s; purging gas: N2. Three extraction cycles of hexane: acetone (3:1) were employed. Extracts were passed through Na2SO4 to remove moisture and rotary evaporated (at 30°C and 12.5psi) to <1mL. The concentrated extracts were spiked with fluoranthene-d10 as recovery standard. Glass columns (8ml) filled with 4g of 10% deactivated silica gel and alumina (1:1) were prepared and conditioned with 10ml hexane and 10ml acetone as a first step in the fractionation and clean-up process.
W25e
Copyright © CRC CARE Pty. Ltd., 2019
CleanUp Conference 2019Adelaide, Australia
8 –12 September 2019603
Table of Contentsfor this manuscript

Fractionation and Clean-up Procedures The concentrated extracts were applied to the solid phase extraction cartridge which was connected to a manifold and operated under vacuum at 5mm Hg. The extracts were fractionated into PAH fraction using 15ml hexane: dichloromethane (5:1), and polar PAHs fraction using 8ml dichloromethane followed by 5ml acetone. The volume of eluent was concentrated to near dryness, and solvent exchanged to hexane by adding 1ml hexane before being transferred to 1.5ml GC vials for GC-MS analysis. Three deuterated internal standard mixes (naphthalene-d8, phenanthrene-d10 and perylene-d12) were added before GC-MS analysis. RESULTS AND DISCUSSION
Industrial Smoking area Recreational Residential0
20
40
60
80
100
Per
cent
Con
tribu
tion
to ?
13P
AH
s
Soil Type
I(CD)P D(AH)A B(A)P B(B/K)F CHRY B(A)A PYR FLUA ANTH PHEN FLU ACEN ACENY
Industrial Smoking area Residential Recreational0
20
40
60
80
100
Per
cent
con
tribu
tion
to ∑
7oxy
-PA
Hs
Soil Type
1,4-NQ 9-FLO9,10-ANQ 2-MAQ 2-EAQ2,3-DMAQ7H-BANT
Fig. 1. Percent contribution of PAHs and oxy-PAHs to total concentrations per soil type.
Fig. 2. Parent and oxy-PAH concentrations in investigated soils
CONCLUSION Oxy-PAHs were as widespread as the parent PAHs in the study area although at much lower concentrations. 9-Fluorenone was the most abundant oxy-PAHs across all the sites. Concentrations of oxy-PAHs in this study were environmentally relevant since much lower concentrations have been shown to elicit toxic effects such as cancers and developmental challenges in other studies. REFERENCES BENIGNI, R. & BOSSA, C. 2011. Mechanisms of chemical carcinogenicity and mutagenicity:
a review with implications for predictive toxicology. Chem Rev, 111, 2507-36.
604
Table of Contentsfor this manuscript

SORPTION AND DESORPTION BEHAVIOUR OF 2,4-D IN NINE SELECTED URBAN SOILS OF AUSTRALIA
Md Meftaul Islam1,2,*, Raja Dharmarajan1, Megharaj Mallavarapu1
1Global Centre for Environmental Remediation (GCER), The University of Newcastle,
Callaghan, NSW 2308, AUSTRALIA 2Department of Agricultural Chemistry, Sher-e-Bangla Agricultural University,
Dhaka-1207, BANGLADESH *[email protected], *[email protected]
INTRODUCTION 2,4-D [2,4‐Dichlorophenoxyacetic acid] is the first commercially developed selective synthetic herbicide extensively used in Australia and around the world for broadleaf weed control and as plant growth regulator for lawns/turfs, home gardens, parks and agricultural crops (Ding et al., 2012, Kaminski et al., 2014). The molecule of 2,4-D contains a carboxyl group, which can partition into soil organic matter via both, their anionic and non-ionic form (Werner et al., 2013, Tulp et al., 2009). This moderately persistent herbicide is most frequently detected in streams, surface and groundwaters (Werner et al., 2013, Carver, 2017). 2,4-D is considered as a potential long-term threat to the environment and human health because of its persistence in water and soils. Nevertheless, this herbicide is still widely used worldwide. In an urban environment including lawn/turf, home garden and also parks where the careless application of pesticide is a more common feature observed almost all over the world. Likewise ,home owners use up to 10 times more chemical pesticides per acre in an urban environment than farmers use on crops (USFWS, 2000). The fate and movement of herbicide in diverse sections of the environment are strongly influenced by the adsorption-desorption process. In general, 2,4-D sorption depends on a combination of factors such as soil pH, organic matter content, cation exchange capacity, total iron, and aluminium oxides, clay content and soil mineralogy. Laboratory batch experiments were conducted to investigate the sorption-desorption characteristics of 2,4-D in nine Australian urban soils. 2,4-D sorption-desorption isotherms will be modelled using the Langmuir and Freundlich equation to estimate the sorption coefficient (Kf). The results of the present study contribute to the new knowledge on the characterization of 2,4-D retention in different urban soils and environment. METHODS Sorption isotherms of 2,4-D on soils will be determined at 21 ± 1 °C. Duplicate samples of 2 g air-dried soils were equilibrated with 10 mL aqueous solution of 2,4-D in 0.01 M CaCl2 placed in 50 mL polypropylene centrifuge tubes. The initial concentration for each solution was 1, 5, 10, 50, 100 and 200 μg mL−1. The tubes were shaken in an end-over-end shaker at the natural pH of soils during 24 h. Suspensions were centrifuged and filtered through a 0.2 µm PTFE filter at the end of the incubation period. The concentration of residual herbicide (2,4-D) in solutions were determined by LC-MS (Agilent Technologies, Japan). RESULTS AND DISCUSSION In this study; fresh samples from surface horizons (0 - 15 cm) of nine urban soils located in and around Newcastle region of Australia (from 32°55′S ′ to 151°45′E) were collected using a spade. Soils were air-dried for 24 h, and sieved through a 2 mm diameter sieve (Ortiz et al., 2017). The soil characterization including soil pH, electric conductivity (EC), cation exchange capacity (CEC), soils texture (sand, silt and clay g/kg), total organic carbon, nitrogen and Sulphur (CNS), Fe, Al, Na, K, Ca, Mg contents and Soil mineralogy were determined following standard procedures.
W25f
Copyright © CRC CARE Pty. Ltd., 2019
CleanUp Conference 2019Adelaide, Australia
8 –12 September 2019605
Table of Contentsfor this manuscript

Table 1. Physico-chemical properties of soils collected from urban environment in and around Newcastle region
Soil ID
% Clay % Silt % Sand Textural Class
pH EC µs/cm
CEC (meq/ 100gm)
%TOC
Soil 1 7.5 41.3 51.3 Loam 5.8 117.6 5.4 7.7 Soil 2 11.2 55.0 33.8 Silt loam 7.5 161.8 4.2 2.0 Soil 3 7.5 16.3 76.3 Loamy sand 8.0 285.5 9.2 0.1 Soil 4 1.2 1.2 97.6 Sand 6.1 42.6 6.4 0.3 Soil 5 18.7 25.0 56.3 Sandy loam 6.6 107.0 7.9 1.4 Soil 6 30.0 41.2 28.8 Loam 5.8 661.0 10.0 0.2 Soil 7 42.5 21.2 36.3 Clay 5.5 116.2 7.6 0.8 Soil 8 7.5 23.8 68.8 Sandy loam 6.2 123.3 6.6 3.5 Soil 9 12.5 23.8 63.8 Sandy loam 6.5 190.5 9.7 1.3
Eventually, the sorption-desorption experiment was conducted using all soils in order to explore the fate and behaviour of 2,4-D in the urban environment.
Fig 1. Sorption kinetics of 2,4-D for Soil 1 CONCLUSION In this study, the sorption-desorption behavior of 2,4-D will be explored, which helps to determine the amount of herbicide residues present in the urban soils and environment or leaching to the surface/ ground water. In addition, the results of this experiment can contribute to predicting the possible risks posed by 2,4-D residues to human and environmental health. REFERENCES CARVER, Z. A. 2017. 2, 4-Dichlorophenoxyacetic Acid (2, 4-D) Transport across an in Vitro
Salivary Acinar Cell System: A Novel Approach to Biomonitoring, Washington State University.
DING, L., LU, X., DENG, H. & ZHANG, X. 2012. Adsorptive removal of 2, 4-dichlorophenoxyacetic acid (2, 4-D) from aqueous solutions using MIEX resin. Industrial & Engineering Chemistry Research, 51, 11226-11235.
KAMINSKI, W., KUSMIEREK, K. & SWIATKOWSKI, A. 2014. Sorption equilibrium prediction of competitive adsorption of herbicides 2, 4-D and MCPA from aqueous solution on activated carbon using ANN. Adsorption, 20, 899-904.
ORTIZ, A. M. G., OKADA, E., BEDMAR, F. & COSTA, J. L. 2017. Sorption and desorption of glyphosate in Mollisols and Ultisols soils of Argentina. Environmental toxicology and chemistry, 36, 2587-2592.
LP, H. C., FENNER, K., SCHWARZENBACH, R. P. & GOSS, K.-U. 2009. pH-dependent sorption of acidic organic chemicals to soil organic matter. Environmental science & technology, 43, 9189-9195.
USFWS 2000. Homeowner’s guide to protecting frogs – lawn and garden care. Division of Environmental Contaminants, July.
55565758596061626364
0 50 100 150 200 250 300 350 400
Con
cent
rati
on (
ppm
)
Time (Minute)
Conc (ppm)
WERNER, D., GARRATT, J. A. & PIGOTT, G. 2013. Sorption of 2, 4-D and other phenoxy herbicides to soil, organic matter, and minerals. Journal of soils and sediments, 13, 129-139.
606
Table of Contentsfor this manuscript

EVALUATION OF GENOTOXICITY OF PERFLUOROOCTANE SULFONATE (PFOS) TO ALLIUM CEPA L.
Anithadevi Kenday Sivaram1,2, Logeshwaran Panneerselvan1,2, Ravi Naidu1,2,
Megharaj Mallavarapu1,2
1Global Centre for Environmental Remediation (GCER), The University of Newcastle (UoN), University Drive, Callaghan, NSW 2308, AUSTRALIA
2Cooperative Research Centre for Contamination Assessment and Remediation of Environments (CRC-CARE), Advanced Technology Centre, The University of Newcastle
(UoN), University Drive, Callaghan, NSW 2308, AUSTRALIA [email protected]
INTRODUCTION The perfluorinated compounds (PFCs) have emerged as an important class of global environmental pollutants. Among the PFCs, the PFOS has unique physiochemical properties such as resistance to temperature, hydrolysis, acidic and alkaline conditions, biodegradation, photolysis, and metabolism (Niu et al., 2012). Hence, PFOS was used widely as the surfactant in firefighting foams, pesticides, wetting agents, surface coating agents for carpets, furniture, and paper products (Kissa, 2001). Due to very low Henry’s law constant (1.1 x 10⁻²), volatilization of PFOS from water to air is implausible, which results in its ability to bioaccumulate and persistent in the aquatic environment. In humans, the PFOS was reported to increase the reactive oxidative species production (ROS) and causes oxidative stress (Eriksen et al., 2010). However, the cyto-genotoxicity of PFOS to higher plants were still unexplored. Therefore, it is important to have adequate knowledge about the cyto-genotoxicity of PFOS to the higher plants like the common onion (Allium cepa), which has been used extensively for environmental monitoring due to the presence of large, reduced number of chromosomes (2n = 16) and higher sensitivity to environmental pollutants. METHODS Healthy onion bulbs were grown in the dark in a cylindrical glass beaker containing deionized water at room temperature (25 °C). When the roots reached 2-3 cm in length, they were exposed to six different concentrations of PFOS (0, 1, 5, 10, 25, 50 and 100 mg L-1) for 24 h. All the treatments, including a positive (Benzo[a]pyrene @ 1 mg L-1) and negative control (in distilled water) were maintained in triplicates. The treated roots were fixed in a mixture of absolute ethanol and acetic acid (3:1 ratio) (Carnoy’s reagent) for 24h at 5 ˚C. Slides were prepared by using Feulgen’s squash technique (Fiskesjo, 1997) to analyse mitotic index and chromosomal aberrations at 10X and 100X magnification. The significance of observed variables was estimated using the Students t test (P ≤ 0.05 and P ≤ 0.01) and correlation by the Pearson correlation test using IBM SPSS 24. RESULTS AND DISCUSSION In this study, the mitotic index was found to be decreased with the increase in the concentrations of PFOS (r = -0.97, P < 0.01) (Table 1). This reduction in the mitotic index indicates that the PFOS can interfere with the cell division and has the potential to cause cyto-genotoxicity by inhibiting cells from entering prophase and blocking interphase mitotic cycle and also by affecting DNA and protein synthesis (Chauhan et al., 1998). Various chromosomal aberrations such as breaks, fragments, vagrants, laggards, C-mitosis, micronucleated cells, and sticky chromosomes were recorded in A. cepa root cells exposed to test concentrations and also in positive control. A significant effect on chromosomes (aberrations) was observed only from 10 mg L-1 of PFOS. With the increase in the concentrations of PFOS, all the chromosomal aberrations were found to have increased with a strong positive correlation (r = 0.99, P < 0.01). The induction of the micronuclei in this study suggests that PFOS have clastogenic potential in inhibiting the spindle fibre formation and
W25g
Copyright © CRC CARE Pty. Ltd., 2019
CleanUp Conference 2019Adelaide, Australia
8 –12 September 2019607
Table of Contentsfor this manuscript

the C-mitosis is formed due to the inhibition of spindle formation (Neelamkavil and Thoppil, 2014). Chromosomal stickiness was also observed in our study from the test concentration of 25 mg L-1 in PFOS. Stickiness in chromosomes, an irreversible effect might be due to depolymerization or degradation of chromosomal DNA, which indicate high toxicity, which leads to cell death (Fiskesjo, 1997).
Table 1. Effect of treatments with different concentrations of PFOS Treatment
(mg L-1)
Mitotic index
Mean ± SD (%)
Total aberration
Mean ± SD (%)
Negative Control 73.4 ± 2.5 0.8 ± 0.1
1 70.1 ± 2.3 1.0± 0.2
5 67.3 ± 3.6* 1.7 ± 0.2
10 62.1 ± 2.5** 2.9 ± 0.6*
25 51.6 ± 1. 6** 5.5 ± 1.2**
50 44.2 ± 1.9** 13.9 ± 2.2**
100 30.7 ± 2.3** 28.9 ± 2.4 **
Positive control 9.9 ± 1.5 89.2 ± 3.6**
CONCLUSIONS The present study suggests the risk of PFOS causing cyto-genotoxicity in plants is likely to be very minimal when compared to the environmental concentrations. However, their persistent nature and continued release into the environment, in particular, close to manufacturing/fire training areas may result in elevated levels of PFOS, thereby may exert toxicity to plants. As several irreversible chromosomal aberrations were observed in the A.cepa cells treated with PFOS at concentrations above 10 mg L-1, which explains its cyto-genotoxic nature. Therefore, results thus conclude that the cyto-genotoxic study using higher plants, especially A.cepa, is an important tool in monitoring environmental and ecological systems. REFERENCES Chauhan, L., Saxena, P., Sundararaman, V.and Gupta, S. (1998) Diuron-induced cytological
and ultrastructural alterations in the root meristem cells of Allium cepa. Pestic. Biochem. Phys. 62:152-163.
Eriksen, K. T., Raaschou-Nielsen, O., Sørensen, M., Roursgaard, M., Loft, S. and Møller, P. (2010) Genotoxic potential of the perfluorinated chemicals PFOA, PFOS, PFBS, PFNA and PFHxA in human HepG2 cells. Mut. Res. /Genet. Toxicol.Environ. Mutagen. 700: 39-43.
Fiskesjo, G. (1997) Allium test for screening chemicals; evaluation of cytological parameters. Plants. Environ. Studies 101:307-333.
Niu, J., Lin, H., Xu, J., Wu, H., Li, Y. (2012) Electrochemical mineralization of perfluorocarboxylic acids (PFCAs) by Ce-doped modified porous nanocrystalline PbO2 film electrode. Environ. Sci.Technol. 46:10191-10198.
Kissa, E.(2001) Fluorinated surfactants and repellents. CRC Press, Newyork. Neelamkavil, S.V., and Thoppil, J.E. (2014) Toxicological evaluation of polar and nonpolar
components of Isodon coetsa (Lamiaceae). Turk. J. Bot. 38: 252-257.
608
Table of Contentsfor this manuscript

HUMAN EXPOSURE TO EMERGING ENVIRONMENTAL CHEMICALS: A COMPREHENSIVE ANALYSIS IN INDOOR DUST
Kurunthachalam Kannan
Wadsworth Center, New York State Department of Health and Department of Environmental
Health Sciences, State University of New York at Albany, New York, USA [email protected]
INTRODUCTION Scientific and professional societies recognize that chemical exposures which occur via air, food, water, personal care products, and indoor dust can increase the risk of adverse health outcomes. Whereas environmental exposures may occur at small doses, and below the threshold levels set for individual chemicals, simultaneous exposures to multiple chemicals can have additive or synergistic health effects. Additionally, several new chemicals enter into the market every year, with now nearly 8,000 chemicals manufactured or imported in high amounts (>25,000 pounds per year), equaling about 9 trillion pounds per year in the United States. Several countries have developed surveillance programs to assess status and trends in human exposure to environmental chemicals. The US National Health and Nutrition Examination Survey indicated that ≥99% of the US population are exposed to tens to hundreds of anthropogenic chemicals, including polychlorinated biphenyls, polybrominated diphenyl ethers, environmental phenols, phthalates, and pesticides. Many of the chemicals were measured at levels shown to increase risks for adverse developmental outcomes in animal and human studies. Although recognition of the contribution of environmental chemical exposures to disease has increased, there are many gaps in our understanding due to limitations of available data sources. The scope of chemicals measured in human biomonitoring and related exposure studies has increased markedly since 2000. The large number of chemicals that are not currently evaluated for exposures creates a challenge in determining the best approach to prioritize chemicals for risk assessment. As we look to expand assessment of chemical exposures in populations, we must be strategic to maximize our understanding of chemical exposures using state of the art analytical methodologies available in recent years. METHODS Whereas untargeted analysis is gaining popularity in identifying novel classes of chemicals to which we are exposed, this presentation outlines the exposure to several emerging classes of environmental chemicals in indoor dust. Dust from indoor environments can contain significant amounts environmental contaminants and is an important source of human exposure to several toxicants. In this presentation, occurrence of several emerging environmental contaminants, namely microplastics, melamine, bisphenols, phthalates, parabens, siloxanes, brominated dioxins, and other environmental chemicals in indoor dust is reviewed. Exposure to environmental chemicals through dust ingestion was evaluated, and the contribution of indoor dust to the total daily exposure of toxicants was estimated. Dust can be a significant source of exposure to various chemicals for infants and toddlers. A need for cumulative risk assessment from multiple chemical exposures and mixture effects should be considered in the development of policies and regulatory measures to minimize chemical exposure in populations. RESULTS AND DISCUSSION In comparison to those classes of chemicals measured house dust, the concentrations of polyethylene terephthlate (PET)-based microplastics (MPs) in indoor dust were highest measured so far (Fig. 1). The concentrations of phthalate esters, which are plasticizers, were one-tenth the concentration of PET-based MPs. The concentrations of MPs were significantly higher than those of tetrabromobisphenol A (TBBPA), perchlorate, siloxanes, synthetic
W26a
Copyright © CRC CARE Pty. Ltd., 2019
CleanUp Conference 2019Adelaide, Australia
8 –12 September 2019609
Table of Contentsfor this manuscript

phenolic antioxidants (SPAs), metabolites of 2,6-di-tert-butyl-4-hydroxytoluene (BHT metabolites) and melamines in dust samples collected from 12 countries (Fig. 1).
Fig. 1. Comparisons of median concentrations of polycarbonate (PC) and polyethylene terephthalate (PET) based microplastics (MPs) in indoor dust samples measured in this study compared with those reported for other chemicals previously measured in indoor dust collected from Albany, NY, United States, by our research group (PCDD and PCDFs, polychlorinated dibenzo-p-dioxins and dibenzofurans, respectively; PBDD and PBDFs, polybrominated dibenzop-dioxins and dibenzofurans, respectively; TBBPA, tetrabromobisphenol A; PFOA, perfluorooctanoic acid; PFOS, perfluorooctanesulfonate; BADGEs, bisphenol A diglycidyl ether; PBDEs, polybrominated diphenyl ethers; BHT metabolites, metabolites of 2,6-di-tert-butyl-4-hydroxytoluene; SPAs, synthetic phenolic antioxidants).
610
Table of Contentsfor this manuscript

INNOVATIVE SCALABLE APPROACHES FOR THE ASSESSMENT AND REMEDIATION OF ASBESTOS-IN-SOIL (ASBINS)
Ross McFarland1, Marc Wydro2, Sam Mitchell2
1AECOM Australia Pty Ltd, PO Box 410, QVB PO Sydney 1230, Australia 2AECOM Australia Pty Ltd, PO Box 73 Hunter Region MC NSW 2310, Australia
Ross.McFarland, Marc.Wydro, [email protected]
OVERVIEW The effective and sustainable management of land impacted by asbestos contamination remains a vexing issue despite quantum improvements over the past two decades. Despite these advances, inadequate assessment and overly conservative remediation, based on the identification of “hazard” rather than the “potential risk” that may be present, has continued to result in unsustainable responses. The outcome of these responses have often lead to enormous and unnecessary costs sometimes blowing out infrastructure project costs by hundreds of millions of dollars (Sydney, 2019). This paper summarises the continuing improvements to the assessment and remediation of ASBestos-IN-Soil (ASBINS), including conventional to innovative solutions that are scalable to the degree and extent of identified ASBINS risk. Remedial responses are also discussed, ranging from conventional (“dig and dump” and “capping”) to innovative (“low energy screening” and “electro-vitrification”). This paper also shares the many lessons for ASBINS assessment and remediation, ranging from effective characterisation of sites and stockpiles, to scalable remedial technologies that are able to be calibrated to the nature and extent of identified ASBINS. Recommendations are offered to further improve ASBINS assessment, remediation and risk communication with a goal to allow more sustainable responses to be implemented for this ubiquitous contaminant. REFERENCE “Sydney roadway asbestos triggers budget blowouts”, https://www.smh.com.au/national/nsw/
sydney-roadway-asbestos-triggers-budget-blowouts-20190427-p51huk.html, accessed 15 May 2019.
W26b
Copyright © CRC CARE Pty. Ltd., 2019
CleanUp Conference 2019Adelaide, Australia
8 –12 September 2019611
Table of Contentsfor this manuscript

AN ADAPTIVE APPROACH TO COMMUNITY ENGAGEMENT TO MANAGE LEGACY ASBESTOS CONTAMINATION IN A
RESIDENTIAL SETTING
Hamish Campbell, Michelle Battam
NSW Environment Protection Authority, 59–61 Goulburn Street, Sydney, NSW 2000, AUSTRALIA
hamish.campbell, [email protected]
INTRODUCTION AND OBJECTIVES Legacy site contamination is an ongoing environmental and human health issue in NSW. In the 1950’s-70’s, left-over material from asbestos-cement manufacturing was sometimes given away for use as landfill to raise low-lying or uneven land. In some cases, this included residential land. The harmful effects of asbestos were not well understood at the time. In recent years, friable asbestos has been identified in backyard soils at a number of residential properties located in areas of legacy asbestos landfilling. This has triggered a whole-of-government program to assess and manage risk at potentially affected communities. This presentation aims to describe some of the key challenges encountered in engaging with communities for this program, as well as the strategies adopted to meet these challenges. METHOD AND APPROACH At the program outset, prompt, broad-reaching community engagement was required to raise awareness of the issue and communicate potential risk. However, there were considerable uncertainties around the nature and extent of the issue, as well as the proposed government response. As such, an adaptive, “living” communications strategy was implemented to guide project personnel, ensure consistent information was provided to all affected parties, and to manage community expectations. As the program progressed, more targeted engagement was undertaken to facilitate a voluntary soil sampling program to aid in determining the nature and extent of the legacy issue. This engagement focused on raising awareness of human health risks from asbestos across an ethnically diverse population, whilst acknowledging landowner concerns about the possible economic consequences of having asbestos identified on their property. The strategy established a number of protocols to guide interactions with property owners and residents, with engagement methods including face to face meetings, provision of letters and fact sheets, and cold calling. RESULTS AND LESSONS LEARNED The adoption of an adaptive, community-focussed communications strategy led to voluntary soil sampling being taken up by the majority of property owners where it was offered. Furthermore, this allowed for ongoing consultation to support make-safe measures where required. Consistent messaging for key themes such as human health was critical to this outcome. The project team also identified that the primary issues of concern (e.g. health risk vs property value) will vary between stakeholders and this needs to be accounted for in community messaging.
W26c
Copyright © CRC CARE Pty. Ltd., 2019
CleanUp Conference 2019Adelaide, Australia8 –12 September 2019 612
Table of Contentsfor this manuscript

COMMUNITY SCALE ASBESTOS REMEDIATION USING DIGITAL DATA CAPTURE TOOLS
Ashton Betti
Senversa Pty Ltd, Level 17, 140 St Georges Terrace, Perth, 6000, AUSTRALIA
[email protected] INTRODUCTION The Wedge and Grey communities, located 150 km north of Perth, have been subject to construction of uncontrolled/unregulated recreational shacks since the 1950s. These communities now comprise more than 500 shacks/structures, which have been constructed of various materials including asbestos containing materials (ACM). A preliminary survey identified that significant volumes of ACM were present within the communities, both within building structures and weathered fragments (including fibres) in shallow surface soils. The Wedge and Grey communities are located in unvested reserves, under the management of the Department of Biodiversity, Conservation and Attractions (DBCA). The DBCA’s long term goal for the site is to have asbestos contamination removed and those areas deemed decontaminated. This presented a unique challenge requiring a ‘whole of community’ approach to remediation. METHODS A project was undertaken to remediate surface ACM (via raking, hand picking and removal) and to assess/risk rank areas that could not be remediated due to practical constraints. Given the extent of remediation required and unstructured nature of the communities, the project needed to be executed in a systematic and methodical manner, with clear and defined decision rules. An electronic data capture system was developed for the project based on an ArcGIS Collector Application, which could be installed on any iOS or android system. The application included satellite imagery, position tracking and bespoke electronic forms (including drop down options, comments fields and photograph options) that were assigned to each data point. Field records were synced to a web-based server via the cloud which enabled the data to be interrogated by the office project team in real time. A field pilot trial was completed and after minor amendments, the system was utilized for the full program of investigation and remediation. RESULTS AND DISCUSSION More than 500 data points were collected and assessed during the project. This application allowed multiple field teams, including involvement from trained local community members, to collect standardised data and make consistent decisions (based on defined data quality objectives) regarding actions associated with areas of identified ACM. To manage this data via more traditional data collection methods (paper field records, maps, etc.) would have been challenging and time consuming, with inconsistent and unreliable data a likely outcome. The digital system developed for this project enabled data to be queried and interrogated in real time by the office project team via a web-based system. This allowed anomalies or missed data points to be rectified within a short period via communication with the field teams. Photographs accompanying the data points allowed for further consideration of the data to assist in future remedial efforts. CONCLUSIONS The data capture system significantly reduced the data management time for the project, however data points still needed to be assessed and verified by the project team to ensure that there was no erroneous data, for which some was identified. For example, a data point
W26d
Copyright © CRC CARE Pty. Ltd., 2019
CleanUp Conference 2019Adelaide, Australia
8 –12 September 2019613
Table of Contentsfor this manuscript

was located in the ocean associated with a satellite failure. In future projects, some further training of field teams may assist in reducing the number of errors in field forms. The system also ensured a consistent approach to risk ranking areas of residual asbestos contamination. This type of application could be adopted for other project, which pose logistical challenges, whether it be in remote sites or for projects where multiple field teams are operating concurrently.
614
Table of Contentsfor this manuscript

BIOBURDEN OF DIOXIN-LIKE POLYCHLORINATED BIPHENYLS (PCBs) IN A TROPICAL CREEK: HEALTH RISK IMPLICATIONS
Amii Usese, Maureen Onyinye Egbuatu, Lucian Obinnaya Chukwu
Ecosystem Health and Pollution Management Unit,
Department of Marine Sciences, Faculty of Science, University of Lagos, NIGERIA [email protected], [email protected]
INTRODUCTION The increasing contamination of water ways and ecosystems by persistent organic pollutants (POPs) from various anthropogenic perturbations has been a major concern in many regions of the world. As man-made environmental pollutant, the level of toxicity exhibited by each PCB congener is a function of the pattern of chlorine substitution. Giesy et al. (2000) stated that the Coplanar PCBs, particularly (PCB-77, 81, 126 and 169) and mono-ortho PCBs (PCB-105,114, 118, 123, 156, 157, 167 and 189) is the most toxic congeners. Ross (2004) also noted that PCB congeners are slowly degraded in the environment and biomagnify in the food chain due to their lipophilic nature, thermal and biological stability. Agboyi Creek has been reported to be severely impacted by the fallouts of domestic and industrial activities over the years. This study provides an insight into the levels of dioxin-like PCB in surface water, sediment and biota to aid effective monitoring and policy formulation for the protection of this highly impacted ecosystem in southwest Nigeria. MATERIALS AND METHODS Sampling and processing of samples of surface water (n = 12), sediment (n = 12) and muscle tissues of fish, Oreochromis niloticus (n = 10) from 3 sites along a contamination gradient in Agboyi creek, Southwest Nigeria followed standard methods and methods reported by Igbo et al. (2018). Samples Digestion and Analysis A Hewlett Packard GC 5890 Series 11 with electron capture detection was used in the analysis of PCBs following the method of Chu et al. (1996) and confirmation was made using a Shimadzu GCMS QP2010. Blanks and replicate samples were included in each batch of analysis. The quality of procedure was also checked with recovery rate of individual PCB congeners from 87% to 100%. Risk Assessment of Polychlorinated Biphenyls Risk assessment was conducted according to USEPA (2000) methods for hazard index (HI) and Life time cancer risk (LCR) as follows:
• ADD (mg/kg/day) = (Cm X (IR) / (BW) • LCR = ADD X CSF • Hazard Index = ADD / Oral RfD
RESULTS AND DISCUSSION In total, 27 PCB congeners were detected in measureable but low concentrations during the study. Of the 12 dioxin-like PCBs detected, PCB 81 predominated in water, sediment and muscle tissue of Juvenile fish. The obtained concentrations of dioxin-like PCBs congeners in sediment (7.46 µg/kg) from Agboyi creek exceeded the Canadian Sediment Quality standard threshold effect level (CSQ TEL) of 0.03 µg/kg and the National Oceanic Atmospheric Administration threshold effect level (NOAA TEL) for fresh and marine sediments cited by Igbo et al. (2018). Overall, relatively higher concentrations of coplanar PCBs were recorded in adult fish muscle tissue when compared to the levels in water and sediment (Fig 1). As noted, by Wang and Zhong (2011), it is an indication of highly toxic samples. Estimated lifetime cancer risk (LCR) and hazard index (HI 1) indicates the safety of consumers at normal consumption
W26e
Copyright © CRC CARE Pty. Ltd., 2019
CleanUp Conference 2019Adelaide, Australia
8 –12 September 2019615
Table of Contentsfor this manuscript

rate. However, estimated toxic equivalent quotient (TEQ) of 1.12 which was higher than NOAA toxic equivalence factors (TEF) and the levels of non-ortho- substituted coplanar PCBs in fish suggests potential adverse effects in populations with high fish consumption rate after a prolonged period of time
Fig 1. Concentration of Coplanar PCBs in water, sediment, adult fish and juvenile fish
CONCLUSION Dioxin-like PCBs are toxic forms of persistent organic pollutants with potential adverse effects in both wildlife and humans. Although the estimated risk LCR and HI suggest no immediate adverse effects, relatively higher levels of most PCB congeners in samples and estimated TEQ has implications for ecological receptors and humans. This calls for continuous monitoring and enforcement of environmental regulations in the area. REFERENCES Chu, S., Yang, C. & Xu, X. (1996). Determination of Polychlorinated biphenyl congeners in
environmental samples. J. Environ. Sci.8: 57-63 Giesy J P, Kannan K, Blankenship A L, Jones, P. D. & Hilscherova, K. (2000) Dixon-like and
non-dioxin-like toxic effects of polychlorinated biphenyls (PCBs): Implications for risk assessment Central European J. of Pub. Health, 8 (SUPPL.), 43–45
Igbo, J.K., Chukwu, L.O. & Oyewo, E.O. (2018). Assessment of Polychlorinated Biphenyls (PCBs) in Water, Sediments and Biota from E-waste Dumpsites in Lagos and Osun States, South-West, Nigeria. J. Appl. Sci. Environ. Manage. 22 (4): 459 – 464
NOAA (National Oceanic and Atmospheric Administration) (1999) Screening quick reference tables (SquiRTs) <http://response.restoration.noaa.gov/cpr/sediment/squirt/squirt. html. Last viewed 03/07/15
Ross, G. 2004. The public health implications of polychlorinated biphenyls (PCBs) in the environment. Ecotoxicol. Environ. Safety 59: 275–291.
USEPA (United States Environmental Protection Agency). (2000). Guidance for assessing chemical contaminant data for use in fish advisories. In Risk assessment and fish consumption limits (Vol 2, 3rd ed). Washington, DC: Office of Science and Technology and Office of Water. (EPA/823/B-97/009).
Wang,,Y. & Zhong, G. (2011). Characterization and risk assessment of PCBs in soils and vegetables near an electronic waste recycling site, South-China. Chemophere. 85(3): 344-350.
0
10
20
30
40
50
PCB -77
PCB -81
PCB-105
PCB-114
PCB-118
PCB-123
PCB-126
PCB-156
PCB-157
PCB-167
PCB-169
PCB-189
Conc
entr
atio
n of
PCB
s (µ
g/L,
µg
/kg)
WATER SEDIMENT ADULT FISH JUVENILE FISH
616
Table of Contentsfor this manuscript

NOT IN OUR BACKYARD… RESEARCH FINDINGS ON THE EMERGING CONTAMINATES FROM CLANDESTINE
LABORATORIES AND THE IMPACT ON THE HEALTH AND ENVIRONMENT OF REGIONAL AUSTRALIAN COMMUNITIES
Juliet L Duffy1, Kathy R Woolley2
1Regional EnviroScience Pty Ltd, Dubbo, NSW, AUSTRALIA
2Western Research Institute, Bathurst, NSW, AUSTRALIA [email protected]
INTRODUCTION This abstract will detail the findings of desktop research undertaken by the Western Research Institute and Regional EnviroScience Pty Ltd on the impacts of clandestine laboratories on regional communities in Australia. The research covers some of the health, social, environmental and financial impacts these laboratories are having in regional Australia. METHODS Analysis on geographically targeted data related to crimes where drug manufacturing has been along with desktop research to seek to profile the issue of illegal drug laboratories in Australia is presented. A desktop review of available data to was undertaken to prepare a summary of crime statistics illustrating drug related incident longitudinal patterns in Australia. Available data was collated on drug related crime and illegal drug laboratories for Australian regional areas. Research for information on impacts arising from illegal drug laboratories on property, the environment and human health. RESULTS AND DISCUSSION The findings indicate large volume of chemicals are required in production processes - many are highly toxic and corrosive. Combined with the volatility of by products and chemicals (particularly solvents which are the most common chemicals found) easily evaporate and may produce flammable vapours. Complexities found include the contamination of specific locations and potentially contamination in the surrounding soils, waterways and air. Compounded by unskilled workers lacking chemistry knowledge, lack of personal protective equipment when "cooking" and when sites are detected. The findings also indicate there is a high prevalence of children on site. While the statistics that show a decline in the number of detections of clandestine laboratories over the past 5 years, the risks relating to the cleanup of sites used for laboratories and the lingering nature of the contamination on those sites remains an area of concern. Caldicott et al (2005) identified the following conclusions in their research paper regarding the management of clandestine drug laboratories:
• There are significant health and environmental implications from contaminated sites • First responders (those responsible for identification of sites and
remediation/dismantling etcetera including police, ambulance officers, health inspectors and site remediation officers) need to have specialised knowledge of risks associated with current and past laboratory sites
W26f
Copyright © CRC CARE Pty. Ltd., 2019
CleanUp Conference 2019Adelaide, Australia
8 –12 September 2019617
Table of Contentsfor this manuscript

The long-term impacts in environmental terms of clandestine laboratories identified for every kilogram of methamphetamine an estimated 6-10 kilograms of hazardous or toxic waste is produced. Traces of chemicals can pervade the walls, drapes, carpets, and furniture of a laboratory site making the contamination a long term or enduring issue for future site uses. Care in the location for disposal of on-site chemicals is needed. Observation of the avoidance buffer zones in local land use planning guidelines and other guidance materials should be considered, including proximity to waterways, fields where stock graze, areas of agricultural production or urban areas when determining sites for chemical disposal. Chemical vapours may be present from laboratories and can be a significant safety risk. It is critical that sites have ventilation and air flow established. enHealth identified that while there had been a decline in both illicit drug incidence and detections of clandestine drug laboratories, the risks associated with cleanup of sites used for drug manufacturing remains high. enHealth echoed the findings of Caldicott et all from 2005 some thirteen years later in their 2018 report identifying that there remained ill-defined procedures and lack of understanding of long-term impacts on property and health of those working in the laboratories or living nearby contaminated sites. CONCLUSIONS The research notes that the decline in the number of detected laboratories does not necessarily indicate a reduction in the volume of drugs being produced. Production levels are influenced by the skills of the people involved and the method of manufacture and the quality of the equipment being used. Nor does the fall in detections lessen the risk to humans and the environment particularly in regional Australia. REFERENCES Caldicott et al, (2005) Clandestine drug laboratories in Australia and the potential harm,
Australian and New Zealand Journal of Public Health, vol 29, No: 2. enHealth, (2017) Guidance on: Clandestine Drug Laboratories and Public Health Risks,
https://www.health.gov.au/internet/main/publishing.nsf/content/A12B57E41EC9F326CA257BF0001F9E7D/$File/Guidance-Clandestine-Drug-Laboratories-Public-Health.pdf.Accessed March 2019.
Australian Criminal Intelligence Commission, (2018) “Illicit Drug Data Report, 2016-17”, p 117
United Nations Office on Drugs and Crime, (2017) Illustrated guide for the Disposal of Chemicals used in the Illicit manufacture of drugs, p3
618
Table of Contentsfor this manuscript

HOW MUCH WILL YOUR REMEDIATION PROJECT REALLY COST?
John Hunt, Ian Brookman, William Taggart
Ventia Utility Services Pty Ltd, 1 Homebush Bay Drive, Rhodes, NSW 2138, AUSTRALIA [email protected]
INTRODUCTION Predicting the cost of remediation projects has been a major issue for the industry since the remediation industry emerged as a separate field of engineering in the 1990s and today many projects still end up in disputes over cost overruns. The reasons are manyfold but the crux of the problem is that cost estimates are based on quantity estimates, and quantity estimates are notoriously uncertain. This is because they are based on subsurface data which may not be representative, coupled with many assumptions, extrapolations, interpolations and guesstimates. A second but lesser source of uncertainty is the monetary rates assumed for various remediation activities. The third source of uncertainty is the many ancillary engineering related costs that may be forgotten in the process of focussing on the remediation part of a project. The presentation will analyse Ventia’s historical data base of remediation project scopes and costs to identify the ancillary project activities that can significantly increase the overall cost of remediation for what appears to be an otherwise straightforward remediation project. METHODS Ventia’s project data base of mainly ex-situ remediation projects has been dissected according to the main types of remediation sites including gasworks sites, chlorinated chemical sites, hydrocarbon sites, landfill sites, defence sites and sediment projects. These have been augmented by published remediation case studies. The costs of remediation have been converted to 2018 dollars, and the adjusted costs cross- plotted against remediation volume to identify outliers in the overall remediation rate for the various types of sites. The scopes and costs of the outliers have then been dissected to identify the reasons for the higher remediation rates. RESULTS AND DISCUSSION The reasons that remediation rates (and costs) within the various types of remediation projects may vary widely are multiple and may include among other things:
• Geotechnical considerations particularly where retaining walls or difficult foundation conditions exist;
• Incorrect predictions of waste classification, where the classification of the waste is underestimated;
• The different types of remediation methods that may be used to remediate a particular type of contaminant;
• Unforeseen (and foreseen) technical issues; • Time and space considerations (often driven by development requirements); and • The application of landfill levies.
CONCLUSIONS Remediation rates and costs can vary significantly for types of contaminants and contaminated sites. The reasons are manyfold, but if any are overlooked in project planning significant project cost overruns may eventuate.
W27a
Copyright © CRC CARE Pty. Ltd., 2019
CleanUp Conference 2019Adelaide, Australia
8 –12 September 2019619
Table of Contentsfor this manuscript

REVISITING REMEDIATION — EVALUATING FIELD AND LABORATORY DATA TO ASSESS THE
SUCCESS OF A HISTORICAL REMEDIATION PROJECT
Zoe Smith
AECOM, Level 21 420 George St, Sydney, 2000, AUSTRALIA [email protected]
INTRODUCTION Forensic evaluation of a remediated site has demonstrated that poor design and administrative controls are drives for potential failure to adequately control risks. Investigation works required in support of major linear infrastructure projects in the Sydney region have resulted in a number of historically contaminated and remediated sites requiring additional assessment to inform ongoing planning and construction works. AECOM Geosciences and Remediation Services (GRS) Team has conducted ongoing water quality monitoring and groundwater sampling within a historic landfill which has an active remediation system. The system was installed to reduce leachate migrating off-site. The site in Tempe, NSW was a former brickpit until the 1920’s when it was repurposed as an uncontrolled landfill till the mid-1970’s. This landfill was historically poorly regulated and managed which has caused a legacy of ongoing waste and leachate management issues. Historical remediation works were undertaken to manage leachate production, which included the construction of a 1.36 km long and 0.5 m wide leachate cut-off wall being installed to a maximum depth of 18 metres below ground level along the landfill perimeter and subsequent capping with a 0.7 m clay layer. The cut off wall was designed to prevent the migration of leachate from the site using a collection system to transfer leachate for treatment prior to discharge to stormwater in accordance with and Environmental Protection License. ASSESMENT The landfill is situated adjacent to Alexandra Canal, a tidally influenced open water body. Groundwater data, from 25 monitoring wells installed both inside and outside the length of the leachate cut-off wall, comprised laboratory analytical results and loggers monitoring groundwater depth and electric conductivity. Electric conductivity monitoring was also conducted to better understand both groundwater and surface water interactions with the leachate in the landfill. The ongoing nature of the monitoring program has allowed for the opportunity to evaluate:
• the effectiveness of historical remedial works conducted at the landfill • the suitability of the remediation system for long term management of leachate • groundwater and surface water interactions • the importance of stakeholder engagement in ensuring compliance with long term
environment management plans; • changes and advancement in technologies within the contaminated land industry
RESULTS AND DISCUSSION The data obtained indicated that variations in the depth of groundwater, landfill leachate and electric conductivity within monitoring wells both on and off-site correlated with tidal fluctuations. These findings resulted in challenges for ongoing leachate management including leachate overtopping the barrier wall and insufficient capacity of the existing system to manage the volume of leachate being produced. Environmental management plans are commonly prepared following completion of remediation projects to identify and mitigate key ongoing risks to both human health and the environment. Although often highly detailed, in some instances there is no delegated
W27b
Copyright © CRC CARE Pty. Ltd., 2019
CleanUp Conference 2019Adelaide, Australia8 –12 September 2019 620
Table of Contentsfor this manuscript

authority to monitor the implementation of mitigation measures on site and to ensure that systems are being utilised as originally purposed. This can lead to challenges when planning and implementing remediation systems that are managed by landowners, as was the case on this site. Although the onus is on the property owner to ensure that systems are being managed correctly this information and appropriate training is not always provided to tenants. CONCLUSIONS The long-term effectiveness of managements controls on remediated sites is rarely evaluated. This site has demonstrated that design and administrative controls have led to failure in success of the remedial works. This is a result of poor regulatory control, involvement of multiple stakeholders and poor design. As consultants, planning remediation must include detailed assessment of these challenges prior to commencing works to ensure that projects are resilient.
621
Table of Contentsfor this manuscript

ACHIEVING THE SUCCESSFUL DELIVERY OF ONE OF SYDNEY’S LARGEST REMEDIATION PROJECTS: BARANGAROO
Adam Fletcher
Ventia Utility Services Pty Ltd,
Tower 1 1/495 Victoria Ave, Chatswood NSW 2067, AUSTRALIA [email protected]
Australia is going through an unparalleled phase of investment in the metropolitan areas fuelled by factors such as population growth, foreign investment and community and political sentiment. A significant portion of this investment has been focused on urban renewal where underutilised often industrial sites are being converted into high density mixed use communities. In addition, to the residential and commercial property investment, the state governments are also aggressively investing in much needed infrastructure to support inner metropolitan living as well as to connect outer suburbs to metropolitan areas and employment hubs.
As much of this redevelopment is centred around brown field sites, the management of contaminated soils and groundwater has become a contentious issue. This is exacerbated by the fact that many projects require contaminated soils to be removed from site to support construction activities. In addition, many such sites are spatially constrained and often reside in sensitive communities making onsite treatment a complex issue.
This presentation will focus on the one of Sydney’s largest remediation projects involving excavation and removal of half a million tonnes of coal tar and asbestos impacted soils in one of Sydney’s most affluent business precincts.
The presentation will explore the constraints experienced by the remediation contractor on site and the strategies utilised to address the risks including the design and construction of a custom engineered rolling odour control enclosure, bringing first of its kind engineering technology to remove a major safety risk. Traditionally removal of the enclosure which presents months of high-risk crane lifts to disassemble. However, an innovative idea developed by our engineering team introduced an idea of using rollers and tracks to winch the structure off the excavation to a safe work area. Subsequent computer aided design and modelling allowed the design to be prototyped and tested in a virtual environment eliminating the requirement to build test units and fast-tracking fabrication. Using technology this single idea has effectively eliminated one of the projects greatest safety risks.
The challenges overcome during the delivery of this project have presented a number of invaluable lessons to be learnt when delivering projects of this size, scale and complexity that can easily be replicated on future projects meaning Ventia continues to be prepared for any challenged encountered during the clean-up of a contaminated site, big or small.
W27c
Copyright © CRC CARE Pty. Ltd., 2019
CleanUp Conference 2019Adelaide, Australia8 –12 September 2019 622
Table of Contentsfor this manuscript

WHAT’S UNDER THE TENT? AN INSIGHT INTO THE REMEDIAL OPERATIONS OF THE BARANGAROO BLOCKS 4 & 5 REMEDIATION PROJECT
Dan O’Hanlon, Nigel Drought, Allan Garland
Ventia Utility Services Pty Ltd, 1 Homebush Bay Drive, Rhodes, NSW 2138, AUSTRALIA
BACKGROUND In May 2009, the NSW EPA determined that part of the Barangaroo site and part of Hickson Road (corresponding with part of the site of the former Millers Point Gas Works) was contaminated to such an extent as to present a significant risk of harm (SROH) to human health and the environment. As a result, the NSW EPA declared this area to be a Remediation Site (Declaration Number 21122; Area Number 3221) under the then section 9 of the Contaminated Land Management (CLM) Act (1997), hereafter referred to as the “Declaration Area”. INTRODUCTION In 2017, Ventia was engaged by Lendlease Building to complete the Bulk Excavation and Remediation Works Package for the Barangaroo Blocks 4 & 5 Project, involving the excavation and disposal of over 450,000 tonnes of contaminated waste within a negative pressure enclosure. The complexity of the project is difficult to grasp and unbeknownst to the majority who have simply observed ‘a big white tent’ on the site for the last 18 months. This presentation aims to provide an insight into the day to day operations in delivering this iconic remediation project in the heart of the City of Sydney. KEY DISCUSSION POINTS The key discussion points of this presentation will be:
• Ensuring the safety of our people - Occupational Health and Hygiene monitoring; • Managing plant on plant interaction within the enclosure; • Daily reporting of excavation and disposal quantities; • The development of an in-situ contamination model; • Progressive validation of the site and managing the potential for cross-contamination; • Disposing of over 450,000 tonnes of contaminated waste and the pressures on the
receiving facilities; • Managing and coordinating a large fleet of road trucks in and out of the city daily; • Management of the atmosphere inside the enclosure; • Odour management onsite and during the transportation of waste; • Coordinating the bulk import of virgin excavated natural material; • Managing the numerous tiers of review and approval.
CONCLUSIONS The experience and knowledge gained by Ventia’s Project Team in the delivery of Barangaroo Blocks 4 and 5 will be integral to further improving how we plan and deliver future remediation projects. The specific lessons learned by individual members of the project team and the team as a whole, will be presented here.
W27d
Copyright © CRC CARE Pty. Ltd., 2019
CleanUp Conference 2019Adelaide, Australia
8 –12 September 2019623
Table of Contentsfor this manuscript

ELIZABETH QUAY DEVELOPMENT, PERTH WA: CASE STUDY
David Sim, Alan Foley, Carl Davies
RPS, 27-31 Troode Street, West Perth, 6005, AUSTRALIA [email protected]
INTRODUCTION Elizabeth Quay is the $440 million redevelopment of Perth’s Swan River foreshore, creating a new waterfront destination and reconnecting the river to the City. The project planning commenced in 2007 and the precinct was officially opened in 2016 to widespread acclaim. The 13 ha site presented many challenges, being a constrained inner-city site, located on a series of former river in-fill deposits and encompassing the Swan River which is Perth’s most prominent environmental and culturally sensitive site. Potential contamination sources included historic fill soils, river sediments and urban runoff discharges, together with underlying Acid Sulfate Soils (ASS). This presentation contains the details of key planning, design and construction elements that realised the successful outcomes of the project, as they relate to the site’s remediation and management of environmental impacts. The presenting author was engaged by the Metropolitan Redevelopment Authority (MRA) as lead Technical Advisor and Project Director - Environment over the life of the project. DEVELOPMENT DETAIL The scope of the development entailed creation of a new inlet and surrounding public realm area, together with the formation of 10 separate build lots. This involved:
• geotechnical ground improvement works; • removal of contaminated material reported above human health / ecological
guidelines (36,000 m3), including polycyclic aromatic hydrocarbons - PAH’s, pesticides and metals (lead, copper);
• major servicing and road relocation; • construction of the inlet walls; • dredging of sediments for boating channels (8,500 m3); predominately contaminated
by metals, PAH’s, pesticides and asbestos fibres; • excavation of the inlet to ~4.5 m below ground level (including 110,000 m3 of ASS); • construction of the island, promenades, event spaces, footbridge and build lots.
PROJECT PLANNING AND DESIGN Critical in the design was that the inlet had to maintain water quality post-construction comparable to the adjacent Swan River (i.e. effective flushing). It was required that there be minimal impacts to the Swan River during construction, through considered staging, best-selection of site working methods, effective controls on all excavation, dewatering and dredging to avoid mobilisation of contaminants and minimise ASS oxidation, and sustainable segregation and re-use of soils. All of this needed to be controlled through detailed investigation, design, management planning and ongoing monitoring. Key features of this work that ensured ultimate project success were:
• baseline studies commenced early to ascertain existing site conditions including for contamination, water quality (river and groundwater), ASS and benthic habitats;
• hydrodynamic modelling to support inlet design and water quality assessment, and likely impacts of dredging;
• groundwater modelling to support inlet design and assessment of dewatering; • trigger levels established for key groundwater, water quality and sedimentation
impacts derived from known "baseline" or modelled conditions rather than reliance on generic literature values;
• all management plans developed up-front (17 separate management plans) to accompany environmental approvals, designed to be “workable”, to avoid construction delays and being-based on inputs from the contracting industry.
W27e
Copyright © CRC CARE Pty. Ltd., 2019
CleanUp Conference 2019Adelaide, Australia8 –12 September 2019 624
Table of Contentsfor this manuscript
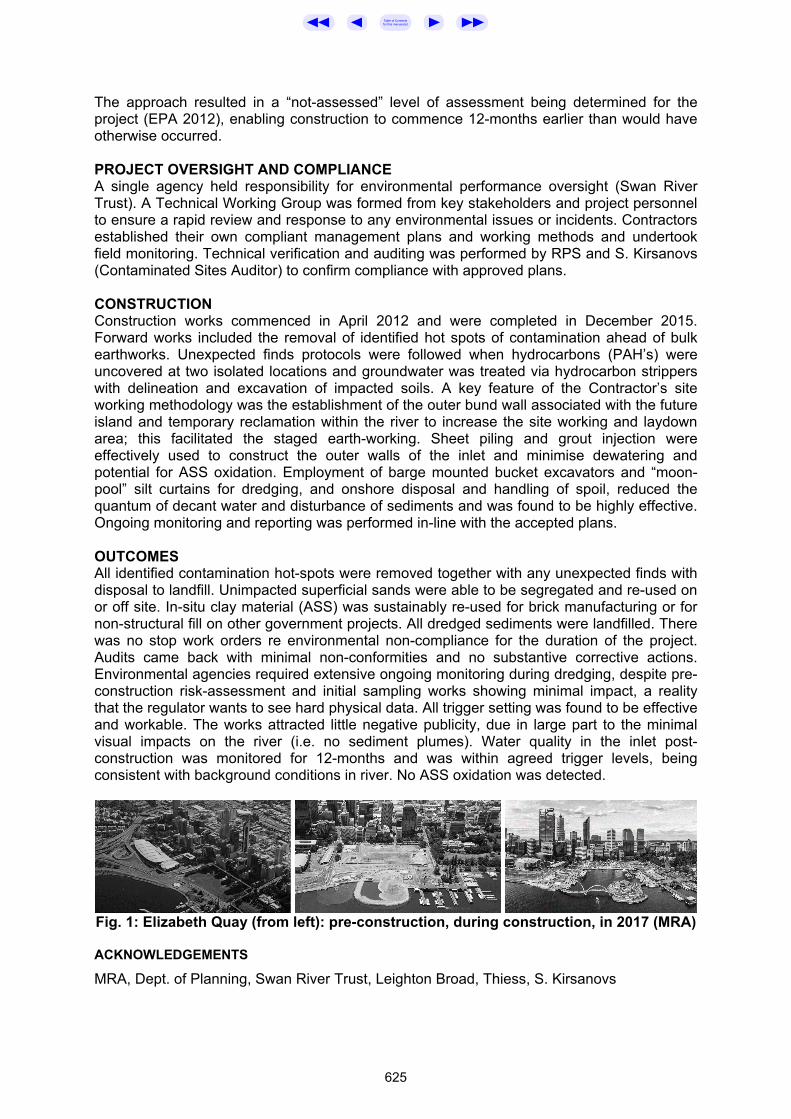
The approach resulted in a “not-assessed” level of assessment being determined for the project (EPA 2012), enabling construction to commence 12-months earlier than would have otherwise occurred. PROJECT OVERSIGHT AND COMPLIANCE A single agency held responsibility for environmental performance oversight (Swan River Trust). A Technical Working Group was formed from key stakeholders and project personnel to ensure a rapid review and response to any environmental issues or incidents. Contractors established their own compliant management plans and working methods and undertook field monitoring. Technical verification and auditing was performed by RPS and S. Kirsanovs (Contaminated Sites Auditor) to confirm compliance with approved plans. CONSTRUCTION Construction works commenced in April 2012 and were completed in December 2015. Forward works included the removal of identified hot spots of contamination ahead of bulk earthworks. Unexpected finds protocols were followed when hydrocarbons (PAH’s) were uncovered at two isolated locations and groundwater was treated via hydrocarbon strippers with delineation and excavation of impacted soils. A key feature of the Contractor’s site working methodology was the establishment of the outer bund wall associated with the future island and temporary reclamation within the river to increase the site working and laydown area; this facilitated the staged earth-working. Sheet piling and grout injection were effectively used to construct the outer walls of the inlet and minimise dewatering and potential for ASS oxidation. Employment of barge mounted bucket excavators and “moon-pool” silt curtains for dredging, and onshore disposal and handling of spoil, reduced the quantum of decant water and disturbance of sediments and was found to be highly effective. Ongoing monitoring and reporting was performed in-line with the accepted plans. OUTCOMES All identified contamination hot-spots were removed together with any unexpected finds with disposal to landfill. Unimpacted superficial sands were able to be segregated and re-used on or off site. In-situ clay material (ASS) was sustainably re-used for brick manufacturing or for non-structural fill on other government projects. All dredged sediments were landfilled. There was no stop work orders re environmental non-compliance for the duration of the project. Audits came back with minimal non-conformities and no substantive corrective actions. Environmental agencies required extensive ongoing monitoring during dredging, despite pre-construction risk-assessment and initial sampling works showing minimal impact, a reality that the regulator wants to see hard physical data. All trigger setting was found to be effective and workable. The works attracted little negative publicity, due in large part to the minimal visual impacts on the river (i.e. no sediment plumes). Water quality in the inlet post-construction was monitored for 12-months and was within agreed trigger levels, being consistent with background conditions in river. No ASS oxidation was detected.
Fig. 1: Elizabeth Quay (from left): pre-construction, during construction, in 2017 (MRA) ACKNOWLEDGEMENTS
MRA, Dept. of Planning, Swan River Trust, Leighton Broad, Thiess, S. Kirsanovs
625
Table of Contentsfor this manuscript

EFFECTIVE PFAS REHABILITATION OF A LARGE FORMER FIRE TRAINING FACILITY
Michael Rehfisch, Juan Riveros, Phoebe Hopkins
Senversa Pty Ltd, L6, 15 William Street, Melbourne, AUSTRALIA
INTRODUCTION AND BACKGROUND Use of legacy PFAS-containing aqueous film forming foams at a former fire fighter training campus resulted in widespread site and downstream receiving environment impacts. Given the scale of impact, the unique environmental setting, technical limitations and lack of commercially available vendor treatment options and in light of overall costs and residual management requirements, a practical risk-based response was the only option. Perceived ‘precedence’ and other sensitivities resulted in significant regulatory delays and intervention, but ultimately a response consistent with the environment protection principles and commensurate with key risk drivers could be developed for the site. This approach was formulated prior to the development of the PFAS National Environmental Management Plan (NEMP) but the works in gaining approval for the project ultimately informed the successful development of early and subsequent version of the document. With works underway, a key element of demonstrating success is real time monitoring and fast turnaround of large datasets, so that a web-enabled GIS database has been established to house and rapidly interrogate data and to allow rolling statistical assessment to assist in decision-making and to inform stakeholders. It is expected that similar rehabilitation approaches will be implemented across the country, in particular as we struggle as a society to deal with such widespread contamination where the traditional approach of complete ‘source’ removal is impracticable. APPROACH PFAS impacted media over an area of at least 150 hectares meant it was not practicable to contemplate an option of ‘total clean up’. Further, the primary risk was associated with impacted overland surface water flow and bank seepage from stormwater and effluent drainage from the main (10 ha) former fire training area. During the original construction of the fire training area, it was raised to create a work platform, and this resulted in a localised, shallow, perched water-bearing system that was surcharged when large volumes of water were used during training exercises. This resulted in a large secondary ‘source’ area. Whilst initial works comprising the diversion of the local creek to isolate this area and associated effluent storage dams from the wider downstream environment reduced discharge, the presence of the large mobile PFAS mass meant the risk of ongoing discharge could not be excluded. The catchment drainage also placed significant stress on the available storage capacity of the site, especially in the winter months. The dams also presented an ongoing bioaccumulation and ecological transference risk. A proven engineering response was developed comprising a consolidation of impacted media into a central area and isolated by a low permeability barrier lining and capping system, with associated package waste water treatment plant to deal with the large volumes of water. Surface water bodies are being decommissioned such that the bioaccumulation and ecological transference risk is reduced. Risk assessment indicates that, post-rehabilitation, risks to terrestrial ecosystems and human health are estimated to be low and acceptable, and that the off-site flux of PFAS will be reduced. A key aspect of the terrestrial ecological risk assessment has been demonstrating the likely absence of particularly sensitive species groups (i.e. insectivorous mammals which can be exposed to elevated concentrations of PFAS which has accumulated in their diet),
W27f
Copyright © CRC CARE Pty. Ltd., 2019
CleanUp Conference 2019Adelaide, Australia8 –12 September 2019 626
Table of Contentsfor this manuscript

and detailed consideration of the depth and extent of residual impacts to estimate representative exposure concentrations. The In-Situ Soil Management Area (ISSMA) involves the three key construction stages comprising the pre-filling, filling and post filling stages, each broken down into two main phases of works, Stage 1 and Stage 2. This approach has been deployed to ensure basal lining, filling and capping is conducted during favourable weather conditions, in a manner to minimise the saturation of engineered backfill forming the bulk fill of the ISSMA structure. Experience in deploying geosynthetic lining materials is an important attribute for any remediation contractor. Whilst the Victorian Best Practice Environmental Management guideline for the Siting, Design, Operation and Rehabilitation of Landfills (EPA Publication 788) [Landfill BPEM], the Landfill BPEM was not developed to present guidance on the design considerations for in-situ soil management and containment solutions. The PFAS NEMP Version 2.0 Consultant Draft has, in its ‘significant update’ provided useful guidance for the design considerations in developing on-site storage, stockpile and long-term containment of PFAS impacted media (section 10 of the document). Key to any design is ensuring it is relevant to the local hydrogeological and climatic conditions, as there is no one size fits all approach. Parties reviewing and approving long term solutions are cautioned against blanket application guidance frameworks developed for different applications. DISCUSSION AND CONCLUSIONS The approach highlighted regulatory difficulties in adopting a risk-based approach and approvals process, with the only comparable guidance on the use of geosynthetics being the Landfill BPEM. Further development of guidance and decision-making on long term management strategies has now been incorporated into the Version 2.0 Consultation Draft of the PFAS NEMP, providing additional certainty that site-specific responses, rather than blanket prohibition of a particular response, can be achieved.
627
Table of Contentsfor this manuscript

CLEANUP 2019 — THE UNSESSION
Paul Nathanail1, Ravi Naidu2, Prashant Srivastava3
1Land Quality Management Ltd, UNIP, Triumph Road, Nottingham NG7 2TU, UK 2Cooperative Research Centre for Contamination Assessment and Remediation of the
Environment, ATC Building, University of Newcastle, Callaghan NSW 2308, AUSTRALIA 3Cooperative Research Centre for Contamination Assessment and Remediation of the
Environment, University of South Australia, Mawson Lakes, SA 5095, AUSTRALIA [email protected]
INTRODUCTION An unsession is a conference session where the conference delegates set the agenda and the unsession chair facilitates discussion and draws together outcomes, opportunities and actions. Previous unsessions at CleanUp 2017 and the Global CleanUp Congress 2018 allowed delegates to focus on topics raised in the conference such as emerging contaminants, the role of professional qualifications, decision making in the face of scientific uncertainty and the level of risk posed by PFAS. METHODS Congress delegates are welcome to make suggestions of topics to consider during the unsession by writing on the unsession poster in the poster area or by emailing the chair. The most popular topics will be discussed during the unsession and the results fed back to the conference during the closing plenary. RESULTS AND DISCUSSION Anyone and everyone is welcome to attend the unsession and to contribute on the topics of interest. The results will depend on the nature of our discussions during the unsession. A brief summary will be presented during the closing plenary and if appropriate written up after the Conference for wider dissemination. CONCLUSIONS The unsession is our chance to set the agenda and respond to pressing interests and needs. We look forward to your engagement!
W41a
Copyright © CRC CARE Pty. Ltd., 2019
CleanUp Conference 2019Adelaide, Australia8 –12 September 2019 628
Table of Contentsfor this manuscript

Author IndexAAbbasi, Sedigheh . . . . . . . . . . . . . M46d 238
M51-P43 337T23d 378
Abriola, Linda . . . . . . . . . . . . . . . . . M42a 190Abunada, Ziyad . . . . . . . . . . . . . . . T25d 400Adamson, David T. . . . . . . . . . . . . M21b 54Adhikari, Sagar . . . . . . . . . . . . . . . M47d 249Aitken, Robert John . . . . . . . . . . . T24c 387Akanksha . . . . . . . . . . . . . . . . . . . . T46f 547Akhtar, Muhammad Javed . . . . T35c 463Akladiss, Naji . . . . . . . . . . . . . . . . . M24b 79Alam, Faraz . . . . . . . . . . . . . . . . . . M46b 234Al Amin, Md. . . . . . . . . . . . . . . . . . . W21e 563Alcalde, David . . . . . . . . . . . . . . . . T33e 443Alghurabi, Abbas . . . . . . . . . . . . . M32d 133Allen, John M. . . . . . . . . . . . . . . . . M32c 131Al-Tabbaa, Abir . . . . . . . . . . . . . . . T25d 400Alvertos, Antonios E. . . . . . . . . . . M32c 131Amon, Freya . . . . . . . . . . . . . . . . . . M51-P40 332
T43c 507W25c 599
Angell, Jonathon . . . . . . . . . . . . . . W21a 554Annamalai, Prasath . . . . . . . . . . . M22d 66Antin, Luminita . . . . . . . . . . . . . . . . M24c 81Anumol, Tarun . . . . . . . . . . . . . . . . W21f 565Aragones, Jordi . . . . . . . . . . . . . . . M37e 180
M47f 253Arblaster, Jennifer . . . . . . . . . . . . T21a 354
T34b 449Arends, Chris . . . . . . . . . . . . . . . . . T33c 439Arshadi, Masoud . . . . . . . . . . . . . . M42a 190Asghar, Hafiz Naeem . . . . . . . . . T35c 463
BBabina, Kateryna . . . . . . . . . . . . . W24c 591
W24d 593Baciocchi, Renato . . . . . . . . . . . . M33b 140
M37a 172T25b 396
Bahar, Md. Mezbaul . . . . . . . . . . M26c 101M26d 103M33c 142T34d 453T43f 514
Bailey, Skyla . . . . . . . . . . . . . . . . . . M51-P8 269Bala Kumari, Preety . . . . . . . . . . T46f 547Balanova, Eugenia . . . . . . . . . . . . M43b 203Ball, Andrew S. . . . . . . . . . . . . . . . M43a 201Barber, Charlie . . . . . . . . . . . . . . . M44d 219
T34c 451Bari, A.S.M. Fazle . . . . . . . . . . . . . M51-P39 330Barker, Andrew . . . . . . . . . . . . . . . T43c 507Barnes, Marie . . . . . . . . . . . . . . . . M33a 138Baronio, Matt . . . . . . . . . . . . . . . . . T23c 376Battam, Michelle . . . . . . . . . . . . . . W26c 612Battye, Nick . . . . . . . . . . . . . . . . . . . M32a 128Beaufoy, Mark . . . . . . . . . . . . . . . . T22e 371Beck, Peter . . . . . . . . . . . . . . . . . . . T23b 374Bekele, Dawit . . . . . . . . . . . . . . . . . M33c 142
M33e 146M47c 247
M51-P15 283M51-P19 291M51-P38 328
T34d 453T41b 481T41c 483T41e 487
Bell, Lyndon . . . . . . . . . . . . . . . . . . M27b 110Bennett, Mark . . . . . . . . . . . . . . . . T44d 522Betti, Ashton . . . . . . . . . . . . . . . . . . W26d 613Biegel-Engler, Annegret . . . . . . M31e 126Birke, Volker . . . . . . . . . . . . . . . . . . M22b 62
T25a 394Biswas, Bhabananda . . . . . . . . . M51-P44 339
T32d 429
Bolan, Nanthi . . . . . . . . . . . . . . . . . M25e 95M26b 99M26d 103M45a 224
M51-P3 261M51-P18 289M51-P23 298M51-P39 330
Bowles, Karl C. . . . . . . . . . . . . . . . M41e 188M44c 217W21c 559
Bradley, Adam . . . . . . . . . . . . . . . . M36d 166Bradney, Lauren . . . . . . . . . . . . . . M45a 224Brewer, R. . . . . . . . . . . . . . . . . . . . . M51-P45 341Brix, Jacob . . . . . . . . . . . . . . . . . . . M46e 240Brodie, Brendan M. . . . . . . . . . . . M35f 158
M37b 174Brookman, Ian . . . . . . . . . . . . . . . . W27a 619Brown, Juliane . . . . . . . . . . . . . . . . T34b 449Bryant, Dan . . . . . . . . . . . . . . . . . . . M35a 148Burmeier, Harald . . . . . . . . . . . . . M22b 62
T25a 394Burns, David . . . . . . . . . . . . . . . . . . M51-P36 324Bush, Richard . . . . . . . . . . . . . . . . T31e 420Butterfield, David . . . . . . . . . . . . . T26d 406Byrd, Jennifer . . . . . . . . . . . . . . . . . M31d 124
M35b 150
CCáceres, Tanya . . . . . . . . . . . . . . . M51-P35 322Caluzzi, Julia . . . . . . . . . . . . . . . . . T23c 376Campbell, Hamish . . . . . . . . . . . . W26c 612Capiro, Natalie . . . . . . . . . . . . . . . . M42a 190Carey, Grant R. . . . . . . . . . . . . . . . M22a 60Carrier, Richard . . . . . . . . . . . . . . . M31a 118Carruthers-Taylor, Temma . . . . . M51-P20 293Cave, Mark . . . . . . . . . . . . . . . . . . . T36a 469Centner, Marc . . . . . . . . . . . . . . . . W21b 557
W21c 559Chadalavada, Sreenivasulu . . . M33c 142
M33e 146M51-P15 283M51-P27 306M51-P38 328M51-P47 345
T41b 481T41c 483T41e 487T42f 501
Chaiyasut, Chaiyavat . . . . . . . . . M51-P47 345Chakma, Sumedha . . . . . . . . . . . T25a 394Champness, David . . . . . . . . . . . M51-P4 263
M51-P12 277W22f 574
Chandra, Anand P. . . . . . . . . . . . . T24d 389Chandrasekar, Sadhvika . . . . . . M51-P27 306Chang, Han-Yu . . . . . . . . . . . . . . . M51-P31 314Chapman, Mark . . . . . . . . . . . . . . M27a 109Charteris, Stefan . . . . . . . . . . . . . T43d 509Chen, Bruce . . . . . . . . . . . . . . . . . . M24d 83Chen, Fanrong . . . . . . . . . . . . . . . . M46f 242Chen, Shyh-Wei . . . . . . . . . . . . . . M51-P31 314Chen, Yongliang . . . . . . . . . . . . . . T45c 529Cheng, Ying . . . . . . . . . . . . . . . . . . M51-P18 289Chiang, S.-Y. . . . . . . . . . . . . . . . . . . T41d 485Choi, Jiyeon . . . . . . . . . . . . . . . . . . M51-P33 318Choi, Youn Jeong . . . . . . . . . . . . . W22a 566Chowdhury, Manjurul Islam . . . M51-P21 295
M51-P37 326Chuasavathi, Thammared . . . . . M51-P23 298Chukwu, Lucian Obinnaya . . . . T35a 459
W26e 615Circelli, Tony . . . . . . . . . . . . . . . . . . M11b 51Clark, Kate . . . . . . . . . . . . . . . . . . . T42a 491Clarke, Bradly . . . . . . . . . . . . . . . . W22b 568Clough, Mark . . . . . . . . . . . . . . . . . T21d 360Clutterham, Matthew . . . . . . . . . . W25a 595Coladonato, Camillo . . . . . . . . . . M36f 168
T25c 398W23d 583
Coleman, Shandel . . . . . . . . . . . . T34c 451
Collins, John A. . . . . . . . . . . . . . . . M51-P22 297Colthorpe, Matthew . . . . . . . . . . . M41b 182Conder, Jason . . . . . . . . . . . . . . . . T21a 354
T34b 449Cook, Laura . . . . . . . . . . . . . . . . . . M42e 198Cooke, Emmylou . . . . . . . . . . . . . M36c 164
T22c 368Cornish, Emma . . . . . . . . . . . . . . . T26c 404Correa, Tanya C. . . . . . . . . . . . . . . M51-P25 302Costanza, Jed . . . . . . . . . . . . . . . . M42a 190Cousins, Ian T. . . . . . . . . . . . . . . . . M21c 56Cowman, Nick . . . . . . . . . . . . . . . . M44e 221
M47d 249Cozens, G. . . . . . . . . . . . . . . . . . . . T33b 437Cramer, Jon . . . . . . . . . . . . . . . . . . T23b 374Creamer, Todd . . . . . . . . . . . . . . . . W24b 589Crimi, Michelle . . . . . . . . . . . . . . . . W23e 585Currell, Matthew . . . . . . . . . . . . . . M43f 209
DDatta, Bithin . . . . . . . . . . . . . . . . . . T46d 543Davey, Brent . . . . . . . . . . . . . . . . . . M32d 133Davies, Carl . . . . . . . . . . . . . . . . . . W27e 624Dea, Peter O. . . . . . . . . . . . . . . . . . T23e 380Death, Clare . . . . . . . . . . . . . . . . . . W22f 574Deb, Amal Kanti . . . . . . . . . . . . . . M51-P44 339De Greene, Ken . . . . . . . . . . . . . . W22d 571Delaere, Ian M. . . . . . . . . . . . . . . . W24c 591
W24d 593DeMott, Robert P. . . . . . . . . . . . . . T24d 389Denison, Lyn . . . . . . . . . . . . . . . . . M35b 150
M43b 203T36d 475
Denny, Russell . . . . . . . . . . . . . . . T23e 380De Nola, Giorgio . . . . . . . . . . . . . . T31d 418
W21d 561Der Tateossian, Daniel . . . . . . . . T33c 439
T42c 495Deschaine, Larry M. . . . . . . . . . . W23a 576Desem, Candan . . . . . . . . . . . . . . M43a 201Devlin, J.F. . . . . . . . . . . . . . . . . . . . . W23e 585Dharmarajan, Rajarathnam . . . M22d 66
M51-P21 295M51-P37 326
T32c 427W21e 563W25f 605
Dhyani, B.P. . . . . . . . . . . . . . . . . . . . T45e 533Dickson, Michael . . . . . . . . . . . . . M51-P32 316
T31e 420Divine, Craig E. . . . . . . . . . . . . . . . W23b 579
W23e 585Dodd, Kylie . . . . . . . . . . . . . . . . . . . T31c 416
W22e 573Donaghey, Mark . . . . . . . . . . . . . . T41e 487Dong, Zhaomin . . . . . . . . . . . . . . . M24e 85
T34d 453Donn, M. . . . . . . . . . . . . . . . . . . . . . . T33b 437Donne, Scott W. . . . . . . . . . . . . . . M26d 103Donovan, Michael S. . . . . . . . . . . M32c 131Dourson, Michael L. . . . . . . . . . . . T41f 489Drew, Roger . . . . . . . . . . . . . . . . . . M51-P4 263
M51-P12 277W22f 574
Drought, Nigel . . . . . . . . . . . . . . . . W27d 623Du, Jianhua . . . . . . . . . . . . . . . . . . M26e 105
M51-P3 261T34d 453T41e 487
Du, Jinyang . . . . . . . . . . . . . . . . . . . T45c 529Duan, Luchun . . . . . . . . . . . . . . . . M22d 66
M47c 247M47e 251
M51-P1 257T36b 471T36c 473T41b 481T41c 483
Duffy, Juliet L. . . . . . . . . . . . . . . . . W26f 617Duran, J. . . . . . . . . . . . . . . . . . . . . . . T33b 437
629

Dutta, Shruti . . . . . . . . . . . . . . . . . . T32f 433T35b 461T43e 511
EEast, Kathryn . . . . . . . . . . . . . . . . . M41b 182Eccleshall, Sarah . . . . . . . . . . . . . M36c 164Eckhardt, Alexander . . . . . . . . . . M22b 62Edwards, Ross . . . . . . . . . . . . . . . M51-P42 336Egbuatu, Maureen Onyinye . . . W26e 615Egidi, Eleonora . . . . . . . . . . . . . . . M47g 255Ellis, Geoff . . . . . . . . . . . . . . . . . . . . M27c 112El Mohtar, Chadi S. . . . . . . . . . . . M32c 131Eriksen, Søren . . . . . . . . . . . . . . . . M46e 240Espinosa, Ruben . . . . . . . . . . . . . T33e 443Esposito, Monica . . . . . . . . . . . . . M47c 247
M47e 251Evans, Geoffrey . . . . . . . . . . . . . . T31e 420Evans, R.A. . . . . . . . . . . . . . . . . . . . W24c 591
W24d 593
FFang, Cheng . . . . . . . . . . . . . . . . . . M21d 58
M22d 66M45d 229M45e 230M47c 247
M51-P38 328T32c 427T42d 497
W21e 563Farhat, Shahla K. . . . . . . . . . . . . . M36a 160Fassbender, Richard . . . . . . . . . . M27b 110Fatema, Kaniz . . . . . . . . . . . . . . . . M51-P48 347Fiacco, Joe . . . . . . . . . . . . . . . . . . . W23d 583Fletcher, Adam . . . . . . . . . . . . . . . T44d 522
W27c 622Foley, Alan . . . . . . . . . . . . . . . . . . . W27e 624Fortner, John . . . . . . . . . . . . . . . . . M42a 190Frangos, John . . . . . . . . . . . . . . . . M51-P40 332
T24f 393W25c 599
Frauenstein, Joerg . . . . . . . . . . . . M31e 126
GGadagbui, Bernard . . . . . . . . . . . T41f 489Gaito, Steven . . . . . . . . . . . . . . . . . T33f 445Galagedara, Heshan . . . . . . . . . . M26a 97Gao, X. . . . . . . . . . . . . . . . . . . . . . . . M51-P45 341Garland, Allan . . . . . . . . . . . . . . . . W27d 623Gebreeyessus, Getachew D. . . M51-P19 291Gemson, Wijnand . . . . . . . . . . . . . M35f 158Gerber, Kathleen . . . . . . . . . . . . . W23e 585Girelli, A. . . . . . . . . . . . . . . . . . . . . . . M33b 140Goodwin, Micheala . . . . . . . . . . . M51-P8 269Gordon, Charlie . . . . . . . . . . . . . . . M51-P41 334Goyal, Dinesh . . . . . . . . . . . . . . . . M51-P24 300Gray, Andrew . . . . . . . . . . . . . . . . . M36f 168
T25c 398W23d 583
Grbich, Nicholas . . . . . . . . . . . . . . T26b 402Grieco, Scott A. . . . . . . . . . . . . . . . M42e 198
M44a 214M51-P42 336
Grimison, Charles . . . . . . . . . . . . W21b 557W21c 559
Grummt, Tamara . . . . . . . . . . . . . . M22b 62Guo, Dabin . . . . . . . . . . . . . . . . . . . M43g 212Gupta, Prem . . . . . . . . . . . . . . . . . . T32f 433Gustafson, Doug . . . . . . . . . . . . . . M42e 198
HHagell, Suzanne . . . . . . . . . . . . . . M33a 138Hagen, Tarah . . . . . . . . . . . . . . . . . M51-P4 263
M51-P12 277T31d 418
W21d 561Hakimabadi, Seyfollah Gilak . . M22a 60Halim, M.A. . . . . . . . . . . . . . . . . . . . M51-P46 343Hall, Adrian . . . . . . . . . . . . . . . . . . . M44b 215
Hall, Linda . . . . . . . . . . . . . . . . . . . . M21b 54Hallchurch, Jacqui . . . . . . . . . . . . T21d 360Hammond, Therese . . . . . . . . . . . T33a 435Hampton, James . . . . . . . . . . . . . M41c 184
M43f 209Hannaford, Jessica . . . . . . . . . . . M47a 243Hanson, Kristi . . . . . . . . . . . . . . . . T21e 362Hassan, Masud . . . . . . . . . . . . . . . M26e 105Hebbard, Karen . . . . . . . . . . . . . . . T42a 491Heggie, Adrian . . . . . . . . . . . . . . . . M37d 178Held, Thomas . . . . . . . . . . . . . . . . . M31e 126Herch, Andrea . . . . . . . . . . . . . . . . M31d 124Hermes, Nanda . . . . . . . . . . . . . . . M31d 124
M35b 150Hers, I. . . . . . . . . . . . . . . . . . . . . . . . T33b 437Hetherington, Chris . . . . . . . . . . . M41c 184
M43f 209Higgins, Christopher . . . . . . . . . . T34b 449
W22a 566Hinkle, Jesse . . . . . . . . . . . . . . . . . W23e 585Hinrichsen, Helena . . . . . . . . . . . M22c 64H. Jayaramaiah, Ramesha . . . . M47g 255Hnatko, Jason . . . . . . . . . . . . . . . . M42a 190Ho, Jonathan . . . . . . . . . . . . . . . . . M36g 170Hoang, Anh . . . . . . . . . . . . . . . . . . . M51-P18 289Holm, Jesper . . . . . . . . . . . . . . . . . M46e 240Hopkins, Phoebe . . . . . . . . . . . . . W25d 601
W27f 626Hossain, Md. Zahangir . . . . . . . . M26c 101
M26d 103Howard, Julian . . . . . . . . . . . . . . . . T21f 364Howes, Andrew . . . . . . . . . . . . . . . T26c 404Hu, Zhihao . . . . . . . . . . . . . . . . . . . T31f 422Hull, John . . . . . . . . . . . . . . . . . . . . M51-P22 297Humphries, Robert . . . . . . . . . . . T45f 535Hung, Hao-Chun . . . . . . . . . . . . . . M51-P31 314Hunt, Andrew . . . . . . . . . . . . . . . . . M36f 168
T25c 398W23d 583
Hunt, John . . . . . . . . . . . . . . . . . . . . M36c 164T44d 522
W27a 619Hunter, David M. . . . . . . . . . . . . . . T31e 420Hurst, Jake . . . . . . . . . . . . . . . . . . . M25d 93
M51-P6 267M51-P7 268M51-P9 271
M51-P11 275M51-P26 304
Hurston, Zarion . . . . . . . . . . . . . . . M51-P8 269Hutson, Phil . . . . . . . . . . . . . . . . . . W25a 595Hyun, Young Hwan . . . . . . . . . . . . M51-P33 318
IIavetz, Raluca . . . . . . . . . . . . . . . . W21b 557
W21c 559Idowu, Oluyoye . . . . . . . . . . . . . . . W25e 603Irving, Jarrod . . . . . . . . . . . . . . . . . M47b 245Islam, Md. Meftaul . . . . . . . . . . . . W25f 605Islam, Md. Rafiqul . . . . . . . . . . . . M51-P14 281Islam, Md. Rashidul . . . . . . . . . . . T34f 457Islam, Shofiqul . . . . . . . . . . . . . . . . T46a 537
JJasemi Zad, Tahereh . . . . . . . . . . W25b 597Javaherian, Mehrdad . . . . . . . . . M32f 136Jayawardhana, Yohan . . . . . . . . . M26a 97Jeffries, Thomas C. . . . . . . . . . . . M32a 128
M47g 255Jit, Joytishna . . . . . . . . . . . . . . . . . . M23a 72
T24e 391Johansen, Mathew P. . . . . . . . . . T34f 457Jones, Scott . . . . . . . . . . . . . . . . . . T23c 376Juhasz, Albert L. . . . . . . . . . . . . . . T31b 414Juntarachot, Nucharee . . . . . . . . M51-P47 345
KKader, M. . . . . . . . . . . . . . . . . . . . . . M46d 238
M51-P43 337Kamsopa, Sireepron . . . . . . . . . . M51-P23 298
Kannan, Kurunthachalam . . . . . W26a 609Kasevich, Ray . . . . . . . . . . . . . . . . W23d 583Kelly, Martin . . . . . . . . . . . . . . . . . . M44e 221Kenday Sivaram, Anithadevi . . M51-P27 306
W25g 607Kennedy, Bruce . . . . . . . . . . . . . . M23a 72
T24e 391Kerrison, G.A. . . . . . . . . . . . . . . . . . M25c 91Keskar, Jayant . . . . . . . . . . . . . . . . M25b 89Khalili, Nasser . . . . . . . . . . . . . . . . M51-P36 324Khan, Anwar Ul Haq . . . . . . . . . . T32c 427Khandewal, Ashish . . . . . . . . . . . T23f 382Kiefer, Ken . . . . . . . . . . . . . . . . . . . . M31d 124
M35b 150M35f 158
M41b 182M51-P16 285
T31c 416T36d 475T45b 527
Kim, Changwoo . . . . . . . . . . . . . . . M42a 190Kim, Jin Peel . . . . . . . . . . . . . . . . . M51-P33 318Kirtana, Koorapati . . . . . . . . . . . . T43e 511Kohli, Anshuman . . . . . . . . . . . . . . M51-P2 259
T46f 547Kohli, Sudha J. . . . . . . . . . . . . . . . . M51-P24 300Konzuk, Julie . . . . . . . . . . . . . . . . . M27c 112Koons, Brad . . . . . . . . . . . . . . . . . . T33f 445Korber, Anneliese . . . . . . . . . . . . . T22d 370Krishna, Deeksha . . . . . . . . . . . . . T46g 549Krishnan, Kannan . . . . . . . . . . . . T24c 387Kuffer, Mark . . . . . . . . . . . . . . . . . . M22f 70Kulathunga, M.R.D.L. . . . . . . . . . M51-P28 308Kulkarni, Poonam R. . . . . . . . . . . M21b 54Kumar, Ashok . . . . . . . . . . . . . . . . T45e 533Kumar, Pushpam . . . . . . . . . . . . . W11b 552Kumari, Swati . . . . . . . . . . . . . . . . . M51-P2 259
LLabbett, Andrew . . . . . . . . . . . . . . M27d 114Lagowski, Jason . . . . . . . . . . . . . . M25d 93
M51-P6 267M51-P7 268M51-P9 271
M51-P11 275M51-P26 304M51-P32 316
T44e 524Lal, Alvin . . . . . . . . . . . . . . . . . . . . . T46d 543Lamb, D.T. . . . . . . . . . . . . . . . . . . . . M26c 101
M26d 103M46d 238
M51-P18 289M51-P39 330M51-P43 337
T23d 378T34e 455T41c 483T43f 514T46c 541
Lane, Anthony . . . . . . . . . . . . . . . . T31d 418W21d 561
Lane, Rory . . . . . . . . . . . . . . . . . . . M27e 116M37c 176T26d 406
Lanza, Heather A. . . . . . . . . . . . . W22e 573Larson, Emily . . . . . . . . . . . . . . . . . T21a 354
T34b 449Lau, Christopher . . . . . . . . . . . . . . T41a 479Lavelle, Peter . . . . . . . . . . . . . . . . . M41b 182Lazenby, Victoria . . . . . . . . . . . . . M33d 144
T21c 358Le, Song Thao . . . . . . . . . . . . . . . . M32a 128Lease, Chris . . . . . . . . . . . . . . . . . . W24d 593Lee, John . . . . . . . . . . . . . . . . . . . . . T43b 505Lee, Matthew . . . . . . . . . . . . . . . . . M32a 128
M35d 154Leeson, Andrea . . . . . . . . . . . . . . . M21a 52Lei, Yongjia . . . . . . . . . . . . . . . . . . . T42d 497
630
Leßlich, Peer Hendrik . . . . . . . . . M22b 62Levicki, Christine . . . . . . . . . . . . . M31a 118Lewin, Mark . . . . . . . . . . . . . . . . . . W21b 557Lewis, Elliott . . . . . . . . . . . . . . . . . . M32d 133Li, Hongbo . . . . . . . . . . . . . . . . . . . . M24e 85Li, Jianfen . . . . . . . . . . . . . . . . . . . . M43g 212Li, Yeling . . . . . . . . . . . . . . . . . . . . . . M24e 85Liang, Gan . . . . . . . . . . . . . . . . . . . M35d 154Lim, Cheryl . . . . . . . . . . . . . . . . . . . W21b 557
W21c 559Liu, Siyuan . . . . . . . . . . . . . . . . . . . M51-P1 257Liu, Yanju . . . . . . . . . . . . . . . . . . . . . M22d 66
M24e 85M26e 105M33c 142M46c 236T32c 427T32e 431T34d 453T41b 481T41c 483T41e 487T45c 529
W21e 563Lo, Irene M.C. . . . . . . . . . . . . . . . . T32a 424Lohmann, Rainer . . . . . . . . . . . . . T31a 412Longpré, Darcy . . . . . . . . . . . . . . . M31a 118Lorusso, Luigi . . . . . . . . . . . . . . . . M31a 118Lowney, Yvette W. . . . . . . . . . . . . T36b 471Lubrecht, Michael . . . . . . . . . . . . . W23b 579
W23e 585Lui, Chen . . . . . . . . . . . . . . . . . . . . . M42a 190Lundmark, Anna . . . . . . . . . . . . . . M35e 156
MMacbeth, Tamzen . . . . . . . . . . . . . T43a 503Macdonald, Catriona A. . . . . . . . M47g 255Madsen, Robyn . . . . . . . . . . . . . . . T44b 518Maizel, Andrew . . . . . . . . . . . . . . . W22a 566Mallavarapu, Megharaj . . . . . . . . M21d 58
M41c 184M43d 207M45d 229M45e 230M46a 232M46d 238M47g 255
M51-P21 295M51-P27 306M51-P34 320M51-P35 322M51-P37 326M51-P43 337M51-P46 343M51-P47 345M51-P48 347
T23d 378T24c 387T42f 501
W25f 605W25g 607
Mandal, Jajati . . . . . . . . . . . . . . . . . M51-P2 259T46f 547
Manefield, Michael J. . . . . . . . . . M32a 128M35d 154
Manning, Sean . . . . . . . . . . . . . . . T42e 499Mansfield, Sarah . . . . . . . . . . . . . . T22b 367Mao, J. . . . . . . . . . . . . . . . . . . . . . . . M51-P45 341Marquez, Nick . . . . . . . . . . . . . . . . M42b 192Martin, Jen . . . . . . . . . . . . . . . . . . . W22f 574Mass, Sarah . . . . . . . . . . . . . . . . . . W22a 566Mauldin, Denton . . . . . . . . . . . . . . W23c 581Maulina, Vida . . . . . . . . . . . . . . . . . T45b 527Maxfield, Keith . . . . . . . . . . . . . . . . M36b 162
M51-P30 312Mays, Sasha . . . . . . . . . . . . . . . . . . M51-P8 269McCabe, Paul . . . . . . . . . . . . . . . . M32e 135McCartney, Ash . . . . . . . . . . . . . . M32c 131McDonald, Danny . . . . . . . . . . . . . T33d 441
McDonough, Jeffrey . . . . . . . . . . M25d 93M51-P6 267M51-P7 268M51-P9 271
M51-P11 275M51-P26 304
W23e 585McFarland, Ross . . . . . . . . . . . . . M24a 77
W26b 611McGinnis, Patricia M. . . . . . . . . . T41f 489McGrath, Steven . . . . . . . . . . . . . . W21b 557
W21c 559McGregor, Rick . . . . . . . . . . . . . . . M22a 60McGuire, Travis M. . . . . . . . . . . . . M36a 160McKenzie, Robert . . . . . . . . . . . . . W22f 574McLeod, Luke . . . . . . . . . . . . . . . . M32e 135McNiven, Campbell . . . . . . . . . . . T44d 522McTigue, John . . . . . . . . . . . . . . . . W23d 583Meaklim, Jean . . . . . . . . . . . . . . . . T42b 493Medd, Jonathan . . . . . . . . . . . . . . W22d 571Meric, Dogus . . . . . . . . . . . . . . . . . W25a 595Merrick, Jeffrey . . . . . . . . . . . . . . . M24c 81Merz, Russell . . . . . . . . . . . . . . . . . T24f 393Mikkonen, Antti . . . . . . . . . . . . . . . M51-P40 332
T24f 393T41d 485W22f 574W25c 599
Mikkonen, H. . . . . . . . . . . . . . . . . . . T24f 393T41d 485
W25c 599Miklos, Matthew . . . . . . . . . . . . . . M37d 178Miles, Jonathan . . . . . . . . . . . . . . . M25d 93
M51-P6 267M51-P7 268M51-P9 271
M51-P10 273M51-P11 275M51-P26 304M51-P32 316
T45a 525Miller, Claire . . . . . . . . . . . . . . . . . . M36d 166Miller, Graeme . . . . . . . . . . . . . . . . M43c 205Mitchell, Andrew S. . . . . . . . . . . . M41e 188
M44c 217Mitchell, Krystle . . . . . . . . . . . . . . . T21f 364Mitchell, Sam . . . . . . . . . . . . . . . . . W26b 611Mohammed, Adnan . . . . . . . . . . . M51-P15 283Morris, Justin . . . . . . . . . . . . . . . . . M42c 194Morrish, Ryan . . . . . . . . . . . . . . . . T44d 522Morrow, Abigail . . . . . . . . . . . . . . . M35e 156Morschel, Geoff . . . . . . . . . . . . . . . W21b 557Mulvey, Philip . . . . . . . . . . . . . . . . . M43a 201
M51-P20 293Murphy, Peter . . . . . . . . . . . . . . . . M51-P36 324
NNadebaum, Peter . . . . . . . . . . . . . M23b 75
T11b 349T21d 360T33a 435T44b 518
W22e 573Nagul, Edward . . . . . . . . . . . . . . . . M45c 227Naidu, Ravi . . . . . . . . . . . . . . . . . . . M21d 58
M22d 66M23a 72M24e 85M25e 95M26c 101M26e 105M33c 142M33e 146M43d 207M45d 229M46a 232M46c 236M46d 238M47c 247M47e 251
M51-P1 257M51-P3 261
M51-P14 281M51-P15 283M51-P25 302M51-P27 306M51-P28 308M51-P35 322M51-P38 328M51-P39 330M51-P43 337M51-P44 339M51-P46 343M51-P47 345
T23d 378T24c 387T24e 391T32c 427T32d 429T32e 431T34d 453T34e 455T34f 457T35d 465T36a 469T36b 471T36c 473T41b 481T41c 483T41e 487T42d 497T42f 501T43f 514T45c 529T46a 537T46b 539T46c 541T46e 545
W21e 563W25g 607W41a 628
Nakayama, Keisuke . . . . . . . . . . . M43b 203Nathanail, Paul . . . . . . . . . . . . . . . T34a 447
W41a 628Ndere, Patrick . . . . . . . . . . . . . . . . M44f 223Newell, Charles J. . . . . . . . . . . . . . M21b 54
M36a 160Ng, Gaelle . . . . . . . . . . . . . . . . . . . . M51-P16 285Ng, Jack C. . . . . . . . . . . . . . . . . . . . M51-P29 310Ngo, Tien . . . . . . . . . . . . . . . . . . . . . M43a 201Nguyen, Dung . . . . . . . . . . . . . . . . W22a 566Nguyen, Ngoc Nong . . . . . . . . . . M51-P3 261Nguyen, Ngoc Son Hai . . . . . . . . M51-P3 261Nicholson, Paul . . . . . . . . . . . . . . . M27c 112
T26d 406Nicklesen, Mike . . . . . . . . . . . . . . . M41d 187Nises, Mats . . . . . . . . . . . . . . . . . . . M22c 64Niven, Robert K. . . . . . . . . . . . . . . M51-P36 324Noh, Hoe-Jung . . . . . . . . . . . . . . . M51-P5 265Nolan, Annette . . . . . . . . . . . . . . . . W21b 557
W21c 559Nolan, Joshua . . . . . . . . . . . . . . . . M46b 234Nuruzzaman, Md. . . . . . . . . . . . . . M51-P25 302
T32e 431
OO’Carroll, Denis M. . . . . . . . . . . . . M32a 128O’Connor, James . . . . . . . . . . . . . T45d 531O’Farrell, Casey . . . . . . . . . . . . . . M35d 154Oh, Na-ri . . . . . . . . . . . . . . . . . . . . . M51-P5 265O’Hanlon, Dan . . . . . . . . . . . . . . . . W27d 623Ohnuki, Toshihiko . . . . . . . . . . . . . T45d 531Ojo, Atinuke F. . . . . . . . . . . . . . . . . M51-P29 310Ok, Yong Sik . . . . . . . . . . . . . . . . . . M26a 97
T32b 425Ombalski, Dan . . . . . . . . . . . . . . . . W23b 579
W23e 585Onder, Ebru . . . . . . . . . . . . . . . . . . M27c 112Onyema, Chijioke . . . . . . . . . . . . . T41f 489Ortiz, Liz . . . . . . . . . . . . . . . . . . . . . . M51-P8 269Osborne, Keith . . . . . . . . . . . . . . . M35d 154Ozbek, Metin . . . . . . . . . . . . . . . . . W23a 576
631

PPac, Tim . . . . . . . . . . . . . . . . . . . . . . M37b 174Padhye, Lokesh P. . . . . . . . . . . . . W25b 597Palanisami, Thavamani . . . . . . . T31e 420
W25e 603Pancras, Tessa . . . . . . . . . . . . . . . M31b 120Pandey, Deepika . . . . . . . . . . . . . T32f 433
T35b 461T36e 477
Panneerselvan, Logeshwaran . M51-P21 295M51-P27 306M51-P37 326M51-P48 347
T42f 501W25g 607
Papageorgiou, Ona . . . . . . . . . . . M33a 138Paparella, Tony . . . . . . . . . . . . . . . M27a 109Park, Jung-Auk . . . . . . . . . . . . . . . M51-P5 265Pashley, Richard . . . . . . . . . . . . . . M51-P36 324Paul, Santosh Kumar . . . . . . . . . M51-P25 302Payne, Timothy E. . . . . . . . . . . . . T23a 373
T34f 457Pearce, Jean-Paul . . . . . . . . . . . . T22a 366Pearson, Cole . . . . . . . . . . . . . . . . W23d 583Peng, Cheng . . . . . . . . . . . . . . . . . M51-P29 310Pennell, Kurt . . . . . . . . . . . . . . . . . . M42a 190Perera, Isiri A. . . . . . . . . . . . . . . . . M43d 207Person, Jessica H. . . . . . . . . . . . . M42e 198Pham, Anh Le-Tuan . . . . . . . . . . . M22a 60Ploug, Niels . . . . . . . . . . . . . . . . . . M46e 240Poole, R. . . . . . . . . . . . . . . . . . . . . . W25c 599Prasad, Rajendra . . . . . . . . . . . . . M51-P17 287Priestley, Megan . . . . . . . . . . . . . . M35e 156Pritchard, Dylan . . . . . . . . . . . . . . T26f 410Prohasky, Kathleen . . . . . . . . . . . M51-P16 285
T36d 475Putnam, Nathan . . . . . . . . . . . . . . M33a 138Pyke, James . . . . . . . . . . . . . . . . . . W21f 565
QQi, Fangjie . . . . . . . . . . . . . . . . . . . . M22d 66
M51-P3 261Qian, Y. . . . . . . . . . . . . . . . . . . . . . . . M51-P45 341
RRahman, Md. Aminur . . . . . . . . . M26c 101
T23d 378T43f 514
Rahman, Mohammad M. . . . . . . M26c 101M51-P14 281M51-P39 330M51-P44 339M51-P46 343
T32d 429T35d 465T43f 514T46a 537T46b 539T46c 541T46e 545
Raj, Kumar R. . . . . . . . . . . . . . . . . . M51-P2 259Ramanayaka, Sammani . . . . . . M26a 97
T32b 425Ramsden, Niall . . . . . . . . . . . . . . . M51-P10 273Rasch, Meredith . . . . . . . . . . . . . . M27e 116
M37c 176Rashid, Md. Harunur . . . . . . . . . T46b 539Rayner, J. . . . . . . . . . . . . . . . . . . . . . T33b 437Rectanus, Heather V. . . . . . . . . . W24b 589Reedy, Darren . . . . . . . . . . . . . . . . M36f 168
M51-P16 285T25c 398
W23d 583Rehfisch, Michael . . . . . . . . . . . . . T21e 362
W25d 601W27f 626
Reinhard, Michael . . . . . . . . . . . . M31e 126Reinikainen, Jussi . . . . . . . . . . . . M31c 122Ren, Jiawei . . . . . . . . . . . . . . . . . . . M26f 107
Richardson, Katie . . . . . . . . . . . . . T21e 362W25d 601
Ritchie, Christopher J. . . . . . . . . M25a 87Riveros, Juan . . . . . . . . . . . . . . . . . W27f 626Robb, Christopher . . . . . . . . . . . . W25a 595Roberts, Michael . . . . . . . . . . . . . W22f 574Robey, Darren . . . . . . . . . . . . . . . . M45c 227Robinson, Scott . . . . . . . . . . . . . . . T33c 439
T42c 495Rodgers, Peter A. . . . . . . . . . . . . . T43b 505Rogers, Zoe . . . . . . . . . . . . . . . . . . M35e 156Rong, Jeb . . . . . . . . . . . . . . . . . . . . W23d 583Ross, Ian . . . . . . . . . . . . . . . . . . . . . M25d 93
M42c 194M51-P6 267M51-P7 268M51-P9 271
M51-P10 273M51-P11 275M51-P26 304M51-P32 316
T44e 524T45a 525
Rothleitner, Craig . . . . . . . . . . . . . T45f 535Rousseau, Matt . . . . . . . . . . . . . . . T33a 435Russ, Matthew . . . . . . . . . . . . . . . . T26e 408
SSacchetti, Lorenzo . . . . . . . . . . . . M37e 180
M47f 253Sachan, H.K. . . . . . . . . . . . . . . . . . T46g 549Saini, Anish . . . . . . . . . . . . . . . . . . . M51-P38 328Sajwan, Kenneth S. . . . . . . . . . . . M45b 225
M51-P8 269Salhotra, Atul M. . . . . . . . . . . . . . . T24b 386
W24a 587Samarasinghe V.A., Chamila . . T24c 387Sana, Tanmoy . . . . . . . . . . . . . . . . M51-P21 295
M51-P37 326Sanderson, Peter . . . . . . . . . . . . . M24e 85
M26c 101M46d 238
M51-P3 261T34e 455T34f 457T43f 514
Sandiford, Christopher . . . . . . . . W22b 568Sarkar, Binoy . . . . . . . . . . . . . . . . . M26d 103
M51-P18 289T32b 425
Schaefer, Charles . . . . . . . . . . . . W22a 566Schroers, Stefan . . . . . . . . . . . . . . M22b 62Schuett, Christine . . . . . . . . . . . . . T25a 394Schulz, Barbara . . . . . . . . . . . . . . T44a 516Scott, Kerry . . . . . . . . . . . . . . . . . . . M23a 72Sellier, Amelie . . . . . . . . . . . . . . . . M51-P4 263
M51-P12 277Selvakumar, Rajendran . . . . . . . M51-P27 306Semple, Kirk T. . . . . . . . . . . . . . . . . M47e 251
W25e 603Seow, Jimmy . . . . . . . . . . . . . . . . . T21b 356Seshadri, Balaji . . . . . . . . . . . . . . . M25e 95
M41c 184M43f 209
M51-P18 289M51-P23 298M51-P39 330
Shahi, Uday Pratap . . . . . . . . . . . T45e 533Shahriar, Syfullah . . . . . . . . . . . . . T46e 545Shahsavari, Esmaeil . . . . . . . . . . M43a 201Shi, Feng . . . . . . . . . . . . . . . . . . . . . M24d 83Shilpi, Sonia . . . . . . . . . . . . . . . . . . M25e 95
T41c 483Shin, Won Sik . . . . . . . . . . . . . . . . M51-P33 318Shnaiderman, Bianca . . . . . . . . . M37d 178Shon, Ho Kyong . . . . . . . . . . . . . . M26f 107Short, Graeme . . . . . . . . . . . . . . . . M41c 184
M43f 209Shrivastava, Manoj . . . . . . . . . . . T23f 382Shukla, Sudeep . . . . . . . . . . . . . . . T32f 433
T35b 461
Sica, Alessandro . . . . . . . . . . . . . . M27d 114Siddique, Abu Bakkar . . . . . . . . . M51-P14 281Sim, David . . . . . . . . . . . . . . . . . . . . W27e 624Simon, David L. . . . . . . . . . . . . . . . W24d 593Singh, Brajesh K. . . . . . . . . . . . . . M47g 255Singh, Rahul . . . . . . . . . . . . . . . . . . T25a 394Singh, S.D. . . . . . . . . . . . . . . . . . . . T23f 382Singh, Yanendra K. . . . . . . . . . . . . M51-P2 259
M51-P17 287Sinnett, Marilyn . . . . . . . . . . . . . . . M42f 199Skabe, Dainis . . . . . . . . . . . . . . . . . M43c 205Slee, Danny . . . . . . . . . . . . . . . . . . W21b 557
W21c 559Sleep, Brent . . . . . . . . . . . . . . . . . . M22a 60Slenders, Hans . . . . . . . . . . . . . . . M31b 120Smit, Andre . . . . . . . . . . . . . . . . . . . M46b 234
T22c 368T33a 435
Smith, Jonathon . . . . . . . . . . . . . . T33f 445Smith, J.W.N. . . . . . . . . . . . . . . . . . M25c 91Smith, Michael B. . . . . . . . . . . . . . T43a 503Smith, Nathan . . . . . . . . . . . . . . . . T43a 503Smith, William Gary . . . . . . . . . . . M35c 152Smith, Zoe . . . . . . . . . . . . . . . . . . . . W27b 620Sobhani, Zahra . . . . . . . . . . . . . . . M45e 230
T23d 378W21e 563
Song, J. . . . . . . . . . . . . . . . . . . . . . . M51-P45 341Song, Xin . . . . . . . . . . . . . . . . . . . . . T31f 422Sordy, Chris . . . . . . . . . . . . . . . . . . M44e 221Sorenson, Kent . . . . . . . . . . . . . . . W22a 566Sparke, Nathan . . . . . . . . . . . . . . . W25a 595Spiese, Richard . . . . . . . . . . . . . . . M41a 181Srivastav, Akansha . . . . . . . . . . . T23f 382Srivastava, Prashant . . . . . . . . . . T34d 453
W41a 628Statham, Tom . . . . . . . . . . . . . . . . . M42c 194
T44e 524Stevanoni, John . . . . . . . . . . . . . . M32b 129Stewart, Richard . . . . . . . . . . . . . . T31b 414
T42e 499Storch, Peter . . . . . . . . . . . . . . . . . M25d 93
M42c 194M51-P6 267M51-P7 268M51-P9 271
M51-P10 273M51-P11 275M51-P26 304M51-P32 316
T44e 524T45a 525
W23e 585Straßburger, Thomas . . . . . . . . . M22b 62Strezov, Vladimir . . . . . . . . . . . . . . M51-P36 324Stroo, Hans . . . . . . . . . . . . . . . . . . . M21a 52Stuckey, Mark . . . . . . . . . . . . . . . . M51-P20 293Su, Yu-Chen . . . . . . . . . . . . . . . . . . M51-P31 314Subashchandrabose, S.R. . . . . M43d 207
M51-P27 306M51-P34 320M51-P47 345M51-P48 347
Sudharsanam, Abinandan . . . . M51-P34 320M51-P47 345
Surapaneni, Aravind . . . . . . . . . . M41c 184M43f 209
Symons, Bob . . . . . . . . . . . . . . . . . M45c 227W21a 554W21b 557W21c 559
TTaggart, Dora . . . . . . . . . . . . . . . . . T42a 491Taggart, William . . . . . . . . . . . . . . . T44d 522
W27a 619Tang, W. . . . . . . . . . . . . . . . . . . . . . . M51-P45 341Tantemsapya, N. . . . . . . . . . . . . . . M51-P13 279Taylor, Mark . . . . . . . . . . . . . . . . . . M51-P36 324Terfassa, Belina . . . . . . . . . . . . . . . M51-P19 291Thakur, Atul . . . . . . . . . . . . . . . . . . T32f 433
632

Thakur, Preeti . . . . . . . . . . . . . . . . T32f 433Thathong, V. . . . . . . . . . . . . . . . . . . M51-P13 279Thomas, Andrew . . . . . . . . . . . . . . M22e 68
W22c 570Thompson, Jack . . . . . . . . . . . . . . W21a 554Thomson, Lisa . . . . . . . . . . . . . . . . M43b 203
T45b 527Thurlow, Stuart . . . . . . . . . . . . . . . M44d 219Tian, Yu . . . . . . . . . . . . . . . . . . . . . . . T42d 497Tijing, Leonard D. . . . . . . . . . . . . . M26f 107Toase, Danielle . . . . . . . . . . . . . . . M25d 93
M51-P6 267M51-P7 268M51-P9 271
M51-P11 275M51-P26 304M51-P32 316
T44e 524T45a 525
Tomoaki, Kato . . . . . . . . . . . . . . . . T45d 531Toop, Andrew . . . . . . . . . . . . . . . . . T42e 499Tsoukalis, Skefos . . . . . . . . . . . . . M42d 196
UUmeh, Anthony C. . . . . . . . . . . . . M47e 251
T41c 483T41e 487
Unnithan, Aravind . . . . . . . . . . . . . M33e 146Uren, Peter . . . . . . . . . . . . . . . . . . . M41c 184
M43f 209Usese, Amii . . . . . . . . . . . . . . . . . . W26e 615Uz-Zaman, Kh. Ashraf . . . . . . . . T32d 429
VValiff, Dilara . . . . . . . . . . . . . . . . . . . M44b 215Valkan, Rebecca . . . . . . . . . . . . . . M42b 192Valle, Paulo . . . . . . . . . . . . . . . . . . . M35b 150
M35f 158Vekateswarlu, Kadiyala . . . . . . . M51-P35 322Verginelli, Iason . . . . . . . . . . . . . . . M33b 140
M37a 172T25b 396
Vigelahn, Lothar . . . . . . . . . . . . . . M22b 62T25a 394
Vithanage, Meththika . . . . . . . . . M26a 97T32b 425T35e 467
Vounaki, Olga . . . . . . . . . . . . . . . . . M35f 158
WWakefield, Gemma . . . . . . . . . . . W22d 571Waldron, Howard D. . . . . . . . . . . . T43b 505Walker, Alice . . . . . . . . . . . . . . . . . . M46b 234
T21d 360Wall, Rachael . . . . . . . . . . . . . . . . . W22d 571Wallace, Sarah . . . . . . . . . . . . . . . M32a 128Wallis, Christian . . . . . . . . . . . . . . M51-P40 332
T24f 393T41d 485T43c 507
W25c 599Wang, Bing-Nan . . . . . . . . . . . . . . M51-P31 314Wang, Bobby . . . . . . . . . . . . . . . . . T33d 441Wang, Eddie . . . . . . . . . . . . . . . . . . M24d 83Wang, Jack . . . . . . . . . . . . . . . . . . . W23e 585Wang, Jinbo . . . . . . . . . . . . . . . . . . M43g 212Wang, Liang . . . . . . . . . . . . . . . . . . M46d 238
M51-P18 289Wang, Maolin . . . . . . . . . . . . . . . . . M46f 242Wang, Sheng-Wei . . . . . . . . . . . . M51-P31 314Wang, Xun . . . . . . . . . . . . . . . . . . . . M43g 212Ward, Akke . . . . . . . . . . . . . . . . . . . M36f 168
T25c 398Warner, Scott D. . . . . . . . . . . . . . . M25a 87
M51-P15 283T44c 520
Wasley, Kristin . . . . . . . . . . . . . . . . T44a 516Weaver, Tamie . . . . . . . . . . . . . . . . M36f 168Weber, Kela P. . . . . . . . . . . . . . . . . M32a 128West, Brooklynn . . . . . . . . . . . . . . M51-P8 269White, Ian . . . . . . . . . . . . . . . . . . . . M24c 81Whitmore, Greg . . . . . . . . . . . . . . . T26c 404Wijayasinghe, Athula . . . . . . . . . . M26a 97Wijayawardena, M.A. Ayanka . M24e 85
M46c 236M51-P28 308
T36a 469Wijesekara, Hasintha . . . . . . . . . M45a 224Williams, Philip . . . . . . . . . . . . . . . M24d 83Wilson, Scott . . . . . . . . . . . . . . . . . M51-P36 324Wilson, Susan C. . . . . . . . . . . . . . M51-P20 293Windle, Dana . . . . . . . . . . . . . . . . . M36f 168
T25c 398Wirojanagud, W. . . . . . . . . . . . . . . M51-P13 279Wong, Ming Hung . . . . . . . . . . . . . T24a 384Wood, S. . . . . . . . . . . . . . . . . . . . . . . T31c 416
Woodard, Steve . . . . . . . . . . . . . . . M22f 70M41d 187M42f 199
M51-P41 334Woodworth, Jill . . . . . . . . . . . . . . . W22e 573Woolley, Kathy R. . . . . . . . . . . . . . W26f 617Worku, Meron . . . . . . . . . . . . . . . . M51-P19 291Wright, Jesse . . . . . . . . . . . . . . . . . W23e 585Wu, Shijun . . . . . . . . . . . . . . . . . . . . M46f 242Wydro, Marc . . . . . . . . . . . . . . . . . . W26b 611Wymore, Ryan A. . . . . . . . . . . . . . T43a 503Wynkoop, Dale . . . . . . . . . . . . . . . M42d 196Wypych, Lech . . . . . . . . . . . . . . . . . T23e 380
XXiao, Bo . . . . . . . . . . . . . . . . . . . . . . M43g 212Xu, G.Y. . . . . . . . . . . . . . . . . . . . . . . M51-P45 341
YYan, Kaihong . . . . . . . . . . . . . . . . . M24e 85
M46c 236T41b 481
Yang, Jiakuan . . . . . . . . . . . . . . . . . M43g 212Yang, Yi-Ning . . . . . . . . . . . . . . . . . M51-P31 314Yang, Yongqiang . . . . . . . . . . . . . . M46f 242Yeasmin, Marjana . . . . . . . . . . . . . T46c 541Yeung, Anna . . . . . . . . . . . . . . . . . . M32a 128York, Raymond G. . . . . . . . . . . . . . T41f 489Yu, Zhigang . . . . . . . . . . . . . . . . . . . T32a 424
ZZahir, Zahir Ahmad . . . . . . . . . . . T35c 463Zhang, Tao . . . . . . . . . . . . . . . . . . . T42e 499Zhao, Hui . . . . . . . . . . . . . . . . . . . . . W21f 565Zingaretti, Daniela . . . . . . . . . . . . T25b 396Zweigenbaum, Jerry . . . . . . . . . . W21f 565
633

ADELAIDE 2019
8-12 September 2019 Adelaide Convention Centre
adelaide2019.cleanupconference.com
8th International Contaminated Site Remediation ConferenceIncorporating the 2nd International PFAS Conference