CSC STEEL CRC Non-Confidential Questionnaire_20150731
61
NON-CONFIDENTIAL PETITION FOR ANTI-DUMPING INVESTIGATION ON IMPORTS OF COLD-ROLLED STEEL COILS, ALLOY OR NON ALLOY, OF A THICKNESS 0.20~2.60MM, AND OF A WIDTH OF 700~1300MM ORIGINATING OR EXPORTED FROM PEOPLE’S REPUBLIC OF CHINA, SOUTH KOREA AND VIETNAM PETITION FILED BY: CSC STEEL SDN. BHD.
-
Upload
khangminh22 -
Category
Documents
-
view
0 -
download
0
Transcript of CSC STEEL CRC Non-Confidential Questionnaire_20150731
NON-CONFIDENTIAL
PETITION FOR ANTI-DUMPING INVESTIGATION ON IMPORTS OF
COLD-ROLLED STEEL COILS, ALLOY OR NON ALLOY,
OF A THICKNESS 0.20~2.60MM, AND OF A WIDTH OF 700~1 300MM
ORIGINATING OR EXPORTED FROM PEOPLE’S REPUBLIC OF C HINA,
SOUTH KOREA AND VIETNAM
PETITION FILED BY:
CSC STEEL SDN. BHD.

NON-CONFIDENTIAL
INTRODUCTION PETITIONER(S): CSC Steel Sdn. Bhd.
PRODUCT(S): COLD-ROLLED STEEL COILS , ALLOY OR NON -ALLOY , OF A THICKNESS 0.20~2.60MM, AND OF A WIDTH OF 700~1300MM. HS CODE:
7209.15.000, 7209.17.000, 7209.18.900, 7209.16.000, 7209.18.290, 7225.50.000
AHTN CODES:
7209.15.0000, 7209.17.0000, 7209.18.9990, 7225.50.9000 7209.16.0000, 7209.18.9920, 7225.50.1000,
ORIGINATING IN: PEOPLE’S REPUBLIC OF CHINA (CHINA), SOUTH KOREA (KOREA), VIETNAM EXPORTED FROM: PEOPLE’S REPUBLIC OF CHINA (CHINA), SOUTH KOREA (KOREA), VIETNAM For the purpose of this questionnaire submission: Year 1 : 01/01/2012~31/12/2012 Year 2 : 01/01/2013~31/12/2013 Period of Investigation (POI) : 01/01/2014~31/12/2014 STATUTORY REFERENCE: Countervailing and Anti-Dumping Duties Act 1993 Countervailing and Anti-Dumping Duties Regulations 1994 Article VI of the General Agreement on Tariffs and Trade 1994

NON-CONFIDENTIAL
TABLE OF CONTENTS
INTRODUCTION DECLARATION i SECTION A: COMPANY STRUCTURE & OPERATIONS 1
A-1 Contact Information 1 A-2 Corporate Information (including related parties) 1 SECTION B: ACCOUNTING SYSTEM AND POLICIES 4
SECTION C: DOMESTIC INDUSTRY 5
SECTION D: PRODUCT DESCRIPTION 7
D-1 Product Specifications 7 SECTION E: DUMPING 22
E-1 Source of Imports 25
E-2 Export Price 27 E-3 Selling Price (Normal Value) in the Exporter’s Domestic Market 28 E-4 Exports from Non-market Economy 30 E-5 Adjustments 31 E-6 Dumping Margin 32
SECTION F: MATERIAL INJURY (OPERATION) 33 F-1 Production and Capacity 33 F-2 Inventories 34
F-3 Employment and Wages 34 F-4 Productivity 36
SECTION G: MATERIAL INJURY (SALES) 37
G-1 Sales Turnover 37 G-2 Sales Volume and Value 37 G-3 Sales Price 39 G-4 Cost to Make and Sell 39

NON-CONFIDENTIAL
SECTION H: MATERIAL INJURY ( PROFITABILITY, RETURN AND CASH FLOW)
44
H-1 Profitability 44 H-2 Return on Total Assets 46 H-3 Investments 47 H-4 Return on Investment 48 H-5 Cash Flow 48 H-6 Minimum Profit Required 49 H-7 Ability to Raise Capital 49
SECTION I: CAUSAL LINK 50 SECTION J: PUBLIC INTEREST 56
J-1 Malaysian Market 56 J-2 Effect of Continued Imports 57 CHECKLIST
NON-CONFIDENTIAL
i
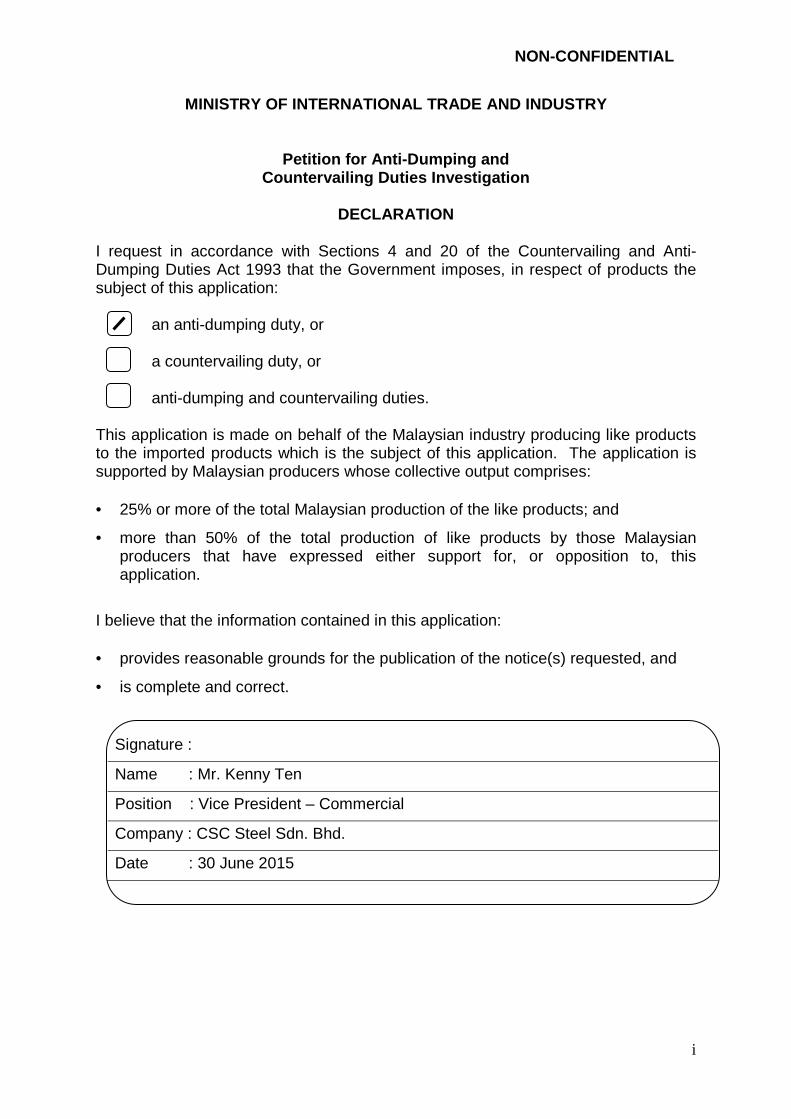
MINISTRY OF INTERNATIONAL TRADE AND INDUSTRY
Petition for Anti-Dumping and Countervailing Duties Investigation
DECLARATION
I request in accordance with Sections 4 and 20 of the Countervailing and Anti-Dumping Duties Act 1993 that the Government imposes, in respect of products the subject of this application:
an anti-dumping duty, or a countervailing duty, or anti-dumping and countervailing duties.
This application is made on behalf of the Malaysian industry producing like products to the imported products which is the subject of this application. The application is supported by Malaysian producers whose collective output comprises: • 25% or more of the total Malaysian production of the like products; and
• more than 50% of the total production of like products by those Malaysian producers that have expressed either support for, or opposition to, this application.
I believe that the information contained in this application: • provides reasonable grounds for the publication of the notice(s) requested, and
• is complete and correct.
Signature :
Name : Mr. Kenny Ten
Position : Vice President – Commercial
Company : CSC Steel Sdn. Bhd.
Date : 30 June 2015

NON-CONFIDENTIAL
1
SECTION A COMPANY STRUCTURE AND OPERATIONS
A-1 Contact Information
Company
Name: CSC Steel Sdn. Bhd. Address: 180, Kawasan Industri Ayer Keroh, Ayer Keroh 75450 Melaka. Ma-laysia. Telephone: 06-2310169 Facsimile: 06-2310167 Email: [email protected] Web page: www.cscmalaysia.com
Factory
Name: CSC Steel Sdn. Bhd.
Address: 180, Kawasan Industri Ayer Keroh, Ayer Keroh 75450 Melaka. Ma-laysia. Telephone: 06-2310169 Facsimile: 06-2310167
Contact person
Name: Mr. Eddy Han Position/Designation: General Manager – Marketing and Logistics Department Address: 180, Kawasan Industri Ayer Keroh, Ayer Keroh 75450 Melaka. Malaysia. Telephone: 06-2310169 (Ext.: 350) Facsimile: 06-2310167 Email: [email protected]
A-2 Corporate Information (including related partie s)
CSC STEEL SDN. BHD. (Company)
1. The principal shareholder as per in Table A-3.1.
Table A-3.1: Shareholdings
Name of principal shareholder
Activity of shar eholder Percentage of shareholding
CSC STEEL HOLDINGS BERHAD
INVESTMENT HOLDING AND PROVISION OF MANAGEMENT SERVICES.
100%

NON-CONFIDENTIAL
2
2. Additional information of the Petitioner: a. A diagram outlining the overall organisational structure, including the
involved units within the company is provided in Appendix CSCM-A-1 (provided in confidential version).
b. Copies of legal documents (e.g. Form 24, Form 48, Form 13) are
provided in Appendix CSCM-A-2 (Form 13) and Appendix CSCM-A-3 (Form 24) – provided in confidential version.
c. A copy of most recent annual report together with relevant brochures
on business activities are provided in Attachment CSCM-A-1 and Attachment CSCM-A-2 (provided in confidential version).
3. Related companies in other countries are as per Table A-3.2:
Table A-3.2: Related Companies Listing
4. Tatt Giap Steel Centre Sdn. Bhd. provide shearing and slitting services.
Name, address, email, telephone, fax of related company
in all countries
List of activities
Tick if manufacturer of
the PUI √
Tick if supplier of input used in
the manufacturing
of the PUI √
Tick if importer
of the PUI
√
Percentage of your
company’s shareholding
in related company
Percentage of related
company’s shareholding
in your company
CHINA STEEL CORPORATION 1 Chung Kang Road Hsiao Kang, Kaohsiung 81233 Taiwan, Republic of China. Tel:886(7)802-1111 Fax:886(7)805-1535
Steel Producer √
√
NIL Not Applicable 46%
TATT GIAP STEEL CENTRE SDN.BHD. Plot 33, Jalan Perusahaan Bukit Minyak, Bukit Minyak Industrial Park, 14000 Bukit Mertajam, Penang, Malaysia. Tel: (6)04-507 0033
/0022 Fax: (6)04-507 0066
Service Center for
Steel Products
√
20% Not Applicable

NON-CONFIDENTIAL
3
A copy of the agreement is provided in Appendix CSCM-A-4(provided in con-fidential version).
CSCM does not have control or influence on the decision making and type of activities of Tatt Giap although CSCM holds a minority 20% share. Based on this we are not able to provide the detailed import information of Tatt Giap. However, CSCM is of the understanding that Tatt Giap is also buying materi-als from Japanese trading house established in Malaysia.

NON-CONFIDENTIAL
4
SECTION B ACCOUNTING SYSTEM AND POLICIES
B-1 Accounting System and Policies
These are submitted in the confidential version of Petition.

NON-CONFIDENTIAL
5
SECTION C DOMESTIC INDUSTRY
C-1 Domestic Industry 1. The Petitioner who is producing the Like Product is submitting the Petition on
behalf of the Domestic Industry and the following Table C-1 provides information on total domestic industry’s production during POI.
Table C-1: Total Production of Domestic Industry
Petitioner’s/Supporting Producers’ data Estimated data
Model/Grade/Type of products Volume (POI)
A. Petitioner (s)
CSCM *****MT B. Companies supporting the application
Megasteel Sdn. Bhd.
Mycron Steel Berhad *****MT*
YKGI Holdings Berhad C. Companies opposing on the application
NONE
D. Companies not commenting on the
application - neutral (estimated)
NONE E. Total Malaysian Production (estimated)
A+B+C+D=E *****MT**
F. Of the companies that have commented,
the portion of production represented by companies supporting the application is (%)
[(A+B)/(A+B+C)]x100
100%
G. The portion of total production
supporting the application is (%)
[(A+B)/(E)]x100
100%

NON-CONFIDENTIAL
6
Source: * Letter of support from domestic producers as in Part B in Table C-1 with individual production volumes have been sent directly to the Investigating Authority. **Consolidated production volume is provided by MSI and is attached as Appendix CSCM-C-1 (provided in confidential version). 2. From table C-1.1, the Petitioner fulfils the requirement of support of more than
50% of the total production of the Like Product by producers supporting or opposing the petition and, at least 25% of the total Malaysian production of the Like Products. The support letters have been sent directly to the Investigating Authority by domestic producers.
3. The details of the Malaysian producers of the Like Products in Table C-2
below: Table C-2: Contact Information of Malaysian Producers
Name of company Address/ Tel ephone/Fax Association Member
Megasteel Sdn. Bhd.
Lot 2319, Kawasan Perindustrian Olak Lempit, Mukim Tanjung Dua Belas, 42700 Banting, Selangor. Tel: +603-3182 2200 Fax: +603-3182 2211 / 2233
MSA (Malaysian Steel Association)
Mycron Steel Berhad Lot 717, Jalan Sungai Rasau, Seksyen 16, P.O.Box 7168, 40706 Shah Alam, Selangor. Tel: +603-5510 6608 Fax: +603-5510 3720 / 4126
MISIF (The Malaysian Iron an d Steel Industry Federation)
YKGI Holdings Berhad
Lot 6472, Lorong Sungai Puloh/KU06, Kawasan Perindustrian Sungai Puloh, 42100 Klang, Selangor. Tel: +603-3297 5555 Fax: +603-3297 5678
MISIF (The Malaysian Iron an d Steel Industry Federation)

NON-CONFIDENTIAL
7
SECTION D
PRODUCT DESCRIPTION D-1 Product Specifications
1. The Petitioner regularly produces Cold Rolled Steel Coil (thickness: 0.2mm-
2.6mm & width: 700mm-1300mm). Widths of less than 700mm can be sup-plied by the Petitioner based on request. (Note: Domestic industries as a whole can produce widths less than 600mm).
2. Details of the products produced and/or exported by the Petitioner (Like Prod-ucts) include:
a. Physical, technical and chemical characteristics ;
Cold rolled steel coil commonly known as “CRC” is a type of flat steel product winded in coil formed, which use hot rolled steel coil as raw material. Cold rolled steel providing bright or dull surface finish free from scale and rust with versatile mechanical strength range from extra soft to high strength depending on end applications requirement.
Cold Rolled Steel Coil (full hard, bright surface) Cold Rolled Steel Coil (annealed, dull surface) Typical chemical and mechanical characteristics:
1. Carbon: 0.02~0.93%; 2. Manganese: 1.5% max; 3. Phosphorus: 0.05% max; 4. Sulphur: 0.05% max; 5. Yield strength: 110~1050mPa; 6. Tensile strength: 150~1100mPa; 7. Elongation: 1~50%; 8. Hardness: 25~105HRB.
b. End use:
Industries Example of end usage Automotive Car body, Car Chair, Canister, Car panels,
Motor chain, Fuel injection tubes, Car window frame, Air bag housing, Safety belts hardness, Brackets
Construction Pipes & tubes, Scaffolding, Deck Hardware & tools Fire extinguisher, Cutter, Wheel barrow
tray, Clips, Rivet, Spring, Washer, Knife Home and electrical appliances
Furniture, Switch board/panel, Tables, Chairs, Drawer slide, Electrical Relay, Oven, TV panel
Storage Steel drums, tanks
NON-CONFIDENTIAL
8
Steel coating (as substrate)
End usages for metallic or paint coated steel product such as roofing & cladding, electrical & home appliances, hardware
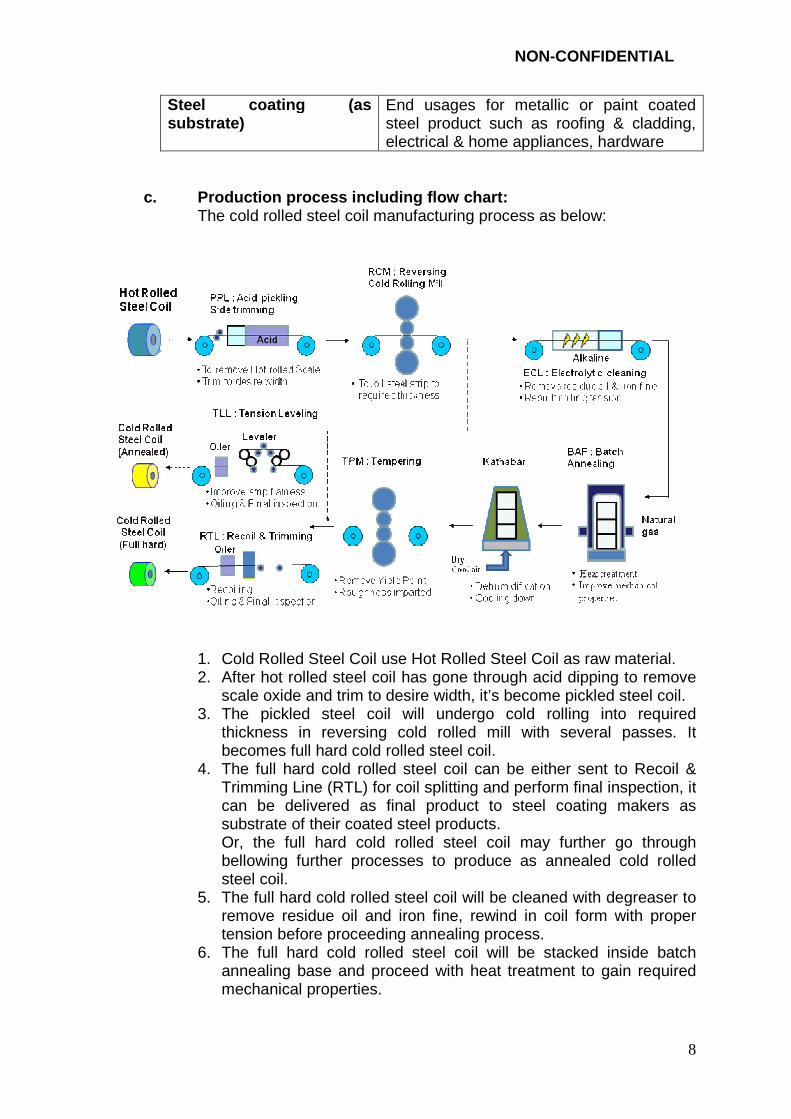
c. Production process including flow chart: The cold rolled steel coil manufacturing process as below:
1. Cold Rolled Steel Coil use Hot Rolled Steel Coil as raw material. 2. After hot rolled steel coil has gone through acid dipping to remove
scale oxide and trim to desire width, it’s become pickled steel coil. 3. The pickled steel coil will undergo cold rolling into required
thickness in reversing cold rolled mill with several passes. It becomes full hard cold rolled steel coil.
4. The full hard cold rolled steel coil can be either sent to Recoil & Trimming Line (RTL) for coil splitting and perform final inspection, it can be delivered as final product to steel coating makers as substrate of their coated steel products. Or, the full hard cold rolled steel coil may further go through bellowing further processes to produce as annealed cold rolled steel coil.
5. The full hard cold rolled steel coil will be cleaned with degreaser to remove residue oil and iron fine, rewind in coil form with proper tension before proceeding annealing process.
6. The full hard cold rolled steel coil will be stacked inside batch annealing base and proceed with heat treatment to gain required mechanical properties.
NON-CONFIDENTIAL
9
7. After annealing process, the cold rolled coils will be further cooled down to room temperature in facility called “Kathabar” before heading for tempering process.
8. During the tempering process in TPM, the yield point phenomenon of annealed cold rolled coil can be eliminated; the coil surface finishing can also be adjusted with certain roughness.
9. Lastly, the cold rolled steel coil will undergo tension levelling to improve the steel strips flatness, performing final inspection and oiling for rust preventive purpose.
10. The annealed cold rolled steel coil will be packed and labelled accordingly before delivering to customer.
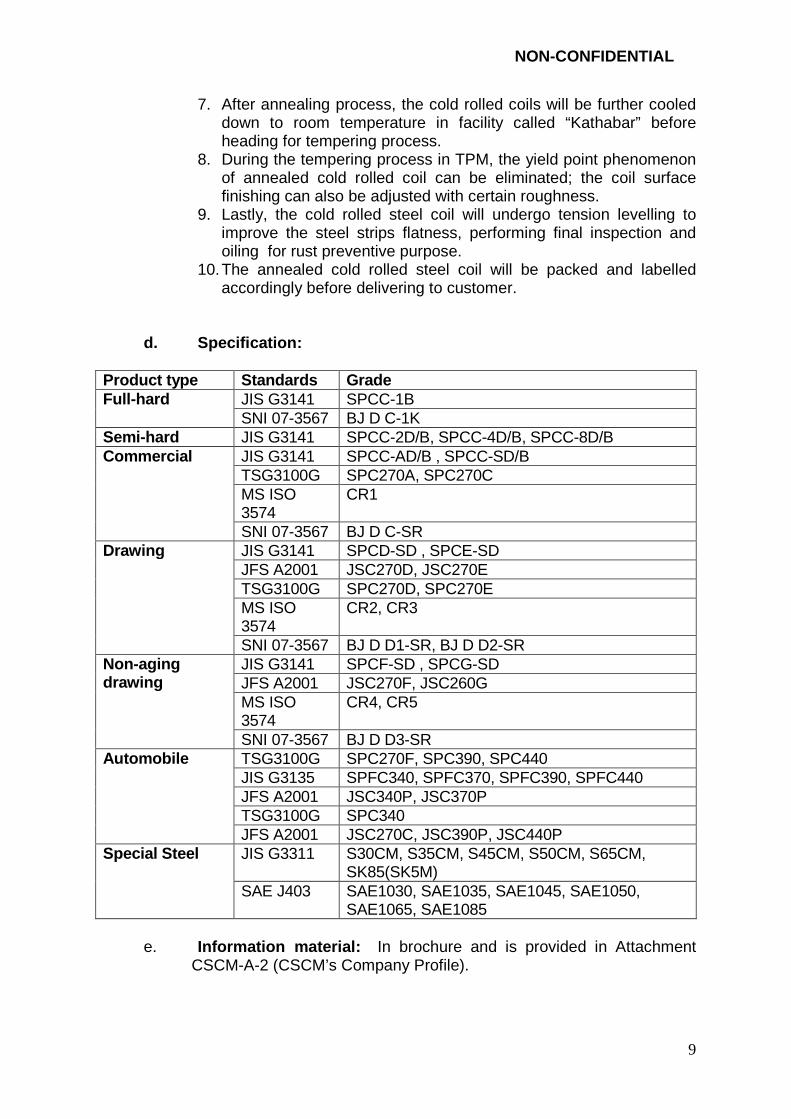
d. Specification:
Product type Standards Grade Full -hard JIS G3141 SPCC-1B
SNI 07-3567 BJ D C-1K Semi-hard JIS G3141 SPCC-2D/B, SPCC-4D/B, SPCC-8D/B Commercial
JIS G3141 SPCC-AD/B , SPCC-SD/B TSG3100G SPC270A, SPC270C MS ISO 3574
CR1
SNI 07-3567 BJ D C-SR Drawing
JIS G3141 SPCD-SD , SPCE-SD JFS A2001 JSC270D, JSC270E TSG3100G SPC270D, SPC270E MS ISO 3574
CR2, CR3
SNI 07-3567 BJ D D1-SR, BJ D D2-SR Non-aging drawing
JIS G3141 SPCF-SD , SPCG-SD JFS A2001 JSC270F, JSC260G MS ISO 3574
CR4, CR5
SNI 07-3567 BJ D D3-SR Automobile TSG3100G SPC270F, SPC390, SPC440
JIS G3135 SPFC340, SPFC370, SPFC390, SPFC440 JFS A2001 JSC340P, JSC370P TSG3100G SPC340 JFS A2001 JSC270C, JSC390P, JSC440P
Special Steel JIS G3311 S30CM, S35CM, S45CM, S50CM, S65CM, SK85(SK5M)
SAE J403 SAE1030, SAE1035, SAE1045, SAE1050, SAE1065, SAE1085
e. Information material: In brochure and is provided in Attachment
CSCM-A-2 (CSCM’s Company Profile).
NON-CONFIDENTIAL
10
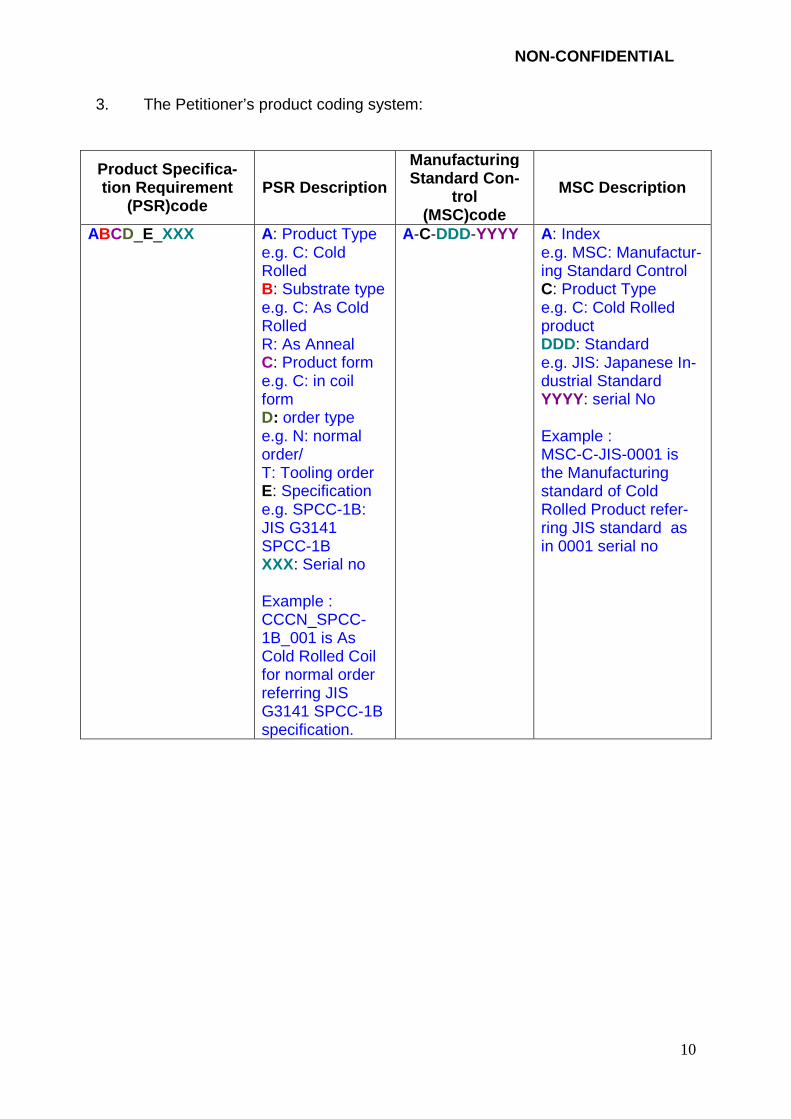
3. The Petitioner’s product coding system:
Product Specifica-tion Requirement
(PSR)code PSR Description
Manufactu ring Standard Con-
trol (MSC)code
MSC Description
ABCD_E_XXX A: Product Type e.g. C: Cold Rolled B: Substrate type e.g. C: As Cold Rolled R: As Anneal C: Product form e.g. C: in coil form D: order type e.g. N: normal order/ T: Tooling order E: Specification e.g. SPCC-1B: JIS G3141 SPCC-1B XXX: Serial no Example : CCCN_SPCC-1B_001 is As Cold Rolled Coil for normal order referring JIS G3141 SPCC-1B specification.
A-C-DDD-YYYY A: Index e.g. MSC: Manufactur-ing Standard Control C: Product Type e.g. C: Cold Rolled product DDD: Standard e.g. JIS: Japanese In-dustrial Standard YYYY: serial No Example : MSC-C-JIS-0001 is the Manufacturing standard of Cold Rolled Product refer-ring JIS standard as in 0001 serial no
NON-CONFIDENTIAL
11
4. Description of the subject merchandise :
a. Physical, technical and chemical characteristics ;
Cold rolled steel coil commonly known as “CRC” is a type of flat steel product wound in coil form, which uses hot rolled steel coil as raw material. Cold rolled steel providing bright or dull surface finish free from scale and rust with versatile mechanical strength range from extra soft to high strength depending on end applications requirement. Typical chemical and mechanical characteristics:
i. Carbon: 0.02~0.93%; ii. Manganese: 1.5% max; iii. Phosphorus: 0.05% max; iv. Sulphur: 0.05% max; v. Boron*: 0.0001~0.003%; vi. Yield strength: 110~1050mPa; vii. Tensile strength: 150~1100mPa; viii. Elongation: 1~50%; ix. Hardness: 25~105HRB.
*: economically and metallurgically insignificant but traceable amount of Boron may be added into the material and declared as alloy steel but can be used for the same purposes/end use as the Like Products produced by the Domestic Industry in Malaysia.
b. End use; Industries Example of end usage Automotive Car body, Car Chair, Canister, Car panels,
Motor chain, Fuel injection tubes, Car window frame, Air bag housing, Safety belts hardness, Brackets…etc
Construction Pipes & tubes, Scaffolding, Deck…etc Hardware & tools Fire extinguisher, Cutter, Wheel barrow
tray, Clips, Rivet, Spring, Washer, Knife…etc
Home and electrical appliances
Furniture, Switch board/panel, Tables, Chairs, Drawer slide, Electrical Relay, Oven, TV panel…etc
Storage Steel drums, tanks…etc Steel coating (as substrate)
End usages for metallic or paint coated steel product such as roofing & cladding, electrical & home appliances, hardware…etc
c. Production process including flow chart:
Cold Rolled Coil (CRC) can be manufactured by undergoing processes which include pickling, cold rolling, various types of facilities either with
NON-CONFIDENTIAL
12
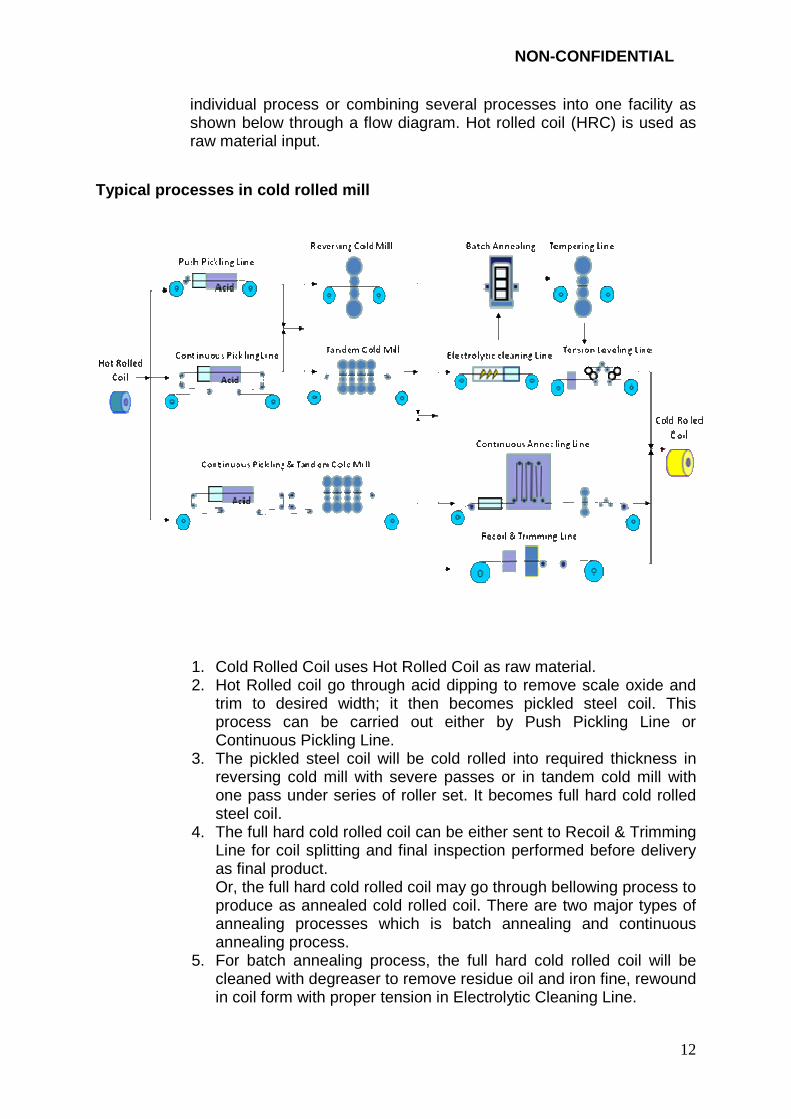
individual process or combining several processes into one facility as shown below through a flow diagram. Hot rolled coil (HRC) is used as raw material input.
Typical processes in cold rolled mill
1. Cold Rolled Coil uses Hot Rolled Coil as raw material. 2. Hot Rolled coil go through acid dipping to remove scale oxide and
trim to desired width; it then becomes pickled steel coil. This process can be carried out either by Push Pickling Line or Continuous Pickling Line.
3. The pickled steel coil will be cold rolled into required thickness in reversing cold mill with severe passes or in tandem cold mill with one pass under series of roller set. It becomes full hard cold rolled steel coil.
4. The full hard cold rolled coil can be either sent to Recoil & Trimming Line for coil splitting and final inspection performed before delivery as final product. Or, the full hard cold rolled coil may go through bellowing process to produce as annealed cold rolled coil. There are two major types of annealing processes which is batch annealing and continuous annealing process.
5. For batch annealing process, the full hard cold rolled coil will be cleaned with degreaser to remove residue oil and iron fine, rewound in coil form with proper tension in Electrolytic Cleaning Line.

NON-CONFIDENTIAL
13
6. The cleaned full hard cold rolled coil will be stacked inside batch annealing base and proceed for heat treatment to gain required mechanical properties. After annealing process, those cold rolled coils will be further cooled down to room temperature in a facility called “Kathabar” before heading for tempering process.
7. During the tempering process in TPM, the yield point phenomenon of annealed cold rolled coil can be eliminated; the coil surface finishing can also be adjusted with certain roughness.
8. Lastly, the cold rolled coil will go through tension levelling to improve the steel strips flatness, performing final inspection and oiling for rust preventive purpose.
9. The annealed cold rolled coil will be packed and labelled accordingly before delivery to customer.
10. For Continuous annealing process, the process flow will be similar to batch annealing process as mentioned in step 5 to 8, except all the processes of cleaning, heat treating, tempering, levelling, oiling and inspection will be performed in a single line equipping with dedicated facilities in a single continuous annealing line. The annealed cold rolled steel coil will be packed and labelled accordingly before delivery to customer.
d. Specification:
Product type Standards Grade Full -hard JIS G3141 SPCC-1B
SNI 07-3567 BJ D C-1K Semi-hard JIS G3141 SPCC-2D/B, SPCC-4D/B, SPCC-8D/B Commercial
JIS G3141 SPCC-AD/B , SPCC-SD/B TSG3100G SPC270A, SPC270C MS ISO 3574 CR1 SNI 07-3567 BJ D C-SR
Drawing
JIS G3141 SPCD-SD , SPCE-SD JFS A2001 JSC270D, JSC270E TSG3100G SPC270D, SPC270E MS ISO 3574 CR2, CR3 SNI 07-3567 BJ D D1-SR, BJ D D2-SR
Non-aging drawing
JIS G3141 SPCF-SD , SPCG-SD JFS A2001 JSC270F, JSC260G MS ISO 3574 CR4, CR5 SNI 07-3567 BJ D D3-SR
Automobile TSG3100G SPC270F, SPC390, SPC440 JIS G3135 SPFC340, SPFC370, SPFC390, SPFC440 JFS A2001 JSC340P, JSC370P TSG3100G SPC340 JFS A2001 JSC270C, JSC390P, JSC440P
Special Steel JIS G3311 S30CM, S35CM, S45CM, S50CM, S65CM, SK85(SK5M)
SAE J403 SAE1030, SAE1035, SAE1045, SAE1050, SAE1065, SAE1085

NON-CONFIDENTIAL
14
5. The following flow charts illustrate the production process of the products produced by the Petitioner with that imported from the alleged country(s) in this proceedings:
One of the Korean CRC producer’s process flow chart :
*For Vietnam we believe the process is similar with Korea.

NON-CONFIDENTIAL
15
One of the China’s Producer’s CRC process flow char t

NON-CONFIDENTIAL
19
6. Table D-1.5 provides the comparability of the products produced by the Petitioner with that imported from the alleged country(s) in this proceeding: .
Table D-1.5: Product Comparability
Types of Product Produced by the
Petitioner
Imported Competitive
Products (Subject
Merchandise)
Identical Characteristics
Differences
Cold Rolled Steel Coil (CR) (HS CODE: 7209.15.000, 7209.16.000, 7209.17.000, 7209.18.290, 7209.18.900, 7225.50.000) (AHTN CODE: 7209.15.0000, 7209.16.0000, 7209.17.0000, 7209.18.9920, 7209.18.9990, 7225.50.1000, 7225.50.9000)
Cold Rolled Steel Coil (CR) - alloy or non-alloy (HS CODE: 7209.15.000, 7209.16.000, 7209.17.000, 7209.18.290, 7209.18.900, 7225.50.000) (AHTN CODE: 7209.15.0000, 7209.16.0000, 7209.17.0000, 7209.18.9920, 7209.18.9990, 7225.50.1000, 7225.50.9000)
• Appearance • Characteristics • Production Pro-
cess^ • Chemical content* • Mechanical proper-
ties • Sizes • Tariff code# • End applications
• Production Process^
• Chemical content*
Remark: ^: Cold rolled steel can be rolled down to require thickness either by reversing cold rolling mill (RCM) or tandem cold rolling mill (TCM). It can also been heat treated either by batch annealing furnace (BAF) or continuous annealing line (CAL). *: Some of the imported cold rolled steel may have traceable amount of Boron element added and classified as alloy steel.
#: Metallurgically insignificant but traceable amount of Boron/ other added alloy may be added into the material but end application is the same.

NON-CONFIDENTIAL
20
7. The tariff classification and rate of duty applied to the subject merchandise are provided in Table D-1.6.
Table D-1.6: Tariff Classification
HS
Code/AHTN Product Description MFN
Rate (%)*
Preferential Rate
ATIGA (%)*
Preferential Rate (%)
China (ACFTA)*
Preferential Rate (%)
Korea (AKFTA) *
7209.15.000, 7209.15.0000
Flat-rolled products of iron or non-alloy steel, of a width of 600mm or more, cold-rolled (cold-reduced), not clad, plated or coated, in coils, not further worked than cold-rolled (cold-reduced): Of a thickness of 3mm or more
20 0 15 20
7209.16.000, 7209.16.0000
Flat-rolled products of iron or non-alloy steel, of a width of 600mm or more, cold-rolled (cold-reduced), not clad, plated or coated, in coils, not further worked than cold-rolled (cold-reduced): Of a thickness exceeding 1mm but less than 3mm
20 0 15 20
7209.17.000, 7209.17.0000
Flat-rolled products of iron or non-alloy steel, of a width of 600mm or more, cold-rolled (cold-reduced), not clad, plated or coated, in coils, not further worked than cold-rolled (cold-reduced): Of a thickness of 0.5mm or more but not exceeding 1mm
20 0 20 20
7209.18.290, Flat-rolled products 20 0 20 20

NON-CONFIDENTIAL
21
7209.18.900, 7209.18.9920, 7209.18.9990
of iron or non-alloy steel, of a width of 600mm or more, cold-rolled (cold-reduced), not clad, plated or coated, in coils, not further worked than cold-rolled (cold-reduced): Of a thickness of less than 0.5mm
7225.50.000, 7225.50.1000, 7225.50.9000
Flat-rolled products of other alloy steel, of a width of 600mm or more, and of a width of less than 600mm, Other, not further worked than cold-rolled (cold-reduced)
0 0 0 0
Source: Royal Malaysian Customs Department (hs-explorer) *The rate of duty is according to latest scheduled rate of duty from the Tariff Finder. (http://tariff.customs.gov.my/)
NON-CONFIDENTIAL
22
SECTION E DUMPING
E-1 Source of Imports 1. The Petitioner is alleging that the sources of dumped imports into the
Malaysia market are from China, Korea and Vietnam. 2. Each alleged country is the country of origin of the imported products. 3. Although Malaysia recognises China as a country to be operating as a market
economy, the Petitioner respectfully requests that each producer/exporter from China needs to satisfy the Investigating Authority that they are indeed also operating under market economy conditions.
4. The names, addresses and contact details as follows of:
a) Producers/exporters from the alleged countries a re as follows:
Company Name Address Tel/Fax Number
1. Baoshan Iron & Steel Co., Ltd.
Baosteel Administrative Center, No. 885 Fujin Road, Baoshan District, Shanghai, China.
Tel: +86 21 26647000 Fax: +86 21 26649000
2. Angang Steel Company Limited
No. 322 South Zhonghua Rd, Anshan, Liaoning, Chi-na.
Tel: (86 412) 6366 804 Fax: (86 412) 6319 703
3. Tangshan Ganglu Iron&steel Co., Ltd.
198 East Street, Hebei Province Zunhua Zhenhai.
Tel: 0315-6651515 Fax: 0315-6651516
4. Taishan Steel No.1, Xinfu Road, Laicheng Dist.; Laiwu; Shandong; 271100
Tel: +86-634-6117211 Fax: +86-634-6114423
5. Jiangsu Shagang International Trade Co.,Ltd.
Jinfeng Town, Zhangjiagang City, Jiangsu Province, PRC.
Tel: +86-512-58568261
6. Jigang Group Co.,Ltd.
21 Gongyebeilu Road, Jinan, Shandong Province, PRC.
Fax:+86-531-88982126
7. Anyang Iron & Steel Group Co.,Ltd.
Yindu District, Anyang henen, 455004. Tel: 0372-3120114 / 0372-3121261 Fax: 0371-3931892
8. Taiyuan Iron & Steel (Group) Co.,Ltd.
No.2, Jiancaoping, Taiyuan, Shanxi Province, China Postcode: 030003
Tel: 86-351-3012615 / 86-351-3131542 Fax: 86-351-3134170
9. China Jianlong Steel Industrial Co.Ltd.
1-10th Floor, Yin Cheng Commercial Mansion, 12 Changnan Road, Dongcheng dist., Beijing, China. Postcode:100020
E-mail: [email protected]
China:

NON-CONFIDENTIAL
23
10. Handan Iron & Steel Group Co., Ltd.
Fuxing Road 232, Handan, Hebei, China. Tel: (86)310-6072141 E-mail: [email protected]
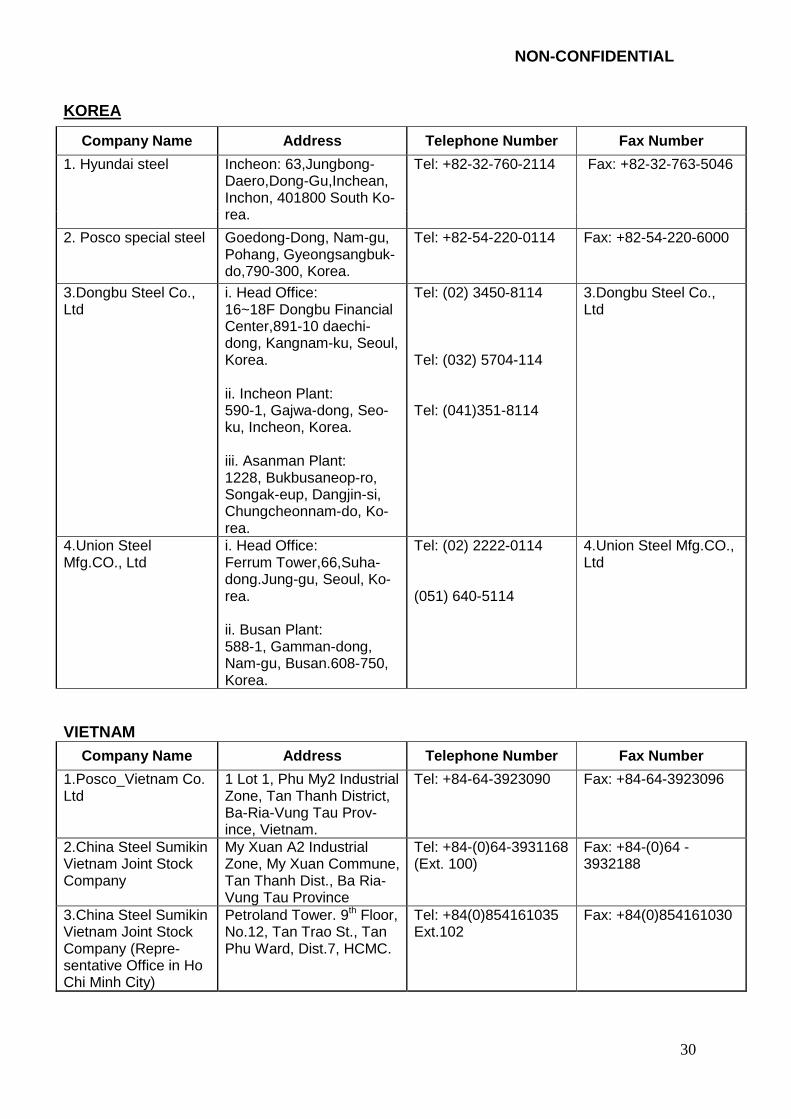
Remark : Refer to Appendix CSCM-D-1 for ‘List of China’s Top 80 Steel Manufacturers’ Korea:
Company Name Address Tel/Fax Number
1. Hyundai steel
Incheon:63,Jungbong-Daero,Dong-Gu,Inchean, In-chon, 401800 South Korea.
Tel: +82-32-760-2114 Fax: +82-32-763-5046
2. Posco South Ko-rea
Goedong-Dong, Nam-gu, Pohang, Gyeongsangbuk-do,790-300, Korea.
Tel: +82-54-220-0114 Fax: +82-54-220-6000
3.Dongbu Steel Co., Ltd
i. Head Office: 16~18F Dongbu Financial Center,891-10 daechi-dong, Kangnam-ku, Seoul, Korea. ii. Incheon Plant: 590-1, Gajwa-dong, Seo-ku, Incheon, Korea. iii. Asanman Plant: 1228, Bukbusaneop-ro, Songak-eup, Dangjin-si, Chungcheonnam-do, Korea.
Tel: (02) 3450-8114 Tel: (032) 5704-114 Tel: (041)351-8114
4.Union Steel Mfg.CO., Ltd
i. Head Office: Ferrum Tower,66,Suha-dong.Jung-gu, Seoul, Korea. ii. Busan Plant: 588-1, Gamman-dong, Nam-gu, Busan.608-750, Ko-rea.
Tel: (02) 2222-0114 (051) 640-5114
Vietnam
Company Name Address Tel/Fax Number
1. Posco_Vietnam Co. Ltd
1 Lot 1, Phu My2 Industrial Zone, Tan Thanh District, Ba-Ria-Vung Tau Province, Vietnam.
Tel: +84-64-3923090 Fax: +84-64-3923096
2. China Steel Sumikin Vietnam Joint Stock Com-pany
My Xuan A2 Industrial Zone, My Xuan Commune, Tan Thanh Dist., Ba Ria-Vung Tau Province
Tel: +84-(0)64-3931168 (Ext. 100) Fax: +84-(0)64 - 3932188
3. China Steel Sumikin Vietnam Joint Stock Com-pany (Repre-sentative Office In Ho Chi Minh City)
Petroland Tower. 9th Floor, No.12, Tan Trao St., Tan Phu Ward, Dist.7, HCMC.
Tel: +84(0)854161035 Ext.102 Fax: +84(0)854161030
NON-CONFIDENTIAL
24
b) Importers in Malaysia (from the alleged countrie s):
Company Name Address Tel/Fax Number
1 Anshin Steel Service Centre Sdn Bhd
Wisma Ann Joo, Lot 19391, Batu 8 ½, Jalan Klang Lama, 46000 Petaling Jaya, Selangor Da-rul Ehsan.
Tel: (603)-7874 2233 Fax: (603)-7874 1249
2 Bright Steel Service Centre Sdn Bhd
Lot 177, Jalan Utas, 40000 Shah Alam, Selangor Darul Ehsan, Malaysia.
Tel : (603) 5519 1088 Fax: (603) 5519 3744
3 Greif Malaysia Sdn Bhd
10 Jalan Kilang, 46050 Petaling Jaya, Selangor Darul Ehsan, Malaysia.
Tel: (603)-7787 6800 Fax: (603)-7783 4342
4 Japmas Steel Sdn Bhd
PLO 132, Jalan Angkasa Mas Utama, Kawasan Perindustrian Tebrau II, 81100 Johor Bahru, Jo-hor, Malaysia.
Tel: (607)-353 7312 Fax: (607)-353 7310
5 Leader Steel Service Centre Sdn Bhd
Plot 85, Lorong Perusahaan Utama, Kawasan Perusahaan Bukit Tengah, 14000 Bukit Tengah, Seberang Perai Tengah, Penang, Malaysia.
Tel: (604)-507 1515 Fax: (604)-507 9527
6 Leform Sdn Bhd
Lot 4306-4312, Jalan Kg Mohd Taib, Kawasan Perindustrian Sg Choh, 48200 Serendah, Selan-gor Darul Ehsan.
Tel: (603)-3290 2022 Fax: (603)-3291 1088.
7 POSCO-MKPC Sdn Bhd
Lot PT 10443, P3 Jalan Persiaran Sultan Abdul Samad, Kawasan Perindustrian Fasa 4, Bandar Sultan Suleiman, 42000 Pelabuhan Klang, Se-langor, Malaysia.
Tel: (603)-3258 2100 Fax: (603)-3258 2103
8 Prestar Precision Tube Sdn Bhd
Lot 1298, Rawang Industrial Estate, 16 1/2 Miles, Jalan Ipoh, 48000 Rawang, Selangor, Malaysia.
Tel: (603)-6090 2759 Fax : (603)-6092 4507
9 Stanta Mauser (Ma-laysia) Sdn Bhd
No.3 & 5, Lorong Keluli 1C, Taman Perindustrian Bukit Raja, 40000 Shah Alam, Selangor. Tel: (603)-3341 0215
Fax: (603)-3344 0915
10 Sumiputeh Steel Cen-tre Sdn Bhd
Lot 10, Persiaran Selangor, P O Box 7089, 40702 Shah Alam, Selangor, Malaysia. Tel: (603)-5519 5411
Fax: (603)-5519 9970
11 Tashin Steel Sdn Bhd Plot 40, Lorong Perusahaan Maju 7, Kawasan Perusahaan 4, 13600 Prai, Penang, Malaysia.
Tel: (604)-509 0888 Fax: (604)-507 7100
12 United U-LI (M) Sdn Bhd
33, Jalan Kartunis U1/47, Temasya Industrial Park, Seksyen U1, 40150 Shah Alam, Selangor Darul Ehsan.
Tel: (603)-5569 5999 Fax: (603)-5569 4170
13 Xinsteel Sdn Bhd Lot 5037 Jalan Teratai, Batu 5, Off Jalan Meru, 41050 Klang, Selangor.
Tel: (603)-3362 2688 Fax: (603)-3392 0327

NON-CONFIDENTIAL
25
5. On the requirement to meet the imports from the alleged countries to be individually above negligible volume of 3%, and based on the following official import statistics obtained from Department of Statistics, Malaysia (DoS), the alleged countries’ individual imports during the POI is above 3%.
6. Table E-1.5 provides the sources of imports of the products under
investigation (PUI).
Table E-1.5: Source of imports
i) Year 1:
Country Volume of Import (MT)
Values of Import (RM)
Percentage of Imports
(%)
Alleged Countries:
KOREA 278,183.398 701,529,165.00 35.47
VIETNAM 105,173.460 243,444,833.00 13.41
CHINA 80,551.872 189,151,281.00 10.27
Sub Total 463,908.730 1,134,125,279.00 59.15
Non Alleged Countries:
JAPAN 199,127.729 552,170,209.00 25.39
TAIWAN 89,882.176 220,290,110.00 11.46
THAILAND 14,061.658 39,887,931.00 1.79
AUSTRALIA 8,229.430 19,269,498.00 1.05
HONG KONG 7,269.164 17,510,976.00 0.93
INDIA 1,401.537 3,794,712.00 0.18
NEW ZEALAND 231.960 502,706.00 0.03
SINGAPORE 171.660 686,620.00 0.02 UNITED ARAB EMIR-ATES 13.772 41,316.00 0.00
UNITED STATES 6.167 51,008.00 0.00
GERMANY 4.200 30,840.00 0.00
UNITED KINGDOM 0.450 6,778.00 0.00
Sub Total 320,399.903 854,242,704 40.85
Total Import 784,308.633 1,988,367,983.000 100.00
NON-CONFIDENTIAL
26
ii) Year 2:
Country Volume of Import (MT)
Values of Import (RM)
Percentage of Imports
(%)
Alleged Countries: KOREA 228,886.965 562,078,530.00 26.95 CHINA 139,545.967 327,232,859.00 16.43 VIETNAM 133,963.063 298,824,808.00 15.77 Sub Total 502,395.995 1,188,136,197.000 59.15 Non Alleged Countries: JAPAN 213,777.366 560,040,718.00 25.17 TAIWAN 68,726.663 160,667,912.00 8.09 AUSTRALIA 53,294.989 117,470,887.00 6.27 INDIA 5,842.060 15,205,811.00 0.69 HONG KONG 2,814.720 6,038,112.00 0.33 UKRAINE 1,380.924 4,497,381.00 0.16 THAILAND 633.309 3,163,576.00 0.07 NEW ZEALAND 266.850 481,219.00 0.03 SINGAPORE 242.937 797,949.00 0.03 FRANCE 40.472 193,565.00 0.00 UNITED STATES 3.219 28,463.00 0.00 UNITED KINGDOM 1.268 12,322.00 0.00 Sub Total 347,024.776 868,597,915.000 40.85
Total Import 849,420.771 2,056,734,112.000 100.000

NON-CONFIDENTIAL
27
iii) POI:
Country Volume of Import (MT)
Value of Import (RM)
Percentage of Imports
(%)
Alleged Countries: KOREA 222,872.749 537,657,718.00 25.73 VIETNAM 136,583.574 319,184,086.00 15.76 CHINA 104,923.137 235,918,115.00 12.11 Sub Total 464,379.459 1,092,759,919.00 53.60 Non Alleged Countries JAPAN 268,266.309 688,523,453.00 30.97 TAIWAN 105,306.433 243,279,162.00 12.16 AUSTRALIA 24,878.320 52,425,328.00 2.87 INDIA 2,419.879 5,418,662.00 0.28 THAILAND 596.663 2,788,079.00 0.07 HONG KONG 382.907 830,056.00 0.04 UNITED STATES 21.033 300,650.00 0.00 FRANCE 9.377 46,573.00 0.00 SINGAPORE 3.355 12,377.00 0.00 SWEDEN 1.880 6,262.00 0.00 INDONESIA 0.624 11,388.00 0.00 Sub Total 401,886.779 993,641,990.00 46.40
Total Import 866,266.239 2,086,401,909.000 100.00 Source: Department of Statistics (DoS) E-2 Export Price
1. The FOB/CIF export price(s) of the imported products during period of
investigation is provided in Table E-2.1:
Table E-2.1: Export price
Country HS Code/AHTN
Grade/Models/Type
Export price USD/mt
(FOB/CIF) China ***** ***** *****
Korea ***** ***** *****
Vietnam ***** ***** *****

NON-CONFIDENTIAL
28
i. Sources of Export Price :
China & Korea : ***** - Appendix CSCM-E-1 (Provided in confidential submission)
Vietnam : ***** - Appendix CSCM-E-2 (Provided in confidential submission)
ii. Please refer to Appendix CSCM-E-3, Appendix CSCM-E-4 and Appen-
dix CSCM-E-5 for the evidences on export prices (provided in confiden-tial submission).
iii. Exchange rate is source from Bank Negara Malaysia as per enclosed
in Appendix CSCM-E-6.
E-3 Selling Price (Normal Value) in the Exporter’s Domestic Market .
1. The selling price on the domestic market of the country of export is provided
in Table E-3.1.
Table E-3.1: Selling price (normal value)
i. Sources of Normal Value :
China & Korea : ***** - Appendix CSCM-E-1 (Provided in confidential submission)
Vietnam : ***** - Appendix CSCM-E-2 (Provided in confidential submission)
ii. Exchange rate is source from Bank Negara Malaysia as per enclosed in Appendix CSCM-E-6.
2. Names and contact details of other known sellers of like products in the domestic market of the exporting country are provided in Table E-3.3.
Country HS Code/AHTN Grade/Models/Type
Selling price (normal value)
EXW China ***** ***** *****
Korea ***** ***** *****
Vietnam ***** ***** *****

NON-CONFIDENTIAL
29
Table E-3.3: List of Foreign Producers
Company Name Address Telephone Number Fax Number
1. Baoshan Iron & Steel Co., Ltd.
Baosteel Administrative Center, No. 885 Fujin Road, Baoshan District, Shanghai, China.
Tel: +86 21 26647000 Fax: +86 21 26649000
2. Angang Steel Company Limited
No. 322 South Zhonghua Rd, Anshan, Liaoning, China.
Tel: +86-412-6366 804
Fax: +86-412-6319 703
3. Tangshan Ganglu Iron&steel Co., Ltd.
198 East Street, Hebei Province Zunhua Zhenhai.
Tel: 0315-6651515
Fax: 0315-6651516
4. Taishan Steel No.1, Xinfu Road, Laicheng Dist.; Laiwu; Shandong; 271100
Tel: +86-634-6117211
Fax: +86-634-6114423
5. Jiangsu Shagang International Trade Co.,Ltd.
Jinfeng Town, Zhang-jiagang City, Jiangsu Prov-ince, PRC.
Tel: +86-512-58568261 Tel: +86-512-58568261
6. Jigang Group Co.,Ltd.
21 Gongyebeilu Road, Ji-nan, Shandong Province, PRC.
Fax:+86-531-88982126
Fax:+86-531-88982126
7. Anyang Iron & Steel Group Co.,Ltd.
Yindu District, Anyang henen, 455004.
Tel: 0372-3120114 / 0372-3121261 Fax: 0371-3931892
Tel: 0372-3120114 / 0372-3121261 Fax: 0371-3931892
8. Taiyuan Iron & Steel (Group) Co.,Ltd.
No.2, Jiancaoping, Taiyu-an, Shanxi Province, Chi-na Postcode: 030003
Tel: 86-351-3012615 / 86-351-3131542 Fax: 86-351-3134170
Tel: 86-351-3012615 / 86-351-3131542 Fax: 86-351-3134170
9. China Jianlong Steel Industrial Co.Ltd.
1-10th Floor, Yin Cheng Commercial Mansion, 12 Changnan Road, Dong-cheng dist., Beijing, China. Postcode:100020
E-mail: [email protected]
E-mail: [email protected]
10. Handan Iron & Steel Group Co., Ltd.
Fuxing Road 232, Han-dan, Hebei, China.
Tel: (86)310-6072141 E-mail: [email protected]
Tel: (86)310-6072141 E-mail: [email protected]
Remark : Refer to Appendix CSCM-D-1 for ‘List of China’s Top 80 Steel Manufacturers’
CHINA
NON-CONFIDENTIAL
30
KOREA
Company Name Address Telephone Number Fax Number
1. Hyundai steel
Incheon: 63,Jungbong-Daero,Dong-Gu,Inchean, Inchon, 401800 South Ko-rea.
Tel: +82-32-760-2114
Fax: +82-32-763-5046
2. Posco special steel
Goedong-Dong, Nam-gu, Pohang, Gyeongsangbuk-do,790-300, Korea.
Tel: +82-54-220-0114
Fax: +82-54-220-6000
3.Dongbu Steel Co., Ltd
i. Head Office: 16~18F Dongbu Financial Center,891-10 daechi-dong, Kangnam-ku, Seoul, Korea. ii. Incheon Plant: 590-1, Gajwa-dong, Seo-ku, Incheon, Korea. iii. Asanman Plant: 1228, Bukbusaneop-ro, Songak-eup, Dangjin-si, Chungcheonnam-do, Ko-rea.
Tel: (02) 3450-8114 Tel: (032) 5704-114 Tel: (041)351-8114
3.Dongbu Steel Co., Ltd
4.Union Steel Mfg.CO., Ltd
i. Head Office: Ferrum Tower,66,Suha-dong.Jung-gu, Seoul, Ko-rea. ii. Busan Plant: 588-1, Gamman-dong, Nam-gu, Busan.608-750, Korea.
Tel: (02) 2222-0114 (051) 640-5114
4.Union Steel Mfg.CO., Ltd
VIETNAM
Company Name Address Telephone Number Fax Number
1.Posco_Vietnam Co. Ltd
1 Lot 1, Phu My2 Industrial Zone, Tan Thanh District, Ba-Ria-Vung Tau Prov-ince, Vietnam.
Tel: +84-64-3923090
Fax: +84-64-3923096
2.China Steel Sumikin Vietnam Joint Stock Company
My Xuan A2 Industrial Zone, My Xuan Commune, Tan Thanh Dist., Ba Ria-Vung Tau Province
Tel: +84-(0)64-3931168 (Ext. 100)
Fax: +84-(0)64 - 3932188
3.China Steel Sumikin Vietnam Joint Stock Company (Repre-sentative Office in Ho Chi Minh City)
Petroland Tower. 9th Floor, No.12, Tan Trao St., Tan Phu Ward, Dist.7, HCMC.
Tel: +84(0)854161035 Ext.102
Fax: +84(0)854161030

NON-CONFIDENTIAL
31
E-4 Exports from a Non-Market Economy
1. Individual producers/exporters from China to satisfy the Investigating Authority that it is functioning under market or non-market economy conditions.
E-5 Adjustments
1. A fair comparison is made below between the export price and the normal value. Adjustments have been made for differences in the terms and circumstances of the sales such as the level of trade, physical characteristics, taxes or other factors that affect price comparability.
2. Details of any known differences between the export price and the normal
value. Include supporting information and evidences, including the basis of estimates are provided as below:
Price of China (EXW) = FOB – Logistic cost Price of Korea (EXW) = FOB price Price of Vietnam (EXW) = CIF – Ocean Freight – Local logistic cost
i. Sources of Export Price :
China & Korea : ***** - Appendix CSCM-E-1 (Provided in confidential version)
Vietnam : ***** - Appendix CSCM-E-2 (Provided in confidential version)
ii. Please refer to Appendix CSCM-E-3, Appendix CSCM-E-4 and Appen-
dix CSCM-E-5 for the evidences on export prices (provided in confiden-tial version).
iii. Exchange rate is source from Bank Negara Malaysia as per enclosed in Appendix CSCM-E-6.
3. The amount of adjustments required for each and the adjustments applied to the domestic prices to calculate normal values, including supporting information and evidences, and the basis of estimates are provided as below:
i. Sources of Normal Value :
China & Korea : ***** - Appendix CSCM-E-1 (Provided in confidential version)
Vietnam : ***** - Appendix CSCM-E-2 (Provided in confidential version)

NON-CONFIDENTIAL
32
ii. Exchange rate is source from Bank Negara Malaysia as per enclosed
in Appendix CSCM-E-6.
E-6 Dumping Margin
1. The dumping margins established are as follows for the three alleged
countries:
China: Export Price : ***** Normal Value : ***** Dumping Margin (USD/MT): 23.78% Korea: Export Price : ***** Normal Value : ***** Dumping Margin (USD/MT): 21.64% Vietnam: Export Price : ***** Normal Value : ***** Dumping Margin (USD/MT): 4.83%

NON-CONFIDENTIAL
33
SECTION F MATERIAL INJURY (OPERATION)
F-1 Production and Capacity
1. The production capacity, actual production and capacity utilisation of the product produced by the Petitioner are provided in Table F-1.1.
Table F-1.1: Capacity Utilisation
Description
Year 1 Year 2 POI
A. Production capacity in units (specify the unit of measurement) 100 100 100
B. Actual production in units (specify the unit of measurement) 100 107 88
C. Capacity utilisation (%) (B/A) x 100 100 108 90
(Presented in indices – Submitted in Confidential Submission)
From Year 1 to Year 2, the actual production in terms of volume increased by *****MT, an increase by 6.53% but dropped by *****MT in POI compared to Year 2, which is 16.93%. The capacity utilisation increased from Year 1 to Year 2 from 100 to 108 but dropped to 90 during POI (in indices). The Petitioner suffered in terms of capacity utilisation during POI compared to Year 2.
2. The basis of determination of the Petitioner’s capacity (i.e. number of shifts,
working days per year, idle time of machinery for maintenance, changes in the production process) are provided as below:
(Presented in indices – Submitted in Confidential Submission)
Remark: WR : Work Roll BUR : Back Up Roll
Year Calendar hours ***** hrs Schedule Non maintenance (Public Holiday) *****
***** hrs Scheduled Maintenance ***** Abnormal downtime and WR/BUR change ***** % Operation delay (change passes, acce. & decc. ***** % Operating time ***** hrs
Annual Capacity *****RCM ***** tons *****RCM ***** tons
Total ***** tons

NON-CONFIDENTIAL
34
RCM : Reversing Cold Mill
3. The Cold-Rolled Coil Temper Mill will be revamped to be upgraded and work will commence around middle of year 2015, to include higher grade of products in future to cater for the Malaysian market.
F-2 Inventories
1. Table F-2.1 showing the volumes of inventories of the Petitioner:
Table F-2.1: Inventories
Description Year 1 Year 2 POI MT MT MT
Opening inventories 100 122 106 Add: Purchases Add: Production 100 107 88 Less: Sales 100 109 91 Captive use* 100 93 93 Other movements (explain) Closing inventories 100 87 74
* Captive use = internal consumption (Presented in indices – Submitted in Confidential Submission)
From Year 1 to Year 2, the Petitioner was able to manage its closing inventories from *****MT to *****MT, which is a fall of 12.95%. Noting the difficulty in selling in the domestic market due to the presence of dumped imports, the Petitioner had to take steps to monitor and better control inventory to reduce holding costs. As a result of these concerted efforts, in managing inventory, the closing inventories further decreased by 26.30% from ******MT to *****MT, when comparing Year 1 to POI. As mentioned, this was due to prudent management of the inventories to avoid over stocking and increased holding costs.
F-3 Employment and Wages
1. Table F-3.1 shows the number of people employed by the Petitioner:

NON-CONFIDENTIAL
35
Table F-3.1: Employment
Description
Year 1 Year 2 POI Total personnel employed
A. Personnel employed in the
production process of the PUI 100 108 108
B. Personnel employed in sales, general and administration of the PUI
100 107 89
C. Total personnel employed in the PUI (A + B)
100 108 98
(Presented in indices – Submitted in Confidential Submission)
Employment in Year 2 increased compared to Year 1 due to additional sales in Year 2. However, the overall personnel employed was reduced during POI by *****persons in an effort to improve and make adjustments to the opera-tions and at the same time to cut costs to meet the unfair pressure imposed by the dumped imports. The Petitioner suffered in terms of personnel em-ployed during POI.
2. Allocation is made due to it is not possible to attribute the number of persons
employed directly to the product. The basis of the allocation is submitted in confidential version.
3. The Petitioner did not reduce working hours due to the nature of CRC
manufacturing process, where the capacity utilization dropped during POI compared to Year 2, except that the number of employees was reduced during POI as explained earlier.
4. Table F-3.4 shows the wages of the total personnel employed in producing
the product.
Table F-3.4: Wages
Description
Year 1 (RM)
Year 2 (RM)
POI (RM)
A. Wages 100 111 103
B. Cost of social benefits 100 108 99
C. Total labour costs (A+B) 100 111 103
(Presented in indices – Submitted in Confidential Submission)

NON-CONFIDENTIAL
36
Comparing wages in Year 1 to Year 2, there was an increase of RM***** (an increase of 11.45%) due to higher sales (better take home pay) and overall the Petitioner was profitable. However, steps were taken and during POI where the wages reduced by RM*****, a decrease by 7.26%.
5. So far the Petitioner’s employees’ salary has not been affected, but due to the
falling sales, the employees’ total take home pay has been affected where they no longer enjoy/benefit from the monthly sales and production incentives as the Petitioner is experiencing losses due to dumped imports during POI.
F-4 Productivity 1. The data on the effects of alleged dumped imports on productivity is provided
in Table F-4.1.
Table F-4.1: Productivity
Description
Year 1 Year 2 POI
A. Production (MT) 100 107 88
B. Machines running hours of Like Products (hours)
100 100 85
C. Productivity (A/B) 100 106 104
(Presented in indices – Submitted in Confidential Submission)
The productivity based on MT per machine hour had improved progressively from *****MT/hr. to *****MT/hr. between Year 1 and Year 2 and dropped slightly to *****MT/hr. between Year 2 and during POI respectively. Despite facing unfair competition, the Petitioner has taken proactive steps to increase productivity. Despite these efforts, the petitioner could not benefit from it as the low priced dumped imports put price pressure on the Petitioner. Nonethe-less, the Petitioner suffered in terms of productivity due to the lower produc-tion and lower capacity utilization caused by again the presence of unfairly dumped imports in the Malaysian market. The Petitioner suffered in terms of productivity due to the presence of the dumped imports from the alleged countries.

NON-CONFIDENTIAL
37
SECTION G MATERIAL INJURY (SALES)
For the Petitioner, the Like Product is sold directly to independent users. G-1 Sales Turnover 1. The total sales turnover (after all discounts and free of taxes) is presented in
Table G-1.1.
Table G-1.1: Turnover
Description
Year 1 (RM)
Year 2 (RM)
POI (RM)
Total turnover (all products) 100 102 94
Turnover of product (CRC 1B and SD) 100 105 83
Turnover of product (purchased) 100 99 102
Other product (PO,GI and PPGI) 100 102 94
(Presented in indices – Submitted in Confidential Submission)
In Year 1, the turnover of the Petitioner’s CRC was RM***** which increased by RM***** (5.12%) to RM***** in Year 2. However, during POI the turnover dropped by 20.82% to RM***** compared to Year 2. The Petitioner suffered in terms of turnover on Like Products during POI.
G-2 Sales Volume and Value 1. For the purpose of Table G-2.1, separate tables of information on net volumes
(after all returns and cancelled sales) and values (after all discounts and free of taxes) are of:
a. Sales of product produced by the Petitioner to unrelated parties are
provided in Table G-2.1 (a) - Provided in confidential submission.
b. Sales of product produced by the Petitioner to related parties are provided in Table G-2.1 (b) - Provided in confidential submission.
c. Sales of product produced by the Petitioner to unrelated and related
parties are provided in Table G-2.1 (c).

NON-CONFIDENTIAL
38
Table G-2.1 (c): Sales of Product
Description
Year 1 Year 2 POI
Jan '12 – Dec '12 Jan'13 - Dec'13 Jan'14 - Dec'14
Volume (MT)
Value (RM)
Volume (MT)
Value (RM)
Volume (MT)
Value (RM)
Sales of product produced in Do-mestic Market
100 100 99 96 70 64
Unit price (RM/MT) 100 97 91
(Presented in indices – Submitted in Confidential Submission) Overall the sales volume of the Petitioner during POI was much lower than sales made in Year 1 and Year 2. The sales in fact dropped drastically by ***** MT (29.08%) during POI when compared to Year 2. The apparent consumption based on Total production, Imports and Exports is provided below.
2. The transaction-by-transaction sales of product to unrelated customers in
Malaysian market during the period of investigation are provided in the format as per Table G-2.2 in Attachment-G-1.
Table G-2.2: Sales Listing
Field name Field description Explanation
NO Sequence number Identify each transaction, or line item, in the sales listing, by sequence number (i.e. the first transaction is “1”, the second is “2”, and so on)
CODE Company internal coding system
Indicate the code used for the product in your records
INV-NO Invoice number Indicate the invoice number
INV-DT Invoice date Indicate the invoice date of the transaction
CUST Customer number Indicate the customer number used in your records
LEV Customer level of trade Use code “1” for end-users, “2” for retailers, “3” for distributors, “4” for others (specify the level)
QTY Quantity of sales Provide quantity (specify the unit of measurement) of product sold
GR-VAL Gross invoice value Provide the gross invoice value, net of taxes, of product sold
DISC Discounts Indicate the discounts deducted on the invoice
NT-VAL Net invoice value Provide the net invoice value after the discounts
PAY-TM Payment terms Indicate the payment terms agreed with the customer (e.g. 30, 60, 90 days, etc.)
DEL-TM Delivery terms Indicate the agreed terms of delivery (e.g. FOB, C&F, CIF, etc.)
DEL-CS Delivery costs Indicate the transport costs either as actual costs or as a function of the invoice value (%) or volume (costs per unit)
NON-CONFIDENTIAL
39
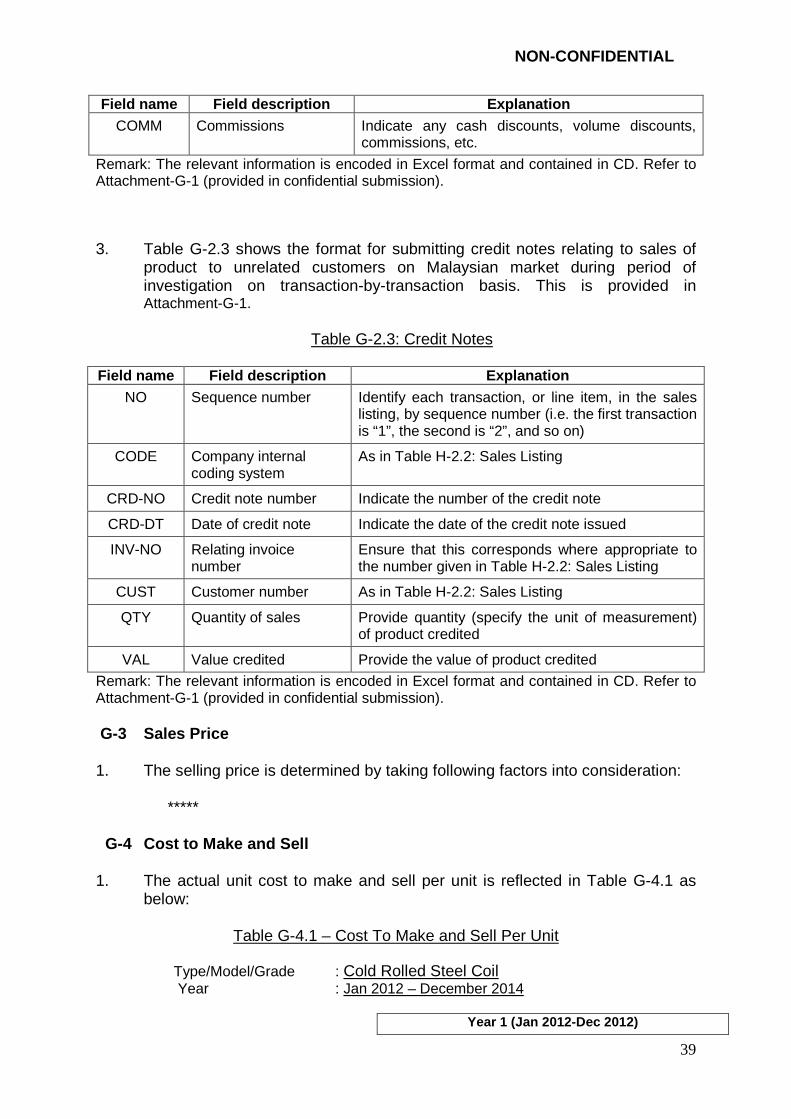
Field name Field description Explanation COMM Commissions Indicate any cash discounts, volume discounts,
commissions, etc.
Remark: The relevant information is encoded in Excel format and contained in CD. Refer to Attachment-G-1 (provided in confidential submission). 3. Table G-2.3 shows the format for submitting credit notes relating to sales of
product to unrelated customers on Malaysian market during period of investigation on transaction-by-transaction basis. This is provided in Attachment-G-1.
Table G-2.3: Credit Notes
Field name Field description Explanation
NO Sequence number Identify each transaction, or line item, in the sales listing, by sequence number (i.e. the first transaction is “1”, the second is “2”, and so on)
CODE Company internal coding system
As in Table H-2.2: Sales Listing
CRD-NO Credit note number Indicate the number of the credit note
CRD-DT Date of credit note Indicate the date of the credit note issued
INV-NO Relating invoice number
Ensure that this corresponds where appropriate to the number given in Table H-2.2: Sales Listing
CUST Customer number As in Table H-2.2: Sales Listing
QTY Quantity of sales Provide quantity (specify the unit of measurement) of product credited
VAL Value credited Provide the value of product credited
Remark: The relevant information is encoded in Excel format and contained in CD. Refer to Attachment-G-1 (provided in confidential submission). G-3 Sales Price
1. The selling price is determined by taking following factors into consideration:
*****
G-4 Cost to Make and Sell
1. The actual unit cost to make and sell per unit is reflected in Table G-4.1 as
below:
Table G-4.1 – Cost To Make and Sell Per Unit
Type/Model/Grade : Cold Rolled Steel Coil Year : Jan 2012 – December 2014
Year 1 (Jan 201 2-Dec 2012)

NON-CONFIDENTIAL
40
COST TO MAKE Jan 2012~ Mar 2012
Apr 2012~ Jun 2012
Jul 2012~ Sept 2012
Oct 2012~ Dec 2012
A. Production Quantity ***** ***** ***** *****
(specify unit of measurement) (Mt) (Mt) (Mt) (Mt)
B. Variable Manufacturing Costs
Raw Materials:
- local ***** ***** ***** *****
- imported ***** ***** ***** *****
Direct Labour
Other (specify) ***** ***** ***** *****
***** ***** ***** *****
C. Fixed Manufacturing Costs
Depreciation ***** ***** ***** *****
Other mfg. Overhead (specify) ***** ***** ***** *****
***** ***** ***** *****
D. Work In Progress
(+) Opening work in progress ***** ***** ***** *****
(-) Closing work in progress ***** ***** ***** *****
***** ***** ***** *****
E. TOTAL COST TO MAKE (B+C+D) ***** ***** ***** *****
F. UNIT COST TO MAKE (E/A) ***** ***** ***** *****
COST TO MAKE & SELL
G. Sales Quantity
(specify unit of measurement) (Mt) (Mt) (Mt) (Mt)
- Domestic sales of local production ***** ***** ***** *****
- Exports sales of local production ***** ***** ***** *****
***** ***** ***** *****
H. Selling & Distribution Expenses (specify) ***** ***** ***** *****
I. Administration Expenses (specify) ***** ***** ***** *****
(personal expense, other income & ex-pense, interest income)
J. Financial Expenses (specify) ***** ***** ***** *****
K. TOTAL COST TO SELL (H+I+J) ***** ***** ***** *****
L. UNIT COST TO SELL (H+I+J)/G ***** ***** ***** *****
M. UNIT COST TO MAKE & SELL (F+L) ***** ***** ***** ***** (Presented in indices – Submitted in Confidential Submission)

NON-CONFIDENTIAL
41
Year 2 (Jan 2013-Dec 2013)
COST TO MAKE Jan 2013~ Mar 2013
Apr 2012~ Jun 2013
Jul 2013~ Sept 2013
Oct 2013~ Dec 2013
A. Production Quantity ***** ***** ***** *****
(specify unit of measurement) (Mt) (Mt) (Mt) (Mt)
B. Variable Manufacturing Costs
Raw Materials:
- local ***** ***** ***** *****
- imported ***** ***** ***** *****
Direct Labour
Other (specify) ***** ***** ***** *****
***** ***** ***** *****
C. Fixed Manufacturing Costs
Depreciation ***** ***** ***** *****
Other mfg. Overhead (specify) ***** ***** ***** *****
***** ***** ***** *****
D. Work In Progress
(+) Opening work in progress ***** ***** ***** *****
(-) Closing work in progress ***** ***** ***** *****
***** ***** ***** *****
E. TOTAL COST TO MAKE (B+C+D) ***** ***** ***** *****
F. UNIT COST TO MAKE (E/A) ***** ***** ***** *****
COST TO MAKE & SELL
G. Sales Quantity
(specify unit of measurement) (Mt) (Mt) (Mt) (Mt)
- Domestic sales of local production ***** ***** ***** *****
- Exports sales of local production ***** ***** ***** *****
***** ***** ***** *****
H. Selling & Distribution Expenses (specify) ***** ***** ***** *****
I. Administration Expenses (specify) ***** ***** ***** *****
(personal expense, other income & ex-pense, interest income)
J. Financial Expenses (specify) ***** ***** ***** *****
K. TOTAL COST TO SELL (H+I+J) ***** ***** ***** *****
L. UNIT COST TO SELL (H+I+J)/G ***** ***** ***** *****
M. UNIT COST TO MAKE & SELL (F+L) ***** ***** ***** ***** (Presented in indices – Submitted in Confidential Submission)

NON-CONFIDENTIAL
42
POI (Jan 2014-Dec 2014)
COST TO MAKE Jan 2014~ Mar 2014
Apr 2014 ~ Jun 2014
Jul 2014~ Sept 2014
Oct 2014~ Dec 2014
A. Production Quantity ***** ***** ***** *****
(specify unit of measurement) (Mt) (Mt) (Mt) (Mt)
B. Variable Manufacturing Costs
Raw Materials:
- local ***** ***** ***** *****
- imported ***** ***** ***** *****
Direct Labour
Other (specify) ***** ***** ***** *****
***** ***** ***** *****
C. Fixed Manufacturing Costs
Depreciation ***** ***** ***** *****
Other mfg. Overhead (specify) ***** ***** ***** *****
***** ***** ***** *****
D. Work In Progress
(+) Opening work in progress ***** ***** ***** *****
(-) Closing work in progress ***** ***** ***** *****
***** ***** ***** *****
E. TOTAL COST TO MAKE (B+C+D) ***** ***** ***** *****
F. UNIT COST TO MAKE (E/A) ***** ***** ***** *****
COST TO MAKE & SELL G. Sales Quantity
(specify unit of measurement) (Mt) (Mt) (Mt) (Mt)
- Domestic sales of local production ***** ***** ***** *****
- Exports sales of local production ***** ***** ***** *****
***** ***** ***** *****
H. Selling & Distribution Expenses (specify) ***** ***** ***** *****
I. Administration Expenses (specify) ***** ***** ***** *****
(personal expense, other income & ex-pense, interest income)
J. Financial Expenses (specify) ***** ***** ***** *****
K. TOTAL COST TO SELL (H+I+J) ***** ***** ***** *****
L. UNIT COST TO SELL (H+I+J)/G ***** ***** ***** ***** M. UNIT COST TO MAKE & SELL (F+L) ***** ***** ***** *****
(Presented in indices – Submitted in Confidential Submission)
NON-CONFIDENTIAL
43
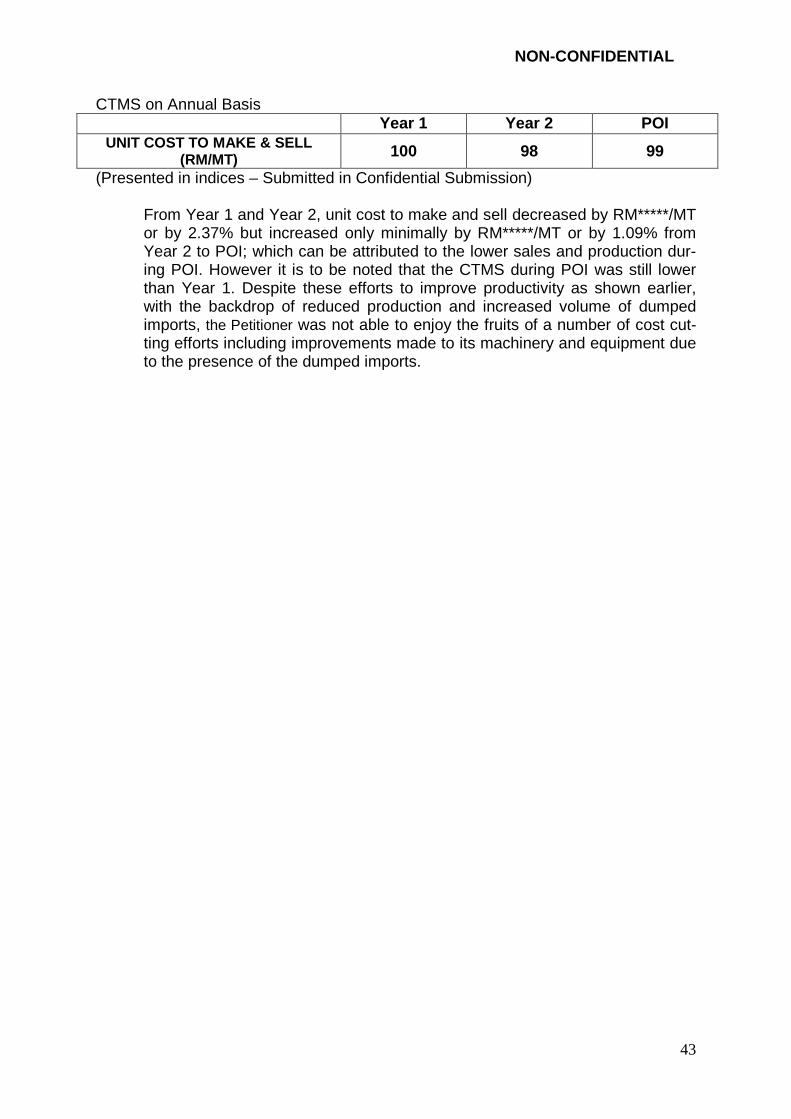
CTMS on Annual Basis Year 1 Year 2 POI
UNIT COST TO MAKE & SELL (RM/MT) 100 98 99
(Presented in indices – Submitted in Confidential Submission)
From Year 1 and Year 2, unit cost to make and sell decreased by RM*****/MT or by 2.37% but increased only minimally by RM*****/MT or by 1.09% from Year 2 to POI; which can be attributed to the lower sales and production dur-ing POI. However it is to be noted that the CTMS during POI was still lower than Year 1. Despite these efforts to improve productivity as shown earlier, with the backdrop of reduced production and increased volume of dumped imports, the Petitioner was not able to enjoy the fruits of a number of cost cut-ting efforts including improvements made to its machinery and equipment due to the presence of the dumped imports.

NON-CONFIDENTIAL
44
SECTION H MATERIAL INJURY (PROFITABILITY, RETURN AND CASH FLO W)
H-1 Profitability 1. Table H-1.1 provides the sales transactions to unrelated parties in Malaysia
Table H-1.1a: Profitability (Total Related & Unrelated)
Description
Year 1 Year 2 POI
Domestic (RM)
Export (RM)
Domestic (RM)
Export (RM)
Domestic (RM)
Export (RM)
Sales ***** ***** ***** ***** ***** ******
Scrap Recovery ***** ***** ***** ***** ***** ******
Less:
Cost of Sales ***** ***** ***** ***** ***** ******
Gross Profit ***** ***** ***** ***** ***** ******
Less:
Selling, General and Administrative Expenses ***** ***** ***** ***** ***** ******
Profit/ (Loss) ***** ***** ***** ***** ***** ****** Other Income/ (Ex-pense) ***** ***** ***** ***** ***** ******
Net Profit/ (Loss) ***** ***** ***** ***** ***** ******
Total Net Profit/(Loss) 100 82 (261)
(Presented in indices – Submitted in Confidential Submission) In terms of domestic sales, the Petitioner registered losses of RM***** in Year 1, showed a profit of RM***** in Year 2 and a loss of RM***** during POI. The Petitioner suffered mate-rial injury in terms of profitability. The loss during POI is the inability to sell at fair value due to the presence of dumped imports. Overall the Petitioner incurred losses in all three years. The Petitioner in Year 1 incurred loss of RM*****, Year 2 loss of RM***** and lastly a loss of RM***** during POI. The Petitioner suffered in terms of profitability.
NON-CONFIDENTIAL
45
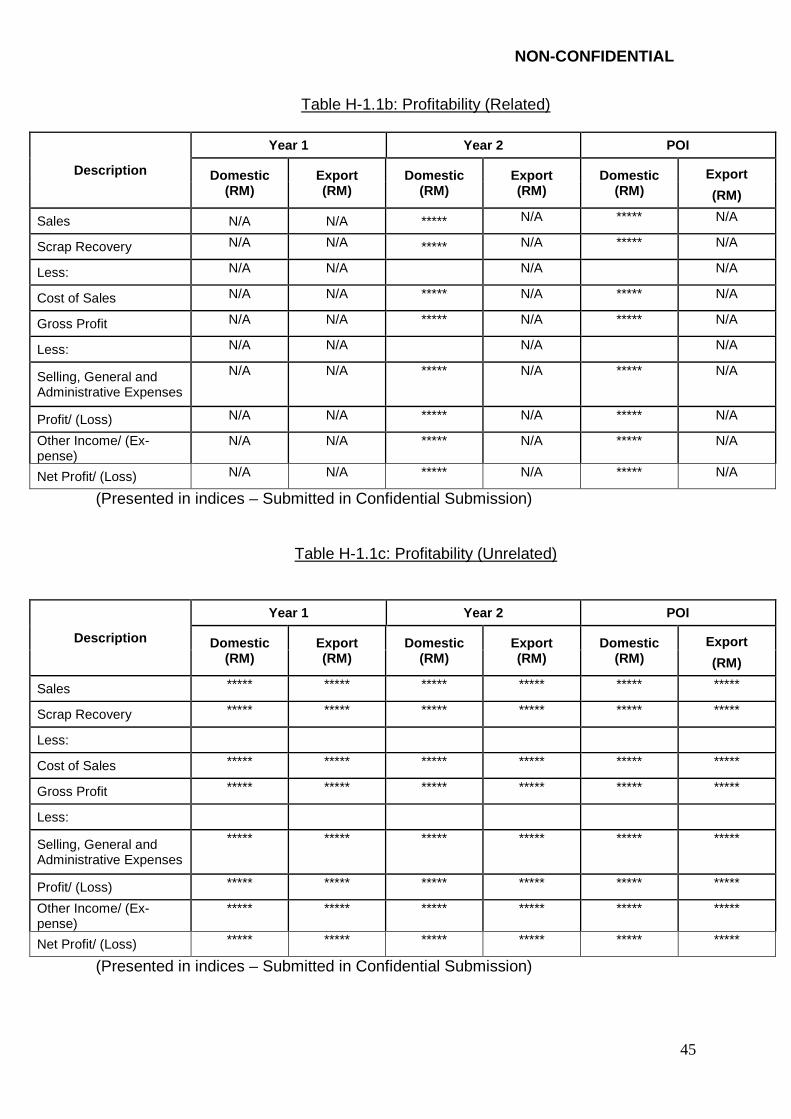
Table H-1.1b: Profitability (Related)
Description
Year 1 Year 2 POI
Domestic (RM)
Export (RM)
Domestic (RM)
Export (RM)
Domestic (RM)
Export
(RM)
Sales N/A N/A ***** N/A ***** N/A
Scrap Recovery N/A N/A ***** N/A ***** N/A
Less: N/A N/A N/A N/A
Cost of Sales N/A N/A ***** N/A ***** N/A
Gross Profit N/A N/A ***** N/A ***** N/A
Less: N/A N/A N/A N/A
Selling, General and Administrative Expenses
N/A N/A ***** N/A ***** N/A
Profit/ (Loss) N/A N/A ***** N/A ***** N/A
Other Income/ (Ex-pense)
N/A N/A ***** N/A ***** N/A
Net Profit/ (Loss) N/A N/A ***** N/A ***** N/A
(Presented in indices – Submitted in Confidential Submission)
Table H-1.1c: Profitability (Unrelated)
Description
Year 1 Year 2 POI
Domestic (RM)
Export (RM)
Domestic (RM)
Export (RM)
Domestic (RM)
Export
(RM)
Sales ***** ***** ***** ***** ***** *****
Scrap Recovery ***** ***** ***** ***** ***** *****
Less:
Cost of Sales ***** ***** ***** ***** ***** *****
Gross Profit ***** ***** ***** ***** ***** *****
Less:
Selling, General and Administrative Expenses
***** ***** ***** ***** ***** *****
Profit/ (Loss) ***** ***** ***** ***** ***** *****
Other Income/ (Ex-pense)
***** ***** ***** ***** ***** *****
Net Profit/ (Loss) ***** ***** ***** ***** ***** *****
(Presented in indices – Submitted in Confidential Submission)

NON-CONFIDENTIAL
46
Table H-1.1: Profitability (unit based) Domestic CR Year 1 Year 2 POI Volume (MT) ***** ***** *****
Selling price (RM per MT) ***** ***** *****
Cost of goods sold (RM per MT) ***** ***** *****
Gross profit /(loss) per MT ***** ***** *****
% gross profit /(loss) ***** ***** *****
(Presented in indices – Submitted in Confidential Submission)
Based on the table above, in Year 2 domestic CR sales volume slightly decreased from *****MT to ***** MT by 0.94% when comparing with Year 1 sales volume. At the same time, the cost of goods sold reduced significantly by 6.24% as compared to the reduction in selling price of 3.37%. The net effect was the Petitioner was able to make gross profit margin of 0.1%. However, during POI, the volume of sales dropped by 29.08% while the selling price dropped at a sharp rate of 5.57%, which was also much higher than a marginal decrease of cost of goods sold of 0.28% leading to a gross loss of 5.50%. This clearly indicates that the prices in the Malaysian market were on a continuous sharp downward movement to cause price depression.
H-2 Return on Total Assets 1. Table H-2.1 below captures the return on total assets employed in the
production of product.
Table H-2.1: Return on Total Assets (based on Unrelated Profitability)
Description Year 1 Year 2 POI
A. Net income* (RM) 100 80 (209) B. Total assets* (RM) ***** ***** ***** C. Return on total assets
(A/B) x 100 (4.01) (2.97) (9.09)
(Presented in indices (except value in C) – Submitted in Confidential Submission)
In Year 1, return on total assets achieved negative 4.01% and remained negative return at 2.97% in Year 2. However, return on total assets dropped sharply to 9.09% in POI. The Petitioner suffered in terms of return on total assets.
NON-CONFIDENTIAL
47
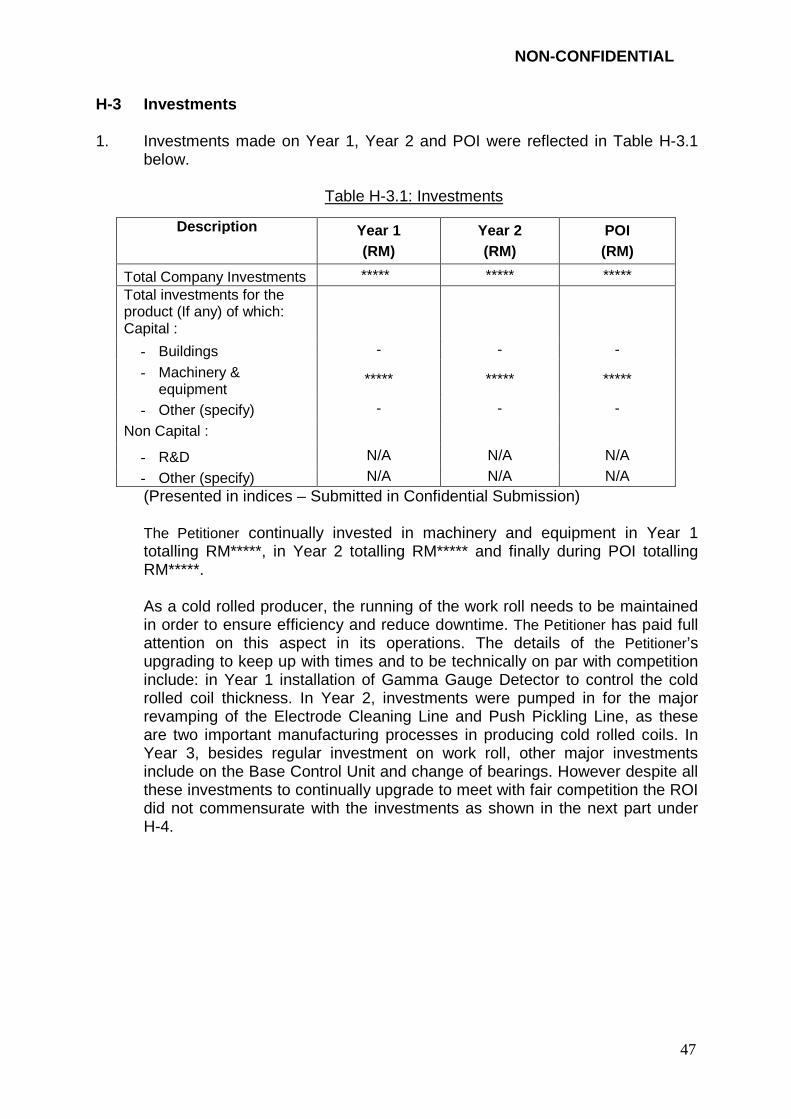
H-3 Investments 1. Investments made on Year 1, Year 2 and POI were reflected in Table H-3.1
below.
Table H-3.1: Investments
Description
Year 1 (RM)
Year 2 (RM)
POI (RM)
Total Company Investments ***** ***** ***** Total investments for the product (If any) of which: Capital :
- Buildings - - -
- Machinery & equipment
***** ***** *****
- Other (specify) - - -
Non Capital :
- R&D N/A N/A N/A
- Other (specify) N/A N/A N/A (Presented in indices – Submitted in Confidential Submission) The Petitioner continually invested in machinery and equipment in Year 1 totalling RM*****, in Year 2 totalling RM***** and finally during POI totalling RM*****. As a cold rolled producer, the running of the work roll needs to be maintained in order to ensure efficiency and reduce downtime. The Petitioner has paid full attention on this aspect in its operations. The details of the Petitioner’s upgrading to keep up with times and to be technically on par with competition include: in Year 1 installation of Gamma Gauge Detector to control the cold rolled coil thickness. In Year 2, investments were pumped in for the major revamping of the Electrode Cleaning Line and Push Pickling Line, as these are two important manufacturing processes in producing cold rolled coils. In Year 3, besides regular investment on work roll, other major investments include on the Base Control Unit and change of bearings. However despite all these investments to continually upgrade to meet with fair competition the ROI did not commensurate with the investments as shown in the next part under H-4.
NON-CONFIDENTIAL
48
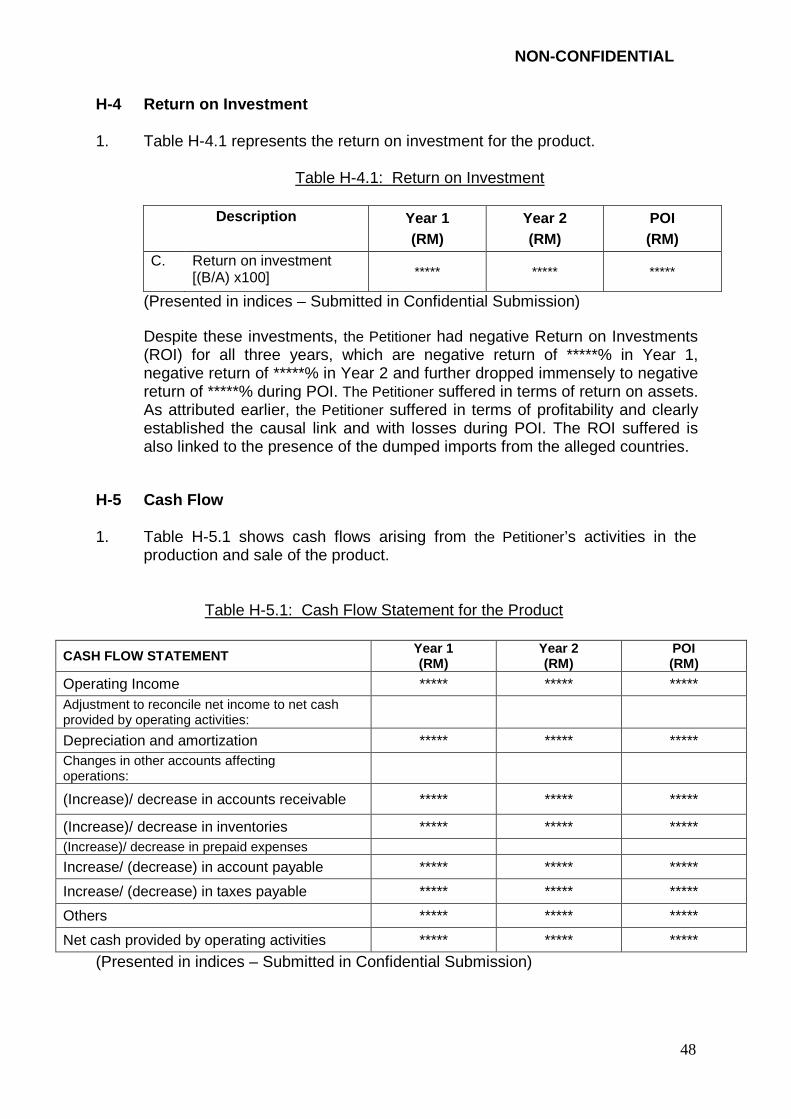
H-4 Return on Investment 1. Table H-4.1 represents the return on investment for the product.
Table H-4.1: Return on Investment
Description
Year 1 (RM)
Year 2 (RM)
POI (RM)
C. Return on investment [(B/A) x100] ***** ***** *****
(Presented in indices – Submitted in Confidential Submission)
Despite these investments, the Petitioner had negative Return on Investments (ROI) for all three years, which are negative return of *****% in Year 1, negative return of *****% in Year 2 and further dropped immensely to negative return of *****% during POI. The Petitioner suffered in terms of return on assets. As attributed earlier, the Petitioner suffered in terms of profitability and clearly established the causal link and with losses during POI. The ROI suffered is also linked to the presence of the dumped imports from the alleged countries.
H-5 Cash Flow 1. Table H-5.1 shows cash flows arising from the Petitioner’s activities in the
production and sale of the product.
Table H-5.1: Cash Flow Statement for the Product
CASH FLOW STATEMENT Year 1 (RM)
Year 2 (RM)
POI (RM)
Operating Income ***** ***** ***** Adjustment to reconcile net income to net cash provided by operating activities:
Depreciation and amortization ***** ***** ***** Changes in other accounts affecting operations:
(Increase)/ decrease in accounts receivable ***** ***** *****
(Increase)/ decrease in inventories ***** ***** ***** (Increase)/ decrease in prepaid expenses
Increase/ (decrease) in account payable ***** ***** *****
Increase/ (decrease) in taxes payable ***** ***** *****
Others ***** ***** *****
Net cash provided by operating activities ***** ***** *****
(Presented in indices – Submitted in Confidential Submission)

NON-CONFIDENTIAL
49
In terms of cash flow, the Petitioner experienced positive net cash inflow in Year 1 of RM***** and RM***** in Year 2 but dropped sharply and very signifi-cantly to RM***** during POI. Compared to Year 2, during POI, the Petitioner suffered in terms of cash flow compared to Year 2.
H-6 Minimum Profit Required Submitted in Confidential Submission. H-7 Ability to Raise Capital
Submitted in Confidential Submission.

NON-CONFIDENTIAL
50
SECTION I CAUSAL LINK
I-1 Other factors 1. Here a number of other factors are examined to see if these factors could
have been a cause of the material injury suffered by the Petitioner. If these other factors are indeed not a cause to the material injury suffered by the Petitioner, one can but only conclude that the material injury suffered by the Petitioner is due to dumped imports from the alleged countries, thus supporting causal link between the material injury suffered by the Petitioner to the dumped imports.
a. Technology The Petitioner has been continually upgrading and maintaining its equipment to match with technology – which is no different of the technology used by competitors, though the process may differ. It has been noted that the Petitioner has been not able to get ROI despite the continued improvement made to its machines as reflected in its machine productivity, due to lower production with the presence of the dumped imports. Based on this technology differences is not a cause to the material injury suffered by the Petitioner.
b. Quality Quality is not a problem with the Petitioner’s products as they comply
with a number of internationally accepted standards as provided under Section D-1-2(e) and could not be cause to material injury suffered by the Petitioner.
c. Exports The main cause of injury to the Petitioner is the inability to sell a decent
volume of its products in the domestic market at fair prices due to the presence of price effects of the dumped imports resulting in the Petitioner’s sales continually decreasing in the domestic market, a drop in sales by 32.94% in Year 2 compared to Year 1 and continued to drop by a further 30.46% in POI. The export sales however were not affected which increased from *****MT in Year 1 to *****MT in Year 2 and increased to *****MT during POI.
I-2 Volume Effects 1. The dumped/subsidised imports affected the Petitioner’s sales volume and
market share, as shown below:
NON-CONFIDENTIAL
51
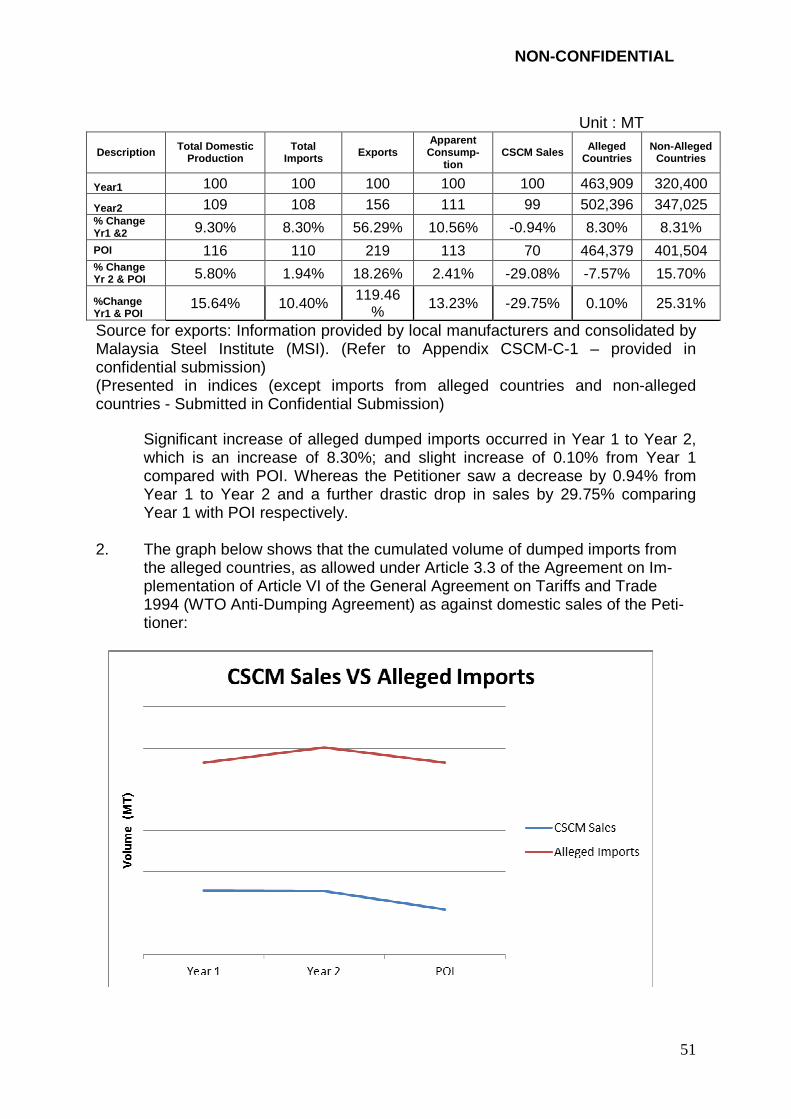
Unit : MT
Description Total Domestic Production
Total Imports Exports
Apparent Consump-
tion CSCM Sales Alleged
Countries Non-Alleged
Countries
Year1 100 100 100 100 100 463,909 320,400
Year2 109 108 156 111 99 502,396 347,025 % Change Yr1 &2 9.30% 8.30% 56.29% 10.56% -0.94% 8.30% 8.31%
POI 116 110 219 113 70 464,379 401,504 % Change Yr 2 & POI 5.80% 1.94% 18.26% 2.41% -29.08% -7.57% 15.70%
%Change Yr1 & POI
15.64% 10.40% 119.46% 13.23% -29.75% 0.10% 25.31%
Source for exports: Information provided by local manufacturers and consolidated by Malaysia Steel Institute (MSI). (Refer to Appendix CSCM-C-1 – provided in confidential submission) (Presented in indices (except imports from alleged countries and non-alleged countries - Submitted in Confidential Submission)
Significant increase of alleged dumped imports occurred in Year 1 to Year 2, which is an increase of 8.30%; and slight increase of 0.10% from Year 1 compared with POI. Whereas the Petitioner saw a decrease by 0.94% from Year 1 to Year 2 and a further drastic drop in sales by 29.75% comparing Year 1 with POI respectively.
2. The graph below shows that the cumulated volume of dumped imports from
the alleged countries, as allowed under Article 3.3 of the Agreement on Im-plementation of Article VI of the General Agreement on Tariffs and Trade 1994 (WTO Anti-Dumping Agreement) as against domestic sales of the Peti-tioner:

NON-CONFIDENTIAL
52
It is to be noted that the domestic sales continually declined whereas the dumped imports volume increased in Year 2 (8.30%) and decreased only 7.57% during POI, which is much lower than the sharp decrease of the sales of the Petitioner by 29.75% comparing Year 1 with POI.
I-3 Profitability 1. As detailed under Section H-1 on Profitability, it has been clearly established
that the Petitioner on domestic sales has suffered during POI recording a loss of RM***** compared to a profit making situation in Year 2 of RM***** in two ways as mentioned earlier. This is due to the dumped imports taking the Petitioner’s market share and in terms of price effects dealt later in this Section. This loss in profitability is attributed to the presence of dumped imports which had negative price effects on the Petitioner as detailed in the following paragraphs.
I-4 Price Effects
Price Suppression
1. The existence of price suppression is demonstrated through comparison of Cost to Make and Sell (CTMS) and sales price of the Petitioner with the prices offered by the dumped imports.
2. The following graph clear shows how the unit cost to make and sell and sales price of the Petitioner trended over the three years:

NON-CONFIDENTIAL
53
Year 1 Year 2 POI UNIT COST TO MAKE & SELL
(RM/MT) 100 98 99
(Presented in indices - Submitted in Confidential Submission)
Domestic CR Year 1 Year 2 POI
Volume (MT) ***** ***** *****
Selling price (RM per MT) 100 97 91
(Presented in indices - Submitted in Confidential Submission)
As can be seen during POI, the Petitioner had to sell below cost which has led to the huge loss experienced due to the presence of the dumped – the inability to sell above CTMS. To support the point that it is the dumped imports prices from the alleged countries that has caused the above situation for the Petitioner to sell below cost is shown below.
Price Undercutting and Price Depression
3. Significant price undercutting by the dumped imports from the alleged countries is clearly evident from the chart below.
COUNTRY
Year 1 Year 2 Year 3
QTY (MT)
VALUE (RM CIF) A.Price QTY
(MT) VALUE
(RM CIF) A.Price QTY (MT)
VALUE (RM CIF) A.Price
CHINA 80,552 ***** ***** 139,546 ***** ***** 104,923 ***** *****
KOREA 278,183 ***** ***** 228,887 ***** ***** 222,873 ***** *****
VIETNAM 105,173 ***** ***** 133,963 ***** ***** 136,584 ***** *****
TOTAL 463,909 ***** ***** 502,396 ***** ***** 464,380 ***** *****
Remark: A. PRICE=RM/MT Source: Department of Statistics of Malaysia (DoS)
NON-CONFIDENTIAL
54
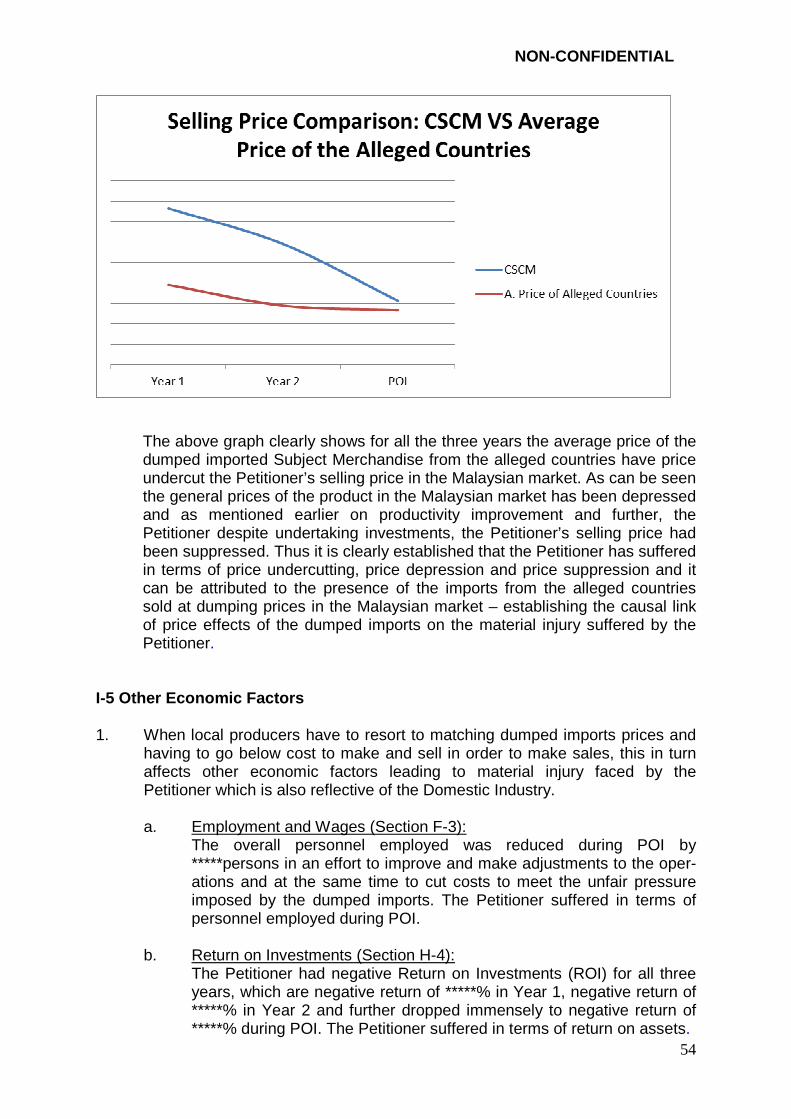
The above graph clearly shows for all the three years the average price of the
dumped imported Subject Merchandise from the alleged countries have price undercut the Petitioner’s selling price in the Malaysian market. As can be seen the general prices of the product in the Malaysian market has been depressed and as mentioned earlier on productivity improvement and further, the Petitioner despite undertaking investments, the Petitioner’s selling price had been suppressed. Thus it is clearly established that the Petitioner has suffered in terms of price undercutting, price depression and price suppression and it can be attributed to the presence of the imports from the alleged countries sold at dumping prices in the Malaysian market – establishing the causal link of price effects of the dumped imports on the material injury suffered by the Petitioner.
I-5 Other Economic Factors 1. When local producers have to resort to matching dumped imports prices and
having to go below cost to make and sell in order to make sales, this in turn affects other economic factors leading to material injury faced by the Petitioner which is also reflective of the Domestic Industry.
a. Employment and Wages (Section F-3):
The overall personnel employed was reduced during POI by *****persons in an effort to improve and make adjustments to the oper-ations and at the same time to cut costs to meet the unfair pressure imposed by the dumped imports. The Petitioner suffered in terms of personnel employed during POI.
b. Return on Investments (Section H-4):
The Petitioner had negative Return on Investments (ROI) for all three years, which are negative return of *****% in Year 1, negative return of *****% in Year 2 and further dropped immensely to negative return of *****% during POI. The Petitioner suffered in terms of return on assets.
NON-CONFIDENTIAL
55
c. Cash Flow (Section H-5):
In terms of cash flow, the Petitioner experienced positive net cash in-flow in Year 1 of RM***** and RM***** in Year 2 but dropped sharply and very significantly to RM***** during POI. Compared to Year 2, dur-ing POI, the Petitioner suffered in terms of cash flow.
2. This has been dealt in sufficient detail earlier in under respective Sections to
establish the material injury suffered as shown; except on the ability to raise capital as the policy of the Petitioner has been to source funding internally.
3. The above material injury cannot be attributed to other factors but solely due to the dumped imports due to the price effects of the dumped imports.
4. The injury factors caused by dumping/ subsidising suffered by the Malaysian industry are considered to be ‘material’:
a. In terms of domestic sales, the Petitioner registered losses of RM*****
in Year 1, showed a profit of RM***** in Year 2 and a loss of RM***** during POI. The Petitioner suffered material injury in terms of profitabil-ity. Overall the Petitioner incurred losses in all three years. The Peti-tioner suffered in terms of profitability. During POI, the volume of sales dropped by 29.08% while the selling price dropped at a sharp rate of 5.57%, which was also much higher than a marginal decrease of cost of goods sold of 0.28% leading to a gross loss of 5.50%.
b. The Petitioner continually invested in machinery and equipment in Year
1 totalling RM*****, in Year 2 totalling RM****** and finally during POI totalling RM*****. Despite these investments, the Petitioner had nega-tive Return on Investments (ROI) for all three years.
c. In terms of cash flow, the Petitioner experienced positive net cash in-
flow in Year 1 of RM***** and RM***** in Year 2 but dropped sharply and very significantly to RM***** during POI. Compared to Year 2, dur-ing POI, the Petitioner suffered in terms of cash flow.
Note: This has also been dealt with under Section H: Material Injury where it has been clearly established during POI that due to the presence of the dumped imports the Petitioner has suffered material injury in terms of profitability, Return on Assets, Return on Investments and cash flow.
5. The price in the Malaysian market are on the downward trend and not
allowing the Petitioner to sell above cost and at the same time the volume of imports from the alleged countries are not letting down and still on the increase. Since this is based on the three-year data basis, the economic condition of the domestic industry is expected to deteriorate further as this trend is expected to continue unless the unfair trade practice of dumping that is causing injury is checked by putting in an appropriate anti-dumping duty to raise the prices in the Malaysian market to a fair value so that the local domestic industry can compete on a level playing field.
NON-CONFIDENTIAL
56
SECTION J PUBLIC INTEREST
J-1 Malaysian Market 1. There are four manufacturers producing and selling cold rolled coils in Malay-
sia, namely CSCM, Mycron Steel Berhad, YKGI Holdings Berhad and Mega-steel Sdn.bhd. The total capacity is 2,570,000MT per year, and the consump-tion is 1,677,721mt in year 2013 based on SEAISI 2014 Steel Statistic Year-book (Refer Appendix CSCM-J-1). As can be seen there is enough capacity in Malaysia to meet the consumption.
2. In Malaysia, the main users of cold rolled coils (CRC) are service centers,
drum makers, pipe makers, coaters, E&E and the automobile industry. This CRC production is an important link for the presence of the fully integrated iron and steel industry in Malaysia. The importance of having the production of CRC in the Malaysian cannot be overstated and its importance for Malaysia to move up the value chain, understated. In the absence of this important link, the industrialization of Malaysia and in moving towards a developed nation may be incomplete and uncertain, especially if Malaysia has to totally be at the mercy of and dependent on imported CRC – in absence of CRC produc-tion base in Malaysia.
3. The current situation in Malaysia however is very unhealthy due to unfair trade practice of dumping and not providing fair and level playing field. The lo-cal cold rolled manufacturers welcome competition from imports in the Malay-sian domestic market - this is good for all parties related to the production and use of CRC. However, the biggest factor that is very unsettling is the cheap imported CRC that are being sold unfairly at dumped prices in the Malaysian market. This is upsetting the market and is hurting the Domestic Industry very badly and that is the reason for CSCM to take the lead, with the full support of all producers of CRC in Malaysia in preparing and having to submit this Peti-tion by and on behalf of the Domestic Industry to seek relief from the unfairly traded CRC in the Malaysian market.
J-2 Effect of Continued Imports
Based on industry’s market intelligence this trend is projected to continue for at least the next two (2) years. The Petitioner and the Domestic Industry as a whole are already suffering losses now, the industry cannot continue to take such a beating and sustain its operation in this kind of unfair situation, thus this request is made to obtain relief from the unfair trade practice of dumping, which is allowed under the Malaysian Countervailing and Anti-Dumping Duties Act 1993 and the Countervailing and Anti-Dumping Duties Regulations 1994, and is consistent with the WTO Anti-Dumping Agreement. Without the corrective measures put in place, the CRC domestic industry’s presence will be undermined and this would not be in public interest to break the link for the development/sustenance of a fully integrated iron & steel industry in Malaysia. It would also not be of public interest, as in the absence

NON-CONFIDENTIAL
57
of a CRC industry in Malaysia, to lose foreign exchange needing to buy all our CRC requirements; and losing out in the ability to impose a moderating effect on domestic prices of CRC. Finally it has to be emphasized that the anti-dumping duty imposed is only to increase the selling price of foreign producers from the alleged countries to a level that is the same price as the foreign producer sells in its own country. In fact the IA will apply the lesser duty rule to ensure that the dumping margin imposed is to only remove the injury caused by the dumped imports on the Malaysian DI. Therefore the AD duty is not applied as punitive measure, unless the foreign producer refuses to participate. For these aforementioned reasons, the Petitioner is of the view that the AD duty that is imposed after a full investigation is completed, would not be against public interest.

NON-CONFIDENTIAL
58
CHECKLIST
The purpose of the following checklist is to ensure that you have answered all questions in section A to section I and to permit a quick survey on information, which may be missing. Tick the box where complete information is submitted or where information has not sufficiently been provided:
Section
Tick if complete information is
submitted
Tick if information is not or insufficiently
submitted
Section A: Company Structure and Operations √
Section B: Accounting System √
Section C: Domestic Industry √
Section D: Product Description √
Section E: Dumping √
Section F: Operation Statistics √
Section G: Sales √
Section H: Profitability, Return And Cash Flow √
Section I: Causal Link √
Section J: Public Interest √

NON-CONFIDENTIAL