Confidential - -ORCA
290
Kinetics and Mechanism of H/D Exchange Reactions and Racemisation in Aqueous Solutions: Configurational Stability of Ester and Amide Arylglycine Derivatives Andrew Ballard A thesis submitted for the Degree of Doctor of Philosophy School of Chemistry Cardiff University July 2011 C ardiff UNIVERSITY PRIFYSGOL C a ER D Y ( 9 AstraZeneca Confidential
-
Upload
khangminh22 -
Category
Documents
-
view
0 -
download
0
Transcript of Confidential - -ORCA

Kinetics and Mechanism of H/D Exchange Reactions
and Racemisation in Aqueous Solutions:
Configurational Stability of Ester and Amide
Arylglycine Derivatives
Andrew Ballard
A thesis submitted for the Degree o f Doctor o f Philosophy
School of Chemistry
Cardiff University
July 2011
CardiffU N I V E R S I T Y
P R I F Y S G O LC a ER D Y ( 9
AstraZeneca
Confidential

UMI Number: U 585519
All rights reserved
INFORMATION TO ALL U SE R S The quality of this reproduction is d ep en d en t upon the quality of the copy subm itted.
In the unlikely even t that the author did not sen d a com plete m anuscript and there are m issing p a g es , th e se will be noted. A lso, if material had to be rem oved,
a note will indicate the deletion.
Dissertation Publishing
UMI U 585519Published by ProQ uest LLC 2013. Copyright in the D issertation held by the Author.
Microform Edition © ProQ uest LLC.All rights reserved . This work is protected against
unauthorized copying under Title 17, United S ta tes C ode.
P roQ uest LLC 789 E ast E isenhow er Parkway
P.O. Box 1346 Ann Arbor, Ml 4 8 1 0 6 -1 3 4 6

DECLARATION
This work h a s not previously b een a ccep ted in su b sta n ce for any d eg ree and is not
concurrently subm itted in candidature for an y d eg ree .
S ign ed f . . ............................... (cand idate) D ate J Z . Z U U ..........
STATEMENT 1
This th es is is being subm itted in partial fulfillment of the requirem ents for the d eg ree of PhD
Sign ed (candidate) D ate /..// /..2 ,...
STATEMENT 2
This th es is is th e result of my own ind ep en d en t work/investigation, ex cep t w here otherw ise
stated .
Other so u rce s are ack n ow led ged by explicit re feren ces.
S ign ed (candidate) D ate . . I C / r . S . 2 ^ .......
STATEMENT 3
I h ereby g ive co n sen t for my th esis , if accep ted , to b e available for photocopying and for
inter-library loan, and for the title and sum m ary to b e m ad e available to outside
organ isations.
S ign ed (candidate) D ate

SummaryThe configurational stability o f a range o f stereogenic centres in aqueous media has been
studied, with the goal of understanding the structural and environmental factors contributing
to configurational instability. This information will be o f use to the pharmaceutical industry,
for which the chiral integrity o f drug compounds is imperative. Chapter 1 outlines the
background to this project, providing an overview o f pharmacological racemisation including
potential mechanisms, examples from literature, and the methodology used.
Chapter 2 focuses on database mining studies undertaken on AstraZeneca compound libraries,
the results o f which guided the structures investigated in the rest of the thesis. Most
compounds in the libraries do not appear at risk o f racemisation. O f those that do, stereogenic
centres with proton, carbonyl, aromatic and nitrogen substituents appear most frequently.
Chapter 3 discusses experimental work determining rate constants o f proton-deuterium
exchange (as a model for racemisation) under physiological conditions, for a set of A-acetyl
arylglycine methyl esters. These rate constants suggest that such compounds are susceptible
to in vivo racemisation through an SeI mechanism.
Chapter 4 outlines experimental work determining rate constants o f proton-deuterium
exchange, for a set o f A-substituted phenylglycine amides. These compounds undergo H/D
exchange through an SeI mechanism, although the rate at which H/D exchange occurs
suggests they would not be at risk o f in vivo racemisation. These results show that an amide
substituent is far weaker than a methyl ester in facilitating racemisation.
Chapter 5 reports the results o f computational studies performed on the compounds
investigated in Chapters 3 and 4. The energy gap between a molecule and its anion when
deprotonated at the stereogenic centre was correlated with the experimentally determined
data, suggesting that prediction o f configurational instability for novel compounds may be
possible. This correlation only holds when the PCM solvent model is used in calculations.
AcknowledgementsFirst and foremost, I would like to thank my supervisor, Dr Niek Buurma, for giving me the
opportunity to undertake this project. Without his guidance, advice and enthusiasm,
completion o f this thesis would not have been possible. My industrial supervisor at
AstraZeneca, Dr Andrew Leach, has also been a massive help. His assistance, particularly
with the database mining studies, and his willingness to travel down from Cheshire on a
regular basis for meetings is greatly appreciated. Thanks must also go to AstraZeneca and the
EPSRC for providing funds for this project.
At Cardiff, I particularly want to thank Dr Rob Richardson for many useful discussions and
helping me with the computational work. Thanks to Prof Barry Carpenter and Dr Eric
Tippmann for being my internal examiners over the years and providing assistance throughout
the project. Dr Larry Goldman also deserves a special mention for his help with
computational work, as does Stefania Narduolo for working alongside me on a similar project
and being very cooperative with sharing data and knowledge, and Dr Ian Morgan who was a
big help especially in the early days of the project. Fellow Buurma group members Mihaela,
Mazin, Ismail, Azzedine, and Lavinia and POC members Julia, Ed, Jamie, Alicja and Zuska
are also thanked. Dr Rob Jenkins deserves my gratitude for his patience with me using the
NMR spectrometers far more than my fair share. Thanks also to Robin and Dave for keeping
the instruments running and returning mass spectra quickly, and to Gaz, Jamie and Mai in
stores.
At AstraZeneca, I am grateful to Dr Nabil Asaad for devising the project alongside Niek and
helping it get off the ground. Dr Simone Tomasi is also thanked for his involvement and ideas
throughout the project. For two periods whilst working in this project I was based at A Z’s
Alderley Park facility, and several people need to be thanked for making my time there both
enjoyable and fruitful. A big, big thank you goes to Chris and Saj Jones, and then Rich and
Clare Ward, for their generosity in hosting me during these periods and making me feel
welcome. The LCMS work in Chapter 4 was conducted during this period and I am very
grateful to Dr Matt Wood and all members o f the Physical Chemistry team at Alderley Park
for allowing me into their lab and giving up time to help me complete this work within a tight
time schedule.
Outside o f the project itself there are many people who have helped me get to this point. I
would like to thank all my friends for helping keep me sane whilst I’ve been working on this

project. Being able to play football to a good standard and with great friends has been
especially important, and so thanks to all the lads from AC Central, AFC Egham, Dynamo
Centurion and Team Colon. Many thanks go to my family, particularly mum and dad, for all
their love and support throughout this period. Most importantly, I’d like to thank Lucy for
being there for me throughout.

Table of Contents
1 INTRODUCTION..........................................................................................1
1.1 Project Background.................................................................................................................. 1
1.2 Definitions....................................................................................................................................3
1.3 Mechanism...................................................................................................................................4
1.4 Substituent Effects.................................................................................................................... 8
1.5 Racemisation Case Studies....................................................................................................13
1.5.1 Base-Catalysed Racemisation of Stereocentres o f the Type R ” R ’RC-H...................19
1.5.2 Other Mechanisms of Racemisation................................................................................22
1.6 Acid and Base C atalysis........................................................................................................26
1.6.1 Acid Catalysis..................................................................................................................... 26
1.6.2 Base Catalysis..................................................................................................................... 27
1.7 Kinetic Isotope Effects........................................................................................................... 28
1.8 Linear Free-Energy Relationships..................................................................................... 30
1.8.1 The Bronsted Catalysis L aw ............................................................................................. 30
1.8.2 The Hammett Equation.......................................................................................................33
1.8.2.1 Factors Affecting p ..................................................................................................... 36
1.8.2.1.1 Distance Between Reaction Site and Aromatic Substituent.........................36
1.8.2.1.2 Temperature Dependence of p ...........................................................................37
1.8.2.1.3 N on-linearity......................................................................................................... 37
1.8.2.2 Modifications o f the Hammett Equation.................................................................. 38
1.8.2.2.1 o~ Substituent Constants......................................................................................38
1.8.2.2.2 a+ Substituent C onstants.....................................................................................39
1.8.2.2.3 The Yukawa-Tsuno Equation............................................................................ 40
1.8.2.3 Cross-Interaction T e rm s............................................................................................ 40
1.8.2.4 Application of the Hammett Equation to Heterocycle-Substituted Reactants..42
1.9 Thermodynamic Activation Param eters..........................................................................43
1.9.1 The Arrhenius Equation.....................................................................................................43
1.9.2 The Eyring Equation.......................................................................................................... 44

1.9.3 Interpretation of Eyring Thermodynamic Activation Param eters............................. 44
1.10 Experimental Techniques..................................................................................................... 46
1.10.1 ‘H NMR Spectroscopy.....................................................................................................46
1.10.2 Mass Spectrom etry.......................................................................................................... 47
1.10.3 Circular D ichroism .......................................................................................................... 48
1.10.4 Computational Chemistry............................................................................................... 49
1.11 Project G oals............................................................................................................................51
1.12 References................................................................................................................................. 52
2 DATABASE MINING................................................................................. 58
2.1 Introduction.............................................................................................................................. 58
2.2 Analysis......................................................................................................................................59
2.2.1 ‘Chiral Chopper’ ................................................................................................................. 59
2.2.2 Classification of Substituents............................................................................................59
2.3 Results and Discussion........................................................................................................... 63
2.3.1 Overview o f Most Frequently Occurring Combinations o f Substituents................... 63
2.3.2 Analysis o f Most Frequently Occurring ‘At Risk’ Combinations of Substituents ...64
2.4 Conclusions............................................................................................................................... 69
2.5 Experimental............................................................................................................................70
2.5.1 SMARTS used for Analysis o f Substituents.................................................................. 70
2.5.2 SMARTS Queries...............................................................................................................73
2.5.3 SMARTS O utput................................................................................................................ 74
2.6 Appendix....................................................................................................................................75
2.6.1 Explanation of Syntax u se d ..............................................................................................75
2.6.1.1 SM ILES........................................................................................................................75
2.6.1.2 SM A RTS......................................................................................................................77
2.6.2 Data T ables..........................................................................................................................79
2.7 References................................................................................................................................. 85vii

3 KINETIC STUDIES ON THE CONFIGURATIONAL INSTABILITY
OF 7V-ACETYL ARYLGLYCINE ESTERS...................................................86
3.1 Introduction...............................................................................................................................86
3.2 Aims............................................................................................................................................. 89
3.3 Synthesis of Compounds for Analysis................................................................................ 90
3.4 Results and Discussion............................................................................................................92
3.4.1 Initial Proton-Deuterium Exchange Experiments..........................................................92
3.4.2 Reaction Scheme..................................................................................................................92
3.4.3 Determination of Rate Constants o f H/D Exchange and Hydrolysis......................... 94
3.4.4 Nature o f Base-Catalysis...................................................................................................95
3.4.5 Hydrolysis.............................................................................................................................98
3.4.6 Hammett Analysis..............................................................................................................100
3.4.7 Variation of Ester Substituent......................................................................................... 103
3.4.8 Mechanism of Racemisation............................................................................................104
3.4.8.1 Comparison of Data from CD and lH NMR Spectroscopy Experiments 105
3.4.8.2 Mechanistic Conclusions.......................................................................................... 105
3.4.9 Analysis of Thiophene Derivatives.................................................................................106
3.4.9.1 Kinetics of H/D Exchange for 3k and 31............................................................... 106
3.4.9.2 Hammett Analysis...................................................................................................... 107
3.5 Conclusions.............................................................................................................................. 110
3.6 Experim ental...........................................................................................................................I l l
3.6.1 General Experim ental....................................................................................................... I l l
3.6.2 Synthesis of Com pounds..................................................................................................I l l
3.6.2.1 Synthesis of Arylglycine Ester Hydrochloride Salts (2a-l)................................ I l l
3.6.2.2 Synthesis of N-Acetyl Arylglycine Esters (3a-l)..................................................116
3.6.2.3 Synthesis of N-Acetyl Phenylglycines (4a, c-e, i-h ) ........................................... 122
3.6.3 Proton-Deuterium Exchange Reactions Followed by lH NMR Spectroscopy 126
3.6.3.1 Experimental Procedure............................................................................................ 126
3.6.3.2 Interpretation of *H NMR Spectra.......................................................................... 126
3.6.3.3 Interpretation of D ata.................................................................................................127viii

3.6.4 Determination o f Enantiomeric E xcess....................................................................... 129
3.6.5 H PL C ...................................................................................................................................130
3.6.6 M iscellaneous...................................................................................................................131
3.7 Appendix.................................................................................................................................133
3.7.1 Theoretical Background for Equations 3.3 and 3 .4 ................................................... 133
3.7.1.1 SeI Mechanism (Eqn 3.3)......................................................................133
3.7.1.2 Se2 Mechanism (Eqn 3.4)...................................................................... 134
3.7.2 Circular Dichroism Calibrations....................................................................................137
3.7.2.1 CD Calibration for the ee Determination o f 4 a ....................................................137
3.7.2.2 CD Calibration for the ee Determination o f 4e .................................................... 138
3.7.3 HPLC Calibrations for 3a and 4 a ................................................................................... 139
3.7.4 Data Tables from !H NMR Spectroscopy Kinetic Experiments............................... 139
3.7.5 Figures from *H NMR Kinetic Experim ents................................................................ 145
3.7.5.1 Compound 3a .............................................................................................................146
3.7.5.2 Compound 3 b ............................................................................................................ 147
3.7.5.3 Compound 3 c .............................................................................................................148
3.7.5.4 Compound 3 d ............................................................................................................ 149
3.7.5.5 Compound 3 e .............................................................................................................150
3.7.5.6 Compound 3 f .............................................................................................................151
3.7.5.7 Compound 3g .............................................................................................................152
3.7.5.8 Compound 3 h ............................................................................................................ 153
3.8 References............................................................................................................................... 154
4 KINETIC STUDIES ON THE CONFIGURATIONAL INSTABILITY
OF A-SUBSTITUTED PHENYLGLYCINE AMIDES.............................. 156
4.1 Introduction............................................................................................................................ 156
4.2 Aims...........................................................................................................................................158
4.3 Synthesis of Compounds for Analysis............................................................................. 159
4.4 Results and Discussion......................................................................................................... 161
4.4.1 N-Acetyl Phenylglycine Primary Amides 6 a -e .......................................................... 161

4.4.1.1 Initial H/D Exchange Kinetic Experiments at 37 °C ...........................................161
4.4.1.2 LCMS Hammett Analysis at 90 ° C ........................................................................163
4.4.1.3 Determination o f Thermodynamic Activation Parameters for H/D Exchange
Reactions of 6e............................................................................................................................ 166
4.4.1.4 High Temperature Kinetic Experiments as a Predictive Tool for Physiological
Tem peratures...............................................................................................................................172
4.4.2 A-Acetyl Phenylglycine Anilides 8a-l.......................................................................... 172
4.4.2.1 Hammett Analysis o f Phenylglycine Aromatic Substituents..............................174
4.4.2.2 Hammett Analysis of Aniline Aromatic Substituents..........................................175
4.4.2.3 Dual Parameter A nalysis..........................................................................................177
4.4.3 A-Benzoyl Phenylglycine Amides 7 a -d ....................................................................... 177
4.4.4 Steric and Electronic Effects........................................................................................... 179
4.5 C onclusions............................................................................................................................. 181
4.6 E x p erim en ta l..........................................................................................................................182
4.6.1 General Experim ental.......................................................................................................182
4.6.2 Synthesis o f Com pounds................................................................................................. 182
4.6.2.1 Synthesis of Phenylglycine Amides 5 a -e ...............................................................182
4.6.2.2 Synthesis o f A-Acetyl Phenylglycine Amides 6a-e .............................................. 184
4.6.2.3 Synthesis o f A-Benzoyl Phenylglycine Amides 7a-d ...........................................187
4.6.2.4 Synthesis o f A-Acetyl Phenylglycine Anilides 8 a - l .............................................190
4.6.3 Proton-Deuterium Exchange Reactions.........................................................................198
4.6.3.1 ‘H NMR Experiments at 37 °C ................................................................................ 198
4.6.3.2 LCMS Experiments at 60, 70, 80 and 90 ° C .........................................................198
4.7 A ppendix ..................................................................................................................................201
4.7.1 Figures from *H NMR Kinetic Experim ents............................................................... 201
4.7.2 Data Tables from LCMS Kinetic Experiments............................................................202
4.7.3 Figures from LCMS Kinetic Experiments....................................................................204
4.7.3.1 Compound 6b, 90 °C ............................................................................................... 205
4.7.3.2 Compound 6d, 90 °C ............................................................................................... 206
4.7.3.3 Compound 6e, 90 °C................................................................................................207
4.7.3.4 Compound 6e, 80 °C................................................................................................208
4.7.3.5 Compound 6e, 70 °C................................................................................................209
x

4.7.3.6 Compound 6e, 60 °C................................................................................................. 210
4.7.3.7 A-Benzoyl Phenylglycine Amides 7a-d, 90 °C ....................................................211
4.7.3.8 N-Acetyl Phenylglycine Anilides 8a-l, 90 °C.......................................................212
4.7.3.9 Eyring Plot for Use as a Predictive T o o l...............................................................215
4.8 References............................................................................................................................... 216
5 COMPUTATIONAL STUDIES AS A PREDICTIVE TOOL FOR
CONFIGURATIONAL INSTABILITY........................................................ 217
5.1 Introduction............................................................................................................................ 217
5.2 Results...................................................................................................................................... 222
5.2.1 Results from Calculations Employing PCM .................................................................223
5.2.1.1 Correlation with Experimentally Determined &gb .................................................223
5.2.1.2 Hammett Analysis of Computational D ata............................................................224
5.2.1.3 Analysis of Heterocyclic Substituent Constants................................................... 225
5.2.2 Computational Analysis Without PC M .........................................................................227
5.2.3 Geometry of Computational Structures.........................................................................229
5.2.3.1 Conformational Searching........................................................................................232
5.2.4 Extension o f Computational A nalysis...........................................................................234
5.2.4.1 Analysis of Functional Group Dependence...........................................................234
5.2.4.2 Analysis o f Experimental Data from Literature...................................................236
5.3 Conclusion...............................................................................................................................239
5.4 Experim ental.......................................................................................................................... 240
5.4.1 Computational D etails......................................................................................................240
5.4.1.1 Calculations Performed Using Polarisable Continuum M odel.......................... 240
5.4.1.2 Calculations Performed in the Gas-Phase..............................................................260
5.4.2 Determination of &gb for Amfepramone and Cathinone..............................................272
5.5 References................................................................................................................................274
6 EPILOGUE................................................................................................ 275
XI

6.1 General Conclusions.............................................................................................................275
6.2 O utlook.................................................................................................................................... 277
xii

1 Introduction
1.1 Project Background
Chirality is o f major interest in the research and development of novel pharmacologically
active molecules. In 2008, it was estimated that around 50 % o f marketed drugs are chiral,1
increased from 40 % in 1993. In the past 30 years there has also been a drastic increase in the
proportion of drugs solely administered as a single-enantiomer. In 2003 not a single new drug
on the market was administered as a racemate,3 and the three top-selling drugs of 2008* were
all single-enantiomers.4 Alongside this move away from developing new drugs as racemates
is the strategy of many pharmaceutical companies known as a ‘chiral switch’, whereby drugs
previous marketed as a racemate are re-marketed as a single-enantiomer.5'7 The switch to
homochirality can be therapeutically advantageous and can therefore enable the manufacturer
to extend the duration o f patent protection. It has also been shown that the presence of a chiral
carbon within a molecule correlates with its successful transition from discovery too
marketable drug.
Because of the chiral environment found within the human body, opposing enantiomers for
many chiral molecules can have drastically different physiological actions.9,10 Enantiomers of
some compounds stimulate different smell and taste receptors to produce different odours and 11 12flavours. ’ O f greater interest are the different pharmaceutical properties found in many
drug molecules. Most pharmaceuticals dispensed as a racemate have one enantiomer
( ‘eutomer’) that is more bioactive than the other (‘distomer’) .13 For the class of compounds
known as non-steroidal anti-inflammatory agents only one enantiomer is pharmaceutically
active. An example o f this is ibuprofen, shown in Scheme 1.1.14
(+)-(S)-Ibuprofen (-)-(7?)-Ibuprofenanti-inflammatory inactive
Scheme 1.1: Enantiomers o f ibuprofen.
* Lipitor (atorvastatin calcium ), Plavix (Clopidogrel bisulfate) and Nexium (esomeprazole magnesium)
1

The administration as a racemate of drugs such as ibuprofen results in a reduction of the
effective dose. The therapeutically non-active isomer of the drug can essentially be considered
an impurity.15 More significantly, in some cases the enantiomer of a pharmacologically active
drug may be harmful to the patient. The molecule thalidomide (Scheme 1.2) is often cited as
an example.
O
NH
N
O
(+)-(/?)-Thalidomide (-)-(S)-Thalidomidesedative teratogen
Scheme 1.2: Enantiomers of thalidomide.
Thalidomide was administered to pregnant women in the late 1950’s to ease morning sickness
pains. It was later discovered to be teratogenic, resulting in many recipients of the drug giving
birth to babies with severe deformities. It has since been documented that the teratogenic1 f\ 18activity is caused by the (S)-enantiomer only. ' Other studies have suggested that both
enantiomers can cause birth defects.19, 20 Either way, one legacy of this tragedy was to
increase awareness o f the potential hazards of the presence o f more than one enantiomer in a
drug. It has been contended that administration of enantiopure (^)-thalidomide would have21 22prevented the catastrophe. ’ However, this would not solve the problem as thalidomide
racemises under physiological conditions. In vivo experiments showed half-lives of chiral
inversion of less than 6 hours in humans.23, 24 As a result, the administration of only one
enantiomer o f thalidomide as a drug will not prevent the presence o f both enantiomers within
the body.
To minimise the possibility of an incident such as that involving thalidomide occurring again,
confirmation that a potential drug molecule is configurationally stable under certain25conditions must be obtained prior to its release. The configurational stability at ambient
temperature and humidity over a period of many months should be determined to ensure the
shelf life o f the drug is known. O f greater risk is that a drug may undergo racemisation in the
blood stream, as in the case o f thalidomide. Therefore the configurational stability o f the
molecule of interest should be known under aqueous conditions, at temperatures ~37 °C and
at pH levels from neutral down to very acidic.
2

The susceptibility o f a compound to racemise is evidently related to its molecular structure.
The mechanism by which a molecule undergoes racemisation is largely dependent on the
interaction between molecular structure and its environment. It is therefore of interest to the
pharmaceutical industry and chemists in general to understand this interaction, to allow
insight into which aspects of the molecular structure facilitate racemisation under
physiological conditions.
Knowledge o f the structural factors affecting racemisation could also be of use in areas other
than the configurational stability o f drugs. In dynamic kinetic resolutions (DKRs) for26example, racemisation is harnessed in the production o f enantiomerically pure compounds.
Kinetic resolution o f a racemic material works on the basis that the two enantiomers are
transformed to products at different rates (e.g. in an enzymatic transformation), with the
desired enantiomer reacting faster. In a DKR, the start material is simultaneously racemised.
This allows the transformation of all the racemic start material to the desired enantiopure
product. Racemisation must occur faster than reaction o f the undesired starting enantiomer in
order for the DKR to be effective. As a result, understanding o f the structural factors that
facilitate or hinder racemisation could also be informative to chemists working on DKR
procedures.
1.2 Definitions
It is important to define the concepts of racemisation and enantiomerisation.29, 30
Racemisation (Scheme 1.3) is a statistical, macroscopic and irreversible process in which half
o f an enantiopure quantity o f compound is transformed into the opposing enantiomer. It is
complete when the enantiomeric excess (ee) of the sample under analysis is reduced to 0%.
Accordingly, the half-life of racemisation is the length of time it takes for the ee of a sample
to drop to half its original value. Distinct from this is enantiomerisation (Scheme 1.4), which
refers to the microscopic, reversible conversion of one molecule o f an enantiomer into the
other.
(R) <R> (S) (S) (S)( R ) ( * *rac (S) (R> *rac (s) (S)
(R) (R) ► (R) (S) (S) (s)
(R> (R) (S) (R) (S) (S)
Scheme 1.3: Illustration of racemisation.
3

^enant
(R) - (S)1r
enant
Scheme 1.4: Illustration o f enantiomerisation.
Chiral inversion of one molecule to its enantiomer reduces the ee by two molecules. The rate
constant of racemisation (^rac) is therefore twice that of enantiomerisation {kenan) (eqn 1.1).
0 -1)
The rate o f diastereoisomerisation (Scheme 1.5) is more complex than the rates of
racemisation or enantiomerisation.
h(R,R) « ----— , (S ,R )
k x
Scheme 1.5: Illustration of diastereoisomerisation.
As diastereoisomers have (by definition) inequivalent thermodynamic stabilities, the rate
constant of conversion o f one diastereomer into another will differ from that of the reverse
reaction (eqn 1.2).
kx ^ k _j (1-2)
The definition o f epimers as ‘diastereoisomers that differ in only one configuration of two or
more elements o f chirality’29 means that the example displayed in Scheme 1.5 could also be
referred to as epimerisation.
1.3 Mechanism
Although one can never be 100% certain of the mechanism by which organic molecules
react,31 information on the path a particular reaction (or series of reactions) take affords
insight into the factors affecting the mechanism. In the context of this thesis, for example,
awareness of the mechanism by which a racemisation reaction takes place could allow
prediction of stereocentres that may be susceptible, or conditions under which certain
stereocentres are at risk. For stereocentres o f the type R ” R ’RC-H,+ the rate constant of
f The notation R” R’RC-H used throughout this thesis refers to any stereogenic centre with one proton
substituent and any three other non-identical substituents (not necessarily alkyl substituents).
4

exchange between the proton bound to the stereogenic centre with deuterium (or tritium) from
the environment in which the reaction is being studied, can be compared with the rate
constant of racemisation to provide insight into the mechanism of racemisation. There are
four limiting ratios o f &deut (rate constant of deuteration) divided by &rac (rate constant of
racemisation):32,33
1) if H/D exchange occurs with retention o f stereochemistry, the ratio &deut / krac tends to
infinite (isoinversion)
2) if H/D exchange occurs with total racemisation, deuteration can occur on either face
and the ratio £deut / knc is equal to 1
3) if H/D exchange occurs with complete stereochemical inversion, then for each event
the ee is reduced by two molecules and the ratio k ^ utl krac is equal to 0.5
4) if racemisation occurs with no H/D exchange, the ratio &deut / kTac tends to 0.
H/D exchange with retention o f stereochemistry has been observed in a handful of
examples.34'36 Dehydronation at the stereogenic centre by a base such as ammonia (M) can be
followed by rehydronation on the same face by the same base molecule (&-D, if rotation of
the base ion (^2) is faster than ion pair dissociation (£3) (Scheme 1.6).
H
H - N - H
CH
R
R = CON(CH3)2
H - N - H H - N - D
R NH3D
Racemic Product Dissociated ions Retained Configuration
Scheme 1.6: Mechanism of H/D exchange with retention o f configuration.32

The rate constants depicted in Scheme 1.6 are temperature and solvent dependent. The
retention mechanism applies when kj and k.\ are greater than £3. When this is the case, &deut /
&rac > 1. At 145 °C in tetrahydrofuran with 0.3 M ammonia, k^QVLil kTac = 148 for the reaction
depicted in Scheme 1.6.
An SeI mechanism will result in equal rates o f H/D exchange and racemisation. The SeI
mechanism entails the initial rate-determining loss of a proton to give a planar carbanion,
which can then be deuterated on either face (Scheme 1.7).
©-H
R1 'R'H
R1
+ D
RT©
D R1 RcD
^deut ^rac enant
Scheme 1.7: SeI mechanism of racemisation.
If a negative charge can be delocalised onto adjacent functional groups, the carbanion
intermediate will be stabilised (see Section 1.4). Equal rates o f proton deuterium exchange
and racemisation have been observed in several circumstances where a negative charge can be
stabilised through delocalisation.37'40
If H/D exchange occurs with stereochemical inversion, fcdeut / kTSLC is equal to 0.5 and the Se2
‘push-pull’ mechanism is presumed to be occurring. The Se2 mechanism consists of
simultaneous bond cleavage and bond formation with a hydron as both the incoming and
leaving group, resulting in chiral inversion (Scheme 1.8).
.B
/R 3H'
R1 R1 R1 kRc/R,
R.‘‘o D
Rc Rc
D
b, = lA k = k^deut ' 1 ^rac ^enant
Scheme 1.8: Se2 mechanism o f racemisation.
Reist et al. proposed an Se2 mechanism for the racemisation of 5-substituted hydantoins,
based on an observed &deut/ ^rac ratio o f 0.5.
Adjacent groups that can stabilise a negative charge, and thus facilitate racemisation through
the SE1 mechanism, may also promote racemisation through an S£2-like mechanism, although
bond breaking and bond formation may not occur precisely simultaneously. If the bond with

the leaving proton is broken before the new bond with the incoming deuteron is formed, but
there is insufficient time for the ion-pair intermediate to fully dissociate before the new bond
is formed, then chiral inversion will still be seen and ^deut = V2 &rac = kenm. Negative charge will
be built up though, and this can be stabilised by adjacent functional groups.
The continuum of mechanisms by which an electrophilic substitution of a proton by a
deuteron takes place can be summarised by a More O ’Ferrall-Jencks diagram (Scheme 1.9).41
The jc - and -axes of the diagram correspond to the extent of C-D bond formation and the C-H
bond being broken, respectively. Starting material is typically represented by the
bottom-left-hand comer of the diagram and the product of the electrophilic substitution in the
top-right-hand comer. The SeI mechanism goes via the top left hand comer, with the C-H
bond being broken before the C-D bond is formed. The SE2 mechanism, with simultaneous
C-H bond breaking and C-D bond formation, is depicted by a diagonal line proceeding from
the origin to the top right comer. An SE2-like mechanism, with negative charge build up, but
not enough time for the ion-pair intermediate to break apart, will proceed somewhere in-
between the ‘pure’ SeI and SE2 mechanisms.
C-Hbreaking
R1 / V 'R 3H
C-Dformation
Scheme 1.9: More O’Ferrall-Jencks diagram for electrophilic substitution
reactions.
7

Addition of the deuteron followed by loss o f a proton (as depicted in the bottom-right-hand
comer of Scheme 1.9) is unlikely for carbon-based chiral centres as it would involve the
formation of a pentavalent carbocation intermediate.
There are many other routes through which drug-like molecules may undergo racemisation.
These will be explored further in Section 1.5.2.
1.4 Substituent Effects
As discussed above, certain functional groups can stabilise a negative charge and as such can
facilitate racemisation of stereogenic centres of the type R ” R ’RC-H. Similarly, there are
certain functional groups that destabilise a negative charge and hence promote configurational
stability. Testa et al. classified several functional groups as either increasing, decreasing or
neutral to configurational stability (Table 1.1) and concluded that in order to be of
pharmaceutical or pharmacological significance, there must be either three
carbanion-stabilising groups present or two carbanion-stabilising groups (one of which must
be strongly so) and one neutral group.42' 43
Table 1.1: List of functional groups affecting the configurational stability of stereogenic
centres of the type R ” R ’RC-H (reproduced from reference 42).
Groups decreasing configurational
stability (acid-strengthening)
Neutral
groups
Groups increasing configurational
stability (acid-weakening)
-CO-O-R (strong) - c h 3 -COO’
-CO-aryl (strong) -CH2CH3 -S 0 3 '
-CONRR’
-OH
-Halogens
-Pseudohalogens
-NRR’
-N=R
-Aryl
-CH2-aryl
-CH2OH

The classifications in Table 1.1 as decreasing or increasing configurational stability can be
seen as a direct consequence o f the ability o f the functional groups to stabilise or destabilise a
negative charge, either through direct resonance delocalisation or inductive contributions.
Groups such as a carbonyl, nitrile or aryl will be able to stabilise a carbanion through
delocalisation (Scheme 1.10).
H
d R 1 R 1
RR
N Rz R"N
Rz
R etc.
Scheme 1.10: Stabilisation of an anion by carbonyl, nitrile and aryl groups.
Table 1.1 also suggests that adjacent amide (orientated with nitrogen adjacent to the
stereogenic centre) and amine groups will stabilise a negative charge and decrease
configurational stability. In these two cases, direct delocalisation o f charge cannot be depicted
as in Scheme 1.10, although work by the Richard group supports the supposition that these
groups, amongst others, stabilise a negative charge.44,45
The Richard group has published substantial information on the stability of carbanions in
water. 4403 By determining equilibrium constants for formation of carbanions (i.e. pATa’s of
carbon acids), structural effects on the stability of the carbanion can be quantified through the
variation of these equilibrium constants. pK ^s were obtained from the ratio of the rate
constants for the reversible proton transfer from the carbon acid to either the solvent or to a
Bronsted base, together with the pKa of the reacting base.44 One method used for
determination of these rate constants of deprotonation for carbon acids was through
monitoring deuterium incorporation into the compound using D2O as a solvent. Rate
constants for protonation of the carbanion were estimated by using an encounter-controlled
reaction as a ‘clock’ for proton-transfer. For reactions o f carbanions, which exist in water only
9

for as long as solvent reorganisation can occur, the rate constant for the dielectric relaxation
(reorganisation) o f solvent water (&reorg ~ 1011 s '1) can be used as such a ‘clock’.46,48
Richard et a l 44' 49 found that the addition of an adjacent -NH(Ac) group made a proton more
acidic by more than 4 pK a units (Scheme 1.11a). The authors attribute this to extra
stabilisation of the intermediate carbanion by electrostatic interactions with a partial positive
charge on the amide nitrogen (Scheme 1.1 lb).
a)
pKa = 18.7 pKa = 14.5
b)
Scheme 1.11 a) Illustration of pKa change upon addition of an acetyl amide
group b) stabilising electrostatic interactions between an enolate anion and
the partial positive charge on amide nitrogen.44
A protonated amine adjacent to a carbon acid will stabilise the conjugate base carbanion
because o f its positive charge (Scheme 1.12).
©H3N O . H
R 1 R 1
favourable
Scheme 1.12: Stabilisation o f anion by protonated amine.
Rios and Richard45 found that the rate constant for deuterium incorporation at a-carbon in
D20 was 3500 times greater for A-protonated glycine methyl ester than for ethyl acetate. The
greater rate constant was attributed to the effect o f the NH3+ group on enolate stability,
resulting in a lower pKa. The importance of this positive charge on the amine is further clear
from the decrease in pKa values for the proton at the a-carbon for the glycine anion upon
protonation. The positive charge on the amine makes the proton at the a-carbon more acidic
by 5 orders of magnitude (Scheme 1.13).44,50
10

44
H H
p^a-34 P^a-29
Scheme 1.13: Change in pK & value upon protonation of adjacent amine/
The classification in Table 1.1 of an imine as decreasing configurational stability is also
supported by work of the Richard group. Addition of acetone to A-protonated glycine methyl
ester to form the iminium adduct was shown to lower the pK a o f the adjacent proton by 7
(Scheme 1.14).51
O
HMAcetone
OMe
pAa = 1 4
OMe
H
pAa = 21
Scheme 1.14: Change in pKa upon formation o f an iminium ion from a
protonated amine.
Richard et al.49,52 also summarised the effect of different carbonyl groups on carbon acidity
(Table 1.2).
Table 1.2: Effect o f carbonyl substituents on pAa of a-carbon.
O
O0©
+ H
X P * a
H 16.7
Me 19.3
SEt 21.0
OMe 25.6
OH 26.6
n h 2 28.4
O' 33.5
C6H4CH3 18.7
11

The authors suggest two factors for the range of pKa values seen in Table 1.2; 1) the polar
effect o f electron-withdrawing groups that stabilise negative charge at the enolate ion, and 2)
the 7r-donor effect o f interactions between any substituent lone-pair and the electron deficient
7r-orbital of the adjacent carbonyl carbon.
The pKa values reported in Table 1.2 suggest that a methyl ester group is more carbanion
stabilising than a primary amide group, by two orders o f magnitude. This difference was
attributed to the partial carbon-nitrogen double-bond character o f amides, due to resonance
delocalisation o f the nitrogen lone pair onto the carbonyl oxygen. The presence of a negative
charge on the carbonyl oxygen of a primary amide prevents delocalisation of any negative
charge built up during enolisation.
In Table 1.1, Testa et al. defined both aryl ketone and ester groups as strongly
configurationally destabilising. As shown in Table 1.2, Richard et a l.49' 52 found that the a-
carbon of an aryl ketone has a far lower pKa (7 pKa units) than that of a methyl ester. This
lower pKa suggests that an aryl ketone substituent would be far more configurationally
destabilising than a methyl ester substituent, if positioned adjacent to a stereogenic centre.
Although possessing a carbonyl, a carboxylate anion is said to increase configurational
stability. This is because an adjacent anion will destabilise any negative charge built up
during racemisation (Scheme 1.15).
unfavourable
Scheme 1.15: Destabilisation of an anion by carboxylate group.
The pKa o f a carboxylic acid is obviously dependent on the structure of the rest o f the
the carboxylate will be deprotonated and hence an anion will be present. This effect on
carbanion stability is also reflected in Table 1.2, where the pKa o f the carboxylate anion
substituted ketone is 8 units lower than the equivalent methyl ester compound.
In conclusion, existing studies generally support the assignments in Table 1.1, although many
of the listed functional groups appear untested. It is also important to acknowledge that
configurational stability is a relative term and that nearly all stereogenic centres can be
O r \
R
molecule but is generally < 5.54 Therefore we can assume that under physiological conditions
12
destabilised under certain conditions.43 The assignments in Table 1.1 are made with regards to
physiological conditions as set out in Section 1.1. Functional group dependence will be
further discussed in the following section containing case studies of racemisation.
1.5 Racemisation Case Studies
There are many examples of in vitro studies on the racemisation of drugs or drug-like
molecules. A review article on the subject was written by Ali et al.55 and a review on
racemisation in general by Ebbers et a l 56 Rate constants, conditions and mechanisms of
racemisation of some chiral compounds (including several drugs) are listed in Table 1.3.
As noted, the rate constants in Table 1.3 were obtained under a variety of conditions. This
means that direct comparisons between the compounds in Table 1.3 will be of little value,
although approximate qualitative evaluations can be made.
13

Table 1.3: Examples from the literature of rate constants of racemisation.
Compound Structure
1.1 57 Amfepranone
ON.
1.257 Cathinone
O
* .N H 2
ro1.3 1,2-Diphenylpropanone
1.459 Clopidogrel *
Cl
&rac / s ’ C ond itions Details8
6.47 x 10’4
1.30 x 10'4
3.17 x 10’4
5.79 x 10’7
D20 , pD 7.4, 37 °C,
0.2 M phosphate
D20 , pD 7.4, 37 °C,
0.2 M phosphate
EtOH, 25 °C, 8 mM
NaOEt
H20 , pH 7.4, 37 °C,
0.1 M phosphate
R” R ’RC-H type, GBC,
SE1
R ” R ’RC-H type, GBC,
SE1
R ” R ’RC-H type,
R ” R ’RC-H type, GBC,
Also see hydrolysis
14

1.533 5-Phenylhydantoin
O
NH
O
1.6603-(4-Aminophenyl)
pyrrolidine-2,5-dione
l-Pentyl-3-(4-
1.760 aminophenyl) pyrrolidine-
2,5-dioneC5H11
1.860 Econazole
Cl
2.56 x 10
4.81 x 10
6.42 x 10
7.29 x 10
1:1 H20:D M S 0 pH
3 7.4,40 °C, 0.1 M
phosphate
5 H20 , pH 7.4, 37 °C,
0.01 M phosphate
5 H20 , pH 7.4, 37 °C,
0.01 M phosphate
5 H20 , pH 7.4, 37 °C,
0.01 M phosphate
R ” R ’RC-H type, SE2,
BC
R ” R ’RC-H type, BC
R ” R ’RC-H type, BC
R ” R ’RC-H type, BC
15

1.961
3-Methyl-6-[ 1 -(imidazo-1 -
yl)-1 -(4-cyanophenyl)
methyl benzothiazolinone
OH
1.1062 9-Hydroxyrisperidone
1.11 63, 64 Ibutilide
CH2CH3
(CH2)6CH3
9.69 x 10'1
4.47 x 10"
N/A
9:1 H20:EtOH pH
7.4, 50 °C, 0.05 M R ” R ’RC-H type, BC
phosphate
R ” R’RC-H type, GAC,. H20 , pH 2.5, 37 °C,’ imine-enamine
0.01 M phosphatetautomerism
AC, via dehydration andH20 , range of pH and
intramoleculartemperatures
nucleophilic attack
16

1.1265
1.1366
1.1467
1.1S68
Adrenaline
Allantoin HoN
O
o
Ketorolac
Oxazepam
6.83 x 10'6
Not stated,
t\/2 > 10 hr
5.0 x 10'9
3.85 x 10'3
H20 , 1.0M HC1,
30 °CAC, via dehydration
H2O, neutral pH,
phosphate buffers
H20 , pH 7.2, 25 °C,
0.04 M phosphate
R ” R ’RC-H type,
racemises through
intramolecular
nucleophilic attack and
Se1/Se2 elimination
R ” R ’RC-H type, GBC
and GAC
Cyclic hemi-aminalH20 , pH 7.5, 23 °C,
opening, accelerated atO.IMTris-HCl buffer
high pH
17

1.1669
1.1770
1.1871
Chlorthalidone
Ibuprofen
RS-10085
H2N. /O
MeO
MeOOH
OEt
4.24 x 10⁻⁴
N/A
N/A
H20 , pH 6.5, 22 °C,
Briton-Robinson
buffer
No examples of in
vitro racemisation at
moderate pH and
temperature
H20 , pH > 7, Range
of temperatures
AC via dehydration, BC
through ring-opening
and -closing, rate
slowed by liposomes
R ” R’RC-H type, many
examples of in vivo
racemisation through
thioester formation and
enzyme catalysis
Three stereogenic
centres of R ” R ’RC-H
type, epimerisation seen
at one, BC
GBC - general-base catalysed, BC - base catalysed, GAC - general-acid catalysed, AC - acid catalysed
18

1.5.1 Base-Catalysed R acem isation of S tereocentres o f the Type R"R'RC-H
Many of the entries in Table 1.3 are for racemisation o f stereocentres of type R ” R ’RC-H,
catalysed by base. Although a specific mechanism was not concluded for some o f these
entries, a rate-determining step involving proton abstraction by specific or general base is
plausible in all. As such, the data can be used as a basis for comparison of the role adjacent
functional groups play in facilitating racemisation of R ” R ’RC-H type stereocentres,
seemingly through stabilisation of negative charge (Section 1.4).
The data in Table 1.3 loosely supports the assignments o f functional groups by Testa et al.
displayed in Table 1.1. The designation of C(0)-aryl as strongly destabilising is supported by
data from compounds 1.1 and 1.2 (amfepramone and cathinone). It was determined that these
compounds undergo racemisation through an SeI mechanism, with half lives of
approximately 20 and 90 minutes respectively (in D20 based 0.2 M phosphate buffers, at 37
°C).57 By the assignments in Table 1.1, both compounds have one neutral substituent
(methyl), one destabilising (amine groups, primary for 1.2, tertiary for 1.1) and one strongly
destabilising (C(0)C6H5). In comparison, for 1.4 (clopidogrel) the rate constants are 2-3
orders of magnitude lower. Compound 1.4 has, by Testa’s classifications, two destabilising
groups (a tertiary amine and an aryl group) and one strongly destabilising group (methyl
ester). This suggests that a methyl ester is (despite its classification in Table 1.1) less
destabilising than an aryl ketone. This would also be consistent with the far lower p v a l u e
found for a ketone than a methyl ester by Richards et al. (Table 1.2). Compound 1.3 (1,2-
Diphenylpropan-1-one) also contains an aryl ketone and racemises much faster than 1.4,
however, as the rate constants were determined in ethanol solution rather than water, direct
comparison is inappropriate.
Reist et al.51 attributed the difference in racemisation rates of 1.1 and 1.2 to the different pK&
values of the amines of 8.79 and 8.37, respectively. They conclude that the greater basicity of
1.1 means that a larger fraction o f its molecules will be protonated (and hence more electron
withdrawing and configurationally destabilising) than 1.2 at the pH at which the experiments
were carried out. However, the rate constants were determined at pH 7.4. At this pH the vast
majority of molecules of both 1.1 and 1.2 will be protonated, suggesting that the protonation
state is unlikely to be responsible, pK a values determined by Rios et al.50 (Scheme 1.13)
suggest that the a-proton of a positively charged amine is more acidic for more substituted
amines (i.e. the pK& for the a-proton is lower for a compound containing Me2N+ than for
H3N+). This difference is attributed to two effects: (1) hydrogen bond formation between
19

H3N+ and solvent, which diffuses positive charge away from nitrogen and onto solvent
molecules and decreases interaction between charges; (2) methyl groups of Me3N+ reduce the
dielectric constant o f the local medium through which the electrostatic interactions occur,
giving greater stabilisation of the negative charge.72,73 It is also noted that a lower pKa for a
proton a to Me3N + than for H3N+ is consistent with the o\ (field effect) values of 0.92 and 0.60
respectively reported by Hine,74 although other sources75 record field effects to be nearly the
same for both substituents.
33Reist et al. determined the rates of H/D exchange for a series of substituted hydantoins. By
comparison with the rate of racemisation for some of the compounds, they concluded that
hydantoins undergo racemisation through an Se2 mechanism, whereby deuteration proceeds
with chiral inversion (Section 1.3). To the best of our knowledge, this is the only reported
example of an Sg2 mechanism of racemisation found in the literature, although recent results
suggest the reaction may follow an SeI mechanism.76 The rate constants of H/D exchange for
the series o f hydantoins can be used to analyse the effect o f substituents on the lability o f the
proton bound to the stereogenic centre (Table 1.4).
Table 1.4: Rate constants of H/D exchange and racemisation o f hydantoins, reproduced from
reference 33.
O
m - A\ NH
o
R group W h '1 k b h '1rt-rac
Ph 11.3 23.7
CH2Ph 0.060 0.119
CH2OH 0.280 -
NHC(0)NH2 0.118 -
c h 3 0.033 -
CH2COOH 0.017 -
CH(CH3)2 0.006 -
a determined in a mixture of D2O phosphate buffer (pD 7.4, 0.1M, I = 0.22) and (d6)DMSO in
proportion 1:1 (v/v) at 50 °C. b determined in a mixture of phosphate buffer (pH 7.4, 0.1M, I =
0.22) and DMSO in proportion 1:1 (v/v) at 50 °C
The rate constant for H/D exchange determined for phenyl substituted hydantoin is far larger
than any other. This is consistent with the designation of aryl groups as destabilising. Table
1.1 also suggests NRR’ substituents are destabilising. However, the rate constant of the amido
20

substituent in Table 1.4 is two orders of magnitude smaller than that of the phenyl substituent.
This suggests that the assignments made by Testa et al. are qualitative rather than
quantitative, and there is much variation within the general classification as ‘destabilising’.
Comparison of the other rate constants provided in Table 1.3 with those in Table 1.4 is
difficult. Compared with most of the other data sets the H/D exchange of hydantoins were
studied at a higher temperature, and using DMSO as a co-solvent (for solubility) which will
affect the observed rate constants.
Compounds 1.6 and 1.7 have similar structures to 1.5 (5-phenylhydantoin). Both are o f the
type R ” R ’RC-H and racemisation is base catalysed. The rate constants for racemisation,
however, are around two orders of magnitude less than for 1.5. This may be due to the
different conditions or due to the differences in structure. For example, 1.6 and 1.7 do not
have the adjacent carbonyl as found in 1.5. Also o f note is the amide substitution on the
phenyl ring adjacent the stereogenic centre in 1.6 and 1.7. The electron-donating nature of the
amide group will destabilise any negative charge built up at the stereogenic centre during
racemisation and hence reduce the rate.
Table 1.3 also provides evidence supporting the classification o f a carboxylate group as
configurationally stabilising. 1.4 contains a methyl ester and racemises. However, 1.4 also
undergoes hydrolysis to the carboxylate after which no further racemisation is observed.59
This is due to the negative charge already existing on the carboxylate.
It is interesting to consider ibuprofen (and indeed, all profens) at this point, as ibuprofen also
has a carboxylate substituent on the stereogenic centre. Profens are known to undergo
racemisation in vivo and a substantial literature exists documenting this.77'81 However, profen
racemisation occurs via an enzymatic conversion of the carboxylate to its acyl CoA thioesters
which increases the lability o f the proton bound to the stereogenic centre and chiral inversion
occurs.70' 82- 83 When the ester is hydrolysed, the starting material is recovered but any
enantiopurity is lost. Similarly, in order to racemise naproxen (another profen), Noorduin etOA
al. first converted the carboxylate into methyl or ethyl esters.
Direct racemisation of ibuprofen without ester formation, required harsh conditions: high
DMSO concentration, very high temperatures (100°C) and a very basic reaction medium (0.5
M NaOH).85 The racemisation of free amino acids by Smith and Sivaua40 also required
temperatures in excess o f 100°C. These results support the assignment of a carboxylate as
configurationally stabilising under physiological conditions. However, the case of ibuprofen
shows the importance o f distinguishing between in vivo and in vitro testing.21

Compound 1.18 (RS-10085) contains 3 stereogenic centres of type R ” R’RC-H. Although
stereogenic centres showed any chiral instability. Comparison of the functional groups present
on each stereogenic centre provides a rationale for this observation. The only stereogenic
centre to show any chiral instability has amine (destabilising), alkyl (neutral) and ester
(strongly destabilising) substituents. The other two stereocentres have an amine
(destabilising), an amide (destabilising) and a methyl (neutral) substituent and an amine
(destabilising), a methyl (neutral) and a carboxylate (stabilising) substituent. These
observations provide general support for Testa’s conclusion that either three destabilising
substituents or two destabilising substituents (with one strongly so) and one neutral
substituent must be present in order to see configurational instability in a stereogenic centre of
type R ” R ’RC-H under physiological conditions.
1.5.2 Other M echanism s o f R acem isation
Stereogenic centres of the type R” R ’RC-H with an adjacent carbonyl may also be susceptible
to racemisation in acidic conditions. Protonation of the carbonyl followed by keto-enol
tautomerism will result in loss of enantiopurity (Scheme 1.16).86
Scheme 1.16: Acid-catalysed racemisation of a-carbonyl stereocentres.
Similarly, acid-catalysed racemisation via imine-enamine tautomerism has been observed for
1.10 (9-hydroxyrisperidone) in aqueous conditions (Scheme 1.17).62
71epimerisation rates were not determined, Gu and Strickley noted that only one of the three
o
22

HO H
CH.
O
HO H H
1.10
o
R = (CH2)2 — N
F
OH H
CH
O
HO H
+ /- H
CH
O
Scheme 1.17: Mechanism o f racemisation of 9-hydroxyrisperidone (1.10).
General-acid catalysis by phosphate was observed for racemisation o f 1.10. The racemisation
of this compound also showed some general-base catalysis, probably through proton
abstraction, but this required severely basic conditions.
Compounds with a stereogenic centre of the form R ” R ’RC-OH have been shown to racemise
through protonation of the alcohol followed by dehydration to give an achiral carbocation
intermediate which can be hydroxylated on either face. Such a mechanism has been observed
for catecholamines, such as 1.12 (adrenaline) (Scheme 1.18).65
HOOH
HoO
OH
1.12
OH
HO
OH
Fk 0 /H
HO"
OH
Scheme 1.18: Acid-catalysed racemisation mechanism of adrenaline (1.12).
23

For 1.12, the electron-donating hydroxy substituent on the phenyl group adjacent to the
stereogenic centre helps stabilise the positive charge build up during racemisation. Removal
of the p-OH group results in a drop in the rate constant o f racemisation by three orders of
magnitude.
1.11 (ibutilide) and 1.16 (chlorthalidone) also contain stereogenic centres o f the type
R ” R ’RC-OH. They too show acid-catalysed racemisation as depicted in Scheme 1.18, with
protonation of the alcohol followed by dehydration giving an achiral cationic intermediate
which is hydroxylised on either face. 1.11 and 1.16 also undergo competing reactions that
complicate the issue. For example, 1.11 also undergoes intramolecular nucleophilic attack by
nitrogen at the stereogenic centre (Scheme 1.19).
H o h CH2CH3
n(CH2)6CH3 r
R = -C6H4N H S 0 2CH3
K © M
(CH2)6CH3
c h 2c h 3I - M' o
(CH2)6CH3
CH2CH3
l3
(CH2)6CH3
R | ^ (C H 2)6CH3
c h 2c h 3
Scheme 1.19: Reactions of ibutilide (1.11).
Lambert et al.64 concluded that some of the observed racemisation goes through the
carbocation intermediate depicted in Scheme 1.19. This can be stabilised by electron donation
from the para amine substituent on the adjacent aryl group (not depicted). However, there is
also direct Sn2 racemisation through intramolecular nucleophilic attack by the amine with a
hydroxyl leaving group.
Lamparter et al.69 observed a U-shaped pH rate profile for the racemisation of 1.16 and
observed both acid and base catalysis. Under acidic conditions protonation of the alcohol
caused racemisation as depicted in Scheme 1.20a, but under basic conditions deprotonation of
the alcohol group leads to ring opening to give an achiral intermediate (Scheme 1.20b).
24

o
b)
NH
OH
Cl
+ H©
h 2o
R = - S 0 2NH2
R = - S 0 2NH2
O
NH
Cl
©o
NH
OH©
Cl
NH
Cl
O
+/- H©
NH
'O H
Cl
Scheme 1.20: Racemisation mechanisms of chlorthalidone (1.16) catalysed
by a) acid, b) base.
The drug 1.15 (oxazepam) undergoes rapid racemisation with a half-life of around 3 minuteszo on oo
at ambient temperature in aqueous media. ’ As the rate of racemisation is fast in
comparison to its pharmacologically active period, it has been suggested to regard 1.15 as ‘aOQ
single compound existing in two very rapidly interconverting chiral states’. 1.15 undergoes
racemisation through the breaking and reforming of a bond adjacent the chiral centre. As the
bond being broken is part o f a seven membered ring, the reformation is not entropically
demanding. This leads to a tautomeric equilibrium depicted in Scheme 1.21.
ci
NH
OH
1.15
NH
OH
Scheme 1.21: Racemisation of oxazepam (1.15).
25

1.15 undergoes racemisation under acidic and basic aqueous solutions. In acidic solutions,
protonation o f the imine may catalyse the rearrangement whereas in basic solutions removal
of the hydroxyl proton may be base catalysed.
1.6 Acid and Base Catalysis90
The aqueous nature o f the blood stream and the presence within it of endogenous buffers such
as proteins, amines and anions such as thiolates, phosphate and bicarbonate means that anyQQ
acid or base catalysis of racemisation should be understood.
1.6.1 Acid C atalysis
There are several examples in the literature o f racemisation reactions catalysed by acid.64,91'93
Catalysis of a reaction by H30 + ions only is referred to as specific-acid catalysis. In aqueous
solutions, specific-acid-catalysed reactions are found to have pseudo first-order rate constants
(eqn 1.3).
- ® = *obt-[R] (1-3)
where [R] is the reactant concentration and &0bs is the observed rate constant.
The observed rate constant for specific-acid-catalysed reactions can be expressed in the form
of eqn (1.4).
*obs= * o + V [ H 3Cr] (1.4)
where k0bs is the observed rate constant, ko is the rate constant for the uncatalysed reaction and
Jen is the rate constant for the reaction catalysed by H30 +, and [H30 +] is the concentration of
H30 +
ko and ku for specific-acid-catalysed reactions can be determined by plotting £0bS against
[H30 +] for the reaction at various acid concentrations. The slope of the line corresponds to kw
and the intercept, where [H30 +] equals 0, is ko.
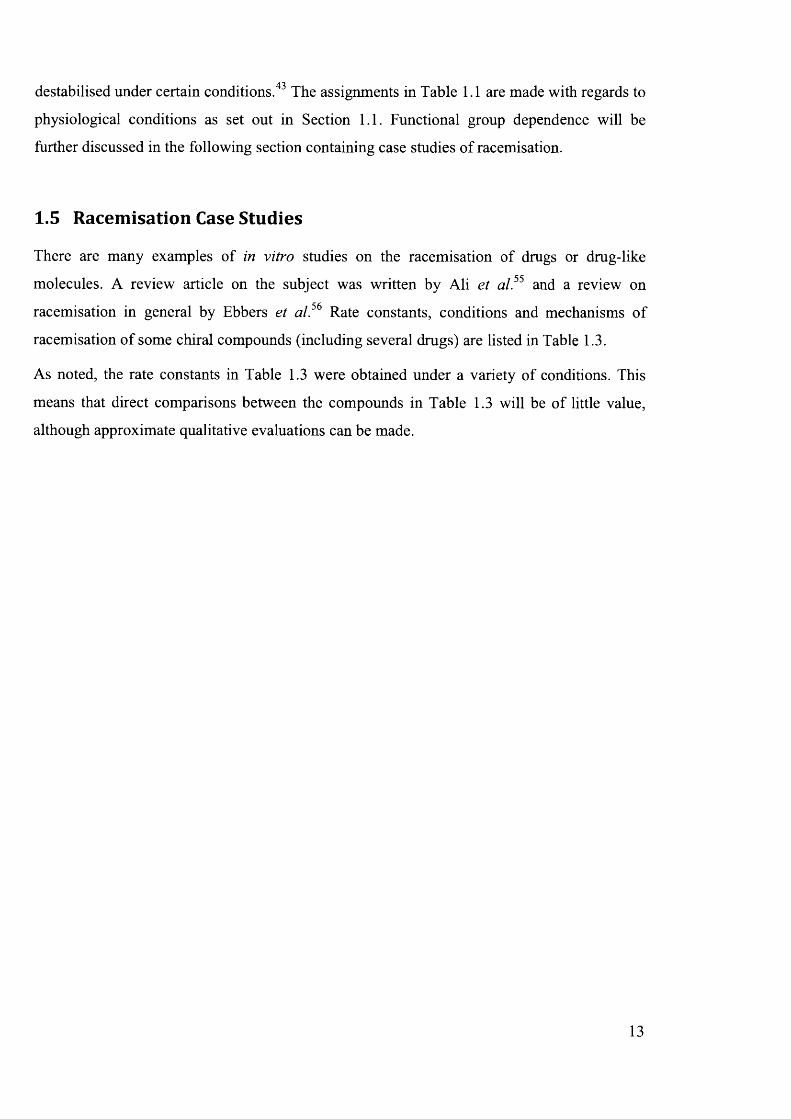
Catalysis by an un-ionised acid A-H is known as general-acid catalysis. General-acid catalysis
will add an extra term to the expression for the rate constant for the reaction for each
catalytically active acid present, resulting in eqn (1.5).
^bs = ^ + A „ - [ H 30 +] + ^ AH'[AH] (1.5)
26
where k0bS is the observed rate constant, ko is the rate constant for the uncatalysed reaction, ku
is the rate constant for the reaction catalysed by H30 +, &ah is the rate constant for the reaction
catalysed by the general acid AH, and E&ah-[AH] is the sum over the contributions of all
catalytically active acids present.
A general-acid-catalysed reaction can be differentiated from a specific-acid-catalysed
reaction, by determining the relationship between k0bS and [AH] at a constant pH. A
specific-acid-catalysed reaction will give a horizontal line, whereas general-acid-catalysed
reactions will give a slope. The intercept, where general acid concentration is 0, corresponds
to ko + &h[H30 +] and the slope of the line corresponds to &ah-
1.6.2 B ase C atalysis
Base-catalysed racemisations are well documented in the literature.40, 57, 61, 85, 94, 95 Base
catalysis is generally a result of proton abstraction by base from stereocentres of the type
R ” R ’RC-H through either an SeI or Se2 mechanism (Section 1.3).
A reaction which takes place that is catalysed by OH' but not by any other bases present is
described as specific-base catalysed, analogous to specific-acid catalysis. The rate law for
such reactions is described in eqn (1.6).
- ^ p = * .b.-[R ] O-6)at
The pseudo first-order rate constant for such reactions can be expressed as eqn (1.7).
*„b. = * 0 + * 0 H - [ O H - ] (1 . 7 )
where k0bS is the observed rate constant, ko is the rate constant for the uncatalysed reaction and
£oh is the rate constant for the reaction catalysed by OH‘.
Akin to specific-acid-catalysed reactions, a plot of &0bs against [OH ] for specific base-
catalysed reactions gives a straight line with intercept ko, and gradient kon-
If a reaction is catalysed by any base, it is general-base catalysed. The observed rate constant
for such reactions is given by eqn (1.8).
*„bS = * o + * o H - [ O H - ] + X * B -[B] (1 .8)
where k0bS is the observed rate constant, ko is the rate constant for the uncatalysed reaction,
£oh is the rate constant for the reaction catalysed by OH\ k& is the rate constant for the
27

reaction catalysed by general base B, and £&b-[B] is the sum over the contributions o f all
catalytically active bases present.
A general-base-catalysed reaction is catalysed by any base. As such, each general base present
will need to be included in the sum function in eqn (1.8). This is important when a general
base may exist in more than form, such as phosphate in different protonation states.
General-base-catalysed reactions are distinguished from specific-base-catalysed reactions in
the same manner as specific- and general-acid-catalysed reactions are distinguished. A plot of
&obs against [B] at constant pH will give a horizontal line for specific-base-catalysed reactions
and a slope for general-base-catalysed reactions with intercept ko + &oh[OH~] and gradient kb.
1.7 Kinetic Isotope Effects96
In studying chemical reactions, the presence o f kinetic isotope effects (KIEs) can offer insight
into the mechanism by which a reaction can take place. It is known that substitution of an
atom within a molecule by an isotope of the same element does not affect the chemistry of the
compound. Such a compound will undergo the same chemical reactions, via the same
mechanisms, regardless of the change in isotope. However, the rate (or equilibrium) constant
for the reaction may become smaller or larger due to the isotopic substitution. It is this change
in rate constant, or lack thereof, that provides information on the mechanism of reaction.
The principles behind the KIR are best discussed for the example of a simple diatomic
molecule, H-X, the zero-point energy (so) of which is given by eqn (1.9).
where v is the vibrational frequency and h is Planck’s constant.
As eqn (1.9) shows, the zero-point energy is dependent on the molecule’s vibrational
frequency. Although increasing the mass of an atom in a molecule by addition of a neutron to
the nucleus has no effect on the bonding within the molecule, it does affect its vibrational
properties. The vibrational frequency o f H-X (where X is an atom much heavier than
hydrogen) is given by eqn (1.10).
x
where k is the force constant of the bond and /^hx is the reduced mass o f the molecule.
s Q = 0.5 hv (1.9)
( 1. 10)
28

The reduced mass for a diatomic molecule H-X is given by eqn (1.11).
f f l u ' W v
Mux ~ 7 \ (1-11)\m H + mx)
where mu is the mass of H and m \ is the mass of X.
If m \ » mu, the reduced mass of H-X is approximately equal to 1. However, for the
deuterated equivalent (D-X) the reduced mass is approximately equal to 2. From the reduced
masses and eqn (1.11), the resulting molecular vibration of DX is lower than that of HX (eqn
1. 12).
2 « 1.41 (1.12);DX V Mux
This difference in vibrational frequencies is the basis for the KIE. As the vibrational
frequency for D-X will be lower than that of H-X (eqn 1.12), the zero-point energy will also
be lower (Figure 1.1).
I
Do(DX)
o6o
<Intemuclear distance, r
Figure 1.1: Enharmonic oscillator potential-energy diagram for diatomic
molecules H - X and D - X (where the mass of X » H ) . D o ( H X ) =
dissociation energy of H - X , D o ( D X ) = dissociation energy of D - X .
Figure 1.1 shows that a greater amount o f energy is required to break the D - X bond than is
required to break the H - X bond. This is the origin of the KIE. For reactions where the rate-
29

determining-step involves breaking of a bond to a proton, the ratio kw / ku is therefore greater
than 1, where kw is the rate constant for the protonated reaction and kr> is the rate constant for
the deuterated reaction. KIEs greater than 1 are known as a normal KIE, and are typically
around 2-3. An example of a normal KIE is the dehydrogenation of propanol (Scheme 1.22).
Scheme 1.22: Dehydrogenation of propan- l-ol by chromium trioxide,
where kw / Ap = 7.96
Instances where kw / k& < 1 are known as an inverse KIE. These occur when the force field of
a vibration involving the isotopically substituted atom increases as the reaction progresses.
This results in the vibrational potential energy curve of the activated complex becoming
steeper than that o f the reactant, and the gap between the lH energy level is larger than that
between the H energy levels.
Heavy atom KIEs may be observed when an element other than hydrogen is isotopically
substituted (e.g. 35C1 and 37C1). However, as the proportional difference in the reduced masses
is far lower for isotopes o f heavy atoms than for hydrogen, any KIE will be smaller in
magnitude.
Isotopic variation of a molecule in positions other than the site o f reaction may also give
different rate constants. This is known as a secondary KIE. Magnitudes are generally far
lower than for primary KIEs, typically around 0.80-1.25, and are dependent on the distance
between the site of reaction and the isotopically varied atom.
KIEs may also be seen when the solvent in which the reaction is taking place is isotopically
substituted. A common example is performing a reaction in both H2O and D2O. Solvent KIEs
may be a result o f the solvent being a reagent in the reaction, or result from different solvation
properties of the isotopically substituted solvent.
1.8 Linear Free-Energy Relationships
1.8.1 T he B r0 n s ted C atalysis Law
The Bronsted catalysis law is a linear free energy relationship (LFER) that describes the
relationship between acid or base strength with its catalytic ability in general-acid and -base
30

catalysis (see Section 1.6). The Bronsted relationship is described by eqn (1.13) for general-
acid catalysis and by eqn (1.14) for general-base catalysis.
log k AH = - a - p K ah + constant (1-13)
log k B = (3 • p K bu + constant (114)
where &Ah is the second-order rate constant for the reaction catalysed by the general acid AH,
j^ah is the acidity constant o f AH, a is the Bronsted factor for catalysis by general acids of the
reaction under scrutiny, kB is the rate constant for the reaction catalysed by the general base B,
K Bu is the acidity constant o f the conjugate acid of B and /? is the Bronsted factor for catalysis
by general bases of the reaction under scrutiny.
Values for a or ft are determined by measuring &ah or kB for reaction for a series of acid or
base catalysts. A logarithmic plot of the resulting rate constants against the p^ah or p^bh of
the catalyst used in each case should give a straight line with gradient a or/? (Figure 1.2).
-a
oJXLO)o
PK
Figure 1.2: Example o f a Bronsted plot, with gradient -a or /?.
The Bronsted a and p coefficients quantify how sensitive the catalysed reaction is to the
strength of the acid or base catalysts, and is typically in the range 0-1 for reactions carried out
in water.
When a and p are close to zero or one, the values are difficult to determine experimentally.
When close to zero, catalysis is insensitive to the strength of the catalyst, meaning the
reaction will take place by pathways in proportion to the relative concentrations of each acid
or base present. Therefore, in aqueous conditions the reaction will be almost exclusively
31
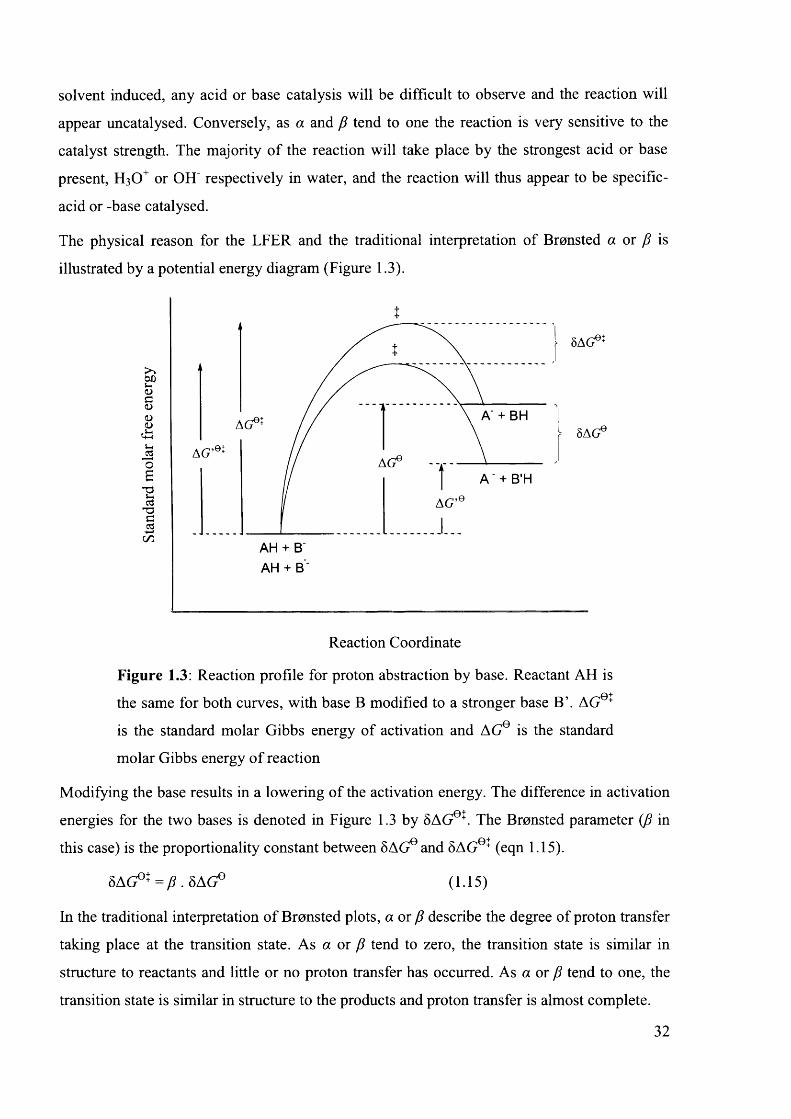
solvent induced, any acid or base catalysis will be difficult to observe and the reaction will
appear uncatalysed. Conversely, as a and p tend to one the reaction is very sensitive to the
catalyst strength. The majority o f the reaction will take place by the strongest acid or base
present, HsO+ or OH' respectively in water, and the reaction will thus appear to be specific-
acid or -base catalysed.
The physical reason for the LFER and the traditional interpretation of Bronsted a or p is
illustrated by a potential energy diagram (Figure 1.3).
fcDS-H<Da<u<D«
r*-1S-i-2oS
T3i-H03ao3-4—>
go
i
A' + BH
A ' + B'H
AH + B'
5AG0*
5AG0
AH + B
Reaction Coordinate
Figure 1.3: Reaction profile for proton abstraction by base. Reactant AH is
the same for both curves, with base B modified to a stronger base B \ AGe+
is the standard molar Gibbs energy of activation and AG0 is the standard
molar Gibbs energy o f reaction
Modifying the base results in a lowering of the activation energy. The difference in activation
energies for the two bases is denoted in Figure 1.3 by 5AGe \ The Bronsted parameter (J3 in
this case) is the proportionality constant between 8AG0 and 5AGe + (eqn 1.15).
8AG°+ = P . SAG0 (1.15)
In the traditional interpretation o f Bronsted plots, a or p describe the degree of proton transfer
taking place at the transition state. As a or p tend to zero, the transition state is similar in
structure to reactants and little or no proton transfer has occurred. As a or p tend to one, the
transition state is similar in structure to the products and proton transfer is almost complete.
32

1.8.2 The H am m ett Equation97 "
The Hammett equation is a Linear Free Energy Relationship (LFER) which can provide
insight into the mechanism by which a specific reaction of a series of substituted aromatic
compounds takes place. A series of compounds, differently substituted in the meta and para
positions but with a common reaction site, will show differences in their reactivity at the
common site dependent on the substituent nature. An equation providing a quantitative link
between processes sharing a common development o f charge was first proposed by Louis P.
Hammett in 1937 based on the varying acidities of substituted benzoic acid derivatives.100
Scheme 1.23: Dissociation of benzoic acid derivatives.
For the deprotonation of benzoic acids, electron-withdrawing substituents stabilise the
negative charge on the carboxylate and hence the equilibrium lies further to the right-hand-
side of Scheme 1.23. Electron-donating substituents destabilise the negative charge and hence
equilibrium lies further to the left. Taking the deprotonation of benzoic acids as a reference
reaction, the basic equation describing the relationship between electronic substituent effect
and equilibrium constants is given by eqn (1.16).
1° 8 { y l | = cP (1-16)
where Kx is the equilibrium constant o f reaction for the compound with aromatic substituent
X, Ko is the equilibrium constant of reaction for the unsubstituted compound, a is the
substituent constant for substituent X and p is the reaction constant.
The reaction constant, p, was arbitrarily set to 1 for the dissociation of benzoic acids in water
at 25 °C. This allows for each substituent X, the assignment of a substituent constant, a,
which quantifies its electron-withdrawing or -donating capability. The same substituent will
have a different o value depending on whether it is in the meta- (crm) or /?ara-position (<tp)
(<ortho substituents are excluded as steric effects become a factor as well as the electronic
factors). Compared to no substitution, electron-withdrawing substituents have a positive o
value; electron-donating substituents have a negative o value (Table 1.5).
33

'"7 C _j_
Table 1.5: List of example Hammett substituent constants. The applicability of crp and <rp
substituent constants is outlined in Sections 1.8.2.2.1 and 1.8.2.2.2.
Substituent
Substituent Constants
<7P <7p +<7p
n o 2 0.71 0.78 1.27 0.79
c f 3 0.43 0.54 0.65 0.61
COOH 0.37 0.45 0.77 0.42
COOMe 0.37 0.45 0.75 0.49
Cl 0.37 0.23 0.19 0.11
F 0.34 0.06 -0.03 -0.07
OMe 0.12 -0.27 -0.26 -0.78
OH 0.12 -0.37 -0.37 -0.92
H 0.00 0.00 0.00 0.00
Et -0.07 -0.15 -0.19 -0.30
Me -0.07 -0.17 -0.17 -0.31
COO' -0.10 0.00 0.30 -0.02
n h 2 -0.16 -0.66 -0.15 -1.30
Using these substituent constants, the p value of any reaction can be determined
experimentally. A positive p value informs us that negative charge is built up during the
reaction or a positive charge is removed; a negative value tells us that positive charge is built
up or a negative charge is removed.
The Hammett equation is most frequently used for analysis of rate constants for reactions of a
series o f substituted aromatic compounds (eqn 1.17).
l ° g j ^ 4 = <?> (1-17)
where kx is the rate constant o f reaction for the compound with aromatic substituent X, ko is
the rate constant o f reaction for the unsubstituted compound, a is the substituent constant for
substituent X and p is the reaction constant to be determined.
34
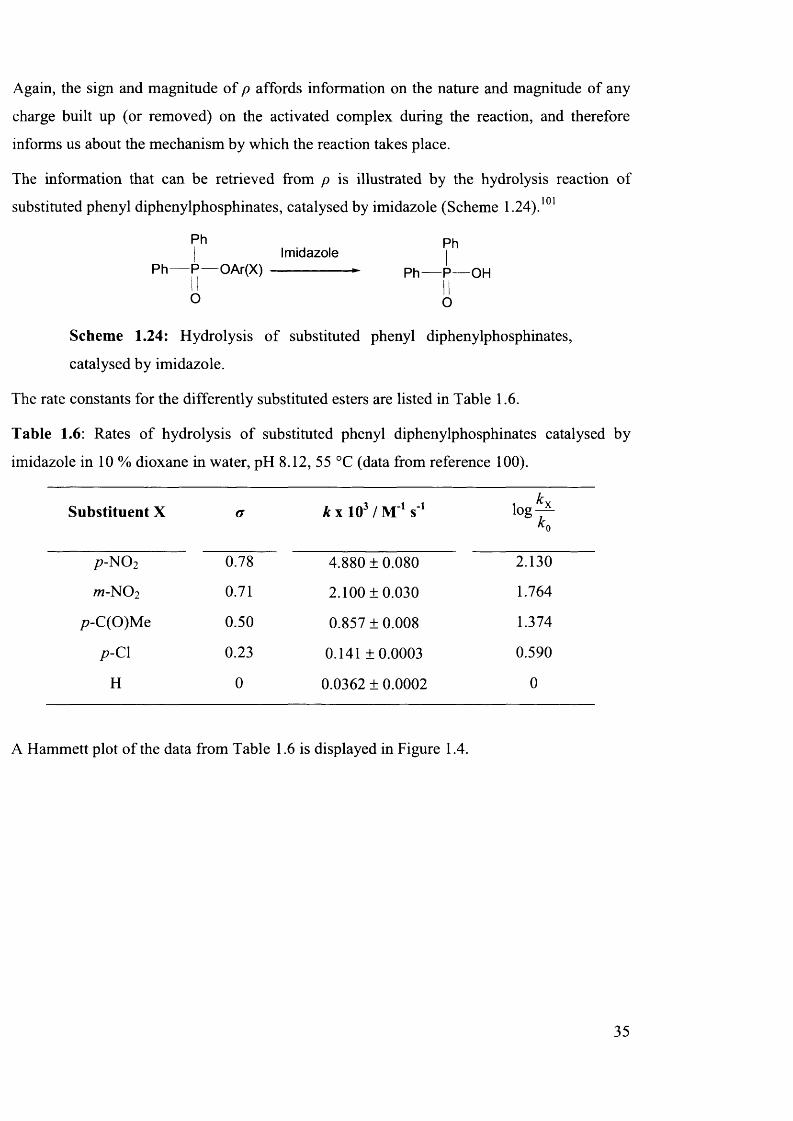
Again, the sign and magnitude o f p affords information on the nature and magnitude of any
charge built up (or removed) on the activated complex during the reaction, and therefore
informs us about the mechanism by which the reaction takes place.
The information that can be retrieved from p is illustrated by the hydrolysis reaction of
substituted phenyl diphenylphosphinates, catalysed by imidazole (Scheme 1.24).101
P h PhI Imidazole i
Ph II— ° Ar^ ------------------ ^ Ph— P — 0HO O
Scheme 1.24: Hydrolysis o f substituted phenyl diphenylphosphinates,
catalysed by imidazole.
The rate constants for the differently substituted esters are listed in Table 1.6.
Table 1.6: Rates o f hydrolysis o f substituted phenyl diphenylphosphinates catalysed by
imidazole in 10 % dioxane in water, pH 8.12, 55 °C (data from reference 100).
Substituent X <T k x 103 / M 1 s'1 log rKq
/7-NO2 0.78 4.880 ± 0.080 2.130
W-NO2 0.71 2.100 ±0.030 1.764
/?-C(0)M e 0.50 0.857 ± 0.008 1.374
p-C\ 0.23 0.141 ±0.0003 0.590
H 0 0.0362 ± 0.0002 0
A Hammett plot o f the data from Table 1.6 is displayed in Figure 1.4.
35

2 .5 - ,
2 .0 -
1 .5 -
.* 1.0 -
0 .5 -
0 .0 -
0.0 0.2— I—
0.4 0.6 0.8
Figure 1.4: Hammett plot for the imidazole catalysed hydrolysis of
substituted phenyl diphenylphosphinates in 10 % dioxane in water, pH 8.12,
55 °C, p = 2.64.
The sign and magnitude of p suggests that a significant extent o f negative charge is built up
on the activated complex during hydrolysis (Scheme 1.25).
Ph P h PhA l
P h — P — OAr(X) B ’ H2° > ) 0 - ^ P — OAr(X) — —/
Ph
P h — P — 'OH + 0 OAr(X)
OO O
Scheme 1.25: Negative charge build up during hydrolysis of phenyl
diphenylphosphinates.
This negative charge is stabilised by electron withdrawing groups. This means AG* is lowered
and hence the reaction takes place with a higher rate constant.
1.8.2.1 Factors Affecting p
1.8.2.1.1 Distance Between Reaction Site and Arom atic Substituent
The number o f bonds in a molecule between the site of reaction and the substituted aromatic
ring will affect the magnitude o f p. Increased distance between the reaction site and the
substituted aromatic ring will diminish the transmission o f any electronic effect, and reduce
the magnitude o f p. This is illustrated by the dissociation o f aromatic acids. The original
36

Hammett a constants are based on the equilibrium constants for dissociation o f benzoic acids
in water at 25 °C. Moving the site o f dissociation away from the site o f substitution lowers the
p value as displayed in Table 1.7.
102Table 1.7: Hammett p values for the dissociation of aromatic acids in H2O at 25 °C.
Acid3 P
ArCOOH 1.00
ArCH2COOH 0.49
ArCH2CH2COOH 0.21
a Ar = X-C6H4- where X is the variable substituent
1.8.2.1.2 Tem perature Dependence o fp
The temperature dependence of p has been subject to much debate. Many studies have
suggested that the reaction constant p varies with temperature,103' 106 in one manner or
another. The effect o f the reaction medium and temperature on p values has been described by
eqn (1.18).100,107,108
r A + (B/D)^P RT
(1.18)
where, A and B describe the susceptibility of the reaction to polar effects independent and
dependent on the reaction medium, D is the dielectric constant of the medium, R is the gas
constant and T is the temperature.
Eqn (1.18) suggests that the magnitude o f p is inversely proportional to T. As a result, we
would expect to see the p value o f a reaction decrease if the temperature is increased.
However, eqn (1.18) and the dependence o f p on T l has not been unequivocally accepted.109'
111 An example o f a lack of temperature dependence of p is provided by the racemisation of
phenylglycines in aqueous conditions, as studied by Smith and Sivakua.40 They found
identical p values of 1.15 for the reaction at both 80 and 110 °C, and concluded that
temperature was not a major factor for the p value.
1.8.2.1.3 Non-linearity
For some reactions, the Hammett relationship does not apply and a non-linear Hammett plot
is found. A non-linear Hammett plot may indicate that the LFER has broken down, potentially37

as a result o f a change in mechanism, for example from an Sn2 to an SnI or SaN119mechanism. The application of modified Hammett substituents in certain circumstances can
also be used to explain and circumvent non-linearity in a Hammett plot.
1.8.2.2 Modifications o f the Hammett Equation
In some circumstances, the Hammett a constants require modification for certain substituents.
In order for a LFER to be valid, the change from the reference compound to the modified
compound (in this case from the unsubstituted to substituted compound) should be
qualitatively the same on the test reaction and the reference reaction (dissociation of benzoic
acids for o constants).
1.8.2.2.1 o~ Substituen t Constants
In certain reactions, developing 7i-electron density can be delocalised directly to a para-
substituent that can accept a formal negative charge, such as a nitro or aldehyde group. In
these circumstances the reference reaction is not directly comparable (as the charge in the
dissociation o f benzoic acids cannot be delocalised to para substituents) and so the o
constants cannot be expected to provide the basis for a good correlation for the new set of
circumstances. As a result, a new modified substituent constant, o~, was developed to properly
account for such situations. The values o f d~ were obtained from the dissociation constants of
substituted phenols in H2O at 25 °C, where a negative charge can be delocalised onto
particular para substituents, such as a nitro substituent (Scheme 1.26).
38

+ h 2o@
+ H30
OHb)
0O
+ HoOCX ©
@+ H30
Scheme 1.26: a) Dissociation o f substituted phenols at 25 °C, reference
reaction for a~ constant; b) example o f stabilisation o f negative charge onto
a /7-NO2 group.
Examples of how some Hammett substituent constants change when a negative charge is built
up directly adjacent to the aromatic ring can be seen in Table 1.5.
1.8.2.2.2 o + Substituent Constants
Correspondingly, for reactions where positive charge built up on the reaction centre can be
directly stabilised through 71-electron donation by a para substituent, the alternative
substituent constant c f was developed. Values for a+ are obtained from rate constants of the
solvolyses o f substituted cumyl chlorides in 90 % aqueous acetone at 25 °C (Scheme 1.27).
C H 3a) CH
CH
©+ CI
b) CH
CH
CH
CH
Scheme 1.27: a) Solvolyses o f substituted cumyl chlorides in 90 % aqueous
acetone at 25 °C, reference reaction for o+ constant; b) example of
stabilisation o f positive charge by /7-NH2 group.
39

Examples o f how some Hammett substituent constants change when a positive charge is built
up directly adjacent to the aromatic ring can be seen in Table 1.5.
1.8.2.2.3 The Yukawa-Tsuno Equation113
The Yukawa-Tsuno equation is an extension of the Hammett equation. Rather than selecting
either the parameter for no significant resonance conjugation between the reaction site and the
substituent (<7), or the parameter for full conjugation (<j~ or a+), the Hammett equation is
refined to acknowledge the possible presence of an intermediate degree of resonance
interaction. This degree o f resonance is denoted by a new parameter, r~ or r+, depending on
whether the substituent is accepting or donating an electron pair, respectively. For electron
pair acceptors, adding the extra term gives eqn (1.19).
l 0 g | j L| = P{CT + '-"(CT" “ O ')} (1.19)
Analogously, for electron pair donors eqn (1.20) is used.
los j y 4 = P{<? + r* ( < ? -& * ) } (1.20)
r~ and r values can be determined by initially determining the p value using only meta-
substituted compounds or para-substituted compounds where o — d~ or <7 = <7+. The value o f r~
or r~ can then be found from the gradient of a plot of
difference o f o and o / a *.
P [against the
y
Other extensions o f the Hammett equation that will not be discussed include the Taft
equation,114 which introduces steric influences and the Swain-Lupton equation,115 which
divides the substituent constant into field (inductive) and resonance effects.
1.8.2.3 Cross-Interaction Terms116'117
The incorporation o f more than one substituted aromatic ring in a reactant can increase the
number o f terms required in the Hammett equation. For example, Lee et a /.118 studied the
nucleophilic substitution o f substituted benzoyl chlorides with substituted anilines (Scheme
1.28).
40

nh2
X = p-CH3, H,/?-Cl, m-N02 Y=/?-CH3, H,/?-Cl
Scheme 1.28: Nucleophilic substitution of substituted benzoyl chlorides
with substituted anilines, in methanol at 35 °C.
Variation o f either X- or Y- substituent over the full range o f substituents in Scheme 1.28
gives a table of 12 rate constants. A value o f p can be determined from the data in each line
and column of the table. One series of p will be for variation o f the nucleophile with different
electrophilic centres and the other series o f p will be for variation o f the electrophilic centre
with different nucleophiles. Rather than reporting a range of px and py values, however, the
kinetic data can be summarised in terms of eqn (1.21).
where px and py are the reaction constants for varying the X- and Y-substituent respectively,
ox and oy are the substituent constants for the X- and Y-substituent respectively and pxy is the
cross-interaction term.
pxy is usually obtained by multiple-regression analysis. The cross-interaction term affords
information as to the intensity o f the interaction between the two substituents through the
reaction system framework. In the example shown in Scheme 1.28, pxy = -0.68. The negative
sign o f pxy suggests that a stronger nucleophile (more electron-donating X-substituent) gives
a more positive reaction constant when varying the electrophile, resulting from a greater
degree o f bond-formation in the transition state (i.e. the development of more negative charge
on reaction centre).
Other systems have been analysed where three aromatic rings have been included in the
reaction centres,119,120 but that is beyond the scope of this thesis.
P x ° x + P y ° y + P x y ° ’x ° ’y ( 1.21)
41

1.8.2.4 Application o f the Hammett Equation to Heterocycle-Substituted Reactants
It was first suggested that effective substituent constants could be defined for aromatic
heterocycles by Jaffe.108 Since then a range of substituent constants have been proposed for
many different heterocycles. Agreement on specific values has proved difficult - Charton121
lists eight different values o f reported a values for 2-thienyl substitution, ranging from -0.15
to 0.71, determined by correlation with various reference reactions. As the author notes, in
order to be useful, substituent constants should be reasonably constant for a range of
reactions. As such, the scope for inclusion o f heteroaryl groups within the Hammett equation
appears limited, and efforts to do so must be viewed in this context. For five-membered
heterocycles, the substituent constants used in this thesis were determined by correlation with
the p£a o f benzoic acids in water at 25 °C. ’ As they are the second most frequently found
aromatic heterocycle in drug databases (after benzene),124 it is also desirable to obtain a
values for pyridine-substituted compounds. Determining a values for pyridines is complicated
by protonation on the heteroatom, which can also lead to zwitterion formation and
tautomerisation when determining o values from data for nicotinic and isonicotinic acids
(which are analogous to benzoic acids).125 Protonation also makes the pyridine heterocycle
much more electron-withdrawing and hence different o values exist for neutral and protonated
pyridine as substituent. The substituent constants used for heterocycles in this thesis are
summarised in Table 1.8.
Table 1.8: Hammett o values o f heterocycles determined by correlation with pK& o f benzoic
acids in water at 25 °C .122' 123 Pyridine rv a lu es determined at 22 °C.125
Heteroatom position
Heterocycle a
thiophene 0.72 0.12
furan 1.08 0.25
pyrrole -0.24 -0.34
3 4
pyridine 0.45 0.76
protonated pyridine 2.09 2.34
The o values for pyridines in Table 1.8 are supported by pKa data for substituted phenyli 'y/:
ketones reported by Richard et al. (Scheme 1.29).42

H
p Ka 14.8 12.7 7.0
Scheme 1.29: Comparison o f pKa s for substituted phenyl ketones.
Scheme 1.29 shows a decrease o f two pK a units for a carbon acid when an adjacent phenyl
group is substituted for a 4-pyridyl group, and a decrease o f nearly 8 pKa units for a carbon
acid when an adjacent phenyl group is substituted for a protonated 4-pyridyl group. These
figures are consistent with the a values for pyridine substituents displayed in Table 1.8, which
suggest that a 4-pyridyl group is more electron-withdrawing than a phenyl group and that a
protonated 4-pyridyl group is far more electron-withdrawing than a phenyl group.
1.9 Thermodynamic Activation Parameters
1.9.1 T h e A rrh e n iu s E q u a tio n
The Arrhenius equation describes the temperature dependence o f reaction rate constants. In
terms o f the Arrhenius equation, each reaction has a pre-exponential factor, A, and an
activation energy, £ a, both o f which have negligible temperature dependence over small127temperature ranges. The Arrhenius equation takes the form of eqn (1.22).
k = A - e E‘ RT (1.22)
where k is the rate constant, A is the pre-exponential factor (having the same units as k), Ea is
the activation energy, R is the gas constant and T the temperature.
Collision theory suggests that the pre-exponential factor is the constant of proportionality
between the concentration o f reactants and the rate at which the reactant molecules collide in
the correct orientation for reaction. The activation energy is the minimum kinetic energy
required for a particular collision to result in reaction, and reflects the temperature
dependence o f the rate constant.128 The greater the activation energy, the greater the
temperature dependence o f the reaction in question.
43

Eqn (1.22) can alternatively be written as eqn (1.23).
Eln£ = ln A ^ (1.23)
R T
Eqn (1.23) shows that a plot o f In A: against 1 IT should result in a linear graph, with a y-axis
intercept equal to In A and a gradient o f -EJR. This plot is known as an Arrhenius plot.
1.9.2 T h e E yring E q u a tio n
The Eyring equation also describes the change in rate constant as a function of temperature.
The Eyring equation differs from the Arrhenius equation in that it is based on the standard
molar Gibbs energy o f activation, AG0*, o f a reaction. The Eyring equation can be used to
determine the enthalpy and entropy o f activation for a chemical reaction. The general form of
the equation is given by eqn (1.24).129-131
k =k j \ A G '
. e RT (1.24)
where kB is the Boltzmann constant, h is Planck’s constant and AG+ is the Gibbs energy of
activation.
Inserting the terms for enthalpy and entropy o f activation into eqn (1.24) gives eqn (1.25)
k =k DT \ AH' AS'
. e r t . e r (1.25)
Eqn (1.25) can be rearranged to the linear form, eqn (1.26).
In - = --------- + In -5- + (1.26)( k )f - & H ^
+ Inf AS* ^
v r J { R T J U ) I R Jwhere AH* is the enthalpy o f activation and AS* is the entropy of activation
Eqn (1.26) shows that a plot o f In k/T against 1 IT should result in a linear plot (Eyring plot).
The gradient o f this plot equals -A H*/R, and they-axis intercept equals In (k^/h) + AS*/R.
1.9.3 In te rp r e ta t io n o f E yring T h e rm o d y n a m ic A ctivation P a ra m e te rs
Interpretation o f AH* and AS* values is best done by comparison. Table 1.9 shows a selection
o f typical literature values o f AH* and AS*.
44

Table 1.9: Some examples o f activation parameters.
Reaction AH* / kJ m o l1 AS4 / J K 1 m o l1
H y d r o ly s is o f C H 3C1 133 100.4 -51.5
H y d r o ly s is o f C H 3B r l32’ 133 96.2 -42.3
H y d r o ly s is o f C H j I 132133 102.7 -33.9
H y d r o ly s is o f n -C 3 H 7 B r l32' 133 92.5 -56.9
S o lv o ly s is o f /-B u ty l ch lo r id e
• 1 1 ^ 132, 134in H 2 O97.15 51.0
S o lv o ly s is o f /-B u ty l ch lo r id e
in C H jO H 132 134104.1 -13.0
S o lv o ly s is o f 1.19 in C 2H 5O H l32' 134 124.0 -9.2
S o lv o ly s is o f 1.19 in H C 0 2H 132' 134 104.0 15.0
S o lv o ly s is o f 1.20 in H 20 135 43.0 -179.0
T h erm al d e c o m p o s it io n o f
l , l ’-a z o b u ta n e 136' 137217.6 79.5
177 178D im e r isa tio n o f cy c lo p e n ta d ie n e 64.9 -142.3
/ .OTs
1.19 1.20
AH* corresponds to the energy required for bond reorganisation in formation of the activated
complex.137 The energy cost o f breaking a bond means that AH* will be high if bond breaking
is important in the rate-determining step, and low if bond formation is important in the rate-
determining step. An example o f a large AH* is the thermal decomposition of l , l ’-azobutane,
where the rate-determining step is homolytic breaking o f C-N bonds. A large AH* is found
because there is little bond formation to compensate for the bond breaking. The solvolysis of
1.20, and the dimerisation o f cyclopentadiene have low AH* as both reactions involve
concerted cyclisation mechanisms with bond formation simultaneous with bond breaking.
45

AS* corresponds to the degree o f organisation that results from activated complex formation.
Loss o f degrees o f electronic, rotational or translation freedom in forming the activated
complex results in reduced entropy o f the system and hence AS* will be strongly negative. A
gain o f degrees of electronic, rotational or translation freedom through molecules falling apart
will result in AS* being slightly negative or positive. The values in Table 1.9 for AS* reflect
this. The hydrolysis reactions occurring by an Sn2 mechanism have a negative AS* as
bringing together the molecules for reaction reduces the entropy. The solvolysis reactions of t-
butyl chloride and 1.19 have only slightly negative or positive AS* as the molecule ‘falls
apart’ increasing disorder in the SN1 mechanism. Slightly negative AS* in the solvolysis of t-
butyl chloride and 1.19 are due to solvent rearrangement giving an increasingly structured
solvation o f the ionic intermediates. The large positive value of AS* for thermal
decomposition o f l , l ’-azobutane is due to the increased entropy resulting from transformation
o f one molecule to three. Conversely, formation of highly ordered cyclic transition states
results in the strongly negative AS* for solvolysis of 1.20, and dimerisation of
cyclopentadiene.
1.10 Experimental Techniques
1.10.1 m NMR S p e c tro sco p y 139 142
The technique Nuclear Magnetic Resonance (NMR) spectroscopy relies on protons and
neutrons having a property called ‘spin’. When placed in a magnetic field, spin will cause
protons and neutrons to orientate themselves either with the magnetic field or opposed to it.
The small energy gap between these two states is dependent on the interaction between the
nucleus and the magnetic field. Application of electromagnetic radiation of a specific
frequency will cause the nuclei to switch from the low energy state (aligned with the magnetic
field) to the high energy state (against the magnetic field). Each spin-active nucleus has a
different resonance frequency and can therefore be distinguished. Furthermore, this resonance
frequency is also slightly dependent on the chemical environment in which the nucleus finds
itself. This difference in resonance frequency allows distinction between atoms in different
chemical environments and allows for elucidation o f a molecular structure.
As discussed previously (Section 1.3), proton-deuterium exchange can be used to indirectly
investigate the rate constant and mechanism of racemisation. lH NMR spectroscopy as a
method o f determining the rate o f H/D exchange has been frequently used to investigate the
46
racemisation o f stereogenic centres o f type R ” R ’RC-H.33,39,57,59,143-145 The molecule under
investigation is dissolved in a D20-based buffer and incubated at the desired temperature. *H
NMR spectra o f the compound are recorded over a period of time. If the protons bound to the
stereogenic centre of the molecule exchange with solvent, they will be replaced by deuterons.
As a result, the lH NMR spectra will show a decrease in the intensity of the peak
corresponding to the proton bound to the stereogenic centre. This decrease in intensity can be
recorded in relation to peaks in the !H NM R spectrum from another part of the molecule (that
is assumed not to undergo H/D exchange itself),146 or relative to an external standard added to
the solution.
1.10.2 M ass S p e c tro m e try 147
Mass Spectrometry (MS) is an important tool in compound characterisation. The procedure to
obtain a mass spectrum can be divided into three stages: initial vaporisation of the analyte;
production o f ions from the gas-phase molecules formed; and subsequent separation and
detection o f these ions by their mass-to-charge ratio (m/z). Vaporisation is achieved by
heating a sample to high temperatures at low pressure. Ionisation is usually achieved through
either the electron impact (El) or chemical ionisation (Cl) method. El proceeds by firing an
electron beam at the sample, removing an electron from the sample and leaving a radical-
cation (eqn 1.27).
M + e ^ > M 9+ +2e (1.27)
The molecular ions produced through El can then fragment through well documented
fragmentation processes. The pattern o f fragment ions can then be used to characterise the
compound.
Cl proceeds by collision o f the sample with ions o f a reagent gas to give a protonated sample.
Initial ionisation of a sample gas such as methane is done with an electron beam as in El
producing a radical cation (eqn 1.28).
C H 4 + e - > C H / + +2e (1.28)
The radical cation produced will then collide with neutral molecules to yield a cation (eqn
1.29).
C H 4*+ + C H 4 -> C H 5+ + C H 3‘ (1.29)
47

Entering the sample into this mixture will cause CHs+ to act as a strong acid and the sample is
protonated (eqn 1.30).
M + CH 5+ -> M H + + C H 4 (1.30)
Fragmentation is less common in Cl than El. This makes the molecular weight of the sample
easily obtainable, as the observed m/z value will be one unit larger than the sample’s
molecular weight. Detection of the ions from both ionisation methods is achieved using a
mass analyser. The mass analyser separates the ions from the spectrometer by deflection of
the ions in a strong magnetic field; ions o f greater mass are deflected less than those o f a
smaller mass. Mass spectrometry can also be enhanced by coupling the technique to gas and
liquid chromatographs (GCMS and LCMS). This allows for chemical separation of analytes
before characterisation by MS.
As in the case o f NM R spectroscopy, MS has been used to investigate the rate constant
and mechanism o f racemisation by determining the rate of H/D exchange.143 Monitoring the
reaction over time and determining the ratio of the parent compound ion to its deuterated
equivalent from the Cl spectra, allows calculation o f the rate constant of deuterium
incorporation at the stereogenic centre.
1.10.3 C ircu la r D ic h ro ism 148
Circular Dichroism (CD) is a phenomenon arising from the molecular property of chirality.
The technique o f CD spectroscopy works through analysis o f the sample using plane
polarised light. Plane-polarised light consists o f two components o f circularly polarised light
o f equal intensity but rotating in opposite directions. These are known as right circularly
polarised light (rcpl) and left circularly polarised light (lcpl). Rcpl and lcpl are mirror images
o f each other. Each component will interact differently with an enantiomer of a chiral
molecule.
The absorbance o f unpolarised light by a sample is defined in eqn (1.31).
A = \ o % ( l J l ) (1.31)
where A is the absorbance o f unpolarised light, / is the intensity of light after it has travelled a
distance / through the sample, 7o is the intensity before it has travelled through sample
A can also be described by the Beer-Lambert law, eqn (1.32).
48

A = s C l (1.32)
where s is the molar absorption coefficient (M ^cm 1), C is the molar concentration (M), / is
the sample pathlength (cm)
Similarly, molar absorption coefficients can be defined for rcpl and lcpl. This allows us to
calculate the molar circular dichroism (eqn 1.33)
Ac = £l - eR = (Al - A r)/C/ (1.33)
where As is the molar circular dichroism (M ^cm '1), sL is the molar absorption coefficient of
left hand polarised light (M ^ cm 1), sR is the molar absorption coefficient of right hand
polarised light (M ^cnT1), A L is the absorbance of left hand polarised light, A R is the
absorbance o f right hand polarised light
The CD instrument measures the intensity o f rclp and lclp after passing through the sample
and from the intensities determines A L - A R and then As using the equations above.
CD spectroscopy can be used to determine how enantiomerically pure a compound is. Several
examples exist o f its use as a method of determining loss o f enantiomeric excess and hence
rate constants o f racemisation.149,150
1.10 .4 C o m p u ta tio n a l C h em istry
The use of computers to rapidly perform high-level theoretical chemistry calculations has
become widespread. Molecular information such as the most stable configuration of nuclei
and the relative energy o f such configurations can be theoretically obtained through such
calculations.
Calculations in Chapter 5 were performed using Density Functional Theory (DFT).151 DFT
uses approximations o f electron interactions to convert the wavefimction into electron density.
Differing approximations give rise to different functionals. The functional used in this body of
work is RB3LYP.152
1 STAlso important in computational chemistry is the choice o f basis set. The basis set is the set
o f functions used to model the molecular orbitals. Using a finite basis, only the molecular
orbital components along the coordinate axes corresponding to the selected basis are
represented. A smaller basis set results in a less computationally expensive calculation, but
gives a poorer representation o f the molecule. Thus, when choosing a basis set a compromise
has to be made between computation time and accuracy. The basis set 6-31+G(d,p) used in
49

this body of work is frequently used in computational chemistry as it provides a good balance
between computation time and accuracy.
Chemistry is usually carried out in a solution, and the interactions between the solvent and
solute can greatly affect molecular properties such as molecular geometry or energy. As a
result, the effects of solvation are often incorporated into theoretical calculations to provide a
better description of the system under analysis. One approach is to include individual solvent
molecules in the calculation, and consider changes in the substrate and solvent due to
interactions with one another. However, in order to accurately model these interactions
hundreds or thousands o f solvent molecules need to be included in the calculations, making
such an approach very computationally demanding. Therefore an alternative approach based
on continuum models has been developed.154
In this body of work, the Polarisable Continuum Model (PCM) of Tomasi et al.155 has been
used. In the PCM model, a cavity for the molecule is generated based on the van der Waals
radii o f the atoms in the molecule. A solvent-accessible surface is then manifested by a
spherical particle rolling on the surface o f the van der Waals surface. This surface is then
treated as one continuous dielectric field, and specific solvent-solute interactions are
disregarded. This approach provides a relatively cheap computational way of mimicking the
effect o f a solvent.
50

1.11 Project Goals
We aim to test the existing kinetic data and substituent effect information on racemisation o f
stereogenic centres o f type R ” R ’RC-H, and to expand the range o f structures for which
kinetic data is available. In doing so we aim to:
1. Determine the structures at risk of racemisation
Dependence of racemisation on the types of functional groups adjacent to the stereogenic
centre will be tested. The assignments made by Testa et al. (Table 1.1) will be considered and
may be further refined.
2. Quantify the risk
Quantification o f the rate constants o f racemisation will allow direct comparison of the risk of
racemisation for different structures. By modifying the structures this may allow us to
quantify the effect o f each particular functional group on racemisation.
3. Establish conditions where racemisation is a threat
By investigating the dependence of racemisation rate constants on pH, temperature and
general-acid or -base concentration, we will be able to determine which factors are important
for racemisation o f individual structures and functional groups.
4. Investigate mechanisms o f racemisation
Examination o f the mechanism (or mechanisms) by which a molecule undergoes racemisation
is an important goal o f the project. This aspect of the project runs parallel to the dependence
on structural aspects on the molecule. The variation with structure of rate constants for
racemisation will allow insight into the mechanism by which racemisation takes place.
5. Explore possible methods for prediction of structures at risk o f racemisation
The ability to assess whether a particular molecule is configurationally unstable under
pharmacological conditions without having to undertake experimentation would be beneficial.
The ability to predict configurational stability depends on knowledge of the mechanisms by
which configurational instability occurs, and will allow structural features to be related to rate
constants for racemisation. The use o f computational chemistry to predict structures at risk
will also be investigated.
51

1.12 References
1. Perez, S.; Barcelo, D., Trac-Trends in Analytical Chemistry 2008, 27 (10), 836-846.2. Ariens, E. J., Trends in Pharmacological Sciences 1993, 14 (2), 68-75.3. Miller, C. P.; Ullrich, J. W., Chirality 2008, 20 (6), 762-770.4. Agranat, I.; Wainschtein, S. R., Drug Discovery Today 2010, 15 (5-6), 163-170.5. Caner, H.; Groner, E.; Levy, L.; Agranat, I., Drug Discovery Today 2004, 9 (3), 105-
110 .
6. Agranat, I.; Caner, H., Drug Discovery Today 1999, 4 (7), 313-321.7. Agranat, I.; Caner, H.; Caldwell, A., Nature Reviews Drug Discovery 2002, 1 (10),
753-768.8. Lovering, F.; Bikker, J.; Humblet, C., Journal o f Medicinal Chemistry 2009, 52 (21),
6752-6756.9. Testa, B.; Trager, W. F., Chirality 1990, 2 (3), 129-133.10. Levy, R. H.; Boddy, A. V., Pharmaceutical Research 1991, 8 (5), 551-556.11. Bentley, R., Chemical Reviews 2 0 0 6 ,106 (9), 4099-4112.12. Zehnter, R.; Gerlach, H., Tetrahedron-Asymmetry 1995, 6 (11), 2779-2786.13. Nunez, M. C.; Garcia-Rubino, M. E.; Conejo-Garcia, A.; Cruz-Lopez, O.; Kimatrai,
M.; Gallo, M. A.; Espinosa, A.; Campos, J. M., Current Medicinal Chemistry 2009 ,16 (16), 2064-2074.
14. Lee, E. J. D.; W illiams, K.; Day, R.; Graham, G.; Champion, D., British Journal o f Clinical Pharmacology 1985, 19 (5), 669-674.
15. Ariens, E. J., European Journal o f Clinical Pharmacology 1984, 26 (6), 663-668.16. Mellin, G. W.; Katzenstein, M., N En g l J M ed 1962, 267, 1184-1244.17. Blaschke, G.; Kraft, H. P.; Fickentscher, K.; Kohler, F., Arzneimittel-Forschung/Drug
Research 1979, 29-2 (10), 1640-1642.18. Kasprzyk-Hordem, B., Chemical Society Reviews 2010, 39 (11), 4466-4503.19. Fabro, S.; Smith, R. L.; Williams, R. T., Nature 1967, 215 (5098), 296.20. Gunzler, V., Drug Safety 1992, 7 (2), 116-134.21. Serilevy, A.; Richards, W. G., Tetrahedron-Asymmetry 1993, 4 (8), 1917-1923.22. Horn, A. S.; De Ranter, C. J., X-Ray Crystallography and Drug Action. Oxford
Science Publications: 1984.23. Eriksson, T.; Bjorkman, S.; Roth, B.; Fyge, A.; Hoglund, P., Chirality 1995, 7 (1), 44-
52.24. Knoche, B.; Blaschke, G., Journal o f Chromatography A 1994, 666 (1-2), 235-240.25. Decamp, W. H., Chirality 1989, 1 (1), 2-6.26. Huerta, F. F.; Minidis, A. B. E.; Backvall, J. E., Chemical Society Reviews 2001, 30
(6), 321-331.27. Pellissier, H., Tetrahedron 2003, 59 (42), 8291-8327.28. Ward, R. S., Tetrahedron-Asymmetry 1995, 6 (7), 1475-1490.29. Wolf, C., Dynamic Stereochemistry o f Chiral Compounds: Principles and
Applications. RSC Publishing: 2008; p 30-43.30. Reist, M.; Testa, B.; Carrupt, P. A.; Jung, M.; Schurig, V., Chirality 1995, 7 (6), 396-
400.31. Carpenter, B. K., Determination o f Organic Reaction Mechanisms. Wiley-
Interscience: 1984; p 1-4.32. Cram, D. J., Fundamentals o f Carbanion Chemistry. Academic Press Inc.: 1965; p 85-
113.33. Reist, M.; Carrupt, P. A.; Testa, B.; Lehmann, S.; Hansen, J. J., Helvetica Chimica
Acta 1996, 79 (3), 767-778.
52

34. Cram, D. J.; Gosser, L., Journal o f the American Chemical Society 1963, 85 (23), 3890-3891.
35. Cram, D. J.; Gosser, L., Journal o f the American Chemical Society 1964, 86 (24), 5457-5465.
36. Guthrie, R. D.; Nicolas, E. C., Journal o f the American Chemical Society 1981, 103 (15), 4637-4638.
37. Hsu, S. K.; Ingold, C. K.; Wilson, C. L., Journal o f the Chemical Society 1938, 78-81.38. Cram, D. J.; Kingsbury, C. A.; Haberfie, P.; Rickbom, B., Journal o f the American
Chemical Society 1961, 83 (17), 3678-3687.39. Matsuo, H.; Kawazoe, Y.; Sato, M.; Ohnishi, M.; Tatsuno, T., Chemical &
Pharmaceutical Bulletin 1967, 15 (4), 391-398.40. Smith, G. G.; Sivakua, T., Journal o f Organic Chemistry 1983, 48 (5), 627-634.41. Isaacs, N., Physical Organic Chemistry. 2nd ed.; Longman Scientific & Technical:
Harlow, 1995; p 140-145.42. Testa, B.; Carrupt, P. A.; Gal, J., Chirality 1993, 5 (3), 105-111.43. Reist, M.; Testa, B.; Carrupt, P. A., Enantiomer 1997, 2 (3-4), 147-155.44. Richard, J. P.; Amyes, T. L., Current Opinion in Chemical Biology 2001, 5 (6), 626-
633.45. Rios, A.; Richard, J. P., Journal o f the American Chemical Society 1997, 119 (35),
8375-8376.46. Richard, J. P.; Amyes, T. L.; Toteva, M. M., Accounts o f Chemical Research 2001, 34
(12), 981-988.47. Amyes, T. L.; Richard, J. P., Journal o f the American Chemical Society 1996, 118
(13), 3129-3141.48. Richard, J. P.; Williams, G.; Gao, J. L., Journal o f the American Chemical Society
19 9 9 ,121 (4), 715-726.49. Chiang, Y.; Griesbeck, A. G.; Heckroth, H.; Hellrung, B.; Kresge, A. J.; Meng, Q.;
O'Donoghue, A. C.; Richard, J. P.; Wirz, J., Journal o f the American Chemical Society 2 0 0 1 ,123 (37), 8979-8984.
50. Rios, A.; Amyes, T. L.; Richard, J. P., Journal o f the American Chemical Society 2000, 122 (39), 9373-9385.
51. Rios, A.; Crugeiras, J.; Amyes, T. L.; Richard, J. P., Journal o f the American Chemical Society 2001, 123 (32), 7949-7950.
52. Richard, J. P.; Williams, G.; O'Donoghue, A. C.; Amyes, T. L., Journal o f the American Chemical Society 2002, 124 (12), 2957-2968.
53. Amyes, T. L.; Richard, J. P., Journal o f the American Chemical Society 1992, 114 (26), 10297-10302.
54. Perrin, D. D.; Dempsey, B.; Serjeant, E. P., pK a Prediction fo r Organic Acids and Bases. Chapman and Hall: 1981; p 1-11.
55. Ali, I.; Gupta, V. K.; Aboul-Enein, H. Y.; Singh, P.; Sharma, B., Chirality 2007, 19 (6), 453-463.
56. Ebbers, E. J.; Ariaans, G. J. A.; Houbiers, J. P. M.; Bruggink, A.; Zwanenburg, B., Tetrahedron 1997, 53 (28), 9417-9476.
57. Reist, M.; Christiansen, L. H.; Christoffersen, P.; Carrupt, P. A.; Testa, B., Chirality 1995, 7(6), 469-473.
58. Mills, A. K.; Smith, A. E. W., Helvetica Chimica Acta 1960, 43 (7), 1915-1927.59. Reist, M.; Roy-De Vos, M.; Montseny, J. P.; Mayer, J. M.; Carrupt, P. A.; Berger, Y.;
Testa, B., Drug Metabolism and Disposition 2000, 28 (12), 1405-1410.60. Pepper, C.; Smith, H. J.; Barrell, K. J.; Nicholls, P. J.; Hewlins, M. J. E., Chirality
1994, 6 (5), 400-404.
53

61. Danel, C.; Foulon, C.; Goossens, J. F.; Bonte, J. P.; Vaccher, C., Tetrahedron- Asymmetry 2006, 77(16), 2317-2321.
62. Danel, C.; Azaroual, N.; Brunei, A.; Lannoy, D.; Odou, P.; Decaudin, B.; Vermeersch, G.; Bonte, J. P.; Vaccher, C., Tetrahedron-Asymmetry 2009, 20 (10), 1125-1131.
63. Lambert, W. J.; Timmer, P. G., Pharmaceutical Research 1991, 8 (11), 1444-1447.64. Lambert, W. J.; Timmer, P. G.; Walters, R. R.; Hsu, C. Y. L., Journal o f
Pharmaceutical Sciences 1992, 81 (10), 1028-1031.65. Venter, D. P., Tetrahedron 1991, 47 (27), 5019-5024.66. Kahn, K.; Tipton, P. A., Bioorganic Chemistry 2000, 28 (2), 62-72.67. Brandi, M.; Conley, D.; Johnson, D., Journal o f Pharmaceutical Sciences 1995, 84
(9), 1045-1048.68. Yang, S. K.; Lu, X. L., Chirality 1992, 4 (7), 443-446.69. Lamparter, E.; Blaschke, G.; Schluter, J., Chirality 1993, 5 (5), 370-374.70. Caldwell, J.; Hutt, A. J.; Foumel-Gigleux, S., Biochemical Pharmacology 1988, 37
(1), 105-114.71. Gu, L.; Strickley, R. G., Pharmaceutical Research 1987, 4 (5), 392-397.72. Kirkwood, J. G.; Westheimer, F. H., Journal o f Chemical Physics 1938, 6 (9), 506-
512.73. Westneimer, F. H.; Kirkwood, J. G., Journal o f Chemical Physics 1938, 6 (9), 513-
517.74. Hine, J., Structural Effects on Equilibria in Organic Chemistry. Wiley-Interscience:
1975;p 98.75. Hansch, C.; Leo, A.; Taft, R. W., Chemical Reviews 1991, 91 (2), 165-195.76. Narduolo, S., Unpublished results.77. Tan, S. C.; Patel, B. K.; Jackson, S. H. D.; Swift, C. G.; Hutt, A. J., Enantiomer 1999,
4 (3-4), 195-203.78. Landoni, M. F.; Soraci, A., Current Drug Metabolism 2001, 2 (1), 37-51.79. Porubek, D. J.; Sanins, S. M.; Stephens, J. R.; Grillo, M. P.; Kaiser, D. G.; Halstead,
G. W.; Adams, W. J.; Baillie, T. A., Biochemical Pharmacology 1991, 42 (1).80. Leipold, D. D.; Kantoci, D.; Murray, D.; Quiggle, D. D.; Wechter, W. J., Chirality
2 0 0 4 ,16 (6), 379-387.81. Berry, B. W.; Jamali, F., Journal o f Pharmacology and Experimental Therapeutics
1991, 258 (2), 695-701.82. Knihinicki, R. D.; Williams, K. M.; Day, R. O., Biochemical Pharmacology 1989, 38
(24), 4389-4395.83. Knihinicki, R. D.; Day, R. O.; Williams, K. M., Biochemical Pharmacology 1991, 42
(10), 1905-1911.84. Noorduin, W. L.; Kaptein, B.; Meekes, H.; van Enckevort, W. J. P.; Kellogg, R. M.;
Vlieg, E., Angewandte Chemie-Intemational Edition 2009, 48 (25), 4581-4583.85. Yuchun, X.; Huizhou, L.; Jiayong, C., International Journal o f Pharmaceutics 2000,
196 (1), 21-26.86. Wolf, C., Dynamic Stereochemistry o f Chiral Compounds: Principles and
Applications. RSC Publishing: 2008; p 58-70.87. Aso, Y.; Yoshioka, S.; Shibazaki, T.; Uchiyama, M., Chemical and Pharmaceutical
Bulletin 1988, 36(5) , 1834-1840.88. Aso, Y.; Yoshioka, S.; Takeda, Y., Chemical and Pharmaceutical Bulletin 1990, 38
(1), 180-184.89. Reist, M.; Testa, B.; Carrupt, P.-A., Drug Racemization and Its Significance in
Pharmaceutical Research. In Handbook o f Experimental Pharmacology, Springer: 2003; Vol. 153, pp 91-112.
54

90. Maskill, H., The Physical Basis o f Organic Chemistry. Oxford Science Publications: 1985; p 315-366.
91. Schroeter, L. C.; Higuchi, T., Journal o f the American Pharmaceutical Association 1958, 47 (6), 426-430.
92. Mohan, A. G.; Conley, R. T., Journal o f Organic Chemistry 1969, 34 (11), 3259- 3263.
93. Alibrandi, G.; Coppolino, S.; D'Aliberti, S.; Ficarra, P.; Micali, N.; Villari, A., Journal o f Pharmaceutical and Biomedical Analysis 2002, 29 (6), 1025-1029.
94. Youssef, A. A.; Sharaf, S. M., Journal o f Organic Chemistry 1974, 39 (12), 1705- 1707.
95. Sato, M.; Tatsuno, T.; Matsuo, H., Chemical & Pharmaceutical Bulletin 1970, 18 (9), 1794-1798.
96. Isaacs, N., Physical Organic Chemistry. 2nd ed.; Longman Scientific & Technical: Harlow, 1995; p 287-318.
97. Carpenter, B., Determination o f Organic Reaction Mechanisms. Wiley-Interscience: 1984; p 142-156.
98. Maskill, H., The Physical Basis o f Organic Chemistry. Oxford Science Publications: 1985; p 442-466.
99. Shorter, J., Pure and Applied Chemistry 1995, 67 (5), 835-840.100. Hammett, L. P., Journal o f the American Chemical Society 1937, 59, 96-103.101. Williams, A.; Naylor, R. A., Journal o f the Chemical Society B-Physical Organic
1971, (10), 1967-1972.102. Maskill, H., The Physical Basis o f Organic Chemistry. Oxford Science Publications:
Oxford, 1985; p 202-211.103. Hansen, L. D.; Hepler, L. G., Canadian Journal o f Chemistry 1972, 50 (7), 1030-
1035.104. Hepler, L. G., Canadian Journal o f Chemistry 1971, 49 (17), 2803-2807.105. Linert, W.; Sapunov, V. N., Chemical Physics 1988, 119 (2-3), 265-274.106. Wells, P. R., Chemical Reviews 1963, 63 (2), 171-219.107. Bowden, K., Canadian Journal o f Chemistry 1963, 41 (11), 2781-2793.108. Jaffe, H. H., Chemical Reviews 1953, 53 (2), 191-261.109. Bitterwolf, T. E.; Linder, R. E.; Ling, A. C., Journal o f the Chemical Society B-
Physical Organic 1970, (9), 1673-1674.110. Charton, M., Journal o f Organic Chemistry 1964, 29 (5), 1222-1227.111. Johnson, C. D., The Hammett Equation. Cambridge University Press: Cambridge,
1973; p 144-150.112. Arcoria, A.; Ballistreri, F. P.; Spina, E.; Tomaselli, G. A.; Maccarone, E., Journal o f
the Chemical Society-Perkin Transactions 2 1988, (10), 1793-1798.113. Yukawa, Y.; Tsuno, Y., Bulletin o f the Chemical Society o f Japan 1959, 32 (9), 971 -
981.114. Taft, R. W., Journal o f the American Chemical Society 1952, 74 (12), 3120-3128.115. Swain, C. G.; Lupton, E. C., Journal o f the American Chemical Society 1968, 90 (16),
4328-4337.116. Isaacs, N., Physical Organic Chemistry. 2nd ed.; Longman Scientific & Technical:
Harlow, 1995; p 186-187.117. Lee, I., Chemical Society Reviews 1990, 19 (3), 317-333.118. Lee, I.; Shim, C. S.; Chung, S. Y.; Kim, H. Y.; Lee, H. W., Journal o f the Chemical
Society-Perkin Transactions 2 1988, (11), 1919-1923.119. Sung, D. D.; Jang, H. M.; II Jung, D.; Lee, I., Journal o f Physical Organic Chemistry
2 0 0 8 ,2 / (11), 1014-1019.
55

120. Lee, I.; Sohn, S. C.; Kang, C. H.; Oh, Y. J., Journal o f the Chemical Society-Perkin Transactions 2 1986, (10), 1631-1634.
121. Charton, M., Applications o f Linear Free Energy Relationships to Polycyclcic Arenes and to Heterocyclic Compounds. In Correlation Analysis in Chemistry: Recent Advances, Chapman, N. B.; Shorter, J., Eds. Plenum: New York, 1978; pp 175-268.
122. Jaffe, H. H.; Jones, H. L., Advances in Heterocyclic Chemistry 1964, 3, 209-261.123. Perrin, D. D.; Dempsey, B.; Serjeant, E. P., pK a Prediction fo r Organic Acids and
Bases. Chapman and Hall: London, 1981; p 82-95.124. Lameijer, E. W.; Kok, J. N.; Back, T.; Ijzerman, A. P., Journal o f Chemical
Information and Modeling 2006, 46 (2), 553-562.125. Johnson, C. D., The Hammett Equation. Cambridge University Press: Cambridge,
1973; p 99-103.126. Crugeiras, J.; Rios, A.; Riveiros, E.; Richard, J. P., Journal o f the American Chemical
Society 2011, 133 (9), 3173-3183.127. Laidler, K. J., Chemical Kinetics. 3rd ed.; Harper & Row: New York, 1987; p 39-48.128. Atkins, P. W., The Elements o f Physical Chemistry. 3rd ed.; Oxford University Press:
Oxford, 2001; p 229-237.129. Maskill, H., The Physical Basis o f Organic Chemistry. Oxford Science Publications:
Oxford, 1985; p 247-249.130. Eyring, H., Chemical Reviews 1935, 17 (1), 65-11.131. Laidler, K. J.; King, M. C., Journal o f Physical Chemistry 1983, 87 (15), 2657-2664.132. Maskill, H., The Physical Basis o f Organic Chemistry. Oxford Science Publications:
Oxford, 1985; p 249-261.133. Robertson, R. E., Progress in Physical Organic Chemistry 1967, 4, 213-280.134. Bentley, T. W.; Schleyer, P. v. R., Advances in Physical Organic Chemistry 1977, 14,
1-57.135. Juric, S.; Kronja, O., Journal o f Physical Organic Chemistry 2005, 18 (4), 368-372.136. Blackham, A. U.; Eatough, N. L., Journal o f the American Chemical Society 1962, 84
(15), 2922-2930.137. Carey, F. A.; Sundberg, R. J., Advanced Organic Chemistry. Part A: Structure and
Mechanisms. 5th ed.; Springer: New York, 2007; p 270-285.138. Wassermann, A., Monatshefte Fur Chemie 1952, 83 (2), 543-544.139. Williams, D. H.; Fleming, I., Spectroscopic Methods in Organic Chemistry. 5th ed.;
McGraw-Hill: London, 1995; p 63-169.140. Banwell, C. N.; McCash, E. M., Fundamentals o f Molecular Spectroscopy. 4th ed.;
McGraw-Hill: London, 1994; p 199-256.141. Friebolin, H., Basic One- and Two-Dimensional NMR Spectroscopy. 3rd ed.; Wiley-
VCH: Weinheim, 1998.142. Hore, P. J., Nuclear Magnetic Resonance. Oxford University Press: Oxford, 1995.143. Williams, G.; Maziarz, E. P.; Amyes, T. L.; Wood, T. D.; Richard, J. P., Biochemistry
2003, 42 (27), 8354-8361.144. Matsuo, H.; Kawazoe, Y.; Sato, M.; Ohnishi, M.; Tatsuno, T., Chemical &
Pharmaceutical Bulletin 1970, 18 (9), 1788-1793.145. Yonetani, K.; Hirotsu, Y.; Shiba, T., Bulletin o f the Chemical Society o f Japan 1975,
48 ( 11), 3302-3305.146. Kawazoe, Y.; Ohnishi, M., Chemical & Pharmaceutical Bulletin 1964, 12 (7), 846-
848.147. Williams, D. H.; Fleming, I., Spectroscopic Methods in Organic Chemistry. 5th ed.;
McGraw-Hill: London, 1995; p 170-225.
56

148. Chamey, E., The Molecular Basis o f Optical Activity: Optical Rotary Dispersion and Circular Dichroism. Wiley-Interscience: New York, 1979.
149. Saito, H.; Mori, T.; Origane, Y.; Wada, T.; Inoue, Y., Chirality 2008, 20 (3-4), 278- 281.
150. Yang, S. K., Chirality 1999, 11 (3), 179-186.151. Jensen, F., Introduction to Computational Chemistry. John Wiley & Sons: Chichester,
1999; p 177-194.152. Becke, A. D., Journal o f Chemical Physics 1993, 98 (7), 5648-5652.153. Cramer, C., Essentials o f Computational Chemistry: Theories and Models. John Wiley
and Sons: Chichester, 2002; p 154-168.154. Tomasi, J.; Persico, M., Chemical Reviews 1994, 94 (7), 2027-2094.155. Cossi, M.; Barone, V.; Cammi, R.; Tomasi, J., Chemical Physics Letters 1996, 255 (4-
6), 327-335.
57

2 Database Mining
2.1 Introduction
Our interest in racemisation is primarily from a pharmaceutical perspective. It is therefore
important to have some perspective on the types of compounds, and more specifically the
types of stereogenic centres commonly found in pharmacologically-active compounds. As a
result, a body o f data regarding different functional groups that are found adjacent to a
stereogenic centre in compounds o f interest was obtained and analysed. O f specific interest is
to gather information on which functional groups appear, the frequency at which they are seen,
and the combinations in which they are found. Such information on functional groups will
also make it possible to classify combinations of functional groups as ‘at risk’ of racemisation
(either through base or acid catalysis) and to see the frequency at which such combinations
occur.
AstraZeneca possess large databases o f compounds of different origin. Here, two databases
were examined; the ISAC database, containing details of all compounds registered as of
interest by AstraZeneca over the history of the company and its predecessors; and the IBEX
database, an externally managed database, comprising o f any compounds that appear in the
medicinal chemistry literature. Both databases are very large; ISAC contains over 1 million
compounds and IBEX over half a million. The trends found in such large libraries of
molecules provide insight into which types o f stereogenic centre have been most frequently
investigated as potential drugs and how often these stereogenic centres appear to be4r
configurationally unstable.
The information in the IBEX and ISAC databases is recorded using the SMILES1'8
(Simplified Molecular Input Line Entry Syntax) chemical language. SMILES syntax enables
molecules and reactions to be represented using a series o f ASCII characters. The basic
structure of the language is outlined in the appendix (Section 2.6.1.1).
An important tool in cheminformatics is sub-structure targeting of compounds in molecular
databases to find a desired chemical ‘m o tif. The SMARTS9, 10 (Smiles Arbitrary Target
Specification) chemical language is an extension of SMILES that enables searching for
specific patterns within molecules and was used for that purpose in this chapter. A brief
overview of SMARTS can be found in the experimental (Section 2.6.1.2). SMARTS have
been used in studies filtering out molecules with detrimental ADM ETf properties,11, 12
’ Details o f specific molecules cannot be discussed due to confidentiality agreements.
+ ADMET - Absorption, Distribution, Metabolism, Excretion and Toxicity.
58

nassessing risk o f undesired reactivity between compounds in pooled screening studies,
identifying commonly occurring molecular fragments found in on-the-market drugs14 and
quantifying the effects o f structural changes on pharmaceutical properties.15
2.2 Analysis
2.2.1 'C h iral C h o p p er '
In order to separately classify each substituent bound to a stereogenic centre in each molecule
listed in the databases, it was first necessary to identify each stereogenic centre and separate
the substituents around it. This was achieved using a program developed in-house by
AstraZeneca named ‘Chiral Chopper’. The program analyses a database of SMILES strings
and detects any stereogenic centres within chiral molecules in the database. The program then
performs an operation on the molecule which outputs a SMILES string representing the
molecule divided around the stereogenic centre, with the stereogenic centre replaced by a
Xenon atom. An example of the operation of the ‘Chiral Chopper’ program on a simple
molecule is displayed in Scheme 2.1.
? H Xe------ NH2 Xe------H'Chiral Chopper'
'Chiral Chopper'
NC(C(=0)0)CC > [Xe]N.[Xe]C(=0)0.[Xe]CC.[XeH]
Scheme 2.1: Illustration o f operation of ‘Chiral Chopper’ program on
2-aminobutanoic acid.
The Xenon atom is inserted as a marker for the stereogenic centre, as it allows for recognition
through SMARTS queries. It is now possible to define various types of substituent and
analyse each newly divided molecule to see which substituents are present on the various
stereogenic centres.
2.2.2 C lassifica tion o f S u b s titu e n ts
In order to analyse the substituents on each stereogenic centre in the databases it is necessary
to choose how substituents are to be defined and how specific each definition is to be. For59

example, it might be sufficient to define a substituent simply as an amide but primary and
secondary amides could also be defined differently. The orientation of certain functional
groups with respect to the stereogenic centre may also impact whether the group facilitates
racemisation or not.
The categories of amides and amines were divided into primary, secondary and tertiary. This
is because different substitution patterns can be expected to have different inductive effects.
Also important is the nature o f the substituents. Some amides and amines were classified as
acidic or nonacidic. Amide substituents with a labile proton (Scheme 2.2) will affect an
adjacent stereocentre differently from those where the proton is constantly bound.
Scheme 2.2: Illustration o f acidic secondary amide substituent classification.
If the aromatic group in Scheme 2.2 was to be replaced by an alkyl group the acidic nature of
the amide proton would not be retained. The difference in inductive effects of differently
substituted amides is illustrated by their o\ values (Scheme 2.3), quantifying the electron-
withdrawing nature o f the substituent.
*1= 0.26 0.35 0.17
Scheme 2.3: Inductive effect constants for three different amides.16
Amide substituents which did not fall into either the aromatic (‘acidic’) or alkyl (‘nonacidic’)
were classified in a separate category (amide ‘other’). Tertiary amides and amines were
similarly divided into separate categories dependent on the nature of the groups bound to the
nitrogen atom.
Amine groups were defined in the same manner as amides. Although the proton on a
secondary amine cannot be said to be ‘acidic’ in the same manner as for an amine, the same
terminology has been used. In this instance, the term ‘acidic’ refers to the conjugate acid of
the secondary amine, which will be more acidic if the amine is aromatic substituted rather
than alkyl substituted.
60

The orientation of an amide with respect to the stereogenic centre is also of interest.
Stabilisation o f a carbanion by an amide can occur in a different manner dependent on the
orientation of the amide. If the carbonyl is adjacent, stabilisation occurs through
delocalisation o f charge onto the oxygen. If the nitrogen is adjacent, stabilisation occurs
through electrostatic interactions between the carbanion and the partial positive charge on the
nitrogen (Section 1.4). Amides bound to the stereogenic centre through nitrogen were
therefore categorised separately as ‘reverse amides’, and were also separated into secondary
and tertiary classifications.
Because we are essentially interested in the effects on the stability of a carbanion, aromatic
groups also require subdivision into more specific categories. Initially, categories were
created for five- and six-membered aromatics, with three-, four- and seven-membered groups
categorised in ‘other’. However, it became apparent that most of the aromatic groups fell in
the six-membered category. As a result it was decided to split this group into different types
of aromatic, with benzene and various nitrogen-containing heterocycles classified separately.
The SMARTS output for each stereogenic centre consists of a series of numbers each
corresponding to a different category. The number denotes how many o f the substituents on
the stereogenic centre are classified in that category. For example, 2-aminobutanoic acid
(Scheme 2.1) will return a ‘1’ in the categories of proton, alkyl, primary amine and carboxylic
acid. Every other category will return ‘O’. In order to check that most substituents are
recognised, the sum o f the substituents was calculated and any molecules not adding up to 4
were scrutinised. If necessary the SMARTS query was then modified to be more specific and
run again.
After this iterative process was complete, a total of 52 different categories for substituents
were established. These are listed in Table 2.1. For details on how each was coded, see the
experimental (Section 2.5.1). Many o f these substituents are fairly common, such as protons,
alkyls and halogens. Other less commonly found groups include epoxides, ammonium salts
and thioethers. Numerous very rare groups such as thiols, azides and sulfiniums were grouped
together as ‘other’.
61

Table 2.1: Substituent categories defined in SMARTS query.
Proton
Halogen
Hydroxyl
Alkyl
Alkene
Alkyne
Nitrile
Nitro
Carboxylic acid
Ketone
Ester
‘Reverse’ Ester
Ether
Aromatic ether
Ether anddouble bond
Epoxide
Amides
Primary
Secondary with non-acidic proton
Secondary with acidic proton
Other secondary
Tertiary with two alkyl groups
Tertiary with two aromatic groups
Tertiary with one aromatic, one alkyl group
Other tertiary
‘Reverse’ secondary
‘Reverse’ tertiary
Double bonded amide
Amines Aromatics
Primary Benzene Hydroxylamine
Secondary with non-acidic proton
Ortho pyridine Hydroxamicacid
Secondary with acidic proton Meta pyridine Thioether
Other secondary Para pyridine Imide
Tertiary with two alkyl groups 2,4-pyrimidine Imine
Tertiary with two aromatic groups
2,6-pyrimidine ‘Reverse’imine
Tertiary with one aromatic, one alkyl group
3,5-pyrimidine Quaternaryammonium
Other tertiary 2,3-pyradizine Sulfoxide
3,4-pyradizine Sulfilimine
Pyrazine Isonitrile
Triazine Thiocarbonyl
Other six membered aromatic
Other
Five membered aromatic
62
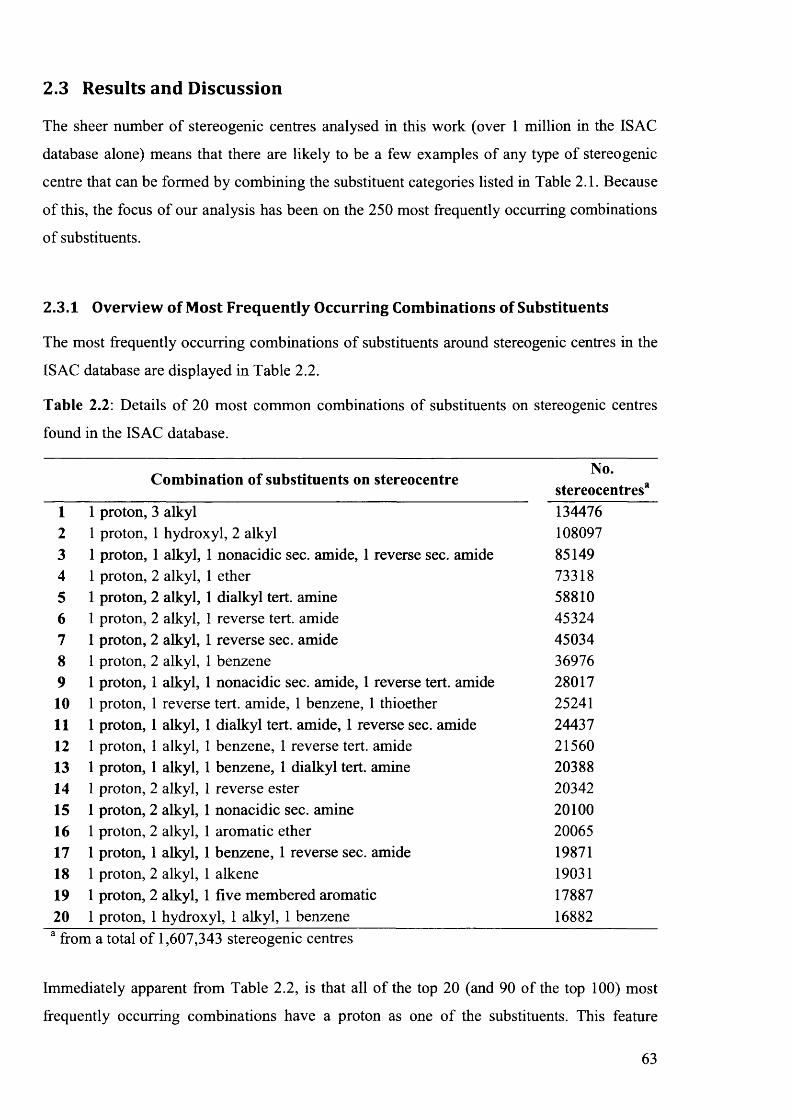
2.3 Results and Discussion
The sheer number of stereogenic centres analysed in this work (over 1 million in the ISAC
database alone) means that there are likely to be a few examples of any type o f stereogenic
centre that can be formed by combining the substituent categories listed in Table 2.1. Because
o f this, the focus o f our analysis has been on the 250 most frequently occurring combinations
o f substituents.
2 .3 .1 O verv iew o f M ost F re q u e n tly O ccu rrin g C o m bina tions of S u b stitu en ts
The most frequently occurring combinations o f substituents around stereogenic centres in the
ISAC database are displayed in Table 2.2.
Table 2.2: Details o f 20 most common combinations of substituents on stereogenic centres
found in the ISAC database.
Combination of substituents on stereocentreNo.
stereocentres81 1 proton, 3 alkyl 1344762 1 proton, 1 hydroxyl, 2 alkyl 1080973 1 proton, 1 alkyl, 1 nonacidic sec. amide, 1 reverse sec. amide 851494 1 proton, 2 alkyl, 1 ether 733185 1 proton, 2 alkyl, 1 dialkyl tert. amine 588106 1 proton, 2 alkyl, 1 reverse tert. amide 453247 1 proton, 2 alkyl, 1 reverse sec. amide 450348 1 proton, 2 alkyl, 1 benzene 369769 1 proton, 1 alkyl, 1 nonacidic sec. amide, 1 reverse tert. amide 2801710 1 proton, 1 reverse tert. amide, 1 benzene, 1 thioether 2524111 1 proton, 1 alkyl, 1 dialkyl tert. amide, 1 reverse sec. amide 2443712 1 proton, 1 alkyl, 1 benzene, 1 reverse tert. amide 2156013 1 proton, 1 alkyl, 1 benzene, 1 dialkyl tert. amine 2038814 1 proton, 2 alkyl, 1 reverse ester 2034215 1 proton, 2 alkyl, 1 nonacidic sec. amine 2010016 1 proton, 2 alkyl, 1 aromatic ether 2006517 1 proton, 1 alkyl, 1 benzene, 1 reverse sec. amide 1987118 1 proton, 2 alkyl, 1 alkene 1903119 1 proton, 2 alkyl, 1 five membered aromatic 1788720 1 proton, 1 hydroxyl, 1 alkyl, 1 benzene 16882a from a total of 1,607,343 stereogenic centres
Immediately apparent from Table 2.2, is that all o f the top 20 (and 90 of the top 100) most
frequently occurring combinations have a proton as one o f the substituents. This feature
63

potentially makes them susceptible to racemisation by proton abstraction by base, as
discussed in Section 1.3. As a result it becomes important to assess whether other substituents
on these stereogenic centres can stabilise a negative charge, as the ability to do so will make
the stereogenic centre more vulnerable to racemisation through the SeI and Se2 mechanisms
(Section 1.3).
All bar one of the combinations displayed in Table 2.2 have at least one alkyl substituent.
Alkyl substituents were defined by Testa et a /.17"19 (Table 1.1) as being neutral towards
stabilising a carbanion. Stereocentres with a neutral substituent are thought to require two
other acid-strengthening groups, one strongly so, in order for configurational instability to be
of pharmaceutical or pharmacological significance. The strongly acid-strengthening groups
designated in Table 1.1 are ester and aryl ketone groups, which none of the combinations in
Table 2.2 contain. As a result, by the definitions in Table 1.1, none o f the most frequent
occurring stereogenic ‘m otifs’ would be anticipated to be configurationally unstable. Similar
conclusions can be drawn from the results o f the IBEX database, illustrated in the Appendix
to the Chapter (Section 2.6). This conclusion is perhaps a reassuring one, although it may also
be a self-fulfilling prophecy if compounds thought or found to be unstable have been avoided.
It is preferable that all stereocentres in chiral drug molecules retain configuration to avoid the
potentially disastrous consequences discussed in Section 1.1. However, although these very
frequently occurring combinations do not appear to be at risk, looking further down the lists
examples o f stereogenic centres which are at risk of configurational instability start to appear.
2.3.2 A nalysis o f M ost F re q u e n tly O ccurring 'At R isk ' C om binations o f
S u b s titu e n ts
The top 250 most frequently occurring combinations from the ISAC database were analysed
and classified as either at risk from base-catalysed racemisation, acid-catalysed racemisation,
not at risk or unknown. Table 2.3 shows how many combinations of substituents around a
stereogenic centre fell into each risk category.
Table 2.3: Number o f combinations o f substituents in each classification of racemisation risk,
from top 250 most frequently occurring combinations from the ISAC database.
Type of risk
Not at risk Base-catalysed Acid-catalysed Unknown
188 38 10 14
64

As seen in several examples in Chapter 1,20-22 molecules with an alcohol group bound to the
stereogenic centre can be susceptible to acid-catalysed racemisation via protonation of the
alcohol followed by dehydration then rehydration, as illustrated in Scheme 1.18. O f the top
250 combinations there were 10 which are potentially susceptible to acid catalysed
racemisation, corresponding to 30,517 individual stereogenic centres (Appendix Table 2.8).
Many more fit the criteria outlined in Table 1.1 which may make them susceptible to base-
catalysed racemisation through proton abstraction. O f the top 250 combinations, 38 are
classified as susceptible to base-catalysed racemisation (78,360 stereogenic centres) and are
displayed in Table 2.4 (overleaf). Combinations with one or more substituent with an
unknown effect on configurational stability (from Table 1.1 and chemical intuition) such as a
thioether substituent, are classified as o f ‘unknown’ risk (appendix Table 2.9).
Table 2.4 illustrates that many molecules investigated as potential drugs contain scaffolds
with stereogenic centres that are potentially unstable under physiological conditions. Table
2.4 shows that many o f the combinations thought at risk o f racemisation through base
catalysis contain a carbonyl adjacent to the stereogenic centre. A carbonyl can stabilise a
carbanion through delocalisation of charge onto the oxygen and facilitate racemisation, as
discussed in Section 1.4.
Also frequently appearing in Table 2.4 are variously-substituted amine and amide groups
bonded to the stereogenic centre through nitrogen. Both are designated in Table 1.1 as
decreasing configurational stability suggesting that both groups will stabilise an adjacent
carbanion. This is due to the formal or partial positive charge on the nitrogen and the
stabilising effect this will have on an adjacent carbanion (Section 1.4).
Table 2.4 shows that a combination o f an adjacent carbonyl-containing group with an amine
or amide bound through nitrogen is found 17 times within the top 250 most common
combinations. Within these 17 different combinations, breakdown of the adjacent carbonyl
groups shows that 6 are ester groups, 9 are amide groups and 2 are ketones. O f the adjacent
nitrogen containing groups, 11 are amides and 7 are amines. These results are summarised in
Table 2.5 (page 67).
65

Table 2.4: Details of all combinations of substituents within the most common 250 in ISAC,
considered at risk o f base-catalysed racemisation
C om bination of substituents on stereocentre, excluding protonNo.
stereocentres329 1 alkyl, 1 ester, 1 reverse sec. amide 1162835 1 benzene, 1 nonacidic sec. amide, 1 reverse tert. amide 862240 1 benzene, 1 reverse sec. amide, 1 reverse tert. amide 712555 1 benzene, 2 alkene 486157 1 alkyl, 1 ester, 1 reverse tert. amide 461860 2 benzene, 1 dialkyl tert. amine 431967 1 alkyl, 1 ester, 1 dialkyl tert. amine 341970 1 alkyl, 1 ketone, 1 reverse sec. amide 338798 1 alkyl and aromatic sub. tert. amide, 1 reverse sec. amide, 1 imine 2143102 1 alkyl, 1 ketone, 1 ester 2013103 1 benzene, 1 five membered aromatic, 1 dialkyl tert. amine 1980106 1 five membered aromatic, 1 nonacidic sec. amide, 1 reverse tert. amide 1885130 1 alkyl and aromatic sub. tert. amide, 1 imine, 1 sec. amine (other) 1483138 1 alkyl, 1 ester, 1 nonacidic sec. amine 1383141 1 alkyl, 1 ester, 1 ether 1374164 1 alkyl, 2 ketone 1132166 1 para pyridine, 1 nonacidic sec. amide, 1 reverse tert. amide 1117170 1 meta pyridine, 1 alkyl, 1 reverse tert. amide 1067176 1 benzene, 1 acidic sec. amide, 1 reverse tert. amide 1040179 1 benzene, 1 reverse sec. amide, 1 tert. amine (other) 984185 1 alkyl, 1 benzene, 1 ester 920188 1 alkyl, 1 ester, 1 prim, amine 904190 1 benzene, 1 five membered aromatic, 1 nonacidic sec. amine 900191 1 benzene, 1 alkyl and aromatic sub. tert. amide, 1 reverse tert. amide 899192 1 nonacidic sec. amide, 1 reverse sec. amide 897199 1 alkyl, 1 benzene , 1 ketone 816210 1 benzene, 1 reverse tert. amide, 1 dialkyl tert. amine 756215 1 five membered aromatic, 2 alkenes 699217 2 benzene, 1 reverse sec. amide 666221 1 hydroxyl, 1 alkyl, 1 ester 645226 1 benzene, 1 acidic sec. amide, 1 reverse sec. amide 627230 1 meta pyridine, 1 five membered aromatic, 1 dialkyl tert. amine 611234 1 alkyl, 1 ester, 1 sec. amine (other) 603237 1 alkyl, 1 benzene , 1 halogen 594241 2 benzene, 1 reverse tert. amide 580244 1 alkyl, 1 ketone, 1 dialkyl tert. amine 561246 1 benzene, 1 alkene, 1 reverse tert. amide 559250 1 alkyl, 1 alkene, 1 ketone 543
a from a total of 1,607,343 stereogenic centres
66
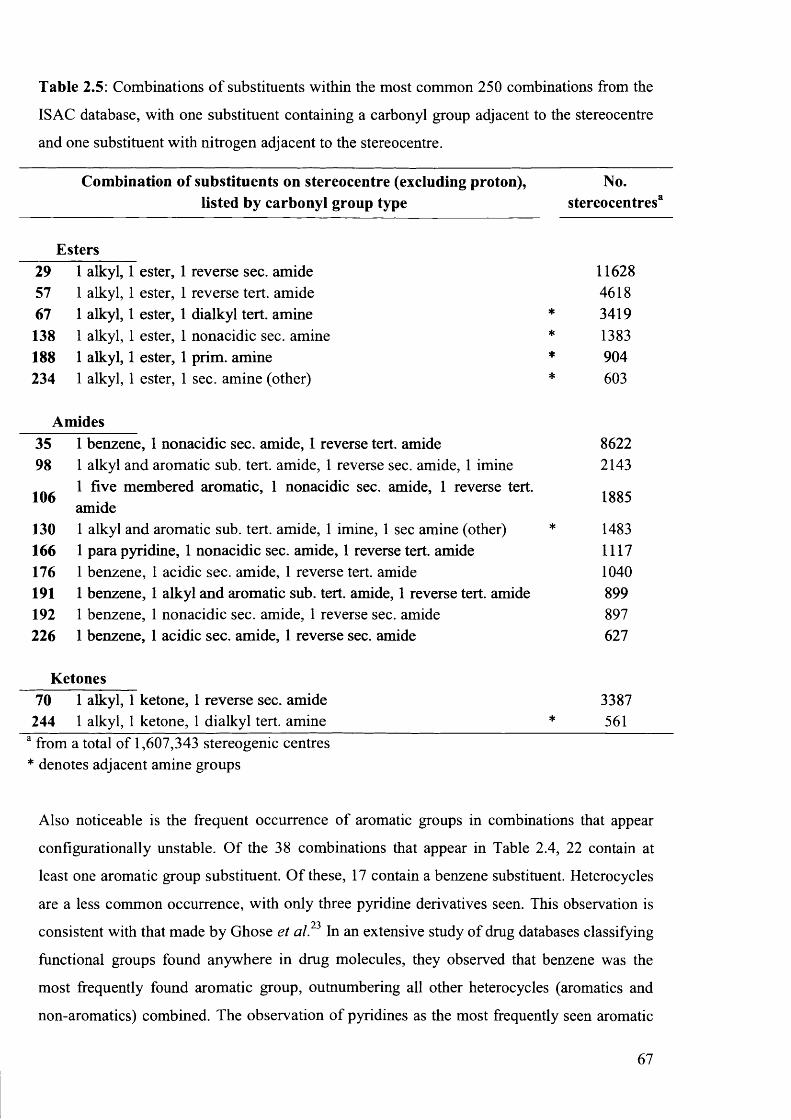
Table 2.5: Combinations o f substituents within the most common 250 combinations from the
ISAC database, with one substituent containing a carbonyl group adjacent to the stereocentre
and one substituent with nitrogen adjacent to the stereocentre.
Combination of substituents on stereocentre (excluding proton), No.listed by carbonyl group type stereocentres3
Esters29 1 alkyl, 1 ester, 1 reverse sec. amide 1162857 1 alkyl, 1 ester, 1 reverse tert. amide 461867 1 alkyl, 1 ester, 1 dialkyl tert. amine * 3419138 1 alkyl, 1 ester, 1 nonacidic sec. amine * 1383188 1 alkyl, 1 ester, 1 prim, amine * 904234 1 alkyl, 1 ester, 1 sec. amine (other) * 603
Amides35 1 benzene, 1 nonacidic sec. amide, 1 reverse tert. amide 862298 1 alkyl and aromatic sub. tert. amide, 1 reverse sec. amide, 1 imine 2143
1061 five membered aromatic, 1 nonacidic sec. amide, 1 reverse tert. amide
1885
130 1 alkyl and aromatic sub. tert. amide, 1 imine, 1 sec amine (other) * 1483166 1 para pyridine, 1 nonacidic sec. amide, 1 reverse tert. amide 1117176 1 benzene, 1 acidic sec. amide, 1 reverse tert. amide 1040191 1 benzene, 1 alkyl and aromatic sub. tert. amide, 1 reverse tert. amide 899192 1 benzene, 1 nonacidic sec. amide, 1 reverse sec. amide 897226 1 benzene, 1 acidic sec. amide, 1 reverse sec. amide 627
Ketones70 1 alkyl, 1 ketone, 1 reverse sec. amide 3387
244 1 alkyl, 1 ketone, 1 dialkyl tert. amine * 561a from a total of 1,607,343 stereogenic centres * denotes adjacent amine groups
Also noticeable is the frequent occurrence o f aromatic groups in combinations that appear
configurationally unstable. O f the 38 combinations that appear in Table 2.4, 22 contain at
least one aromatic group substituent. O f these, 17 contain a benzene substituent. Heterocycles
are a less common occurrence, with only three pyridine derivatives seen. This observation is23consistent with that made by Ghose et al. In an extensive study o f drug databases classifying
functional groups found anywhere in drug molecules, they observed that benzene was the
most frequently found aromatic group, outnumbering all other heterocycles (aromatics and
non-aromatics) combined. The observation o f pyridines as the most frequently seen aromatic
67

group after benzene is consistent with the observations of Lameijer et al.24 in their analysis of
the database o f the National Cancer Institute.
Analysis of the data from the IBEX database was carried out in the same manner as for the
ISAC database. As in the ISAC database, none of the 20 most frequently occurring
combinations o f substituents on a stereogenic centre in the IBEX appear susceptible to base-
catalysed racemisation (Table 2.10). Risk-of-racemisation assessment of the top 250 most
frequently occurring combinations are shown in Table 2.6.
Table 2.6: Number o f combinations o f substituents in each classification of racemisation risk,
from top 250 most frequently occurring combinations from the IBEX database.
Type of risk
Not at risk Base-catalysed Acid-catalysed Unknown
193 22 16 19
Although the number o f combinations deemed not at risk in Table 2.6 is approximately the
same as for the ISAC database, the number deemed at risk o f base-catalysed racemisation is
much lower and the numbers in the other two risk categories slightly higher. The manner in
which the two databases are compiled suggests potential explanations for this difference. The
ISAC database is comprised o f any compound that has ever been of interest AZ (or its
precursor companies), as opposed to IBEX which only contains compounds that have
appeared in the medicinal chemistry literature. The discretionary nature of compound
registration into the ISAC database may have resulted in some entries being far removed from
the types o f compound which generally end up making it into literature. It may also be the
case that other organisations are developing drugs for different illnesses than AstraZeneca,
and so the types o f molecules required may be completely different. Alternatively, other
organisations maybe approaching the same diseases but with a completely different solution.
The combination of a carbonyl substituent with a nitrogen-adjacent substituent (as outlined in
Table 2.5 for the ISAC database) occurs often in the IBEX database (Table 2.12). The
frequent occurrence o f benzene groups in the ISAC database is also seen in the IBEX
database. This is illustrated in Table 2.11, where all the aromatic groups found in
combinations susceptible to base-catalysed racemisation are benzene rings.
68

2.4 Conclusions
The results from this chapter allow three main conclusions to be drawn.
Primarily, the vast majority o f the stereogenic centres analysed have one proton substituent.
This illustrates the importance o f understanding the factors required for proton abstraction by
base to occur and which substituents promote and supress it.
Secondly, following the definitions from Table 1.1, the vast majority of stereogenic centres
found in the compounds investigated are not at risk from base-catalysed racemisation via
proton abstraction. This is largely due to the presence on most stereogenic centres of an alkyl
substituent which is unable to stabilise a negative charge.
Finally, of those frequently observed combinations of substituents on a stereogenic centre
which do appear susceptible to racemisation, adjacent carbonyl, nitrogen and aromatic groups
are commonly found. As a result the experimental studies that will follow this chapter were
based around the following scaffold (Scheme 2.4).
X = O R , N H R
Scheme 2.4: Compounds to be investigated in Chapters 3 and 4.
69

2.5 Experimental
2.5.1 SMARTS Used for Analysis of Substituents
The SMARTS syntax used for substituent analysis is shown below. The recursive SMARTS
definitions called upon in several categories are shown after the category definitions.
PROTON [XeHl] 1 1HYDROXYL [Xe][OHl] 1 1HALOGEN [Xe][F,Cl,Br,I] 1 1ALKYL [Xe][CX4] 1 1ALKENE [Xe]C=[C,c] 1 1ALKYNE [Xe]C#C 1 1NITRILE [Xe]C#N 1 1NITRO [Xe]N (=0)(=0) 1 1CARBOXYLIC_ACID [Xe]C(=0)[ODl] 1 1KETONE [Xe]C(=0)[C,c] 1 1ESTER [Xe]C(=0)[0D2][A,a] 1 1REVERSE_ESTER [Xe][0D2][$CARBONYL] 1 1ETHER [Xe][0D2][CX4;!$C_NEXT_TO_CHIRAL] 1 1AROMATIC_ETHER [Xe][0D2][c] 1 1ETHER_DB [Xe] [0D2][$ALKENE_DEF,$ALK_ETHER_N_DEF,$ALK_ETHER_S_DEF] 1 1 EPOXIDE [Xe][0D2][$C_NEXT_TO_CHIRAL] 1 1 PRIM_AMIDE [Xe]C(=0)[ND1] 1 1S E C_AMIDE_NONACIDIC [Xe]C (=0) [ND2] [$ALKYL_DEF] 1 1 SEC_AMIDE_ACIDIC [Xe]C(=0) [ND2] [$CARBONYL,$AROMATI C_DEF] 1 1 SEC_AMIDE_OTHER [Xe]C(=0)[ND2][!$SEC_AMIDE_OTHER_DEF] 1 1 TERT_AMIDE_DIALKYL [Xe]C (=0) [ND3] ( [$ALKYL_DEF] ) [$ALKYL_DEF] 1 1 TERT_AMIDE_DIAROMATIC [X e ]C (=0)[ND3]([$AROMATIC_DEF])[$AROMATIC_DEF] 1 1 TERT_AMIDE_ALKYL_AROMATIC [Xe]C (=0) [ND3] ( [$ALKYL_DEF] ) [$AROMATIC_DEF] 1 1 TERT_AMIDE_OTHER[Xe] [$TERT_AROMATIC_AMIDE_DEF, $TERT_AMIDE_OTHER_DEF, $TERT_AMIDE_ALKYL_OTHER _DEF,$TERT_AMIDE_AROMATIC_OTHER_DEF] 1 1 REVERSE_SEC_AMIDE [Xe][ND2][$CARBONYL] 1 1REVERSE_TERT_AMIDE [Xe] [ND3] ( [A,a; !$CARBONYL]) [$CARBONYL] 1 1 AMIDE_DB [Xe][$CARBONYL]N=[A,a] 1 1 PRIM_AMINE [Xe][NDl] 1 1SEC_AMINE_NONACIDIC [Xe][ND2] [$ALKYL_DEF] 1 1 SEC_AMINE_ACIDIC [Xe] [ND2][$AROMATIC_DEF;!$CARBONYL] 1 1SEC_AMINE_OTHER [Xe] [ND2][!$AROMATIC_DEF;!$CARBONYL;!$ALKYL_DEF] 1 1 TERT_AMINE_DIALKYL [Xe] [ND3]([$ALKYL_DEF])[$ALKYL_DEF] 1 1 TERT_AMINE_ALKYL_AROMATIC [Xe] [ND3]([$ALKYL_DEF])[$AROMATIC_DEF] 1 1 TERT AMINE DIAROMATIC [Xe] [ND3]([$AROMATIC DEF]) [$AROMATIC DEF] 1 1
70

TERT_AMINE_OTHER[$TERT_AMINE_OTHER_DEF,$ TERT_AMINE_ALKYL_OTHER_DEF,$TERT_AMINE_AROMATIC_OTH ER_DEF] 1 1BENZENE [Xe]clcccccl 1 1 PYRIDINE_ORTH [Xejclnccccl 1 1 PYRIDINE_META [Xe]clcncccl 1 1 PYRIDINE_PARA [Xe]clccnccl 1 1 PYRIMIDINE_2_6 [Xe]clncccnl 1 1 PYRIMIDINE_2_4 [Xe]clncnccl 1 1 PYRIMIDINE_3_5 [Xe]clcncncl 1 1 PYRADIZINE_2_3 [Xe]clnncccl 1 1 PYRADIZINE_3_4 [Xe]clcnnccl 1 1 PYRAZINE [Xe]clnccncl 1 1 TRIAZINE [Xe]clncncnl 1 1 SIX_MEMBERE D_GENERAL[$SIX_MEMBERED_GENERAL_DEF; !$BENZENE; !$TRIAZINE; !$PYRADIZINE_3_4; !$PYRADIZI NE_2_3; !$PYRAZINE; !$PYRIMIDINE_3_5; !$PYRIMIDINE_2_4 ; !$PYRIMIDINE_2_6; !$PYRI DINE_PARA;!$PYRIDINE_META;!$PYRIDINE_ORTH] 1 1 FIVE_MEM_AROMATIC [Xe] [ $FIVE_MEMBERED_AROMATIC_DEF] 1 1 0_HYDR0XYLAMINE [Xe] [0D2] [N,n] 1 1IMIDE [Xe][ND3]([$CARBONYL])[$CARBONYL] 1 1 IMINE [Xe][ND2]= [CX3,c] 1 1 REVERSE__ IMINE [Xe]C=[N+0] 1 1HYDR0XAMIC_ACID [Xe]C(=0) [ND2] [OD1] 1 1QUAT_AMMONIUM [Xe][NX4 ; !$QA_DEF] 1 1 SULFOXIDE [Xe]=0 1 1 SULFILIMINE [Xe]=N 1 1 THIOETHER [Xe][SD2]-[A , a ] 1 1ISONITRILE [Xe][$IS0NITRILE_1DEF,$IS0NITRILE_2DEF] 1 1THIOCARBONYL [Xe]C=[SDl] 1 1OTHER[ $OTHER_ATOM, $N3, $N_C_OS, $NN_DB, $THIOESTER, $ACID_CHLORIDE, $ALDEHYDE, $PHOSPH OROUS_DERIV, $THIOL, $ETHER_OTHER, $S_N_DB, $OXOIMINIUM, $ASULFINIUM, $SULFINIUM, $ I MINIUM, $REV_IMINIUM, $THREE_MEM_RING, $FOUR_MEM_RING, $SULFUR_OXIDE_DEF, $SEV EN_MEM_RING] 1 1
CARBONYL C(=0) 1 0C_NEXT_TO_CHIRAL C[Xe] 1 0 ALKENE_DEF C=C 1 0 ALK_ETHER_N_DEF C=N 1 0 ALK_ETHER_S_DEF C=S 1 0 ALKYL DEF [CX4] 1 0
71

FIVE_MEMBERED_AROMATIC_DEF alaaaal 1 0 SIX_MEMBERED_AROMATIC_DEF alaaaaal 1 0AROMATIC_DEF [ $FIVE_MEMBERED_AROMATIC_DEF, $SIX_MEMBERED_AROMATIC_DEF] 1 0 SEC_AMIDE_OTHER_DEF [$CARBONYL,$AROMATIC_DEF,$ALKYL_DEF, ODl ] 1 0TERT_AMIDE_OTHER_DEFC (=0)[ND3]([!$AROMATIC_DEF;!$ALKYL_DEF])[!$AROMATIC_DEF;!$ALKYL_DEF] 1 0 TERT_AMIDE_ALKYL_OTHER_DEFC (=0) [ND3] ( [$ALKYL_DEF] ) [!$AROMATIC_DEF; !$ALKYL_DEF] 1 0 TERT_AMIDE_AROMATIC_OTHER_DEFC (=0) [ND3] ([$AROMATIC_DEF] ) [!$AROMATIC_DEF; !$ALKYL_DEF] 1 0TERT_AROMATIC_AMIDE_DEF C (=0)n 1 0TERT_AMINE_OTHER_DEF[Xe] [ND3] ([!$AROMATIC_DEF; !$ALKYL_DEF; !$CARBONYL]) [!$AROMATIC_DEF; !$ALKYL EF;!$CARBONYL] 1 0 TERT_AMINE_ALKYL_OTHER_DEF[Xe] [ND3] ( [$ALKYL_DEF] ) [!$AROMATIC_DEF; !$CARBONYL; !$ALKYL_DEF] 1 0 TERT_AMINE_AROMATIC_OTHER_DEF[Xe] [ND3] ([$AROMATIC_DEF] ) [!$AROMATIC_DEF; !$ALKYL_DEF; !$CARBONYL] 1 0SIX_MEMBERED_GENERAL_DEF [Xe]alaaaaal 1 0QA_DEF [NH2;D2]=C 1 0IS0NITRILE_1DEF [N+]#C 1 0IS0NITRILE_2DEF N=[CDl;HO] 1 0ETHER_0THER [X e ][0 D 2 ][1C ;!c ;!N ;!n ] 1 0THIOL [Xe][SHI] 1 0SULFUR_OXIDE_DEF [Xe]S(=0) 1 0SEVEN_MEM_RING [Xe]alaaaaaal 1 0FOUR_MEM_RING [Xe]alaaal 1 0THREE_MEM_RING [Xe]alaal 1 0IMINIUM [Xe]C=[N+l] 1 0REV_IMINIUM [Xe] [N+l]=C 1 0SULFINIUM [Xe][SHI]=A 1 0ASULFINIUM [Xe]C=[SHl;D2] 1 0OXOIMINIUM [Xe]N (=0)=C 1 0S_N_DB [X e ]S=N 1 0PHOSPHOROUS_DERIV [Xe]P 1 0ALDEHYDE [Xe][CD2]=0 1 0ACID_CHLORIDE [X e ][$CARBONYL][C l ,F] 1 0THIOESTER [Xe][$CARBONYL]S 1 0NN_DB [Xe]N=[N+0] 1 0N3 [X e ]N=[N+1]=[N - 1] 1 0N_C_OS [Xe]N=C=[0,S] 1 0OTHER ATOM [X e ] [Se, N a ,B ,Sn,Si,A s ] 1 0

2.5.2 SMARTS Queries
The definitions in the SMARTS code shown in Section 2.5.1 were used to interpret the
SMILES strings from the AZ databases after processing using the ‘chiral chopper’ program
atom and, as can be seen in the SMARTS code, this is used to identify the location of the
stereogenic centre within each substituent.
The use of recursive SMARTS is well illustrated by the category ‘other six-membered
aromatic’. This category contains all six-membered aromatic groups other than benzene and
the nitrogen-containing heterocycles displayed in Table 2.1. After initial SMARTS were
written for each o f these aromatics, a ‘catch all’ six-membered aromatic definition was
written:
SIX_MEMBERED_GENERAL_DEF [Xe]alaaaaal 1 0
A SMARTS definition was then written for ‘other six-membered aromatic’, which looks for
SMILES strings which fit the definition of a six-membered aromatic group but are not any of
the specific groups defined previously (benzene, pyridines etc.):
SIX_MEMBERED_GENERAL[$SIX_MEMBERED_GENERAL_DEF; !$BENZENE; !$TRIAZINE; !$PYRADIZINE_3_4 ; !$PYRADIZI NE_2_3;!$PYRAZINE;!$PYRIMIDINE_3_5;!$PYRIMIDINE_2_4;!$PYRIMIDINE_2_6;!$PYRI DINE_PARA;!$PYRIDINE_META;!$PYRIDINE_ORTH] 1 1
Similar examples o f recursive SMARTS were used in the definitions for differently
substituted amide groups, as well as the ‘other’ category.
The ‘chiral chopper’ program also recognises the chirality found on sulphur atoms in
sulfoxide and sulfilimine functional groups, on account of the sulphur lone pair (Scheme 2.5).
Scheme 2.5: Chirality in sulfoxide and sulfilimine functional groups.
When the ‘chiral chopper’ program encounters molecules containing these functional groups,
it results in SMILES denoting a Xenon atom double bonded to either an oxygen (sulfoxide) or
a nitrogen (sulfilimine). Therefore, when analysing the output of the SMARTS query it has to
be taken into account that SMILES strings for these molecules will only have three
substituents.
(Section 2.2.1). The stereogenic centre in each molecule is replaced by a ‘marker’ Xenon
• • • •
R R'
R"N
R
\
Sulfoxide Sulfilimine
73
2.5.3 SMARTS Output
The output from the SMARTS query consists of a large .txt file with a molecule number for
every compound listed in the database queried followed by a series o f numbers,
corresponding to each of the 52 categories o f substituent tested for and how many instances o f
that group the compound contains. In order to check that the SMARTS code was recognising
every substituent as one of the designated categories, the sum of the substituents was
calculated for each molecule. If every substituent of a molecule has been categorised the sum
is equal to 4, except in cases where the stereogenic centre is not a carbon atom such as
sulfoxides and sulfilimines (Section 2.5.2). This worked as an iterative process; the SMARTS
output was analysed for cases where the sum of the groups was more or less than four and the
structure of the original molecule was analysed. The SMARTS code was then rewritten to
either ‘tighten up’ certain definitions (so it did not record substituents in more than one
category) or new functional groups were coded for (either as a stand-alone category or to be
classified as ‘other’).
Each stereogenic centre in the SMARTS output was given an identifier code, produced by
stringing together the series of numbers corresponding to each substituent category. This
results in all stereogenic centres with the same combinations of substituents having the same
identifying code. The number o f stereogenic centres bearing each combination of substituents
could then be totalled.
The most frequently occurring combinations of substituents were then analysed, and using
chemical intuition and the guidelines set by Testa et al. (Table 1.1) assessed for susceptibility
to acid- or base-catalysed racemisation.
74

2.6 Appendix
2.6.1 E x p lan a tio n o f Syntax Used
2.6.1.1 SMILES
The information in the ISAC and IBEX databases is recorded using the SMILES1'8
(Simplified Molecular Input Line Entry Syntax) chemical language. Using SMILES,
molecules and reactions can be represented using a series of ASCII characters. The basic
structure o f the language is as follows:
• Atoms within a molecule are represented by their atomic symbol inside square
brackets.
• For elements within the ‘organic subset’ (Boron, Nitrogen, Carbon, Oxygen,
Phosphorous, Sulphur and the halogens), the square brackets are not necessary if the
number of hydrogens conforms to the lowest normal valence.
• W ithin square brackets, any attached hydrogens or formal charge must be specified.
• Aromaticity is signified by lowercase lettering.
• Bonds are assumed to be single unless specified otherwise. Molecular branches can be
specified by enclosure within parentheses.
• Cyclic structures are represented by assigning a number to an atom and then referring
back to it.
• Chirality is indicated by either @ or @ @ designation of stereogenic centre.
Some examples o f simple molecules represented by SMILES syntax are shown in Table 2.7.
75

Table 2.7: Examples of SMILES syntax.
Compound name Graphical Depiction SMILES notation
Propane
Propan-1 -ol
Propanoic acid
OH
,O H
ccc
ccco
C C C (=0)0o
Cyclohexane C1CCCCC1
Benzene
Pyrazine
Cis-2-butene
L-Phenylglycine
N
N
O
OH
clcccccl
clnccncl
C\C=C/C
N[C@@H](clcccccl)C(=0)0
Sodium Chloride NaCI [Na+].[Cl-
76

2.6.1.2 SMARTS
The SMARTS9,10 (Smiles Arbitrary Target Specification) chemical language is an extension
of SMILES that enables sub-structure targeting o f compounds in molecular databases to find
a desired chemical ‘m otif. All SMILES characters and properties are valid terms in
SMARTS, which also includes logical operators (such as ‘and’, ‘or’ and ‘not’). This allows
queries to be made with the desired level o f specificity. For example, using SMILES, methane
can be written as C or [CH4 ]. A SMARTS search of C would result in a match for methane,
but would also match for ethane, propane, or any compound in the database containing an
aliphatic carbon. A SMARTS search o f [CH4] would match only for methane. If one
wanted to search for carbonyl containing compounds, the following SMARTS searches would
give varying results:
• C=0 would return molecules containing a carbonyl (ketone, amide, etc.)
• CC (= 0) C would only return ketones
• CC (=0) O would return all esters and carboxylic acids
• CC (=0) OC would only return esters
Some other important features of SMARTS are described below:
• “a” is any aromatic atom, “A” is any aliphatic
• “D” is any heavy atom (i.e. not hydrogen)
o E.g. [ 0D2 ] is oxygen bonded to any two heavy atoms
• “ #” can be used to define any atom of a specified atomic number
o E.g. [ #7 ] is any aromatic or aliphatic nitrogen
• “ ! ” is the “not” logical operator
o E.g. [ ! C ] is any atom that is not an aliphatic carbon
• “ , ” is the “or” logical operator
o E.g. [ 0 , N ] is any atom that is an aliphatic oxygen or carbon
• “ &” and “ ; ” are both “and” logical operators. “ &” is higher precedence than the “or”
operator (“ , ”), “ ; ” is lower precedence than “or”. High precedence “and” is the
default operator and may be omitted.
o [ C & + 1 , + 0 ] is an aliphatic carbon with +1 charge or any neutral atom
77

o [ C ; + 1 , + 0 ] is an aliphatic carbon with +1 or neutral charge
The examples below show the range o f specificity possible with SMARTS.
Aliphatic oxygen attached to carbon with any bond:
■ O O
Oxygen or nitrogen, with at least one hydrogen attached and not in a ring:
■ [0,N;!H0;!R]
Oxygen double bonded to aliphatic carbon or nitrogen:
■ [0] = [C,N] or [#6] = [C,N]
Oxygen double bonded to aliphatic carbon or nitrogen, single bonded to an aromatic ring,
with a halogen in meta position:
■ [#6] = [C,N]-aaa[F,Cl,Br, I]
It is also possible to define SMARTS and then refer back to them. So-called recursive
SMARTS are used to define an atomic environment which can be called upon using the
S symbol. In the following example, a carbonyl group is defined and then referred back to
when searching for a primary amide group:
CARBONYL_DEF C (=0) 1 0
PRIM_AMIDE [$CARBONYL_DEF] [ND1] 1 1
Recursive SMARTS were used in writing the search criteria for the analysis in this chapter.
The numbers after the definition determine whether the SMARTS desire output or not. ‘1 O’ after SMARTS code is used when something is defined to be called upon later and does not
give any output. ‘1 1’ after SMARTS code instructs the program to output whether the
SMARTS have been found or not. It does this in the form of a ‘ 1 ’ for yes, ‘O’ for no.
78

2.6.2 Data Tables
Table 2.8: Details of all combinations of substituents within the most common 250 in ISAC,
considered at risk of acid-catalysed racemisation.
Combination of substituents on stereocentreNo.
stereocentres3
20 1 proton, 1 hydroxyl, 1 benzene, 1 alkyl 1688272 1 hydroxyl, 1 benzene, 2 alkyl 329177 1 proton, 1 hydroxyl, 1 alkyl, 1 alkene 2866115 1 hydroxyl, 2 benzene, 1 alkyl 1717127 1 hydroxyl, 2 benzene, 1 alkyl and aromatic sub. tert. amide 1502134 1 proton, 1 hydroxyl, 1 five-membered aromatic, 1 alkyl 1398196 1 proton, 1 hydroxyl, 1 benzene, 1 dialkyl tert. amide 861203 1 proton, 1 hydroxyl, 1 benzene, 1 five-membered aromatic 795219 1 hydroxyl, 1 benzene, 1 alkyl, 1 dialkyl tert. amide 661249 1 proton, 1 hydroxyl, 1 alkyl, 1 ether 544a from a total of 1,607,343 stereogenic centres
Table 2.9: Details o f all combinations of substituents within the most common 250 in ISAC,
with unknown risk o f racemisation.
Combination of substituents on stereocentreNo.
stereocentres3
10 1 proton, 1 benzene, 1 reverse tert. amide, 1 thioether 2524133 1 proton, 1 alkyl, 1 dialkyl tert. amide, 1 thioether 963139 1 proton, 2 alkyl, 1 thioether 728653 1 proton, 2 alkyl, 1 other 521561 1 proton, 1 alkyl, 1 reverse tert. amide, 1 thioether 415262 1 proton, 1 benzene, 1 alkyl, 1 thioether 414089 1 proton, 2 alkyl, 1 epoxide 2426186 1 proton, 1 alkyl, 1 ester, 1 thioether 913200 1 proton, 1 alkyl, 1 nitrile, 1 reverse sec. amide 814208 1 proton, 1 five-membered aromatic, 1 nitrile, 1 reverse sec. amide 768224 1 proton, 1 alkyl, 1 ester, 1 other 639225 chiral sulfoxide, 1 hydroxyl, 1 ether 631229 1 proton, 1 benzene, 1 meta pyridine, 1 ether 613245 1 proton, 1 meta pyridine, 1 alkyl, 1 ether 561a from a total of 1,607,343 stereogenic centres
79

Table 2.10: Details of 20 most common combinations of substituents on stereogenic centres
found in IBEX database.
Combination of substituents on stereocentreNo.
stereocentres3
1 1 proton, 3 alkyl 1078202 1 proton, 1 hydroxyl, 2 alkyl 762133 1 proton, 2 alkyl, 1 dialkyl tert. amine 599254 1 proton, 2 alkyl, 1 benzene 371185 1 proton, 2 alkyl, 1 ether 355576 1 proton, 2 alkyl, 1 reverse sec. amide 353987 1 proton, 2 alkyl, 1 nonacidic sec. amine 309638 1 proton, 2 alkyl, 1 reverse tert. amide 268339 1 proton, 1 alkyl, 1 nonacidic sec. amide, 1 reverse sec. amide 1469610 1 proton, 2 alkyl, 1 aromatic ether 1450511 1 proton, 2 alkyl, 1 five membered aromatic 1337912 1 proton, 1 hydroxyl, 1 alkyl, 1 benzene 1300513 1 proton, 2 alkyl, 1 prim, amine 1287014 1 proton, 1 alkyl, 1 benzene, 1 reverse sec. amide 1062315 1 proton, 2 alkyl, 1 reverse ester 1060116 3 alkyl, 1 benzene 1039217 1 proton, 1 alkyl, 1 benzene, 1 dialkyl tert. amine 1020218 1 proton, 2 alkyl, 1 acidic sec. amine 964219 1 proton, 2 alkyl, 1 alkyl and aromatic sub. tert. amine 940820 1 proton, 2 alkyl, 1 nonacidic sec. amide 8821a from a total o f 989,125 stereogenic centres
80

Table 2.11: Details of all combinations of substituents within the most common 250 in IBEX,
considered at risk of base-catalysed racemisation.
Combination of substituents on stereocentre, excluding protonNo.
stereocentres8
26 1 alkyl, 1 ketone, 1 reverse sec. amide 700360 1 alkyl, 1 ester, 1 reverse sec. amide 243071 1 alkyl, 1 ketone, 1 reverse tert. amide 197174 1 benzene, 2 alkene 190083 1 alkyl and aromatic sub. tert. amide, 1 reverse sec. amide, 1 imine 154087 1 alkyl, 1 ester, 1 reverse tert. amide 145495 1 alkyl, 1 ester, 1 nonacidic sec. amine 1231106 1 alkyl, 1 benzene, 1 ester 1143107 2 benzene, 1 dialkyl tert. amine 1140132 1 alkyl, 1 benzene, 1 ketone 801141 1 benzene, 1 dialkyl tert. amide, 1 reverse sec. amide 756149 1 alkyl, 1 ketone, 1 ester 694162 1 alkyl, 2 ketone 618176 1 benzene, 1 five-membered aromatic, 1 dialkyl tert. amine 551184 1 alkyl, 1 ester, 1 prim, amine 508196 1 alkyl, 1 ketone, 1 nonacidic sec. amine 467210 2 benzene, 1 reverse tert. amide 435220 1 benzene, 1 acidic sec. amide, 1 reverse sec. amide 417234 1 benzene, 1 nonacidic sec. amide, 1 reverse sec. amide 386244 2 benzene, 1 alkene 364246 1 alkyl, 1 ester, 1 dialkyl tert. amine 360247 1 alkyl, 1 ester, 1 sec. amine (other) 359a from a total of 989,125 stereogenic centres
81
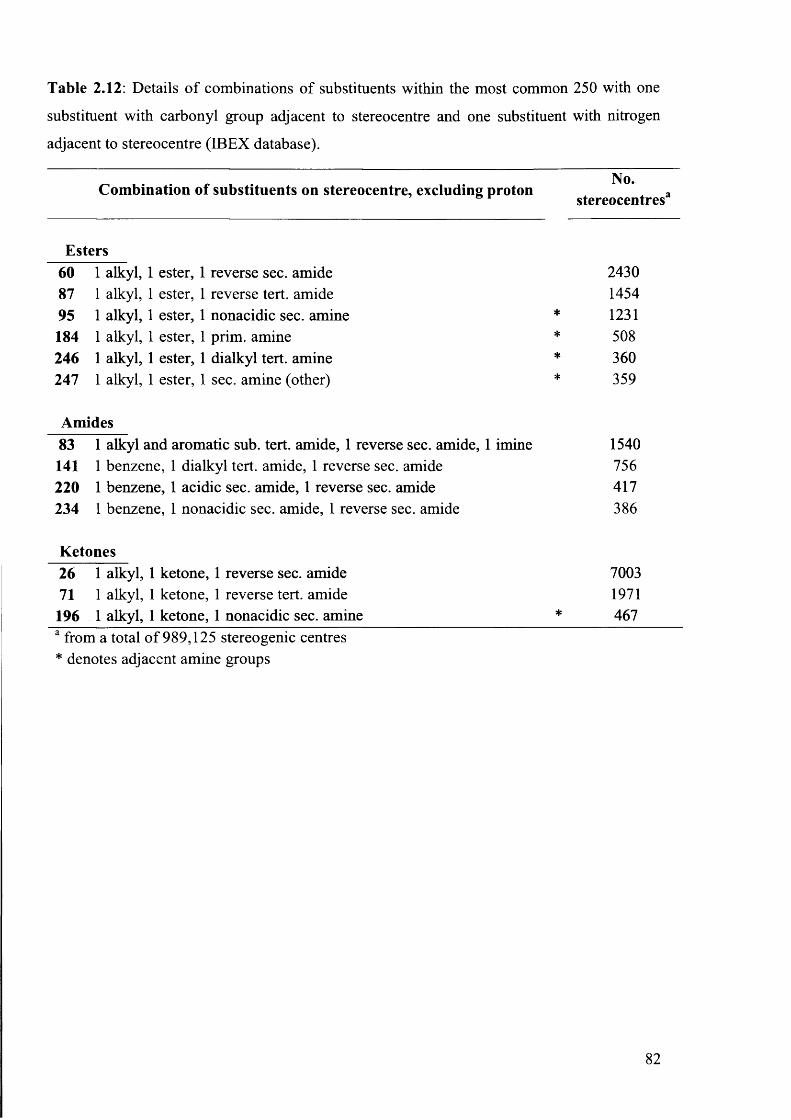
Table 2.12: Details o f combinations o f substituents within the most common 250 with one
substituent with carbonyl group adjacent to stereocentre and one substituent with nitrogen
adjacent to stereocentre (IBEX database).
Combination of substituents on stereocentre, excluding protonNo.
stereocentres3
Esters60 1 alkyl, 1 ester, 1 reverse sec. amide 243087 1 alkyl, 1 ester, 1 reverse tert. amide 145495 1 alkyl, 1 ester, 1 nonacidic sec. amine * 1231184 1 alkyl, 1 ester, 1 prim, amine * 508246 1 alkyl, 1 ester, 1 dialkyl tert. amine * 360247 1 alkyl, 1 ester, 1 sec. amine (other) * 359
Amides83 1 alkyl and aromatic sub. tert. amide, 1 reverse sec. amide, 1 imine 1540141 1 benzene, 1 dialkyl tert. amide, 1 reverse sec. amide 756220 1 benzene, 1 acidic sec. amide, 1 reverse sec. amide 417234 1 benzene, 1 nonacidic sec. amide, 1 reverse sec. amide 386
Ketones26 1 alkyl, 1 ketone, 1 reverse sec. amide 700371 1 alkyl, 1 ketone, 1 reverse tert. amide 1971196 1 alkyl, 1 ketone, 1 nonacidic sec. amine * 467a from a total o f 989,125 stereogenic centres* denotes adjacent amine groups
82

Table 2.13: Details of all combinations of substituents within the most common 250 in IBEX,
considered at risk of acid-catalysed racemisation.
Combination of substituents on stereocentreNo.
stereocentres3
12 1 proton, 1 hydroxyl, 1 benzene, 1 alkyl 1300545 1 proton, 1 hydroxyl, 1 alkyl, 1 alkene 362851 1 hydroxyl, 1 benzene, 2 alkyl 286470 1 proton, 1 hydroxyl, 1 five-membered aromatic, 1 alkyl 1981110 1 proton, 1 hydroxyl, 1 meta pyridine, 1 alkyl 1132135 1 hydroxyl, 2 alkyl, 1 alkyne 784143 1 hydroxyl, 1 benzene, 1 alkyl, 1 nonacidic sec. amide 747170 1 hydroxyl, 1 benzene, 1 alkyl, 1 ester 568177 1 hydroxyl, 2 benzene, 1 alkyl 544178 1 proton, 1 hydroxyl, 2 benzene 536191 1 hydroxyl, 1 five-membered aromatic, 2 alkyl 490192 1 proton, 1 hydroxyl, 1 alkyl, 1 ether 488201 1 proton, 1 hydroxyl, 1 ortho pyridine, 1 alkyl 460203 1 hydroxyl, 1 para pyridine, 1 alkyl, 1 ester 450206 1 proton, 1 hydroxyl, 1 para pyridine, 1 alkyl 442242 1 hydroxyl, 2 benzene, 1 reverse tert. amide 366a from a total o f 989,125 stereogenic centres
83
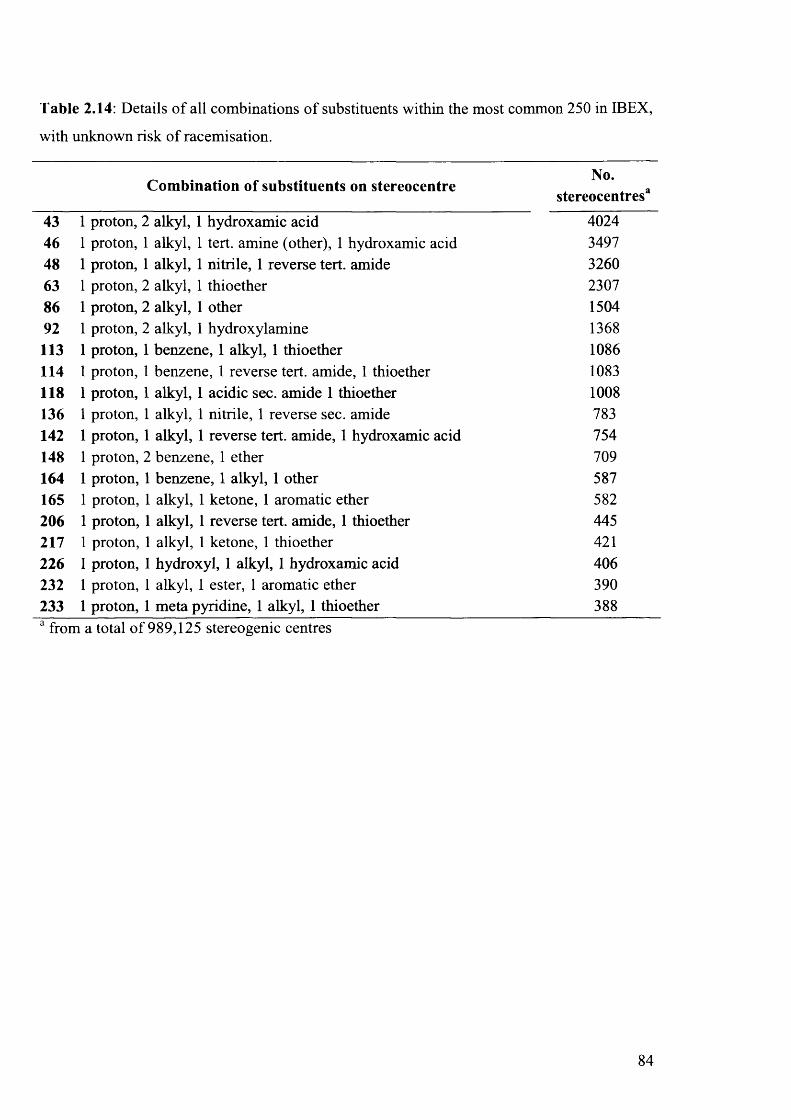
Table 2.14: Details of all combinations of substituents within the most common 250 in IBEX,
with unknown risk of racemisation.
C om bination of substituents on stereocentreNo.
stereocentres3
43 1 proton, 2 alkyl, 1 hydroxamic acid 402446 1 proton, 1 alkyl, 1 tert. amine (other), 1 hydroxamic acid 349748 1 proton, 1 alkyl, 1 nitrile, 1 reverse tert. amide 326063 1 proton, 2 alkyl, 1 thioether 230786 1 proton, 2 alkyl, 1 other 150492 1 proton, 2 alkyl, 1 hydroxylamine 1368113 1 proton, 1 benzene, 1 alkyl, 1 thioether 1086114 1 proton, 1 benzene, 1 reverse tert. amide, 1 thioether 1083118 1 proton, 1 alkyl, 1 acidic sec. amide 1 thioether 1008136 1 proton, 1 alkyl, 1 nitrile, 1 reverse sec. amide 783142 1 proton, 1 alkyl, 1 reverse tert. amide, 1 hydroxamic acid 754148 1 proton, 2 benzene, 1 ether 709164 1 proton, 1 benzene, 1 alkyl, 1 other 587165 1 proton, 1 alkyl, 1 ketone, 1 aromatic ether 582206 1 proton, 1 alkyl, 1 reverse tert. amide, 1 thioether 445217 1 proton, 1 alkyl, 1 ketone, 1 thioether 421226 1 proton, 1 hydroxyl, 1 alkyl, 1 hydroxamic acid 406232 1 proton, 1 alkyl, 1 ester, 1 aromatic ether 390233 1 proton, 1 meta pyridine, 1 alkyl, 1 thioether 388a from a total o f 989,125 stereogenic centres
84

2.7 References
1. http://www.daylight.com/dayhtml_tutorials/languages/smiles/index.html (accessed 19/01/2011).
2. Weininger, D., Journal o f Chemical Information and Computer Sciences 1988, 28 (1), 31-36.
3. Weininger, D.; Weininger, A.; Weininger, J. L., Journal o f Chemical Information and Computer Sciences 1989, 29 (2), 97-101.
4. Weininger, D., Journal o f Chemical Information and Computer Sciences 1990, 30 (3),237-243.
5. Engel, T., Journal o f Chemical Information and Modeling 2006, 46 (6), 2267-2277.6. Gasteiger, J.; Engel, T., Chemoinformatics: a textbook. Wiley-VCH: 2003; p 26-27.7. Leach, A. R., Molecular Modelling: Principles and Applications. 2nd ed.; Prentice
Hall: 2001; p 642-647.8. Velingkar, V. S.; Pokhama, G.; Kohle, N. S., International Journal o f Current
Pharmaceutical Research 2011, 3 (1), 71-75.9. http://www.daylight.com/dayhtml_tutorials/languages/smarts/index.html (accessed
19/01/2011).10. Schneider, G.; Baringhaus, K.-H., Molecular Design: Concepts and Applications.
Wiley-VCH: 2008; p 25-29.11. Lagorce, D.; Sperandio, O.; Galons, H.; Miteva, M. A.; Villoutreix, B. O., BMC
Bioinformatics 2008, 9:396.12. Walters, W. P.; Murcko, M. A., Advanced Drug Delivery Reviews 2002, 54 (3), 255-
271.13. Hann, M.; Hudson, B.; Lewell, X.; Lifely, R.; Miller, L.; Ramsden, N., Journal o f
Chemical Information and Computer Sciences 1999, 39 (5), 897-902.14. Vieth, M.; Siegel, M. G.; Higgs, R. E.; Watson, I. A.; Robertson, D. H.; Savin, K. A.;
Durst, G. L.; Hipskind, P. A., Journal o f Medicinal Chemistry 2004, 47 (1), 224-232.15. Leach, A. G.; Jones, H. D.; Cosgrove, D. A.; Kenny, P. W.; Ruston, L.; MacFaul, P.;
Wood, J. M.; Colclough, N.; Law, B., Journal o f Medicinal Chemistry 2006, 49 (23), 6672-6682.
16. Hansch, C.; Leo, A.; Taft, R. W., Chemical Reviews 1991, 91 (2), 165-195.17. Reist, M.; Testa, B.; Carrupt, P. A., Enantiomer 1997, 2 (3-4), 147-155.18. Testa, B.; Carrupt, P. A.; Gal, J., Chirality 1993, 5 (3), 105-111.19. Reist, M.; Testa, B.; Carrupt, P.-A., Drug Racemization and Its Significance in
Pharmaceutical Research. In Handbook o f Experimental Pharmacology, Springer: 2003; Vol. 153, pp 91-112.
20. Lambert, W. J.; Timmer, P. G., Pharmaceutical Research 1991, 8 (11), 1444-1447.21. Lambert, W. J.; Timmer, P. G.; Walters, R. R.; Hsu, C. Y. L., Journal o f
Pharmaceutical Sciences 1992, 81 (10), 1028-1031.22. Venter, D. P., Tetrahedron 1991, 47 (27), 5019-5024.23. Ghose, A. K.; Viswanadhan, V. N.; Wendoloski, J. J., Journal o f Combinatorial
Chemistry 1999, 7 (1), 55-68.24. Lameijer, E. W.; Kok, J. N.; Back, T.; IJzerman, A. P., Journal o f Chemical
Information and Modeling 2006, 46 (2), 553-562.
85
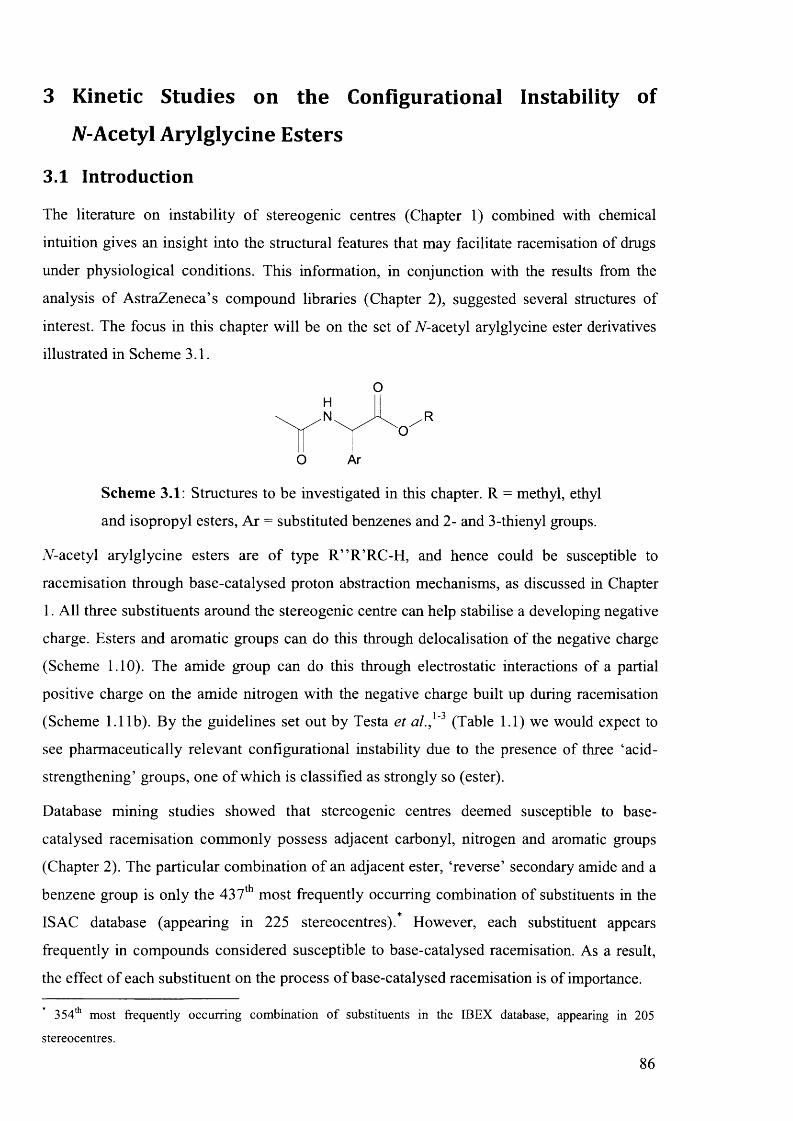
3 Kinetic Studies on the Configurational Instability of yV-Acetyl Arylglycine Esters
3.1 Introduction
The literature on instability of stereogenic centres (Chapter 1) combined with chemical
intuition gives an insight into the structural features that may facilitate racemisation of drugs
under physiological conditions. This information, in conjunction with the results from the
analysis o f AstraZeneca’s compound libraries (Chapter 2), suggested several structures of
interest. The focus in this chapter will be on the set of A-acetyl arylglycine ester derivatives
illustrated in Scheme 3.1.
S c h e m e 3.1: Structures to be investigated in this chapter. R = methyl, ethyl
and isopropyl esters, Ar = substituted benzenes and 2- and 3-thienyl groups.
iV-acetyl arylglycine esters are of type R ” R ’RC-H, and hence could be susceptible to
racemisation through base-catalysed proton abstraction mechanisms, as discussed in Chapter
1. All three substituents around the stereogenic centre can help stabilise a developing negative
charge. Esters and aromatic groups can do this through delocalisation of the negative charge
(Scheme 1.10). The amide group can do this through electrostatic interactions of a partial
positive charge on the amide nitrogen with the negative charge built up during racemisation1 ^(Scheme 1.11b). By the guidelines set out by Testa et al., ' (Table 1.1) we would expect to
see pharmaceutically relevant configurational instability due to the presence of three ‘acid-
strengthening’ groups, one o f which is classified as strongly so (ester).
Database mining studies showed that stereogenic centres deemed susceptible to base-
catalysed racemisation commonly possess adjacent carbonyl, nitrogen and aromatic groups
(Chapter 2). The particular combination o f an adjacent ester, ‘reverse’ secondary amide and a
benzene group is only the 437th most frequently occurring combination of substituents in the*
ISAC database (appearing in 225 stereocentres). However, each substituent appears
frequently in compounds considered susceptible to base-catalysed racemisation. As a result,
the effect o f each substituent on the process o f base-catalysed racemisation is of importance.
354th most frequently occurring combination o f substituents in the IBEX database, appearing in 205
stereocentres.
O
O Ar
86

Several o f the top selling pharmaceutical drugs on the market have stereogenic centres similar
to that shown in Scheme 3.1. Stereogenic centres similar to the those under investigation in
this chapter are found in the platelet aggregate inhibitor Clopidogrel,4,5 cholesterol regulator
Ezetimibe,6 psychostimulant Methylphenidate7, 8 and ACE+ inhibitor Perindopril9 (Scheme
3.2).
Clopidogrel
NH
Methylphenidate
.NH
OHPerindopril
,OHOH
Ezetimibe
S ch em e 3 .2 : Drugs with similar stereogenic centres to the scaffold shown in
Scheme 3.1.
Mining studies o f drug databases have shown that, although not as abundant as benzene rings,
aromatic heterocycles are commonly found in drug molecules.10 Nitrogen-containing
heterocycles are the most commonly found, followed by oxygen-containing and
sulphur-containing heterocycles.11 Pyridine was found to be the second most frequently
occurring ring system in the National Cancer Institute drug database (after benzene),12appearing in 2.7 % of molecules (> 250,000 drugs analysed). Thiophene is the most
common sulphur-containing heterocycle found in the Comprehensive Medicinal Chemistry
database.11 An example o f a thiophene containing drug is the antidepressant Duloxetine
(Scheme 3.3).
13
+ ACE - Angiotensin-Converting Enzyme.87

Scheme 3.3: Structure of Duloxetine.
Because of their abundance in drug molecules, it is desirable to incorporate compounds
containing heterocycles into our analysis. Thiophenes were chosen for analysis in this chapter
due to the commercial availability o f appropriate starting materials. Although thiophenes are
not the most desired heteroaromatics for study, analysis of their behaviour will allow insight
into how the effect o f heteroaromatic substituents on a stereogenic centre may differ from the
effect of benzene derivatives.

3.2 Aims
This chapter has five main aims.
First, to determine the rates o f racemisation and proton-deuterium exchange (H/D exchange)
for compounds o f general structure illustrated in Scheme 3.1, under conditions analogous to
those found in the body. Evaluation o f these rates will inform as to whether or not stereogenic
centres such as those found in the compounds under analysis are at risk of configurational
instability in the body.
Second, to analyse the effect changes in conditions have on the rate constants of
configurational instability.
Third, resulting from the previous point, to determine whether configurational instability is
general- or specific-base catalysed.
Fourth, to investigate the effects each substituent has on configurational stability. Quantifying
the effect o f slight changes in molecular structure on the rate constants of H/D exchange will
afford insight into the importance o f each substituent in the process.
Fifth, to determine the mechanism by which racemisation and H/D exchange takes place. This
will also be informed by the effect o f different substituents on the rate constants for
racemisation and H/D exchange.
89

3.3 Synthesis of Compounds for Analysis
A set of A-acetyl arylglycine methyl esters 3 a -l was selected for analysis (Scheme 3.4).
O
OMe
O
3 a -h
O
O
RO'
X = a) H , b ) p-OH, c) /?-Me, d ) p-F, e) p-C 1, f) m-F, g) m-F, h) /?-CF3
O
3i-jR = i) Et, j) *Pr
O
OMe
O
3 k
OMe
O
31
S ch em e 3.4: A-Acetyl arylglycine methyl esters 3a-l.
Compounds 3 a -l were synthesised from commercially available arylglycine starting materials
(Scheme 3.5).
O O O
HoNOH ROH
0 © Cl h 3n
OR NaHCO;
Ar SO C f Ar Ac20
l a - h , k , 1 2 a -l
S chem e 3.5: Synthetic route to compounds 3a-l.
O Ar
3a-l
OR
90

For comparison, a set of 7V-acetyl phenylglycines, 4a, c-e, g-h, was also synthesised for
analysis (Scheme 3.6).
O
OH
O
4a, c-e, g-hX = a) H, c) /?-Me, d) p -F,
e)/?-Cl, g) m-F, h) /?-CF3
Scheme 3.6: N-acetyl phenylglycines 4a, c-e, g-h.
These compounds were also synthesised from commercially available arylglycine starting
materials, as displayed in Scheme 3.7.
O OH
H2N.OH N aO H / A c20
Ar
la , c-e, i-h 4a, c-e, i-h
Scheme 3.7: Synthetic route to compounds 4a, c-e, g-h.
Enantiopure analogues o f 3a, 3e, 4a and 4e were synthesised in the same manner from
enantiopure starting materials.
91

3.4 Results and Discussion
3.4.1 In itia l P ro to n -D e u te r iu m E xchange E x p erim en ts
As discussed in Chapter 1, configurational instability for stereogenic centres of type
R ” R ’RC-H can be monitored through H/D exchange experiments. If deuterium incorporation
at the stereogenic centre is observed then this strongly suggests that the compound is not
configurationally stable. The use o f H/D exchange experiments as a model for racemisation
also has the advantage that enantiopure or enantioenriched compounds do not need to be used.
Compounds 3a-j were placed in deuterated buffers and incubated at 37 °C. A range of
different phosphate buffer strengths were used. Generally, buffers with pH** 7.4 were
u s e d /14' 16 Some experiments were undertaken at pH** 7.8, in order to evaluate the relative
involvement of the different phosphate species present (H2PO4' and HPO42') in H/D exchange.
A constant ionic strength o f 1 M was used. The reaction was monitored over time using !H
NMR spectroscopy. The extent o f H/D exchange at the stereogenic centre is measured by
looking for a decrease in the intensity of the peak corresponding to the proton bound to the
stereogenic centre. The intensity o f the peak is calculated relative to the peak for the protons
on the benzene ring. It is assumed that no deuterium incorporation takes place on the benzene
ring and, thus, that the intensity of the aromatic protons remains constant over time.
3.4.2 R eac tio n S chem e
H/D exchange at the stereogenic centre was observed for all compounds 3a-l. Ester hydrolysis
was also seen for each compound. As the ester was being hydrolysed, a new peak in the *H
NMR spectrum appeared. This peak corresponds to a proton bound to the stereogenic centre
for the relevant hydrolysis products 4a-h, k-1. Confirmation that this new peak was a result of
ester hydrolysis was obtained by comparison o f the chemical shift of the new peak in the
NMR spectrum, with that seen for the synthesised corresponding A-acetyl phenylglycine.
: When reporting the acidity o f D20-based solutions, the term ‘pH*’ is often used to denote the value recorded
on a standard electrode. It is widely accepted that deuterium isotope effects cause the actual pD of D 20 solutions
to equal pH* + 0.4 units. However, the value o f pH* is commonly used as a deuterium isotope effect also alters
the position o f equilibrium between buffer components, generally raising the pKa by 0.5-0.7 units. This
approximately offsets the error from the uncorrected pH meter reading. The term ‘pH**’ adds the extra caveat
that the buffers used are not temperature corrected, i.e. the values displayed were determined at 25 °C and the
buffers were used at 37 °C.
92

Following ester hydrolysis, no further H/D exchange is seen at the stereogenic centre.
Confirmation that no H/D exchange at the stereogenic centre occurs for 4a-h, k-1 was
obtained by monitoring 4h under the same conditions. No decrease in the intensity of the peak
corresponding to the proton bound to the stereogenic centre was seen after 30 days for
compound 4h, indicating no H/D exchange occurs. As the p-C F3 aromatic substituent in 4h is
the most electron withdrawing substituent analysed, it can be concluded that if H/D exchange
does not occur for this compound, it will not for any of the A-acetyl phenylglycines 4a-h, k-1
(cf. Section 1.8.2). The observation that no further H/D exchange occurs is consistent with the
classification of a carboxylate group as enhancing configurational stability, because of
unfavourable interactions between the carboxylate anion and negative charge built up during
H/D exchange (Scheme 1.15). Therefore, the reaction scheme for compound 3a in deuterated
buffers can be summarised as in Scheme 3.8.
O O
!Io
H
O'cdeut
o
D
4 iyd
o
chyd
o
j
o
H
o
D
Scheme 3.8: Reaction o f 3a in deuterated buffer. Superscript letters in
compound numbering refer to the nature o f the hydron bound to the
stereogenic centre in molecule.
The reaction profile in Scheme 3.8 also applies to compounds 3b-j.
Despite ester hydrolysis, there is negligible difference in the chemical shift of the protons
bound to the benzene ring between compounds 3 and 4. The total intensity of the peaks from
93

the aromatic groups remains constant over time. Thus, when calculating relative integrals for
protons bound to the stereogenic centre for both compounds, they are relative to the intensity
o f aromatic protons from both species.
3.4.3 D e te rm in a tio n o f R ate C o n stan ts o f H /D E xchange a n d H ydrolysis
Observed rate constants for the disappearance of start material protonated at the stereogenic
centre were obtained for compounds 3a-h. Each compound was analysed at a range of buffer
concentrations and pH **’s, at an ionic strength of 1 M and temperature of 37 °C. Rate
constants for H/D exchange and hydrolysis were derived from the observed rate constants as
described in the experimental (Section 3.6.3.3). The observed rate constants and the derived
rate constants for H/D exchange and hydrolysis of 3a are summarised in Table 3.1.
Table 3.1: Rate constants for H/D exchange and for hydrolysis o f 3a in D2O buffers at 37 °C,
/ = 1 M.
pH**phosphate
conc. / M
[H P 04z ]
conc. / M*0bs X 106 / S’1 £deut x 106 / s'1 *hyd x 106 / s'1
7.4 0.050 0.030 3.47 ±0.15 1.36 ±0.18 2.11 ±0.09
7.4 0.100 0.061 4.10 ± 0.13 1.82 ±0.15 2.28 ± 0.08
7.4 0.200 0.122 4.91 ±0.08 2.80 ±0.09 2.11 ±0.04
7.4 0.250 0.152 5.52 ±0.16 3.25 ±0.17 2.27 ± 0.07
7.8 0.200 0.159 7.03 ±0 .14 3.57 ±0.16 3.46 ± 0.07
7.4 0.300 0.182 6.16 ± 0.11 3.64 ±0.12 2.53 ± 0.05
7.8 0.355 0.282 10.22 ±0.18 5.61 ±0.19 4.61 ±0.08
Tables analogous to Table 3.1 for 3b-h can be found in the appendix (Section 3.7.1.1).
To confirm the method o f analysis, the rate constant for hydrolysis o f 3a was also determined
through HPLC. The rate constant o f hydrolysis (&hyd) of 3a in D20 buffer of pH** 7.4,
phosphate concentration 0.2 M, I = 1M at 37 °C was determined to be (2.14 ± 0.05) x 10"6 s '1
(see experimental Section 3.6.5). This value compares favourably with the value of &hyd
determined under these conditions through *H NMR spectroscopy, of (2.11 ± 0.04) x 10‘6 s '1.
94

3.4.4 Nature of Base-Catalysis
For each compound 3a-h, the rate constant for deuteration was plotted as a function of the
concentration of the basic component of the buffer (Figure 3.1 for 3a).
6.00x10'I1
4.50x10
i Iw 3.00x10
*
1.50x10'
0.000.0 0.1 0.2 0.3
[H P O /l / M
Figure 3.1: Variation o f &deut of 3a with [HPO42 ] at 37 °C, / = 1 M, (■)
pH** 7.4, (A ) pH** 7.8.
Figure 3.1 shows a linear increase in the rate constant for H/D exchange as a function of the
concentration o f the basic buffer component. This linear increase suggests that H/D exchange
is subject to general-base catalysis by phosphate dianion. The experimental rate constant for
deuteration follows the rate law given by eqn (3.1).
where koeut is the observed rate constant for deuteration, ko is the rate constant of the
uncatalysed reaction, &oh is the rate constant of the hydroxide-catalysed deuteration reaction
and &gb is the rate constant o f the phosphate dianion-catalysed deuteration reaction.
The gradient of the line in Figure 3.1 corresponds to the rate constant for H/D exchange by
general-base catalysis. The intercept with they-axis corresponds to the sum of the uncatalysed
and hydroxide-catalysed H/D exchange reaction, ko’ (eqn 3.2).
For 3a, the non-zero y-axis intercept suggests a degree o f H/D exchange proceeding by non
general-base catalysed pathways. As Figure 3.2 shows, not all compounds 3b-h display this
non-zero y-axis intercept.
*d eu , = * 0 + *O H [ O H " ] + / t g b [ H P 0 4 2- ] (3.1)
V = * o + * o h [ O H - ] (3.2)
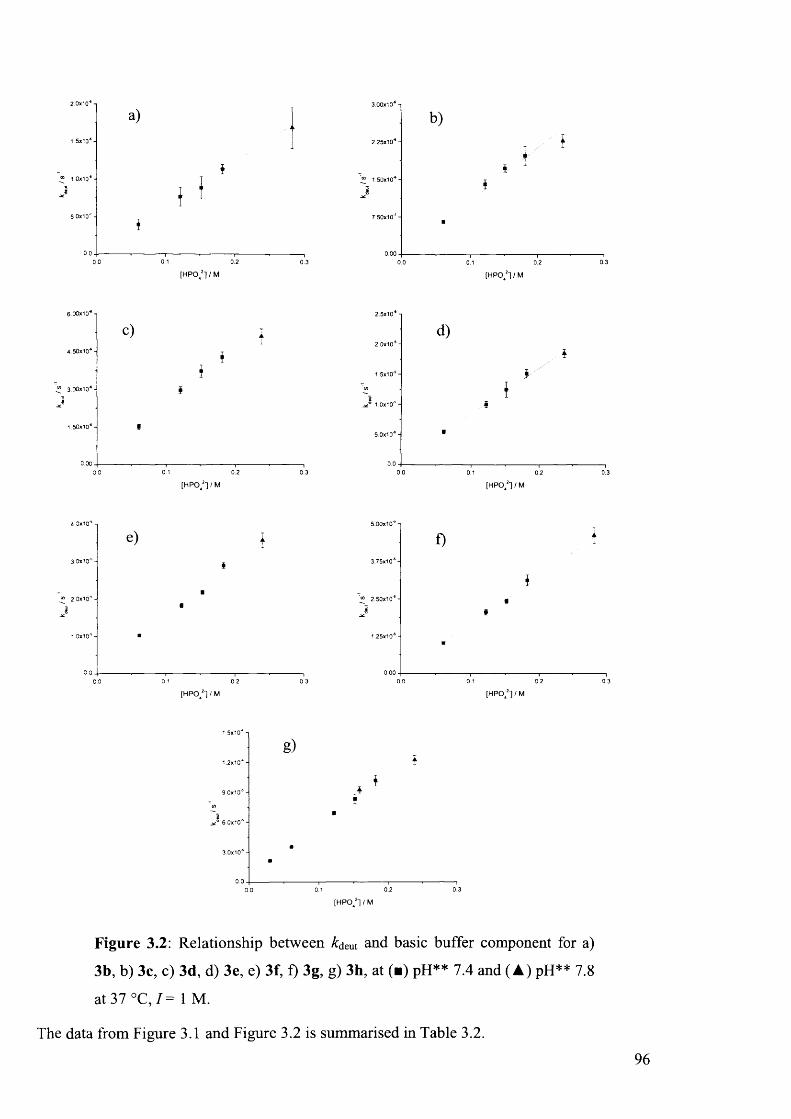
1 0x10* -
a)
[HP04!] / M
6.00x10*-i
3 00x10*
1.50x10*
c)
2 0x10*-
e)
[HP042]/M
2.25x10*
7.50x1 O'7
b)
2.5x10 * i
2.0x10*
1.0x10*
0.0------1-------- T ...‘T
0.1 0.2 0.3
[ H P O / l / M
-
d )
-
I-
Ii
-■
0.0 0.1 0.2 0.3
[ H P O / -] / M
'
f) f
i- *
i
■
[HPO/] / M [HP0421 / M
g)
[HPO,2! / M
Figure 3.2: Relationship between &deut and basic buffer component for a)
3b, b) 3c, c) 3d, d) 3e, e) 3f, f) 3g, g) 3h, at (■) pH** 7.4 and (A ) pH** 7.8
at 37 °C, / = 1 M.
The data from Figure 3.1 and Figure 3.2 is summarised in Table 3.2.
96

Table 3.2: kgh and ko' for 3a-h, at pH** 7.4 and 7.8, 37 ° C , I = 1 M.
C om pound k gb / s^M '1 Ao’/ s '1
3a (1.64 ± 0.09) x 1 O'5 (8.05 ± 1.28) x 10''
3b (6.01 ± 0.72) x 10'6 (0.24 ± 1.05) x 10'7
3c (1.03 ± 0.06) x 10'5 (4.47 ± 5.92) x 10'7
3d (2.20 ± 0.13) x 1 0 5 (1.92 ± 1.54) x 10'7
3e (7.47 ± 0.38) x 10'5 (9.37 ± 4.71) x 10'7
3f (1.40 ± 0.05) x 10-4 (1.48 ± 0.50) x 10 6
3g (1.60 ± 0.06) x 1 O'4 (4.68 ± 4.53) x 10'7
3h (5.15 ± 0.13) ± 10"1 (5.01 ± 0.98) x 10'7
Table 3.2 shows that for 3b and 3c, ko' is zero within error margins and most other
compounds are not too far away from this. A significant value for ko' is only seen for 3a and
3h. If specific-base catalysis were occurring to a significant extent, data from the experiments
undertaken at pH** 7.8 would not fall on the same line o f best fit with the experiments at
pH** 7.4, but would appear above the others. However, for all compounds 3a-h the data
points obtained at pH** 7.8 fit with those seen at pH** 7.4. As a result, specific-base catalysis
can be ignored for the pH** tested here, and analysis will focus on general-base catalysis by
HPO42" ions.
Table 3.2 shows that the rate constants for H/D exchange are greater for compounds with
more electron-withdrawing substituents. Approximate half-lives of deuteration in 0.3 M D2O
phosphate buffers at pH** 7.4, / = 1 M at 37 °C, are given in Table 3.3.
97

Table 3.3: Half-lives o f H/D exchange for 3a-h in D20 0.3 M phosphate buffers of pH** 7.4,
1= 1 M, 37 °C.
Compound Aryl Substituent t\i2 of deuteration / h
3a - 62.7
3b p-OU 175.9
3c p -Me 94.7
3d P~ F 48.0
3e p-C 1 14.2
3f m-F 7.1
3g ra-Cl 6.7
3h P-C f 3 2.0
Table 3.3 shows that H/D exchange at the stereogenic centre, and hence racemisation, o f 3a-h
takes place on a pharmaceutically relevant timescale. This is particularly true for compounds
with electron-withdrawing ring substituents.
3.4.5 H ydrolysis
In contrast to H/D exchange, hydrolysis appears much more dependent on OH' concentration.
Plots of khyd against [H P 042 ] (Figure 3.3) do not show a good correlation for all compounds.
This is especially true for experiments undertaken at pH** 7.8, for which &hyd is generally
much higher than for experiments at pH** 7.4. The data from Figure 3.3 is summarised in
Table 3.4
98

a)8.0x1 O'* -i
b)
3 0x10"*-
4.0x10"* -
[HP042]/M [HPO/f/M
c)
6.00x10"* -\
d)
1.50x10*-
[HPQ4 ] / M [HPO, ] / M
6 0x10*-e) f)
* I
[HPO, ] / M [HP0421 / M
6 0x10*-
g) h)
[h p o 42t /m [h p o42i/m
Figure 3.3: Relationship between £hyd and basic buffer component for a) 3a,
b) 3b, c) 3c, d) 3d, e) 3e, f) 3f, g) 3g, h) 3h, at (■) pH** 7.4 and (A ) pH**
7.8 at 37 °C, / = 1 M. (— ) fitted solely with pH** 7.4 data points.
99

Table 3.4: &gb(hyd) and £o’(hyd) for 3a-h, at pH** 7.4, 37 °C, / = 1 M.
Compound gb(hyd) / S M ^o’(hyd)/ S '
3a (2.66 ± 0.55) x 10* (1.92 ± 0.08) x 10*
3b (2.35 ± 0.47) x 10* (1.52 ± 0.07) x 10*
3c (7.07 ± 0.38) x 10* (8.27 ± 0.38) x 10'7
3d (1.29 ± 0.08) x 10 s (1.43 ± 0.09) x 10*
3e (2.05 ± 0.18) x 10* (1.69 ± 0.20) x 10*
3f (1.30 ± 0.1 l ) x 10* (2.73 ± 0.14) x 10 6
3g (1.05 ± 0.16) x 10* (2.74 ± 0.13) x 10*
3h (4.62 ± 0.25) ± 10* (7.19 ± 3.57) x 10‘6
Table 3.4 shows that, although there appears to be some general-base catalysis of hydrolysis
for 3a-h, it is less than that seen for H/D exchange. It is also noticeable that general-base
catalysed hydrolysis shows no apparent increase for the structures with more electron-
withdrawing aromatic substituents. A possible explanation for this is that the reaction site for
hydrolysis is further away from the aromatic ring than the site of H/D exchange. The values
o f *b’ are larger in magnitude for the hydrolysis of 3a-h than for H/D exchange. It was
observed that the values o f £hyd at pH** 7.8 are larger than would be expected if hydrolysis
was solely general-base catalysed, suggesting a significant degree o f specific-base catalysis
by hydroxide ions.
3.4.6 H a m m ett A nalysis
Hammett plots o f the rate constants o f general base-catalysed H/D exchange for 3a-h (from
Table 3.2) as a function o f a- and o ~-constants were constructed (Figure 3.4).
100

Figure 3.4: Hammett plots for data from Table 3.2 for general
base-catalysed H/D exchange at the stereogenic centres of 3a-h, in D2O
phosphate buffers o f I = 1 M at 37 °C a) as a function of <7- values (—) line
of best fit for all data points, p = 2.50 ± 0.03, R2 = 0.979 , (—) line of best
fit for data points where a > 0, p = 2.79 ± 0.04, R2 = 0.998. b) as a function
of o~ -values, (— ) p = 2.07 ± 0.02, R2 = 0.984. Hammett constants from
Table 1.5.17
The linear nature o f both plots in Figure 3.4 suggests a common mechanism of H/D exchange
for compounds 3a-h. The positive gradients seen in Figure 3.4 confirms that negative charge
is built up on the reaction centre during H/D exchange. Using er-constants, the data shows a
good linear correlation for electron-withdrawing substituents (a > 0) but this does not hold for
electron-donating substituents 3b and 3c (p-OH and /?-Me). Figure 3.4 shows a better overall
correlation to cr“-values than with standard cr-values. The better correlation with o~ is
attributed to direct conjugation o f the site o f reaction to the aromatic ring. Negative charge
built up during H/D exchange can be resonance-delocalised through the phenyl group onto the
substituent.
Although Figure 3.4 shows a better correlation with o~-values than with o'-values for general
base-catalysed H/D exchange o f 3a-h, it should be noted that for most of the substituents
analysed there is not a great deal o f difference between o and o~, Of the eight different
compounds, only three have different o- and cT-values and the largest difference (/7-C F 3) is
only 0.11 units. This small difference makes conclusively determining whether the data
correlates better with one set o f substituent constants or with another difficult. Ideally, a
substituent such as a nitro group (a- and ^-values 0.78 and 1.27 respectively) would be
included in the Hammett analysis, to simplify determination of which set of substituent
constants is best for the data. Unfortunately, the appropriately substituted phenylglycine
starting material is not commercially available and efforts to synthesise it were unsuccessful.
101

In circumstances where data appears to fit somewhere in between a- and o -values (or indeed
possible presence o f an intermediate degree of resonance interaction. However, as the
difference in o- and o~-values for 3a-h is only small there is little value in carrying out an
analysis in terms o f the Yukawa-Tsuno equation for the current dataset.
The magnitude o f p from Figure 3.4 gives us an insight into the degree of negative charge
built up on the reaction centre during H/D exchange. The value of p = 2.07 can be contrasted
with that of p = 1.15 for the racemisation of arylglycines in phosphate buffers, determined by18Smith and Sivakua. The authors consider this p value for arylglycine racemisation to be
quite low, suggesting little charge stabilisation is derived from the aryl group. This is because
either very little charge is built up on the reaction centre or, as considered more likely by the
authors, stabilisation results from moieties other than the aryl substituents. They conclude that
major stabilisation comes from the reaction medium (water) and the adjacent -N H 3+ group.§
The Sgl mechanism was proposed as the mechanism of racemisation for arylglycines, based
on the relative ratio o f the rate constants o f racemisation and H/D exchange (Section 1.3). A
similarly small p o f 0.83 was determined for the ionisation of arylnitromethanes (ArCH2N02)
in water at 25 °C by Bordwell and Boyle.19,20 The small p value was believed to be a result of
the adjacent nitro group providing major stabilisation.
Conversely, a p value o f 3.58 for the racemisation of profen thioesters catalysed by9 1trioctylamine in isooctane at 45 °C was determined by Chen et al. (Scheme 3.9).
Scheme 3.9: Racemisation o f profen thioesters in isooctane via proton
abstraction with trioctylamine base, p = 3.58.
The higher p value for the reaction in Scheme 3.9 can be attributed to two factors. Firstly, the
methyl group adjacent the site o f negative charge build-up (the stereogenic centre) cannot
stabilise a charge in the manner that an -NHAc group (compounds 3a-h), an -N H 3+ group
(reference 18) or an - N 0 2 group (reference 19) does. Therefore the reliance on charge
The experiments discussed from reference 18 were undertaken at pH 10, where the ratio of arylglycine free
base (anion) to zwitterion is approximately 100:1. However, the rate constant o f racemisation for the zwitterion
over the free base is approximately 100,000:1, suggesting that the zwitterion is the major species undergoing
racemisation and supporting the assertion o f stabilisation from -N H 3+.
o- and cr+-values) the Yukawa-Tsuno equation (Section 1.8.2.2.3) is used, to acknowledge the
trioctylamine
O O
102

stabilisation by the aryl substituent is greater. Secondly, the reaction medium in this case is
isooctane. This nonpolar alkane cannot stabilise a charge in the manner that water can in the
other cited examples, giving even greater importance to the stabilisation by the aryl
substituent.
3.4.7 V a ria tio n o f E s te r S u b s ti tu e n t
The effect o f the nature o f the ester substituent was investigated through comparison of rate
constants of H/D exchange and hydrolysis for compounds 3a, 3i and 3j. The rate constants are
summarised in Table 3.5.
Table 3.5: Rate constants o f 3a, 3i and 3j in pH** 7.4 D2O buffers of 0.3 M phosphate
concentration, at 37 °C, / = 1 M.
Compound A:obs X 106 / s ' 1 A:deut x 106 / s'1 V i x IO V s'1
3a 6.16 ± 0.11 3.64 ±0.12 2.53 ± 0.05
3i 2.85 ± 0 .08 1.91 ±0.08 0.95 ± 0.03
3j 0.98 ± 0.04 0.88 ± 0.04 0.10 ±0.01
As expected, rate constants o f hydrolysis were found to decrease as the ester substituent
increased in size. This decrease is attributed to steric hindrance disfavouring general- and
specific- base catalysed hydrolysis by blocking attack at the carbonyl carbon.22, 23 Rate
constants o f H/D exchange also decreased with increasing size o f alkyl ester substituent. As
with hydrolysis, this decrease is likely due to steric hindrance blocking base-catalysed proton
abstraction at the stereogenic centre. As many drug molecules are much larger in molecular
weight and have a much larger ‘framework’ than those analysed here, the observation that
racemisation can be retarded by steric bulk may become important when assessing the
racemisation risk o f prototype drugs.
The rate constant for hydrolysis shows a larger decrease with increasing bulk of the ester
substituent than the rate constant for H/D exchange. The rate constant of hydrolysis drops by
an approximate factor o f 25 when the methyl ester is replaced by an isopropyl ester (3a to 3j),
whereas the rate constant for H/D exchange drops by an approximate factor of 4. This
observation is probably due to the proximity o f the ester alkyl substituent being varied to the
site o f reaction, which is closer for hydrolysis (carbonyl carbon) than for H/D exchange
(stereogenic centre). As a result, the increasing steric hindrance from the ester group will have
103

a greater impact on the rate constant o f hydrolysis than it will on the rate constant of H/D
exchange.
3.4.8 M echan ism o f R ac e m isa tio n
Comparison between the rate constants for racemisation and H/D exchange can inform as to
by which mechanism racemisation is occurring. The two most likely mechanisms of
racemisation are known as SeI and Se2. Previous studies on compounds similar to 3a-h have
generally concluded that racemisation occurs through an SE1 mechanism,18,24,25 although an
example o f racemisation by the Se2 mechanism has been reported.26 The SeI and Se2
mechanisms can be distinguished by comparison of the rate constants of racemisation and
H/D exchange (Section 1.3).
Ester hydrolysis o f 3a-h is a problem when trying to determine the rate constant of
racemisation. The hydrolysis reaction results in the presence of more than one species (ester
and carboxylate) in the reaction mixture at the same time. Ideally, chiral HPLC is used to
determine the concentration o f each o f the enantiomers of ester and carboxylate throughout
the reaction, however this technique was unavailable. Multiple species in the reaction mixture
makes analysis through spectroscopy difficult, as distinguishing between the signals from the
ester and carboxylate species is a problem. However, a way around this problem is to only
look at the final composition o f the reaction mixture, once hydrolysis is complete. The
enantiomeric excess o f the final, fully hydrolysed product can be determined through CD
spectroscopy (Section 1.10.3). Comparison o f the ee o f the fully hydrolysed compound with
the final proportion o f molecules deuterated at the stereogenic centre (i.e. proportion that have
undergone H/D exchange prior to hydrolysis) affords information on the mechanism by which
H/D exchange is taking place. The expected observations for the SeI and Se2 mechanisms are
outlined in eqns (3.3) and (3.4), respectively.
Q " = e e t (3.3)
Qf H > ee{ (3.4)
where QfH is the percentage o f molecules protonated at the stereogenic centre after hydrolysis
is complete and eef is the enantiomeric excess of hydrolysed species after hydrolysis is
complete. The theoretical basis for equations 3.3 and 3.4 is outlined in Appendix Section
3.7.1.
104

3.4.8.1 Comparison o f Data from CD and 1H NMR Spectroscopy Experiments
H/D exchange/racemisation experiments in deuterated buffer were undertaken for enantiopure
(R)-3a and (S)-3e. H/D exchange was monitored through lH NMR spectroscopy and
hydrolysis was followed by HPLC. Once hydrolysis was complete, the final ee was
determined through CD spectroscopy. Comparisons o f Q f1 with ee? for 3a and 3e are
displayed in Table 3.6.
Table 3.6: Comparison o f Q f1 with eef for 3a and 3e in D2O buffers of pH** 7.4, 0.3 M
phosphate concentration, / = 1 M at 37 °C.
Compound X-substituent QfH eef
3a - 41.1 ±0.3 % 45.5 ±2.1 %
3e p-C 1 26.8 ± 0 .6 % 30.2 ± 1.4 %
Table 3.6 shows that QfH and eef for both 3a and 3e are approximately the same. This strongly
suggests that H/D exchange, and hence racemisation, occur via an SeI mechanism. Although
the values determined for QfH and eef for both compounds do not exactly match, in both cases
eef is slightly higher than Q f \ If the Se2 mechanism were taking place, Q f1 would be higher
than eef, and significantly so given the comparative rates o f £deut and k^yd determined by *H
NMR and HPLC for 3a and 3e. As discussed in Section 1.3, there are known examples where27 28deuteration can proceed with retention o f stereochemistry (isoinversion). ’ The small
discrepancy between QfH and eef may be due to isoinversion or experimental error.
Although the eef could only be determined for 3a and 3e, it seems safe to extrapolate this
result to all differently substituted 3 compounds. This is based on the conclusion from the
linear Hammett plot (Figure 3.4) that all compounds 3a-h share a common mechanism of H/D
exchange.
3A.8.2 Mechanistic Conclusions
Overall, it can be concluded that general-base catalysed H/D exchange and racemisation of
3a-h proceed through the SeI mechanism, under the conditions studies here. This is based on
three observations.
First, the value o f p o f 2.07 determined from Figure 3.4 is compatible with an SeI
mechanism. The positive value o f p confirms that negative charge is built up during H/D
105

exchange. The magnitude o f p is also suggestive of an SeI mechanism; a large p value means
that a considerable amount o f negative charge is built up during H/D exchange, which is more
characteristic o f an SeI mechanism than o f an Se2 mechanism.
Second, Hammett plots o f the rate constants for general base-catalysed H/D exchange of 3a-h
show a better correlation with o~ constants than with standard o constants (Figure 3.4). This
suggests that the negative charge is built up on the reaction centre during H/D exchange, as it
can be directly conjugated with the aromatic ring substituents. This location of charge is
consistent with the SeI mechanism, although it does not rule out an Se2 mechanism.
Third, CD and NM R analysis o f the final, fully hydrolysed products of 3a and 3e show the
proportion of material protonated at the stereogenic centre is almost equivalent with the
enantiomeric excess. This observation rules out H/D exchange by the Se2 mechanism.
3.4.9 A nalysis o f T h io p h e n e D eriv a tiv es
As described in Section 3.3, /V-acetyl thienylglycine methyl esters 3k and 31 (Scheme 3.10)
were also synthesised for analysis o f H/D exchange reactions.
O O
O
3k
O
31
Scheme 3.10: Structure o f compounds 3k and 31.
O f specific interest is the possibility o f incorporating heteroaromatic groups into the Hammett
plots depicted in Figure 3.4. The application of the Hammett equation to heterocycles is
discussed in Section 1.8.2.4. If it is shown that the kinetics o f racemisation of compounds 3k
and 31 can be accounted for by the Hammett analysis, it may then be possible to extend this
relationship to predict the rate constants o f H/D exchange for other heteroaromatic /V-acetyl
arylglycine methyl esters.
3.4.9.1 Kinetics o f H/D Exchange fo r 3 k and 31
Reactions of compounds 3k and 31 in deuterated buffers were monitored via *H NMR
spectroscopy. Rate constants o f H/D exchange and hydrolysis were determined for 31.
106

Hydrolysis of 3k was negligible compared to H/D exchange ( < 4 %). Rate constants of H/D
exchange were plotted as a function o f basic buffer component (Figure 3.5).
a)4 0 x 1 0 '' -
1.5x10* -I
5.0x1 O'* -
b)
0.10
[HPO/l/M0.10
[HPO/l/M
Figure 3.5: Relationship between &deut and concentration o f the basic buffer
component for a) 3k b) 31. Experiments carried out at 37 °C with I = 1 M.
Values for ko\ kgb and approximate half-lives of deuteration are collected in Table 3.7.
Table 3.7: kgb and ko’ values for 3k and 31, approximate half-lives of deuteration at
stereocentre o f 3k-l determined in D2O 0.3 M phosphate buffers of pH** 1.4,1= 1 M, 37 °C.
Compound
3k
31
kgb / s lM T kb ! s
(2.74 ± 0.10) x 10’
(5.62 ± 0.35) x 10'
3 -(-2.28 ± 1.32) x 10
(1.16 ± 0.41) x 10'6
ii /2 of deuteration / h
0A
16.5
As was the case for compounds 3a-h, the values o f &o’ displayed in Table 3.7 show that
specific base-catalysed or non-catalysed H/D exchange o f compounds 3k and 31 is negligible.
3.4.9.2 Hammett Analysis
Data for compounds 3k and 31 were added to the Hammett analysis displayed in Figure 3.4,
using the o-values displayed in Table 1.8 (Figure 3.6).
107

F ig u re 3.6: Hammett plots o f data from Table 3.2 and Table 3.7 for general
base-catalysed H/D exchange at the stereogenic centre o f 3 a-h and 3k-l, in
D20 phosphate buffers o f / = 1 M at 37 °C . a) as a function of cr-values (—)
line o f best fit for all data points, p = 2.70 ± 0.02, R2 = 0.968 , (—) line of
best fit for data points were a > 0, p = 2.95 ± 0.03, R2 = 0.980. b) as a
function o f to o ~-values (—) p = 2.35 ± 0.02, R2 = 0.928.
Figure 3.6 shows that the Hammett cr-constants for thiophene heterocycles displayed in Table
1.8 are in reasonable agreement with the experimental rate constants determined for
compounds 3k-l. The value o f kgb for 3k shows best correlation using c-constants with
electron withdrawing compounds only. The value of kgb for 31 shows best correlation using d -
constants. Although neither &gb value for 3k-l fits exactly with the data obtained for
compounds 3a-h, the general characterisation of a 2-thienyl heterocycle as a strongly
electron-withdrawing substituent and 3-thienyl heterocycle as a moderately electron-
withdrawing substituent is supported by this data. The reasonable fit with Hammett plots for
3a-h suggests that H/D exchange for compounds 3k-l also follows the SeI mechanism
proposed for 3a-h.
Using the cr-constants displayed in Table 1.8, we can extrapolate the Hammett plots to predict
the susceptibility to racemisation o f compounds containing other heterocycles. A compound
based on the general scaffold displayed in Scheme 3.1 with a 2-furyl aromatic substituent (cr =
1.08), would therefore be expected to undergo H/D exchange at a rate faster than that seen for
3k. Such a compound would therefore be at particular risk of racemisation under
pharmacological conditions. Based on these ^-constants, a 3-furyl substituted analogue would
be expected to undergo H/D exchange at a rate similar to that seen for 3e (p-Cl substituted
benzene). Pyrrole-substituted analogues would be expected to undergo H/D exchange at much
slower rates, similar to that seen for 3b (p-OH substituted benzene). A pyridine substituted
analogue would be at a high risk o f physiological racemisation. The pK& o f pyridine is 5.23,29
108
so the heteroatom would not be protonated at pH 7.4. However, the cr-values in Table 1.8 still
suggest that at this pH pyridine substituents are very electron-withdrawing {a = 0.45 for 3-
pyridine, o = 0.76 for 4-pyridine) and would hence make racemisation a significant risk.
Although rates o f H/D exchange have not been determined at pH < 5.23, conditions like this
do of course exist in the body. The very high <r-value of a pyridine protonated at the
heteroatom would be cause for concern even though general-base catalysis at low pH would
be far weaker than under conditions investigated in this chapter.
109

3.5 Conclusions
Rate constants for H/D exchange and hydrolysis of compounds 3a-l have been determined
under aqueous conditions in phosphate buffers at physiological pH and temperature. From
this data the following conclusions can be drawn.
First, H/D exchange o f 3 a -l is general-base catalysed by the basic species of the phosphate
buffer at pH** 7.4 (H P 042‘).
Second, H /D exchange o f 3 a-l is o f pharmacological relevance, particularly for those
compounds with more electron-withdrawing aromatic groups.
Third, for compounds 3 a and 3e, studies suggest an Sgl mechanism for H/D exchange and
racemisation. Hammett correlations imply the same mechanism for 3 b -d , f-1.
Fourth, results for 3 k -l show that Hammett plots can be used to extend the scope of our
results, allowing assessment o f racemisation risks for other heterocyclic compounds.
110

3.6 Experimental
3.6.1 G enera l E x p e rim en ta l
All reagents were purchased from Acros Organics, Alfa Aesar, Fluorochem or Sigma-Aldrich.
*H NMR and 13C NMR spectra were recorded on a Bruker DPX 400 or DPX 500
spectrometer. 8 values are reported in ppm downfield from trimethylsilane. HPLC was
performed using an Agilent Technologies 1200 series instrument. Infrared spectra were
obtained using a Varian 7000 FT-IR spectrometer. Samples were applied directly to the
diamond tip. Circular Dichroism spectra were recorded using an Applied Photophysics
Chirascan CD spectrometer. High-resolution mass spectra were obtained on a Waters LCT
Premier XE mass spectrometer.
3.6.2 S yn thesis o f C o m p o u n d s
3.6.2.1 Synthesis o f Arylglycine Ester Hydrochloride Salts (2a-l)
Compounds 2a-l were synthesised from commercially available starting materials la -h , l k-1A
and 11 according to the method outlined by Kudelko and Zielinski (Scheme 3.11).
O0 ©
r o h , s o c i 2 c i .h 3n
Ar
S chem e 3.11: Synthesis o f compounds 2a-l.
The general method outlined below in the synthesis of 2a was used in the synthesis of all
compounds 2a-l, with the appropriate arylglycine starting material and alcohol used.
P heny lg lyc ine m eth y l e s te r h y d ro c h lo r id e (2a)
A suspension of phenylglycine (5 g, 33.1 mmol) in methanol (25 ml) was cooled to 0 °C and
thionyl chloride (6.5 ml, 3.97 g, 33.3 mmol) was added dropwise. The reaction mixture was
allowed to warm to room temperature and left to stir overnight, then solvent was removed
using a rotary evaporator. The crude product was washed with diethyl ether (30 ml) and dried
under reduced pressure to give phenylglycine methyl ester hydrochloride as a white solid
(6.38 g, 31.7 mmol, 96 %).
*H NMR (400 MHz, D20 ) 5 = 7.32-7.39 (m, 5H, -C6H5), 5.15 (s, 1H, -CH(C6H5)-), 3.77 (s,
3H, -COOCH3).
I l l

I3C NMR (100 MHz, D 20 ) 8 = 169.90 (1C, -C(0)OCH3), 131.26 (1C, aromatic), 130.76 (1C,
aromatic), 130.01 (2C, aromatics), 128.32 (2C, aromatics), 56.68 (1C, -CHNH3 ), 54.20 (1C,
-OCH3).
IR (ss) v/cm'1: 3082, 1744, 1552
Found m/z (AP+) = 166.0870, calculated 166.0868
M.p. = 190-192 °C
(R )-(-)-P heny lg lyc ine m e th y l e s te r h y d ro c h lo r id e (2a)
Yield: 95 %, [a f£ = -122.0° (c 1.0, H20 ). Spectroscopic data as for racemate.
M.p. = 191-192 °C
(S )-(+ )-P heny lg lyc ine m e th y l e s te r h y d ro c h lo r id e (2a)
Yield: 93 %, +124.4° (c 1.0, H20 ). Spectroscopic data as for racemate.
M.p. = 191-192 °C
(p -H y d ro x y p h en y l)g ly c in e m e th y l e s te r h y d ro c h lo r id e (2b)
Yield: 99 %
NMR (500 MHz, D20 ) 8 = 7.19 (d, 2H, aromatic CH meta to hydroxyl, V h -h = 8.65 Hz),
6.81 (d, 2H, aromatic CH ortho to hydroxyl, Vh-h = 8.60 Hz), 5.08 (s, 1H, -CH(C6H40H)-),
3.65 (s, 3H, -COOCH3).
13C NMR (125 MHz, D20 ) 5 = 169.83 (1C, -C(0)O CH 3), 157.27 (1C, aromatic carbon ipso to
hydroxyl), 129.87 (2C, aromatic carbon meta to hydroxyl), 122.75 (1C, aromatic carbon para
to hydroxyl), 116.41 (2C, aromatic carbon ortho to hydroxyl), 55.95 (1C, -CHNH3+), 53.90
(1C ,-0C H 3).
IR (ss) v/cm'1: 3285, 3098, 1738, 1541
Found m/z (AP+) = 182.0814, calculated 182.0817
M.p. = 206-208 °C
(p -M eth y lp h en y l)g ly c in e m e th y l e s te r h y d ro c h lo r id e (2c)
Yield: 92 %
*H NMR (500 MHz, D20 ) 5 = 7.23 (s, 4H, -C6H4CH3), 5.13 (s, 1H, -CH(-C6H4CH3)-), 3.69
(s, 3H, -OCH3), 2.24 (s, 3H, -C6H4CH3).
112

13C NMR (100 MHz, D 20 ) 5 = 170.08 (1C, -C (0 )0C H 3), 141.41 (1C, aromatic carbon ipso to
methyl substituent), 130.55 (2C, aromatic carbon ortho to methyl substituent), 128.29 (1C,
aromatic carbon para to methyl substituent), 128.26 (2C, aromatic carbon meta to methyl
substituent), 56.46 (1C, -CHNH3+), 54.17 (1C, -OCH3), 20.64 (1C, -C6H4CH3).
Found m/z (AP+) = 180.1030, calculated 180.1025
IR (ss) v/cm'1: 3031, 1744, 1533
M.p. = 210-211 °C
(p -F lu o ro p h en y l)g ly c in e m e th y l e s te r h y d ro c h lo r id e (2d)
Yield: 92 %
*H NMR (500 MHz, D20 ) 5 = 7.37 (dd, 2H, -C6H4F (aromatic CH meta to fluorine), V H-h =
7.04 Hz, Vh-f = 4.12 Hz), 7.13 (t, 2H, -C6H4F (aromatic CH ortho to fluorine), 3Jh-h = Vh-f =
7.04 Hz), 5.19 (s, 1H, -CH(C6H4F)-), 3.70 (s, 3H, -COOCH3).
,3C NMR (100 MHz, D20 ) 5 = 169.78 (1C, -C (0)O C H 3), 163.77 (d, 1C, aromatic carbon ipso
to fluorine, ^c-f = 246.18 Hz), 130.75 (d, 1C, aromatic carbon meta to fluorine, 3Jc-f = 8-86
Hz), 127.37 (d, 1C, aromatic carbon para to fluorine, V c - f = 3.20 Hz), 116.96 (d, 1C, aromatic
carbon ortho to fluorine, 2J C-f = 22.08 Hz), 56.05 (1C, -CHNH3+), 54.35 (1C, -OCH3).
Found m/z ( A P ) = 184.0777, calculated 184.0774
IR (ss) v/cm'1: 3069, 1758, 1732, 1550
M.p. = 192-193 °C
(p -C h lo ro p h e n y l)g ly c in e m e th y l e s te r h y d ro c h lo r id e (2e)
Yield: 90 %
‘H NMR (400 MHz, D20 ) 5 = 7.37 (d, 2H, aromatic CH, V H-h = 8.60 Hz), 7.30 (d, 2H,
aromatic CH, VHH = 8.60 Hz), 5.17 (s, 1H, -CH(C6H4C1)-), 3.67 (s, 3H, -COOCH,).
I3C NMR (100 MHz, D20 ) 5 = 169.56 (1C, -C(0)OCH3), 136.22 (1C, aromatic), 130.01 (2C,
aromatics), 129.95 (2C, aromatics), 129.85 (1C, aromatic), 56.02 (1C, -CHNH3 ), 54.31 (1C,
-OCH3).
IR (ss) v/cm'1: 3055, 1746, 1548
Found m/z (AP*) = 200.0476, calculated 200.0478
M.p. = 201-202 °C
(5 )-(+ )-(p -C h lo ro p h e n y l)g ly c in e m e th y l e s te r h y d ro c h lo r id e (2e)
113

Yield: 99 %, [cttf£= +120.8° (c 1.0, H2O). !H and 13C NMR spectra as for racemate.
M.p. = 198-199 °C
(w-Fluorophenyl)glycine methyl ester hydrochloride (2f)
Yield: 82 %
*H NMR (400 MHz, D20 ) 5 = 7.41 (dt, 1H, -C6H4F (aromatic CH meta to fluorine), Vh-h =
7.90 Hz, 4J h -f = 6.00 Hz), 7.13-7.19 (m, 3H, -C6H4F (aromatic CH ortho and para to fluorine),
5.20 (s, 1H, -CH(C6H4F)-), 3.70 (s, 3H, -COOCH3).
13C NMR (100 MHz, D20 ) 5 = 169.11 (1C, -C(0 )OCH3), 162.71 (d, 1C, aromatic carbon ipso
to fluorine xJq-f = 245.61 Hz), 132.95 (d, 1C, aromatic carbon meta to fluorine, ipso to rest of' i ' i
molecule, Jq.f = 7.53 Hz), 131.68 (d, 1C, aromatic carbon meta to fluorine, Jq-f = 8.30 Hz),
124.00 (1C, aromatic carbon para to fluorine), 117.43 (d, 1C, aromatic carbon ortho to•y
fluorine and rest of molecule Jq-f = 20.75 Hz), 115.18 (d, 1C, aromatic carbon ortho to
fluorine l / C-r = 23.00 Hz), 55.85 (1C, -CHNHV'), 54.08 (1C, -OCH3).
Found m/z (AP+) = 184.0775, calculated 184.0774
IR (ss) v/cm'1: 3061, 1749, 1560
M.p. = 207-208 °C
(m-Chlorophenyl)glycine methyl ester hydrochloride (2g)
Yield: 90 %
‘H NMR (400 MHz, D20 ) 5 = 7.26-7.42 (m, 4H, -C6H4C1), 5.18 (s, 1H, -CHfCeHtCl)-), 3.69
(s, 3H, -COOCH3).
13C NMR (100 MHz, D20 ) 5 = 169.38 (1C, -C(0)OCH 3), 135.08 (1C, aromatic carbon),
133.03 (1C, aromatic carbon), 131.46 (1C, aromatic carbon), 130.81 (1C, aromatic carbon),
128.40 (1C, aromatic carbon), 126.74 (1C, aromatic carbon), 56.10 (1C, -CHNH3+), 54.35
(1 C ,-OCH3).
Found m/z (AP+) = 200.0476, calculated 200.0482
IR (ss) v/cm'1: 3045, 1780, 1590
M.p. = 209-210 °C
(p-Trifluoromethylphenyl)glycine methyl ester hydrochloride (2h)
Yield = 92 %
114

*H NMR (400 MHz, D20 ) 5 = 7.70 (d, 2H, -C6H4CF3 (aromatic CH ortho to trifluoromethyl),
Vh-h = ^-12 Hz), 7 - 5 3 (d, 2H, -C6H4CF3 (aromatic CH meta to trifluoromethyl), 3J h - h = 8.12
Hz), 5.30 (s, 1H, -CH(C6H4CF3)-), 3.70 (s, 3H, -COOCH3).
13C NMR (100 MHz, D20 ) 5 = 169.28 (1C, -C (0 )0C H 3), 135.15 (s, 1C, aromatic carbon para
to trifluoromethyl), 131.90 (q, 1C, aromatic carbon ipso to trifluoromethyl, 2Jc-f = 32.24 Hz),
129.06 (s, 2C, aromatic carbon meta to trifluoromethyl), 126.88 (q, 2C, aromatic carbon ortho
to trifluoromethyl, V C-f = 3.68 Hz), 124.00 (q, 1C, -CF3, = 270.04 Hz), 56.18 (1C, -
CHNH3+), 54.39 (1C, -OCH3).
Found m/z (AP4) = 234.0741, calculated 234.0742
IR (ss) v /cm 1: 3091, 1730, 1540
M.p. = 180-181 °C
Phenylglycine ethyl ester hydrochloride (2i)
Yield: 91 %
'H NMR (400 MHz, D20 ) 5 = 7.32-7.39 (m, 5H, -C6H5), 5.12 (s, 1H, -CH(C6H5)-), 4.08-4.21
(dq, 2H, -COOCH2CH3), 1.06 (t, 3H, OCH2CH3, 3J H-h = 7.16 Hz).
I3C NMR (100 MHz, D20 ) 6 = 169.42 (1C, -C (0 )0 C H 3), 131.38 (1C, aromatic), 130.76 (1C,
aromatic), 130.03 (2C, aromatics), 128.36 (2C, aromatics), 64.30 (1C, -OCH2CH3), 56.68
(1C, -CHNH3+), 13.39 (1C, -OCH2C H 3).
IR (ss) v/cm'1: 3085, 1740, 1566
Found m/z (ES+) = 180.1033, calculated 180.1025
M.p. = 214-215 °C
Phenylglycine isopropyl ester hydrochloride (2j)
Yield: 83 %
lH NMR (500 MHz, D20 ) 5 = 7.33-7.40 (m, 5H, -C6H5), 5.10 (s, 1H, -CH(C6H5)-), 5.01
(sept, 1H, -COOCH(CH3)2, V H-h = 6.30 Hz), 1.14 (d, 3H, -OCH(CH3)A(CH3)B, VH-h = 6.30
Hz), 1.04 (d, 3H, -OCH(CH3)a(CH3)b, V h -h = 6.25 Hz).
13C NMR (100 MHz, D20 ) 6 = 169.60 (1C, -C (0 )0C H 3), 131.20 (1C, aromatic), 130.46 (1C,
aromatic), 129.76 (2C, aromatics), 128.06 (2C, aromatics), 72.77 (1C, -OCH(CH3)2), 56.65
( 1C, -CHNH3+), 20.71 ( 1C, -OCH(CH3)a(CH3)b), 20.47 ( 1C, -OCH(CH3)A(CH3)B).
Found m/z ( A P ) = 194.1181, calculated 194.1181
IR (ss) v/cm'1: 3098, 1738, 1550115

M.p. = 222-223 °C
(2-Thienyl)glycine methyl ester hydrochloride (2k)
Yield: 87 %
!H NMR (400 MHz, D 2O) 5 = 7.46 (d, 1H, aromatic CH in 3 position, 3J h.h = 5.08 Hz), 7.16
(d, 1H, aromatic CH in 5 position, V H-h = 4.20 Hz), 7.00 (t, 1H, aromatic CH in 4 position,
Vh-h = 5-00 Hz), 5.50 (s, 1H, -CHNH3+), 3.71 (s, 3H, -OCH3).
,3C NMR (100 MHz, D20 ) 5 = 169.08 (1C, -C(0)O CH 3), 131.83 (1C, aromatic C in 1
position), 130.10 (1C, aromatic C in 4 position), 129.36 (1C, aromatic C in 5 position),
128.20 (1C aromatic C in 3 position), 54.43 (1C, -CHNH3+), 51.79 (1C, -OCH3).
IR (ss) v/cm'1: 3051, 1745, 1530
Found m/z (A P^ = 172.0430, calculated 172.0432
M.p. = 189-190 °C
(3-Thienyl)glycine methyl ester hydrochloride (21)
Yield: 90 %
*H NMR (500 MHz, D20 ) 5 = 7.60 (m, 1H, aromatic C H in 4 position), 7.51 (m, 1H,
aromatic C H in 2 position), 7.12 (m, 1H, aromatic C H in 5 position), 5.38 (s, 1H, - C H N H 3+ ) ,
3.76 (s, 3H, - O C H 3 ) .
13C NMR (125 MHz, D20 ) 5 = 169.35 (1C, -C(0)O CH 3), 130.75 (1C, aromatic C in 1
position), 128.67 (1C, aromatic C in 5 position), 127.14 (1C, aromatic C in 2 position),
126.06 (1C, aromatic C in 4 position), 54.12 (1C, -CHNH3+), 51.91 (1C ,-0C H 3).
IR (ss) v/cm'1: 3042, 1740, 1560
Found m/z (ES+) = 172.0429, calculated 172.0432
M.p. = 197-198 °C
3.6.2.2 Synthesis ofN-AcetyI Arylglycine Esters (3a-l)
Compounds 3a-l were synthesised from compounds 2a-l according to the method outlined by
Kudelko and Zielinski (Scheme 3.12).30
116

o o0 © CI.H3 N
ORN aH C 03, Ac20
OR
Ar O Ar
Scheme 3.12: Synthesis o f compounds 3a-l.
The general method outlined below in the synthesis of 3a was used in synthesis o f all
compounds 3a-l.
TV-Acetyl phenylglycine methyl ester (3a)
Phenylglycine methyl ester hydrochloride (2 g, 9.9 mmol) was dissolved in cold water (20
ml). Sodium hydrogen carbonate (2.13 g, 2.5 equiv., 25 mmol) was added and the mixture
was stirred until carbon dioxide liberation was complete. Acetic anhydride (1 ml, 10.5 mmol)
was added dropwise and the mixture stirred for 1 hour. The solution was cooled to 0 °C and
the precipitate filtered off and recrystallised from isopropanol to give TV-acetyl phenylglycine
methyl ester as a white solid (1.67 g, 8.1 mmol, 82 %).
‘H NMR (400 MHz, d6-DMSO) 5 = 8.74 (d, 1H, -NH-, V H-h = 6.96 Hz), 7.34-7.39 (m, 5H, -
C6H5), 5.39 (d, 1H, -CH(C6H5)-, V h - h = 7.12 Hz), 3.62 (s, 3H, -OCH3), 1.90 (s, 3H,
CH3C(0)-).
I3C NMR (100 MHz, d6-DMSO) 8 = 171.57 (1C, CH3C(0)-), 169.68 (1C, -C(0)OCH3),
136.63 (1C, aromatic), 129.07 (2C, aromatics), 128.63 (1C, aromatic), 128.15 (2C,
aromatics), 56.63 (1C, - CH(C6H 5)-), 52.55 (1C, -OCH3), 22.50 (1C, -C(0)CH 3).
IR (ss) v /cm 1: 3311, 1746, 1650, 1523
Found m/z (EI+) = 207.0897, calculated 207.0895
M.p. = 81-82 °C
(*)-(-) -TV-Acetyl phenylglycine methyl ester (3a)
Yield: 70 %, [a]^= -174.8° (c 1.0, MeOH). Spectroscopic data as for racemate.
M.p. = 80-82 °C
(5)-(+)-A-Acetyl phenylglycine methyl ester (3a)
Yield: 76 %, [a]2= +169.4° (c 1.0, MeOH). Spectroscopic data as for racemate.
M.p. = 81-82 °C
A-Acetyl (p-hydroxy phenyl)glycine methyl ester (3b)
Yield: 63 %117

]H NMR (400 MHz, d6-DMSO) 5 = 9.60 (s, 1H, -C6H4OH), 8.59 (d, 1H, -NH-, VH-h = 6.76
Hz), 7.17 (d, 2H, aromatic CH meta to hydroxy, Vh-h = 8.56 Hz), 6.76 (d, 2H, aromatic CH
ortho to hydroxy, V H-h = 8.48 Hz), 5.23 (d, 1H, -CH(C6H40H)-, V H-h = 6.76 Hz), 3.60 (s,
3H, -OCH3), 1.88 (s, 3H, CH3C(0)-).
13C NMR (125 MHz, d6-DMSO) 5 = 171.49 (1C, CH3C(0)-), 169.21 (1C, -C (0)0C H 3),
157.38 (1C, aromatic carbon ipso to hydroxyl), 128.93 (2C, aromatic carbons meta to
hydroxyl), 126.14 (1C, aromatic carbon para to hydroxyl), 115.27 (2C, aromatic carbons
ortho to hydroxyl), 55.72 (1C, - CH(C6H4OH)-), 51.86 (1C, -OCH3), 21.97 (1C, -C(0)CH3).
IR(ss) v /cm 1: 3353, 1732, 1612, 1539, 1515
Found m/z (EI+) = 223.0842, calculated 223.0845
M.p. = 176-177 °C
TV-Acetyl (p-methyl phenyl)glycine methyl ester (3c)
Yield: 80 %
'H NMR (500 MHz, d6-DMSO) 6 = 8.68 (d, 1H, -NH-, VH.H = 7.00 Hz), 7.26 (d, 2H,
aromatic CH meta to methyl group, ./h-h = 8.05 Hz), 7.19 (d, 2H, aromatic CH ortho to
methyl group, VH.H = 7.90 Hz), 5.33 (d, 1H, -CH(C6FL,CH3)-, V h - h = 7.05 Hz), 3.61 (s, 3H, -
OCH3), 2.30 (s, 3H, -C6H4CH 3), 1.89 (s, 3H, CH3C(0)-).
I3C NMR (125 MHz, d6-DMSO) 8 = 171.28 (1C, CH3C(0)-), 169.24 (1C, -C (0)0C H 3),
137.57 (1C, aromatic), 133.27 (1C, aromatic), 129.16 (2C, aromatics), 127.62 (2C,
aromatics), 55.97 (1C, - CH(C6H4CH3)-), 52.07 (1C, -OCH3), 22.11 (1C, -C(0)CH3), 20.63
(1C ,-C 6H4CH3).
IR (ss) v/cm'1: 3278, 1748, 1648, 1537, 1514
Found m/z (EI+) = 221.1051, calculated 221.1052
M.p. = 110-111 °C
/V-Acetyl (p-fluoro phenyl)glycine methyl ester (3d)
Yield: 71 %
‘H NMR (500 MHz, d6-DMSO) 5 = 8.76 (d, 1H, -NH-, V H.H = 7.00 Hz), 7.44 (dd, 2H, -
C6H4F (aromatic CH meta to fluorine), V h-h = 8.50 Hz, V h-f = 5.50 Hz), 7.23 (t, 2H,
(aromatic CH ortho to fluorine), V h-h = V h-f = 8.80 Hz), 5.42 (d, 1H, -CH(C6H4F)-, V h-h =
7.10 Hz), 3.62 (s, 3H, -OCH3), 1.90 (s, 3H, CH3C(0)-).
118

13C NMR (125 MHz, d6-DMSO) 5 = 171.04 (1C, CH3C(0)-), 169.24 (1C, -C(0)OCH3),
161.88 (d, 1C, aromatic carbon ipso to fluorine, V c -f = 243.06 Hz), 132.61 (d, 1C, aromatic
carbon para to fluorine, V c - f = 3.1 Hz), 129.87 (d, 2C, aromatic carbon meta to fluorine, V c - f
= 8.36 Hz), 115.45 (d, 2C, carbon ortho to fluorine, V c - f = 21.59 Hz) , 55.44 (1C, -
CH(C6H4F)-), 52.22 (1C, -OCH3), 22.12 (1C, -C(0)CH3).
IR (ss) v /cm 1: 3308, 1756, 1734, 1650, 1533, 1507
Found m/z (El*) = 225.0807, calculated 225.0801
M.p. = 96-97 °C
/V-Acetyl (p-chloro phenyl)glycine methyl ester (3e)
Yield: 74 %
]H NMR (500 MHz, d6-DMSO) 5 = 8.79 (d, 1H, -NH-, V h-h = 6.12 Hz), 7.46 (d, 2H,
aromatic CH, V h-h = 7.92 Hz), 7.41 (d, 2H, aromatic CH, 3J h-h = 6.64 Hz), 5.43 (d, 1H, -
CH(C6H4C1)-, V h -h = 7.04 Hz), 3.62 (s, 3H, -OCH3), 1.90 (s, 3H, CH3C(0)-).
13C NMR (125 MHz, d6-DMSO) 5 = 171.24 (1C, CH3C(0)-), 169.68 (1C, -C(0)OCH3),
135.74 (1C, aromatic), 133.28 (1C, aromatic), 130.04 (2C, aromatics), 129.00 (2C,
aromatics), 55.83 (1C, - CH^eHUCl)-), 52.69 (1C, -OCH3), 22.47 (1C, -C(0)CH3).
IR (ss) v/cm'1: 3289, 1754, 1738, 1650, 1533
Found m/z (EC) = 241.0506, calculated 241.0506
M.p. = 126-128 °C
(5)-(+)-Ar-Acetyl (p-chloro phenyl)glycine methyl ester (3e)
Yield: 73 %, [a]2= +166.0° (c 1.0, MeOH). Spectroscopic data as for racemate.
M.p. = 117-119 °C
/V-Acetyl (m-fluoro phenyl)glycine methyl ester (3f)
Yield: 61 %
‘H NMR (400 MHz, d6-DMSO) 5 = 8.81 (d, 1H, -NH-, V H-h = 7.32 Hz), 7.44 (q, 1H,
aromatic CH meta to fluorine, V h -h = V h - f = 6.92 Hz), 7.17-7.25 (m, 3H, aromatic CH ortho
and para to fluorine), 5.47 (d, 1H, -CH(C6H4F)-, V h -h = 7.32 Hz), 3.63 (s, 3H, -OCH3), 1.91
(s, 3H, CH3C(0)-).
13C NMR (125 MHz, d6-DMSO) 5 = 170.71 (1C, CH3C(0)-), 169.30 (1C, -C(0)OCH3),
162.03 (d, 1C, aromatic carbon ipso to fluorine Vc-f = 242.28 Hz), 139.01 (d, 1C, aromatic
119

carbon meta to fluorine, ipso to rest of molecule, V c - f = 7.11 Hz), 130.64 (d, 1C, aromatic
carbon meta to fluorine, Vc-f = 8.25 Hz), 123.93 (d, 1C, aromatic carbon para to fluorine, V c_
f = 1.68 Hz), 115.07 (d, 1C, aromatic carbon ortho to fluorine and rest of molecule Jc-v =
20.56 Hz), 114.57 (d, 1C, aromatic carbon ortho to fluorine Vc-f = 22.33 Hz), 55.61 (1C, -
CH(C6H4C1)-), 52.34 (1C, -OCH3), 22.13 (1C, CH3C(0)-).
IR (ss) v/cm'1: 3291, 1746, 1646, 1530
Found m/z (EI+) = 225.0799, calculated 225.0801
M.p. = 89-91 °C
/V-Acetyl (m-chloro phenyl)glycine methyl ester (3g)
Yield: 61 %
NMR (500 MHz, d6-DMSO) 5 = 8.83 (d, 1H, -NH-, V H-h = 7.15 Hz), 7.35-7.48 (m, 4H, -
C6H4C1), 5.47 (d, 1H, -C H ^H ^C l)- , V H.H = 7.30 Hz), 3.64 (s, 3H, -OCH3), 1.91 (s, 3H,
CH3C(0)-).
13C NMR (125 MHz, d6-DMSO) 5 = 170.67 (1C, CH3C(0)-), 169.29 (1C, -C(0)OCH3),
138.78 (1C, aromatic), 133.17 (1C, aromatic), 130.50 (1C, aromatic), 128.18 (1C, aromatic),
127.52 (1C, aromatic), 126.57 (1C, aromatic), 55.58 (1C, - C H ^F C C l)-), 52.37 (1C, -
OCH3), 22.13 (1C, -C(0)CH 3).
IR (ss) v/cm'1: 3278, 1499, 1655, 1531
Found m/z (EI+) = 241.0499, calculated 241.0506
M.p. = 66-67 °C
7V-Acetyl (p-trifluoromethyl phenyl)glycine methyl ester (3h)
Yield: 80 %
lH NMR (400 MHz, d6-DMSO) 5 = 8.90 (d, 1H, -NH-, V H-h = 7.28 Hz), 7.77 (d, 2H,
aromatic CH, V h -h = 8.24 Hz), 7.62 (d, 2H, aromatic CH, V h -h = 8.16 Hz), 5.58 (d, 1H, -
CH(C6H4CF3)-, V h -h = 2.28 Hz), 3.64 (s, 3H, -OCH3), 1.91 (s, 3H, CH3C(0)-).
13C NMR (100 MHz, DMSO) 5 = 170.93 (1C, CH3C(0)-), 169.73 (1C, -C(0)OCH3), 141.51
(s, 1C, aromatic carbon para to trifluoromethyl), 129.13 (q, 1C, aromatic carbon ipso to
trifluoromethyl, J c - f = 31.79 Hz), 129.03 (s, 2C, aromatic carbon meta to trifluoromethyl),
125.89 (q, 2C, aromatic carbon ortho to trifluoromethyl, V c - f = 3.68 Hz), 124.44 (q, 1C, -CF3,
Vc-f = 270.56 Hz), 56.11 (1C, - CH(C6H4CF3)-), 52.79 (1C, -OCH3), 22.49 (1C, -C(0)CH3).
IR (ss) v/cm'1: 3309, 1739, 1643, 1531
120

Found m/z (El*) = 275.0776, calculated 275.0769
M.p. = 96-98 °C
.Y-Acetyl phenylglycine ethyl ester (3i)
Yield: 83 %
'H NMR (400 MHz, d6-DMSO) 5 = 8.73 (d, 1H, -NH-, 3J H-h = 7.08 Hz), 7.32-7.39 (m, 5H, -
C6H5), 5.36 (d, 1H, -CH(C6H5)-, Vh-h = 712 Hz)> 4.03-4.14 (dq, 2H, -OCH2CH3), 1.90 (s,
3H, CH3C(0)-), 1.12 (t, 3H, OCH2CH3, V H-h = 7.16 Hz).
I3C NMR (100 MHz, d6-DMSO) 5 = 171.05 (1C, CH3C (0)-), 169.67 (1C, -C (0)0C H 3),
136.67 (1C, aromatic), 129.04 (2C, aromatics), 128.59 (1C, aromatic), 128.11 (2C,
aromatics), 61.19 (1C, -OCH2CH3), 56.73 (1C, - CH(C6H5)-), 22.50 (1C, -C(0)CH3), 14.29
(1C, -OCH2CH3).
IR (ss) v/cm'1: 3314, 1731, 1649, 1535
Found m/z (AP+) = 222.1138, 222.1130
M.p. = 85-86 °C
A-Acetyl phenylglycine isopropyl ester (3j)
Yield: 82 %
'H NMR (500 MHz, d6-DMSO) 8 = 8.69 (d, 1H, -NH-, VHH = 7.05 Hz), 7.32-7.39 (m, 5H, -
C6H5), 5.34 (d, 1H, -CH(C6H5)-, V H - h = 7.20 Hz), 4.90 (sept, 1H, -OCH(CH3)2, V H - h = 6.20
Hz), 1.90 (s, 3H, CH3C(0)-), 1.19 (d, 3H, -OCH(CH3)A(CH3)B, V h - h = 6.20 Hz), 1.04 (d, 3H,
-OCH(CH3)a(CH3)b, V h - h = 6.20 Hz).
I3C NMR (125 MHz, d6-DMSO) 8 = 170.11 (1C, CH3C (0)-), 169.25 (1C, -C(0)OCH3),
136.41 (1C, aromatic), 128.58 (2C, aromatic), 128.10 (1C, aromatic), 127.61 (2C, aromatic),
68.28 (1C, -OCH(CH3)2), 56.46 (1C, - CH(C6H5)-), 22.11 (1C, -C(0)CH3), 21.40 (1C, -
OCH(CH3)a(CH3)b), 21.15 (1C, -OCH(CH3)a(CH3)b).
IR (ss) v/cm-1: 3302, 1723, 1648, 1538
Found m/z (EI+) = 235.1208, calculated 235.1208
M.p. = 102-104 °C
N-Acetyl (2-thienyl)glycine methyl ester (3k)
Yield: 69 %
121

‘H NMR (400 MHz, d6-DMSO) 6 = 8.87 (d , 1H, -NH-, V H-h = 7.04 Hz), 7.53 (dd, 1H,
aromatic CH in 3 position, V h -h = 5.12 Hz, V h -h = 112 Hz), 7.11 (d, 1H, aromatic CH in 5
position, V h -h = 3.40 Hz), 7.02 (dd, CH in 4 position, V h -h = 5.08 Hz, V h -h = 3.60 Hz), 5.64
(d, 1H, -CHNH3\ V h -h = 7.08 Hz), 3.67 (s, 3H, -OCH3), 1.90 (s, 3H, -COCHj).
13C NMR (100 MHz, d6-DMSO) 5 = 170.77 (1C, CH3CO-), 169.69 (1C, -COOCH3), 138.36
(1C, aromatic CH in 1 position), 127.29 (2C, aromatic CH in 4 and 5 positions), 126.92 (1C,
aromatic CH in 3 position), 52.82 (1C, -CNHAc), 52.02 (1C, -OCH3), 22.40 (1C, -C(0)CH3).
IR (ss) v /cm 1: 3239, 1746, 1641, 1540
Found m/z (AP+) = 214.0532, calculated 214.0538
M.p. = 91-93 °C
A-Acetyl (3-thienyl)glycine methyl ester (31)
Yield: 73 %
'H NMR (500 MHz, d6-DMSO) 5 = 8.72 (d, 1H, -NH-, V H-h = 7.20 Hz), 7.56 (dd, 1H,
aromatic CH in 4 position, V h -h = 4.95 Hz, V h -h = 2.95 Hz), 7.53 (m, 1H, aromatic CH in 2
position), 7.12 (dd, 1H, aromatic CH in 5 position, V h -h = 4.95 Hz, V h -h = 1 -65 Hz), 5.49 (d,
1H, -CHNHAc, V h -h = 7.25 Hz), 3.64 (s, 3H, -OCH3), 1.90 (s, 3H, -COCH3).
13C NMR (125 MHz, d6-DMSO) 5 = 170.94 (1C, CH3CO-), 169.29 (1C, -COOCH3), 136.29
(1C, aromatic CH in 1 position), 127.04 (1C, aromatic CH in 5 position), 126.81 (1C,
aromatic CH in 2 position), 123.78 (1C, aromatic CH in 4 position), 52.14 (1C, -CNHAc),
52.02 (1C, -OCH3), 22.09 (1C, -C (0)C H 3).
IR (ss) v/cm'1: 3237, 1746, 1636, 1541
Found m/z (AP+) = 214.0545, calculated 214.0538
M.p. = 108-109 °C
3.6.2.3 Synthesis ofN-Acetyl Phenylglycines (4a, c-e, i-h)
Compounds 4a, c-e, i-h were synthesised from compounds la , c-e, i-h according to the
method outlined by de Boer et a l? x
122
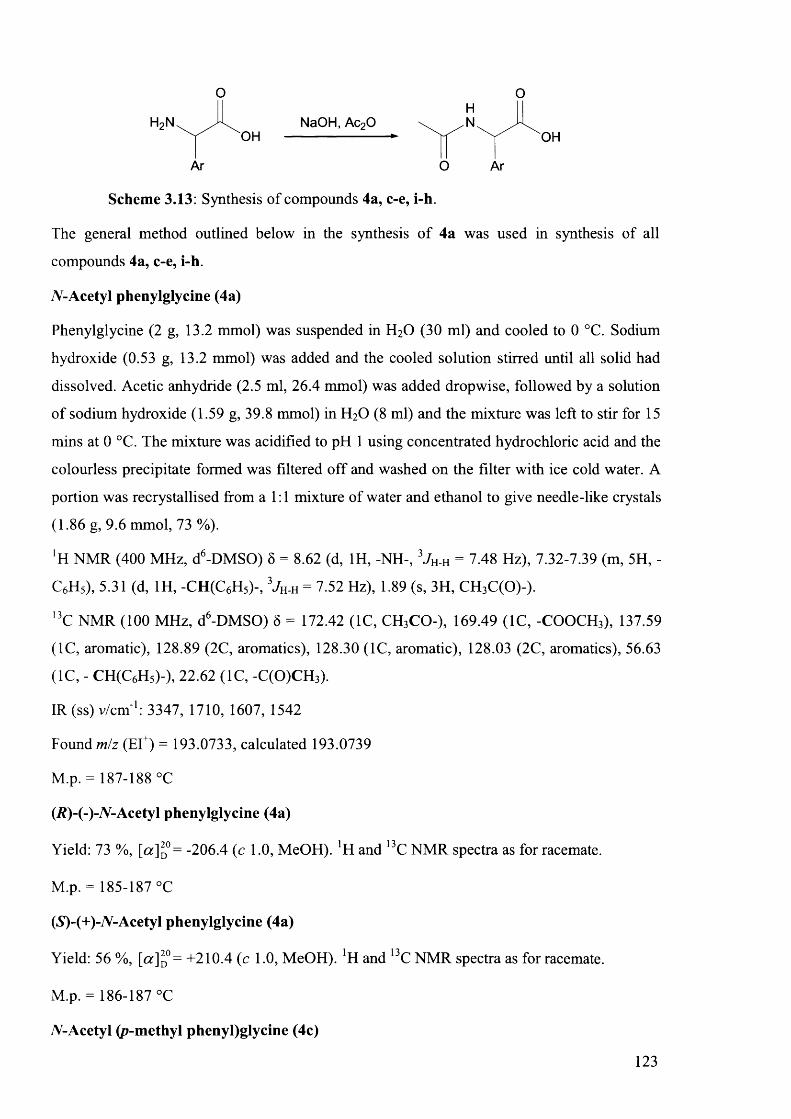
o o
OHN aO H , A c20
OH
Ar O Ar
Scheme 3.13: Synthesis of compounds 4a, c-e, i-h.
The general method outlined below in the synthesis o f 4a was used in synthesis of all
compounds 4a, c-e, i-h.
TV-Acetyl phenylglycine (4a)
Phenylglycine (2 g, 13.2 mmol) was suspended in H2O (30 ml) and cooled to 0 °C. Sodium
hydroxide (0.53 g, 13.2 mmol) was added and the cooled solution stirred until all solid had
dissolved. Acetic anhydride (2.5 ml, 26.4 mmol) was added dropwise, followed by a solution
of sodium hydroxide (1.59 g, 39.8 mmol) in H2O (8 ml) and the mixture was left to stir for 15
mins at 0 °C. The mixture was acidified to pH 1 using concentrated hydrochloric acid and the
colourless precipitate formed was filtered off and washed on the filter with ice cold water. A
portion was recrystallised from a 1:1 mixture of water and ethanol to give needle-like crystals
(1.86 g, 9.6 mmol, 73 %).
'H NMR (400 MHz, d6-DMSO) 8 = 8.62 (d, 1H, -NH-, l / HH = 7.48 Hz), 7.32-7.39 (m, 5H, -
C6H5), 5.31 (d, 1H, -CH(C6H5)-, 3J„.h = 7.52 Hz), 1.89 (s, 3H, CH3C(0)-).
I3C NMR (100 MHz, d6-DMSO) 8 = 172.42 (1C, CH3CO-), 169.49 (1C, -COOCH3), 137.59
(1C, aromatic), 128.89 (2C, aromatics), 128.30 (1C, aromatic), 128.03 (2C, aromatics), 56.63
( 1C, - CH(C6H5)-), 22.62 ( 1C, -C (0)C H 3).
IR (ss) v/cm'1: 3347, 1710, 1607, 1542
Found m/z (EI+) = 193.0733, calculated 193.0739
M.p. = 187-188 °C
(R)-(-)-N-Acetyl phenylglycine (4a)
Yield: 73 %, [ a ^ = -206.4 (c 1.0, MeOH). !H and 13C NMR spectra as for racemate.
M.p. = 185-187 °C
(V)-(+)-/Y-Acetyl phenylglycine (4a)
Yield: 56 %, [« ]d° = +210.4 (c 1.0, MeOH). *H and 13C NMR spectra as for racemate.
M.p. = 186-187 °C
TV-Acetyl (p-methyl phenyl)glycine (4c)
123

Yield: 94 %
'H NMR (400 MHz, d6-DMSO) 5 = 8.56 (d, 1H, -NH-, V H.H = 7 48 Hz), 7.26 (d, 2H,
aromatic CH meta to methyl group, Jh-h = 8.08 Hz), 7.18(d, 2H, aromatic CH ortho to
methyl group, 3J H.H = 8.00 Hz), 5.25 (d, 1H, -CHNHAc, V H-h = 7.44 Hz), 2.29 (s, 3H, -
C6H4CH3), 1.88 (s, 3H, CH3C(0)-).
13C NMR (100 MHz, d6-DMSO) 8 = 172.54 (1C, CH3CO-), 169.42 (1C, -COOCH3), 137.56
(1C, aromatic), 134.58 (1C, aromatics), 129.39 (2C, aromatic), 127.92 (2C, aromatics), 56.34
( 1C, - CH(C6H4CH3)-), 22.61 (1C, -C(0)CH 3), 21.04 (1C, C6H4CH3).
IR (ss) v/cm'1: 3332, 1713, 1592, 1541
Found m/z (EI+) = 207.0891, calculated 207.0895
M.p. = 235-236 °C
7V-Acetyl (p-fluoro phenyl)glycine (4d)
Yield: 64 %
!H NMR (400 MHz, d6-DMSO) 5 = 8.69 (d, 1H, -NH-, V H-h = 7.48 Hz), 7.48 (dd, 2H, -
C6H4F (aromatic CH meta to fluorine), VH-h = 8.72 Hz, V H-f = 5.52 Hz), 7.27 (t, 2H,
(aromatic CH ortho to fluorine), VH-h ~ 3 h-f = 8.84 Hz), 5.39 (d, 1H, -CH(C6H4F)-, VH-h =
7.52 Hz), 1.95 (s, 3H, CH3C(0)-).
13C NMR (100 MHz, d6-DMSO) 5 = 172.30 (1C, CH3C (0)-), 169.45 (1C, -C (0)0C H 3),
162.10 (d, 1C, aromatic carbon ipso to fluorine, Vc-f = 242.38 Hz), 133.92 (d, 1C, aromatic
carbon para to fluorine, Vc-f = 3.08 Hz), 130.08 (d, 2C, aromatic carbon meta to fluorine, Vc-
f = 8.23 Hz), 115.68 (d, 2C, carbon ortho to fluorine, Vc-f = 21.37 Hz) , 55.84 (1C, -
CH(C6H4F)-), 22.61 (1C, -C(0)CH 3).
IR (ss) v/cm'1: 3337, 1719, 1607, 1540, 1507
Found m/z (EI+) = 211.0640, calculated 211.0645
M.p. = 194-195 °C
A-Acetyl (p-chloro phenyl)glycine (4e)
Yield: 86 %
'H NMR (400 MHz, d6-DMSO) 5 = 8.67 (d, 1H, -NH-, Vh-h = 7.48 Hz), 7.45 (d, 2H,
aromatic CH, Vh-h = 8.52 Hz), 7.41 (d, 2H, aromatic CH, Vh-h = 8.44 Hz), 5.35 (d, 1H, -
CH(C6H4C1)-, V h.h = 7.52 Hz), 1.89 (s, 3H, CH3C(0)-).
124

,3C NMR (100 MHz, d6-DMSO) 5 = 172.06 (1C, CH3C (0)-), 169.48 (1C, -C(0)OCH 3),
136.75 (1C, aromatic), 132.93 (1C, aromatic), 129.88 (2C, aromatics), 128.85 (2C,
aromatics), 55.90 (1C, - CH(C6H4C1)-), 22.62 (1C, -C (0)CH 3).
IR (ss) v /cm 1: 3333, 1714, 1593, 1537
Found m/z (EI+) = 227.0345, calculated 227.0349
M.p. = 208-210 °C
(S)-(+)-7V-Acetyl (p-chloro phenyl)glycine (4e)
Yield: 80 %, [a fD°= +206.2° (c 1.0, MeOH)
M.p. = 189 °C
N-Acetyl (m-chloro phenyl)glycine (4g)
Yield: 66 %
'H NMR (500 MHz, d6-DMSO) 5 = 8.74 (d, 1H, -NH-, 3JH.H = 7.64 Hz), 7.39-7.50 (m, 4H, -
CsHjCl), 5.41 (d, 1H, -CH(C6H4C1)-, 3JH-h = 7.64 Hz), 1.94 (s, 3H, CH3C(0)-).
I3C NMR (100 MHz, d6-DMSO) 5 = 171.89 (1C, CH3C (0)-), 169.51 (1C, -C(0)OCH3),
140.15 (1C, aromatic), 133.43 (1C, aromatic), 130.77 (1C, aromatic), 128.25 (1C, aromatic),
127.74 (1C, aromatic), 126.85 (1C, aromatic), 56.03 (1C, - CH(C6H4C1)-), 22.63 (1C, -
C (0)C H 3).
IR(ss) v/cm'1: 3342, 1718, 1601, 1533
Found m/z ( E f ) = 227.0348, calculated 227.0349
M.p. = 173-174 °C
/V-Acetyl (p-trifluoromethyl phenyl)glycine (4g)
Yield: 85 %
‘H NMR (400 MHz, d6-DMSO) 5 = 8.81 (d, 1H, -NH-, V H.H = 7.60 Hz), 7.80 (d, 2H,
aromatic CH, V h-h = 8.24 Hz), 7.66 (d, 2H, aromatic CH, V h-h = 8.12 Hz), 5.52 (d, 1H, -
CH(C6H4CF3)-, V h-h = 7.64 Hz), 1.96 (s, 3H, CH3C(0)-).
I3C NMR (100 MHz, DMSO) 5 = 171.73 (1C, CH3C (0)-), 169.52 (1C, -C(0)OCH3), 142.54
(s, 1C, aromatic carbon para to trifluoromethyl), 128.84 (s, 2C, aromatic carbon meta to
trifluoromethyl), 128.80 (q, 1C, aromatic carbon ipso to trifluoromethyl, V c-f = 31.83 Hz),
125.78 (q, 2C, aromatic carbon ortho to trifluoromethyl, V c-f = 3.75 Hz), 124.72 (q, 1C, -CF3,
V c -f = 270.12 Hz), 56.19 (1C, - CH(C6H4CF3)-), 22.62 (1C, -C(0)CH3).
125

IR (ss) v/cm'1: 3355, 1724, 1598, 1535
Found m/z (EF) = 260.0533, calculated 260.0535
M.p. = 202-203 °C
3.6.3 P ro to n -D eu te r iu m Exchange R eactions Follow ed by XH NMR S p ec tro scopy
3.6.3.1 Experimental Procedure
Buffers for H/D exchange experiments were prepared as follows. The appropriate quantity of
NaH2P04 for the desired buffer concentration was dissolved in D2O. The ionic strength was
made to 1 M using NaCl. The desired pH** was obtained through adding portions of
NaOD/D20 solution whilst monitoring the pH.
H/D exchange experiments were carried out as follows. 1 ml solutions of approximately 0.005
M concentration of the compound for analysis in the appropriate buffer solution were
prepared in Eppendorf vials. The vial was vortexed to aid dissolution, and the contents filtered
to ensure no solid remained. The resulting solution was then placed in a sealed NMR tube
which was maintained at 37 °C using a thermostatted water bath. The tube was removed from
the water bath at intervals as required for analysis by *H NMR spectroscopy, then returned to
the water bath. The hydrolysis reaction of compounds 3a-l produces the carboxylic acid,
which lowers the pH**. As a result, the pH** of the reaction mixture was monitored using a
micro pH meter and maintained at the desired pH** ± 0.05 by addition of aliquots of a 0.01 M
NaOD/D20 solution as required. Initial experiments showed that H/D exchange and
hydrolysis reactions obeyed pseudo-first-order rate law and hence rate constants are
independent o f initial concentration.
Compound 3k underwent H/D exchange too rapidly to adequately monitor the reaction
through the previously described method. As such, the compound was dissolved in the
appropriate buffer in an NMR tube as described previously, and the NMR tube was placed in
the probe of the NMR spectrometer, which was maintained at 37 °C and spectra were
recorded every 15 minutes. As hydrolysis rates for 3k were small in respect to H/D exchange,
pH** adjustments were not required.
3.6.3.2 Interpretation of 1H NMR Spectra
Spinworks 2.5.5 was used to analyse *H NMR spectra. The analysis in this chapter was based
on the integration o f the peaks corresponding to the protons bound to the stereogenic centre in126

compounds 3a-l and 4a-h, k-1. The integration o f these peaks was relative to the peaks for the
aromatic protons. The data was ‘normalised’ according to the number of aromatic protons.
For example, when analysing compounds 3a, i-j, the integrations of the
stereogenic-centre-bound proton relative to the aromatic protons were multiplied by five, as
3a has five aromatic protons. For compounds 3c-h, the signal was multiplied by four. As the
two aromatic peaks in compound 3b have rather different chemical shifts (~0.4 ppm), it was
decided to base the integration on only the farthest up field peak (7.17 ppm) to avoid errors
resulting from integrating over large stretches of baseline. As such the signal was normalised
by a factor of two. Integrals for 3k were normalised based on the aromatic thiophene peak at
7.53 ppm. Integrals for 31 were normalised based on the aromatic thiophene peak at 7.12 ppm.
3.6.3.3 Interpretation of Data
The analysis of the data for compound 3a in deuterated buffer shall be used as an example to
illustrate the method by which the data was interpreted for all compounds 3a-l.
The relative peak integration corresponding to the proton bound to the stereogenic centre for
both 3a and 4a can be used to calculate the proportion of molecules which have been
deuterated at the stereogenic centre. This value can be obtained by subtracting the relative
intensity of both from the initial relative intensity o f the protons bound to the stereogenic
centre (eqn 3.5).
[3a° ] + [4a° ] = [3aH ]0 - {[3aH ] + [4aH ]} (3.5)
where [3a°] is the concentration o f 3a with a deuteron bound to the stereogenic centre, [4a°]
is the concentration o f 4a with a deuteron bound to the stereogenic centre, [3aH] is the
concentration of 3a with a proton bound to the stereogenic centre, [4aH] is the concentrationu
of 4a with a proton bound to the stereogenic centre and [3a ]o is the starting concentration of
3a with a proton bound to the stereogenic centre.
[3aH], [4aH] and {[3aD] + [4a°]} were plotted as a function of time (Figure 3.7).
127
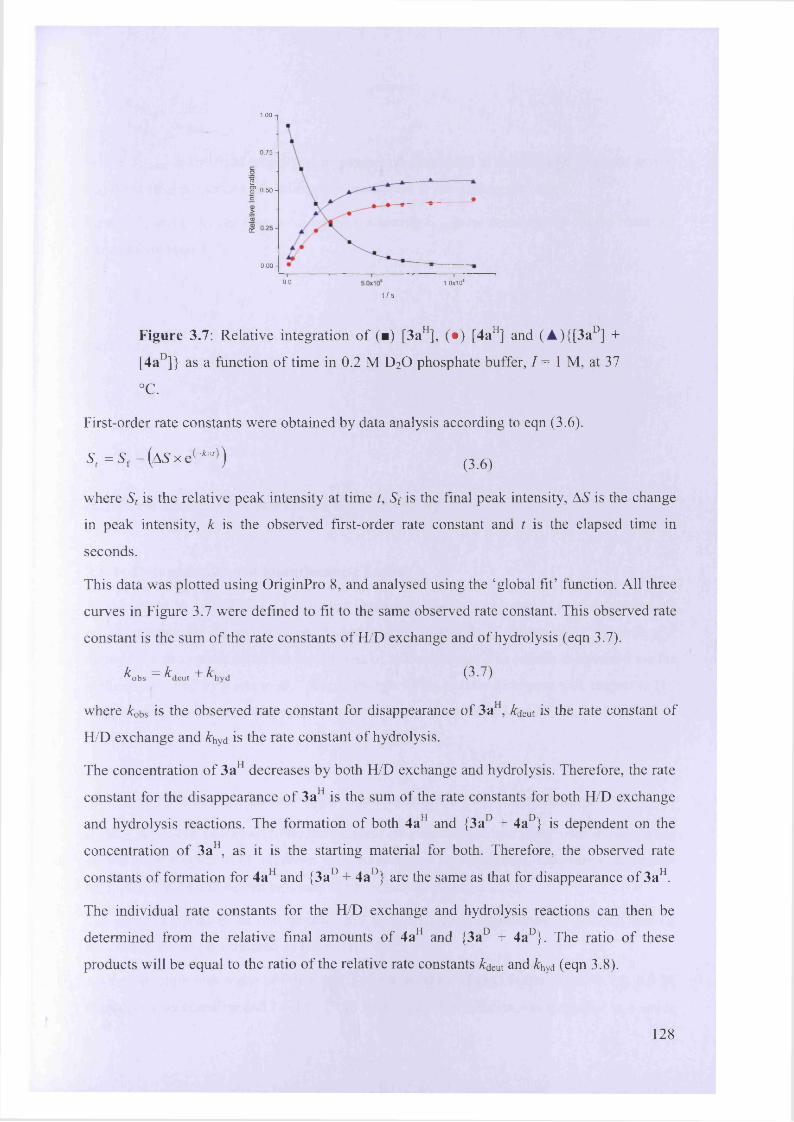
1.00
0.75-
O2£ 0.50-c
>—aa .
o .o o -
1.0x10⁶o.o
t / s
Figure 3.7: Relative integration of (■) [3aH], (• ) [4aH] and (A){[3a°] +
[4a°]} as a function of time in 0.2 M D20 phosphate buffer, I = 1 M, at 37
°C .
First-order rate constants were obtained by data analysis according to eqn (3.6).
S ,= S f -(&Sxe<-**>) (3.6)
where St is the relative peak intensity at time t, Sf is the final peak intensity, AS is the change
in peak intensity, k is the observed first-order rate constant and t is the elapsed time in
seconds.
This data was plotted using OriginPro 8, and analysed using the ‘global fit’ function. All three
curves in Figure 3.7 were defined to fit to the same observed rate constant. This observed rate
constant is the sum of the rate constants of H/D exchange and of hydrolysis (eqn 3.7).
* o b s = fcdeu, + * h y d ( 3 -7 >
TT
where &0bs is the observed rate constant for disappearance of 3a , &deut is the rate constant of
H/D exchange and khyd is the rate constant of hydrolysis.
The concentration of 3aH decreases by both H/D exchange and hydrolysis. Therefore, the rate
constant for the disappearance of 3aH is the sum of the rate constants for both H/D exchange
and hydrolysis reactions. The formation of both 4aH and {3a° + 4a°} is dependent on the
concentration of 3aH, as it is the starting material for both. Therefore, the observed rate
constants of formation for 4aH and {3a° + 4a°} are the same as that for disappearance of 3aH.
The individual rate constants for the H/D exchange and hydrolysis reactions can then be
determined from the relative final amounts of 4aH and {3a° + 4a°}. The ratio of these
products will be equal to the ratio of the relative rate constants &deut and &hyd (eqn 3.8).
128

7 Cdeut _ f (deut) ^ o \
k ~ Vhyd f (hyd)
Where *Sf (deut) is the final proportion of compound deuterated at the stereogenic centre and Sf
(hyd) is the final proportion o f carboxylate protonated at the stereogenic centre.
Eqns (3.7) and (3.8) can then be combined, allowing £hyd to be determined from the observed
rate constant (eqn 3.9).
, ^ f (d e u t ) j
deut — ~ hydf (hyd)
therefore,
, _ S f (deut) , ,ob s — ~ hyd ^ ^ h y d
f (hyd)
*.b. = M T 222L + 1} (3-9)f (hyd)
deut is then determined by substituting &hyd back into eqn (3.7).
3 .6 .4 D e te rm in a tio n o f E n an tio m eric Excess
As described in Section 3.4.8.1, Circular Dichroism spectroscopy was used to determine theo
eef o f compounds 4a and 4e after hydrolysis of 3a and 3e. Comparison of eef with Qf
allowed the determination o f the mechanism of H/D exchange. The eef was determined via the
method described by Reetz et al?2 Normalisation of the circular dichroism with respect to UV
absorbance gives the anisotropy factor, also known as the g factor (eqn 3.10)
where g is the anisotropy factor, 0 is the ellipticity and A is the UV absorbance.
If the g factor can be shown to be independent of concentration and linear with respect to the
ee, the ee of a solution of unknown concentration can be determined. Calibration curves for
the g factor of 4a and 4e can be found in the Appendix (Section 3.7.2).
The ee of compounds 4a and 4e after full hydrolysis from enantiopure 3a and 3e starting
materials (eef) was determined as follows.
A stock solution was made of 0.026 g (R)-(-)-3a in 20 ml of D2O buffer of pH** 7.4, 0.3 M
phosphate concentration and 1= 1 M (6.28 mM in 3a). The solution was incubated in a water
129

bath at 37 °C. Intermittently, a 0.5 ml portion was removed and analysed through NMR, to
monitor hydrolysis. pH** 7.4 ± 0.05 was maintained through addition of aliquots of a 0.01 M
NaOD/D20 solution as required. After 350 hrs, the ‘H NMR spectrum suggested no 3a
remained in solution (disappearance o f peak corresponding to methyl ester protons). To
ensure full hydrolysis, the solution was kept incubated for a further 150 hrs. HPLC analysis
(see Section 3.6.5) confirmed that no 3a remained in solution. The solution was then analysed
using CD spectroscopy. The g factor was determined for the fully hydrolysed solution, at 6
concentrations between 0.123 and 0.355 mM (dilution with H20). The g factor was found to
be -40.391 ± 1.828, corresponding to eef = -45.499 ± 2.133 (from Figure 3.10).
The experiment for hydrolysis of 3e to 4e was carried out in an analogous fashion. The
original stock solution used was 0.010 g (£)-(+)-3e in 20 ml of D20 buffer of pH** 7.4, 0.3 M
phosphate concentration and / = 1 M (2.07 mM in 3e). After 60 hrs incubation at 37 °C the *H
NMR spectrum suggested no 3e remained in solution. The solution was incubated for a
further 150 hrs before CD spectroscopy was used to determine the g factor at 223 nm for 6
different concentrations between 0.058 and 0.141 mM (dilution with H20 ). The average g
factor was found to be 15.856 ± 0.732, corresponding to eef = +30.166 ± 1.387 (from Figure
3.12).
3.6.5 HPLC
Reverse-phase HPLC was used to confirm khyd as determined by 'H NMR spectroscopy.
Experiments were carried out using an Eclipse column (XD8-C18, 5 pm, 4.6 x 150 mm). A
method to separate ester 3a from hydrolysis product 4a was developed. Flow rate was 1 ml /
minute and UV detection of products was at 260 nm with 40 nm bandwidth. The eluents and
the gradient used in the LC method are as follows:
Channel A = H20 , Channel B = CH3CN, Channel C = 0.02 % TFA in H20 (pH 1.67).
Table 3.8: Gradient used for HPLC experiments.
Time (mins) % A % B % C
0.0 90 0 10
4.0 50 40 10
7.0 50 40 10
9.0 90 0 10
130

Carboxylic acid 4a eluted between 5-5.25 minutes, ester 3a eluted between 6.15-6.3 minutes.
HPLC calibration curves for 3a and 4a can be found in the Appendix (Section 3.7.3).
&hyd of 3a in D20 buffer of pH** 7.4, phosphate concentration 0.2 M, / = 1 M was determined
according to the following method.
0.013 g of 3a was dissolved in 10 ml of D20 buffer. The sample tube was incubated at 37 °C.
pH** 7.4 ± 0.05 was maintained through addition of small portions of 0.01 M NaOD/D20
solution as required. Intermittently, a 0.5 ml portion of this stock solution was withdrawn and
placed in a HPLC vial. A 10 pi injection from this vial was made into the HPLC instrument
and the previously described HPLC method run. The remaining material was returned to the
stock solution for further injections to be made. Results of the HPLC run were compared with
the calibration curves to determine the quantity of each species. These results are displayed in
Figure 3.8.
=5 5.00x1 O'* -
2.50x10'“-
0.00 -
1x1 <f 2x10*0t/S
Figure 3.8: Change in quantity of ( • ) 3a and (■) 4a in 10 pi injections over
time.
Each curve produced the same rate constant of (2.14 ± 0.05) x 10'6 s’1. This compares
favourably with the &hyd value determined under the same conditions through *H NMR
spectroscopy.
3.6.6 M iscellaneous
The data presented in Figure 3.9 (Appendix Section 3.7.1.2) was modelled numerically using
Microsoft Excel 2010. Calculations modelled the kinetic scheme shown in Scheme 3.15.
Initial concentrations were set at 100 for (R)-3aH and 0 for all other species. The
concentration of each species is displayed in eqns (3.11)-(3.16), where [ ]pt refers to the
concentration of the denoted species at the previous time point, &inv is the rate constant for
131

proton deuterium exchange at the stereogenic centre with chiral inversion, khyd is the rate
constant of hydrolysis, KIR is the kinetic isotope effect on kmv and dt refers to the time step
since the previous time point.
[(*)-3aH] = [(tf)-3aH]pt.{ 1 - (£lnv + khyi) . dr} (3.11)
[(5)-3aD] = [(5)-3aD]pt. { 1 - (khyi + (kmy / K IE )) . dr} + [(^)-3aH]pt. kiny. dt
+ [(«)-3aD]pt. f e v / K IE). dr (3.12)
[(tf)-3aD] = [(«)-3aD]pt.{ 1 - (khyi + (kmy / K IE )) . dr} + [(5)-3aD]p, . (*lnv / K IE ). At
(3.13)
[TO-4aH] [(R)-3a ]pt. feyd . At (3.14)
[(S)-4aD] [(5)-3a ]p, . khyi . dr (3.15)
[(I?)-4aD] = [(R)-3aD]pt. khyi. dr (3.16)
^mv, hyd and KIE are all variables, and the time step dt was chosen to be as short as
practically possible. Modification of &inv, &hyd and KIE produced the different values for QfH
and eef shown in Table 3.9.
132

3.7 Appendix
3.7.1 T heoretical Background for Equations 3.3 and 3.4
3.7.1.1 S eI Mechanism (Eqn 3.3)
If the experiments outlined in Section 3.4.1 are undertaken with a chiral starting material, (R)-
3a, and H /D exchange proceeds through the Se I mechanism, the reaction profile shown in
Scheme 3.8 is altered to that shown in Scheme 3.14.
OH H
+D O
cr
chyd
o
o o
S chem e 3.14: Reaction scheme o f (R)-3a in deuterated buffers, if
mechanism of H /D exchange/racemisation is SeI.
Because the carbanion intermediate formed from deprotonation of (R )-3a can be deuterated
on either face, the portion of the final, fully hydrolysed product 4a which is deuterated at the
stereogenic centre will also be racemic. The portion of final product 4a which is protonated at
the stereogenic centre will be enantiopure; once hydrolysis has occurred no H/D exchange or
racemisation will take place due to the negative charge on the carboxylate. Therefore, if the ee
of 4a (after hydrolysis is complete) is equal to the percentage of 4a which is protonated at the
stereogenic centre, the data is consistent with an SeI mechanism (eqn 3.3).
Q{H =ee{ (3.3)
where QfH is the percentage of 4 a molecules protonated at the stereogenic centre after
hydrolysis is complete and eef is the enantiomeric excess of 4a after hydrolysis is complete.133

3.7.1.2 Se2 Mechanism (Eqn 3.4)
If H/D exchange/racemisation o f (/?)-3a proceeds via the Se2 mechanism, the reaction scheme
will be as depicted in Scheme 3.15.
O O O
Oin v
ok;nv / KIE
O
(R)-3a H (S)-3aD (R)- 3aD
(7?)-4aH (5 )-4 a° (JR)-4a°
S chem e 3.15: Reaction scheme o f (7?)-3a in deuterated buffers, if
mechanism of H/D exchange/racemisation is Se2. kxm is the rate constant of
H/D exchange at stereogenic centre with chiral inversion. KIE is the
primary kinetic isotope effect on kmv as a result o f deuteration on the
stereogenic centre. Secondary kinetic isotope effects on &hyd due to
deuteration on the stereogenic centre were considered negligible.
A kinetic analysis of how the concentrations o f each species shown in Scheme 3.15 changes
with time if an SE2 mechanism is occurring is displayed in Figure 3.9.
134

1 0 0 -
7 5 -
S 50-oQ3Q .V)
2 5 -
0.0 2.5 5.0 10.07.5
Figure 3.9: Kinetic profile for reaction scheme displayed in Scheme 3.15,
where (■) («)-3aH, ( • ) (S)-3aD, (A ) (i?)-3aD, ( T ) H, (< ) (,S>4aD,
(►) (ft)-4aD. The time units in Figure 3.9 are arbitrary. The ratio of kim:
is set to 1 : 0.7,** and the kinetic isotope effect on kinv of a deuterated
stereogenic centre set to 2.5. Details of the construction of this plot are
provided in the experimental (Section 3.6.6).
Figure 3.9 can be used to predict what would be the expected ratio of final ee to the
proportion of molecules protonated at the stereogenic centre for the fully hydrolysed productIT
4a. The only final product protonated at the stereogenic centre is (^)-4a (T in Figure 3.9).
Therefore, the proportion o f molecules deuterated at the stereogenic centre for the fully
hydrolysed product 4a, is equal to the proportion of (7?)-4aH in the reaction mixture after the
reaction is complete (i.e. the proportion of molecules that undergo hydrolysis before Fl/D
deuteration). This is the same as previously described for the SeI mechanism. However,
because the Se2 mechanism deuterates with chiral inversion, the 3a° molecules formed from
the starting material will be of (S) stereochemistry (unlike the racemate formed from SE1
mechanism). This means that a far higher proportion of the final 4a product is of (S)
stereochemistry and the ee will be lower than the proportion of protonated final product. Eqns
(3.17)-(3.19) illustrate this for the Se2 mechanism.
Qfu = m - 4 a H] (3.17)
ee, = [ ( * ) - 4 a H] - t ( S ) - 4 a D] - [ ( / ? ) - 4 a D]} (3.18)
'* Experimentally determined ratio o f fcdeut hyd for 3a in 0.3 M buffer, displayed in Table 3.1.135

ee, = Q ," - t( .S ')-4aD]- [ ( /? ) -4 a 1']} (3.19)
Eqns (3.17)-(3.19) show that, as the molecules o f 4a deuterated on the stereogenic centre will
have a higher proportion o f (S) than (R) configuration, the value for will be higher than
eef if an Se2 mechanism is occurring. The ratio of kmv to &hyd and the KIE used in formulation
of Figure 3.9 would give QfH = 41 % and eef = 14 %.
Using different ratios o f kmv to &hyd and a different KIE will alter the ratio of QfH to eef.
However, QfH will always be greater than eef for an Se2 mechanism except in cases where k[m
is far greater than &hyd- In circumstances where kmv » &hyd, deuterated 3a will equilibrate
before any can be ‘siphoned-off by hydrolysis resulting in Qf 1 = eef. The relationship
between Q f1 and eef for the Se2 mechanism is therefore described by eqn (3.4).
Q * > e e f (3 .4)
except where &inv > > k ^ .
Values of QfH and eef for scenarios o f different kmv, &hyd and KIE are displayed in Table 3.9.
Table 3.9: Expected values o f QfH and eef based on values o f kmv, &hyd and KIE, if an SE2
mechanism of racemisation is taking place.
Input Output
inv hyd KIE Q " eef
1 0.7 2.5 41 % 14%
1 1.5 2.5 60% 34%
1 0.7 1 41 % 26%
1 1.5 1 60% 43%
1 5 2.5 83 % 69%
1 0.01 2.5 1 % 0%
136
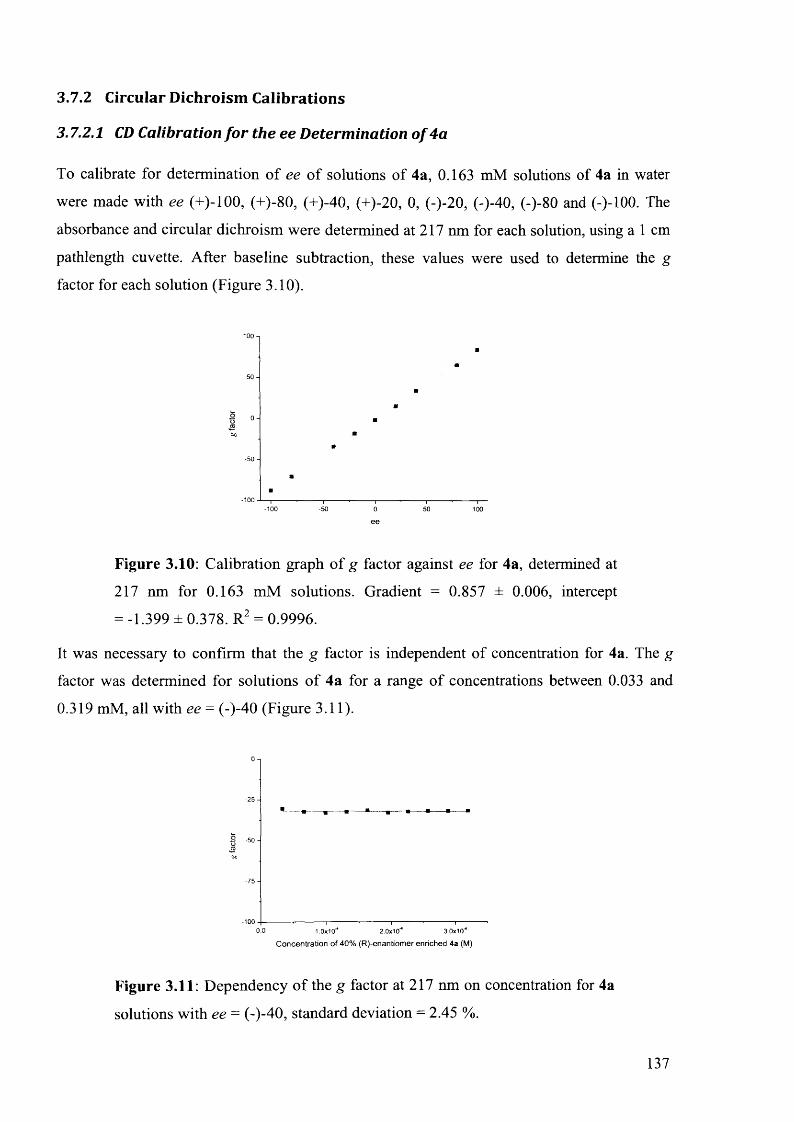
3.7.2 Circular Dichroism Calibrations
3.7.2.1 CD Calibration fo r the ee Determination of 4a
To calibrate for determination o f ee o f solutions o f 4a, 0.163 mM solutions of 4a in water
were made with ee (+)-100, (+)-80, (+)-40, (+)-20, 0, (-)-20, (-)-40, (-)-80 and (-)-100. The
absorbance and circular dichroism were determined at 217 nm for each solution, using a 1 cm
pathlength cuvette. After baseline subtraction, these values were used to determine the g
factor for each solution (Figure 3.10).
Figure 3.10: Calibration graph o f g factor against ee for 4a, determined at
217 nm for 0.163 mM solutions. Gradient = 0.857 ± 0.006, intercept
= -1.399 ± 0.378. R2 = 0.9996.
It was necessary to confirm that the g factor is independent of concentration for 4a. The g
factor was determined for solutions o f 4a for a range o f concentrations between 0.033 and
0.319 mM, all with ee = (-)-40 (Figure 3.11).
0.0 1.0x10“ 2 0 x 1 0 “ 3 .0x10“
C o n c e n tr a t io n o f 4 0 % (R )- e n a n t io m e r e n r ic h e d 4a (M)
Figure 3.11: Dependency o f the g factor at 217 nm on concentration for 4a
solutions with ee = (-)-40, standard deviation = 2.45 %.
137

Figure 3.11 clearly shows that the g factor for 4a is independent of concentration.
3.7.2.2 CD Calibration fo r the ee Determination of4e
The ee determination for 4e was calibrated in the same manner as for 4a. Absorbance and
circular dichroism were determined at 223 nm. As only (S)-(+)-4e was available, the g factor
was only determined for (+)-ee values (Figure 3.12)
0 - ■
1-■ 1 1--------------< 1 1----------------------0 25 50 75 100
e e
Figure 3.12: Calibration graph o f g factor against ee for 4e, determined at
223 nm for 0.086 mM solutions. Gradient = 0.528 ± 0.012, intercept = -
0.072 ± 0.743. R2 = 0.997.
The g factor was determined for solutions o f 4e at a range o f concentrations between 0.052
and 0.185 mM, all with ee = (+)-40 (Figure 3.13).
4 0 -
5.0x1 O'5 1.0x1 O'4 1.5x1 O'4 2 .0x10“
C o n c e n tr a t io n o f 4 0 % (S ) - e n a n t io m e r e n r ic h e d 4 e (M)
Figure 3.13: Dependency o f g factor at 223 nm on concentration for 4e
solutions with ee = (-)-40, standard deviation = 2.62 %.
Figure 3.13 clearly shows that the g factor of 4e is independent of concentration.
138

3.7.3 HPLC Calibrations for 3a and 4a
Solutions o f 4 and 2 g L 1 o f 3a and 4a were made up. Each solution was then diluted by %, V4,
and 3/4. HPLC calibration graphs were obtained using 5 and 10 pi injections of each solution
(Figure 3.14 and Figure 3.15).
§ 750 -
1.0x10 2.0x10
E s te r Q u a n ti ty In je c te d (m ol)
Figure 3.14: HPLC calibration for 3a. Gradient = (5.46 ± 0.05) x 10s
intercept = 11.28 ± 3.87. R2 = 0.999.
1.0x10' 2.0x10
Q u a n tity a c id in je c te d (m ol)
Figure 3.15: HPLC calibration o f 4a. Gradient = (5.64 ± 0.07) x 10
intercept = 15.94 ± 6.22. R2 = 0.998.
3.7.4 D ata T ab le s fro m *H NMR S p ec tro sco p y K inetic E x p erim en ts
The kinetic data from lH NM R spectroscopy from which Figure 3.2 and Figure 3.3 were
constructed is listed in the tables displayed in the following pages.
139

Table 3.10: Rate constant data for compound 3a in D2 O buffers at 37 °C, / = 1 M.
pH**phosphate
conc. / M
|H P 0 4z ]
conc. / M*obs X 106 / S‘‘ &deut X 106 / S'1 *hyd x 106 / s '1 ‘5'f (deut) *Sf (hyd)
7.4 0.050 0.030 3.47 ±0.15 1.36 ± 0.18 2.11 ±0.09 0.378 ± 0.009 0.584 ±0.010
7.4 0.100 0.061 4.10 ± 0.13 1.82 ± 0.15 2.28 ± 0.08 0.437 ± 0.007 0.546 ± 0.007
7.4 0.200 0.122 4.91 ±0.08 2.80 ±0.09 2.11 ±0.04 0.569 ± 0.004 0.428 ± 0.003
7.4 0.250 0.152 5.52 ±0.16 3.25 ±0.17 2.27 ± 0.07 0.588 ± 0.006 0.411 ±0.005
7.8 0.200 0.159 7.03 ±0.14 3.57 ±0.16 3.46 ±0.07 0.502 ± 0.003 0.485 ± 0.003
7.4 0.300 0.182 6.16 ± 0.11 3.64 ±0.12 2.53 ±0.05 0.590 ± 0.003 0.411 ±0.003
7.8 0.355 0.282 10.22 ±0.18 5.61 ±0.19 4.61 ±0.08 0.547 ± 0.003 0.450 ± 0.003
ksb = (1.64 ± 0.09) x 10'5 s '1 M, kQ' = (8.05 ± 1.28) x 10‘7 s’1
140
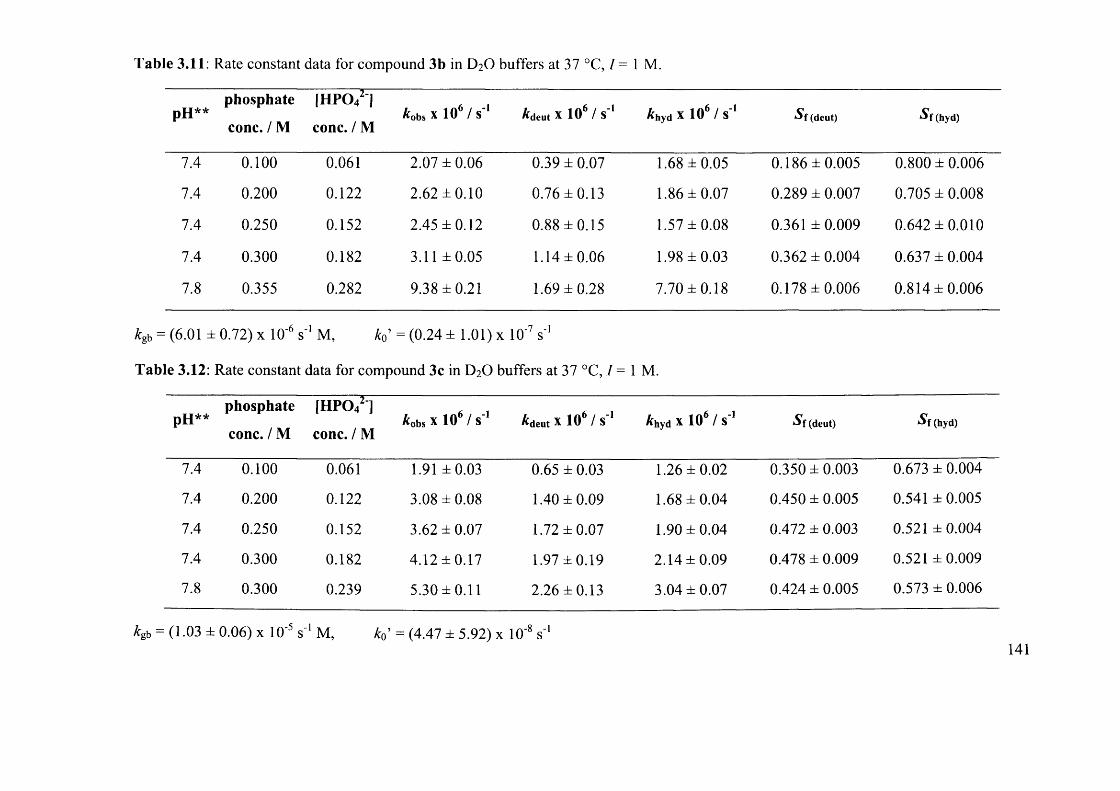
Table 3.11: Rate constant data for compound 3b in D2 O buffers at 37 °C, I = 1 M.
pH**phosphate
conc. / M
[h p o 42'1
conc. / M*obs x 106 / s'1 kdeut X 106 / S'* k hyd x 106 / s'1 ‘Sf (deut) Sf (hyd)
7.4 0.100 0.061 2.07 ±0.06 0.39 ± 0.07 1.68 ±0.05 0.186 ±0.005 0.800 ± 0.006
7.4 0.200 0.122 2.62 ±0.10 0.76 ±0.13 1.86 ±0.07 0.289 ± 0.007 0.705 ± 0.008
7.4 0.250 0.152 2.45 ±0.12 0.88 ±0.15 1.57 ±0.08 0.361 ±0.009 0.642 ±0.010
7.4 0.300 0.182 3.11 ±0.05 1.14 ±0.06 1.98 ±0.03 0.362 ± 0.004 0.637 ± 0.004
7.8 0.355 0.282 9.38 ±0.21 1.69 ±0.28 7.70 ±0.18 0.178 ±0.006 0.814 ±0.006
= (6.01 ±0.72) x 10'6 s' 1 M, *0 ’ = (0.24 ± 1.01) x 10'7 s' 1
le 3.12: Rate constant data for compound 3c in D2O buffers at 37 °C, / = 1 M.
pH**phosphate
conc. / M
|H P<V‘]
conc. / Mkohs x 106 / s'1 fcdeut X 106 / S'1 k hyA x 106 / s'1 »Sf (deut) Sf (hyd)
7.4 0.100 0.061 1.91 ±0.03 0.65 ± 0.03 1.26 ±0.02 0.350 ±0.003 0.673 ± 0.004
7.4 0.200 0.122 3.08 ±0.08 1.40 ±0.09 1.68 ±0.04 0.450 ±0.005 0.541 ±0.005
7.4 0.250 0.152 3.62 ±0.07 1.72 ±0.07 1.90 ±0.04 0.472 ± 0.003 0.521 ±0.004
7.4 0.300 0.182 4.12 ± 0.17 1.97 ±0.19 2.14 ±0.09 0.478 ± 0.009 0.521 ±0.009
7.8 0.300 0.239 5.30 ± 0.11 2.26 ±0.13 3.04 ±0.07 0.424 ± 0.005 0.573 ± 0.006
kgh = (1.03 ± 0.06) x 10'5 s '1 M, k0’ = (4.47 ± 5.92) x 10'8 s '1141

Table 3.13: Rate constant data for compound 3d in D2 O buffers at 37 °C, / = 1 M.
pH**phosphate
conc. / M
|HPO„z'l
conc. / M*obs x 106 / s'1 Adeut X 106 / S_1 Ahyd X 106 / S '1 *Sf (deut) Sf (hyd)
7.4 0.100 0.061 3.79 ±0.08 1.49 ±0.10 2.29 ± 0.05 0.392 ± 0.005 0.602 ± 0.005
7.4 0.200 0.122 5.74 ± 0.13 2.95 ±0.14 2.79 ±0.06 0.510 ±0.004 0.482 ± 0.004
7.4 0.250 0.152 7.04 ±0.22 3.72 ± 0.25 3.33 ± 0.11 0.524 ±0.005 0.469 ± 0.005
7.4 0.300 0.182 8.32 ±0.18 4.26 ± 0.20 4.06 ± 0.09 0.509 ±0.005 0.485 ± 0.005
7.8 0.300 0.239 10.20 ±0.27 5.09 ±0.30 5.11 ±0.14 0.501 ±0.006 0.504 ± 0.006
= (2.20 ± 0.13) x 10'5 s' 1 M, *0 ’ = (1.92 ± 1.54) x 10‘7 s' 1
le 3.14: Rate constant data for compound 3e in D20 buffers at 37 °C, / = 1 M.
pH**phosphate
conc. / M
IHPO42 ]
conc. / M^obsXlOVs'1 Adeut X 106 / S '1 Ahyd x 106 / s'1 *Sf (deut) * f (hyd)
7.4 0.100 0.061 0.84 ±0.03 0.55 ±0.03 0.29 ±0.01 0.659 ±0.010 0.353 ±0.009
7.4 0.200 0.122 1.43 ±0.05 1.00 ±0.05 0.43 ± 0.02 0.699 ± 0.007 0.303 ± 0.007
7.4 0.250 0.152 1.67 ±0.12 1.25 ± 0.13 0.42 ± 0.04 0.746 ±0.015 0.252 ±0.014
7.4 0.300 0.182 2.06 ± 0.07 1.51 ±0.07 0.55 ± 0.02 0.741 ±0.006 0.268 ± 0.006
7.8 0.300 0.239 2.43 ± 0.07 1.84 ±0.07 0.59 ± 0.02 0.763 ± 0.006 0.245 ± 0.006
£gb (7.47 ± 0.37) x 10 5 s 1 M, ko’ — (9.37 ± 4.71) x 10 7 s 1142

Table 3.15: Rate constant data for compound 3f in D2 O buffers at 37 °C, I = 1 M.
pH**phosphate
conc. / M
[h p o 42 i
conc. / Mf c o b s X l o V s - 1 &deut X 106 / s ' 1 £hyd X 106 / S"1 *5f (deut) Sf (hyd)
7.4 0.100 0.061 1.36 ±0.03 1.02 ±0.03 0.35 ±0.01 0.740 ± 0.004 0.251 ±0.004
7.4 0.200 0.122 2.30 ±0.05 1.82 ±0.05 0.48 ± 0.01 0.786 ±0.005 0.209 ± 0.004
7.4 0.250 0.152 2.64 ± 0.05 2.18 ±0.05 0.46 ±0.01 0.819 ±0.004 0.174 ±0.003
7.4 0.300 0.182 3.38 ±0.07 2.89 ±0.08 0.49 ±0.01 0.852 ± 0.004 0.144 ±0.003
7.8 0.300 0.239 4.61 ±0.19 3.56 ±0.20 1.05 ±0.06 0.770 ±0.014 0.228 ± 0.012
= (1.40 ± 0.05) x 10'4 s' 1 M, k0' = (1.48 ± 0.49) x 10'6 s' 1
le 3.16: Rate constant data for compound 3g in D20 buffers at 37 °C, 1 = 1 M.
pH**phosphate
conc. / M
[HPO42 ]
conc. / My U x i o V s '1 fcdeut X 106 / S’1 *hyd x 106 / s'1 *Sf (deut) Sf (hyd)
7.4 0.100 0.061 1.36 ±0.02 1.02 ± 0.02 0.34 ±0.01 0.751 ±0.003 0.247 ± 0.003
7.4 0.200 0.122 2.54 ±0.09 2.05 ±0.10 0.49 ± 0.02 0.820 ± 0.009 0.196 ±0.008
7.4 0.250 0.152 2.82 ±0.07 2.42 ± 0.07 0.41 ±0.02 0.867 ± 0.006 0.146 ±0.005
7.4 0.300 0.182 3.58 ±0.18 3.11 ±0.19 0.47 ± 0.04 0.876 ±0.012 0.131 ±0.010
7.8 0.355 0.282 6.81 ±0.25 4.60 ± 0.26 2.21 ±0.09 0.676 ± 0.007 0.325 ± 0.007
kgb = (1.60 ± 0.06) x 10’4 s '1 M, /to’ = (4.68 ± 4.53) x 10'1 s '1

Table 3.17: Rate constant data for compound 3h in D2 O buffers at 37 °C, / = 1 M.
pH**phosphate
conc. / M
[H P042 J
conc. / Mkobs X 106 / s'1 *deut x 106 / s'1 *hyd x 106 / s*1 *Sf (deut) *Sf (hyd)
7.4 0.050 0.030 2.61 ±0.08 2.12 ±0.08 0.48 ± 0.02 0.805 ± 0.007 0.184 ±0.006
7.4 0.100 0.061 4.01 ±0.09 3.50 ±0.09 0.51 ±0.02 0.879 ± 0.005 0.127 ±0.005
7.4 0.200 0.122 7.44 ±0.17 6.89 ±0.18 0.54 ±0.04 0.921 ±0.006 0.073 ± 0.005
7.4 0.250 0.152 8.91 ±0.47 8.30 ±0.48 0.61 ±0.10 0.919 ±0.013 0.067 ±0.011
7.8 0.200 0.159 10.48 ±0.31 9.24 ±0.32 1.24 ±0.08 0.875 ± 0.008 0.118 ±0.007
7.4 0.300 0.182 10.74 ±0.54 10.16 ±0.54 0.59 ±0.08 0.933 ± 0.008 0.054 ±0.007
7.8 0.300 0.239 13.26 ±0.44 12.24 ±0.44 1.02 ±0.09 0.924 ± 0.008 0.077 ± 0.007
kgb = (5.15 ± 0.13) x 10'4 s '1 M, ko’ = (5.01 ± 0.98) x 10'6 s '1
144

3.7.5 Figures from XH NMR Kinetic Experiments
The graphs from which the data in the tables in Section 3.7.1.1 was obtained are displayed in
the figures in the following pages. All experiments were carried out at 37 °C, / = 1 M. pH**
7.4 unless denoted. (■) 3xH, ( • ) 4xH, (A ) {[3x°] + [4xD]}, where x refers to the specific
compound denoted in the heading for that section.
145

3.7.5.1 Compound 3a
g* 0.50 1I| 0-2S
a)
.■ •
* *
0.00 2 50x10* 500x10* 7.50x10* 1.00x10* 125x10*
t / S
0.75
s2g* 0.50
b)
0 0 0 2.50x10* 5.00x10* 7.50x10* 1.00x10* 1.25x10*
t / S
® 0 50 £
15I? 0 2 5
'• c)
A • A •
0 0 0 2-50x10* 5.00x10* 750x10* 100x10* 1.25x10P
t / S
.00
0.75
0.50
007.50x10* 1.00x10* 125x10*0.00 250x10* 5.00x10*
e)
I 2 0 50 c
I 0 2 5
0.0 5.0x10* 1.0x10* 1.8x10* 2 0x10*
t / S
2.50x10* 5.00x10* 7.50x10* 1.00x10* 1,25x10*
t / S
5.00x10* 7.50x10* 1.00x10*
t / S
1 25x10*250x10*
Figure 3.16: H/D exchange of 3a, with phosphate concentration a) 0.05 M,
b) 0.1 M, c) 0.2 M, d) 0.25 M, e) 0.3 M, f) pH** 7.8, 0.2 M, g) pH** 7.8,
0.355 M.
146

Rel
ativ
e In
tegr
atio
n R
elat
ive
Inte
grat
ion
3.7.5.2 Compound3b
oo
.75
0.50
0.000.0 5.0x10* 1.0x10* 2.0x10* 2.5x10*
00
.50
002.5x10*0.0
.00
75
0 2 5
0.00
5.0x10* 1 0x10*0.0 2.5x10*
.00
.75
.50
0.00
2.0x10*0.0 1.0x10*
1 0 0. .
0-0 2.0x10* 4.0x10* 6.0x10* 60x10*
t / S
Figure 3.17: H/D exchange o f 3b with phosphate concentration a) 0.1 M, b)
0.2 M, c) 0.25 M, d) 0.3 M, e) pH** 7.8, 0.355 M.

Rel
ativ
e In
tegr
atio
n R
elat
ive
Inte
grat
ion
3.7.5.3 Compound3c
1.0x10* 1.5x10* 2.0x10*
t / S
3.0x10s 6.0x10s 9.0x10s 12x10*
t / S
5.0x10s
.00
0.75
0.00
3.0x10s 6.0x10s0.0 1.2x10*
.00
.75
—l0 5 0
0.00
3.0x10’ 6 .0x ltf 9.0x10* 1.5x10*0 0
9.0x10*
t / S
Figure 3.18: H/D exchange of 3c with phosphate concentration a) 0.1 M, b)
0.2 M, c) 0.25 M, d) 0.3 M, e) pH** 7.8, 0.3 M.
148

3.7.5.4 Compound 3d
1.0
0.8
0.6
0.4
02m
0.000 5.0x10s
§ 0.50
i •
7.50x10s 1.00x10s 1.25x10*2.50x10s
S 050
5 025 *i • •
0.00 2 50x10’ 5 00x10’ 7.50x10* 1.00x10s 125x10*
t / S
.75
t0.50
0 2 5
0.00 2.50x10s 5.00x10* 7.50x10* 1.00x10* 125x10*
t / S
g* 0 5 0 -
S. 0 2 5 -
e)
: ‘ "
o o o 2.50x10* 5.00x10* 7.50x10* 1.00x10* 1.25x10*
t / S
Figure 3.19: H/D exchange of 3d with phosphate concentration a) 0.1 M, b)
0.2 M, c) 0.25 M, d) 0.3 M, e) pH** 7.8, 0.3 M
149

3.7.5.5 Compound3e
a)
2g* 0 5 0 -
\
\ ^ *‘ t*
0 0 2.0x10s 4.0x10* 6.0x10s
t / s
S ' 0.2S
5x10s0 1x10* 2x10* 3x10* 4x10*
00
.75
0.50
.00
2x10* 4x10s 5x10*0 0-00 1.50x10* 3.00x10* 4.50x10* 6.00x10* 7.50x10*
t / S
.00
.75
0.50
0.00
3.00x10*0.00 7.50x10*
Figure 3.20: H/D exchange of 3e with phosphate concentration a) 0.1 M, b)
0.2 M, c) 0.25 M, d) 0.3 M, e) pH** 7.8, 0.3 M.
150

3.7.5.6 Compound 3 f
S ’ 0.50
a)
0.0 2.0x10s 4.0x10s 6.0x10s 8.0x10s
t / s0-00 7.50x10* 150x10s 2.25x10s 3.00x10s
t / S
£ 0.25
1 C)
1
• ------------------
----------------- A
------- ----------- m .• • •
------------------■
0.00 1-25x10* 2.50x10s 3.75x10* 5.00x10*
t / S
1.00
0.75
c
e0.50
c
8
0.00
7.50x10* 1.50x10s 225x10* 3.00x10*0.00
1.00
0.75
!0.50
>
8
0 001.0x10* 2.0x10*0.0
Figure 3.21: H/D exchange of 3f with phosphate concentration a) 0.1 M, b)
0.2 M, c) 0.25 M, d) 0.3 M, e) pH** 7.8, 0.3 M.
151

3.7.5.7 Compound 3g
1 a)
2S’ a so
X
IA
0.00 2.50x10* 5.00x10* 7.50x10*
t / s
c
Ifc
>
4x10*1x10* 2x10* 3x10*0
g 1 0 5 0 -
, C>V\
■
..*\
0.0 5.0X10* 1.0X10* 1.5x10*
t / s
j? 0 50
£ 0 2 5
0.0 5.0x10* 10x10* 1.5x10’ 2.0x10*
t / s
1.00-1
0 .7 5 -1 e )
5 \2S ’ 0 .5 0 -
3=
1 / \
S . ° 2 5 -
0 .0 0 -
:
•
5.0x10* 1.0x10*
t / S
Figure 3.22: H/D exchange of 3g with phosphate concentration a) 0.1 M, b)
0.2 M, c) 0.25 M, d) 0.3 M, e) pH** 7.8, 0.355 M.
152

3.7.5.8 Compound3h
.00
0.75
0.50
0 2 5
0.000.00 1.50x10* 3.00x10*
.00
.75
50
.00
3.00x10’0.00
2§* 0 .5 0 -
50x10* 1.0K10P 1.5x10*
t / s
1.00
.75
.000.0 9.0x10* 1.2x10*
£ 0 5 5 -
60x10*0.0 1.2x10*
.00
0.75
0.50
0 5 5
002.0x10*0.0 1.0x10*
0 .7 5 -
01g 1 0 .5 0 -
g)
1 /
(§ 0 .2 5 - * -
0-0 2.0x10* 4.0x10* 6.0x10* 8.0x10* 1.0x10*
t / S
Figure 3.23: H/D exchange o f 3h with phosphate concentration a) 0.05 M,
b) 0.1 M, c) 0.2 M, d) 0.25 M, e) 0.3 M, f) pH** 7.8, 0.2 M, g) pH** 7.8,
0.355 M.
153

3.8 References
1. Reist, M.; Testa, B.; Carrupt, P. A., Enantiomer 1997, 2 (3-4), 147-155.2. Testa, B.; Carrupt, P. A.; Gal, J., Chirality 1993, 5 (3), 105-111.3. Reist, M.; Testa, B.; Carrupt, P.-A., Drug Racemization and Its Significance in
Pharmaceutical Research. In Handbook o f Experimental Pharmacology, Springer: 2003; Vol. 153, pp 91-112.
4. Pereillo, J. M.; Maftouh, M.; Andrieu, A.; Uzabiaga, M. F.; Fedeli, O.; Savi, P.;Pascal, M.; Herbert, J. M.; Mafffand, J. P.; Picard, C., Drug Metabolism and Disposition 2002, 30 (11), 1288-1295.
5. Savi, P.; Zachayus, J. L.; Delesque-Touchard, N.; Labouret, C.; Herve, C.; Uzabiaga,M. F.; Pereillo, J. M.; Culouscou, J. M.; Bono, F.; Ferrara, P.; Herbert, J. M., Proceedings o f the National Academy o f Sciences o f the United States o f America 20 0 6 ,103 (29), 11069-11074.
6. Garcia-Calvo, M.; Lisnock, J. M.; Bull, H. G.; Hawes, B. E.; Burnett, D. A.; Braun, M. P.; Crona, J. H.; Davis, H. R.; Dean, D. C.; Detmers, P. A.; Graziano, M. P.; Hughes, M.; MacIntyre, D. E.; Ogawa, A.; O'Neill, K. A.; Iyer, S. P. N.; Shevell, D. E.; Smith, M. M.; Tang, Y. S.; Makarewicz, A. M.; Ujjainwalla, F.; Altmann, S. W.; Chapman, K. T.; Thomberry, N. A., Proceedings o f the National Academy o f Sciences o f the United States o f America 2005, 102 (23), 8132-8137.
7. Froimowitz, M.; Patrick, K. S.; Cody, V., Pharmaceutical Research 1995, 12 (10), 1430-1434.
8. Heal, D. J.; Pierce, D. M., Cns Drugs 2006, 20 (9), 713-738.9. Patel, A.; MacMahon, S.; Chalmers, J.; Neal, B.; Woodward, M.; Billot, L.; Harrap,
S.; Poulter, N.; Marre, M.; Cooper, M.; Glasziou, P.; Grobbee, D. E.; Hamet, P.; Heller, S.; Liu, L. S.; Mancia, G.; Mogensen, C. E.; Pan, C. Y.; Rodgers, A.; Williams, B.; Collaborative, A., Lancet 2007, 370 (9590), 829-840.
10. Ghose, A. K.; Viswanadhan, V. N.; Wendoloski, J. J., Journal o f Combinatorial Chemistry 1999, 1 (1), 55-68.
11. Xu, J.; Stevenson, J., Journal o f Chemical Information and Computer Sciences 2000, 40 {5), 1177-1187.
12. Lameijer, E. W.; Kok, J. N.; Back, T.; Ijzerman, A. P., Journal o f Chemical Information and M odeling 2006, 46 (2), 553-562.
13. Bymaster, F. P.; Beedle, E. E.; Findlay, J.; Gallagher, P. T.; Krushinski, J. H.; Mitchell, S.; Robertson, D. W.; Thompson, D. C.; Wallace, L.; Wong, D. T., Bioorganic & M edicinal Chemistry Letters 2 0 0 3 ,13 (24), 4477-4480.
14. Primrose, W. U., In NMR o f Macromolecules: A Practical Approach, Roberts, G. C. K., Ed. Oxford University Press: Oxford, 1993; pp 22-23.
15. Nicoll, A. J.; Allemann, R. K., Organic & Biomolecular Chemistry 2004, 2 (15), 2175-2180.
16. Broo, K. S.; Brive, L.; Ahlberg, P.; Baltzer, L., Journal o f the American Chemical Society 1997, 119 (47), 11362-11372.
17. Hansch, C.; Leo, A.; Taft, R. W., Chemical Reviews 1991, 91 (2), 165-195.18. Smith, G. G.; Sivakua, T., Journal o f Organic Chemistry 1983, 48 (5), 627-634.19. Bordwell, F. G.; Boyle, W. J., Journal o f the American Chemical Society 1972, 94
(11), 3907-3911.20. Bordwell, F. G.; Boyle, W. J., Journal o f the American Chemical Society 1971, 93 (2),
511-512.21. Chen, C. Y.; Chang, Y. S.; Lin, S. A.; Wen, H. I.; Cheng, Y. C.; Tsai, S. W., Journal
o f Organic Chemistry 2002, 67 (10), 3323-3326.22. Hammett, L. P.; Pfluger, H. L., Journal o f the American Chemical Society 1933, 50
(10), 4079-4089.154

23. Hilal, S. H.; Karickhoff, S. W.; Carreira, L. A.; Shrestha, B. P., Qsar & Combinatorial Science 2004, 22 (9-10), 917-925.
24. Matsuo, H.; Kawazoe, Y.; Sato, M.; Ohnishi, M.; Tatsuno, T., Chemical & Pharmaceutical Bulletin 1970,1 8 (9), 1788-1793.
25. Reist, M.; Christiansen, L. H.; Christoffersen, P.; Carrupt, P. A.; Testa, B., Chirality 1995, 7 (6), 469-473.
26. Reist, M.; Carrupt, P. A.; Testa, B.; Lehmann, S.; Hansen, J. J., Helvetica Chimica Acta 1996, 79 (3), 767-778.
27. Cram, D. J.; Gosser, L., Journal o f the American Chemical Society 1964, 86 (24), 5457-5465.
28. Guthrie, R. D.; Nicolas, E. C., Journal o f the American Chemical Society 1981, 103 (15), 4637-4638.
29. Albert, A.; Serjeant, E. P., Ionization Constants o f Acids and Bases. Methuen & Co: London, 1962; p 143-146.
30. Kudelko, A.; Zielinski, W., Tetrahedron 2009, 65 (6), 1200-1206.31. de Boer, J. W.; Browne, W. R.; Harutyunyan, S. R.; Bini, L.; Tiemersma-Wegman, T.
D.; Alsters, P. L.; Hage, R.; Feringa, B. L., Chemical Communications 2008, (32), 3747-3749.
32. Reetz, M. T.; Kuhling, K. M.; Hinrichs, H.; Deege, A., Chirality 2000, 12 (5-6), 479- 482.
155
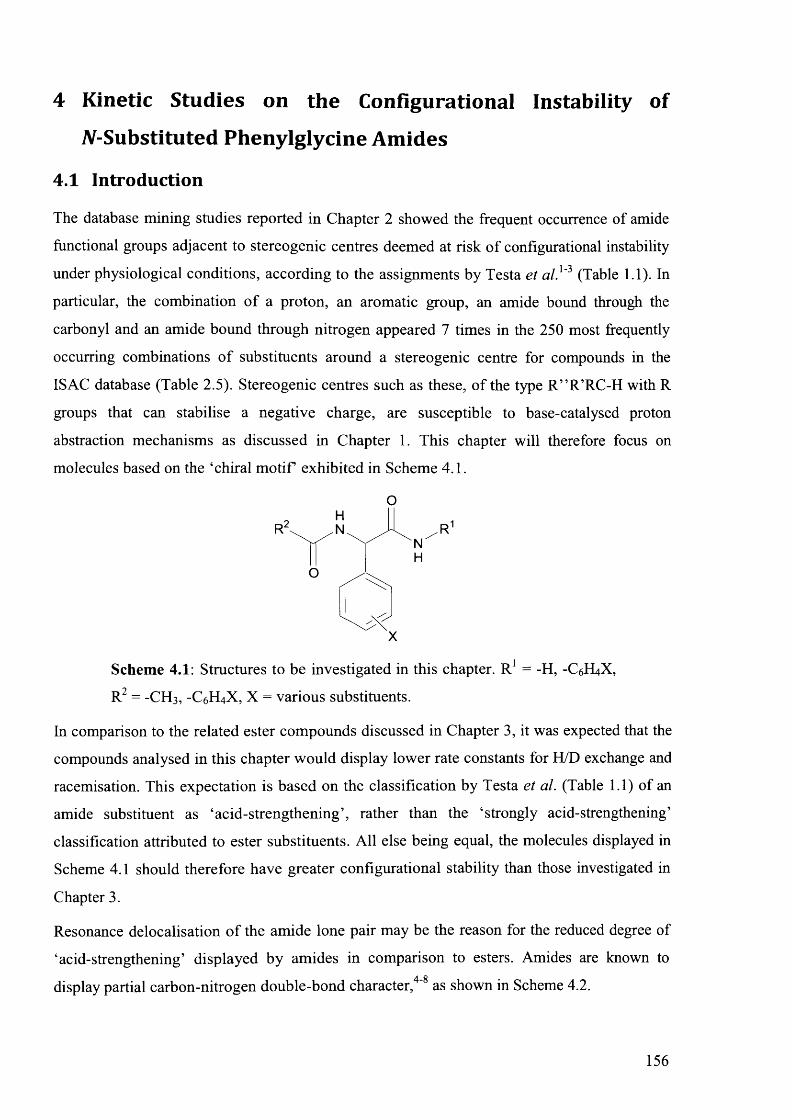
4 Kinetic Studies on the Configurational Instability of N-Substituted Phenylglycine Amides
4.1 Introduction
The database mining studies reported in Chapter 2 showed the frequent occurrence of amide
functional groups adjacent to stereogenic centres deemed at risk o f configurational instability
under physiological conditions, according to the assignments by Testa et a /.1"3 (Table 1.1). In
particular, the combination o f a proton, an aromatic group, an amide bound through the
carbonyl and an amide bound through nitrogen appeared 7 times in the 250 most frequently
occurring combinations o f substituents around a stereogenic centre for compounds in the
IS AC database (Table 2.5). Stereogenic centres such as these, o f the type R ” R ’RC-H with R
groups that can stabilise a negative charge, are susceptible to base-catalysed proton
abstraction mechanisms as discussed in Chapter 1. This chapter will therefore focus on
molecules based on the ‘chiral m o tif exhibited in Scheme 4.1.
O
O
Scheme 4.1: Structures to be investigated in this chapter. R 1 = -H, -C6H4X,
R2 = -CH3, -C6H4X, X = various substituents.
In comparison to the related ester compounds discussed in Chapter 3, it was expected that the
compounds analysed in this chapter would display lower rate constants for H/D exchange and
racemisation. This expectation is based on the classification by Testa et al. (Table 1.1) of an
amide substituent as ‘acid-strengthening’, rather than the ‘strongly acid-strengthening’
classification attributed to ester substituents. All else being equal, the molecules displayed in
Scheme 4.1 should therefore have greater configurational stability than those investigated in
Chapter 3.
Resonance delocalisation o f the amide lone pair may be the reason for the reduced degree of
‘acid-strengthening’ displayed by amides in comparison to esters. Amides are known to4 8display partial carbon-nitrogen double-bond character, as shown in Scheme 4.2.
156

Scheme 4.2: Amide resonance structures.
An adjacent carbonyl group can favour H/D exchange and racemisation via an SeI reaction by
delocalisation of negative charge onto the carbonyl oxygen. However, for amide substituents
the presence of resonance structure B diminishes delocalisation onto the carbonyl oxygen, as
the carbonyl is already carrying an enhanced partial negative charge through delocalisation of
the nitrogen lone pair.
Many drugs on the market contain stereogenic centres similar to those shown in Scheme 4.1
and those investigated in this chapter. These drugs include the antibiotic Cephalexin,9 anti
epileptic Levetiracetam10 and proteasome inhibitors Bortezomib11 and Lenalidomide.12
OCefalexin Leviracetam
Bortezomib Lenalidomide
Scheme 4.3: Drugs with stereocentres alike the scaffold in Scheme 4.1.

4.2 Aims
There are 3 mains aims for this chapter.
First, to determine the rate constants o f H/D exchange for the compounds illustrated in
Scheme 4.1, under conditions mimicking physiological conditions. These kinetic studies will
clarify whether stereogenic centres such as those in Scheme 4.1 are at risk of racemisation if
administered as a drug.
Second, to understand the effect o f changes in buffer concentration and temperature on the
kinetics of H/D exchange. The former will inform us as to whether the process is general- or
specific-base catalysed; the latter will allow determination of thermodynamic activation
parameters for the H/D exchange reaction.
Third, to investigate the effects each moiety on the stereogenic centre has on configurational
stability. Quantification o f the effect that alterations in molecular structure have on rate
constants of H/D exchange will provide information on the role of each substituent.
Comparisons can also be made with the results presented in Chapter 3 for /V-acetyl
arylglycine esters. These comparisons may inform as to the mechanism by which H/D
exchange occurs.
158
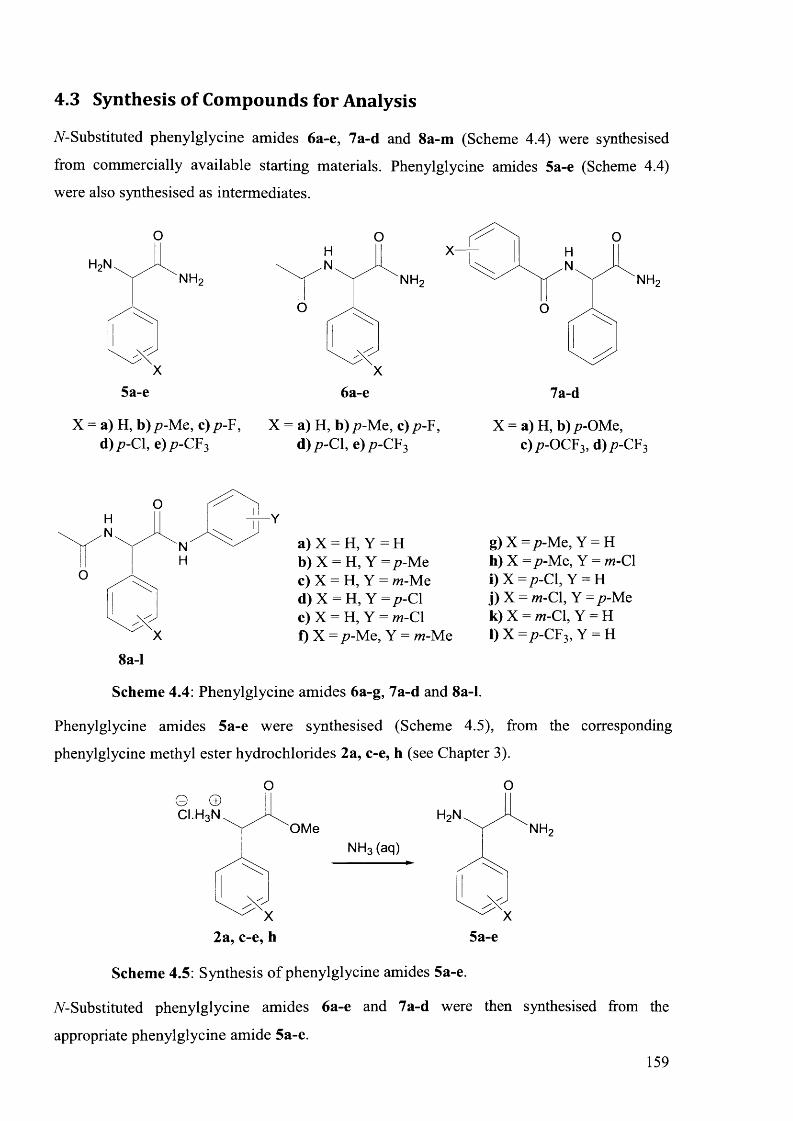
4.3 Synthesis of Compounds for Analysis
N -Substituted phenylglycine amides 6a-e, 7a-d and 8a-m (Scheme 4.4) were synthesised
from commercially available starting materials. Phenylglycine amides 5a-e (Scheme 4.4)
were also synthesised as intermediates.
O
NH
5a-e
X a) H, b) p-Me, c)p-F, d) p-C 1, e) p-CF3
X = a) H, b) p-M e, c) p -F, d) p-Cl, e) p-CF3
NH
O O
6a-e
X = a) H, b) p-OMe,c)p-OCF3, d)p-CF3
O
o
8a-l
a) X = H, Y = Hb) X = H, Y = p-Mec) X = H, Y = m-Med) X = H, Y = p -C 1e) X = H, Y = m-Clf) X = p-Me, Y = m-Me
g) X = p-Me, Y = Hh) X = p-Me, Y = m-C 1i) X = p-Cl, Y = Hj) X = m-C 1, Y = p-Me k) X = m-C 1, Y = H 1) X = p-CF3, Y = H
Scheme 4.4: Phenylglycine amides 6a-g, 7a-d and 8a-l.
Phenylglycine amides 5a-e were synthesised (Scheme 4.5), from the corresponding
phenylglycine methyl ester hydrochlorides 2a, c-e, h (see Chapter 3).
O O
N H 3 (aq)
O M e
2a, c-e, h
NH
5a-e
Scheme 4.5: Synthesis o f phenylglycine amides 5a-e.
AA-Substituted phenylglycine amides 6a-e and 7a-d were then synthesised from the
appropriate phenylglycine amide 5a-e.
159

o
NH
O
6a-e
AcCI
NEt,
H2INHNH2
BnzCI O
5a-e 7a-d
Scheme 4.6: Synthesis o f N -substituted phenylglycine amides 6a-e, 7a-d.
The synthesis of A^-acetyl phenylglycines 4a, c, e, h was described in Chapter 3. From these,
iV-acetyl phenylglycine amides 8a-l were synthesised (Scheme 4.7).
4a, c, e, h
E E D Q
N H 2C 6 H4Y
8a-l
Scheme 4.7: Synthesis o f N-substituted phenylglycine amides 8a-l.
Details of procedures used in synthesis and characterisation o f products can be found in the
experimental (Section 4.6.2).
160
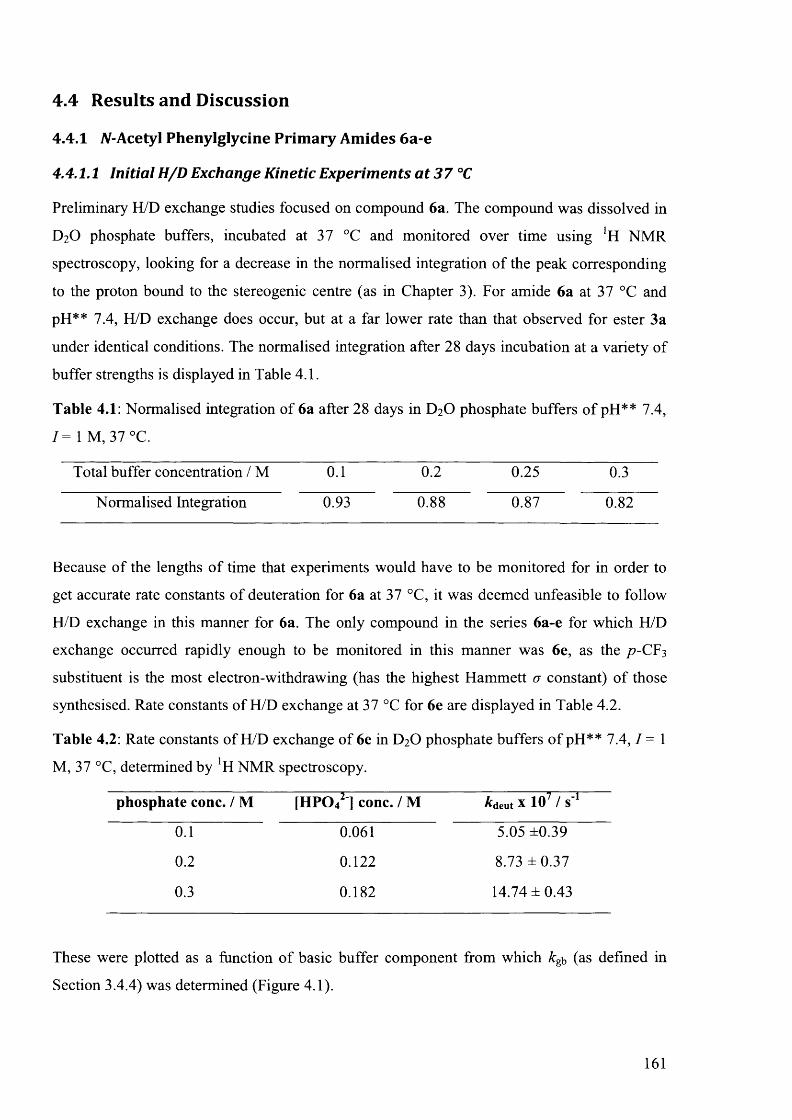
4.4 Results and Discussion
4.4.1 W-Acetyl P heny lg lycine P r im a ry A m ides 6a-e
4.4.1.1 Initial H/D Exchange Kinetic Experiments a t 37 °C
Preliminary H/D exchange studies focused on compound 6a. The compound was dissolved in
D2O phosphate buffers, incubated at 37 °C and monitored over time using *H NMR
spectroscopy, looking for a decrease in the normalised integration of the peak corresponding
to the proton bound to the stereogenic centre (as in Chapter 3). For amide 6a at 37 °C and
pH** 7.4, H/D exchange does occur, but at a far lower rate than that observed for ester 3a
under identical conditions. The normalised integration after 28 days incubation at a variety of
buffer strengths is displayed in Table 4.1.
Table 4.1: Normalised integration of 6a after 28 days in D2O phosphate buffers o f pH** 7.4,
/ = 1 M, 37 °C.
Total buffer concentration / M 0.1 0.2 0.25 0.3
Normalised Integration 0.93 0.88 0.87 0.82
Because of the lengths o f time that experiments would have to be monitored for in order to
get accurate rate constants of deuteration for 6a at 37 °C, it was deemed unfeasible to follow
H/D exchange in this manner for 6a. The only compound in the series 6a-e for which H/D
exchange occurred rapidly enough to be monitored in this manner was 6e, as the /?-CF3
substituent is the most electron-withdrawing (has the highest Hammett o constant) of those
synthesised. Rate constants of H/D exchange at 37 °C for 6e are displayed in Table 4.2.
Table 4.2: Rate constants of H/D exchange of 6e in D2O phosphate buffers o f pH** 7.4, / = 1
M, 37 °C, determined by lH NMR spectroscopy.
phosphate conc. / M [HPO42 ] conc. / M 7 -1^ d e u t X 10 / S
0.1 0.061 5.05 ±0.39
0.2 0.122 8.73 ±0 .37
0.3 0.182 14.74 ± 0.43
These were plotted as a function of basic buffer component from which &gb (as defined in
Section 3.4.4) was determined (Figure 4.1).
161
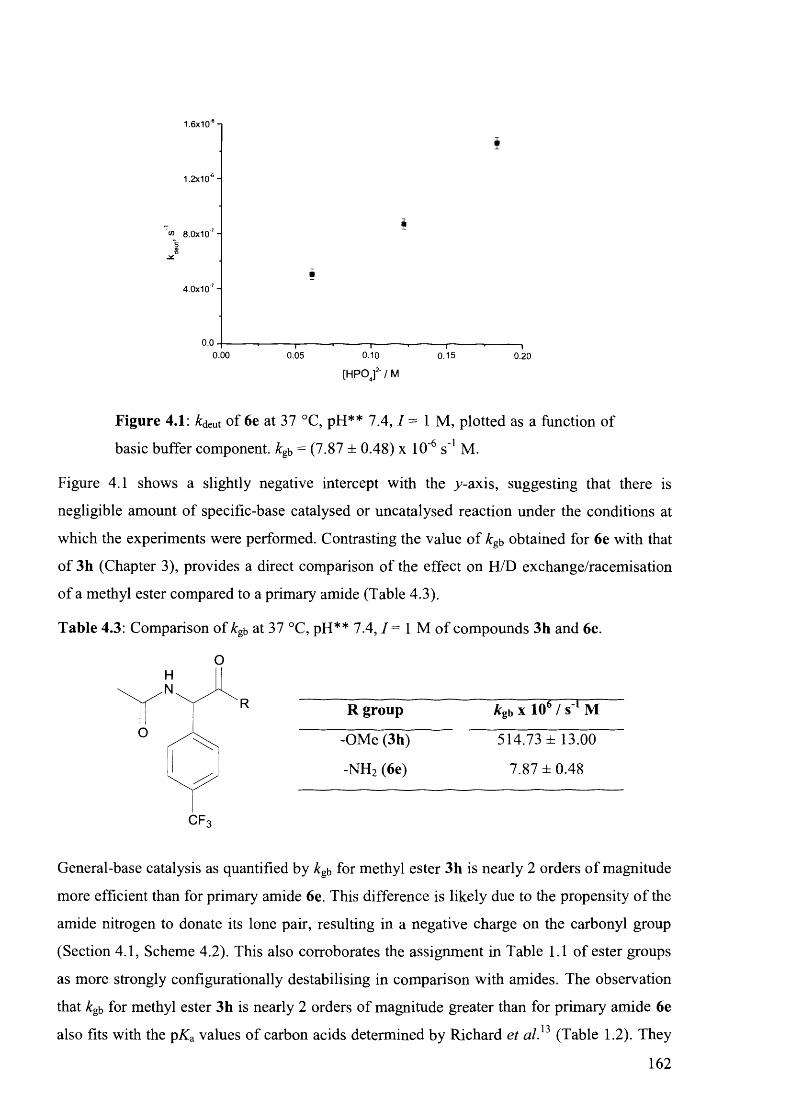
1.6x10
1.2x10 -
« 8.0x10 -
4.0x10 -
0 .0 .
0.00 0.05 0.10
[HPO I2' / M
0.15 0.20
Figure 4.1: kdexit of 6e at 37 °C, pH** 7.4, 1 = 1 M, plotted as a function of
basic buffer component, kgb = (7.87 ± 0.48) x 10~6 s '1 M.
Figure 4.1 shows a slightly negative intercept with the .y-axis, suggesting that there is
negligible amount of specific-base catalysed or uncatalysed reaction under the conditions at
which the experiments were performed. Contrasting the value o f kgb obtained for 6e with that
of 3h (Chapter 3), provides a direct comparison of the effect on H/D exchange/racemisation
of a methyl ester compared to a primary amide (Table 4.3).
Table 4.3: Comparison of kgb at 37 °C, pH** 7 .4 ,1= 1 M o f compounds 3h and 6e.
O
O
R R g ro u p kgb x 106 / s'1 M
-OMe (3h) 514.73 ± 13.00
-NH2 (6e) 7.87 ±0.48
General-base catalysis as quantified by kgb for methyl ester 3h is nearly 2 orders o f magnitude
more efficient than for primary amide 6e. This difference is likely due to the propensity o f the
amide nitrogen to donate its lone pair, resulting in a negative charge on the carbonyl group
(Section 4.1, Scheme 4.2). This also corroborates the assignment in Table 1.1 of ester groups
as more strongly configurationally destabilising in comparison with amides. The observation
that kgb for methyl ester 3h is nearly 2 orders of magnitude greater than for primary amide 6e
also fits with the pKa values of carbon acids determined by Richard et a lP (Table 1.2). They
162

found that the pKa o f the a-carbon o f methyl acetate was over two pKa units lower than that of
acetamide.
Because of the longer periods o f time required for H/D exchange experiments of 6a-d, it was
not deemed possible to analyse them in the same way as compounds 3a-l or 6e. It was also
impossible to analyse compounds 7a-d and 8a-l in this manner, as these compounds are too
insoluble in D2O to allow sufficient concentrations for analysis through *H NMR
spectroscopy. To avoid these problems, rate constants o f H/D exchange were obtained using
LCMS at higher temperatures. The higher temperatures increased the rate of the reactions and
the greater sensitivity o f the LCMS (compared with 'H NMR spectroscopy) allowed for lower
concentrations of analyte to be used. As in Chapter 3, analysis was undertaken in D20
phosphate buffers. The solution was monitored over time using LCMS. Deuterium-
incorporation was monitored by changes in the mass spectrogram over time (see Experimental
Section 4.6.3.2).
4.4.1.2 LCMS Hammett Analysis a t 90 °C
Rate constants of H/D exchange for 6b, 6d and 6e were determined in D20 buffers o f pH*
7.4f at 90 °C at a range o f buffer concentrations using LCMS. Compounds 6a and 6c could
not be analysed in the same way, as neither was sufficiently retained on the LCMS column.
The greater lipophilicity of 6b, 6d and 6e (as expected from Hansch 7r-values14, 15) gave
retention times long enough for analysis. Details of how rate constants were obtained using
the LCMS instrument are outlined in the experimental (Section 4.6.3.2). Individual kinetic
traces are displayed in the Appendix. Rate constants for H/D exchange as a function of basic
buffer component for compounds 6b, 6d and 6e are displayed in Figure 4.2.
f The term ‘pH*’ is used in this chapter for the experiments carried out at 60, 70, 80 and 90 °C as the pH o f the
buffers used was corrected for temperature, so that the buffers were at the desired pH at the temperature at which
experiments were carried out. See experimental (Section 4.6.3.2) for further details.
163
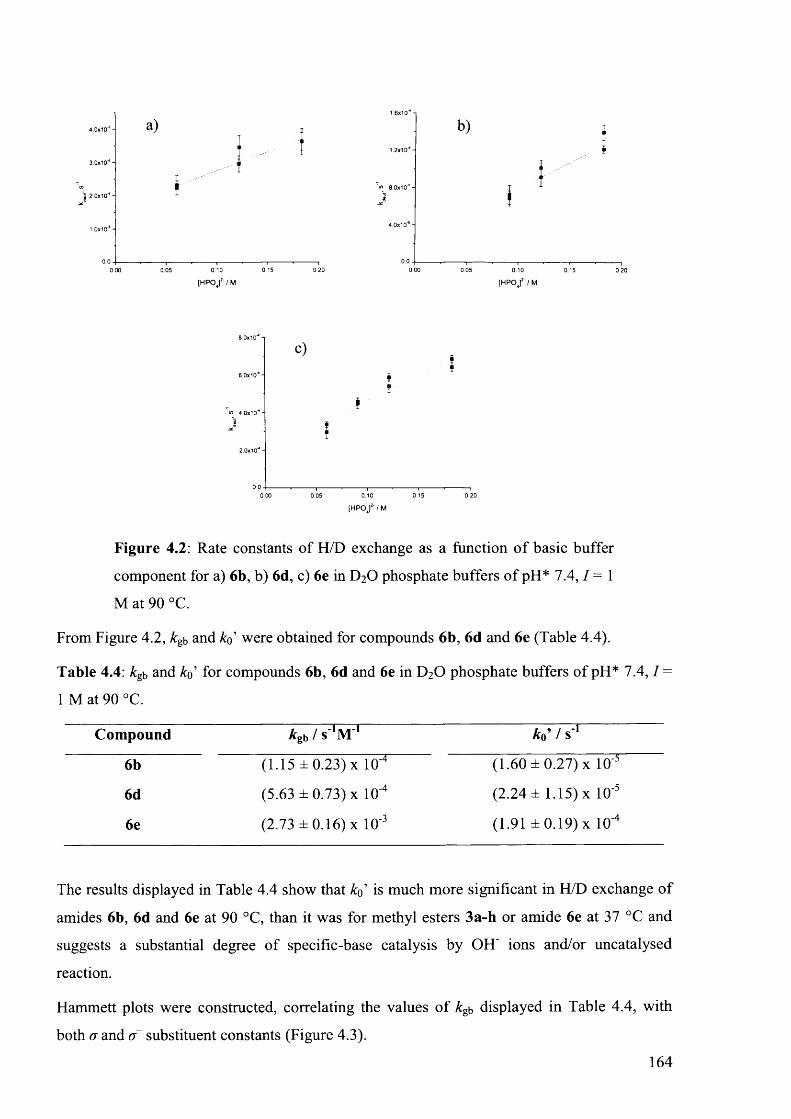
Figure 4.2: Rate constants of H/D exchange as a function o f basic buffer
component for a) 6b, b) 6d, c) 6e in D2O phosphate buffers o f pH* 7 .4 ,7 = 1
M at 90 °C.
From Figure 4.2, kgb and 7o’ were obtained for compounds 6b, 6d and 6e (Table 4.4).
Table 4.4: kgb and 7o’ for compounds 6b, 6d and 6e in D20 phosphate buffers of pH* 7.4, 7 =
1 M at 90 °C.
Compound Agb / s 'S r 1 *0’ / s '1
6b (1.15 ± 0.23) X lO'4 (1.60 ± 0.27) x 10'5
6d (5.63 ±0.73) x lO"1 (2.24 ± 1.15) x 10'5
6e (2.73 ± 0.16) x 10’3 (1.91 ± 0.19) x 10'4
The results displayed in Table 4.4 show that 7o’ is much more significant in H/D exchange of
amides 6b, 6d and 6e at 90 °C, than it was for methyl esters 3a-h or amide 6e at 37 °C and
suggests a substantial degree of specific-base catalysis by OH' ions and/or uncatalysed
reaction.
Hammett plots were constructed, correlating the values o f kgb displayed in Table 4.4, with
both a and d~ substituent constants (Figure 4.3).

Figure 4.3: Hammett plots of kg o f 6b, 6d and 6e at 90 °C, pH* = 7.4, 7 = 1
M, fitted to a) o constants, p = 2.02 ± 0.12, R2 = 0.990 and b) o~ constants, p
= 1.61 ± 0.10, R2 = 0.992.
Figure 4.3 shows that the values determined for kgb correlate reasonably well with both a and
o~ values. As in the case of the methyl esters (Section 3.4.6), distinguishing between the two
sets of substituent constants is difficult as none of the substituents analysed have drastically
different a and o~ values, leaving little difference between graphs. This similarity between
substituent constants results in similar p values for both sets o f substituent constants. These p
values are compared with those found for methyl ester compounds 3a-h in Table 4.5.
Table 4.5: p values determined from kgb of 6b, d, e at 90 °C and 3a-h at 37 °C, pH* = 7.4, 1 =
1 M (from Figure 3.4).
Series a a
6b, d, e 2.02 ±0.12 1.61 ±0 .10
3a-h 2.50 ±0.03 2.07 ± 0.02
It should be noted that the p values for the two series displayed in Table 4.5 were determined
at different temperatures. As discussed in Section 1.8.2.1.2, reaction constants have been
observed to be temperature dependent. Eqn 1.18 suggests p values are dependent on T l. This
temperature dependence is a potential explanation for the greater magnitude o f p determined
for the series 3a-h, and suggests that a greater p value would be obtained for 6b, d, e if the
experiments were to be carried out at 37 °C. However, as discussed in Section 1.8.2.1.2, a
definitive relationship between p and T x has not been conclusively proven. In any case,
assuming that p would be equal for 6b, d, e and 3a-h at a specific temperature seems unwise.
Ignoring the effect of temperature, it would generally be expected that the magnitude of p for
the primary amides would be higher than that seen for the methyl esters. As discussed in

Section 4.1 and illustrated in Scheme 4.2, electron-pair donation by the amide nitrogen results
in a substantial negative charge build up on the carbonyl oxygen. This means that a negative
charge built up on the stereogenic centre o f 6b, d, e during H/D exchange cannot be stabilised
through delocalisation onto the carbonyl oxygen as much as it can for 3a-h. As a result it
would be expected that the stabilising effect o f the aromatic group would be more important
for H/D exchange of 6b, d, e than for 3a-l, and larger p values would be seen. An increased
dependence on the aromatic group for stabilisation is the proposed cause for the large
magnitude o fp = 3.58 seen for profen thioesters, as discussed in Section 3.4.6 (Scheme 3.9).16
The p value of 1.61, from kg\> values o f 6b, d, e (using a~ constants) at 90 °C, sits between the
p values of 2.07 and 1.15 determined from &gb values o f 3a-h (using o~ constants) at 37 °C and
for the racemisation of phenylglycines at 80 °C (Smith and Sivakua17) respectively. In both of
the latter cases, an SeI mechanism was concluded based on equivalent rate constants of
racemisation and H/D exchange (see Section 1.3). These p values and the similarities in
molecular structure between the three sets of compounds suggest that an SeI mechanism is
also likely for H/D exchange of 6b, d, e. Computational studies providing further evidence
towards this conclusion will be presented in Chapter 5.
4.4.1.3 Determination of Thermodynamic Activation Param eters fo r H/D Exchange
Reactions of 6e
In order to determine the activation energy and pre-exponential factor according to the
Arrhenius equation (Section 1.9.1), and enthalpy and entropy o f activation according to the
Eyring equation (Section 1.9.2) for the general-base catalysed H/D exchange of 6e, &gb was
determined at 60, 70 and 80 °C using the LCMS method. These rate constants were combined
with the values of kgb determined at 90 °C using the LCMS method and the rate constant at 37
°C using the 'H NMR spectroscopic method to produce Arrhenius and Eyring plots, which
were used to obtain the activation parameters. Rate constants o f H/D exchange as a function
of basic buffer component for compound 6e at 60, 70 and 80 °C are displayed in Figure 4.4.
166

Figure 4.4: Rate constants of H/D exchange as a function o f basic buffer
component for 6e in D2O phosphate buffers o f pH* 7.4, 1 = 1 M at a) 60 °C,
b) 70 °C and c) 80 °C.
The values o f &gb and ko’ determined for 6e from Figure 4.4 along with those determined at 37
and 90 °C are displayed in Table 4.6.
Table 4.6: values of kg b and ko’ for 6e in D2O phosphate buffers o f pH** 7.4, / = 1 M.
Temperature / °C *gb / s 'M '1 k9" / s'1
37 (7.87 ± 0.48) x 1 O'6 (-1.23 ± 6.10) x 10's
60 (2.19 ± 0.39) x 10'4 (3.20 ± 5.1 l ) x 10'6
70 (6.05 ± 0.64) x 10'4 (1.72 ± 1.04) x 10'5
80 (1.04 ± 0.07) x 10’3 (8.61 ±0.88) x 10‘5
90 (2.73 ± 0.16) x 10'3 (1.91 ±0.19) x 10-4
An Arrhenius plot of the data in Table 4.6 is shown in Figure 4.5.

C - 1 0 -
- 1 2 -
2.8x1 O'3 3.4x10
1 / T
Figure 4.5: Arrhenius plot for general-base catalysed H/D exchange of 6e,
in D20 phosphate buffers at pH* 7.4, / = 1 M. y-axis intercept = In A =
28.38 ± 1.44. Gradient = -EJR = -12428.02 ± 490.636 K.
From the intercept and gradient of Figure 4.5, an activation energy (£a) o f 103.33 ± 4.08 kJ
mol’1 and a pre-exponential factor {A) of 2.12 x 10¹² s’1 M '1 (min 5.01 x 10¹¹ s’1 M"1, max 8.98
x 1012 s '1 M '1) were determined for general-base catalysed Fl/D exchange o f 6e.
An Eyring plot of the data in Table 4.6 is displayed in Figure 4.6.
-12 -
c
-16 -
3 .2x1032.8x10'3 3.0x10³ 3.4x10'
1 n
Figure 4.6: Eyring plot of general-base catalysed H/D exchange of 6e, in
D20 phosphate buffers at pH* 7.4, I = 1 M. y-axis intercept = In (&b/h) +
AS l/R = 21.57 ± 1.45. Gradient = -A Hl/R = -12094.01 ± 492.97 K.
168

From the intercept and gradient of Figure 4.6, an enthalpy o f activation (A//*) o f 100.55 ±
4.10 kJ m ol'1 and entropy o f activation (AS*) o f -18.21 ± 12.06 J K '1 m ol'1 for general-base
catalysed H/D exchange of 6e were determined.
It is notable that the percentage error margins on the value determined for A from Figure 4.5
and AS* from Figure 4.6 are both very large. This is because each value was obtained from the
intercept with the y-axis, which involves a relatively long extrapolation from a small cluster
o f points. This long extrapolation magnifies any error in the calculation. As an alternative,
both A and AS* were calculated at each individual data point using the values o f Ea and A//*
calculated from Figure 4.5 and Figure 4.6 respectively by substituting into eqn (1.23) and
(1.26). These values are summarised in Table 4.7.
Table 4.7: A and AS* calculated at individual data points, using the values of Ea and AH*
determined from Figure 4.5 and Figure 4.6.
7 7 ° C ftgb / s '1 M '1 A / s '1 M '1 AS* / J K '1 m ol'1
37 (7.87 ± 0.48) x 10'6 1.97 x 10¹² -18.86
60 (2.19 ± 0.39) x 10"4 3.44 x 10¹² -14.17
70 (6.05 ± 0.64) x 10“* 3.21 x 10¹² -14.76
80 (1.04 ± 0.07) x 10'3 1.98 x 10¹² -18.79
90 (2.73 ± 0.16) x 10'3 1.97 x 10¹² -18.83
Table 4.7 shows that calculated A and AS* values are very similar for experiments at 37, 80
and 90 °C. These are the data points with the smallest error margins from the original
experiments and hence should be the most accurate values for A and AS*. Using these values
gives AS* = -17.08 ± 2.40 J K '1 m ol'1 (errors calculated from standard deviation).
It is of interest to compare the activation parameters for general-base catalysed H/D exchange
of 6e to other examples. Some values o f AH* and AS* for racemisation reactions thought to
proceed through similar mechanism are listed in Table 4.8, 4.9 and 4.10.
169

Table 4.8: Activation parameters for racemisation of amino acids by Smith et a l}1,18
Amino Acid AH x / kJ mol'1 AS'* / J K"1 m o l1
alanine 115.5 ± 2.5 -78.2 ± 5 .4
valine 116.6 ± 1.3 -85.4 ± 2 .9
isoleucine 113.4 ± 2.5 -90.4 ± 5 .9
leucine 114.2 ±2.1 -84.5 ± 4.6
phenylalanine 97.1 ± 0 .8 -117.2 ± 2.1
phenylglycine 83.3 ± 0 .0 -121.3 ± 0 .4
m-nitrophenylglycine 84.1 ± 0 .4 -102.5 ± 1.7
w-chlorophenylglycine 83.3 ± 1.3 -110.9 ± 3 .8
/7-chlorophenylglycine 82.0 ± 1.3 -118.8 ± 3.3
p-methylphenylglycine 85.4 ± 0 .4 -118.4 ± 1.3
/7-methoxyphenylglycine 84.9 ± 0.4 -120.9 ± 1.3
Table 4.9: Activation parameters for racemisation of 5-monosubstituted hydantoins from
Reist et a l.19
Hydantoin C(5) Substituent AHx / kJ m o l1 AS1* / J K 1 mol"1
-Ph 72.3 ± 4.0 -68.2 ± 5 .0
-CH2OH 76.7 ± 2 .8 -86.6 ± 4.6
-NHONH2 94.1 ±2.1 -39.3 ± 1.3
-CH2Ph 94.3 ± 2.5 -43.1 ± 1.7
-c h 3 85.3 ±2.1 -77.0 ± 2.9
-c h 2c o o h 98.4 ± 3 .2 -42.3 ±2.1
-CH(CH3)2 80.7 ± 3 .0 -105.4 ± 6 .7
Table 4.10: Activation parameters for general-base catalysed racemisation o f TV-substituted 5-
benzylhydantoins by phosphate buffer at pH 7.2.
Hydantoin N- Substituent AH x / kJ m o l1 AS4 / J K 1 m o l1
-c h 3 83.7 ± 0 .8 -55.2 ± 2 .9
-c h 2c h 2o c h 3 87.9 ± 2 .9 -44.8 ± 10.0
-CH2CH2N+(CH3)3 93.7 ±2.1 -13.4 ± 6.7
170

It should be noted that the values in Table 4.8 and 4.9 appear to have been calculated from
&0bs at a single buffer concentration, rather than from the second-order rate constants obtained
from the gradient of £0bs plotted against buffer concentration. This means that the results have
not been normalised to a standard state concentration o f 1 mol L '1, and this will result in an
incorrect entropy of activation. If an extent o f specific-base catalysis contributes to the overall
rate constant as well, the problem is made worse as the enthalpy of activation is a
combination of two separate reactions (specific- and general-base catalysed).
The values determined for AH* for H/D exchange of 6e are of similar magnitude to those
displayed in Table 4.8, 4.9 and 4.10. This value is indicative of bond breaking being
important in the rate-determining step, which is consistent with an SeI mechanism.
The negative value of AS* seen for 6e is to be expected, as bringing molecules together for
reaction reduces the degrees freedom. Increased solvation (and hence negative AS*) from the
formation of a negative charge is counterbalanced by the dispersal of the doubly negative
charge from the phosphate ion. However, the value determined for AS* o f H/D exchange o f 6e
seems remarkably small in comparison with those in Table 4.10.
The entropies of activation in Table 4.10 for TV-substituted 5-benzylhydantoins have been
corrected in the same manner as for 6e. O f the three entries displayed in Table 4.10, the
quaternary amine substituted hydantoin has a less negative value o f AS* than the other entries.
This is thought to be partially because of intramolecular stabilisation of a negative charge
built up during H/D exchange by the positively charged amine, but mainly due to solvation
differences. As there is already a positive charge on the hydantoin the solvation shell is
already tightly ordered, meaning less reorganisation necessary upon deprotonation at the
stereogenic centre and hence a smaller AS*. The value o f -13.4 J K 1 m ol'1 observed for the
quaternary amine substituted hydantoin is the most similar to that observed for 6e. As no such
positive charge exists in 6e it would be expected to exhibit a AS* closer to those displayed by
the A-methyl and A-ethyl methoxy substituted hydantoins in Table 4.10. The differences
between these values and that determined for 6e may be due to the extent to which proton
transfer is complete in the activated complex. One manner in which this could be resolved is
through determination and comparison o f the Bronsted /^-coefficients.
171

4.4.1.4 High Temperature Kinetic Experiments as a Predictive Tool for
Physiological Temperatures
Alongside its use in the determination o f thermodynamic activation parameters, the data in
Table 4.6 can be used to assess the potential for using experiments at high temperatures as a
guide for potential configurational instability under physiological conditions. If accurate
predictions of unknown rate constants of H/D exchange at physiological temperatures could
be made based on high temperature experiments, experimentation on a potential drug
molecule could be carried out at higher temperatures, giving results more quickly and the
process of analysis more amenable.
An Eyring plot for H/D exchange of 6e, with the data point at 37 °C omitted, was constructed.
The extrapolated line o f best fit was used to make a ‘prediction’ for the value o f &gb at 37 °C,
giving a ‘predicted’ &gb at 37 °C of 2.39 x 10‘5 s '1 M '1. The experimental &gb at 37 °C is (7.87 ±
0.48) x 10'6 s"1 M '1.
The ‘predicted’ value of &gb is approximately 3 times higher than the experimentally
determined value. Although this is not particularly accurate, it is within an order of
magnitude. This type of approximation could therefore be o f use in drug development to
determine whether a molecule may be of a high risk of being configurationally unstable under
physiological conditions/
4.4.2 W-Acetyl P heny lg lycine A nilides 8a-l
Compounds 8a-l (Scheme 4.8) were also studied using LCMS to obtain rate constants of H/D
exchange.
1 As discussed in Section 4.4.1.2, &deu, values determined at 90 °C include a substantial degree o f specific base-
catalysis by OH' ions and/or uncatalysed reaction not observed at 37 °C. Therefore, extrapolation to predict rate
constants o f H/D exchange at high temperature from experimental data obtained at 37 °C will exclude any
contribution from kQ\ and hence is unlikely to be accurate.
172

a) X = H, Y = Hb) X = H, Y = p - M qc) X = H, Y = m-Med) X = H, Y = p-C\e) X = H, Y = m-C 1f) X = /?-Me, Y = ra-Me
g) X =/?-Me, Y = Hh) X = p-M e, Y = m-C 1i) X = p-Cl, Y = Hj) X = m-Cl, Y = p-M e k) X = m-C 1, Y = H 1) X = p - CF3, Y = H
Sa-I
Scheme 4.8: Phenylglycine amides 8a-l.
Because of the number o f compounds to analyse, it was not possible to analyse these
compounds at a range of different buffer concentrations, as was done for 6b, d, e. Therefore,
each compound 8a-l was only analysed at a single buffer concentration and temperature. Data
for all experiments are collected in the appendix. The results for each compound are
summarised in Table 4.11.
Table 4.11: Rate constants for H/D exchange of 8a-l in D20 0.3 M phosphate buffers, pH*
7 .4 ,1= 1 M at 90 °C, determined by LCMS analysis.
Compound X-substituent Y-substituent b / s'* 3 ^deut ' S
8a - - (5.45 ± 0.25) x 10'5
8b - p-M e (3.32 ± 0.35) x 10'5
8c - m-Me (4.24 ± 0.69) x 10'5
8d - p-C\ (6.41 ± 0.43) x 10 5
8e - m-C 1 (8.86 ± 0.25) x 10'5
8f p -Me ra-Me (2.22 ± 0.46) x 10'5
8g p-M e - (2.61 ±0 .44) x 10'5
8h p-Me m-Cl (4.54 ± 0.25) x 10'5
Si l Q - (1.18 ± 0.05) x lO-4
8j ra-Cl p-M e (1.44 ± 0.04) x 10‘4
8k m-Cl - (2.12 ± 0.04) x lO'4
81 P-C f 3 - (6.00 ± 0.52) x 10-4
average of two experiments
Because experiments were only carried out at one buffer concentration, it is not possible to
separate out rate constants for general- and specific- base catalysis. As a result, comparisons
173

between the values should be made with care. Nevertheless, a Hammett analysis o f the data in
Table 4.11 is still of interest.
4.4.2.1 Hammett Analysis of Phenylglycine Aromatic Substituents
Hammett plots o f the data displayed in Table 4.11 for compounds 8a, 8g, 8i, 8k and 81
(varying substituents on phenylglycine ring, no substituents on aniline ring) were constructed,
using both o and d~ substituent constants (Figure 4.7).
a) b)
Figure 4.7: Hammett plots of &deut for compounds 8a, 8g, 8i, 8k and 81
determined at 0.3 M phosphate concentration, pH* 7.4, / = 1 M, 90 °C,
correlated with a) o substituent constants, p = 1.69 ± 0.14, R2 = 0.975 and
b) substituent constants, p = 1.58 ± 0.05, R2 = 0.997.
Figure 4.7 shows that the data in Table 4.1 correlates reasonably well with both a and o~
substituent constants. Again, the small differences between a and d~ for the substituents
available make distinguishing between the two sets o f substituent constants difficult.
Nevertheless, both the size o f the error margin of p and the R2 values suggest a slightly better
correlation with the a~ substituent constants. A better correlation with d~ is consistent with
negative charge being built up on the carbon at the stereogenic centre, where it can be directly
resonance-delocalised onto the Hammett substituent.
The value o f p o f 1.58 found for &deut of 8a, g, i, k, 1 is very similar to that of 1.61 found from
&gb of 6b, d, e suggesting a similar mechanism of H/D exchange between the two sets of
compounds. Hence, the SrI mechanism is the probable mechanism of H/D exchange o f 8a, g,
i, k, 1.
174

4.4.2.2 Hammett Analysis o f Aniline Aromatic Substituents
A Hammett plot was also constructed for the H/D exchange reaction of compounds 8a-e. In
all five of these compounds the phenylglycine ring remains unsubstituted, whilst the
substituent on the aniline ring is varied. This provides an indication as to the amount of
stabilisation of negative charge provided by the aniline aromatic group. As no direct
resonance delocalisation of a negative charge built up on the stereogenic centre onto
substituents on the aniline ring is possible, the data was only correlated with Hammett o
constants (Figure 4.8).
0.50-,
0 .2 5 -
X
CJ>O
-0.25 -
-0.500.30 0.45-0.30 -0.15 0.00 0.15
<7
Figure 4.8: Hammett plot of kfeut for compounds 8a-e, at 0.3 M phosphate
concentration, pH* 7.4, / = 1 M, 90 °C. p = 0.65 ± 0.09, R2 = 0.933.
Figure 4.8 shows that the Hammett p value for H/D exchange o f 8a-e is significantly lower
than that seen for the series 8a, g, i, k, 1. The difference in p values is attributed to the number
of bonds between the site of H/D exchange and the aromatic group upon which the
substituents are being varied. The position o f the aromatic ring with substituents in the series
8a-e is three bonds away from the reaction site, as opposed to only one bond in the series 8a,
g, i, k, 1, meaning the transmission of any electronic effect is attenuated. This results in the
lower observed p value (cf. Section 1.8.2.1.1, Table 1.7).
The p value of 0.65 obtained for H/D exchange of the series is o f a similar magnitude to other
examples where the reaction site is more than one bond away from the substituted aromatic
ring, and is not in direct conjugation. Some examples are shown in Table 4.12.
175

Table 4.12: Examples of reactions with p values similar to that derived from Figure 4.8.21
Reaction a Conditions P
ArCH2COOC2H5 + OH’ -► ArCH2COO' 88 % EtOH, 30 °C 0.82
ArCH2CH2COOC2H5 + OH’ -> ArCH2CH2COO 88 % EtOH, 30 °C 0.49
ArCH2Cl + I’ —* ArCH2I Acetone, 20 °C 0.79
ArCH2F + OH’ ArCH2OH 95 % EtOH, 76 °C 0.45
a Ar = X-C6H4- where X is the variable substituent
The values of p < 1 in the examples shown in Table 4.12 and in the H/D exchange of 8a-e,
suggests that the amount of negative charge delocalised onto the aromatic ring in these
examples is less than that found in the dissociation of benzoic acids.
Transmission of electron-withdrawing effects through a secondary amide bond in the manner
shown for 8a-e has been observed through !H, 13C and 15N NM R spectroscopy.22’24 Electron-
withdrawing substituents on the anilide ring in benzanilides cause an upfield chemical shift of
the proton and carbon signals o f the acyl aromatic group in good agreement with Hammett 0
values.
The effect of varying substitution patterns on the aromatic ring o f anilide compounds was
investigated by Bergon and Calmon25 on the rate constants o f hydrolysis o f methyl
carbanilates at 25 °C (Scheme 4.9).
Scheme 4.9: Alkaline hydrolysis o f methyl carbanilates.
A p value o f 1.06 was determined for electron-withdrawing X-substituents in the reaction
depicted in Scheme 4.9. This contrasts with the value o f 0.65 determined for H/D exchange of
8a-e, which also shows transmission o f the electronic effect through the nitrogen atom of an
anilide group. The greater value determined for the reaction in Scheme 4.9 is likely because
the site of reaction is the carbonyl carbon, whereas for H/D exchange o f 8a-e the reaction site
is the a-carbon.
176

4.4.2.3 Dual Parameter Analysis
A 3D Hammett plot of the data in Table 4.11 was constructed (Figure 4.9), with
X-substituents correlated with o~ constants and Y-substituents correlated with o constants.
< r -Y
1
log(fc / k())
0.0 0.2 0.4 0.6
cr~ —X
Figure 4.9: Hammett plot of &deut for compounds 8a-l determined at 0.3 M
phosphate concentration, pH* 7.4, 1 = 1 M, 90 °C. X-substituents correlate
with a constants; Y-substituents correlate with a constants, p = (1.69 ±
0.05)x + (0.71 ±0.06)y.
Figure 4.9 shows a good correlation with the Hammett substituent constants in both the X-
and Y-positions for 8a-l. The magnitude of the slopes in both the X- and Y-directions of
Figure 4.9, are similar to the p values determined in Figure 4.7 and Figure 4.8. The good fit to
the data using a two-parameter fit suggests there is no need for a cross-interaction term
(Section 1.8.2.3). We note, however, that the absence of a requirement for a cross-interaction
term may be because there is not a great range in the values of the substituent constants in
either the X- or Y- direction.
4.4.3 N-Benzoyl Phenylglycine A m ides 7a-d
The LCMS method was also used to obtain rate constants for H/D exchange of 7a-d. As with
8a-l, each compound was only analysed at a single buffer concentration and temperature.
Individual plots are displayed in the appendix. The results for each compound are displayed in
Table 4.13.
177

Table 4.13: Rate constants o f H/D exchange of 7a-d in D20 phosphate buffers of
concentration 0.3 M, pH* 7.4, / = 1 M at 90 °C, determined by LCMS analysis.
Compound Y-substituent a ^ d e u t / S
7a - (6.50 ± 0.45) x lO'5
7b jP-OMe (5.06 ± 0.25) x 10‘5
7c / 7 - O C F 3 (8.05 ± 0.58) x 10‘5
7d P-C f 3 (9.89 ± 0.47) x 10‘5
a benzoyl ring substituent
b average of two experiments
A Hammett plot of the data in Table 4.13 is displayed in Figure 4.10.
0 .3 -,
0.2 -
X
CD 0 . 0 -o
- 0.1 -
- 0.20.750.00 0.25 0.50-0.25-0.50
<7
Figure 4.10: Hammett plot o f &deut for 7a-d determined at 0.3 M phosphate
concentration, pH* 7.4, 1 = 1 M, 90 °C. p = 0.35 ± 0.02, R2 = 0.992.
The Hammett analysis o f 7a-d in Figure 4.10 shows a p value o f 0.35. As with compounds
8a-e, this value reflects the number o f bonds between the negative charge and the aromatic
substituent. The p value o f 0.35 for 7a-d, is less than the p value o f 0.65 for 8a-e (Figure 4.8).
This suggests that a negative charge is less well transmitted through a secondary amide bond
if it is orientated with the nitrogen bound to the site o f negative charge build up.
178

4.4.4 Steric and Electronic Effects
Comparison of the rate o f H/D exchange between molecular scaffolds 6 and 8 shows an
interesting result, hi Section 3.4.7, the rate constants o f H/D exchange for 3a, 3i and 3j were
compared. It was found that increasing the size o f the ester group markedly reduced the rate
constants of H/D exchange (and hydrolysis). This was attributed to increasing steric hindrance
preventing the general base from attacking the stereogenic centre. A similar effect was
expected for the comparison of £deut between amides 6e and 81, which are the same except for
the nature o f the amide group (primary in 6e, substituted with a phenyl group in 81). However,
comparison between 6e and 81 shows similar rate constants under identical conditions (Table
4.14).
Table 4.14: Comparison o f &deut for 6e and 81 at 90 °C, in 0.3 M D20 phosphate buffers o f
pH* 7 .4 ,7= 1 M.
R group kdeut X 1 0 4 / S '1
-H (6e)
-C6H5 (81)
6.62 ±0.21
6.00 ± 0 .52
The values o f &deut in Table 4.14 are the same within error margins. This is somewhat
surprising in light o f the result mentioned earlier for the different ester compounds, as a bulky
phenyl group on the amide would provide far more steric hindrance than the esters
investigated. If this steric hindrance is present, it would suggest that the phenyl amide
substituent present in 81 is significantly more configurationally destabilising than the primary
amide in 6e, cancelling its rate-retarding steric effect. If this is the case, this may be due to the
difference in resonance delocalisation between the two groups.
Delocalisation o f the amide nitrogen lone pair onto the carbonyl oxygen will restrict any
negative charge developing on the stereogenic centre during H/D exchange being delocalised
onto the carbonyl oxygen (Scheme 4.2). This is a potential reason for the lower rates o f
racemisation seen when an ester group is replaced by an amide, and thus for the different
classifications of amide and ester groups by Testa et al. (Table 1.1). However, for a
phenyl-substituted amide the nitrogen lone-pair can be delocalised onto the phenyl ring
(Scheme 4.10).
179

N
H H
Scheme 4.10: Delocalisation o f a phenyl amide nitrogen lone-pair onto
aromatic ring.
The delocalisation shown in Scheme 4.10 will mean less negative charge build up on the
carbonyl oxygen, allowing for greater stabilisation of any negative charge built up on the
stereogenic centre during H/D exchange. It appears to be the case that the decrease in
configurational stability from these electronic factors offsets the increase in configurational
stability from steric hindrance. This results in similar rate constants o f H/D exchange for
primary amide substituted 6e and phenyl amide substituted 81.
180

4.5 Conclusions
Rate constants for H/D exchange and hydrolysis o f compounds 6b, d, e, 7a-d and 8a-l have
been determined under aqueous conditions in phosphate buffers. Analysis of this data and
comparison with the results and conclusions from Chapter 3, suggest the following
conclusions.
First, rate constants of H/D exchange for compounds with an amide substituent on the
stereogenic centre are much lower than those for analogous compounds with an ester
substituent on the stereogenic centre. This supports the assignments o f Testa et al. (Table 1.1),
that designate an ester group as a stronger configurationally destabilising substituent than an
amide. The low rate o f H/D exchange for compounds 6a-e at physiological pH and
temperature suggests that stereogenic centres such as these are not at high risk of undergoing
racemisation in the body under pharmacological timescales. However, the magnitude of the
rate constants of H/D exchange for 6a-e may be important in the synthesis or shelf-life o f a
drug based on a similar scaffold.
Second, evidence suggests that the mechanism of H/D exchange for the compounds analysed
in this chapter is the SeI mechanism. Hammett analysis o f 6b, d, e and 8a, g, i, k, 1 shows
similar levels o f negative charge built up on the reaction centre during H/D exchange as seen
for 3a-l in Chapter 3, for which an SeI mechanism was deduced. Similarly, the
thermodynamic activation parameters calculated for 6e are consistent with the SeI mechanism
when compared to literature values.
Third, Arrhenius and Eyring plots o f H/D exchange data for 6e have shown the potential for
high-temperature work to be used for rapid screening to obtain approximate information on
configurational instability at lower temperatures.
Fourth, Hammett analysis o f compounds 7a-d and 8a-l illustrates how substituents several
bonds away from the stereogenic centre can still have a large influence over the rate constant
for H/D exchange.
181

4.6 Experimental
4.6.1 G enera l E x p e rim en ta l
All reagents were purchased from Acros Organics, Alfa Aesar, Fluorochem or Sigma-Aldrich.
*H NMR and 13C NM R spectra were recorded on a Bruker DPX 400 or DPX 500
spectrometer. HMBC and HSQC experiments were used on the same spectrometers to
confirm assignments when necessary. 5 values are reported in ppm downfield from
trimethylsilane. LCMS experiments were performed using a Waters 2790 liquid
chromatograph and a W aters ZQ mass spectrometer. Samples were loaded using a Gilson
232XL autosampler. Mass spectrometry data was processed using Waters MassLynx software
and Waters QuanLynx software was used to analyse the data. Infrared spectra were obtained
using a Varian 7000 FT-IR spectrometer. Samples were applied directly to the diamond tip.
High-resolution mass spectra were obtained on a Waters LCT Premier XE mass spectrometer.
4.6.2 S yn thesis o f C o m p o u n d s
4.6.2.1 Synthesis of Phenylglycine Amides 5a-e
Compounds 5a-e were synthesised from the appropriate phenylglycine methyl ester
hydrochloride salts 2a-l, the synthesis o f which was described in the experimental to Chapter263. The method was adapted from that used by Noorduin et al. (Scheme 4.11).
O O
OMe
2
H2INH
5
Scheme 4.11: Synthesis o f phenylglycine amides 5a-e.
The general method outlined below in the synthesis of 5a was used for the synthesis o f all
compounds 5a-e.
Phenylglycine amide (5a)
Phenylglycine methyl ester hydrochloride salt (2a, 10 g, 49.6 mmol), was added to a solution
of concentrated aqueous ammonia (35 ml). The solution was stirred at room temperature for 5
182

hours. The solution was cooled to 0 °C, and the precipitate was filtered and dried under
reduced pressure to give phenylglycine amide as a white solid (6.21 g, 41.4 mmol, 83 %).
‘H NMR (400 MHz, DMSO) 5 = 7.55 (s, 1H, -C (0)N H aHb), 7.26-7.46 (m, 5H, -C6H6), 7.10
(s, 1H, -C(0)NHaH„), 4.37 (s, 1H, -CH(C6H5)-).
I3C NMR (100 MHz, DMSO) 5 = 175.37 (1C, -C (0)N H 2), 142.79 (1C, ipso aromatic carbon),
128.40 (2C, meta aromatic carbon), 127.36 (1C, para aromatic carbon), 127.12 (2C, ortho
aromatic carbon), 59.01 (1C, -C H ^ H s)-) .
IR (ss) v/cm'1: 3381, 3279, 1681
Found m/z (AP+) = 151.0865, calculated 151.0871
M.p. = 140-141 °C
(p-Methyl phenyl) glycine amide (5b)
Synthesised from compound 2c. Yield: 72 %
‘H NMR (400 MHz, DMSO) 8 = 7.46 (s, 1H, -C (0)N H aHb), 7.28 (d, 2H, aromatic protons
meta to methyl, J h-h = 7.92 Hz), 7.11 (d, 2H, aromatic protons ortho to methyl, J h-h = 7.84
Hz), 7.03 (s, 1H, -C (0)N H aH b), 4.25 (s, 1H, -CH(C6H4CH3)-), 2.27 (s, 3H, -CH3).
I3C NMR (100 MHz, DMSO) 5 = 175.57 (1C, -C(0)NH 2), 139.92 (1C, aromatic carbon para
to methyl), 136.36 (1C, aromatic carbon ipso to methyl), 128.92 (2C, aromatic carbon ortho to
methyl), 126.98 (2C, aromatic carbon meta to methyl), 59.01 (1C, -CH(C6H4CH3)-), 21.03
(1 C ,-C6H4CH3).
IR (ss) v /cm 1: 3370, 3291, 1660
Found m/z (AP+) = 165.1030, calculated 165.1028
M.p. = 114-115 °C
(p-Fluoro phenyl) glycine amide (5c)
Synthesised from compound 2d. Yield: 64 %
*H NMR (400 MHz, DMSO) 5 = 7.53 (s, 1H, -C(0)NHaHb), 7.44 (dd, 2H, aromatic protons
meta to fluorine, 37H-h = 8.68 Hz, V H-f = 5.72 Hz), 7.15 (t, 2H, aromatic protons ortho to
fluorine, V H-h = V h-f = 8.92 Hz), 7.11 (s, 1H, -C(0)NHaHb), 4.35 (s, 1H, -CHfCeHLjF)-).
13C NMR (100 MHz, DMSO) 5 = 175.57 (1C, -C(0)N H 2), 160.76 (d, 1C, aromatic carbon
ipso to fluorine, Vc-f = 243.52 Hz), 133.02 (d, 1C, aromatic carbon para to fluorine, V c r =
3.00 Hz), 130.08 (d, 2C, aromatic carbon meta to fluorine, 3J q.f = 8.44 Hz), 114.98 (d, 2C,
carbon ortho to fluorine, 2Jq-f = 22.08 Hz), 58.94 (1C, -CH(C6H4F)-).
183

IR (ss) v/cm'1: 3372, 3311, 1658
Found m/z (AP+) = 169.0770, calculated 169.0777
M.p. = 107-108 °C
(p-Chloro phenyl) glycine amide (5d)
Synthesised from compound 2e. Yield: 68 %
'H NMR (400 MHz, DMSO) 5 = 7.52 (s, 1H, -C(0)N H aHb), 7.42 (d, 2H, aromatic protonsO -J
ortho to chloro, J h-h = 8.56 Hz), 7.37 (d, 2H, aromatic protons meta to chloro, 7H-h = 8.52
Hz), 7.09 (s, 1H, -C(0)NH aH b), 4.30 (s, 1H, -CH(C6H4C1)-).
I3C NMR (100 MHz, DMSO) 5 = 175.43 (1C, -C(0)N H 2), 142.39 (1C, aromatic carbon para
to chlorine), 131.76 (1C, aromatic carbon ipso to chlorine), 128.91 (2C, aromatic carbon ortho
to chlorine), 128.27 (2C, aromatic carbon meta to chlorine), 58.54 (1C, -C H ^F C C l)-).
IR (ss) v/cm'1: 3361, 3312, 3292, 1670
Found m/z (AP+) = 185.0480, calculated 185.0482
M.p. = 105-106 °C
(p-Trifluoromethyl phenyl) glycine amide (5e)
Synthesised from compound 2h. Yield: 73 %
*H NMR (400 MHz, DMSO) 5 = 7.68 (d, 2H, aromatic protons ortho to trifluoromethyl, 3JH.h
= 8.28 Hz), 7.62 (d, 2H, aromatic protons meta to trifluoromethyl, Vh-h = 8.24 Hz), 7.57 (s,
1H, -C (0)N H aHb), 7.13 (s, 1H, -C(0)N H aH b), 4.40 (s, 1H, -CH(C6H4CF3)-).
13C NMR (100 MHz, DMSO) 5 = 175.07 (1C, -C(0)NH 2), 148.09 (s, 1C, aromatic carbon
para to trifluoromethyl), 127.86 (s, 2C, aromatic carbon meta to trifluoromethyl), 127.85 (q,
1C, aromatic carbon ipso to trifluoromethyl, Jc-f = 31.48 Hz), 125.22 (q, 2C, aromatic carbon
ortho to trifluoromethyl, 3J C-f = 3.92 Hz), 124.75 (q, 1C, -CF3, 'Jc-f = 270.06 Hz), 58.88 (1C,
-CH(C6H4CF3)-).
IR(ss) v/cm'1: 3349, 3315, 3285, 1686
Found m/z (AP+) = 219.0744, calculated 219.0745
M.p. = 134-135 °C
4.6.2.2 Syn thesis o f N-Acetyl Phenylglycine Amides 6a-e
Compounds 6a-e were synthesised from phenylglycine amides 5a-e (Scheme 4.12).
184

o o
NH
5
O
6
Scheme 4.12: Synthesis of N-acetyl phenylglycine amides 6a-e.
The general method outlined below in the synthesis of 6a was used for the synthesis o f all
compounds 6a-e.
N -Acetyl phenylglycine amide (6a)
Phenylglycine amide (5a, 0.5 g, 3.33 mmol) was suspended in anhydrous DCM (30 ml) under
a nitrogen atmosphere. Triethylamine (1.2 equiv., 4 mmol, 0.56 ml) was added, and the
mixture stirred for 30 mins. Acetyl chloride (1.2 equivs., 4 mmol, 0.29 ml) was added and the
mixture left to stir for a further three hours, before being evaporated to dryness. The residue
was washed with a small quantity of ice-cold water, before being dried under reduced
pressure to give A-acetyl phenylglycine amide as a white solid (0.49 g, 2.55 mmol, 77 %).
'H NMR (400 MHz, DMSO) 5 = 8.48 (d, 1H, -NH-, V H-h = 8.12 Hz), 7.68 (s, 1H, -
C (0)N H aHb), 7.27-7.42 (m, 5H, -C6H5), 7.13 (s, 1H, -C(0)N H aH b), 5.39 (d, 1H, -CH(C6H5)-,
V H.H = 8.12 Hz), 1.89 (s, 3H, CH3C(0)-).
I3C NMR (100 MHz, d6-DMSO) 6 =172.17 (1C, CH3C (0)-), 169.18 (1C, -C(0)N H 2), 139.59
(1C, aromatic), 128.56 (2C, aromatics), 127.72 (1C, aromatic), 127.45 (2C, aromatics), 56.37
(1C, - CH(C6H5)-), 22.81 (1C, -C (0)C H 3).
IR (ss) v/cm'1: 3338, 3268, 3188, 3083, 1653, 1631, 1542
Found m/z (AP+) = 193.0976, calculated 193.0977
M.p. = 182-183 °C
/V-Acetyl (p-methyl phenyl)glycine amide (6b)
Synthesised from compound 5b. Yield: 61 %
'H NMR (400 MHz, DMSO) 5 = 8.42 (d, 1H, -NH-, V H-h = 8.04 Hz), 7.63 (s, 1H, -
C (0)N H aHb), 7.29 (d, 2H, aromatic protons meta to methyl, Vh-h = 7.80 Hz), 7.13 (d, 2H,
aromatic protons ortho to methyl, Vh-h = 7.76 Hz), 7.10 (s, 1H, -C(0)NHaH b), 5.34 (d, 1H, -
CH(C6H4CH3)-, V h-h = 8.08 Hz), 2.27 (s, 3H, - C6H4CH3), 1.88 (s, 3H, -COCH3).
185

I3C NMR (100 MHz, DMSO) 5 = 172.36 (1C, CH3C (0)-), 169.13 (1C, -C (0)N H 2), 136.87
(1C, aromatic carbon ipso to methyl), 136.60 (1C, aromatic carbon para to methyl), 129.07
(2C, aromatic carbon ortho to methyl), 127.41 (2C, aromatic carbon meta to methyl), 56.11
(1C, - CH(C6H4CH3)-), 22.81 (1C, -C (0)CH 3), 21.03 (1C, -C6H4CH3).
IR(ss) v/cm'1: 3313, 3279, 3149, 1663, 1634, 1543
Found m/z (AP+) = 207.1143, calculated 207.1134
M.p. = 224-225 °C
/V-Acetyl (p-fluoro phenyl)glycine amide (6c)
Synthesised from compound 5c. Yield: 49 %
'H NMR (400 MHz, DMSO) 8 = 8.50 (d, 1H, -NH-, V H.n = 8.04 Hz), 7.70 (s, 1H, -
C (0)N H aHb), 7.44 (dd, 2H, -CbFL|F (aromatic protons meta to fluorine), V h-h = 8.60 Hz, V h-f
= 5.60 Hz), 7.17 (t, 2H, (aromatic protons ortho to fluorine), V h-h = V h-f = 8.92 Hz), 5.39 (d,
1H, -CH(C6H4F)-, V h-h = 8.08 Hz), 1.89 (s, 3H, CH3C(0)-).
I3C NMR (100 MHz, DMSO) 5 = 171.04 (1C, CH3C(0)-), 169.24 (1C, -C (0)O C H 3), 161.88
(d, 1C, aromatic carbon ipso to fluorine, V c-f = 243.06 Hz), 132.61 (d, 1C, aromatic carbon
para to fluorine, V c-f = 3.1 Hz), 129.87 (d, 2C, aromatic carbon meta to fluorine, V c-f = 8.36
Hz), 115.45 (d, 2C, carbon ortho to fluorine, V C.F = 21.59 Hz) , 55.44 (1C, - CH(C6H4F)-),
52.22 (1C, -OCH3), 22.12 (1C, -C (0)C H 3).
IR (ss) v/cm'1: 3322, 3254, 3158, 3061, 1652, 1628, 1551
Found m/z (AP+) = 211.0879, calculated 211.0883
M.p. = 214-215 °C
A-Acetyl (p-chloro phenyl)glycine amide (6d)
Synthesised from compound 5d. Yield: 71 %
'H NMR (400 MHz, DMSO) 8 = 8.52 (d, 1H, -NH-, V HH = 8.00 Hz), 7.73 (s, 1H, -
C (0)N H aHb), 7.36-7.45 (m, 4H, aromatic protons), 7.19 (s, 1H, -C(0)N H aH b), 5.40 (d, 1H, -
CH(C6FL,C1)-, V h-h = 8.04 Hz).
I3C NMR (100 MHz, DMSO) 8 = 171.78 (1C, CH3C (0)-), 169.27 (1C, -C (0)N H 2), 138.67
(1C, aromatic carbon para to chlorine), 132.39 (1C, aromatic carbon ipso to chlorine), 129.30
(2C, aromatic carbon ortho to chlorine), 128.56 (2C, aromatic carbon meta to chlorine), 55.71
(1C, -CH(C6H4C1)-), 22.77 (1C, CH3C(0)-).
IR (ss) v/cm ': 3259, 3165, 3069, 1651, 1624, 1555
186

Found m/z (AP+) = 227.0588, calculated 227.0587
M.p. = 223-224 °C
/V-Acetyl (p-trifluoromethyl phenyl)glycine amide (6e)
Synthesised from compound 5e. Yield: 62 %
'H NMR (400 MHz, DMSO) 8 = 8.63 (d, 1H, -NH-, Vh-h = 8.04 Hz), 7.83 (s, 1H, -
C(0)NHaHb), 7.73 (d, 2H, aromatic protons ortho to trifluoromethyl, Vh-h = 8.12 Hz), 7.63
(d, 2H, aromatic protons meta to trifluoromethyl, Vh-h = 8.04 Hz), 7.27 (s, 1H, -C(0)NHaHb),
5.51 (s, 1H, -CH(C6H4CF3)-, Vh-h = 8.04 Hz), 1.91 (s, 3H, -COCHj).
13C NMR (100 MHz, DMSO) 6 = 171.39 (1C, CH3C(0)-), 169.40 (1C, -C(0)NH2), 144.36 (s,
1C, aromatic carbon para to trifluoromethyl), 128.23 (q, 1C, aromatic carbon ipso to
trifluoromethyl, Jq-y = 63.08 Hz), 128.20 (s, 2C, aromatic carbon meta to trifluoromethyl),
125.55 (q, 2C, aromatic carbon ortho to trifluoromethyl, Vc-f = 3.66 Hz), 124.61 (q, 1C, -CF3,
Vc-f = 270.40 Hz), 56.09 (1C, -CH(C6H4CF3)-), 22.74 (1C, CH3C (0)-).
IR (ss) v/cm’1: 3305, 3167, 1682, 1620, 1540
Found m/z (AP+) = 261.0856, calculated 261.0851
M.p. = 232-233 °C
4 .6.2.3 S yn th esis o fN -B en zo yl P henylg lycine A m id es 7a-d
Compounds 7a-d were synthesised from phenylglycine amide 5a (Scheme 4.13).
X
O
NH
5a
X C 6H4C (0 )C I
NEt-a
O
7a-d
NH;
Scheme 4.13: Synthesis o f A-benzoyl phenylglycine amides 7a-d.
The general method outlined below in the synthesis o f 7a was used for the synthesis of all
compounds 7a-d.
A-Benzoyl phenylglycine amide (7a)
187

Phenylglycine amide (5a, 0.5 g, 3.33 mmol) was suspended in anhydrous DCM (30 ml) under
a nitrogen atmosphere. Triethylamine (1.2 equiv., 4 mmol, 0.56 ml) was added, and the
mixture stirred for 30 mins. Benzoyl chloride (1.2 equivs., 4 mmol, 0.29 ml) was added and
the mixture left to stir for a further three hours, before being evaporated to dryness. The
residue was triturated with water and filtered. The residue was washed on the filter with
water, then with 1 M HC1, water, saturated NaHCC>3 solution, water and finally with diethyl
ether before being dried under reduced pressure to give A-benzoyl phenylglycine amide as a
white solid (0.73 g, 2.87 mmol, 86 %).
'H NMR (400 MHz, DMSO) 8 = 8.73 (d, 1H, -NH-, l / H-n = 7.96 Hz), 7.92 (d, 2H, ortho
benzoyl aromatic protons, 3J h -h = 7.08 Hz), 7.71 (s, 1H, -C (0)N H aHb), 7.28-7.56 (m, 8H,
meta and para benzoyl aromatic protons and phenylglycine aromatic protons), 7.26 (s, 1H, -
C(0)NHaH b), 5.63 (d, 1H, -CH(C6H5)-, 3J H-h = 7.96 Hz).
13C NMR (125 MHz, DMSO) 8 = 171.63 (1C, -C(0)N H 2), 165.89 (1C, -C (0)C 6H5), 138.78
(1C, ipso phenylglycine aromatic carbon), 133.96 (1C, ipso benzoyl aromatic carbon), 131.35
(1C, para benzoyl aromatic carbon), 128.21 (2C, meta benzoyl aromatic carbon), 128.18 (2C,
meta phenylglycine aromatic carbon), 127.54 (2C, ortho benzoyl aromatic carbon), 127.47
(1C, para phenylglycine aromatic carbon), 127.43 (2C, ortho phenylglycine aromatic carbon),
56.80 (1C, -CH(C6H5)-).
IR (ss) v/cm'1: 3370, 3255, 3164, 1660, 1636, 1520
Found m/z (A P ^ = 255.1129, calculated 255.1134
M.p. = 224-225 °C
7V-(p-Methoxy benzoyl) phenylglycine amide (7b)
Yield: 79 %
'H NMR (400 MHz, DMSO) 8 = 8.55 (d, 1H, -NH-, VH H = 8 08 Hz)> 7 91 (d> 2H> ortho t0 carbonyl benzoyl aromatic protons, Vh-h = 8.84 Hz), 7.69 (s, 1H, -C(0)NHaHb), 7.51 (d, 2H,
ortho phenylglycine aromatic protons, 7h-h = 7.20 Hz), 7.35 (t, 2H, meta phenylglycine
aromatic protons, 3J H-h = 7.56 Hz), 7.29 (t, 1H, para phenylglycine aromatic proton, V H-h =
7.16 Hz), 7.24 (s, 1H, -C(0)NHaHb), 6.99 (d, 2H, meta to carbonyl benzoyl aromatic protons,
V h = 8.88 Hz), 5.61 (d, 1H, -CH(C6H5)-, 3J H-h = 8.00 Hz), 3.81 (s, 3H, -OCH3).
I3C NMR (125 MHz, DMSO) 8 = 171.79 (1C, -C(0)NH 2), 165.32 (1C, -C(0)C 6H40C H 3),
161.74 (1C, benzoyl aromatic carbon ipso to methoxy, para to amide), 138.96 (1C, ipso
phenylglycine aromatic carbon), 129.42 (2C, benzoyl aromatic carbon meta to methoxy, ortho
to amide), 128.18 (2C, meta phenylglycine aromatic carbon), 127.41 (1C, para phenylglycine188

aromatic carbon), 127.41 (2C, ortho phenylglycine aromatic carbon), 126.17 (1C, benzoyl
aromatic carbon para to methoxy, ipso to amide), 113.42 (2C, benzoyl aromatic carbon ortho
to methoxy, meta to amide), 56.73 (1C, -CH(C6H5)-), 55.33 (1C, -OCH3).
IR (ss) v/cm'1: 3367, 3283, 3196, 1739, 1626, 1608
Found m/z (AP+) = 285.1243, calculated 285.1239
M.p. = 191-192 °C
7V-(p-Trifluoromethoxy benzoyl) phenylglycine amide (7c)
Yield: 49 %
'H NMR (400 MHz, DMSO) 5 = 8.93 (d, 1H, -NH-, 3J H.H = 7.88 Hz), 8.05 (d, 2H, ortho to
carbonyl benzoyl aromatic protons, V h-h = 8.76 Hz), 7.73 (s, 1H, -C(0)NH„Hb), 7.52 (d, 2H,' i
ortho phenylglycine aromatic protons, J h-h = 7.20 Hz), 7.46 (d, 2H, meta to carbonyl benzoyl3 3aromatic protons, J h-h = 8.16 Hz), 7.36 (t, 2H, meta phenylglycine aromatic protons, J H H =
7.28 Hz), 7.30 (t, 1H, para phenylglycine aromatic proton, V h-h = 7.12 Hz), 7.26 (s, 1H, -
C(0)NHaHb), 5.61 (d, 1H, -CH(C6H5)-, V H-h = 7.88 Hz).
13C NMR (125 MHz, DMSO) 5 = 171.52 (1C, -C(0)NH2), 164.84 (1C, -C(0)C6H4OCF,),
150.37 (1C, benzoyl aromatic carbon ipso to trifluoromethoxy, para to amide), 138.57 (1C,
ipso phenylglycine aromatic carbon), 133.09 (1C, benzoyl aromatic carbon para to
trifluoromethoxy, ipso to amide), 130.02 (2C, benzoyl aromatic carbon meta to
trifluoromethoxy, ortho to amide), 128.19 (2C, meta phenylglycine aromatic carbon), 127.51
(1C, para phenylglycine aromatic carbon), 127.51 (2C, ortho phenylglycine aromatic carbon),
120.38 (2C, benzoyl aromatic carbon ortho to trifluoromethoxy, meta to amide), 119.96 (q,
1C, -OCF3, Vc-f = 255.61 Hz), 57.00 (1C, -CH(C6H5)-).
IR(ss) v/cm*1: 3364, 3281,3189, 1739, 1627, 1607
Found m/z (AP+) - 339.0951, calculated 339.0957
M.p. = 239-240 °C
7V-(p-Trifluoromethyl benzoyl) phenylglycine amide (7d)
Yield: 86 %
*H NMR (400 MHz, DMSO) 6 = 9.07 (d, 1H, -NH-, V H.H = 7.84 Hz), 8.11 (d, 2H, ortho to
carbonyl benzoyl aromatic protons, 3J H-h = 8.12 Hz), 7.84 (d, 2H, meta to carbonyl benzoyl
aromatic protons, Vh-h = 8-32 Hz), 7.75 (s, 1H, -C(0)NHaHb), 7.53 (d, 2H, ortho
phenylglycine aromatic protons, V H-h = 7.64 Hz), 7.37 (t, 2H, meta phenylglycine aromatic
189

protons, V h -h - 7.32 Hz), 7.31 (t, 1H, para phenylglycine aromatic proton, 3Jh-h = 7.20 Hz),
7.27 (s, 1H, -C(O)NHaHb), 5.63 (d, 1H, -CH(C6H5)-, V H-h = 7.88 Hz).
13C NMR (125 MHz, DMSO) 5 = 171.42 (1C, -C (0)N H 2), 164.96 (1C, -C(0)C6H4CF3),
138.46 (1C, ipso phenylglycine aromatic carbon), 137.80 (1C, benzoyl aromatic carbon para
to trifluoromethyl, ipso to amide), 131.22 (q, 1C, benzoyl aromatic carbon ipso to
trifluoromethyl, para to amide, V c-f = 31.64 Hz), 128.59 (2C, benzoyl aromatic carbon mate
to trifluoromethyl, ortho to amide), 128.22 (2C, meta phenylglycine aromatic carbon), 127.54
(1C, para phenylglycine aromatic carbon), 127.54 (2C, ortho phenylglycine aromatic carbon),
125.10 (q, 2C, benzoyl aromatic carbon ortho to trifluoromethyl, meta to amide, V c-f = 3.42
Hz), 123.92 (q, 1C, -CF3, ‘J c-f = 270.91 Hz), 57.04 (1C, -CH(C6H5)-).
IR (ss) v /cm 1: 3260, 3168, 1739, 1635, 1531
Found m/z (ES') = 321.0865, calculated 321.0851
M.p. = 218-220 °C
4.6.2.4 S y n th es is o f N -A cetyl P h en y lg lyc in e A n ilid es 8a-l
Compounds 8a-l were synthesised from the corresponding A-acetyl phenylglycines 4a, c-e, g-
h, the synthesis o f which is described in the experimental to chapter 3. The method was9 7adapted from that used by Hyun et al. (Scheme 4.14).
NH
O
8
O H
E E D QO
4
Scheme 4.14: Synthesis o f A-acetyl phenylglycine anilides 8a-l.
The general method outlined below in the synthesis o f 8a was used for the synthesis of all
compounds 8a-l. Assignments o f *H and 13C NMR spectra were made with the aid of 2D
spectra (HSQC and HMBC) and the use o f approximate substituent chemical shift tables by28Williams and Fleming.
2-Acetamido-2-phenyl acetanilide (8a)
190
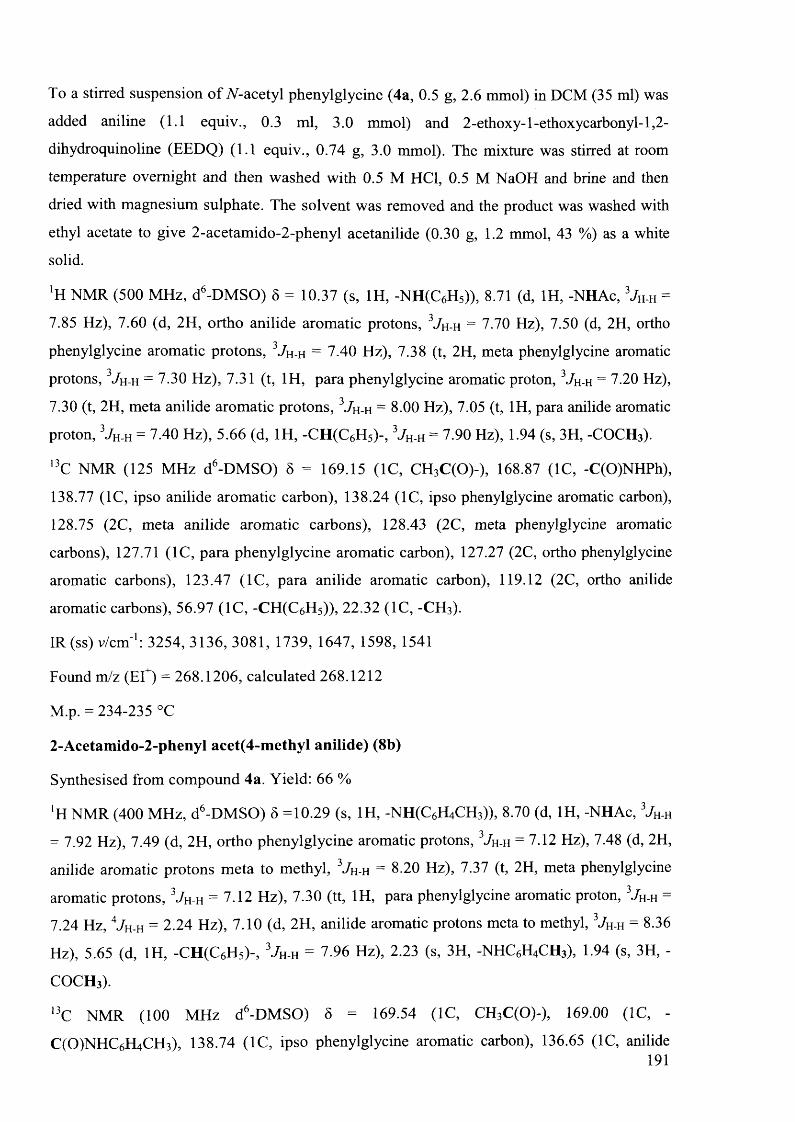
To a stirred suspension o f A-acetyl phenylglycine (4a, 0.5 g, 2.6 mmol) in DCM (35 ml) was
added aniline (1.1 equiv., 0.3 ml, 3.0 mmol) and 2-ethoxy-1-ethoxycarbonyl-1,2-
dihydroquinoline (EEDQ) (1.1 equiv., 0.74 g, 3.0 mmol). The mixture was stirred at room
temperature overnight and then washed with 0.5 M HC1, 0.5 M NaOH and brine and then
dried with magnesium sulphate. The solvent was removed and the product was washed with
ethyl acetate to give 2-acetamido-2-phenyl acetanilide (0.30 g, 1.2 mmol, 43 %) as a white
solid.
*H NMR (500 MHz, d6-DMSO) 5 = 10.37 (s, 1H, -NH(C6H5)), 8.71 (d, 1H, -NHAc, 3J H-h =
7.85 Hz), 7.60 (d, 2H, ortho anilide aromatic protons, V h-h = 7.70 Hz), 7.50 (d, 2H, ortho
phenylglycine aromatic protons, 3J H-h = 7.40 Hz), 7.38 (t, 2H, meta phenylglycine aromatic3 3protons, 7h-h = 7-30 Hz), 7.31 (t, 1H, para phenylglycine aromatic proton, J h-h = 7.20 Hz),
7.30 (t, 2H, meta anilide aromatic protons, V h-h = 8.00 Hz), 7.05 (t, 1H, para anilide aromatic
proton, V H-h = 7.40 Hz), 5.66 (d, 1H, -CH (C6H5)-, 3J HH = 7.90 Hz), 1.94 (s, 3H, -COCH3).
I3C NMR (125 MHz d6-DMSO) 8 = 169.15 (1C, CH3C (0)-), 168.87 (1C, -C(O)NHPh),
138.77 (1C, ipso anilide aromatic carbon), 138.24 (1C, ipso phenylglycine aromatic carbon),
128.75 (2C, meta anilide aromatic carbons), 128.43 (2C, meta phenylglycine aromatic
carbons), 127.71 (1C, para phenylglycine aromatic carbon), 127.27 (2C, ortho phenylglycine
aromatic carbons), 123.47 (1C, para anilide aromatic carbon), 119.12 (2C, ortho anilide
aromatic carbons), 56.97 (1C, -CH(C6H 5)), 22.32 (1C, -CH3).
IR (ss) v/cm'1: 3254, 3136, 3081, 1739, 1647, 1598, 1541
Found m/z (EI^) = 268.1206, calculated 268.1212
M.p. = 234-235 °C
2-Acetamido-2-phenyl acet(4-m ethyl anilide) (8b)
Synthesised from compound 4a. Yield: 66 %
'H NMR (400 MHz, d6-DMSO) 5 =10.29 (s, 1H, -NH(C6H4CH3)), 8.70 (d, 1H, -NHAc, 3J H-h
= 7.92 Hz), 7.49 (d, 2H, ortho phenylglycine aromatic protons, V H-h = 7.12 Hz), 7.48 (d, 2H,
anilide aromatic protons meta to methyl, V H-h = 8.20 Hz), 7.37 (t, 2H, meta phenylglycine
aromatic protons, 3J H-h = 7.12 Hz), 7.30 (tt, 1H, para phenylglycine aromatic proton, VH-h =
7.24 Hz, V H-h = 2.24 Hz), 7.10 (d, 2H, anilide aromatic protons meta to methyl, 3J H-h = 8-36
Hz), 5.65 (d, 1H, -CH (C6H 5)-, V h-h = 7.96 Hz), 2.23 (s, 3H, -NHC6H4CH3), 1.94 (s, 3H, -
COCH3).
,3C NMR (100 MHz d6-DMSO) 6 = 169.54 (1C, CH3C(0)-), 169.00 (1C, -
C (0)N H C 6H4CH3), 138.74 (1C, ipso phenylglycine aromatic carbon), 136.65 (1C, anilide191

aromatic carbon para to methyl), 132.81 (1C, anilide aromatic carbon ipso to methyl), 129.52
(2C, anilide aromatic carbons ortho to methyl), 128.81 (2C, meta phenylglycine aromatic
carbons), 127.08 (1C, para phenylglycine aromatic carbon), 127.64 (2C, ortho phenylglycine
aromatic carbons), 119.48 (2C, anilide aromatic carbons meta to methyl), 57.27 (1C, -
CH(C6H5)), 22.72 (1C, -COCH3), 20.79 (1C, -C6H4CH3).
IR(ss) v /cm 1: 3300, 3260, 1739, 1648, 1539
Found m/z (EI+) = 282.1377, calculated 282.1368
M.p. = 210-211 °C
2-Acetamido-2-phenyl acet(3-methyl anilide) (8c)
Synthesised from compound 4a. Yield: 39 %
'H NMR (400 MHz, d6-DMSO) 5 =10.27 (s, 1H, -NH(C6H4CH3)), 8.68 (d, 1H, -NHAc, V h - h
= 7.80 Hz), 7.49 (d, 2H, ortho phenylglycine aromatic protons, 3, / h . h = 7.24 Hz), 7.41 (s, 1H,
anilide aromatic proton, ortho to methyl and amide), 7.35-7.39 (m, 3H, meta phenylglycine
aromatic protons and anilide aromatic proton, ortho to amide, para to methyl), 7.30 (tt, 1H,
para phenylglycine aromatic proton, V H-h = 7.20 Hz, V h -h = 2.20 Hz), 7.17 (t, 1H, anilide
aromatic proton, meta to methyl and amide, V H-h = 7.80 Hz), 6.86 (d, 1H, anilide aromatic
proton, ortho to methyl, para to amide, Vh-h = 7.48 Hz), 5.63 (d, 1H, -CH(C6H5)-, Vh-h =
7.84 Hz), 2.25 (s, 3H, -NHC6H4C H 3), 1.93 (s, 3H, -COCH3).
13C N M R (100 M H z d6-DMSO) 5 = 169.55 (1C, C H 3C ( 0 ) - ) , 169.19 (1C, -
C (0 )N H C 6 H 4C H 3), 139.08 (1C, anilide aromatic carbon ipso to amide), 138.60 (1C, ipso
phenylglycine aromatic carbon), 138.35 (1C, anilide aromatic carbon, ipso to methyl), 129.00
(1C, anilide aromatic carbon, meta to methyl and amide), 128.82 (2C, meta phenylglycine
aromatic carbons), 128.11 (1C, para phenylglycine aromatic carbon), 127.67 (2C, ortho
phenylglycine aromatic carbons), 124.55 (1C, anilide aromatic carbon, para to amide, ortho to
methyl), 119.98 (1C, anilide aromatic carbon, ortho to methyl and amide), 116.66 (1C, anilide
aromatic carbon, ortho to amide, para to methyl), 56.97 (1C, - C H ^ H s ) ) , 22.32 (1C, -C H 3).
IR(ss) v /cm 1: 3250, 1739, 1636, 1538
Found m/z (EI+) = 282.1372, calculated 282.1368
M.p. = 223-224 °C
2-Acetamido-2-phenyl acet(4-chloro anilide) (8d)
Synthesised from compound 4a. Yield: 56 %
192

‘H NMR (400 MHz, d6-DMSO) 5 = 10.57 (s, 1H, -NH(C6H4C1)), 8.74 (d, 1H, -NHAc, l / H-n =
7.72 Hz), 7.64 (d, 2H, anilide aromatic protons meta to chloro, Vh-h = 8.76 Hz), 7.49 (d, 2H,
ortho phenylglycine aromatic protons, V H-H = 7.44 Hz), 7.31-7.39 (m, 5H, meta and para
phenylglycine aromatic protons and anilide aromatic protons ortho to chloro), 5.63 (d, 1H, -
CH(C6H5)-, V h -h = 7.72 Hz), 1.93 (s, 3H, -COCH3).
13C NMR (100 MHz d6-DMSO) 5 = 169.62 (1C, CH3C (0)-), 169.46 (1C, -C(0)NHC6H4C1),
138.29 (1C, ipso phenylglycine aromatic carbon), 138.12 (1C, anilide aromatic carbon para to
chloro), 129.07 (2C, anilide aromatic carbons ortho to chloro), 128.88 (2C, meta
phenylglycine aromatic carbons), 128.22 (1C, anilide aromatic carbon ipso to chloro), 127.73
(2C, ortho phenylglycine aromatic carbons), 127.41 (1C, para phenylglycine aromatic
carbon), 121.04 (2C, anilide aromatic carbons meta to chloro), 57.45 (1C, -CH(C6H5)), 22.68
(1C, -CH3).
IR(ss) v /cm 1: 3329, 3254,3191, 1739, 1646, 1539
Found m/z (EI+) = 302.0820, calculated 302.0822
M.p. = 221-222 °C
2-Acetamido-2-phenyl acet(3-chloro anilide) (8e)
Synthesised from compound 4a. Yield: 42 %
*H NMR (400 MHz, d6-DMSO) 6 = 10.56 (s, 1H, -NH(C6H4C1)), 8.73 (d, 1H, -NHAc, VH.H =
7.60 Hz), 7.81 (t, 1H, anilide aromatic proton ortho to amide and chloro, Vh-h = 1-92 Hz),
7.48 (d, 2H, ortho phenylglycine aromatic protons, V h -h = 7.24 Hz), 7.45 (d, 1H, anilide
aromatic proton ortho to amide para to chloro, V h -h = 8.48 Hz), 7.38 (t, 2H, meta
phenylglycine aromatic protons, V h -h = 7.04 Hz), 7.30-7.35 (m, 2H, para phenylglycine
aromatic proton, meta anilide aromatic proton), 7.11 (d, 1H, anilide aromatic proton ortho to
chloro para to amide, V h -h = 7.92 Hz, V h -h = 1.28 Hz), 5.60 (d, 1H, -OfrC^Hs)-, V h -h = 7.60
Hz), 1.93 (s, 3H, -COCH3).
I3C NMR (100 MHz d6-DM SO) 5 = 169.71 (1C, CH3C (0)-), 169.69 (1C, -C(0)NHC6H4C1),
140.57 (1C, anilide aromatic carbon ipso to amide), 138.05 (1C, ipso phenylglycine aromatic
carbon), 133.47 (1C, anilide aromatic carbon ipso to chloro), 130.92 (1C, anilide aromatic
carbon meta to amide and chloro), 128.92 (2C, meta phenylglycine aromatic carbons), 128.30
(1C, para phenylglycine aromatic carbon), 127.78 (2C, ortho phenylglycine aromatic
carbons), 123.61 (1C, anilide aromatic carbon ortho to chloro para to amide), 118.90 (1C,
anilide aromatic carbon ortho to amide and chloro), 117.87 (1C, anilide aromatic carbon ortho
to amide para to chloro), 57.56 (1C, -CH(C6Hs)), 22.65 (1C, -CH3).
193

IR(ss) v/cm'1: 3300, 1738, 1645, 1597
Found m/z (EI+) = 302.0815, calculated 302.0822
M.p. = 211-212 °C
2-Acetamido-2-(4-methyl phenyl) acet(3-methyl anilide) (8f)
Synthesised from compound 4c. Yield: 28 %
'H NMR (500 MHz, d6-DMSO) 5 = 10.21 (s, 1H, -NH(C6H4CH3)), 8.61 (d , 1H, -NHAc, V H-h
= 7.70 Hz), 7.40 (s, 1H, anilide aromatic proton ortho to amide and methyl), 7.35-7.37 (m,
3H, phenylglycine aromatic protons meta to methyl and anilide aromatic proton ortho to
amide para to methyl), 7.15-7.18 (m, 3H, phenylglycine aromatic protons ortho to methyl and
anilide aromatic proton meta to amide and methyl), 6.86 (d, 1H, anilide aromatic proton para
to amide ortho to methyl, V H-h = 7.30 Hz), 5.57 (d, 1H, -CH(C6H4CH3)-, Vh-h = 7.75 Hz),
2.27 (s, 3H, -CH(C6H4CH 3)-), 2.26 (s, 3H, -NHC6H4CH3), 1.92 (s, 3H, -C(0)CH 3).
13C NMR (125 MHz d6-DMSO) 6 = 169.08, (1C, CH3C(0)-), 168.96 (1C, -
C(0)NHC6H4CH3), 138.73 (1C, anilide aromatic carbon ipso to amide), 137.91 (1C, anilide
aromatic carbon ipso to methyl), 136.94 (1C, phenylglycine aromatic carbon ipso to methyl),
135.23 (1C, phenylglycine aromatic carbon para to methyl), 128.92 (2C, phenylglycine
aromatic carbons ortho to methyl), 128.56 (1C, anilide aromatic carbon meta to amide and
methyl), 127.19 (2C, phenylglycine aromatic carbons meta to methyl), 124.09 (1C, anilide
aromatic carbon para to amide ortho to methyl), 119.60 (1C, anilide aromatic carbon ortho to
amide and methyl), 116.29 (1C, anilide aromatic carbon ortho to amide para to methyl), 56.72
(1C, -CH(C6H4CH3), 22.31 (1C, -C (0 )C H 3), 21.12 (1C, -NHC6H4CH3), 20.63 (1C, -
CH(C6H4CH3)-).
IR (ss) v/cm'1: 3296, 2971, 1739, 1647, 1539
Found m/z (El ) = 296.1522, calculated 269.1525
M.p. = 198-200 °C
2-Acetamido-2-(4-methyl phenyl) acetanilide (8g)
Synthesised from compound 4c. Yield: 30 %
!H NMR (500 MHz, d6-DMSO) 5 = 10.28 (s, 1H, -NH(C6H5)), 8.60 (d, 1H, -NHAc, VH.H =7.85 Hz), 7.58 (d, 2H, ortho anilide aromatic protons, V H - h = 7.70 Hz), 7.37 (d, 2H,
phenylglycine aromatic protons meta to methyl, V h-h = 8.05 Hz), 7.29 (t, 2H, meta anilide
aromatic protons, V H - h = 7.60 Hz), 7.17 (d, 2H, phenylglycine aromatic protons ortho to
194

methyl, V h-h - 7.95 Hz), 7.04 (t, 1H, para anilide aromatic proton, V h-h = 7.35 Hz), 5.60 (d,
1H, -CH(C6H4CH,)-, V h-h = 7.85 Hz), 2.28 (s, 3H, - Q IH C H j), 1.93 (s, 3H, -C(0)CH3).
13C NMR (125 MHz d6-DMSO) 5 = 169.08, (1C, CH3C (0)-), 169.02 (1C, -C(0)NHC6H5),
138.81 (1C, anilide aromatic carbon ipso to amide), 136.95 (1C, phenylglycine aromatic
carbon ipso to methyl), 135.25 (1C, phenylglycine aromatic carbon para to methyl), 128.93
(2C, phenylglycine aromatic carbons ortho to methyl), 128.71 (2C, meta anilide aromatic
carbons), 127.19 (2C, phenylglycine aromatic carbons meta to methyl), 123.41 (1C, para
anilide aromatic carbon), 119.12 (2C, ortho anilide aromatic carbons), 56.72 (1C, -
CH(C6H4CH3), 22.32 (1C, -C (0 )C H 3), 20.62 (1C, -CH(C6H4CH3)-).
IR (ss) v/cm'1: 3018, 1739, 1646, 1540
Found m/z (EI+) = 282.1362, calculated 282.1368
M.p. = 218-220 °C
2-Acetamido-2-(4-methyl phenyl) acet(3-chloro anilide) (8h)
Synthesised from compound 4c. Yield: 27 %
lH NMR (400 MHz, d6-DMSO) 5 =10.50 (s, 1H, -N H ^H U C l)), 8.66 (d, 1H, -NHAc, VH-h =
7.52 Hz), 7.80 (d, 1H, anilide aromatic proton ortho to amide and chloro, V h-h = 1-96 Hz),
7.44 (td, 1H, anilide aromatic proton ortho to amide para to chloro, Vh-h = 8.02 Hz, Vh-h =
1.00 Hz), 7.36 (d, 2H, phenylglycine aromatic protons meta to methyl, V h-h = 8.08 Hz), 7.32
(t, 1H, anilide aromatic proton meta to amide and chloro, J h-h = 8.12 Hz), 7.18 (d, 2H,
phenylglycine aromatic protons ortho to methyl, Vh-h = 7.96 Hz), 7.04 (dt, 1H, anilide
aromatic proton para to amide ortho to chloro, Vh-h = 7.28 Hz, Vh-h = 1-20 Hz), 5.53 (d, 1H,
-CH(C6H4CH3)-, V h-h = 7.60 Hz), 2.28 (s, 3H, - C6H4CH3), 1.92 (s, 3H, -C(0)CH 3).
13C NMR (100 M H z d6-DMSO) 5 = 169.88, (1C, C H 3C ( 0 ) - ) , 169.63 (1C, -
C (0 )N H C 6 H 4C H 3), 140.62 (1C, anilide aromatic carbon ipso to amide), 137.58 (1C,
phenylglycine aromatic carbon ipso to methyl), 135.03 (1C, phenylglycine aromatic carbon
para to methyl), 133.45 (1C, anilide aromatic carbon ipso to chloro), 130.91 (1C, anilide
aromatic carbon meta to amide and chloro), 129.42 (2C, phenylglycine aromatic carbons
ortho to methyl), 127.70 (2C, phenylglycine aromatic carbons meta to methyl), 123.54 (1C,
anilide aromatic carbon para to amide ortho to chloro), 118.17 (1C, anilide aromatic carbon
ortho to amide and chloro), 117.84 (1C, anilide aromatic carbon ortho to amide para to
chloro), 57.31 (1C, -C H (C 6H 4 C H 3), 22.65 (1C, - C ( 0 ) C H 3), 21.04 (1C, -C H (C 6H 4 C H 3)-).
IR (ss) v/cm '1: 3011, 1739, 1646, 1595, 1534
195

Found m/z (EI+) = 316.0987, calculated 316.0979
M.p. = 202-206 °C
2-Acetamido-2-(4-chloro phenyl) acetanilide (8i)
Synthesised from compound 4e. Yield: 22 %
*H NMR (400 MHz, d6-DMSO) 5 = 10.42 (s, 1H, -NH(C6H5)), 8.77 (d, 1H, -NHAc, V H-h =
7.88 Hz), 7.59 (d, 2H, ortho anilide aromatic protons, Vh-h = 7.72 Hz), 7.52 (d, 2H,
phenylglycine aromatic protons m eta to chloro, V H.H = 8.56 Hz), 7.46 (d, 2H, phenylglycine
aromatic protons ortho to chloro, V H-h = 8.52 Hz), 7.31 (t, 2H, meta anilide aromatic protons,
V h-h = 7.68 Hz), 7.06 (t, 1H, para anilide aromatic proton, V h-h = 7.36 Hz), 5.68 (d, 1H, -
CH(C6H4C1)-, V h-h = 7.88 Hz), 1.94 (s, 3H, -C (0)C H 3).
13C NMR (100 MHz d6-DMSO) 5 = 169.62, (1C, CH3C (0)-), 168.84 (1C, -C(0)NHC6H5),
139.01 (1C, anilide aromatic carbon ipso to amide), 137.65 (1C, phenylglycine aromatic
carbon para to chloro), 132.84 (1C, phenylglycine aromatic carbon ipso to chloro), 129.49
(2C, phenylglycine aromatic carbons ortho to chloro), 129.19 (2C, meta anilide aromatic
carbons), 128.85 (2C, phenylglycine aromatic carbons meta to chloro), 124.01 (1C, para
anilide aromatic carbon), 119.52 (2C, ortho anilide aromatic carbons), 56.66 (1C, -
CH(C6H4C1), 22.70 (1C, -C (0 )C H 3).
IR (ss) v/cm'1: 3290, 3260, 1739, 1643, 1536
Found m/z (EI+) = 302.0814, calculated 302.0822
M.p. = 235-237 °C
2-Acetamido-2-(3-chloro phenyl) acet(4-methyl anilide) (8j)
Synthesised from compound 4g. Yield: 39 %
'H NMR (500 MHz, d6-DMSO) 8 = 10.29 (s, 1H, -NHC6H4CH3), 8.73 (d, 1H, -NHAc, Vh-h
= 7.95 Hz), 7.55 (s, 1H, phenylglycine aromatic proton ortho to chloro and SC), 7.46 (d, 2H,
aniline aromatic protons ortho to amide meta to methyl, V h -h = 8.30 Hz), 7.46 (obs d, 1H,
phenylglycine aromatic proton ortho SC para to chloro), 7.41 (t, 1H, phenylglycine aromatic
proton meta to chloro and SC), 7.38 (dt, 1H, phenylglycine aromatic proton ortho to chloro
para to SC, V H H = 7 85 H z> ^h -h = 1-75 Hz), 7.11 (d, 2H, aniline aromatic protons meta to
amide ortho to methyl, V h -h = 8.30 Hz), 5.66 (d, 1H , -CH(C6H4C1)-, V h -h = 7.95 Hz), 2.24
(s, 3H, -NHC6H4CH 3), 1.94 (s, 3H, -C (0 )C H 3).
13C NMR (125 MHz d6-DMSO) 5 = 169.20, (1C, CH3C (0)-), 167.96 (1C, -C(0)NHC6H5),
140.83 (1C, phenylglycine aromatic carbon meta to chloro, ipso to SC), 136.01 (1C, anilide
196

aromatic carbon ipso to amide), 133.05 (1C, phenylglycine aromatic carbon ipso to chloro),
132.66 (1C, anilide aromatic carbon ipso to methyl), 130.35 (1C, phenylglycine aromatic
carbon meta to chloro and SC), 129.15 (2C, anilide aromatic carbon ortho to methyl meta to
amide), 127.68 (1C, phenylglycine aromatic carbon ortho to chloro, para to SC), 126.97 (1C,
phenylglycine aromatic carbon ortho to chloro and SC), 125.96 (1C, phenylglycine aromatic
carbon para to chloro, ortho to SC), 119.23 (2C, anilide aromatic carbon meta to methyl ortho
to amide), 56.38 (1C, -CH (C6H4C1), 22.31 (1C, -C (0)C H 3), 20.39 (1C, -NHC6H4CH3).
IR (ss) v/cm'1: 3270, 1738, 1640, 1533
Found m/z (EI+) = 316.0984, calculated 316.0979
M.p. = 230-232 °C
2-Acetamido-2-(3-chloro phenyl) acetanilide (8k)
Synthesised from compound 4g. Yield: 53 %
'H NMR (500 MHz, d6-DMSO) 8 = 10.39 (s, 1H, -NHC6H4CH3), 8.76 (d , 1H, -NHAc, 3./H-h
= 7.90 Hz), 7.58 (d , 2H, ortho aniline aromatic protons, Vh-h = 8.30 Hz), 7.56 (s, 1H,
phenylglycine aromatic proton ortho to chloro and SC), 7.47 (d, 1H, phenylglycine aromatic
proton ortho SC para to chloro), 7.41 (t, 1H, phenylglycine aromatic proton meta to chloro
and SC, Jh-h = 7.85 Hz), 7.38 (dt, 1H, phenylglycine aromatic proton ortho to chloro para to
SC, V h-h = 7.95 Hz, V h-h = 1.55 Hz), 7.31 (t, 2H, meta aniline aromatic protons, V h-h = 8.20
Hz), 7.06 (t, 1H, para aniline aromatic protons, V h -h = 7.40 Hz), 5.68 (d, 1H , -C H ^ H s)- ,
V h-h = 7.95 Hz), 1.95 (s, 3H, -C (0 )C H 3).
13C NMR (125 MHz d6-DMSO) 5 = 169.23, (1C, CH3C (0)-), 168.22 (1C, -C(0)NHC6H5),
140.71 (1C, phenylglycine aromatic carbon meta to chloro, ipso to SC), 138.56 (1C, ipso
anilide aromatic carbon), 133.08 (1C, phenylglycine aromatic carbon ipso to chloro), 130.35
(1C, phenylglycine aromatic carbon meta to chloro and SC), 128.78 (2C, meta anilide
aromatic carbon), 127.72 (1C, phenylglycine aromatic carbon ortho to chloro, para to SC),
127.02 (1C, phenylglycine aromatic carbon ortho to chloro and SC), 125.99 (1C,
phenylglycine aromatic carbon para to chloro, ortho to SC), 123.68 (1C, para anilide aromatic
carbon), 119.25 (2C, ortho anilide aromatic carbon), 56.47 (1C, -CH(C6H4C1), 22.31 (1C, -
C (0)C H 3).
IR (ss) v/cm'1: 3294, 3261, 1740, 1639, 1539
Found m/z (EI+) = 302.0814, 302.0822
M.p. = 205-206 °C
197

2-Acetamido-2-(4-trifluoromethyI phenyl) acetanilide (81)
Synthesised from compound 4g. Yield: 28 %
*H NMR (400 MHz, d6-DMSO) 5 = 10.49 (s, 1H, -NH(C6H5)), 8.87 (d, 1H, -NHAc, V h-h =
7.88 Hz), 7.77 (d, 2H, phenylglycine aromatic protons ortho to trifluoromethyl, V h-h = 8.36
Hz), 7.71 (d, 2H, phenylglycine aromatic protons meta to trifluoromethyl, V h-h = 8.28 Hz),
7.58 (d, 2H, ortho anilide aromatic protons, V H.H = 7.72 Hz), 7.31 (t, 2H, meta anilide
aromatic protons, V h-h = 7.68 Hz), 7.06 (t, 1H, para anilide aromatic proton, V h-h = 7.40 Hz),
5.77 (d, 1H, -CH(C6H4CF3)-, V h .h = 7.84 Hz), 1.95 (s, 3H, -C (0)C H 3).
,3C NMR (125 MHz d6-DMSO) 5 = 169.30, (1C, CH3C (0)-), 168.03 (1C, -C(0)NHC6H5),
142.98 (1C, phenylglycine aromatic carbon para to trifluoromethyl), 138.52 (1C, ipso anilide
aromatic carbon), 128.80 (2C, meta anilide aromatic carbon), 128.35 (q, 1C, phenylglycine
aromatic carbon ipso to trifluoromethyl, V C-f = 31.09 Hz), 128.01 (2C, phenylglycine
aromatic carbon meta to trifluoromethyl), 125.41 (q, 2C, phenylglycine aromatic carbon ortho
to trifluoromethyl, V C.F = 3.56 Hz), 124.15 (q, 1C, -CF3, VC.F = 270.20 Hz), 123.72 (1C,
para anilide aromatic carbon), 119.22 (2C, ortho anilide aromatic carbon), 56.61 (1C, -
CH(C6H4CF3), 22.29 (1C, -C (0 )C H 3).
IR (ss) v/cm'1: 2971, 1739, 1645, 1536
Found m/z (EC) = 336.1086 calculated 336.1086
M.p. = 244-245 °C
4.6.3 P ro to n -D e u te r iu m E x ch an g e R ea c tio n s
4.6.3.1 1H NMR Experiments a t3 7 °C
The H/D exchange reactions o f 6e at 37 °C, described in Section 4.4.1.1, were monitored by
NMR spectroscopy. These experiments were carried out according to the method
described in the experimental to Chapter 3, with the exception that no hydrolysis occurs for
6e. Therefore, there is no drop in pH and hence no need to maintain the pH** with addition of
NaOD solution.
4.6.3.2 LCMS Experiments a t 60, 70, 80 and 90 °C
Buffers for H/D exchange experiments were made according to the following method. The
appropriate quantity o f N aH 2P 0 4 for the desired buffer concentration was dissolved in D20 .
The ionic strength was made to 1 M using NaCl. As pK& varies with temperature, the required
198

pH* of the solution at room temperature, was calculated so that the desired pH* at
temperatures o f 60, 70, 80 and 90 °C was obtained. This temperature-corrected pH* was
obtained through adding portions o f NaOD/T^O solution whilst monitoring with a pH probe
at 25 °C. The pH* was also measured at the temperature at which the buffer was to be used in
order to confirm it was at the desired value at this temperature.
H/D exchange kinetic experiments were carried out in duplicate, using a liquid
chromatograph with mass spectrometer detection. Before analysis, calibration curves were
produced for the mass spectrometer response o f each compound for analysis. Starting with
initial concentrations o f 9-10 pM, these were subsequently diluted four times, each time by a
dilution factor o f four to produce five solutions with a range o f concentrations down to < 0.1
pM. These solutions were then analysed using the mass spectrometer, with detection at the
appropriate mass to find the M +l molecular ion. A linear response was obtained for each
compound 6b, d, e, 7a-d and 8a-l. To initiate each experiment, the autosampler injected a 10
pi portion from a stock solution o f compound dissolved in acetonitrile into 1 ml of the
appropriate buffer solution. The buffer solution was preheated to the appropriate temperature
in a thermostatted vial tray, from where injections were made at the desired (pre
programmed) times. After each injection, the mass spectrogram was automatically analysed.
The integral was converted to the concentration o f compound protonated at the stereogenic
centre using the calibration curve. To ensure that H/D exchange was the only process
resulting in loss o f the original m olecular ion, in each case a control sample o f the substrate in
H2O 0.3 M phosphate buffer solution was also analysed. As the mass spectrometer response
for the M +l ion o f this sample did not reduce over time for any o f the compounds analysed, it
is safe to assume that the only process resulting in a reduction in the response of the M +l ion
is H/D exchange. For compound 6e, a sample was left in deuterated buffers at 90 °C for 2
days to ensure all compound was deuterated at the stereogenic centre. This sample was then
diluted four-fold, four times and used to produce a calibration curve with detection of the
M+2 molecular ion. Formation o f this species was followed at 60 °C, simultaneous with
monitoring the decrease in the response for the M +l molecular ion. These curves are plotted
together in Figure 4.17.
Experiments were carried out using an XTerra column (MS C l8 2.5 mm, 2.1x30 mm: part no.
186000592). Flow rate was 0.7 ml per minute. The eluents and the gradient used in the LC
method are as follows:
Channel A = 5 % CH3CN, 10 mM NH4OAc, 0.1 % Acetic acid (pH = 4.5), Channel B = 95 %
CH3CN, 0.05 % Acetic acid.
199

Table 4.15: Gradient used for Chapter 4 LCMS experiments.
Time (mins) % A % B
0.0 100 0
6.0 0 100
10.0 0 100
10.1 100 0
14.0 100 0
The data obtained from the kinetic experiments was plotted using OriginPro 8. Observed first-
order rate constants were obtained through fitting the data to eqn (3.6). Figure 4.9 was plotted
using Wolfram Mathematica 8.0.
200

4.7 Appendix
4.7.1 Figures from XH NMR Kinetic Experiments
The graphs from which the rate constants o f H/D exchange for compound 6e in Table 4.2
were determined are displayed in Figure 4.11. All experiments were carried out at 37 °C, I = 1
M. pH** 7.4.
a)
1.0x10s 8 .0x10s
t / s
oc
0 75
05C
0 2 5
coc
6.0x10s2 .0 x 1 0 s0.0
c)
Figure 4.11: H/D exchange data for compound 6e at 37 °C, pH** 1.4,1= 1
M. Phosphate buffer concentration a) 0.1 M, b) 0.2 M, c) 0.3 M.
201

4.7.2 Data Tables from LCMS Kinetic Experiments
The LCMS experimental data from which Figure 4.2 and Figure 4.4 were constructed is listed
in the tables displayed in the following pages.
T a b le 4.16: Rate constant data for compound 6b in D20 buffers o f pH* 7.4 at 90 °C, / = 1 M.
p h o s p h a te [H P O 42 ] . Adeut x 105 / s*deut X 105 / S'1
cone. / M cone. / M (d u p lic a te )
0T00 0.061 2.31 ± 0 .29 2.23 ±0.21
0.200 0.122 2.95 ± 0 .24 3.45 ± 0.35
0.300 0.182 3.62 ± 0 .39 3.63 ±0 .26
kgh = (1.15 ± 0.23) x 10-4 s '1 M, ko' = (1.60 ± 0.27) x 10'5 s '1
T a b le 4.17: Rate constant data for compound 6 d in D 20 buffers o f pH* 7.4 at 90 °C , / = 1 M.
p h o s p h a te [H P O ? ] 1 " W x 105 / s '1Adeut X 105 / S’1
conc. / M conc. / M (d u p lic a te )
0T50 0.091 7.20 ± 1.00 6.82 ±0.81
0.200 0.122 10.06 ± 0 .83 9.09 ±0 .98
0.300 0.182 12.06 ± 0 .40 13.91 ±0.83
kgb = (5.63 ± 0.73) x 10"4 s’1 M, k0* = (2.24 ± 1.15) x 10'5 s’1
T a b le 4.18: Rate constant data for compound 6e in D20 buffers o f pH* 7.4 at 90 °C, / = 1 M.
phosphate
conc. / M
[h p o 42 i
conc. / M*deut X 104 / S’ 1
Adeut X 104 / s'1
(duplicate)
0.100 0.061 3.36 ±0.15 2.96 ±0.35
0.150 0.091 4.58 ± 0 .18 4.49 ± 0.29
0.200 0.122 5.40 ±0.33 5.87 ±0 .19
0.300 0.182 6.41 ± 0 .22 6.83 ± 0.20
kgb = (2.73 ± 0.16) x 10’3 s '1 M, Ao’ = (1.91 ± 0.19) x lO ^ s '1
202

Table 4.19: Rate constant data for compound 6e in D20 buffers of pH* 7.4 at 80 °C, I = 1 M.
phosphate
conc. / M
[h p o 42 i
conc. / MAdeut X 104 / S'1
deut X 104 / S'1
(duplicate)
0.100 0.061 1.60 ±0 .07 1.90 ± 0 .09
0.150 0.091 1.75 ±0 .06 1.91 ± 0 .15
0.200 0.122 2.10 ±0 .09 1.97 ± 0 .09
0.300 0.182 2.75 ±0 .07 2.89 ± 0.09
kgh = (1.04 ± 0.07) x 10'3 s■' M, k0'’ = (8.61 ± 0 .88) x 10*5 s -1
Table 4.20: Rate constant data for compound 6e in D20 buffers o f pH* 7.4 at 70 °C ,I= 1 M.
phosphate
conc. / M
[HPO42]
conc. / M£deut X 105 / S'1
fcdeut X 105 / S'1
(duplicate)
0.100 0.061 5.63 ± 0 .98 6.06 ± 1.12
0.200 0.122 10.10 ± 1.89 8.16 ±0 .73
0.300 0.182 11.53 ± 0 .6 4 13.29 ± 0 .39
£gb = (6.05 ± 0.64) x IQ-4 s■' M, k0’ = (1 .72± 1.04) x 10’5 s'-1
Table 4.21: Rate constant data for compound 6e in D20 buffers o f pH* 7.4 at 60 °C, 1= 1 M.
phosphate
conc. / M
[HPO42]
conc. / M&deut X 105 / S_1
*deut X 105 / S'1
(duplicate)
0.100 0.061 1.64 ±0 .33 -
0.150 0.091 3.02 ± 0.46 3.00 ± 0.45
0.200 0.122 3.76 ± 0 .50 3.46 ±0 .53
0.300 0.182 4.41 ± 0 .56 4.21 ± 0 .54
*gb = (2.19 ± 0.39) x 10'5 s_1 M, k0’ = (3.20 ± 5 .11) x 10’6 s'-1
The data displayed in Table 4.11 and Table 4.13 show the average rate constants o f H/D
exchange calculated from two kinetic experiments. Results from individual experiments are
displayed in Table 4.22 and Table 4.23.
203

T a b le 4.22: Individual experiment data for H/D exchange experiments of 7 a -d in D20 buffers
pH* 7.4 with phosphate concentration 0.3 M at 90 °C , / = 1 M.
C o m p o u n d *deut X 105 / S'1*deut X 105 / S'1
(d u p lic a te )
A v e ra g e
£deut X 105 / S'*
7a 6.92 ± 0.48 6.09 ±0.41 6.50 ± 0.45
7b 5.38 ±0.31 4.74 ±0.18 5.06 ±0.25
7c 8.16 ±0.62 7.95 ±0.55 8.05 ±0.58
7d 10.47 ±0.27 9.31 ±0 .66 9.89 ± 0.47
T a b le 4.23: Individual experiment data for H/D exchange experiments of 8 a -l in D20 buffers
pH* 7.4 with phosphate concentration 0.3 M at 90 °C, 1= 1 M.
C o m p o u n d fcdeut X 105/ S 1*deut X 105/ S'1
(d u p lic a te )
A v e ra g e
A:deut X 105/ S'1
8a 5.42 ±0.26 5.48 ±0 .28 5.45 ± 0.25
8b 3.24 ±0.37 3.40 ±0.33 3.32 ±0.35
8c 4.62 ± 0.94 3.86 ±0 .55 4.24 ± 0.69
8d 6.61 ±0.37 6.21 ±0 .50 6.41 ±0.43
8e 8.96 ±0.27 8.77 ± 0.24 8.86 ±0.25
8 f 2.29 ±0.36 2.14 ±0.55 2.22 ± 0.46
8g 2.64 ± 0.42 2.58 ±0.45 2.61 ±0.44
8h 4.30 ±0.35 4.77 ±0 .16 4.54 ±0.25
8i 11.92 ±0 .54 11.72 ±0 .55 11.82 ±0.55
8j 14.42 ±0 .19 14.44 ±0 .64 14.43 ±0 .42
8k 21.33 ±0.20 20.98 ± 0.62 21.15 ± 0.41
81 51.62 ±2.37 68.32 ±8 .12 59.97 ± 5.24
4.7.3 F ig u res fro m LCMS K inetic E x p e rim en ts
The graphs from which the data in the tables in Section 4.7.2 was obtained are displayed in
the following figures. All experiments were carried out at pH* 7 .4 ,1= 1 M.
204

4.7.3.1 Compound 6b, 90 °C
- a)
*0x10* 8 0x10*
t / s
b)
* 0x10* 8 0x10* 1.2x10s
t / s
c)
10x10* 8 0x10*
t / s
d)
4 0x10* 8.0x10* 1 2x10s
t / S
e)i
3 4 -j
*0x10* 8 0x10*
t ! S
f)
1.0x10* 8 0x10* 12x10s
t / s
F ig u re 4.12: H/D exchange data for compound 6b at 90 °C with phosphate
buffer concentration a) 0.1 M, b) 0.1 M (duplicate), c) 0.2 M, d) 0.2 M
(duplicate), e) 0.3 M, 1) 0.3 M (duplicate).
205

4.7.3.2 Compound 6d, 90 °C
2x10⁴
t / S
2x10⁴
t / s
c)
xKJ4 2x10* 3x1C4 4*10* 5X1Q4
t / S
d)
2x10⁴ 3x1O4 4x10⁴ 5x10⁴
t / S
e)
2xiQ4 3x10⁴
t : S
4x1C 5x10
f)
1x10⁴ 2x10* 3x104 4x10⁴ 5x10⁴
t / s
Figure 4.13: H/D exchange data for compound 6d at 90 °C with phosphate
buffer concentration a) 0.15 M, b) 0.15 M (duplicate), c) 0.2 M, d) 0.2 M
(duplicate), e) 0.3 M, f) 0.3 M (duplicate).
206

4.7.3.3 Compound 6e, 90 °C
a)
2 50x10s 5 00x10s 7 50x10s 1 00x10*
t / S
b)
0 00 2.50x10s 5.00x10s
t / s
7.50x10 1.00x10*
c)
2 50x10s 5 00x10s 7 50x10s
t ' S
d)
0 00 2 50x10s 5.00x10s 7 50x10s 1.00x10*
t / S
e)
5 00x10'
t / s
7 50x10 1 00x10
f)
0 00 2 50x10s 5 00x10s 7 50x10s 1.00x10*
t / S
g) h)
2S0x10: 5 00x10s 7 50x10s
X> S
2 50x10s 5.00x10s
Figure 4.14: H/D exchange data for compound 6e at 90 °C with phosphate
buffer concentration a) 0.1 M, b) 0.1 M (duplicate), c) 0.15 M, d) 0.15 M
(duplicate), e) 0.2 M, f) 0.2 M (duplicate), g) 0.3 M, h) 0.3 M (duplicate).
207

4.7.3.4 Compound 6e, 80 °C
a)
2x10⁴
t / s
3x1 0 4 x 1 0
b)
1x10* 2x1 O'*
t / s
3x10* 4x10*
2 1
c)
2x10
t / S
3x10 4x10
d)
1x10* 2x10“
t / s
3X10⁴ 4x10"
e)
2x10
t / S
3x1Q4 4x1Q4
f)
1x10⁴ 2x10⁴
t / S
3 x 1 0 4x10
g)
104 2x i0 4
t / s
Figure 4.15: H/D exchange data for compound 6e at 80 °C with phosphate
buffer concentration a) 0.1 M, b) 0.15 M, c) 0.15 M (duplicate), d) 0.2 M, e)
0.2 M (duplicate), f) 0.3 M, g) 0.3 M (duplicate).
208

4.7.3.5 Compound 6e, 70 °C
a)
2 0x10* 4 0x10*
t / s
c)
2 OxiC* 4 0x10*
t / S
b)
2 0x10* 4 0x10* 6.0x10*
t / s
d)
2 0x10* 4 0x10* 6.0x10*
t / s
2 i
e) f)
■ •
2 0x10* 4 0x10* 6 0x10*
t t S
• ■
2 0x10* 4 0x10* 6 0x10*
1 1 s
Figure 4.16: H/D exchange data for compound 6e at 70 °C with phosphate
buffer concentration a) 0.1 M, b) 0.1 M (duplicate), c) 0.2 M, d) 0.2 M
(duplicate), e) 0.3 M, f) 0.3 M (duplicate).
209

4.7.3.6 Compound 6e, 60 °C
2.0x10* 8 0x10* 2.0x10* 6.0x10*
20x10* 6 0x10* 80x10* 80x10*
6.0x10*20x10* 60x10* 2.0x10* 8.0x10*
10-
S
0 0 20x10* 4.0x10* 60x10* 8.0x10*
I f s
Figure 4.17: H/D exchange data for compound 6e at 60 °C with phosphate
buffer concentration a) 0.1 M, b) 0.15 M, c) 0.15 M (dup), d) 0.2 M, e) 0.2
M (dup), f) 0.3 M, g) 0.3 M (dup). (■) H species data, (•) D species data.

4.7.3.7 N-Benzoyl Phenylglycine Amides 7a-d, 90 °C
a) b)
4 0x10* 6 0x10* 8 0x10*
t / S
2.0x10* 4.0x11
t / S
c)
0-10 0 2 0*10' 4 0x10" 6 0x10' 8 0x10'
t ' s
d)
4 0x10*
t / s
6 0x10* 8 0x10*
e)
0 0 2 0x10* 4 0x10* 6 0x10*
t / S
f)
0 0 2.0x10* 4 0x10* 6 0x10*
t / S
g)
2 0x10* 4 0x10
t / S
h)
0 0 2 0x10* 4 0x10* 6 0x10*
t / s
Figure 4.18: H/D exchange data for at 90 °C, 0.3 M phosphate buffer
concentration for a) 7a, b) 7a (duplicate), c) 7b, d) 7b (duplicate), e) 7c, f)
7c (duplicate), g) 7d, h) 7d (duplicate).
211

4.7.3.8 N-Acetyl Phenylglycine Anilides 8a-lt 90 °C
a)
0 0 2 0x10* 4 0x10* 6 0x10* 8 0x10* 10x10*
t / s
b)
0 0 2 0x10* 4.0x10* 6 0x10* 8 0x10* 1.0x10s
1 1 s
c)
0 0 2 0x10* 4 0x10* 6 0x10* 8.0x10* 1 0x10s
t i s
d)
0 0 2.0x10* 4 0x10* 6 0x10* 8 0x10* 1.0x10s
1 1 s
C 5 -|
e)
3 0x10 6 0x10
t S
f)
3.0x10* 6 0x10* 9.0x10*
t / s
g) h)
2 0x10* 4 0x10*
t / s
0 0 2.0x10* 4 0x10* 6.0x10* 8 0x10*
t / s
Figure 4.19: H/D exchange data for at 90 °C, 0.3 M phosphate buffer
concentration for a) 8a, b) 8a (duplicate), c) 8b, d) 8b (duplicate), e) 8c, f)
8c (duplicate), g) 8d, h) 8d (duplicate).
212

Figure 4.20: H/D exchange data for at 90 °C, 0.3 M phosphate buffer
concentration for a) 8e, b) 8e (duplicate), c) 8f, d) 8f (duplicate), e) 8g, f) 8g
(duplicate), g) 8h, h) 8h (duplicate).

Figure 4.21: H/D exchange data for at 90 °C, 0.3 M phosphate buffer
concentration for a) 8i, b) 8i (duplicate), c) 8j, d) 8j (duplicate), e) 8k, f) 8k
(duplicate), g) 81, h) 81 (duplicate).

4.7.3.9 Eyring Plot for Use as a Predictive Tool
As discussed in Section 4.4.1.4, an Eyring plot was constructed o f using the data in Table 4.6
of rate constants of general-base catalysed H/D exchange, omitting the data point obtained
using ]H NMR spectroscopy at 37 °C. This was for the purpose o f analysing the use o f high-
temperature work as a predictive tool for lower temperatures. The Eyring plot constructed is
shown in Figure 4.22.
- 1 2 -
-1 4 -
2.9x1032.8x103
1 /T
Figure 4.22: Eyring plot of general-base catalysed H/D exchange of 6e
(without data point at 37 °C), in D20 phosphate buffers at pH* 7.4 , 1 = 1 M.
y-axis intercept = In Q'cq/H) + AS+/R = 14.86 ± 3.03. Gradient = —AH*/R = -
9701.09 ± 1075.72.
The line o f best fit shown in Figure 4.22 was extrapolated to 37 °C, and the expected value for
kgb was calculated as 2.39 x 10'5 s '1 M*1.
215

4.8 References
1. Testa, B.; Carrupt, P. A.; Gal, J., Chirality 1993, 5 (3), 105-111.2. Reist, M.; Testa, B.; Carrupt, P. A., Enantiomer 1997, 2 (3-4), 147-155.3. Reist, M.; Testa, B.; Carrupt, P.-A., Drug Racemization and Its Significance in
Pharmaceutical Research. In Handbook o f Experimental Pharmacology, Springer: 2003; Vol. 153, pp 91-112.
4. Clayden, J. P.; Greeves, N.; Warren, S.; Wothers, P. D., Organic Chemistry. Oxford University Press: 2001; p 164-166.
5. Bennet, A. J.; Somayaji, V.; Brown, R. S.; Santarsiero, B. D., Journal o f the American Chemical Society 1991, 113 (20), 7563-7571.
6. Mujika, J. I.; Mercero, J. M.; Lopez, X., Journal o f the American Chemical Society 2005, 727(12), 4445-4453.
7. Kemnitz, C. R.; Loewen, M. J., Journal o f the American Chemical Society 2007, 129(9), 2521-2528.
8. Wang, W. H.; Cheng, C. C., Bulletin o f the Chemical Society o f Japan 1994, 67 (4),1054-1057.
9. Wick, W. E., Applied Microbiology 196 7 ,15 (4), 765-769.10. Abou-Khalil, B., Neuropsychiatric Disease and Treatment 2008, 4 (3), 507-23.11. Adams, J.; Kauffman, M., Cancer Investigation 2004, 22 (2), 304-311.12. Vallet, S.; Palumbo, A.; Raje, N.; Boccadoro, M.; Anderson, K. C., Leukemia &
Lymphoma 2008, 49 (7), 1238-1245.13. Richard, J. P.; Williams, G.; O'Donoghue, A. C.; Amyes, T. L., Journal o f the
American Chemical Society 200 2 ,124 (12), 2957-2968.14. Fujita, T.; Hansch, C.; Iwasa, J., Journal o f the American Chemical Society 1964, 86
(23), 5175-5180.15. Leo, A.; Jow, P. Y. C.; Silipo, C.; Hansch, C., Journal o f Medicinal Chemistry 1975,
18 (9), 865-868.16. Chen, C. Y.; Chang, Y. S.; Lin, S. A.; Wen, H. I.; Cheng, Y. C.; Tsai, S. W., Journal
o f Organic Chemistry 2002, 67 (10), 3323-3326.17. Smith, G. G.; Sivakua, T., Journal o f Organic Chemistry 1983, 48 (5), 627-634.18. Smith, G. G.; Williams, K. M.; Wonnacott, D. M., Journal o f Organic Chemistry
1978, 43 ( 1), 1-5.19. Reist, M.; Carrupt, P. A.; Testa, B.; Lehmann, S.; Hansen, J. J., Helvetica Chimica
Acta 1996, 79 (3), 767-778.20. Narduolo, S., Unpublished results.21. Jaffe, H. H., Chemical Reviews 1953, 53 (2), 191-261.22. Suezawa, H.; Yuzuri, T.; Hirota, M.; Ito, Y.; Hamada, Y., Bulletin o f the Chemical
Society o f Japan 1990, 63 (2), 328-334.23. Yuzuri, T.; Suezawa, H.; Hirota, M., Bulletin o f the Chemical Society o f Japan 1994,
67(6), 1664-1673.24. Lee, C. K.; Yu, J. S.; Ji, Y. R., Journal o f Heterocyclic Chemistry 2002, 39 (6), 1219-
1227.25. Bergon, M.; Calmon, J. P., Tetrahedron Letters 1981, 22 (10), 937-940.26. Noorduin, W. L.; Izumi, T.; Millemaggi, A.; Leeman, M.; Meekes, H.; Van
Enckevort, W. J. P.; Kellogg, R. M.; Kaptein, B.; Vlieg, E.; Blackmond, D. G., Journal o f the American Chemical Society 2 0 0 8 ,130 (4), 1158-59.
27. Hyun, M. H.; Lee, G. S.; Han, S. C.; Cho, Y. J.; Baik, I. K., Chirality 2002, 14 (6), 503-508.
28. Williams, D. H.; Fleming, I., Spectroscopic Methods in Organic Chemistry. 5th ed.; McGraw-Hill: London, 1995; p 63-169.
216

5 Computational Studies as a Predictive Tool for Configurational Instability
5.1 Introduction
In this Chapter, the potential o f computational chemistry methods to predict configurational
instability in molecules (under the pharmacological conditions such as those used in Chapters
3 and 4) is investigated. The ability to obtain approximate rate constants o f racemisation for
molecules under investigation as a potential drug, without having to undertake the physical
experimental procedures described in Chapters 3 and 4 or without synthesising a compound,
would be of substantial benefit to the pharmaceutical industry. The results from
computational modelling of a molecule could either eliminate or necessitate the need for
further experimental analysis. If a computational model can be found that correlates with the
rate constants of H/D exchange determined in Chapters 3 and 4, then application of that
model to other compounds of interest could give theoretical rate constants for H/D exchange
(and therefore for racemisation).
The rate constants of H/D exchange determined thus far have been for molecules o f the type
R ” R ’RC-H, and the reaction was found to take place through an SeI mechanism (Chapter 3).
As shown in Scheme 1.7, the SeI mechanism takes place through loss o f the labile proton
bound to the stereogenic centre to leave a planar carbanion which can then be deuterated on
either face (resulting in the loss o f any enantiopurity). The stability o f this carbanion is
strongly dependent on the nature of neighbouring groups, specifically their ability to stabilise
the negative charge either through delocalisation or electrostatic interactions. The results in
Chapters 3 and 4 show that the stability of this carbanion is fundamental to the rate constant
of H/D exchange, illustrated by the positive slope displayed in Hammett plots. Therefore, it
was the stability o f the carbanion, relative to the protonated state, that was investigated
through computational methods. This relative stability is indicated by AGe in the reaction
profile for the SeI mechanism (Figure 5.1).
217

HR .R "
R' R'
Reaction Coordinate
Figure 5.1: Reaction profile for H/D exchange through the SeI mechanism,
where AGe+ is the standard molar free energy o f activation and AG° is the
standard molar free energy of reaction.
Nakata et al. used computational methods to investigate the stability o f benzylic anions in the
gas-phase.1 The energies and geometries o f ring substituted anions and the corresponding
neutral species were calculated using the B3LYP/6-311 + G(2d,p) level o f theory. The
substituent effects o f on the relative stability o f the anions was then determined through
hypothetical proton transfer reactions (Scheme 5.1).
£ „ ( - ) £ x (H ) £ h (H) £ x (-)
Scheme 5.1: Proton transfer reactions analysed by Nakata et al.
218

AEx was calculated for the reaction depicted in Scheme 5.1, via equation (5.1).
AEx = [Eh (H) + E x (-)] - [Eh (-) + E x (H)] (5.1)
with £s(Y) the calculated energy of the species with substituent S on aromatic ring, and Y
describing the protonation state at the benzylic position. AEx denotes the calculated stability
o f the substituted benzylic anion with respect to the unsubstituted benzylic anion.
Electron-withdrawing aromatic substituents were found to stabilise a negative charge relative
to the unsubstituted benzylic anion. The authors analysed their results in terms o f an extended
Yukawa-Tsuno equation, and found that resonance and saturation effects2, 3 were present
alongside the fundamental inductive effect.
A method of investigation similar to that of Nakata et al. was employed in this chapter. For all
compounds under investigation, the standard molar Gibbs energy of the compound was
calculated both for the protonated and deprotonated (at the stereogenic centre) form. The
difference in these values for individual compounds does not m ean anything in itself, as the
loss of a proton from one species to the other makes direct comparison impossible. However,
when compared with the values obtained in the same manner for other compounds, it can be
assumed that all errors involved in the calculations cancel out (as in the example from Nakata
et al. illustrated in Scheme 5.1). Hence, if carbanion stability is an important factor in
determining H/D exchange rates and the calculations are performed at a sufficient level of
accuracy, a correlation between the calculated energy difference o f the two protonation states
with the rate constants of H/D exchange calculated in Chapters 3 and 4 should be obtainable.
If such a correlation is be found, the relationship could be used to predict rate constants of
H/D exchange and racemisation from calculated energies o f molecules o f interest. In essence,
the proposed link between anion stability and the rate constant for racemisation is a linear free
energy relationship.
The rate of deprotonation at the stereogenic centre is dependent on AGe + (see Figure 5.1).
However, the Hammond Postulate4, 5 suggests that if the energy difference between
protonation states is lowered by changes to the molecular scaffold, i.e. through greater
stabilisation of negative charge, the energy o f the activated complex should also be reduced.
This is illustrated in Figure 5.2.
219

A ' + BH
' + BH
r 5A G °
5 A G 0
AH + B'
A'H + B'
Reaction Coordinate
Figure 5.2: Reaction profile for proton abstraction by base. Reactants AH
and A ’H (in their protonated states) set at same molar free energy. The base,
B , is the same in both reactions.
The structural modification o f A to A ’ results in stabilisation o f the negative charge in the
anionic product. According to the Hammond postulate, this structural modification will also
stabilise the transition state (relative to the unmodified structure) in the same manner
(although not necessarily to the same extent), by delocalisation o f the negative charge built up
on the transition state during proton abstraction. The relationship between SAG0* and AG0 is
typically quantified using the Bronsted relationship (Section 1.8.1).
Calculating the energy difference between the compound in its protonated and deprotonated
(at the stereogenic centre) states gives a value related to AG0, the real difference in energy
between the two protonation states. This calculated value will include errors resultant from
changes in the number of atoms in the calculation as well as limitations in the level o f theory
used (including solvation), and shall be referred to as ‘AG0*’. We assume that the remaining*
theory-specific errors in calculated energies are consistent between structures being
investigated and cancel out, as illustrated in Figure 5.3.
+ Many errors present in the calculations will have previously been cancelled when subtracting the calculated
energies o f the two protonation states.
220

Increasing Anion Stability
Figure 5.3: AG0 * as anion stability increases with modification o f molecular
structure. (■) Portion of AG0* due to errors in calculation, ( ) portion of
AG0* resulting from molecular structure. Contributions not to scale.
Figure 5.3 illustrates that, although the size o f the errors will be unknown, these errors are
anticipated to cancel out upon subtraction of AG0* for one compound from that calculated for
another. This procedure should thus afford 5AG0 with acceptable residual errors (see Figure
5.2). It should then be possible to correlate this value with the rate constants o f H/D exchange
determined in Chapters 3 and 4.

5.2 Results
Calculations were undertaken on all species from Chapters 3 and 4 for which rate constants o f
H/D exchange as a function o f basic buffer concentration (£gb) had been determined at pH**
7.4 at 37 °C. These were compounds 3a-h, 3k-l and 6e (Scheme 5.2).
O
OOMe
O
3a-hX = a ) H, b ) /?-OH, c ) p-Me, d ) p-¥,
e) p-C\, f) m-F, g) m-F, h) /?-CF3
O O
OMe
O
3k
OMe
O
31
Scheme 5.2: Structures for which computational analysis was performed.
Calculations were performed on each structure, for both species/ i.e. protonated and
deprotonated at the stereogenic centre. All calculations in this chapter were performed using
density functional theory (DFT, c f Section 1.10.4) at the RB3LYP/6-31 + G(d,p) level of
theory, with the geometry optimised prior to frequency calculations being performed. Each
calculation was performed both in the gas-phase and with an aqueous solvent modelled using
the polarisable continuum method (PCM, c f Section 1.10.4). Calculations were performed on
each species of each compound, with a range (minimum of 4) o f starting geometries prior to
optimisation. These starting geometries were proposed largely based on ‘chemical intuition’
i.e. conformations that appear to be good candidates for the most stable structure. Using
several different starting geometries gives optimised structures o f a range o f configurations.
* In this Chapter, the term ‘structure’ shall be used to define a general molecular scaffold, such as 3a . The term
‘species’ shall be used to distinguish between the different protonation states o f the stereogenic centre, for each
structure.
222

The optimised geometry with the lowest energy in each case was used for correlation
analysis.
5.2.1 R esu lts from C alcu la tions E m ploy ing PCM
For each structure on which calculations were performed, the calculated energy differences
between the two protonation states, AG0*, and the calculated energy differences between the
two protonation states relative to compound 3a, 5AG°, are displayed in Table 5.1.
Table 5.1: AG0* and 5AG0 of 3a-h, 3k-l and 6e, from calculated energies o f each structure in
both protonation states, using the PCM.a
Compound AG0* / kJ mol'1 5AG0 b / kJ mol'1
3a 1270.253 0.000
3b 1277.833 7.580
3c 1273.848 3.594
3d 1269.718 -0.536
3e 1264.504 -5.750
3f 1259.975 -10.279
H 1257.667 -12.587
3h 1250.814 -19.440
3k 1245.821 -24.433
31 1263.650 -6.603
6e 1268.447 -1.806
a Number of decimal places carried through from Gaussian output.
b Relative to compound 3a.
The calculated 8AG0 in Table 5.1 were then used for correlation analysis with the
experimental rate constant data, and with Hammett substituent constants.
5.2.1.1 Correlation with Experimentally Determined kgb
The rate constants for general-base catalysed H/D exchange (A:gb , from Tables 3.2, 3.7 and 4.3)
were plotted against 8AG0 (from Table 5.1) for methyl esters 3a-h, 3k-l and primary amide 6e
(Figure 5.4).
223
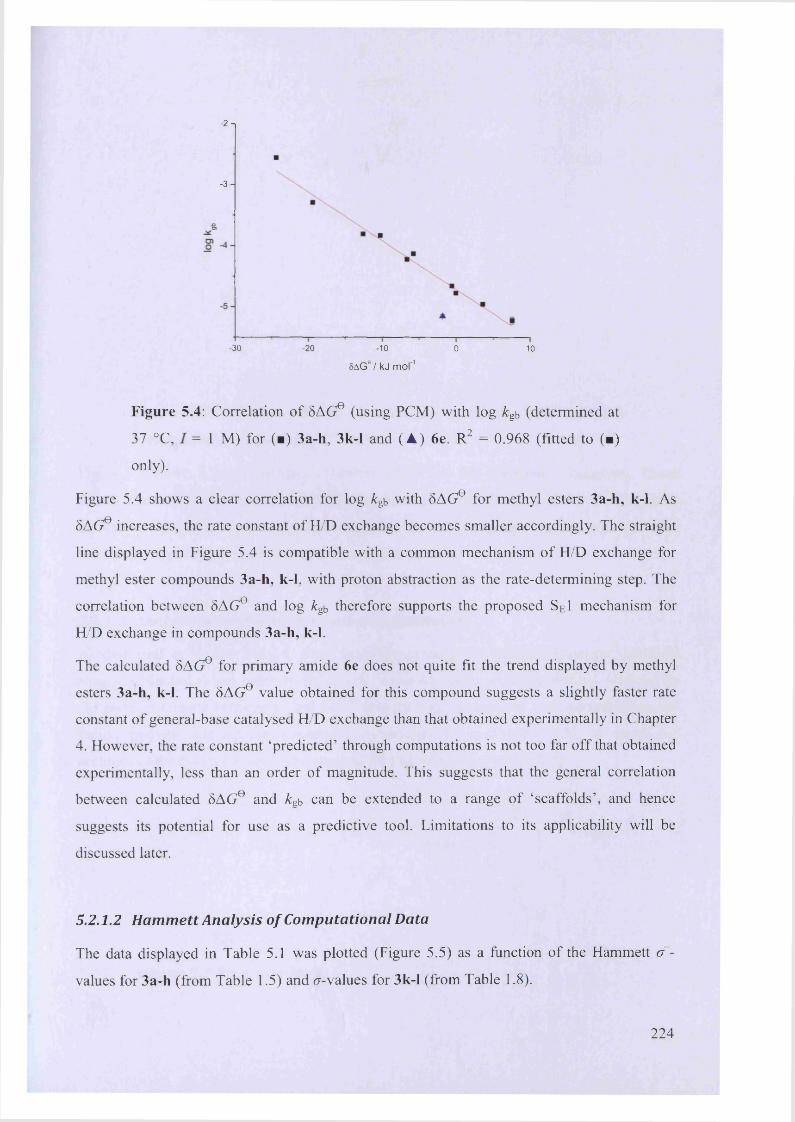
-2 - |
-3 -
-30 -20 -10 0 10
SAG8 / kJ m ol'1
Figure 5.4: Correlation of SAG0 (using PCM) with log kgb (determined at
37 °C, I = 1 M) for (■) 3a-h, 3k-l and (A ) 6e. R2 = 0.968 (fitted to (■)
only).
Figure 5.4 shows a clear correlation for log /rgb with SAG0 for methyl esters 3a-h, k-1. As
SAG0 increases, the rate constant of H/D exchange becomes smaller accordingly. The straight
line displayed in Figure 5.4 is compatible with a common mechanism of H/D exchange for
methyl ester compounds 3a-h, k-1, with proton abstraction as the rate-determining step. The
correlation between SAG0 and log kgb therefore supports the proposed SeI mechanism for
H/D exchange in compounds 3a-h, k-1.
The calculated SAG0 for primary amide 6e does not quite fit the trend displayed by methyl
esters 3a-h, k-1. The SAG0 value obtained for this compound suggests a slightly faster rate
constant of general-base catalysed H/D exchange than that obtained experimentally in Chapter
4. However, the rate constant ‘predicted’ through computations is not too far off that obtained
experimentally, less than an order of magnitude. This suggests that the general correlation
between calculated SAG0 and A:gb can be extended to a range of ‘scaffolds’, and hence
suggests its potential for use as a predictive tool. Limitations to its applicability will be
discussed later.
5 .2 .1 .2 H a m m e tt A n a ly s is o f C o m p u ta t io n a l D a ta
The data displayed in Table 5.1 was plotted (Figure 5.5) as a function of the Hammett (re
values for 3a-h (from Table 1.5) and cr-values for 3k-l (from Table 1.8).
224

20 -i
0 -
o<
- 2 0 -
-0.5— I—
0.0 0.5 1.0
Figure 5.5: Hammett analysis o f calculated 5AG° for 3a-h and 3k-l
correlated with o~-constants. R2 = 0.979.
Figure 5.5 shows a good correlation between 5AG° and the Hammett o '-constants. These
results also support the heterocyclic Hammett constants o f 0.72 and 0.12 for the thiophene
derivatives 3k and 31 respectively. This suggested that the computational data could be used
to analyse proposed Hammett substituent constants for other heterocycles.
5.2.1.3 A n a lys is o f H eterocyclic S u b s titu e n t C onstants
As discussed in Section 1.8.2.4, there have been a range o f different Hammett constants
suggested for individual heterocyclic groups, many o f which are contradictory. Inspired by
the good correlation between o~ and 5AG° (Figure 5.5), calculations were performed on the
furan-, pyrrole- and pyridine-containing compounds 3m-o (Scheme 5.3), to assess the
accuracy o f the Hammett constants proposed for these structures (Table 1.8).
O
O M eO M e
OO
NH
3o3n
O M e
O
3m
Scheme 5.3: Structures 3m-o.
225
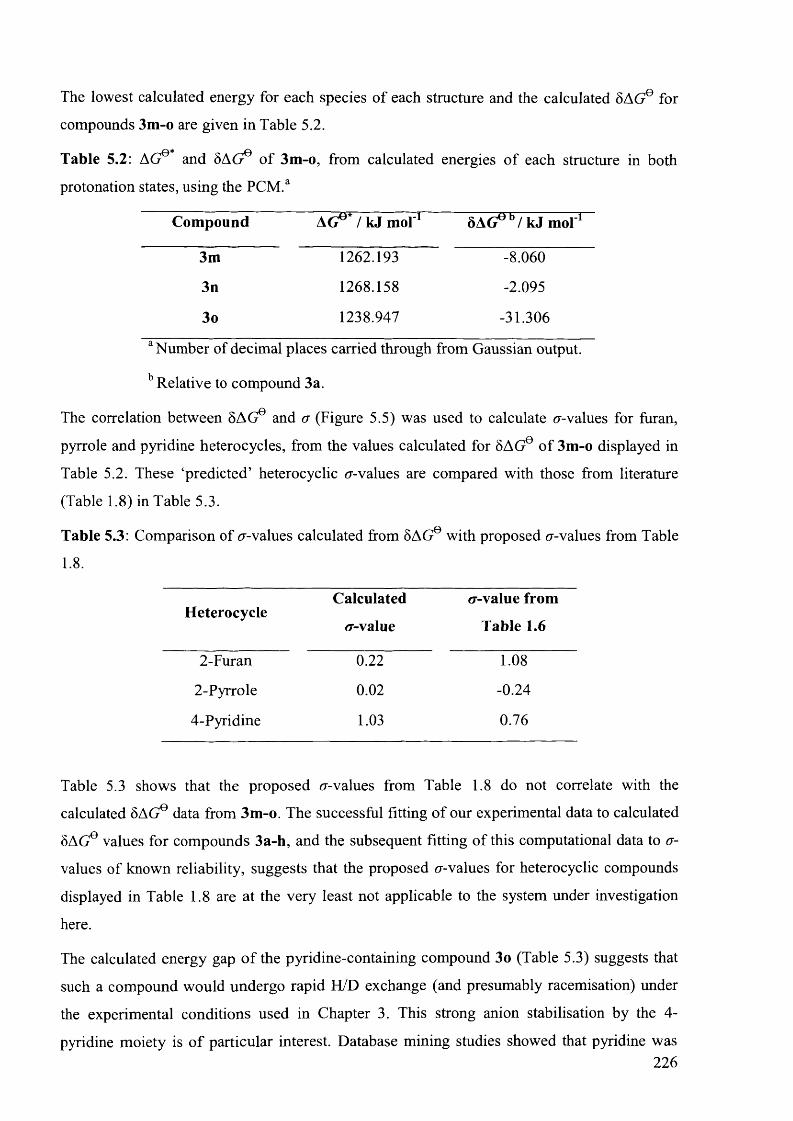
The lowest calculated energy for each species o f each structure and the calculated SAG0 for
compounds 3m-o are given in Table 5.2.
Table 5.2: AG0* and SAG0 of 3m-o, from calculated energies o f each structure in both
protonation states, using the PCM.a
Compound AG0 * / kJ m o l1 6AG0 b / kJ mol'1
3m 1262.193 -8.060
3n 1268.158 -2.095
3o 1238.947 -31.306
a Number of decimal places carried through from Gaussian output.
Relative to compound 3a.
The correlation between SAG0 and a (Figure 5.5) was used to calculate a-values for furan,
pyrrole and pyridine heterocycles, from the values calculated for SAG0 o f 3m-o displayed in
Table 5.2. These ‘predicted’ heterocyclic er-values are compared with those from literature
(Table 1.8) in Table 5.3.
Table 5.3: Comparison of er-values calculated from SAG0 with proposed er-values from Table
1. 8 .
HeterocycleCalculated
er-value
er-value from
Table 1.6
2-Furan 0.22 1.08
2-Pyrrole 0.02 -0.24
4-Pyridine 1.03 0.76
Table 5.3 shows that the proposed er-values from Table 1.8 do not correlate with the
calculated SAG0 data from 3m-o. The successful fitting o f our experimental data to calculated
SAG0 values for compounds 3a-h, and the subsequent fitting of this computational data to er-
values o f known reliability, suggests that the proposed er-values for heterocyclic compounds
displayed in Table 1.8 are at the very least not applicable to the system under investigation
here.
The calculated energy gap o f the pyridine-containing compound 3o (Table 5.3) suggests that
such a compound would undergo rapid H/D exchange (and presumably racemisation) under
the experimental conditions used in Chapter 3. This strong anion stabilisation by the 4-
pyridine moiety is o f particular interest. Database mining studies showed that pyridine was226

the second most frequently occurring aromatic group (after benzene) adjacent to a stereogenic
centre in the AstraZeneca ISAC database (Section 2.3.2). Literature studies also show that
pyridine is the most commonly found heterocycle in drug molecules.6,7 The results in Table
5.3 suggest that a drug molecule with a 4-pyridine substituent adjacent to a stereogenic centre
of type R ” R ’RC-H, could be at particular risk o f configurational instability under
physiological conditions, even if other substituents are not stabilising towards an anion.
5.2.2 C o m pu ta tiona l A nalysis W ith o u t PCM
Computational analysis in the gas-phase is less expensive than analysis using a solvent model
such as PCM. Although PCM is a relatively cheap solvent model, it still requires the use of
far greater computing resources than gas-phase calculations. As a result, gas-phase
calculations would be preferable to calculations performed using the PCM if they could be
shown to produce results of comparable predictive power. We therefore carried out gas-phase
calculations on 3a-h, 3k-l and 6e (Table 5.4).
Table 5.4: AG0' and SAG0 for 3a-h, 3k-l and 6e, from calculated energies o f each structure
in both protonation states calculated in the gas-phase.a
Compound A ( j * / kJ m o l1 SAG0 a / kJ mol"1
3a 1449.163 0.000
3b 1456.394 7.231
3c 1458.116 8.953
3d 1440.226 -8.937
3e 1436.366 -12.797
3f 1429.802 -19.360
3g 1425.688 -23.475
3h 1406.583 -42.580
3k 1414.002 -35.161
31 1431.078 -18.084
6e 1433.420 -15.742
a Number o f decimal places carried through from Gaussian output.
b Relative to compound 3a.
227

The rate constants for general-base catalysed H/D exchange (kgb, from Tables 3.2, 3.7 and 4.3)
were plotted against 5AG0 (from Table 5.4) for compounds 3a-h, 3k-l and 6e (Figure 5.6).
- 2 -1
-3 -
O)o
-5 -
-20 0 20
8AGe /k J mol"1
Figure 5.6: Correlation of 5AG° from gas-phase with log A:gb (determined at
37 °C, / = 1 M) for (■) 3a-h, 3k-l and (A ) 6e. R2 = 0.755 (fitted to (■)
only).
Figure 5.6 shows only a very loose correlation between the experimentally-determined rate
constants for H/D exchange of 3a-h, 3k-l and 6e with the values o f SAG calculated in the
gas-phase. A greater rate constant for H/D exchange broadly correlates with a smaller value of
SAG0, although the relationship is far less consistent than that shown in Figure 5.4 when the
PCM was employed. This is reflected in the R2 values determined for the data in the two
graphs; R2 = 0.968 and 0.755 for the PCM and gas-phase calculations, respectively. These
results suggest that employment of the PCM is necessary if computational chemistry is to be
used to predict rate-constants of H/D exchange or racemisation for stereogenic centres of type
R” R ’RC-H.
228

5.2.3 Geometry of Computational Structures
The lowest energy geometries of both neutral and anionic states of 3a when PCM is applied
are displayed in Figure 5.7.
b)
— o
Figure 5.7: Lowest energy geometries found when applying the PCM for
3a, a) protonated at stereogenic centre, b) deprotonated at stereogenic
centre.
The geometries of the lowest energy structures found are quite consistent for the set of
compounds 3a-h. For each compound 3a-h, the neutral species has the configuration as seen
in Figure 5.7a for 3a, with the phenyl ring perpendicular to the main chain of the molecule.
Generally, the lowest energy configurations found for the anionic species of 3a-h are as
depicted for 3a in Figure 5.7b, with the planar carbanion in the same plane as the phenyl ring
and the amide group perpendicular to this. The only difference from the geometry depicted in
Figure 5.7b found for the anions of the set 3a-h, is the orientation of the ester group. For
compounds 3a-b, f-g the orientation is as shown in Figure 5.7b, with the methoxy group of
the ester pointing away from the phenyl ring. For compounds 3c-e, h the orientation is
reversed, with the carbonyl group o f the ester pointing away from the phenyl ring. This
alternative configuration is illustrated in Figure 5.8, for the anionic species of 3c.
229

t
Figure 5.8: Lowest energy geometry found when applying the PCM for
anionic species of 3c.
For the anions of compounds 3c-e, h the energy of the structure with geometry as depicted in
Figure 5.7b was found to be slightly higher (0.228 kJ m ol'1 for 3c, number of decimal places
carried through from Gaussian output) than that for the orientation with the carbonyl pointing
away from the phenyl group (Figure 5.8). For the anionic species of each compound 3c-e, h,
the lowest energy structure found when not using the PCM solvent model was with the
methoxy group of the ester away from the phenyl ring. This suggests that the interactions of
the phenyl ring substituents in 3c-e, h with the continuum solvent model, somehow causes the
geometry of the anionic species to differ from that displayed by 3a-b, f-g. For each compound
3a-h, the anionic structure was also investigated with the carbonyl orientated in the opposite
direction to ensure the lowest energy structure was taken in each case.
To further understand the anion-stabilising effect of the different substituents, the HOMO of
3a deprotonated at the stereogenic centre was visualised (Figure 5.9).
230

Figure 5.9: Lowest energy geometry found for 3a deprotonated at the
stereogenic centre, with HOMO displayed.
The HOMO of the deprotonated species of 3a displayed in Figure 5.9 formally corresponds to
the negative charge formed by removal of the proton bound to the stereogenic centre. Figure
5.9 shows that the orbital is delocalised over the entire molecule, suggesting all substituents
on the stereogenic centre play a role in anion stabilisation. This observation is consistent with
the presumed additivity of substituent effects.
The geometry of the lowest energy structure found for both species o f amide 6e is similar to
those found for 3a (Figure 5.7). The protonated species has the main chain of the molecule
perpendicular to the aromatic group. The anionic species is planar at the location of the
carbanion, with the primary amide group in the plane of the aromatic group. The secondary
amide is perpendicular to the plane of the rest of the molecule (Figure 5.10).
Figure 5.10: Lowest energy geometry found when applying the PCM for
anionic species of 6e.231

The geometry of the lowest energy structures for the neutral species of compounds 3k, 1 was
the same as that found for 3a-h (Figure 5.7a). However, the deprotonated species of
compounds 3k, 1 displayed a slightly different configuration compared to that found for 3a-h.
This is depicted for 3k in Figure 5.11 (31 has the same geometrical arrangement).
Figure 5.11: Lowest energy geometry found for deprotonated species of 3k.
As Figure 5.11 shows, the lowest energy geometrical structure o f the deprotonated species of
3k (and 31) has the amide group twisted round in front o f the molecule. This orientation is
displayed by the lowest energy conformation of the anionic species of both 3 k-1 whether the
calculation is performed in the gas-phase or with the PCM employed.
The heterocyclic compounds 3m-o were found to display similar geometries to compounds
3a-h. The neutral species in each case has the aromatic ring perpendicular to the main chain
of the molecule. The anionic species has a planar geometry at the site of deprotonation, with
the heterocycle and methyl ester group in the same plane. The amide group is perpendicular to
this plane, as in Figure 5.7b for compound 3a. For compound 3m, the anionic species has the
carbonyl group of the ester pointing away from the aromatic group. For 3n-o, the methyl ester
group is pointing away from the aromatic group.
5 .2 .3 .1 C o n fo r m a tio n a l S e a r c h in g
Ensuring that the lowest energy structure is discovered in each case is of importance in
undertaking work such as described in this Chapter. For every species of each structure
analysed here, at least 4 different starting geometries were investigated. Such a process is
required to ensure the molecular geometry of lowest energy is discovered in each case. Failure
y
c
232

to discover the lowest energy configuration could result in large errors in SAG0, and several
examples of this initially occurred whilst undertaking the work in this Chapter. One such case
was when trying to calculate SAG0 for 3k. After analysing 4 different optimised molecular
geometries for the anionic species of 3k, the conformation found to have the lowest energy
was that depicted in Figure 5.12.
Figure 5.12: Initial lowest energy geometry found for the deprotonated
species of 3k.
Using this particular geometry, the plot of SAG0 against log kgb for methyl ester compounds
3a-h, k-1 is depicted in Figure 5.13.
- 2 - i
3k
-3 -
jQ0>
-5 -
100-10-20
5AGa/k J m ol
Figure 5.13: Correlation of SAG0 with log kgb (determined at 37 °C, 7 - 1
M) for 3a-h, k-1, using original value of SAG0 obtained for 3k.
233

As Figure 5.13 shows, using the value o f 5AG0 calculated for 3k from the geometry displayed
in Figure 5.12 gives an erroneous result. Because of the incompatibility of this value of 5AGe
with the experimental data from Chapter 3, and the different geometry displayed by the
structure shown in Figure 5.12 from the geometry o f the other anionic species of 3a-h, 1, it
seemed likely that further conformational searching would find a structure lower in energy
than that displayed in Figure 5.12. Such analysis yielded the geometry displayed in Figure
5.11, which gave a value o f 5AG° much more compatible with the experimental data (Figure
5.4). However, if computational analysis were to be used as a tool to investigate
configurational stability o f compounds not yet synthesised or for which no experimental
racemisation data is available, it would not be as apparent that further investigation was
required. As a result, it is imperative that a thorough investigation of many different
molecular geometries be undertaken, before any conclusions are drawn from computational
data.
5.2.4 E xtension o f C om putational A nalysis
5.2.4.1 A n a lys is o f F u n c tio n a l G roup D ep endence
Calculations were also performed on several other compounds to further examine the
computational method o f analysis used in this Chapter for the prediction of configurational
instability. According to Testa et a l.8 (Table 1.1), methyl and ethyl groups are classified as
neutral in the assignment o f substituents as configurationally stabilising, destabilising or
neutral, for stereogenic centres o f type R ” R ’RC-H. To investigate this assignment,
calculations were perform ed on compounds 9-11 (Scheme 5.4).
9 10 11
Scheme 5.4: Compounds 9-11.
Each compound 9-11 is based on the same framework as 3a, but with one o f the substituents
replaced by a methyl group. The value o f 5AG0 for each compound 9-11 with respect to 3a
should therefore inform as to the ability o f a methyl group to stabilise a negative charge in
234
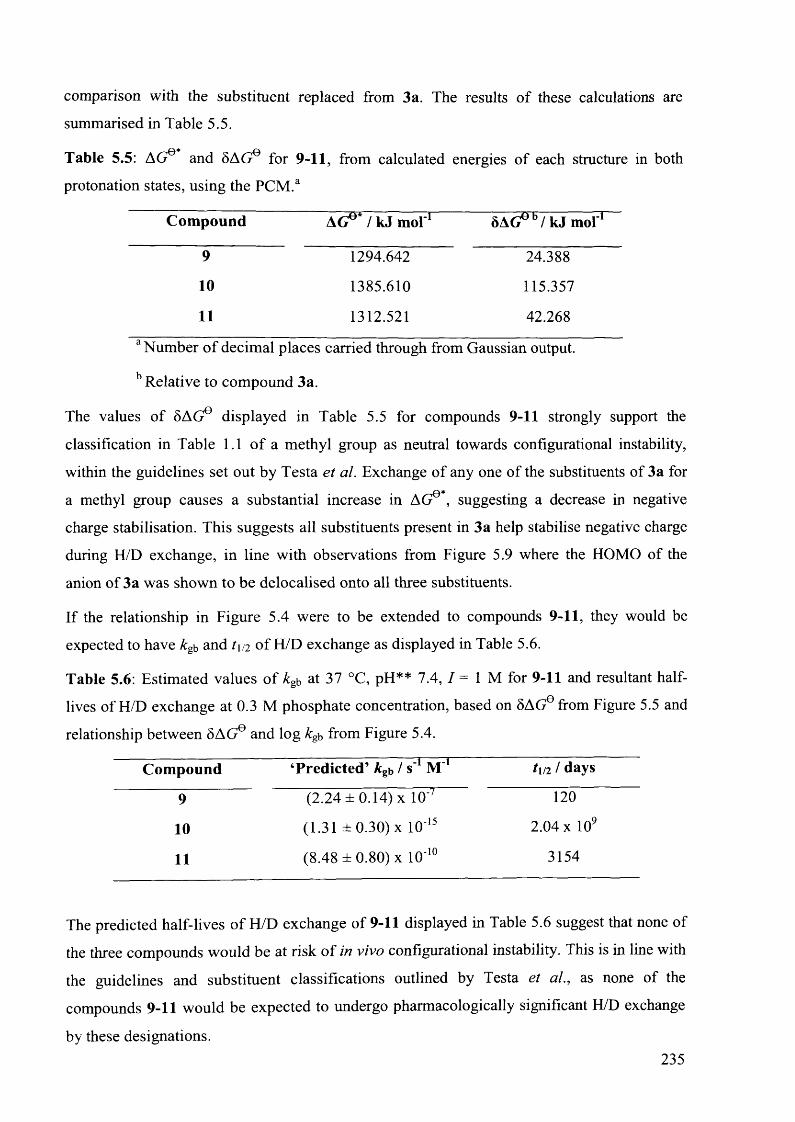
comparison with the substituent replaced from 3a. The results o f these calculations are
summarised in Table 5.5.
Table 5.5: AG®’ and SAG® for 9-11, from calculated energies of each structure in both
protonation states, using the PCM .a
Compound AG0* / kJ m o l1 S A G ^ /k J m o l^
9 1294.642 24.388
10 1385.610 115.357
11 1312.521 42.268
a Number o f decimal places carried through from Gaussian output.
b Relative to compound 3a.
The values o f SAG0 displayed in Table 5.5 for compounds 9-11 strongly support the
classification in Table 1.1 o f a methyl group as neutral towards configurational instability,
within the guidelines set out by Testa et al. Exchange o f any one of the substituents of 3a for
a methyl group causes a substantial increase in AG0*, suggesting a decrease in negative
charge stabilisation. This suggests all substituents present in 3a help stabilise negative charge
during H/D exchange, in line with observations from Figure 5.9 where the HOMO of the
anion of 3a was shown to be delocalised onto all three substituents.
If the relationship in Figure 5.4 were to be extended to compounds 9-11, they would be
expected to have kgb and t\/2 o f H/D exchange as displayed in Table 5.6.
Table 5.6: Estimated values o f kgb at 37 °C, pH** 7.4, / = 1 M for 9-11 and resultant half-
lives of H/D exchange at 0.3 M phosphate concentration, based on SAG0 from Figure 5.5 and
relationship between SAG0 and log kg\> from Figure 5.4.
Compound ‘Predicted’ k gb / s"1 M'1 tm / days
9 (2.24 ± 0.14) x 10'' 120
10 (1.31 ± 0.30) x 10'15 2.04 x 10⁹
11 (8.48 ± 0.80) x 10'10 3154
The predicted half-lives o f H/D exchange of 9-11 displayed in Table 5.6 suggest that none of
the three compounds would be at risk o f in vivo configurational instability. This is in line with
the guidelines and substituent classifications outlined by Testa et al., as none of the
compounds 9-11 would be expected to undergo pharmacologically significant H/D exchange
by these designations.235

The greatest value o f 5AG0 is displayed by compound 10, for which the methyl ester
substituent o f 3a was replaced by a methyl group. This implies that the methyl ester group of
3a provides the greatest degree o f negative charge stabilisation, in line with the classification
in Table 1.1 o f a methyl ester group as ‘strongly configurationally destabilising’ (compared to
the classification o f amido and aryl groups as ‘configurationally destabilising’). The
comparative values o f SAG0 for 9 and 11 suggest that a phenyl substituent provides more
stabilisation of an adjacent negative charge than an amide (bonded through nitrogen) moiety.
5.2.4.2 A n a lys is o f E x p e r im e n ta l D a ta f r o m L ite ra tu re
Attempts were also made to compare computational results with experimental data from the
literature. The relationship between SAG0 and rate constants o f general-base catalysed H/D
exchange displayed in Figure 5.4 is based on data obtained in aqueous conditions at pH 7.4,
37 °C using phosphate buffers. Only comparison with experimental data obtained under the
same (or very similar) conditions will be meaningful. As such data is sparse, the only direct
comparison that could be made is with the data collected by Reist et al? for the amphetamines
amfepramone and cathinone (Scheme 5.5). They determined rate constants o f H/D exchange
for both compounds at a range o f phosphate concentrations, under near identical conditions
and using the same method o f analysis (*H NM R spectroscopy) employed in Chapters 3 and
4. As discussed in Section 1.5.1, the amine functional group present in both amfepramone
and cathinone will be protonated at the pH under which the experiments were performed. As a
result, calculations were carried out on the structures depicted in Scheme 5.5, both protonated
and deprotonated at the stereogenic centre.
NH
Amfepramone
NH
Cathinone
Scheme 5.5: Amfepramone and cathinone, protonated at amine moiety.
The kgh values displayed in Table 5.7 were not explicitly stated, and thus were determined
from the reported kinetic data (see Experimental Section 5.4.2).
236

Table 5.7: Rate constants o f general-base catalysed H/D exchange of amfepramone and
cathinone from reference 9, determined at 37 °C, pD 7.4, / = 0.43 M.
C om pound * gb / S '1 M '1
Amfepramone (5.09 ± 0.27) x 10‘J
Cathinone (9.80 ± 0.87) x lO'4
The calculated values of SAG0 for amfepramone and cathinone are given in Table 5.8.
Table 5.8: AG0* and SAG0 of amfepramone and cathinone (both protonated at the amine),
from calculated energies o f each structure in both protonation states (at the stereogenic
centre), using the PCM.a
Com pound AG0* / kJ mol'1 SAG0 b / kJ m o l1
Amfepramone 1226.715 -43.539
Cathinone 1233.381 -36.873
a Number o f decimal places carried through from Gaussian output.
b Relative to compound 3a.
The data from Table 5.7 and Table 5.8 was plotted alongside those for compounds 3a-h, 3k-1
(Figure 5.14).
- 2 -
- 3 -
- 5 -
-50— I—-40
-I—-30
—»-----1-----20
5AG0/k J m ol
— i—
-10 10
Figure 5.14: Correlation o f SAG0 (using PCM) with log kgh for (■) 3a-h, k-
1, (A ) 6e, (▼) amfepramone, ( • ) cathinone.
237

Figure 5.14 shows that the data for amfepramone and cathinone does not correlate particularly
well with that obtained for methyl esters 3a-h, k-1. A partial explanation for the lack of
correlation o f the data for amfepramone and cathinone is the positive charge on the amine.
This will result in a different set o f errors in the computational analysis than those present in
the comparison between the methyl ester species.
Figure 5.14 reveals an important limitation of the method of analysis employed in this
chapter. Major changes in m olecular structure will change the set of errors to the point that
any correlation will break down. However, Figure 5.14 also suggests a gradient between the
data points found for amfepramone and cathinone which is similar to the gradient found for
3a-h, k-1. This suggests that the introduction of a positive charge on the amine in
amfepramone and cathinone adds (or removes) a consistent error to AG9*, compared to the
error found in AG9* for 3a-h, k-1. Further experimental work would be required to confirm
and quantify such a standard ‘offset’ for calculations performed on a compound containing a
protonated amine. Hypothetically, it may also prove possible to discover standard ‘offsets’ for
other major structural changes.
238

5.3 Conclusion
Comparison o f computationally determined values for SAG0 with experimentally determined
rate constants for general-base catalysed H/D exchange has produced the following
conclusions.
First, correlation analysis shows that for minor changes in molecular structure,
computationally determined values o f 5AGe could be used to predict kgb.
Second, major changes to the molecular structure will introduce additional errors that make
the relationship between computationally determined SAG0 and kgb break down at this level of
theory.
Third, employment o f the Polarisable Continuum Model leads to increased accuracy in
correlation analysis.
Fourth, determination o f SAG0 for compounds 9-11 broadly supports the assignments of
functional groups ability to stabilise an anion by Testa et al. (Table 1.1).
239

5.4 Experimental
5.4.1 C o m p u ta tio n a l D e ta ils
All computations were perform ed at the RB3LYP/6-31 + G(d,p) level of theory, using the
Gaussian03 suite o f program s.10 Geometry optimisation was performed prior to frequency
calculations. A range o f starting geometries (> 4) was tested in each case; the lowest energy
optimised geometry is reported for each compound. Energies are reported in Hartrees. All
compounds were analysed with the PCM model, using the Gaussian default parameters for
water. Compounds 3a-h, k-1 and 6e were also analysed in the gas-phase. Molecular orbitals
were calculated using G A M ESS.11 Visualisations were created using the MacMolPlot
program.12
5.4.1.1 C a lcu la tions P e r fo rm e d U sing P o la risa b le C ontinuum M odel
Energies are given in units o f Hartrees.
Geometry and energy o f 3a, protonated at stereogenic centre
1 6 0 1.211986 -0 .819877 1 .1919122 6 0 2.412138 -1 .513168 1.3718503 6 0 3.205154 -1.845368 0 .2670504 6 0 2.791216 -1.481604 -1.0183065 6 0 1.589447 -0.788219 -1.1979476 6 0 0.792229 -0 .455094 -0 .0958387 6 0 -0.517644 0 .311889 -0 .3049618 7 0 -1.660967 -0 .296588 0 .3574569 6 0 -0.362732 1.751328 0 .190271
10 8 0 0.348536 2 .483537 -0 . 67215611 8 0 -0.802761 2 .171910 1 .24629912 6 0 0.633172 3.851133 -0 .28842513 6 0 -2.487739 -1.164946 -0 .27750814 6 0 -3.609913 -1.752318 0.55358015 8 0 -2.339732 -1.472636 -1.47103516 1 0 0.601679 -0.569615 2.05958017 1 0 2 . 728147 -1.793157 2.37585718 1 0 4.139315 -2 .387166 0 .40830519 1 0 3.399681 -1.740677 -1 .88374720 1 0 1.266740 -0.509779 -2 .20096421 1 0 -0.730814 0 .345522 -1.37844022 1 0 -1 .813378 -0 .079170 1.34484823 1 0 1.227871 4 .258644 -1.10472924 1 0 1.196556 3.868393 0.64711125 1 0 -0.298669 4.408880 -0 .17308226 1 0 -4.553833 -1.617767 0.01810627 1 0 -3.689576 -1 . 304501 1. 54752128 1 0 -3 .439172 -2.828514 0 . 662507
Sum of electronic and thermal Free Energies— 707.342232
Geometry and energy o f 3a, deprotonated at stereogenic centre
l 6 0 1.885641 1.046461 -0.375006240

2 6 0 3 .276652 1.121728 -0.3029053 6 0 4.045737 -0.004363 0 . 0201804 6 0 3.374698 -1.209346 0.2685985 6 0 1.983279 -1.296113 0 .1986026 6 0 1.177838 -0.165752 -0.1291697 6 0 -0.271563 -0 .206409 -0 .2286808 7 0 -0 . 944227 1.015114 -0.5799119 6 0 -1.065308 -1.359983 -0.070862
10 8 0 -2.424605 -1.132850 -0 .30575011 8 0 -0 . 694690 -2 . 523093 0.23347812 6 0 -3 .285583 -2 .259809 -0 .13143613 6 0 -1 . 432421 1.914476 0.30252114 6 0 -2 .165730 3 . 105816 -0.29108515 8 0 -1 . 308186 1.809538 1.53761716 1 0 1 . 327468 1. 942432 -0.62843717 1 0 3.765047 2.076004 -0.50201818 1 0 5.131151 0 . 055420 0 . 07649219 1 0 3.944144 -2 .103831 0.52325320 1 0 1.493251 -2 .241251 0.39515421 1 0 -1.128524 1.196227 -1.56947422 1 0 -4.291903 -1.895756 -0 .34965523 1 0 -3.244508 -2.641300 0.89419524 1 0 -3 . 028848 -3.073365 -0 .81774125 1 0 -1 . 743875 4 . 027097 0 .12100926 1 0 -3 .217072 3 . 059150 0 .01223627 1 0 -2.116319 3.144374 -1.382931
. of electronic and thermal Free Energies= -706. 858418
Geometry and energy o f 3b, protonated at stereogenic centre
1 6 0 -1 . 177957 -0 .123066 -1.1326162 6 0 -2 . 550984 -0.318592 -1.2700473 6 0 -3.350410 -0 .474076 -0 .1282364 6 0 -2.765917 -0 .434805 1.1435155 6 0 -1 . 387661 -0.239490 1.2663626 6 0 -0.577346 -0 . 084193 0.1359507 8 0 -4.690878 -0 . 661670 -0 . 3201138 6 0 0.928579 0 .128890 0.2910509 7 0 1 . 732103 -0 .861985 -0.411985
10 6 0 1 .315988 1. 526505 -0 .19700011 8 0 0 . 976155 2 .461479 0 . 69702512 8 0 1 . 837632 1 .767512 -1.27224713 6 0 1 .219757 3.839666 0.32374014 6 0 2.283638 -1.931081 0.21391615 8 0 2 .163580 -2 .125970 1.43451016 6 0 3 .065339 -2 .890478 -0.66011317 1 0 -0 . 572778 -0.004413 -2.03160018 1 0 -3.013894 -0 . 350172 -2 .25494019 1 0 -3 . 386688 -0 . 559376 2 . 03115020 1 0 -0 . 941505 -0 . 211365 2.26020721 1 0 -5.159792 -0 . 759348 0.54269522 1 0 1 . 181445 0.061916 1.35398123 1 0 1.850506 -0 . 749611 -1. 42163824 1 0 0 . 873972 4 .430499 1.17079225 1 0 0 . 655709 4 . 089026 -0.57781226 1 0 2.286424 3 . 998505 0.15129727 1 0 2.592731 -3 . 876477 -0 . 60904128 1 0 4 . 078466 -2 . 986882 -0.25861929 1 0 3.120609 -2 . 574897 -1. 705104
Sum of electronic and thermal Free Energies= -782.576559
241

Geometry and energy o f 3b, deprotonated at stereogenic centre
1 6 0 -1.5172582 6 0 -2.9087773 6 0 -3 . 6710174 6 0 -3 .0124235 6 0 -1 . 6182736 6 0 -0.8099387 8 0 -5.0468858 6 0 0.6467729 7 0 1.315105
10 6 0 1.43719411 8 0 2 .80202712 8 0 1.06513113 6 0 3 . 66574814 6 0 1.82891415 8 0 1.74105016 6 0 2.54229517 1 0 -0.96276018 1 0 -3.40977719 1 0 -3.59250220 1 0 -1.13504521 1 0 -5.46519622 1 0 1.47009323 1 0 4.67351824 1 0 3.42450525 1 0 3.61382226 1 0 2.08830027 1 0 2.51110928 1 0 3.588181
Sum of electronic and thermal Free Energies=
Geometry and energy o f 3c, protonated at stereogenic centre
1 6 0 -1 .0932912 6 0 -2.4738243 6 0 -3.3229684 6 0 -2.7446405 6 0 -1.3662796 6 0 -0.5258957 6 0 0.9824918 7 0 1.7930539 6 0 1.368074
10 8 0 1.01056311 8 0 1.90371512 6 0 1 .25004713 6 0 2.21221814 6 0 3.02706215 8 0 1.94993516 6 0 -4.81441717 1 0 -0.46237718 1 0 -2.89493419 1 0 -3.37853820 1 0 -0.93988921 1 0 1.22400422 1 0 2 .01804523 1 0 0.89074324 1 0 0.69472825 1 0 2.31767626 1 0 3.98615527 1 0 3 .20825728 1 0 2.498370
1.047008 -0.3630651.129587 -0 .2935390.004596 0 . 0010291.217316 0.2238831.297758 0 .1533860.166934 -0 .1449570.130906 0 . 0592720.208216 -0 .2436051.017822 -0 . 5866271.356917 -0 .0835601.129995 -0 .3092592.523678 0 .2188262 .245519 -0.0917721.898035 0.2999881.767016 1.5364673.104064 -0.2885941.951178 -0.5956082 . 081212 -0 .468614■2 .112161 0 .455817■2 .250614 0.329139•0.736467 0.2619621.221653 -1.576944•1 .882635 -0 . 306311•3.080999 -0 .757289•2.598535 0.9439054 .016828 0 .1089743.135080 -1.3813383.088085 0.035085
-782 .089858
■0.312379 -1.108608■0 .491126 -1.239686•0.429538 -0 .124567■0.182233 1.131178■0.004792 1.267076■0 .069757 0.1482500 .144482 0.308309•0 . 859569 -0.3647591.527808 -0.2200512.489277 0.6368821.735122 -1.2952913.855999 0 .219828■1.987221 0.261879■2 . 956600 -0 .569486■2 .222933 1 . 452224•0 . 634185 -0.261489•0.370194 -1. 995391■0. 681078 -2 .2268300 .132532 2 .0168570.181032 2.2527670.113267 1.3763130.711226 -1.3507544.472640 1.0424674.070675 -0.6959204.015402 0.0544423.128421 -0.0717682.604648 -1.5882803.914137 -0.610676

293031
1
1
1
000
-5.372307 0.196488 0.185774-5.136452 -1.549756 0.249436-5.110025 -0.715008 -1.311441
Sum of electronic and thermal Free Energies= -746.636470
Geometry and energy o f 3c, deprotonated at stereogenic centre
1 6 0 1.468523 1 .181120 0.1223382 6 0 0 . 631509 0 .068670 -0 .1750703 6 0 1 . 321259 -1.164456 -0.3647844 6 0 2 .707959 -1.271449 -0.2691755 6 0 3.519694 -0.163210 0 . 0238086 6 0 2 .857429 1. 057839 0.2162717 6 0 -0.822192 0 . 114122 -0.2971238 7 0 -1.480707 -1.128986 -0 . 6030569 6 0 -2.002669 -1. 974892 0.310933
10 8 0 -1.943858 -1 .785713 1.54145011 6 0 5 . 024127 -0 .284429 0 .11983912 1 0 5.472771 -0.567714 -0 .84143613 1 0 5.477367 0.663642 0.42729314 1 0 5.325102 -1.048094 0 .84814415 6 0 -1.700177 1 .214301 -0.21006916 8 0 -1.095770 2.436686 0.07472717 8 0 -2.949526 1.187553 -0.36884118 6 0 -2.668715 -3.227102 -0.23536919 1 0 0.751222 -2 . 059541 -0.59215920 1 0 3.168392 -2 .248312 -0 . 42701521 1 0 3.441705 1 . 949690 0.44891522 1 0 1 . 021183 2 . 152352 0.28336723 1 0 -1 . 623726 -1.369625 -1.58704724 1 0 -3.692610 -3 .281296 0.14657525 1 0 -2.690886 -3 .265165 -1.32801426 1 0 -2 .130624 -4 . 104086 0.13910927 6 0 -1 . 960948 3 . 574066 0.13530128 1 0 -1 . 312159 4 . 422535 0.36317729 1 0 -2 .469013 3 .741013 -0.81971030 1 0 -2 .715340 3 .461818 0 . 920109
. of electronic and thermal Free Energies^ -746 .151287
Geometry and energy of 3c, deprotonated at stereogenic centre (with alternate geometry, see
Section 5.2.3)
1 6 0 -2 . 942080 -1 .253854 0 .2761052 6 0 -1 . 547078 -1 . 320506 0.2172443 6 0 -0 .758896 -0 .192349 -0 . 1426264 6 0 -1 .487876 0.993311 -0.4363005 6 0 -2 .879808 1.044335 -0 . 3735906 6 0 -3 . 647775 -0 . 077010 -0.0143877 6 0 0 . 694631 -0.210780 -0.2343678 6 0 1 .501981 -1.351616 -0.0753609 8 0 2 .862028 -1.105777 -0.299776
10 6 0 3 . 728946 -2 . 223864 -0 .11820711 6 0 -5 . 153449 -0 .010265 0 .06131912 7 0 1 . 356882 1. 021909 -0 .56805413 6 0 1 .761489 1. 955960 0 . 32310814 6 0 2 .407933 3.194698 -0.26863515 8 0 1.594868 1.854150 1.55241016 8 0 1 . 143763 -2.520904 0.21928217 1 0 -5.592522 0 . 325721 -0.88630618 1 0 -5 .579150 -0 . 991024 0.296352
243

19 1 0 -5.490072 0.691047 0.83566820 1 0 -0 . 948377 1.891492 -0.72133521 1 0 -3.380926 1.983872 -0 . 61245822 1 0 -3 .495678 -2.150979 0.55784423 1 0 -1 . 044260 -2.253989 0.44187524 1 0 1.592169 1.192278 -1.54819325 1 0 3 .102528 3.620809 0 .45729726 1 0 2 . 934140 2.989019 -1.20575227 1 0 1. 631022 3.940674 -0 .47388428 1 0 4.735880 -1.855500 -0.32661129 1 0 3.680365 -2.605675 0 . 90710930 1 0 3 .483324 -3.039225 -0 . 806376
i of electronic and thermal Free Energies= -746.:151200
)metry and energy o f 3 d , protonated at stereogenic centre
l 6 0 -1.134387 -0 . 227109 -1.1318162 6 0 -2 .508051 -0 .432955 -1.2794223 6 0 -3.288649 -0 .486753 -0 .1311444 6 0 -2.764692 -0.347967 1 .1464145 6 0 -1.386898 -0.143812 1 .2725126 6 0 -0 .563444 -0.083221 0 .1415697 9 0 -4 . 635455 -0.689704 -0 .2673258 6 0 0.941664 0.147291 0 .3031549 7 0 1 . 759430 -0.842252 -0.380370
10 6 0 1.317490 1.544279 -0 .19800011 8 0 0 . 905230 2 .487313 0 . 65473112 8 0 1.893811 1.773449 -1.24687613 6 0 1.137641 3.864308 0 .26843214 6 0 2 . 236331 -1. 948378 0 .24800615 6 0 3 . 049463 -2.893694 -0 . 61577516 8 0 2.024362 -2 .170606 1.44966417 1 0 -0 .510273 -0 .185615 -2 . 02431118 1 0 -2 . 964840 -0 . 547944 -2 .26078019 1 0 -3 .414762 -0.402770 2 .01780920 1 0 -0 . 952872 -0.035123 2 .26589621 1 0 1 . 183857 0.100683 1 .37038922 1 0 1 . 944973 -0.704663 -1.37695123 1 0 0 . 730011 4.461751 1.08266824 1 0 0 . 620310 4.082876 -0.66844625 1 0 2.208591 4.045498 0.15434226 1 0 3 .391181 -3.730208 -0 . 00573127 1 0 3 . 916688 -2 . 379603 -1.04446828 1 0 2 .444189 -3.274957 -1. 445635
Sum of electronic and thermal Free Energies= -806.591982
Geometry and energy o f 3 d , deprotonated at stereogenic centre
1 6 0 -1.333545 -1.195580 -0.3487892 6 0 -2.720070 -1. 330048 -0 .2549613 6 0 -3 .482310 -0.205749 0 . 0252444 6 0 -2 .898497 1.038532 0 .2136245 6 0 -1 .510597 1.163024 0 .1165476 6 0 -0 . 664663 0.051253 -0.1714377 6 0 0 .786216 0.116496 -0.2974568 7 0 1 .461739 -1.115758 -0 . 6067859 6 0 1.648752 1.229711 -0.208434
10 8 0 1.027825 2 .440896 0.08239411 8 0 2.896425 1.219383 -0.36951912 6 0 1.873729 3.594031 0.13172013 6 0 2.007398 -1.948333 0.306850
244

14 6 0 2.720351 -3 .173777 -0.23998215 8 0 1.940644 -1.762082 1.53710016 9 0 -4 .857608 -0.328498 0.12046117 1 0 -0 .752604 -2 . 084019 -0 . 57014018 1 0 -3.197661 -2 .298212 -0.39808619 1 0 -3.517865 1.906592 0.43514820 1 0 -1 . 070349 2.138597 0 .26542021 1 0 1.609040 -1.350576 -1.59181822 1 0 1.211563 4.431264 0.36213023 1 0 2 .370342 3.765435 -0 . 82836324 1 0 2.636104 3.497138 0.91066425 1 0 3.766629 -3.146991 0.08082226 1 0 2.685483 -3 .244222 -1.33076627 1 0 2.265874 -4.071153 0 .190957
i of electronic and thermal Free Energies^ -806.:108372
)metry and energy o f 3e, protonated at stereogenic centre
l 6 0 -0.788792 -0 .185997 -1.0849952 6 0 -2.175871 -0 .293958 -1.2092453 6 0 -2.962693 -0 . 222782 -0.0590964 6 0 -2.397202 -0 . 048700 1.2033255 6 0 -1.007373 0.055885 1.3088066 6 0 -0.193630 -0 .013201 0 .1721867 6 0 1.326802 0 .115324 0 .3119788 7 0 2.068834 -0 . 931582 -0 .3706859 6 0 1.785167 1.479248 -0.211666
10 8 0 1.411385 2 .460562 0 . 61395311 8 0 2.389972 1.654107 -1.25495212 6 0 1.729091 3 .814369 0.20570213 6 0 2.415005 -2 .091460 0.24715414 6 0 3.155373 -3 .098124 -0 . 61194215 8 0 2.138585 -2.314688 1.43532516 17 0 -4.718050 -0 .359769 -0 .20633017 1 0 -0.176683 -0 .242757 -1. 98498618 1 0 -2.634572 -0 . 429019 -2.18672419 1 0 -3.025215 0.000187 2.09059520 1 0 -0.555610 0.191588 2.29098121 1 0 1.578170 0.068648 1. 37774322 1 0 2.308092 -0.786351 -1.35443823 1 0 1.336140 4.450562 0.99746024 1 0 1.246989 4.040494 -0 .74788725 1 0 2.810906 3.933365 0 .11489426 1 0 3.503906 -3.917041 0 .01794527 1 0 4.009832 -2.636272 -1.11781528 1 0 2 .488273 -3 .499727 -1.383202
Sum of electronic and thermal Free Energies= -1166.947320
Geometry and energy o f 3e, deprotonated at stereogenic centre
1 6 0 -0 . 976617 -1.088292 -0 . 4553502 6 0 -2 .366324 -1.163127 -0 .3844363 6 0 -3.097676 -0.030690 -0 . 0266144 6 0 -2 .440542 1.166429 0 .2574575 6 0 -1 .049459 1.233050 0 .1819066 6 0 -0 .251062 0.108069 -0.1806817 6 0 1 .198074 0.110346 -0 .2760108 7 0 1. 832528 -1. 144770 -0.5763639 6 0 2 .102885 1 .191602 -0 .189073
10 8 0 1.526357 2 .433601 0.04860411 8 0 3 .351247 1.122531 -0.320989
245

12 6 0 2.424532 3 . 544716 0.13480113 6 0 2 .172830 -2 . 082920 0.33652614 6 0 2.842800 -3 . 330719 -0.21840615 8 0 1.926761 -1. 980206 1.55277216 17 0 -4.871037 -0 .114841 0.07138117 1 0 -0.434173 -1 . 984229 -0.73718118 1 0 -2.871785 -2 .101131 -0.60780019 1 0 -3.007233 2 . 051856 0.54098020 1 0 -0.569192 2 .174413 0.40972021 1 0 2.161517 -1.294140 -1.53359622 1 0 1.793443 4 .414252 0.32928923 1 0 2.975384 3.685491 -0 . 80015724 1 0 3 .141811 3.414454 0.95081725 1 0 3.408938 -3 .818745 0.57694026 1 0 3.510903 -3 .104186 -1.05544427 1 0 2.078759 -4 .030529 -0.576325
i of electronic and thermal Free Energies= -1166.■465696
imetry and energy o f 3f, protonated at stereogenic centre
l 6 0 0.916530 -0 .205895 1.4923732 6 0 2.231989 -0 .461193 1. 8889723 6 0 3.244153 -0 . 626140 0.9366144 6 0 2.891431 -0 . 525606 -0 .4017235 6 0 1.595532 -0.273007 -0.8330966 6 0 0.593349 -0 .111553 0.1309317 6 0 -0.844348 0.176592 -0.3154388 7 0 -1.821383 -0 . 738200 0 .2507829 6 0 -1.230402 1. 608903 0 .060318
10 8 0 -0.627975 2 .493324 -0.73834311 8 0 -1.970720 1 . 906248 0.98159612 6 0 -0.852425 3 .895163 -0.44754413 6 0 -2.141966 -1 . 910557 -0.35220114 6 0 -3.141691 -2.787116 0.37349815 8 0 -1 . 641256 -2.257269 -1.43324416 9 0 3.866622 -0.689697 -1.34956117 1 0 0.141644 -0 .085956 2.24830118 1 0 2 .475383 -0 . 533160 2 . 94782619 1 0 4 .275125 -0 . 828312 1.22109220 1 0 1.376965 -0 .208960 -1.89799121 1 0 -0.889870 0.091032 -1.40715422 1 0 -2.244912 -0 .492319 1.14826623 1 0 -0.281037 4 .437101 -1. 19969124 1 0 -0.492363 4.130830 0.55645225 1 0 -1.916382 4.128320 -0 . 52704826 1 0 -3.893516 -3 .132410 -0 .34094727 1 0 -3 . 635555 -2.278574 1.20561428 1 0 -2.618708 -3 . 668888 0.759552
Sum of electronic and thermal Free Energies= -806.593491
Geometry and energy o f 3f, deprotonated at stereogenic centre
1 6 0 -1.321684 -1.504931 -0.4203492 6 0 -2.671598 -1 . 843040 -0.3741073 6 0 -3.660996 -0.885430 -0 .1009644 6 0 -3 .202597 0.407487 0.1171205 6 0 -1.875895 0.795303 0.0825856 6 0 -0.864472 -0.171161 -0.1959407 6 0 0.544850 0 .148993 -0.2638358 7 0 1.454984 -0 . 920651 -0.5665339 6 0 1.087333 1.443405 -0.111356
246

10 8 0 2.467133 1 .489236 -0.30484911 8 0 0.478038 2 .509363 0.15516512 6 0 3.082897 2 .766616 -0 .11953813 6 0 2.062352 -1.704792 0.35251414 6 0 3.026123 -2 .747278 -0 .18797115 8 0 1.858620 -1.616863 1.57787016 9 0 -4.141709 1 . 386547 0.39118117 1 0 -0.596719 -2 .282121 -0.63647318 1 0 -2.966676 -2.876437 -0 . 55405819 1 0 -4 .719987 -1.126857 -0 . 05969520 1 0 -1.608218 1. 827720 0.26503421 1 0 1.719669 -1.065152 -1.54384922 1 0 4 .147129 2.607759 -0.30495823 1 0 2.935452 3 .136732 0.90018224 1 0 2.689796 3.507668 -0.82262625 1 0 4.021990 -2.553857 0.22326526 1 0 3 .086994 -2.759200 -1.27944827 1 0 2.712859 -3 .735542 0 .163282
Sum of electronic and thermal Free Energies=
Geometry and energy o f 3g, protonated at stereogenic centre
-806 .113592
1 6 0 -0.736439 0 . 404691 1.8831482 6 0 -2 . 109139 0.404030 2.1464513 6 0 -3 . 026994 0.107309 1.1350344 6 0 -2 . 538546 -0 .187538 -0.1382895 6 0 -1 .174735 -0.191896 -0.4235856 6 0 -0 .264743 0.106357 0.5999407 6 0 1 .240591 0.126574 0.3101478 7 0 1 . 709412 -1.033176 -0.4294079 6 0 1.600412 1.391595 -0 .474148
10 8 0 1.563497 2.470681 0 . 31066211 8 0 1.859328 1.414978 -1.66456012 6 0 1.814729 3.749444 -0 . 32409613 6 0 2.105599 -2 .171144 0.19552614 6 0 2.548254 -3.310570 -0.69862215 8 0 2.104880 -2.281436 1.43134816 17 0 -3.682303 -0 .566644 -1.43219417 1 0 -0.029158 0.631272 2.67996318 1 0 -2.471011 0.629947 3 .14842819 1 0 -4.096835 0 . 101238 1.33320220 1 0 -0.829763 -0 . 431144 -1. 42814521 1 0 1.771968 0.161415 1.26816122 1 0 1.719679 -0 . 980074 -1. 45000523 1 0 1. 734314 4 .484727 0.47515524 1 0 1.067043 3 . 935310 -1.09826825 1 0 2.815560 3 . 759951 -0.76081726 1 0 3.538503 -3.646512 -0 .37811427 1 0 2 . 582541 -3 .040005 -1. 75704128 1 0 1.854858 -4.147844 -0 .568021
t of electronic and thermal Free Energies= -1166.948348
)metry and energy o f 3g, deprotonated at stereogenic centre
l 6 0 0.813758 -2 . 027680 0.2870152 6 0 2 .147815 -2 . 402527 0 . 4242743 6 0 3.198987 -1.491730 0.2404754 6 0 2 . 834126 -0.186766 -0 . 0885805 6 0 1. 517366 0 .227726 -0.2334356 6 0 0 .442212 -0.691438 -0 . 0500187 6 0 -0.925662 -0 .248603 -0.214730
247

8 7 0 -1.144367 1.138430 -0 . 5219949 6 0 -2 .061903 -1 . 084822 -0.141683
10 8 0 -3.254600 -0 .411515 -0 .40054411 8 0 -2 .103506 -2 .314498 0.10883212 6 0 -4 .446671 -1.197378 -0.32269313 6 0 -1 . 327749 2 .112093 0.39903514 6 0 -1 . 611746 3 .502542 -0 .14294815 8 0 -1.266866 1.918122 1. 62757716 17 0 4.127706 1.018195 -0 . 33870617 1 0 0.031031 -2.759591 0 .43608518 1 0 2.383247 -3 .434649 0.68413819 1 0 4.239866 -1. 783756 0 . 34835220 1 0 1.310367 1.258699 -0 .49476621 1 0 -1.259782 1.402847 -1.50320322 1 0 -5.264915 -0.509652 -0.54589423 1 0 -4.437356 -2 . 013008 -1.05287124 1 0 -4.580762 -1 . 622054 0.67733125 1 0 -0.879003 4 .203444 0.26816026 1 0 -1.585078 3 . 554995 -1.23488627 1 0 -2.601462 3 .819022 0 .202317
Sum of electronic and thermal Free Energies= -1166.469328
Geometry and energy o f 3h, protonated at stereogenic centre
1 6 0 -0 . 403622 0 .298796 1.3286712 6 0 -1 .797188 0.253761 1.2417683 6 0 -2 .400766 -0.061895 0.0214744 6 0 -1.616506 -0.337515 -1.1071555 6 0 -0 .227099 -0.291679 -1.0105386 6 0 0 .388897 0 . 027355 0 .2085107 6 0 1. 916018 0 .100579 0.3190148 7 0 2 . 603922 -0.986673 -0 . 3550849 6 0 2 .413326 1. 431224 -0.254967
10 8 0 2 . 140446 2 .442717 0 . 57142811 8 0 2 . 962992 1.552810 -1.33540712 6 0 2 .497177 3.772752 0 .11768913 6 0 2 .861011 -2.165554 0 .26721814 6 0 3.577184 -3 .218197 -0 .55301715 8 0 2.527538 -2 . 376944 1.44343316 6 0 -3.895107 -0 .146056 -0 .10072017 9 0 -4.547178 0.304494 0.99865118 9 0 -4.369026 0 .573806 -1 .15734719 9 0 -4.324678 -1 . 427361 -0 .30539420 1 0 0.066647 0 .541283 2.28088621 1 0 -2.401055 0 . 459916 2 .12241522 1 0 -2.085609 -0 . 585104 -2 . 05871423 1 0 0.374991 -0.511358 -1.89120024 1 0 2.184793 0.071567 1.38165225 1 0 2.891223 -0.845255 -1. 32580026 1 0 2.182208 4 .440482 0.91833927 1 0 1.970141 4 . 004594 -0.81051128 1 0 3.576224 3 . 837136 -0.03830929 1 0 4.436752 -3 .582808 0 .01647530 1 0 3.917207 -2 . 849075 -1.52414131 1 0 2.899212 -4.063225 -0 .711995
Sum of electronic and thermal Free Energies= -1044.403854
Geometry and energy o f 3h, deprotonated at stereogenic centre
1 6 0 0.543874 1.008850 -0.4081342 6 0 1.927553 1.059466 -0.354317
248

3 6 0 2 . 6780364 6 0 1. 9912595 6 0 0 . 6038346 6 0 -0 .1874617 6 0 -1. 6242338 6 0 4 .1570319 9 0 4 . 604640
10 9 0 4.76324911 9 0 4 . 72919612 7 0 -2 .28254113 6 0 -2 .44198214 8 0 -3 .79188515 8 0 -2 .08452816 6 0 -4.67753717 6 0 -2 . 75278918 6 0 -3 . 52455219 8 0 -2 .58570620 1 0 0.00144321 1 0 2 .43311822 1 0 2.54531223 1 0 0 .10262324 1 0 -2 .50414025 1 0 -5.67749726 1 0 -4.62739827 1 0 -4 .44740328 1 0 -3.62869729 1 0 -4 . 52514730 1 0 -3 . 029434
. of electronic and thermal Free Energies^
Geometry and energy o f 3k, protonated at stereogenic centre
1 6 0 -0.4403412 6 0 -0.1194603 7 0 -1.5786954 6 0 0 .7869835 6 0 1 .3917106 6 0 2 . 5304837 6 0 2.7784228 16 0 1.6262569 8 0 0 .562580
10 8 0 -0 . 42371611 6 0 -2.64973712 6 0 -3.74036913 8 0 -2 .73839114 6 0 0.98994515 1 0 -0 . 73673816 1 0 -1.55295217 1 0 1 . 02961318 1 0 3 . 13474919 1 0 3 .56449920 1 0 -4.69546721 1 0 -3 . 81094322 1 0 -3.56546423 1 0 1.52626424 1 0 0.12105025 1 0 1.646571
Sum of electronic and thermal Free Energies—
0.091397 -0 . 0491981.290449 0 .2008261.345859 0 .1458190 .196120 -0.1634360.203806 -0.2427510.003646 0.0226360.842210 1.0139771.198067 0.2564360.492407 -1.1254521.027320 -0 .5830471.349218 -0.0675891.090080 -0.273488■2 .512979 0.228876•2.198463 -0.0912111. 925480 0.3140323 .095771 -0.2757021. 820097 1. 5423791. 916949 -0 . 6487292 . 004791 -0.550845■2 .195474 0.442031•2 .284605 0.3409271.197264 -1.567566■1 . 809375 -0.292598•2 . 583633 0.932190•3 .012338 -0 .7858743 . 877529 0 .4778602 .763201 -0.5765593.505543 -1.162134
-1043. 927444
0.281831 0.3323741.698660 -0.163944-0.246087 -0.405194-0 . 603259 0.279280•1 .232558 1.338514•2 .011432 0.958561■1.961614 -0.388184■0 . 960005 -1.2169392 . 387447 0.7547882 .130221 -1.261760•0 .809816 0.211120■1 . 339843 -0 . 696741■0.898391 1.4456593 . 722624 0.3865800 . 353386 1. 3847280.186209 -1.4269951.140741 2 .3606612.584669 1.6577372.452548 -0.9542640.904220 -0.3905102.424164 -0 .5624061.124373 -1. 7537204 .100082 1.2558304.346298 0.1663973.678066 -0 .484947
-1028.124167
Geometry and energy o f 3k, deprotonated at stereogenic centre
249

1 6 0 1.181587 0 .167321 -0 .1896142 6 0 1.903215 1.348184 -0.3604383 6 0 3.311055 1.202291 -0.1703354 6 0 3.692678 -0 . 074468 0.1475615 16 0 2 . 302929 -1.144287 0.2227696 6 0 -0.237139 -0.023735 -0.3251097 7 0 -0.994025 1.121790 -0.7308978 6 0 -0.871416 -1.262472 -0.1329789 8 0 -0.312271 -2 . 333021 0.216921
10 8 0 -2.243777 -1.242565 -0.35989411 6 0 -2.935154 -2 . 473768 -0 .12879812 6 0 -1.734654 1.924759 0 .06513813 8 0 -2.391904 2.877560 -0.40875214 6 0 -1.760304 1. 615311 1.54690015 1 0 1.424692 2.288566 -0.61641716 1 0 4.014147 2.027847 -0 .26687417 1 0 4.685721 -0.460821 0.35179918 1 0 -1.008590 1.382830 -1. 72489119 1 0 -3.981703 -2.270427 -0 .36400020 1 0 -2.844132 -2.791629 0 . 91482821 1 0 -2.556733 -3.271984 -0 .77494422 1 0 -2.144073 2 .485426 2 .08207823 1 0 -0.768867 1.345935 1. 91943324 1 0 -2.424734 0 .763993 1.730794
. of electronic and thermal Free Energies= -1027 .649659
Geometry and energy o f 3k, deprotonated at stereogenic centre (not lowest energy, from
Section 5.2.3.1)
1 6 0 1. 136441 0 .184020 -0 .1888682 6 0 1 . 667612 1. 423286 -0.5355763 6 0 3 .092365 1.487100 -0 .4573914 6 0 3 . 668367 0 .312966 -0.0494695 16 0 2 . 453128 -0 . 910571 0 .2623036 6 0 -0.253619 -0 .210663 -0 .2008817 7 0 -1 .178288 0 .807810 -0.5961838 6 0 -0 . 682028 -1.489992 0 .1740649 8 0 0 . 054299 -2 .376647 0 . 684308
10 8 0 -2.030532 -1 . 850311 0 . 05295811 6 0 -2.750471 -1.568125 -1.15646612 6 0 -1.932406 1.577615 0 .22571013 6 0 -1.863560 1.300827 1.71238514 8 0 -2.684387 2 .461755 -0.23508515 1 0 1.045463 2.258096 -0 . 84397416 1 0 3.664181 2 .381775 -0 . 69701917 1 0 4.718291 0 . 085163 0 .10329718 1 0 -1.230011 1. 080125 -1.58600919 1 0 -3.468168 -2.383393 -1 .28402420 1 0 -2.074467 -1. 544510 -2 . 01768121 1 0 -3.289738 -0 . 618810 -1.09503422 1 0 -2 .271155 2 .159548 2.24814323 1 0 -0 . 840705 1.098274 2 . 03892924 1 0 -2 .466966 0 .417611 1.951313
Sum of electronic and thermal Free Energies— -1027.641464
Geometry and energy o f 31, protonated at stereogenic centre
1 6 0 -3.359185 -0.973851 0.6557892 6 0 -2.069851 -1.026610 1.1130063 6 0 -1.157729 -0.276146 0.298152
250
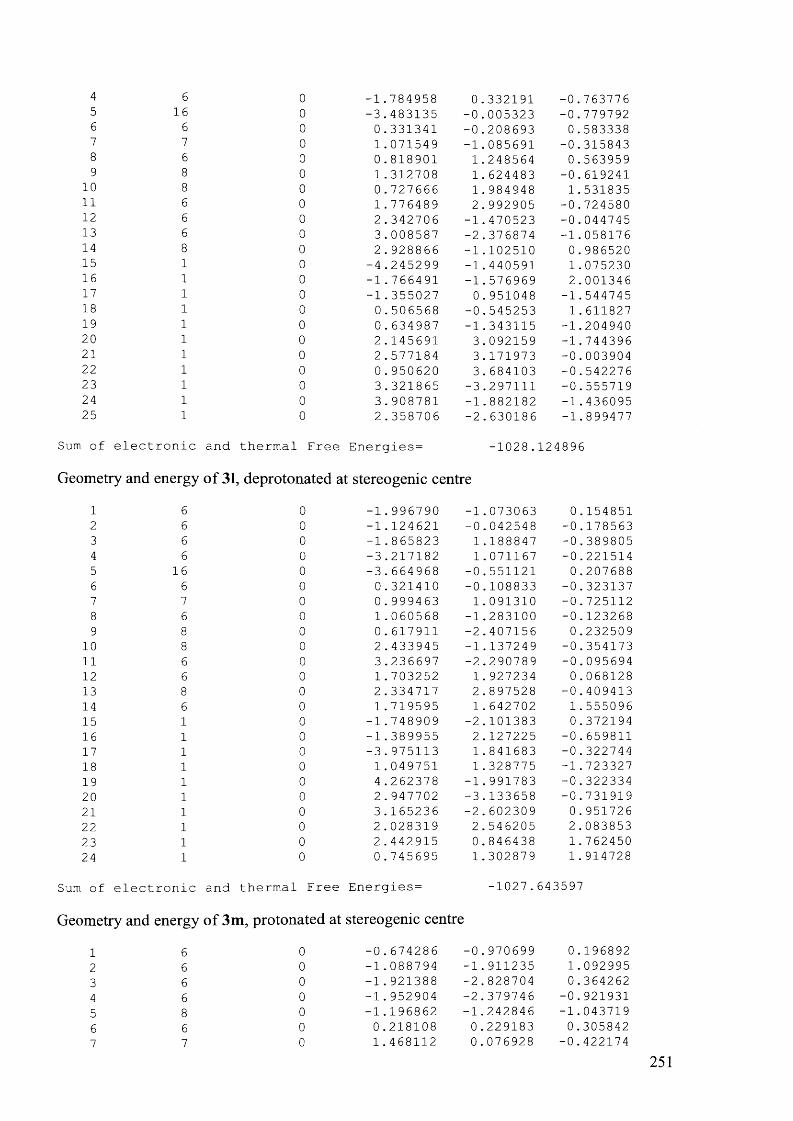
4 6 0 -1.784958 0.332191 -0 .7637765 16 0 -3.483135 -0.005323 -0.7797926 6 0 0.331341 -0.208693 0.5833387 7 0 1.071549 -1.085691 -0.3158438 6 0 0.818901 1.248564 0.5639599 8 0 1.312708 1.624483 -0.619241
10 8 0 0.727666 1. 984948 1.53183511 6 0 1.776489 2 . 992905 -0 . 72458012 6 0 2.342706 -1.470523 -0.04474513 6 0 3.008587 -2 . 376874 -1.05817614 8 0 2.928866 -1.102510 0.98652015 1 0 -4.245299 -1.440591 1. 07523016 1 0 -1.766491 -1.576969 2.00134617 1 0 -1.355027 0.951048 -1.54474518 1 0 0.506568 -0.545253 1.61182719 1 0 0.634987 -1.343115 -1.20494020 1 0 2.145691 3.092159 -1.74439621 1 0 2.577184 3.171973 -0.00390422 1 0 0 . 950620 3.684103 -0 .54227623 1 0 3.321865 -3.297111 -0 . 55571924 1 0 3 . 908781 -1.882182 -1.43609525 1 0 2 . 358706 -2.630186 -1.899477
i of electronic and thermal Free Energies= -1028 .124896
)metry and energy o f 31, deprotonated at stereogenic centre
l 6 0 -1.996790 -1.073063 0.1548512 6 0 -1.124621 -0 . 042548 -0.1785633 6 0 -1 .865823 1.188847 -0 . 3898054 6 0 -3 .217182 1.071167 -0.2215145 16 0 -3 . 664968 -0 . 551121 0.2076886 6 0 0 . 321410 -0 .108833 -0 . 3231377 7 0 0.999463 1.091310 -0.7251128 6 0 1.060568 -1.283100 -0.1232689 8 0 0.617911 -2 .407156 0.232509
10 8 0 2 .433945 -1.137249 -0.35417311 6 0 3.236697 -2.290789 -0.09569412 6 0 1. 703252 1.927234 0 .06812813 8 0 2 .334717 2 .897528 -0 .40941314 6 0 1.719595 1. 642702 1.55509615 1 0 -1 .748909 -2 .101383 0 .37219416 1 0 -1 . 389955 2 .127225 -0 . 65981117 1 0 -3 . 975113 1.841683 -0 . 32274418 1 0 1.049751 1.328775 -1 . 72332719 1 0 4 .262378 -1 . 991783 -0 . 32233420 1 0 2.947702 -3 .133658 -0 . 73191921 1 0 3 . 165236 -2 . 602309 0 . 95172622 1 0 2 . 028319 2 .546205 2.08385323 1 0 2 .442915 0.846438 1.76245024 1 0 0 . 745695 1.302879 1.914728
Sum of electronic and thermal Free Energies— -1027 . 643597
Geometry and energy o f 3 m , protonated at stereogenic centre
1 6 0 -0 . 674286 -0 . 970699 0.1968922 6 0 -1.088794 -1.911235 1.0929953 6 0 -1. 921388 -2 . 828704 0.3642624 6 0 -1.952904 -2.379746 -0 . 9219315 8 0 -1.196862 -1.242846 -1. 0437196 6 0 0.218108 0.229183 0.3058427 7 0 1.468112 0 . 076928 -0 . 422174
251

8 6 0 -0.503478 1 . 509317 -0 .1491109 8 0 -0.183997 2.181661 -1.111361
10 8 0 -1.536536 1.781933 0 . 65380811 6 0 -2.326598 2.951900 0.32764312 6 0 2.662908 -0 .080194 0 .20373613 6 0 3.870086 -0.253936 -0 . 69374314 8 0 2.771600 -0 .091504 1.43985915 1 0 -0.831531 -1. 945843 2 .14621916 1 0 -2.427345 -3 .706252 0.75160117 1 0 -2.434812 -2.725735 -1. 82844218 1 0 0.468457 0 . 351614 1.36671519 1 0 1.425798 0.088453 -1.44490420 1 0 -3.106908 2.989807 1.08643421 1 0 -2.760423 2.844218 -0.66883722 1 0 -1.703151 3.847704 0.36864123 1 0 4.631373 0.476613 -0.40573124 1 0 3.638131 -0.135911 -1.75526225 1 0 4.288057 -1.252440 -0.529429
i of electronic and thermal Free Energies= -705.:145688
)metry and energy o f 3m , deprotonated at stereogenic centre
l 6 0 1.131204 -0.568871 -0 .1493442 6 0 1. 509969 -1.905159 -0 .1552443 6 0 2 . 926599 -1.940344 0.0689834 6 0 3 .337686 -0.648839 0.2003825 8 0 2.253794 0.201569 0.0679326 6 0 -0 .159828 0.034043 -0.3548917 7 0 -1 . 174989 -0.905081 -0 .7301038 6 0 -0 .543517 1.388498 -0.2856549 8 0 -1.689631 1.844688 -0.528873
10 8 0 0.462689 2 .260627 0 .10822411 6 0 0 .093086 3.641169 0.19643712 6 0 -2 . 172976 -1.368381 0.05338913 8 0 -3 . 049319 -2 .137893 -0 . 40152014 6 0 -2.204398 -0 . 908406 1.49489115 1 0 0.849676 -2 . 750283 -0.29927216 1 0 3 . 557963 -2 . 820827 0 .12815617 1 0 4 .289939 -0.169274 0 .38577218 1 0 -1 .198800 -1.254423 -1.69624119 1 0 -0.705948 3.795661 0.92811320 1 0 -0 .236151 4.030034 -0 . 77228921 1 0 0.996482 4.163853 0.51758122 1 0 -2.903948 -1. 534735 2.05065923 1 0 -2 . 540009 0.133466 1.53818524 1 0 -1 .211506 -0 . 952097 1.950266
Sum of electronic and thermal Free Energies^ -704 . 664424
Geometry and energy o f 3n, protonated at stereogenic centre
1 6 0 -0 .218764 0.213796 0.2776772 6 0 0 .433951 1 .514610 -0.2050703 7 0 -1 .476635 0 . 006798 -0 .4335554 6 0 0 . 748416 -0 . 934870 0 .1560245 8 0 1.216745 2 . 044709 0 .7403596 8 0 0.290186 1. 987105 -1.3197447 6 0 1.962918 3.233352 0.3804298 6 0 -2 . 647919 -0 .236659 0.2072109 6 0 -3 .861748 -0 .449646 -0.673852
10 8 0 -2 . 737371 -0.283052 1.44470711 6 0 1.236591 -1.782241 1.137626
252

12 6 0 2 .120259 -2 .706054 0.50648813 6 0 2 .144922 -2 .392313 -0 .84163614 7 0 1. 316240 -1.315776 -1. 04217715 1 0 -0 .460166 0 . 325691 1. 33878116 1 0 -1.454433 0.031573 -1.45661317 1 0 2.530603 3.495134 1.27225118 1 0 1.276880 4.038390 0.10842119 1 0 2 . 632526 3.015892 -0.45467520 1 0 -4.291463 -1 .430566 -0 .44901621 1 0 -3.635732 -0 .392781 -1.74167722 1 0 -4.612940 0.306395 -0 . 42514923 1 0 0.979771 -1.733408 2 .19048724 1 0 2.673378 -3 .507585 0.98343325 1 0 2.679097 -2 .843314 -1.66988826 1 0 1.137006 -0 .892521 -1.958181
Sum of electronic and thermal Free Energies=
Geometry and energy o f 3n, deprotonated at stereogenic centre
-685.287175
1 6 0 1.386380 0 . 026917 -0 .1385762 6 0 2 . 187446 1.163361 -0.3222783 6 0 3.549890 0 .774609 -0 .1230074 6 0 3.560290 -0 .575044 0 . 1756295 7 0 2.246488 -1.012332 0 .1621226 6 0 -0.051844 -0.139689 -0.2391747 7 0 -0.801181 1. 023760 -0.6084518 6 0 -0.685875 -1.370234 -0 .0652919 8 0 -0.128908 -2.466336 0.250170
10 8 0 -2 .065565 -1. 351800 -0 .28069211 6 0 -2 .746306 -2 .592883 -0.08336812 6 0 -1 . 375019 1.888979 0.25895513 6 0 -2 . 128080 3 .054655 -0.36070214 8 0 -1 . 320944 1.767351 1.49674515 1 0 1 . 824899 2.153725 -0 .56824516 1 0 4 . 422481 1.416131 -0 . 19013617 1 0 4.373302 -1.255917 0 .39648518 1 0 1.908638 -1. 953770 0 . 33940719 1 0 -0.904435 1 .233117 -1. 60463920 1 0 -3.798546 -2 .385889 -0.29061921 1 0 -2.636384 -2 . 952551 0 . 94508122 1 0 -2.380316 -3 .366736 -0.76605623 1 0 -1.791421 3 . 984585 0 .10621524 1 0 -3.195465 2 . 942519 -0 . 14198125 1 0 -1.997865 3 .127040 -1.444110
i of electronic and thermal Free Energies= -684.1304159
)metry and energy o f 3o, protonated at stereogenic centre
l 7 0 -3 . 856704 -0 .873289 0 .1756352 6 0 -3 .041670 -0.658545 1 .2221863 6 0 -1. 676936 -0 .392647 1.0959544 6 0 -1.112745 -0 . 352452 -0.1850885 6 0 -1.953883 -0 .574173 -1.2790496 6 0 -3.308093 -0 . 828135 -1.0494777 1 0 -3.500735 -0 . 697167 2 .2106468 1 0 -1.077170 -0.224133 1.9902689 6 0 0.371208 -0 . 079079 -0.393502
10 1 0 -1.567601 -0 . 550462 -2 .29717611 1 0 -3.981082 -1. 003274 -1.88957112 1 0 0.570005 -0 . 003272 -1.46928113 6 0 0.755129 1.278812 0.225597
253
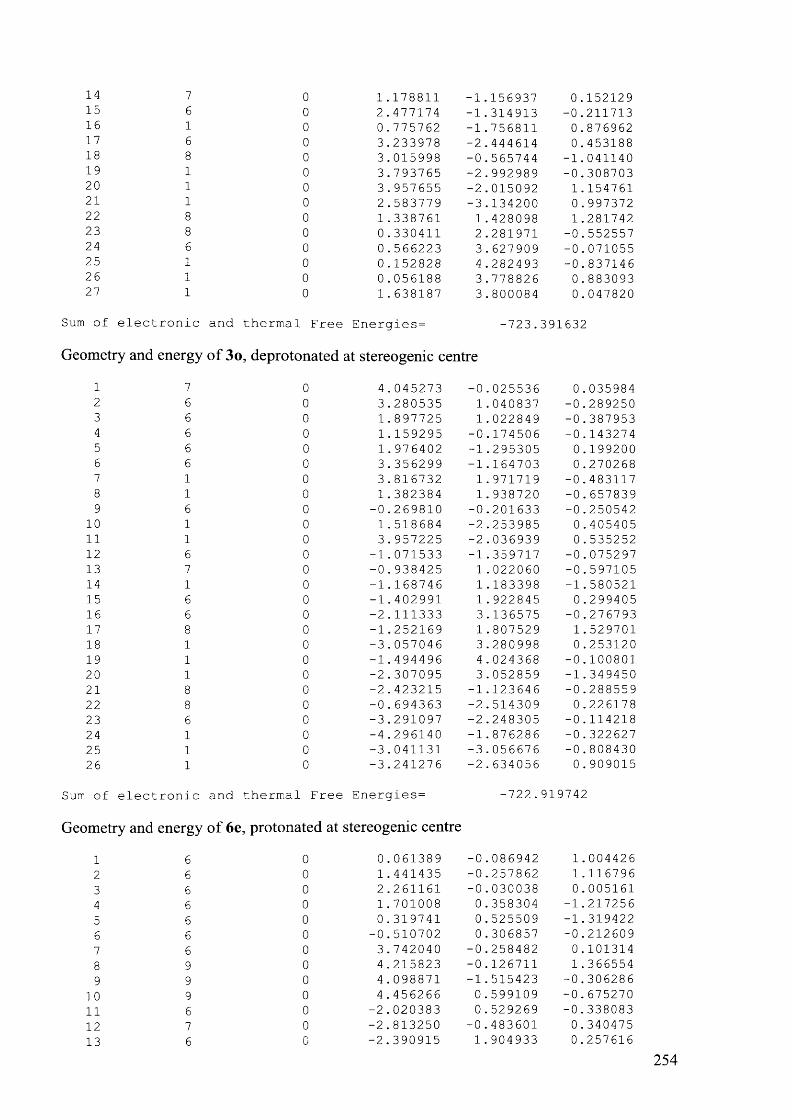
14 7 0 1.178811 -1.156937 0 .15212915 6 0 2 .477174 -1 .314913 -0.21171316 1 0 0.775762 -1.756811 0 .87696217 6 0 3.233978 -2 .444614 0 .45318818 8 0 3.015998 -0 .565744 -1.04114019 1 0 3.793765 -2 . 992989 -0.30870320 1 0 3 . 957655 -2.015092 1.15476121 1 0 2 . 583779 -3 .134200 0.99737222 8 0 1.338761 1.428098 1.28174223 8 0 0 . 330411 2 .281971 -0.55255724 6 0 0.566223 3 . 627909 -0.07105525 1 0 0.152828 4.282493 -0.83714626 1 0 0.056188 3 .778826 0 .88309327 1 0 1.638187 3.800084 0 .047820
Sum of electronic and thermal Free Energies=
Geometry and energy o f 3o, deprotonated at stereogenic centre
-723 . 391632
1 7 0 4 . 045273 -0.025536 0.0359842 6 0 3.280535 1.040837 -0.2892503 6 0 1.897725 1.022849 -0.3879534 6 0 1.159295 -0.174506 -0 .1432745 6 0 1.976402 -1.295305 0.1992006 6 0 3.356299 -1.164703 0.2702687 1 0 3 .816732 1 . 971719 -0 .4831178 1 0 1 .382384 1. 938720 -0.6578399 6 0 -0.269810 -0.201633 -0.250542
10 1 0 1 .518684 -2 .253985 0 .40540511 1 0 3 . 957225 -2 . 036939 0 . 53525212 6 0 -1.071533 -1 . 359717 -0 . 07529713 7 0 -0 . 938425 1 . 022060 -0 .59710514 1 0 -1.168746 1.183398 -1.58052115 6 0 -1.402991 1 . 922845 0.29940516 6 0 -2 . 111333 3 .136575 -0.27679317 8 0 -1 .252169 1 . 807529 1. 52970118 1 0 -3.057046 3 .280998 0 .25312019 1 0 -1.494496 4 . 024368 -0.10080120 1 0 -2 .307095 3 . 052859 -1.34945021 8 0 -2 .423215 -1.123646 -0.28855922 8 0 -0.694363 -2 .514309 0.22617823 6 0 -3 .291097 -2 .248305 -0 . 11421824 1 0 -4 .296140 -1. 876286 -0 . 32262725 1 0 -3 .041131 -3 . 056676 -0 .80843026 1 0 -3 .241276 -2 . 634056 0.909015
i of electronic and thermal Free Energies= -722 . !919742
)metry and energy o f 6e, protonated at stereogenic centre
l 6 0 0 .061389 -0.086942 1.0044262 6 0 1 .441435 -0.257862 1.1167963 6 0 2 .261161 -0.030038 0.0051614 6 0 1 .701008 0.358304 -1.2172565 6 0 0 .319741 0 . 525509 -1.3194226 6 0 -0 .510702 0 . 306857 -0.2126097 6 0 3.742040 -0 .258482 0.1013148 9 0 4.215823 -0.126711 1.3665549 9 0 4.098871 -1.515423 -0.306286
10 9 0 4.456266 0.599109 -0.67527011 6 0 -2.020383 0.529269 -0.33808312 7 0 -2 .813250 -0.483601 0.34047513 6 0 -2 .390915 1. 904933 0.257616
254

14 7 0 -2 . 338607 2 . 940429 -0 .59587615 8 0 -2 . 678984 2 .019156 1.45610616 6 0 -3.172530 -1. 644256 -0.26090117 6 0 -4.014051 -2 .597468 0 .56247418 8 0 -2 .840070 -1.918038 -1.42539719 1 0 -0 .568259 -0.265721 1.87394020 1 0 1. 872419 -0.562585 2 .06823821 1 0 2 .332717 0.526815 -2 . 08762822 1 0 -0.113566 0.821367 -2 .27473323 1 0 -2 .285247 0 .511652 -1.40178624 1 0 -3 .097549 -0 .292101 1.30329425 1 0 -2 .167692 2 .815701 -1.59208326 1 0 -2.528826 3 .881975 -0.25285927 1 0 -4.961980 -2 .768953 0 . 04295928 1 0 -4.220176 -2.228724 1.57057829 1 0 -3 .494213 -3.557899 0.630125
Sum of electronic and thermal Free Energies=
Geometry and energy o f 6e, deprotonated at stereogenic centre
-985.258608
1 6 0 -2 .367262 0.027264 -0 .0550912 6 0 -1. 512974 -1.040984 -0.3859873 6 0 -0 . 140126 -0 . 860220 -0 .4414114 6 0 0 .478964 0.402353 -0 . 1723425 6 0 -0.417950 1.465945 0 .1616596 6 0 -1.793141 1.279836 0.2195877 1 0 -1 . 928231 -2 . 024738 -0.6041628 1 0 0 .477645 -1.710855 -0 . 7077819 6 0 1. 907001 0.552326 -0.249825
10 1 0 -0 . 001581 2.441625 0.37231011 1 0 -2.427934 2.124222 0 .48125012 6 0 -3.829915 -0.200076 0.02497613 9 0 -4.549627 0.939330 0.21085314 9 0 -4.350064 -0.797991 -1.09839515 9 0 -4.199565 -1.042064 1.05425216 6 0 2.626912 1.772588 -0.09670417 7 0 2.679372 -0 . 619974 -0.57983118 1 0 2.870872 -0 .810163 -1 .56844419 6 0 3.087601 -1 .556293 0.31533520 6 0 3.804450 -2 .766392 -0.25767421 8 0 2.896704 -1.459029 1.53983422 1 0 4.759263 -2 .893408 0.26086323 1 0 3.200935 -3.658769 -0.06121724 1 0 3.985550 -2 . 692680 -1. 33352725 7 0 4 .010425 1. 749094 -0 . 31901326 8 0 2 . 111754 2 . 903345 0.17383227 1 0 4.497932 2.545510 0.08479428 1 0 4.501249 0.869338 -0.217031
i of electronic and thermal Free Energies= -984.775482
)metry and energy o f 9, protonated at stereogenic centre
l 6 0 -1.202928 0.408133 1 . 0272342 6 0 -2.456083 -0.102264 1. 3793663 6 0 -3.261862 -0.720685 0.4162894 6 0 -2 .804119 -0.826607 -0.9007865 6 0 -1 .547649 -0 .319401 -1.2500726 6 0 -0 . 735366 0.306199 -0 .2931797 6 0 0 . 625641 0 .876835 -0.6996518 6 0 0 .711578 2.400455 -0.5083779 6 0 1 . 723444 0.162272 0.080107
255

10 8 0 2 .100617 -0 . 977181 -0.52779511 8 0 2 .199838 0.540256 1.13847612 6 0 3 .093385 -1.780632 0 .15083613 1 0 -0.587568 0 .885370 1.78867314 1 0 -2.803057 -0.016459 2.40844515 1 0 -4 .238635 -1.116399 0.69126216 1 0 -3 . 422462 -1.305598 -1.65903717 1 0 -1.195248 -0.407557 -2.27770018 1 0 0.780445 0.636031 -1.75850319 1 0 1.677815 2 .781900 -0.85455920 1 0 0.593693 2 . 676080 0.54276721 1 0 -0.079422 2.887947 -1.08600522 1 0 3.261878 -2.639183 -0 .49852423 1 0 2 .716856 -2.102395 1.12488324 1 0 4 . 015828 -1.210167 0 .282247
Sum of electronic and thermal Free Energies=
Geometry and energy o f 9, deprotonated at stereogenic centre
■538 . 642453
1 6 0 1 .882371 1.166928 -0.0181702 6 0 3.231306 0 .806567 -0.0238923 6 0 3 . 621596 -0 . 538453 -0.0060684 6 0 2 . 611500 -1.512000 0 . 0151395 6 0 1.261139 -1.162884 0 . 0204226 6 0 0 . 827714 0 .200629 0.0061187 6 0 -0.561000 0.635471 0 . 0149318 6 0 -0.830824 2.129091 0 . 0289239 6 0 -1.638678 -0.270700 -0 . 002975
10 8 0 -2.905426 0.349240 -0 . 01726311 8 0 -1 . 620541 -1.534534 -0 . 00962212 6 0 -4.033098 -0 . 523156 -0 .00823513 1 0 1.641460 2 .224663 -0 . 03614814 1 0 3.986949 1.592582 -0.04345415 1 0 4.673354 -0.818940 -0.00987116 1 0 2.879897 -2 .569140 0 . 02821817 1 0 0.508498 -1. 940244 0 . 03539918 1 0 -1.899169 2.332757 0 .09330519 1 0 -0.455171 2.637820 -0 . 87395520 1 0 -0.348562 2.631626 0.88216321 1 0 -4 . 909652 0.129289 -0 . 02084922 1 0 -4.054008 -1.150057 0 . 88998623 1 0 -4.048009 -1.176959 -0 .886875
1 of electronic and thermal Free Energies= -538 .:149350
)metry and energy o f 10, protonated at stereogenic centre
l 6 0 -0.800593 0 .343194 0 .0627192 6 0 -1.213006 -0 .265065 -1 .1328153 6 0 -2.462163 -0.887318 -1.2218704 6 0 -3 . 320240 -0 . 906617 -0.1158715 6 0 -2.918481 -0.301300 1.0791776 6 0 -1.666008 0.317368 1.1651937 1 0 -0.555698 -0.261200 -2 . 0020098 1 0 -2.765538 -1. 357690 -2 .1564499 1 0 -4.292467 -1. 392579 -0.185081
10 1 0 -3.575630 -0 .315121 1. 94787611 1 0 -1.355568 0.781085 2 . 10196212 6 0 0.536391 1.075086 0.16758913 1 0 0 . 777155 1.183244 1.23034614 7 0 1.643664 0.321182 -0 . 43082515 6 o 0 .469503 2.471619 -0 . 472059
256

16 1 0 1.413249 3.007299 -0.32594917 1 0 0 .269684 2.401207 -1.54769318 1 0 -0.337302 3.054099 -0.01803119 1 0 1.813162 0.437006 -1. 43278020 6 0 2.428597 -0 .534517 0.26334121 6 0 3.522735 -1.233767 -0.52039522 8 0 2.279646 -0 .748459 1.47994023 1 0 4.482240 -1.051385 -0.02747124 1 0 3.337868 -2.312522 -0.49706025 1 0 3.585623 -0.906139 -1.561466
Sum of electronic and thermal Free Energies= -518.783181
Geometry and energy o f 10, deprotonated at stereogenic centre
1 6 0 -0 .885958 0 .230689 -0.0275152 6 0 -2.037652 1.111504 -0.0512883 6 0 -3.339512 0 . 632747 0.0341504 6 0 -3.624645 -0.744931 0.1263165 6 0 -2 . 529339 -1.630873 0.1244706 6 0 -1.216462 -1 .178909 0.0486747 1 0 -1 .882487 2 .184397 -0 .1332878 1 0 -4.161036 1.351358 0.0183839 1 0 -4.647805 -1.108869 0.187308
10 1 0 -2.707050 -2.705921 0.19036411 1 0 -0.410902 -1.909671 0.08341512 6 0 0.429721 0 .712601 -0 .09046413 7 0 1.465038 -0.232675 -0 .39476514 6 0 0 .770224 2 .160790 -0 . 32734715 1 0 1 . 826728 2 .347799 -0 .11150616 1 0 0 .583013 2.500154 -1.36738117 1 0 0.193868 2 .830909 0.32318418 1 0 1.291123 -0.899877 -1.15463919 6 0 2 . 688455 -0 .297535 0.17096020 6 0 3 . 659176 -1.298967 -0.43034421 8 0 3.050987 0.435034 1.12234122 1 0 4.134737 -1 .863273 0 . 37741323 1 0 3.181332 -1.996151 -1.12591124 1 0 4.451270 -0.765099 -0 . 968387i of electronic and thermal Free Energies= -518.;255430
)metry and energy o f 11, protonated at stereogenic centre
l 6 0 -0.386072 2.173101 -0 .2975602 6 0 -0 . 071343 0.727913 0 .1365363 6 0 -1.231246 -0.202649 -0.2289044 8 0 -1.237788 -0.985091 -1.1629135 7 0 1.167404 0.254898 -0 .4535896 6 0 2 .197115 -0 .246273 0.2736127 6 0 3.405998 -0 .711062 -0 .5130768 8 0 2.172603 -0.317511 1.5136529 8 0 -2.268255 -0 .019929 0.600458
10 1 0 1.227342 0 .237309 -1.47534411 1 0 0 .049382 0 . 693298 1.22420612 1 0 -1 .317231 2.516032 0.16101913 1 0 0 . 426584 2.831190 0.02152414 1 0 -0 .485020 2.242084 -1.38627515 1 0 3.296292 -0.576445 -1.59213616 1 0 4.284373 -0.155817 -0.17012517 1 0 3.578811 -1.770172 -0.29849218 6 0 -3.463948 -0.792630 0 . 33461019 1 0 -4.172794 -0.498290 1.10740820 1 0 -3.852692 -0.553509 -0.657744
257

21 1 0 -3.242377 -1.860114 0.400194
Sum of electronic and thermal Free Energies= -515.641260
Geometry and energy o f 11, deprotonated at stereogenic centre
1 6 0 0 . 074676 1.899561 -0.4830172 6 0 0 .133305 0 .419940 -0.2136783 6 0 1.281899 -0.339007 -0 . 0857094 8 0 2 .480839 0 .405630 -0 .1304685 7 0 -1 . 078427 -0.328573 -0.3869366 6 0 -2 .266889 -0.077166 0 .1977127 6 0 -3 . 429976 -0.953522 -0.2391758 8 0 -2.447444 0.837552 1. 0353069 8 0 1.365811 -1.607369 0 . 027009
10 1 0 -1.020866 -1.162186 -0.97639211 1 0 1.058998 2.347152 -0.32906412 1 0 -0.233667 2.121199 -1.51969813 1 0 -0.640998 2.410397 0 .17348514 1 0 -3.119541 -1.818139 -0.83330115 1 0 -3.969163 -1.298214 0 . 64810316 1 0 -4 .128471 -0 .356475 -0.83663517 6 0 3 . 635889 -0.252293 0.38581018 1 0 4.462830 0 . 450741 0.25826019 1 0 3.519918 -0.487162 1.45184920 1 0 3 . 852871 -1.178884 -0.154489
Sum of electronic and thermal Free Energies= -515. 141347
Geometry and energy o f Amfepramone (protonated at amine), protonated at stere
centre
l 6 0 4 .150926 0 .723576 0 .2822242 6 0 4 .450917 -0.291236 -0.6367803 6 0 3.425807 -1.070583 -1 .1827944 6 0 2 .100284 -0 .844129 -0 . 8098415 6 0 1.790083 0 .174381 0.1123656 6 0 2 . 829912 0 . 958513 0 . 6525997 6 0 0 . 403722 0.470066 0 . 5382048 6 0 -0 .716520 -0 . 561132 0 .2685989 8 0 0.111372 1.482113 1.172068
10 7 0 -2.036815 0 .199000 0.27727211 6 0 -0 . 632713 -1. 642068 1. 35798612 6 0 -3.269419 -0 . 648171 0 . 55515713 6 0 -2.161805 1. 027069 -0 . 99638214 6 0 -3 .361133 1 . 964248 -1.00326315 6 0 -3.604008 -1.656623 -0 . 53416416 1 0 4 . 949751 1. 328254 0.70882317 1 0 5 .485021 -0.473228 -0 . 92732218 1 0 3.657159 -1.854687 -1.90176219 1 0 1. 320531 -1.455769 -1.25993020 1 0 2 .588537 1. 742259 1.36705021 1 0 -0.621450 -1.012497 -0 . 72506622 1 0 -1.962311 0 . 873577 1. 07253623 1 0 -1.326621 -2 .464273 1.17305724 1 0 -0 . 822202 -1.221500 2.35086725 1 0 0.376819 -2.060502 1.35704226 1 0 -4 .086599 0 .061170 0.70176127 1 0 -3 .099510 -1.134519 1 .51634928 1 0 -2 .191184 0 . 320138 -1. 82895629 1 0 -1.237017 1.602022 -1. 07249730 1 0 -3.283311 2 . 600895 -1.889708
258

3132333435
•3 .367834 •4 . 315928 ■4 . 456243 ■2 .781379 ■3 .895805
2.617234 1.435358 ■2.249714 -2 .348785 -1.178800
-0 .123730 -1.060006 -0.188936 -0.737303 -1.473176
Sum of electronic and thermal Free Energies^ -637.047397
Geometry and energy o f Amfepramone (protonated at amine), deprotonated at stereogenic
centre
l 6 0 -3.732934 1.294354 -0.1204782 6 0 -4.577073 0 .218302 0.1713053 6 0 -4.039912 -1.070773 0.2811964 6 0 -2.670532 -1.278738 0.1004055 6 0 -1.809092 -0 .201904 -0.1751836 6 0 -2 . 359328 1. 085483 -0 .2900417 6 0 -0 . 348432 -0.467493 -0.3934378 6 0 0. 624081 0.280847 0 . 2368159 8 0 -0.025356 -1 .446621 -1.200982
10 7 0 1.970087 -0 .206115 -0 .17740911 6 0 0 . 506017 1.341269 1.29032812 6 0 2 .761439 -0 .839958 0 . 94128513 6 0 2 .764002 0 .731768 -1.06629414 6 0 3 .469991 1.874396 -0.34660815 6 0 3.972934 -1. 627119 0 . 45221616 1 0 -4.142465 2 .298637 -0.22274217 1 0 -5.645748 0 .380193 0.30582318 1 0 -4.690211 -1.915430 0.50613619 1 0 -2 .257443 -2.282987 0.17464120 1 0 -1.715570 1.927874 -0.53436621 1 0 1.636394 -0 . 985843 -0 . 80424622 1 0 0.678986 2.363053 0.92347423 1 0 1.204185 1.178248 2.12186524 1 0 -0 .500148 1.322539 1.71567625 1 0 2.053842 -1.497168 1.45388326 1 0 3.055607 -0.052889 1.63911827 1 0 2.042099 1.112155 -1.79336628 1 0 3.489278 0.115501 -1.60652129 1 0 3.993093 2 .474712 -1.09779230 1 0 4.219814 1.520510 0 .36733031 1 0 2.772520 2.530830 0 . 17698032 1 0 4.415835 -2 .149975 1 . 30554933 1 0 4.746549 -0.986120 0.01989834 1 0 3.688656 -2 .380670 -0 .290676
Sum of electronic and thermal Free Energies= -636.!580166
Geometry and energy o f Cathinone (protonated at amine), protonated at stereogenic cen
l 6 0 2.845091 0 . 926591 0.2995152 6 0 3 .292948 -0 .360714 -0 . 0263633 6 0 2.375480 -1.353922 -0.3848344 6 0 1.010012 -1.067570 -0 .4139155 6 0 0.551747 0.223770 -0 .0884136 6 0 1.484374 1.219213 0 .2659077 6 0 -0.883109 0.588098 -0.1110808 6 0 -1.943606 -0.524469 -0.1790619 8 0 -1.274523 1.750750 -0.031857
10 7 0 -3.236354 0.123090 -0 .59498211 6 0 -2 .126076 -1.219430 1.17560212 1 0 3.559304 1.699029 0 .580430
259

13 1 0 4.358001 -0 .588509 -0.00168214 1 0 2.722552 -2 .352525 -0.64491215 1 0 0.320054 -1.854440 -0.71175716 1 0 1 .127826 2.214849 0 .52007717 1 0 -1.708965 -1.252812 -0.96522518 1 0 -4.015686 -0.555967 -0 .59569419 1 0 -3.170294 0 .515559 -1.54998520 1 0 -3.483372 0.907817 0 .03201621 1 0 -2 . 905848 -1.984655 1.10875522 1 0 -2 .398623 -0 .497171 1.95254823 1 0 -1.195448 -1.708203 1.471006
L O f electronic and thermal Free Energies= -47 9.'905944
)metry and energy o f Cathinone (protonated at amine), deprotonated at stereogenic c
l 6 0 -2 .704372 -0.864843 0.6568722 6 0 -3 .243325 0.282748 0.0610843 6 0 -2 .401020 1.164591 -0.6234394 6 0 -1.027456 0 . 906402 -0 . 7041195 6 0 -0 .475713 -0.237715 -0 .1046416 6 0 -1 . 334906 -1.125423 0.5663657 6 0 0 . 986357 -0.569548 -0 .2127548 6 0 1.945694 0.352795 0 .1387589 8 0 1 . 307553 -1.759681 -0 . 645111
10 7 0 3.307732 -0 .190257 -0 .06862111 6 0 1.876900 1.709926 0 .76214512 1 0 -3 . 353078 -1.558342 1.19087313 1 0 -4 .311871 0 .483687 0 .12573314 1 0 -2.812151 2.053017 -1.10148415 1 0 -0.383599 1.591109 -1 .25294016 1 0 -0 . 920357 -2.023699 1 .02066117 1 0 3 .872719 0.338935 -0.75139618 1 0 3 .132540 -1. 149644 -0 .44040019 1 0 3 .864582 -0.265578 0 .79765520 1 0 2 .282300 2 .502324 0 .11414621 1 0 2.439856 1.752808 1.70779522 1 0 0 . 841556 1.971036 0.988963
i o f electronic and thermal Free Energies= -479 .436174
5.4.1.2 C alcula tions P e r fo rm e d in th e G as-Phase
Geometry and energy o f 3a, protonated at stereogenic centre
1 6 0 1 . 450945 -1. 044862 -1.1669202 6 0 2.648054 -1 . 732771 -0 . 9499423 6 0 3 .190492 -1.808288 0.3348874 6 0 2 . 529194 -1.195185 1.4039005 6 0 1 .333493 -0.508606 1.1861306 6 0 0 . 786513 -0.428496 -0 .1020707 6 0 -0.528000 0.318089 -0.3475748 7 0 -1.663193 -0.257827 0 . 3550899 6 0 -0.397462 1.775239 0 .092400
10 8 0 0.333131 2 .487265 -0 .77497411 8 0 -0 . 877145 2.225063 1.11653812 6 0 0 . 585133 3 .863757 -0 .41879913 6 0 -2 .416513 -1.256818 -0.19510914 6 0 -3.587807 -1. 737909 0.64309915 8 0 -2 . 156875 -1.742822 -1.29387816 1 0 1 . 021154 -1.001228 -2 .163357
260

17 1 0 3.151065 -2 .214098 -1.78364218 1 0 4 .119910 -2 .344251 0.50423719 1 0 2 . 944435 -1.250799 2 .40613920 1 0 0.823897 -0.036159 2 . 02214121 1 0 -0.741168 0 .290170 -1.41968422 1 0 -1 . 943325 0 .192814 1.21634223 1 0 1.184035 4 .265535 -1.23479824 1 0 -0.356901 4 .408044 -0.32343225 1 0 1.132417 3.914160 0.52512726 1 0 -3.745412 -1.151150 1.55238627 1 0 -4.492902 -1.707563 0.03096828 1 0 -3 .412000 -2 .781636 0.920443
Sum of electronic and thermal Free Energies=
Geometry and energy o f 3a, deprotonated at stereogenic centre
-707 .317933
1 6 0 -1.884334 1.115982 -0.3130332 6 0 -3.272664 1.216587 -0.2547583 6 0 -4.069823 0 .095815 0.0109544 6 0 -3.422536 -1.130824 0.2216885 6 0 -2.036077 -1.246688 0.1660906 6 0 -1.204373 -0 .120271 -0.1117917 6 0 0 .234471 -0 .200012 -0.2071458 7 0 0.950372 0 . 993078 -0.5619049 6 0 0.988378 -1.386769 -0.059801
10 8 0 2.366285 -1.184767 -0.30954311 8 0 0.604092 -2 . 534820 0.22865712 6 0 3.176917 -2 . 330104 -0 .10404113 6 0 1.541976 1.865142 0 . 30031414 8 0 1.442545 1. 832721 1.52648015 6 0 2.381149 2 . 958438 -0.36799816 1 0 -1.298579 2.008774 -0 . 50713417 1 0 -3.738146 2.188799 -0 .41343318 1 0 -5.153268 0.175704 0 . 05874019 1 0 -4.012647 -2.021186 0.43650320 1 0 -1. 558845 -2 .203834 0.33450521 1 0 1.195484 1.121709 -1.53713422 1 0 4 .200634 -2.015001 -0 .33074923 1 0 2 .886809 -3.159031 -0 .76094824 1 0 3.119205 -2 . 685392 0.93184725 1 0 3 . 429244 2 .808232 -0 . 08872926 1 0 2 .068628 3 . 930881 0.02327827 1 0 2.306993 2.969953 -1 .461051
i of electronic and thermal Free Energies= -706.'765983
)metry and energy o f 3b, protonated at stereogenic centre
l 6 0 -1 . 357280 -0 .349804 1.2612192 6 0 -2 . 735410 -0.500750 1.1190263 6 0 -3 . 321784 -0.343712 -0.1402964 6 0 -2.524960 -0 . 038648 -1.2500105 6 0 -1 . 146811 0 .111091 -1.0928106 6 0 -0 .545910 -0 .041904 0 .1625577 8 0 -4 . 680144 -0 . 502197 -0.2281978 6 0 0.965252 0.115534 0 . 3384509 7 0 1. 747973 -0.870235 -0.392002
10 6 0 1.407751 1.499963 -0.13043111 8 0 1. 102108 2 .446224 0.76690912 8 0 1.946233 1.718672 -1.20025413 6 0 1.403737 3.806583 0.38904414 6 0 2 . 075523 -2.077629 0.157458
261

15 6 0 2 . 916469 -2 . 993489 -0.71450016 8 0 1.705840 -2 .407108 1.28264317 1 0 -0.904217 -0 .489546 2.23818918 1 0 -3.364190 -0 .746829 1.96825319 1 0 -2.977755 0 . 083354 -2 .23170720 1 0 -0.539502 0.348183 -1.96252121 1 0 -4.968890 -0.384481 -1.14267622 1 0 1.197398 0.010387 1.40157023 1 0 2.131201 -0.581285 -1.28230724 1 0 1.087109 4 .415554 1.23458725 1 0 0.850931 4 . 078518 -0.51296026 1 0 2.474744 3.920220 0.20778427 1 0 3.240203 -2.530732 -1.65107828 1 0 2.331352 -3 .888888 -0.94485829 1 0 3.794044 -3 . 310937 -0.145313
i of electronic and thermal Free Energies= -782 .!541245
imetry and energy o f 3b, deprotonated at stereogenic centre
l 6 0 -1. 502925 1 . 058162 -0.3491562 6 0 -2.894939 1 .142142 -0.3022263 6 0 -3 . 656576 0.008464 -0.0235354 6 0 -3.001938 -1.202833 0.2093845 6 0 -1. 609536 -1.290014 0 .1628336 6 0 -0 .799353 -0 .156712 -0 .1261157 8 0 -5 . 048896 0.130714 0.0138798 6 0 0 . 647775 -0.213407 -0.2064819 7 0 1 . 350314 0.987405 -0.561959
10 6 0 1.411608 -1.386279 -0 .04949711 8 0 2.794956 -1.166046 -0.27573112 8 0 1.037934 -2 .543589 0.22736613 6 0 3.614014 -2 . 304565 -0 .06943614 6 0 1.815978 1 . 934780 0.29810915 6 0 2.668008 3.030081 -0 . 35065316 8 0 1.585322 1 . 974124 1.50664617 1 0 -0.937051 1 . 960844 -0.55386918 1 0 -3.396128 2.091760 -0 .47337919 1 0 -3.583351 -2 .099286 0.43245020 1 0 -1.118912 -2 .237551 0.34709221 1 0 -5 .414739 -0 . 726527 0.26427122 1 0 1 . 707441 1. 056826 -1 . 50791623 1 0 4.637403 -1. 978507 -0.28275724 1 0 3.339512 -3 .132197 -0 . 73477525 1 0 3.549335 -2.668407 0.96332426 1 0 3.655444 3 . 022526 0 .12143427 1 0 2.210232 4 . 002800 -0 .14567928 1 0 2.791383 2 . 915353 -1. 433142
Sum of electronic and thermal Free Energies= -781. 986873
Geometry and energy o f 3c, protonated at stereogenic centre
1 6 0 -1.113641 0 . 072741 -1.0986062 6 0 -2.493702 -0 .062133 -1.2495483 6 0 -3.323891 -0 . 307285 -0 .1449104 6 0 -2 . 723281 -0 .407475 1.1171635 6 0 -1.341832 -0.273906 1.2730486 6 0 -0 . 522292 -0 . 033398 0 .1670647 6 0 0. 991059 0.112210 0.3436188 7 0 1.762491 -0.885168 -0.3812219 6 0 1.445911 1.489625 -0.135538
10 8 0 1.119693 2.448704 0.740721262
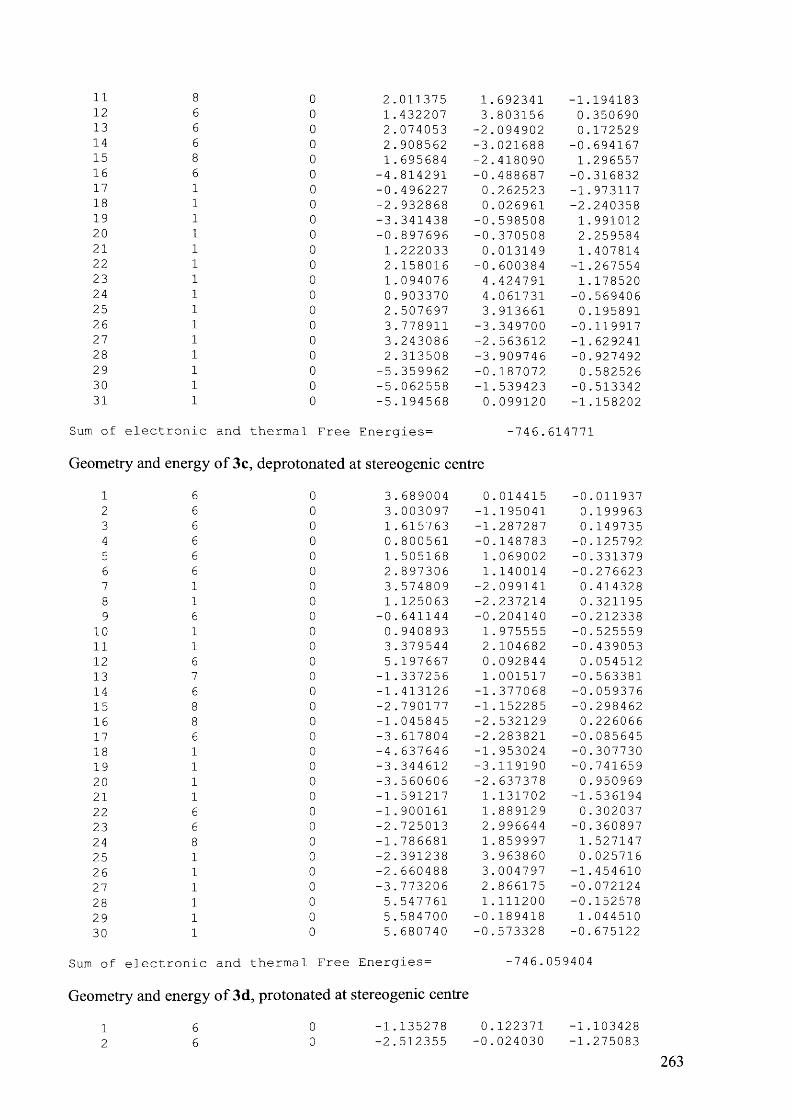
11 8 0 2 .011375 1.692341 -1.19418312 6 0 1.432207 3 .803156 0.35069013 6 0 2 . 074053 -2.094902 0 .17252914 6 0 2.908562 -3.021688 -0 . 69416715 8 0 1.695684 -2 .418090 1.29655716 6 0 -4.814291 -0 .488687 -0.31683217 1 0 -0 .496227 0.262523 -1. 97311718 1 0 -2.932868 0 . 026961 -2 .24035819 1 0 -3 .341438 -0 .598508 1.99101220 1 0 -0 .897696 -0 .370508 2.25958421 1 0 1.222033 0.013149 1.40781422 1 0 2 .158016 -0.600384 -1.26755423 1 0 1.094076 4 .424791 1.17852024 1 0 0 . 903370 4.061731 -0.56940625 1 0 2 . 507697 3.913661 0 .19589126 1 0 3 .778911 -3 .349700 -0 .11991727 1 0 3.243086 -2 .563612 -1. 62924128 1 0 2 .313508 -3.909746 -0 . 92749229 1 0 -5 . 359962 -0.187072 0.58252630 1 0 -5.062558 -1.539423 -0.51334231 1 0 -5.194568 0 .099120 -1.158202
i of electronic and thermal Free Energies= -746. 614771
>metry and energy o f 3c, deprotonated at stereogenic centre
l 6 0 3 . 689004 0.014415 -0.0119372 6 0 3 . 003097 -1.195041 0.1999633 6 0 1.615763 -1.287287 0.1497354 6 0 0.800561 -0 .148783 -0.1257925 6 0 1.505168 1.069002 -0.3313796 6 0 2 .897306 1.140014 -0.2766237 1 0 3 . 574809 -2 .099141 0.4143288 1 0 1 . 125063 -2 .237214 0.3211959 6 0 -0 . 641144 -0.204140 -0.212338
10 1 0 0.940893 1.975555 -0 . 52555911 1 0 3 . 379544 2 .104682 -0 .43905312 6 0 5 .197667 0 .092844 0 .05451213 7 0 -1 .337256 1 . 001517 -0 .56338114 6 0 -1 .413126 -1.377068 -0.05937615 8 0 -2 .790177 -1.152285 -0.29846216 8 0 -1. 045845 -2 . 532129 0 .22606617 6 0 -3 . 617804 -2 .283821 -0 .08564518 1 0 -4.637646 -1. 953024 -0 . 30773019 1 0 -3 . 344612 -3 . 119190 -0.74165920 1 0 -3 .560606 -2.637378 0 . 95096921 1 0 -1 .591217 1.131702 -1. 53619422 6 0 -1 . 900161 1.889129 0 .30203723 6 0 -2 . 725013 2.996644 -0 .36089724 8 0 -1 .786681 1.859997 1. 52714725 1 0 -2.391238 3.963860 0.02571626 1 0 -2 . 660488 3.004797 -1.45461027 1 0 -3 .773206 2.866175 -0 .07212428 1 0 5 . 547761 1.111200 -0.15257829 1 0 5.584700 -0 .189418 1.04451030 1 0 5.680740 -0 .573328 -0 . 675122
Sum of electronic and thermal Free Energies-
Geometry and energy o f 3d, protonated at stereogenic centre
-746.059404
-1.135278 -2.512355
0 .122371 -0.024030
-1.103428 -1.275083
263
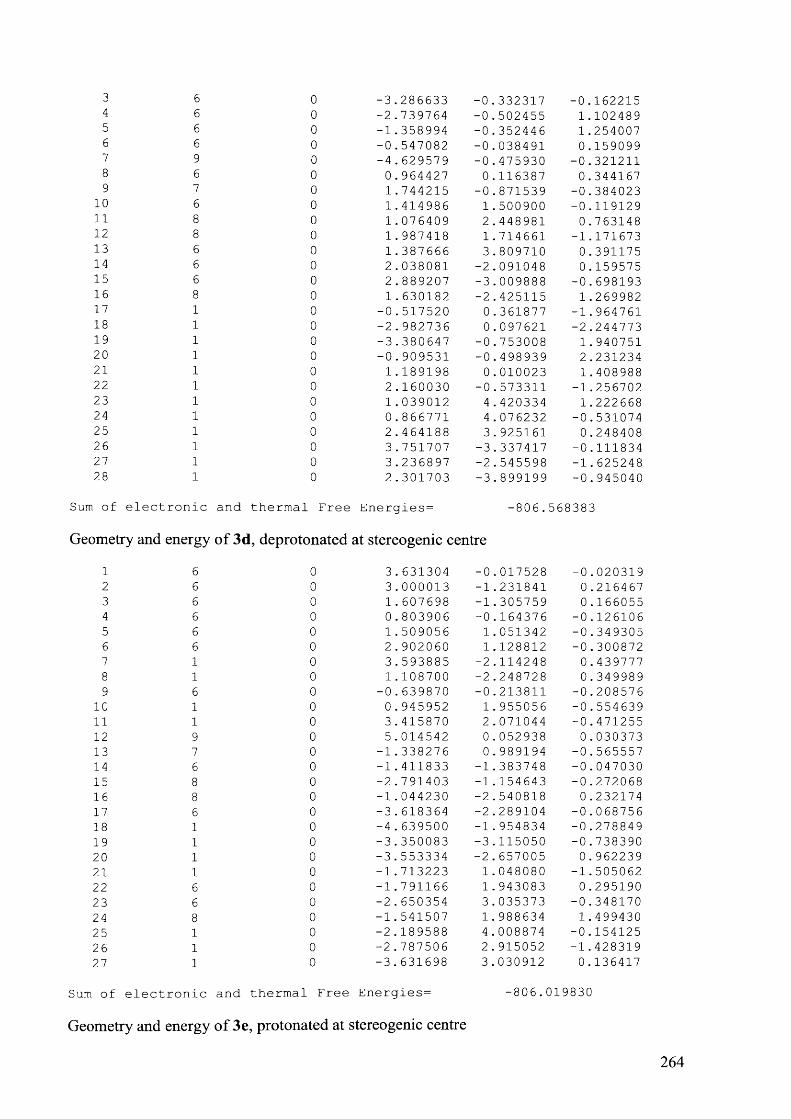
3 6 0 -3 .286633 -0 . 332317 -0.1622154 6 0 -2 .739764 -0.502455 1.1024895 6 0 -1.358994 -0 . 352446 1.2540076 6 0 -0.547082 -0 .038491 0 .1590997 9 0 -4 . 629579 -0 . 475930 -0.3212118 6 0 0 . 964427 0 .116387 0.3441679 7 0 1.744215 -0.871539 -0.384023
10 6 0 1.414986 1.500900 -0 .11912911 8 0 1.076409 2 .448981 0.76314812 8 0 1.987418 1.714661 -1.17167313 6 0 1.387666 3 .809710 0.39117514 6 0 2 . 038081 -2 .091048 0 .15957515 6 0 2.889207 -3.009888 -0 . 69819316 8 0 1.630182 -2 .425115 1.26998217 1 0 -0 .517520 0.361877 -1. 96476118 1 0 -2.982736 0 .097621 -2.24477319 1 0 -3.380647 -0.753008 1.94075120 1 0 -0.909531 -0.498939 2.23123421 1 0 1.189198 0.010023 1.40898822 1 0 2.160030 -0 . 573311 -1.25670223 1 0 1.039012 4.420334 1.22266824 1 0 0.866771 4.076232 -0.53107425 1 0 2.464188 3.925161 0.24840826 1 0 3.751707 -3.337417 -0 .11183427 1 0 3.236897 -2 .545598 -1.62524828 1 0 2.301703 -3 .899199 -0.945040
. of electronic and thermal Free Energies= -806. 568383
Geometry and energy o f 3d, deprotonated at stereogenic centre
1 6 0 3.631304 -0 . 017528 -0 . 0203192 6 0 3.000013 -1.231841 0.2164673 6 0 1.607698 -1. 305759 0.1660554 6 0 0.803906 -0 .164376 -0 .1261065 6 0 1.509056 1.051342 -0.3493056 6 0 2.902060 1.128812 -0.3008727 1 0 3.593885 -2 .114248 0 .4397778 1 0 1.108700 -2.248728 0.3499899 6 0 -0.639870 -0 .213811 -0.208576
10 1 0 0.945952 1.955056 -0 .55463911 1 0 3.415870 2.071044 -0 .47125512 9 0 5.014542 0.052938 0.03037313 7 0 -1.338276 0.989194 -0 .56555714 6 0 -1.411833 -1.383748 -0.04703015 8 0 -2.791403 -1.154643 -0.27206816 8 0 -1.044230 -2.540818 0 .23217417 6 0 -3.618364 -2.289104 -0 .06875618 1 0 -4.639500 -1.954834 -0.27884919 1 0 -3.350083 -3.115050 -0 .73839020 1 0 -3.553334 -2 . 657005 0 . 96223921 1 0 -1.713223 1.048080 -1.50506222 6 0 -1.791166 1 . 943083 0.29519023 6 0 -2.650354 3.035373 -0 .34817024 8 0 -1.541507 1.988634 1.49943025 1 0 -2.189588 4.008874 -0 .15412526 1 0 -2 .787506 2.915052 -1. 42831927 1 0 -3 . 631698 3.030912 0 .136417
Sum of electronic and thermal Free Energies= -806.019830
Geometry and energy o f 3e, protonated at stereogenic centre
264

1 6 0 -0.793828 0.207665 -1.0532622 6 0 -2 .179683 0 .135255 -1.1934953 6 0 -2 . 961826 -0.137582 -0 .0698454 6 0 -2.379655 -0.341285 1.1802655 6 0 -0 . 990458 -0.265149 1. 3035086 6 0 -0 .186272 0.010327 0 .1938997 6 0 1. 335028 0.084037 0.3449348 7 0 2.041362 -0.946599 -0.3982459 6 0 1. 848747 1.441221 -0.133924
10 8 0 1.568637 2.410084 0 .74582811 8 0 2.418433 1.618768 -1.19451312 6 0 1.942058 3.751777 0 .36143413 6 0 2.262592 -2.185479 0 .13622614 6 0 3.045746 -3 .152024 -0 .73349615 8 0 1.846091 -2 .497626 1.24974116 17 0 -4 .710201 -0.230075 -0 .23762917 1 0 -0.185389 0 .418311 -1. 92884418 1 0 -2.647799 0 .289711 -2 .15946419 1 0 -2.999801 -0.562427 2 . 04192820 1 0 -0.530301 -0 .440923 2.27103021 1 0 1.577661 -0.030962 1.40504222 1 0 2.463259 -0 . 670009 -1.27521823 1 0 1.637077 4 .383097 1.19460324 1 0 1.420701 4 . 039332 -0.55420725 1 0 3.020654 3 .812367 0.20176926 1 0 3.904599 -3 .518022 -0.16461327 1 0 3.394515 -2 .712864 -1.67227128 1 0 2 .408741 -4 .012514 -0 . 958246
i of electronic and thermal Free Energies= -1166. 924404
imetry and energy o f 3e, deprotonated at stereogenic centre
l 6 0 -0.931686 -1.053752 -0.4510112 6 0 -2 . 322432 -1.109093 -0.4534243 6 0 -3 .060352 0 .005538 -0 . 0573824 6 0 -2.402748 1.167449 0 . 3453805 6 0 -1.010673 1.218173 0.3446476 6 0 -0.208519 0 . 112428 -0.0650167 6 0 1.234317 0.130138 -0 .1064828 7 0 1.944207 -1.076769 -0.4370739 6 0 2.118988 1 .233991 -0.104114
10 8 0 1.545917 2 .482516 0.14373411 8 0 3.347789 1.173568 -0.34283312 6 0 2.443709 3.582261 0.06600913 6 0 2 .011444 -2 .224170 0.29299414 6 0 3 . 031225 -3.244569 -0.21727315 8 0 1.286506 -2 .499388 1.25345516 17 0 -4.842044 -0 . 059112 -0 . 05284617 1 0 -0.384962 -1 . 939091 -0 .74920918 1 0 -2 . 828473 -2 . 020659 -0.75790719 1 0 -2.974093 2 . 034298 0.66549420 1 0 -0.526062 2 .129351 0.66568121 1 0 2.745038 -0.899895 -1. 03318722 1 0 1.843265 4 .468160 0.29305723 1 0 2.882947 3 . 674353 -0. 93382824 1 0 3.260845 3 .486050 0 .78917725 1 0 3.605980 -3.612404 0.63757626 1 0 3.718530 -2 .841855 -0 . 96872627 1 0 2.500957 -4.099957 -0.651050
[ of electronic and thermal Free Energies= -1166.377321
265
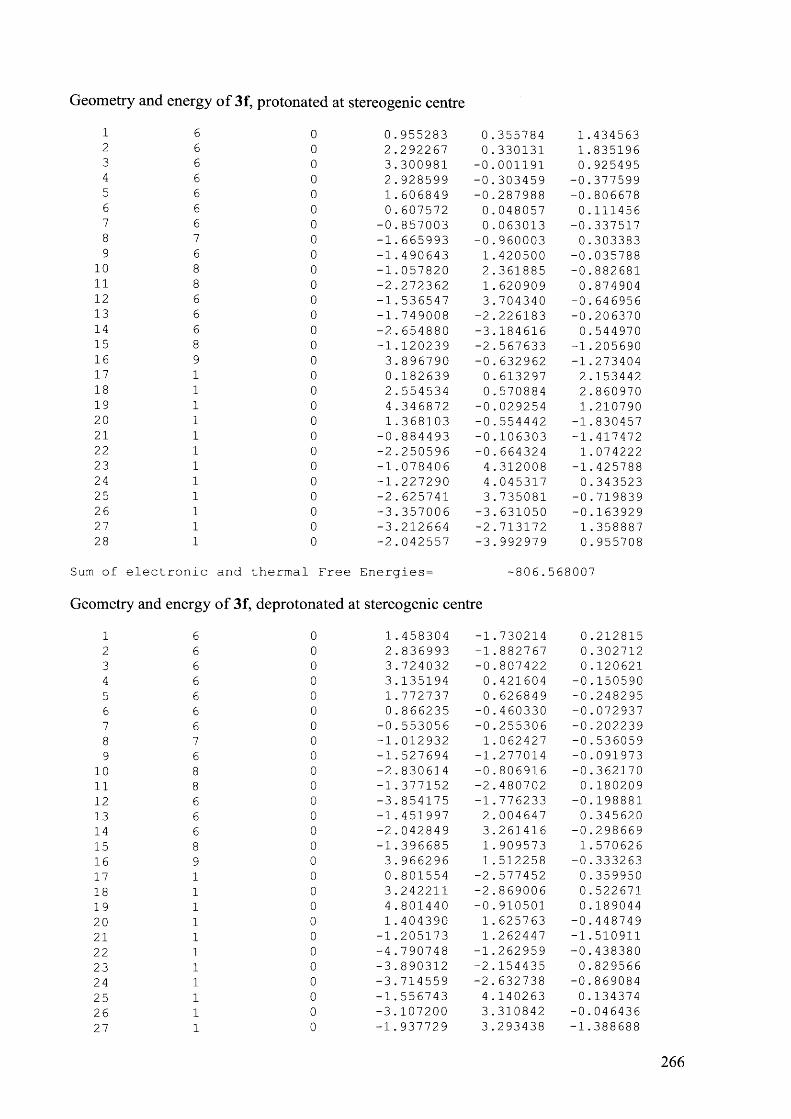
Geometry and energy o f 3f, protonated at stereogenic centre
1 6 0 0.955283 0.355784 1.4345632 6 0 2.292267 0.330131 1.8351963 6 0 3 . 300981 -0.001191 0.9254954 6 0 2.928599 -0 . 303459 -0.3775995 6 0 1.606849 -0 .287988 -0.8066786 6 0 0.607572 0 . 048057 0 .1114567 6 0 -0.857003 0 .063013 -0.3375178 7 0 -1.665993 -0 . 960003 0.3033839 6 0 -1.490643 1.420500 -0.035788
10 8 0 -1 .057820 2.361885 -0.88268111 8 0 -2.272362 1.620909 0 .87490412 6 0 -1.536547 3 .704340 -0 . 64695613 6 0 -1.749008 -2 .226183 -0.20637014 6 0 -2.654880 -3 .184616 0 . 54497015 8 0 -1.120239 -2 .567633 -1.20569016 9 0 3.896790 -0 . 632962 -1.27340417 1 0 0.182639 0 . 613297 2.15344218 1 0 2.554534 0.570884 2.86097019 1 0 4.346872 -0.029254 1.21079020 1 0 1.368103 -0.554442 -1.83045721 1 0 -0.884493 -0.106303 -1.41747222 1 0 -2.250596 -0.664324 1. 07422223 1 0 -1.078406 4.312008 -1.42578824 1 0 -1.227290 4.045317 0.34352325 1 0 -2 . 625741 3 . 735081 -0 .71983926 1 0 -3.357006 -3.631050 -0.16392927 1 0 -3.212664 -2.713172 1.35888728 1 0 -2.042557 -3 . 992979 0.955708
i of electronic and thermal Free Energies= -806. 568007
3metry and energy o f 3f, deprotonated at stereogenic centre
l 6 0 1 .458304 -1. 730214 0 .2128152 6 0 2 .836993 -1.882767 0 .3027123 6 0 3 . 724032 -0.807422 0 .1206214 6 0 3 .135194 0.421604 -0 .1505905 6 0 1 . 772737 0.626849 -0 .2482956 6 0 0 .866235 -0.460330 -0.0729377 6 0 -0 . 553056 -0.255306 -0.2022398 7 0 -1 .012932 1.062427 -0 . 5360599 6 0 -1 . 527694 -1.277014 -0 .091973
10 8 0 -2 .830614 -0 .806916 -0.36217011 8 0 -1.377152 -2 .480702 0 .18020912 6 0 -3.854175 -1.776233 -0 .19888113 6 0 -1.451997 2 . 004647 0.34562014 6 0 -2 . 042849 3.261416 -0.29866915 8 0 -1.396685 1 . 909573 1.57062616 9 0 3.966296 1.512258 -0.33326317 1 0 0.801554 -2 .577452 0.35995018 1 0 3.242211 -2 .869006 0 . 52267119 1 0 4.801440 -0.910501 0.18904420 1 0 1.404390 1.625763 -0 .44874921 1 0 -1.205173 1.262447 -1.51091122 1 0 -4 .790748 -1.262959 -0.43838023 1 0 -3.890312 -2 .154435 0.82956624 1 0 -3.714559 -2.632738 -0 .86908425 1 0 -1.556743 4.140263 0.13437426 1 0 -3.107200 3.310842 -0.04643627 1 0 -1. 937729 3.293438 -1.388688
266
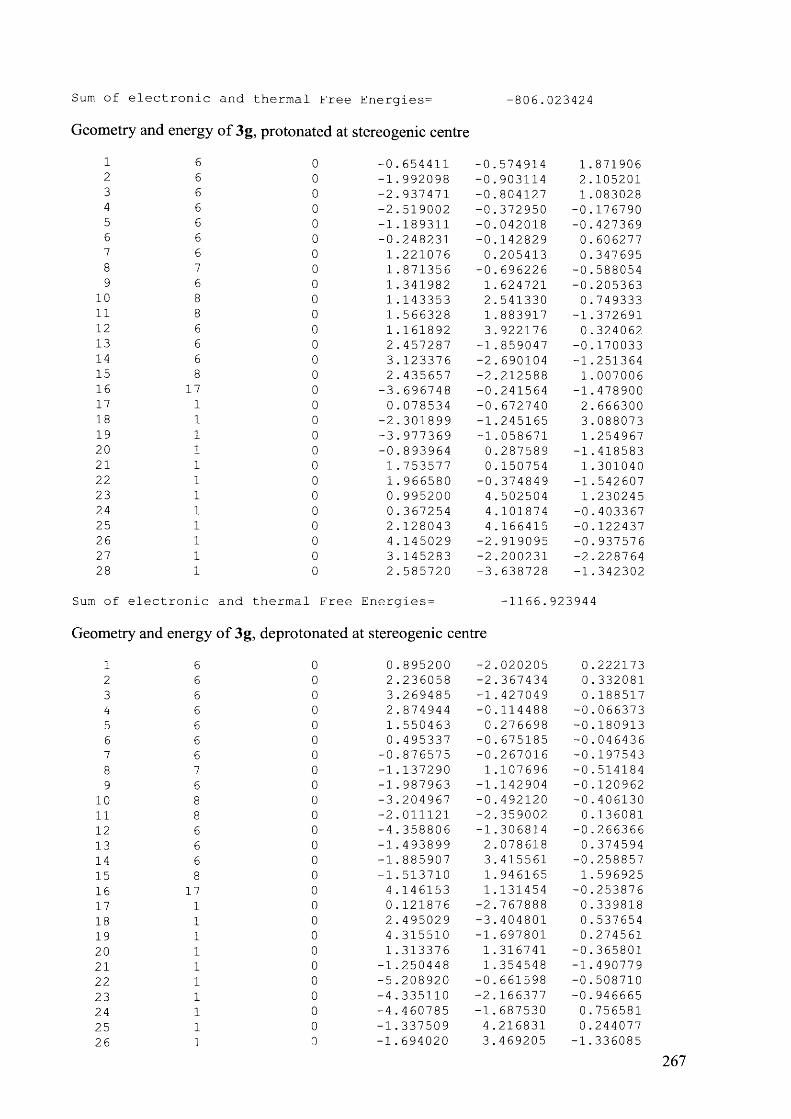
Sum of electronic and thermal Free Energies= -806.023424
Geometry and energy o f 3g, protonated at stereogenic centre
1 6 0 -0 . 654411 -0 .574914 1.8719062 6 0 -1. 992098 -0 . 903114 2.1052013 6 0 -2.937471 -0.804127 1.0830284 6 0 -2.519002 -0.372950 -0.1767905 6 0 -1.189311 -0.042018 -0 . 4273696 6 0 -0.248231 -0.142829 0.6062777 6 0 1.221076 0.205413 0.3476958 7 0 1.871356 -0.696226 -0 . 5880549 6 0 1.341982 1.624721 -0 .205363
10 8 0 1.143353 2.541330 0 .74933311 8 0 1.566328 1. 883917 -1. 37269112 6 0 1.161892 3.922176 0.32406213 6 0 2 .457287 -1.859047 -0.17003314 6 0 3.123376 -2.690104 -1.25136415 8 0 2.435657 -2 .212588 1.00700616 17 0 -3.696748 -0 .241564 -1.47890017 1 0 0.078534 -0 . 672740 2.66630018 1 0 -2.301899 -1.245165 3.08807319 1 0 -3.977369 -1.058671 1.25496720 1 0 -0.893964 0.287589 -1.41858321 1 0 1 . 753577 0.150754 1.30104022 1 0 1.966580 -0.374849 -1.54260723 1 0 0.995200 4.502504 1.23024524 1 0 0.367254 4.101874 -0.40336725 1 0 2.128043 4.166415 -0 .12243726 1 0 4.145029 -2.919095 -0.93757627 1 0 3.145283 -2 .200231 -2.22876428 1 0 2.585720 -3 . 638728 -1.342302
a of electronic and thermal Free Energies= -1166. 923944
ometry and energy o f 3g, deprotonated at stereogenic centre
l 6 0 0.895200 -2 . 020205 0.2221732 6 0 2.236058 -2 .367434 0 . 3320813 6 0 3 .269485 -1. 427049 0.1885174 6 0 2 .874944 -0 .114488 -0.0663735 6 0 1.550463 0 .276698 -0 .1809136 6 0 0.495337 -0 . 675185 -0.0464367 6 0 -0.876575 -0 .267016 -0 .1975438 7 0 -1.137290 1 .107696 -0.5141849 6 0 -1.987963 -1.142904 -0.120962
10 8 0 -3.204967 -0.492120 -0 .40613011 8 0 -2 .011121 -2 . 359002 0 .13608112 6 0 -4.358806 -1.306814 -0 .26636613 6 0 -1.493899 2 .078618 0.37459414 6 0 -1.885907 3 .415561 -0 .25885715 8 0 -1.513710 1. 946165 1.59692516 17 0 4.146153 1.131454 -0.25387617 1 0 0.121876 -2 .767888 0.33981818 1 0 2.495029 -3 .404801 0.53765419 1 0 4.315510 -1.697801 0 .27456120 1 0 1.313376 1.316741 -0 .36580121 1 0 -1.250448 1.354548 -1.49077922 1 0 -5 .208920 -0.661598 -0.50871023 1 0 -4.335110 -2 .166377 -0.94666524 1 0 -4.460785 -1. 687530 0 . 75658125 1 0 -1.337509 4 .216831 0.24407726 1 0 -1.694020 3 .469205 -1. 336085
267

27 1 0 -2.954218 3.581050 -0.083974
Sum of electronic and thermal Free Energies= -1166.380928
Geometry and energy o f 3h, protonated at stereogenic centre
1 6 0 -0.391865 -0 . 221373 1.3550342 6 0 -1.783202 -0.280174 1.2517483 6 0 -2.394065 -0 .097146 0.0096014 6 0 -1.614058 0.142495 -1.1286695 6 0 -0 .227509 0 .199065 -1.0173906 6 0 0.394956 0 . 021194 0.2265797 6 0 1.920160 0 . 078155 0.3496918 7 0 2.596427 -0.964049 -0.4032149 6 0 2.441107 1.427868 -0 .144815
10 8 0 2.165823 2.406363 0 . 72465111 8 0 3 . 012816 1.589185 -1.20649112 6 0 2.549960 3 .742532 0.32911613 6 0 2.790006 -2.210598 0 .12634314 6 0 3.551646 -3 .190954 -0 .74634215 8 0 2.365116 -2 .515675 1.23831716 6 0 -3.893471 -0.113804 -0.12063617 9 0 -4.505060 -0 . 672337 0.95064818 9 0 -4.403030 1.143633 -0 .24923419 9 0 -4.302468 -0 .802100 -1.21811920 1 0 0.083788 -0.385160 2.31678821 1 0 -2.385638 -0 .478337 2 .13112322 1 0 -2 . 088877 0 .280204 -2 .09462323 1 0 0.372176 0 .378918 -1.90537224 1 0 2.180294 -0 . 033768 1.40620225 1 0 3 .027753 -0 . 690196 -1.27663726 1 0 2.246905 4.383158 1.15574227 1 0 2 . 033094 4.024975 -0.59056028 1 0 3.629395 3 .793473 0.17236429 1 0 4 .405724 -3.572771 -0 .18062830 1 0 3.905190 -2.757919 -1.68610931 1 0 2.898197 -4 . 039529 -0.968819
Sum of electronic and thermal Free Energies^ -1044.379636
Geometry and energy o f 3h, deprotonated at stereogenic centre
1 6 0 0 . 547249 1 .048923 -0 . 3702592 6 0 1. 931275 1.109372 -0.3343743 6 0 2.697784 -0 . 041587 -0.0813264 6 0 2.015399 -1.251230 0.1535105 6 0 0.632440 -1 . 320276 0.1195786 6 0 -0.171569 -0 .167381 -0 .1541047 6 0 -1.601336 -0 .200221 -0.2326018 6 0 4 .172422 0 . 027277 0 . 0171959 9 0 4.647701 0 .191764 1.306016
10 9 0 4.801573 -1.104516 -0 .43213911 9 0 4.715788 1.068975 -0 . 68509412 7 0 -2 .288189 1. 013542 -0 .57309713 6 0 -2.393422 -1.368154 -0 .06005914 8 0 -3.759706 -1.124590 -0.28464715 8 0 -2 . 032975 -2 .519525 0.23045516 6 0 -4.605489 -2.245184 -0.06688217 6 0 -2 . 844864 1.890012 0.31132518 6 0 -3. 677665 3.004206 -0 . 32618119 8 0 -2 . 713380 1.838809 1. 53262820 1 0 -0 .011780 1.957783 -0.56333821 1 0 2 . 427670 2.060308 -0.507159
268
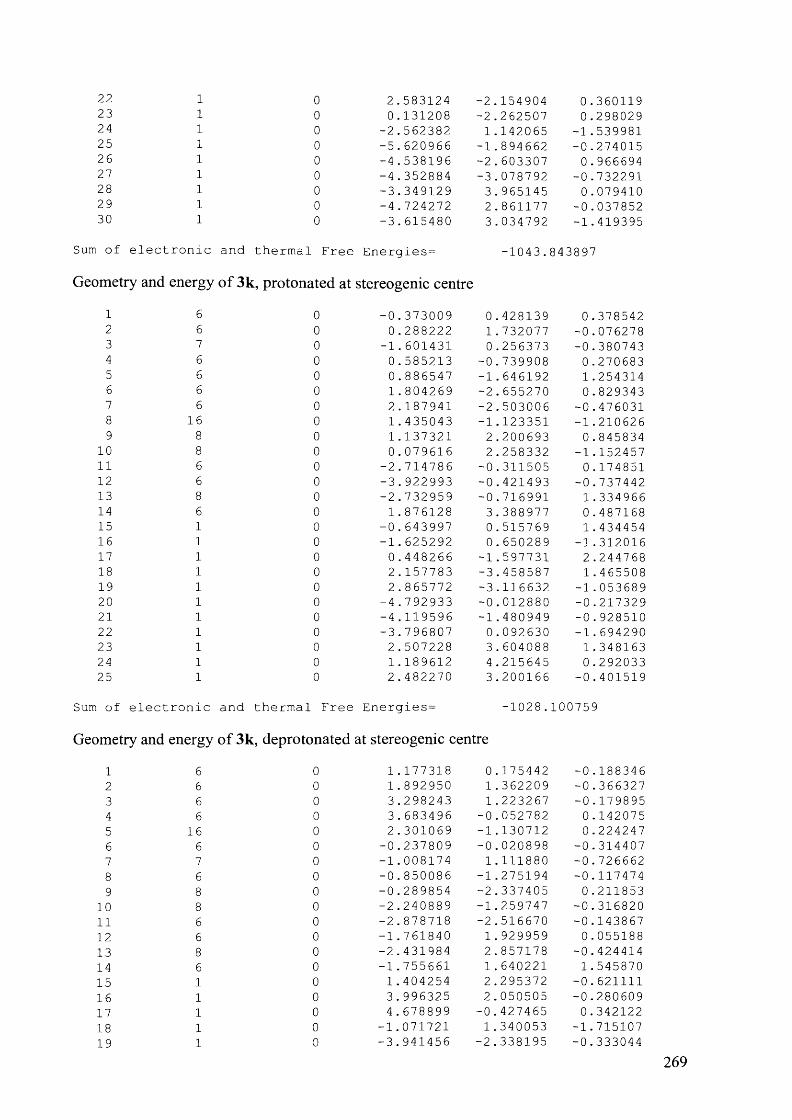
22 1 0 2.583124 -2.154904 0 .36011923 1 0 0.131208 -2 .262507 0 .29802924 1 0 -2.562382 1.142065 -1.53998125 1 0 -5 . 620966 -1 .894662 -0 .27401526 1 0 -4 . 538196 -2.603307 0 .96669427 1 0 -4 . 352884 -3.078792 -0 .73229128 1 0 -3 .349129 3.965145 0 .07941029 1 0 -4 . 724272 2.861177 -0.03785230 1 0 -3.615480 3.034792 -1.419395
Sum of electronic and thermal Free Energies=
Geometry and energy o f 3k, protonated at stereogenic centre
-1043.843897
1 6 0 -0 . 373009 0 . 428139 0.3785422 6 0 0 .288222 1. 732077 -0.0762783 7 0 -1.601431 0 .256373 -0.3807434 6 0 0.585213 -0.739908 0 .2706835 6 0 0.886547 -1.646192 1.2543146 6 0 1.804269 -2.655270 0.8293437 6 0 2.187941 -2.503006 -0 .4760318 16 0 1.435043 -1.123351 -1.2106269 8 0 1.137321 2.200693 0 .845834
10 8 0 0.079616 2.258332 -1 .15245711 6 0 -2.714786 -0.311505 0.17485112 6 0 -3.922993 -0 . 421493 -0.73744213 8 0 -2.732959 -0 .716991 1.33496614 6 0 1.876128 3 . 388977 0.48716815 1 0 -0 . 643997 0 . 515769 1.43445416 1 0 -1.625292 0.650289 -1 .31201617 1 0 0.448266 -1.597731 2.24476818 1 0 2 . 157783 -3.458587 1.46550819 1 0 2.865772 -3.116632 -1. 05368920 1 0 -4.792933 -0 .012880 -0 .21732921 1 0 -4.119596 -1.480949 -0 . 92851022 1 0 -3.796807 0.092630 -1 .69429023 1 0 2 .507228 3 . 604088 1.34816324 1 0 1 .189612 4.215645 0.29203325 1 0 2 .482270 3.200166 -0 .401519
1 of electronic and thermal Free Energies= -1028. 100759
)metry and energy o f 3k, deprotonated at stereogenic centre
l 6 0 1 . 177318 0.175442 -0 .1883462 6 0 1.892950 1.362209 -0 .3663273 6 0 3.298243 1.223267 -0 .1798954 6 0 3.683496 -0.052782 0.1420755 16 0 2.301069 -1 . 130712 0.2242476 6 0 -0.237809 -0 . 020898 -0.3144077 7 0 -1 . 008174 1.111880 -0.7266628 6 0 -0.850086 -1.275194 -0.1174749 8 0 -0.289854 -2 . 337405 0.211853
10 8 0 -2.240889 -1 .259747 -0.31682011 6 0 -2 .878718 -2 .516670 -0 .14386712 6 0 -1.761840 1 . 929959 0.05518813 8 0 -2 .431984 2.857178 -0.42441414 6 0 -1.755661 1 . 640221 1.54587015 1 0 1.404254 2 .295372 -0.62111116 1 0 3 . 996325 2.050505 -0 .28060917 1 0 4.678899 -0.427465 0.34212218 1 0 -1.071721 1.340053 -1.71510719 1 0 -3. 941456 -2.338195 -0.333044
269
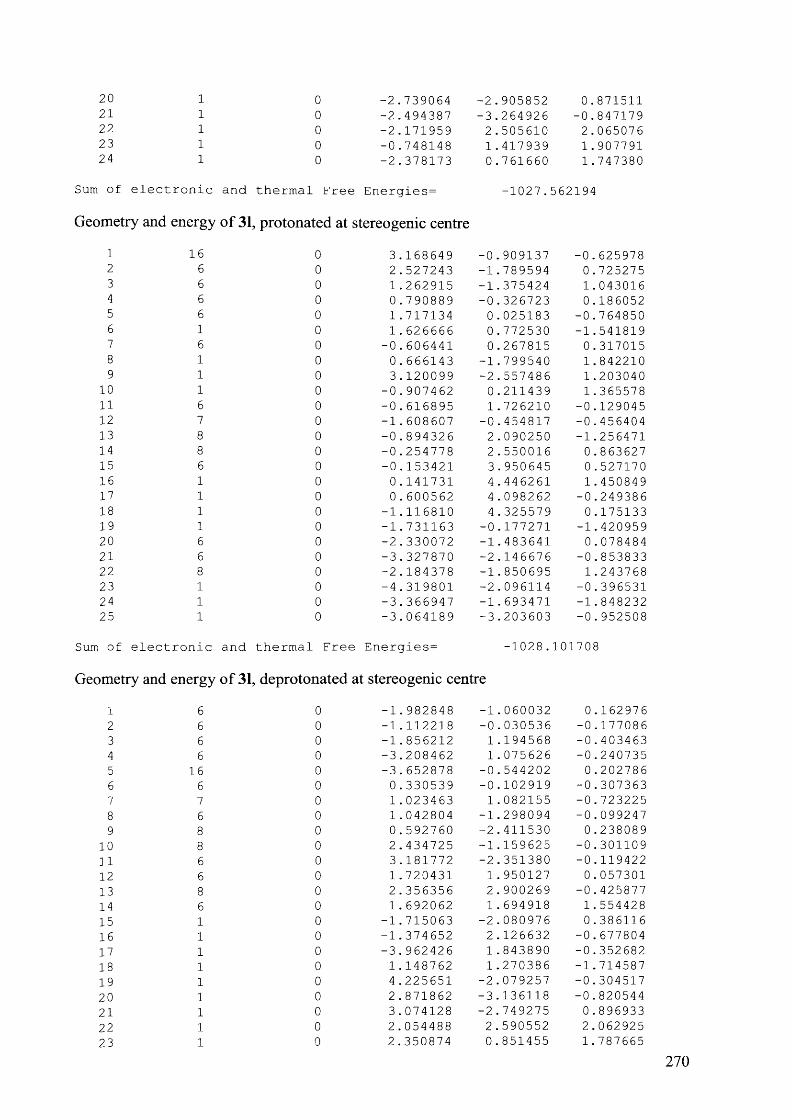
2021222324
■2 .739064 ■2 .494387 -2 .171959 -0 .748148 -2 .378173
■2 . 905852 •3 .264926 2 . 505610 1.417939 0.761660
0 .871511 -0.847179 2.065076 1.907791 1.747380
Sum of electronic and thermal Free Energies=
Geometry and energy o f 31, protonated at stereogenic centre
-1027 . 562194
1 16 0 3 .168649 -0 . 909137 -0.6259782 6 0 2 . 527243 -1.789594 0 . 7252753 6 0 1.262915 -1. 375424 1.0430164 6 0 0 .790889 -0 . 326723 0 .1860525 6 0 1.717134 0 . 025183 -0.7648506 1 0 1. 626666 0.772530 -1.5418197 6 0 -0.606441 0.267815 0 .3170158 1 0 0.666143 -1 .799540 1.8422109 1 0 3.120099 -2 . 557486 1.203040
10 1 0 -0.907462 0.211439 1.36557811 6 0 -0.616895 1. 726210 -0 .12904512 7 0 -1.608607 -0 . 454817 -0.45640413 8 0 -0.894326 2 .090250 -1.25647114 8 0 -0 .254778 2 . 550016 0.86362715 6 0 -0 .153421 3 . 950645 0 .52717016 1 0 0.141731 4.446261 1.45084917 1 0 0.600562 4.098262 -0 .24938618 1 0 -1.116810 4 . 325579 0.17513319 1 0 -1.731163 -0 .177271 -1. 42095920 6 0 -2.330072 -1.483641 0.07848421 6 0 -3.327870 -2 . 146676 -0.85383322 8 0 -2.184378 -1. 850695 1.24376823 1 0 -4.319801 -2 .096114 -0 .39653124 1 0 -3.366947 -1 . 693471 -1. 84823225 1 0 -3.064189 -3 .203603 -0.952508
1 of electronic and thermal Free Energies= -1028 .101708
)metry and energy o f 31, deprotonated at stereogenic centre
i 6 0 -1.982848 -1.060032 0 .1629762 6 0 -1.112218 -0 . 030536 -0 .1770863 6 0 -1.856212 1 .194568 -0 .4034634 6 0 -3.208462 1. 075626 -0.2407355 16 0 -3 . 652878 -0 .544202 0.2027866 6 0 0.330539 -0 .102919 -0.3073637 7 0 1.023463 1 . 082155 -0 . 7232258 6 0 1 . 042804 -1.298094 -0 .0992479 8 0 0 .592760 -2 .411530 0 .238089
10 8 0 2.434725 -1.159625 -0.30110911 6 0 3.181772 -2 . 351380 -0 .11942212 6 0 1.720431 1. 950127 0.05730113 8 0 2.356356 2 . 900269 -0.42587714 6 0 1.692062 1 . 694918 1.55442815 1 0 -1.715063 -2 . 080976 0.38611616 1 0 -1.374652 2 .126632 -0.67780417 1 0 -3. 962426 1 .843890 -0.35268218 1 0 1 .148762 1.270386 -1.71458719 1 0 4 .225651 -2 . 079257 -0.30451720 1 0 2.871862 -3 .136118 -0.82054421 1 0 3 .074128 -2 . 749275 0.89693322 1 0 2.054488 2.590552 2.06292523 1 0 2.350874 0.851455 1.787665
270

24 0 . 690249 1.428284 1.901328
Sum of electronic and thermal Free Energies^
Geometry and energy o f 6e, protonated at stereogenic centre
-1027.556639
1 6 0 -0.106941 0.527701 -0 .9631522 6 0 -1 .479871 0 .344762 -1.1012423 6 0 -2.237525 -0.094162 -0 . 0076484 6 0 -1.616836 -0 . 352882 1.2158525 6 0 -0.238083 -0.167973 1.3455956 6 0 0.526322 0 .279251 0.2638227 6 0 -3.728765 -0.240498 -0.1536068 9 0 -4.077612 -0.741360 -1.3657229 9 0 -4 .265459 -1.055605 0.785712
10 9 0 -4.366864 0.958644 -0.03779311 6 0 2 . 033017 0.486624 0 .41826012 7 0 2.820497 -0 . 422048 -0.39197313 6 0 2.446739 1. 924816 0 . 03440714 7 0 1. 921310 2.906708 0 .81098315 8 0 3.210342 2 .148019 -0.90006916 6 0 3.099796 -1.688422 0.04147417 6 0 4 . 021741 -2.504999 -0 .84473818 8 0 2.618673 -2.139580 1.07958819 1 0 0.476939 0.861952 -1.81635420 1 0 -1.961877 0.537861 -2.05388421 1 0 -2.199289 -0 .711820 2 .05714022 1 0 0.250434 -0 . 406589 2.28553023 1 0 2 .289127 0 .319957 1.47194924 1 0 3.350837 0.010263 -1.14054625 1 0 1.198297 2.716192 1.48846426 1 0 2.101598 3.866544 0.55341027 1 0 4.866918 -2.853702 -0.24506528 1 0 4.395494 -1.952765 -1.71110429 1 0 3.478599 -3 .388466 -1.192683
i of electronic and thermal Free Energies= -985.,225524
imetry and energy o f 6e, deprotonated at stereogenic centre
i 6 0 -0 . 046912 -0.803961 -0.5306452 6 0 -1 .416219 -0.990034 -0.5444353 6 0 -2.288260 -0 . 040084 0.0268054 6 0 -1.720975 1.096437 0.6268775 6 0 -0.347293 1.290936 0 . 6383006 6 0 0 .560738 0.367978 0 . 0252837 6 0 -3 . 754536 -0.212544 -0 . 0568088 9 0 -4 . 155456 -1.519593 0.0171719 9 0 -4 . 438734 0 .454737 0.921849
10 9 0 -4 .308909 0.246602 -1.24132911 6 0 1.974075 0.575408 -0 . 03421312 7 0 2.850604 -0.510361 -0.35721413 6 0 2.676540 1.820198 -0.10522114 7 0 1.987765 3.047469 0 .01587815 8 0 3.919460 1.880071 -0.32009616 6 0 2 . 964482 -1.711101 0.27394917 6 0 4 . 152984 -2 .558006 -0 .18262318 8 0 2 .167667 -2 .155188 1.10700019 1 0 0 . 588260 -1 .568180 -0.96018520 1 0 -1. 824575 -1.889507 -0 . 99708021 1 0 -2.362675 1. 822032 1.11899222 1 0 0 . 046976 2 .133329 1.19482423 1 0 3.689639 -0 .169602 -0 .817908
271

24 1 0 1.028399 3.051917 -0.31240325 1 0 2.549427 3.788005 -0.38788826 1 0 4.674391 -2.927666 0.70530627 1 0 4.860708 -2.015936 -0.81833228 1 0 3.783979 -3.430272 -0.734038
Sum of electronic and thermal Free Energies= -984.679563
5.4.2 D eterm in ation o f k gb for A m fepram one and Cathinone
The rate constants for general-base catalysed H/D exchange of amfepramone and cathinone
(Section 5.2.4.2) were obtained from the data reported by Reist et al.9 This data is reproduced
in Table 5.9.
Table 5.9: Rate constants o f H/D exchange for amfepramone and cathinone from reference 9,
in D20 phosphate buffers o f pD 7 .4 ,1= 0.43, at 37 °C.
phosphate conc. / M [HPO42 ] conc. / M
^ d e u t / S
Amfepramone Cathinone
0.00067 0.00041 1.50 x 10'7 -
0.0013 0.00079 2.72 x 10‘6 -
0.0020 0.0012 3.33 x 10'6 -
0.013 0.008 3.06 x 10'5 -
0.067 0.041 1.61 x 10'4 4.95 X 10‘5
0.100 0.061 - 6.50 x 10‘5
0.133 0.081 3.56 x 10⁻⁴ 8.11 x 10'5
0.167 0.102 - 9.78 x 10'5
0.200 0.122 6.47 x 10‘4 1.30 x 10⁻⁴
From the data displayed in Table 5.9, the rate constant of H/D exchange was plotted as a
function o f basic buffer component (Figure 5.15 and Figure 5.16). From these plots, kgb and
ko were obtained for amfepramone and cathinone.
272

8.0x10
6.0x10 -
4.0x10 -
2.0x10 -
0.0 .
0.00 0.03 0.06 0.09
[HPO ]2' / M
0.12 0.15
Figure 5.15: Variation o f kdeut of amfepramone with [HPO42 ] at 37 °C, pD
7 .4 ,7= 0 .43 . fcgb = (5.09 ± 0.27) x 10'3, k> = (-1.34 ± 1.54) x 10'5.
1.6x1 O'* -i
1.2x10
w 8.0x10 ;
4.0x10 -
0.00.00 0.03 0.06 0.09 0.12 0.15
[HPO t / M
Figure 5.16: Variation o f A:deut o f cathinone with [H P042'] at 37 °C, pD 7.4
/ = 0.43. kgh = (9.80 ± 0.87) x 10'4, k0' = (4.37 ± 7.48) x 10"6.
273

5.5 References
1. Nakata, K.; Fujio, M.; Nishimoto, K.; Tsuno, Y., Journal o f Physical Organic Chemistry 2010, 23 (11), 1057-1065.
2. Hoefnagel, A. J.; Hoefnagel, M. A.; Wepster, B. M., Journal o f the American Chemical Society 1976, 98 (20), 6194-6197.
3. Taagepera, M.; Summerhays, K. D.; Hehre, W. J.; Topsom, R. D.; Pross, A.; Radom, L.; Taft, R. W., Journal o f Organic Chemistry 1981, 46 (5), 891-903.
4. Maskill, H., The Physical Basis o f Organic Chemistry. Oxford Science Publications: Oxford, 1985; p 261-263.
5. Hammond, G. S., Journal o f the American Chemical Society 1955, 77 (2), 334-338.6. Xu, J.; Stevenson, J., Journal o f Chemical Information and Computer Sciences 2000,
40 (5), 1177-1187.7. Lameijer, E. W.; Kok, J. N.; Back, T.; IJzerman, A. P., Journal o f Chemical
Information and Modeling 2006, 46 (2), 553-562.8. Testa, B.; Carrupt, P. A.; Gal, J., Chirality 1993, 5 (3), 105-111.9. Reist, M.; Christiansen, L. H.; Christoffersen, P.; Carrupt, P. A.; Testa, B., Chirality
1995, 7(6), 469-473.10. Frisch, M. J.; Trucks, G. W.; Schlegel, H. B.; Scuseria, G. E.; Robb, M. A.;
Cheeseman, J. R.; Montgomery, J., J.A.; Vreven, T.; Kudin, K. N.; Burant, J. C.; Millam, J. M.; Iyengar, S. S.; Tomasi, J.; Barone, V.; Mennucci, B.; Cossi, M.; Scalmani, G.; Rega, N.; Petersson, G. A.; Nakatsuji, H.; Hada, M.; Ehara, M.; Toyota, K.; Fukuda, R.; Hasegawa, J.; Ishida, M.; Nakajima, T.; Honda, Y.; Kitao, O.; Nakai, H.; Klene, M.; Li, X.; Knox, J. E.; Hratchian, H. P.; Cross, J. B.; Bakken, V.; Adamo, C.; Jaramillo, J.; Gomperts, R.; Stratmann, R. E.; Yazyev, O.; Austin, A. J.; Cammi, R.; Pomelli, C.; Ochterski, J. W.; Ayala, P. Y.; Morokuma, K.; Voth, G. A.; Salvador, P.; Dannenburg, J. J.; Zakrzewski, V. G.; Dapprich, S.; Daniels, A. D.; Strain, M. C.; Farkas, O.; Malick, D. K.; Rabuck, A. D.; Raghavachari, K.; Foresman, J. B.; Ortiz, J. V.; Cui, Q.; Baboul, A. G.; Clifford, S.; Cioslowski, J.; Stefanov, B. B.; Liu, G.; Liashenko, A.; Piskorz, P.; Komaromi, I.; Martin, R. L.; Fox, D. J.; Keith, T.; Al- Laham, M. A.; Peng, C. Y.; Nanayakkara, A.; Challacombe, M.; Gill, P. M. W.; Johnson, B.; Chen, W.; Wong, M. W.; Gonzalez, C.; Pople, J. A. 03. Gaussian, E01. Revision, Gaussian, Inc.: W allingford CT, 2004.
11. Schmidt, M. W.; Baldridge, K. K.; Boatz, J. A.; Elbert, S. T.; Gordon, M. S.; Jensen, J. H.; Koseki, S.; Matsunaga, N.; Nguyen, K. A.; Su, S. J.; Windus, T. L.; Dupuis, M.; Montgomery, J. A., Journal o f Computational Chemistry 1993 ,14 (11), 1347-1363.
12. Bode, B. M.; Gordon, M. S., Journal o f Molecular Graphics & Modelling 1998, 16 (3), 133-138.
274

6 Epilogue
6.1 General Conclusions
This thesis describes our endeavours to improve our understanding of the many factors
affecting configurational instability, specifically addressing the potential problem of
enantiopure compounds undergoing racemisation after being administered as a dmg.
Literature studies suggested that the threat of racemisation under aqueous conditions is
greatest for compounds with a stereogenic centre o f the type R ” R’RC-H. If adjacent R groups
can stabilise a negative charge, then an anion may be formed by deprotonation at the
stereogenic centre and any enantiopurity will be lost as a result. Research by the Testa group
classified specific groups as increasing or decreasing configurational stability. A wealth of
literature from the Richard group into how adjacent functional groups influence the pKa of
carbon acids also provided insight into how functional groups bound to a stereogenic centre
will affect the lability o f the proton.
The goal o f this project was thus to test the conclusions from these studies as well as to
expand on them, through determining rate constants for the H/D exchange reactions of
selected compounds. From these rate constants, it was hoped that mechanisms and substituent
effects for the process could be elucidated. To do so, a range of experimental techniques and
methods in physical organic chemistry were used.
The database mining studies outlined in Chapter 2 were undertaken with the intent of
exploring and categorising the structure o f stereogenic centres most commonly found in
pharmacologically-active compounds. To this end, the wealth of compounds found in the
databases under analysis (ISAC and IBEX databases, containing over 1 million and over half
a million compounds respectively) comprises a great resource. Specifically, the goal of this
part of our research was to assess which combinations of functional groups are frequently
found together around stereogenic centres and to identify frequently found combinations
thought to be at risk o f racemisation for further analysis. It became apparent that when so
many compounds containing stereogenic centres were under analysis, it would be possible to
find almost any combination o f substituents that could be imagined. As a result it was decided
to narrow down the analysis to the top 250 most frequently appearing combinations in each
database. In this selection, the majority o f stereogenic centres were not deemed to be
susceptible to in vivo racemisation. However, there were many regularly-appearing
combinations that did appear to be at risk o f configurational instability under the conditions
275

under investigation. In particular, the combination of adjacent carbonyl, nitrogen and aromatic
groups on a stereogenic was commonly found. As a result, this particular combination was
targeted for further investigation through physical experimentation.
In Chapter 3, specific rate constants for proton-deuterium exchange (as a model for
configurational instability of stereogenic centres carrying a relatively labile proton) were
determined for a series o f A-acetyl arylglycine methyl esters. The magnitude of these rate
constants showed that compounds containing stereogenic centres of this type are at risk of
undergoing racemisation under physiological conditions. The linear relationship between rate
constants for proton-deuterium exchange with basic buffer component showed that the
process under analysis is general-base catalysed. These results also broadly fit with the
assignments by Testa et al. of functional groups as promoting or retarding configurational
stability when adjacent a stereogenic centre. Hammett correlations showed that
electron-withdrawing groups increased rate constants of racemisation, through stabilisation of
a (developing) negative charge. Comparison of the rate constants for racemisation with rate
constants for proton-deuterium exchange allowed us to conclude that these two processes take
place via an SeI mechanism, consistent with the mechanism determined for similar structures.
For H/D exchange of A-acetyl phenylglycine methyl esters the best Hammett relationship was
found with o~ values. Rate constants for proton-deuterium exchange were also determined for
thiophene-substituted analogues, and were o f a magnitude that suggests that such compounds
are at risk of racemisation under physiological conditions. The rate constants for one of the
thiophene-containing compounds also suggests that a 2-thiophene moiety is more
electron-withdrawing than any o f the substituted-phenyl groups also analysed in Chapter 3.
Attempts to fit these heterocycle-containing analogues into the previously-mentioned
Hammett analysis using a values found in the literature proved successful.
Rate constants for proton-deuterium exchange for a set o f A-substituted phenylglycine amides
were determined in Chapter 4, for the purpose o f comparison with those determined for A-
acetyl phenylglycine methyl esters in Chapter 3. The rate constants determined in Chapter 4
suggest that the A-substituted phenylglycine amides investigated are not at risk of
configurational instability under physiological conditions. This dataset, in combination with
the data collected in Chapter 3, allowed for a direct comparison of the effects of an ester and
of an amide on configurational instability, and showed that an adjacent ester group will
destabilise a stereogenic centre o f type R ” R ’RC-H more than an amide group in the same
position. These findings are consistent with the assignments made by Testa et a l As with the
ester compounds analysed in Chapter 3, the amides investigated in Chapter 4 undergo
276

proton-deuterium exchange through general-base catalysis and via an SeI mechanism.
Variable-temperature work in Chapter 4 allowed for the determination of thermodynamic
activation parameters. The large positive enthalpy and negative entropy of activation found
were consistent with the SeI mechanism. The variable-temperature work also showed that
high-temperature kinetics could potentially be used for rapid screening, providing
approximate information on configurational instability at lower temperatures.
Chapter 5 used computational chemistry to relate experimental data with theoretical
calculations. Because the proton-deuterium exchange reactions examined in Chapters 3 and 4
were found to proceed through an SeI mechanism, it was suspected that the stability o f the
anion formed upon deprotonation at the stereogenic centre relative to the compound prior to
deprotonation could provide a good correlation with the rate at which proton-deuterium
exchange occurs. It was found that this calculated energy difference correlated well with the
rate constants of proton-deuterium exchange experimentally determined in Chapters 3 and 4,
when the PCM solvent model is applied. This relationship holds well for minor structural
changes, such as the modification of Hammett substituents, but less well for major structural
changes.
6.2 Outlook
It is hoped that the correlation between the computationally-calculated energy differences and
the experimentally-determined rate constants could be of significant use to the pharmaceutical
industry, by enabling the prediction of configurational instability in a compound only from
calculations. In order for this to become reality a great deal of further work would have to be
done. Foremost, the number of compounds for which rate constants o f proton-deuterium
exchange has been determined under conditions analogous to those used in Chapters 3 and 4
would need to be greatly expanded. Correlation with a greater number and a wider range of
structures would allow for increased confidence in the relationship. An increase in the range
of structures may also allow for the discovery o f a standard ‘offset’ for functional groups
which significantly change the electronic properties of the compound, such as the cation
found in the quaternary amines amfepramone and cathinone analysed in Chapter 5.