
FLEXIBILITY STRATEGIES FOR ENGINEER-TO - -ORCA
307
FLEXIBILITY STRATEGIES FOR ENGINEER-TO- ORDER CONSTRUCTION SUPPLY CHAINS by Jonathan Gosling A Thesis Submitted in Fulfilment o f the Requirements for the Degree o f Doctor o f Philosophy o f Cardiff University Logistics Systems Dynamics Group, Logistics and Operations Management Section of Cardiff Business School, Cardiff University
-
Upload
khangminh22 -
Category
Documents
-
view
0 -
download
0
Transcript of FLEXIBILITY STRATEGIES FOR ENGINEER-TO - -ORCA

FLEXIBILITY STRATEGIES FOR ENGINEER-TO- ORDER CONSTRUCTION SUPPLY CHAINS
by
Jonathan Gosling
A Thesis Submitted in Fulfilment o f the Requirements fo r the Degree o f Doctor o fPhilosophy o f Cardiff University
Logistics Systems Dynamics Group, Logistics and Operations Management Section o f Cardiff Business School, Cardiff University

UMI Number: U584527
All rights reserved
INFORMATION TO ALL USERS The quality of this reproduction is dependent upon the quality of the copy submitted.
In the unlikely event that the author did not send a complete manuscript and there are missing pages, these will be noted. Also, if material had to be removed,
a note will indicate the deletion.
Dissertation Publishing
UMI U584527Published by ProQuest LLC 2013. Copyright in the Dissertation held by the Author.
Microform Edition © ProQuest LLC.All rights reserved. This work is protected against
unauthorized copying under Title 17, United States Code.
ProQuest LLC 789 East Eisenhower Parkway
P.O. Box 1346 Ann Arbor, Ml 48106-1346

Ca r d iffUNIVERSITY
P R I F Y S G O L
Cae RDY[5>
CardiffBusiness
SchoolCardiff University
DECLARATION
This work has not previously been accepted in substance for any degree and is not concurrently,submitted in candidature for any degree.
S igned ............................................................. (candidate)
Date . . X l . f & f . U . ................
STATEMENT 1
This thesis is being submitted in partial fulfillment of the requirements for the degree of ...................PhD......
S igned .........................................................(candidate)
Date....................... ................
STATEMENT 2
This thesis is the result of my own independent work/investigation, except where otherwise stated. Other sources ate acknowledged by footnotes giving explicit references.
Signed (candidate)
Date ...(.7^6 . .1 .1 X ..............
STATEMENT 3
I hereby give consent for my thesis, if accepted, to be available for photocopying and for inter-library loan, and for tae-titte and summary to be made available to outside organisations.
Signed (candidate)
Date . . . 1 . 7 ................
ii

This thesis is dedicated to the memory o f Mark Rogers, who sadly passed away in 2006.
ABSTRACT
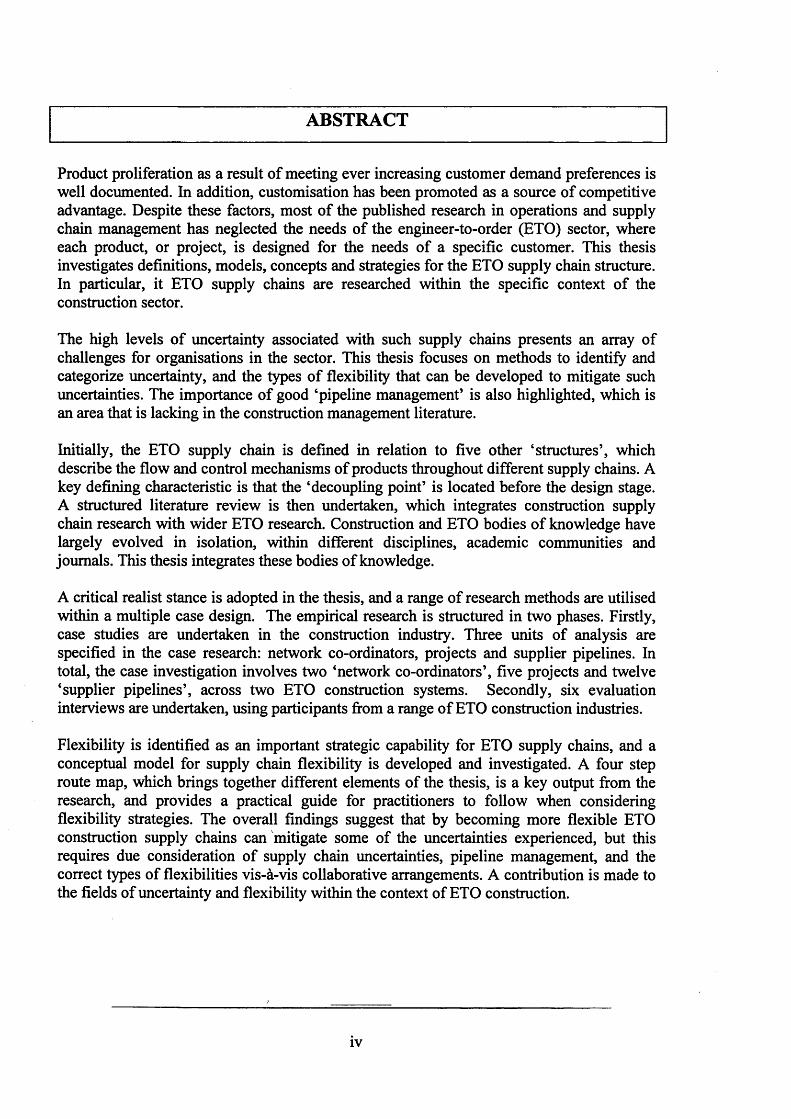
Product proliferation as a result of meeting ever increasing customer demand preferences is well documented. In addition, customisation has been promoted as a source of competitive advantage. Despite these factors, most of the published research in operations and supply chain management has neglected the needs of the engineer-to-order (ETO) sector, where each product, or project, is designed for the needs of a specific customer. This thesis investigates definitions, models, concepts and strategies for the ETO supply chain structure. In particular, it ETO supply chains are researched within the specific context of the construction sector.
The high levels of uncertainty associated with such supply chains presents an array of challenges for organisations in the sector. This thesis focuses on methods to identify and categorize uncertainty, and the types of flexibility that can be developed to mitigate such uncertainties. The importance of good ‘pipeline management’ is also highlighted, which is an area that is lacking in the construction management literature.
Initially, the ETO supply chain is defined in relation to five other ‘structures’, which describe the flow and control mechanisms of products throughout different supply chains. A key defining characteristic is that the ‘decoupling point’ is located before the design stage. A structured literature review is then undertaken, which integrates construction supply chain research with wider ETO research. Construction and ETO bodies of knowledge have largely evolved in isolation, within different disciplines, academic communities and journals. This thesis integrates these bodies of knowledge.
A critical realist stance is adopted in the thesis, and a range of research methods are utilised within a multiple case design. The empirical research is structured in two phases. Firstly, case studies are undertaken in the construction industry. Three units of analysis are specified in the case research: network co-ordinators, projects and supplier pipelines. In total, the case investigation involves two ‘network co-ordinators’, five projects and twelve ‘supplier pipelines’, across two ETO construction systems. Secondly, six evaluation interviews are undertaken, using participants from a range of ETO construction industries.
Flexibility is identified as an important strategic capability for ETO supply chains, and a conceptual model for supply chain flexibility is developed and investigated. A four step route map, which brings together different elements of the thesis, is a key output from the research, and provides a practical guide for practitioners to follow when considering flexibility strategies. The overall findings suggest that by becoming more flexible ETO construction supply chains can mitigate some of the uncertainties experienced, but this requires due consideration of supply chain uncertainties, pipeline management, and the correct types of flexibilities vis-a-vis collaborative arrangements. A contribution is made to the fields of uncertainty and flexibility within the context of ETO construction.

ACKNOWLEDGEMENTS
This PhD has not been completed in isolation, and I have lucky enough to receive support
from a range people. I wish to make the following acknowledgements:
• My principal supervisor, Professor Mohamed Naim, for expert guidance.
• The remainder of my supervision team, Dr Stephen Disney and Professor Bob Lark,
for their helpful comments and discussions.
• Colleagues in the Logistics and Operations Management section at Cardiff,
including those from research teams in the Innovative Manufacturing Research
Centre and the Logistics Systems Dynamics Group, for providing a supportive and
stimulating environment for research.
• The practitioners that have contributed to this research. Most notably, Nicholas
Fowler and Brian Moone for their valuable input.
• Professor Denis Towill, for sage advice and wise counsel
• My family and friends, for their support and encouragement.
• My wife, Heather, for understanding, and for making sacrifices to enable me to
complete this thesis.

TABLE OF CONTENTS
ABSTRACT........................................................................................................IV
ACKNOWLEDGEMENTS...............................................................................V
TABLE OF CONTENTS................................................................................. VI
TABLE OF FIGURES.......................................................................................X
LIST OF ABBREVIATIONS.........................................................................XII
CHAPTER 1......................................................................................................... 1
INTRODUCTION...................................................................................................................... 1
1.1 INDUSTRIAL AND RESEARCH CONTEXT......................................................................3
1.2 AIM AND RESEARCH QUESTIONS....................................................................................5
1.3 STRUCTURE OF THESIS........................................................................................................7
1.4 SUMMARY ................................................................................................................................ 12
CHAPTER 2 ....................................................................................................... 13
LITERATURE REVIEW........................................................................................................ 13
2. INTRODUCTION.....................................................................................................................14
2.1 SUPPLY CHAINS AND SUPPLY CHAIN MANAGEMENT...................................16
2.2 A TAXONOMY OF SUPPLY CHAIN STRUCTURES................................................. 23
2.3 THE ENGINEER-TO-ORDER SUPPLY CHAIN STRUCTURE.............................29
2.4 METHOD FOR THE STRUCTURED LITERATURE REVIEW ................................. 30
2.5 DEFINING THE ENGINEER-TO-ORDER SUPPLY CHAIN .....................................33
2.6 STRATEGIES FOR ETO SUPPLY CHAINS.....................................................................37
2.7 LEAN AND AGILE PARADIGMS AND THE ENGINEER-TO-ORDER SUPPLY
CHAIN......................................... 42
2.8 RESEARCH METHODOLOGY AND SECTORIAL ANALYSIS.................................. 45
2.9 SYNTHESIS............................................................................................................................... 49
2.10 IMPLICATIONS FOR THE THESIS.................................................................................52
2.11 SUPPLY CHAIN UNCERTAINTY...............................................................................52
2.12 SUPPLY CHAIN FLEXIBILITY......................................................................................59

2.13 CONFIRMING THE LITERATURE GAPS IN RELATION TO ETO
CONSTRUCTION SUPPLY CHAINS........................................................................................69
2.14 SUMMARY .............................................................................................................................. 70
CHAPTER 3.......................................................................................................72
METHODOLOGY...................................................................................................................72
3. INTRODUCTION....................................................................................................................... 73
3.1 RESEARCH PARADIGMS.....................................................................................................73
3.2 RESEARCH QUESTIONS..................................................................................................... 80
3.3 RESEARCH APPROACH...................................................................................................... 82
3.4 CASE RESEARCH METHODS............................................................................................86
3.5 SUMMARY ............................................. 93
CHAPTER 4.......................................................................................................95
RESEARCH DESIGN............................................................................................................. 95
4. INTRODUCTION.......................................................................................................................96
4.1 CASE STUDY DESIGN AND SELECTION......................................................................96
4.3 APPLICATION OF THE RESEARCH METHODS.......................................................105
4.4 VALIDITY................................................................................................................................ 115
4.5 SUMMARY.............................................................................................................................. 118
CHAPTER 5..................................................................................................... 120
A METHOD FOR IDENTIFYING AND CATEGORISING THE SOURCES OF
UNCERTAINTY IN ENGINEER-TO-ORDER SUPPLY CHAINS................................120
5. INTRODUCTION.....................................................................................................................121
5.1 METHOD OVERVIEW.........................................................................................................122
5.2 INDIVIDUAL PROJECT PROFILES............................................................................... 126
5.3 SYSTEM UNCERTAINTIES................................................................................................131
5.4 CATEGORISING SUPPLY CHAIN UNCERTAINTY.................................................. 134
5.5 USING A POSITIONING MATRIX TO EVALUATING PROJECT
UNCERTANTIES.......................................................................................................................... 143
5.6 DISCUSSION AND STATEMENT OF CONTRIBUTION..........................................144
5.7 CONCLUSION....................................................................................................................... 146

CHAPTER 6..................................................................................................... 148
PIPELINE IMPROVEMENT STRATEGIES FOR ENGINEER-TO-ORDER
CONSTRUCTION SUPPLY CHAINS................................................................................148
6. INTRODUCTION.....................................................................................................................149
6.1 METHOD OVERVIEW.........................................................................................................150
6.2 OVERVIEW OF THE PIPELINE...................................................................................... 151
5.3 ANALYSIS OF THE PIPELINE SURVEY....................................................................... 154
6.4 PROBLEMS IN THE PIPELINE....................................................................................... 165
6.5 SOURCES OF COMPETITIVE ADVANTAGE IN PIPELINES................................ 171
6.6 RECOMMENDATIONS FOR PIPELINE IMROVEMENT........................................ 180
6.7 DISCUSSION AND STATEMENT OF CONTRIBUTION..........................................183
6.8 CONCLUSION.......................................................................................................................184
CHAPTER 7 .....................................................................................................186
ACHIEVING FLEXIBILITY IN ENGINEER-TO-ORDER CONSTRUCTION SUPPLY
CHAINS.............................................................................................................. 186
7. INTRODUCTION.....................................................................................................................187
7.1 METHOD OVERVIEW.........................................................................................................189
7.2 VENDOR FLEXIBILITY.............................................................................................. 191
7.3 A PURCHASING MODEL FOR ENGINEER-TO-ORDER SUPPLY CHAINS... 199
7.4 INTEGRATING SUPPLY CHAIN FLEXIBILITY AND PURCHASING.................202
7.5 THE ROLE OF SUPPLY CHAIN FLEXIBILITY IN MITIGATING PROJECT
UNCERTAINTIES........................................................................................................................ 208
7.6 DISCUSSION AND STATEMENT OF CONTIBUTION............................................. 211
7.7 CONCLUSION.......................................................................................................................212
CHAPTER 8........................ 215
EVALUATION OF THE CASE RESEARCH....................................................................215
8. INTRODUCTION.....................................................................................................................216
8.1 METHOD OVERVIEW.........................................................................................................217
8.2 INTEGRATING THE CASE STUDY FINDINGS WITH THE EVALUATION
INTERVIEW FINDINGS............................................................................................................ 218

8.3 A FRAMEWORK FOR ACHIEVING APPROPRIATE FLEXIBILITIES TO
MITIGATE THE UNCERTAINTIES IN ETO CONSTRUCTION SUPPLY CHAINS 230
8.4 EVALUATION........................................................................................................................233
8.5 DISCUSSION AND STATEMENT OF CONTRIBUTION..........................................237
8.6 CONCLUSIONS.................................................................................................................... 238
CHAPTER 9.....................................................................................................240
CONCLUSIONS....................................................................................................................240
9. INTRODUCTION.................................................................................................................. 241
9.1 ANSWERS TO RESEARCH QUESTIONS.................................................................... 241
9.3 GENERALIZABILITY...........................................................................................................243
9.3 A SUMMARY OF RESEARCH FINDINGS IN RELATION TO THE PRIMARY AIM
OF THE THESIS.......................................................................................................................... 244
9.4 ACADEMIC CONTRIBUTIONS....................................................................................... 247
9.5 SUMMARY OF IMPLICATIONS FOR INDUSTRY..................................................... 252
9.6 LIMITATIONS........................................................................................................................252
9.7 FURTHER RESEARCH....................................................................................................... 253
9.8 CONCLUSIONS.....................................................................................................................255
REFERENCES ............................................................................... 256
APPENDICES..................................................................................................280
APPENDIX 1 - OVERALL PROJECT DESCRIPTION AND PROTOCOL................. 280
APPENDIX 2 - LOG OF INTERVIEWS FOR NETWORK CO-ORDINATORS 282
APPENDIX 3 - PROJECT UNCERTAINTY DATA COLLECTION PROTOCOL 285
APPENDIX 4 - THE PIPELINE SURVEY........................................................................287
APPENDIX 5 - INTERVIEW LOG FOR PIPELINE SURVEY.......................................293
APPENDIX 6 - INPUT-OUTPtJT DIAGRAM.................................... 294

TABLE OF FIGURES
CHAPTER 1Figure 1.1: Thesis structure.........................................................................................................8
Figure 1.2: Timings of the empirical phases of the research...................................................9
CHAPTER 2Figure 2.1: Venn diagram to show interaction between bodies of knowledge..................... 14
Figure 2.2: The six supply chain structures............................................................................ .24
Figure 2.3: Synthesis of structured literature review............................................................. .49
Figure 2.4: Conceptualisation of supply chain flexibility.......................................................65
CHAPTER 4Figure 4.1: Positioning of case research design.......................................................................97
Figure 4.2: The two ETO systems and the units of analysis.................................................. 99
Figure 4.3: Scope and depth of understanding offered by different units of analysis 100
Figure 4.4: The snowball sampling process and operational criteria for the different units of
analysis......................................................................................................................................102
CHAPTER 5Figure 5.1: The two ETO systems and the primary focus of Chapter 5.............................. 122
Figure 5.2: Flow of research activities underpinning Chapter 5,..........................................122
Figure 5.3: Method for identifying and categorising supply chain uncertainty.................. 124
Figure 5.4: The sources of uncertainty in ETO construction supply chains....................... 135
Figure 5.5: Cause and effect diagram for ETO construction uncertainties......................... 140
Figure 5.6: Relative importance of different uncertainties...................................................145
CHAPTER 6Figure 6.1: The two ETO systems and the primary focus of Chapter 6.............................. 149
Figure 6.2: Flow of research activities in Chapter 6..............................................................150
Figure 6.3: Generic pipeline activities and potential stockholding points.......................... 152
Figure 6.4: Order-cycle-time for pipelines plotted against variability.................................160
Figure 6.5: Most likely lead-times for individual pipelines..................................................162
Figure 6.6: Cumulative variability for individual pipelines..................................................163
Figure 6.7: Average variability and average lead-times for different pipeline activities...164
x

Figure 6.8: Causal modelling for problems in the pipeline..................................................167
Figure 6.9: Causal modelling for sources of competitive advantage.................................. 174
CHAPTER 7Figure 7.1: Conceptualisation of supply chain flexibility.................................................... 188
Figure 7.2: The two ETO systems and the focus of Chapter 7............................................ 189
Figure 7.3: Flow of research activities in Chapter 7,.............................................................190
Figure 7.4: A purchasing model for engineer-to-order supply chains................................201
Figure 7.5: Interaction between supply chain flexibility antecedents.................................203
Figure 7.6: Integration of supply chain flexibility and the purchasing mode.................... 208
CHAPTER 8Figure 8.1: Timeline of research activities and the focus of chapter 7,...............................216
Figure 8.2: A framework for achieving flexibility in ETO supply chains......................... 231
Figure 8.3: SWOT analysis.................................................................................................... 234
CHAPTER 9Figure 9.1: A framework for achieving flexibility in ETO supply chains with answers to
research questions..................................................................................................................... 247

LIST OF ABBREVIATIONS
ABS: Association of Business SchoolsATO: Assemble-to-orderBTO: Build-to-orderBPR: Business Process Re-engineeringBSE: Business Systems EngineeringCAD: Computer Aided DesignCODP: Customer Order Decoupling PointDTO: Design-to-orderETO: Engineer-to-orderETS: Engineer-to-stockEPSRC: Engineering and Physical Sciences Research CouncilGRP: Glass Reinforced PolyesterGDP: Gross Domestic ProductIGLC: International Group Lean ConstructionIT: Information TechnologyJIT: Just in TimeKPI: Key Performance IndicatorsMcCLOSM: Mass customised Collaborative Logistics for Sustainable ManufactureMTS: Make-to-stockRQ: Research QuestionSME: Small Medium EnterprisesSMED: Single Minute Exchange of DiesSTS: Ship-to-stockSWOT: Strengths Weaknesses Opportunities and Threats TPS: Toyota Production System UDSO: Understand, Document, Simplify Optimise UK: United Kingdom 3D: Three dimensional

[Chapter 1 - Introduction]
CHAPTER 1
INTRODUCTION
AIMS.OE-QHAPTER 11. Establish the context and reasoning for the research in this thesis2. Introduce the primary aim and research questions3. Provide a summary of the literature gaps4. Outline the structure of the thesis
The turbulence of the modem business environment is well documented (Christopher,
2005). Globalisation, technological change and more demanding customers result in higher
levels of uncertainty for organisations. Product proliferation as a result of meeting ever
increasing customer demand preferences is well documented (Forza and Salvador, 2002).
Customisation has been promoted as a source of competitive advantage (Amaro et al., 1999;
Lampel and Mintzberg, 1996). Despite these factors, most of the published research in
operations and supply chain management has neglected the needs of the ‘engineer-to-order’
(ETO) supply chain (Hicks et al., 2000).
The ETO supply chain can be defined in relation to a family of supply chain structures.
Based on Hoekstra and Romme (1992) and Naylor et al. (1999) five different supply chain
structures can be defined: buy-to-order, make-to-order, assemble-to-order, make-to-stock
and ship-to-stock. These structures describe the flow and control structures of products
throughout different supply chains. A ‘decoupling point’ can be used to distinguish the point
at which the customer penetrates the supply chain (Naylor et al., 1999). A sixth supply chain
structure, the ETO supply chain, is emerging as an addition to the five established structures,
but it has received much less attention than the other structures (Hicks et al., 2001).
However, at present there is no consensus on definitions, models and strategies that are
suitable for this particular type of supply chain.
Uncertainty affecting supply chain operations has long been recognised by researchers as a
major obstacle to the delivery of customer value in different supply chains (Childerhouse
and Towill, 2004). Supply chain uncertainty can be defined as “situations in the supply
1

[Chapter 1 - Introduction]
chain in which the decision maker does not know definitely what to decide as he is indistinct
about the objectives; lacks information about or understanding of the supply chain system or
its environment; lacks information processing capabilities; is unable to accurately predict the
impact of possible control actions on supply chain behaviour; or, lacks effective control
actions” (van der Vorst and Beulens, 2002). Whilst it has been acknowledged that different
types of supply chain have different uncertainty profiles, and that strategy must be matched
with these profiles (Fisher, 1997; Lee, 2002), there is little academic literature addressing
the particular uncertainties relating to the ETO supply chain, or how these uncertainties may
be managed.
There have been numerous studies suggesting that a philosophy of ‘one size fits all* strategy
to supply chain management is not appropriate (Fisher, 1997). In particular, the application
and suitability of different supply chain strategies, including the application of ‘lean’,
Teagile’ and ‘agile’ approaches, have attracted much debate in academic literature
(Christopher and Towill, 2000, 2002; Cooney, 2002; Cusumano, 1994; Hines et al., 2004;
Katayama and Bennett, 1999; Naylor et al., 1999; Van-Hoek, 2000). Many authors agree
that supply chains must be matched to specific markets, but there is less consensus relating
to which strategies should be applied in which markets. The philosophy of ‘one size does
not fit all’ has also been discussed in the area of project management (Shenhar, 2001) and
logistics, where tailored logistics strategies are proposed (Bask, 2001; Fuller et al., 1993;
Naim et al., 2006; Wang et al., 2007). However, it is unclear from this.literature which
strategies are appropriate for the ETO supply chain.
Agility has been proposed as an approach for dealing with the uncertainty found in modem
globalised markets (Christopher, 2000). Agility, it is proposed, provides the capabilities
required to keep up with the pace of change. It is no longer adequate to be low cost. Supply
chains must be able to respond quickly to sudden changes in supply or demand, handle
unexpected disruptions and reshape themselves in line with market requirements (Lee,
2004). They have to deliver exactly what the customer wants, in the right location, at
precisely the right time. Flexibility is considered as an important enabler of this
(Christopher, 2000; Naylor et al., 1999; Prater et al., 2001; Yusuf et al., 1999). The value of
2

[Chapter 1 - Introduction]
flexibility as a response to uncertainty is well documented (Gerwin, 1993; Schmenner and
Tatikonda, 2005; Swamidass and Newell, 1987; Tang and Tomlin, 2008).
This thesis seeks to weave together the themes raised in this short introduction. An
important theme is the need to achieve a tailored strategy for different supply chains,
specifically those required for the ETO supply chain. It will support the development of
definitions for the ETO supply chain structure and will investigate the problems associated
with supply chain uncertainty. This will be undertaken within the context of developing
agile, flexible supply chains. The initial research problems addressed in this thesis can be
articulated as follows:
• Most of the published research in operations and supply chain management has
neglected the needs of the ETO supply chain.
• There is no consensus on definitions, models and strategies that are suitable for the
ETO supply chain.
• Whilst it has been acknowledged that different types of supply chains have different
uncertainty profiles and that strategy must be matched with these profiles there is
little academic literature addressing the particular uncertainties relating to the ETO
supply chain, or investigation into how these uncertainties may be managed.
1.1 INDUSTRIAL AND RESEARCH CONTEXT
The ETO supply chain covers a range of industry sectors including construction projects,
ship-building, aerospace, capital goods and high tech equipment, power plant, bespoke
electronics and complex components in general manufacturing. As many areas of
manufacturing are being outsourced to low cost locations such as China, these high value
adding and complex supply chains form a vital part of the UK economy . The arena for the
empirical work in this thesis is the construction industry. While the recession at the time of
writing has led to a downturn in construction activity, the sector still accounts for
approximately 8.5% of the UK GDP and employs around 3 million people across 300,000
firms (Cridland, 2010). The sector consumes huge quantities of materials, labour and other
resources, and has been at the receiving end of a number of high profile Government reports
seeking to drive improvements (Egan, 1998; Latham, 1994).
3

[Chapter 1 - Introduction]
In this thesis, two supply chain networks form the construction industry are investigated in
depth, covering a total of 5 projects and 12 suppliers. The first network focuses on the
activities of a main contractor based in the South of the UK, which has a turnover of £70
million with a workforce of around 550 employees. Major clients include housing
associations, care scheme operators, commercial and industrial concerns and schools. The
organisation specialises in delivering projects on a design and build basis. It has won
numerous awards for best developments, and has been included in a number of best practice
guides written about client partnering and supply chain management. Three projects and
nine suppliers are investigated from this network.
The second network investigated focuses on the activities of a global construction
management company with a turnover of £530 million and 2800 employees. The
organisation specialises in large commercial tower buildings delivered on a construction
management contract basis. The company was voted in the top 5 of the Sunday Times ‘top
track’ in 2008 and was also awarded the construction management organization of the year
by a leading trade magazine. The organisation’s approach to supply chain management and
collaboration are well recognized in the industry. Two projects and three suppliers are
investigated from this network.
The findings from these networks are then evaluated by interviewing employees from a
range of construction sectors. These include house building, commercial buildings, civil
engineering, as well as representing a range of organisation types including clients,
manufacturers, network co-ordinators, design, logistics and organisational bodies.
Organisations from both these networks were partners on an EPSRC funded research
project at Cardiff entitled McCLOSM (Mass customised Logistics for Sustainable
Manufacturing). McCLOSM was a 5 year industry linked project examining frameworks for
logistics and supply chain across the 3 sectors of steel, construction and retail, running
between 2004 and 2009. This thesis draws on the construction related activities undertaken
in the project, which the author was solely responsible for.
4

[Chapter 1 - Introduction]
1.2 AIM AND RESEARCH QUESTIONS
The literature introduced in the initial section will be developed further in the literature
review. There is clearly a need for more clarity in the ETO body of knowledge, especially
with respect to definitions and strategies tailored specifically for the ETO supply chain. This
thesis offers an empirical investigation into the uncertainties experienced in the ETO supply
chain and the specific flexibility strategies required for mitigating these uncertainties. In
doing so, definitions of the ETO supply chain, and of supply chain flexibility, are developed.
During this research the author attended an executive supplier training day held by an ETO
organisation. At this event the chief executive of the organisation began his address with the
following
“You have got to be flexible - or you will be rolled over”
Bringing these themes together, the prim ary aim of this thesis is to develop a framework
for achieving appropriate flexibilities to mitigate the uncertainties in ETO
construction supply chains. This overall aim is reduced to 4 research questions. These are
articulated in the following section and are developed more fully in the literature review
chapter. Each of the research questions is related to a specific literature gap. A summary of
the literature gap associated with each of the research questions and the primary aim can be
found in table 1.1. This table is revisited in the final section to include conclusions to the
research questions and specific contributions.
1. Research question 1: How does construction f i t within a taxonomy o f supply chain
structures? This question addresses the underlying structure of construction supply
chains. In the academic literature, construction and ETO supply chain bodies of
knowledge have evolved in isolation and have not been integrated. This thesis
considers construction supply chains within a range of proposed supply chain
structures. In doing so, construction is placed within the ETO structure, where much
of supply chain is customised for an individual customer order. This research
question is addressed in chapter 2, but aspects of the case research are also used to
5
[Chapter 1 - Introduction]
make final conclusions for this question. An answer for this question is articulated
following the analysis of the evaluation interviews in chapter 8.
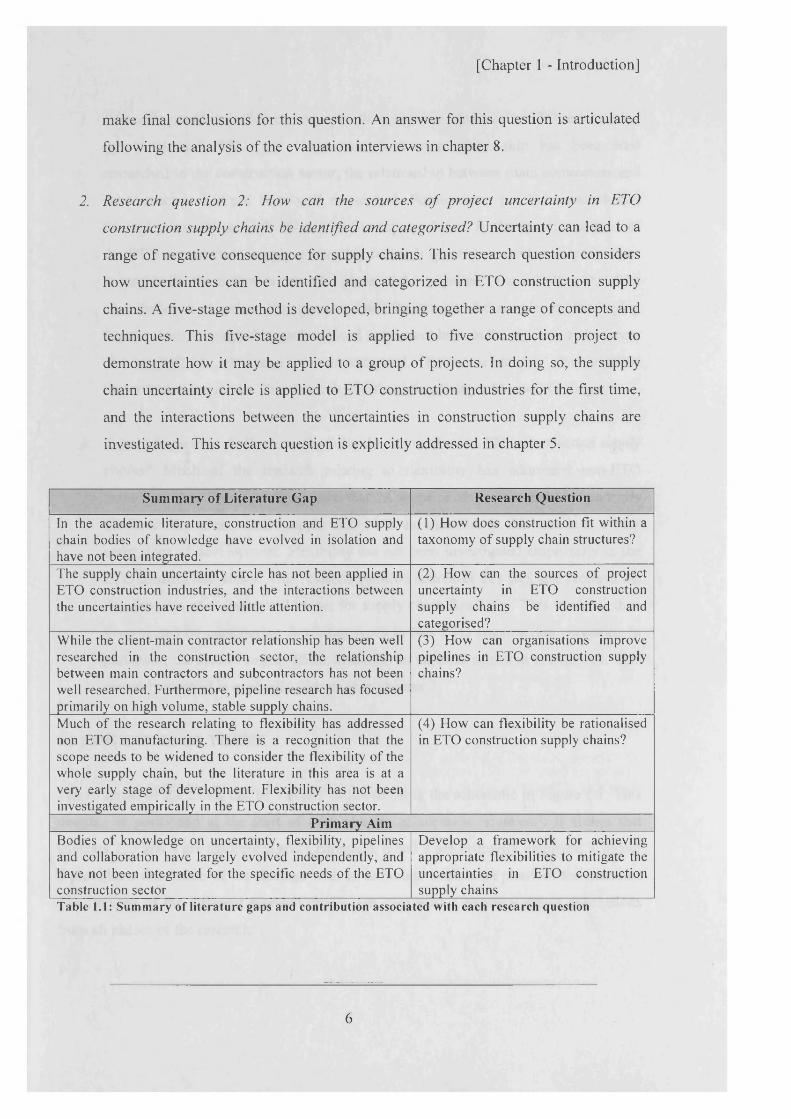
2. Research question 2: How can the sources o f project uncertainty in ETO
construction supply chains be identified and categorised? Uncertainty can lead to a
range of negative consequence for supply chains. This research question considers
how uncertainties can be identified and categorized in ETO construction supply
chains. A five-stage method is developed, bringing together a range of concepts and
techniques. This five-stage model is applied to five construction project to
demonstrate how it may be applied to a group of projects. In doing so, the supply
chain uncertainty circle is applied to ETO construction industries for the first time,
and the interactions between the uncertainties in construction supply chains are
investigated. This research question is explicitly addressed in chapter 5.
Summary o f Literature Gap Research Question
In the academic literature, construction and ETO supply chain bodies o f knowledge have evolved in isolation and have not been integrated.
(1) How does construction fit within a taxonomy o f supply chain structures?
The supply chain uncertainty circle has not been applied in ETO construction industries, and the interactions between the uncertainties have received little attention.
(2) How can the sources o f project uncertainty in ETO construction supply chains be identified and categorised?
While the client-main contractor relationship has been well researched in the construction sector, the relationship between main contractors and subcontractors has not been well researched. Furthermore, pipeline research has focused primarily on high volume, stable supply chains.
(3) How can organisations improve pipelines in ETO construction supply chains?
Much o f the research relating to flexibility has addressed non ETO manufacturing. There is a recognition that the scope needs to be widened to consider the flexibility o f the whole supply chain, but the literature in this area is at a very early stage o f development. Flexibility has not been investigated empirically in the ETO construction sector.
(4) How can flexibility be rationalised in ETO construction supply chains?
Primary AimBodies o f knowledge on uncertainty, flexibility, pipelines and collaboration have largely evolved independently, and have not been integrated for the specific needs o f the ETO construction sector
Develop a framework for achieving appropriate flexibilities to mitigate the uncertainties in ETO construction supply chains
Table 1.1: Summary o f literature gaps and contribution associated with each research question
6
[Chapter 1 - Introduction]
3. Research question 3: How can organisations improve pipelines in ETO construction
supply chains? While the client-main contractor relationship has been well
researched in the construction sector, the relationship between main contractors and
subcontractors has not been well researched. Furthermore, pipeline research has
focused primarily on high volume, stable supply chains. In the specific context of
the ETO construction supply chain, this research question considers improvement
strategies for the activities that take place in the ‘pipeline’: the activities that take
place between an order being generated and the receipt of that order by the buying
organisation. Through this question, lead times, problems in the pipeline and sources
of competitive advantage are investigated. Recommendations for pipeline
improvement are made. This research question is explicitly addressed in chapter 6.
4. Research question 4: How can flexibility be rationalised in ETO construction supply
chains? Much of the research relating to flexibility has addressed non-ETO
manufacturing. There is a recognition that the scope needs to be widened to consider
the flexibility of the whole supply chain, but the literature in this area is at a very
early stage of development. Flexibility has not been investigated empirically in the
ETO construction sector. This research question addresses this gap, and prompts the
development of a conceptual model for supply chain flexibility. This model is then
investigated by considering flexibility types in two ETO construction networks. In
particular, the role of supply chain flexibility in supplier selection is explored. This
research question is explicitly addressed in chapter 7.
1.3 STRUCTURE OF THESIS
The structure of the thesis can be visually followed using the schematic in Figure 1.1. This
diagram is positioned at the start of each chapter to act as a ‘signpost’. It shows that
chapters 2, 3 and 4 are theoretical and Chapters 5, 6 and 7 are primarily empirical. Chapter
8 provides a discussion of the findings with an empirical evaluation phase of the research.
The findings of the different research phases are integrated. Chapter 9 draws conclusions
from all phases of the research.
7

Theoretical
~ K ? ~
Chapter 2
Chapters 3 and 4
M eth o d o lo g y
Chapter 3: Methodology
Chapter 4: Research Design
RQ1
Figure 1.1: Thesis structure
Empirical
Chapter 5
Uncertainty in ETO Systems
RQ2
Chapter 6
PipelineImprovement
Strategies
RQ3
Chapter 7
Supply Chain Flexibility
RQ4
[Chapter 1 - Introduction]
Chapter 8
Evaluation Of The Case Research
UnifiedFrameworkPresented
All RQs
Research Findings
— v —
Chapter 9
The empirical phase of the research can be separated into two parts. As shown in figure 1.2,
the first phase of the research process is an extensive case study research of two ETO
‘systems’. The ETO systems are made up of three main units of analysis. These are a
network co-ordinator, projects and supplier pipelines. These units of analysis are described
in greater detail in the methodology chapter. In total, across the two systems, there are 2
network co-ordinators, 12 supplier pipelines and five projects. As shown in Figure 1.2,
system 1 was investigated from year 1 to year 3 of the research process and system 2 was
investigated over the course of years 2 and 3. The evaluation interviews were conducted at
the beginning of year 4. Chapters 5-7 present the empirical findings from the case study
phase of the research, using data collected from both ETO systems. Chapter 8 presents the
empirical data gathered from evaluation interviews.

[Chapter 1 - Introduction]
EvaluationInterviews
1 Network Co-ordinator
Engineer-to-oidei system 2
2 Projects 3 Suppliers
1 Network Co-ordinator
Engineer-to-order system 1
3 Projects 9 Suppliers
Y ea r l Year 2 Year 3 Year 4— |— ^
Figure 1.2: Timings o f the different empirical phases o f the research
This chapter provides background information to the research problem, as well as
presenting the main research aim and questions. Chapter 2, which provides a literature
review, traces the formulation of these research questions from the literature, showing the
origins of the research questions. The initial part of the review, which examines the
characteristics of different supply chain structures was first presented at the ‘Construction
management and economics: past, present and future’ conference in 2007. The full
reference is as follows:
Gosling, J. Naim, M. M. Fowler, N. and Fearne, A. (2007). “Defining the lean and agile
characteristics o f engineer-to-order construction projects Construction Management and
Economics: Past, Present and Future, Reading (CME25), Reading, UK.
Chapter 2 also offers a structured literature review for papers that are specifically related to
the ETO supply chain. This part of the literature review also addresses research question 1
(How does construction fit within a taxonomy of supply chain structures?). This structured
literature review has been accepted for publication in the International Journal o f
Production Economics. The full reference is:
Gosling, J. and Naim, M. M (2009). "Engineer-to-order supply chain management: A
literature review and research agenda International Journal o f Production Economics,
Vol. 122. Pp 741-754
9

[Chapter 1 - Introduction]
The final elements of the literature review focus on literature in the areas of supply chain
uncertainty and supply chain flexibility. Research questions 2-4 are developed during this
stage of the literature review. A conceptual model of supply chain flexibility is developed.
Chapter 3 describes the methodological stance adopted in the thesis as well as a description
of the research methods employed. It defends the multiple case study research design
selected and the various research methods and data analysis techniques chosen. A mixed
methodological approach is taken, using qualitative and quantitative techniques. While the
study is primarily qualitative, quantitative data provides an important contribution to the
thesis. The strengths and weaknesses of different methods are evaluated.
After chapter 4 the empirical part of the study begins. Chapter 5 answers research question
2 (How can the sources of project uncertainty in ETO construction supply chains be
identified and categorised?), and is primarily concerned with the ‘project’ unit of analysis.
The uncertainties experienced in 5 different ETO projects are identified and analysed. This
work was first presented at the European Operations Management Association in
Gothenburg, Sweden. The full reference for the paper is:
Gosling, J. and Naim, M. 2009. “Sources o f project uncertainty in an engineer-to-order
system" European Operations Management Association (EurOMA) Gothenburg, Sweden:
14th-l 7th June.
Chapter 6 is concerned with describing and analysing ‘pipeline’ activities across the 12
different supplier pipelines case studies used in the research. The chapter answers research
question 3 (How can organisations improve pipelines in ETO construction supply chains?),
and is primarily concerned with the ‘supplier pipeline’ unit of analysis. The generic
activities in the pipeline are described and the results of a ‘pipeline survey’ are analysed.
Some of the early ideas for this chapter can be found in a paper published in the
International Journal o f Agile Manufacturing. The full reference is:
10

[Chapter 1 - Introduction]
Gosling, J. Naim, M. Fowler, N. and Fearne, A., 2007. “Manufacturers’ preparedness for
agile construction International Journal o f Agile Manufacturing, 10(2), 113-124.
While chapter 7 is primarily concerned with the network co-ordinator unit of analysis it
examines the functioning of the whole ETO system. The conceptual model of supply chain
flexibility is explored in this section, which answers research question 4 (How can
flexibility be rationalised in ETO construction supply chains?). This chapter is largely based
on a paper that has been published in the International Journal o f Production Economics.
The full reference is:
Gosling, J. Purvis, L. and Naim, M. M., “Supply chain flexibility as a determinant o f
supplier selection”. International Journal o f Production Economics, Vol 128, Issue 1, pp
11 - 2 .
Chapter 8 assesses the main learning points from the case study research and explores the
implications for industry. It includes empirical data using feedback from professionals in a
range of ETO organisations. This chapter offers an indication of the potential to generalise
the findings to different ETO construction environments. The empirical data is used to
evaluate the findings and the implications of the case study research across different ETO
construction sectors, and for different members of the supply chain. The findings for each of
the research questions are discussed in the light of the evaluation interviews. An answer for
research question 1 (How does construction fit within a taxonomy of supply chain
structures?) is formulated for the first time in the thesis. A framework for achieving supply
chain flexibility is articulated at the end of this chapter, bringing together all the different
elements of the study.
Finally, chapter 9 presents the conclusions. The overall research findings are summarised,
and the original research contributions are discussed. The chapter finishes by discussing
both the academic and the practical implications of the findings along with limitations and
the potential for future research.
11

[Chapter 1 - Introduction]
1.4 SUMMARY
This chapter has outlined the context for the thesis and has introduced the primary aim. It
provides an overview of the thesis as a whole. A broad background to the ETO supply chain
has been presented and the key areas of literature have been introduced. To support the
primary aim of the thesis, 4 research questions have been articulated. These will be
developed more fully in the next chapter. A summary of the structure and the different
phases of the empirical research have been introduced. The next chapter will provide a more
fully developed contextual background for the thesis through the literature review, which
identifies gaps and shortfalls in the literature.
SUMMARY OF CHAPTER 1 AIMS1. Establish the context and reasoning for the research in this thesis
- The context and motivation for research on ETO supply chains has been introduced
2. Introduce the primary aim and research questions- The primary aim is to develop a framework for achieving appropriate flexibilities
to mitigate the uncertainties in ETOsupply chains.- Four research questions and fourresearch propositions have been introduced
3. Provide a summary of the literature gaps- Asummary of the literature gaps and research questions can be found in table
1.14. Outline the structure of the thesis
- Asummary of the structure and the different phases of the empirical research has been presented
/
12

[Chapter 2 - Literature Review]
C H A P T E R 2
L IT E R A T U R E R E V IE W
CHAPTER 2 AIM$1 .Develop a foundation for the th es is in the pub lished literature2.Form ulate re se a rc h q u e s tio n s in relation to the literature and identify the resea rchg ap s3.Identify the c h a ra c te ris tic s of the eng ineer-to -o rder su p p ly chain4 .C o m p are th e eng ineer-to -o rder supp ly chain with o th er ty p es of supp ly cha in s5 .D evelopa c o n c ep tu a l m odel to rationalise supp ly chain flexibility
RESEARCH QUESTION APPRESSEPRQ1: How do co n stru c tio n supp ly ch a in s fit within a taxonom y of sup p ly chain
s tru c tu re s?
Theoretical
~ \ r ~
Chapter 2
RQ1
Chapters 3 and 4
M eth od o logy
Chapter 3: Methodology
Chapter 4: Research Design
Empirical
" V
Chapter 5
Uncertainty in ETO Systems
RQ2
Chapter 6
PipelineImprovement
Strategies
RQ3
Chapter 7
Supply Chain Flexibility
RQ4
Chapter 8
Evaluation Of The Case Research
UnifiedFrameworkPresented
All RQs
Research Findings
V -
Chapter 9
13

[Chapter 2 - Literature Review]
2. INTRODUCTION
This chapter establishes the theoretical foundations of the thesis. It provides an overview of
the published literature that is related to the main research areas and highlights relationships
between these different bodies of knowledge, showing how different areas interact. The
principle subject areas of the thesis are articulated and research questions are formulated.
The review will also highlight gaps in the literature.
The areas of academic research and their relationships are summarised in the Venn diagram
in figure 2.1. The broadest area of literature is the field of supply chain management. Within
the field of supply chain management the literature relating to supply chain structures can
be placed. One specific structure from a range of supply chain structures is then addressed:
the ETO supply chain. The figure shows that there are two more bodies of knowledge that
cut across those already described. Construction supply chain management is discussed
within the context of supply chain structures and then with particular reference to the ETO
structure. The figure also shows that this thesis is positioned, within the context of the ETO
supply chain, at the intersection of construction supply chain management, supply chain
uncertainty and supply chain flexibility.
Supply Chain M anagem ent
Supply Chain Structures
E n g i n eer-to-o rder S tru ctu re
Construction Supply Chain M an agem en t
Supply Chain Uncertainty
T h esis
Supply Chain Flexibility
Figure 2.1: Venn diagram to show interaction between bodies o f knowledge
14

[Chapter 2 - Literature Review]
This review begins with a general grounding in supply chain management including
definitions, and then moves on to review literature relating to supply chain management in
the construction industry. Literature relating to supply chain structures is reviewed and a
taxonomy of structures is developed. A structured literature review specifically relating to
the ETO supply chain structure is then offered. This is an important section of the literature
review as it addresses research question 1 (How does construction fit within a taxonomy of
supply chain structures?). The final sections then review the literature related to uncertainty
and flexibility, two of the major themes in this thesis. This area of the review develops a
model for supply chain flexibility which is investigated empirically later in the thesis. Table
2.1 shows the aims of each part of the literature review, the relevant bodies of knowledge,
and the link with research questions.
Bodies o f Knowledge
Aims Link with Thesis and Research Questions
Supply Chain Management
Locate thesis within the supply chain management discipline
-Facilitates overall positioning o f thesis -Provides theoretical grounding for all research questions and chapters
Construction Supply Chain Management
Provide an industrial context for the research
-Industrial context for all research questions and chapters
Supply Chain Structures
Develop a taxonomy o f supply chain structures and identify their characteristics
-Facilitates overall positioning o f thesis -Provides theoretical grounding for all research questions and chapters
ETO supply chain
-Synthesize literature specifically relating to ETO supply chains -Discuss construction within ETO context
- Specifically addresses RQ1- Guides RQ2, RQ3 and RQ4 and all chapters
Supply Chain Uncertainty
-Review and highlight gaps in the supply chain uncertainty literature -Review the supply chain uncertainty circle
Provides a foundation for RQ2 and Chapter 5
PipelineManageemnt
-Review and highlight gaps in the pipeline management literature
Provides a foundation for RQ3 and Chapter 6
Supply Chain Flexibility
-Classify Supply Chain Flexibility Literature.-Develop a model o f Supply Chain flexibility
Provides a foundation for RQ4 and Chapter 7
Table 2.1: Summary of literature review and the links with research questions
15

[Chapter 2 - Literature Review]
2.1 SUPPLY CHAINS AND SUPPLY CHAIN MANAGEMENT
It has been argued that in the modem business environment supply chains compete, not
individual companies or organisations (Christopher, 2005). Firms can no longer compete
effectively in isolation of from various members of the supply chain. The field of supply
chain management appears to have originated in the early 1980s and has since rapidly
expanded (Harland, 1996). However, it remains fragmented and the emerging bodies of
knowledge or ‘functional silos’ within the field remain largely unconnected (Burgess et al.,
2006; Harland, 1996). A distinction is made between supply chains as phenomena that
exist, and the management of those supply chains (Mentzer et al., 2001). The rest of this
section explores the definitions o f ‘supply chain’ and then ‘supply chain management’.
Harland (1996) proposes a useful framework to illustrate the different levels of research and
conceptual development within supply chain management. The different levels proposed
are:
1) The internal chain. This refers to the internal flow of materials and information
within one specific company;
2) Dyadic relationships. This refers to the company and its immediate supplier or
customer;
3) The external chain. This refers to the dyad and the extended supply chain including
the supplier’s supplier and the customer’s customer;
4) The network. This refers to the complete network of organisations involved in the
provision of a product or service required by an end customer.
Different chapters in this thesis address different levels of research. The units of analysis in
this thesis are discussed in depth in the Methodology chapter.
It is also important to note the use of the term ‘value chain’ and ‘value stream’ within
supply chain management. Value chains and value streams have been espoused by a number
authors, most notably by Womack and Jones (1996) and Porter (1985). This provides an
approach for thinking about the value to the customer offered by different activities not only
in an individual organisation but across a supply chain. Supply chains, it is argued, are
made up of one or more value chains (Childerhouse and Towill, 2003).
16

[Chapter 2 - Literature Review]
2.1.1 Definitions of a supply chain
Mentzer et al. (2001) suggest that the definition of ‘supply chain’ is more common across
authors than the definition of ‘supply chain management’. There is an abundance of
definitions for a supply chain including:
• “A system whose constituent parts include suppliers of materials, production
facilities, distribution services and customers, all linked together via the feed
forward flow of materials and the feedback flow of information” (Stevens, 1989);
• “The network of connected and interdependent organisations mutually and co
operatively working together to control, manage and improve the flow of materials
and information from suppliers to end users” (Christopher, 2005);
• “The functions within and outside a company that enable the value chain to make
products and provide services to the customer” (Cox and Blackstone, 1998);
• “All those activities associated with moving goods from the raw materials stage
through to the end user. This includes sourcing and procurement, production
scheduling, order processing, inventory management, transportation, warehousing
and customer service. It also involves the information systems necessary to monitor
these activities” (Quinn, 1997);
• “All activities associated with the flow and transformation of goods from raw
materials stage, through to the end user, as well as the associated information flow.
Materials and information flow up and down the supply chain” (Handfield and
Nichols, 1999).
For the purposes of this thesis, a supply chain will be defined as “a system whose
constituent parts include suppliers of materials, production facilities, distribution services,
resources and customers, all linked together via the feed forward flow of materials and the
feedback flow of information” (adapted from Stephens, 1989). This definition captures the
‘systems’ perspective adopted in this thesis. A system may be described as recognizable
whole which consists of a number of parts that are connected up in an organised way. This
recognizable whole includes a boundary, an environment, a purpose and emergent
properties (Waring, 1996). A systems philosophy demands that an uncoordinated approach
17

[Chapter 2 - Literature Review]
is replaced by a framework in which the identities of the separate parts are subsumed by the
identity of the total system. Via a system engineering approach, the individual elements and
subsystems are designed and fitted together to achieve an overall system purpose, where the
right parts must be connected and in balance if the system is to produce the desired results
(Pamaby, 1995; Towill, 1997b). The Stevens (1989) definition has been adapted to make it
more relevant to the ETO supply chain. It includes resources, such as labour and working
capital, which are required to flow through ETO supply chains to fulfil individual project
requirements.
2.1.2 Definitions of Supply Chain Management
There appears to be little consensus on the definition of supply chain management
(Lummus and Vokurka, 1999; Mentzer et al., 2001; New, 1997). This is reiterated by
Croom et al. (2000) who argued that there is a confusing profusion of overlapping
terminology and meanings in supply chain management. The following definitions show
some of the perspectives on supply chain management:
• “An integrative approach to dealing with the planning and control of the material
flow from suppliers to end users” (Ellram, 1991);
• “An integrative philosophy to manage the total flow of a distribution channel from
supplier to ultimate user” (Cooper et al., 1997);
• “The systematic, strategic coordination of the traditional business functions and the
tactics across these business functions within a particular company and across
businesses within the supply chain, for the purposes of improving the long term
performance of individual companies and the supply chain as a whole” (Mentzer et
al., 2001);
• “The management of a network of organisations that are involved, through
upstream and downstream linkages, in the different processes and activities that
produce value in the form of products and services in the hands of the ultimate
customer” (Christopher, 2005);
• “The management, control and coordination of material, cash, resource and
information flows in order to construct habitable dwellings based on specific design
18

[Chapter 2 - Literature Review]
requirements, including the appraisal and selection of skilled labour and material
suppliers” (Childerhouse et al., 2000).
For the purposes of this thesis, supply chain management will be defined as “the
management, control and coordination of material, cash, resource and information flows in
order to complete projects based on specific design requirements, including the appraisal
and selection of suppliers” (Adapted from Childerhouse et al., 2000) . This definition is
adopted for a number of reasons. Firstly, it captures the specific design requirements for
projects that are an important part of the ETO supply chain. Secondly, it emphasizes the
appraisal and selection of suppliers in supply chain management. This emphasis is
important, as this thesis considers how network co-ordinators in ETO systems can achieve
supply chain flexibility through robust sourcing and selection criteria for their suppliers.
2.1.3 Construction Supply Chains
As the empirical investigation is conducted with companies operating in the construction
industry, this section will provide a description of the sector. Many authors believe
construction is separate from all other industries because of its heterogeneous nature.
Schonberger (1990) argued that “One industry, construction, is so fouled up as to be in a
class by itself; delay, lack of coordination, and mishaps are normal, everyday events for the
average company”. As mentioned in the introduction, the UK Government has
commissioned several reports to advise on improving construction including those of Egan
(1998) and Latham (1994). The former make specific recommendations to the construction
sector as a whole, in the areas of partnering the supply chain, lean construction and design
standardisation.
A recent handbook on construction supply chain management (O'Brian et al., 2009)
acknowledges that while the construction industry has recognized the importance of supply
chain management to improve the performance of projects, initial research has shown how
complex and ineffective they are in practice, and how immature the area is when compared
to supply chain management in the manufacturing sector. An introduction to a special issue
on supply chain management in the construction industry (Segerstedt and Olofsson, 2010)
19

[Chapter 2 - Literature Review]
highlights the peculiarities of construction supply chains, such as one-of-a-kind products,
temporary organization and site production, and questions the extent to which supply chain
solutions from other industries are applicable.
Partnerships
One area that has been the subject of research in construction supply chains is that of
partnering. Many authors, including the aforementioned UK Government initiatives,
support the adoption of partnering within construction supply chains. Agapiou et al. (1998b)
argued that the construction sector can best benefit from builders merchants by recognizing
the importance of long-terms relationships and effective supply chain management. Fortune
and Setiawan (2005) investigated the use of partnering practices by Housing Associations in
the UK, and find that are a range of benefits to be gained by the use of partnering
arrangements between clients and principal contracting organisations.
The uptake of supply chain management practices within construction, however, appears to
be slow. In a survey of UK contractors by Akintoye (2000), it was concluded that the
construction industry is still at its infancy with regard to adopting collaboration and supply
chain management principles. Culture and management commitment are identified as key
barriers, and the findings reveal that contractors are more oriented towards client partnering
arrangements than with suppliers and subcontractors. These findings are supported by Saad
et al. (2002), who found that although construction practitioners have some knowledge of
supply chain management they need a better conceptual understanding of it, and new and
more systematic approaches to its implementation. Barker and Naim (2008) also provided a
survey examining a range of recognized indicators of supply chain sophistication in the
housebuilding industry and find that awareness within the housebuilding industry was still
low and that much inefficiency remains.
A number of authors have suggested that the partnership literature for construction supply
chains has placed too much emphasis on client relationships, as opposed to those that might
arise upstream. Proverbs and Holt (2000) developed a cost minimisation model for
construction supply chains and suggest that although downstream alliances are common
20

[Chapter 2 - Literature Review]
(contractor to client), there is a lack of upstream alliances (contractors and suppliers), which
would increase the effectiveness of the whole supply chain. In particular, little attention has
been paid to the integration of small and medium-size enterprises (SMEs) in the
subcontractor and material supply sectors (Dainty et al., 2001a). A further study highlights
serious concerns among subcontractors and material suppliers that point towards a
fundamental mistrust and scepticism within existing supply chain relationships (Dainty et
al., 2001b). Some authors question the extent to which full supply chain integration through
partnering can be achieved in construction supply chains (Ireland, 2004).
Learning from Manufacturing and Lean Construction
A further theme within the construction supply chain management literature is the
identification of the potential lessons that can be learnt from manufacturing research. Gann
(1996) described the benefits to be gained from considering construction as a manufacturing
process. In particular, the role of learning from the automotive industry is highlighted,
whereby standardised parts are balanced with flexible assembly. The role of modularity in
construction supply chains was investigated by Voordijk (2006), who used a 3 dimensional
concept to describe product, process and supply chain modularity in the building industry.
Lean construction has also been promoted as a way of improving construction. Ballard and
Howell (2002) introduced Lean Project Management, which is derived from Just-in-Time
(JIT) principles. The same authors also promoted the shielding of production from
uncertainty as a way of removing waste (Ballard and Howell, 1998), and the ‘last planner’
principle has also been proposed (Ballard and Howell, 2002). In the last planner system, the
final person in the planning hierarchy to choose to carry out work that will be most
productive is proposed in order to enable a more reliable work flow. Barker and Naim
(2004) investigated the meaning of value and waste in house-building supply chains, and
concluded that improvements can be facilitated by engineering change models. Naim and
Barlow (2003) explored potential applications of lean and agile approaches in the
construction sector from a supply chain perspective. The paper concluded that house
building supply chains have to be engineered according to whether the market objectives
are low cost, flexibility or a combination of the two
21

[Chapter 2 - Literature Review]
Project Management and Construction
The literature on project management as applied to the construction sector is also pertinent
for this thesis. As will be described throughout this literature review, the project nature of
construction, and other ETO environments, presents inherent problems relative to more
stable production environments. Winch and Carr (2001) focused on the role of process
protocols to understand ‘the shape’ of the construction process. They identify generic stages
of construction projects as define need, establish viability, conception, scheme design,
detailed design, production planning, main trades, finishing trades, commissioning and
facility management (Winch and Carr, 2001). These stages are used in chapter 4 to develop
the research design adopted in the thesis.
The purpose of project management can be described as the challenge “to foresee or predict
as many of the dangers and problems as possible and to plan, organize and control activities
so that the project is completed as successfully as possible in spite of all the risks” (Lock,
2000). A wide range of books have been written on the subject of project management,
from an operations management perspective (Maylor, 1999; Meredith and Mantel, 2003),
and from a construction perspective (Clough et al., 2000; Winch, 2002). Lock (2000)
provided a useful classification of four ETO project types:
1. Civil Engineering, construction, petrochemical, mining and quarrying projects -
where the common feature is that the fulfilment phase must be conducted on a site
that is exposed to the elements
2. Manufacturing projects - where fulfilment is conducted in a factory
3. Management Projects - where the end result is not principally an item of hardware
or construction
4. Research projects - where the end objectives are usually difficult or impossible to
define.
The focus of this thesis is category 1.
The classification above highlights the importance of on-site operations in construction
supply chains. Vrijhoef and Koskela (2000) defined four roles for supply chain management
22

[Chapter 2 - Literature Review]
in construction including a focus on the interface between the supply chain and the
construction site, focus on the supply chain, focus on transferring activities from the
construction site to the supply chain and focus on the integrated management of the supply
chain and the construction site. They concluded that many of the problems in construction
are caused by ‘myopic control of the supply chain’. This highlights the debate relating to the
extent to which construction activities should be completed offsite, in a factory controlled
environment, or on-site (Segerstedt and Olofsson, 2010). Pheng and Hui (1999) investigated
seven different ways in which JIT can be applied to site organization and layout, but
concluded that JIT research in construction is in its infancy and requires more empirical
testing.
From the review of literature relating to construction supply chains, the following can be
concluded:
• Supply chain management is still in its infancy within the construction industry. The
literature has focused on the client-contractor relationship rather than relationships
with upstream material suppliers.
• Construction supply chains have a project and site elements which must be factored
into any supply chain strategy. Learning from manufacturing has been identified as a
theme within the literature, but it is unclear which approaches are most effective for
the construction industry.
At this point, the first research question is posed:
Research Question 1: How does construction Jit within a taxonomy o f supply chainstructures?
2.2 A TAXONOMY OF SUPPLY CHAIN STRUCTURES
This section will highlight differences between supply chain types, thereby highlighting the
difficulties of managing ETO supply chains in comparison with those that are more stable.
A range of supply chain structures have been proposed to illustrate the diverse range of
supply chain operations. Based on Hoekstra and Romme (1992), Naylor et al. (1999), Yang
23

[Chapter 2 - Literature Review]
and Bums (2003), Olhagar (2003) and Lampel and Mintzberg (1996) six different supply
chain structures can be defined: engineer-to-order (ETO), buy-to-order (BTO), make-to-
order (MTO), assemble-to-order (ATO), make-to-stock (MTS) and ship-to-stock (STS).
Based on the aforementioned authors, figure 2.2 shows the level of standardisation and
customisation that takes place before a customer order is received in each of the different
supply chain structures. The shaded cells indicate that the activity is customised and the
cells that are not shaded indicate a standardised activity. The line that runs through the
different structures is the decoupling point, and shows the point at which the customer order
enters the supply chain. The customer, in this case, is taken to be the next direct receiver of
the material in the supply chain as opposed to the ultimate end user.
Englneer-to- order (ETO)
Buy-to-order(BTO)
Make-to-order(MTO
A ssem ble-to- order (ATO)
Make-to-stock Ship-to-stock (MTO) (STS)
Design Design Design Design Design D esign
I — i—i 1 I J IPurchasing Purchasing Purchasing Purchasing Pu r ch a s i n g Purchasing
— t— 1 1 1Fabrication
11Fabrication Fabrication Fabricatton Fabricatton Fabricatton
1 I ---1---- 1 1Assem bly Assem bly Assembly Assem bly Assem bly Assem bly
J — — i _ i _ :Distribution Distributor Distributor Distributor Distributor Distributor
High Level of Customization High Level of Standardization
Figure 2.2: The six supply chain structures (Source: synthesis from various)
Differences between supply chain stmctures are identified through a synthesis of relevant
literature review to create a number of dimensions that can be used to differentiate between
the different stmctures. Table 2.2 summarises the main differences between the supply
chain stmctures and the market outputs that each stmcture offers. The following section
highlights some of the main differences by reference to the extremes of the spectmm and to
intermediate stmctures as appropriate.
24

[Chapter 2 - Literature Review]
Attributes Engineer to order (ETO)
Buy to order (BTO)
Make to order
(MTO)
Assemble to order (ATO)
Make to stock
(MTS)
Ship to stock (STS)
DecouplingPoint
Design Purchasing Fabrication Assembly Distribution - Central
Distribution - Local
Purchasing Identify sources of
supply
Scheduleproduct
deliveriesfrom
suppliers
Hold raw materials /
components
Fabricate or buy modules
Holdfinishedgoods
centrally
Holdfinishedgoodslocally
Stocks No stock No stock Rawmaterials
Preassembledmodules
Finishedgoods
Finishedgoods
Design Produce new design
Modifyexistingdesign
Pick from wide range o f options
Pick from limited
range o f design options
Take design as is
Take design as is
Method Project/jobshop
Job shop Batch Batch/Flow Flow Flow
ForecastingAccuracy
Extremelylow
Very low Low Moderate High Very High
Market OutputsLevel o f
Customisation
Extremelyhigh
Very high High Moderate Low Very Low
Variety Extremelyhigh
Very high High Moderate Low Very Low
Variability Extremelyhigh
Very high High Moderate Low Very Low
Volume Extremelylow
Very low Low Moderate High Very High
Time to Market
Extremelyhigh
Very high High Moderate Low Very Low
Table 2.2: Attributes of different supply chain structures
2.2.1 Attributes of Different Supply Chain Structures
The Decoupling Point
The customer order decoupling point (CODP) is a stock holding point that separates the part
of the supply chain that responds directly to the customer from the part of the supply chain
that uses forecast planning. The decoupling point can act as a strategic buffer against the
variability in demand and an efficient way of scheduling standardised parts. Upstream from
the CODP all products are produced to forecast, whereas downstream from the CODP all
25

[Chapter 2 - Literature Review]
products are pulled by the end-user (Christopher, 2000; Hoekstra and Romme, 1992;
Mason-Jones et al., 2000; Naylor et al., 1999; Olhager, 2003). The decoupling point in the
ETO supply chain lies at the design stage. The customer order asserts a high level of
customisation for all activities in the supply chain. The decoupling point in the STS
structure is the local distribution channel, hence there is no customisation whatsoever.
Purchasing and Stocks
The position of the decoupling point, described above, has a significant impact on the
purchasing and strategic stockholding. Suppliers in an ETO structure are identified and
mobilised in response to a specific customer order and would, typically, service a particular
project. An ETO product may put every order out to competitive tender to a group of
potential suppliers with the required capabilities (Amaro et al., 1999; Hicks et al., 2000).
Stock will then be purchased according to the needs of a specific project. In a BTO structure
the supply chain is established but no stocks are purchased. Product deliveries are scheduled
from established suppliers after an order has been received. At the other end of the
spectrum, the STS structure holds finished goods from established suppliers at a local
distribution channel in order to satisfy forecasted demand very quickly.
Design
The level of influence that a customer has in the design process has significant implications
for the supply chain. Based on Amora et al. (1999), the degree of design customisation can
be categorized along five different classifications: produce new design, modify an existing
design, pick from a wide range of design options, pick from a limited range of design
options and take existing design as is. An ETO project will require a new design with a
large amount of customer input, whereas an MTS or STS supply chain, for example,
designs for a general market based on recommendations by marketing departments
(Rahman et al., 2003a, b). Designs will show increasing levels of standardisation and
reduced direct customer input the further the supply chain moves away from the ETO
structure. In a BTO supply chain similar existing designs are modified to new customer
requirements whereas the MTO and ATO mass customisation strategies are used to offer
degrees of standardised options.
26

[Chapter 2 - Literature Review]
Production Method
The production method refers to the technique used to manufacture or assemble a product.
Four popular assembly methods are job shops, batching, flow and project. The technique
used will vary depending on the complexity and volume of the product (Ballard and
Howell, 1998; Hicks et al., 2000; Porter et al., 1999). The production method for an ETO
supply chain will closely resemble a project or job shop assembly method. Project
production offers a unique product, requiring large scale inputs to be co-ordinated in order
to achieve customers’ requirements. An STS structure is more likely to involve flow
production. Flow production is characterised by the large volume production of a small
range of standard products (Porter et al., 1999). An ATO structure may involve a mixture
of batch and flow production, with flow being utilised upstream from the CODP and batch
utilised downstream from the decoupling point.
Forecasting Accuracy
The ease with which demand for a product can be forecasted has also been widely used to
classify different supply chains (Fisher, 1997; Naylor et al., 1999; Olhager, 2003). The level
of forecasting is closely related to demand volatility and the level of customisation. In
supply chains where demand volatility and customisation is high the potential for forecast
error usually increases. Supply chains that have more stable demand characteristics and
standardised products can usually forecast demand more accurately. The level of forecasting
possible in an ETO supply chain structure is extremely low in relation to other structures.
The high degree of customisation and low volumes involved result in high levels of
uncertainty and lumpy demand patterns. Any stock runs the risk of becoming obsolete and
incorrect to specification. When products are more standardised and volumes are higher,
such as in the MTS and STS structures, the level of forecasting possible increases, as it is
possible to forecast aggregate demand more accurately. ETO companies often have to
forecast skills, capacities and industry trends, whereas MTS companies are required to
forecast the type of product, quantity and location (Rahman et al., 2003b).
Level o f Customisation
Offering customisation to the market is increasingly becoming recognised as a source of
strategic advantage (Lampel and Mintzberg, 1996; Pine, 1993; Salvador et al., 2007). This
27
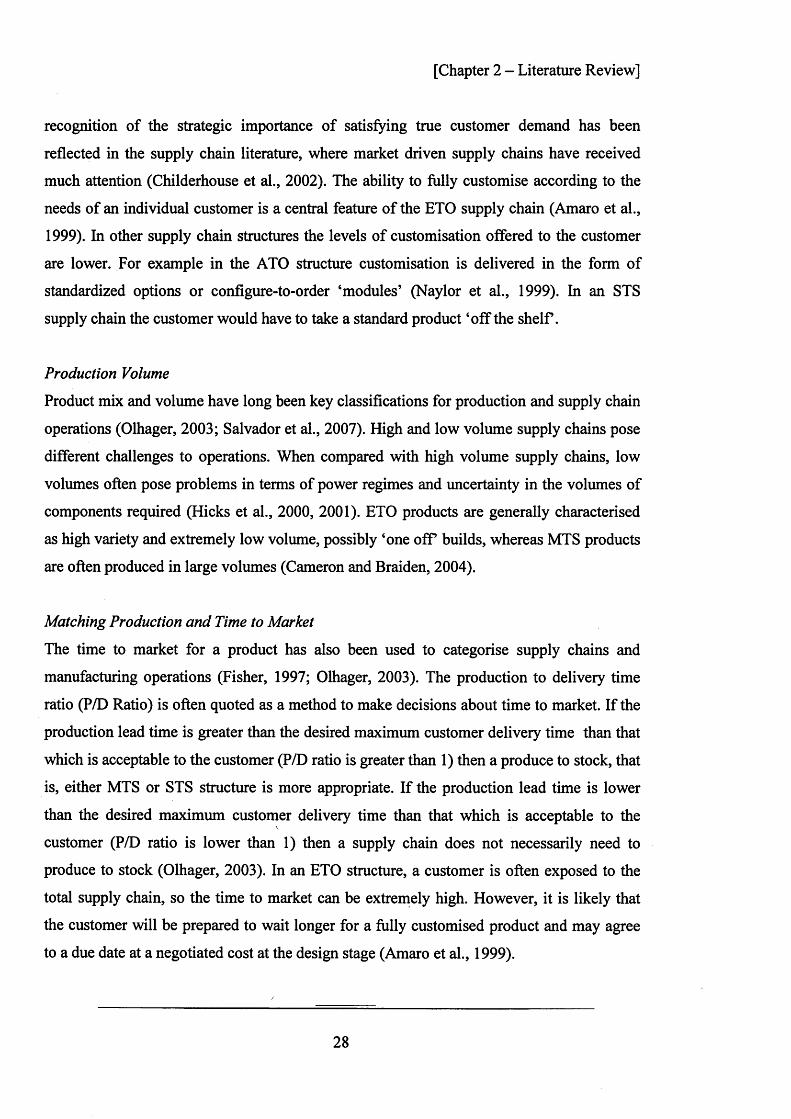
[Chapter 2 - Literature Review]
recognition of the strategic importance of satisfying true customer demand has been
reflected in the supply chain literature, where market driven supply chains have received
much attention (Childerhouse et al., 2002). The ability to fully customise according to the
needs of an individual customer is a central feature of the ETO supply chain (Amaro et al.,
1999). In other supply chain structures the levels of customisation offered to the customer
are lower. For example in the ATO structure customisation is delivered in the form of
standardized options or configure-to-order ‘modules’ (Naylor et al., 1999). In an STS
supply chain the customer would have to take a standard product ‘off the shelf.
Production Volume
Product mix and volume have long been key classifications for production and supply chain
operations (Olhager, 2003; Salvador et al., 2007). High and low volume supply chains pose
different challenges to operations. When compared with high volume supply chains, low
volumes often pose problems in terms of power regimes and uncertainty in the volumes of
components required (Hicks et al., 2000, 2001). ETO products are generally characterised
as high variety and extremely low volume, possibly ‘one o ff builds, whereas MTS products
are often produced in large volumes (Cameron and Braiden, 2004).
Matching Production and Time to Market
The time to market for a product has also been used to categorise supply chains and
manufacturing operations (Fisher, 1997; Olhager, 2003). The production to delivery time
ratio (P/D Ratio) is often quoted as a method to make decisions about time to market. If the
production lead time is greater than the desired maximum customer delivery time than that
which is acceptable to the customer (P/D ratio is greater than 1) then a produce to stock, that
is, either MTS or STS structure is more appropriate. If the production lead time is lower
than the desired maximum customer delivery time than that which is acceptable to the
customer (P/D ratio is lower than 1) then a supply chain does not necessarily need to
produce to stock (Olhager, 2003). In an ETO structure, a customer is often exposed to the
total supply chain, so the time to market can be extremely high. However, it is likely that
the customer will be prepared to wait longer for a fully customised product and may agree
to a due date at a negotiated cost at the design stage (Amaro et al., 1999).
28

[Chapter 2 - Literature Review]
This section highlights the inherent difficulties related to the ETO supply chain relative to
more stable production environments. These difficulties can be summarised as follows:
• High variety - low volume environment;
• The customer is involved in the design process and hence there is more uncertainty
relating to customization;
• The customer is exposed to all activities in the supply chain;
• The supply chain must be configured to account for the changing requirements of
different projects.
2.3 THE ENGINEER-TO-ORDER SUPPLY CHAIN STRUCTURE
The aim of this section of the literature review is to provide a framework to understand the
developments that have emerged in the literature relating specifically to the ETO supply
chain, as well as providing a theoretical grounding for this thesis. More specifically, the
objectives of this section of the literature review are:
1. Develop a more robust definition of the ETO supply chain;
2. Categorise the operational strategies that have been researched in the sector;
3. Investigate the relationships between lean and agile paradigms and the ETO supply
chain;
4. Highlight the research methods and industry sectors that are prevalent or missing;
5. Explore the linkages and contributions to the development of the ETO supply chain
from three different streams of knowledge: supply chain structures, ETO strategy
and lean and agile literature streams;
6. Indicate directions for future research to develop the ETO supply chain.
Section 2.6 will address definitions of ETO supply chains, exploring the ETO supply chain
in comparison to other supply chain structures and the different segments within the ETO
type. The structured literature review is organised based on a classification of 3 ‘streams’ of
literature. Stream 1 relates to the body of knowledge pertaining to supply chain structures.
This stream emerged from part 1 of the literature review, where six supply chain structures
were defined and discussed. Literature stream 2 relates to strategy and performance
improvement techniques. Based on the categorisation from stream 2 of the literature,
29
[Chapter 2 - Literature Review]
section 2.7 discusses a categorisation of the different strategies for the ETO supply chain to
emerge from the literature. Literature stream 3 relates to lean and agile approaches. Using
the literature from stream 3, the relationship between lean and agile approaches with the
ETO type is explored. Finally, research methods and sectors are identified and analysed.
This is followed by a synthesis and an indication of future research directions.
2.4 METHOD FOR THE STRUCTURED LITERATURE REVIEW
2.4.1 Sampling
In order to review systematically the literature related to ETO supply chains, the first step
was to develop a criterion for including papers in the review. Candidates for inclusion
consisted of published journal articles, but not limited to particular journals. Key word
searches were made through several databases including ABI Inform, EBSCO, internet
searches, Google Scholar, Scopus, Science Direct and Emerald. Keywords included those
highlighted in table 2.4. Level 1 keywords must appear in the articles, whereas level 2
keywords, used in conjunction with level 1 keywords, refined and narrowed the search
criteria as well as helping to categorise papers. Once papers were identified, the references
were reviewed to assist in locating additional papers, resulting in a snowball sampling
effect. Journal papers were read and a decision as to whether the papers should be included
rested on their contribution to questions and aims specified for the structured literature
review. Three key questions were asked of each paper. Does it contribute to the
development of definitions of the ETO type? Does it contribute to the development of
strategy? Does it help to relate the lean and agile paradigms to the ETO type? Ninety one
articles were identified by the databases and search engines combined. Although a number
of books are also mentioned throughout this chapter in order to provide background
material, these are not included in the classification.
30

[Chapter 2 - Literature Review]
Key words - Level 1 Keywords - Level 2Engineer-to-order Supply chain structure
Project Supply chainDesign-to-order Strategy
Build-to-order/Make-to-order Lean/Leagile/AgileNon make-to-stock Construction/Capital Goods
One-of-a-kind FlexibilityDecoupling Point
New Product Development ProcessPerformance Improvement
Case/Survey/Questionnaire/Model/T oolTable 2.4: Keyword used in the literature search
2.4.2 Quality Assessment
In order to determine the perceived quality of the journals in which the papers appear the
Association of Business Schools (ABS) “Academic Journal Quality Guide” (Harvey et al.,
2007) has been utilised. This guide is widely adopted by business schools in the UK to
judge the acceptability of articles in the UK’s university sector Research Assessment
Exercise in 2008. The guide synthesises a number of existing perception based survey
results of the academic community as well as the ISI impact factor scores. Journals are then
ranked according to a five point scoring system, with 4 being the highest and 0 the lowest.
Journals are grouped according to discipline, namely Operations and Technology
Management (OTM), Management Science and Operations Research (MSOR), General
Management (GM), Information Systems and Management (IM), Research and Innovation
(INNOV), Marketing (MKT) and Sectoral Studies (SCT). Where a journal does not appear
in the guide it has been termed as unclassified (UC). Table 2.5 shows the different journals
used in the study ranked by the number of papers appearing in this review.
31

[Chapter 2 - Literature Review]
Literature Stream C ategoryJournal T itle Stream 1:
Supply Chain
Structures
Stream 2: ETO
Strategy
Stream 3: Lean and
Agile
All
International Journal o f Production Economics (OTM 3) 2 8 7 17International Journal o f Operations and Production
Management (OTM 3)2 6 3 11
International Journal o f Production Research (OTM 3) 2 0 3 5Construction Management and Economics (SCT 2) 0 3 2 5
Supply Chain Management: An International Journal (OTM 3)
0 3 1 4
Journal o f Operations Management (OTM 4) 1 1 1 3Sloan Management Review (UC) 1 1 1 3
European Journal o f Purchasing and Supply Management (UC)
0 3 0 3
International Journal o f Logistics (OTM 2) 1 1 1 3Building Research and Information (UC) 0 1 2 3
Computers in Industry (UC) 1 2 0 3International Journal o f Project Management (OTM 2) 1 2 0 3
Housing Studies (UC) 0 • 0 2 2Journal o f Construction Engineering and Management
(UC)0 1 1 2
Production Planning & Control (OTM 2) 1 1 0 2International Journal o f A gile Management Systems
(OTM 1)0 0 2 2
Journal o f Supply Chain Management (OTM 1) 0 1 0 1Industrial Management & Data Systems (IM 1) 1 0 0 1
Industrial Marketing Management (MKT 3) 0 0 1 1Integrated Manufacturing Systems (TOM 2) 1 0 0 1
Harvard Business Review (GM 3) 1 0 0 1European Journal o f Operational Research (MSOR 3) 0 1 0 1
European Journal o f Innovation Management (INNOV 1) 0 1 0 1Journal o f Purchasing and Supply Management (OTM 2) 0 1 0 1International Journal o f Logistics Management (OTM 2) 0 0 1 1
International Journal o f Computer Integrated Manufacturing (OTM 2)
0 1 0 1
Engineering, Construction and Architectural Management (SCT 1)
0 1 0 1
IEEE Transactions on Engineering Management (OTM 3) 0 1 0 1Production and Inventory Management Journal (OTM 2) 0 1 0 1
Business Process Management Journal (OTM 1) 0 1 0 1International Journal o f A gile Manufacturing (UC) 0 0 1 1International Journal o f A gile Management (UC) 0 0 1 1International Journal o f Physical Distribution and
Logistics (OTM 1)0 0 1 1
European Management Journal (GM 1) 0 0 1 1International Journal o f Industrial and Systems
Engineering0 1 0 1
Journal o f Manufacturing Technology Management (OTM2)
0 0 1 1
Cum ulative total 15 43 33 91Table 2.5: C ategorisation o f the ETO literature
32

[Chapter 2 - Literature Review]
2.4.3 Categorisation
The papers reviewed are then categorised into three different streams of literature, which
form the basis for the rest of the paper. The three streams are as follows:
• Stream 1 ‘Supply chain structures’ - Papers that primarily focus on developing
definitions or typologies for the ETO supply chain or a range of supply chain
structures with reference to ETO supply chains.
• Stream 2 ‘Strategy’ - Papers that primarily focus on strategies or performance
improvement techniques specifically for ETO supply chains. Papers that explore
strategies for non-MTS supply chains were also considered for this category.
• Stream 3 ‘Lean and Agile’ - Papers that primarily focus on Lean or Agile aspects of
ETO supply chains.
2.5 DEFINING THE ENGINEER-TO-ORDER SUPPLY CHAIN
2.5.1 Supply chain structures and the ETO supply chain
The importance of classifying supply chains according to particular markets and
characteristics has been widely addressed in the supply chain literature. This section will
review some of the key contributions. The frameworks reviewed in this section are often
referred to as supply chain structures and propose to make sense of the diverse range of
supply chain operations by showing how different parts of the supply chains interact with
customer orders. Some papers, however, do not address the full range of supply chain
structures and focus on a select few or one specific structure. These papers relate directly to
stream 1.
The initial part of literature review identified and discussed six supply chain structures. The
ETO supply chain structure was identified as one of these six structures. This structured
literature review helps to integrate this stream of literature with other streams pertinent to
the thesis. Papers that contribute to the development of the ETO structure are discussed in
this section.
33

[Chapter 2 - Literature Review]
Ohlager (2003) simplified the classification of supply chain structures to include MTS,
where the decoupling point is located at the shipment stage, ATO, where the decoupling
point is located at the final assembly stage, MTO, where the decoupling point is located at
the fabrication and procurement stage and ETO, where the decoupling point is located at the
design stage. Ohlager (2003) built on previous work by developing a conceptual impact
model for the factors affecting the positioning of the order penetration point.
Lampel and Mintzberg (1996) provided an important contribution to the supply chain body
of knowledge by proposing a continuum of strategies to show how standardization and
customization of products, processes and customer transactions can be rationalised. The
continuum of strategies show how the level of standardisation and customisation for key
processes, such as design, fabrication, assembly and distribution of products can be
configured to produce five different strategies: pure standardisation, segmented
standardisation, customised standardisation, tailored customisation and pure customisation.
Yang and Bums (2003) developed this continuum of strategies and framed it within the
postponement literature. Postponement centres around delaying activities in the supply
chain until real information about the market is available. Lampel and Mintzberg’s (1996)
continuum is expanded to incorporate new processes, notably packaging, and a number of
postponement strategies are included in the model.
A number of different ways of classifying manufacturing are explored by Porter et al.
(1999). They suggested a number of different ways of thinking about different types of
manufacturing, but most importantly, for this review, they proposed five classes of
manufacturing MTS, ATO, MTO, ETO and design-to-order (DTO). ETO, in this case, is
defined as a standard product range offered with the added availability of modifications and
customisations. DTO is defined as where design, engineering and manufacturing are newly
designed based on each new customer order. This distinction highlights a confusing aspect
of the ETO supply chain whereby different authors have used different terms to distinguish
between variations of the ETO type.
Table 2.6 offers an overview of the key variations in definitions across the different
categories of literature.
34

[Chapter 2 - Literature Review]
Literature Stream C ategoryDefinition Stream 1: Supply Chain
StructuresStream 2: E T O Strategy Stream 3: Lean and
A gileETO supply chains
have customised production
dimensions with the decoupling
point located at the design stage
7.(Lampel and Mintzberg, 1996; Martlnez-Olvera and
Shunk, 2006; Olhager, 2003; Rudberg and Wikner, 2004; Samadhi and Hoang, 1995; Wikner and Rudberg, 2005;
Yang and Bums, 2003)
4(Bertrand and Muntslag,
1993; Gann, 1996; Tersine and Hummingbird, 1995;
Vrijhoef and Koskela, 2000)
2(Barlow, 1999; Cooney, 2002)
ETO supply chains offer customised products where
existing designs are modified to order.
4(Amaro et al., 1999; Porter et al., 1999; Rudberg and
Wikner, 2004; Wikner and Rudberg, 2005)
3(Bozarth and Chapman,
1996; Rahman et al., 2003b; Wadhwa et al., 2006)
0
ETO supply chains offer customised products where completely new
designs are developed to order
3(Amaro et al., 1999;
Rudberg and Wikner, 2004; Wikner and Rudberg, 2005)
9(Bertrand and Muntslag,
1993; Bozarth and Chapman, 1996; Chin-Sheng, 2006;
Little et al., 2000; Rahman et al., 2003b; Vrijhoef and
Koskela, 2000; Wacker and Miller, 2000; Wadhwa et al.,
2006; Wortmann, 1995)
0
ETO supply chains operate in a project environment with
project specific demands/One-of-a
kind
5(Hameri, 1997; Hicks et al., 2001; Martinez-Olvera and Shunk, 2006; Samadhi and
Hoang, 1995; Tu, 1997)
11(Cameron and Braiden,
2004; Caron and Fiore, 1995; Dainty et al., 2001a;
Donselaar et al., 2001; Elfving et al., 2005; Gann,
1996; Hicks et al., 2000; Karkkainen et al., 2003; Thompson et al., 1998;
Vrijhoef and Koskela, 2000; Wortmann, 1995; Y eo and
Ning, 2002)
1(Sanderson and Cox
2008)
Table 2.6: Categorisation o f the literature defining ETO supply chains
Many authors agree that all production dimensions are customised for each order in the
ETO supply chain, that the decoupling point is located at the design stage, and that they
operate in project specific environments. The lack of agreement is found in the extent to
which existing designs are modified to order, or whether completely new designs are
developed for each order. Furthermore, there is also a lack of clarity as to the appropriate
terminology to use. Authors use different terms to describe very similar operating
environments. Project (Elfving et al., 2005), craft (Barlow, 1999), one-of-a-kind (Hameri,
1997; Tu, 1997), DTO and ETO (Hicks et al., 2001) are frequently used in conjunction with
35

[Chapter 2 - Literature Review]
supply chain, production, organisation and system to refer to the supply chain type that is
investigated herein.
2.5.2 Segmenting ETO supply chains
Wikner and Rudberg (2005) proposed a useful framework to help overcome the confusion
over the design aspect of ETO supply chains. They decoupled the engineering and
production related activities of the supply chain and propose a non linear approach. An
engineering dimension and production dimension were advocated with the engineering
dimension ranging from ETO, where a new product is designed, and engineer to stock
(ETS), where a design is already ‘in stock’. Between ETO and ETS engineering
modifications to existing product designs are used in varying degrees. This is consistent
with observations elsewhere that ETO products can include varying degrees of standardised
and customised bills of materials from order to order (Bozarth and Chapman, 1996; Hicks et
al., 2000,2001).
Various ETO types have also been proposed in the literature. Amaro et al. (1999)
distinguished between the versatile manufacturing sector which are involved in a
competitive bidding situation for every order and the repeat business customisers, which
may receive a series of similar orders from particular customers. Furthermore, Amaro et al.
(1999) suggested four types of ETO in their taxonomy of versatile manufacturing
companies along with five types of MTO supply chain and two ATO. The commonality
among the four ETO types is the ‘pure’ degree of customisation (a new design is produced
to order), but the four different types vary in the amount of responsibility that is managed
in-house, such as design and purchasing, and the number and type of activities that are
completed after the receipt of an order, such as design, routing and purchasing. Hicks et al.
(2001) also defined four ideal types of ETO companies: vertically integrated, design and
assembly, design and contract and project management. All four types produce outputs with
a deep product structure (high product complexity), but differ in the core competencies,
source of competitive advantage, degree of vertical integration, supplier relationships,
environment and types of risk.
36

[Chapter 2 - Literature Review]
From the review in this section, which focussed primarily on literature relating to literature
stream 1, supply chain structures, it can be concluded that:
■ There is a range of structures that describe the characteristics of different supply
chains. The majority of models use the CODP as a way of distinguishing between
different structures;
■ There is a lack of clarity as to the appropriate terminology to use to describe the
ETO supply chain type;
■ ETO supply chain frameworks agree that the production flow is all driven by actual
customer orders with the decoupling point located at the design stage, but disagree
on the definitions for the design dimension. Some argue that ETO companies
modify existing orders, while others argue that completely new designs are
developed to order. Wikner and Rudberg’s (2005) decoupling approach offers a
useful starting point for considering the relationship between design and production
dimensions;
■ Several types of ETO system may exist. Amaro et al. (1999) and Hicks et al. (2001)
both identified four different types of ETO organisations.
2.6 STRATEGIES FOR ETO SUPPLY CHAINS
This section will now review the literature that has specific relevance to developing
strategies for the ETO sector. These papers have been classified as literature stream 2,
strategy. Literature stream 2 also includes, where appropriate, literature relating to strategies
for the build-to-order sector as a whole. The classification illustrated in Table 2.7 outlines
the main themes from this category and the linkages with the other two categories of
literature.
37

[Chapter 2 - Literature Review]
Literature Stream C ategoryStrategy Stream 1: Supply Chain
StructuresStream 2: ETO Strategy Stream 3: Lean and
AgileShift between supply chain
structure to suit marketplace/
Standardisation/ Reduce
complexity.
7(Lampel and Mintzberg, 1996; Martlnez-Olvera
and Shunk, 2006; Olhager, 2003; Rudberg
and Wikner, 2004; Wadhwa et al., 2006; Wikner and Rudberg,
2005; Yang and Bums, 2003)
9(Barlow et al., 2003; Gann, 1996;
Hicks et al., 2000; Holweg and Pil, 2001; Ireland, 2004; Jahnukainen and
Lahti, 1999; Krajewski et al., 2005; Voordijk et al., 2006; Wacker and
Miller, 2000)
5(Ballard and Howell, 1998; Barlow, 1999;
Christopher and Towill, 2002; Naylor
eta l., 1999)
Supply chain Integration
1(Hicks eta l., 2001)
14(Caron and Fiore, 1995; Cox and Thompson, 1997; Dainty et al.,
2001a; ElfVing et al., 2005; Hicks et al., 2000 ,2001; Ireland, 2004; Jahnukainen and Lahti, 1999;
Kingsman et al., 1996; Parker et al., 2008; Thompson et al., 1998;
Vrijhoef and Koskela, 2000; Y eo and Ning, 2002)
7(Christopher, 2000;
Christopher and Towill, 2002; Cox
and Chicksand, 2005; Narasimhan et al.,
2006; Naylor et al., 1999; Storey et al.,
2005; Vonderembse et al., 2006)
InformationManagement
3(Hameri, 1997; Porter et
al., 1999; Tu, 1997)
9(Bertrand and Muntslag, 1993; Corti et al., 2006; Donselaar et al., 2001; Ebadian et al., 2008; Gelders, 1991; Karkkainen et al., 2003; Little et al.,
2000; Wortmann, 1995; Zorzini et al., 2008)
3(Christopher, 2000; Naylor eta l., 1999; Storey et al., 2005)
Business Systems Engineering
/Business Process Re-engineering.
0 4(Cameron and Braiden, 2004;
Childerhouse et al., 2003b; McGovern et al., 1999; Towill, 2001)
0
Flexibility 3(Martlnez-Olvera and
Shunk, 2006; Tu, 1997; Wadhwa et al., 2006)
5(Coronado and Lyons, 2007; Gann, 1996; Gil et al., 2005; H olweg and Pil, 2001; Krajewski et al., 2005;
Salvador et al., 2007)
4(Christopher and
Towill, 2002; Cooney, 2002;
Narasimhan et al., 2006; Naylor et al.,
1999)
Time Compression 0 6(Bozarth and Chapman, 1996; Chin-
Sheng, 2006; ElfVing et al., 2005;Handfield, 1994; Tersine and
Hummingbird, 1995; Towill, 2003)
3(Christopher, 2000;
Mason-Jones and Towill, 1999; Naylor
eta l., 1999)
N ew Product Development
Process Improvement
0 3(Caron and Fiore, 1995; Karkkainen et al., 2001; Rahman et al., 2003b)
0
Table 2.7: Sum m ary o f strategies for ETO supply chains
38

[Chapter 2 - Literature Review]
Shift between supply chain structures
There is a large body of literature that promotes the movement from a MTS strategy to a
BTO strategy to gain competitive advantage (Gunasekaran and Ngai, 2005; Hicks et al.,
2001; Salvador et al., 2007). A much smaller body of knowledge exists that has explored
organisations and supply chains that operate in markets that dictate a BTO or ETO
approach. Amaro et al (1999) highlighted that the ability to customise is not always
necessarily a source of competitive advantage, in pure customisation markets it may only
qualify an organisation to operate in such markets. A possible strategy to manage the
diverse product variety in the ETO sector is to forward shift through supply chain structures
via modularity. In the house building and commercial sector there have been moves to
forward shift through the supply chain structures by adopting modular design and greater
standardisation of supply chain activities (Barlow et al., 2003; Voordijk et al., 2006). Hicks
et al. (2000), researching the capital goods sector, found that modular configurations and
standard items can reduce costs and lead times.
Supply chain integration
Addressing supply chain management for ETO systems, Vrijhoef and Koskela (2006)
suggested four roles that are pertinent to construction: improving the interface between site
activities and the supply chain, improving the supply chain, transferring activities from the
site to the supply chain and integration of site and the supply chain. Jahnukainen and Lahti
(1999) argued that JIT and supplier development initiatives from high volume sector can be
used, such as reduction of suppliers, deeper and longer lasting relationships and suppliers
controlled as part of in-house manufacturing. Hicks et al. (2000) emphasized that some
lessons can be learnt from the high volume sector, such as reduction of the supplier base
and long term relationships, but that the characteristics of ETO markets significantly
constrain the application of established supply chain management methods. Briscoe and
Dainty (2005) found that the large number of supply chain partners and the significant level
of fragmentation in the construction environment place constraints on the level of supply
chain integration that is achievable. Ireland (2004) concluded that demand regularity and
39

[Chapter 2 - Literature Review]
power regimes are the key variables dictating which supply chain management techniques
are suitable and those which are not.
Information Management
Van Donselaar et al. (2001) concluded that advanced demand information, even if
incomplete and imperfect, can help manufacturers in a project supply chain reduce their
demand uncertainty. This helps manufacturers to reduce the stock of finished goods.
Karkkainen et al. (2003) explored the potential of utilising web and product identification
technologies to overcome logistical challenges of a project supply chain. They concluded
that many benefits can be gained from using an identity based system for tracing, tracking
and control of project deliveries. Research examining information management systems for
production control of ETO systems has also been published. Bertrand and Muntslag (1993)
and Little et al. (2000) addressed the failure of the Material Resource Planning (MRP)
production control system to effectively manage an ETO system. They suggest that the
characteristics of an ETO system differ substantially from the basic assumptions of MRP.
Both papers propose different production control systems to take into account the high level
of uncertainty and customer specific product specifications. Wortman (1995) compares the
information systems for a MTS and an ETO system and suggested that information and
production systems for an ETO supply chain should allow for basic information to be
incomplete, partly inconsistent, or not up to date.
Business Systems Engineering
Business Systems Engineering (BSE) and Business Process Re-engineering (BPR) have
also been proposed as routes to improving the ETO sector. Towill (2001) applied the
Understand, Document, Simplify and Optimise (UDSO) BSE routine to a Doyle Wilson
case study to demonstrate a successful application of the systems approach by a housing
contractor. Childerhouse et al. (2003b) provided a case study to show best practice for
business process re-engineering and cycle time compression in construction. They
demonstrated how a BPR programme yielded substantial improvements in measures such as
cycle times, delivery frequencies, stock turns, profit margin and annual volume. BPR was
carried out across four different areas: JIT manufacturing, reducing lead times, supplier
integration and customer integration. However, Cameron and Braiden (2004), when
40
[Chapter 2 - Literature Review]
applying BPR techniques to four different ETO companies, found some difficulties emerged
when trying to apply BPR in the ETO sector. Redesigning processes within functional areas
was found to be useful and easy but difficulties increased when functional boundaries and
supply units were crossed. The absence of risk assessments in BPR methodologies was also
noted as a key constraint for its application in the ETO sector.
Flexibility
Flexibility has been considered as crucial to ETO strategy. Salvador et al. (2007)
highlighted the importance of volume and mix flexibility in implementing a BTO system. In
particular they highlight product flexibility, assembly flexibility, workforce flexibility and
supplier flexibility. However, they suggest that there are tradeoffs and synergies associated
with different types of flexibility. Holweg and Pil (2001) suggested that the three
dimensions of a successful BTO strategy are process flexibility, product flexibility and
volume flexibility. Krajewski et al. (2005) explored the flexibility strategies suppliers use
to respond to schedule changes in BTO supply chains and argue that two distinct strategies
have emerged from the case studies examined, ‘reduce uncertainty’ and ‘cope with
uncertainty’. Tu (1997) also suggested that one-of-a-kind production companies require
flexible or dynamic control structures and adaptable production scheduling. The flexibility
literature is important for this thesis and Part 3 of the literature review will explore the
flexibility body of knowledge in greater depth.
Time Compression
The application of time compression principles has been proposed to improve ETO supply
chains. The importance of time compression is highlighted in Towill’s (2003) conclusion
that a 40% reduction in project time can lead to a 25% reduction in total work undertaken
and costs. In particular, procurement and the competitive bidding, as well as the design
stage have been highlighted as being time bottlenecks for ETO supply chains (ElfVing et al.,
2005; Gosling et al., 2007a). In addition, concurrent engineering has been suggested as a
way of reducing the time to market in a MTO system (Babu, 1999).
7
41

[Chapter 2 - Literature Review]
New Product Development Process Improvement
Rahmin et al. (2003b) suggested that ETO companies can achieve business objectives more
effectively by reducing design iterations and rework, recognizing customers’ requirements
up-front and building quality into design and manufacturing. They analysed existing
frameworks from published literature and find that existing frameworks are not suitable for
ETO companies. They proposed a set of requirements for establishing a design and
manufacture framework specifically for ETO companies. Caron and Fiore (1995) explored
the integration of product development processes in the ETO system and its integration with
logistics and project management. They suggested that taskforces help to facilitate
information exchange between the design and manufacture stages.
From the review in this section it can be concluded that:
■ Research relating to strategies for ETO supply chains can be classified under six
different categories: shift between supply chain structures, supply chain integration,
information management, business systems engineering, flexibility, time
compression and new product development process improvement;
■ Strategies for organisations operating in low volume, highly customised, ETO
environments have received much less attention from researchers than high volume,
standardised, MTS environments;
■ Some supply chain management and BPR techniques may be appropriate for ETO
supply chains but confusion exists as to which may be suitable. The variables
offered by Ireland (2004), demand regularity and power regimes, are useful for
considering which strategies are appropriate or not;
■ Various types of flexibility are required to compete effectively in a BTO or ETO
supply chain but there are no agreements on what types of flexibilities are required,
or if there are synergies or tradeoffs between them.
2.7 LEAN AND AGILE PARADIGMS AND THE ENGINEER-TO-ORDER SUPPLY
CHAIN
This review has* now covered literature relating to supply chain structures and literature
relating specifically to the ETO or BTO strategies. This section will synthesize literature
42

[Chapter 2 - Literature Review]
related to two the paradigms discussed in Part 1 of the literature review: lean thinking and
agile manufacturing. Table 2.8 summarises some of the key literature relating to this area.
Literature Stream C ategoryThem e Stream 1: Supply Chain
StructuresStream 2: ETO
StrategyStream 3: Lean and A gile
Definitions / Integrating Lean
and Agile
0 1(Gann, 1996)
15(Christopher, 2000; Christopher and Towill, 2001; Gunasekaran,
1999; Hines et al., 2004; Katayama and Bennett, 1999; Mason-Jones et al., 2000; Narasimhan et al., 2006; Naylor et al., 1999; Papadopoulou and Ozbayrak, 2005; Sanchez and Nagi, 2001; Sanderson and Cox,
2008; Sharp et al., 1999; Vonderembse et al., 2006; Yusuf and Adeleye, 2002; Yusuf et al.,
1999)Match supply
chains strategies to your market place / Agile suitable for
non make-to-stock structures whereas
lean suitable for make-to-stock
structures
9(Fisher, 1997;
Gunasekaran and Ngai, 2005; Lampel and Mintzberg, 1996;
Martlnez-Olvera and Shunk, 2006; Olhager,
2003; Rudberg and Wikner, 2004; Wadhwa et
al., 2006; Wikner and Rudberg, 2005; Yang and
Bum s, 2003)
1(Gann, 1996)
5(Christopher, 2000; Mason-Jones et
al., 2000; Naylor et al., 1999; Towill et al., 2002; Vonderembse et
al., 2006)
Critique o f the Applicability o f
Lean
0 2(Gann, 1996; Ireland,
2004)
4(Cooney, 2002; Cox and
Chicksand, 2005; Cusumano, 1994; Green, 1999)
One Paradigm fits in another
0 1(Holweg, 2005)
5(Hines et al., 2004; Narasimhan et
al., 2006; Papadopoulou and Ozbayrak, 2005; Storey et al.,
2005; Van-Hoek, 2000)
Lean ETO Supply Chains.
1(Tu, 1997)
4(Chin-Sheng, 2006; ElfVing et al., 2005; Gann, 1996; Ireland,
2004)
4(Ballard and Howell, 1998,2002; Barlow, 1999; Naim and Barlow,
2003)
Agile ETO Supply Chains.
1(Tu, 1997)
2(Chin-Sheng, 2006;
Ireland, 2004)
5(Babu, 1999; Barlow, 1999; Barlow
and Ozaki, 2003; Gosling et al., 2007a; Naim and Barlow, 2003)
Table 2.8: Lean and A gile Strategies and the ETO supply chain
43

[Chapter 2 - Literature Review]
Numerous guidelines for the application of lean and agile paradigms have been suggested.
A common approach is the use of supply chain structure concepts to help determine their
applicability. The literature suggests that increasing levels of leanness are appropriate
moving towards the STS structure, where products and processes are more standardised,
and increasing levels of agility are appropriate moving towards the opposite end of the
spectrum towards the ETO structure, where products and processes are more customised
(Christopher, 2000; Gosling et al., 2007b; Naylor et al., 1999). It is also worth noting that a
combination of the approaches, leagility, has been proposed and is more commonly
associated with the ATO supply chain structure (Mason-Jones et al., 2000; Naylor et al.,
1999; Van-Hoek, 2000).
Both lean and agile strategies have been proposed in the ETO sector. Koskela (1992)
proposed that the construction industry needed to adopt a new production philosophy based
on the emerging methodologies, techniques and tools associated with lean production.
Similarly, the Egan Report (1998) argued that lean principles, such as standardisation, JIT
and long term partnerships with suppliers should be adopted. The International Group for
Lean Construction (IGLC) has also been formed and numerous researchers have attempted
to define and research ‘lean construction’. However, the extent to which lean principles are
suitable in the ETO or BTO environment has been questioned (Cooney, 2002).
Agility has also been suggested as a suitable strategy for the BTO and ETO sector, but has
received less attention. Agility has been proposed as a strategy in the BTO manufacturing
literature (Babu, 1999; Gunasekaran and Ngai, 2005), and as a good conceptual fit with the
characteristics of the ETO supply chain (Gosling et al., 2007b). Agility has also been
proposed in the construction sector (Barlow, 1999; Naim and Barlow, 2003). In summary,
although there is a good conceptual fit between agility and the ETO sector there is little
empirical testing available to draw firm conclusions.
From the review in this section it can be concluded that:
■ There are disagreements as to the boundaries, definitions and applicability of
leanness and agility;
44

[Chapter 2 - Literature Review]
■ Lean, agile and leagile strategies can be mapped onto supply chain structures to help
determine their applicability. This approach would suggest that agility is more suited
to the ETO supply chain and leanness to a STS supply chain;
■ Both lean and agile strategies have been proposed in the literature as strategies for
the ETO and BTO sector, but there is no clear answer regarding their applicability.
2.8 RESEARCH METHODOLOGY AND SECTORIAL ANALYSIS
2.8.1 Research Methods
Although the overall sample is quite small it is still possible to make some generic
observations of the results within a methodological framework. Table 2.9 shows a summary
of the different research methods used in the different streams of literature. The ETO
literature streams support Burgess et al. (2006), who highlighted the relative immaturity of
supply chain management research and the need to further understand the landscape of
supply chain management. This is reflected in the dominance of conceptual and case study
approaches with much less research undertaking large scale questionnaires or surveys.
Across all three streams of literature there is a shortage of focus group research and
questionnaire research contributing to the development of the ETO type. Conceptual and
case study research account for the majority of papers in the review. Dainty et al. (2001)
provided the only use of focus groups across all streams. They used a mixture of focus
groups and interviews to identify the barriers to supply chain integration. Tools and models
are well represented in the strategy literature stream but are not so well represented in the
other two streams.
45

[Chapter 2 - Literature Review]
Literature Stream C ategoryM ethod Stream 1: Supply Chain
StructuresStream 2: ETO Strategy Stream 3: Lean and
A gileConceptual 9
(Gunasekaran and Ngai, 2005; Lampel and Mintzberg, 1996;
Martinez-Olvera and Shunk, 2006; Olhager,
2003; Porter et al., 1999; Rudberg and Wikner,
2004; Samadhi and Hoang, 1995; Wikner and Rudberg, 2005; Yang and
Bums, 2003)
11(Bozarth and Chapman, 1996; Chin-
Sheng, 2006; Cox and Ireland, 2002; Cox and Thompson, 1997; Gelders, 1991; H olweg and Pil, 2001; Karkkainen et al., 2003;
Tersine and Hummingbird, 1995; Towill, 2003; Wacker and Miller,
2000; Yeo and Ning, 2002)
13(Babu, 1999;
Christopher, 2000; Cusumano, 1994; Green,
1999; Gunasekaran, 1999; Hines et al., 2004;
Mason-Jones et al., 2000; Mason-Jones and Towill, 1999; Sanchez and Nagi, 2001; Towill et al., 2002; Van-Hoek, 2000; Vonderembse et al., 2006; Y usuf et al.,
1999)
Primary case study
4(Amaro et al., 1999;
Hameri, 1997; Hicks et al., 2001; Wadhwa et al.,
2006)
19(Barlow et al., 2003; Childerhouse et al., 2003b; Coronado and Lyons,
2007; Dainty et al., 2001a; Donselaar et al., 2001; ElfVing et al., 2005; Gann, 1996; Gil et al.,
2005; Handheld, 1994; Hicks et al., 2000; Ireland, 2004; Jahnukainen and Lahti, 1999; Krajewski et al.,
2005; McGovern et al., 1999; Salvador et al., 2007; Thompson et
al., 1998; Voordijk et al., 2006; Vrijhoef and Koskela, 2000; Zorzini
et al., 2008)
11(Ballard and Howell, 1998; Barlow, 1999;
Barlow and Ozaiki, 2003; Cooney, 2002; Cox and
Chicksand, 2005; H olweg, 2005; Naim and Barlow, 2003; Naylor et al., 1999; Papadopoulou
and Ozbayrak, 2005; Sanderson and Cox,
2008; Storey et al., 2005)
Focus Groups 0 2(Cameron and Braiden, 2004;
Dainty et al., 2001a)
0
Survey / Questionnaire
0 2(Little et al., 2000; Parker et al.,
2008)
4(Katayama and Bennett, 1999; Narasimhan et al., 2006; Sharp et al., 1999;
Y usuf and Adeleye, 2002)
Tool/Model 1(Tu, 1997)
11(Bertrand and Muntslag, 1993;
Cameron and Braiden, 2004; Caron and Fiore, 1995; Corti et al., 2006; Ebadian et al., 2008; Karkkainen et
al., 2001; Kingsman et al., 1996; Little et al., 2000; Rahman et al., 2003b; Towill, 2003; Wortmann,
1995)
3(Ballard and Howell,
2002; Christopher and Towill, 2001;
Christopher and Towill, 2002)
Table 2.9: Em erging research m ethods from the ETO literature
46

[Chapter 2 - Literature Review]
Stream 1 is largely conceptual with only a few papers making use of secondary case studies
to highlight differences between supply chain structures. All other types have little or no
representation. Notable exceptions here include Whadhwa et al.’s (2006) use of automotive
case studies to develop postponement strategies, Amaro et al.’s (1999) 22 case studies of
non MTS companies including 4 ETO firms and Hicks et al.’s (2001) study of five ETO
companies. Stream 2 is well represented by case research, conceptual and tools/model
development. Survey and focus group research are not well represented. Finally, stream 3 is
well represented by conceptual and case research but less so in all other research methods.
2.8.2 Sector Analysis
Table 2.10 illustrates the different sectors that have been studied in the ETO literature
streams. Overall, construction is the dominant sector for the ETO literature, followed by
capital goods. Stream 1 is mostly conceptual and focuses on generic types of supply chains
rather than specific sectors. Stream 2, ETO strategy, is concentrated around the construction
and capital goods industries. However, there are notable exceptions in the high tech
industry, automotive and consumer electronics. Stream 3 shows a more varied profile with
lean and agile paradigms being explored across a wide range of industries. High tech and
capital goods industries are not represented in stream 3, but it is the only stream to include a
paper from the shipbuilding industry (Sanderson and Cox, 2008). Defillipi and Arthur’s
(1998) analysis of the film making industry highlights that there are many industries,
including law cases, software writing and shipbuilding that share similar underlying ETO
characteristics. Empirical research relating these sectors to the wider ETO body of literature
would contribute significantly to the development of the ETO type.
47
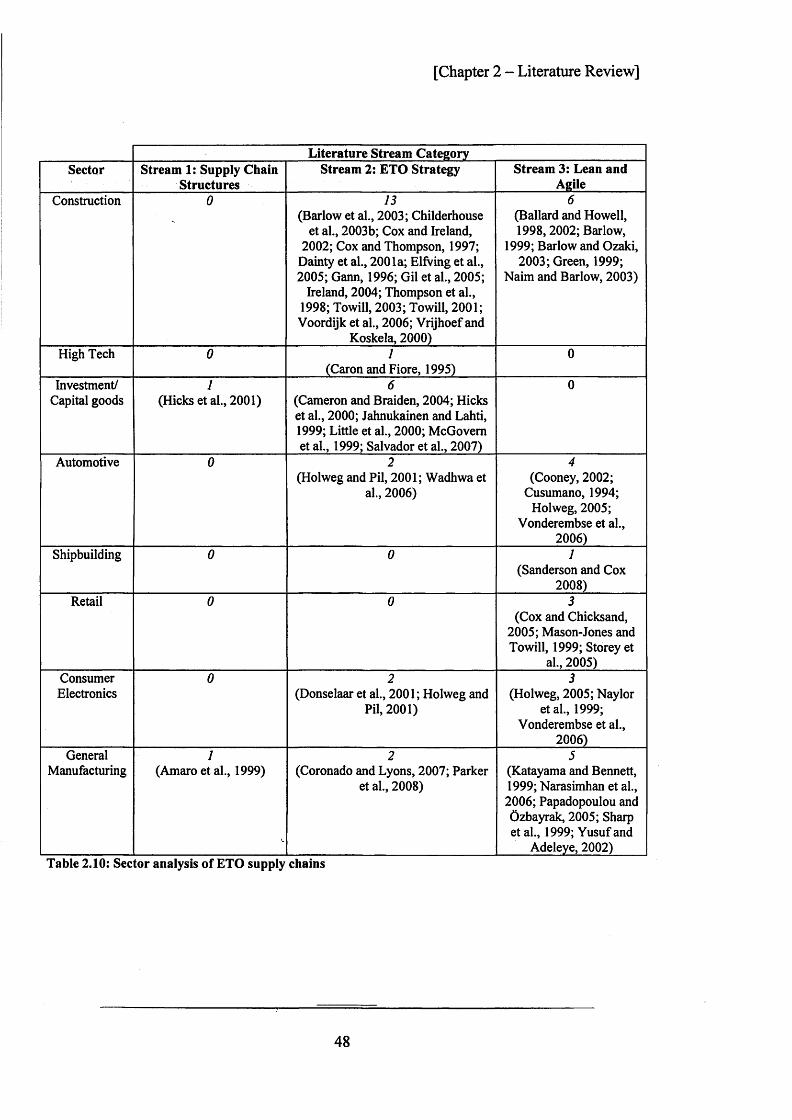
[Chapter 2 - Literature Review]
Literature Stream C ategorySector Stream 1: Supply Chain
StructuresStream 2: ET O Strategy Stream 3: Lean and
A gileConstruction 0 13 6
(Barlow et a l , 2003; Childerhouse et al., 2003b; Cox and Ireland,
2002; Cox and Thompson, 1997; Dainty et al., 2001a; ElfVing et al., 2005; Gann, 1996; Gil et al., 2005;
Ireland, 2004; Thompson et al., 1998; Towill, 2003; Towill, 2001;
Voordijk et al., 2006; Vrijhoef and Koskela, 2000)
(Ballard and Howell, 1998,2002; Barlow,
1999; Barlow and Ozaki, 2003; Green, 1999;
Naim and Barlow, 2003)
High Tech 0 1(Caron and Fiore, 1995)
0
Investment/ 1 6 0Capital goods (Hicks et al., 2001) (Cameron and Braiden, 2004; Hicks
et al., 2000; Jahnukainen and Lahti, 1999; Little et al., 2000; McGovern et al., 1999; Salvador et al., 2007)
Automotive 0 2(Holweg and Pil, 2001; Wadhwa et
al., 2006)
4(Cooney, 2002;
Cusumano, 1994;Holweg, 2005;
Vonderembse et al., 2006)
Shipbuilding 0 0 1(Sanderson and Cox
2008)Retail 0 0 3
(Cox and Chicksand, 2005; Mason-Jones and Towill, 1999; Storey et
al., 2005)Consumer 0 2 3
Electronics (Donselaar et al., 2001; H olweg and Pil, 2001)
(Holweg, 2005; Naylor eta l., 1999;
Vonderembse et al., 2006)
General 1 2 5Manufacturing (Amaro et a l , 1999) (Coronado and Lyons, 2007; Parker
et al., 2008)(Katayama and Bennett, 1999; Narasimhan et al., 2006; Papadopoulou and Ozbayrak, 2005; Sharp et al., 1999; Yusuf and
Adeleye, 2002)Table 2.10: Sector analysis o f ETO supply chains
48

[Chapter 2 - Literature Review]
2.9 SYNTHESIS
Literature stream 1 was primarily used to identify the unique characteristics of ETO supply
chains (see section 2.6). Literature stream 2 was primarily used to identify the strategies for
ETO supply chains (see section 2.7). Literature stream 3 was primarily used to investigate
the relationship between lean and agile paradigms and the ETO supply chain (see section
2.8). The different literature streams have been integrated in each section to identify links
between the literature streams. Section 2.9 discussed the research methods used across all 3
literature streams. Figure 2.3 shows a summary of responses developed in this paper to the
research questions posed in the structured literature review. These findings emerge from the
preceding discussion of the 3 different literature streams. Based on these findings, four
recommendations are proposed for future investigation of the ETO supply chain. These
recommendations are now discussed in turn.
2. Operational strategies for the ETO supply chains
3. The relationships between lean and agile paradigms and the ETO
supply chain.
1. Definition o f the ETO supply chain
ETOSupplyChain
•Shift between supply chain structures•Supply chain integration•Information management•Business systems engineering•Flexibility•Time compression•New product development processimprovement
• Across all 3 streams of ETO literature there is a dominance of conceptual and case study approaches.• Across all 3 streams of ETO literature there is a lack o f focus groups and survey based research •Supply chain structure literature is largely conceptual with some use of secondary case studies.
•There are disagreements as to the boundaries, definitions and applicability •Lean, agile and leagile strategies can be mapped onto supply chain structures to help determine their applicability.•Agility has a good ‘conceptual fit’ with the ETO supply chain•Both strategies have been proposed, but there is no clear answer for applicability.
•Production flow in an ETO supply chains is all driven by actual customer orders.• The decoupling point is located at the design stage.•ETO companies may modify existing designs or develop completely new designs.•Several types o f ETO supply chain organisation exist
4. Methodological approaches to studying ETO supply chains
Figure 2.3: Synthesis o f structured literature review
49
[Chapter 2 - Literature Review]
2.9.1 Towards a comprehensive definition of the ETO supply chain
The first objective of the structured literature review was to identify the unique
characteristics of the ETO supply chain. The supply chain structure stream of literature
characterises the ETO supply chain as one of a number of supply chain structures, which
has a high degree of customisation when compared with other structures. The strategy
stream of literature has also contributed to the development of definitions for the ETO
supply chain by describing contexts and industrial sectors while exploring ETO strategy.
This review has helped to highlight some of the commonalities of ETO types and some of
the differences between ETO types in different sectors. The commonalities are that the ETO
supply chain operates in a project environment and that each product is different to the last.
Production dimensions of the supply chain are completely customised and the decoupling
point is located at the design stage. The differences are that existing designs maybe
modified-to-order or completely new designs are developed-to-order. There may also be
sector specific differences. For example, each construction project has to be completed on a
new site, whereas shipbuilding may take place at a fixed location.
2.9.2 Tailoring strategies for the ETO sector
The second objective of the structured literature review was to identify operational
strategies have been proposed to improve performance in the ETO sector. Research relating
to strategies for ETO supply chains has been classified under six different categories in this
paper: shifting between supply chain structures, supply chain integration, information
management, business systems engineering, flexibility, time compression and new product
development process improvement. The review also suggests that some strategies may be
more appropriate for ETO supply chains while others may be less suitable. For example,
research relating to supply chain integration and BPR techniques has received mixed
conclusions from researchers. It is also unclear as to whether the strategy of shifting through
supply chain structures undermines the strategic advantage gained from offering
customisation to clients and customers. Information management, flexibility, time
compression and new product development process improvement have a greater level of
consensus regarding their appropriateness.

[Chapter 2 - Literature Review]
2.9.3 Identifying appropriate applications of lean and agile paradigms in the ETO
sector
The third objective of the structured literature review was to identify the relationship
between lean and agile paradigms and the ETO supply chain. Both lean and agile strategies
have been proposed in the literature as strategies for the ETO and BTO sector, but there is
no clear answer regarding their applicability. Indeed, this review has highlighted that there
are broad disagreements as to the boundaries, definitions and applicability of leanness and
agility across many different sectors. In some cases supply chain structures have been used
to help determine their applicability. These studies suggest that agility may be more suited
to the ETO supply chain and leanness to STS supply chains, but there is little empirical
research testing this proposition. More empirical research examining the extent to which
lean and agile paradigms apply to different sectors and supply chain structures would
strengthen the ETO body of knowledge.
2.9.4 A range of methodological approaches
The fourth objective of the structured literature review was to identify the methodological
approaches that have been utilised to study ETO supply chains. Literature stream 1, relating
to supply chain structures, is largely conceptual with some use of secondary case studies.
Literature stream 2 is well represented in conceptual studies, case study research and
tool/model development, but is not well represented by focus groups and survey research.
Literature stream 3 is well represented by conceptual and case study research, and less well
represented by focus groups, survey and tool/model development. Across all 3 literature
streams there is a dominance of conceptual and case study approaches. There is also a lack
of focus group and survey based methods. Research addressing the gaps in these literature
streams is encouraged to achieve coverage from a broad range of methodological
perspectives.
51
[Chapter 2 - Literature Review]
2.10 IMPLICATIONS FOR THE THESIS
From the structured literature review it can be conclude that the ETO supply chain operates
in a project environment and that each product is different to the last. Production
dimensions of the supply chain are completely customised and the decoupling point is
located at the design stage. The differences are that existing designs maybe modified-to-
order or completely new designs are developed-to-order. However, there may be specific
differences between different ETO sectors.
The structured literature review has provided a framework to understand the developments
that have emerged in the literature relating specifically to the ETO supply chain as well as
providing a theoretical grounding for this thesis. There are a number of important
implications for this thesis. Firstly, all 3 literature streams support the need to tailor
strategies to the ETO supply chain. Literature stream 2 highlights that there is no consensus
as to which strategies may be the most appropriate. Literature stream 3 highlights the lack
of empirical investigation of lean and agile approaches to the ETO sector. Secondly, there is
a lack of focus group research across all 3 literature streams. Finally, flexibility has been
considered as important for a BTO and ETO strategy, but the flexibility types required, and
the tradeoffs and synergies between different flexibility types, are unclear. The flexibility
literature is addressed in more details in the next part of the literature review.
2.11 SUPPLY CHAIN UNCERTAINTY
Uncertainty can be defined as “a state or condition, ranging from falling short of certainty to
an almost complete lack of conviction or knowledge about an outcome or result” (Merriam-
Webster, 2009). Uncertainties affecting supply chain operations are recognized as
significant obstacles to achieving value for customers. As a result, researchers in the field of
operations management and supply chain management have examined sources and types of
supply chain uncertainty and strategies to cope with such uncertainties (Childerhouse and
Towill, 2004; Mason-Jones and Towill, 1998; Prater et al., 2001; van der Vorst and
Beulens, 2002; Wilding, 1998). While it has been acknowledged that different types of
52

[Chapter 2 - Literature Review]
supply chains are associated with different uncertainty profiles, the supply chain uncertainty
literature has not addressed the particular sources of uncertainty and risk related to the ETO
supply chain. Furthermore, the supply chain uncertainty circle has been successfully applied
in a range of sectors, but there are no applications in the construction sector. This prompts
the second research question.
Research Question 2: How can the sources o f uncertainty in ETO construction supplychains be identified and categorized?
Davis (1993) suggests that the underlying problem when managing complex networks is
“the uncertainty that plagues them”. Geary et al. (2002) support this by asserting that
“uncertainty rules the supply chain”. A considerable amount of research exists on
identifying and managing uncertainty in supply chain management (Childerhouse and
Towill, 2004; Geary et al., 2002; Mason-Jones and Towill, 1998; van der Vorst and
Beulens, 2002; Wilding, 1998). Understanding the sources of supply chain uncertainty and
managing these uncertainties is clearly of interest to researchers and practitioners alike.
Uncertainty and risk are very often confused or used interchangeably. In this thesis a
distinction is made between the two. Raftery (1994) suggested that risk is generally taken to
have quantifiable attributes, whereas uncertainty does not, and that risks are insurable,
whereas uncertainties are not. He also proposes a continuum with risks on one extreme,
quantifiable, data driven and open to statistical testing, and uncertainties at the other, based
on subjective probability and informed opinion. This is supported by Rodrigues et al. (2008)
who argued that risk is a function of outcome and probability and hence it is something that
can be estimated; uncertainty, on the other hand, occurs when decision makers cannot
estimate the outcome of an event or the probability of its occurrence. The two concepts are
clearly closely related and intertwined. Uncertainty increases risk and risk is a consequence
of uncertainty.
Managing risk has emerged as an important topic in supply chain management. This is due
to a number of trends, including the increase in strategic outsourcing, the globalization of
markets, the increasing reliance on suppliers for specialized capabilities and innovation, and
/
53

[Chapter 2 - Literature Review]
the reliance on supply networks for competitive advantage (Narasimhan and Talluri, 2009).
While these trends offer innovative strategies for firms, they also increase the potential and
magnitude of supply chain risk (Blackhurst et al., 2005). Supply chain risk comes in many
different forms. Harland et al. (2003) classified these as strategic, operations, supply,
customer, asset impairment, competitive, reputation, financial, fiscal, regulatory and legal
risks. Chopra and Sohdi (2004) defined different categories of supply risk, including
disruptions, delays, systems, forecast, intellectual property, procurement, receivables,
inventory and capacity in their classification. Juttner et al. (2005) defined the basic
constructs of supply chain risk management as supply chain risk sources, risk consequences,
risk drivers and risk mitigation strategies. They argued that supply chain risk comprise “any
risks for the information, material and product flows from original supplier to the delivery
of the final product for the end user” (Juttner et al., 2005: p 200).
The argument that supply chain agility not only allows firms to respond efficiently and
effectively to unanticipated changes in the marketplace, but also works as a risk mitigation
strategy in managing anticipated and actual risks has been proposed by a number of
researchers (Chopra and Sodhi, 2004; Christopher, 2000; Narasimhan and Talluri, 2009).
Braunscheidel and Suresh (2009) found that agility and its antecedents is a disruption risk
management tactic that enables the firm and its partners to respond rapidly to market place
changes, and to respond rapidly to both potential and actual disruptions in the supply chain.
Juttner et al. (2005) and Chopra and Sodhi (2004) both emphasized flexibility as a risk
mitigation strategy.
A useful definition of supply chain uncertainty is offered by van der Vorst and Beulens
(2002): supply chain uncertainty refers to “decision making situations in the supply chain in
which the decision maker does not know definitely what to decide as he is indistinct about
the objectives; lacks information about its environment or the supply chain; lacks
information processing capacity; is unable to accurately predict the impact of possible
control actions on supply chain behaviour; or, lacks effective control actions”. Supply chain
uncertainty can lead to over-reactions, unnecessary interventions, second guessing, mistrust
and distorted information flows (Childerhouse et al., 2003a; Christopher and Lee, 2004).
54

[Chapter 2 - Literature Review]
These observations highlight the need to effectively anticipate, identify, classify and assess
supply chain uncertainty.
Mason-Jones and Towill (1998), building on Davis (1993), developed the uncertainty circle
model to conceptualize the different sources of uncertainty that affect supply chain
performance. The uncertainty circle classifies supply chain uncertainty into four general
types: process, supply, demand and control. Process uncertainty affects internal abilities to
meet a target. Supply uncertainty results from poorly performing suppliers handicapping
value adding processes. Demand uncertainty is associated with specific customers in
relation to schedule variability and transparency of information flow. It also refers to the
difference between the end marketplace demand and orders placed by customers. Control
uncertainty affects the ability to transform customer orders into targets and supplier raw
material requests. It has subsequently been refined and applied in a number of different
ways (Childerhouse and Towill, 2004; Sanchez-Rodrigues et al., 2008; Towill et al., 2002)
and, therefore, it is considered as a suitable and robust basis for categorizing the
disturbances encountered in an ETO system, and for contrasting against other supply chain
types and sectors.
2.11.1 Supply chain uncertainty and the pipeline
The phrase ‘pipeline management’ was originally coined by Forrester (1961) to describe the
controlled flow of goods on demand. The pipeline has since been defined as the delay
between an order being generated and the delivery of that order (Berry et al., 1998; Mason-
Jones et al., 1997). Christopher (2005) referred to pipeline management as “the process
whereby manufacturing and procurement lead times are linked to the needs of the
marketplace” (p 154). Mason-Jones and Towill (1998) proposed that all supply chains have
two distinct pipeline lead times. The first is the order-to-raw-material supplier information
transfer pipeline. The second is the product transfer pipeline from raw material to customer.
Orders flow upstream and, as a direct consequence, products flow downstream. In
traditional supply chains individual companies have very little direct visibility of what is
happening anywhere else in the supply chain.
7
55

[Chapter 2 - Literature Review]
The importance of pipeline management has been confirmed by a number of studies.
Sterman (1989) found that the inclusion of pipeline information in a master production
schedule ordering rule can have a dramatic impact on improving dynamic behaviour and
reducing uncertainty. The findings of Berry et al. (1998) support this. A lack of
consideration of the pipeline can lead to costly swings in supply, production and inventory,
which in turn can lead to periods of poor customer service and excessive stock. Mason-
Jones et al. (1997) argued that it is essential that ordering systems include pipeline feedback
at every echelon of the supply chain. Typically, in a four level chain, demand amplification
can be halved by divulging marketplace data throughout the pipeline in a timely manner.
Christopher (2000) argued that lengthy and slow moving pipelines are unsustainable. The
goals of pipeline management are lower costs, higher quality, more flexibility and faster
response times. Two key strategies are, first, to reduce the length of the pipeline and,
second, speed up the flow through that pipeline (Christopher, 2005).
According to Christopher (2005), short lead times themselves are a source of competitive
advantage, but the reliability or consistency of lead times are equally important. Due to
bottlenecks, inefficient processes and fluctuations in the volume of orders handled, there
will often be considerable variation in the time taken for pipeline activities to be completed.
The overall effect can be a substantial reduction in the reliability of delivery. Davis (1993)
highlighted the importance of understanding variability from the supply side, both by
degree of inconsistency as measured by standard deviation and the root cause of these
variations. It is also important to understand the buying organisation’s response to this
variability in terms of safety stocks, ordering policies and collaborative arrangements.
There is also a significant amount of literature concerned with lead time analysis and
reduction. Schmenner (2001) proposed a theory of “swift, even flow”, with a focus on
increasing speed and reduction of variability. Time based competition advocates a
competitive strategy purely based on speed (Hum and Sim, 1996; Rich and Hines, 1997;
Stalk, 1988). Cycle time compression is based on the assumption that collapsing lead times
can lead to improved demand forecasting, quicker defect detection, quicker to market and a
shifting of the decoupling point towards the customer (Towill, 1996). It has also been noted
56
[Chapter 2 - Literature Review]
that agility requires the slashing of process lead time throughout the supply chain (Mason-
Jones and Towill, 1997).
Much of the research on pipelines has been conducted in high volume manufacturing
sectors. Sanderson and Cox (2008) concluded that complex project environments introduce
radical unpredictability into functional pipelines, which should demonstrate stable demand
patterns. ElfVing et al. (2005) found that project based production has characteristics, such
as competitive bidding, which stifle attempts at radical reduction in lead time. Project
supply chains may be part of existing, longer lived supply chains that operate regardless of
whether or not any one particular project exists. Alternatively, project supply chains may be
established specifically to meet one, or a small number of, project needs (Tommelein et al.,
2009). Pipelines in project environments, therefore, may operate under different constraints
and conditions than those in high volume make-to-stock structures. Hence, an
understanding of the pipeline is important for the study of ETO supply chains.
Berry et al. (1998) found that it is still common to find companies operating under
uncertainty as they have not adequately addressed the pipeline. Until pipelines are analysed
and re-engineered it is likely that they will experience protracted and variable lead times.
Christopher and Towill (2002) noted that a philosophy of ‘one size fits all’ does not apply
to pipeline design, implementation and control. Supply chain strategies must be contingent
on market conditions. An important gap highlighted by this review is that is that the
pipeline has not been researched in the ETO sector.
Synthesising the research gaps within the construction and pipeline management litertaure
the following can be articulated. Research in construction supply chains is still in its
infancy, and most of the supply chain research that has been conducted addresses the client-
main contractor relationship rather than relationships with upstream suppliers. While
pipeline management research, focusing on improving processes between order placement
and delivery, has been insightful, most of the research has focused on high volume stable
manufacturing supply chains.
57
[Chapter 2 - Literature Review]
Research question 2 can be formulated as:
Research Question 3: How can organisations improve pipelines in ETO construction
supply chains?
2.11.2 Project uncertainty
Part 1 of the literature review identified the project environment as a distinguishing feature
of ETO supply chains. This was reconfirmed in the structured literature review in part 2.
Consequently, the discussion on supply chain uncertainty would not be complete without
reference to the project management literature relating to project uncertainty. Project
heterogeneity is well documented in the literature. Differences such as location and the
amount of projects within an overall programme (Evaristo and van Fenema, 1999) and the
amount of technological uncertainty (Shenhar and Dvir, 1996) have been described in the
literature. As a result of this heterogeneity, and the uncertainty and risks that arise from it,
project risk has attracted a large amount of attention from practitioners and researchers.
Edwards and Bowen (1998) presented an analytical review of construction risk literature
from 1960 to 1997 and find over 280 papers relating to risk and risk management in
authoritative English language publications. A considerable amount of published material
relating to project risk analysis and assessment is available (Ackermann et al., 2007;
Chapman, 1997; Mulholland and Christian, 1999; Mustafa and Al-Bahar, 1991) and risk
management has also been a popular area for researchers (Al-Bahar and Crandall, 1990;
Chapman, 1997; Conroy and Soltan, 1998). Much of the risk management literature seeks
to establish formal risk management processes, protocols and management tools and
techniques.
Project uncertainty has received much less attention in the literature. Ward and Chapman
(2003) argued that the restricted focus of risk management must be modified to incorporate
an uncertainty management perspective. Perminova et al. (2008) developed definitions of
uncertainty for project management scholars and define it as “a context for risks as events
having a negative impact on the project’s outcomes or opportunities” (Perminova et al.,
58

[Chapter 2 - Literature Review]
2008). DeMeyer et al. (2002) presented a useful classification of project uncertainty
defining four types. Variation, they argue, refers to uncertainties where performance levels
vary randomly but within a predictable range. Foreseen uncertainty refers to situations
where a few known factors will influence the project but in unpredictable ways. Unforeseen
uncertainty is where one or more major influence factors cannot be predicted and chaos
refers to unforeseen events that completely invalidate the project’s target, planning and
approach.
2.12 SUPPLY CHAIN FLEXIBILITY
2.12.1 What is flexibility?
Flexibility is defined by the Collins dictionary as the ability to be “bent easily without
breaking; pliable”. Flexibility in the operations management literature is generally
perceived as an adaptive response to environmental uncertainty (Gerwin, 1993). More
specifically, it is a reflection of the ability of a system to change or react with little penalty
in time, effort, cost or performance (Morlok and Chang, 2004; Upton, 1994). Hence,
flexibility may be seen as a proactive attribute designed into a system, rather than a reactive
behaviour that may in fact result in a detriment to time, effort, cost and performance (Naim
et al., 2006). This echoes Gerwin’s (1993) contrasting of a flexible factory, which quickly
adapts to realised uncertainty, and proactive flexibility, which controls uncertainty through
advance planning.
Slack (2005) found that managers accept that the word flexibility is used in two senses, to
mean range and response. Range refers to the range of states or behaviours that a system
can exhibit, whereas response refers to the ease with which the system moves from one state
to another. A system which moves quickly, smoothly and cheaply between a range of states
is considered as flexible. Flexibility may also be seen as having two distinct elements, those
internal to the business that describe system behaviour, and those that are viewed externally
by customers, which determine the actual or perceived performance of the company (Oke,
2005).
/
59

[Chapter 2 - Literature Review]
2.12.2 Why is flexibility important?
Flexibility is an effective response to uncertainty
The relationship between uncertainty and flexibility is well documented. Gerwin (1993)
and Schmenner and Tatikonda (2005) proposed that uncertainties are the impetus for a
manufacturing organisation to possess various flexibility types. Tang and Tomlin (2008)
examine the benefits of different flexibility strategies in the context of supply chain risk
management. They provided analytical models to illustrate the power of flexibility for
reducing supply chain risk. Swamidass and Newell (1987), using an analytical path method
and an empirical study of 35 manufacturing firms, confirmed that the greater the level of
flexibility, the greater a firm’s performance was. They also found that an organisation may
find at least some help in coping with the high uncertainties imposed by their environment
by increasing manufacturing flexibility. The relationship between uncertainty and flexibility
has also been researched by Prater et al. (2001), Childerhouse and Towill (2004) and
Vickery et al. (1999). These studies all suggested that flexibility is an effective response to
uncertainty.
Flexibility is a source o f competitive advantage
The turbulence of the modem business environment is well documented (Christopher,
2005). Globalisation, technological change and more demanding customers, amongst other
drivers, result in higher levels of uncertainty for organisations. As customers demand faster
response times and a wider variety of products, flexibility, above all other measures of
manufacturing performance, is cited as a solution (Slack, 2005). Dreyer et al. (2004), in a
statistical analysis of the performance of 35 fish processing firms, conclude that flexibility
is a valuable skill that has a major impact on competitive position. A seminal work by Hitt
et al. (1998) argued that the most important attribute that firms must achieve to operate
effectively in the modem competitive landscape is that of strategic flexibility. This was
supported by Sanchez (1995), who concludes that in dynamic product markets relative
competitive advantage may be explained largely by firms’ differing strategic flexibilities.
Flexibility is an enabler o f agility
Agile supply chains have been promoted as a route to competitive advantage in modem
/
60

[Chapter 2 - Literature Review]
markets with flexibility as a key enabler to cope with high levels of uncertainty
(Christopher, 2000; Naylor et al., 1999; Prater et al., 2001; Yusuf et al., 1999).
Manufacturing flexibility has been well addressed in the literature (Gerwin, 1993; Koste
and Malhotra, 1999; Oke, 2005; Upton, 1994, 1995), but flexibility in the larger context of
supply chain flexibility has received less attention by researchers. As Oke (2005) has noted,
the subject of flexibility can be complex and confusing. The plethora of research on
flexibility has resulted in many perspectives and definitions. Ambiguity regarding
terminology still exists, although the fundamental ideas appear to be very similar (Naim et
al., 2006).
Agility has been proposed as a response to the high levels of complexity and uncertainty in
modem markets (Christopher and Juttner, 2000; Gunasekaran, 1999; Yusuf et al., 1999).
According to Naylor et al. (1999), “agility means using market knowledge and a virtual
corporation to exploit profitable opportunities in a volatile market place”. The link between
agility and flexibility is widely discussed in the literature (Christopher, 2000; Prater et al.,
2001; Swafford et al., 2006). Swafford et al. (2006) propose that the combined effect of
different types of flexibilities determine an organisation’s supply chain agility, with
flexibility being an antecedent of agility. Christopher (2000) suggested that the origins of
agility lie in flexible manufacturing systems.
2.12.3 The development of a model for supply chain flexibility
From manufacturing to supply chain flexibility
Early studies of flexibility focused on the value of flexible manufacturing systems,
establishing the importance of flexibility as a manufacturing capability, and attempting to
define it (Collins and Schmenner, 1993; Gerwin, 1993; Slack, 2005; Upton, 1994). This has
been followed by a number of papers seeking to establish more detailed definitions of
flexibility types and dimensions (D'Souza and Williams, 2000; Koste and Malhotra, 1999;
Koste et al., 2004; Oke, 2005; Vokurka and O'Leary-Kelly, 2000; Zhang et al., 2003). More
recently, the flexibility debate has refocused towards supply chain flexibility, suggesting
that manufacturing is too narrow in its scope and that flexibility must be conceived in the
broader context of the supply chain (Duclos et al., 2003; Pujawan, 2004; Sanchez and Perez,
[Chapter 2 - Literature Review]
2005; Swafford et al., 2006; Vickery et al., 1999). However, the supply chain flexibility
field is still at an early stage, and consensus regarding definitions, scope, meaning and
application has not yet been achieved.
Vickery et al. (1999) defined supply chain flexibility as an amalgamation of product
flexibility, volume flexibility, new product flexibility, distribution flexibility and
responsiveness flexibility. Swafford et al. (2006) built on this and develop a model that
explores the interactions among flexibilities with respect to design, sourcing, manufacturing
and logistics. Prater et al. (2001) identified speed and flexibility of sourcing, manufacturing
and delivery as key determinants of supply chain flexibility. Tachizawa and Thomsen
(2007) concluded that there are two main strategies that could be employed at supply chain
level in order to increase the flexibility of a supply chain: improved supplier responsiveness
and flexible sourcing.
In summary, much of the flexibility research relates to manufacturing. There is a
recognition that the scope needs to be widened to consider the flexibility of the supply
chain, but research is still at an early stage of development with very little empirical testing.
For this thesis it is important to note that supply chain flexibility has not been investigated
in the ETO construction sector. At this point Research Question 4 is introduced:
Research Question 4: How can flexibility be rationalised in ETO construction supply
chains?
Rationalisation ofsupply chain flexibility
Whilst the focus of flexibility is shifting from manufacturing to the wider supply chain,
there is, as yet, little consensus on the definitions and concepts related to supply chain
flexibility. The distinction between internal flexibilities, those internal to the business that
describe system behaviour, and external flexibilities, which are viewed externally by
customers, has already been noted (Oke, 2005). This section seeks to rationalise the internal
and external flexibility types that determine supply chain flexibility.
External flexibility types for manufacturing are well documented in the literature (Oke,
/
62

[Chapter 2 - Literature Review]
2005). These have been synthesised by Naim et al. (2006), for both manufacturing and
logistics flexibility. The following flexibility types, which are proposed as the external
flexibility types of a supply system, are adapted from Naim et al. (2006) and can be defined
as:
• New product flexibility is the range of, and ability to, accommodate the production
of new product;
• Mix flexibility is the range and ability to change products currently being produced;
• Volume flexibility refers to the range of, and ability to, accommodate change in
production output;
• Delivery flexibility is the range of, and ability to, change delivery dates;
• Access flexibility is the ability to provide extensive coverage, and reflects the
capability of a supply chain to provide the required geographical coverage for
different customers.
Internal flexibility types have been determined by a classification of literature. The
classification of the supply chain flexibility literature can be found in table 2.11. It shows
two key internal flexibility types which are termed antecedents of supply chain flexibility:
vendor and sourcing flexibility. It is proposed that these two antecedents determine the
external flexibilities of a supply system, those that are visible to the customer. Vendor
flexibility consists of flexibilities related to manufacturing, warehousing and logistics.
Sourcing flexibility consists of the ability of the network co-ordinator to reconfigure the
supply chain, the ability to adapt to market requirements, ability to increase supplier
responsiveness and the ability of the network co-ordinator to integrate the supply chain.
Using the literature, the antecedents of vendor and sourcing flexibility are developed over
the following 2 sections. The following definitions are proposed:
1. Vendor flexibility - the specific types of flexibility relating to individual vendors that
support manufacturing, warehousing or transport operations.
2. Sourcing flexibility - the ability to reconfigure a supply chain network through selection
and de-selection of vendors.
63

[Chapter 2 - Literature Review]
A conceptual model for supply chain flexibility is shown in figure 2.4. It shows the 5
external flexibility types adapted from Naim et al. (2006) and the two antecedents of supply
chain flexibility developed from the classification in table 2.11.
Authors V endor Flexibility Sourcing FlexibilityM
anuf
actu
ring
War
ehou
sing
Log
isti
cs
Abilit
y to
Rec
onfig
ure
the
Supp
ly
Cha
in
Abili
ty
to A
dapt
to
Mar
ket
Req
uire
men
ts
Abili
ty
to In
crea
se
Supp
lier
Res
pons
iven
ess
Abili
ty
to In
tegr
ate
the
Supp
ly
Cha
in
(Abrahamsson et al., 2003) X X X(Baker, 2006) X X
(Das and Abdel-Malek, 2003) X X(Duclos et al., 2003) X X X
(Gerwin, 1993) X(Lee, 2004) X X
(Lummus, 2005) X X X(Naim et al., 2006) X(Prater et al., 2001) X X X
(Pujawan, 2004) X X X(Slack, 2005) X >
(Stevenson and Spring, 2007) X X(Stevenson and Spring, 2009) X X X
(Swafford et al., 2006) X X X X(Swafford et al., 2008) X
(Tachizawa et al., 2007) X X(Tachizawa and Gimenez, 2009) X X X
(Vickery et al., 1999) X X(Zhang et al., 2002) X X X
Total 9 4 8 6 6 4 7Table 2.11: C lassification o f supply chain flexibility literature
Vendor Flexibility
Vendor flexibility refers to the collective types of flexibilities offered by different vendors
in the supply chain. Vendor flexibility may be one or a combination of manufacturing,
warehousing and transport flexibilities. In a review of empirical research on manufacturing
flexibility, Vokurka and O’Leary-Kelly (2000) highlighted 15 dimensions of manufacturing
flexibility, most of them similar to those identified earlier by Koste and Malhotra (1999).
Amongst others, flexibility types and measurements have also been investigated by Slack
(2005), Gerwin (1993), Zhang et al. (2003) and Koste and Malhotra (2004). These have
been summarised by Naim et al. (2006) as either internal flexibility types, machine, process,
/
64

[Chapter 2 - Literature Review]
operation, capacity and re-routing flexibility, or external flexibility types, product, mix,
volume, delivery and access flexibility.
Warehousing flexibility has also been discussed in the literature. This would include the
ability of a system to cope with variable inventory volumes (Baker, 2006), time window
pressure (Abrahamsson et al., 2003; Barad and Even Sapir, 2003) and to offer additional
value-adding services such as different forms of palletisation, packaging and cross-docking
(Abrahamsson et al., 2003; Baker, 2006). Synthesising the literature on transport flexibility,
Naim et al. (2006) identified key components of transport flexibility. Nine internal
flexibility types are offered. The first three, mode, fleet and vehicle flexibility, relate to the
physical movement of the goods. Node, link and temporal flexibility are more closely
aligned with the infrastructure provision. The final three internal flexibility types are
capacity, routing and communication flexibility. The external flexibility types for a
transport system are the same as those defined in the previous section.
I n te rn a lF le x ib ili tie s
S u p p ly C h a in F le x ib ility
V e n d o rF le x ib ility
S o u r c in gF le x ib ility
F le x ib ili tie s
N e w P r o d u c t F le x ib ility
V o lu m eF le x ib ility
M ixF le x ib ility
D e liv e r yF le x ib ility
A c c e ssF le x ib ility
E x te r n a l
Figure 2.4: Conceptualisation of supply chain flexibility
At a supply chain level, Das and Abdel-Malek (2003) define flexibility as the “elasticity” of
the buyer-supplier relationship under changing supply conditions. They suggest that order
65

[Chapter 2 - Literature Review]
quantities and supply lead times are the two most common changes in supply chains.
Gosain et al. (2005) used “offering flexibility” to describe an important feature of supply
chain flexibility: the ability of a supply chain linkage to support changes in product or
service offering, in response to changes in the business environment. However, Swafford et
al. (2006) highlighted that such definitions of supply chain flexibility primarily focus on the
existing supply chain structure and have a narrow view of supply chain flexibility,
consistent with the idea of rigid flexibility (Collins and Schmenner, 1993). Stevenson and
Spring (2007) built on this, and argue that rigid flexibility, which is bounded by existing
relationships and existing supply chain structures, provides limited scope for flexibility in
the supply chain.
Sourcing Flexibility
An important component of sourcing flexibility is the ability to reconfigure the supply
chain. Tachizawa and Thomsen (2007) considered that flexible sourcing should involve the
adoption of a larger supplier base and constantly redesigning and reconfiguring the supply
chain. Stevenson and Spring (2007) referred to re-configuration flexibility, which they
described as the ease with which the supply chain can be reconfigured. Duclos et al. (2003)
described supply flexibility as the ability to reconfigure the supply chain altering the
product in line with demand. Hence, flexible sourcing is partly determined by the ability of
the leading firm to redesign the supply network quickly and at low cost. Chung et al. (2004)
provided a study of computer and peripheral firms which highlights how lead companies
rely on the ability to switch partners easily, allowing for greater organisational flexibility.
The same pattern was found in the apparel industry by Gereffi (1994), Christopher et al.
(2004) and Masson et al. (2007), where the main job of the core company was to make sure
that all the pieces of the network come together as an integrated whole.
Gosain et al. (2005) referred to “partnering flexibility” as the ease of changing supply chain
partners in response to changes in the business environment. This definition highlights the
role of long term relationships in developing supply chain flexibility. There are a range of
collaborative arrangements, which can be competitive (Cousins, 2002) and network types,
which should be configured based on the nature of product that they are created for
(Lamming et al., 2000). However, it is possible that long term relationships could result in
/
66

[Chapter 2 - Literature Review]
the “rigid flexibility” described by Stevenson and Spring (2007) or a “lock-in” effect,
whereby high levels of asset specificity and investment reinforce continuity of the
relationship (Wathne and Heide, 2004).
Another important element of sourcing flexible is adaptability. An adaptable supply chain is
one that can adjust its own supply chain design to meet structural shifts in markets, and
modify supply networks to strategies, products and technologies (Easton and Rothschild,
1987; Lee, 2004). Lee (2004) defined the objective of an adaptable supply chain as
adjusting supply chain design to accommodate market changes. Duclos et al. (2003)
included market flexibility in their classification, which they defined as the ability to mass
customise, and build close relationships with customers, including designing and modifying
new and existing products. Vickery et al. (1999) referred to this as responsiveness to target
markets.
Sourcing flexibility may also involve a buying organisation increasing the responsiveness of
suppliers. Increasing responsiveness is used to describe practices by a buying organisation
to increase supplier response capabilities, such as suppliers’ short term process flexibility
(Tachizawa and Thomsen, 2007). This may represent an attempt to improve the overall
vendor flexibility of a supply system or the specific parts of the system, such as
manufacturing flexibility. Das and Abdel-Malek (2003) highlighted the need to estimate the
flexibility of potential supply chain partners and make a choice accordingly. A final
consideration for flexible sourcing is supply chain integration. Christopher (2000) has
emphasized the role of integrating the virtual supply chain in developing agility, and
Swafford et al. (2006) found that higher levels of agility can be achieved by integrating
information flows through a value chain. Lee (2004) referred to the importance of alignment
between different supply chain members to improve the performance of the entire chain.
Once a supply chain is reconfigured for a specific purpose it must then be integrated to
ensure that it performs effectively.
2.12.4 Supply chain flexibility and purchasing
67

[Chapter 2 - Literature Review]
A range of portfolio models have been proposed in the literature in order to support
purchasing decisions and supplier selection. Kraljic’s (1983) seminal paper on purchasing
strategy classifies purchases according to a four box portfolio analysis model. The
dimensions of the four box model are segmented by “importance of purchasing” and
“complexity of supply market”. A four by four matrix is then used to determine four
categories of supplier including “strategic” (high profit impact, high supply risk),
“bottleneck” (low profit impact, high supply risk), “leverage” (high profit impact, low
supply risk) and “non critical” (low profit impact, low supply risk). Individual plans are
then offered for each category of supplier.
Olsen and Ellram (1997) built on Kraljic’s portfolio model. They argued that supplier
relationships can be categorised based on the relative supplier attractiveness and the
strength of the relationship between the buyer and supplier, and propose more detailed
guidelines for the factors influencing supplier attractiveness and strength of relationship. A
three by three model was developed. De Boer et al. (2001) also proposed a classification to
describe the diversity of purchasing situations. They plotted present day purchasing practice
of new task, modified rebuy (leverage items), straight rebuy (routine items) and straight
rebuy (strategic/bottleneck) against different phases in the supplier selection process:
problem definition, formulation of criteria, qualification and choice. The implications for
the different phases are then explored for each situation.
More specifically to the construction sector, Cox (2009) explored the most appropriate way
in which construction goods and services can be purchased. A two by two matrix with ‘level
of work and scope’ with a supplier (either just working with a first tier supplier or becoming
more deeply involved with different tiers of the supply chain) on one axis and ‘focus of
buyer relationship’ with supplier on the other (either reactive, keeping suppliers at arms
length, or proactive, becoming proactively involved with suppliers operations) is developed.
The interactions between these variables result in four options for buyers in construction:
supplier development, supply chain sourcing, supplier development and supply chain
management. These categories of suppliers are then developed further to take account of
power and leverage circumstances and appropriate relationship management strategies.
i
68

[Chapter 2 - Literature Review]
Synthesising the literature, a number of dimensions of purchasing are identified as
important for project purchasing. It is important to highlight these criteria as they are used
later in this thesis for the development of a purchasing model. An important gap that is not
considered in the purchasing literature is the role of supply chain flexibility in purchasing
decisions. The purchasing criteria from the literature are as follows:
• Criticality - The criticality of the output of a supplier or subcontractor to project
success. Some products or services will have significant implications for cost and
time if they fail (Constructing-Excellence, 2003);
• Regularity of demand - The extent to which demand is one off or project specific or
high volume, and applies to a number of different projects (Ireland, 2004);
• Spend - This is used this to refer to the proportion of total procurement or relative
cost spend that a service, supplier or subcontractor accounts for (Constructing-
Excellence, 2003);
• Degree of supplier involvement and development - This refers to the extent to
which the buying organization proactively develops supplier capabilities and
collaborative relationships (Cox, 2009);
• Supply Risk - This refers to the extent of monopoly or oligopoly conditions, entry
barriers, the pace of technological advance and complexity of the products (Kraljic,
1983).
2.13 CONFIRMING THE LITERATURE GAPS IN RELATION TO ETO
CONSTRUCTION SUPPLY CHAINS
This review highlights that, overall, ETO supply chains have received very little attention in
the literature. Uncertainty and flexibility have also not been researched in the context of
ETO Construction supply chains. Based on all elements of the literature review, the gaps in
the existing research that will be further investigated in this thesis can be defined as follows:
• While it has been acknowledged that different types of supply chains are associated
with different uncertainty profiles, the supply chain uncertainty literature has not
addressed the particular sources of uncertainty related to the ETO construction
supply chains. Furthermore, the supply chain uncertainty circle has been
successfully applied in a range of sectors, but there are no applications in the
69

[Chapter 2 - Literature Review]
construction sector.
• Research in construction supply chains is still in its infancy. Most of the supply
chain research that has been conducted addresses the client-main contractor
relationship rather than relationships with upstream suppliers. While pipeline
management research, focusing on improving processes between order placement
and delivery, has been insightful, most of the research has focused on high volume
stable manufacturing supply chains.
• Much of the flexibility research relates to manufacturing. There is a recognition that
the scope needs to be widened to consider the flexibility of the supply chain, but
research is still at an early stage of development with very little empirical testing.
For this thesis it is important to note that supply chain flexibility has not been
investigated in the ETO construction sector. The role of supply chain flexibility has
also not been considered in purchasing classifications.
• Bodies of knowledge on uncertainty, flexibility and pipeline management have not
been integrated for the specific needs of the ETO construction sector.
2.14 SUMMARY
This chapter has reviewed the literature relevant to ETO supply chains. The ETO supply
chain is framed by reference to a taxonomy of six supply chain structures, where the ETO
supply chain has the highest levels of customisation compared to the other structures. The
literature relating to construction supply chains was reviewed and place in the context of the
ETO supply chain.
A structured literature review of the ETO supply chain concludes that an ETO supply chain
operates in a project environment and that each product is different to the last. Production
dimensions of the supply chain am completely customised and the decoupling point is
located at the design stage. However, the design dimension may have standard elements:
existing designs maybe modified to order or completely new designs may be developed to
order. There may also be sector specific differences in which certain activities in the supply
chain may be standardised. The structured literature review provides a framework to
understand the developments that have emerged in the ETO field, as well as providing a
/
70

[Chapter 2 - Literature Review]
theoretical grounding for this thesis. This part of the literature review concludes that there is
a need to tailor strategies to the ETO supply chain, that there is no consensus on the role of
flexibility in ETO supply chains.
The final part of the review addresses the literature surrounding supply chain uncertainty
and supply chain flexibility. In particular the supply chain uncertainty literature raises the
supply chain uncertainty circle as a framework for considering uncertainty. This is
important as the model is applied to ETO uncertainties in chapter 5. A conceptual model of
supply chain flexibility was also developed. This is used in chapter 7 to investigate supply
chain flexibility in the construction case studies. In the last section of the literature review
the literature gaps are summarised. As a result of the literature review section, four research
questions have been developed. In the next chapter these research questions are discussed
with reference to research methods and the overall methodology.
SUMMARY OF CHAPTER 2 AIMS1. Develop a foundation for the thesis in the published literature
- Important areas of literature have been reviewed to develop a foundation includingliterature relating to construction supply chains, supply chain structures, the ETO supply chain, supply chain uncertainty and supply chain flexibility.
2. Formulate research questions in relation to the literature and identify the research gaps
- Four research questions have been developed from the literature.- The gaps in the different bodies of knowledge are identified at the end of the
chapter3. Compare the engineer-to-order supply chain with other types of supply chains
- A taxonomy of supply chain structures was developed, and the ETO supply chainis compared with the characteristics of 5 other supply chain structures: MTO, BTO.ATO, MTS and STS.
4. Identify the characteristics of the engineer-to-order supply chain- A robust definition of the ETO supply chain has been developed
5. Develop a conceptual model to rationalise supply chain flexibility- Supply chain flexibility has been rationalised using antecedents of sourcing and
vendorflexibility and 5 external flexibility types
71

[Chapter 3 - Methodology]
CHAPTER 3
METHODOLOGY
CHAPTER 3 AIMS1.Review research ph ilosophy literature and explicate the philosophical position adop ted2.Critically review resea rch m ethods tha t will be u se d in the s tudy3.Justify multiple c a s e s tudy research and mixed m eth o d s des ign
Theoretical Empirical Research Findings
Chapter 2
§Cd
2!3*->Ht_<u*■*3
RQ1
Chapters 3 and 4
M eth o d o lo g y
Chapter 3: Methodology
Chapter 4: Research Design
Chapter 5
Uncertainty in ETO Systems
RQ2
Chapter 6
PipelineImprovement
Strategies
RQ3
Chapter 7
Supply Chain Flexibility
RQ4
Chapter 8
Evaluation Of The Case Research
UnifiedFrameworkPresented
All RQs
Chapter 9
72
[Chapter 3 - Methodology]
3. INTRODUCTION
This chapter begins by describing three major research paradigms. This is followed by the
identification of the paradigmatic stance adopted. The research questions that were
deVeloped from the literature in chapter 2 are then revisited. They are linked to different
are^ o f theory, and the nature of investigation for each of the research questions is
smnhi^rised. The research strategy, namely multiple case study research, is discussed in
ternil strengths and weaknesses, and a justification of the research strategy selection is
offk?e4. The strengths and weaknesses of specific data collection techniques and data
an#ly$is techniques are assessed. The application of these specific techniques in the thesis is
d isu se d in the following chapter.
3,1 Re s e a r c h p a r a d ig m s
A plr^digm can be defined as “a cluster of beliefs and dictates which for scientists in a
partcidar discipline influence what should be studied, how research should be done, and
how results should be interpreted” (Bryman and Bell, 2003: p25). A number of different
re#etr<cli paradigms coexist. Whereas a number of alternative terms are used, three
paftdlgms can be identified as positivism, critical realism and constructivism. Different
Vahttfts and terms are associated in the literature more or less closely with these three
different paradigms (Easterby-Smith et al., 1991).
Tfre three paradigms hold different assumptions regarding some fundamental questions
relatifig to the pursuit of knowledge. Before the three paradigms are explored in greater
d^pth mention must be made of some of the terms associated with these assumptions.
OP^logy refers to the nature of reality. Two aspects of ontology are objectivism and
subjectivism. Objectivism holds that social entities exist in reality external to social actors
cc^eraed with their existence. Subjectivism holds that social phenomena are created from
the perceptions and consequent actions of those social actors concerned with their existence
(3ahtfders et al., 2007). Epistemology concerns the general set of assumptions about the best
W ^s of inquiring into the nature of the world (Easterby-Smith et al., 1991). It refers to the
qi%tion of what is, or should be, regarded as acceptable knowledge in a discipline (Bryman
73

[Chapter 3 - Methodology]
and Bell, 2003). Finally, axiology refers to the role of values in research (Goles and
Hirschheim, 2000). This relates to the extent to which research is viewed as value free and
unbiased or value laden and biased.
3.1.1 Positivism
Positivism draws much from scientific experimentation where knowledge is extended by
objective observation and measurement. The important, or most widely accepted,
components of positivism are outlined in table 3.1. The ontological assumption in positivism
is that there is an external world independent of researcher. The epistemological assumption
is that this external world can be observed objectively. There is a hypothetico-deductive
cycle of enquiry which suggests that science proceeds through a process of hypothesizing
fundamental laws and then deducing what kind of observations will demonstrate the truth or
falsity of these hypotheses (Easterby-Smith et al., 1991). Since only knowledge that is
observed objectively is considered valid, the axiology is value free (Wass and Wells, 1994).
Typically, a hypothesis about a specific causal relationship between a theoretically
dependent object and a set of theoretically independent objects is deduced from abstract
theoretical concepts. A hypothesis is then expressed, which is then refuted or verified.
74

R esearch P aradigm P ositiv ism C ritical R ea list C on stru ctiv istOntology Objectivism - a world exists
independent o f subjective consciousness
1) A real world exists independent o f subjective consciousness2) Stratification o f ontology
Subjectivism - the real world does not exist outside the consciousness o f the individual, Realities are multiple and constructed.
Epistem ology Only that w hich is objective ly observed is valid know ledge
Valid knowledge com prises individua 1 comprehension o f the external world
Valid knowledge com prises individual com prehension o f the external world
A xiology Value free Value bound Value boundObjective U ncover general law s, discovery exposure U ncover and explain individual
conceptualisation and interpretation o f external factors, invention
Type o f Data (tendency) Quantitative Quantitative & Qualitative QualitativeTechniques for Collecting Data Simulation, M athematical M odelling,
Structured QuestionnaireComplete tool kit often in context o f a case study
Observation, Interviews, Textual A nalysis, Ethnography
C ycle o f Enquiry Hypothetico-deductive Retroductive Inductive - theory grounded in empirical observation
System Assumptions Closed O pen O penA ssociated Terms Scientific method, Natural Science, Pragmatism Phenom inalism , antipositivist,
naturalism, constructiionism , constructivism, hermeneutic, relativism, interpretivism see p24 easterby
Sources: (Bertrand and Fransoo, 2002; Bryman and B ell, 2003; Easterby-Smith et aL, 2008; Easterby-Smith et aL, 199 Saunders et a l , 2007; W ass and W ells, 1994)
; Eriksson and K ovalainen, 2008;
Table 3.1: Characteristics of research paradigms
[Chapter 3
- M
ethodology]

[Chapter 3 - Methodology]
Positivism inclines towards quantitative data, and includes research methods such as
simulation, mathematical modelling, and structured questionnaires (Bertrand and Fransoo,
2002; Bryman and Bell, 2003; Easterby-Smith et al., 1991; Wass and Wells, 1994). The
main strengths of positivism and the associated methodologies are that they can provide
coverage of a range of situations, they can be fast and economical, and they can have
considerable relevance to policy decisions. The weaknesses are that they are rather inflexible
and artificial; They are not very effective in understanding processes or the significance that
people attach to actions, and the implications for actions are not obvious (Easterby-Smith et
al., 2008). A key weakness of positivism, and the associated research methods, is well
summarised by Bertrand and Fransoo (2002) who argue that it “does not (yet) provide us
with sufficiently powerful methods of analysis to address problems that come close to the
complexity that is observed in most real life operational processes” (Bertrand and Fransoo,
2002: p261). This difficulty is reflected in the assumption of a closed system. Models
require clear boundaries and assumptions in order to model the change of one variable upon
another.
3.1.2 Constructivism
A new paradigm has arisen during the last half century largely in reaction to the application
of positivism to the social sciences. At the centre of this paradigm is that all knowledge is
socially dependent because all knowledge is socially constructed (Boghossian, 2006). The
knower and the known are interactive and inseparable, whereas in positivism the knower
and known are independent (Lincoln and Guba, 1985). The interpretivist paradigm holds
that the world is socially constructed and the logic of scientific experimentation is rejected
as a model to conduct social research. The ontological assumption rejects the independence
of the social world from subjective interpretation and argues that the real world does not
exist outside the consciousness of the individual. In epistemological terms, valid knowledge
comprises individual comprehension of the external world. Research is value bound and the
aim of research is to uncover and explain individual conceptualisation and interpretation
(Wass and Wells, 1994).
76

[Chapter 3 - Methodology]
Constructivism primarily relies on inductive reasoning, where data is collected first and then
theory developed as a result of data analysis (Saunders et al., 2007). Constructivism also
inclines towards qualitative methods such as observation, interviews, textual analysis and
ethnography (Bryman and Bell, 2003; Wass and Wells, 1994). The strengths of
constructivism and the associated methodologies are that they provide the ability to look at
change processes over time, to understand people’s meaning and to adjust to new issues and
ideas as they emerge. It also provides the ability to contribute to the evolution of new
theories and an approach to gathering data which can be described as natural rather than
artificial (Easterby-Smith et al., 2008). Opposition to the constructivist position is well
summarised by Boghossian (2006), who suggests that while the constructivist position is
appealing as it is empowering, “the intuitive view is that there is a way things are that is
independent of human opinion, and that we are capable of arriving at belief about how
things are that is objectively reasonable, binding on anyone capable of appreciating the
relevant evidence regardless of their social or cultural perspective” (Boghossian, 2006:
pl31).
3.1.3 Critical realism
Critical realism offers an alternative position to constructivism and positivism. It proposes a
way of combining positivist conceptions of an external world with the recognition of
interpretive understanding that is a feature of constructivism. Critical realism accepts that an
entity can exist independently of our knowledge of it, but the possibility of subjective
interpretation of the world and the impact of meaningful interpretation on action are
recognised (Wass and Wells, 1994). The critical realist perspective argues for a stratified
ontology, which distinguishes between the real, the actual and the empirical (Bhaskar,
2008). The real is whatever exists, and is the realm of objects, structures and powers. These
powers may exist unexercised. The actual refers to causal powers that are activated. Finally,
the empirical refers to the events that we actually experience.
Critical realism accepts that an entity can exist independently of our knowledge of it.
However, the possibility of subjective interpretation of the world and the impact of
meaningful interpretation on action are recognised. The world can only be known in terms
77

[Chapter 3 - Methodology]
of available descriptions or discourses. Events are affected by underlying structures and
mechanisms, which interplay with different contexts. A fundamental aim of critical realism
is to uncover these different levels or layers of social reality and construct models of
underlying or generative structures, explaining the make-up of mechanisms or structures and
their effects under certain conditions. From this perspective the objective of a social science
project is to demonstrate explanatory mechanisms which link a diverse empirical reality via
an intervening contextual layer to deeper social structures (Bryman and Bell, 2003; Collier,
1994; Wass and Wells, 1994).
One of the most distinctive features of critical realism is its analysis of causation. Positivism
draws heavily on the successionist view of regularities among sequences of events. From the
critical realist perspective, causation is not understood on the model of regular successions
of events; therefore explanation need not depend on finding regularities or searching for
putative social laws. What causes something to happen has nothing to do with the amount of
times we have observed it happening. Explanation, from a critical realist perspective,
focuses on identifying causal mechanisms, discovering how they work, and discovering if
they have been activated in different conditions (Sayer, 1999). Consistent regularities are
only likely to occur under special conditions. In a closed system causal powers are stable
and the external conditions are constant. This rarely occurs spontaneously in the social
world, which is much more likely to be characterised by open systems, where the same
causal power can produce different outcomes under different conditions (Bhaskar, 2008).
3.1.4 Research in supply chain and operations management
The positivist paradigm has been dominant in both operations management and supply chain
management. As a result, much of the early research in operations management has been
confined to quantitative modelling and statistical analysis (Meredith et al., 1989). Within the
field of operations management there have been calls to balance the traditional rationalist
methods of optimisation, simulation and statistical modelling with empirical studies that
gather data from the field in different ways (Flynn et al., 1990; Meredith, 1998). Scudder
and Hill (1998) highlighted that empirical research in operations management has
demonstrated a bias towards survey and statistical research methods. They review papers
i
78

[Chapter 3 - Methodology]
from 1986 to 1995 published in 13 different journals and find that out of the empirical
research available 294 papers utilised survey methods, 168 used case studies, 10 used
database (archival analysis) and 5 used panel studies (group of experts). In the field of
supply chain management, Burgess et al. (2006) find that out of 100 randomly selected
journal articles, taken from July 2003 onwards, 39 were conceptual analytical, 7 were
mathematical analytical, 23 used statistical sampling techniques and 31 used case studies.
Burgess et al. (2006) concluded from their sample that a positivist research paradigm stance
is prevalent.
3.1.5 The paradigmatic stance adopted in the thesis
The position adopted in this research is that of critical realism. The stratified ontology
assumed by critical realism offers an appealing position from which to investigate the layers
of uncertainty and the key characteristics of the particular context, the ETO supply chain. In
terms of epistemology, the critical realism position acknowledges the subjective role of the
researcher in generating knowledge. The argument adopted herein is that claims of a
researcher’s independence in the social sciences are hard to sustain and that the value free,
objective, detached observation associated with positivism is difficult to achieve.
Subjectivity, therefore, need not be seen as a failing needing to be eliminated but as an
important element of the research process.
This research will incline towards retroductive logic of enquiry rather than the hypothetico-
deductive reasoning often related with positivism. Research questions are modified as
research iterates between observation and theory. It will also assume a critical realist view of
causation with the ETO system being characterised as an open system. The ETO system is
complex and it would be difficult to isolate out components and examine them under
controlled conditions as suggested by the positivist tradition. The closed system approach
linked with positivism would be too simplistic and constrained to achieve the rich and
detailed characterisation of the system that this research aims to achieve.
The following summarises the key influences of critical realism on this thesis.
/
79
[Chapter 3 - Methodology]
• Stratification o f ontology. Supply chains can be thought of as having underlying
mechanisms and structures that drive events.
• Interpret *truth’ subjectively. The researcher’s role in generating knowledge is
acknowledged as subjectivity is seen as part of the process. The role of opinions and
interpretation are accepted as valid in the research process.
• Research is not value free. The argument adopted herein is that claims of a researcher’s
independence in the social sciences are hard to sustain and that the value free, objective,
detached observation associated with positivism is difficult to achieve.
• The ETO supply chain is an open system. A supply chain can be viewed as an open
system with mechanisms, powers and structures contributing to occurrences. Research
can be designed with the aim of uncovering these structures and powers.
• The critical realist view o f causation. It is more important to seek underlying, contextual
mechanisms, powers and structures than repeated occurrences.
• A retroductive cycle o f enquiry. Research can be investigated using a retroductive cycle
of enquiry with iterations between theory and data. The researcher’s role in generating
knowledge is acknowledged, as subjectivity is seen as part of the process.
• A range o f methods are compatible within a case context. Research methods often form
a complete tool kit of techniques in the context of a case study. A range of research
methods are appropriate, including both qualitative and quantitative approaches (Collier,
1994; Sayer, 1999; Wass and Wells, 1994).
3.2 RESEARCH QUESTIONS
Research questions 1-4 were developed from the literature in the last chapter. However, as
noted by Eisenhardt (1989), the constructs, questions, definitions and measurements in case
study research often emerge from the analysis process itself rather than being specified a
priori. Emergent relationships between constructs are also confirmed, revised or
discontinued as case study research progresses. Emergent concepts, questions and findings
were compared with enfolding literature as the research progressed (Eisenhardt, 1989).
Table 3.2 brings together research questions, showing how they relate to different areas of
the literature and the nature of investigation. This builds on the preceding literature review
chapter.
80

[Chapter 3 - Methodology]
Research Question Theory/Body of Knowledge
Nature of Investigation(1) How do construction supply chains fit within a taxonomy of supply chain structures?
Supply chain structures, ETO Supply chain, Construction Supply Chains, Systems thinking
• Conceptual - places construction within a taxonomy of six supply chain structures
• Structured literature review - synthesis of ETO literature allows construction to be placed within the broader ETO body of knowledge
• Case studies and evaluation interviews are compared with ETO characteristics
(2) How can the sources of project uncertainty in Engineer-to-order construction supply chains be identified and categorised?
Supply chain uncertainty, Project risk and uncertainty
• Development of a five stage method to identify and classify uncertainty in ETO construction supply chains
• Application of the five stage model to five construction projects - to demonstrate how the method may be applied to a group of projects
• Six evaluation interviews - to establish accuracy and potential to generalise across the construction sector
(3) How can organisations improve pipelines in ETO construction supply chains?
Time-based competition, Systems dynamics, Supply chain collaboration
• Investigation of 12 supplier pipelines via a pipeline survey
• Six evaluation interviews - to establish accuracy and potential to generalise across the construction sector
(4) How can flexibility be rationalised in ETO construction supply chains?
Supply chain flexibility, Purchasing Models
• Conceptual - develops a model of supply chain flexibility
• Investigation of the conceptual model through all units of analysis: two network coordinators, 12 supplier pipelines and five projects.
• Six evaluation interviews - to establish accuracy and potential to generalise across the construction sector
Table 3.2: Integration of research questions with theory
Research question 1 is grounded in the literature relating to supply chain structures, and the
construction supply chain management literature. A taxonomy of supply chain structures
was proposed in the literature review and definitions for the ETO supply chain were
developed. This provides the theoretical grounding for comparing the characteristics of
ETO supply chain with case studies and the evaluation interviews.
Research question 2 is primarily grounded in the supply chain uncertainty literature. It aims
to uncover the specific uncertainties that can be found in the ETO construction supply chain.
The project uncertainty and risk body of knowledge also contributed to the development of
this research question. This is important, as a project environment is an important feature of
81

[Chapter 3 - Methodology]
the ETO supply chain structure. An existing conceptual model, the supply chain uncertainty
circle, which has been applied in a number of industries and sectors, is applied to the ETO
sector. This research question is primarily investigated using case studies of 5 projects from
two ETO construction systems, using a risk and uncertainty protocol to collect data. This is
also supported by the'6 evaluation interviews.
Research question 3 is grounded in a number of different bodies of knowledge. Systems
dynamics emphasizes the importance of supply pipelines for the overall dynamics of a
supply chain, and the time-based competition literature highlights the strategic significance
of lead-time analysis and time compression in supply pipelines. The question is also linked
to the supply chain collaboration literature, suggesting that individual organisations in a
supply chain can work together to improve supply pipelines. Research question 3 is
primarily investigated through 12 supplier pipelines from 2 ETO systems. Data is collected
via a ‘pipeline survey’ protocol. This is supported by the 6 evaluation interviews.
Research question 4 is grounded in the literature relating to supply chain flexibility, within
the context of agile supply chains. It also draws on purchasing literature that addresses
criteria and models for supplier selection. Using the supply chain flexibility literature, a
conceptual model for supply chain flexibility was developed in the literature review chapter
(see section 2.13). A purchasing model is also developed during the investigation of
research question 4. Case studies involving all units of analysis are used in answering the
research question. Two network co-ordinators, the 12 supplier pipelines and 5 projects from
the 2 ETO systems are used. This is supported by the 7 evaluation interviews.
3.3 RESEARCH APPROACH
3.3.1 The selection of a multiple case study methodology
Multiple case studies are used in this thesis. This section justifies and evaluates the approach
adopted. Yin (2003) defined a case study as “an empirical enquiry that investigates a
contemporary phenomenon within its real life context” (Yin, 2003: p i2). Often, the
boundaries between phenomenon and context are not clearly evident. According to Yin
82
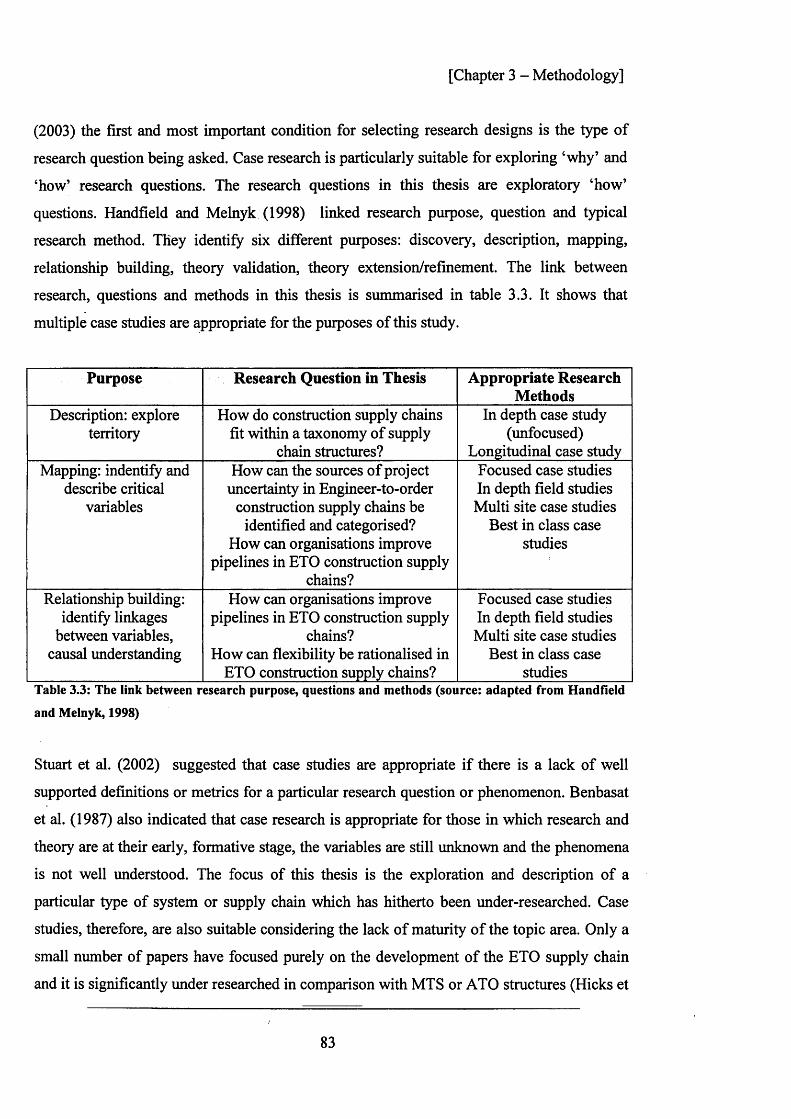
[Chapter 3 - Methodology]
(2003) the first and most important condition for selecting research designs is the type of
research question being asked. Case research is particularly suitable for exploring ‘why’ and
‘how’ research questions. The research questions in this thesis are exploratory ‘how’
questions. Handfield and Melnyk (1998) linked research purpose, question and typical
research method. They identify six different purposes: discovery, description, mapping,
relationship building, theory validation, theory extension/refinement. The link between
research, questions and methods in this thesis is summarised in table 3.3. It shows that
multiple case studies are appropriate for the purposes of this study.
Purpose Research Question in Thesis Appropriate Research Methods
Description: explore territory
How do construction supply chains fit within a taxonomy of supply
chain structures?
In depth case study (unfocused)
Longitudinal case studyMapping: indentify and
describe critical variables
How can the sources of project uncertainty in Engineer-to-order
construction supply chains be identified and categorised?
How can organisations improve pipelines in ETO construction supply
chains?
Focused case studies In depth field studies Multi site case studies
Best in class case studies
Relationship building: identify linkages
between variables, causal understanding
How can organisations improve pipelines in ETO construction supply
chains?How can flexibility be rationalised in
ETO construction supply chains?
Focused case studies In depth field studies Multi site case studies
Best in class case studies
Table 3.3: The link between research purpose, questions and m ethods (source: adapted from Handfield
and M elnyk, 1998)
Stuart et al. (2002) suggested that case studies are appropriate if there is a lack of well
supported definitions or metrics for a particular research question or phenomenon. Benbasat
et al. (1987) also indicated that case research is appropriate for those in which research and
theory are at their early, formative stage, the variables are still unknown and the phenomena
is not well understood. The focus of this thesis is the exploration and description of a
particular type of system or supply chain which has hitherto been under-researched. Case
studies, therefore, are also suitable considering the lack of maturity of the topic area. Only a
small number of papers have focused purely on the development of the ETO supply chain
and it is significantly under researched in comparison with MTS or ATO structures (Hicks et
!
83

[Chapter 3 - Methodology]
al., 2000, 2001). As a result, there is little consensus as to the definition of an ETO supply
chain. It may be referred to as a ‘project supply chain’ (Elfving et al., 2005) or a ‘one of a
kind supply chain’ (Hameri, 1997) or as ‘design to-order’ (Amaro et al., 1999) where
definitions have very many overlaps. Many of the variables, concepts and subsystems are
also poorly defined and understood. This would make it difficult to ground any large scale
survey work within existing theory and calls for more exploratory, case based methods. This
research helps to develop these definitions and concepts.
The case study is preferred when examining contemporary events, but when the relevant
behaviours cannot be manipulated (Yin, 2003). A key advantage in using the case study
approach to investigate the research questions outlined in this paper is the rich accounts and
descriptions of a natural setting that are offered, and the ability to learn the innovations put
in place by practitioners. Rich descriptions of context will help to highlight the peculiarities
of the ETO system and the various subsystems within it. Supply chain management research
has also been highlighted as being a particularly applied field. It is both for management and
about management (Tranfield and Starkey, 1998). Knowledge production primarily moves
forward by a constant flow back and forth between theoretical and applied (Gibbons et al.,
1994). Case research strategy is well suited for capturing the knowledge of practitioners and
developing theories from it. Case base research is also suitable for exploring which theories
are relevant to the ETO sector. As noted by Stuart et al. (2002), case based research attempts
to ground theoretical concepts with reality and find out the conditions under which theories
are applicable.
Meredith (1998) cites three strengths of case research based on suggestions made by
Benbensat et al. (1987):
• The phenomena can be studied in their natural setting and meaningful, relevant theory
generated from understanding gained through observing actual practice;
• The case method allows the questions of why, what and how to be answered with a
relatively full understanding of the nature and complexity of the complete phenomenon;
• The case method lends itself to early, exploratory investigations where the variables are
still unknown and the phenomena not all understood.
f
84

[Chapter 3 - Methodology]
A further strength of the case study data collection is the opportunity to many different
sources of evidence to develop converging lines of enquiry (Yin, 2003). To get an accurate
characterisation of the ETO supply chain, and the type of uncertainties that are experienced,
a number of techniques are required. If a single method was used it would be likely that the
conclusions would be overly biased towards a certain perspective. The weaknesses of
adopting an approach that relies on triangulation includes the time and cost of the approach,
the requirements that the researcher to be well versed in a range of data collection
techniques and the danger of analysing different data types separately (non convergence)
(Yin, 2003).
Yin (2003) argued that traditional prejudices against the case study approach are the
historical lack of rigour in carrying out case research, the reduced basis for scientific
generalisation and the time constraints involved in managing the scale of data involved in
case research. Eisenhardt (1989) suggested that there is a danger that case study research can
yield theory which is overly complex or that is narrow and idiosyncratic. Case research is
also often associated with increased cost and time when compared with other research
methods (Stake, 1994). The agendas of participating companies may also provide
difficulties for qualitative case research. Companies may agree access and in kind support
but may have a preferred outcome for the results of the study.
Another commonly perceived weakness of case research is the issue of generalisability. The
extent to which case studies provide a basis for empirical generalisability is a common
criticism of case studies (Gill and Johnson, 1997; Stake, 1994). Yin (2003) defends the case
study approach against these criticisms by claiming that case studies are generalisable to
theoretical propositions and analytic generalisations and do not seek to enumerate
frequencies or claim statistical generalisation to populations.
3.3.2 The Selection of a Mixed Methods Design
The view adopted in this thesis is that qualitative and quantitative techniques should be
viewed as complementary rather than as rivals. The use of different kinds of data allow for
85

[Chapter 3 - Methodology]
greater accuracy in research. Greene at al. (1989) reviewed 57 mixed methods studies from
the 1980s and listed 5 purposes:
• triangulation, or seeking convergence of results;
• complementarity, or examining overlapping and different facets of a phenomena;
• initiation, or discovering paradoxes, contradictions, fresh perspectives;
• development, or using the methods sequentially, such that results from the first
method inform the use of the second method;
• expansion, or mixed methods adding breadth and scope to a project.
Triangulation is broadly defined as “the combination of methodologies in the study of the
same phenomena” (Denzin, 1978: p291). Multiple methods can refer to the use of different
methods to examine the same dimension of a research problem, or it can refer to multiple
techniques within a given method to collect and interpret data. The strengths of the multiple
methods are that a more complete holistic and contextual portrayal of the units under study
is possible. As noted by Jick (1979), triangulation in a primarily qualitative study can
potentially generate ‘holistic work’ or ‘thick description’, and quantitative techniques can
highten qualitative research. The development of quantifiable schemes for coding complex
data sets can also strengthen qualitative research.
Two important decisions must be addressed when planning mixed method research designs.
Firstly, the extent to which the study will operate within one dominant paradigm and,
secondly, whether to conduct the phases concurrently or sequentially (Johnson and
Onwuegbuzie, 2004). While this study will employ mixed research methods, qualitative will
be the primary paradigm. This is because the thesis primarily seeks to explore the ETO
supply chain with rich, detailed data in a natural setting. The quantitative element adds to
comparability. Phases will be conducted concurrently.
3.4 CASE RESEARCH METHODS
This section will review the specific package of research methods used in the thesis along
with the strengths and weaknesses of different methods. The data collection methods are
/
86

[Chapter 3 - Methodology]
addressed first, followed by the data analysis techniques used. The following section gives a
detailed description of how they are applied to different units of analysis.
3.4.1 Industrial Secondment
Research that is immersed in the field, such as ethnographic and action research, has been
successfully used for producing 'thick descriptions' (Geertz, 1973). In this thesis, the
immersion in the field takes the form of a 10 week industrial secondment to a case
company. This secondment provides a structure for the case research. The researcher was
‘embedded’ in the workplace and was given a desk in the participating organisation. Lewis
(2009) noted that prolonged engagement in the field can allow a researcher to better predict
and interpret the meaning of events. Such immersion can also help researchers increase their
access to otherwise unavailable data in organisations. It permits trust relations to develop,
allows the researcher to collect data that are different in kind and quality from data
produced by any other method (Michael and Urs, 1999). Evered and Louis (1981) noted the
differences in data and data quality that is obtained from research 'inside' as opposed to
'outside' organizations. Some phenomena can only be uncovered, and an integrated
understanding can only be achieved, by doing research actually in organizations (Michael
and Urs, 1999). This approach provides improved access to data, and an intuitive
understanding of the organization, all of which extends the external and internal validity of
those data. The industrial secondment is an important part of the research process. It
presents the opportunity to be immersed in the natural setting of an ETO supply chain, and
provides a foundation for approaching different companies and elements within the system.
3.4.2 Observation and Process Mapping
As noted by Bryman and Bell (2003), many definitions of ethnography and participant
observation are very difficult to distinguish. Both allude to the researcher immersing him or
herself in a particular group for an extended period of time, observing behaviour, listening
to conversations between others and conversations including the field worker. It often
includes more than simply observation, and is often done in combination with interviews
and collection of documents (Bryman and Bell, 2003). In the context of case research, Yin
/
87

[Chapter 3 - Methodology]
(2003) argues that the strengths of observation are; that events are covered in real time, that
context is captured and that insight can be provided into interpersonal behaviour and
motives. The weaknesses are that observation can be time consuming and potentially costly,
as well as selective. The event may also proceed differently because it is being observed
(Yin, 2003).
Observation also relates to site and factory visits. Barker et al. (2000) referred to the
importance of ‘walking’ the process and using mapping techniques to capture material and
information flows. Process mapping is a popular starting point for the analysis of operations
(Hines and Rich, 1997; Watson, 1994). ‘Walking’ the process involves observing selected
sites or manufacturing processes, often accompanied by an employee to ‘talk through’ the
process. A process can be defined as any activity which takes a set of input resources, which
are then used to transform something or are transformed into outputs. Various process
mapping techniques exist, which usually involve the construction of a model that shows
relationships between activities, people, data and objects involved in the production of an
output. The strengths of process mapping are that they provide an established method for
documenting and analysing existing processes as well as improving or redesigning business
processes (Biazzo, 2002; William et al., 1997). Hines and Rich (1997) proposed 7 different
mapping tools. More recently process mapping has started to become more popular in the
construction sector (Winch and Carr, 2001).
3.4.3 Interviews
Semi-structured interviews will be primarily used in this study. This form of interview
involves designing a framework which encourages respondents to discuss their opinions and
experiences. The semi-structured approach is suitable for research that is exploratory in
nature. It allows respondents some freedom and flexibility to elaborate on topics of
particular interest or relevance to their knowledge. As part of this method, a broad interview
topic guide would be used to guide the interview. The interviewer would usually use a
standardised interview schedule with set questions which will be asked of all respondents. A
similar order and format is employed to enable comparison between answers.
/
88

[Chapter 3 - Methodology]
The semi structured approach does offer scope for pursuing and probing for novel, relevant
information, through additional questions often noted as prompts on the schedule and the
interviewer frequently has to formulate impromptu questions in order to follow up leads that
emerge during the interview. A key characteristic of the semi structured interview is the
flexibility. The interviewee will pursue topics of interest along higher level themes while the
researcher prompts and responds accordingly depending on the responses of different
interviewees. Interviewees will not be forced to select specific options but may be steered
towards the higher level themes outlined in the questions (Bryman and Bell, 2003; Saunders
et al., 2007). Semi-structured interviews were chosen over the structured interview as the
latter are more are suitable for collecting data that is largely factual, quantitative or non
emotive and from businesses that have several features in common. They are particularly
appropriate when the aim is to quantify the relative importance of different responses to
questions about a set of well defined topics (Wass and Wells, 1994).
3.4.4 Archival Data
Barker et al. (2000) in the terrain scanning methodology for construction supply chains
suggested that obtaining relevant archival and analytical information is an important part of
the triangulation process, and can include previous analysis undertaken by companies,
company literature and other documentation. Other sources of documentation include
computer files, organisational maps and charts and previously collected data about a site.
Yin (2003) suggested that the strengths of documentation are: that the sources are often
stable and can be reviewed repeatedly, they are unobtrusive as they are not created as a
result of the case study, and they are exact in terms of details. The weaknesses are: that
information can be biased, as they are often produced for a specific purpose and audience,
there is the potential for selective bias if a collection of documents is incomplete, and finally
access may be deliberately blocked. Yin (2003) also pointed out that documents and archival
data can be of central importance in a research project or only of passing relevance. In this
research, documents are used as supporting sources of information.
/
89
[Chapter 3 - Methodology]
3.4.6 Brainstorming
The importance of brainstorming when triangulating multiple data collection methods in
supply chain management research has been highlighted by Naim et al. (2002). It shares
similarities with a group interview where members of a group are interviewed in a relatively
unstructured way about joint experiences. An interviewer will, typically, prepare some open
questions and will also take on the role of facilitator during the group interview (Bryman
and Bell, 2003) . Brainstorming provides an ideal way for members of a supply chain or
system collectively to make sense of phenomena, problems and potential solutions. It also
provides an important opportunity to make sense of a fragmented complex system. The task
oriented, interaction-centred group interview has also been identified as a robust
methodology to explore professionals’ experiences and for them to describe that experience
(Calder, 1994).
3.4.7 Cross case analysis
Eisnehardt (1989) suggested structuring analysis by considering within case analysis and
cross case analysis. Cross case analysis consists of examining, categorising, tabulating,
testing and recombining both quantitative and qualitative evidence from different cases.
Cross case analysis is particularly important for highlighting and identifying patterns. The
following list of data analysis strategies will be used, which have been adapted and
synthesised from Yin (2003), Eisnehardt (1989) and Stuart et al. (2002):
• Tabulation of data relating to different variables or concepts;
• Listing of differences and similarities between different cases;
• Summary diagrams, data displays and flowcharts;
• Current state process maps; -
• Compare data relating to different units of analysis and/or embedded units of
analysis;
• Quantification of embedded units of analysis;
• Comparison of case study reports;
• Pattern matching (relating case data to a priori assumptions);
90

[Chapter 3 - Methodology]
• Explanation building.
3.4.8 Interview Coding
Coding entails reviewing transcripts and field notes and giving labels to separate, compile
and organise data into its component parts (Bryman and Bell, 2003). Strauss and Corbin
(1990) distinguish three types of coding practice:
• Open coding. The process of breaking down, examining, comparing, conceptualising
and categorising data;
• Axial coding. Data are put back together in new ways after open coding to make
connections between categories. Codes are linked to context, consequences, patterns
of interaction and to causes;
• Selective coding. The procedure of selecting the core category, systematically
relating it to other categories, validating those relationships and filling in categories
that need further refinement and development. A core category is the central issue or
focus around which all other categories are integrated.
A further issue in coding is that of analysing group interviews and brainstorming sessions.
An important consideration here is the extent to which whole group analysis, where the data
is analysed at a group level without delineating individual contributions, and participant
based analysis, where the contributions of individual participants are analysed separately
within the wider context of the whole discussion, are used (Bryman and Bell, 2003;
Saunders et al., 2007). It is proposed that both data analysis types will be used for the
analysis of brainstorming sessions. While coding is a recognised technique for analysing
concepts and categorising data, a number of dangers are highlighted. There is the possibility
of losing the context of the original data, the fragmentation of data and the contamination of
words and behaviours.
3.4.9 Quantifying data and Descriptive statistics
According to Tashakkori and Teddlie (2003) transforming qualitative information into
numerical codes that can be analysed statistically can provide a richer understanding of
!
91

[Chapter 3 - Methodology]
variables. This might include frequency counts of certain themes responses behaviours and
events or a rating of strength or intensity of these behaviours or expressions (Tashakkori and
Teddlie, 2003). Researchers can start with in depth process data and then systematically list
and code qualitative incidents according to predetermined characteristics, gradually reducing
the complex mass of information to a set of quantitative data that can be analysed using
statistical methods. Assumed that the original data is complete and the coding reliable, the
advantage of the quantification process lies in the systematisation of process analysis
(Langley, 1999).
Van de Ven and Poole (1990) transformed incidents into a series of binary codes associated
with categories forming a 0-1 matrix that the authors called a ‘bit map’. This type of
quantification allowed the researchers to search for pattern and compare data effectively
across cases. This technique is also useful for comparing dynamic relationships between
events and categories. However, Langley (1999) highlighted the danger of losing the
richness of data that qualitative research can yield by relying solely on a quantification
strategy. Once data has been transformed into quantitative data, descriptive statistics, such as
bar charts, pie charts and histograms, might be used to summarise and organise frequency
counts and binary codes (Tashakkori and Teddlie, 2003).
3.4.10 Cause and Effect
Cause and effect diagrams help to depict relationships between adverse events and their
contributing factors. The tools are popular in the quality literature (Aguayo, 1991) , where
the ‘five whys’ analysis has been proposed as a tool for exploring root causes of problems.
In this technique, a tree diagram is developed by asking ‘why’ (the cause) five times before
a root cause is established. Cause and effect analysis can also take the form of Ishikawa
diagram. This uses brainstorming to highlight possible contributing causes of a particular
problem. The same technique is often referred to as a ‘fishbone’ diagram due to the form of
the diagram (Bicheno, 2006). Cause and effect analysis is also an important part of systems
dynamics modelling, where the underlying objective is to determine cause-and-effect
relationships and thereby to understand the forces that have led to a particular system state
92

[Chapter 3 - Methodology]
(Sterman, 1989). Causal influence diagrams, in particular, have been extensively used in
systems dynamics.
Cause and effect analysis techniques are important as they illustrate the causes of problems
in concise and visual ways, and often bring stakeholders together to find the source of a
problem. One of the key analytical tools for auditing a supply chain, as demonstrated in the
quick scan approach, is a cause and effect analysis (Naim et al., 2002). The ‘terrain scanning
methodology’, a supply chain diagnostic tool for the construction industry, also emphasizes
the importance of cause and effect analysis for construction supply chains (Barker et al.,
2000). They have been used effectively by Barker et al. (2004) to investigate time
compression potential in the design process and also as a way of examining supply chain
uncertainty (van der Vorst and Beulens, 2002).
3.5 SUMMARY
In this chapter, three main research paradigms have been described including positivism,
critical realism and social constructivism. The author’s stance has been highlighted as a
critical realism. The use of multiple case study research was justified, taking into account
the research aim and questions. Advantages and disadvantages of case study research have
been discussed. A mixed methods research design was also specified, with qualitative
methods playing the dominant role and quantitative techniques playing a supporting role.
Qualitative and quantitative techniques will be used concurrently.
This chapter has also described and defended the multiple data collection techniques that
will be employed in the study. First of all, the strengths and weaknesses of the different
approaches are addressed. These techniques include interviews, process mapping,
observation and site visits, brainstorming and archival data. This chapter has also described
the data analysis techniques used in the study. Multiple data analysis techniques are used
including cross case analysis, process maps, interview coding, quantification, description
statistics, cluster analysis, brainstorming and cause and effect analysis.
93

[Chapter 3 - Methodology]
SUMMARY OF CHAPTER 3 AIMS
1.Review research philosophy literature and explicate the philosophical position adopted
- The positivist, critical realist and constructivist research philosophies have been reviewed. A critical realist research stance is adopted, and key implications for the thesis have been articulated.
2.Critically review research methods that will be used in the study- The strengths and weaknesses for each data collection and data analysis technique have been discussed along with the strengths and weaknesses associated with case research.
3 Justify multiple case study research and mixed methods design- A multiple case research strategy using a mixed method design has been justified
/
94
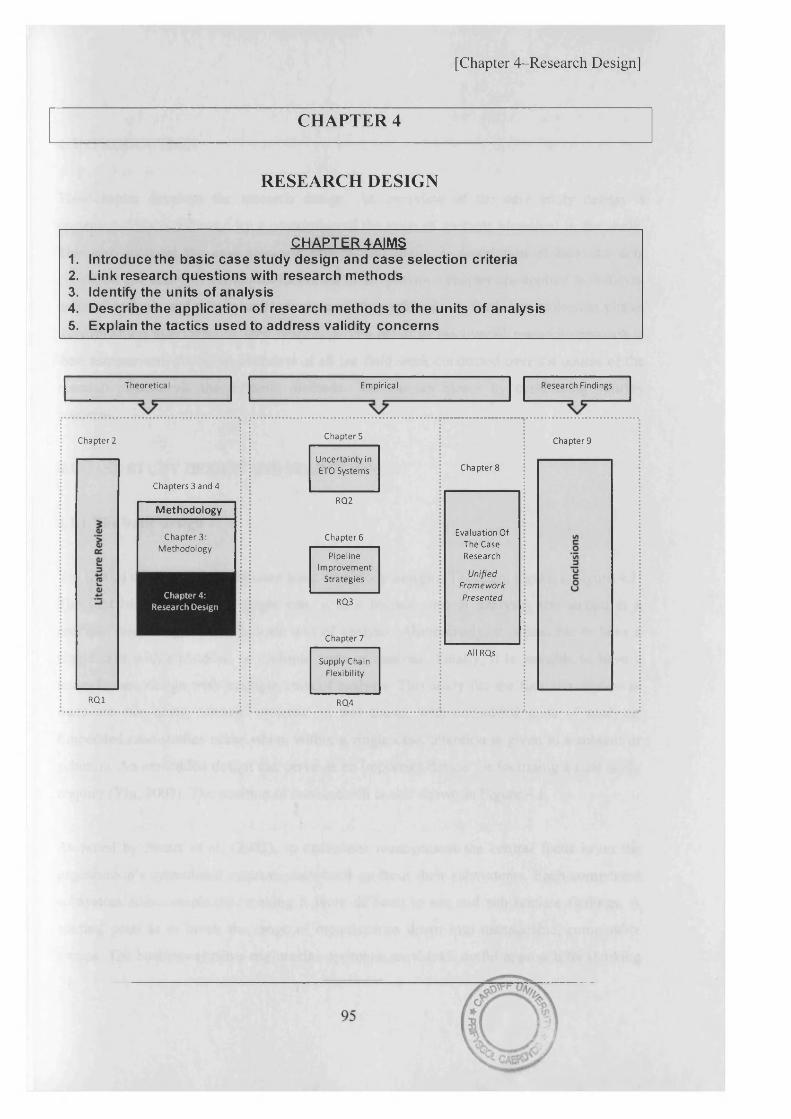
[Chapter 4-Research Design]
CHAPTER 4
RESEARCH DESIGN
CHAPTER 4 AIMS1. Introduce the basic c a s e s tudy des ign and c a s e se lec tion criteria2. Link research q u e s t io n s with resea rch m ethods3. Identify the units of analysis4. Describe the application of resea rch m e th o d s to the units of ana lysis5. Explain the tactics u sed to a d d re s s validity c o n c e rn s
Theoretical Empirical Research Findings
Chapter 2
RQ1
Chapters 3 and 4
M eth o d o lo g y
Chapter 3: Methodology
Chapter 4: Research Design
Chapters
Uncertainty in ETO Systems
RQ2
Chapter 6
PipelineImprovement
Strategies
RQ3
Chapter 7
Supply Chain Flexibility
RQ4
Chapter 8
Evaluation Of The Case Research
UnifiedFrameworkPresented
All RQs
Chapter 9

[Chapter 4-Research Design]
4. INTRODUCTION
This chapter develops the research design. An overview of the case study design is
presented. This is followed by a description of the units of analysis identified in the study.
This also includes the case selection criteria and logic. A description of how the data
collection and analysis techniques identified in the previous chapter are applied to different
units of analysis and the research questions is then offered. A final data collection phase,
the evaluation interviews, is then described. The detail of the overall research approach is
then summarised, giving an overview of all the field work conducted over the course of the
research process via the different methods. The chapter closes by considering validity
concerns.
4.1 CASE STUDY DESIGN AND SELECTION
4.1.1 The basic design
Yin (2003) envisaged four different basic case study designs. These are shown in figure 4.1.
The first basic design is a single case with a holistic unit of analysis; the second is a
multiple case design with a holistic unit of analysis. Alternatively, it is possible to have a
single case with embedded or multiple units of analysis. Finally, it is possible to have a
multiple case design with multiple units of analysis. This study fits the final description as
there are two cases, termed ‘systems’ in this thesis, with embedded units of analysis.
Embedded case studies occur when, within a single case, attention is given to a subunit or
subunits. An embedded design can serve as an important device for focussing a case study
enquiry (Yin, 2003). The position of this research is also shown in Figure 4.1.
As noted by Stuart et al. (2002), in operations management the central focus is on the
organisation’s operational systems, each built up from their subsystems. Each component
subsystem adds complexity, making it more difficult to see and substantiate findings. A
starting point is to break the range of organisations down into manageable, comparable
groups. The business systems engineering approach provides a useful approach for thinking
/
96

[Chapter 4-Research Design]
about this complexity and identifying manageable and comparable groups, termed
subsystems. A system may be described as recognizable whole which consists of a number
of parts that are connected up in an organised way. This recognizable whole includes a
boundary, an environment, a purpose and emergent properties (Waring, 1996). According to
Watson (1994) business system engineering is “an approach to designing business processes
in a structured way that maximises both customer value and enterprise performance”
(Watson, 1994: p42). A systems philosophy demands that an uncoordinated approach is
replaced by a framework in which the identities of the separate parts are subsumed by the
identity of the total system. Via the system engineering approach, the individual elements
and subsystems are designed and fitted together to achieve an overall system purpose,
where the right parts must be connected and in balance if the system is to produce the
desired results (Pamaby, 1995; Towill, 1997b).
MultipleCaseStudies
SingleCaseStudy
Figure 4.1: Positioning o f case research design (Source: adapted from Yin, 2003)
A system thinking perspective provides a foundation for conceptualization of the objects of
study in this thesis as well as a framework for guiding the study of a system. Consideration
of system boundaries and elements contributes significantly to the ‘carving up’ and
definition of the objects of study. At the system level, the focus of this thesis is the ETO
Position of Research Study
Holistic Case Embedded Units ofStudy Analysis
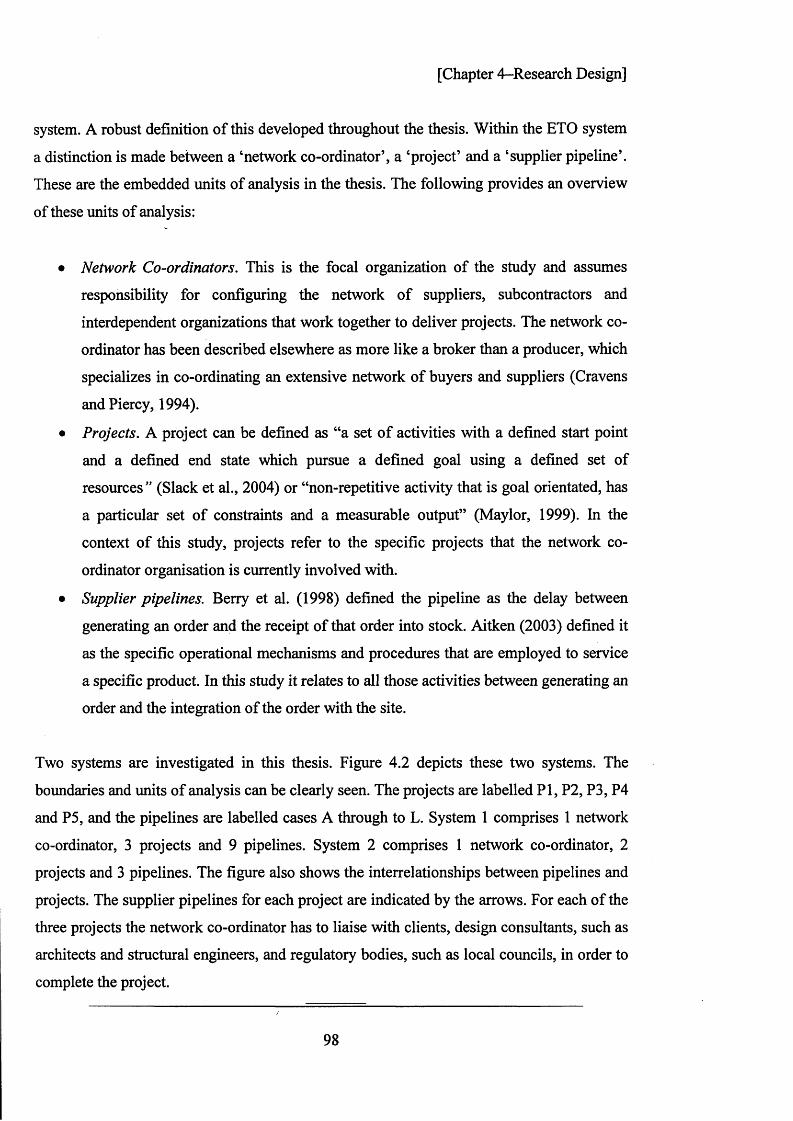
[Chapter 4-Research Design]
system. A robust definition of this developed throughout the thesis. Within the ETO system
a distinction is made between a ‘network co-ordinator’, a ‘project’ and a ‘supplier pipeline’.
These are the embedded units of analysis in the thesis. The following provides an overview
of these units of analysis:
• Network Co-ordinators. This is the focal organization of the study and assumes
responsibility for configuring the network of suppliers, subcontractors and
interdependent organizations that work together to deliver projects. The network co
ordinator has been described elsewhere as more like a broker than a producer, which
specializes in co-ordinating an extensive network of buyers and suppliers (Cravens
andPiercy, 1994).
• Projects. A project can be defined as “a set of activities with a defined start point
and a defined end state which pursue a defined goal using a defined set of
resources ” (Slack et al., 2004) or “non-repetitive activity that is goal orientated, has
a particular set of constraints and a measurable output” (Maylor, 1999). In the
context of this study, projects refer to the specific projects that the network co
ordinator organisation is currently involved with.
• Supplier pipelines. Berry et al. (1998) defined the pipeline as the delay between
generating an order and the receipt of that order into stock. Aitken (2003) defined it
as the specific operational mechanisms and procedures that are employed to service
a specific product. In this study it relates to all those activities between generating an
order and the integration of the order with the site.
Two systems are investigated in this thesis. Figure 4.2 depicts these two systems. The
boundaries and units of analysis can be clearly seen. The projects are labelled PI, P2, P3, P4
and P5, and the pipelines are labelled cases A through to L. System 1 comprises 1 network
co-ordinator, 3 projects and 9 pipelines. System 2 comprises 1 network co-ordinator, 2
projects and 3 pipelines. The figure also shows the interrelationships between pipelines and
projects. The supplier pipelines for each project are indicated by the arrows. For each of the
three projects the network co-ordinator has to liaise with clients, design consultants, such as
architects and structural engineers, and regulatory bodies, such as local councils, in order to
complete the project.
i
98

[Chapter 4-Research Design]
CN |
EV>w«>
- O
94*>ao>c
LU
EGO«>
T J
9o««>cCDC.
LU
p
Figure 4.2: The two ETO systems and the units of analysis
The design of this study aims to balance breadth and depth of knowledge. Figure 4.3 shows
that the research design offers both scope and depth of understanding. The two network co
ordinators are investigated in depth with less structured and more qualitative methods. The
99

[Chapter 4-Research Design]
five projects offer increasing breadth with slightly less depth. More structured methods,
including mixed research methods, are utilised. The 12 supplier pipelines offer the most
breadth and least depth. A structured pipeline survey is developed to analyse different
components of lead time and responses are analysed by quantifying responses. Due to the
varied levels of depth and breadth associated with different units of analysis, and the number
of cases for each level, a different package of research methods are required. The package of
research questions for each unit of analysis is described later in this chapter. The final data
collection phase, the 7 evaluation interviews, is also shown on figure 4.3. These have
moderate breadth and moderate depth, but are external to the two ETO systems that make up
the case study research phase of the thesis.
Network Co-ordinators
ComprehensiveEvaluationInterviewsProjects
Depth of Knowledge Acquired
SupplierPipelines
Overview -
Breadth - No of cases
Figure 4.3: Scope and depth o f understanding offered by different units o f analysis (Source: adapted
from Towill et al. 2001)
4.1.2 Case Selection
According to Stake (1994), while case study research is not sampling research, some cases
may do a better job than others, so when selecting cases it is important to maximise what
one can learn about the phenomena under study. Cases are often chosen for theoretical, not
/
100

[Chapter 4-Research Design]
statistical, reasons. Cases may be chosen to replicate previous cases or extend emergent
theory, or they may be chosen to fill theoretical categories and provide examples of polar
types (Eisenhardt, 1989). This study employs a deliberate theoretical sampling plan for
different units of analysis.
The network co-ordinator was selected based on a number of criteria. The most important
characteristic of the network co-ordinator in selecting the focal company was the likeness of
the supply chain with the expected characteristics of an ETO supply chain as specified in
the literature review. They were also chosen based on the willingness of the organisation to
engage with academic research. In particular, they were chosen on the basis of motivation to
address the uncertainties that exist within their supply chains and explore supply chain
strategies to enable them to cope with such uncertainty. Companies demonstrating and
engaging in innovative supply chain initiatives were sought out. Both network co-ordinators
were partners on an EPSRC funded research project at Cardiff entitled McCLOSM (Mass
customised Logistics for Sustainable Manufacturing). McCLOSM was a 5 year industry
linked project examining frameworks for logistics and supply chain across the 3 sectors of
steel, construction and retail, running between 2004 and 2009. This thesis draws on the
construction related activities undertaken in the project, which the author was solely
responsible for.
The network coordinator in System 1 is a main contractor based in the South of the UK and
has a turnover of £70 million with a workforce of around 550 employees. Major clients
include housing associations, care scheme operators, commercial and industrial concerns
and schools. The organisation specialises in delivering projects on a design and build basis,
which has been described elsewhere as an integration coalition, where a client transfers the
majority of risk to a main contractor who then takes responsibility for the design and
execution of the project (Winch, 2002). The network coordinator has a total network of over
750 suppliers, which it configures based on the needs of each project. It has won numerous
awards for best developments, and has been included in a number of best practice guides
written about client partnering and supply chain management.
i
101

[Chapter 4-Research Design]
The network co-ordinator in System 2 is a global construction management company with a
turnover of £530 million and 2800 employees. The organisation specialises in large
commercial tower buildings delivered on a construction management contract basis. This
contract type has been described as a mediated coalition which is characterized by the
appointment of a construction manager who is responsible for managing trade contractors
(Winch, 2002). The value and duration of the projects is much greater than in System 1.
The company was voted in the top 5 of the Sunday Times ‘top track’ in 2008 and was also
awarded the construction management organization of the year prize by a leading trade
magazine. The organisations approach to supply chain management and collaboration are
well recognized in the industry.
Once the network co-ordinators were selected the next step was to identify suitable projects
and supplier pipelines to study. Projects and supplier pipelines were both selected via
‘snowball sampling’ (Sanderson and Cox, 2008; Scarbrough et al., 2004). This process
includes using recommendations regarding areas of focus, and interviewees suggested by
key industrial contacts from the focal organisations, which in this case was the network co
ordinator. Yin (2003) suggested defining a set of operational criteria whereby candidates
will be deemed qualified to serve as cases. An illustration of the snowball sampling process
and the operational criteria for the different units of analysis is shown in figure 4.4.
Recommendations from project team s for supplier
pipelines to study
Recommendations from network co-ordinator for
projects to study
Selection of Network Co-ordinator
• Likeness with ETO supply chain• Willingness to engage in research• Innovation and best practice in supply chain m anagement
• Supply into one or more of selected projects• Represent range of supply chain structures• Range of relationships with network coordinator
Selection of Pipelines
• Within portfolio of network co-ordinator• Early project phase •R ange of project characteristics• Willingness of project team to engage in research
Selection of Projects
Figure 4.4: The snowball sampling process and operational criteria for different units
of analysist
102

[Chapter 4-Research Design]
A set of criteria to screen different candidate projects was developed. Firstly, the phase that
the project was in at the time of selection was used as a selection criterion. Projects were
favoured if they were at the beginning of the construction phase. This would allow the
researcher to visit as the site develops and offer the opportunity to observe construction
processes as they took place. Secondly, pragmatic concerns such as the willingness of the
project management team to engage with the researcher were also considered. Finally, build
characteristics such as value, time constraints, construction method, and logistical
challenges were also considered for project selection. The intention was to include projects
with a range of values, construction methods and logistical challenges. A more detailed
description and analysis of these projects is offered in chapter 5. Table 4.1 shows a
summary of the projects selected. Eight projects from network co-ordinator 1 were short
listed. Three of these were chosen which are shown in the table as projects 1, 2 and 3. Only
two projects from network co-ordinator 2 fit the criteria, and are shown in the table as
projects 4 and 5.
P r o je c t 1 P ro jec t 2 P ro jec t 3 P ro jec t 4 P ro jec t 5V alu e £4.7m £3.2m £66m £155m £100m
T im e P eriod 74 Weeks 68 Weeks 60 Months 3 Years 2 YearsC u sto m er Social Social Consortium Commercial Commercial
T yp e HousingDeveloper
HousingDeveloper
o f private and government
Developer Developer
P roject T yp e Social and Social Regeneration Large HighPrivate
HousingHousing Project Commercial
TowerSpecification
OfficeBuilding
C on stru ction Concrete Timber Timber Concrete ConcreteM eth od Frame Frame Frame Frame frameB u ild in gD eta ils
32 Flats 37 Flats 442 new homes, 325
refurbished. 3 commercial
buildings
21 Storey 3 Tier Glass
facade Tower (586,000sqft)
6 Storey Office Block (100,000sqft)
C on tract Design and Design and Private Construction ConstructionT yp e Build Build Finance
InitiativeManagement Management
N etw ork C o o rd in a to r
1 1 1 2 2
Table 4.1: Summary o f projects in the study
103

[Chapter 4-Research Design]
Supplier pipelines were also recruited via snowball sampling, but a specific selection criteria
was also developed. In order to analyse different pipelines in ETO supply chains, the
researcher was given access to contact details for suppliers and subcontractors with
recommendations as to which may be suitable for research. Suppliers were then approached
according to three criteria. Firstly, only suppliers that were involved with the projects
selected were considered. Secondly, the range of suppliers were chosen to represent the
spread of supply chains structures from buy-to-order, where components are only purchased
when a customer order exists, to MTS, where finished goods are held in a fixed location
awaiting customer orders (Hoekstra and Romme, 1992; Naylor et al., 1999). Thirdly,
suppliers were chosen to represent a range of categories of supplier relationships with the
network co-ordinator. Table 4.2 shows the details for the different supply pipelines that
participated in the pipeline survey, and their relationships to projects and network co
ordinators. These relationship categories are described in more depth in chapters 7 and
include strategic partners, preferred suppliers and approved suppliers
Cas
e
Sect
or
Em
ploy
ees
Tur
nove
r
Net
wor
k C
o-
orin
dato
r
Proj
ects
Prim
ary
Supp
ly
Chain
St
ruct
ure
Rel
atio
nshi
p wi
th
Net
wor
k C
o-or
dina
tor
A Elevators and Escalators 44000 £3.83b
n 1 1 ATO Strategic Partner
B Windows 20-30 £4.5m 1 1 and 2 MTO Preferred
C Pre-castConcrete 350 £23 0m 1 1 MTO Preferred
D Roof Trusses 150 £8m 1 2 MTO PreferredE Metalwork 10,20 £1.25m 1 1 BTO ApprovedF Brickwork 234 £15.7m 1 1 MTS Approved
G Timber Frame Systems 1400 £420m 1 2 and 3 MTO Strategic Partner
H Doors 205 £22.5m 1 3 BTO Preferred
I BuildersMerchant 10600 £2bn 1 3 MTS Approved
J Paint 67 £ 1 1.5m 2 4 and 5 MTS Strategic Partner
K ModularBathrooms 425 £53.8m 2 4 and 5 ATO Strategic Partner
L Drylining/Safet y systems
52-100 £14m 2 4 and 5 BTO Strategic Partner
Table 4.2: Summary of the supplier pipelines
104

[Chapter 4-Research Design]
4.3 APPLICATION OF THE RESEARCH METHODS
The next step in conducting the case research was the development of research
instrumentation and an accompanying research protocol. This section will describe the
specific package of research methods used in the thesis. The instruments refer to the
particular methods to be employed, and the protocol contains the procedures and general
rules that should be used, as well as who or from where the different kinds of information
are to be sought when using the instruments (Voss et al., 2002). The case study protocol
contains the instruments as well as the general rules to be followed in using the protocol. It
guides the investigator in carrying out the data collection and is essential when doing a
multiple case study to ensure reliability across different cases (Yin, 2003). It has been noted
that triangulation of different data collection methods can help the development of
converging lines of inquiry (Eisenhardt, 1989; Yin, 2003). Table 4.3 provides an overview
of the data collection methods used in the study for different units of analysis.
M e th o d N e tw o r k C o -o r d in a to r P r o je c t S u p p lie r P ip e lin e sA im E xp lore Supply Chain
F lex ib ilityId en tify Project
U ncerta in tiesE xplore Supplier
P ip elinesProtocol A p p en d ix 1 A p p en d ix 3 A p p en d ix 4
Interview s M ajor p rocess team s S ite M anagem ent R ecom m en ded C ontact
ProcessM apping
S up ply chain p rocess m apping. M ap p ing o f requ isition and b uyin g
process.
S ite p rocesses Input - Output process m aps. Individual process
m aps for p ipelines. G eneric p rocess m aps for
all p ipelines.
O bservation T eam m eetin gs, m anagem ent p rocesses
and system s
S ite v is its , v isu a l control boards
Factory v is its , v isu al control boards, system s
dem onstrations.Brainstorm ing R egular m eetin gs w ith
k ey stakeholders to brainstorm fin d in gs so far
and ver ify data. A lso u sed to ‘m ap ’ supply ch ain f lex ib ility onto
uncertainties
B rainstorm ing se ss io n s to d evelop generic
uncertainties, h igh light cau se and e ffec t o f uncertainties and to
estab lish im pact/ lik elih ooh
B rainstorm ing sess io n s to estab lish relationships in
causal m od ellin g diagram s.
A rchival D ata P ro cess and procedure d ocum ents,
organ isational charts, w eb site inform ation,
records o f supplier perform ance, lead tim e data, com pany reports.
Project sp ec ific docum ents. D raw in gs,
project p lans, requisition form s, b ills o f m aterials,
order schedu les.
W eb sites , com pany reports, P rocess and
procedure docum ents, lead tim e data.
Table 4.3: Overview of data collection techniques
/
105

[Chapter 4-Research Design]
Table 4.4 provides an overview of the data collection methods used in the study for
different units of analysis.
M ethod N etw ork C o-ordinator Project Supplier P ipelinesCross case
analysisCompare purchasing
behaviour in two different ' ETO systems.
Compare embedded units o f analysis. Find
commonalities o f uncertainties across 5
Projects.
Compare embedded units o f analysis. Compare 12
Pipelines.
Process Maps Supply chain process mapping. Mapping o f
requisition process and purchasing models.
Site processes Input - Output process maps. Individual process
maps for pipelines. Generic process maps for all
pipelines.Interview
codingInterviews with process
teams coded1) Code individual project profiles to create a generic
uncertainty profile2) Categorise uncertainties
under sources o f supplychain uncertainty
1) Code ‘problems in the pipeline’
2) Code ‘sources o f competitive advantage’
Quantification N ot used Binary coding mapping techniques for flexibility types and uncertainties
Binary coding for analysis o f pipeline interviews.
DescriptiveStatistics
N ot used Graphs and charts for uncertainties identified
Graphs and charts for lead time data
Cluster Analysis N ot used Investigate clusters identified in binary coding
Investigate clusters identified in binary coding
Brainstorming Regular meetings with key stakeholders to brainstorm findings so far and verify data. A lso used to ‘map’
supply chain flexibility onto uncertainties
Brainstorming sessions to develop generic
uncertainties, highlight cause and effect o f uncertainties and to establish impact and
likelihood o f uncertainties
Brainstorming sessions to establish relationships in
causal modelling diagrams.
Cause and Effect
Cause and effect analysis o f uncertainties
Cause and effect analysis o f uncertainties
Causal modelling for pipeline problems and
solutionsTable 4.4: Sum m ary o f data analysis techniques
The remainder of this section offers a detailed description of the data collection techniques
and data analysis techniques that were used for the 3 units of analysis.
4.3.1 The Network Coordinators
As previously noted, the network coordinator represents the focal organization for the
system. For system 1 the researcher undertook a 10 week industrial secondment. The
researcher was given a desk at the case company and was placed under the care of the
‘business improvement manager’ and was seated with the ‘business improvement team’.
/
106

[Chapter 4-Research Design]
Prior to the secondment a case study protocol was developed. This consisted of research
objectives, provisional questions, planned activities, planned activities, data collection and
analysis techniques, major deliverables and resources required. An industrial workshop was
organised to pilot the protocol and was presented to members of the McCLOSM project,
including practitioners from retail, steel and construction sectors, as well as academics from
the McCLOSM team. Along with comments from the business improvement manager at the
network coordinator, minor revisions were then made to the case protocol. The protocol then
led to the development of a case study brief, which is shown in appendix 1.
The secondment afforded the opportunity to sit in team meetings, encounter informal chats
in corridors and get insights into the minutiae of how operations are conducted and
managed. Semi-structured interviews were carried out with major process teams, including
‘preconstruction’, ‘construction’, ‘technical’ and ‘new business’ teams, and the researcher
was granted permissions to sit in different team meetings. Organisational charts and
structures were used to select relevant interviewees. Supply chain managers, buyers,
quantity surveyors, technical design staff, logistics and business improvement employees
were all interviewed as part of the protocol. An interview log is shown in appendix 2.
The researcher was given access to a range of archival data types. This included access to
internal systems and databases, publicity material, in house magazines, process maps,
protocols and procedures. It also included access to marketing literature such as
presentations, public relations material and case study leaflets. Records of supplier
performance and key performance indicators held on a database were also used.
Brainstorming was also used to help synthesize different data types. Regular meetings with
the business improvement manager were held to brainstorm findings so far and verify data.
This also helped to indentify new avenues for data collection and refine ideas. Minutes of
brainstorming sessions were documented by the researcher. Process maps and models were
developed and then presented at brainstorming sessions.
Due to resource constraints, a secondment was not conducted for the network coordinator in
system 2, but the researcher was given free access to visit and collect data, and the same
i
107

[Chapter 4-Research Design]
protocol and case study brief were used. A research diary and folder was maintained for
each system.
4.3.2 Projects
The focus of the project unit of analysis was the identification of project uncertainties and
risks. Five sites across the two systems were visited. Some were visited more than once to
observe site progress. Visits to the sites are also shown in the fieldwork log shown in
appendix 2. In all of the site visits the researcher was accompanied by members of site
management and other staff from headquarters. This gave the researcher the opportunity to
ask questions, clarify and observe processes during the tour of the site. Photos, process maps
and notes were recorded during these visits.
Semi structured interviews were conducted with site managers and project managers. A
template was designed for interviewing and capturing data from project managers based on
risks and uncertainties across all the stages of a project. This is shown in appendix 3. Risks
and uncertainties were probed against the project stages identified in the project protocol
suggested by (Winch and Carr, 2001). The stages they suggest are define need, establish
viability, conception, scheme design, detailed design, production planning, main trades,
finishing trades, commissioning and facility management. Documents, such as project plans,
project designs, requisition forms, bills of materials, tender documents, photos and site logs
were provide to support other forms of data collection.
For the analysis of project uncertainties, a risk and uncertainty register, in the form of a
spreadsheet, was developed for each project based on the data collected from semi
structured interviews with site management teams. The uncertainties for individual projects
were then categorized to develop a more generic list o f uncertainties. A final spreadsheet
was developed listing the generic uncertainties, grouping them by sources of supply chain
uncertainty described in Mason-Jones and Towill (1998).
Once a generic list of uncertainties was developed, the next step in the research protocol
was to establish the likelihood of different uncertainties developing into a negative outcome
i
108

[Chapter 4-Research Design]
and the potential impact in terms of cost and time penalties. These two dimensions, which
are well documented in the risk management literature (The Institution of Civil Engineers,
1998), are used here to indicate the relative importance of the different uncertainties. A
brainstorming activity was conducted and uncertainties identified were plotted on a graph
with the axes ‘impact’ and ‘likelihood’. This activity was supported by a clustering and
brainstorming exercise, including business improvement manager from network co
ordinator 1 and a business unit director from network co-ordinator 2, with the aim of
producing a cause and effect diagram. The results of the cause and effect analysis are
mapped onto the dimensions of the supply chain uncertainty circle to provide an insight into
the causes and relationships between uncertainties in the ETO system.
In chapter 6 a binary coding mapping exercise is undertaken to identify whether
uncertainties can be mitigated by vendor and sourcing flexibility, the two antecedents of
supply chain flexibility. The uncertainties identified in the study were listed in a table
column. Vendor and sourcing flexibility were then listed across the top of the table in order
to ‘map’ them against uncertainties. The table was then populated with binary coding to
indicate which antecedent can be used to mitigate the different uncertainties. A ‘0’ indicates
that it cannot mitigate the uncertainty, and a ‘ 1 ’ indicates that it can be used to respond to a
specific uncertainty. The decision about whether or not a flexibility type is required to
mitigate an uncertainty was reached by a triangulation of sources of information:
• Literature and interviews. The researcher used the literature to establish appropriate
applications of flexibility types and coded interviews from site management teams
which included suggestions as to the ways in which uncertainty can be mitigated
were used.
• Brainstorming sessions. Once a preliminary matrix was developed the results were
brainstormed with the business development manager from network co-ordinator 1
and a business unit director from network co-ordinator 2.
• Evaluation presentations. The results were then presented to a range of organisations
to evaluate the results.
i
109
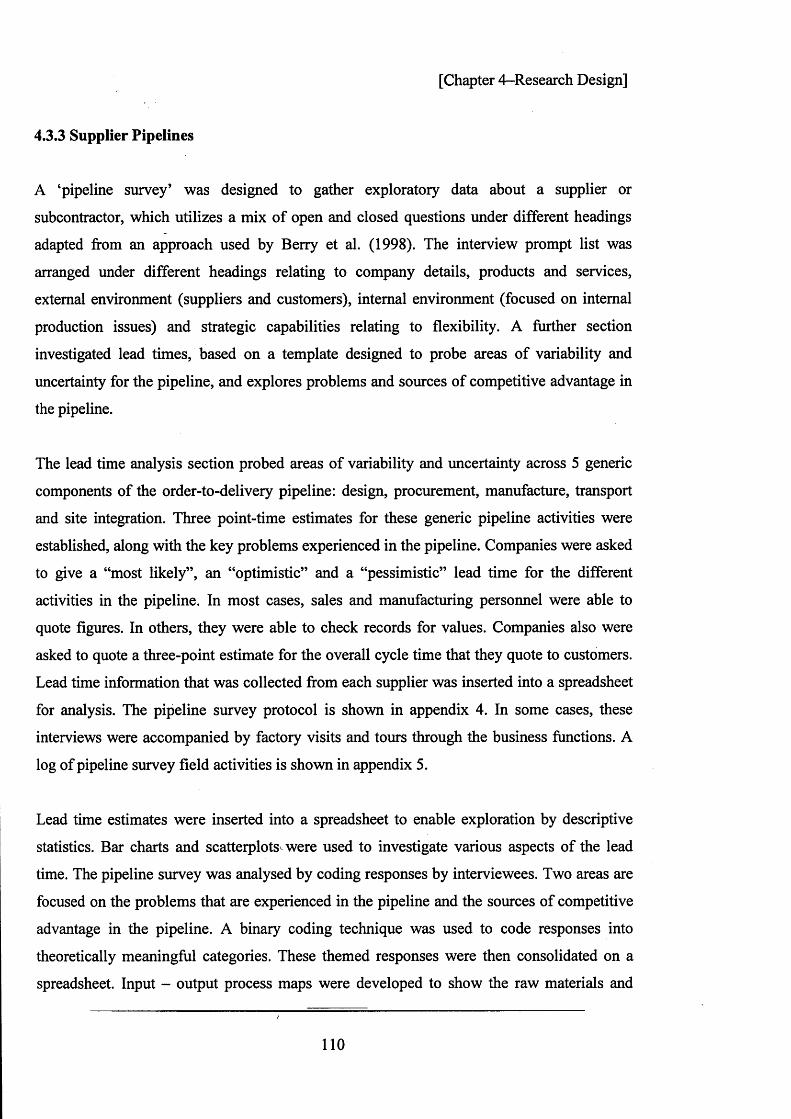
[Chapter 4-Research Design]
4.3.3 Supplier Pipelines
A ‘pipeline survey’ was designed to gather exploratory data about a supplier or
subcontractor, which utilizes a mix of open and closed questions under different headings
adapted from an approach used by Berry et al. (1998). The interview prompt list was
arranged under different headings relating to company details, products and services,
external environment (suppliers and customers), internal environment (focused on internal
production issues) and strategic capabilities relating to flexibility. A further section
investigated lead times, based on a template designed to probe areas of variability and
uncertainty for the pipeline, and explores problems and sources of competitive advantage in
the pipeline.
The lead time analysis section probed areas of variability and uncertainty across 5 generic
components of the order-to-delivery pipeline: design, procurement, manufacture, transport
and site integration. Three point-time estimates for these generic pipeline activities were
established, along with the key problems experienced in the pipeline. Companies were asked
to give a “most likely”, an “optimistic” and a “pessimistic” lead time for the different
activities in the pipeline. In most cases, sales and manufacturing personnel were able to
quote figures. In others, they were able to check records for values. Companies also were
asked to quote a three-point estimate for the overall cycle time that they quote to customers.
Lead time information that was collected from each supplier was inserted into a spreadsheet
for analysis. The pipeline survey protocol is shown in appendix 4. In some cases, these
interviews were accompanied by factory visits and tours through the business functions. A
log of pipeline survey field activities is shown in appendix 5.
Lead time estimates were inserted into a spreadsheet to enable exploration by descriptive
statistics. Bar charts and scatterplots were used to investigate various aspects of the lead
time. The pipeline survey was analysed by coding responses by interviewees. Two areas are
focused on the problems that are experienced in the pipeline and the sources of competitive
advantage in the pipeline. A binary coding technique was used to code responses into
theoretically meaningful categories. These themed responses were then consolidated on a
spreadsheet. Input - output process maps were developed to show the raw materials and
/
110

[Chapter 4-Research Design]
resource inputs for each supplier and the resulting outputs. An example of a simple process
map for the focal company in pipeline K is shown in appendix 6. It shows key inputs and
outputs at various process stages with key enablers for different processes shown in vertical
text. After the process maps were completed, and the interviews written up, they were
emailed to interviewees for verification.
4.3.4 Evaluation Interviews
As noted by Easterby-Smith et al. (2008), an underlying concern for researchers of all
persuasions is that a piece of research stands up to outside scrutiny. This section describes
how the case research in this thesis was evaluated using outside scrutiny. According to
Lincoln and Guba (1985), ‘member checking’, whereby data, analytic categories,
interpretations and conclusions are tested with members of stakeholder groups, is a crucial
technique for establishing the credibility of research. This could come in the form of
reporting findings to those from whom the data was originally tested or knowledgeable
individuals from relevant groups. The researcher must then hear and weigh their
meaningfulness and, unless the researcher has reason to doubt the integrity of informants, a
member check is valid way to establish the meaningfulness of findings and interpretations
and provides a strong foundation for convincing readers and critics of the authenticity of
research.
Evaluation presentations were made to key stakeholder groups. The evaluation interviews
are important as they provide a method for exposing the findings of the case research
outside of the two case systems. The interviews offer findings that help to establish the
potential to generalise the findings to different ETO construction environments. The aims of
this activity were as follows:
1. Assess the accuracy, completeness, value, fairness and perceived validity of the
findings by external review;
2. Evaluate the extent to which the findings can be generalised to different ETO
construction sectors;
3. Evaluate the strengths, weaknesses, opportunities and threats associated with the
research;
/
111

[Chapter 4-Research Design]
4. Enhance and enrich findings with evaluative empirical data;
5. Identify avenues for further research.
Potential participants were approached with standard email stating the above aims and
giving a brief overview of the research findings. If this invitation was accepted a
presentation was made to the participant. At the beginning of the presentation participants
were reminded of the aims and the opportunity to ask questions and make comments was
offered at any time during the presentation. If no comments were forthcoming the
researcher prompted a response by probing for thoughts on key slides. A paper copy of the
presentation was given to participants to read after the activity to allow more detailed
scrutiny after the presentation had been made. At the end of the presentation, the
interviewee was asked to identify the strengths, weaknesses, opportunities and threats
associated with the research. The interviewees were also asked about the extent to which
findings could be applied to their respective ETO construction sectors.
Table 4.5 provides a summary of the evaluation interviews. This selection process was
purposeful, and had the objective of gathering feedback from a range of sectors and a wide
range of supply chain members. A purposeful selection criterion was developed based on
the units of analysis identified in the case research. As the construction sector provides the
arena for the case research, the interviewees were targeted to cover a range of sub-sectors
from the construction industry. Potential interviewees were also approached with the
intention of covering a range of organisational types including clients, manufacturers,
network co-ordinators, design, logistics and organisational bodies.
Table 4.5 shows that the interviewees were from a range of ETO construction sectors, house
building, commercial buildings, civil engineering and government bodies, as well as
representing a range of organisation types including clients, manufacturers, network co
ordinators, design, logistics and organisational bodies. It is also important to note that all
interviewees were experienced, respected professionals in senior roles in their respective
sectors.
i
112

[Chapter 4-Research Design]
OrganisationType
Sector
House-Building
CommercialBuildings
CivilEngineering
Government
Client Interviews 5 & 6ManufacturerNetwork Co
ordinator Interview 4
Architect/Designengineer Interview 1
Logistics Interview 2Organisational
Body Interview 3
Table 4.5: O verview o f evaluation interview s
4.3.5 Summary of empirical data collection
This section seeks to bring together all the different data collection phases of the study.
Table 4.6 presents a summary of the contact with industry across the different data
collection phases, showing the frequencies of different data collection activities. Interviews
were the most numerous data collection technique with a total of 38. This was followed by
site and factory visits which amounted to 14 across both systems.
Eight brainstorming sessions were conducted in total, one of which involved members from
both systems. These are shown in the detailed log in appendix 2, and are also summarised in
chapter 5, which makes extensive use of the brainstorming sessions (see table 5.1). Sessions
1 and 2 aimed to confirm the scope, scale and focus of the research. Sessions 3, 4 and 5
aimed to identify and consolidate supply chain uncertainties. The spreadsheets for different
projects, as well as the generic uncertainty profile were discussed in these sessions. Sessions
5, 6 and 7 investigated the cause and effect of uncertainties. A ‘post-it-note’ exercise was
undertaken, whereby uncertainties and their relationships were established by the group by
writing, moving and agreeing on the position of post it notes showing the cause and effect
of uncertainties. This is a popular technique used in lean process mapping (Hines et al.,
1998; Hines and Taylor, 2000). Sessions 6, 7 and 8 sought to identify the likelihood and
impact of uncertainties. Post it notes, with the generic supply chain uncertainties written on
them, were added to a large board with the axis impact, running from high to low, and
/
113
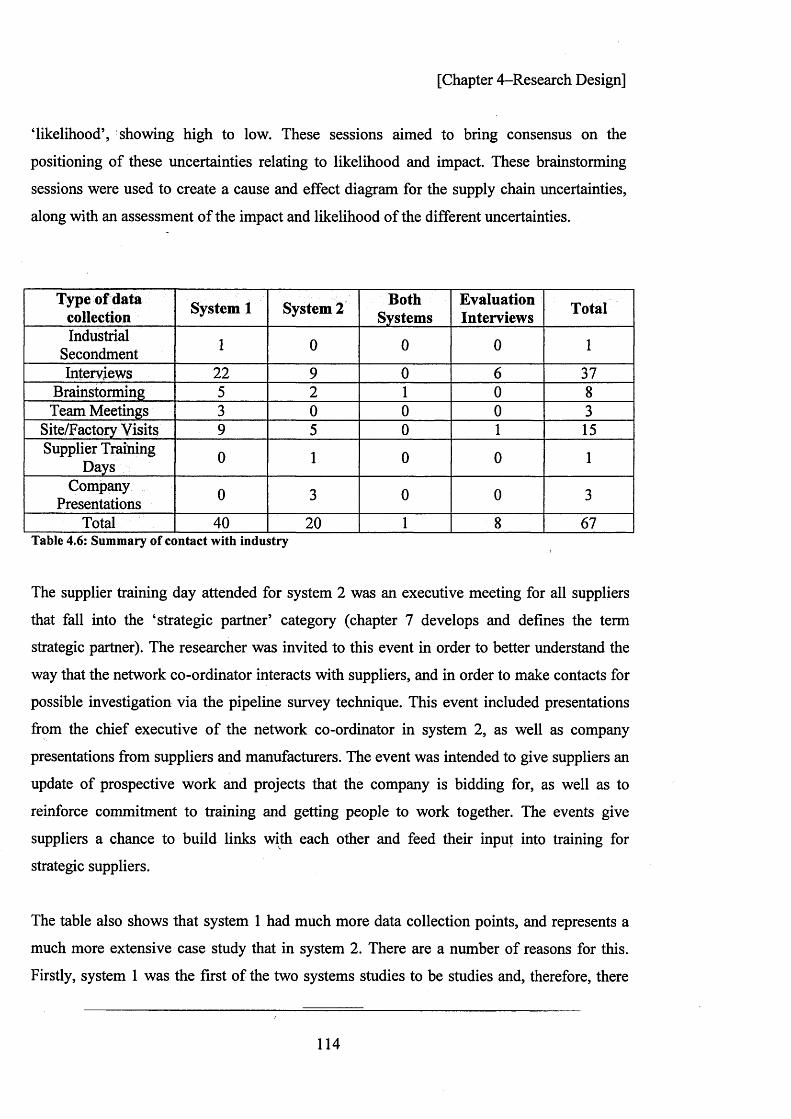
[Chapter 4-Research Design]
‘likelihood’, showing high to low. These sessions aimed to bring consensus on the
positioning of these uncertainties relating to likelihood and impact. These brainstorming
sessions were used to create a cause and effect diagram for the supply chain uncertainties,
along with an assessment of the impact and likelihood of the different uncertainties.
Type of data collection System 1 System 2 Both
SystemsEvaluationInterviews Total
IndustrialSecondment 1 0 0 0 1
Interviews 22 9 0 6 37Brainstorming 5 2 1 0 8Team Meetings 3 0 0 0 3
Site/Factory Visits 9 5 0 1 15Supplier Training
Days 0 1 0 0 1
CompanyPresentations 0 3 0 0 3
Total 40 20 1 8 67Table 4.6: Sum m ary o f contact w ith industry
The supplier training day attended for system 2 was an executive meeting for all suppliers
that fall into the ‘strategic partner’ category (chapter 7 develops and defines the term
strategic partner). The researcher was invited to this event in order to better understand the
way that the network co-ordinator interacts with suppliers, and in order to make contacts for
possible investigation via the pipeline survey technique. This event included presentations
from the chief executive of the network co-ordinator in system 2, as well as company
presentations from suppliers and manufacturers. The event was intended to give suppliers an
update of prospective work and projects that the company is bidding for, as well as to
reinforce commitment to training and getting people to work together. The events give
suppliers a chance to build links with each other and feed their input into training for
strategic suppliers.
The table also shows that system 1 had much more data collection points, and represents a
much more extensive case study that in system 2. There are a number of reasons for this.
Firstly, system 1 was the first of the two systems studies to be studies and, therefore, there
/
114
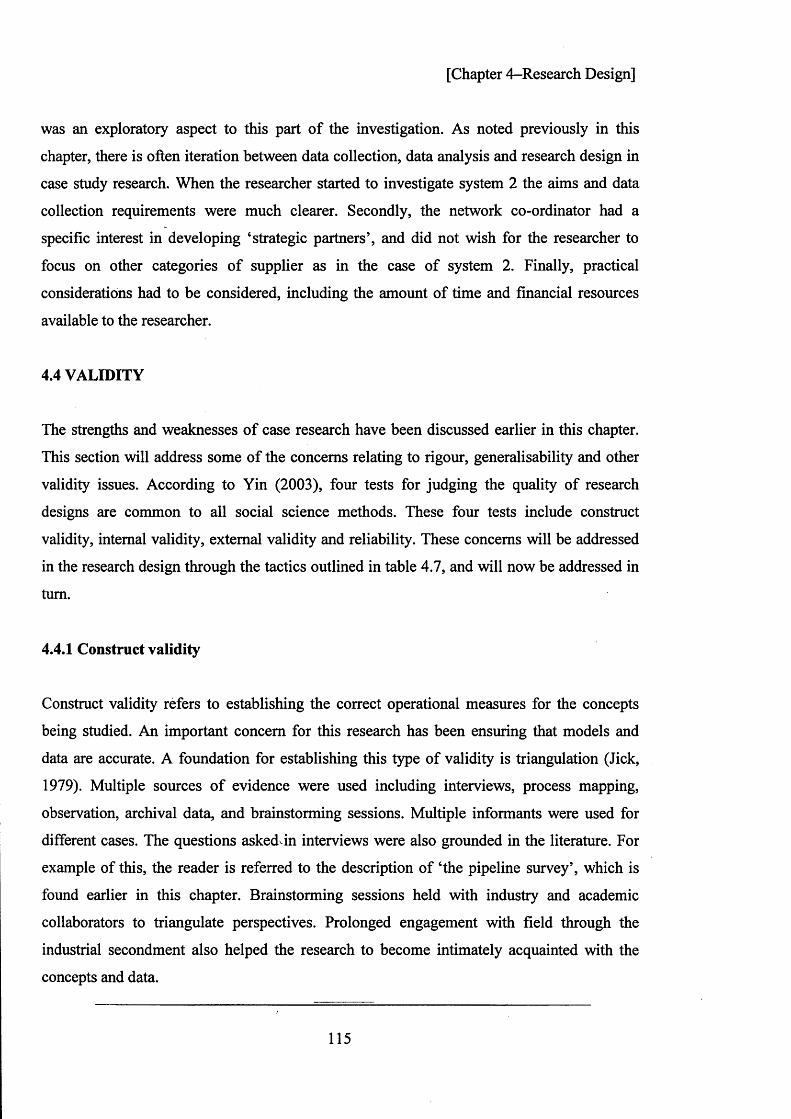
[Chapter 4-Research Design]
was an exploratory aspect to this part of the investigation. As noted previously in this
chapter, there is often iteration between data collection, data analysis and research design in
case study research. When the researcher started to investigate system 2 the aims and data
collection requirements were much clearer. Secondly, the network co-ordinator had a
specific interest in developing ‘strategic partners’, and did not wish for the researcher to
focus on other categories of supplier as in the case of system 2. Finally, practical
considerations had to be considered, including the amount of time and financial resources
available to the researcher.
4.4 VALIDITY
The strengths and weaknesses of case research have been discussed earlier in this chapter.
This section will address some of the concerns relating to rigour, generalisability and other
validity issues. According to Yin (2003), four tests for judging the quality of research
designs are common to all social science methods. These four tests include construct
validity, internal validity, external validity and reliability. These concerns will be addressed
in the research design through the tactics outlined in table 4.7, and will now be addressed in
turn.
4.4.1 Construct validity
Construct validity refers to establishing the correct operational measures for the concepts
being studied. An important concern for this research has been ensuring that models and
data are accurate. A foundation for establishing this type of validity is triangulation (Jick,
1979). Multiple sources of evidence were used including interviews, process mapping,
observation, archival data, and brainstorming sessions. Multiple informants were used for
different cases. The questions asked in interviews were also grounded in the literature. For
example of this, the reader is referred to the description of ‘the pipeline survey’, which is
found earlier in this chapter. Brainstorming sessions held with industry and academic
collaborators to triangulate perspectives. Prolonged engagement with field through the
industrial secondment also helped the research to become intimately acquainted with the
concepts and data.
i
115
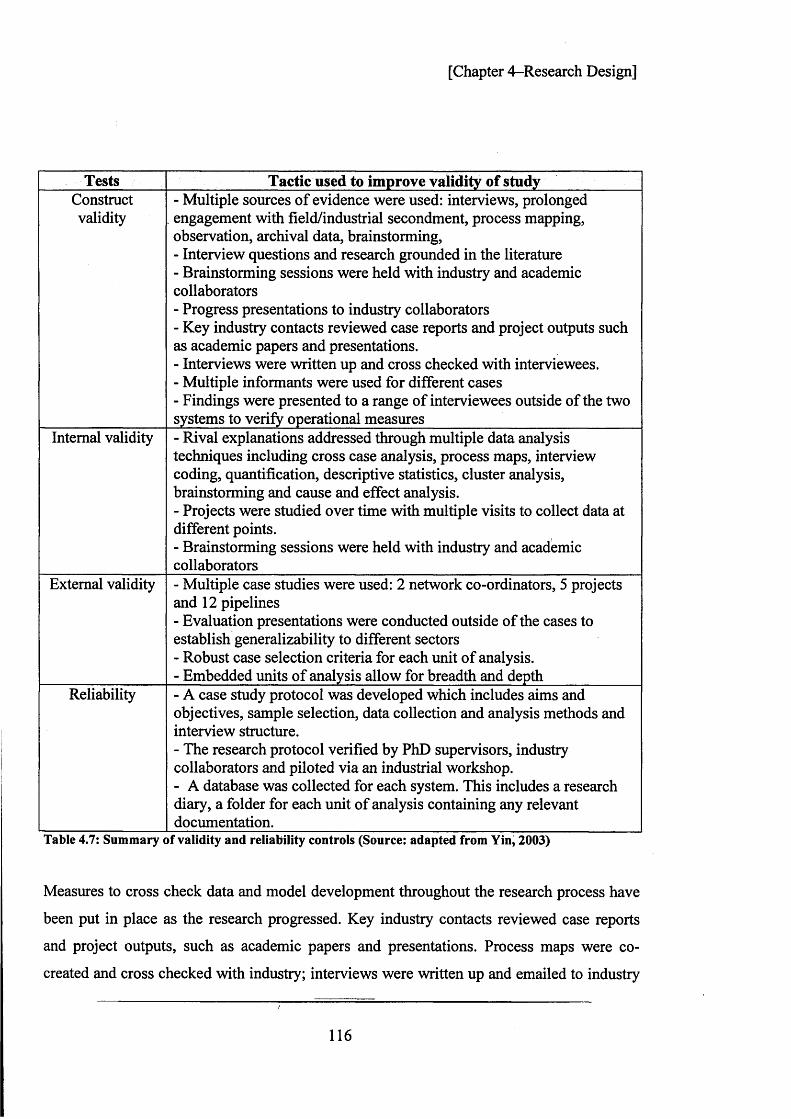
[Chapter 4-Research Design]
Tests Tactic used to improve validity of studyConstructvalidity
- Multiple sources of evidence were used: interviews, prolonged engagement with field/industrial secondment, process mapping, observation, archival data, brainstorming,- Interview questions and research grounded in the literature- Brainstorming sessions were held with industry and academic collaborators- Progress presentations to industry collaborators- Key industry contacts reviewed case reports and project outputs such as academic papers and presentations.- Interviews were written up and cross checked with interviewees.- Multiple informants were used for different cases- Findings were presented to a range of interviewees outside of the two systems to verify operational measures
Internal validity - Rival explanations addressed through multiple data analysis techniques including cross case analysis, process maps, interview coding, quantification, descriptive statistics, cluster analysis, brainstorming and cause and effect analysis.- Projects were studied over time with multiple visits to collect data at different points.- Brainstorming sessions were held with industry and academic collaborators
External validity - Multiple case studies were used: 2 network co-ordinators, 5 projects and 12 pipelines- Evaluation presentations were conducted outside of the cases to establish generalizability to different sectors- Robust case selection criteria for each unit of analysis.- Embedded units of analysis allow for breadth and depth
Reliability - A case study protocol was developed which includes aims and objectives, sample selection, data collection and analysis methods and interview structure.- The research protocol verified by PhD supervisors, industry collaborators and piloted via an industrial workshop.- A database was collected for each system. This includes a research diary, a folder for each unit of analysis containing any relevant documentation.
Table 4.7: Sum m ary o f valid ity and reliability controls (Source: adapted from Yin^ 2003)
Measures to cross check data and model development throughout the research process have
been put in place as the research progressed. Key industry contacts reviewed case reports
and project outputs, such as academic papers and presentations. Process maps were co
created and cross checked with industry; interviews were written up and emailed to industry
/
116

[Chapter 4-Research Design]
for validation. Progress presentations were also regularly delivered to industry and academic
collaborators. Finally, the overall findings were examined for construct validity through the
evaluation interviews, which were presented to a range of interviewees outside of the two
systems to verify operational measures and to ensure that stakeholders outside of the
systems of study were able to relate to the concepts in a meaningful way.
4.4.2 Internal validity
Internal validity pertains to establishing a causal relationship, whereby certain conditions are
shown to lead to other conditions, as distinguished from spurious relationships. This type of
validity has important implications for the cause and effect analyses undertaken in this
thesis. Establishing accurate causal relationships has been ensured through a number of
techniques. Multiple data analysis techniques have been used, including cross case analysis,
process maps, interview coding, quantification, descriptive statistics, cluster analysis, and
brainstorming, drawing on both qualitative and quantitative data. Multiple perspectives
have been gathered through brainstorming sessions, ensuring that the cause and effect
relationships have been reached as a result of a consensus between stakeholders. Projects
were studied over time, with multiple visits to collect data at different points. The findings
from cause and effect analysis are also related back to theory and relevant studies.
4.4.3 External validity
External validity refers to establishing the domain to which a study’s findings can be
generalised. The term ‘generisability’ can be defined as “whether the findings are equally
applicable to other research settings, such as other organisations” (Saunders et al., 2007).
The research design adopted herein is based on multiple case studies with multiple units of
analysis. More specifically it includes 2 network co-ordinators, 5 projects and 12 pipelines
across 2 ETO systems. The first tactic to note is the use of embedded units of analysis which
account for depth and breadth of analysis. The network co-ordinators allow an in depth
‘immersed’ investigation of the key organisation within the ETO supply chain. The supplier
pipelines allow for focussed data collection which accounts for greater breadth of coverage.

[Chapter 4-Research Design]
The project unit of analysis provides an intermediate between breadth and depth. A robust
case selection criterion was used for each unit of analysis.
The extent to which the findings can be generalised to different sectors is addressed
specifically in the evaluation interviews. Evaluation presentations were conducted outside of
the cases to establish generalizability to different ETO construction sectors. A case selection
criterion was designed to recruit interviewees from a range of ETO construction sectors and
a cross section of organisation types. The extent to which findings can be generalised was a
particular area of focus for these interviews.
4.4.4 Reliability
The final test is that of reliability. To achieve reliability the study must address the extent to
which the operations of a study, such as the data collection procedures, can be repeated with
the same results (Yin, 2003).To facilitate reliability, a case study protocol was developed
which includes aims and objectives, sample selection, data collection and analysis methods,
and interview structure. A more specific protocol was developed from the project and
pipeline units of analysis. These research protocols were verified by PhD supervisors,
industry collaborators and piloted via an industrial workshop that was held as part of the
McCLOSM project. A database was created for each ETO system. This included a research
diary, a folder for each unit of analysis within the system containing any relevant
documentation.
4.5 SUMMARY
The case research design has been developed in this chapter. The study uses multiple case
study design using three embedded units of analysis. Three units of analysis of interest have
been specified within an ETO system: the network co-ordinator, projects and supplier
pipelines. The case selection criteria have been presented, where ‘snowball sampling’ plays
an important role. A mixed methods research design was also specified, with qualitative
118

[Chapter 4-Research Design]
methods playing the dominant role and quantitative techniques playing a supporting role.
Qualitative and quantitative techniques will be used concurrently.
This chapter has also described the ways in which research methods reviewed in chapter 3
were applied to different units of analysis are described. These individual research methods
have been tailored to investigate different units of analysis. This chapter has also described
the data analysis techniques used in the study. Multiple data analysis techniques are used
including cross case analysis, process maps, interview coding, quantification, description
statistics, cluster analysis, brainstorming and cause and effect analysis. Data analysis
techniques are also tailored to the units of analysis. Finally, discussions around validity and
reliability are addressed. A summary of the tactics used to address four key validity and
reliability concerns was presented.
.SUMMARY QF CHAPTER 4AIMS1. Introduce the basic case study design and case selection criteria
- A multiple c a se research with em bedded units of analysis strategy w as specified2. Link research questions with research methods
- Each research question h a s been related to bodies of know ledge in the literatureand th e na tu re of investigation during th e thesis
3. Identify the units of analysis- Three units of an a ly sis have been specified: network co-ordinators, projects and
supplier pipelines. T he data collection m ethods em ployed for each unit of analysis h av e been p resen ted along with the data analysis techniques.
4. Describe the application of research methods to the units of analysis- The research m ethods for each of th e units of analysis have been specified
5. Explain the tactics used to address validity concerns- The tactics u se d to improve construct validity, internal validity, external validity and
reliability h av e been d iscu ssed
119

[Chapter 5 - Identifying and Categorizing Sources of Supply Chain Uncertainty]
CHAPTER 5
A METHOD FOR IDENTIFYING AND CATEGORISING THE
SOURCES OF UNCERTAINTY IN ENGINEER-TO-ORDER SUPPLY
CHAINS
CHAPTER 5 AIMS1) Develop a m ethod for th e identification and ca tego risa tion of uncertain ty in ETO construction su p p ly c h a in s .2) Apply the m ethod to 5 co n s tru c tio n p ro jec ts
R ESEARCH QUESTION ADDRESSED RQ2: How can th e s o u rc e s of p ro jec t uncerta in ty in ETO co n stru c tio n supp ly ch a in s
be identified and c a te g o rise d ?
Theoretical Empirical Research Findings
Chapter 2
RQ1
Chapters 3 and 4
M eth o d o lo g y
Chapter 3: Methodology
Chapter 4: Research Design
Chapter 5
Uncertainty in ETO Systems
RQ2
Chapter 6
PipelineImprovement
Strategies
RQ3
Chapter 7
Supply Chain Flexibility
RQ4
Chapter 8
Evaluation Of The Case Research
UnifiedFrameworkPresented
All RQs
VChapter 9
120

[Chapter 5 - Identifying and Categorizing Sources of Supply Chain Uncertainty]
5. INTRODUCTION
As noted in the literature review, uncertainties affecting supply chain operations are
recognized as significant obstacles to achieving value for customers. Mason-Jones and
Towill (1998), building on Davis (1993), developed the uncertainty circle model to
conceptualise the different sources of uncertainty that affect supply chain performance. This
chapter refines this model and applies it to five construction projects. Surprisingly, project
uncertainty has received very little attention in the literature. Ward and Chapman (2003)
argued that the restricted focus of project risk management must be modified to incorporate
an uncertainty management perspective. As noted by Patterson and Neailey (2002), while
various authors discuss uncertainty profiles in their work, very little has been written about
their development and construction.
The chapter begins with an overview of the projects used in the study, and will primarily
draw on empirical data relating to five projects from the project unit of analysis within the
ETO system. This is shown by the marked area with dotted lines in figure 5.1. The key
contribution of this chapter is the development of a five-stage method for identifying and
classifying uncertainty and its application to 5 construction projects. In doing this a number
of aims are achieved:
• Supply chain uncertainties are identified for 5 construction projects;
• The uncertainty circle is applied to categorise the uncertainties;
• A model of interactions for the analysis of uncertainties is developed;
• A positioning matrix is used to evaluate the relative importance of the uncertainties.
J . . ! -
121

[Chapter 5 - Identifying and Categorizing Sources of Supply Chain Uncertainty]
Figure 5.1: The two ETO systems and the primary focus of Chapter 4
5.1 METHOD OVERVIEW
This chapter is primarily concerned with identifying and categorising the uncertainties
experienced by the project management teams of five construction projects. The flow of
research activities that underpin this chapter are shown in figure 5.2. The first stage is the
development of a method for identifying and categorising supply chain uncertainty, based
on relevant literature. The method was then applied to 5 construction projects. During the
application phase, the first activity was site visits to five different projects along with semi
structured interviews based on the research protocol shown in appendix 3. Using these
interviews and site visits, individual project uncertainty profiles were entered on a
spreadsheet. These were then coded to create a generic project uncertainty profile for the 5
projects. The generic uncertainty profile was categorised by grouping them by sources of
supply chain uncertainty described in Mason-Jones and Towill (1998).
•D eve lo p s stage m ethod from literature
DEVELOPMETHOD
CATEQQRISEU N C E R T A IN T IE S• C ategorise uncertainties accord ing to supply chain uncertainty circle
DEVELOPUNCERTAINTY
PROFILES• D evelop ind iv idual spread sh eets• D evelop generic profile
•S em i S tructured In terv iew s •S ite V is its to Five P ro jects
DATACOLLECTION • Identify O riginators
o f U ncertainties• Identify cause and effect o f uncertainties• Identify likelihood and im pact of uncertainties and deve lop positioning matrix
B R A IN S TO R MSESSIONS
APPLICATION OF METHOD TO 5 CONSTRUCTION PR O JEC T S
Figure 5.2: Flow of research activities underpinning Chapter 5
122

[Chapter 5 - Identifying and Categorizing Sources of Supply Chain Uncertainty]
This chapter is largely based on the results of the brainstorming sessions described in the
methodology chapter. Brainstorming sessions were used to identify and consolidate supply
chain uncertainties, identify the originators of uncertainties, identify the cause and effect of
uncertainties and identify the likelihood and impact of uncertainties for the development of
a positioning matrix. A complete listing of all interviews conducted for the projects is
shown in appendix 2. As brainstorming sessions are an important for this chapter, a
summary of the 8 sessions is presented in table 5.1.
Session Date System Participants Focus1 11/7/06 1 Business development team (5 people)
and academic collaboratorDevelop scope and scale of case study
2 10/11/06 1 Academic collaborator, business improvement manager and supervisor
Develop scope and scale of case study
3 17/4/07 1 Onsite at project 2. Project manager, site manager and foreman.
Identify and consolidate supply chain uncertainties
4 29/5/07 1 Onsite at project 1. Site Team: Site Manager, Project Manager, Quantity Surveyor, Technical Manager.
Identify and consolidate supply chain uncertainties
5 12/1/08 2 Executive meeting for suppliers. Group director, Mechanical and engineering director, business unit director. Representatives of 15 suppliers were present at the training day.
- Identify and consolidate supply chain uncertainties- Cause and effect of
uncertainties
6 24/11/08 2 Business unit director and logistics manager.
- Cause and effect of uncertainties- Identify likelihood and impact of uncertainties
7 13/1/09 1 Business improvement manager, supply chain manager, project manager
- Cause and effect of uncertainties- Identify likelihood and impact of uncertainties
8 14/1/09 1 &2 Business improvement manager (system 1), business unit director (system 2), logistics manager (system 1) ^
- Verify list of uncertainties and cause and effect diagrams- Match uncertainties with flexibilities- Confirm likelihood and impact of uncertainties
Table 5. : Summary of brainstorming sessions
The table shows the date, the relevant system and the participants that were involved. A
summary of the focus of the session is also shown. Sessions 1 and 2 aimed to confirm the
scope, scale and focus of the research. Sessions 3, 4 and 5 aimed to identify and consolidate
123

[Chapter 5 - Identifying and Categorizing Sources of Supply Chain Uncertainty]
supply chain uncertainties. The spreadsheets for different projects, as well as the generic
uncertainty profile were discussed in these sessions. Sessions 5, 6 and 7 investigated the
cause and effect of uncertainties. A ‘post-it-note’ exercise was undertaken, whereby
uncertainties and their relationships were established by the group by writing, moving and
agreeing on the position of post it notes showing the cause and effect of uncertainties. This
is a popular technique used in lean process mapping (Hines et al., 1998; Hines and Taylor,
2000). Sessions 6, 7 and 8 sought to identify the likelihood and impact of uncertainties. Post
it notes, with the generic supply chain uncertainties written on them, were added to a large
board with the axis impact, running from high to low, and ‘likelihood’, showing high to
low. These sessions aimed to bring consensus on the positioning of these uncertainties
relating to likelihood and impact. These brainstorming sessions were used to create a cause
and effect diagram for the supply chain uncertainties, along with an assessment of the
impact and likelihood of the different uncertainties.
5.2 A METHOD FOR IDENTIFYING AND CATEGORIZING UNCERTAINTY
In order to guide this chapter, a method for identifying and categorizing uncertainty is
proposed. This is shown in figure 5.3, and is developed throughout the remainder of this
section. The rest of chapter examines how the method may be applied to a group of projects.
Effective Identification and Categorisation of
Uncertainty
5.3 M ethod for identifying and categorising supply chain uncertainty
Identity Uncertainties
Create Uncertainty
Profile
Categorise Uncertainties According to Source and Originator
Model interactions
Between Uncertainties
Use Positioning
Matrix to identify Severity
Step 1 - Identify uncertainties
The first step in the method is the identification of uncertainty, van der Vost and Beulens
(2002) argued that in order to identify effective supply chain redesign strategies, one should
focus on the identification and management of uncertainties in the decision making
processes that hinder optimal performance. Using a qualitative methodology, they argued it
is possible to identify uncertain scenarios. Ward and Chapman (2003) proposed that
uncertainty management requires the identification of all the many sources of uncertainty
124

[Chapter 5 - Identifying and Categorizing Sources of Supply Chain Uncertainty]
which give rise to and shape our perceptions of threats and opportunities. Books aimed at
practitioners provide some useful guidelines for possible ways to identify uncertainties. For
example, the Institution of Civil Engineers (1998) suggested that risk and uncertainty is best
identified through teams of stakeholders analyzing the whole life of an investment, using
such aids as site visits, check lists of problems, information from similar investments and
projects, case studies, safety reviews and impact studies, reviews of plans, designs and key
documentation.
Step 2 - Create an uncertainty profile
The next step is to compile an uncertainty profile. According to Williams (1994), a project
risk register should be a list of adverse events that might occur, and is likely to include
information on impact and risk reducing actions. It acts as a repository of knowledge and
initiates the analysis and plans that follow from it. The risk register is an effective tool to
enable a project team to evaluate the risks as part of the decision making process and
enables risk reduction and mitigation plans (Patterson and Neailey, 2002). Ward (1999)
suggested that the risk register enables the documentation of the sources of risk and their
responses, as well as their classification and involves compiling a log, list or register.
However, as noted by Patterson and Neailey (2002), while various authors discuss risk
registers in their work, very little has been written about their development and
construction. Project uncertainty profiling is based on similar principles to the risk register,
but has received much less attention in the literature. De Meyer et al. (2002) suggested that
an uncertainty profile is a qualitative characterization of uncertainties, and the degree to
which different types of uncertainty may affect the project. This uncertainty profile is a
subjective estimate and indicates which uncertainty types are the most important. To help
identify the dominant uncertainty types, a team may use experiences gained from previous
projects, or they may adopt more formal approaches such as statistical analyses, technology
and market forecasts, scenario planning and creativity management techniques.
Step 3 - Categorize according to source o f supply chain uncertainty and originator
Once the sources of uncertainty have been identified and profiled, Ward and Chapman
(2003) argued that it is useful to explore, understand and categorize the origins of project
uncertainty before seeking to manage it. As described in the literature review and
125

[Chapter 5 - Identifying and Categorizing Sources of Supply Chain Uncertainty]
methodology chapters, the uncertainty circle can be used to classify uncertainties in the
supply chain, which includes demand, supply, process and control sources of uncertainty
(Childerhouse and Towill, 2004; Mason-Jones and Towill, 1998; Sanchez-Rodrigues et al.,
2008).
Step 4 - Establish model o f interactions fo r uncertainties
The importance of establishing cause and effect was highlighted in the literature review
(Aguayo, 1991; Bicheno, 2006; Sterman, 1989). This logic was applied to the method for
identifying and categorising uncertainty. Identifying the interactions between uncertainties
will enable project managers and supply chain managers to understand the root cause of the
uncertainties that they face. In this chapter, cause and effect techniques are modified to
show the interactions between uncertainties using the uncertainty circle as a framework.
Step 5 - Use a positioning matrix to establish the relative importance
Early research highlighted the importance of establishing probabilities and cost and time
scenarios for different risks (Chapman, 1979). Williams (1996) suggested that two key
dimensions of risk are likelihood, which is the probability of an undesirable occurrence, and
impact, which is the seriousness and scale on other activities. Cost and time are key
elements of the impact (The Institution of Civil Engineers, 1998). The multiplication of
likelihood by impact pervades the risk management literature (Baccarini and Archer, 2001;
Williams, 1996), and facilitates the development of a ranked list. An important associated
technique is the Likelihood-Impact Matrix, where the probability and impacts of each
uncertainty are assessed against defined scales, and plotted on a two-dimensional grid. The
position on the matrix offers an indication of the relative significance of the risk (Hillson,
2002).
5.2 INDIVIDUAL PROJECT PROFILES
The section offers an overview of each of the projects in the two systems. An individual
uncertainty profile has been developed for each project, which are presented in the rest of
this section.
126

[Chapter 5 - Identifying and Categorizing Sources of Supply Chain Uncertainty]
5.2.1 Projects in engineer-to-order system 1
Project 1
This project consisted of the design and build of 32 units comprising 24 flats and 8
affordable dwellings. The 3 storey scheme included commercial units on the ground floor
and a basement car park. Space on the site was very limited, as the footprint of the building
covered the entire site. Therefore, careful planning was required to make sure that access to
the site was kept clear at all times. The site is based in London. Much of the frame of the
building was made up from pre-cast concrete, which required large volumes of pre-cast
concrete deliveries. The contract type was a ‘design and build’ contract. The supplier
pipelines in the system that are involved in this project are the elevator pipeline (case A),
windows (case B), pre-cast concrete (case C), a metalwork subcontractor (case E), and a
brick and block supplier (case F). The project was completed in August 2007. The main
uncertainties for project 1 are shown in table 5.2.
_______. ___________Uncertainties for Project 1 ■Cost uncertainty. Meeting the cost constraints of a low budget project was, a consistentchallenge throughout the project._________________________________________________Permissions and project milestones. Getting permissions from local council for services took a long time and was time consuming. This put pressure on meeting projectmilestones.____________________________________________________________________Resource and workflow. Synchronising resource requirements with the workflow. In particular, matching labour resources to timber frame erection and deliveries waschallenging (delivered at 4 hour intervals)._________________________________________Access. Securing access for regular deliveries of timber frame in a city centre location wasdifficult.______________________________________________________________________Capacity o f subcontractors. Towards the end of the project the main contractor was offered some extra work extending the original project. Some of the suppliers and subcontractors could respond to these requirements, others did not have the capacity totake on extra work._____________________________________________________________Equipment. Uncertainty over availability of equipment, such as urban articulated trailersand tower cranes.______________________________________________________________Information exchange and decision piaking. Slow information exchange, between client,designers and suppliers made decision making difficult.______________________________Design approvals and project milestones. Long lead-times for feedback on designs putpressure on the project plan._____________________________________________________Late changes in specification. The client awarded the main contractor an extension phase, adding to the original project. Information for the new phase was very late and difficult toaccommodate._________________________________________________________________Labour. Difficult to get flexible labour to match upswings and downswings in workflow.
Table 5.2 Uncertainties experienced in project 1
127

[Chapter 5 - Identifying and Categorizing Sources of Supply Chain Uncertainty]
Project 2
Project 2 was a development of 37 flats for a social housing developer in Greater London.
The building was designed using a timber frame system construction. The contract type for
this project was also a ‘design and build’. Cost was a key driver for this project with a small
project value of £3.2 million, and the site was adjacent to 2 schools, making it important to
liaise with the local community throughout the build. The supplier pipelines investigated in
this project were windows (case B) and timber frame systems (case G). The project was
completed in January 2007. The main uncertainties for project 2 are shown in table 5.3.
__________________ Uncertainties for Project 2___________________Access and impact on community. Maintaining access for local businesses, and deliveries made to these businesses, situated within and behind the site was challenging throughout the project. This created further uncertainty for relating to access points and work areamanagement on site.____________________________________________________________Storage space and deliveries. Tight storage space constraints led to the need for small, frequent and timely deliveries. Suppliers were not always able to meet these requirements. Permissions. Lack of information from planners regarding permissions led to problemssetting up services for the site. As a result, work started on site with no services._________Access, workflow and community impact. Large volumes of pre-cast concrete had to be delivered into a busy London location. Due to access constraints these deliveries wouldoften lead to the blocking o f traffic routes, causing traffic and workflow problems._______Equipment. Uncertainty over availability of desired equipment._______________________Accuracy o f project plan. Timings and resource requirements for the critical chain (mostlyrelated to pre-cast concrete deliveries) had to be revised frequently.____________________Geology. Abnormal features o f site were encountered, which could not have been foreseen. Underground infrastructure, such as sewage and pipelines, caused early delays inthe project.____________________________________________________________________Information exchange. Co-ordinating timely and correct information from clients andconsultants._______________ ____________________________________________________Shared objectives. The project combines private and public housing. Mixing public andprivate interests can lead to conflicting priorities.___________________________________Weather. Excessive rain during the summer led to unexpected delays__________________
Table 5.3: Uncertainties experienced in project 2
Project 3
Project three was a regeneration project and is for a consortium of clients. The scheme
included refurbishment of 325 houses with new external works, playgrounds, footpaths and
landscaping. In addition, the scheme included 442 new homes, three commercial units and
128

[Chapter 5 - Identifying and Categorizing Sources of Supply Chain Uncertainty]
a community building, with accommodation for a library and a housing office managed
across ten separate sites. The overall contract value was around £66m, with refurbishment
works due to be completed in 36 months and the new build development site in 60 months.
This project was managed on a private finance initiative basis, where public and private
organisations worked together to deliver the project. This involves private sector provision
of capital asset and services with the public sector acting as the main purchaser or enabler of
the project. This project included a consortium of developers and housing associations. The
supplier pipelines investigated in this project were timber frame systems (case G), doors
(case H) and timber (case I). The project was due to be completed in March 2012. The main
uncertainties for project 3 are shown in table 5.4.
' Uncertainties for Project 3____________________ _Scheme viability. Finding the appropriate balance between regeneration, new build, flatsand houses.____________________________________________________________________Late changes to specification. A late decision regarding whether or not the existingcommercial centre be moved out or not led to a lot of changes to the original plans._______Shared objectives. Maintaining good relationships, and building a common understanding,between private and public organisations._________________________________ _________Fragmented decision making. Nobody made decisions about tolerances in the originaldesigns._______________________________________________________________________Rigid design. Not enough tolerance was built into the design to allow for variability in theconstruction process.________________________________________________________ 'Supplier bankruptcy. Uncertainty over subcontractors and suppliers going out o f business.This became more acute as the ‘credit crunch’ recession of 2008/2009 unfolded. _____Deliveries. Suppliers and transport companies faced uncertainty over which phase o f the site to deliver to. Deliveries were frequently made to the wrong site/phase of the project. Weather and Impact on local community. Bad weather, and movement between multiplesites, made it difficult to keep roads and sites clear from mud.___________________ _Impact on local community. The impact of multiple sites in a residential area causedtraffic management problems, especially near schools.________________________________Security. Security issues were prevalent across multiple sites and phases.___________ __
Table 5.4: Uncertainties experienced in project 3
5.2.2 Projects in engineer-to-order system 2
Project 4
Project four was a twenty storey commercial tower in the City of London creating 586,000
square feet of office space. The building was designed for professional and financial
services occupiers and provides two trading floors at the lower level, with a variety o f floor
129

[Chapter 5 - Identifying and Categorizing Sources of Supply Chain Uncertainty]
plates above. The scheme also included over 50,000 square feet of planted roof terraces.
The project was delivered on a construction management contract by the network co
ordinator in system 2. The project was delivered over approximately 3 years for a private
client. A key design feature was a three tier glass fa9ade. The core of the building was
constructed using the slipform method, where the formwork and attached working platforms
are slowly moved up using hydraulic jacks so that the system slides up continuously
throughout the day. The supplier pipelines investigated in this project were those of a paint
subcontractor (case J), modular bathroom supplier (case K) and a dry-lining subcontractor
(case L). Construction of the project was completed in May 2009. The main uncertainties
for project 4 are shown in table 5.5.
' ■ Uncertainties for Project 4 _________Scheme viability and Market conditions. Uncertainty over the extent to which demand foroffice space will remain strong during the recession._________________________________Access and Deliveries. Getting frequent deliveries of materials into the City of London,which is located in a congestion charge zone._______________________________________Project team and Shared objectives. Managing and co-ordinating the large numbers oforganisations required for such a complex project.__________ ____________ ___________Permissions and Workflow. Local authority and planning permissions dictated that the slip-form operations could not work continuously and had to finish by 6pm due to noiseregulations. This constrained the effectiveness of shift working in the project.____________Supplier failure/ bankruptcy. Uncertainty over subcontractors and suppliers going out of business. This became more acute as the ‘credit crunch’ recession of 2008/2009 unfolded. Access. Very difficult to get the volume of deliveries required for the site into the limitedaccess point. It was also difficult to manage the queues of lorries around the site._________Cost. The network co-ordinator is responsible for meeting a fixed price contract for theclient.________________________________________________________________________Meeting project milestones. Noise regulation thresholds constrained overtime hours,meaning that any delays were difficult to make up.__________________________________Safety. Scope of project and height of structure called for rigorous safety procedures.______Sourcing. Uncertainty over sourcing and delivery of specialist materials and buildingelements______________________________________________________________________
Table 5.5: Uncertainties experienced in project 4
Project 5
Project five was a six storey office block in an exclusive part of central London creating
100,000 square feet of office space. As with project one, the construction method relied on
pre-cast concrete for the frame of the building. The scheme included six floors and a
basement. The finish of the building is of a very high standard with a Portland stone and
130

[Chapter 5 - Identifying and Categorizing Sources of Supply Chain Uncertainty]
Indian granite fa9ade and award winning artistic sculptures adorning the building. The
design also included a large atrium structure at the centre of the building. Strict grading
regulations applied to the building, which had to conform to the historic surroundings. The
project was a construction management contract to be delivered over approximately 2 years
for a private client. The supplier pipelines investigated in this project were those of a paint
subcontractor (case J), modular bathroom manufacturer (case K) and a dry-lining
subcontractor (case L). The main uncertainties for project 5 are shown in table 5.6.
_______________ Uncertainties for Project_5______________________ _Quality. Meeting high quality and specification requirements for the client was a challengethroughout the project. __________________________________________________ _Late changes to specification. Due the high quality specification of the project, the client was very particular about the detail in the design process and introduced a number ofchanges during the build._____________________________________________________ _New technology or technique. The scheme involved innovative design features (e.g. the use of artistic sculptures and architectural art throughout the building) which required newapproaches to be developed. _________________________________________________Permissions. Heritage and grading organisations had to be consulted at each step of thedesign process to ensure that the project conformed to their requirements. ___________Effectiveness o f contractual arrangements. The client wished to change contractual termsafter the project had started._______________________________________________Access. Access points to the site were very restricted, especially for larger vehicles.Work areas and storage space. Storage areas and working areas were very restricted. A number of ‘workshop areas’ had to be set up to manage the flow of materials and toperform various works._________________________________________________________Scheme viability and Market conditions. Uncertainty over the extent to which demand foroffice space will remain strong during the recession.______________________________ _Sourcing and Deliveries. Uncertainty over sourcing and delivery of specialist materialsand building elements.________________________________________________________ _Cost and Meeting project milestones. The network co-ordinator is responsible for meetinga fixed price contract for the client._______________________________________________
Table 5.6: Uncertainties experienced in project 5
5.3 SYSTEM UNCERTAINTIES
5.3.1 Uncertainties in system 1
Table 4.7 shows the uncertainties that are experienced across the 3 projects in system 1. It
highlights the uncertainties that apply to individual projects and those that were experienced
131

[Chapter 5 - Identifying and Categorizing Sources of Supply Chain Uncertainty]
across projects. Projects 1 and 2 shared uncertainties relating to permissions, volatility of
workflow, access issues, equipment and information exchange. Projects 2 and 3 shared
uncertainties relating to deliveries, impact on the community, shared objectives and the
weather. Projects 1 and 3 both experienced uncertainties relating to late changes in
specification and fragmented decision making.
System 1
Project 1 Project 2 Project 3
CostDesign approvals
LabourMeeting project milestonesCapacity of subcontractors
ResourceStorage space
Accuracy of project planGeology
Scheme viabilityRigid design
SecuritySupplier bankruptcy
Fragmented Decision MakingFragmented decision
making
Late changes in specificationLate changes in
specificationDeliveries
Impact on communityShared objectives
WeatherPermissions
_______________________Workflow_______________________________________________ Access_________ _ _ _____________________Equipment________________________________Information exchange_________________________________________Table 5.7: Uncertainties in system 1
5.3.2 Uncertainties in System 2
Table 5.8 presents the uncertainties that were experienced across the 2 projects in system 2.
It also shows the uncertainties that applied to individual projects and those that were
132

[Chapter 5 — Identifying and Categorizing Sources of Supply Chain Uncertainty]
experienced across projects 4 and 5. Projects 4 and 5 both experienced uncertainty relating
to access, sourcing, deliveries, scheme viability, market conditions, cost, meeting project
milestones and permissions.
System 2
P ro jec t 4 Project 5
SafetySupplier failure/ bankruptcy
Project teamShared objectives
Workflow
•Quality
Late changes to specificationNew technology or technique
Effectiveness of contractual arrangementsWork areas and storage space
AccessSourcing
DeliveriesScheme viability
Market conditionsCost
Meeting project milestonesPermissions
Table 5.8: U ncertainties in system 2
5.3.3 Similarities and differences between the two systems
The previous 2 sections have shown that there are uncertainties that are unique to individual
projects and those that are shared between projects. A summary of these similarities and
differences is shown in table 5.9. This section shows the uncertainties that are unique to
the different systems and those that are shared across the two systems.
The uncertainties experienced in both systems included supplier failure and bankruptcy,
shared objectives, workflow volatility, late changes to specification, storage pace, access,
deliveries, scheme viability, cost, meeting project milestones and permissions.
Uncertainties experienced in system 1 included design approvals, labour, capacity of
subcontractors, resource, security, rigid design, geology, accuracy of project plan, impact on
133

[Chapter 5 - Identifying and Categorizing Sources of Supply Chain Uncertainty]
community, weather, equipment and information exchange. Uncertainties experienced in
system 2 include safety, project team, quality, new technology or technique, work areas,
sourcing, deliveries and market conditions.
Uncertainties experienced in both systems
Uncertainties in System ! only
Uncertainties in System 2 only
Supplier failure/bankruptcy Design approvals SafetyShared objectives Labour Project team
Workflow Capacity of subcontractors Quality
Late changes to specification ResourceNew technology or
techniqueStorage space Security Work areas
Access Rigid design SourcingDeliveries Geology Deliveries
Scheme viability Accuracy of project plan Market conditionsCost Impact on community
Meeting project milestones WeatherPermissions Equipment
Information exchangeTable 5.9: Differences and similarities between system uncertainties
5.4 CATEGORISING SUPPLY CHAIN UNCERTAINTY
Figure 5.4 provides a summary of the sources of supply chain uncertainty. The uncertainties
have been categorized according to the different sources of supply chain uncertainty:
control, demand, process, and supply. The figure shows 39 uncertainties with 9 control
uncertainties, 7 demand, 16 process and 7 supply uncertainties. A further 3 external
uncertainties were identified as beyond the boundaries of the system. These external
uncertainties were identified as market conditions, unforeseen geology or site conditions
and the weather. Forty two uncertainties were identified in total. The largest source of
supply chain uncertainty was process uncertainty, which accounts for 16 of the 42
uncertainties.
134

Figure 5.4: The
sources of uncertainty
in ETO
construction supply
chains
Supply1. Bad performance from suppliers2. Capacity of subcontractors3. Consistency of suppliers4. R esponsiveness of suppliers5. Early or late deliveries6. Subcontractor bankruptcy7. Timely & correct information from suppliers
Demand1. Late ch anges in specification2. Drawing approvals3. New technology or technique4. Effective design5. Schem e viability long term6. Design too rigid7. Client non paym ent
Control1. Achieving project milestones2. Fragmented decision making3. Timely & correct information from consultants4. Effectiveness of contract arrangem ents5. Perm issions from regulators6. Shared objectives7 .T hingsnotaccountedforin planning8. Competency of projectteam9. Timely & correct information from clients
1. Desired equipm ent 9. Deliveries unable to unavailable a c c e ss site2. Quality Problems 1 S peed of construction3. Labour resources 11 ■ Volatility of workflow4. Site im pacton local 12- Accuracy of project
plan13. Delivery bottlenecks14. Amount of storage sp ace15. Amount of w orkspace available16. Final cost
community5. Security6. Site m anagem ent competency7. Safety hazards8. D am ages
Process
[Chapter 5
- Identifying
and Categorizing
Sources of Supply
Chain U
ncertainty]

[Chapter 5 - Identifying and Categorizing Sources of Supply Chain Uncertainty]
The categorisation of uncertainties in figure 5.4 also highlights the interconnectivity
between different sources o f uncertainty. Demand, process, supply and control uncertainties
were intimately related. For example, a network co-ordinator may contribute to early or late
deliveries by not passing on required information to suppliers or ordering materials early
enough. Demand uncertainty, such as client non payment may filter down the supply chain
and result in a supplier bankruptcy.
It shows that control uncertainties relate primarily to information exchange, team working
structures and project management. Demand uncertainty is exacerbated by unique
requirements for individual projects and a fragmented design process, where external design
consultants such as architects and structural engineers liaise with clients, main contractors
and suppliers to reach a decision of final specifications. Major demand uncertainties also
refer to the extent to which the scheme will be viable long term.
Process uncertainty refers primarily to those uncertainties experienced during on site, such
as equipment failure or the volatility o f workflow. Supply uncertainties result from poorly
performing suppliers. This may take the form of early or late deliveries, inconsistent lead
times or supplier financial failure. Suppliers and subcontractors are the main originators of
these uncertainties, but the network coordinator may also contribute to some of these
uncertainties. External uncertainties are those that originate outside of the ETO system.
These may take the form of inclement weather conditions that delay site progress or
unforeseen geology or underground characteristics, such as underground sewage works or
archaeological finds.
A full listing of the generic uncertainty profile for all projects is shown in Table 5.10. It
shows the generic uncertainty, the source of supply chain uncertainty, and the originator of
the uncertainty. The originators were identified as clients, designers/architects, network co
ordinators, suppliers and regulators. Some of the uncertainties have multiple originators.
The external uncertainties also have uncertainties that originate outside of the system.
136

[Chapter 5 - Identifying and Categorizing Sources of Supply Chain Uncertainty]
U ncertainty Supply C hain U ncertainty
Type
Clie
nt
Arc
hite
ct
Net
wor
kC
oord
inat
or
Supp
lier
Reg
ulat
or
Timely/correct information from clients Control XTimely/correct information from consultants Control X
Fragmented decision making Control X X X X XPermissions from regulators Control X
Effectiveness o f contractual arrangements Control X X
Shared objectives Control X XCompetency o f project team Control X XAchieving project m ilestones Control X
Things not accounted for in planning Control X X XClient non payment Demand X
Appropriate or effective design for scheme Demand X XLate changes in specification Demand X X
Drawing approvals Demand X XN ew technology or technique Demand X X X X X
Scheme viability long term Demand XDesign too rigid to accom modate change Demand X
Economic market conditions ExternalWeather External >
Geology/site characteristics ExternalCost Process X X X X X
Desired equipment unavailable Process X XAccuracy o f project plan Process X
Quality/Excessive snagging Process X XLabour resources Process X X
Competency o f site management Process XDeliveries unable to access site Process X
Delivery bottlenecks Process XAmount o f storage space available Process X
Amount o f work space available Process XSite impact on local community Process X X X X X
Speed o f construction Process XVolatility o f workflow Process X
Safety hazards Process XSecurity Process X
Damages Process XTimely and correct information from suppliers Supply X
Early or late deliveries Supply X XSubcontractor bankruptcy Supply X
Bad performance from suppliers Supply X XCapacity o f subcontractors Supply X
Consistency o f suppliers SupplyResponsiveness o f suppliers Supply X
Table 5.10: G eneric uncertain ty profile
137

[Chapter 5 — Identifying and Categorizing Sources of Supply Chain Uncertainty]
Table 5.11 provides a summary of the uncertainty profile. The uncertainties have been
categorized according to the different sources of supply chain uncertainty: control, demand,
process supply and external. It also shows a summary of the originators of these
uncertainties. The summary table shows that the largest source of supply chain uncertainty
is process uncertainty, which accounts for 16 of the 42 uncertainties. 23 of the 41
uncertainties were also identified as having the network co-ordinator as the sole or joint
originator of the uncertainty. Regulators were the originators of the least uncertainties and
were the sole or joint originator of 5 uncertainties.
SupplyChain
Uncertainty
Number of Uncertainties
Identified
Client Architect NetworkCoordinator
Supplier Regulator
Control 9 6 3 6 1 2Demand 7 6 5 1 1 1Process 16 2 2 16 5 2Supply 7 0 0 2 7 0
External 3 0 0 0 0 0Total 42 14 10 23 14 5
Table 4.11: Summary of supply chain uncertainties and their originators
As can be seen from table 5.11, the client and main contractor are the most frequent
originators of control uncertainties. Demand uncertainty is exacerbated by the unique
requirements for each individual project, and, also by a fragmented design process, where
external design consultants such as architects and structural engineers liaise with clients,
main contractors and suppliers to reach a decision of final specifications. Major demand
uncertainties also refer to the extent to which the scheme will be viable long term. Table
5.11 shows that the client and the architect are the major originators of these demand
uncertainties.
Process uncertainty refers primarily to those uncertainties experienced during site
construction phase, such as equipment failure or the volatility of workflow. Table 5.11
highlights that the network co-ordinator contributes most to these uncertainties. Supply
uncertainties result from poorly performing suppliers. This may take the form of early or
late deliveries, inconsistent lead times or supplier financial failure. Suppliers and
subcontractors are the m ain originators of these uncertainties, but the network coordinator
138

[Chapter 5 - Identifying and Categorizing Sources of Supply Chain Uncertainty]
may also contribute to some of these uncertainties. For example, a network co-ordinator
may contribute to early or late deliveries by not passing on required information, or by not
ordering materials early enough. External uncertainties are those that originate outside of
the ETO system. These may take the form of inclement weather conditions that delay site
progress, or unforeseen geology, or underground characteristics such as underground
sewage works or archaeological finds.
5.5 MODELLING THE INTERACTIONS BETWEEN UNCERTAINTIES
A cause and effect diagram, based on the sources of supply chain uncertainty, is shown in
figure 5.5. This investigates the causes and interactions between some of the uncertainties
developed in the profile. The uncertainty circle shows that site processes, and their
interaction with the supply and demand side, are directed by the control system. The supply
chain uncertainty circle captures the interrelationships between different uncertainties and
between different parts of the supply chain. The network coordinator responds to the
immediate customer, which in this case is the client, with a design process facilitated by
design consultants. Required materials, equipment and labour are replenished by various
subcontractors and suppliers from the supply side. The potential outputs of these
uncertainties are time overruns, cost overruns, quality defects, a poor safety record and a
building ‘unfit for purpose’.
The causes identified for each uncertainty source are discussed below. Relevant literature is
referred to for the different causes in order to highlight the link with different bodies of
knowledge and further explain the different causes.
139

[Chapter 5 - Identifying and Categorizing Sources of Supply Chain Uncertainty]
oa V** Mi*.EQ> C (D
CO
C0JS>
t? . ft
cl r»£O£
4-> co£ to o
O )fc g
% c
8 f t 2 j e00- J
u> U
co .£ a> j* u £ «? c © c 3 c
E f tSO) 0̂o u
x > O ) c/><J> c w<8 13ft 52 <» 9 ® °•g tJ x>(JO C £23 «3
0>c § ? 1 22
S 00 a> oo
X CO
S ' -«E € sO w Su COf t <X> TO©CL E
t t ia> jsi s i& CO IE ~ iC l CO f — >. I» fc!
jQ <0« * ■- >*<*> 00 "K
ft 3 e CLeu H 5 3-js ffl® c c o O£ O 2 O
° < CL
Q. C&O Util 3 j
W * CL j
& g><0 CO a> coo ffl
Figure 5.5: Cause and effect d iagram for engineer-to-order construction uncertainties
140

[Chapter 5 - Identifying and Categorizing Sources of Supply Chain Uncertainty]
The causes of control uncertainties result in, among other negative impacts, poor project
team working for the project coalition and an unclear ownership of risk. Control
uncertainties in the ETO systems are caused by the following:
• Ineffective contractual arrangements. Many authors have argued that contractual
arrangements are a critical success factor for projects (Chua et al., 1999; Sanvido et
al., 1992). The literature in this area refers to the importance of getting the right
contract type, the allocation and management of risk, setting realistic and clear
objectives (Gordon, 1994), as well as the provision of a formal resolution process to
resolve disputes (Diekmann and Girard, 1995).
• Poor supply chain management. The consequences of poor supply chain
management have been widely addressed in the supply chain management
literature, across a range of sectors and industries (Christopher, 2005). In the
construction industry there are specific studies and government reports exploring
the dangers o f poor supply chain management and arguing for change (Dainty et al.,
2001a; Egan, 1998; Latham, 1994; Vrijhoef and Koskela, 2000).
• Poor planning and project management. Zwikael and Globerson (2006) found that
an effective project plan was the most frequently quoted success factor in the
literature they reviewed. Successful project management has been defined in terms
of the successful accomplishment of time, quality, resource and cost objectives o f a
project (Baccarini, 1999).
A combination of process uncertainty causes on site can result in an inability to complete an
activity effectively. The root causes are:
• Inadequate resources. This refers to the lack of availability of labour, equipment, or
materials to complete an activity.
• Poor site logistics. I f suppliers and subcontractors are unable to access the site at the
right time then the ability to complete a task may be affected. Poor work area
management could also lead to delays if the work area is not free and accessible
when work is scheduled to start. Agapiou et al. (1998a) propose that major
productivity gains are possible by improving site logistics and material flow. They
find that improvements in logistics processes reduce costs by 5%.
141

[Chapter 5 - Identifying and Categorizing Sources of Supply Chain Uncertainty]
• Poor site management. Poor procedures, such as poor security protocols, poor health
and safety and poor community engagement processes, will increase the risk of
accidents and break-ins and have a negative impact on the local community. This is
consistent with Chan and Kumaraswamy (1997) who found that one of the five
principal causes of project delays is ineffective site management and supervision.
The causes of supply uncertainty result in either an untimely delivery or, possibly, a new
supplier being required. The causes are:
• Supplier financial failure. Supplier financial problems may range from ‘chains of
credit’ from further up the supply chain (from the demand side) or from failures
further down the down the supply chain (from a supplier’s supplier). These
problems agree with the findings in chapter 6. The results could range from late
deliveries to a complete inability to supply. The recession at the time of writing has
made this seem more likely. On one of the projects visited during this study a facade
supplier went into administration.
• Inadequate supplier capabilities. Suppliers’ capacities and capabilities are identified
as a root cause of supply uncertainty. Naim and Barlow (2002) recognized the
‘inability to rapidly reconfigure’ as a hot spot in their analysis of house-building
supply chains. Subcontractors were selected by headquarters, but are called on as
and when required by the site without medium term planning horizons.
Subcontractors and suppliers therefore commit themselves to a number of different
sites without actually having the capabilities or capacity to do so.
• Poor visibility o f site progress. Suppliers are often unable to gain up to date
information on site progress and cannot, therefore, attain visibility of delays or early
requirements for deliveries. This problem is also highlighted in chapter 6 of this
thesis. The importance of transparency and visibility of progress on project sites has
been discussed by Formoso et al. (2002).
• Orders not p laced in time. This concurs with Naim and Barlow (2003), who
highlighted the lack of market knowledge in making purchasing decisions as a ‘hot
spot’. Time scales for buying and calling off materials are often not properly
established and suppliers have little visibility of long term requirements.
142
[Chapter 5 - Identifying and Categorizing Sources of Supply Chain Uncertainty]
• Late changes to orders. Late changes originating from the demand side can cause
problems for the supply side. In the study conducted by Chan and Kumaraswamy
(1997) another of the five principal causes of project delays is client initiated
variations. -
Demand uncertainties can lead to programme delays, late changes in specification and an
unviable scheme. The sources of these are:
• Inadequate or inappropriate designs. The most severe outcome of this uncertainty is
that the scheme is no longer deemed viable and must be terminated. A less severe
outcome is that there are late changes in project specification as the project
progresses. An in depth study of the effect on a system of changes to orders is
provided by Williams and Eden (1995). Their systems dynamics analysis suggests
that design changes can add 22% to project cost.
• Delays approving designs. The problems associated with design approval have been
well documented in the literature (Barker et al., 2004; Williams and Eden, 1995).
Barker et al. (2004) found that information exchange at the design stage was one of
the major concerns in programme development.
• Financial problems. Dainty et al. (2001a) suggested that even legislation within the
1998 Construction Act had failed to ensure on time payments to subcontractors or to
prevent companies from withholding retention payments at the end of contracts.
Such practices lead to cash flow difficulties throughout the supply chain.
• M arket Changes. At the current time of writing market changes have had a huge
impact on market demand across a range of sectors, making tenants and buyers for
buildings difficult to find and significantly reducing the number of commercial
projects being initiated in the marketplace.
5.5 USING A POSITIONING MATRIX TO EVALUATING PROJECT
UN CERT ANTIES
This section investigates the relative importance of different uncertainties. It establishes the
likelihood o f different uncertainties developing into a negative outcome and the potential
impact in terms o f cost and time penalties. These two dimensions, which are well
143

[Chapter 5 - Identifying and Categorizing Sources of Supply Chain Uncertainty]
documented in the risk management literature (Patterson and Neailey, 2002; Wiliams,
1994), are used here to indicate the relative importance o f the different uncertainties. As
previously described, a brainstorming activity was conducted and uncertainties identified in
table 5.11 were plotted on a graph with the axes ‘impact’ and ‘likelihood’. Gridlines were
then placed on the graph to enable numerical values to be allocated to uncertainties. The
positioning matrix is shown in figure 5.6.
As can be seen by the clustering in the positioning matrix, control uncertainties have the
highest importance rating with an average per uncertainty of 6.5. Demand uncertainties
average 5.2 per uncertainty, with supply uncertainties averaging 3.4. Process uncertainties
average 3.1, with external uncertainties averaging 2.1.
5.6 DISCUSSION AND STATEMENT OF CONTRIBUTION
This chapter is valuable for a number of reasons. Firstly, it offers important insights into the
identification and profiling o f uncertainties. As noted by Patterson and Neailey (2002),
while various authors discuss risk and uncertainty profiles in their work, very little has been
written about their development and construction. In doing this, the chapter provides a
range of uncertainties identified from primary data. Secondly, these uncertainties have been
categorized by the application of a supply chain management framework, the uncertainty
circle, to project uncertainties, which has not been undertaken previously. This is important,
as it extends the notion of project uncertainty to include supply chain management, and
refines a model that has previously been applied only in MTS sectors. The modelling of
interactions between uncertainties is also an important and novel contribution to the overall
method. Finally, the positioning matrix, which is classified according to the sources of
supply chain uncertainty, provides a useful tool for analyzing the relative importance of
uncertainty and observing the clusters from different sources o f uncertainty.
144

Figure 5.6: Positioning
matrix
to show
relative im
portance of different uncertainties
3.5
IPb^ 0 c O 2.5O
(0 2a£
1.5
0.5
♦ Selle m e VtabtMy♦ E c o n o m i c Market C
♦ S upp lie r Ba
♦ G e o
Availability of
♦C
a C om p Man
m en t♦ C o n s is t e n c y o f S upp ln irs
♦ R e s p o n s i v e n e s s
♦S ite A c c e s s
eliveryB o t t le n e c k s
e tency of Site a g e m e n t
ond i t io n snkruptcy
Bari P p jf n r r t i a r i£ & i io m S
♦ S p e e c
zq u ip m e n t ^ Q ua li ty /Snagg ing
of C ons truc t o ?♦ Volatility of W orkflow
♦ Effective
♦ C o m p e te n c y o f Projedt T ea m
o f S u p p lie rs
Info f r o m S ^ p t ^ 10' 3 9 6 SpaC4 W ork S p a c e♦ L abour
♦ New ti ♦ D e s ig n to o Rigidt e c h n o lo g y / r e c h n i^ e L aleC hanges to
♦ P lann ing S p e c i f ic a t io n
C T a l s * S h a re d O b je c t iv e s
♦ Achieving P ro jec t fv♦ E f f e c t i v e n e s s of
Ttrer/'n
i l e s to n es
Secu r ity
♦ C o s tW e a th e r
♦ D a m a g e s
♦ Timely/Correct info f rom .C lien tsi Deliveries
♦ A c c u ra c y of P ro jec t P lan
D e s ig n A P e rm is s io n frojm R e g u la to rs♦ F ra q m e n ed D e c is io n
Iim ely /C i i r r f idriMinfo
akm gf ro m C o n s u l ta n ts
S a fe ty
Im pac t on Local ♦ C om m unity H a za rd s
^Process♦ C o n t r o l
♦ S u p p l y ♦ D e m a n d ♦ Ex terna l
05 1.5 2 2 5
Likelihood
35
[Chapter 5 -
Identifying and
Categorizing Sources of Supply
Chain U
ncertainty]

[Chapter 5 - Identifying and Categorizing Sources of Supply Chain Uncertainty]
The values and scores reported herein are based on primary data from 5 construction
projects, covering residential and commercial sectors. Consequently, care must be taken in
generalizing the uncertainties identified and scores to the wider construction industry. The
values and scores reported may differ according to the nature of projects or the type of
supply chain being analysed. The areas of the chapter that are mode widely applicable are
those associated with the method of identifying and categorizing uncertainty. The key
contribution of this chapter is, therefore, the development of a five-stage method for
identifying and classifying uncertainty and its application to 5 construction projects. In
doing this a number of important aims are achieved. The uncertainty circle is applied to the
ETO construction sector and a model of interactions for the analysis of uncertainties is
developed.
The importance and contribution of this chapter can be summarised as follows:
The supply chain uncertainty circle has not been applied in ETO Construction industries,
and the interactions between the uncertainties have received little attention. A five-stage
method o f identifying, classifying uncertainty was developed, bringing together a range o f
tools and methods, which was applied to 5 construction projects. The method applies the
uncertainty circle in project environments, and provides a model fo r modelling the
interactions o f uncertainty. This is the firs t time these techniques have been integrated into
a holistic method to identify and categorize supply chain uncertainty, and then applied to a
group o f projects within the ETO construction sector.
5.7 CONCLUSION
In this chapter, the research question ‘How can the sources of project uncertainty in
engineer-to-order construction supply chains be identified and categorised?’ was explicitly
addressed. A five stage method was presented at the start of this chapter including the
following steps: identify uncertainties, create uncertainty profiles, categorize uncertainties
according to supply chain uncertainty source and originator, model interactions between
uncertainties and use positioning matrix to identify severity. The empirical investigation
reported in this chapter demonstrates how the framework may be applied to a group of
146
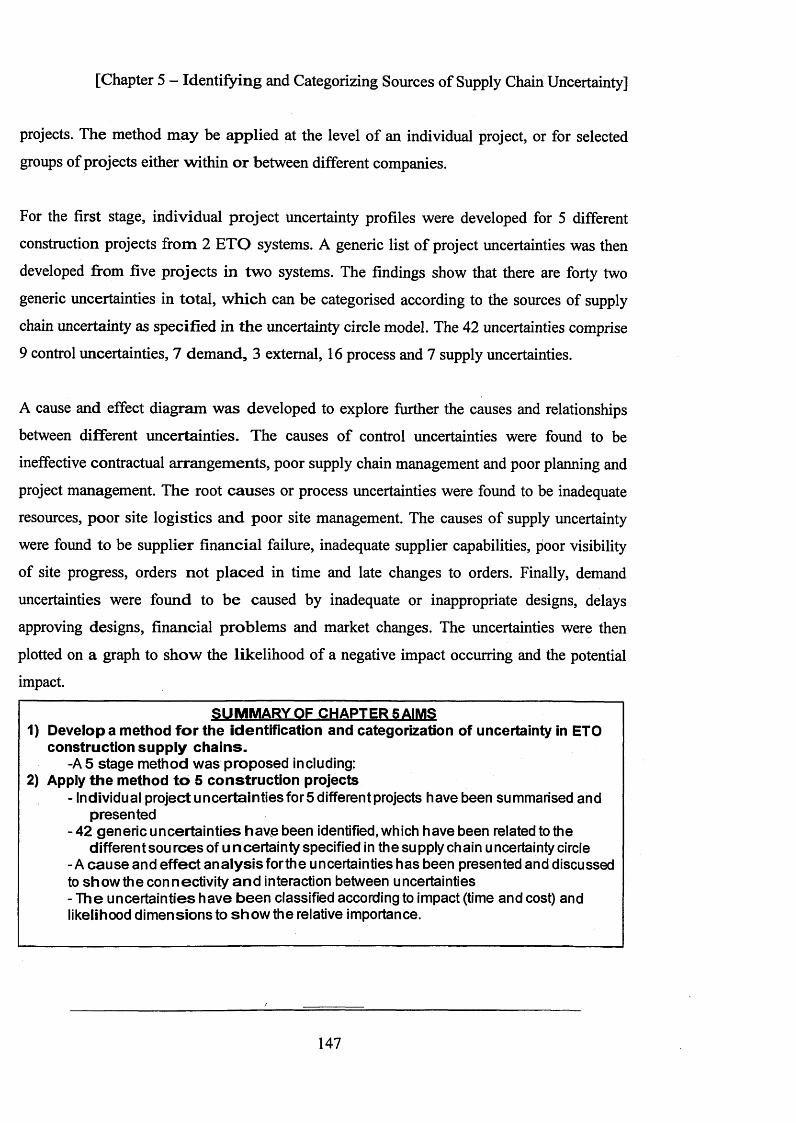
[Chapter 5 - Identifying and Categorizing Sources of Supply Chain Uncertainty]
projects. The method m ay be applied at the level of an individual project, or for selected
groups of projects either within o r between different companies.
For the first stage, individual project uncertainty profiles were developed for 5 different
construction projects from 2 ETO systems. A generic list of project uncertainties was then
developed from five projects in two systems. The findings show that there are forty two
generic uncertainties in total, w hich can be categorised according to the sources of supply
chain uncertainty as specified in the uncertainty circle model. The 42 uncertainties comprise
9 control uncertainties, 7 demand, 3 external, 16 process and 7 supply uncertainties.
A cause and effect diagram was developed to explore further the causes and relationships
between different uncertainties. The causes of control uncertainties were found to be
ineffective contractual arrangem ents, poor supply chain management and poor planning and
project management. The root causes or process uncertainties were found to be inadequate
resources, poor site logistics and poor site management. The causes of supply uncertainty
were found to be supplier financial failure, inadequate supplier capabilities, poor visibility
of site progress, orders not p laced in time and late changes to orders. Finally, demand
uncertainties were found to be caused by inadequate or inappropriate designs, delays
approving designs, financial problems and market changes. The uncertainties were then
plotted on a graph to show the likelihood of a negative impact occurring and the potential
impact.
SUMMARY OF CHAPTER 5 AIMS1) Develop a method for the identification and categorization of uncertainty in ETO
construction supply chains.-A5 stage method w as proposed including:
2) Apply the method to 5 construction projects- Individual project uncertainties for 5 different projects have been summarised and
presented- 42 generic uncertainties have been identified, which have been related to the
different sou rces of uncertainty specified in the supply chain uncertainty circle -A ca u se and effect an a lysis for the uncertainties has been presented and discussed to show the connectivity an d interaction between uncertainties- The uncertainties have b een classified according to impact (time and cost) and likelihood dim ensions to sh o w the relative importance.
147

[Chapter 6 - Pipeline Improvement Strategies for ETO Construction Supply Chains]
CHAPTER 6
PIPELINE IMPROVEMENT STRATEGIES FOR ENGINEER-TO-
ORDER CONSTRUCTION SUPPLY CHAINS
CHAPTER (? AIM?1.Investigate pipeline activities in the ran g e of su p p ly chain s tru c tu re s feeding engineer-to-order su p p ly c h a in s2.Analyse and c o m p a re lead t im es for different p ro d u c ts3.ldentify and a n a ly se p rob lem s in th e pipeline4.ldentify and a n a ly s e s o u r c e s of com petitive a d v a n ta g e in pipelines
RESEARCH QUESTION ADDRESSED RQ3: How can o rg a n is a t io n s im prove pipelines in ETO C onstruc tion su p p ly c h a in s ?
Theoretical Empirical Research Findings
Chapter 2
Chapters 3 and 4
M e th o d o lo g y
Chapter 3: Methodology
Chapter 4: Research Design
RQ1
Chapter 5
Uncertainty in ETO Systems
RQ2
Chapter 6
PipelineImprovement
Strategies
RQ3
Chapter 7
Supply Chain Flexibility
RQ4
Chapter 8
Evaluation Of The Case Research
UnifiedFrameworkPresented
All RQs
Chapter 9
148
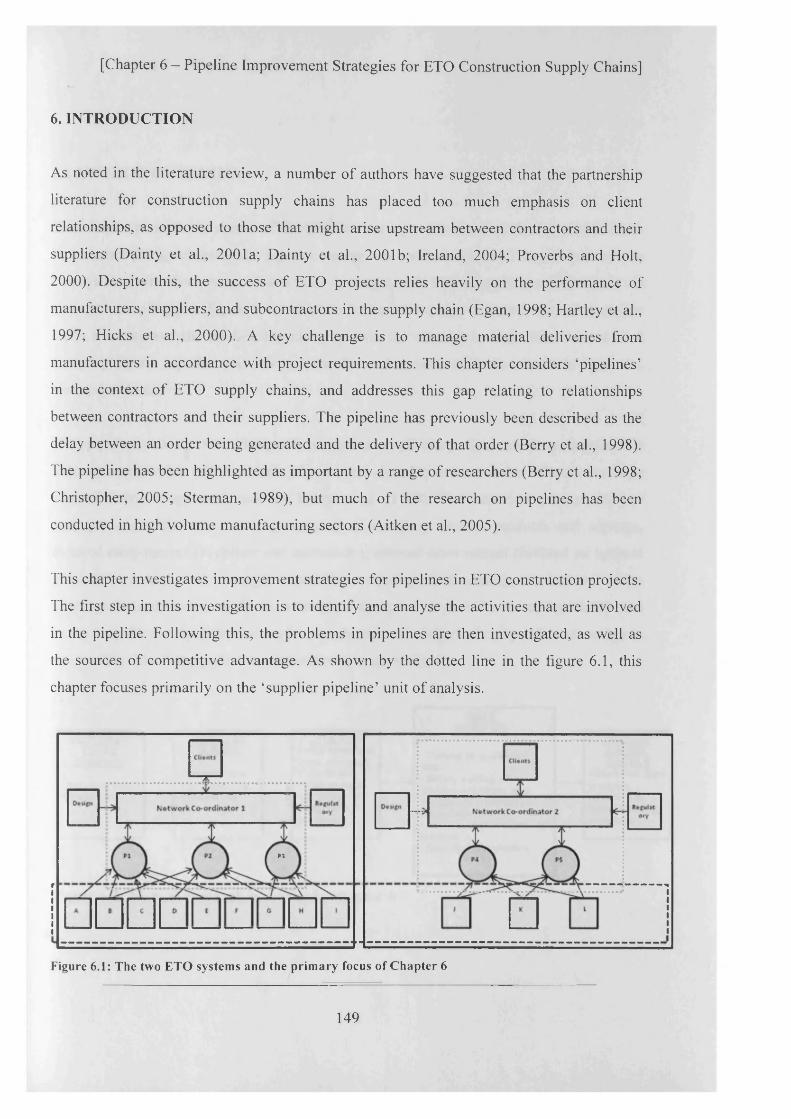
[Chapter 6 - Pipeline Improvement Strategies for ETO Construction Supply Chains]
6. INTRODUCTION
As noted in the literature review, a number of authors have suggested that the partnership
literature for construction supply chains has placed too much emphasis on client
relationships, as opposed to those that might arise upstream between contractors and their
suppliers (Dainty et al., 2001a; Dainty et al., 2001b; Ireland, 2004; Proverbs and Holt,
2000). Despite this, the success of ETO projects relies heavily on the performance of
manufacturers, suppliers, and subcontractors in the supply chain (Egan, 1998; Hartley et al.,
1997; Hicks et al., 2000). A key challenge is to manage material deliveries from
manufacturers in accordance with project requirements. This chapter considers ‘pipelines’
in the context of ETO supply chains, and addresses this gap relating to relationships
between contractors and their suppliers. The pipeline has previously been described as the
delay between an order being generated and the delivery of that order (Berry et al., 1998).
The pipeline has been highlighted as important by a range of researchers (Berry et al., 1998;
Christopher, 2005; Sterman, 1989), but much of the research on pipelines has been
conducted in high volume manufacturing sectors (Aitken et al., 2005).
This chapter investigates improvement strategies for pipelines in ETO construction projects.
The first step in this investigation is to identify and analyse the activities that are involved
in the pipeline. Following this, the problems in pipelines are then investigated, as well as
the sources of competitive advantage. As shown by the dotted line in the figure 6.1, this
chapter focuses primarily on the ‘supplier pipeline’ unit of analysis.
pj
Figure 6.1: The two ETO systems and the primary focus of Chapter 6
149
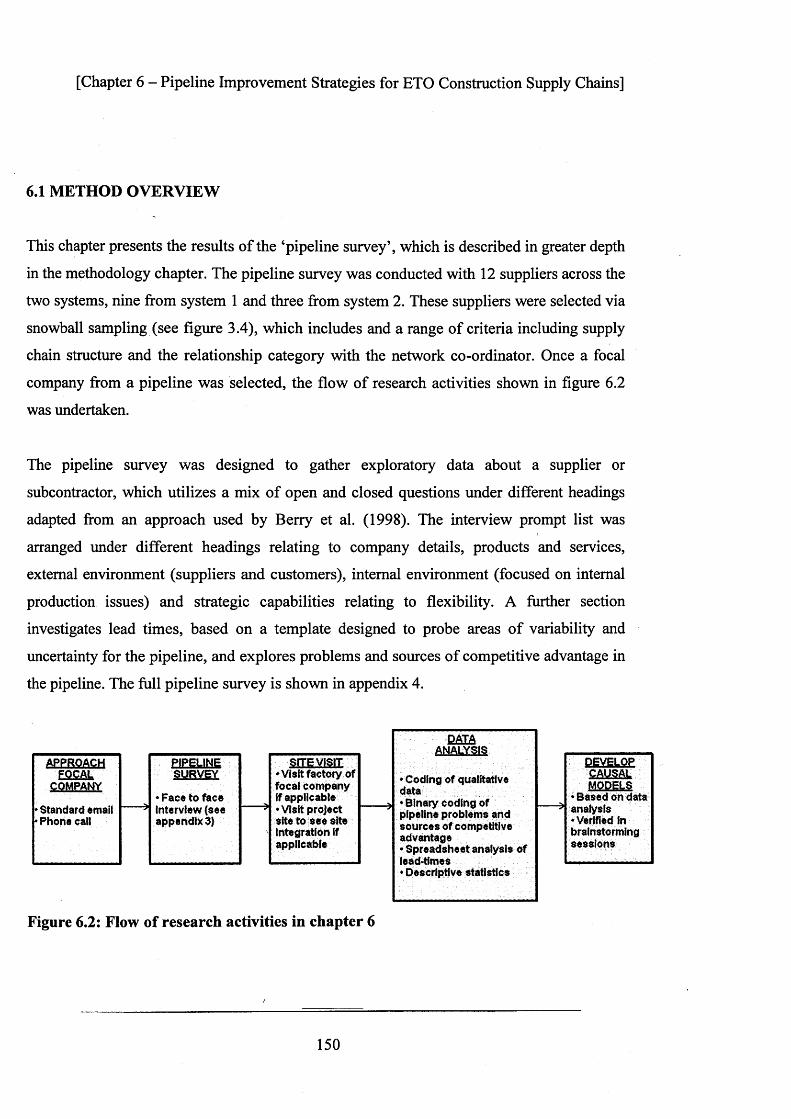
[Chapter 6 - Pipeline Improvement Strategies for ETO Construction Supply Chains]
6.1 METHOD OVERVIEW
This chapter presents the results of the ‘pipeline survey’, which is described in greater depth
in the methodology chapter. The pipeline survey was conducted with 12 suppliers across the
two systems, nine from system 1 and three from system 2. These suppliers were selected via
snowball sampling (see figure 3.4), which includes and a range of criteria including supply
chain structure and the relationship category with the network co-ordinator. Once a focal
company from a pipeline was selected, the flow of research activities shown in figure 6.2
was undertaken.
The pipeline survey was designed to gather exploratory data about a supplier or
subcontractor, which utilizes a mix of open and closed questions under different headings
adapted from an approach used by Berry et al. (1998). The interview prompt list was
arranged under different headings relating to company details, products and services,
external environment (suppliers and customers), internal environment (focused on internal
production issues) and strategic capabilities relating to flexibility. A further section
investigates lead times, based on a template designed to probe areas of variability and
uncertainty for the pipeline, and explores problems and sources of competitive advantage in
the pipeline. The full pipeline survey is shown in appendix 4.
DATAANALYSIS
. APPROACH FOCAL
COMPANY
* Standard email •Phone call
PIPELINESURVEY
♦ Face to face Interview (see appendix 3)
: m&ms,♦Visit factory of focal company If applicable ♦Visit project site to see site integration If applicabie
♦ Coding of qualitative data♦ Binary coding of pipeline problems and sources of competitive advantage♦ Spreadsheet analysis of lead-times♦ Descriptive statistics
CAUSAL MODELS
♦Based on data analysis ♦Verified in brainstorming sessions
Figure 6.2: Flow of research activities in chapter 6
150

[Chapter 6 - Pipeline Improvement Strategies for ETO Construction Supply Chains]
Three-point-time estimates for generic pipeline activities were established, along with the
key problems experienced in the pipeline. Companies were asked to give a “most likely”, an
“optimistic” and a “pessimistic” lead time for the different activities. Companies also were
asked to give a three-point estimate for the overall cycle-time that they quote to customers.
Lead time information that was collected from each supplier was inserted into a spreadsheet
for analysis. In some cases, these interviews were accompanied by factory visits and tours
through the business functions. Lead time estimates were inserted into a spreadsheet to
enable exploration by descriptive statistics. Bar charts and scatterplots are used to
investigate various aspects of the lead time. The pipeline survey was analysed by coding
responses from interviewees. Two areas are focused on the problems that are experienced in
the pipeline and the sources of competitive advantage in the pipeline. A binary coding
technique was used to code responses into theoretically meaningful categories. These
themed responses were then consolidated on a spreadsheet. Input - output process maps
were developed to support data collection and analysis.
The final step in the flow of research activities was to develop causal models for the
problems that are experienced in the pipeline and the sources of competitive advantage in
the pipeline. These were developed using the responses from the pipeline survey, and by
brainstorming these models with industry contacts (for an overview of the brainstorming
sessions see table 5.1).
6.2 OVERVIEW OF TH E PIPELINE
The generic activities in the pipeline can be defined as: an initial enquiry, design and
approval of a product, procurement of the relevant materials, manufacture and assembly,
transport to the site and then final integration of the product with the site. Figure 6.3 shows
these different activities as well as four potential stock holding points. The enquiry stage
refers to the initial interest for an order made by a buying company. This stage will include
exchange of all relevant information for pricing negotiations. The design stage, typically,
includes negotiation of details of the drawings from architects and structural engineers. The
approval stage refers to the final iteration whereby a final sign off from all parties is
151

[Chapter 6 - Pipeline Improvement Strategies for ETO Construction Supply Chains]
obtained. Clients, architects and main contractors will usually participate in the approval
process.
SiteIntegrationDesign &
ApprovalEnquiry Manufacture Transport
RM FGFG
Time
Key
= Stock Holding Point RM - Raw Materials WIP = Work in Progress FG = Finished Goods
Figure 6.3: G eneric p ipeline activ ities and potential stockholding points
After the pricing and designs have been approved, a supplier will begin production
planning. The companies in the pipeline differ in their approach to stockholding. Stock is
held in different forms, with some holding generic stock of material inputs procured through
ordering algorithms, others buy stock only after receiving an order. If a customer order is
not satisfied through generic stock it will have to be procured through the supply chain after
the customer order has been received. Alternatively, if a customer order is satisfied through
generic stock it is likely that regular and consistent deliveries of materials will be procured
irrespective of the timing of particular customer orders, as they are aggregated and
smoothed to enable forecasting. Procurement lead times vary, depending on the complexity
of the product and the extent of sourcing from overseas or by local suppliers.
Once the materials have been procured the manufacture can commence. Elevators and
modular bathrooms have a relatively complex and deep product structure involving
numerous sub-assemblies. Products such as roof trusses and timber have a relatively
shallow product structure. After manufacture, finished goods may be held at either the
supplier or at a 3rd party logistics provider. In the case of A, the lift manufacturer
consolidated orders at a centre in mainland Europe and delivered elevators flat-pack to site.
Many of the companies in this study held stock of finished goods only when changes to the
due date made stockholding compulsory.
152

[Chapter 6 - Pipeline Improvement Strategies for ETO Construction Supply Chains]
The next activity in the pipeline is to transport the finished goods, either straight after
manufacture or from stocks of finished goods, to the site. Companies in the sample used
either in-house transport or outsourced logistics service providers to transport their goods,
sometimes combining both approaches. After delivery of a product, stock may be held on
site until it is required for the project. Much of the metalwork produced in case E could be
stored on site and, consequently, is often stored for up to 2 weeks before being integrated.
Alternatively, pre-cast concrete, supplied in case C, was delivered to site and, due to the
size, transferred directly from the vehicle to the final location on the site and integrated
immediately. Deliveries of pre cast concrete were delivered at set intervals to keep up with
the workflow, allowing site labour to integrate each load into the site as it is delivered.
Some companies used estimates for planning site installation. For example, in case B, the
window supplier used 4 0 - 5 0 windows per week as a basis for installation planning. In one
of the cases, the paint subcontractor often spent up to 9 months on site in larger projects
providing support. A reminder of the details for the 12 supplier pipelines that are analysed
and described in this chapter, and are shown in table 6.1. Whilst this table is already shown
in the methodology chapter, it serves as a useful reminder for the reader.
153

[Chapter 6 - Pipeline Improvement Strategies for ETO Construction Supply Chains]C
ase
Sect
or
Em
ploy
ees
Tur
nove
r
Netw
ork
Co-
or
inda
tor
Proj
ects
Prim
ary
Supp
ly
Chain
St
ruct
ure
Rel
atio
nshi
p wi
th
Net
wor
k C
o-or
dina
tor
AElevators and
Escalators 44000£3.83b
n 1 1 ATOStrategic Partner
B Windows 20-30 £4.5m 1 1 and 2 MTO Preferred
CPre-castConcrete 350 £23 0m 1 1 MTO
Preferred
D Roof Trusses 150 £8m 1 2 MTO Preferred
E Metalwork 10,20 £1.25m 1 1 BTO Approved
F Brickwork 234 £15.7m 1 1 MTS Approved
GTimber Frame
Systems 1400 £420m 1 2 and 3 MTOStrategic Partner
H Doors 205 £22.5m 1 3 BTO Preferred
I BuildersMerchant 10600 £2bn 1 3 MTS
Approved
J Paint 67 £ 1 1.5m 2 4 and 5 MTS Strategic Partner
KModular
Bathrooms 425 £53.8m 2 4 and 5 ATOStrategic Partner
LDrylining/Safet
y systems52-100 £14m 2 4 and 5 BTO
Strategic Partner
Table 6.1: Summary of the supplier pipelines
5.3 ANALYSIS OF THE PIPELINE SURVEY
5.3.1 Supply Chain Structures
Using the attributes of different supply chain structures identified in the literature review
chapter, table 6.2 shows the supply chain structure attributes of case pipelines. The pipeline
survey included 3 BTO supply chains, 4 MTO supply chains, 2 ATO supply chains and 3
MTS supply chains. All these supply chains feed into one or more of the ETO project cases
in the study. No cases of a primarily ETO or STS structure could be used. The different
structures are now discussed in turn.
Buy-to-order supply chains
Case E, the metalwork subcontractor, Case H, the door manufacturer, and Case L, the
drylining supplier, all had structures that closely resemble the BTO supply chain. In all
154

[Chapter 6 - Pipeline Improvement Strategies for ETO Construction Supply Chains]
these cases, no stock was held and raw materials were purchased in batches on a project to
project basis when a customer order was placed. A small difference between the design
strategies was evident. The customer could pick from wide range of standardised options for
doors, whereas metalwork relied on designs from architects. Drylining was purchased in a
standard format, which was then customised for size requirements. The door manufacturer
held some of its most popular variants in stock, but the primary structure was BTO for
delivery into major projects.
Make-to-order supply chains
In cases B (windows), C (pre-cast concrete), D (roof trusses) and G (timber frame systems)
stocks of raw materials were held. This is typical of a make-to-order supply chain. For
example, in case B, the window manufacturer held stock of timber and aluminium. The
manufacturer of pre-cast concrete held generic stock of sand and aggregate for its pre-cast
concrete, which was then mixed for specific orders. In the case of roof trusses, stocks of
treated timber were held to complete its orders. The roof truss manufacturer differed slightly
in its production methods as, alongside batch production of orders for projects, a job shop
operated to complete one off orders with irregular size dimensions. Finally, the timber
frame system manufacturer held stock of timber for incoming orders.
Assemble-to-order supply chains
Cases A (elevators) and K (modular bathrooms) held generic stock of ‘modules’. In case A,
the manufacturer held standardised modules locally and centrally for its European
operations. However, some bespoke components were ordered on a project specific basis. In
case K, modular platform modules of steel and wood, used as a basis for all units, were held
in stock. This provided a standardized core that can be overlaid with customized design
features for specific clients.
155

Case Product PrimaiyStructure
DecouplingPoint Purchasing Stock Design Production
MethodA Elevator ATO Assembly Raw materials or buy pre
assembled modulesPre Assembled
ModulesPick from wide range of
optionsProject and
BatchB Windows MTO Fabrication Regular deliveries of raw
materials Raw Materials Pick from wide range of options Batch
C Pre-castConcrete MTO Fabrication Regular deliveries of raw
materials Raw MaterialsStandard concrete mix-
customised size/dimensions
Batch
' D Roof Trusses MTO Fabrication Regular deliveries of raw materials Raw Materials
Standard timber finish - customised size and
arrangementBatch and Job
E Metalwork BTO Purchasing Schedule when order received No Stock Take design as given by architect Batch
F Brickwork MTS CentralDistribution
Regular deliveries of raw materials
Finished goods held centrally Standard designs Batch/Flow
G Timber Frame Systems MTO Fabrication Regular deliveries of raw
materials Raw Materials Pick from wide range of options Batch
H Doors BTO Purchasing Schedule when order received No stock Pick from wide range of options Batch
I Timber MTS CentralDistribution
Regular deliveries of raw materials
Finished goods held centrally
Standard designs - range of finishes Batch/Flow
J Paint MTS CentralDistribution
Regular deliveries of raw materials
Finished goods held centrally
Standard designs - range of finishes Batch/Flow
K ModularBathrooms ATO Assembly Regular deliveries of raw
materialsPre Assembled
ModulesPick from wide range of
optionsProject and
BatchL Drylining
/Safety Systems BTO Purchasing Schedule when order received No stockStandard timber finish - customised size and
arrangementBatch
Table 6.2: Supply chain structures of cases in the pipeline survey
[Chapter 6 -
Pipeline Im
provement Strategies
for ETO Construction
Supply C
hains]

[Chapter 6 - Pipeline Improvement Strategies for ETO Construction Supply Chains]
Make-to-stock supply chains
Cases F (brick and block), I (timber) and J (paint) all held stock of finished goods to meet
customer demand. After manufacture, stock is held and then distributed to a site on a project
by project basis, so the last activity, the distribution, is customised. These cases are typical
of a MTS supply chain. For example, in case F, standardized bricks and blocks were
produced in high volume and customers ordered bulk amounts of bricks and blocks and
then ‘called o ff their requirements from working stock as projects progressed.
6.3.2 Scope of Responsibility
For the companies investigated in this study, there is considerable diversity regarding the
extent of responsibility that each company undertook for different activities in the pipeline.
Table 6.3 summarises the scope o f responsibility taken on by each of the case companies in
the pipeline survey. The table indicates the potential in-house capabilities by the companies.
It shows that rarely can a single organisation provide all the capabilities required to
complete all pipeline activities. A range of organisations, material suppliers, 3rd part
logistics suppliers, specialist design consultants and equipment suppliers, often have to
work together to complete all activities in the pipeline. The companies in cases A
(elevators) and K (modular bathrooms) were the only ones who were able to offer a
complete work package to customers without outsourcing certain activities. In case F, the
company acts as a co-ordinator for brickwork packages and has direct control over very few
aspects of the pipeline. It specialises in managing the different contractors involved. It is
worth noting that both network co-ordinators referred to companies that can offer
comprehensive work packages as subcontractors and those that purely offer material supply
as suppliers.
The amount of design work required varies across the different product groups. Table 6.3
indicates where companies have the capability to work with customers and contribute to the
design of areas within the project. Only the focal companies in cases E (metalwork), F
(brick and block) and I (timber) did not have the capability to support customers in design
157

[Chapter 6 - Pipeline Improvement Strategies for ETO Construction Supply Chains]
aspects for the project. In case A, the manufacture of elevators had the capability to support
clients on large complex projects with large amounts of design work. Five percent of its
business consisted of large ETO projects. For the manufacture of roof trusses, existing
designs were reused for different projects, where dimensions and layout were normally very
different. The focal company in case E, on the other hand, supplied metalwork packages to
contractors and assumed responsibility for all activities in the pipeline other than design.
The company did not have the necessary accreditations to take responsibility for design
work.
Case Design Assembly Transport SiteIntegration Equipment Labour
A ✓ / ✓ ✓ ✓ ✓B ✓ ✓ ✓ ✓ ✓C ✓ ✓ ✓ ✓ 1 ✓D ✓ ✓ ✓E ✓ /FG / ✓ ✓ / / ✓H ✓ ✓I ✓J / ✓ ✓ ✓ VK / ✓ ✓ ✓ / ✓L / ✓ / ✓ ✓
Table 6.3: Scope of responsibility of focal companies in each of the pipelines
Transport and logistics capabilities are a further activity in the pipeline where the scope of
responsibility changes in different pipelines. In cases B, C, F and H the focal company did
not have in-house transport capabilities, relying on the services of a 3rd party logistics
provider. For example, the focal company in case B was a UK branch of a Scandinavian
window manufacturer who is integrated vertically with the timber-sourcing operations. All
logistics operations were managed by a 3rd party logistics provider, who was responsible for
material handling, stockholding and transport. In case C, the pre-cast concrete manufacturer
assumed responsibility for all activities in the pipeline other than the transport, which was
also managed by a 3rd party logistics company.
158

[Chapter 6 - Pipeline Improvement Strategies for ETO Construction Supply Chains]
Another area of the pipeline where focal companies differ is their approach to site
integration, which in many cases requires plant and labour for installation of a product. The
focal companies in cases D, E, F, H and I did not offer site integration services. They
operated on a ‘supply only’ model. The focal company on case A, the lift manufacturer,
planned for 4-6 weeks on-site for installation, including 1 week to install, 1 week to test, 2
weeks to make good, 1 week final testing. Finally there a 12 month service period was
offered. It supplied all the materials, labour and equipment required to install the elevator on
site. Alternatively, in case D, the roof truss manufacturer was responsible for all activities in
the pipeline other than installation. The company has had problems in the past finding
enough local labour to install its products on the various projects it is working on. It took
the decision to cease offering an installation service. In case L, the supplier of drylining and
safety system, the focal company made to order, while its drylining suppliers made-to-
stock. It combined labour, safety systems equipment and additional metalwork, to offer a
safety system ‘package’ to customers, which is all installed on site as part of the package.
6.3.3 Lead-times
Overall Lead-times
Overall order to delivery cycle-times were obtained as part of the pipeline survey, along
with an estimate of optimistic and pessimistic lead-times. This represents a 3-point estimate
that the focal companies would offer to customers. This quoted order cycle time included all
activities other than site integration and was quoted in weeks. Figure 6.4 shows the quoted
order cycle time plotted against the variability of this order cycle time. The variability refers
to the difference between optimistic and pessimistic lead-times. A trend that emerges from
the figure is that the higher the lead time, the greater the degree of variability that exists.
This concurs with Berry et al. (1998) in their pipeline survey of companies in the UK. This
investigation of overall cycle-time and variability precedes a more details analysis of lead-
times for pipeline activities. This is addressed in the rest of this section.
159

[Chapter 6 - Pipeline Improvement Strategies for ETO Construction Supply Chains]
Cycletime vs Variability for Each Case
0 5 10 IS 20
Cycletime (Weeks)
Figure 6.4: Order-cycle-time plotted against variability of order-cycle-time
Detailed investigation o f lead-times
A master table of lead-times for all activities in the pipeline across all the cases is shown in
table 6.4. The optimistic, most likely and pessimistic lead-times for all pipeline activities
are displayed. The unit of measurement shown in the table is days. The enquiry, design and
approval activities have been grouped together. The lead-times for the site integration phase
are not shown as, in some of the cases, the focal companies in the pipeline study do not take
responsibility for site installation. Therefore, they were unable to offer accurate lead-times
for this activity.
160

Ca
se E n q u i r y , d e s i g n a n d
a p p r o v a lP r o c u r e m e n t S t o c k
M a n u f a c t u r i n g a n d
A s s e m b l y
S t o c k o f f i n i s h e d
g o o d sT r a n s p o r t
44 >> 44 44 4J © >> 44 44 _44 u 44 44 _44
Via»
24 V)a>
24 cn Vi44
24 C/5 +■»Vi
4424 Vi ■*-»Vi
4424 C/5 tn
4424 Vi
a a a +* a a E a -*-> a a J a aq *
Vi© tnn Cu Vi© inm a C/5o in
in & CAotnn +-*a
(Ao oti a -<41o
ViVi
o 244&H o £
442 - o £ Ph o £ On o 2 P* o 2 p *
A 14 28 56 14 21 28 0 14 56 14 28 42 0 7 14 4 7 12
B 28 42 112 7 14 21 1 4 7 14 21 28 0 0 14 4 7 12
|C28 35 56 0 1 2 1 2 7 14 19 21 0 1 14 1 1 2
D 7 14 21 1 1 2 1 7 14 1 1 7 0 2 4 1 1 2
E 28 26 49 0 1 2 0 2 7 14 19 21 0 3 14 1 2
F 7 14 56 1 2 112 0 0 0 1 2 3 0 1 7 1 2 5
G 28 35 126 1 7 56 2 4 7 1 7 14 0 7 14 1 1 2
H 14 21 42 1 7 21 0 2 7 1 7 14 0 2 7 7 14
I 0 2 49 1 2 7 2 4 7 2 3 14 2 4 21 1 1 2
J 7 28 364 1 7 21 0 14 21 0 3 7 0 7 56 1 1 2
K 70 84 126 42 49 70 0 2 4 7 14 28 0 1 1 1 1 3
L 14 21 28 2 3 7 0 0 0 7 14 21 0 7 14 1 1 2
Table 6.4: Lead times for pipeline activities
[Chapter 6 -
Pipeline Im
provement Strategies
for ETO Construction
Supply C
hains]

[Chapter 6 - Pipeline Improvement Strategies for ETO Construction Supply Chains]
Figure 6.5 shows the most likely lead-times for pipeline activities in the different cases.
Modular bathrooms (K) and elevators (A) had the longest pipeline lead times with 151 and
105 days respectively. Timber (I) and brick and block (F) had the shortest pipeline lead-
times with 16 and 21 days respectively. If the most likely lead-times are summed and
averaged, it is possible to see that the enquiry, design and approval stage accounts for the
largest proportion of lead-times. The average lead-time for this stage was 29 days, which
accounts for 56% of the average pipeline lead-time. Procurement accounted for 18%,
manufacturing 21% and transport 5%. Stockholding was relatively low, with an average of
4.7 days for raw materials or strategic stock and 2.9 days of finished goods.
Most Likely Lead Times for Pipeline Activities
>■Qo
■ 1 . 11A B C D E F G H 1 1 J K L !
Transport 7' 7 1 1 1 2 1 7 1 1
4 7
1
1
1
7Stock of Finished Goods 7•----------------- r ■ -f—
0 1 2 3 1 7 2
■ Manufacture & Assembly 28 21 19 1 19 2 7 7 3 3 14 14
■ Strategic Stock 14 4 2 7 2 0 4 3 4 14 2 0
■ Procurement21 14 1 1 1 2 7 7 2 7 49 2
■ Enquiry, Design & Approval 28 42 35 14 26 14 35 21 2 28 84 21
Figure 6.5: Most likely lead times for individual pipelines
162

[Chapter 6 - Pipeline Improvement Strategies for ETO Construction Supply Chains]
The range between optimistic and pessimistic lead-time estimations was used to calculate
the lead-time variability. Figure 6.6 shows there was most cumulative variability in the
paint pipeline, case J. In particular, the enquiry, design and approval stage in the paint
pipeline was very variable, ranging from 7 days to a year. The focal company in the paint
pipeline works on very large projects and delivers complex and comprehensive packages, so
it is usually communicating with site management about design details for the majority of
the planning and construction phase of a project. There was least cumulative variability in
the roof truss pipeline, 45 days, followed by timber, at 51 days.
Variability for Different Pipeline Activities
</>nQ
500450400350300250200150100 l l
A B C D E F G H'
1 J K j[ L '
Transport 8 8 1 1 2 4 1 15 1 1 2 1
Stock of Finished Goods 14 14 14 4 14 7 14 7 22 56 1 14
■ Manufacture & Assembly 28 14 7 9 7 3 16 16 15 3 21 14
■ Strategic Stock 56 9 16 7 0 8 7 8 21 4 0
■ Procurement 14 14 2 1 2 114 58 23 9 23 28 8
■ Enquiry, Design & Approval 42 84 28 14 21 49 98 28 49 357 56 1 4 |
Figure 6.6: Cumulative variability for individual pipelines
To give an indication of the average variability found in different pipeline activities a box
plot diagram has been developed, which is shown in figure 6.7. This shows the variability
of specific pipelines activities when the case values are averaged. The spread of the boxplot
whiskers show the variability of the different pipeline activities. All pipeline activities other
than manufacturing and assembly have a positive skew. The pessimistic lead-times are
generally much further away from most likely lead-times than optimistic lead-times. The
163

[Chapter 6 - Pipeline Improvement Strategies for ETO Construction Supply Chains]
figure also shows that the enquiry, design and approval stage is the most variable pipeline
activity, with an average variability of 70 days. The average optimistic lead-time for
enquiry, design and approval was 20 days, the most likely lead-time was 29 days, and the
pessimistic lead-time was 90 days. Transport is the activity with the shortest most likely
lead-time, having an average most likely time of just over 2.5 days. Transport is also the
least variable, with the difference between average optimistic and pessimistic lead-times
being 4.5 days.
A verage Variability for Different P ipeline A ctivities
105- 100-
95- 90- 85- 80- 75- 70- 65-
> 6 0 -
Q 55 50-
I *Z 40-
35- 30- 25- 20-
15' 10 -
5- 0-
-5-
1—
J .
' _L- i
2§-<'oCD
>73■go<
§cETacCD
’>v>(A5
313s—9ClOooClV)
G>23.
Pipeline Activity
Figure 6.7: Average variability and average lead times for different pipeline activities
164

[Chapter 6 - Pipeline Improvement Strategies for ETO Construction Supply Chains]
6.4 PROBLEMS IN THE PIPELINE
The pipeline survey also collected data relating to the problems experienced in the pipeline.
Table 6.5 shows a summary of the different problems experienced in each of the pipelines.
Ten generic problems have been identified (shown across the top of the table). They have
been sorted, horizontally, by the most frequently cited problems and, vertically, by the
pipeline that cited the most problems. A causal modelling diagram has been developed in
order to highlight the cause of problems and their solutions. This is shown in figure 6.8. The
generic problems along with their causes and potential solutions are now discussed in turn.
P ro b le m s in th e P ip e lin e *
□<UmU
1 2 3 4 5 6 7 8 9 10
Tot
al
A 0 1 1 0 0 1 0 0 1 1 5
D 1 1 1 0 1 0 0 1 0 0 5
K 1 0 1 0 0 1 1 0 0 0 4
C 0 1 0 1 0 0 1 0 0 0 3
G 1 0 0 1 0 1 0 0 0 0 3
B 0 1 0 1 0 0 0 0 0 0 2
F 0 1 0 0 0 0 0 1 0 0 2
H 1 0 0 0 1 0 0 0 0 0 2
I 1 0 0 0 0 0 0 0 1 0 2
L 0 0 1 0 1 0 0 0 0 0 2
E 1 0 0 0 0 0 0 0 0 1 2
J 0 0 0 1 0 0 0 0 0 0 1
Total 6 5 4 4 3 3 2 2 2 2*1 = Design Changes/
Information Exchange, - 8 = Excessive Product
ncorrect Specification, 2 = Establis > = Supply Risks, 6 = Integrating W Variation, 9 = Payment & Chains o
ling Site Readiness 3 = Labour, 4 =
ith Other Trades, 7 = Access Issues, f Custody, 10 = Tender Uncertainty
°A = Elevators, B = Windows, C = Pre cast concrete, D = Roof Trusses, E = Metalwork, F = Brick and Block, G = Timber frame systems, H= Doors, I = Timber, J = Paint, K = Modular bathrooms,
L = Drylining.Table 6.5: Binary coding of problem s in the pipeline
Problem 1 - Design Changes/Incorrect Specification
As has already been noted, the design and approval process represents a major time
bottleneck and proved to be the most variable of all pipeline activities analysed. This is
165

[Chapter 6 — Pipeline Improvement Strategies for ETO Construction Supply Chains]
cited as a problem in cases D, E, H, G, I and K. In the design of modular bathrooms, getting
the design right early on saves a lot of time and effort later on. Design changes that are
made late in the pipeline can be particularly costly. The manufacturer in this case had made
significant investments in design software and expertise. Design changes were also a
problem for the timber frame manufacturer. Initial designs were not usually prepared for a
timber frame construction method, so they had to be converted. Late design changes were
so costly that the company insisted on a design freeze cut off point. Cases H and I, doors
and timber, both cited incorrect specification from designers as a significant problem in the
pipeline. Design changes and incorrect specifications can be the result of a combination of
late changes made by the client, initial designs that are too vague, and suppliers receiving
designs too late in the project to make any realistic contributions or react to any problems.
Solutions include having a design freeze and keeping quotes open and subject to variation.
Problem 2 - Unable to establish site readiness
Establishing site readiness for delivery is also frequently identified as a problem. Cases A,
B, C, D and F all register this problem. The due dates are agreed upon early in the tender
process. Deliveries and installation require careful coordination of trades and activities to
meet this due date, and when the supplier is ready to deliver the initial due date agreed is
either too early or too late. If the supplier has poor visibility of site progress, or if the
communication between the site management and supplier are poor, changes to the due date
will not be registered. A symptom of not being able to establish site readiness is the
requirement to store finished goods. This often incurs a financial cost to the supply chain
and difficulties managing labour for installation. In the case of the lift manufacturer delivery
dates given in the planning stages are nearly always too early. One of the interviewees
estimated that 9 times out of 10 the site is only half way through the preceding activity
when the product is ready to be delivered. Pre-cast concrete, due to its bulk and weight,
once cut and set, needed to get to" the site and be put in place quickly. This makes
establishing site readiness for delivery a premium.
166

[Chapter 6 - Pipeline Improvement Strategies for ETO Construction Supply Chains]
CO3oI— 3 _1oco
►— a .
Q- «
<*> ® cS £ £ B ■ o « < 3 ®? n ^ -
-COLU
3
Q
9 <2
® c =5 D«
35 » ® > QO
Figure 6.8: Causal modelling for problems in the pipeline
167
1

[Chapter 6 - Pipeline Improvement Strategies for ETO Construction Supply Chains]
A cause of this poor visibility is a lack of access to updated drawings and programmes.
Solutions include information technology (IT) systems that facilitate visibility of project
progress and good proactive communication between supply chain members'. Another
solution to this problem is the use of consolidation centres or a strategic stockholding points
so that stock can be held and deliveries controlled to ensure that the site is ready to accept.
Problem 3 - Labour Shortages
Labour is the third most frequently cited problem. Cases A, D, K and L all refer to this as a
problem. For elevators, labour at peak times could be ‘difficult to juggle’, especially for
site installations. The roof truss manufacturer found it difficult to recruit drivers for its in-
house fleet and in finding local labour for the factory. The company had to stop offering
installation services as adequate labour ‘gangs’ could not be recruited effectively. The
manufacturer of modular bathrooms finds it difficult to get skilled joiners and fitters and has
initiated its own in house training facility to overcome this problem. The drylining
subcontractor found labour a ‘major constraint for completing tasks’. The causes of this
were unpredictable workflow and the lack of labour resources. Possible solutions include
in-house training schemes to develop local labour and flexible labour models through
combinations of in-house and outsourced labour.
Problem 4 - Information Exchange
Getting the correct information at the right time was perceived as a significant problem for
pipeline activities. This was identified as a major problem in cases B, C, G and J. In the case
of the window suppliers, getting appropriate and up to date information from clients,
consultants and main contractors was seen as the most significant problem in the pipeline,
especially the acquisition of up-to-date drawings and sizes. For the pre-cast concrete
manufacturer, a lack of information about hole penetration points for casts and fittings, as
well as vague designs and enquiry information, was a difficulty. The original design
information received by the timber frame system manufacturer was not usually tailored for
timber frame designs, so technical staff were employed to convert drawings and information
to the correct format. Furthermore, design information was usually received too late to
make meaningful improvements.
168

[Chapter 6 - Pipeline Improvement Strategies for ETO Construction Supply Chains]
The paint subcontractor in the Pipeline J required 3 types of information to complete a
project: programme details which include a start date, a schedule of works and a finishing
specification. Typically, at least 1 of these pieces of information was not received early
enough. The main cause of this was a fragmented supply chain. For each project that
suppliers work on, they are often working as a part of different project coalitions as opposed
to a consistent, established supply chain. It is difficult to instil a sense o f team working into
such as supply chain and real time information exchange is often lacking. Possible solutions
here include proactive and flexible communication systems, early involvement in design for
suppliers and meetings, facilitated by the network co-ordinator, to foster relationships
between different groups of suppliers that must work together.
Problem 5 - Supply Risks
After integrating with other trades and establishing site readiness, supply risks were the next
mostly frequently cited in the pipeline survey. Cases D, H and L all alluded to supply risks.
The door manufacturer suffered from problems in global supply networks, as there were
only a few specialist suppliers of specialist parts. Case L, the dry-lining supplier, was
dominated by terms and conditions of the three big suppliers of dry-lining timber. Finally,
the roof truss manufacturer was at risk from the lack of suppliers of the plating which binds
rook truss beams. This was integrated with design software of which there are only a few
specialist suppliers in the UK. The cause is attributed to dependency on a few suppliers,
which reinforces the need for long term partnerships if there are no alternative sources of
supply.
Problem 6 - Integration with other trades
Cases A, K and G all cited integrating with other trades as a problem. This comes at the end
of the pipeline in the site integration phase. This is connected with the problem of
establishing site progress, as frequently the activities of other trades are not completed on
time and this delay is not communicated effectively. For the timber frame manufacturer
problems arose when the groundwork was insufficiently prepared. The elevator
manufacturer has to interface with many trades, and this causes problems with
fragmentation of the supply chain, inconsistent project teams and trades being ignorant of
169

[Chapter 6 - Pipeline Improvement Strategies for ETO Construction Supply Chains]
each others’ requirements. Potential solutions include educating trades and team working
initiatives to encourage discussion between related trades. Work package teams have been
suggested.
Problem 7 - Access Issues
The inability of the suppliers to access sites is highlighted by two o f the case pipelines.
Cases C and K both regularly experienced difficulties when planning access points for sites.
One of the key challenges for the manufacturer of modular bathrooms is ensuring clear
access and an uninterrupted work area on site. The manufacture o f pre-cast concrete also
experienced problems with site access. Typically, for the delivery of pre-cast concrete, large
volumes and frequent deliveries were made on to site. Space is required for lifting
equipment and a large work area is required.
Access issues can be caused by poor site management and planning. I f site work areas and
access points are not managed to ensure materials can flow to required areas then access
will become an issue for suppliers. Some sites, however, may be severely constrained in
terms of access points, especially if they are situated in dense urban areas. The solutions to
this problem lie with the site management. Suppliers and site management may work
together to promote delivery flexibility. This may also involve improving site processes.
Network co-ordinator 2 has developed a specific area within the business that advises
different site management teams on site logistics, access and on site material flows.
Problem 8 - Excessive Product Variation
A further problem in the pipeline is excessive product variation caused by architects’
designs. Companies D and F perceived this as a problem. For the manufacture of roof
trusses, architects frequently liked to introduce new designs. A key challenge for the brick
and block supply chain was to get architects and engineers to select a package of bricks
from an established list to suit aesthetic and strength requirements, as it is very costly to
introduce new designs. The root cause of this problem is that suppliers deliver to projects
that vary in scope, scale and design requirements. Architects do not have incentives to
standardize elements of their designs, and product variation proliferates as a result. Two
170

[Chapter 6 - Pipeline Improvement Strategies for ETO Construction Supply Chains]
potential solutions are increased product flexibility capabilities at the supplier level or more
standardisation from architects, with due care and attention to design for manufacture.
Problem 9 - Payment and ‘chains o f custody ’
Payment and establishing chains of custody was also highlighted as a problem. Chain of
custody refers to the auditing and tracing of changing ownership of materials as they flow
through the supply chain and the corresponding payment and quality assurances for these
materials. Companies A and I both highlighted this as a problem. In the case of the lift
manufacturer customer payment was perceived to be an important issue. The organisational
processes were system driven, so, in some cases, employees were unable to proceed with
orders until the system requirements have been fulfilled. In many cases late payments from
customers held up these processes and have delayed delivery. Company I, the timber
supplier, stated that commercial negotiations and payment have, in the past, held up
deliveries. A cause of this is a fragmented supply chain. A possible solution is integrated,
supply chain track and trace systems and good customer relationships.
Problem 10- Tender uncertainty
A further problem was the competitive tendering process. This supports other studies that
suggest that competitive bidding in project procurement is a key contributor to overall lead
time (Elfving et al., 2005). Companies A and E both stated that the tender process was a
problem. A network co-ordinator, typically, will send an enquiry out to a number of
potential subcontractors for work packages and material supplies, selecting each project
through a competitive tendering mechanism. More consistency from clients and contractors
in purchasing arrangements with effective framework or collaborative agreements would
help suppliers and subcontractors forecast and build relationships for improved service. This
type of relationship building could result in collaborative forecasting for prospective orders.
6.5 SOURCES OF COMPETITIVE ADVANTAGE IN PIPELINES
Competitive advantage is the search for a favourable position in an industry (Porter, 1985).
The resource based view of the firm argues that companies that are able to sustain
competitive advantage from the resources and capabilities that they accumulate (Grant,
171

[Chapter 6 - Pipeline Improvement Strategies for ETO Construction Supply Chains]
1991; Peteraf, 1993). Dyer and Singh (1998) extended this view of the firm of the unit of
analysis when they observed that a pair or network of companies can develop relationships
that result in sustained competitive advantage. In the field of supply chain management,
studies have highlighted that supply chain management practices can have a direct impact
on competitive advantage (Christopher, 2005; Li et al., 2006; To will, 1997a). According to
Christopher (2005), competitive advantage can be found in the ability of the organisation to
differentiate itself, in the eyes of the customer, from its competition and by operating at a
lower cost and hence at greater profit. Successful companies either have a cost advantage or
they have a value advantage, or a combination of the two. This section addresses the
sources of competitive advantage that can be developed in supplier pipelines for project
environments.
Table 6.6 shows a summary of the sources of competitive advantage in the different
pipelines. Ten sources have been identified (shown across the top of the table). They have
been sorted, horizontally, by the most frequently cited sources and, vertically, by the
pipelines that cited the most, and least, different sources. As with the previous section, a
causal modelling diagram has been developed in order to show relationships between
sources, enablers and benefits. This is shown in figure 6.9. Each source of advantage is now
discussed in turn.
Source 1 - Specialist Expertise
The most widely cited source of competitive advantage, along with supply chain
integration, is specialist expertise. Cases G, C, D, H, E and J all cited this as a source of
competitive advantage. It refers to mastery of a particular product, service or combination
of goods and services. In particular, they referred to the ability to offer support for clients in
tendering for projects and for providing advice specifically relating to their expertise. The
timber frame system and roof truss manufacturer both referred to the importance of design
expertise when dealing with customers. The manufacturer of pre-cast concrete highlighted
the ability to advise clients on strength requirements, hole penetration points, timings and
resource requirements as a major contributor to winning orders. The paint subcontractor
perceived that the ability to advise clients effectively on a ‘package’ of requirements is
172

[Chapter 6 - Pipeline Improvement Strategies for ETO Construction Supply Chains]
crucial in securing repeat business. This package would include recommendations on labour
requirements, time implications and finishing specification.
S o u r c e s o f C o m p e tit iv e A d v a n ta g e *
□4>Vi£
U1 2 3 4 5 6 9 7 8 10 T
otal
A 0 1 1 0 0 1 1 0 1 0 5J 1 0 0 0 1 1 1 0 0 1 5G 1 1 1 0 0 0 0 1 0 0 4K 0 1 1 0 1 0 0 0 1 0 4D 1 1 0 1 0 0 0 0 0 0 3B 0 0 0 1 0 1 0 1 0 0 3C 1 0 0 0 0 0 1 0 0 0 2H 1 0 0 0 0 0 0 0 0 1 2I 0 1 0 1 0 0 0 0 0 0 2E 1 0 0 0 0 0 0 0 0 0 1
F 0 1 0 0 0 0 0 0 0 0 1
L 0 0 0 0 1 0 0 0 0 0 16 6 3 3 3 3 3 2 2 2
*1-= Specialist Expertise, 2 = Supply Chain Integration, 3 = Information 1fechnology Systems, 4= Logistics , 5 = Labour, 6 = Management Systems and Processes, 7 = New Product and Process
Innovation, 8 = Manufacturing Excellence, 9 = Modularity, 10 = Flexible OrganisationalStructure
\ = Elevators, B = Windows, C = Pre cast concrete, D = Roof Trusses, E = Metalwork, FBrick and Block, G = Timber frame systems, H= Doors, I = Timber, J = Paint, K = Modular
bathrooms, L = Drylining.Table 6.6: Binary coding of sources of competitive advantage
The enablers for specialist expertise were highlighted as highly trained staff and investment
in training facilities. In case K, an in-house training school had recently been set up to
maintain a pool of skilled labour. The timber frame system manufacturer also had a skills
academy. Expertise supports the capabilities to advise clients, contribute to designs and can
enable a suitable and well positioned mix of products for its customers.
173

Figure 6.9: C
ausal modelling
for sources
of competitive
advantage
BENEFITSCorrect
OrganisationalCompetencies
MoreConsistentDemandFlexible Logistics
CorrectLabour
Capabilities
Strength from Portfolio of Suppliers
Information Availability and
Visibility
Improved Product Mbc
Offering
Bettor visibility of
Demand
MassCustomisation
Visibility and Control
Econom lesof Scale for
Purchasing
ImprovedSupplier
PerformanceStandardisation
E N A B L E R SLow overhead Investment In
structure training facilitiesNew Standard
Products Operating * Procedures
in-house ConsolldatiorCentres
PartnershipFrameworks
Investment In Capacity
Service Level AgreementsBespoke
Supplier Improvement and Training
FlexibleAutomated Flexible Investm ents Outsourced Highly Trained
Factory Workshops Com petences Labour StaffOlobal SAP
SystemNew
TechnologyFramework
Agreements
CustomerFteiationshlps
StrategicAcquisitions
Designexpertise
Management System s and
New Product ProcessesFlexible
OrganisationalSupply Chain Manufacturing Specialistinnovation(7) (6) iTSystem s(3) Logistics^) integration(2) E x c e lle n c e s Modularity(9) Structure(10) Labour(5) Expertise(t)
[Chapter 6 -
Pipeline Im
provement Strategies
for ETO Construction
Supply C
hains]

[Chapter 6 - Pipeline Improvement Strategies for ETO Construction Supply Chains]
Source 2 - Supply Chain Integration
Supply chain integration was, jointly with specialist expertise, the most widely perceived
source of competitive advantage. Cases A, D, F, G, I and K can be categorised under this
group. Within supply chain integration, a cluster of cases refer to customer relationships as
a key source, and a second cluster stresses the importance of working closely with suppliers.
As previously noted, the roof truss manufacturer was at risk from a lack of suppliers for the
plating which binds roof truss beams. The manufacturer stated that long term relationships
with plate manufacturers and software providers were extremely important. The
manufacturer of modular bathrooms highlighted that relationships with suppliers of critical
components was essential for successful project delivery. The Brick and Block supplier
stated that it was essential to have supply chain framework agreements in place with
suppliers in order to deliver effectively to customers.
Cases A, G and I all alluded to the integration with customers as a source of competitive
advantage. In the case of timber frame manufacturers, a team consisting of design, project
and manufacturing staff were assigned for each client order in order so that different areas
of the business could be integrated to deliver client needs. The company espoused the
“partnership opportunity curve”, which was articulated in company documents. This
suggests that if the manufacturer is only involved in the construction phase of a project, or
shortly before the start of construction, there is limited opportunity to add value. If the
manufacturer is involved early on during planning approval, tender issue and project design
stages, then it can advise on appropriate specification, cut costs, contribute to buildability,
design out waste and minimise design risk and error. The lift manufacturer suggested that
building close relationships with centralised purchasing contacts at major clients was
critical to securing repeat business. The timber supplier argued that long term relationships
can build a common understanding that helps to reduce the costs of transactions. The
capabilities of suppliers can be harnessed for responding to volume, mix and new product
changes. A “seamless supply chain” (Towill, 1997a), where information requirements are
freely available on time and in undistorted form, captures a more accurate picture of
customer requirements and facilitates quick response, improving delivery flexibility.
175

[Chapter 6 - Pipeline Improvement Strategies for ETO Construction Supply Chains]
Source 3 - Information Technology Systems
Information technology (IT) systems were cited 3 times as a source of competitive
advantage. Cases G and K both stressed the importance of bespoke IT systems as a source
of advantage. In the case of the timber frame manufacturer, bespoke software interfaced
with design software (such as CAD - Computer Aided Design) to facilitate integration of
manufacture and design. This promoted ‘design for manufacture’ principles into the system.
The bespoke IT system utilised by the modular bathroom manufacturer increases visibility
and offered structure to different stages of the process. Case A, the lift manufacturer, used a
global enterprise resource planning system. This helped the organisation maintain data
integrity and availability across its different business units and activities. IT systems
promote real-time visibility of demand information, thereby better allowing organisations in
the supply chain to match capacity with demand. Real-time visibility of project progress and
delivery date requirements would allow suppliers to be more proactive and flexible in
changing due dates.
Source 4 - Logistics
It is also possible to gain an edge over competition through logistics capabilities. This was
highlighted in cases B, D, I and K. Case D, the roof truss manufacturer, gains advantage
from combining in-house transport capabilities with outsourced logistics. The in house
capabilities include drivers and a fleet of different vehicles. Further vehicles are then shared
between different product areas within the organisation. Contract transport and agency
drivers are also used to meet any periods of high demand or urgency. The window
manufacturer outsourced all of its logistics operations to a third party logistics service
provider. Service level agreements are agreed and the logistics provider was able to offer
stockholding either centrally, in northern Europe, or locally, at locations in the UK, if
required. The paint subcontractor highlighted the advantages of consolidation centres for
delivering into construction projects. Operational advantage was gained from the recently
opened logistics and consolidation centre located near the M25 to serve London. This
provided a controlled environment for inventory management and reduced reliance on
inconsistent deliveries from large suppliers of standard paints.
176

[Chapter 6 - Pipeline Improvement Strategies for ETO Construction Supply Chains]
Logistics capabilities have an impact on delivery and access flexibility. The strategic
location o f warehouses and consolidation centres, as well as the capabilities of the transport
system, will affect the ability of a pipeline to provide a quick response to changing delivery
due dates. Logistics capabilities will also determine the geographical spread that a supplier
can offer to its customers.
Source 5 - Labour
Labour, in terms of getting the appropriate amount and skills, was identified as a source of
advantage in cases J, K and L. The manufacturer of modular bathrooms highlighted the
importance of a good project manager who can ensure that the work area has clear access
and work can progress without interruption. Good site supervision and getting the right
amount of people on site for site activity was a crucial advantage for the painting
subcontractor, which used a flexible labour model to respond to project requirements.
Whereas the company only employed around 80 employees, it could expand to over 200
through the use of subcontracted labour. The company organised a pool of flexible labour
under the different skills required for paint work packages and contracts them on a flexible
basis. In case L the dry-lining supplier emphasized the need to get people early on site and
ensure good communications with site management.
A multi-skilled flexible work force supports the design of new products, and provides the
flexibility to switch between different products. A flexible pool of labour facilitates volume
flexibility as resources can be up scaled or downscaled in accordance with demand
requirements. Finally, extra labour resources can be used to deal quickly with ‘rush’ orders
in the case of changing due dates, thereby improving delivery flexibility.
Source 6 - Management Systems and Processes
Management systems and processes Prefer to the step by step methods and practices used to
complete activities. These were cited on three occasions. Case A, the lift manufacturer,
relies on process driven operations to overcome the complexity of its operations. In case J,
the paint subcontractor proposed that its success was due to getting the right management
systems and procedures in place using effective key performance indicators (KPIs) and
standard operating procedures. Case B, the windows manufacturer, emphasized the
177

[Chapter 6 - Pipeline Improvement Strategies for ETO Construction Supply Chains]
processes and measures required for materials handling on site to reducing damages. The
key enablers for effective management systems were KPIs and standard operating systems,
which were associated with better information visibility and control, as well as
standardisation and simplification.
Defined protocols for changing between products and new product design can support mix
flexibility and new product flexibility. KPIs and control processes help to support volume
and delivery flexibility, as they help to provide visibility of performance and potential
control actions for fluctuations in demand and delivery. Delivery flexibility could also be
improved by defined protocols for rush orders and project delays.
Source 7 - New Product or Process Innovation
New product and process innovation was cited in three of the cases. This refers to the
development of new offering to customers in the form of new products or new and better
ways of doing similar offerings. Cases A and C stressed the importance of new products.
The pre-cast concrete manufacturer proposed that a secret concrete mix that offers a high
strength to setting ratio, which sets very quickly and offers high strength and load bearing,
is a major source of competitive advantage. The lift manufacturer distinguished itself from
the competition with intelligent information systems and technology. The organisation
invests large amounts of research and design in technology systems to remain ahead of
competition. Case J highlighted the importance of process innovation. The paint
subcontractor has developed a new off-site spray booth for off-site paint treatment, Biffa
waste-safes and tin disposal facilities as well as new and specialist applications. New
product and process innovation is intimately linked with new product flexibility.
Source 8 - Manufacturing Excellence
Many key texts in operations management and lean thinking make reference to
manufacturing excellence (Hill, 2005; Slack et al., 2004; Womack and Jones, 1996;
Womack et al., 1990). Manufacturing excellence was cited in two of the cases, B and G, as
a source of advantage. Company B, the window supplier, described the importance of
quality and reducing defects as an essential part of its competitive strategy. The timber
frame manufacturer referred to automation of its factory and state of the art machinery as
178

[Chapter 6 - Pipeline Improvement Strategies for ETO Construction Supply Chains]
key to gaining an edge over competitors. This allows precision in manufacturing and design
that competitors cannot match. A standard sized timber frame house can be manufactured in
45 minutes. The enablers of manufacturing excellence are automated factories using best
practice principles along with flexible workshops. The combination of these two enablers
can help deliver mass customisation (Pine, 1993). Manufacturing excellence helps to
develop mix flexibility and volume flexibility. Single minute exchange of dies (SMED), a
technique for minimising machine set up times, can reduce time taken to switch between
products increasing mix flexibility (Gilmore and Smith, 1996). Capacity planning and
evaluation techniques have also been linked with improved volume flexibility (Zorzini et
al., 2008).
Source 9 - Modularity
Modularity involves product configurations that are obtained by mixing and matching sets
of standard components (Salvador et al., 2002; Voordijk et al., 2006). Company K, the
modular bathroom manufacturer, used a modular base, made from steel frame and wood
panelling, with careful thought given to how this interfaces with different components. This
acted as a core. High specification bespoke finishes were then added to this core. This
approach combines the cost savings of generic standardised components with the service
level of a customised finish. Company A, the lift manufacturer, also used modular design
principles. Standard components and interfaces are used across and between product groups
to enable cross product architectures. Assembly kits were delivered flat pack and the kits
could be assembled with minimal labour and time on the construction site. Modularity helps
companies to deliver mass customised products.
Modularity supports new product flexibility as many components can be re-used in new
designs. It improves mix flexibility as it is easier to switch between existing products that
have the same modular platform. Volume and delivery flexibility are improved as buffer
stocks of standardised components combined with a customised finish offers the capabilities
to cope effectively with fluctuations in demand and sudden changes in delivery
requirements.
179

[Chapter 6 - Pipeline Improvement Strategies for ETO Construction Supply Chains]
Source 10 - Flexible Organisational Structure
Finally, a flexible organisational structure was highlighted by two of the cases, J and H.
This refers to the ability to shrink or grow an organisation w ith little penalty in time or cost.
In case J, the paint subcontractor employed a minimal overhead strategy. Fixed overheads
were never put at risk, and variable overheads could grow or shrink to match the order
book. The organisation kept a pool of self employed labour on its books which it called
upon when demand was high. Logistics was also outsourced. In the case of H, the door
manufacturer, buying and selling strategic acquisitions in response to market requirements
was seen a key capability. This included buying competitors and selling off business units
or assets when the time is right. The enablers for a flexible overhead structure are
investment in capacity and capabilities, flexible outsourced labour and a low overhead
structure. This type of organisational structure supports volum e flexibility.
6.6 RECOMMENDATIONS FOR PIPELINE IMROVEMENT
This final section seeks to assemble and synthesize the findings from the pipeline survey,
and to relate these findings to the relevant literature. The synthesis is structured using four
different recommendations for pipeline improvement. The recommendations are: reduce
uncertainty by addressing the problems in the pipeline, strive for shorter and more
consistent lead times, consider the sources o f competitive advantage in pipeline
improvement strategies and work together to improve pipelines. These recommendations
are now discussed in turn.
1. Reduce uncertainty by addressing the problem s in the pipeline
The problems that companies experience in the pipeline have been investigated in the
pipeline survey. Ten problems in the pipeline have been identified and have been ranked
according to the frequency that they were experienced in different pipelines. The 10 generic
pipeline problems were identified which are as follows and are listed with the frequency
that the problem occurred in the pipeline survey shown in brackets after each source:
design changes/incorrect specification (6), establishing site readiness (5), labour shortages
(4), information exchange (4), supply risks (3), integration o f related trades on site (3),
access issues (2), excessive product variation (2), paym ent and chains of custody (2), and
180

[Chapter 6 - Pipeline Improvement Strategies for ETO Construction Supply Chains]
tender uncertainty (2). A causal model was presented which illustrates the causes of these
problems and potential solutions. The solutions to these problems are now summarised and
related back to the structured literature review in chapter 2.
• Information management. A greater degree o f information transparency has been
proposed as a fundamental concern for effective supply chains (Mason-Jones and
Towill, 1997). It is also important for developing agile supply chains (Christopher,
2000; Goldman et al., 1995). The structured literature review identified 15 papers
investigating information management as a strategy for improving ETO supply
chains. The analysis of pipeline activities that feed into ETO supply chains
presented in this chapter suggests that better information management would address
some of the problems experienced by the cases described herein. More specifically,
project visibility for suppliers and manufacturers would enable them to establish site
readiness for deliveries more effectively. The use of IT systems may help to
facilitate information exchange and visibility throughout the pipeline.
• Supply chain integration. The structured literature review in chapter two identified
22 papers related to supply chain integration in ETO supply chains. The causal
modelling presented earlier in this chapter suggests that collaborative forecasting
and early supplier involvement in the design process are solutions to uncertainty and
problems in the pipeline. It also suggests that proactive communications and early
conditioning and familiarisation for areas of the supply chain that must work
together on site are important to facilitate integration across the pipeline.
• Flexibility. Twelve papers that link flexibility with ETO activities were identified in
part 2 of the literature. The causal relationships highlighted suggest that product
flexibility, delivery flexibility, flexible labour models and communications
flexibility are potential solutions to the problems in the pipeline.
2 Strive fo r shorter and more consistent lead times
Short and consistent lead times from manufacturers and suppliers are important in
delivering the flexibility and agility requirements o f ETO supply chains. The results of the
pipeline survey suggest that longer lead times are more variable, and the most of the
variability is located at the design stage. The obvious route is to move toward greater
simplicity and to re-engineer processes so as to reduce lead times and increase consistency.
181

[Chapter 6 - Pipeline Improvement Strategies for ETO Construction Supply Chains]
Reducing variability and lead times in the design and approval stage would reduce
significantly the overall length and uncertainty o f order to delivery pipelines. In part 2 of the
literature review, nine papers were categorised under the ‘tim e compression’ category,
suggesting that time compression should be adopted in ETO supply chains. The results of
this chapter supports these papers, proposing that tim e compression is an important
objective for improving pipelines that feed into ETO supply chains.
3. Consider the sources o f competitive advantage in p ip e lin e improvement strategies
This chapter has investigated the sources of competitive advantage in the pipeline. The
sources of advantage for the focal companies in pipelines were analysed, identifying 10
sources. They are listed as follows, with the frequency that the source occurred in the
pipeline survey shown in brackets after each source: specialist expertise (6), supply chain
integration (6), information technology systems (3), logistics capabilities (3), labour (3),
management systems and processes (3), new product and process innovation (3),
manufacturing excellence (2), modularity (2) and a flexible organisational structure (2).
A company can also consider re-engineering its operations by forward or backward shifting
through supply chain structures for strategic benefit by shifting the decoupling point.
Moving the decoupling point further toward the STS structure may help to reduce the
delivery lead time to customers and to increase manufacturing efficiency, while moving the
decoupling point backwards toward the ETO structure shift may help to increase the
knowledge of customer orders at the time of production (Olhager, 2003). An assessment of
the appropriate amount of customisation and product variety, and hence flexibility, to offer
to the customer is important in developing an appropriate supply chain structure.
4. Work together to improve pipelines
The analysis of problems in the pipeline highlights the need for a collaborative, holistic
approach to pipeline improvement. The solutions to the problems highlighted often require
network co-ordinators to work together to improve flows o f information and integrate
processes. In some cases they also require different suppliers within the project supply chain
to work together more effectively. The success o f an ETO project will rely heavily on the
ability of a responsive “extended” enterprise. This analysis has illustrated that Companies
182

[Chapter 6 - Pipeline Improvement Strategies for ETO Construction Supply Chains]
must work together develop responsiveness. Different relationship strategies are addressed
in more detail in the next chapter, but this chapter has highlighted the role of the following
in improving pipelines:
• More consistency from clients and contractors in purchasing and managing
collaborative frameworks would help suppliers and subcontractors to predict
demand levels and to manage their operations in more effective and efficient ways;
• Proactive communication between different members of the supply chain would
support shorter and more consistent lead times. IT systems that allow visibility of
information between different members of the supply chain would help to enable
more responsive pipelines;
• Supplier training and improvement by network co-ordinators would help to develop
the required capabilities and improve pipelines.
6.7 DISCUSSION AND STATEMENT OF CONTRIBUTION
This chapter has addressed the specific gap identified whereby the partnership and pipeline
literature for construction supply chains has placed too much emphasis on client
relationships, as oppose to those that might arise upstream between contractors and their
suppliers (Dainty et al., 2001a; Dainty et al., 2001b; Ireland, 2004; Proverbs and Holt,
2000). In addition, much of the research on pipelines has been conducted in high volume
manufacturing sectors (Aitken et al., 2005).
The importance and contribution provided by this chapter can be summarised as follows:
While the client-main contractor relationship has been well researched in the construction
sector, the relationship between main contractors and subcontractors has not been well
researched. Furthermore, pipeline research has focused primarily on high volume, stable
supply chains. This chapter has addressed this gap by providing an empirical investigation
o f pipeline activities between two network co-ordinators and 12 suppliers within the
construction industry. The problems and sources o f competitive advantage were identified
within these pipelines, and recommendations are made fo r pipeline improvement.
183

[Chapter 6 - Pipeline Improvement Strategies for ETO Construction Supply Chains]
6.8 CONCLUSION
In the context of ETO systems, this chapter has specifically addressed the research question
‘How can organisations improve pipelines in ETO supply chains?’ At the start of the
chapter, the generic activities in the pipeline were identified. Enquiry, design, approval,
procurement, manufacture, transport and site integration phases were discussed. Analysis of
the pipeline survey has shown that lead-times associated with the design stage are the most
variable. The pipeline survey also indicates that as lead-times get longer they also get more
variable. The findings of the pipeline survey also highlight the diversity of operations that
feed into an ETO project. A range of supply chain structures must be managed to
successfully deliver an ETO project.
In addition to analysing the generic pipeline activities and their lead-times, the main
problems in the pipeline have been investigated in this chapter. Ten generic pipeline
problems were identified, which are as follows and are listed with the frequency that the
problem occurred in the pipeline survey shown in brackets after each source: design
changes/incorrect specification (6), establishing site readiness (5), labour shortages (4),
information exchange (4), supply risks (3), integration of related trades on site (3), access
issues (2), excessive product variation (2), payment and chains of custody (2), and tender
uncertainty (2). A causal model was presented which illustrates the causes of these
problems and potential solutions.
The sources of advantages for the focal companies in pipelines were also analysed,
identifying 10 sources. They are listed as follows with the frequency that the source
occurred in the pipeline survey shown in brackets after each source: specialist expertise (6),
supply chain integration (6), information technology systems (3), logistics capabilities (3),
labour (3), management systems and processes (3), new product and process innovation (3),
manufacturing excellence (2), modularity (2) and a flexible organisational structure (2). The
benefits of these different approaches are illustrated using a causal model.
The synthesis in the final part of the chapter develops four recommendations for pipeline
improvement. The recommendations are: reduce uncertainty by addressing the problems in
184

[Chapter 6 — Pipeline Improvement Strategies for ETO Construction Supply Chains]
the pipeline, strive for shorter and more consistent lead times, consider the sources of
competitive advantage in pipeline improvement strategies and work together to improve
pipelines. The next chapter addresses the last recommendation in more detail, exploring
different relational categories that a network co-ordinator can use to optimise the network of
suppliers in ETO projects.
SUMMARY OF CHAPTERS AIMS1. Rationalise and investigate supply chain flexibility in the ETO sector
-A conceptual model of supply chain flexibility has been developed and explored th rou gh th e case research.
2. Develop a purchasing model for engineer-to-order supply chains-A purchasing model consisting of 3 tiers of supplier has been developed including
approved suppliers, preferred suppliers and strategic partners3. Integrate supply chain flexibility concepts with a purchasing model
- The dimensions of supply chain flexibility were integrated with the 3 tiers ofsuppliers. High levels of vendorflexibility can be achieved through strategic partnerships and sourcing flexibility can be achieved with approved suppliers
4. Considerthe role of supply chain flexibility in mitigating project uncertainties- A mapping exercise w as conducted, which concludes thatvendor and sourcing
flexibility can be used to mitigate 23 of the 42 uncertainties
/
185

[Chapter 7 - Achieving Flexibility in ETO Construction Supply Chains]
CHAPTER 7
ACHIEVING FLEXIBILITY IN ENGINEER-TO-ORDER
CONSTRUCTION SUPPLY CHAINS
CHAPTER 7 AIMS1. Rationalise an d inves tiga te s u p p ly cha in flexibility in th e ETO cons truc tion
se c to r2. Develop a p u rc h a s in g m odel for eng inee r- to -o rde r su p p ly c h a in s3. Integrate su p p ly cha in flexibility c o n c e p t s with a p u rc h a s in g m odel4. C o n s id e r th e role of su p p ly ch a in flexibility in mitigating p ro jec t uncerta in ties
R ESEARCH Q UESTION AD DRESSED RQ4: How can flexibility be ra t ionalised in ETO co n s tru c t io n su p p ly c h a in s ?
Theoretical
Chapter 2
Chapters 3 and 4
M eth o d o lo g y
i Chapter 3:CC Methodology<L>3re<£+J Chapter 4:—1
Research Design
RQ1
Empirical
" V
Chapter 5
Uncertainty in ETO Systems
RQ2
Chapter 6
PipelineImprovement
Strategies
RQ3
Chapter 7
Supply Chain Flexibility
RQ4
Chapter 8
Evaluation Of The Case Research
UnifiedFrameworkPresented
All RQs
Research Findings
V —
Chapter 9
186

[Chapter 7 - Achieving Flexibility in ETO Construction Supply Chains]
7. INTRODUCTION
The literature review established flexibility as an important strategic capability for
companies and supply chains to achieve. The development of supply chain flexibility is of
particular importance when developing an agile supply chain in uncertain market
conditions. Sanchez and Perez (2005) conducted a survey of 126 Spanish automotive firms
and found a positive relation between a superior performance in flexibility capabilities and
firm performance. Oke (2005) supported this and suggested that flexibility can be a major
competitive weapon, but noted that it is a complex, multidimensional construct. Dreyer and
Gronhaug (2004) argued that it is important to identify the types of flexibility so that can be
matched with uncertainties faced by a supply chain. The importance of identifying
flexibility types and the sources of flexibility has been noted by a number of authors
(Dreyer and Gronhaug, 2004; Koste and Malhotra, 1999; Naim et al., 2006; Slack, 2005).
Early studies of flexibility focused on the value of flexible manufacturing systems,
establishing the importance o f flexibility as a manufacturing capability, and attempting to
define it (Collins and Schmenner, 1993; Gerwin, 1993; Slack, 2005; Upton, 1994). More
recently, the flexibility debate has refocused towards supply chain flexibility, suggesting
that manufacturing is too narrow in its scope and that flexibility must be conceived in the
broader context of the supply chain (Duclos et al., 2003; Pujawan, 2004; Sanchez and Perez,
2005; Swafford et al., 2006; Vickery et al., 1999). However, the supply chain flexibility
field is still at an early stage, and consensus regarding definitions, scope, meaning and
application has not yet been achieved. Hence, this chapter develops and investigates a
conceptual model of supply chain flexibility.
In section 2.13 of the literature review a classification of supply chain literature was
developed, and a model of supply chain flexibility was developed using the classification as
a foundation. The model is reprinted in figure 7.1 to provide a reminder for the reader. It is
investigated via the case studies throughout this chapter.
187

[Chapter 7 - Achieving Flexibility in ETO Construction Supply Chains]
InternalFlexibilities
S u p p ly C h a in F le x ib i l ity
V e n d o rF le x ib i l ity
S o u r c in gF le x ib i lity
Flexibilities
N e w P r o d u c t F le x ib i lity
V o lu m eF le x ib i lity
M ixF le x ib ility
D e liv e r yF le x ib ility
A c c e ssF le x ib ility
External
Figure 7.1: Conceptualisation of supply chain flexibility
This model proposes the antecedents of vendor and sourcing flexibility. Vendor flexibility
was defined as the specific types of flexibility relating to individual vendors that support
manufacturing, warehousing or transport operations. Sourcing flexibility was defined as the
ability to reconfigure a supply chain network through the selection and de-selection of
vendors. This model is investigated within the empirical setting of the two ETO
Construction systems. Figure 7.2 shows that this chapter draws from data collection
activities from all units of analysis studied in the thesis.
This chapter examines how supply chain flexibility can be achieved in the ETO sector,
where high levels of uncertainty arise from project specific demands. The strategic
partnering approach to supply chain management has been promoted by researchers
(Akintoye et al., 2000; Beach et al., 2005; Bresnen and Marshall, 2000; Cox and Thompson,
1997; Ireland, 2004) and UK government reports (Latham, 1994). However, in a sector
dominated by projects, often varying in frequency, scope and scale, strategic partnerships
need to be considered vis-a-vis flexibility requirements. A range of portfolio models have
been proposed in the literature in order to support purchasing decisions and supplier
selection (Cox and Thompson, 1997; Kraljic, 1983), but the role of supply chain flexibility
188

[Chapter 7 - Achieving Flexibility in ETO Construction Supply Chains]
has not been addressed in purchasing.
The chapter begins with a description of the external flexibilities offered by the focal
companies in the pipeline survey, thereby providing a useful exploration of vendor
flexibility within the two ETO systems. A purchasing model for network co-ordinators in
ETO supply chains is then developed, which investigates three different relational
categories between network co-ordinators and suppliers. The following section integrates
supply chain flexibility and the purchasing model, showing how sourcing and vendor
flexibility can be achieved in different relation categories. Finally, the role of supply chain
flexibility in mitigating the project uncertainties identified in chapter 5 is considered.
Conclusions are then summarised.
m y0« u jn
oryN *tw ork C o-ordiriJtoy 1 N e t w o r k C o - o r d i n a l or 1
Figure 7.2: The two ETO systems and the focus of the chapter 7
7.1 METHOD OVERVIEW
This chapter draws from data collected from all three units of analysis. The flow of research
activities for the chapter is shown in figure 7.3. It shows that a model of supply chain
flexibility and a purchasing model are developed iteratively using literature and
observations from the case research. As noted by Eisenhardt (1989), the constructs,
questions, definitions and measurements in case study research often emerge from the
analysis process itself rather than being specified a priori. Emergent relationships between
constructs are also confirmed, revised or discontinued as case study research progresses.
189
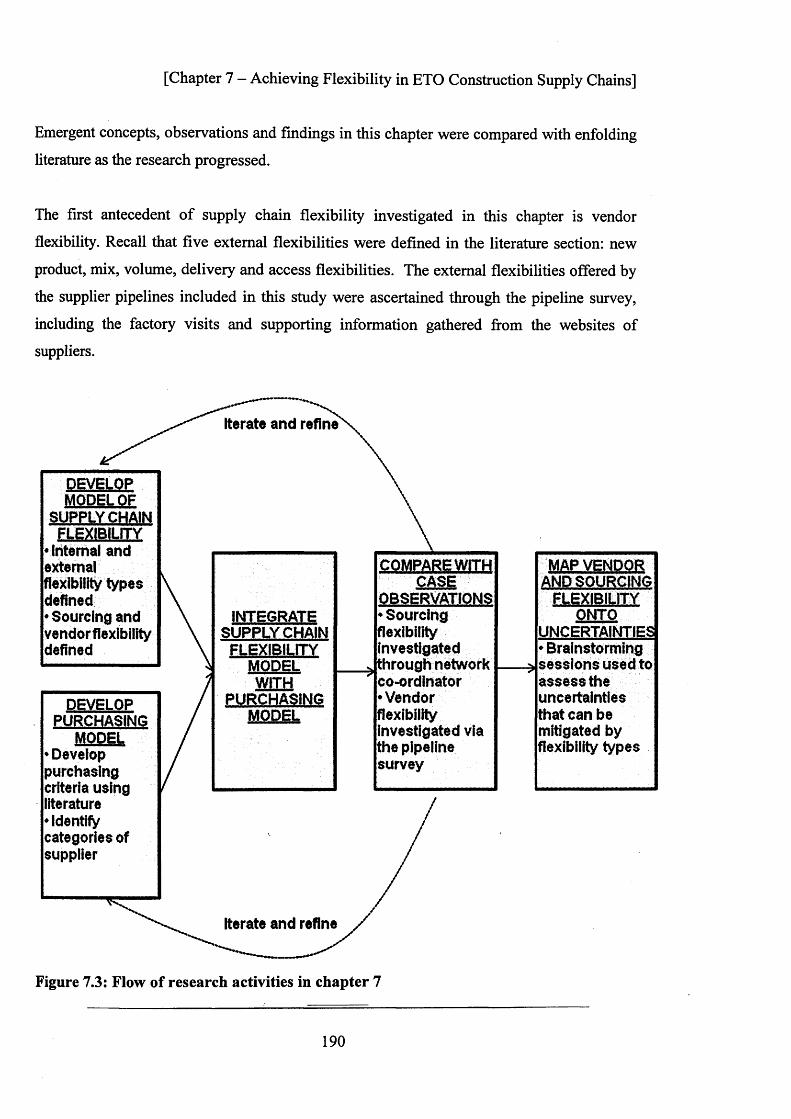
[Chapter 7 - Achieving Flexibility in ETO Construction Supply Chains]
Emergent concepts, observations and findings in this chapter were compared with enfolding
literature as the research progressed.
The first antecedent of supply chain flexibility investigated in this chapter is vendor
flexibility. Recall that five external flexibilities were defined in the literature section: new
product, mix, volume, delivery and access flexibilities. The external flexibilities offered by
the supplier pipelines included in this study were ascertained through the pipeline survey,
including the factory visits and supporting information gathered from the websites of
suppliers.
FLEXIBILITY Internal and
external flexibility types defined
Sourcing and vendorflexibiiity defined
Iterate and refine
DEVELOPMODEL.OF
■aEBEfldftM
DEVELOP PURCHASING
MODEL ♦Develop purchasing criteria using literature ♦ Identify categories of supplier
INTEGRATESUPPLYCHAIN
FLEXIBILITYMODELm m
PURCHASINGMODEL
COMPARE WITH
OBSERVATIONSSourcing
flexibility investigated through network co-ordinator Vendor
flexibility investigated via the pipeline survey
Iterate and refine
MAP VENDOR AND SOURCING
FLEXIBILITY ONTO
UNCERTAINTIES♦Brainstorming sess io n s used to a s s e s s th e uncertainties tha t can be mitigated by flexibility types
Figure 7.3: Flow of research activities in chapter 7
190

[Chapter 7 - Achieving Flexibility in ETO Construction Supply Chains]
A purchasing criterion was then developed from the literature and iteratively compared with
the behaviour of network co-ordinators in the two systems. This was achieved through in
depth interviews with the network co-ordinators regarding purchasing processes and
systems. The industrial secondment facilitated this iterative process. The three categories in
the purchasing model were developed as a result of this iterative process. Supply chain
flexibility antecedents were then integrated with this model and compared with the
behaviour of network co-ordinators. Finally, antecedents of supply chain flexibility were
then mapped onto the 42 uncertainties identified in chapter 2 to establish the role of supply
chain flexibility in mitigating uncertainties. Brainstorming sessions were used to confirm
the accuracy of this mapping exercise.
7.2 VENDOR FLEXIBILITY
Before the issue of sourcing flexibility is investigated, this section will explore the
flexibilities offered by suppliers. In the literature review chapter, vendor flexibility was
defined as the specific types of flexibility relating to individual vendors that support
manufacturing, warehousing or transport operations. This section summarises the external
flexibilities offered in the 12 case pipelines, and provides a foundation for a later
exploration of how vendor and sourcing flexibilities can be combined to achieve different
levels of supply chain flexibility.
7.2.1 Pipeline A - Elevator Manufacturer
New Product Flexibility - Information systems and technology were a big differentiator for
company A. Around 5-10% of business required completely new engineering work. These
projects often involve large scale commercial developments with unique layouts that are
linked via intelligent systems.
Mix Flexibility — The majority of elevators utilised standardized options for customers. A
typical residential elevator, for example, offered a range of finishes, colours, capacities,
dimensions, doors, panels lighting, rails and controls.
Volume Flexibility - Production volumes were forecasted 6-12 months ahead to ensure that
191

[Chapter 7 - Achieving Flexibility in ETO Construction Supply Chains]
capacity can meet demand requirements. The forecasts were based on relationships with
clients, monitoring of construction investment and construction levels in different markets,
and an analysis of which organisations are winning tenders. This type of forecasting is
accurate within +/-10%.
Delivery Flexibility - Delivery, in the case of elevators, also included the task of
installation, which can take up to 4-6 weeks. Due to delays on site, storage for clients was
commonplace and flexible labour installation plans must be revised daily. Key standardized
modules and parts are held locally and centrally to help respond to urgent new installations
or service requirements.
Access Flexibility - With international operations, Company A was able to offer almost
global coverage. Parts are consolidated in mainland Europe, where an in-house logistics
function manages logistics.
7.2.2 Pipeline B - Window Manufacturer
New Product Flexibility - While many windows are produced to order, very few are offered
to the customer on an engineer-to-order agreement with new designs.
Mix Flexibility - Customers were offered a wide range of standard choice for windows,
including a variety of colours, sizes, locking mechanisms, acoustics, ventilation systems,
sills, restrictors and glazing. Finished goods were held for the Swedish market, where the
manufacturing is based, and products for the UK are typically made-to-order.
Volume Flexibility - Different quantity requirements can easily be built onto the planning
system unless it is a very large project, which might increase the lead time.
Delivery Flexibility - In addition to delivery, installation for windows was also offered as a
service by company B. Gangs of labour can install 40-50 windows per week into a building
if required. Logistics was outsourced to a third party who can rush through orders or offer
stockholding either centrally, in northern Europe, or locally, at locations in the UK, if a due
date is too early for a project.
Access Flexibility - A third party logistics provider offered coverage of the UK and most of
Europe.
192

[Chapter 7 - Achieving Flexibility in ETO Construction Supply Chains]
7.2.3 Pipeline C - Pre Cast Concrete Manufacturer
New Product Flexibility — Typically, each order had unique fixing and hole penetration
points. Pre-cast concrete also usually required unique dimensions for different projects,
which are subject to a maximum and minimum. Special requests were considered on a
project by project basis.
Mix flexibility - A range of standard depths for pre-cast concrete were offered which are set
in 5mm increments. Widths and lengths could be cut to order, but a maximum is placed on
both dimensions. Company C also offered design, stock holding and installation services.
Volume flexibility - If the order book was full it was very difficult to increase volume at
short notice as the manufacturing capacity is constrained by concrete pouring space.
Delivery flexibility - When pre-cast concrete is delivered, plant and labour are both required
on arrival to install flooring directly into location on site. In the case of rush orders it was
possible to reduce the manufacturing lead time down to two weeks, but labour and plant
must be available for site installation to make this worthwhile.
Access flexibility - Due to the size and difficulty o f transporting concrete most of the market
was in the south of the UK.
7.2.4 Pipeline D - Roof Truss Manufacturer
New Product Flexibility - Roof trusses were rarely based on completely new designs, but
mix or reuse pre-existing designs for different orders. Designs varied depending on size,
preferred style and construction method. Plating systems, which were used to bind the
timber together, were the main obstacle to new product development. They are usually tied
in with design software, and are only available from a small number of suppliers in the UK.
Mix Flexibility - For the majority of orders, Company D received sizes and designs from
design consultants and then designed the roof trusses within these guidelines. Most of these
drawings were based on existing designs. No installation service were offered.
Volume Flexibility - Very large orders required a one or two week notice period.
Delivery Flexibility - Company D could hold around two weeks worth of stock on site.
Extra stock could be called off on a short lead time unless there are very large volumes.
Access Flexibility - 75% of business was in London or the south of the UK with rest being
193

[Chapter 7 - Achieving Flexibility in ETO Construction Supply Chains]
in the Midlands or the South West o f the UK.
7.2.5 Pipeline E - Metalwork Subcontractor
New Product Flexibility - Company E responded to metalwork design requirements that are
produced by design consultants and either responded with a competitive bid for the work or
rejects the work if it is unsuitable. The company was unable to offer any design support
services.
Mix Flexibility - Small design changes, which were fully specified by drawings, could be
accommodated. A wide range of metalwork products were also offered, including structural
steel, architectural steel, balustrading, handrails, sheet metalwork and metal decking.
Volume Flexibility - Company E operated from a small site in the South East of the UK
with limited space. Volume flexibility was, therefore, limited. The flow o f make-to-order
and buy-to-order products needed careful management to overcome these capacity
constraints.
Delivery Flexibility — Due to the small premises there was limited space to hold stock. Once
items were produced there was little flexibility to hold these in storage in the case of project
delays. Most items, however, could be held on site.
Access Flexibility - Company E targeted the south east of the UK as its primary market.
7.2.6 Pipeline F - Brick and Block Supplier
New Product Flexibility - New designs and technical specifications were difficult and
expensive to implement but Company F was willing to liaise with raw material suppliers,
manufacturers and designers to deliver such requirements.
Mix Flexibility - A standardised list o f brickwork, based on aesthetic, technical
specifications and cost, was offered to customers. Company F acted as an agent among
construction companies, manufacturers and design consultants, to encourage all parties to
agree on a package that will have an overall cost, finish and specification to meet the needs
of all stake-holders.
Volume and Delivery Flexibility - Working stock availability at manufacturing locations
determined the degree of delivery and volume flexibility. For more standardised bricks,
194

[Chapter 7 - Achieving Flexibility in ETO Construction Supply Chains]
Company F was able to search for available product from a range of manufacturers or
stockholders to satisfy late delivery or volume changes.
Access Flexibility — With 24 sites in the UK, Company F offered coverage throughout the
UK.
7.2.7 Pipeline G - Timber Frame System Manufacturer
New Product Flexibility — The timber frame system manufacturer offered the opportunity to
work with clients at every stage of a new project and was willing to enter into new sectors
for application of timber frame technologies. The company offered concept design and
detailed design services, as well as manufacture, delivery and erection. The automated
factory was very flexible, but if this was unable to meet a specification the company had a
bespoke workshop and skilled joiners to manage bespoke requirements. Bespoke joinery,
windows, plasterboard and insulation requirements could also be discussed as part of a
package.
Mix Flexibility - A range of acoustic and thermal performance, specifications and finishes
were offered. Machine settings could easily be changed to cope with size variations.
Automated machinery integrates with design software which automatically programmes
different specifications into the manufacturing system. Orders were relatively large; orders
of 10 homes or less were not taken on, so manufacturing was often batched. The company
also offered wide sector coverage and has experience of building hotels, housing, leisure
centres, student accommodation and care homes.
Volume Flexibility - The total yearly output for the company was approximately 12,000
units. The requirements for a house could be manufactured in 45 minutes.
Delivery Flexibility - A mixture of in-house and outsourced logistics was used to meet
delivery requirements. These were usually staggered across a few weeks at regular intervals
on larger projects. Typically, transport was on a 1 or 2 day lead-time, but delivery
requirements were planned in advance and phased to suit build plans. There is a large stock
yard at the factory, which could be used if a project was delayed.
Access Flexibility - The focal company had 2 major manufacturing sites in the UK, offering
UK wide coverage.
195
[Chapter 7 - Achieving Flexibility in ETO Construction Supply Chains]
7.2.8 Pipeline H — Door M anufacturer
New Product Flexibility — Whereas the company did not offer customers the opportunity to
directly impact the ̂ design process, the company was planning to launch a ‘design your own
door* online facility, which would allow customers to pick from a wide range of
standardised options and visualise the final product online.
Mix Flexibility - Three basic product groups were offered: glass reinforced polyester
(GRP), eco frame and steel doors. Within the GRP group 10 door styles were offered, in a
range of colours, with a choice of glazing including clear, bevelled and patterned. A
selection of hardware and furniture doors options were offered, including letter plates, eye
viewers, security chains and locks.
Volume Flexibility - Batch orders for projects were made-to-order. Capacity was allocated
according to the order book and due dates for project requirements. Some standardised lines
were made to stock and were delivered to retailers in high volumes. The demand for
standard lines was predictable, so spare manufacturing capacity was held for batch project
orders. The total manufacturing capacity was 600 doors per week.
Delivery Flexibility - Deliveries were usually consolidated into economic loads and route
plans. This tended to add a little to the delivery lead time, which had a most likely time
estimate of 7 days.
Access Flexibility - The focal company had 1 major manufacturing site in the UK, which
offered UK wide coverage.
7.2.9 Pipeline I - T im ber Supplier
New Product Flexibility — Timber was treated based on standard designs and processes, but
engineered timber solutions and bespoke designs, as well as more complex assemblies, such
as roof trusses, were offered. A quote was promised in 5 working days. The focal company
was also willing to set up an ‘outsource store’, which could be devoted to a particular
customer or site and thereby act as a consolidation point for a range of products.
Mix Flexibility - A range of different treatments, species of timber and expected service life
options were offered. The company could advise based on customer requirements. Such
advice depended on the exposure of timber to moisture and weather conditions, and if
196

[Chapter 7 - Achieving Flexibility in ETO Construction Supply Chains]
timber would be above or below ground level. Much of the treated timber was held in stock
and could be cut to size at a local store.
Volume Flexibility — The focal company was the largest importer of timber into the UK, so
even very large .orders could be accommodated very easily and quickly. A stock
management system was used to co-ordinate deliveries; bulk deliveries could be delivered
direct from treatment centres and timber mills to site.
Delivery Flexibility - Logistics was managed in-house. The focal company could offer
frequent daily deliveries direct from a local store to a site, or large bulk deliveries could be
offered direct from a treatment centre.
Access Flexibility - The builders’ merchant had over 500 branches across the UK, with 3
main distribution and processing centres.
7.2.10 Pipeline J - Spray and Painting Subcontractor
New Product Flexibility - Approximately 80% of the business was general applications,
with 20% specialist applications. The focal company in this pipeline was able to develop
and discuss specialist effects with clients, such as stone, marbling, graining, colourwash,
antiquing, dragging, sponging and speckling. It was also able to undertake specialist
artwork finishes to large areas of wall to create murals and illusions.
Mix Flexibility - General applications could include airless spraying of very large areas of
walls and ceilings. A large range o f coatings were available, including fire and other
protective coatings.
Volume Flexibility - The focal company was able to accommodate contracts that value from
£5,000 to £5 million. Through a pool of flexible skilled labour and site managers, the
workforce could be enlarged dramatically to suit the needs of a project. The company could
deploy 200 plus operatives on a project if required.
Delivery Flexibility - Flexible deliveries were made possible by a consolidation centre on
the outskirts of the M25. This allowed a ‘milk round’ of deliveries to different sites in the
South East. The company had its own fleet of vehicles for outbound deliveries from the
consolidation centre, but most of the inbound deliveries were made by the large standard
paint manufacturers. Deliveries could be rushed to a certain site if required or, if a project
was delayed, stocks of paint could be held at the consolidation centre.
197

[Chapter 7 - Achieving Flexibility in ETO Construction Supply Chains]
Access Flexibility - The company offered general applications across the South of the UK,
but covered the whole of the UK for specialist applications.
7.2.11 Pipeline K - Modular Bathroom Manufacturer
New Product Flexibility - the focal company had over 20 in-house design technicians that
were able to create new designs, take architectural drawings and convert them into detailed
working drawings. The team could produce 3D modelling to clients to visualise new
designs.
Mix Flexibility - The factory could accommodate timber from rough sawn boards through
to detailed veneering, finishing and assembly. The company used a patented modular
technique, which is an adaptive walling system that could be manufactured to any size due
to flexible interfaces. It could be manipulated to suit site access and forms a base to which a
final face finish could be applied. This was all undertaken offsite so that a delivery of
walling units to site provided a series of modules ready for simple installation by minimal
labour.
Volume Flexibility - Capacity at the time of writing allowed for a minimum of 600 wall
modules per week.
Delivery Flexibility - If the factory was not running at capacity, delivery dates could be
moved forward. There was plenty of storage at the factory if a project was delayed.
Transport was outsourced.
Access Flexibility - The focal company had two large manufacturing facilities in the UK. It
offered UK wide coverage. Approximately 50% of business was in the South East with the
rest of UK accounting for the other 50%.
7.2.12 Pipeline L - Drylining and Safety Systems Subcontractor
New Product Flexibility - Technical designs or drylining systems were largely fixed, and
dominated by very large suppliers such as British Gypsum and Lafarge. The focal
organisation added value by advising clients on the right product to use on a project to
minimize the cost. The company could also work with clients to offer bespoke packages of
fire and safety services to be installed with the drylining.
198
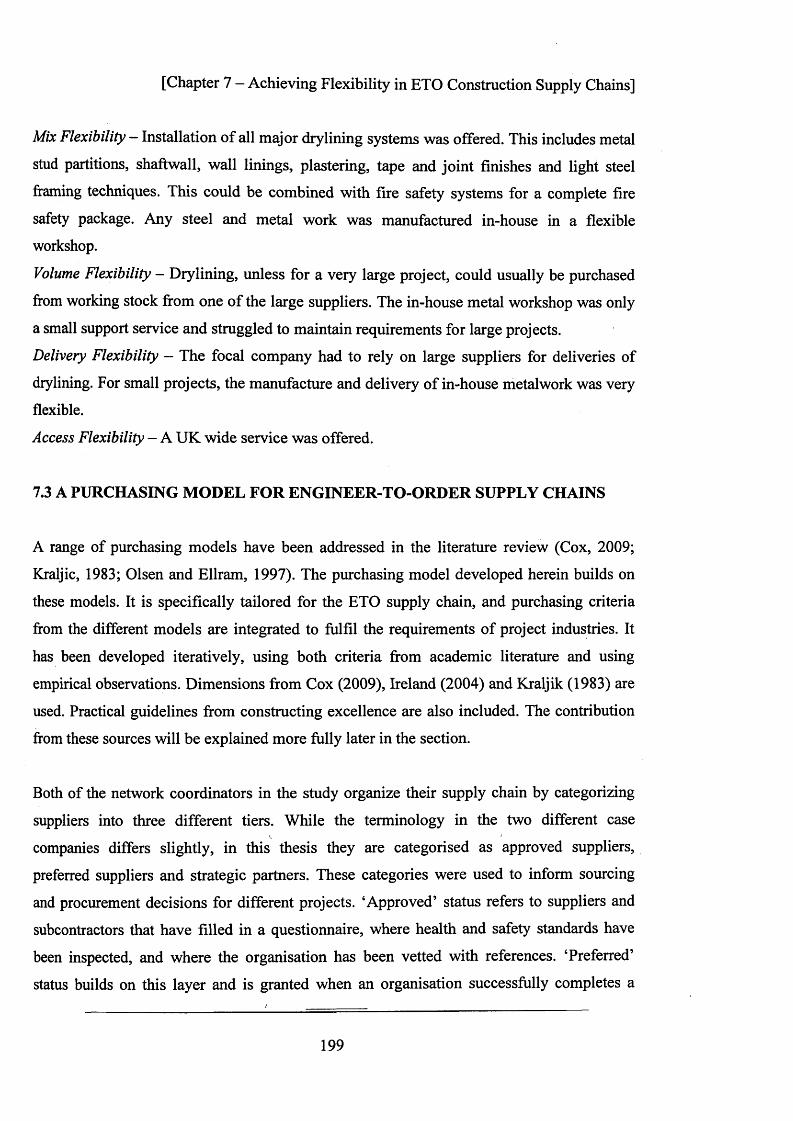
[Chapter 7 - Achieving Flexibility in ETO Construction Supply Chains]
Mix Flexibility — Installation of all major drylining systems was offered. This includes metal
stud partitions, shaftwall, wall linings, plastering, tape and joint finishes and light steel
framing techniques. This could be combined with fire safety systems for a complete fire
safety package. Any steel and metal work was manufactured in-house in a flexible
workshop.
Volume Flexibility - Drylining, unless for a very large project, could usually be purchased
from working stock from one of the large suppliers. The in-house metal workshop was only
a small support service and struggled to maintain requirements for large projects.
Delivery Flexibility - The focal company had to rely on large suppliers for deliveries of
drylining. For small projects, the manufacture and delivery of in-house metalwork was very
flexible.
Access Flexibility — A UK wide service was offered.
7.3 A PURCHASING MODEL FOR ENGINEER-TO-ORDER SUPPLY CHAINS
A range of purchasing models have been addressed in the literature review (Cox, 2009;
Kraljic, 1983; Olsen and Ellram, 1997). The purchasing model developed herein builds on
these models. It is specifically tailored for the ETO supply chain, and purchasing criteria
from the different models are integrated to fulfil the requirements of project industries. It
has been developed iteratively, using both criteria from academic literature and using
empirical observations. Dimensions from Cox (2009), Ireland (2004) and Kraljik (1983) are
used. Practical guidelines from constructing excellence are also included. The contribution
from these sources will be explained more fully later in the section.
Both of the network coordinators in the study organize their supply chain by categorizing
suppliers into three different tiers. While the terminology in the two different case
companies differs slightly, in this thesis they are categorised as approved suppliers,
preferred suppliers and strategic partners. These categories were used to inform sourcing
and procurement decisions for different projects. ‘Approved’ status refers to suppliers and
subcontractors that have filled in a questionnaire, where health and safety standards have
been inspected, and where the organisation has been vetted with references. ‘Preferred’
status builds on this layer and is granted when an organisation successfully completes a
199

[Chapter 7 - Achieving Flexibility in ETO Construction Supply Chains]
number of projects and delivers consistently on KPIs. A ‘strategic partner’ is a formal
recognition of a partnership and includes agreements on tender assistance services, resource
management and availability, environmental performance, collaborative working, training,
and performance measurement and review. Strategic partners help to streamline contractual
arrangements for individual projects, and help suppliers to achieve a more stable demand
pattern.
In System 1, the main contractor held a database of around 750 suppliers and
subcontractors. Seventy of these were recognised as strategic partnerships, 180 were
recognised as preferred contractors and 500 were approved suppliers. In System 2 there
were 30 strategic partners, 90 preferred and 180 approved suppliers. Both case companies
allowed suppliers to progress through the different categories as long as they met the
criteria. KPIs were managed by a supply chain manager and regular reports were produced
examining KPI figures.
This model is developed further by mapping the criteria outlined in the purchasing literature
review onto these different supplier categories. The following dimensions of purchasing are
identified as important for project purchasing in the literature review:
• Criticality - The criticality of the output of a supplier or subcontractor to project
success. Some products or services will have significant implications for cost and
time if they fail (Constructing Excellence, 2003).
• Regularity of demand - the extent to which demand is one off or project specific or
high volume and applies to a number of different projects (Ireland, 2004).
• Spend - This is used to refer to the proportion of total procurement or relative cost
spend that a service, supplier or subcontractor accounts for (Constructing
Excellence, 2003).
• Degree of supplier involvement and development - This refers to the extent to
which the buying organization proactively develops supplier capabilities and
collaborative relationships (Cox, 2009).
• Supply Risk -This refers to the extent of monopoly or oligopoly conditions, entry
barriers, the pace of technological advance and complexity of the products (Kraljic,
1983).
200

[Chapter 7 — Achieving Flexibility in ETO Construction Supply Chains]
Figure 7.4 shows the different categories and the criteria taken from the literature. Strategic
partners should be selected based on a number o f criteria. The product or service should
have a high regularity of demand across different projects rather than a one-off transaction.
The product or service should be critical for the success of different projects and should
account for a high proportion of supply spend. A further rationale for a strategic partner is
high supply risk. There may be few suppliers of a particular product or service on the
marketplace. Finally, the supplier must have an excellent track record of performing on
KPIs. Network co-ordinators consider investing resources to develop suppliers in this
category.
Preferred suppliers should also be categorised according to robust criteria. The demand for
the particular product or service may not be as regular as for the strategic partner category
and may not be as critical for the project success. The product or service would account for
less spend than the previous category. Products may be critical or non critical and may pose
a moderate supply risk. Network co-ordinators invest resources in suppliers in this group
only if they consider them to be progressing towards the strategic partner group. Finally,
approved suppliers are those where the demand for the good or service are low, and perhaps
even for a one-off project or purchase. These would typically be for non-critical products,
which account for a low proportion of spend and pose very little supply risk.
•Network 1 -70 •Network 2- 30 / S tr a te g ic X
/ P a r tn e r s \
•Regular dem and for product•Critical product•High proportion o f spend•Excellent performance record•High supply risk•High level o f supplierdevelopm ent
•Network 1- 180 •Network 2- 90 / P r e fe r r e d \
f S u p p lie r s \
•M oderate dem and for product •Critical or non critical •M oderate proportion o f spend •M oderate supply risk
\ 'M oderate level o f supplier \ developm ent
•Network 1 -500 / •Network 2- 180 / A p p r o v e d
S u p p lie r s
\ • Low dem and for product \ • Critical or non critical
\ »Low proportion o f spend \ *Low supply risk
\ *Low level o f supplier 'developm ent
Figure 7.4: A purchasing model for engineer-to-order supply chains
201

[Chapter 7 - Achieving Flexibility in ETO Construction Supply Chains]
The purchasing model proposed in figure 7.4 has been developed from industry, using case
studies from the two network co-ordinators, and from the purchasing literature, using
pertinent papers to develop robust criteria to map onto the model. Flexibility has not been
investigated in depth as a consideration in purchasing behaviour, and is not considered in
the industry case studies. The next section explores how supply chain flexibility might be
integrated into this purchasing model.
7.4 INTEGRATING SUPPLY CHAIN FLEXIBILITY AND PURCHASING
In the literature review, sourcing flexibility was defined as the ability to reconfigure a
supply chain network through selection and de-selection of vendors. Figure 7.5 shows a
matrix illustrating the proposed supply chain flexibility implications for different supplier
categories. The diagonal line running through the matrix shows three different relationship
categories between buyer and supplier. Along the axis the matrix shows the level of
sourcing and vendor flexibility associated with each relationship type. The supplier
categories propose an ideal fit for achieving flexibility. If the supply chain moves towards
the top left of the matrix, utilising high levels of vendor flexibility and high levels of
sourcing flexibility, then there is an over-compensation for risk and uncertainty. Hence, the
supply chain is burdened with unnecessary cost. If the supply chain moves toward the
bottom right of the matrix, utilising low vendor flexibility and low sourcing flexibility, then
the supply chain may be under-prepared for risk and uncertainty. The remainder of this
section will describe in more detail the relationship of different supplier categories with
supply chain flexibility.
7.4.1 Strategic Partners
Strategic partnerships demonstrate recognition of the benefits of the strategic partnering
approach where strategic suppliers are selected for key elements, or work packages,
delivered by the supply chain. In the network co-ordinator case studies, this category had
the lowest number of suppliers, 70 suppliers in network co-ordinator 1 and 30 in network
co-ordinator 2, compared with the preferred and approved categories, but those suppliers
that achieve the strategic partner status should be well integrated with the buying

[Chapter 7 - Achieving Flexibility in ETO Construction Supply Chains]
organisation and its established supply chain due to their strategic importance.
d£
High
S MediumT3
Low
Over compensating fo r risk and uncertainty
Under compensating for risk and uncertainty
P referredS u p p lie r s
A p p r o v e dS u p p lie r s
S tr a te g icP a rtn e rs
Close
Medium
73c.2 •»—<
Loose
High Medium Low
Sourcing Flexibility
Figure 7.5: Interaction between supply chain flexibility antecedents
In this category there is a high level of vendor flexibility, a level of sourcing flexibility and
close relationships. The aim is to build close relationships by investing in the development
of the supplier in order to achieve high levels of supply chain flexibility through vendor
flexibility, as opposed to sourcing flexibility. The network co-ordinator will need to look
carefully at both the external and internal flexibilities of these strategic partners with the
aim of maximising vendor flexibility in relevant areas of interest. A supplier may be
promoted to this category as a result of its overall flexibility levels or due to specific
flexibility qualities, such as high levels of new product flexibility. Sourcing flexibility will
be lower as a result of a ‘lock-in’ effect, whereby any change in supplier would result in the
loss of investment in the supplier, so transaction costs associated with changing supplier
will be higher.
203

[Chapter 7 - Achieving Flexibility in ETO Construction Supply Chains]
Table 7.1 shows the different suppliers in the study and the purchasing category in which
they are grouped. It shows that in system 1 the focal companies in pipelines A, where the
focal company is a lift manufacturer, and G, where the focal company is a door
manufacturer, are strategic partners. The lift is a critical project input for the majority of
projects that the case company completes and represents a key expenditure. The lift
manufacturer invests heavily in new technology development and modular design principles
for its products. New product flexibility and mix flexibility are, as a result, relatively high.
The product range is also wide as they can offer residential as well as commercial elevators
of different sizes and specification to suit the network co-ordinator’s requirements. In
pipeline G, the timber frame systems manufacturer offers a high level of mix flexibility at
low cost. The company can also support design and tender documents, helping the network
co-ordinator to bid for new projects.
In system 2, the focal companies in pipelines J (paint), K (modular bathrooms) and L
(drylining) were all strategic partners. In addition to a record of delivering on all KPIs on all
previous projects and providing a high volume service across numerous projects for the
network co-ordinator, the spray painting subcontractor had a very high level of volume
flexibility. As previously noted, through a pool of flexible skilled labour and site managers
the workforce could be enlarged dramatically to suit the needs of a project. The focal
company in pipeline K was responsible for all high specification commercial toilets and
bathrooms for the network co-ordinator. There was regular demand for the product from
project to project, and the company delivered excellent results on all KPIs. The company
offered a high level of mix flexibility and new product flexibility at a low cost achieved
through modular offsite manufacturing techniques. The drylining and safety systems
subcontractor in case L, offered a high level of mix flexibility in terms of drylining systems
coupled with a flexible metal workshop. It was also able to offer specialist expertise in
safety systems and has established supply chain relationships with relevant suppliers.
Overall, suppliers in this group tended to offer complex work packages and assume
responsibility for a defined area of a project. High levels of new product flexibility, mix
flexibility and volume flexibility appear to be important external flexibilities for this group
of suppliers. These capabilities also help suppliers contribute to bid and tender support for
204

F[Chapter 7 - Achieving Flexibility in ETO Construction Supply Chains]
network co-ordinators.
Supplier System Product Supplier CategoryA 1 Elevators Strategic PartnerB 1 Windows PreferredC 1 Pre-cast concrete PreferredD 1 Roof Trusses PreferredE 1 Metalwork ApprovedF 1 Brickwork ApprovedG 1 Timber frame systems Strategic PartnerH 1 Doors PreferredI 1 Timber ApprovedJ 2 Paint Strategic PartnerK 2 Modular bathrooms Strategic PartnerL 2 Drylining Strategic Partner
Table 7.1: Sum m ary o f p ipeline su ppliers and the p urchasing categories
Strategic suppliers in system 2 were developed through formal training courses run by
network co-ordinator 2. This included a passport programme, which included a number of
training modules that are targeted at managers within key suppliers. The training
programmes ensure that management within suppliers are conversant with leading best
practice in project management, processes and procedures. A ‘passport" is achieved by
attending a series of these training modules. Suppliers keep track of their progress with a
stamp card showing the different courses which have been completed. These suppliers are
given early visibility of projects in the pipeline, more consistent workflow and become
more involved in tender development. They would be used for the core activities that are
consistently demanded across different construction projects, such as mechanical and
electrical work packages. Unique or less common requirements for different projects might
then be procured from approved or preferred suppliers. The whole supply chain is
reconfigured from the three different tiers according to the needs of each project.
7.4.2 Preferred Suppliers
In the preferred supplier category the range of suppliers is higher than the strategic partner
category, 180 in the case of network co-ordinator 1 and 90 in network co-ordinator 2, but
205

[Chapter 7 - Achieving Flexibility in ETO Construction Supply Chains]
processes will not be integrated to the same degree as the previous category of supplier. The
approach in this category is to balance a moderate am ount of vendor flexibility with a
moderate level of sourcing flexibility. The network co-ordinator may only wish to look at
the external flexibilities offered by such vendors, bu t if a particular supplier is moving
towards a position whereby it may be considered as a strategic partner the network co
ordinator may also wish to take an interest in internal flexibilities. Many practical details
will have already been completed, such as health and safety records checked and financial
and key contact data stored in a database, so the transaction costs associated with contacting
and contracting a supplier will be reduced. Switching costs are lower than the strategic
partner category as there will be less o f the ‘lock-in5 effect. This should accelerate
integration into a project supply chain.
In system 1, the focal companies in pipelines B, C, D and H were preferred suppliers. In
pipeline B, there was a consistent demand for widows across projects and they were
purchased at a moderate volume. However, there w ere many different suppliers of
windows, and, while the company has performed reasonably well in terms of KPIs, the
record was not yet sufficient for promotion to the strategic partner category. There is a
moderate amount of demand for pre cast concrete (C). N ot a ll projects managed by network
co-ordinator 1 used pre-cast concrete as a construction method, so the supplier was not
required for every project. In the case of H, the demand for doors is regular, but the product
is relatively standard, and there are a lot of other suppliers offering similar products.
Overall, suppliers in this category are used relatively frequently for different projects that
require their products and services. However, vendor flexibility levels, and other key
determinants of supplier selection, are not sufficient to w arrant a promotion to strategic
partner.
7.4.3 Approved Suppliers
Approved suppliers represent the biggest group of suppliers used by both network co
ordinators: 500 suppliers in the case of network co-ordinator 1 and 180 for network co
ordinator 2. The approach here is to develop a high level o f sourcing flexibility. There is
little lock-in effect and a premium is placed on the ability o f the network co-ordinator to
206
,1

[Chapter 7 - Achieving Flexibility in ETO Construction Supply Chains]
reconfigure the supply chain with little penalty in time or cost. In contrast to strategic
partners, the network co-ordinator may only wish to look at the external flexibilities offered
by such vendors, and the vendor flexibility level requirements may be low. Relationships
are loose with little investment by the network co-ordinator in developing the supplier or
integrating processes. Sourcing through this category of supplier has much in common with
arms length spot trading where a network co-ordinator may put a package of work out to
tender among a number o f approved suppliers.
The focal companies in cases E, F and I fall under this category. Bricks and timber are both
standard products with many potential suppliers in the marketplace. In most cases these are
‘supply’ only contracts with little value adding services other than the supply of standard
materials. While demand is consistent for both of these product groups, and delivery
flexibility is relatively high as products are purchased from stock, there is a very low supply
risk and the complexity o f the offering is low. The metalwork supplier in pipeline E had no
in-house design capability and, therefore, could offer very little new product flexibility.
Volume flexibility is also limited as the company is a small - medium enterprise (SME)
with a very small site. Overall, suppliers in this group tended towards standard goods on a
supply only basis. Delivery flexibility appeared to be the external flexibility that network
co-ordinators most require from this category.
7.4.4 The integration of supply chain flexibility and purchasing
Figure 7.6 summarises the integration of supply chain flexibility and purchasing
dimensions. It shows the original criteria of the purchasing model, the supply chain
flexibility implications with reference to vendor and sourcing flexibility and the supplier
development requirements in the three different categories.
An important conclusion to be drawn from this table is that there are different ways of
achieving flexibility. High levels of vendor flexibility can be developed with strategic
partners and high levels of sourcing flexibility can be developed by switching between
approved or preferred suppliers. The intermediate category, preferred suppliers, offers
moderate levels of both flexibility types. As a result, the network co-ordinator should focus
207

[Chapter 7 — Achieving Flexibility in ETO Construction Supply Chains]
on developing the internal flexibility of strategic partners, while minimising transaction
costs in switching between approved suppliers. Furthermore, a network co-ordinator can
maintain a suitable level of supply chain flexibility by maintaining a pool of suppliers in
each category.
SupplierGroup Criteria Supply Chain Flexibility
Implications Developing Supplier Flexibilities
StrategicPartners •Regular demand for product
•Critical product •High proportion of spend •Excellent performance record •High supply risk•High level of supplier development
• High vendor flexibility• Low sourcing flexibility •External and internal
flexibilities
PreferredSuppliers
•Moderate demand for product •Critical or non critical •Moderate proportion of spend •Moderate supply risk •Moderate level of supplier development
• Moderate vendor flexibility• Moderate sourcing flexibility
•External and internal if supplier will ‘progress’
ApprovedSuppliers
•Low demand for product •Critical or non critical •Low proportion of spend •Low supply risk•Low level of supplier development
• Low vendor flexibility• High sourcing flexibility •External flexibilities only
Figure 7.6: Integration o f supply chain flex ib ility and the purchasing m odel
7.5 THE ROLE OF SUPPLY CHAIN FLEXIBILITY IN MITIGATING PROJECT
UNCERTAINTIES
Table 7.2 shows the generic uncertainties for the projects in the study categorized according
to the supply chain uncertainty source. Vendor and sourcing flexibilities have been mapped
onto this table of uncertainties to indicate the role they can play in mitigating or responding
to different uncertainties. Those that are not marked are areas where supply chain flexibility
would not be effective in mitigating the uncertainty and are outside the ability of the supply
network to respond.
Two of the demand uncertainties can be managed by supply chain flexibility. Late changes
by the client can be mitigated through vendor flexibility. On a sustainable housing project in
System 1 the client changed the specification of the grain-effect coating of the doors during

[Chapter 7 — Achieving Flexibility in ETO Construction Supply Chains]
the construction phase o f the project. The door supplier was able to respond to the new
requirements, source the required materials and scale up production to meet the new
requirements to ensure there were no delays on the project. Technological uncertainty can
also be supported by supply chain flexibility. For example, an elevator manufacturer in
System 1 invested much into research and development and has the expertise to support
network main contractors in bidding for projects that require complex technological
solutions in their area. Alternatively, the main contractor may search through preferred or
approved contractors for specialists in the required area.
A number of process uncertainties can also be mitigated. Uncertainty over the availability of
equipment can be mitigated by allowing a supplier to take ownership of the delivery of a
‘package’ of work. A manufacturer o f pre-cast concrete in System 1 managed the design,
manufacture, delivery and installation (including plant and equipment) of pre-cast concrete.
Similarly, uncertainty over labour can be supported by vendors with high levels of labour
flexibility. On a commercial tower project visited in System 2, a painting contractor
regularly recruited extra gangs of labour to meet the progress requirements of the project. If
the speed of construction and volatility of workflow is unpredictable, this can also be
mitigated with high levels of vendor flexibility.
Supply chain flexibility can be used to mitigate five of the control uncertainties. Sourcing
flexibility will contribute to the competency of the team as the network co-ordinator with
high sourcing flexibility has the ability to reconfigure the supply chain to get the right team
for a particular project. This includes a mixture of strategic partners, preferred suppliers and
approved suppliers, and also includes the ability of the network co-ordinator to encourage
shared objectives and effective contractual arrangements. A high level of vendor flexibility
will help to respond to any changes in project milestones. High levels of both vendor and
sourcing flexibility will help to Overcome activities that are not accounted for in the
planning-process.

| [Chapter 7 - Achieving Flexibility in ETO Construction Supply Chains]i
f Uncertainty Supply Chain Uncertainty Type
Vendor Sourcing
Timely/correct information from clients Control 0 0Timely/correct information from consultants Control 0 0Fragmented decision making Control 0 0Permissions from regulators Control 0 0Effectiveness of contractual arrangements Control 0 1Shared objectives Control 0 1Competency of project team Control 1 1Achieving project milestones Control 1 1Things not accounted for in planning Control 1 1Client non payment Demand 0 0Appropriate or effective design for scheme Demand 0 0Late changes in specification Demand 1 1Drawing approvals Demand 0 0New technology or technique Demand 1 1Scheme viability long term Demand 0 0Design too rigid to accommodate change Demand 0 0Construction market conditions External 1 1Weather External 1 0Geology/site characteristics External 1 0Final cost Process 1 , 1Desired equipment unavailable Process 1 1Accuracy of project plan Process 1 1Quality/Excessive snagging Process 0 0Labour resources Process 1 1Competency of site management Process 0 0Deliveries unable to access site Process 0 0Delivery bottlenecks Process 0 0Amount of storage space available Process 0 0Amount of work space available Process 0 0Site impact on local community Process 0 0Speed of construction Process 1 0Volatility of workflow Process 1 0Safety hazards Process 0 0Security Process 0 0Damages Process 0 0Timely and correct information from suppliers Supply 1 0Early or late deliveries Supply 1 1Subcontractor bankruptcy Supply 1 1Bad performance from suppliers Supply 0 1Capacity of subcontractors Supply 1 1Consistency of suppliers Supply 1 1Responsiveness of suppliers Supply 1 1Total 20 18
| Table 7.2: U ncertainties th a t can be m itigated w ith su p p ly chain flexibility
210

[Chapter 7 - Achieving Flexibility in ETO Construction Supply Chains]
r ■; 5 '
Supply chain flexibility can also play a role in responding to external uncertainties. In times• t •of changing market conditions the ability to reconfigure suppliers may help to support
fhovement into new markets. The network co-ordinator in System 2 decided to begin
bidding for nuclear power projects to counterbalance the downturn in the commercial office
sector and used the skills of the suppliers to support this. Suppliers with high level of
Vendor flexibility allow projects to react to unforeseen geological features and excessive
bad weather.I; ;
^endor and sourcing flexibility play a comprehensive role in responding to all 7 supply
uncertainties. Suppliers with high levels of delivery flexibility are able to respond to due
Hate changes quickly, hence reducing uncertainty related to early or late deliveries. A hight*;hlevel of sourcing flexibility mitigates the risks associated with subcontractor bankruptcy. In
I commercial tower project in system 2 a fagade supplier went bankrupt during the
Construction phase and the network co-ordinator quickly integrated a new supplier into the
supply chain. The uncertainty relating to the capacity of subcontractors and responsiveness
bf suppliers is characteristic of low vendor flexibility. This can be addressed by developing
suppliers or by leveraging the capacity of a number of different suppliers. CommunicationsIflexibility of suppliers and the network co-ordinator facilitates timely and correct
information exchange. The network co-ordinator in system 2 had a web based information
management system which suppliers could log into to get up-to-date information for
different aspects of projects they are involved with.
17.6 DISCUSSION AND STATEMENT OF CONTIBUTIONf?
The literature relating to flexibility has recognized the need to adopt a supply chain
perspective, rather than the restricted scope of manufacturing flexibility (Duclos et al.,
^003; Pujawan, 2004; Sanchez and Perez, 2005; Swafford et al., 2006; Vickery et al., 1999).
however, the supply chain flexibility field is still at an early stage, and consensus regarding
definitions, scope, meaning and application has not yet been achieved. This thesis has
Helped to address this by providing a classification of the supply chain literature (see table
211

[Chapter 7 — Achieving Flexibility in ETO Construction Supply Chains]
*2.11 in the literature review) and a conceptual model for supply chain flexibility (see figure
7.1 at the start of this chapter). It also offers an empirical investigation of supply chain
flexibility in the construction industry in this chapter, something that is lacking in the
[ literature on supply chain flexibility.
I Furthermore, in a sector dominated by projects, often varying in frequency, scope and scale,
.strategic partnerships need to be considered vis-a-vis flexibility requirements. The role of
| supply chain flexibility has not been addressed in purchasing. A purchasing model for
network co-ordinators in ETO construction supply chains was developed, which
investigates three different relational categories between network co-ordinators and
suppliers.
The importance and contribution o f this chapter is
While the importance offlexib ility has been acknowledged, much o f the research relating to
|flexibility has addressed non ETO manufacturing. There is a recognition that the scope
Heeds to be widened to consider the flexib ility o f the whole supply chain, but the literature
in this area is at a very early stage o f development. Flexibility has also not been
investigated empirically in the ETO construction sector. This chapter develops a model o f
supply chain flexibility, identifying the sources o f flexibility as ‘vendor’ and ‘sourcing’
\ flexibility. It also provides, an empirical investigation in the two ETO construction supply
chains, showing that flexibility may be achieved by integrating these two sources o f
\ flexibility with a three-tiered purchasing model. The chapter supports the claim that
[flexibility is an important strategic capability, and increases researchers and practitioners
understanding o f flexibility.
7.7 CONCLUSION
;This chapter has specifically addressed the research question ‘How can flexibility be
rationalised in ETO construction supply chains’? Supply chain flexibility has been
Nationalised for the ETO sector, proposing the antecedents of vendor flexibility and sourcing
fflexibility. A purchasing model was developed using case study data collected from two
212

[Chapter 7 - Achieving Flexibility in ETO Construction Supply Chains]
network co-ordinators in the construction industry and purchasing criteria outlined in the
purchasing literature. Three categories of supplier were investigated: approved suppliers,
preferred suppliers and strategic partners. Vendor and sourcing flexibility were integrated
with the purchasing model, developing the argument that different categories of supplier
have different implications for supply chain flexibility. The final section explored the role
of supply chain flexibility in mitigating uncertainties experienced in five different
construction projects. Vendor and sourcing flexibility were mapped onto the generic
uncertainty profile developed in chapter 5 to ascertain which uncertainties could be
mitigated by supply chain flexibility.
Network co-ordinators operating in project environments can achieve supply chain
flexibility by balancing vendor flexibility and sourcing flexibility through three different
categories of supplier: strategic partners, preferred suppliers and approved suppliers.
Strategic partners are associated with high levels of vendor flexibility and approved
suppliers are associated with high levels of sourcing flexibility. Preferred suppliers are an
intermediate category offering moderate levels of vendor and sourcing flexibility. A
network co-ordinator can maintain a healthy balance of supply chain flexibility by
maintaining a pool of suppliers in each category.
The findings show that supply chain flexibility can mitigate 23 of the project uncertainties
identified in ETO projects. These include uncertainties from all of the different sources of
supply chain uncertainty. More specifically, it suggests that five control uncertainties, two
demand uncertainties, three external uncertainties, six process uncertainties and seven
supply uncertainties can be alleviated with different facets of supply chain flexibility. This
chapter makes a case for supply chain flexibility to be integrated with mainstream
purchasing models.
213

[Chapter 7 - Achieving Flexibility in ETO Construction Supply Chains]
SUMMARY OF Cfcl.APTEB.9AlM?1. Present the findings from the evaluation interviews
- The findings from the evaluation interviews for each research question have been discussed in turn
2. Evaluate the findings for each research question using findings from the evaluation interviews
-T he findings from the evaluation interviews for each research question have been integrated with the fin dings from the case study phase
3. Presents framework for achieving flexibility in supply chains-A four step framework has been presented including identify supply chain structure,
identify sources of uncertainty, optimise pipelines and configure network with required flexibility
4. Evaluate the strengths, weaknesses, opportunities and threats related to the research
-A SWOT analysis has been presented and discussed5. Discuss the contribution of the evaluation interviews in to validity concerns
-T he contribution of the evaluation to the overall validity of the thesis has been discussed. In particular, the contribution of the evaluation interviews to generalisability claims have been addressed.
214

[Chapter 8 - Evaluation of Case Research]
C H A P T E R 8
E V A L U A T IO N O F T H E CA SE R E S E A R C H
CHAPTER 8 AIMS1. P re se n t th e findings from the evaluation interviews2. Evaluate the findings for each research question using findings from the
evaluation interviews3. P re sen t a framework for achieving flexibility in supply chains4. Evaluate the s treng ths , w eak n esses , opportunities and threats related to the
research5. D iscuss the contribution of the evaluation interviews in to validity concerns
RESEARCH QUESTION ADDRES S ED All research questions are ad d re s se d in this chap ter
Theoretical Empirical Research Findings
Chapter 2
RQ1
Chapters 3 and 4
M eth od ology
Chapter 3: Methodology
Chapter 4: Research Design
Chapter 5
Uncertainty in ETO Systems
RQ2
Chapter 6
PipelineImprovement
Strategies
RQ3
Chapter 7
Supply Chain Flexibility
RQ4
Chapter 8
Evaluation Of The Case Research
UnifiedFrameworkPresented
All RQs
Chapter 9
215

[Chapter 8 - Evaluation of Case Research]
8. INTRODUCTION
This chapter provides an assessment of the results and findings from the case study phase of
the research. The case study phase of the research has provided rich and detailed data for
each of the research questions. However, although the cases were selected purposely, with
depth and breadth achieved through embedded units of analysis, the extent of the
applicability of these findings across ETO construction sectors is unclear from the case
findings alone. Through 6 evaluation interviews conducted with interviewees outside of the
two case systems, this chapter provides some indication of the generalisability of the
findings of the study to other settings. It also enriches the answers to the research questions
generated from the case study phase. This phase of the thesis is indicated by the shaded area
in figure 8.1., and it shows that the evaluation interviews were conducted in the final year of
the research.
Evaluationin te i v i ew s
Eiigi»eer4o-order system 1
C o - o r tS r 3 Projects 9 Suppliers
E ngineef-to-order system 2
Coordinator 2 Projects 3 Suppliers
Yearl I Year 2 I Year 3 Year 4I S ’
Figure 8.1: Timeline of research activities and the focus of this chapter
The chapter begins with an overview of the evaluation interviews. This is followed by a
detailed discussion of each research question. The findings from the case study phase of the
research are summarised, and the feedback from the evaluation interviews is then integrated
with these findings. Using the feedback from the evaluation interviews a SWOT (strengths,
weaknesses, opportunities and threats) analysis is conducted. The chapter finishes with an
appraisal of the validity of the research and its generalisability. Conclusions are then drawn.
It is important to note that the focus of this chapter is to assess the findings from a
216

[Chapter 8 - Evaluation of Case Research]
practitioner perspective. The academic contributions are discussed more fully in the final
chapter.
8.1 METHOD OVERVIEW
As described in the methodology chapter, evaluation interviews were conducted with a
purposely selected range of interviewees from different organisation types and different
ETO sectors. The author presented the findings of the case study phase of the research,
which was structured using the 4 different research questions. Each interview lasted around
2 hours. The aims of this activity were as follows:
1. Assess the accuracy, completeness, value, fairness and perceived validity of the
findings by external review;
2. Evaluate the extent to which the findings can be generalised to different ETO
sectors;
3. Evaluate the strengths, weaknesses, opportunities and threats associated with the
research;
4. Enhance and enrich findings with evaluative empirical data;
5. Identify avenues for further research.
Six evaluation interviews were conducted. The types of organisations, the position of the
interviewee and the sector associated with each interviewee are shown in table 8.1. In this
chapter the findings from the evaluation interviews are discussed alongside findings from
the case study phase of the research.
217

[Chapter 8 - Evaluation of Case Research]
Interview Type of Organisation
Position of Interviewee
Sector
1 Architect Architect Residential and Commercial Projects
2 3rd Party Logistics Provider
Business Unit Manager
Range of sectors including building materials
3 Non departmental public body
Lead Technologist Range of construction and manufacturing sectors
4 Civil engineering contractor
OperationsManager
Civil Engineering
5 Governmentdepartment
ProcurementManager
Range of public sector construction projects
6 Governmentdepartment
Contracts Manager Public sector civil engineering projects
Table 8.1: Overview of evaluation interviews
8.2 INTEGRATING TH E CASE STUDY FINDINGS W ITH THE EVALUATION
INTERVIEW FINDINGS
The remainder of the chapter will address the individual research questions posed in this
thesis.
8.2.1 Research Question 1: How does construction fit within a taxonomy of supply
chain structures?
By undertaking a structured literature review of the ETO supply chain, and by grounding
the empirical construction focused phases of the research in the ETO literature, this thesis
has argued that construction is a particular form of ETO supply chain. The evaluation
interviews looked to develop this argument by presenting the taxonomy of supply chain
structures to interviewees and probing the likeness of the ETO supply chain with different
structures.
During the literature review, a taxonomy of six supply chain structures, including the
engineer-to-order (ETO), buy-to-order (BTO), make-to-order (MTO), assemble-to-order
(ATO), make-to-stock (MTS) and ship-to-stock (STS) supply chain was proposed. A review
of the literature relating to supply chain structures led to the development of different
218

[Chapter 8 - Evaluation of Case Research]
attributes for the ETO supply chain. The decoupling point is based at the design stage and
the sources of supply are identified to order. The organisation carries no stocks and a new
design is produced for each order. Production methods include project and job shop where
forecasting accuracy is very low. Levels of customisation are higher than in all other
structures and volume and time to market are lower than all other structures.
The structured literature review founds that the ETO supply chain operates in a project
environment and that each product is different to the last. Production dimensions of the
supply chain are completely customised and the decoupling point is located at the design
stage. However, existing designs maybe modified to order or completely new designs are
developed to order. There may also be sector specific differences. For example, each
construction project has to be completed on a new site, whereas shipbuilding may take place
at a fixed location.
In this thesis, the ETO supply chain has also been rationalised as a system, consisting of
network co-ordinators, who assume responsibility for configuring the network of suppliers,
subcontractors and interdependent organizations. These organisations work together to
deliver the specific projects that the network co-ordinator organisation is currently involved
with. A range of supplier pipelines are required for order fulfilment, this includes the
activities that take place between generating an order and the receipt of that order into the
project.
A summary of the feedback regarding this research question by each of the interviewees is
shown in table 8.2. Interviewees were all able to relate their working environment to supply
chain structures and the ETO supply chain, with the decoupling point located at the design
stage. However, as pointed out succinctly by interviewees 2 and 3, it is likely that there are
decoupling points within the design phase of the ETO supply chain, and that varying levels
of standardisation in the design stage are employed across different ETO sectors. This
agrees with the structured literature review, which concluded that there are varying levels of
design re-use across ETO sectors. All interviewees recognised the units of analysis and their
interaction as a valid description of the ETO system. Interviewees 5 and 6 pointed out
though that there are many more stakeholders that impact on the system in public
219

[Chapter 8 - Evaluation of Case Research]
construction projects and that there is a blurry line between the client and the network co
ordinator in public procurement. Interviewees 4 highlights that there are there are subtle
differences between different ETO construction sectors. In civil engineering projects the site
itself is likely to be a lot larger, increasing the risk of groundwork uncertainties.
Interview How does construction fit within a taxonomy of supply chainstructures?
1 No Comment2 • Many construction sectors fit into the ETO category, but there may
be different degrees of standardisation in terms of the designs.• The system conceptualisation does not address the role of a logistics
company in the ETO supply chain.3 • The supply chain structures diagram is an accurate and useful
framework for thinking about different supply chains.• Within the ETO sector there are varying levels of design
standardisation. Perhaps there are a range of decoupling points within the design stage.
4 • Civil engineering projects are arguably more bespoke and customised than house-building or commercial projects.
• The design aspect o f the ETO project places considerable uncertainty and complexity into the system.
5 • Sometimes the role of the client and the network co-ordinator can become blurred in ETO supply chains.
6 • Public procurement projects have a great many stakeholders that have to be considered outside of the defined ‘system’.
Table 8.2: Summary of feedback from the evaluation interviews for research question 1
8.2.2 Research Question 2: How can the sources of project uncertainty in ETO
construction supply chains be identified and categorised?
In chapter 5, a five stage method was presented, which included the following steps:
identify uncertainties, create uncertainty profiles, categorize uncertainties according to
supply chain uncertainty source and originator, model interactions between uncertainties
and use positioning matrix to identify severity. The empirical investigation reported
demonstrates how the framework may be applied to a group of projects. The method may be
applied at the level o f an individual project, or for selected groups of projects either within
or between different companies.
220

[Chapter 8 - Evaluation of Case Research]
For the group o f construction projects that the method was applied to, 42 uncertainties were
identified comprising o f 9 control uncertainties, 7 demand, 3 external, 16 process and 7
supply uncertainties. A cause and effect diagram was developed to explore further the
causes and relationships between different uncertainties. This identifies the causes of
control, demand, process and supply uncertainties. The causes of control uncertainties were
found to be ineffective contractual arrangements, poor supply chain management and poor
planning and project management. The root causes o f process uncertainties were found to
be inadequate resources, poor site logistics and poor site management. The causes of supply
uncertainty were found to be supplier financial failure, inadequate supplier capabilities,
poor visibility o f site progress, orders not placed in time and late changes to orders. Finally,
demand uncertainties were found to be caused by inadequate or inappropriate designs,
delays approving designs, financial problems and market changes. The uncertainties were
then plotted on a graph to show the likelihood o f a negative impact occurring and the
potential impact.
The supply chain uncertainty model used to categorise the uncertainties received positive
comments from all interviewees. It was perceived as useful as it broadens the debate about
risk and uncertainty to the wider supply chain. A summary of the feedback from each of the
interviewees regarding this research question by is shown in table 8.3. All interviewees
confirmed that the 42 uncertainties identified were recognisable to those working in the
ETO construction sector. None o f these uncertainties were disputed, but further
uncertainties were identified. Interviewee 5 argued that in public procurement projects there
is the additional uncertainty o f a change o f government, a change in budget or change in the
focus of policy. A further root cause was also highlighted as ‘disruption to the project
team’.
Interviewees 1 and 3 both suggested that while contractual issues are mentioned in the 42
uncertainties, and in the cause and effect analysis conducted, the contract type had profound
implications for the management and allocation o f risk and uncertainty, and is not addressed
from the client perspective. Interviewee 5 proposed ‘project related insurance’ as a solution
to risk and uncertainty allocation. This technique uses a common insurance policy for a
221

[Chapter 8 - Evaluation of Case Research]
project, forcing different members of a supply chain to share risk and uncertainty while still
having contractual relationships.
Interview How can the sources of project uncertainty in ETO construction supply chains be identified and categorised?
1 • The supply chain uncertainty circle is useful as it forces you to think about the broader sources of risk and uncertainty.
• The supply chain uncertainty model misses the importance of contract type. This will affect the way in which risk and uncertainty is managed and allocated.
2 • The ETO sector needs to be forced to think more carefully about risk, uncertainty and reward. It is not currently adequately pricing risk into operations.
3 • Does not address the way that different procurement routes influence uncertainty, such as design and build vs public private partnerships.
• The impact of uncertainties is not limited to time and cost. It can also impact on quality and environmental performance. Companies are increasingly being asked to show their quality and sustainability credentials.
4 No Comment5 • Public sector procurement has a different demand uncertainty
profile. A change in government, a policy change or budget implications all affect operations.
6 • Excessive bad weather is a particular problem in civil engineering projects as much of the work is undertaken across large areas of land involving digging up earth.
Table 8.3: Summary of feedback from the evaluation interviews for research question 2
While the uncertainties were undisputed, the relative importance of different uncertainties
was disputed. For example, in civil engineering the weather was identified as one of the
highest impact with the highest likelihood of occurring. Interviewee 6 proposed that the
weather had a high impact on civil engineering projects as the construction work is spread
over large areas of land. This makes it unfeasible to take the measures to reduce the impact
of weather that are possible in, for example, housebuilding. Interviewee 3 pointed out that,
in addition to cost and time, uncertainty can also be viewed in terms of negative impact on
quality and sustainability. Uncertainties, therefore, have different levels of importance in
different ETO construction sectors, and they also have a greater impact than merely on time
and cost.
222

[Chapter 8 - Evaluation of Case Research]
As previously mentioned, the five stage method represents the main contribution from this
element of the research. The method has been investigated during the case phase of the
research using a group o f five projects. This shows how the method may be applied, but it is
worth noting that the results for each application m ay differ.
8.2.3 Research Question 3: How can organisations improve pipelines in ETO
construction supply chains?
The literature review highlighted the importance o f understanding and improving the
pipeline. The first step in improving supplier p ipelines is to gain a greater understanding of
pipeline activities. The generic activities in the ETO construction pipeline can be defined as:
an initial enquiry, design and approval of a product, procurement of the relevant materials,
manufacture and assembly, transport to the site and then final integration of the product
with the site. Of these activities, the design stage is the most variable and time consuming
activity in the pipeline with an average variability o f 70 days for the pipelines involved in
this study. The results also indicate that as the lead tim e increases it gets more variable. The
scope of responsibility differs between focal companies. Some companies will take on
responsibility for all pipeline activities and include a full work package; others take on only
selected responsibilities.
The problems that companies experience in the pipeline were investigated in the pipeline
survey. Ten generic pipeline problems were identified which are as follows and are listed
with the frequency that the problem occurred in the pipeline survey shown in brackets after
each source: design changes/incorrect specification (6), establishing site readiness (5),
labour shortages (4), information exchange (4), supply risks (3), integration of related trades
on site (3), access issues (2), excessive product variation (2), payment and chains of custody
(2), and tender uncertainty (2). The sources o f advantages for the focal companies in
pipelines were analysed. Ten sources of com petitive advantage were identified which are as
follows and are listed with the frequency that the source occurred in the pipeline survey
shown in brackets after each source: Specialist expertise (6), supply chain integration (6),
information technology systems (3), logistics capabilities (3), labour (3), management
223

[Chapter 8 - Evaluation of Case Research]
systems and processes (3), new product and process innovation (3), manufacturing
excellence (2), modularity (2) and a flexible organisational structure (2).
A summary of the feedback by each of the interviewees regarding this research question is
shown in table 8.4. The response from interviewee 1, suggesting that buying organisations
often underestimate the length o f lead times, and do not adequately understand the potential
problems, underlines the importance of the descriptive elements of the pipeline survey.
Interviewee 4 underlined that variability in the pipeline can introduce many of the problems
identified.
Interviewee 2 reinforced the need to work with suppliers closely from the beginning o f the
design process, if full value is to be realised. Interviewee 6 arranged ‘project bank accounts’
that suppliers can draw from to alleviate problems associated with late payments filtering
down the supply chain. A further point, made by interviewee 3, is that the solutions to
problems in the pipeline may depend on the contract type or relationship type with the
network co-ordinator. No further problems or sources of competitive advantage were
suggested.
Interview How can organisations improve pipelines in ETO construction supplychains?
1 • Buyers often underestimate the length of lead times and do not see the potential problems that can occur. Network co-ordinators must think a lot further in advance about starting pipeline activities.
2 • Suppliers must be included at the start of the design process. This would reduce uncertainty and should improve design for manufacture.
3 • The solutions to the pipeline problems identified may depend upon the contract type or the relationship with the customer.
4 • Variability in the pipeline is a big problem for buying organisations. Consistency is more important than a short lead time.
5 No Comment6 • Project bank accounts have been pioneered in the public sector.
This reduces the problems associated with non payment and chains o f custody. Using this system suppliers do not have to wait for payments from customers’ customers to trickle through to them.
Table 8.4: Summary of feedback from evaluation interviews for research question 3
224

[Chapter 8 - Evaluation of Case Research]
8.2.4 Research Question 4: How can flexibility be rationalised in ETO construction
supply chains?
In the literature review, and in chapter 7, supply chain flexibility was rationalised by
proposing the antecedents of vendor flexibility and sourcing flexibility. A three tiered
purchasing model was developed using case study data collected from the two network co
ordinators and purchasing criteria outlined in the purchasing literature. Three categories of
supplier were proposed including approved suppliers, preferred suppliers and strategic
partners. Vendor and sourcing flexibility were then integrated with the purchasing model,
developing the argument that different categories of supplier have different implications for
supply chain flexibility. Strategic partners are associated with high levels of vendor
flexibility and approved suppliers are associated with higher levels of sourcing flexibility.
Preferred suppliers are an intermediate category offering moderate levels of both vendor
and sourcing flexibility. A network co-ordinator can maintain a healthy balance of supply
chain flexibility by maintaining a pool of suppliers in each category.
Chapter 7 then investigated the role of supply chain flexibility in mitigating uncertainties
experienced in five different construction projects. Vendor and sourcing flexibility were
mapped onto the generic uncertainty profile developed in chapter 5 to ascertain which
uncertainties could be mitigated by supply chain flexibility. The findings show that supply
chain flexibility can help to mitigate 23 of the project uncertainties identified. These include
uncertainties from all o f the different sources of supply chain uncertainty. More specifically,
it suggests 5 control uncertainties, 2 demand uncertainties, 3 external uncertainties, 6
process uncertainties and 7 supply uncertainties which can be alleviated using either vendor
or sourcing flexibility.
A summary of the feedback regarding this research question by each of the interviewees is
shown in table 8.5. All interviewees apart from interview 1 were aware of, and had engaged
with, purchasing models based on different criteria. Many companies used a similar model,
either formally or informally. However, none had formally considered the role of flexibility
in supplier selection. Two further criteria for the purchasing model were suggested
225
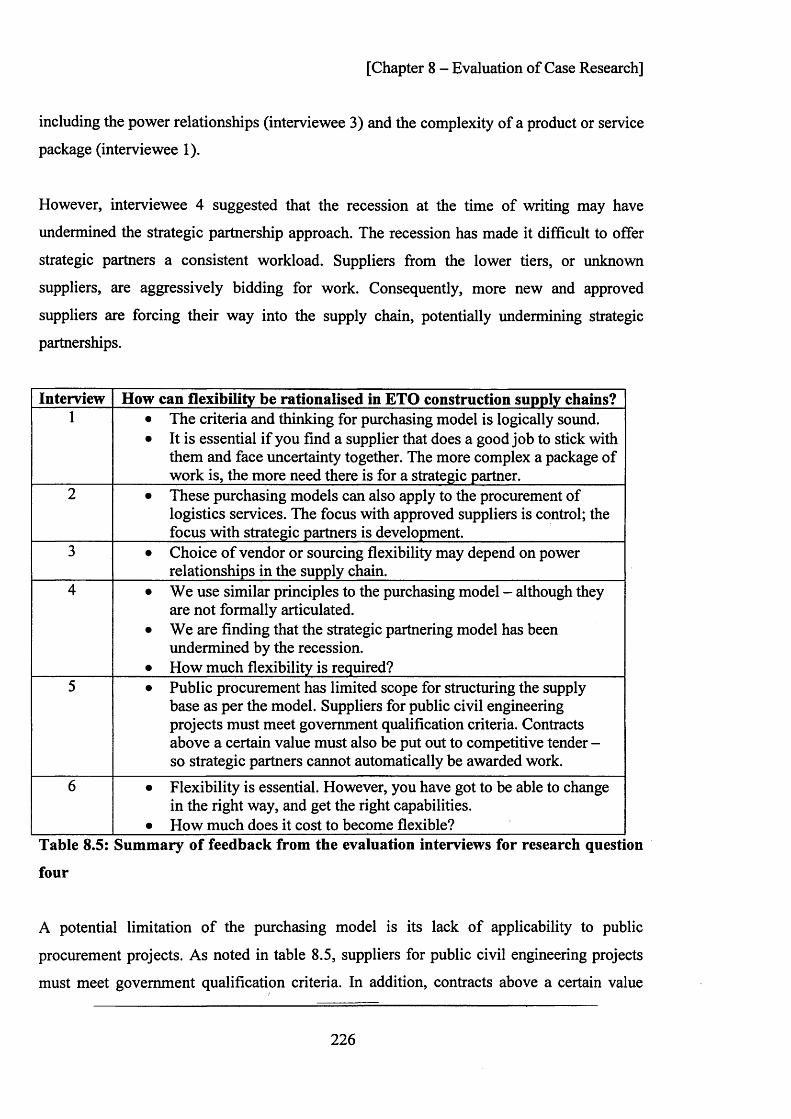
[Chapter 8 - Evaluation of Case Research]
including the power relationships (interviewee 3) and the complexity of a product or service
package (interviewee 1).
However, interviewee 4 suggested that the recession at the time of writing may have
undermined the strategic partnership approach. The recession has made it difficult to offer
strategic partners a consistent workload. Suppliers from the lower tiers, or unknown
suppliers, are aggressively bidding for work. Consequently, more new and approved
suppliers are forcing their way into the supply chain, potentially undermining strategic
partnerships.
Interview How can flexibility be rationalised in ETO construction supply chains?1 • The criteria and thinking for purchasing model is logically sound.
• It is essential if you find a supplier that does a good job to stick with them and face uncertainty together. The more complex a package of work is, the more need there is for a strategic partner.
2 • These purchasing models can also apply to the procurement of logistics services. The focus with approved suppliers is control; the focus with strategic partners is development.
3 • Choice of vendor or sourcing flexibility may depend on power relationships in the supply chain.
4 • We use similar principles to the purchasing model - although they are not formally articulated.
• We are finding that the strategic partnering model has been undermined by the recession.
• How much flexibility is required?5 • Public procurement has limited scope for structuring the supply
base as per the model. Suppliers for public civil engineering projects must meet government qualification criteria. Contracts above a certain value must also be put out to competitive tender - so strategic partners cannot automatically be awarded work.
6 • Flexibility is essential. However, you have got to be able to change in the right way, and get the right capabilities.
• How much does it cost to become flexible?Table 8.5: Summary of feedback from the evaluation interviews for research question
four
A potential limitation of the purchasing model is its lack of applicability to public
procurement projects. As noted in table 8.5, suppliers for public civil engineering projects
must meet government qualification criteria. In addition, contracts above a certain value
226

[Chapter 8 - Evaluation of Case Research]
must automatically be put out to competitive tender, eliminating the scope to award
strategic partners work. The purchasing model must, therefore, be reconsidered for
application in the public sector. This is an avenue for further research.
All interviewees accepted the definitions of the antecedents of supply chain flexibility,
vendor and sourcing flexibility, and found it a useful way to ‘operationalise’ and consider
supply chain flexibility. The distinction between internal and external flexibilities was a
useful and meaningful distinction for industry. Interviewee 4 raised the issue of measuring
sourcing flexibility: ‘How do you measure the ability of a company to switch between
suppliers?’ A potential route for further research would be the development of measuring
systems for the different elements of sourcing flexibility. Based on the dimensions of
sourcing flexibility identified in the literature review, a measurement system could be
developed to assess the ability to reconfigure the network, the ability to adapt the network to
market requirements, the ability to increase supplier responsiveness and to assess the
integration of the supply chain. A related point is highlighted by interviewee 5: ‘How do
you assess how flexible a supplier is?” This relates to the measurement of vendor flexibility.
While the framework for external flexibilities was perceived as a useful framework to
consider the flexibility o f suppliers, a formal tool for assessing suppliers’ capabilities may
improve commercial utility.
The finding that supply chain flexibility can mitigate 23 of the uncertainties produced
mixed responses from interviewees. Interviewee 3 suggested that uncertainty related to
damages would require either vendor or sourcing flexibility to respond. This was not
proposed in the original classification. Interviewee 4 suggested that all uncertainties related
to information exchange cannot be solved by the ability to be flexible alone. The ability to
switch between modes o f communication effectively would not, by itself, help to mitigate
these uncertainties. It would also need proactive team working. However, as argued in the
literature review section of this thesis, flexibility involves range and response. The latter
includes the ability to proactively respond. All other interviewees confirmed that supply
chain flexibility could be used to mitigate the 23 uncertainties.
227
[Chapter 8 - Evaluation of Case Research]
A final point is raised by interviewee 5, who suggested that good market awareness is an
essential enabler for supply chain flexibility. This is the ability to monitor the market and
looking forward, to predict what capabilities will be required in the future. The company
must then take action to ensure that it has these capabilities.
Interviewee four raised the question ‘How much flexibility is required?’ While this is an
important question, it is beyond the scope of this thesis, and has been addressed analytically
by Tang and Tomlin (2008) who, using analytical models, showed that the benefits of
flexibility can actually be achieved with low levels of flexibility. Interviewee 6 raised the
question ‘How much does flexibility cost?’ This research has identified the types of
flexibility required, but has not addressed the potential cost of flexibility. A cost - benefit
analysis for different flexibility types and capabilities could be considered as an avenue for
further research that would make the findings to this research question more commercially
applicable.
8.2.5 Integrating the findings of the case study and research and the evaluation
interviews
Table 8.6 provides a synthesis o f the findings of the case study phase of the research and the
evaluation interviews for each research question. The findings from the evaluation
interviews confirm, enrich and give an indication of the generalisability of the case findings.
They add much to the validity o f the research. A discussion of the ways in which validity
claims have been supported by the evaluation interviews can be found at the end of the
chapter.
228
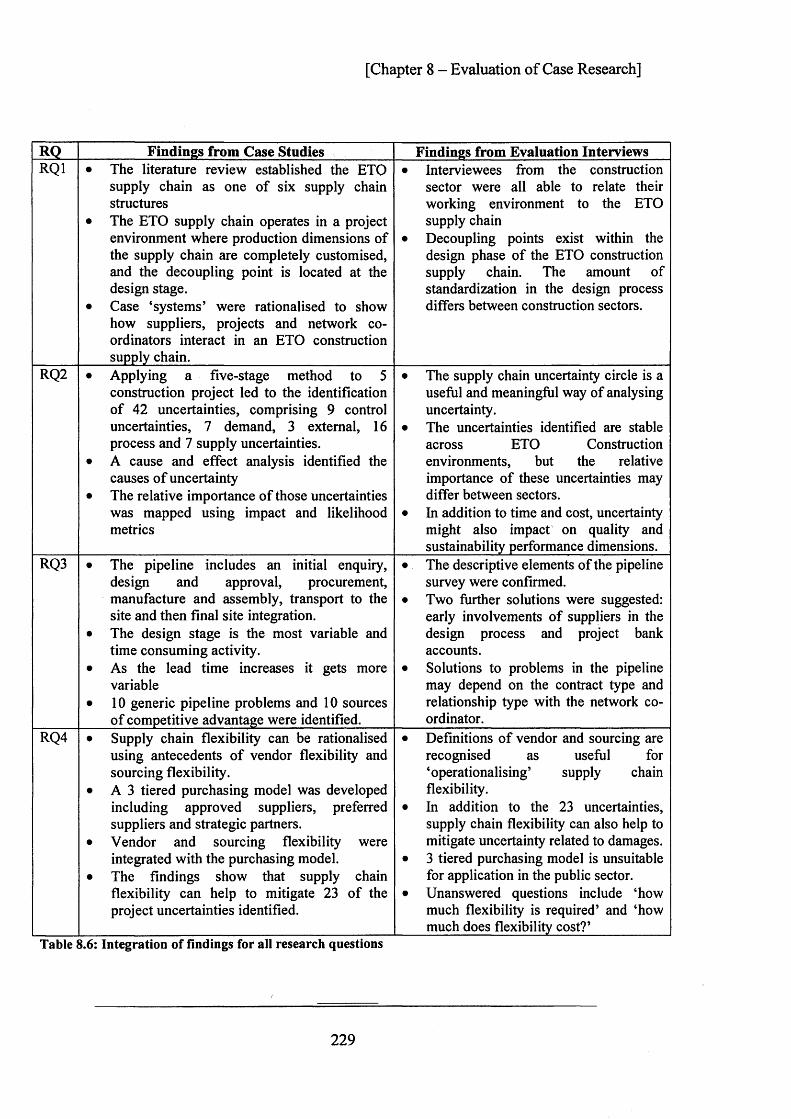
[Chapter 8 - Evaluation of Case Research]
RQ Findings from Case Studies Findings from Evaluation InterviewsRQ1 • The literature review established the ETO
supply chain as one of six supply chain structures
• The ETO supply chain operates in a project environment where production dimensions of the supply chain are completely customised, and the decoupling point is located at the design stage.
• Case ‘systems’ were rationalised to show how suppliers, projects and network coordinators interact in an ETO construction supply chain.
• Interviewees from the construction sector were all able to relate their working environment to the ETO supply chain
• Decoupling points exist within the design phase of the ETO construction supply chain. The amount of standardization in the design process differs between construction sectors.
RQ2 • Applying a five-stage method to 5 construction project led to the identification of 42 uncertainties, comprising 9 control uncertainties, 7 demand, 3 external, 16 process and 7 supply uncertainties.
• A cause and effect analysis identified the causes of uncertainty
• The relative importance of those uncertainties was mapped using impact and likelihood metrics
• The supply chain uncertainty circle is a useful and meaningful way of analysing uncertainty.
• The uncertainties identified are stable across ETO Construction environments, but the relative importance of these uncertainties may differ between sectors.
• In addition to time and cost, uncertainty might also impact on quality and sustainability performance dimensions.
RQ3 • The pipeline includes an initial enquiry, design and approval, procurement, manufacture and assembly, transport to the site and then final site integration.
• The design stage is the most variable and time consuming activity.
• As the lead time increases it gets more variable
• 10 generic pipeline problems and 10 sources of competitive advantage were identified.
• The descriptive elements of the pipeline survey were confirmed.
• Two further solutions were suggested: early involvements of suppliers in the design process and project bank accounts.
• Solutions to problems in the pipeline may depend on the contract type and relationship type with the network coordinator.
RQ4 • Supply chain flexibility can be rationalised using antecedents of vendor flexibility and sourcing flexibility.
• A 3 tiered purchasing model was developed including approved suppliers, preferred suppliers and strategic partners.
• Vendor and sourcing flexibility were integrated with the purchasing model.
• The findings show that supply chain flexibility can help to mitigate 23 of the project uncertainties identified.
• Definitions of vendor and sourcing are recognised as useful for ‘operationalising’ supply chain flexibility.
• In addition to the 23 uncertainties, supply chain flexibility can also help to mitigate uncertainty related to damages.
• 3 tiered purchasing model is unsuitable for application in the public sector.
• Unanswered questions include ‘how much flexibility is required’ and ‘how much does flexibility cost?’
T able 8.6: Integration o f findings for all research questions
229

[Chapter 8 - Evaluation of Case Research]
8.3 A FRAMEWORK FOR ACHIEVING APPROPRIATE FLEXIBILITIES TO
MITIGATE THE UNCERTAINTIES IN ETO CONSTRUCTION SUPPLY CHAINS
A number of interviewees had queries regarding implementation issues. This raises an
important point relating to action research and implementing change in organisations. The
action research cycle has been identified as observe, reflect, plan and act (Elliot, 1991). The
planning phase will include a form of diagnosis and an analysis of observations. The plan
may include recommendations about what needs to change supported by tools methods or
frameworks. The last stage, act, represents the implementation phase, where a change is
initiated in the organisation (Coughlan and Coghlan, 2009). This research primarily
addresses observe, reflect and plan phases, offering definitions, diagnostics and
recommendations for change rather than implementing change. The assumption made is that
industrialists know their organisation best, and are in a position to take the findings and use
them effectively in their organisations.
To support this planning phase, a framework, or route map for industry, is developed for
achieving flexibility. This describes the pragmatic steps required to achieve flexibility in the
supply chain. The ‘act’ phase is beyond the scope of this thesis, and would also move the
thesis into a different methodological orientation. Potential change programmes are
suggested in the future research activities in the conclusions. This section pulls together the
thesis to develop a framework for achieving the flexibilities to mitigate uncertainty in
different supply chains. The framework is shown in figure 8.2. It shows four steps for
achieving supply chain flexibility, and acts as a route map for companies to follow. It aims
to explain the pragmatic steps required to implement the findings of this thesis. The
research questions have been integrated with these four steps to show how the framework
relates to the different elements within the thesis. The four steps are now discussed in turn.
8.3.1 Step I - Identify the supply chain structure
The need to match supply chain strategy with structure has been outlined in the literature
review. Six different supply chain structures were identified. Accordingly, the first step is
the framework is the identification of the decoupling point. This can be achieved, primarily,
230

[Chapter 8 - Evaluation of Case Research]
by considering the form of strategic stock in the supply chain and the extent to which
different supply chain activities are customised or standardised for each order. This thesis
has addressed the ETO structure within the specific setting of the construction industry.
RQ1. How does RQ2. How can construction fit the sources of
within a taxonomy project of supply chain uncertainty in
structures? ETO construction supply chains be
identified and categorised?
I I
RQ3. How can organisations
improve pipelines in ETO
construction supply chains?
* ,
RQ4. How can flexibility be
rationalised in ETO construction supply chains?
1X . X Identify \
X Identify X sources Of X Supply Chain X Supply / Structure / chain
/ / Uncertainty,
X Optimise
/ p,pe,,n;
v Configured S . Network W it h \ .
X Required ^ ^ y Flexibility .y
y Levels /
Appropriate Flexibilities for
ETO Construction supply chain
Figure 8.2: A fram ew ork for achieving flexibility in ET O supply chains
8.3.2 Step 2 - Identify the sources of supply chain uncertainty
The next step is to identify the uncertainties in the supply chain. This can be approached by
categorising uncertainties according to the different sources of uncertainty articulated in the
supply chain uncertainty circle: supply, demand, process, control and external uncertainties.
The root causes of these different uncertainties can then be explored through cause and
effect analysis. The relative importance of these uncertainties can be analysed by
considering the likelihood that a negative effect will come to fruition and the impact that an
uncertainty could have on time, cost, quality and sustainability performance measures.
8.3.3 Step 3 - Optimise pipelines
Network co-ordinators must fully understand the activities in the pipeline and the lead time
implications. This will involve understanding and documenting techniques, such as the
input-output diagrams and process flow charting, simplification, by removing problems and
231

[Chapter 8 - Evaluation of Case Research]
improving information and material flows throughout the pipeline. The final stage is re
engineering to reduce problems in the pipelines. This thesis has produced four
recommendations for pipeline improvement strategies:
1. Reduce uncertainty by addressing the problems in the pipeline;
2. Strive for shorter and more consistent lead times;
3. Consider the sources o f competitive advantage in pipeline improvement strategies;
4. Work together to improve pipelines.
8.3.4 Step 4 - Configure the network with required flexibility
This thesis has argued that the supplier network can be structured using a 3 tiered
purchasing model, which is integrated with supply chain flexibility considerations. The first
action for an organisation, therefore, is to organise the existing supply base according to
these tiers. This would involve examining the criteria for the different tiers, and identifying
which suppliers are, or should be, approved, preferred and strategic partners.
Once this has been achieved, the development of supply chain flexibility can be addressed.
It should also be noted that flexibility would be one of the criteria considered for placing
suppliers in the different supplier tiers. Network co-ordinators can then begin to develop
strategic partners by offering formal training in flexibility in the required areas and
capabilities. The next stage would be to develop sourcing flexibility capabilities for
approved and preferred suppliers. The classification developed in the literature review
suggests that the key abilities here are:
• Ability to reconfigure the supply chain;
• Ability to adapt to market requirements;
• Ability to increase supplier responsiveness;
• Ability to integrate the supply chain.
The final stage is to establish a performance management system to address the promotion
and demotion through performance monitoring. The experience of the network co-ordinator
from system 1 suggests that KPIs and a dedicated supply chain manager are essential for
this last stage.
232

[Chapter 8 - Evaluation of Case Research]
8.4 EVALUATION
This final section seeks to give a closing evaluation of the findings before conclusions are
drawn.
8.4.1 Strengths, weaknesses, opportunities and threats
Based on the feedback from the evaluation interviews, figure 8.3 shows the perceived
strengths, weaknesses, opportunities and threats (SWOT) of the research. This is intended to
summarise the strengths and weaknesses of the research from a practitioner perspective.
Strengths
The first perceived strength of the research is the objectivity and holistic approach adopted
in the research. Many o f the interviewees felt that problems, risks and uncertainties are
usually analysed from a very specific or narrow perspective, serving particular needs. This
research was perceived as holistic, including the wider supply chain in the analysis of
uncertainty. The research was also perceived to have integrity by interviewees, with clear
relationships between data and findings. The result is an accurate and unbiased investigation
of the problems facing the ETO construction sector. The definitions, models, methods and
frameworks were also felt to be useful for driving innovation and change. In particular,
many of the interviewees enjoyed stepping out of the day-to-day fire fighting from within
their organisations and discussing strategy in the context of the evaluation presentation.
Weaknesses
The evaluation interviews identified three omissions from the research. The first omission is
that the system conceptualisation does not include transport and logistics activities. Whereas
these are identified as part of the pipeline, they are not shown in the conceptualisation of the
ETO system. As mentioned in the discussion of the research question 2 above, the
contractual arrangements are not addressed in this research. Finally, the research does not
offer a current state assessment of sourcing flexibility.
233

[Chapter 8 - Evaluation of Case Research]
STRENGTHS•Research approach is holistic and objective, whilst also being very close to industry •An accurate and insightful representation of uncertainties in ETO projects •integrity of research process •Framework and flexibility definitions are useful for driving innovation and change in industry
WEAKNESSES •Does not adequately address contractual arrangem ents as a barrier or enablerof flexibility•The role of a logistics provider is not addressed•Does not address the assessment of current flexibility capabilities
OPPORTUNITIES•Pipeline improvement workshops •Potential for further developm ent of commercial tools and techniques related to:
•Uncertainty identification and analysis •flexibility capability assessment and matching•Organisingthe supply base
•Potential for application in different sectors
THREATS•Cultural and organsational barriers to change•Incurring too much cost by overcompensatingfor flexibility •No clear overall management and direction of flexibility a t the system level.
Figure 8.3: SW O T analysis
Opportunities
Interviewee 7 suggested that the findings from chapter 5 relating to pipelines would be
useful in supplier training days, whereby suppliers and the network co-ordinator come
together to analyse, discuss and improve pipelines.
Most of the other opportunities identified by practitioners in the evaluation interviews relate
to tool development. In the areas of uncertainty, identification and analysis, and
opportunities for developing and formalising the method undertaken for collecting and
synthesizing the uncertainties would be welcomed, as well as integrating these techniques
with formal risk management frameworks. The models for organising the supply base were
felt to be a useful decision support tool for practitioners and could initiate change
programmes for re-engineering business processes. A complete tool kit would allow
organisations to assess their current capabilities in terms of flexibilities, and also allow them
to identify the required flexibilities for the uncertainties in their supply chains.
234

[Chapter 8 - Evaluation of Case Research]
Finally, there are opportunities for application of these models, tools and techniques outside
of the ETO sector. As described in the literature review, many organisations, even those
outside of the ETO sector, are trying to make their supply chains more responsive, and are
trying to offer more choice to customers. The findings from this thesis, therefore, may offer
insight for such organisations to achieve more responsive and customised supply chains.
Threats
The first threat identified was the cultural and organisational barriers to change. In
particular, the problem of initiating customer focused change in non customer facing
activities was highlighted. The issues of ‘who pays for flexibility?’ and ‘how much does it
cost?’ were also identified as potential threats. A cost - benefit analysis for different
flexibility types and capabilities can be considered as an avenue for further research which
would make the findings to this research question more commercially applicable. A further
threat highlighted was the danger that there is no clear overall management of flexibility in
the supply chain.
8.4.2 Validity and Generalizability
The subject of validity in research was introduced in the methodology chapter. In addition
to the validity concerns addressed in the research design of the case research, the evaluation
interviews presented in this chapter have helped to address overall validity concerns in the
study. Firstly, the evaluation interviews have improved the claim to portray an accurate
relationship between variables in the various models and classifications developed. The
models exposed to outside scrutiny are as follows:
• The uncertainty circle and the 42 uncertainties;
• The cause and effect of different uncertainties;
• The causal modelling for pipeline problems;
• The causal modelling for the sources of competitive advantage in the pipeline;
• The conceptual model for supply chain flexibility;
• The purchasing model for ETO construction supply chains;
• The classification of flexibility types for ETO construction supply chains;
• The findings of the flexibility mapping technique.
235

[Chapter 8 - Evaluation of Case Research]
While measures were taken throughout the case research process to ensure the accuracy of
these models and classifications, they have also been subjected to outside scrutiny from a
range of stakeholders from outside of the case systems, but within the focal sectors that the
research seeks to generalise. As described above, in some cases, the models, findings and
classifications were enriched by the evaluation interview.
By integrating the findings of the two phases of the research, the following can be
concluded:
• Construction is a particular form of ETO supply chain, but the amount of design
standardization differs across construction sectors;
• The uncertainties identified, and the cause and effect relationships between these
uncertainties, are consistent across different construction sectors, but the relative
importance of these uncertainties is not consistent;
• The generic activities in the pipeline for construction suppliers can be defined as: an
initial enquiry, design and approval of a product, procurement of the relevant
materials, manufacture and assembly, transport to the site and then final integration
of the product with the site;
• Ten different pipeline problems for construction suppliers can be identified which
are recognised across different construction sectors;
• Ten sources of competitive advantage can be identified in the pipeline; these are
recognised across different construction sectors;
• Supply chain flexibility can be rationalised using antecedents of sourcing and
vendor flexibility. An ETO network can be configured to cope with uncertainty
using a 3 tiered purchasing model which is integrated with these antecedents to
achieve supply chain flexibility. A network co-ordinator operating in the ETO
construction sector can best cope with uncertainty by maintaining a pool of suppliers
in each category;
• Supply chain flexibility, defined as consisting of vendor and sourcing flexibility, can
help to mitigate at least 23 of the uncertainties identified in the construction projects.
236
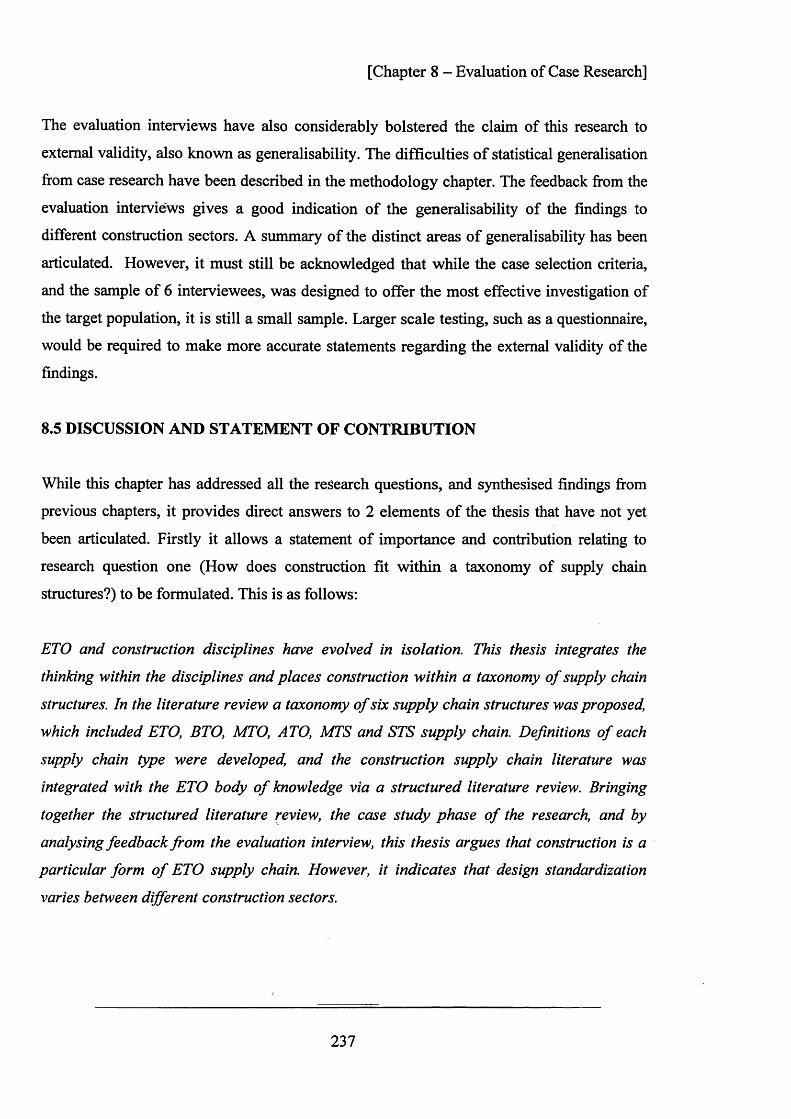
[Chapter 8 - Evaluation of Case Research]
The evaluation interviews have also considerably bolstered the claim of this research to
external validity, also known as generalisability. The difficulties o f statistical generalisation
from case research have been described in the methodology chapter. The feedback from the
evaluation interviews gives a good indication of the generalisability of the findings to
different construction sectors. A summary of the distinct areas o f generalisability has been
articulated. However, it must still be acknowledged that while the case selection criteria,
and the sample of 6 interviewees, was designed to offer the most effective investigation of
the target population, it is still a small sample. Larger scale testing, such as a questionnaire,
would be required to make more accurate statements regarding the external validity of the
findings.
8.5 DISCUSSION AND STATEMENT OF CONTRIBUTION
While this chapter has addressed all the research questions, and synthesised findings from
previous chapters, it provides direct answers to 2 elements of the thesis that have not yet
been articulated. Firstly it allows a statement of importance and contribution relating to
research question one (How does construction fit within a taxonomy of supply chain
structures?) to be formulated. This is as follows:
ETO and construction disciplines have evolved in isolation. This thesis integrates the
thinking within the disciplines and places construction within a taxonomy o f supply chain
structures. In the literature review a taxonomy o f six supply chain structures was proposed,
which included ETO, BTO, MTO, ATO, M TS and STS supply chain. Definitions o f each
supply chain type were developed, and the construction supply chain literature was
integrated with the ETO body o f knowledge via a structured literature review. Bringing
together the structured literature review, the case study phase o f the research, and by
analysing feedback from the evaluation interview, this thesis argues that construction is a
particular form o f ETO supply chain. However, it indicates that design standardization
varies between different construction sectors.
237

[Chapter 8 - Evaluation of Case Research]
Recall that the primary aim of the thesis was to develop a fram ework for achieving
appropriate flexibilities to mitigate the uncertainties in ETO construction supply
chains. This chapter has integrated different elements of the thesis to develop a four stage
framework to satisfy this primary aim. In relation to the primary aim, the following can be
articulated:
Bodies o f knowledge on uncertainty, flexibility, pipelines and collaboration have largely
evolved independently, and have not been integrated fo r the specific needs o f the ETO
construction sector. Based on the different elements o f the research, a four stage framework
fo r achieving appropriate flexibilities to mitigate the uncertainties in ETO construction
supply chains has been presented to satisfy the primary aim o f the research and fi l l this
research gap.
8.6 CONCLUSIONS
This chapter has summarised the findings from the case study phase for each of the four
research questions. These findings have then been discussed with reference to empirical
data collected from 6 evaluation interviews. A framework for achieving flexibility in an
ETO construction supply chain was then presented consisting of four steps: identify supply
chain structure, identify supply chain uncertainties, optimise pipelines and configure the
network with required flexibility. Each step relates to the research questions in the thesis.
This can act as a route map for practitioners to implements the findings of this research. A
SWOT analysis of the research has also been presented based on the empirical data
collected in the evaluation interviews. The final section addresses the role of the evaluation
interviews in the claims to validity for the study. The evaluation interviews are considered
to improve the claims to internal, construct and external validity. In particular, this chapter
is important as it strengthens the potential to generalise the findings to different ETO
construction environments.
238

[Chapter 8 - Evaluation of Case Research]
SUMMARY OF CHAPTER 8 AIMS1. Present the findings from the evaluation interviews
-T he findings from the evaluation interviews for each research question have been discussed in turn
2. Evaluate the findings for each research question using findings from the evaluation interviews
-The findings from the evaluation interviews for each research question have been integrated with the findings from the case study phase
3. Present a framework for achieving flexibility in supply chains-A fourstep framework has been presented including identify supply chain structure,
identify sources of uncertainty, optimise pipelines and configure network with required flexibility
4. Evaluate the strengths, weaknesses, opportunities and threats related to the research
-A SWOT analysis has been presented and discussed5. Discuss the contribution of the evaluation interviews in to validity concerns
-The contribution of the evaluation to the overall validity of the thesis has been discussed. In particular, the contribution of the evaluation interviews to generalisability claims have been addressed.
239

[Chapter 9 - Conclusions]
CHAPTER 9
CONCLUSIONS
SUMMARY QF CHAPTER 9 AIM§1. Articulate c o n c is e a n s w e r s to e a c h of th e r e se a rc h q u e s t io n s2. S um m arise the r e s e a rc h find ings in relation to the primary aim of the thes is3. Identify th e a c a d e m ic c o n tr ibu tions4. Identify the im plications for p rac tit ioners5. Identify the limitations an d a re a s for fu rther re se a rc h
RESEARCH QUESTION ADDRESSED All r e s e a rc h q u e s t io n s a re a d d re s s e d in this c h a p te r
Theoretical Empirical Research Findings
Chapter 2
RQ1
Chapters 3 and 4
M e th o d o lo g y
Chapter 3: Methodology
Chapter 4: Research Design
Chapters
Uncertainty in ETO Systems
RQ2
Chapter 6
PipelineImprovement
Strategies
RQ3
Chapter 7
Supply Chain Flexibility
RQ4
Chapter 8
Evaluation Of The Case Research
UnifiedFrameworkPresented
AllRQs
Chapter 9
i/>co
■JrtJ3uc5
240

[Chapter 9 - Conclusions]
9. INTRODUCTION
This final chapter summarises the research findings. A concise answer to each of the four
research questions is articulated. A short discussion of the findings from the research in
relation to the primary aim set out at the start o f the thesis is offered, along with a clear
statement of the extent to which findings can be generalised. The original contributions to
the literature are highlighted and the implications for practitioners are summarised. Finally,
the limitations and avenues for further research are identified.
9.1 ANSWERS TO RESEARCH QUESTIONS
9.1.1 Research question 1: How does construction fit within a taxonomy of supply
chain structures?
A taxonomy o f 6 supply chain structures was proposed including ETO, BTO, MTO, ATO,
MTS and STS supply chains. Definitions o f each supply chain type were developed, and the
construction supply chain literature was integrated with the ETO body o f knowledge via a
structured literature review. The ETO supply chain structure has the highest levels o f
customisation across all supply chain activities. A project method is required, and
production activities in the supply chain are largely customised. The decoupling point is
located at the design stage and, while customers always participate in the design phase,
there may be elements o f standard designs that are reused across different projects.
Bringing together the structured literature review, the case study phase o f the research, and
by analysing feedback from the evaluation interview, this thesis argues that construction is
a particular form o f ETO supply chain. However, it indicates that design standardization
varies between different construction sectors. This thesis integrates the thinking within the
disciplines and places construction within a taxonomy o f supply chain structures.
241
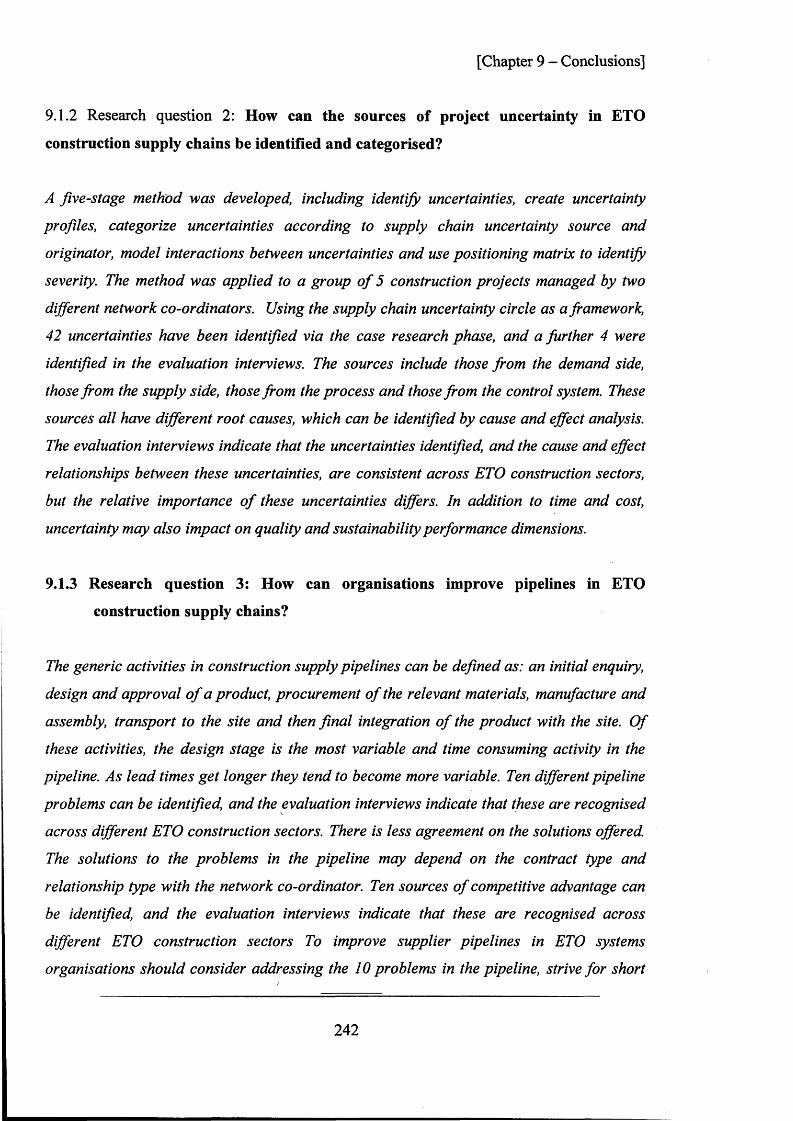
[Chapter 9 - Conclusions]
9.1.2 Research question 2: How can the sources of project uncertainty in ETO
construction supply chains be identified and categorised?
A five-stage method was developed, including identify uncertainties, create uncertainty
profiles, categorize uncertainties according to supply chain uncertainty source and
originator, model interactions between uncertainties and use positioning matrix to identify
severity. The method was applied to a group o f 5 construction projects managed by two
different network co-ordinators. Using the supply chain uncertainty circle as a framework,
42 uncertainties have been identified via the case research phase, and a further 4 were
identified in the evaluation interviews. The sources include those from the demand side,
those from the supply side, those from the process and those from the control system. These
sources all have different root causes, which can be identified by cause and effect analysis.
The evaluation interviews indicate that the uncertainties identified, and the cause and effect
relationships between these uncertainties, are consistent across ETO construction sectors,
but the relative importance o f these uncertainties differs. In addition to time and cost,
uncertainty may also impact on quality and sustainability performance dimensions.
9.1.3 Research question 3: How can organisations improve pipelines in ETO
construction supply chains?
The generic activities in construction supply pipelines can be defined as: an initial enquiry,
design and approval o f a product, procurement o f the relevant materials, manufacture and
assembly, transport to the site and then fin a l integration o f the product with the site. O f
these activities, the design stage is the most variable and time consuming activity in the
pipeline. As lead times get longer they tend to become more variable. Ten different pipeline
problems can be identified, and the evaluation interviews indicate that these are recognised
across different ETO construction sectors. There is less agreement on the solutions offered.
The solutions to the problems in the pipeline may depend on the contract type and
relationship type with the network co-ordinator. Ten sources o f competitive advantage can
be identified, and the evaluation interviews indicate that these are recognised across
different ETO construction sectors To improve supplier pipelines in ETO systems
organisations should consider addressing the 10 problems in the pipeline, strive fo r short
242

[Chapter 9 - Conclusions]
and consistent lead-times, develop sources o f competitive advantage in the pipeline and,
finally, work together to achieve these goals.
9.1.4 Research question 4: How can flexibility be rationalised in ETO construction
supply chains?
Supply chain flexibility ca n be achieved in an ETO construction supply chain by using a 3
tiered purchasing m odel which is integrated with antecedents o f supply chain flexibility.
Three categories o f supplier, including approved suppliers, preferred suppliers and
strategic partners, are proposed, each with different vendor and sourcing flexibility
implications. Strategic partners are associated with high levels o f vendor flexibility and
approved suppliers are associated with higher levels o f sourcing flexibility. Preferred
suppliers are an intermediate category offering moderate levels o f both vendor and
sourcing flexibility. A netw ork co-ordinator can best cope with uncertainty by maintaining a
pool o f suppliers in ea ch category. The case study phase suggests that supply chain
flexibility can mitigate 2 3 o f the uncertainties identified. A further uncertainty that could be
mitigated was identified a t the evaluation interview stage. Market awareness may be an
important enabler fo r establishing how much flexibility is required.
9.3 GENERALIZABILITY
While this thesis is grounded in the ETO literature, it focuses on the construction sector.
The case study phase and the evaluation interviews are all conducted within the
construction industry. Therefore this thesis only focuses on the potential to generalize to the
ETO construction sector, rather than the wider ETO sector.
By integrating the findings of the case phase and the evaluation interviews, the following
can be concluded regarding the generalizability of findings to the ETO construction sector.
• The ETO construction supply chain can be rationalised as a system, consisting of
network co-ordinators, who assume responsibility for configuring the network of
suppliers, subcontractors and interdependent organizations that work together to
243

[Chapter 9 - Conclusions]
deliver projects, the specific projects that the network co-ordinator organisation is
currently involved with and a network of supplier pipelines.
• The 42 uncertainties identified, and the cause and effect relationships between these
uncertainties, are consistent across different construction sectors, but the relative
importance of these uncertainties is not consistent.
• The generic activities in the pipeline for construction suppliers can be defined as: an
initial enquiry, design and approval o f a product, procurement of the relevant
materials, manufacture and assembly, transport to the site and then final integration
of the product with the site.
• Ten different pipeline problems for construction suppliers can be identified which
are recognised across different construction sectors.
• Ten sources of competitive advantage can be identified in the pipeline; these are
recognised across different construction sectors.
• Supply chain flexibility can be rationalised using antecedents of sourcing and
vendor flexibility. An ETO construction network can be configured to cope with
uncertainty using a 3 tiered purchasing model which is integrated with these
antecedents to achieve supply chain flexibility. A network co-ordinator operating in
the ETO construction sector can best cope with uncertainty by maintaining a pool of
suppliers in each category.
• Supply chain flexibility, defined as consisting of vendor and sourcing flexibility, can
help to mitigate at least 23 o f the uncertainties identified in the construction projects.
9.3 A SUMMARY OF RESEARCH FINDINGS IN RELATION TO THE PRIMARY
AIM OF THE THESIS
Recall that the primary aim of this thesis is to develop a framework for achieving
appropriate flexibilities to mitigate the uncertainties in ETO supply chains.
Chapter 2 argues that the ETO supply chain is one of six supply chain structures and the
particular attributes of the ETO supply chain structure are a good ‘conceptual fit’ with the
characteristics of agility. Agility is a strategic approach to supply chain management based
on responsiveness and flexibility. A structured literature review was undertaken to provide a
244

[Chapter 9 - Conclusions]
more precise classification of the characteristics of the ETO supply chain, and a
classification of the different strategic approaches to improving ETO supply chains. The
structured literature review also highlights the methodological landscape of the area and an
overview of the sectors that are associated with the ETO supply chain. The final part of the
literature review establishes a relationship between uncertainty and flexibility, suggesting
that flexibility is an effective response to uncertainty. Finally, a conceptual model for
supply chain flexibility was developed, which is an expansion of the principles of
manufacturing flexibility to the wider supply chain. Vendor and sourcing flexibility were
proposed as the ‘antecedents’ of supply chain flexibility. The primary aim was broken down
into 4 research questions.
Chapter 3 provides a context to the research design of the thesis. The philosophical stances
of positivism, critical realism and constructivism are discussed. The overall research stance
of critical realism is identified and multiple case study research is identified as the primary
empirical phase of the research. A review o f the strengths and weaknesses of a range of
research methods that are pertinent to the thesis was presented.
Chapter 4 expands chapter 3, explaining how the research methods are applied in the study
and linking these with the research questions. Three units of analysis are specified in an
ETO ‘system’. These are first network co-ordinators, who assume responsibility for
configuring the network o f suppliers, subcontractors and interdependent organizations that
work together to deliver projects, second, the specific projects that the network co-ordinator
organisation is currently involved with and, third, a network of supplier pipelines. The
multiple case studies consist of 2 network co-ordinators, 5 projects and 12 supplier
pipelines. This is followed by seven evaluation interviews. Validity concerns and controls
were addressed at the end o f the chapter.
A relationship between uncertainty and flexibility was established in the literature review.
In order to understand the flexibility requirements of ETO supply chains, the uncertainties
experienced in ETO construction supply chains must be identified. C hapter 5 presented a
five-stage method to identify and categorize uncertainties, which was applied to 5
construction projects. In dong this, the supply chain uncertainty circle was adopted as a
245

[Chapter 9 - Conclusions]
framework to classify the uncertainties, and a root causes of these uncertainties was
conducted to model the interactions. In total, forty two uncertainties were identified in the
case study phase of the research.
If flexibility and responsiveness is to be achieved in ETO supply chains, effective pipelines
must be developed. C hap ter 6 investigates the pipeline activities in the case studies.
Generic pipeline activities are identified, lead times are analysed, and problems, solutions
and sources o f competitive advantage are investigated. C hapter 7 investigates how supply
chain flexibility can be achieved. A 3 tiered purchasing model was developed and the
antecedents of vendor and sourcing flexibility were integrated with this model. The chapter
concludes that 23 o f the 42 uncertainties identified can be mitigated through supply chain
flexibility.
C hapter 8 integrates the findings from the case study phase of the research with the
findings of 6 evaluation interviews. This chapter is important as it provides an indication of
the elements of the research that can be generalised to other ETO construction
environments. A framework for achieving the appropriate flexibilities in supply chains is
developed in chapter 8. This framework brings together all elements of the research, and
satisfies the primary aim o f the research. It is reprinted below for emphasis, in figure 9.1,
but this version integrates the findings for each of the research questions.
246

[Chapter 9 - Conclusions]
RQ1. How does construction fit
within a taxonomy of supply chain structures?
RQ2. How can the sources of
project uncertainty in
ETO construction supply chains be ' identified and
categorised?
RQ3. How can organisations
improve pipelines in ETO
construction supply chains?
RQ4. How can flexibility be
rationalised in ETO construction
supply chains?
Identify Supply Chain
Structure
Identify Sources Of
Supply Chain
Uncertainty
T
OptimisePipelines
Construction is a particular form of ETO supply chain
Configure' Network With
Required Flexibility
Levels
A five stage Based on an method was investigation of 12
developed and pipelines, four applied to 5 recommendations construction were proposed
projects
By considering vendorand
sourcing flexibility in the
purchasing process
Appropriate Flexibilities for
ETO Construction supply chain
Figure 9.1: A framework for achieving flexibility in supply chains with answers to research questions
9.4 ACADEMIC CONTRIBUTIONS
The research adds to the overall body of literature through a number of contributions. A
summary of these contributions, in relation to each of the research questions and the
conclusions, can be found in table 9.1. These contributions will be discussed in relation to
four types of knowledge creation in logistics and supply chain research proposed by
Arlbjom and Halldorsson (2002). These four types are as follows:
• Storytelling and/or quantitative testing o f new knowledge. This category focuses on
theory testing with a loose theory base (not based in well established theory).
• Generating new concepts. This category focuses on theory development with a loose
theory base.
• Refining the existing knowledge base. This category focuses on theory testing with a
solid theory base (well established theory using well recognised language and
concepts).
• Expanding the knowledge base. This category focuses on theory development with a
solid theory base (Arlbjom and Halldorsson, 2002).
247
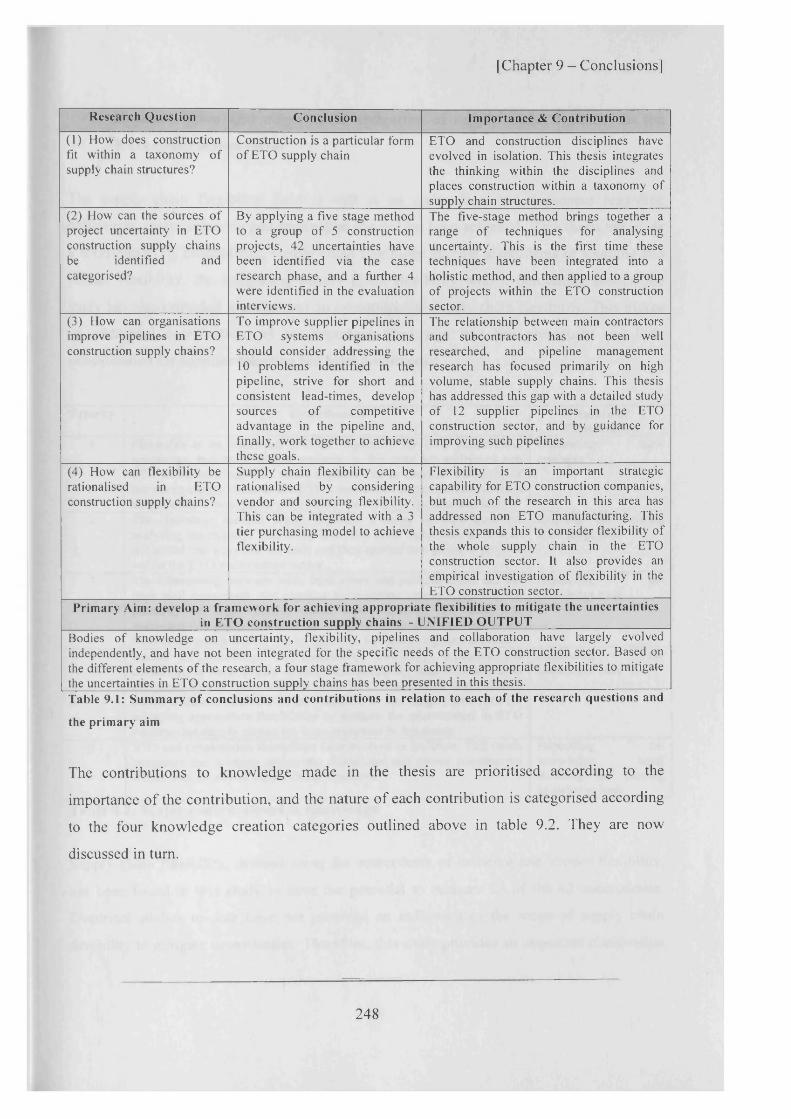
[Chapter 9 - Conclusions]
Research Question Conclusion Importance & Contribution(1) How does construction fit within a taxonomy of supply chain structures?
Construction is a particular form of ETO supply chain
ETO and construction disciplines have evolved in isolation. This thesis integrates the thinking within the disciplines and places construction within a taxonomy of supply chain structures.
(2) How can the sources of project uncertainty in ETO construction supply chains be identified and categorised?
By applying a five stage method to a group of 5 construction projects, 42 uncertainties have been identified via the case research phase, and a further 4 were identified in the evaluation interviews.
The five-stage method brings together a range of techniques for analysing uncertainty. This is the first time these techniques have been integrated into a holistic method, and then applied to a group of projects within the ETO construction sector.
(3) How can organisations improve pipelines in ETO construction supply chains?
To improve supplier pipelines in ETO systems organisations should consider addressing the 10 problems identified in the pipeline, strive for short and consistent lead-times, develop sources of competitive advantage in the pipeline and, finally, work together to achieve these goals.
The relationship between main contractors and subcontractors has not been well researched, and pipeline management research has focused primarily on high volume, stable supply chains. This thesis has addressed this gap with a detailed study of 12 supplier pipelines in the ETO construction sector, and by guidance for improving such pipelines
(4) How can flexibility be rationalised in ETO construction supply chains?
Supply chain flexibility can be rationalised by considering vendor and sourcing flexibility. This can be integrated with a 3 tier purchasing model to achieve flexibility.
Flexibility is an important strategic capability for ETO construction companies, but much of the research in this area has addressed non ETO manufacturing. This thesis expands this to consider flexibility of the whole supply chain in the ETO construction sector. It also provides an empirical investigation of flexibility in the ETO construction sector.
Primary Aim: develop a framework for achieving appropriate flexibilities to mitigate the uncertainties in ETO construction supply chains - UNIFIED OUTPUT
Bodies of knowledge on uncertainty, flexibility, pipelines and collaboration have largely evolved independently, and have not been integrated for the specific needs of the ETO construction sector. Based on the different elements of the research, a four stage framework for achieving appropriate flexibilities to mitigate the uncertainties in ETO construction supply chains has been presented in this thesis.Table 9.1: Summary of conclusions and contributions in relation to each of the research questions andthe primary aim
The contributions to knowledge made in the thesis are prioritised according to the
importance of the contribution, and the nature of each contribution is categorised according
to the four knowledge creation categories outlined above in table 9.2. They are now
discussed in turn.
248

[Chapter 9 - Conclusions]
1. Rationalisation and empirical investigation of supply chain flexibility in the
ETO construction sector
The supply chain flexibility field is still at an early stage and consensus regarding
definitions, scope, meaning and application has not yet been achieved. This thesis has made
a contribution by rationalising supply chain flexibility into the antecedents of sourcing and
vendor flexibility. By integrating supply chain flexibility with a purchasing model, the
study has also provided a useful way to operationalise supply chain flexibility. This makes
an additional contribution, as an important dimension that has previously had little
consideration for supplier selection has been investigated.
Priority C ontribution N ature o f Contribution
1 Flexibility is an im portant strategic capability for ETO construction com panies, but m uch o f the research in this area has addressed non ETO manufacturing. T h is thesis expands this to consider flexibility o f the w hole supply chain in the ETO construction sector. It also provides an empirical investigation o f flexibility in the ETO construction sector.
Generating n ew concepts
2 The five-stage m ethod brings together a range o f techniques for analysing uncertainty. This is the first tim e these techniques have been integrated into a h o listic m ethod, and then applied to a group o f projects within the ETO construction sector.
Refining the existing knowledge base
3 The relationship b etw een m ain contractors and subcontractors has not been w ell researched, and pipeline management research has focused primarily on high vo lu m e, stable supply chains. This thesis has addressed this gap w ith a detailed study o f 12 supplier pipelines in the ETO construction sector, and by guidance for improving such pipelines
Expanding the knowledge base
4 Bodies o f k n ow led ge on uncertainty, flexibility, pipelines and collaboration have largely evolved independently, and have not been integrated for the sp ec ific needs o f the ETO construction sector. Based on the different elem en ts o f the research, A four stage framework for achieving appropriate flex ib ilities to mitigate the uncertainties in ETO construction supply chains has been presented in this thesis.
Expanding the knowledge base
5 ETO and construction d isciplines have evolved in isolation. This thesis integrates the th inking w ithin the disciplines and places construction within a taxonom y o f supply chain structures.
Expanding the knowledge base/ Refining the existing knowledge base
Table 9.2: Major contributions to knowledge
Supply chain flexibility, defined using the antecedents of sourcing and vendor flexibility,
has been found in this study to have the potential to mitigate 23 of the 42 uncertainties.
Empirical studies to date have not provided an indication of the scope of supply chain
flexibility to mitigate uncertainties. Therefore, this study provides an important clarification
249

[Chapter 9 - Conclusions]
of the extent to which s u p p ly chain flexibility can mitigate uncertainty, helping to establish
the role o f supply chain flex ib ility .
The conceptual model o f su p p ly chain flexibility fits under the knowledge creation category
of generating new k n o w led g e . A new model has been proposed to rationalise supply chain
flexibility. This has b e e n investigated through empirical research in the ETO construction
sector. This adds to the su p p ly chain flexibility body of knowledge, and the ETO strategy
literature.
2. Developing and applying a five-stage method for identifying and categorizing
uncertainty in E T O construction supply chains
The literature review h ig h lig h ted the potential disruptions that uncertainty can lead to within
a supply chain. The f iv e -s tag e method developed in the thesis brings together a range of
techniques for id en tify in g and categorizing uncertainty. This is the first time these
techniques have been in teg ra ted into a holistic method, and then applied to a group of
projects within the E T O construction sector. By developing and applying the five-stage
method, two specific m in o r contributions can be highlighted:
• The supply c h a in uncertainty circle has been successfully applied in a range of
sectors, but there a re no applications in the ETO construction sector. By applying
the supply chain uncertain ty circle concept to a novel area this thesis has made the
contribution o f re f in in g an existing model;
• The model o f in te rac tio n s applied in the five-stage method provides a novel tool for
identifying the c a u s e and effect o f uncertainties.
3. Identification o f pipeline improvement strategies for ETO construction supply
chains
An important gap a d d re ssed in this thesis is the investigation of pipeline activities between
main contactors and th e ir suppliers in construction projects. The majority of the literature in
has addressed the client — contractor relationship. Pipeline management has been identified
250

[Chapter 9 - Conclusions]
in the literature as crucial for effective supply chain management, but much of the research
has been undertaken within stable MTS supply chains. The pipeline survey conducted in
this thesis has identified the generic activities in the pipeline, and the lead-time analysis
illustrates the time bottlenecks and areas of variability. The problems and sources of
competitive advantage in the pipeline have also been identified. This expands the
knowledge base by providing an empirical investigation of pipeline management in the
particular context o f the ETO construction supply chain. The contribution has been
recognised by the International Journal of Agile Manufacturing (Gosling et al., 2007a)
4. A four stage framework that integrates supply chain structure, supply chain
uncertainty, pipeline improvement strategies and supply chain flexibility
The framework proposed in figure 9.1 integrates the concepts investigated in this thesis, and
is considered to be the main output of the thesis. It synthesises concepts related to supply
chain structures, supply chain uncertainty, pipeline management and supply chain
flexibility. This makes the important contribution of consolidating and establishing
relationships between fields and concepts. This can be categorised under the knowledge
creation type of refining the existing knowledge base.
5. Placing construction within a taxonomy of supply chain structures
Most of the literature in supply chain management has addressed repetitive, standardised
supply chains. This thesis has focused on the ETO supply chain within the specific setting
of the construction industry, where activities are customised for a particular order. ETO and
construction disciplines have evolved in isolation. This research integrates the thinking from
these disciplines and places construction within a taxonomy of supply chain structures,
arguing that it a particular form of ETO supply chain. Positioning construction as a
particular form o f ETO supply chain helps companies and researchers consider more
appropriate strategies. The thesis adds weight to the body of knowledge suggesting that a
‘one-size-fits-air approach to supply chain management is not appropriate. Overall, this
thesis also firmly establishes the ETO structure as an important consideration in the family
251

[Chapter 9 - Conclusions]
of supply chain structures. In addition, the literature review provides the first structured
review of the ETO supply chain to be published (Gosling and N aim , 2009).
9.5 SUMMARY OF IMPLICATIONS FOR INDUSTRY
The implications for industry are fully discussed in chapter 8, so this section will only
provide a brief summary. The findings herein will be o f in terest to practitioners in
organisations that have to cope with the complexities and uncertainties inherent in ETO
supply chains. It provides a convincing case for the need to develop flexible, agile supply
chains in the ETO sector. A framework for mitigating uncertainty is provided, and the thesis
offers a structured route to achieving flexibility. The important steps for practitioners to
carry out are as follows: identify supply chain structure, identify sources of supply chain
uncertainty, optimise pipelines and configure network with required flexibility.
9.6 LIMITATIONS
While validity concerns were addressed in the methodology chapter, there are inevitable
limitations associated with the study and the methods adopted. Despite purposeful case
selection criteria, and the evaluation interviews conducted to establish external validity, the
sample size of case studies is a limitation. The case study phase o f th e research provides an
in-depth investigation o f two ETO systems. Both systems are from the construction sector.
The evaluation interviews were designed to gather evaluative data from interviewees
outside of these two systems, but within the construction sector. W hile this research strategy
does bolster the case for generalisability, any claims must be m ade w ith caution.
A further limitation related to the issue of sampling is the coverage of ETO sectors in the
study. The literature review highlighted a range o f sectors associated with the ETO supply
chain. While potential interviewees were targeted from a range o f construction sectors, the
full range o f construction companies is not accounted for. The interviewees do, however,
fulfil the range o f organisational types hoped for including clients, manufacturers, network
co-ordinators, design, logistics and organisational bodies.
252

[Chapter 9 - Conclusions]
While every effort to address construct validity concerns has been made, there is a
subjective element in the research process that must be acknowledged. Triangulation
techniques, interview questions grounded in the literature, brainstorming sessions, and
prolonged engagement with case companies were some of the techniques used to ensure
construct validity. Key industry contacts review case reports and project outputs. Process
maps co-created and cross checked with industry, and interview transcripts were cross
checked by industry. Progress presentations were also regularly delivered to industry and
academic collaborators and the overall findings were examined for construct validity
through the evaluation interviews. However, as many of these techniques rely on subjective
perceptions, it is difficult to provide hard ‘proof that the models, classifications and
concepts are an accurate picture o f reality. It is hoped that the techniques described above,
together with a transparent data collection and analysis process, provide a robust response to
construct validity concerns.
9.7 FURTHER RESEARCH
This research has added structure to a relatively unchartered research field. Hence, a range
of future research avenues can be identified. Constraints relating scope, time, finance and
access prevented the uptake o f these areas. First and foremost, to address the lack of
coverage of all ETO sectors, evaluation interviews in other ETO sectors, such as
shipbuilding, tool making and high technology would add to the potential to generalise to
all ETO sectors. In addition to this, a number of key areas for development are identified.
Further research could be undertaken that would help to develop a more accurate definition
of the ETO supply chain. These are as follows:
• Where are the decoupling points within the design stage? The structured literature
review highlighted that decoupling points may exist in the design stage of the ETO
supply chain. This was re-iterated in the evaluation interviews, showing that
practitioners also recognise that there may be strategic buffer points within the
design process.
• How can project classifications be incorporated into ETO supply chain definitions?
Various project classifications are proposed in the literature. Given that the ETO
253

[Chapter 9 - Conclusions]
supply chain operates in a project environment, due consideration of project type
would add to strategy formulation. Building on the findings of chapter 4, a further
avenue that could be pursued is the factors that differentiate the mix of uncertainties
in individual projects.
The evaluation interviews identified fruitful areas for further research relating to the
assessment of flexibility requirements and the application of this in industry. These are as
follows:
• How much flexibility is required? This research has identified which flexibility
types are required and a methodology for identifying these requirements. It has not
identified how much of each flexibility type is required.
• How much does flexibility cost? As identified in the evaluation interviews, a cost-
benefit analysis o f the flexibility types would support further commercialisation.
• An assessment tool for current flexibility capabilities would also help companies to
diagnose current state, and match this against the desired state that is identified in
this research.
• These follow-on studies could be supported by action research projects
implementing flexibility re-engineering programmes in industry. This would involve
re-engineering supply chains with more appropriate capabilities for managing
uncertainties and observing the effectiveness of these changes.
• The conceptual model for supply chain flexibility could be applied and researched in
different industries.
A final area that would be fruitful for more research is ‘when to reduce and when to respond
to uncertainty’? This thesis focussed on the response to uncertainty in ETO supply chains,
and in doing so has addressed a gap in the literature. The reduction of uncertainty as an
approach to managing uncertainty has been previously addressed by researchers in other
areas of supply chain management (Childerhouse and Towill, 2004). A fruitful area of
research would be to integrate these two approaches.
254

[Chapter 9 - Conclusions]
9.8 CONCLUSIONS
In this final chapter, Jhe primary aim of the study has been discussed along with the findings
for each o f the research questions. The academic contributions have been summarised along
with the implications for practitioners. The chapter has also presented the limitations and
areas for future research.
■SUMMARY OF CHAPTER 9AIMS1. Articulate concise answers to each of the research questions
- Concise answers for each of the 4 RQs have been articulated2. Summarise the research findings in relation to the primary aim of the thesis
- The primary aim has been revisited and each chapter has been summarised3. Identify the academic contributions
- 5 principal contributions have been identified4. Identify the implications for practitioners
- These have been summarised, but are covered in greater depth in chapter8.5. Identify the limitations and areas for further research
- Limitations have been identified. The need to cover a greater range of ETO sectors was noted
- Further research has been identified in relation to ETO definitions and flexibility assessm ent
255

[References]
REFERENCES
1. Abrahamsson, M. Aldin, N. and Stahre, F., 2003. Logistics platforms for improved strategic flexibility. International Journal o f Logistics Research and Applications, 6(3), 85-106.
2. Ackermann, F. Eden, C. Williams, T. and Howick, S., 2007. Systemic risk assessment: a case study. The Journal o f the Operational Research Society, 58(1), 39-51.
3. Agapiou, A. Clausen, L. E. Flanagan, R. Norman, G. and Notman, D., 1998a. The role of logistics in the materials flow control process. Construction Management and Economics, 16(2), 131-137.
4. Agapiou, A. Flanagan, R. Norman, G. and Notman, D., 1998b. The changing role of builders merchants in the construction supply chain. Construction Management and Economics, 16(3), 351 - 361.
5. Aguayo, R. 1991. Dr Demming: The American who taught the Japanese about quality. New York: Fireside.
6. Aitken, J. Childerhouse, P. Christopher, M. and Towill, D., 2005. Designing and managing multiple pipelines. Journal o f Business Logistics, 26(2), 73-96.
7. Aitken, J. Childerhouse, P. and Towill, D., 2003. The impact of product life cycle on supply chain strategy. International Journal o f Production Economics, 85(2), 127-140.
8. Akintoye, A. McIntosh, G. and Fitzgerald, E., 2000. A survey of supply chain collaboration and management in the UK construction industry. European Journal of Purchasing & Supply Management, 6(3-4), 159-168.
9. Al-Bahar, J. F. and Crandall, K. C., 1990. Systematic Risk Management Approach for Construction Projects. Journal o f Construction Engineering and Management, 116(3), 533- 546.
10. Amaro, G. Hendry, L. and Kingsman, B., 1999. Competitive advantage, customisation and a new taxonomy for non make-to-stock companies. International Journal of Operations & Production Management, 19(4), 349-371.
11. Arlbjom, J. S. and Halldorsson, A., 2002. Logistics knowledge creation: reflections on content, context and processes. International Journal of Physical Distribution & Logistics Management, 32, 22-40.
12. Babu, A. S., 1999. Strategies for enhancing agility of make-to-order manufacturing systems. International Journal of Agile Management Systems, 1(1), 23-29.
256
[References]
13. Baccarini, D., 1999. The Logical Framework Method for Defining Project Success. Project Management Journal, 30(4), 25-32.
14. Baccarini, D. and Archer, R., 2001. The risk ranking of projects: A methodology. International Journal o f Project Management, 19(3), 139-145.
15. Baker, P., 2006. Designing distribution centres for agile supply chains. International Journal of Logistics, 9 (3), 207-221.
16. Ballard, G. and Howell, G., 1998. Shielding Production: Essential Step in Production Control. Journal o f Construction Engineering and Management, 124(1), 11-17.
17. Ballard, G. and Howell, G., 2002. Lean project management. Building Research and Information, 31 (2), 119-133.
18. Barad, M. and Even Sapir, D., 2003. Flexibility in logistic systems-modeling and performance evaluation. International Journal of Production Economics, 85 (2), 155-170.
19. Barker, R. Childerhouse, P. Naim, M. Masat, J. and Wilson, D., 2004. Potential of Total Cycle Time Compression in Construction: Focus on Program Development and Design. Journal of Construction Engineering & Management, 130(2), 177-187.
20. Barker, R. Hong-Minh, S. and Naim, M. M., 2000. The terrain scanning methodology, Assessing and improving construction supply chains. European Journal of Purchasing & Supply Management, 6(3-4), 179-193.
21. Barker, R. and Naim, M. M., 2004. Housebuilding Supply Chains: Remove Waste — Improve Value. International Journal of Logistics Management, 15(2), 51-64.
22. Barker, R. and Naim, M. M., 2008. Is supply chain thinking permeating the UK housebuilding industry? Findings from a survey of UK housebuilders. International Journal of Logistics Research and Applications: A Leading Journal of Supply Chain Management, 11(1), 6 7 -8 0 .
23. Barlow, J., 1999. From Craft Production to Mass Customisation. Innovation Requirements for the UK Housebuilding Industry. Housing Studies, 14(1), 23 - 42.
24. Barlow, J. Childerhouse, P. Gann, D. Hong-Minh, S. v. Naim, M. and Ozaki, R., 2003. Choice and delivery in housebuilding: lessons from Japan for UK housebuilders. Building Research & Information, 31 (2), 134-145.
25. Barlow, J. and Ozaki, R., 2003. Achieving Customer Focus in Private Housebuilding: Current Practice and Lessons from Other Industries. Housing Studies, 18, 87-101.
26. Bask, A. H., 2001. Relationships among TPL providers and members of supply chains - a strategic perspective. The Journal of Business and Industrial Marketing, 16(6), 470-486.
257

[References]
27. Beach, R. Webster, M. and Campbell, K. M., 2005. An evaluation of partnership development in the construction industry. International Journal of Project Management, 23(8), 611-621.
28. Benbasat, I. Goldstein, D. K. and Mead, M., 1987. The Case Research Strategy in Studies of Information Systems. MIS Quarterly, 11(3), 369-387.
29. Berry, D. Evans, G. N. and Naim, M. M., 1998. Pipeline Information Survey: a UK Perspective. Omega, 26( 1), 115-131.
30. Bertrand, J. W. M. and Fransoo, J. C., 2002. Operations management research methodologies using quantitative modeling. International Journal of Operations & Production Management, 22, 241-264.
31. Bertrand, J. W. M. and Muntslag, D. R., 1993. Production control in engineer-to-order firms. International Journal of Production Economics, 30/31, 3-22.
32. Bhaskar, R. 2008. A Realist Theory o f Science Verso.
33. Biazzo, S., 2002. Process mapping techniques and organisational analysis: Lessons from sociotechnical system theory. Business Process Management Journal, 8(1), 42-52.
34. Bicheno, J. 2006. Fishbone Flow: Integrating Lean, Six Sigma, TPM and Triz. Picsie books: Birmingham.
35. Blackhurst, J. Craighead, C. W. Elkins, D. and Handfield, R. B., 2005. An empirically derived agenda o f critical research issues for managing supply-chain disruptions. International Journal o f Production Research, 43, 4067-4081.
36. Boghossian, P. 2006. Fear of Knowledge: Against Relativism and Constructivism Oxford: Clarendon Press
37. Bozarth, C. and Chapman, S., 1996. A contingency view of time-based competition for manufacturers. International Journal of Operations & Production Management, 16(6), 56-67.
38. Braunscheidel, M. J. and Suresh, N. C., 2009. The organizational antecedents of a firm's supply chain agility for risk mitigation and response. Journal of Operations Management, 27(2), 119-140.
39. Bresnen, M. and Marshall, N., 2000. Building partnerships: case studies of client- contractor collaboration in the UK construction industry. Construction Management and Economics, 18, 819-832.
40. Briscoe, G. and Dainty, A., 2005. Construction supply chain integration: an elusive goal? Supply Chain Management: An International Journal, 10(4), 319-326.
41. Bryman, A. and Bell, E. 2003. Business Research Methods. Oxford: University Press.
258

[References]
42. Burgess, K. Singh, P. J. and Koroglu, R., 2006. Supply chain management: a structured literature review and implications for future research. International Journal of Operations & Production Management, 26(7), 703-329.
43. Calder, B. 1994. Qualitative marketing research. In: Bagozzi, R. ed. Principles of marketing research. Oxford: Basil Blackwell.
44. Cameron, N. S. and Braiden, P. M., 2004. Using business process re-engineering for the development of production efficiency in companies making engineered to order products. International Journal of Production Economics, 89(3), 261-273.
45. Caron, F. and Fiore, A., 1995. "Engineer to order" companies: How to integrate manufacturing and innovative processes. International Journal of Project Management, 13(5), 313-319.
46. Chan, D. W. M. and Kumaraswamy, M. M., 1997. A comparative study of causes of time overruns in Hong Kong construction projects. International Journal of Project Management, 15(1), 55-64.
47. Chapman, C., 1997. Project risk analysis and management—PRAM the generic process. International Journal o f Project Management, 15(5), 273-281.
48. Chapman, C. B., 1979. Large Engineering Project Risk Analysis. IEEE Transactions on Engineering Management, EM26(3), 78-86.
49. Childerhouse, P. Aitken, J. and Towill, D. R., 2002. Analysis and design of focused demand chains. Journal o f Operations Management, 20(6), 675-689.
50. Childerhouse, P. Hermiz, R. Mason-Jones, R. Popp, A. and Towill, D. R., 2003a. Information flow in automotive supply chains-identifying and learning to overcome barriers to change. Industrial Management + Data Systems, 103(7), 491-502.
51. Childerhouse, P. Hong-Minh, S. and Naim, M. M. 2000. House building supply chain strategies: selecting the right strategy to meet customer requirements.#/* Annual Conference o f the Internaltional Group fo r Lean Construction. Brighton, UK:
52. Childerhouse, P. Lewis, J. Naim, M. and Towill, D. R., 2003b. Re-engineering a construction supply chain: A material flow control approach. Supply Chain Management, 8(3/4), 395-406.
53. Childerhouse, P. and Towill, D. R., 2003. Engineering the seamless supply chain. International Journal o f Logistics Management, 14(1), 109-120.
54. Childerhouse, P. and Towill, D. R., 2004. Reducing uncertainty in European supply chains. Journal of Manufacturing Technology Management, 15(7), 585-598.
259

[References]
55. Chin-Sheng, C., 2006. Concurrent engineer-to-order operation in the manufacturing engineering contracting industries. International Journal of Industrial and Systems Engineering, 1(1-2), 37-58.
56. Chopra, S. and Sodhi, M. S., 2004. Managing Risk to Avoid Supply-Chain Breakdown. MIT Sloan Management Review, 46(1), 53-61.
57. Christopher, M., 2000. The agile supply chain. Industrial Marketing Management, 29(1), 37-44.
58. Christopher, M. 2005. Logistics and Supply Chain Management: Creating Value- Adding Networks. Financial Times Prentice Hall.
59. Christopher, M. and Jtittner, U., 2000. Developing strategic partnerships in the supply chain: a practitioner perspective. European Journal of Purchasing & Supply Management, 6(2), 117-127.
60. Christopher, M. and Lee, H., 2004. Mitigating supply chain risk through improved confidence. International Journal of Physical Distribution & Logistics Management, 34(5), 388-396.
61. Christopher, M. Lowson, R. and Peck, H., 2004. Creating agile supply chains in the fashion industry. International Journal o f Retail & Distribution Management, 32(8), 367- 376.
62. Christopher, M. and Towill, D., 2001. An integrated model for the design of agile supply chains. International Journal o f Physical Distribution & Logistics Management, 31(4), 235-246.
63. Christopher, M. and Towill, D. R., 2000. Supply chain migration from lean and functional to agile and customised. Supply Chain Management, 5(4), 206-213.
64. Christopher, M. and Towill, D. R., 2002. Developing market specific supply chain strategies. International Journal of Logistics Management, 13(1), 1-14.
65. Chua, D. K. H. Kog, Y. C. and Loh, P. K., 1999. Critical Success Factors for Different Project Objectives. Journal of Construction Engineering and Management, 125(3), 142-150.
66. Chung, W. W. C. Yam, A. Y. K. and Chan, M. F. S., 2004. Networked enterprise: A new business model for global sourcing. International Journal of Production Economics, 87(3), 267-280.
67. Clough, R. H. Sears, G. A. and Sears, S. K. 2000. Construction Project Management. 4th ed. New York: John Wiley & Sons.
68. Collier, A. 1994. Critical realism. London: Verso.
260

[References]
69. Collins, R. S. and Schmenner, R. W., 1993. Achieving rigid flexibility: factory focus for the 1990s. European Management Journal, 11(4), 443-447.
70. Conroy, G. and Soltan, H., 1998. ConSERV, a project specific risk management concept. International Journal o f Project Management, 16(6), 353-366.
71. Constructing-Excellence. 2003. Available at: <URL: http://www.constructingexcellence.org.uk/tools/sfctoolkit/cl workbooks/cl workbooks 1 .ht ml > [Accessed: 15/6/2009]
72. Cooney, R., 2002. Is "lean" a universal production system? Batch production in the automotive industry. International Journal of Operations & Production Management, 22(9/10), 1130-1147.
73. Cooper, M. C. Lambert, D. M. and Pagh, J. D., 1997. Supply Chain Management: More Than a New Name for Logistics. The International Journal of Logistics Management, 8, 1-14.
74. Coronado, A. E. and Lyons, A. C., 2007. Evaluating operations flexibility in industrial supply chains to support build-to-order initiatives. Business Process Management Journal, 13(4), 572-587.
75. Corti, D. Pozzetti, A. and Zorzini, M., 2006. A capacity-driven approach to establish reliable due dates in a MTO environment. International Journal of Production Economics, 104(2), 536-554.
76. Coughlan, P. and Coghlan, D. 2009. Action research.Researching Operations Management. New York: Routledge.
77. Cousins, P. D., 2002. A conceptual model for managing long-term inter-organisational relationships. European Journal o f Purchasing and Supply Management, 8, 71-82.
78. Cox, A. 2009. Strategic Management of Construction Procurement. In: O'Brien, W.J. et al. eds. Construction Supply Chain Management Handbook. CRC Press.
79. Cox, A. and Chicksand, D., 2005. The Limits of Lean Management Thinking: Multiple Retailers and Food and Farming Supply Chains. European Management Journal, 23(6), 648-662.
80. Cox, A. and Ireland, P., 2002. Managing construction supply chains: the common sense approach. Engineering Construction and Architectural Management, 9(5-6), 409-418.
81. Cox, A. and Thompson, I., 1997. 'F it for purpose' contractual relations: determining a theoretical framework for construction projects. European Journal of Purchasing & Supply Management, 3(3), 127-135.
82. Cox, J. F. and Blackstone, J. H. eds. 1998. APICS Dictionary. 9th ed. Falls Church: The APICS Educational and Research Foundation.
261
i

f
[References]
83. Cravens, D. W. and Piercy, N. F., 1994. Relationship marketing and collaborative networks in service. International Journal of Service Industry Management, 5(5), 39-44.
84. Cridland, J. 2010. Public sector construction vital to economy. The Guardian. 5th March.
85. Croom, S. Romano, P. and Giannakis, M., 2000. Supply chain management: an analytical framework for critical literature review - management of R&D activity. European Journal of Purchasing and Supply Management, 6, 67-83.
86. Cusumano, M. A., 1994. The Limits of "Lean". Sloan Management Review, 35(4), 27-32.
87. D'Souza, D. E. and Williams, F. P., 2000. Toward a taxonomy of manufacturing flexibility dimensions. Journal o f Operations Management, 18(5), 577-593.
88. Dainty, A. R. J. Briscoe, G. H. and Millett, S. J., 2001a. New perspectives on construction supply chain integration. Supply Chain Management, 6(3/4), 163-173.
89. Dainty, A. R. J. Briscoe, G. H. and Millett, S. J., 2001b. Subcontractor perspectives on supply chain alliances. Construction Management and Economics, 19(8), 841 - 848.
90. Das, S. K. and Abdel-Malek, L., 2003. Modeling the flexibility of order quantities and lead-times in supply chains. International Journal of Production Economics, 85, 171-181.
91. Davis, T., 1993. Effective Supply Chain Management. Sloan Management Review, 34(4), 35-46.
92. de Boer, L. Labro, E. and Morlacchi, P., 2001. A review of methods supporting supplier selection. European Journal o f Purchasing & Supply Management, 7(2), 75-89.
93. DeFillippi, R. J. and Arthur, M. B., 1998. Paradox in project-based enterprise: The case of film making. California Management Review, 40(2), 125-139.
94. DeMeyer, A. Loch, C. H. and Pich, M. T., 2002. Managing project uncertainty: From variation to chaos. MIT Sloan Management Review, 43(2), 60-67.
95. Denzin, N. 1978. The reserach act: a theoretical introduction to sociological methods New York: McGraw-Hill.
96. Diekmann, J. E. and Girard, M. J., 1995. Are Contract Disputes Predictable? Journal of Construction Engineering and Management, 121(4), 355-363.
97. Donselaar, K. v. Kopczak, L. R. and Wouters, M., 2001. The use of advance demand information in a project-based supply chain. European Journal of Operational Research, 130(3), 519-538.
262
I.

I
[References]
98. Dreyer, B. and Gronhaug, K., 2004. Uncertainty, flexibility, and sustained competitive advantage. Journal o f business research, 57, 484-494.
99. Duclos, L. K. Vokurka, R. J. and Lummus, R. R., 2003. A conceptual model of supply chain flexibility. Industrial Management & Data Systems, 103, 446-456.
100. Easterby-Smith, M. Thorpe, R. and Jackson, P. R. 2008. Management Research. 3rd Edition ed. London: Sage.
101. Easterby-Smith, M. Thorpe, R. and Lowe, A. 1991. Management Research: An Introduction. London: Sage Publications.
102. Easton, G. and Rothschild, R. 1987. The influence of product and production flexibility on marketing strategy. In: Pettigrew, A. ed. The Management of Strategic Change. Oxford: Basil Blackwell Limited.
103. Ebadian, M. Rabbani, M. Jolai, F. Torabi, S. A. and Tavakkoli-Moghaddam, R., 2008. A new decision-making structure for the order entry stage in make-to-order environments. International Journal of Production Economics, 111(2), 351-367.
104. Edwards, P. J. and Bowen, P. A., 1998. Risk and risk management in construction: a review and future directions for research. Engineering Construction & Architectural Management, 5(4), 339-349.
105. Egan, J. 1998. Rethinking Construction: The Report of the Construction Task Force London: DETR.
106. Eisenhardt, K. M., 1989. Building theories from case study research. The academy of management review, 14(4), 532-550.
107. Elfving, J. A. Tommelein, I. D. and Ballard, G., 2005. Consequences of competitive bidding in project-based production. Journal of Purchasing and Supply Management, 11(4), 173-181.
108. Elliot, J. 1991. Action research for educational change. Philadelphia: Open University Press.
109. Ellram, L. M., 1991. Supply Chain Management: The Industrial Organisation Perspective. International Journal of Physical Distribution & Logistics Management, 21(1), 13-23.
110. Evaristo, R. and van Fenema, P. C., 1999. A typology of project management: emergence and evolution o f new forms. International Journal of Project Management, 17(5), 275-281.
111. Evered, R. and Louis, M. R., 1981. Alternative perspectives in the organizational sciences: 'Inquiry from the inside' and 'Inquiry from the outsid'. The academy of management review, 6(3), 385-395.
263

[References]
112. Fisher, M. L., 1997. What is the right supply chain for your product? Harvard Business Review, 75(2), 105-116.
113. Flynn, B. B. Sakakibara, S. Schroeder, R. G. Bates, K. A. and Flynn, E. J., 1990. Empirical Research Methods in Operations Management. Journal of Operations Management, 9(2), 250-284.
114. Formoso, C. T. Santos, A. D. and Powell, J. A., 2002. An exploratory study on the applicability of process transparency in construction sites. Journal of Construction Research, 3(1), 35-54.
115. Forrester, J. W. 1961. Industrial Dynamics Pegasus Communications
116. Fortune, C. and Setiawan, S., 2005. Partnering practice and the delivery of construction projects for Housing Associations in the UK. Engineering, Construction and Architectural Management, 12(2), 181-193.
117. Forza, C. and Salvador, F., 2002. Managing for variety in the order acquisition and fulfilment process: The contribution o f product configuration systems. International Journal of Production Economics, 76(1), 87-98.
118. Fuller, J. B. O Conor, J. and Rawlinson, R., 1993. Tailored logistics: The next advantage. Harvard Business Review, 71(3), 87-97.
119. Gann, D. M., 1996. Construction as a manufacturing process? Similarities and differences between industrialized housing and car production in Japan. Construction Management and Economics, 14, 437-450.
120. Geary, S. Childerhouse, P. and Towill, D., 2002. Uncertainty and the Seamless Supply Chain. Supply Chain Management Review, July/August, 52-61.
121. Geertz, C. 1973. The Interpretation o f Cultures: Selected Essays. London: Hutchinson of London.
122. Gelders, L. F., 1991. Production control in an engineer-to-order environment. Production Planning & Control, 2(3), 280 - 285.
123. Gereffi, G. 1994. The organisation o f buyer-driven global commodity chains: how US retailers shape global production networks. In: Gereffi, G. and Korzeniewicz, M. eds. Commodity Chains and Global Capitalism. Westport: Greenwood Press.
124. Gerwin, D., 1993. Manufacturing flexibility: A strategic perspective. Management Science, 39(4), 395-410.
125. Gibbons, M. C. Limoges, H. Nowotny, S. Schwartzman Scott, P. and Trow, M. 1994. The new production o f knowledge: the dynamics of science and research in contemporary societies. London: Sage.
264
[References]
126. Gil, N. Tommelein, I. D. Stout, A. and Garrett, T., 2005. Embodying Product and Process Flexibility to Cope with Challenging Project Deliveries. Journal of Construction Engineering and Management, 131(4), 439-448.
127. Gill, J. and Johnson, P. 1997. Research Methods for Managers. 2nd ed. London: Paul Chapman Publishing.
128. Gilmore, M. and Smith, D. J., 1996. Set-up reduction in pharmaceutical manufacturing: an action research study. International Journal of Operations & Production Management, 16, 4-17.
129. Goldman, S. L. Nagel, R. N. and Preiss, K. 1995. Agile competitors and virtual organizations: strategies for enriching the customer. United States: Van Nostrand Reinhold.
130. Goles, T. and Hirschheim, R., 2000. The paradigm is dead, the paradigm is dead...long live the paradigm: the legacy of Burrell and Morgan. Omega, 28, 249-268.
131. Gordon, C. M., 1994. Choosing Appropriate Construction Contracting Method. Journal of Construction Engineering and Management, 120(1), 196-210.
132. Gosain, S. Malhotra, A. and Sawy, O. A. E., 2005. Coordinating for Flexibility in e- Business Supply Chains. Journal of Management Information Systems, 21(3), 7-45.
133. Gosling, J. Naim, M. Fowler, N. and Feame, A., 2007a. Manufacturer's preparedness for agile construction. International Journal of Agile Manufacturing, 10(2), 113-124.
134. Gosling, J. and Naim, M. M., 2009. Engineer-to-order supply chain management: A literature review and research agenda. International Journal of Production Economics, 122(2), 741-754.
135. Gosling, J. Naim, M. M. Fowler, N. and Feame, A. eds. 2007b. CME25: Construction Management and Economics: Past, Present and Future Reading, UK:
136. Grant, R. M., 1991. The resource-based theory of competitive advantage: implications for strategy formulation. California management review, Spring, 114-135.
137. Green, S. D., 1999. The missing arguments of lean construction. Construction Management and Economics, 17(2), 133-137.
138. Greene, J. C. Caracelli, V. J. and Graham, W. F., 1989. Toward a Conceptual Framework for Mixed-Method Evaluation Designs. Educational Evaluation and Policy Analysis, 11(3), 255-274.
139. Gunasekaran, A., 1999. Agile manufacturing: A framework for research and development. International Journal of Production Economics, 62(1,2), 87-105.
265
[References]
140. Gunasekaran, A. and Ngai, E. W. T., 2005. Build-to-order supply chain management: a literature review and framework for development. Journal of Operations Management, 23(5), 423-451.
141. Hameri, A.-P., 1997. Project management in a long-term and global one-of-a-kind project. International Journal o f Project Management, 15(3), 151-157.
142. Handfield, R. B., 1994. Effects o f concurrent engineering on make-to-order products. Engineering Management, IEEE Transactions on, 41(4), 384-393.
143. Handfield, R. B. and Melnyk, S. A., 1998. The scientific theory-building process: a primer using the case o f TQM. Journal o f Operations Management, 16(4), 321-339.
144. Handfield, R. B. and Nichols, E. L. 1999. Introduction to supply chain management. Upper Saddle River: Prentice Hall
145. Harland, C. Brenchley, R. and Walker, H., 2003. Risk in supply networks. Journal of Purchasing and Supply Management, 9(2), 51-62.
146. Harland, C. M., 1996. Supply chain management: Relationships, chains and networks. British Journal of Management, 7, 63-80.
147. Hartley, J. L. Zirger, B. J. and Kamath, R. R., 1997. Managing the buyer-supplier interface for on-time performance in product development. Journal of Operations Management, 15(1), 57-70.
148. Harvey, C. Morris, H. and Kelly, A. 2007. Academic journal quality guide Association of business schools. Available at: <URL: http://www.the-ABS.org.uk> [Accessed: 10/9/08]
149. Hicks, C. McGovern, T. and Earl, C. F., 2000. Supply chain management: A strategic issue in engineer to order manufacturing. International Journal of Production Economics, 65(2), 179-190.
150. Hicks, C. McGovern, T. and Earl, C. F., 2001. A Typology of UK Engineer-to-Order Companies. International Journal o f Logistics, 4, 43-56.
151. Hill, T. 2005. Operations Management. New York: Palgrave Macmillan.
152. Hillson, D., 2002. Extending the risk process to manage opportunities. International Journal of Project Management, 20(3), 235-240.
153. Hines, P. Holweg, M. and Rich, N., 2004. Learning to evolve: A review of contemporary lean thinking. International Journal of Operations & Production Management, 24(9/10), 994-1011.
154. Hines, P. and Rich, N., 1997. The seven value stream mapping tools. International Journal of Operations & Production Management, 17, 46-64.

[References]
155. Hines, P. Rich, N. Bicheno, J. Brunt, D. Taylor, D. Butterworth, C. and Sullivan, J., 1998. Value Stream Management. The International Journal of Logistics Management, 9, 25-42.
156. Hines, P. arid Taylor, D. 2000. Going Lean. Cardiff: Lean Enterprise Research Centre
157. Hitt, M. A. Keats, B. W. and DeMarie, S. M., 1998. Navigating in the new competitive landscape: Building strategic flexibility and competitive advantage in the 21st century. Academy of Management Executive 12(4), 22-42.
158. Hoekstra, S. and Romme, J. 1992. Integral Logistics Structures: Developing Customer Oriented Goods Flow. London: McGraw-Hill.
159. Holweg, M., 2005. The three dimensions of responsiveness. International Journal of Operations & Production Management, 25(7/8), 603-622.
160. Holweg, M. and Pil, F. K., 2001. Successful Build-To-Order Strategies Start With the Customer. MIT Sloan Management Review, 43(1), 74-83.
161. Hum, S.-H. and Sim, H.-H., 1996. Time-based competition: literature review and implications for modelling. International Journal of Operations & Production Management, 16(1), 75-90.
162. Ireland, P., 2004. Managing appropriately in construction power regimes: understanding the impact of regularity in the project environment. Supply Chain Management, 9(5), 372-382.
163. Jahnukainen, J. and Lahti, M., 1999. Efficient purchasing in make-to-order supply chains. International Journal o f Production Economics, 59(1-3), 103-111.
164. Jick, T. D., 1979. Mixing Qualitative and Quantitative Methods: Triangulation in Action. Administrative Science Quarterly, 24(4), 602-611.
165. Johnson, R. B. and Onwuegbuzie, A. J., 2004. Mixed Methods Research: A Research Paradigm Whose Time Has Come. Educational Researcher, 33(7), 14-26.
166. Juttner, U., 2005. Supply chain risk management: Understanding the business requirements from a practitioner perspective. International Journal of Logistics Management, 16(1), 120-141.
167. Karkkainen, H. Piippo, P. and Tuominen, M., 2001. Ten tools for customer-driven product development in industrial companies. International Journal of Production Economics, 69(2), 161 -176.
168. Karkkainen, M. Holmstrom, J. Framling, K. and Artto, K., 2003. Intelligent products - A step towards a more effective project delivery chain. Computers in Industry, 50(2), 141-151.
267
[References]
169. Katayama, H. and Bennett, D., 1999. Agility, adaptability and leanness: A comparison of concepts and a study o f practice. International Journal of Production Economics, 60/61, 43-51.
170. Kingsman, B. Hendry, L. Mercer, A. and de Souza, A., 1996. Responding to customer enquiries in make-to-order companies Problems and solutions. International Journal of Production Economics, 46/47, 219-231.
171. Koskela, L. 1992. Application of the New Production Philosophy to Construction.Stanford University.
172. Koste, L. L. and Malhotra, M. K., 1999. A theoretical framework for analyzing the dimensions of manufacturing flexibility. Journal of Operations Management, 18(1), 75-03.
173. Koste, L. L. Malhotra, M. K. and Sharma, S., 2004. Measuring dimensions of manufacturing flexibility. Journal of Operations Management, 22(2), 171-196.
174. Krajewski, L. Wei, J. C. and Tang, L.-L., 2005. Responding to schedule changes in build-to-order supply chains. Journal of Operations Management, 23(5), 452-469.
175. Kraljic, P., 1983. Purchasing must become supply management. Harvard Business Review, 61(5), 109-117.
176. Lamming, R. Zheng, T. J. J. and Harland, C., 2000. An initial classification of supply networks. International Journal o f Operations & Production Management, 20(6), 675-691.
177. Lampel, J. and Mintzberg, H., 1996. Customizing Customization. Sloan Management Review, 38(1), 21-30.
178. Langley, A., 1999. Strategies for theorizing from process data. The Academy of Management Review, 24(4), 691 -710.
179. Latham, S. M. 1994. Constructing the team.Department of the Environment.
180. Lee, H. L., 2002. Aligning supply chain strategies with product uncertainties. California Management Review, 44(3), 105-119.
181. Lee, H. L., 2004. The Triple-A Supply Chain. Harvard Business Review, 82(10), 102- 112.
182. Lewis, J. A., 2009. Redefining qualitative methods: belivability in the fifth moment. International Journal o f Qualitative Methods, 8(2), 1-14.
183. Li, S. Ragu-Nathan, B. Ragu-Nathan, T. S. and Subba Rao, S., 2006. The impact of supply chain management practices on competitive advantage and organizational performance. Omega, 34(2), 107-124.

[References]
184. Lincoln, Y. S. and Guba, E. G. 1985. Naturalistic Enquiry. California: Sage Publications.
185. Little, D. Rollins, R. Peck, M. and Porter, J. K., 2000. Integrated planning and scheduling in the engineer-to-order sector. International Journal of Computer Integrated Manufacturing, 13, 545-554.
186. Lock, D. 2000. Project Management. 7th ed. Aldershot: Gower.
187. Lummus, R. J., Vokurka, L. K., and Duclos L .K ., 2005. Delphi study on supply chain flexibility. International Journal o f Production Research, 43(13), 2687-2708.
188. Lummus, R. R. and Vokurka, R. J., 1999. Defining supply chain management: a historical perspective and practical guidelines. Industrial Management & Data Systems, 99, 11-17.
189. Martinez-Olvera, C. and Shunk, D., 2006. Comprehensive framework for the development of a supply chain strategy. International Journal of Production Research, 44(21), 4511-4528.
190. Mason-Jones, R. Naim, M. and Towill, D. R., 1997. The impact of pieline control on supply chain dynamics The International Journal of Logistics Management, 8(2), 47-62.
191. Mason-Jones, R. Naylor, B. and Towill, D. R., 2000. Engineering the leagile supply chain. International Journal of Agile Management Systems, 2(1), 54-61.
192. Mason-Jones, R. and Towill, D. R., 1997. Information enrichment: designing the supply chain for competitive advantage. Supply Chain Management, 2(4), 137-148.
193. Mason-Jones, R. and Towill, D. R., 1998. Shrinking the supply chain uncertainty circle. IOM Control, 24(7), 17-22.
194. Mason-Jones, R. and Towill, D. R., 1999. Total cycle time compression and the agile supply chain. International Journal o f Production Economics, 62(1/2), 61-73.
195. Masson, R. Iosif, L. MacKerron, G. and Femie, J., 2007. Managing complexity in agile global fashion industry supply chains. The International Journal of Logistics Management, 18, 238-254.
196. Maylor, H. 1999. Project Management. Prentice Hall.
197. McGovern, T. Earl, C. F. and Hicks, C., 1999. Modelling supply chain management processes in engineer-to-order companies. International Journal of Logistics Research and Applications, 2, 147-159.
198. Mentzer, J. T. DeWitt, W. Keebler, J. S. and Min, S., 2001. Defining supply chain management. Journal of Business Logistics, 22(2), 1-25.

[References]
199. Meredith, J., 1998. Building operations management theory through case and field research. Journal of Operations Management, 16, 441-454.
200. Meredith, J. R. and Mantel, S. J. 2003. Project Management: A Managerial Approach 7th ed. John Wiley & Sons.
201. Meredith, J. R. Raturi, A. Amoako-Gyampah, K. and Kaplan, B., 1989. Alternative research paradigms in operations. Journal of Operations Management, 8(4), 297-326.
202. Merriam-Webster. 2009. Merriam-Webster Online Dictionary Available at: <URL: http://www.merriam-webster.com/dictionarv/uncertaintv
> [Accessed: 21 October]
203. Michael, J. R. and Urs, S. D., 1999. Rethinking research methods for the resource- based perspective: Isolating sources of sustainable competitive advantage. Strategic Management Journal, 20(5), 487-494.
204. Morlok, E. K. and Chang, D. J., 2004. Measuring capacity flexibility o f a transportation system. Transportation Research Part A: Policy and Practice, 38(6), 405-420.
205. Mulholland, B. and Christian, J., 1999. Risk Assessment in Construction Schedules. Journal of Construction Engineering and Management, 125(1), 8-15.
206. Mustafa, M. A. and Al-Bahar, J. F., 1991. Project risk assessment using the analytic hierarchy process. Engineering Management, IEEE Transactions on, 38(1), 46-52.
207. Naim, M. and Barlow, J., 2003. An innovative supply chain strategy for customized housing. Construction Management & Economics, 21(6), 593-602.
208. Naim, M. M. Childerhouse, P. Disney, S. M. and Towill, D. R., 2002. A supply chain diagnostic methodology: determining the vector of change. Computers & Industrial Engineering, 43(1/2), 135-157.
209. Naim, M. M. Potter, A. T. Mason, R. J. and Bateman, N., 2006. The role of transport flexibility in logistics provision. The International Journal of Logistics Management, 17, 297-311.
210. Narasimhan, R. Swink, M. and Kim, S. W., 2006. Disentangling leanness and agility: An empirical investigation. Journal of Operations Management, 24(5), 440-457.
211. Narasimhan, R. and Talluri, S., 2009. Perspectives on risk management in supply chains. Journal of Operations Management, 27(2), 114-118.
212. Naylor, J. B. Naim, M. M. and Berry, D., 1999. Leagility: Integrating the lean and agile manufacturing paradigms in the total supply chain. International Journal of Production Economics, 62(1,2), 107-118.
270

[References]
213. New, S. J., 1997. The scope of supply chain management research. Supply Chain Management, 2, 15-22.
214. O'Brian, W. J. Formosa, C. T. Vrijhoef, R. and London, K. A. eds. 2009. Construction Supply Chain M anagement HandbookCRC Press.
215. Oke, A., 2005. A framework for analysing manufacturing flexibility. International Journal of Operations & Production Management, 25, 973-996.
216. Olhager, J., 2003. Strategic positioning of the order penetration point. International Journal of Production Economics, 85(3), 319-329.
217. Olsen, R. F. and Ellram, L. M., 1997. A portfolio approach to supplier relationships. Industrial Marketing Management, 26(2), 101-113.
218. Papadopoulou, T. C. and Ozbayrak, M., 2005. Leanness: experiences from the journey to date. Journal of Manufacturing Technology Management, 16(7/8), 784-807.
219. Parker, D. B. Zsidisin, G. A. and Ragatz, G. L., 2008. Timing and extent of supplier integration in new product devlopment: a contingency approach. Journal of Supply Chain Management, 44(1), 71-83.
220. Pamaby, J., 1995. Systems engineering for better engineering Engineering Management Journal, 5(6), 256-266.
221. Patterson, F. D. and Neailey, K., 2002. A Risk Register Database System to aid the management of project risk. International Journal of Project Management, 20(5), 365-374.
222. Perminova, O. Gustafsson, M. and Wikstrom, K., 2008. Defining uncertainty in projects - a new perspective. International Journal of Project Management, 26(1), 73-79.
223. Peteraf, M. A., 1993. The cornerstones of competitive advantage: a resource based view. Strategic management journal, 14(3), 179-191.
224. Pheng, L. S. and Hui, M. S., 1999. The application of JIT philosophy to construction: a case study in site layout. Construction Management and Economics, 17(5), 657 - 668.
225. Pine, J. 1993. Mass customization: the new frontier in business competition. United States of America: Harvard Business School Press.
226. Porter, K. Little, D. Peck, M. and Rollins, R., 1999. Manufacturing classifications: relationships with production control systems. Integrated Manufacturing Systems, 10(4), 189-199.
227. Porter, M. E. 1985. Competitive advantage: creating and sustaining superior performance. New York: The free press.
271
[References]
228. Prater, E. Biehl, M. and Smith, M. A., 2001. International supply chain agility - Tradeoffs between flexibility and uncertainty. International Journal of Operations and Production Management, 21, 823-839.
229. Proverbs, D. G. and Holt, G. D., 2000. Reducing construction costs: European best practice supply chain implications. European Journal of Purchasing & Supply Management, 6(3-4), 149-158.
230. Pujawan, I. N., 2004. Assessing supply chain flexibility: a conceptual framework and case study. International Journal o f Integrated Supply Management, 1, 79-97.
231. Quinn, F. J., 1997. "What's the buzz?". Logistics Management, (February), 43-46.
232. Raftery, J. 1994. Risk analysis in project management. St Edmunds: Chapman & Hall.
233. Rahman, A. Rahim, A. Shariff, M. and Baksh, N., 2003a. Case study method for new product development in engineer-to-order organizations. Work Study, 52(1), 25-36.
234. Rahman, A. Rahim, A. Shariff, M. and Baksh, N., 2003b. The need for a new product development framework for engineer-to-order products. European Journal of Innovation Management, 6(3), 182-196.
235. Rich, N. and Hines, P., 1997. Supply-chain management and time-based competition: the role of the supplier association. International Journal of Physical Distribution & Logistics Management, 27(3/4), 210-225.
236. Rudberg, M. and Wikner, J., 2004. Mass customization in terms of the customer order decoupling point. Production Planning & Control, 15(4), 445 - 458.
237. Saad, M. Jones, M. and James, P., 2002. A review of the progress towards the adoption of supply chain management (SCM) relationships in construction. European Journal of Purchasing & Supply Management, 8(3), 173-183.
238. Salvador, F. Forza, C. and Rungtusanatham, M., 2002. Modularity, product variety, production volume, and component sourcing: theorizing beyond generic prescriptions. Journal of Operations Management, 20, 549-575.
239. Salvador, F. Rungtusanatham, M. Forza, C. and Trentin, A., 2007. Mix flexibility and volume flexibility in a build-to-order environment. International Journal of Operations & Production Management, 27(11), 1173-1191.
240. Samadhi, T. M. A. A. and Hoang, K., 1995. Shared computer-integrated manufacturing for various types of production environment. International Journal of Operations & Production Management, 15(5), 95-108.
241. Sanchez-Rodrigues, V. Stantchev, D. Potter, A. Naim, M. and Whiteing, A., 2008. Establishing a transport operation focused uncertainty model for the supply chain. International Journal of Physical Distribution & Logistics Management, 38(5), 388-411.
272

[References]
242. Sanchez, A. M. and Perez, M. P., 2005. Supply chain flexibility and firm performance: A conceptual model and empirical study in the automotive industry. International Journal of Operations & Production Management, 25, 681.
243. Sanchez, L. M. and Nagi, R., 2001. A review of agile manufacturing systems. International Journal o f Production Research, 39, 3561.
244. Sanchez, R., 1995. Strategic flexibility in product competition. Strategic Management Journal, 16(S1), 135-159.
245. Sanderson, J. and Cox, A., 2008. The challenges of supply strategy selection in a project environment: evidence from UK naval shipbuilding. Supply Chain Management: An International Journal, 13(1), 16-25.
246. Sanvido, V. G robler, F. Parfitt, K. Guvenis, M. and Coyle, M., 1992. Critical Success Factors for Construction Projects. Journal of Construction Engineering and Management, 118(1), 94-111.
247. Saunders, M. Lew is, P. and Thornhill, A. 2007. Research Methods for Business Students. 4th ed. London: Prentice Hall.
248. Sayer, A. 1999. R ealism and Social Science Sage Publications
249. Scarbrough, H. Sw an, J. Laurent, S. Bresnen, M. Edelman, L. and Newell, S., 2004. Project-Based Learning and the Role of Learning Boundaries. Organization Studies, 25(9), 1579-1600.
250. Schmenner, R. W ., 2001. Looking ahead by looking back: swift, even flow in the history of manufacturing. Production and Operations Management, 10(1), 87-96.
251. Schmenner, R. W. and Tatikonda, M. V., 2005. Manufacturing process flexibility revisited. International Journal of Operations & Production Management, 25(12), 1183- 1189.
252. Schonberger, R. J. 1990. Building a chain of customers : linking business functions to create the world class company. London: Free Press.
253. Scudder, G. D. and Hill, C. A., 1998. A review and classification of empirical research in operations managem ent. Journal of Operations Management, 16(1), 91-101.
254. Segerstedt, A. and Olofsson, T., 2010. Supply chains in the construction industry Supply Chain M anagement: An International Journal15(5), 347-353.
255. Sharp, J. M. Irani, Z . and Desai, S., 1999. Working towards agile manufacturing in the UK industry - The International Bi-Monthly for Total Quality Management. International Journal of Production Economics, 62, 155-169.
273
[References]
256. Shenhar, A. J., 2001. One Size Does Not Fit All Projects: Exploring Classical Contingency Domains. Management Science, 47(3), 394-414.
257. Shenhar, A. J. and Dvir, D., 1996. Toward a typological theory of project management. Research Policy, 25(4), 607-632.
258. Slack, N., 2005. The flexibility o f manufacturing systems. International Journal of Operations & Production Management, 25(12), 1190-1200.
259. Slack, N. Chambers, S. and Johnston, R. 2004. Operations Management. Prentice Hall.
260. Stake, R. 1994. The Art o f Case Study Research. Sage Publications.
261. Stalk, G., Jr., 1988. Time ~ The Next Source of Competitive Advantage. Harvard Business Review, 66(4), 41-52.
262. Sterman, J., 1989. Modeling managerial behavior—misperceptions of feedback in a dynamic decision making experimentManagement science, 35(3), 334-365.
263. Stevens, G. C., 1989. Integrating the Supply Chain. International Journal of Physical Distribution & Materials Management, 19(8), 3-8.
264. Stevenson, M. and Spring, M., 2007. Flexibility from a supply chain perspective: definition and review. International Journal of Operations & Production Management, 27(7), 685-713.
265. Stevenson, M. and Spring, M., 2009. Supply chain flexibility : an inter-firm empirical study. International Journal o f Operations & Production Management, 29(9), 946-971.
266. Storey, J. Emberson, C. and Reade, D., 2005. The barriers to customer responsive supply chain management. International Journal of Operations & Production Management, 25(3/4), 242-260.
267. Strauss, A. and Corbin, J. M. 1990. Basics of qualitative research: grounded theory procedures and techniques. California: Sage.
268. Stuart, I. McCutcheon, D. Handfield, R. McLachlin, R. and Samson, D., 2002. Effective case research in operations management: a process perspective. Journal of Operations Management, 20(5), 419-433.
269. Swafford, P. M. Ghosh, S. and Murthy, N., 2008. Achieving supply chain agility through IT integration and flexibility. International Journal of Production Economics, 116(2), 288-297.
274

[References]
270. Swafford, P. M. Ghosh, S. and Murthy, N. N., 2006. A framework for assessing value chain agility. International Journal of Operations and Production Management, 26, 118- 140.
271. Swamidass, P. M. and Newell, W. T., 1987. Manufacturing Strategy, Environmental Uncertainty and Performance: A Path Analytic Model. Management Science, 33(4), 509- 515.
272. Tachizawa, E. and Gimenez, C., 2009. Assessing the effectiveness of supply flexibility sources: an empirical research. International Journal of Production Research, 47(20), 5791- 5809.
273. Tachizawa, E. M. Thomsen, C. G. and nez, 2007. Drivers and sources of supply flexibility: an exploratory study. International Journal of Operations & Production Management, 27, 1115-1136.
274. Tang, C. and Tomlin, B., 2008. The power of flexibility for mitigating supply chain risks. International Journal o f Production Economics, 116, 12-27.
275. Tashakkori, A. and Teddlie, C. 2003. Handbook of mixed methods in social and behavioral research. London: Sage Publications.
276. Tersine, R. J. and Hummingbird, E. A., 1995. Lead-time reduction: The search for competitive advantage. International Journal of Operations & Production Management, 15(2), 8-18.
277. The Institution o f Civil Engineers 1998. Risk analysis and management for projects. London: Thoman Telford.
278. Thompson, I. Cox, A. and Anderson, L., 1998. Contracting strategies for the project environment. European Journal o f Purchasing & Supply Management, 4(1), 31-41.
279. Tommelein, I. D. Ballard, G. and Kaminsky, P. 2009. Supply chain management for lean project delivery. In: O'Brien, W.J. et al. eds. Construction supply chain management handbook. CRC Press.
280. Towill, D., 2003. Construction and the time compression paradigm. Construction Management and Economics, 2 f(6), 581 -591.
281. Towill, D. R., 1996. Time compression and supply chain management - a guided tour. Supply Chain Management: An International Journal, 1(1), 15-27.
282. Towill, D. R., 1997a. The seamless supply chain - The predator's strategic advantage. International Journal of Technology Management, 13(1), 37-56.
283. Towill, D. R., 1997b. Successful business systems engineering. Part 1: The systems approach to business processesEngineering Management Journal, 7(1), 55-64.
275

[References]
284. Towill, D. R., 2001. The idea of building business processes: The responsive housebuilder. Construction Management and Economics, 19(3), 285-293.
285. Towill, D. R. Childerhouse, P. and Disney, S. M., 2002. Integrating the automotive supply chain: Where are we now? International Journal of Physical Distribution & Logistics Management, 32(1/2), 79-95.
286. Tranfield, D. and Starkey, K., 1998. The Nature, Social Organization and Promotion of Management Research: Towards Policy. British Journal of Management, 9(4), 341-353.
287. Tu, Y., 1997. Production planning and control in a virtual One-of-a-Kind Production company. Computers in Industry, 34(3), 271-283.
288. Upton, D. M., 1994. The management of manufacturing flexibility. California Management Review, 36(2), 72-89.
289. Upton, D. M., 1995. W hat really makes factories flexible? Harvard Business Review, 73(4), 74-84.
290. Van-Hoek, R. I., 2000. The thesis of leagility revisited. International Journal of Agile Management Systems, 2, 196-201.
291. Van de Ven, A. H. and Poole, M. S., 1990. Methods for Studying Innovation Development in the M innesota Innovation Research Program. Organization Science, 1(3), 313-335.
292. van der Vorst, J. G. A. J. and Beulens, A. J. M., 2002. Identifying sources of uncertainty to generate supply chain redesign strategies. International Journal of Physical Distribution & Logistics Management, 32, 409-430.
293. Vickery, S. n. Calantone, R. and Droge, C., 1999. Supply Chain Flexibility: An Empirical Study. The Journal o f Supply Chain Management, 35(3), 16-24.
294. Vokurka, R. J. and O'Leary-Kelly, S. W., 2000. A review of empirical research on manufacturing flexibility. Journal of Operations Management, 18(4), 485-501.
295. Vonderembse, M. A. Uppal, M. Huang, S. H. and Dismukes, J. P., 2006. Designing supply chains: Towards theory development. International Journal of Production Economics, 100(2), 223-238.
296. Voordijk, H. Meijboom, B. and Haan, J. d., 2006. Modularity in supply chains: a multiple case study in the construction industry. International Journal of Operations & Production Management, 26(6), 600-618.
297. Voss, C. Tsikriktsis, N. and Frohlich, M., 2002. Case research in operations management. International Journal of Operations & Production Management, 22, 195-219.
276

[References]
298. Vrijhoef, R. and Koskela, L., 2000. The four roles of supply chain management in construction. European Journal of Purchasing & Supply Management, 6(3-4), 169-178.
299. Wacker, J. G. and Miller, M., 2000. Configure-to-order planning bills of material: Simplifying a complex product structure for manufacturing planning and control. Production and Inventory Management Journal, 41(2), 21-26.
300. Wadhwa, S. Bhoon, K. S. and Chan, F. T. S., 2006. Postponement strategies through business process redesign in automotive manufacturing: Knowledge innovation. Industrial Management & Data Systems, 106(307-326).
301. Wang, Y. Potter, A. and Naim, M., 2007. Electronic marketplaces for tailored logistics. Industrial Management + Data Systems, 107(8), 1170-1187.
302. Ward, S. and Chapman, C., 2003. Transforming project risk management into project uncertainty management. International Journal of Project Management, 21(2), 97-105.
303. Ward, S. C., 1999. Assessing and managing important risks. International Journal of Project Management, 17(6), 331-336.
304. Waring, A. 1996. Practical Systems Thinking. Oxford: Chapman Hall.
305. Wass, J. V. and Wells, P. E. 1994. Principles and Practice in Business and Management Research. Dartmouth Publishing Company.
306. Wathne, K. H. and Heide, J. B., 2004. Relationship Governance in a Supply Chain Network. Journal o f marketing, 68(January), 73-89.
307. Watson, G. H. 1994. Business Systems Engineering. John Wiley and Sons.
308. Wikner, J. and Rudberg, M., 2005. Integrating production and engineering perspectives on the customer order decoupling point. International Journal of Operations & Production Management, 25(7/8), 623-641.
309. Wilding, R., 1998. The supply chain complexity triangle: Uncertainty generation in the supply chain. International Journal of Physical Distribution & Logistics Management, 28(8), 599-616.
310. Wiliams, T. M., 1994. Using a risk register to integrate risk management in project definition. International Journal of Project Management, 12(1), 17-22.
311. William, J. K. James, T. C. T. and Subashish, G., 1997. Business process change: A study of methodologies, techniques, and tools. MIS Quarterly, 21(1), 55-80.
312. Williams, T. and Eden, C., 1995. The effects of design changes and delays on project costs. Journal of the Operational Research Society, 46(7), 809-819.
277

[References]
313. Williams, T. M., 1996. The two-dimensionality of project risk. International Journal of Project Management, 14(3), 185-186.
314. Winch, G. M. 2002. Managing Construction Projects. Oxford: Blackwell Publishing.
315. Winch, G. M. and Carr, B., 2001. Processes, maps and protocols: understanding the shape of the construction process. Construction Management and Economics, 19, 519-531.
316. Womack, J. P. and Jones, D. T. 1996. Lean Thinking: Banish Waste and Create Wealth in Your Corporation New York: Free press.
317. Womack, J. P. Jones, D. T. and Roos, D. 1990. The Machine That Changed The World. New York: Maxwell Macmillan international.
318. Wortmann, J. C., 1995. Comparison of information systems for engineer-to-order and make-to-stock situations. Computers in Industry, 26(3), 261-271.
319. Yang, B. and Bums, N., 2003. Implications of postponement for the supply chain. International Journal o f Production Research, 41(9), 2075 - 2090.
320. Yeo, K. T. and Ning, J. H., 2002. Integrating supply chain and critical chain concepts in engineer-procure-construct (EPC) projects. International Journal of Project Management, 20(4), 253-262.
321. Yin, R. K. 2003. Case study research: design and methods. 3rd ed. London: Sage publications.
322. Yusuf, Y. Y. and Adeleye, E. O., 2002. A comparative study of lean and agile manufacturing with a related survey of current practices in the UK. International Journal of Production Research, 40(17), 4545-4562.
323. Yusuf, Y. Y. Sarhadi, M. and Gunasekaran, A., 1999. Agile manufacturing: The drivers, concepts and attributes. International Journal of Production Economics, 62(1/2), 33-43.
324. Zhang, Q. Vonderembse, M. A. and Lim, J.-S., 2003. Manufacturing flexibility: Defining and analyzing relationships among competence, capability, and customer satisfaction. Journal o f Operations Management, 21 (2), 173 -191.
325. Zhang, Q. Vonderembse, M. A. and Lim, J. S., 2002. Value chain flexibility: a dichotomy of competence and capability. International Journal of Production Research, 40, 561-583.
326. Zorzini, M. Corti, D. and Pozzetti, A., 2008. Due date (DD) quotation and capacity planning in make-to-order companies: Results from an empirical analysis. International Journal of Production Economics, 112(2), 919-933.
278

[References]
327. Zwikael, O. and Globerson, S. 2006. From Critical Success Factors to Critical Success Processes.Intemational Journal of Production Research. Taylor & Francis Ltd. pp. 3433- 3449
279

[Appendices]
APPENDICES
APPENDIX 1 - OVERALL PROJECT DESCRIPTION AND
PROTOCOL
MainResearchProposition
Supply chain flexibility can enable ETO supply chains to cope with project uncertainties
InitialResearchQuestions
1. What is an ETO supply chain?2. What are the sources o f project uncertainty?3. What are the coping mechanisms for uncertainty?4. How can pipelines in ETO supply chains be improved?5. How can the network o f suppliers be configured to cope with uncertainty?
Units o f analysis
• Network Co-ordinator - the company that assumes responsibility for configuring the network o f suppliers, subcontractors and interdependent organizations that work together to deliver projects.
• Projects — a selection o f current projects in the network co-ordinator’s portfolio• Pipelines - the activities between an order being placed with a supplier and the order
being delivered.
DataCollectionTechniques
Interviews, process mapping, observations, brainstorming sessions, archival data
Sequence o f Activities
1) General IntroductionOrganise interviews with major process teams to gain understanding o f the system, the organisational structure and the type o f projects in the system.Identify subsystems
2) Project IdentificationDevelop criteria for project selection
3) Project Data CollectionObtain programme and documents for each o f the chosen projectsOrganise site visits and interviews with site management to gather data on risk and uncertainty
4) Supplier IdentificationDevelop criteria for supplier selectionOrganise site visit to supplier to undertake ‘pipeline survey’ (see appendix4)
5) Supply Chain ManagementUnderstand the systems and processes in place for managing subcontractors and suppliersInvestigate the role o f supply chain flexibility
6) Organise Brainstorming SessionsConsolidate uncertainty data collected from projects
Data analysisCross case analysis, process mapping, interview coding, quantification, descriptive statistics, cluster analysis, brainstorming and cause and effect analysis
280

[Appendices]
Deliverablesanddissemination
1) Case study report
2) Feedback presentations to McCLOSM and participating companies
3) Professional journals
4) Conference papers
5) Journal papers
Relevance to Organisations
- Independent view o f supply chain for participating companies- Transfer o f academic thinking/elements o f best practice- Able to demonstrate commitment to best practice/continuous improvement- Possibility to learn from other construction operations- Cross-learning between industrial partners
ProjectGovernance
R (responsible) — Mr Jonathan Gosling A (accountable) - Professor Mohamed NaimC (consulted) - Mr Nicholas Fowler, Mr Brain Moone, Dr. Robert Mason, Dr Andrew Potter, Professor Andrew FeameI (informed) — Dr. A. Glanfield, Dr Andrew Davis, McCLOSM team
281

[Appendices]
APPENDIX 2 - LOG OF INTERVIEWS FOR NETWORK CO
ORDINATORS
Network Coordinator 1 - Projects 1,2 and 3ProjectReference
Date Industrial Secondment: 10 weeks total spent at network co-ordinator 1.
11/4/06 Interview• Business Improvement Manager• Scope, scale and focus o f case study research
28/11/06 Interview• Business Improvement Manager• Data collection requirements• Secondment and timing plans
Project 2 30/6/06 Project Manager (project 2)• The role o f a project manager• Overview o f project 2
4/7/06 Interview• Supply Chain Manager• Purchasing Models• Key Performance Indicators• The sourcing database• Supply Chain Processes and Systems
Project 1 6/7/06 Site Visit to Project 1• Meeting with Project manager & Site Manager• Guided tour o f the site by the site manager• Profile and description o f the project• Inspection and discussion of project plans• Requisition forms and processes• Material Procurement and Suppliers
11/7/06 Brainstorming Session.• Business development team (5 People) and academic
collaborator• Scope, scale and focus o f case study research
Project 1 14/7/06 Interview• Quantity Surveyor• Work package preparation and pricing• The tender process• Work packages in Project 1• Problems, risks and uncertainty in project 1
Projects 1, 2 and 3
19/7/06 Interview• Buyer• Material procurement• Use o f ‘The Sourcing Database’• Requisition forms and processes
Project 1 29/5/07 Site Visit to Project 1 and Brainstorming Session• Site Manager, Project Manager, Quantity Surveyor,
Technical Manager.
282

[Appendices]
• Identify and consolidate supply chain uncertainties
Project 2 19/7/07 Quantity Surveyor• Work package preparation and pricing• The tender process• Work packages in Project 2• Problems, risks and uncertainty in project 2
Project 2 21/7/06 Site Visit to project 2• Observation o f team meeting (site manager, project
manager, quantity surveyor and buyer)• Problems, risks and uncertainty in project 2
26/7/06 Interview• Technical Manager• Pre-construction phases• Technical development• Relationships with Architects
18/8/06 Observation/participation in team meeting • Business Improvement Team
8/9/06 Interview• Business Improvement manager• Clarification o f data.
Project 2 13/10/06 Site Visit to project 2• Team meeting including Site manager, Project manager,
Quantity surveyor and Buyer10/11/06 Brainstorming session
• Academic from Kent Business School, Business improvement Manager, Project Leader.
• Scope, scale and focus o f case study research15/3/07 Interview
• Business Improvement Manager.Project 2 17/4/07 Site visit to project 2
• Watch deliveries o f pre cast concrete from the focal supplier in pipeline C
Project 2 17/4/07 Brainstorming session• Project manager and site manager• Identification o f supply chain uncertainties
11/12/08 Interview• Business Improvement Manager• Feedback presentation• Identification o f next steps.
Project 3 13/1/09 Site Visit to Project 3• Site managers and business improvement manager• Visit to different phases o f the project
Projects 1, 2 and 3
13/1/09 Brainstorming session• Business Improvement Manager, Supply Chain Manager,
Project Manager• Identify and consolidate supply chain uncertainties• Identify cause and effect o f uncertainties
Network Coordinator 2 — Projects 4 and 5
283
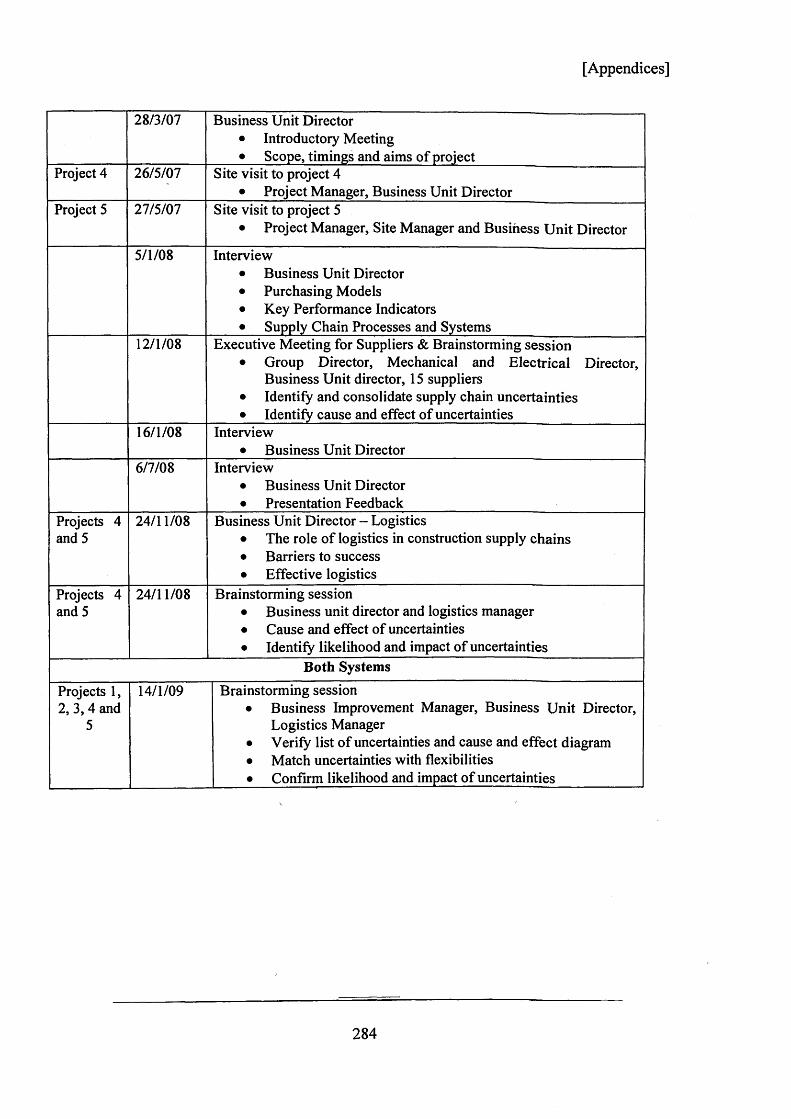
[Appendices]
28/3/07 Business Unit Director• Introductory Meeting• Scope, timings and aims o f project
Project 4 26/5/07 Site visit to project 4• Project Manager, Business Unit Director
Project 5 27/5/07 Site visit to project 5• Project Manager, Site Manager and Business Unit Director
5/1/08 Interview• Business Unit Director• Purchasing Models• Key Performance Indicators• Supply Chain Processes and Systems
12/1/08 Executive Meeting for Suppliers & Brainstorming session• Group Director, Mechanical and Electrical Director,
Business Unit director, 15 suppliers• Identify and consolidate supply chain uncertainties• Identify cause and effect o f uncertainties
16/1/08 Interview• Business Unit Director
6/7/08 Interview• Business Unit Director• Presentation Feedback
Projects 4 and 5
24/11/08 Business Unit Director - Logistics• The role o f logistics in construction supply chains• Barriers to success• Effective logistics
Projects 4 and 5
24/11/08 Brainstorming session• Business unit director and logistics manager• Cause and effect o f uncertainties• Identify likelihood and impact o f uncertainties
Both SystemsProjects 1, 2, 3 ,4 and
5
14/1/09 Brainstorming session• Business Improvement Manager, Business Unit Director,
Logistics Manager• Verify list o f uncertainties and cause and effect diagram• Match uncertainties with flexibilities• Confirm likelihood and impact o f uncertainties
284

[Appendices]
APPENDIX 3 - PROJECT UNCERTAINTY DATA COLLECTION
PROTOCOL
Aims and Objectives: Identify Uncertainties at different stages during the project life cycle
Research Question Addressed: What are the sources of uncertainty in engineer-to-order
projects?
Protocol:
1. Identify project
2. Gain an understanding of the project using documentation and informal interviews
with relevant employees
3. Organise site visit and interviews with site management
4. Use project uncertainty data collection template to gather data relating to project
uncertainties
The data collection template is shown on the following page:
285

[Appendices]
Project U ncertainty D ata Collection TemplateProject:Interviewee:
Standardised Project Phases (as defined by Winch and Carr)
1) W hat are the risks and uncertainties for this project during the following stages?
2) W here does this uncertainty O riginate from ?
3) How could this uncertainty be m itigated?
1) In your experience, w hat arethe general risks and
uncertainties experienced during the following project
stages?2) W here does this uncertainty
Originate from?3) How could this uncertainty be
mitigated?
Define Need
EstablishViability
Conception
Scheme Design
Detailed Design
ProductionPlanning
Construction (Main Trades)
Construction(FinishingTrades)
Commissioning
FacilityManagement
286

[Appendices]
APPENDIX 4 - THE PIPELINE SURVEY
The research protocol is as follows:
1. Identify Company
2. Arrange interview and site visit
3. Present introductory slides
4. Conduct Interview
5. Site Visit
6. Write up interview notes and notes from site tour
7. Data analysis - Coding o f interview data.
8. Data analysis - Develop process maps.
PIPELINE SURVEYCompany DetailsName: Company: Date:
Position of Interviewee:
No of Employees: Turnover:
Trade: Project working on in system:
Products and ServicesKey Markets?
Product and Service Range?
Areas o f Responsibility: Labour, Installation, Plant, Materials, Design, Delivery?
Geographical area covered?
287

[Appendices]
Project InterfaceDescription of works being undertaken:
Responsibilities: Labour/Plant/Materials/Design/Delivery
Other trades interfacing with (Any issues here?)?
Plant and Equipment Requirements?
Labour requirements?
Information requirements?
Materials and SuppliersMaterials (what type, who supplies, who responsible for ordering, trigger for ordering):
Key production inputs?
Stock held in days?
Central vs project stock?
288

[Appendices]
What form is the stock held in? Generic? Work in progress? Finished goods?
Buy from stock or made to order?
How do you manage your supply chain?
Key Performance Indicators for suppliers?
How do you forecast supply requirements?
ProductionWhat is the supply chain structure (Show and discuss supply chain structure diagram and
table showing attributes o f supply chain structures). Prompt interviewee to relate this to
their own operations.
Make to stock vs Make to order?
Planning System/IT System?
PROCESS STEPS:
Main Production Steps (suggest drawing brief process map)?
289

[Appendices]
Please could you describe the manufacturing process?
Inbound logistics?
Outbound logistics?
Key production inputs?
Is any of the assembly outsourced?
Customer ProfileMain Customer/Client Profile:
Repeat framework agreements or one offs?
How do you manage relationships with customers?
Collaborative forecasting?
Do you support your customers with bid development?
Strategic CapabilitiesFLEXIBILITY CAPABILITIES:
New Product Flexibility?
290

[Appendices]
Mix flexibility?
Volume Flexibility?
Delivery Flexibility?
Access Flexibility?
What are the sources o f competitive advantage?
/
291

292
Lead Time Activity: Enquiry Design Approval Procurement
Manufacture Stocks Transport Site
StorageSite
Integration
W hat amount of time would you estimate that the following contributes to the LT of product?Optimistic/Mo st likely/Pessimistic estimate?
What are the key problems/risks/uncertaintie s along the chain of activities?
What might help to overcome these issues?
Overall LTOptimistic LTMost Likely LTPessimistic LT [A
ppendices]

[Appendices]
APPENDIX 5 - INTERVIEW LOG FOR PIPELINE SURVEY
Date Product Interviewee(s) Factory Visit7/7/06 Windows Account Manager27/7/06 Pre-cast
ConcreteAccount Manager
3/10/06 Operations Manager and Site Manager from Network Coordinator
1
4/10/06 Metalwork Managing Director9/10/06
30/1/07
Lift Account Manager
Regional Sales Manager12/4/07 Roof
TrussesOperations Manager 1
27/06/07 Brick and Block
Sales Executive & Divisional Director
11/6/08 Paint Managing Director 126/6/08
13/1/08
ModularBathrooms
Business Development ManagerPresentation at Supplier training day
1
9/7/08 Drylining and Safety
Chief Estimator 1
22/1/09 Doors Account Manager29/1/09 Timber
FrameSystems
Sales Manager, Project manager & CAD engineer
1
2/2/09 Timber Account Manager
/
293

APP
END
IX
6 -
INPU
T-O
UTP
UT
DIA
GR
AM
03<DO
H8,a<
Clear Access And Work Without Interruption
Good Comms and Project Management
u
Good Relationships with SuppliersDesign Expertise
GoodRelationships
withSuppliers
s •3 i) o§■ § |UiJ Ud V) u«
Subcontractor Located On
Site For Quick Response
Early Involvement In
The Design Process
\
Mat
eria
ls 1
Wor
k
S«2®2>,