CONFIDENTIAL TREATMENT REQUESTED BY LEHMAN ...
324
CONFIDENTIAL TREATMENT REQUESTED BY LEHMAN BROTHERS HOLDINGS, INC. Lehman Brothers/Government Investigations CSE LBEX-WGM 000236
-
Upload
khangminh22 -
Category
Documents
-
view
3 -
download
0
Transcript of CONFIDENTIAL TREATMENT REQUESTED BY LEHMAN ...

CONFIDENTIAL TREATMENT REQUESTED BYLEHMAN BROTHERS HOLDINGS, INC.
Lehman Brothers/Government Investigations
CSE
LBEX-WGM 000236

CO
NFID
ENTIA
L TREA
TMEN
T REQ
UESTED
BY
LEHM
AN
BR
OTH
ERS H
OLD
ING
S, INC
.
r m m >< ~ G) s 0 0 0 1\) w ......
CP Daily Updates
Liquidity Pool Trend
Liquidity Pool Detail
Global Projections (Treasury MIS)
Global Repo Maturity Report
Executive Summary
- contains information concerning Lehman's
I Commercial Paper daily trade I activity
- contains information I concerning Lehman's liquidity
sources and uses within preceding 1 - 2 weeks
- contains a day to day I comparison of LBHIIiquidity
I
I
pool composition
- contains overview of Lehman's liquidity
- contains information concerning Lehman's repo lines by collateral allocation
- contains summary of Lehman's liquidity profile
Daily
I FED
I SEC Daily
FED
SEC Daily
I FED
--' SEC
Daily
FED
SEC Daily
I FED
SEC
Daily Treasury
FED

CO
NFID
ENTIA
L TREA
TMEN
T REQ
UESTED
BY
LEHM
AN
BR
OTH
ERS H
OLD
ING
S, INC
.
r m m >< ~ G) s 0 0 0 1\) w co
Eligible Collateral Report
Firm Financial Summary
Committed PB Report
Liquidity Pool Composition (Footnote)
Cash Capital
I concerning Lehman's eligible collateral (Liquid and Less
Liquid Assets)
- contains information concerning Lehman's Balance I Sheet, liquidity, cash capital
1 usage, traditional investment returns, issuance levels, loan
updates, and thriftlfunding sources and uses
- contains information I concerning Prime Brokerage
committed margin facilities
ains information
1
concerning LBHI, LBI and LBIE liquidity and the total
C&C equivalents available to LBHI
1tains information concerning Lehman's cash
I capital sources and uses on a week by week comparison
basis
Weekly
FED
SEC
Weekly
I FED
I
I SEC Weekly
I FED
Weekly I SEC
FED
SEC Weekly I Jim Giles I gilesi@ sec.gov I Treasury I Irina Veksler
FED

CO
NFID
ENTIA
L TREA
TMEN
T REQ
UESTED
BY
LEHM
AN
BR
OTH
ERS H
OLD
ING
S, INC
.
r m m >< ~ G) s 0 0 0 1\) w CD
Monthly Risk Review*
CSE Monthly Capital Computation**
* need to confirm recipients •• need to confirm recipients and
obtain copy of report
Monthly n!a nla
FED
SEC Monthly nla nla
FED

CONFIDENTIAL TREATMENT REQUESTED BYLEHMAN BROTHERS HOLDINGS, INC.
I. Presentation to the Fed & SEC for Lehman Bank Entities
2. Presentation to the Fed & SEC re: Stressed Liquidity Scenario
3. Quarterly Price Verification Review
4. Operating Results
5. Balance Sheet Analysis
6. Consolidating Balance Sheets
7. Consolidating Income Statements
9. Investment Management Division Results Overview
I 0. Investment Banking Division Resu Overview
!!.Liquidity & Funding Report
12. Capital Markets Overview
13. Regulatory Review: Executive Summary (capital, liquidity and funding)
- contains information concerning business plan for Lehman's three banks (LBBM, LBCB AND LBBAG), including balance
sheet information, key financial ratios, projected asset growth, cash and fu
- contains information concerning Lehman's funding philosophy and framework, lays out liquidity stress tests used by Lehman
and the assumptions built in to the liquidity stress tests
- contains information concerning Lehman's verification process with respect to its valuations of securitized products
and compares Lehman valuations against third party data
- P&L summary for Investment Banking division, Capital Markets division and Investment M division.
- contains information concerning Lehman's financial condition as compared to preceding quarter, including comparisons of equity roll forward, balance sheet leverage, long and short
inventory owned, corporate debt, mortgages and asset backed securities, commercial mortgage and real estate investments, inventory of global real estate, inventory of corporate equities,
a s of secured borrowi -contains overview of balance sheets for all Lehman Brothers
entities - contains details of balance sheets for each Lehman Brothers
- contains information concerning reported revenues, assets under rna and s nificant transactions
- contains information concerning Lehman's revenues and activity as compared to those of other major investment banks,
revenue detail by product type and by region, and market volume.
- contains information concerning Lehman's liquidity policy changes, any breaches of liquidity policy, debt issuances, cash
ital uirements and firm fi",..""",..' - contains information concerning LBHI capital markets
revenues and trends
- contains information concerning capital and risk allowances for LBHI, LSI, LBIE and LBJ.
LBEX-WGM 000240

CONFIDENTIAL TREATMENT REQUESTED BYLEHMAN BROTHERS HOLDINGS, INC.
LBEX-WGM 000241

CONFIDENTIAL TREATMENT REQUESTED BYLEHMAN BROTHERS HOLDINGS, INC.
LBEX-WGM 000242

CO
NFID
ENTIA
L TREA
TMEN
T REQ
UESTED
BY
LEHM
AN
BR
OTH
ERS H
OLD
ING
S, INC
.
r m m >< ~ G) s 0 0 0 1\) ~ w
Commercial Paper
16-Jul 17-Jul 18-Jul 19-Jul 20-Jul 21-Jul 22-Jul 23-Jul 24-Jul 25-Jul 26-Jul 27-Jul 28-Jul 29-Jul 30-Jul London Beginning Bal. 846 846 846 846 846 846 846 853 867 846 814 814 814 814 814
Maturing (432) (432) (432) (432) (432) (439) (453) (463) (431) (431) (431) Roll 432 432 432 432 439 453 432 431 431 . 431 426 Ending Bal. 846 846 846 846 846 846 853 867 846 814 814 814 814 814 809 /). 7 14 (21) (32) (5)
New York Beginning Bal. 3,397 3,287 3,341 3,145 3,145 3,145 3,159 3,179 3,526 3,099 3,242 3,242 3,242 2,922 2,958
Maturing (1 ,670) (1,560) (1 ,434) (1,309) (1 ,420) (1 ,452) (1,710) (1,535) (1,743) (1,266) (1 ,304) Roll ·1 ,560 1,614 1,238 1,322 1,440 1,799 1,282 1,678 1,423 1,302 1,503 Ending Bal. 3,287 3,341 3,145 3,145 3,145 3,159 3,179 3,526 3,099 3,242 3,242 3,242 2,922 2,958 3,158 /). (110) 54 (196) 13 20 347 (427) 144 (321) 36 200
Global 16-Jul 17-Jul 18-Jul 19-Jul 20-Jul 21-Jul 22-Jul 23-Jul 24-Jul 25-Jul 26-Jul 27-Jul 28-Jul 29-Jul 30-Jul B13ginning Bal. ft,243 ··• 4,133 · · · '.4;187;< ·· ; 3;991 : ; ..•. · :3,991•'·:., '· 3;991'-'"'%'!4,004~<;:{yc,)::fi4\Q.32 'iw <2;4;393\i' 'iji:f3j9452~i':'''{;~•(4i05pJ~\1/{:i!\(;'4).Q()6~7~\'6';;:;::4';'Q.56;::i'F}:1~;7<3.5';i!':''iCi'i;ji:3,7i:ZMi
Maturing (2,102) (1,992) (1 ,866) (1,741) (1,852) (1 ,891) (2,163) (1,998) (2,174) (1,697) (1,735) Roll 1,992 2,046 1,670 1,754 1,879 2,252 1,714 2;109 1,854 1,733 1,929
, ·Ending Bal:· · -~~-~lf;133-~;187---:-:~.-99Fi:"~-:--,c3Jj91· ':' ·.:·: 3,991··,,. D4;o<i4i~l;)q,(:~&ji,032~~klif{(i!4;393J ;q/:~3i9~5.::-0jc%~4;'o§6'~"~t4;(j5~~Y\;;::4;if51•~~'5'3\7:~~v,;~~6M
Confidential Treatment Requested

CO
NFID
ENTIA
L TREA
TMEN
T REQ
UESTED
BY
LEHM
AN
BR
OTH
ERS H
OLD
ING
S, INC
.
r m m >< ~ G) s 0 0 0 1\) ~ ~
31-Jul
809
(426) 423 806
(3)
3,158
(1,301) 882
2,739 (418)
31-Jul . · .. ··.· 3,966
(1,727) 1,305
3,545
1-Aug
806
(423) 423 806
2,739
(1,274) 1,382 2,847
108
1-Aug 3,545.
(1,697) 1,805
3,653
2-Aug 3-Aug 4-Aug 5-Aug 6-Aug 7-Aug 8-Aug 9-Aug 10-Aug 11-Aug 12-Aug 13-Aug 14-Aug 15-Aug 16-Aug
806 806 806 806 806 808 805 805 805 805 829 804 794 904 891
(423) (423) (423) (425) (422) (519) (447) (422) (412) (499) 423 423 425 422 422 544 422 412 522 486
806 806 806 806 808 805 805 805 805 829 804 794 904 891 891 2 (3) 25 (25) (10) 110 (13)
2,847 2,847 2,847 2,846 3,523 3,690 3,198 3,075 3,075 3,075 3,064 3,040 3,258 3,091 3,270
(1 ,319) (1 ,293) (2,019) (2,085) (1 ,472) (1 ,437) (1,340) (1,315) (1,482) (1 ,255) 1,318 1,970 2,185 1,593 1,349 1,427 1,315 1,534 1,315 1,434
!2,847 2,847 2,846 3,523 3,690 3,198 3,075 3,075 3,075 3,064 3,040 3,258 3,091 3,270 3,270 (2} 677 167 (492) (123) (11,1 (25) 219 (167) 178
2-Aug 3-Aug 4-Aug 5-Aug 6-Aug 7-Aug 8-Aug 9-Aug 10-Aug 11-Aug 12-Aug 13-Aug 14-Aug 15-Aug 16-Aug 3,653 '; '·3,653 • ''3,653 · ·. • '3i652·· • :: 4,329·.·• . 4,498;'ii>;;;•fi4;ooz.;,;:•~:~1:.{:3;1;18Qi,i~•'·' ': 3i81;1Q ;~::~.:•,!;~;81;10\f.i;: w;:;::3j894!~'i·fc;?;~i~3;il44'•·'7f.i"\'~:'4;053'i''>:•l'i:::\.:3;9~.6W,i•1i•:'fll14/161;:.~
(1,742) (1,716) (2,442) (2,510) (1,894) (1 ,957) (1,787) (1,737) (1,894) (1,754) 1,741 2,393 2,610 2,015 1,771 1,971 1,737 1,946 1,837 1,920
3,653 - '3,653 ,.·,,., /3,652 4,329 ' '. '4;498 4,ooz;.:·:di!;t3;!l8o .' :;; :'3;880 • :c 2iqi88o·,··, .:~;;tp.3;8.~4•;:•;.:o.;1~<~,844•>; ·•••oyi 4;05:3<',~\J;\(;.3;99.6\'):;,•:vk4;•t6i!!::£~;;;4~'M~'.1ill.1'f!
Confidential Treatment Requested 2

CO
NFID
ENTIA
L TREA
TMEN
T REQ
UESTED
BY
LEHM
AN
BR
OTH
ERS H
OLD
ING
S, INC
.
r m m >< ~ G) s 0 0 0 1\) ~ 0'1
17-Aug
891
891
3,270
3,27(}
17-Aug 4,161
4,161
18-Aug
891
(423) 409 877 (14)
3,270
(1 ,681) 1,245 2,834 (436)
18-Aug 4,161
(2,104) 1,654
3,711
19-Aug 20-Aug
877 803
(409) (335) 335 336 803 804 (74) 1
2,834 2,900
(1,256) (1,322) 1,322 1,275 2,900 2,853
66 (47)
19-Aug 20-Aug : 3,711 .• 3;703··
(1,665) (1,657) 1,657 1,611
'3,703 '3,657
21-Aug 22-Aug 23-Aug 24-Aug 25-Aug 26-Aug 27-Aug 28-Aug 29-Aug 30-Aug 31-Aug
804 804 804 804 804 894 945 558 558 558 558
(336) (336) (336) (387) 336 336 90 387 804 804 804 804 894 945 558 558 558 558 558
90 51 (387)
2,853 2,957 2,870 2,870 2,870 3,114 3,299 1,963 1,763 1,603 1,603
(1 ,275) (1 ,194) ,_.. (1 ,005) (1,327) (1,335) (20()) (160) 1,379 1,107 1,249 1,512 2,957 2,870 2,870 2,870 3,114 3,299 1,963 1,763 1,603 _1 ,603 1,603
104 (87) 244 185 (1,335) (200) (160)
21-Aug 22-Aug 23-Aug 24-Aug 25~Aug 26-Aug 27-Aug 28-Aug 29-Aug 30-Aug 31-Aug . 3,657 .···· 3,161 <. •··:3;674 ·. ; ,. 3;674•·· •·: \3;6(4 c/•%\!54;008 .(;, ''4;244 ''i ··:~2;522}i:::,·?;<;]'2;322~\"~<:.;•c2;t62!' 1:;:>;~ 2;1621
. (1 ,611) (1,530) (1,005) (1,663) (1,722) (200) (160) 1,715 1,443 1,339 1,~99
3,761 . .·: '3,674 < ·.' 3;674 . . . 3,674\• ::' . .)4,008 :, ::; '4;244: ) '·'2;522.: c:':<'2;322 .. : >"'''2;162}' ·::::.;.; 2;162::;.; :'i'2;'162··i
Confidential Treatment Requested 3

CO
NFID
ENTIA
L TREA
TMEN
T REQ
UESTED
BY
LEHM
AN
BR
OTH
ERS H
OLD
ING
S, INC
.
r m m >< ~ G) s 0 0 0 1\) ~ en
09/01/2008 and beyond
558
(559)
(1) (806)
1,603
(1,603)
(2,739)
09/01/2008 and beyond 2,162
(2,162)
(0)
Confidential Treatment Requested 4

CONFIDENTIAL TREATMENT REQUESTED BYLEHMAN BROTHERS HOLDINGS, INC.
LBEX-WGM 000247

CO
NFID
ENTIA
L TREA
TMEN
T REQ
UESTED
BY
LEHM
AN
BR
OTH
ERS H
OLD
ING
S, INC
.
r m m >< ~ G) s 0 0 0 1\) ~ co
DOD LBHI Liquidity l'ool Po.~ition
Uno;~;:<:un:d Facilities: Oms.c European SMBCIJPYJ
Sublntnl
Secaul!rlFncilities:
Suhtutnl
St.1BC(JPYJ MctUfc Bchnonl £Conduit) Fidelity BGI ABN Wc~tLB
LTI>Acth·ity
LTD Sculcn~nL~ LTDMntt~ritics
Suhtnl:ll
STDActi\·ity CP ~~~u.:mcc Bank Loan c.lmwclown STDMRiuritics:
Shurt-TcrmBVnotcs CP B:utkLoans
Lcth!TS ufCrcdit
Suhtntal
LoanFtmrlint-: Derinlth·es
lnt~n:OIIIJI:III)' fundhil!
lntcrcompMyfundint! Capit:1l injl'cliorv'rcpatrialion
Subtntal
ABCP ln\'cslm!nl Other
EOD LUlU Liqu:ictity·Pool Po.'>ltion
Oul<;lnnrlinJ! Cl' OOlance
2-.hm 44.6
(0.1)
{0.!)
JJJ 0.1
{(},{1)
(1.1)
(0.11)
1.9
(0.2)
(U.R!
11.0)
(l.ll)
(1.1)
43.3
9.7
J-.hlll 43.3
0.0
(ILl)
(0.1)
J.!l 0.1
{lUI)
{3.4) (0.1)
11.-1
(11.7)
(11.3)
0.0
lUI
Hl.l)
42..<
10.0
4-.lun 425
{lUI) (11.1))
:u II.~
(().[))
(3.7)
((1.1)
(11.4)
0.1 11.-1
0.5
11.5
0.5
0.5
44.0
9-<
S·Jtm 44.0
(lUI)
(lUI}
3.6 0,(
(IUIJ (4.1)
(0.2)
(lUi)
(11.4)
0.4
0.4
n.6
44.0
9.0
ti-.hm 44.0
(0.2)
(0.2)
2.9 0.1
(3.7)
(0.2)
(lJI)
(ll.l)
(0.2)
0.1
0.1
(().3)
42.4
8.1
9-.lnn 42.4
(().0)
(O.fl)
2.-1 0.0
(IU!J
0.4) (0.1)
(1.11)
0.2 {11.2)
(1.0)
(1.11)
0.3
40.6
7.2
/
llt·Jun 11-.Juu 1:!.-Jun 13-.Jun lti-Jun 17-.hm 18-.hm 19-Jnn 211-.hm 23-.Jnn 24-,hm 25-.Jnn 26-,Jun 27-.lun 3U-.hut 1-.lnl 2-.lul 3-Jul 4-.lnl 40.6 41.9 40.4 48.4 46.5 42.6 41.5 43.1 42.0 42.6 41.9 ·' 41.5 ··42.2• ···•'42.0·' •4U .. 41.0 :·.41.0 40.F·'·i·•.·J9.1'
(ti.OJ (1).{1)
2.7 0.1
!lUI) (2.3)
(0.0)
0.3
0.3 0.3
({).))
(0.3)
0.6
41.9
,_,
(0.1)
(0.1)
3.1 0.2
(2:.8) (0.1)
0.4
(11.1)
(1.9)
0.4
IIA
(0.1)
40.4
7.7
(i,(l
(lVI)
$.6
2.9 0.1
(0.0) (2.9)
(0.:!)
0,()
2.4
(0.1)
(0.:?..) (0.2)
0.1
48.4
7.H
(1.0)
(1.11)
(().:?.)
(11.2)
).6
0.1
(0.11)
(3..l)
(11.1)
(1.8)
(0.1) (11.7}
CUI
0.8
).)
46.5
6.0
({1.3)
(0.3)
\.3 0.1
(0.0) {1.3)
(}.3)
(1.1)
(IJ.I)
(1.2)
(0.8)
(11.8)
(0.4)
42.6
6.1
{(1.0)
{0.0)
0.9
0.1
{(l.fl)
{1.5)
(0.1)
((l.{l)
0.1 (0.3)
0.2
0.2
(0.4)
41.5
.5.5
Confidential Treatment Requested
(0.2)
(0.2)
).9
0.0
(0,[))
(!.Ill (0.1)
11.8
0.1 11.3
0.6
U.(i
1.1 (1.3)
43.1
6.4
(IJ.6)
(0.6)
2.1 0.1
(().())
(2.0)
(0.0)
11.2
(0.2)
(II. I)
0.0
11.1}
(0.5)
'42.0
6.S
{0.5) (05)
1.7
0.1
(0.1)) (2.1)
(0.1)
(0.4)
(11.21 1.2
0.3
0.3
0.3 {0.0)
!0.2) {(1.2)
2.11 0.1
[{Ul)
!Ut)
tO. I)
11.1
U.l tO,:!)
10.3)
10.3)
10.::!)
42.6 '11.9
6.1 6.2
{0.2)
{0.2)
2.0
0.1
(2.))
(0.1)
(11.2)
11.7 11.1
0.3
0.3
11.0) !0.1)
41.5
6.0
o.n <0.2) (().!)
2.3
1.3
HUl) {2.2) (0.1)
1.2
11.2 (11.11)
(1).2)
(U,2)
(0.3)
().(}
(0.0) (0.0)
2.4
0.0
<0.0) (2.6) (0.1)
(U.3)
0.4
{0.4)
(0.4)
(0.0)
42.2. . 42.0'
6.0 5.9
0.1)
10.0) {0.11)
2.5 ().()
tO,O)
1,2.5) tO.O)
1.0.0)
11.3 (0.3)
r.0.3J
(U.J}
10.7)
(0.2) (11.2)
2.1 {l.()
(0.1))
c.:to, (0.0)
(0.9)
(11.5)
tl.2
1.5 (0.1)
1.4
(0.0)
0.)
((l.O)
0.1
0.1
({UI)
{1.4)
(ll.tl)
(ll.l)
il.4
11.4
(0.9)
(11.9)
0.2
0.0 (11.0) (1.0
:w
(0,0)
(2.2) <0.1)
(11.3)
(0.1)
(0.5)
0.0
0.0
(0.11 (0.1)
:.w
(11.0) (2.0) (0.11)
0.11
0.4 (0.6)
(0.8)
0.0 (0.0)
0.0
0.4 0.1
((1.4)
(0.0)
11.1
•to .. · ·. ·•uf·· · 4I.o' ·.4o.1·· ...... ,·39.1 ~3?.2 ..
s.s 4.9 4.7 4.6 4.6 4.6

CO
NFID
ENTIA
L TREA
TMEN
T REQ
UESTED
BY
LEHM
AN
BR
OTH
ERS H
OLD
ING
S, INC
.
r m m >< ~ G) s 0 0 0 1\) ~ CD
BOD LlJHI Liquidity Pool Position
Un:sccun:d Fncilitit:,;:
Cha..\C
Europcrut
Slv1BCCJPYJ Suhtntal
Sccun:d.Fndlltit:s:
Suhtntal
SMBC(JPYJ MctLifc Belmont (Conduit) Fidelity BGI ABN WcstLB
LTD Acti1·ity LTD ScnlccncnL~
LTDMntUiitics Suhtntnl
~I'D t\cth·ity
CP l~stLOuJCc Bank L.mn drnwdown
STDMaturitics:
Shan-Term 8 V notes CP 8arJkloM~
Lcncrs ufCrcdit
Suhtntal
Luun Fmxling_ Dcli1·ath·cs
lntct"CUlllJ~Iny fundiJll.:
Intcrcompomyfundinl:! C:1pit:1l injc.::tionhcpntrialiun
Subtntnl
ABCP lnvc~Lln!nt Other
EOD LHHI Liquidity P()(ll Position
OutstanclinA CP habmce
7-.lul 39:2
0.0
m.IJ (11.1)
2.3 n.n
((UIJ (2.2}
ti}.IJ
(11.11)
0.1 (11.4)
(0.1)
(11.1)
0.0
38.7
4,7
8-.Jul 3'8.'1
lUI (1}.0)
11.11
:u 0.0
(11.11)
tlJJ ((l.O)
{11.1)
(11.3) (ll.2)
0.4
11.4
ltl.O)
38.4
4.5
9-.lnl llt·Jul 11-.Jul 14-Jul 15-.Jnl lll-Jul 17-.)ul 18-.Iul 21-Jul 22-Jul 23-Jtll 24-.Jul 25-Jul 28-.lul 29-.lul 311-.lul 31-Jul 1-Au.p: 4-Aug 5-An~ 6-Au~ 7-Aug 8-Au~ 11-Atq.:
38.4 39.9 40.3 40.2. ··39.5 38.6. 38.2 38.6 40.1 ··40.1 38.0 39.1i 39.7 .. 40.1 39.5. "39.0' 39.7.-""39.2':. 39.2· "39.2' 39.7 ···.40.3"·····'.'38,6'······"'38.5·<
0.1
(0.21
(II. I)
2J n.n
CIJ.{lJ
(1.1)
(0.0)
ll.2
(11.2)
1.3
tl.l
11.1
ll.l
39.9
4.7
0.1 {(}.I}
0.0
2.3 0.0
(!).())
(1.1)
10.0)
11.1
(11.11)
0.4
40.3.
4.8
(0.1)
(11.1)
1.1
tl.O
(0.0) (1J)
to ,OJ
(11.3)
(11.1)· 11.4
(0.1)
(ILl)
0.0
40.2
4S
lUI {{).2)
(11.2)
2.3 tl.O
(0.0) (2.4)
(0.0)
(0.1)
(11.2) (0.1)
OJ
0.3
(().4)
39-'i
4S
ll.O (0.0)
(11,0)
2.1 0.1
(0.11) {2.3J (1.2)
(1.3)
0.5 (0.6)
0.9
0.9
(0.3)
38.6
4.2
(1).5)
(11.5)
2.0 11.1
(11.0) (1.11 ({}.\)
(0.1)
(11.3)
0.4
38.2
4.1
(ll.IJ (0.1)
2.0 0.1
(0.0)
(2.0)
!0.1)
o.n
l.S (11.5)
({1.3)
(0.3)
(0.31
38.6
4.2
11.3
tii.JI (11.0)
1.7 1.1
(fl.OJ (1.9)
(0.1)
0.7
(0.1)
0.2
(0.4)
(11.4)
0.7
0.4
40.1
4.0
to. I) !0.1)
1.8 0.1
(0.0) (1.7)
(0.1)
0.1
0.1 0.1
0.?
0.5
(0.3! (0.3)
40.1
4.0
0.11 10.01 (0,0)
1.9 0.3
JI}.O) (1.9)
(0.1)
0.2
(11.3) (0.0)
(2.5)
(2.~)
0.6 (0.0)
38.0
4.0
Confidential Treatment Requested
10.31 (0.3)
2.3 0.0
(11.01 (1.9)
I lUI
0.3
0.2 0.2
0.7
39.1
4.3
(0.1)
(11.1)
1.7 IJ.1
{0.0)
C2.2) (ILIII
(113)
{113)
1.1
1.1
0.1
'39.7
3.9
0.0
(0.0! (0.0)
1.1 0.0
(11.0)
(2.0)
(0.2)
(11.1)
1.3 {tl.l)
0.)
0.1
J0.7) !0.1)
40.1
4.0
(0.1! (11.1)
1.9
0.11
(O.OJ (!.2)
(0.0!
(11.3)
(0.2)
(0.2)
(0.1)
(0.2)
0.7 (0.3)
0.0
to. I) (0.1)
1.7 0.0
(0.11! {1.7)
(0.0)
11.11
0.3 (11.5)
(11.6) 0.3
39-< ' . ' 39.0
3.7 3.8
0.0
to. I) (II. I)
1.9 0.0
(1}.11) {1.7) (lUI)
0.2
11.2 0.3
O.J
0.3
(0.71 11.4
39.7
4.0
0.0
(11.111 (11.0)
1.3 1.0
(0.0) (1.7)
(1.01
(0.4)
(0.2)
0.4
(11.3)
(),{)
(0.0) (0,0)
1.8
0.0
(1.7)
(0,0)
0.1
11.4 11.1
(0.1)
{11.1)
(0.5! (0.1})
ll.O (0.2) (0.2)
1.7 ().()
(11.0) (1.7)
(0.0)
(0.1))
0,1
11.1
0.1
11.1
(0.1)
0.0
0.0
(0.2) (0.2)
1.4
0.0
(0.0) (1.7) (0.0)
0,7
1).3 (0.1)
(().2)
(11.2)
(0.1)
0.1
(0.0) (0.1))
2.6 0.0
(0.0)
(2.4) (0.0)
0.1
(0.1) 0.2
0.4
(1,4
(0.0)
0.0
(1.0) (1.0)
2.0
0.1
(11.11) !25) (0.0)
(0.4)
(0.1)
(0.3)
til. I) (0.1)
1.8
11.11
(1.9)
(0.1)
(0.2)
(0.5}
(0.2)
(0.2)
1.0
!0.1)
(0.1))
(0.0)
2.0
11.0
(11.01 (1.9) (0,0)
(ll.O)
11.1 (11.4)
0.3
11.3
tl.l (11.0)
39.2 ' 39.2 '• 139.2 · ···.-··39.7. '',"c'4():,3';.'' .. ;' ·38,6><" ' ·: 38;5''•· .',.''-'~38:S:~
3.S 3.7 3.7 4.3 4.S 4.0 3.9 3.9

CO
NFID
ENTIA
L TREA
TMEN
T REQ
UESTED
BY
LEHM
AN
BR
OTH
ERS H
OLD
ING
S, INC
.
r m m >< ~ G) s 0 0 0 1\) 0'1 0
UOD LBHl Liquidity l'ool Position
Unsc:cu~di,.:tcilitll:s:
Cha~c
Europ~:m
SMBCOPYJ Subtotal
Stcured Fncil!tles: St-.1BC<JPYJ Mct!Jfc
Belmont (Conduit) Fidelity
BGI ABN Wc.~t LB
Suhtutul
LTD Acth·ily
LTDSwlcll).!11L( LTD Maturities
Suhtntal
~-ruActivity
CPhsu:mcc Bwtk Loan drawtlown STD M;~turitic~:
SIIOri·Tcrm BV note~
CP B:ulkl.oarn
LcncrsofCrctlit
Suhllllal
LmmFtmding Dt!ri\'llliVt!S
lnh:n:umjXUJy fmxling
lntcrcompa.ny funding Cnpit:1l injcctiun/rcpntriatino
Subtotal
ABCP Investment
Olho,
EOD LBHl Liquidity Pooll'ositlon
Outst11rxliflR Cl' balance
12-At~ --------
38.5
({},OJ
(ll,U)
1.7
0.1
(0.0) (1.8)
(!1.0)
f),()
0.1 (£1.11}
(0.})
((1.2)
0.(
38.5
3.9
JJ·Attg 14-AUA 15-Au:.: IS· A~ 38.5 38.4 38.6 38.2
0.0 0.0 0.0 {(l.IJ ((!.OJ ((l.OJ (IJ.I) (O.tl) (0.1)) ((),0) (ILl)
2.0 1.8 1.9 1.7
0.1 tl.l IU n.o
(0.0) 10.0) (!).()1
{!.7) (1.9) (1.8) (2.1) (0.1) {0.2) {),]) (0.1)
11.3 (0.2) {1.11) (11.5)
(11.1) 11.6 1.2 0.1 0.4 ((1.4) 11.3
(0.1) 0.1 (tl.l) (0.1)
(II. I) 11.1 (II.!) 10.1)
(0.1) (1.0)
(0.1) ().3 (0.1) O.J.
38.4 38.6 38.2 38.0
4.1 4.0 4.2 3.8
l'!!riod-tu-d:ltl! 19-Au~ 20-An~ 21-Aug 22-Aug l.~·Aug 26-Attf! fnJmMnvJO
38.0 38.1 38.0 ·. 38.1 . 38.0 38.0 I :44.6
(1.0)
(1.0)
11.0 n.u 6.8 {(l.l) (fl.}) (IJ.IJ) ({)A) (0.1) (IJ.1) (8.8)
(0.1) (11.2) (0,0) (0.4) (0.1) (0.1) (2.11)
1.7 1.6 1.7 1.4 1.2 1.9 ll7.9 0.5 0.8 0.1 0.0 O.tl 0.0 8.6
({).()) (0.1)) ({1.0) (tl,{}J (lUI) (0.0) (0.4)
(1.7) (1.7} (1.6) (1.5) (I.IJ) (1.7) {131.4)
(0.0) (0.1) {0.1) (0.1) (0.0) (0.0) (8.7)
11.5 11.7 n.1 (11.1) 0.2 11.2 (3.9)
(11.4) (0.1) 11.2 0.2 7.4 (0.3) (0.3) 0.1 {11,0) 0.1 (5.1)
(0.1) {0.1) (0.3) (l.\ tl.:! (0.3)
(0.3)
(0.1) (0.1) (0.3) O.J 0.2 (0.6)
0.3 0.3 0.3 (ll.IJ (0.4) 0.4 IU (0.2) (0.() (0.]) (0.3) 0.:! (1.9)
38.1 38.0 38.1 38.0 38.0 38.0 38.0
3.7 3.7 3.8 3.7 3.9 4.2
Confidential TreatmeJtt Requested

CONFIDENTIAL TREATMENT REQUESTED BYLEHMAN BROTHERS HOLDINGS, INC.
LBEX-WGM 000251

CO
NFID
ENTIA
L TREA
TMEN
T REQ
UESTED
BY
LEHM
AN
BR
OTH
ERS H
OLD
ING
S, INC
.
r m m >< ~ G) s 0 0 0 1\) 0'1 1\)
LBHI Reportable Liquidity as of August 26, 2008 By Investments:
-Deposits/MMF -New York 21,324 -London 4,678
-Boxed Inventory in LBHI -Boxed Inventory in LBI -Boxed Inventory in LBIE -Boxed Inventory in LBAH
Reportable Liquidity
By Region:
-New York -London
Reportable Liquidity
r·-
LBHI Reportable Liquidity as of August 25, 2008 By Investments:
-Deposits/MMF -New York 16,852
26,002 -London 6,177 5,756 -Boxed Inventory in LBHI 1,961 -Boxed Inventory in LBI 4,275 -Boxed Inventmy in LBIE
-Boxed Inventory in LBAH 37,995 Reportable Liquidity
By Region:
29,042 -New York 8,953 -London
37,995 Reportable Liquidity
Confidential Treatment Requested
~~
DoD Changes By Investments:
-Deposits/MMF -New York 4,472
23,029 -London (1,499) 2,973 5,642 -Boxed Inventory in LBHI 114 4,745 -Boxed Inventory in LBI (2,783) 4,643 -Boxed Inventory in LBIE (367)
-Boxed Inventory in LBAH 38,059 Reportable Liquidity (64)
By Region:
27,239 -New York 1,803 10,820 -London (I ,867) 38,059 Reportable Liquidity (64)

CONFIDENTIAL TREATMENT REQUESTED BYLEHMAN BROTHERS HOLDINGS, INC.
LBEX-WGM 000253

CO
NFID
ENTIA
L TREA
TMEN
T REQ
UESTED
BY
LEHM
AN
BR
OTH
ERS H
OLD
ING
S, INC
.
r m m >< ~ G) s 0 0 0 1\) 0'1 ~
DAlLY TREASURY MIS AS OF 08/26/08 I,Tfl SP!tEADS t\S OF OllnCi/011
-~yt
lOp
.lnrr
l1S.,.lMl1SilLUIOR.
~ ~
)(,~
)4~ )0
'"' f.un>r~., lM IISO LlllOit
~
,., )~(,
)(,9
l£.Aw·nM l~·AIIr-UW t'I.Aur.UM
"""""" "" ''" "'
~
"' 420
"""""' 4U
<ll
ICI\'rC:.,II'(>riltorSpt.,.<hi•I=USO lyr
$.rr Myr
~
"'""'""'('"'"' iAI"J:.S!>rra4(1n~)
A>·~. ~l•t. ~·n)
£cgll.r&L(hrmJ
4Kr· 4))
fY.l9.!!l a:; Sll,7.17,ll $7,711.11
.1.~9
(Sl.OI) ($6-l,\)
1!J: S4,CII4.79
"' (SU.Ul I .~
~1.11
'"' S4.6J
llmk.tau r.wtl.t.Rl!W. l!:&tt:U AA.JAal lf.\1 11+/A.o.l 199
JrMCHAS£ c:sfn Mihal
LEH A•h\1
~M.IA.ol UTI
,,,
"""""' '"
·'·-'IS
tW!i.Yaollb _,£l~Jo.fuill&
S4,.tSD.DS Sl,Sill.4t S14~.U
1.7.1 SO. OJ
1: .:~~:,·,:::,' PAI'FR AS<!fO,l6/UH ~ ll:4llt:!!B. ~ ~ J.:&iJ:i!
,l,ltt 1.~6l 1,7U 1,,0.1 rNIA
IlK '10 SSM ~~~ S53 JfN/A
!Jl..Il!.uJi
~ T('II~IA£~<t~
t'UUuiAlrt<liiiJ:
flll.llflr;'r>mlMJl,l
!.UH! llnrw""l~<
lj• nf \(/~:·",::::~Ill\~
C,\Stl CAriTA! fi\JCO
Nr!C:uhC"aplt•!rlloltltlll(s.\1~1)
Tli~I("~JIM"'
i<Jlllla~·N~t Mt"(ll""'ld"" (SI>I:tl) 1\ddl>\,"lH•i"utWul•uin~ 1\d>ll>l,l!n>C>tlli<IIIH~ittuU
"""""-
1!,]117
l.ll~
t.OHl l'um:r~ l'll<l><tf\" 'lli>Ltyo l'~<not.:rctdrarcr:o<Jn,~oyo
Uti.:• !>Tll"' vn d•~• fhl.:r
Tr~ollllhilll~M•h•ntiu
~ 1\qo.o)m<r.l<t/(n\("m-c>l.•wrtni.UHI
l'ln.:< !Onutrfu••lin~. tUH!toi.UVl!l!l: l'l'lltnll>ll'mr.~ll'"'l'"fllliECII.dt
·~•II Y••~M('O I'1Ullf~ (SMM)
Jh1iiL ll.U•l 2Jiotl
Jh1iiL
l.27~ (.II)
{19,)~7)
12~0)
(lWS)
" (211,t12l)
" " '1:i5ii
4,JH l,~U 1 .. 111 1,161 rN!A
JDIIMCph'I\IJIM~(nl!!l]
C'al!,o.bk = Mil! ~
"' Nro.C•II•bl~·· 1.1!19 HI!
lllUitf>AUIItCJ l.lYtl Xl2
·'IT<'•• -~ I ycat
Srtodrowrl.ruOR
KUI
'" l(1.(.4bfli 107,)lhp.l 01>(1.<
• fi(QII:hi;•Ml'Dia~><dln,....PI"rltoiML!lat.
••srrco<fadjWicdby)Uly>o(»flJonan<Xfcc•
"""" 2.1100
"""" ).27~
"" (19.205)
{2Kll)
(}K7)
(I'I.H7l)
" " 1.m'
~ Mr2..0.t.m (4).11) l'r>~tion clt"u.o.:d b~ .S4Hmrn
~ lf•)
"' "' "' ~
l(,]
'"
-$4,4~1.91 t14.H
1.1' 'S7.0lJ
HI>IDrlc IZfll•,.llllt.u>,t:~nllll USDL180R
w ""'
"' "'
Hlrl•ricllM<>IIIbR.ul:~
w ""' " " no n lll
SYrC'.rrdii:Dd•uiiS>n-11
LEH Ol
MEil MS
JPMC'W.SE
16-Au;.nJ ll:A.ur:!!! JH J60' !(,(, IM
"' ,. "
,. "
~JJYn.!llll2!!A~ C'J!Iablc IS ~l ~J
N~~~~~~t;t, ~~ ~~;, •• :~~I
~ --~--- --- 1
CcmRIIu.tJ.tl Tn•l-nt Rnlunlctl
Lllli!illiTYAS_OF_08/1610&
~ ~ ~ ~ frn!rr!rdp.ouy.n
t.BHII.Iquidity(acludln1CP) 2C..91ro 21,015 11.191 lM,MSll )),11)1
LBil'~)'l'bltiDL8f/INY{ucludiiiJCl') 9(o\ 1,745 2.Mo7
LDI.E l'ayabl~ 111 t.BH!t.IK (udwiitiJ Cl') ~r.o (I )l) {l.tlr•) lBIEi\mlial~ l'ayahl~/{ltcc>:lv.-hlc) <I,OS\1 <I,US'I 4,11)'1 <!.HI
LDHI Drl>wu CCCM!i~cd fACility 0 0 0 II
!conm:rda.ll'~p1wt~k•) 1.r.66 I.Slr. r.r.r,l 1.441
tJ,_,.,,u!.t<dC~JY~u!dlty 34,117 .14,.117 H,U4 )5,669 J$,1196
CI'(Slwctb) 1.511 l.Ul l,lSI l.lSI Bar.kliMt 1.290 1.2G'I I,ZWii 114 4)
i\ ........ Sc11 otr!!!tl.alh n o o 11 u l.OHI Roporult!d.lqllldUr J7,t9S .\7,90 l7,9U .ll,ll~ J6,Jil1 LfiHIUndiJI..,C'on>mlncdl'•dlily 4.50!1 <~,Sou •.soo 4.SOII 4.Sua
NM ltcpm.htc TriV<Illllrc loo:ku(I(CWUIIWI.) 0 0 II Noo-AU.......,.blclttt~l>l'llll{!Liqu.ldity 417 417 417 Af!OISliquidlty o o u o
;LI.III!Tn>l'(l<d 1.l45 1.~17 LlK~ 1.401 l(;llliqYhlily (, ) S
LOTCLI<!<>illity Yll4 X9r. 194 C..1halflank(' ),79S 2..1!•1 !.IIY l.lOfo
Tnhd ClulloiC.n~ all<l lnwtCmrnl:l 41,961 47,461 4M,JP' 47,,.lS Eu:t>f'<'/Mialn~>tn~mu Lm.r:cr ll11U1 OIN (4,72~)
NYtm~nm,,ur-,trlfWI~ (211,811)
Ellrof'C ltr<cM..enlrOJl/Cul!l'ool (5.(.19)
NY~ntAvaihblctnb.:liqui>hJ.tdO/N (9C.I) 'NYlll>"utm<nUOINC'>Uhl'<>OI {7.S7l) l.fllkLOTClm·.:A""'niSOINCuhPwl {9111)
tSHICrowuiUtdfacllit)' . {~.SIMI) jca.t,11 Bank~ _Q1llL__
C'JI.!hA'I'IlilahletobefnVUI<dlnNY _!2l,__ •('.U,at Bank inch.der US halonc:c S\7MS.7nw.L Euro~ balM~ SJOOnm.1111d Asll balonct SJ7011nw.IUO( i\lljltll\15, 2UUX
rnoJrdr.SU..rr,ut.tcdConoLIIJuldlty S+ 1 !i+l
Curnnq" Bf'tlllulam~ afLiqui.Sity{r~:>~tS,..,)
llUR
USD
0"'' CllrrrnC)'RITak>J••n•fLI!juldll)l(rnos.,..rl
CUR
our
EU!ti.IJOAG
USOLUBAG
&.tclii•ICil'
OUJ• ~t<:rmlCII'
LDit.I<Juldlly
ln•·utm.:nu rrcrundi!IJ'
CAD
(lrtdOOun OC'C Moocy Fmds)
T<>!aJLllllal'n!ru<all
IJC'Iiomn.int:ffM!lCPI
lt('UmnwinJ&M!LIJHI
Nr!I.DIU•Juldll)'
•o ... ~t.DIDnl..o:>ts LUI DoE LBIMTSO»>.(Actlllll•hlcg~dudinJTiclll)
LBI TMS 0»>. (i\ctl011lble Eadudinl TroW) Tn:~uriu
iUII MTS 11:. TMS fl~»> {IIHI% CC A~l)
T~I•ILlliDa¥
f~QIKir~w~.t C•th S•Jmm•cr T"'II..<Ul)'lnn:<ln~
l.lllnfkfOiiU
l!u~YieldEn!Rne(fll<ft\
N~t U3HI l'ayabJ~
!.UIEOrnuT"'J'(>ttl (Smm) LUIEaffilitlcl"yahlCI(availthlct~~toflllrcom.:d) t.OIEN~!TDpptd (Snw.>)
l.BI£-Pfliii(hrokr~ C.~>!h_,S_C)J!f_~~t_il_lsll~r)
C'JI.:ItS{U)inLOm [C~r:bS(ll)inlBI Cloln\C.thS!UJ
.lS,I96 .lS,116
~~~
4.270
"' lii.S9S
34,117
7.lo03
'" {l\IS) 0 ,., 0
J.SIS
"' JW'7
l,HM
li,O!D 1.411
:14.W
lo,lirrll
(D)
" ,.. " ),549
11,4\1
1.2tl4 i4.ii1
l,(oD4
"' )0,7(,(,
!.Mol -;;,m
,., (IX.S)
" '" ' ),6)S
l\,47$
l.OlS
~
1(,0 l.l.40 1,750
2117 Ill su 967 1,191 l,MUO
0 (43) (llt) (9f>l) (1.7~5) !2.M•7)
' " l.bi!!.t:!! ~ n.Aur-nll 4fol 26).
1.4711 IM9
11 n l.OOS }.014
4.'1~7 S.lllM
16-AIIJ:..IlN lS-AII,-tll li-AIIJ1-IIM $.112 4,Yllo <l,f.\ll
/ill 1.41l l,liiS
' " (4f.O) (Xr.J)
S.AB4 5,476 r.,.U)
(4M9l t4om !4.nm 1,145 l,oll7 l.lK4
~~~ WA l,l\4 3,~41
1,114
~
2.1U•
" l.~I,M
'f.(.Qi
l\llrl1ns:i\>'CDI:rr 'iji1jijf'AU
J,lU 0
Ui1
,, "" ).7'1.1
4,,450 tll.lSI)
(11.)14) (S,IiM9)
(l.5M) ,.~
tllln) (4,!00)
!l,7<JS)
)~,,46
rrulrrr .. 117-0Ur-nlf
.. iiiij
" (Mil})
i!!.llil:.A!:l: , .. l.271 ,,. ),072
s:i41
"""""" 4.0))
.f,UJl
l!!.!l!l:A!J:
"' IH
U27
"""""'U,. t .. ln7
" (,,)!17
•u ... a~ .... r..utt..~<-l•r~ ... ;,~_•u•l [!f!Vf'!fi"l"1t"NIS• JYTDf>V<no,~:cSptT...tt .. JWnkLIIMir
~1U!!%:!!!1~ ,.,. """ l.f2.2
I'~EfToctln
•JWulr.Uhbr 'IMGII.tbl.lhor
~ 1.9i.ir-u• u:Au1o:oM
rWA l.D2ll% •WI\ l.<I!N% /JWi\ 1.472'/o I

CONFIDENTIAL TREATMENT REQUESTED BYLEHMAN BROTHERS HOLDINGS, INC.
LBEX-WGM 000255

CO
NFID
ENTIA
L TREA
TMEN
T REQ
UESTED
BY
LEHM
AN
BR
OTH
ERS H
OLD
ING
S, INC
.
r m m >< ~ G) s 0 0 0 1\) (11 en
Global Repo Maturity Schedule as of August 26th, 2008
By Cullii!i!riil Allii~iltiim Princioa/ in $K-' -Region Collateral Allocated Summary ASIA EMG
EMG Total EQUITIES
EQUITIES Total ASIA Total EUROPE ASSET BACKS· INVESTMENT GRADE
ASSET BACKS - INVESTMENT GRADE Total ASSET BACKS ·NON-INVESTMENT GRADE
ASSET BACKS- NON-INVESTMENT GRADE Total Cl ·INVESTMENT GRADE CONVERTIBLES
Cl -INVESTMENT GRADE CONVERTIBLES Total C2 ·NON-INVESTMENT GRADE CONVERTIBLES
C2- NON-INVESTMENT GRADE CONVERTIBLES Total CORPORATES ·INVESTMENT GRADE
ICounterparty Group IDRESDNER
DRESDNER JP MORGAN CHASE MITSUBISHI OSAKA SECURJTIES FINANCE THE TOKYO TANSHI CO.,LTD.
BANK AUSTRJA BANKHAUS CAL YON CITIBANK DEKABANK DRESDNER ECB KBC NATJXJS RZB STATE STREET
BANKHAUS CITIBANK DEKABANK
BANK AUSTRJA BANKHAUS DEKABANK DEXIA DRESDNER DZBANK EXXONMOBIL FINANCIAL SERVICES BY USD KBC NATIXJS RBC RZB STATE STREET
BANK AUSTRJA BANKHAUS CAL YON DEKABANK DEXIA DRESDNER DZBANK FORTIS KBC NATIXIS RBC RZB STATE STREET
I:ANK AUSTRJA BANKHAUS CACEISBANK
Confidential Treatment Requested
27 Aug 28 Aug :19 Aug 01 Scp 02 Sep 03 SCI'_ to 24 Nov >= 25 Nov Grand Total 0.0 0.( 0.0 0.( 0.3 o.:
0.2 o.; 0.3 o.:
0.7 0.~
0.2 o.; 0.5 0.5 0.7 1.(
0.5 0.5 0.7 1.(
0.0 o.c 1.! 0.1 0.4 l.i
0.0 o.c 0.1 0.2 0.3
0.0 0.0 0.0 0.0 0.0 0.0
12.1 12.1 0.0 0.0
0.0 0.0 0.0 0.0 0.0 0.0
0.0 0.0 1.1 0.1 0.5 0.0 0.0 12.4 0.0 14.1 0.0 0.0 0.0 0.0
0.0 0.0 0.0 0.0 0.0 0.0
0.0 0.0 0.0 0.0 0.0 0.0 0.1 0.0 0.0
0.0 0.0 0.0 0.0 0.0 0.0 0.0
0.0 0.0 0.0 0.0 0.0 0.0
0.0 0.0 0.0 0.0
0.1 0.1 0.0 0.0 0.0 0.3 0.0 0.3
0.0 0.0 0.0 0.1 0.0 0.0
0.0 0.0 0.0 0.0 0.5 0.1 0.6 0.0 0.0·
0.0 0.0 0.0 0.0 0.0 0.0
0.1 0.0 0.0 0.1 0.0 0.0
0.0 0.1 0.1 0.2 0.2
0.0 0.0 0.1 0.1 0.1 0.1 0.3
0.0 0.0 0.0 0.0
0.0 0.0 0.! 0.2 0.0 0.0 0.0 0.0 0.0 0.! 0.0 0.7 0.2 1.0
0.4 0.4 0.1 0.0 0.1 0.0 0.0 0.0 0.1

CO
NFID
ENTIA
L TREA
TMEN
T REQ
UESTED
BY
LEHM
AN
BR
OTH
ERS H
OLD
ING
S, INC
.
r m m >< ~ G) s 0 0 0 1\) 0'1 ......
Region
/'
Collateral Allocated Summary
CORPORATES -INVESTMENT GRADE Total CORPORATES- NON-INVESTMENT GRADE
CORPORATES - NON-INVESTMENT GRADE Total EMG
(~
Countcrparty Group CAL YON
CJTIBANK DANSKEBANK DEKABANK DEXIA DRESDNER DZBANK EXXONMOBIL FINANCIAL SERVICES BV USD FORTIS KBC LCH RBC ROYAL BANK OF SCOTLAND PLC RZB STATE STREET ZURCHER KANTONALBANK
BANK AUSTRIA BANKHAUS CAL YON CITIBANK DANMARKS NATIONALBANK DANSKEBANK DEKABANK DEXIA DRESDNER DZBANK FORTIS JP MORGAN CHASE KBC LCH NATIXIS RBC ROYAL BANK OF SCOTLAND PLC RZB STATE STREET
ABN AMRO BANK AUSTRIA BANKHAUS CACEIS BANK CAL YON CITIBANK DANSKEBANK DEKABANK DEXIA DRESDNER DZBANK EXXONMOBIL FINANCIAL SERVICES BV USD FORTIS HSBC KBC LCH NATIXIS NOMURA RBC ROYAL BANK OF SCOTLAND PLC RZB STATE STREET ZURCHERKANTONALBANK
Confidential Treatment Requested
27 Aug 28 Aug 29 Aug 01 Scp 02 Scp 03 Scp to 24 Nov >- 25 Nov Grand Total
0.2 0.2
Q.l 1.0 1.0
0.5 0.5
0.1 0.1 0.0 0.3 0.1 0.5 0.2 0.7
0.6 0.0 0.6 0.0 0.0
0.0 0.0
0.0 0.0 0.5 0.5
0.2 0.2 0.0 OA 0.1 0.2 0.2 0.8 0.0 1.2
0.0 0.0 0.0
0.0 0.0 0.0 0.0
0.8 0.2 0.5 0.2 0.1 1.8 0.1 0.1
L7 1.1 OA 0.8 0.4 3.4 0.3 8.0 0.0 0.0
0.3 0.0 0.4 0.7
0.0 0.0 0.1 0.1
0.0 0.0
0.0 0.0
0.2 0.1 0.0 0.3
0.0 0.0 0.0 0.1
0.0 0.0 0.0 0.3 0.3
0.0 0.0
0.0 0.0 0.1 0.1
0.0 0.0
0.0 0.0 0.0 0.0
0.0 0.0 0.0
0.0 0.0 0.1
0.1 0.0 0.1 0.2
0.3 0.0 0.0 . 0.3
0.4 0.4 0.0 0.2 OJ 1.2 OJ 2.4
0.0 0.0 0.0 0.0
0.8 0.1 0.6 0.0 1.5
0.0 0.0 0.0
0.0 0.0
0.0 0.1 0.2
0.0 0.0
0.1 0.1 0.0 0.3 0.5 0.2 0.1 0.8
0.0 0.1 0.2 0.3 0.0 0.0
0.0 0.0
0.6 0.1 0.2 0.8
0.1 O.I 0.1 0.2 0.2
0.1 0.0 0.2 0.1 0.0 0.0 0.1
0.0 0.0 0.0 0.0 0.2
0.0 0.0 O.I 0.5 0.1 0.7
0.0 0.1 0.4 0.5
0.0 0.0 0.1 0.1
0.5 0.0 0.0 0.0 0.6 0.0 0.0
2

CO
NFID
ENTIA
L TREA
TMEN
T REQ
UESTED
BY
LEHM
AN
BR
OTH
ERS H
OLD
ING
S, INC
.
r m m >< ~ G) s 0 0 0 1\) 0'1 co
.
Region
,r
'
EUROPE Total u.s.
Collateral Allocated Summary EMGTotal
EQUITIBS
EQUITIES Total MONEY MARKETS
MONEY MARKETS Total PRIVATE LABELS- HIGH YIELD PRIVATE LABELS - HIGH YIELD Total PRIVATE LABELS - INVESTMENT GRADE
PRIVATE LABELS -INVESTMENT GRADE Total
ASSET BACKS - INVESTMENT GRADE
ASSET BACKS- INVESTMENT GRADE Total ASSET BACKS -NON-INVESTMENT GRADE
ASSET BACKS- NON-INVESTMENT GRADE Total Cl -INVESTMENT GRADE CONVERTIBLES
C 1 - INVESTMENT GRADE CONVERTIBLES Total C2- NON-INVESTMENT GRADE CONVERTIBLES
C2- NON-INVESTMENT GRADE CONVERTIBLES Total CORPORATES- INVESTMENT GRADE
(~
Countcrparty Group
BANKHAVS CAL YON
DEKABANK DRESDNER DZBANK EXXONMOBIL FINANCIAL SERVICES BV USD FORTIS HSBC HYPO VEREINSBANK KBC NATIXIS NOMURA RBC RZB SOCIETE GENERALE ZURCHER KANTONALBANK
DEXIA DRESDNER
IBANKHAUS
BANK AUSTRIA BANKHAUS CITIBANK
BONY/MELLON DWIGHT A.M. FEDERAL RESERVE FEDERATED FIDELITY FIELD STREET MASTER FUND, LTD. JP MORGAN CHASE KEYBANK MITSUBISHI STATE STREET SUMITOMO
DWIGHT A.M. FEDERATED FIDELITY FIELD STREET MASTER FUND, LTD. GOLDMAN SACHS & CO KEYBANK STATE STREET
FIDELITY STATE STREET
FIDELITY JP MORGAN CHASE STATE STREET
BGI BONY/MELLON CSFB DWIGHT A.M. FEDERATED
Confidential Treatment Requested
.~
/
27 Aug 28 Aug 29 Aug 0 I Scp 02 Scp 03 Scp to 24 Nov >= 25 Nov Gra~ 2.1 0.2 0.9 0.4 0.8 2.0 0.4 6.: 0.0 0.2 0.0 1.2 0.7 2.1 0.1 0.1
0.7 0.4 0.1 t.: 0.6 0.(
0.4 0.' 0.2 o.;
0.0 0.( 0.2 0.2 0.5 1.1 2.1
0.3 o.: 0.3 o.: 0.1 0.1 o.:
0.1 0.2 0.! 0.4 0.1 0.2 2.8 0.4 3.c
0.1 0.1 0.3 0.~
0.2 O.< 0.3 o.;
0.4 0.4 0.6 !.4 0.3 7.7 1.9 12.( 0.0 o.c
0.0 o.c 0.0 0.0 0.0
0.0 0.0 0.0 0.0
0.0 0.0 0.0 0.0
0.0 0.0 0.0 0.0 0.0 5.7 2.3 2.5 2.9 1.5 27.9 2.9 45.7 0.2 0.5 0.7
0.1 0.1 0.7 0.7
0.1 0.1 0.0 0.8 0.8 0.0 0.0 0.! 0.1
0.1 0.1 0.0 0.0, 0.5 0.0 0.5 0.0 0.0• 1.0 O.I 2.1 3.2:
0.7 0.7! 0.4 0.4 0.0 0.2 0.2 0.0 0.0 O.I 0.1
0.0 0.0 0.0 0.0 0.5 0.0 0.9 1.3 0.4 0.4
0.0 . 0.0
0.4 0.0 0.4 0.1 0.1 0.5 0.5
0.2 0.2 0.6 0.2 0.7 2.0 2.0
0.0 0.0 0.3 0.3
0.6 0.6 0.0 0.0
3

CO
NFID
ENTIA
L TREA
TMEN
T REQ
UESTED
BY
LEHM
AN
BR
OTH
ERS H
OLD
ING
S, INC
.
r m m >< ~ G) s 0 0 0 1\) 0'1 CD
RcCTion Collateral Allocated Summary
CORPORATES- INVESTMENT GRADE Total CORPORATES- NON-INVESTMENT GRADE
CORPORATES -NON-INVESTMENT GRADE Total EQUITIES
EQUITIES Total MONEY MARKETS
MONEY MARKETS Total MUNI
MUN!Total PRIVATE LABELS- HIGH YIELD
r·
Countcrparty Group FIDELITY FRQSTBANK.
KEY BANK MARSHALL & ISLEY MET WEST METLIFE STATE STREET SUMITOMO UBOC US BANK& TRUST
BGI CONSORCIO DANSKEBANK FENWAY FUNDING LLC FIDELITY FIELD STREET MASTER FUND, LTD. GOLDMAN SACHS & CO JP MORGAN CHASE NORTHERN PASCAL FUND LTD RACERS STATE STREET TELEMEX TENSOR TRIARA.COM US BANK & TRUST
BANK OF TOKYO BGI DRESDNER FENW A Y FUNDING LLC FIDELITY GOLDMAN SACHS & CO JP MORGAN CHASE KEY BANK NORTHERN SFTC SKAND!NA VISKA ENSKILDA BANKEN CORPORATION STATE STREET
BANKHAUS BONY/MELLON CSFB DRESDNER FORTIS GOLDMAN SACHS & CO NORTHERN NOR WEST STATE STREET
DRESDNER FIDELITY FORTIS STATE STREET
AEGON BONY/MELLON DWIGHT A.M. FEDERAL RESERVE
Confidential Treatment Requested
27 Au~ 28 Au~ 29 Au~ 01 Sen 02 Sen 03 Sen to 24 Nov >= 25 Nov Grand Total 2.5 0.0 2.5
0.2 0.~
0.6 0.1 0.0 0.( 0.5 0.~
0.0 0.( 1.5 0.2 1.1 0.4 OA 0.1 0.1 0.1 0.1 8.0 0.4 0.6 9.1 O.I 0.1
0.0 0.0 0.0 0.0
0.2 0.2 I. I 0.0 1.1 0.0 0.0 0.1 0.1 0.0 0.0 0.1 0.1 0.0 0.0
0.0 0.0 2.1 0.0 2.1 0.0 0.0 0.0 0.0 0.0
0.0 0.0 0.0 0.0 3.8 0.0 0.0 0.0 3.9 0.6 0.6 0.1 0.4 0.5 0.4 0.5 0.5 1.3 0.1 0.1 1.1 I. I 0.0 0.0 0.2 0.2 0.5 0.5 1.3 1.3 0.1 0.1 0.5 0.5 0.5 0.3 2.3 3.I 5.4 0.4 0.8 2.8 9.4
1.0 1.0 3.0 3.0 0.0 0.0 0.8 0.8 0.2 0.2 0.0 0.0 0.7 0.7 1.7 1.7 0.0 0.0 0.0 6.4 1.0 0.0 7.5 0.9 0.9 0.1 0.1 0.5 0.5 1.3 1.3 2.8 2.8 0.0 0.0 O.I 1.0 1.1
0.2 0.2 0.0 0.0
4

CO
NFID
ENTIA
L TREA
TMEN
T REQ
UESTED
BY
LEHM
AN
BR
OTH
ERS H
OLD
ING
S, INC
.
r m m >< ~ G) s 0 0 0 1\) en 0
Region
•u.s. Totnl IGrond Totnl
Collateral Allocated Summary
PRIVATE LABELS- HIGH YIELD Total PRIVATE LABELS - INVESTMENT GRADE
PRIVATE LABELS- INVESTMENT GRADE Total WHOLELOAN RESIDENTIAL
WHOLELOAN RESIDENTIAL Total
--------------------
Countcrparty Group FEDERATED FIDELITY
FIELD STREET MASTER FUND, LTD. MITSUBISHI NORTHERN RICOH STATE STREET SWISS RE
AEGON BONY /MELLON CITIBANK DWIGHT A.M. FEDERAL RESERVE FEDERATED FIDELITY MJTSUBISHJ STATE STREET SWISSRE
DANSKEBANK RICOH ROWAN STATE STREET
Confidential Treatment Requested
27 Aug 28 Aug 19 Aug 0 I Sep 02 Sep 03 Scp to 24 Nov >- 25 Nov Grand Total 0.0 0.0 0.0 0.1 0.1
0.0 0.0 0.0 0.0 0.0 0.0 0.0 0.0 0.1 0.1 0.1 0.1 0.3 1.3 1.6 0.1 0.1 0.3 0.1 0.5 0.1 0.1
0.0 0.0 1.3 1.3
0.1 0.1 0.7 0.2 0.9 0.3 0.3 3.3 0.0 3.3 0.0 O.Oi 5.0 1.6 6.6!
0.3 0.3 0.0 0.0
0.0 0.0 0.2 0.2
0.0 0.0 0.5 0.5 34.3 1.0 0.5 7.4 3.9 47.0 40.5 2.3 3.5 2.9 2.0 35.8 7.4 94.4
5

CONFIDENTIAL TREATMENT REQUESTED BYLEHMAN BROTHERS HOLDINGS, INC.
LBEX-WGM 000261

CONFIDENTIAL TREATMENT REQUESTED BYLEHMAN BROTHERS HOLDINGS, INC.
"-
LEHMAN BROTHERS LIQUIDITY EXECUTIVE SUMMARY
$billions 26-Aug
LBHI Liquidity Pool 38.0
CP outstanding U.S. 3.3 Europe 0.9
Total 4.2
LBI 15c3 Lockup (Weekly-Excluding PAIB) 3.3 LBIE Prime Broker Customer Free Credit 0.9
Repo book (Excl. Tsy, Agcy, & Agcy MBS) Asia 1.6 Europe 45.7 u.s. 47.0
Total 94.4
%0/N 43% %<=1 wk II% %>Iwk 46%
ST Debt maturities (incl. CP and current portion of LTD) Next day <= 1 wk 1wk-lmth >lmth
Total
Avail ::able Undrawn Committed Facilities u.s. Europe
2.0 0.4 3.8
22.6
28.9
2.0 2.5
25-Aug
38.0
3.1 0.8
3.9
3.3 0.9
1.1 45.8 48.0
95.0
42% 9%
48%
1.7 0.6 2.9
23.4
28.6
2.0 2.5
22-Aug
38.0
2.9 0.8
3.7
4.6 0.9
1.4 46.6 48.1
96.1
41% 10% 50%
1.4 0.7 2.8
23.4
28.4
2.0 2.5
21-Aug
38.0
3.0 0.8
3.8
4.6 0.9
1.4 46.1 48.3
95.8
43% 7%
50%
2.1 0.8 2.6
22.3
27.8
2.0 2.5
20-Aug
38.0
2.9 0.8
3.7
4.6 1.0
1.4 45.4 47.7
94.5
39% 10% 51%
1.7 1.1 2.5
22.3
27.6
2.0 2.5
CONFIDENTIAL TREATMENT REQUESTED
NOT FOR DISTRIBUTION 11120/2008, 9:55 AM
Change vs. 25-Aug 22-Au~
0.0 0.0
0.2 0.4 0.1 0.1
0.3 0.6
(1.3) (0.0) 0.0
0.5 0.2 (0.1) (0.9) ( 1.0) (1.0)
(0.6) (1.7)
+0.5pp +2.lpp + 1.9pp +1.8pp (2.3)pp (3.8)pp
0.4 0.6 (0.2) (0.3) 0.9 1.0
(0.8) (0.8)
0.3 0.5
LBEX-WGM 000262

CONFIDENTIAL TREATMENT REQUESTED BYLEHMAN BROTHERS HOLDINGS, INC.
LBEX-WGM 000263

CONFIDENTIAL TREATMENT REQUESTED BYLEHMAN BROTHERS HOLDINGS, INC.
LBEX-WGM 000264

CONFIDENTIAL TREATMENT REQUESTED BYLEHMAN BROTHERS HOLDINGS, INC.
~~~~~~~--~~--~~=-~~~--------------------------------------~------~~~n'"~'IIDENTIAL TREATMENT REQUESTED INSTITUTION: Lehman Brothers AS OF: 8/29/08 ($in billions)
Treasuries 8.9 188.9 33.2 231.1
GlO Govermrients 23.2 78.7 13.2 115.0
Agencies 17.8 23.3 6.0 47.1
AgencyMBS 7.6 62.6 0.0 70.2
AgencyCMOs 3.7 7.0 0.0 10.7
.··•· :sti-BiOiAttiQtn:Di' · . , ,, .. ·.·•··.·.· .. · '6t.3 ·' •. ,_·,_ ·.·. '36o:4 • .'. : ••.••.•...••..•...• 52:4' . ._,.~- :· 1.''\· ··474.0 . ·.
LESS LIQUID
Asset Backed Securities
PDCF Eligible 0.9 0.8 0.0 1.7
ECB or Oiher CB Eligible 5.8 2.3 0.0 8.1
Non-Eligible 4.3 2.4 0.0 6.7
Bank Loans
PDCF Eligible 0.0 0.0 0.0 0.0
ECB or Other CB Eligible 0.0 0.0 0.0 0.0
Non-Eligible 0.0 0.0 0.0 0.0
Ci\iiu l'rivate Label
PDCF Eligible 1.6 2.9 0.0 4.5
ECB or Oiher CB Eligible 0.0 0.0 0.0 0.0
Non-Eligible 3.6 1.1 0.0 4.7
Commercial Paper
PDCF Eligible 7.5 0.0 0.0 7.5
ECB or Olher CB Eligible 0.0 0.0 0.0 0.0
Non-Eligible 0.1 0.0 0.0 0.1
Corporates
PDCFE!igible 1.9 11.2 1.2 14.3
ECB or Other CB Eligible 1.6 7.8 1.3 10.6
Non-Eligible 6.4 14.1 1.1 21.6
Equity
PDCFE!igible 0.0 0.2 0.0 0.2
ECB or Other CB Eligible 0.0 0.2 0.0 0.2
Non-Eligible 22.5 62.3 !9.3 !04.!
International
PDCFE!igible 0.2 0.9 0.0 1.2
ECB or Other CB Eligible 0.2 0.8 0.5 1.5
Non-Eligible 6.6 14.0 1.2 21.8
Money !VI arket
PDCF Eligible o.b 0.0 0.0 0.0
ECB or Otl1er CB Eligible 0.0 0.0 0.0 0.0
Non-Eligible 0.0 0.0 0.0 0.0
Municipals
PDCF Eligible 1.2 0.0 0.0 1.2
ECB or Otl1er CB Eligible 0.0 0.0 0.0 0.0
Non-Eligible 1.4 0.1 0.0 1.5
Whole Loan
PDCF Eligible 0.0 0.0 0.0 0.0
ECB or Olher CB Eligible 0.0 0.0 0.0 0.0
Non-Eligible 0.7 0.2 0.0 0.9
Other
PDCF Eligible 0.0 0.0 0.0 0.0
ECB or Other CB Eligible 0.0 0.0 0.0 0.0
Non-Eligible 0.0 0.0 0.0 0.0
SUETOTAL LESS LIQUID 66.4• 121.2 24.6 212.2 . Footnotes:
SECURED FUNDING R/R to cover shorts extracted
Liquid Cvllateral 61.3 360.4 52.4 474.0 Margin debits integrated
PDCF Eligible 13.3 15.9 1.2 30.4 Box Collateral extracted
ECB or Other CB Eligible 7.6 11.0 1.9 20.5 Excludes impact ofGSCC & FfN41 Netting
Non-Eligible 45.5 94.3 20.3 160.2
TOTAL SECURED FUNDING 127.7 481.6 75.8 : 685.1
··The break-out between LBI and LBIE is approximately equivalent to the regional break-out on the daily Executive Summary report; LBI @ 54.5% and LBIE @ 44.0% of the to·tal
LBEX-WGM 000265

CONFIDENTIAL TREATMENT REQUESTED BYLEHMAN BROTHERS HOLDINGS, INC.
LBEX-WGM 000266

CONFIDENTIAL TREATMENT REQUESTED BYLEHMAN BROTHERS HOLDINGS, INC.
Weekly Firm Financial Summary (August 29, 2008 Meeting) Financial Planning & Analysis
Table of Contents (
1. Balance Sheet: Reported Capital and Equity
2. Liquidity
a. MCO
b. Cash Capital by Summary
c. Cash Capital by BPM
d. Cash Capital Usage
3. Traditional Investment Returns
4. Issuance Levels
5. Peer Group Benchmark Issuances
6. New Issue/Closed Loan Update
7. Banks
a. Thrift
~--- • Sources and Uses (
• Pipeline
b. LBCB
• Sources and Uses
• Pipeline
c. Bankhaus
• Sources and Uses
• Pipeline
8. Loan Database
a. Top 20 Loan Changes
b. Top 20 Loan Positions
- I -
LBEX-WGM 000267

CONFIDENTIAL TREATMENT REQUESTED BYLEHMAN BROTHERS HOLDINGS, INC.
1. Balance Sheet, Reported Capital and Equity .,.-·-.
ASSETS Fixed Income Core
Net Tangible Gross
Equities Core Net Tangible Gross
Capital Markets Prime Services Net Tangible Total Cap Mkts Prime Services Gross
Total Principal Investing Net Tangible Gross
Asset Management Net Tangible
Grn.c;s
Treasury Cash Liquidity Reverse Repo & BmTows Short Term Securities
Total Treasury
Other Net Tangible Gross
Total Net Tangible Gross
'justed Net Assets :ash Shorts
Adjusted Net Assets
EQUITY, DEBT AND TOTAL CAPITAL Stockholders' Equity Tangible Shareholders' Equity
Hybrid - European (Junior Subdebt) Euro ECAPS - LB UK Capital Funding IV I Euro ECAPS - LB UK Capital Funding V L Hybrid- US ECAPS (Junior Subdebt) Traditional Trust Preferred (Junior Subdebt New MCAPS Issuance
PrefeiTed .Securities Classified as Subdebt Total Tangible Equity Leverage Equity (Subject To Limits)
LEVERAGE RATIOS Gross £xtenwl Reporr:-
IGAAP (Total A~seto.;/ Shrhldr.;' Eq) lnlenmlTar)!et:
ITangihlc (ft-;-.t:ll Tangible As~cls /L Eq)
Net u ... EH (Tangi hie Net A<:.~et~ I L Eq)
Comnctitnr Net Leverage MER MS GS Peer Average
Actual
Nov-06
171,025 247,266
38,226 48,412
32,844 147,042
7,444 9,528
5,663
8.669
5,237 30,694
I 047
36,978
7,451 5,650
268,937 503,545
107,943 376,880
19,191 15,829
1,218
296 1.224
2,738 18.567 18,567
26.2xl
26.9xl
14.5xl
12.6x 14.9x 13.7x 14.5x
Actual
Feb-07
187,404 272,237
46,800 56,562
35,661 167,360
8,667 10,996
7,576
10.652
3,433 23,797
1403
28,633
9,854 15,842
300,798 562,283
123,080 423,878
20,005 16,474
1,226 262
300 1,225
3,013 19,488 19,488
Actual
May-07
201,909 279,959
50,922 62,264
42,209 181,445
10,172 12,153
10,782
14.016
4,691 26,000
____l,lli
31.906
15,767 24,118
337,667 605,861
144,014 481,681
21,129 17,476
1.243 269
300 1.225 1,485
4,522 21,998 21,881
28.1xll 28.7xll
28.7xll 27.5xll
15.4xl ._I ---'1'-"5'-'.4;:Jxll
12.7x 15.3x 14.8x 15.3x
13.lx 15.9x !4.4x 14.5x
Actual
Aug-07
212,048 283,937
52,364 62,644
40,267 224,017
12,988 14,857
12,604
15.832
6,143 30,638
....--1..W.. 39,568
17,902 18,361
357,103 659,216
113,115 470,218
21,733 17,625
1,114 273 500 300
1,225 _____l_2QQ_
4,911 22,537 22,164
Actual
Nov-07
231,141 315,334
50,749 61,064
44,900 220,479
11,810 13,588
11,872
15.144
6,363 37,785
_2d:E.. 46,375
13,897 19,078
372,959 691,063
117,996 490,955
22,490 18,363
1,203 295 500 255
1,225 ___!_2QQ.
4,978 23,341 23,103
Actual
Feb-08
249,321 368,234
48,463 60,124
48,612 260,677
14,687 16,756
14,258
17.552
6,229 35,780
1,884
43,893
13,220 18,798
396,674 786,035
159,Q96 555,770
24,832 20,720
1,218 304 500 255
1.225 1,475
4,976 25,696 25,696
Actual
May-08
212,897 280,559
38,862 49,994
29,509 209,141
9,555 14,229
9,722
12.965
5,393 47,077
3 580
56,049
18,256 16,495
327,774 639,432
115,622 443,396
26,276 22,174
1,239 311 500 255
1,225 1,475
5,004 27,179 27,179
Financial Planning & Analysis
Daily B/S
Aug-08
207,826 270,350
33,713 41.338
31,878 319,918
8,067 10,661
9,437
12.669
13,968 227
22,123
36,318
14,577 16,709
341,588 707,963
100,000 441,588
28,545 24,544
1,241 311 500 255
1,225 1,475
5,007 29,551 29,551
Target
03
216,000 284,000
35,000 46,000
35,000 214,000
9,000 13,000
9,000
14.000
3,500 32,000 3 500
39,000
15,000 28,000
326,000 638,000
100,000 426,000
28.545 24,544
1,241 311 500 255
1,225 1,475
5,007 29,551 29,551
(Under) I Over
03
(8,174) (13,650)
(1,287) (4,662)
(3,122) 105,918
(933) (2,339)
437
(1.331)
10,468 C\1,774) 18 623
(2,682)
(423) (11,291)
15,589 69,963
15.589
30.3xll L ---"30e.:·.!.!7x"-·1 ___ ::_31"-.7-'-'x"-·1 ___ 2:::4!.!:.3o::ox:LI ___ :::24::.:.8!!'x"-·l __ ---'2:::2:::.4~xLI ___ ..::.2:::.5~xl
29.6xl Ll _ _:::29"-''"-'7x::.tl ___ .:o30:::..3::.:x!l.·l ___ :::23:.:..4::.::x:LI ___ ,::23e..:·:::8x"-1 ___ 2"-'lc;.6:oxLI ___ ..::.2::.:.2~xl
16.1xl Ll _ __:.16::.:·.:;lx01! ___ ..:;15::.:.4.:.:x,_·l ___ ..:;l2:.:.·:.::1x"-1 ___ .:.1:.:1.:::6x::.t·l ___ ,_,11::.:.0::.:x,_I ___ _,0::.:.5~xl
16.4x 16.7x 15.4x 16.2x
21.2xl
19.4x 16.5x 14.8x 16.9x
21.3xl
16.7x 14.8x 16.0x 15.8x
21.6xl
15.2x !2.Sx 12.8x 13.6x
16.3xl
-2-
LBEX-WGM 000268

CONFIDENTIAL TREATMENT REQUESTED BYLEHMAN BROTHERS HOLDINGS, INC.
2. Liquidity a. MCO
LBHI WEEKLY MCO REPORT AS OF AUGUST 22, 2008
..:P..:.r.::.eVI..:"c::o:::iis:..w:.:.•:::•;::k..:'s..:.M;::.C=O_.p:.:·o.:;Sic::ti.::.on::.· .:;as'-o"'f-'8"'/1:.:5'-------'--'--'----·~· ·.:.;7.:::2_· Comments
Chan!;e in Sources LTD Issu<~.nce LTDRoll·in LTD Buybacks
Total Change in Sources
0.1. (1.2) (0.3)
Chan~e in Usa!!e
Net Loan Funding Derivatives Change in Trupped Capital Injection/Repatriation Pre funding for Unfum.led Commitment Cn ntingent Collater;J.Iization Other,;
Total Change in Usoge
Tow/ Change in MCO Position
Current week's MCO position as of 8/22
Summar of Loan Activitv:
(0.1) 0.0
(0.3)
1.0 (0.0)
1.6 0.2
(1.5)
2.3
O.R
8.0
Refer to the Loo.n Summary below Collateral margins and swap payment:> LB Lux Intercompany payment to LBIE Pending settlement of $1.0hn LBIE subdebt repayment
July .schedule update
~O~c~a~l~-~-~~------~B7,'~~~in~c~ss~~R~e~g~in;::n~~P~rc~)j~cc~·t~ed~--~A~m~l7.>u~n~t Contmen~ THSRC transfer to BH HY/HG Asia Yes 0.3 Clio CLO HY/HG Europe Yes 0.2
Other (<$50MM) (0.2) Loan Activity 0.3
Chan~e in Pending Settlement of Loan Syndication/Securitization (0.4)
Net Loan Svndication/(Funding} <0.1)
Sumntarv of Reportable Liquidity Pool and Maximum Cumulative Outflows:
Previous wel!k1s Reportable'Liquiditv as of 8115 38.2
STD net issuance Loan Activity Others
LTD net maturity/huyhrick Dc:rivativcs Change in Trappetl
Total Inflows
Tow/ OuJjlow.1·
Tollll ClutnKe in Reporwble Liquidity
Current week's Reportable Liquidity as of 8/22
P~ miing LTD Seulements Pending STD Settlements
Intlows 0.7 0.3 0.1
Outflows (0.7) (0.3) (0.3)
Ll
(1.3)
(0.2)
38.0
11.4
Net impact on Reportable Liquidity
$(0.3)hn THSRC transfer to BH, $(0.2)hn Thalia restructure to Clio Net impuct on MCO
$1.2bn US bank lmm drawdown, $(0.5)bn net CP maturity Refer to the Loan Summary Ahove
$(0.4)bn matmity, ${0.3)hn huyhucks Collateral margins. which will he reven;eU next week LB Lux lntercmnpuny payment to LB IE
Financial Planning & Analysis
P~ nJing Other Settlements 7.1 $2.3hn excess CC in Reg entities, $2.5hn penUing Joan symlicutillllS. $l.lhn rewrn of LBI upstreamahte balance, $()J~hn 7th
Ave mHe repo to Bunkh:ms
Total Liquidity (A)
LTD Maturity (based on expected life)
STOMaturity Sc=cured Facilities Maturity C~.:>ntingent Commitment (?refunding) Debt and Equity Buyb>~ck l.;etter.sofCrerJit C .. _., ntingent Ct)Jiateral izatiun LB Lux Certiticates!Warrnnt'\
Total Outflow (8)
Current week's MCO position as of 8/22 (A-B)
45.5
24.4 5.7 1.7 2.1 0.3 0.6
2.4 ll.4
37.5
8.0
lncl. $1l.51>n Fiuelily. $0.41>n Sweubank. $0.51>n SMBC (JPYJ; $0.41>n SMBC (USD)
LBHI MCO & Reportable Liquidity 16.0 r 50.0 14.0 ~-0
12.0 ... 40.0 -10.0 35.0 ~ 8.0 30.0
8 ~ 6.0 25.0 "' OJ 4.0 20.0
.!:!1 2.0 15.0 o.ot--7~--~~--------~~--------~~~----~--------------------~------~~---------------------------------------+to.o
(2.0) 5.0 ~~ QO
-->~eo Reporlable liquidity
LBEX-WGM 000269

CONFIDENTIAL TREATMENT REQUESTED BYLEHMAN BROTHERS HOLDINGS, INC.
2. b. Cash Capital Summary
LBHI Cash Capital Change: 8/15-8/22 Starting CC position as of 8/15
Sources- increase/(decrease)
LTD Issuance Ro 11 in to current portion LTD Buybacks Mise
CC Sources as of 8/15
Total Change in Sources
Uses- increase/(decrease)
Contingent Collateralization Pending Settlements Update Mise
CC Sources as of 8/22
CC Uses as of 8/15
Total Change in Uses
CC Uses as of 8/22
l/C Funding- (increase)/decrease
I/C Balance as of 8/15
Total Chan e in 1/C IIC Balance as of 8/22
Closing CC position as of 8/22
Financial Planning & Analysis
13.2
139.9
0.1 (1.2)
(0.3) A A v.v
(1.4)
138.5
125.5
(1.5) (1.0)
(0.1) (2.6)
122.9
(1.2)
0.0 (1.2)
14.3
-4-
LBEX-WGM 000270

CONFIDENTIAL TREATMENT REQUESTED BYLEHMAN BROTHERS HOLDINGS, INC.
Financial Planning & Analysis
2. c. Cash Capital by BPM
lu$nun
Tnu.!ilioMICCSourt-c~
Dr~"TIDnnsl.:efA~i!it)'
Dru.,.:nS,_.1BCF..ci1ily
OrR"1' Chn.~e Convniu~U f'ncility
Dnn,nSt•t<>SII".:>:I B11nl.:f'~dlil)'
Dra\\TI F~nwuy Cooduit
Ora"nRAC'!ORSFadliry
Dr•wnDrc:<o.l•~o:rFaciliry
OnwnMetlireFatiliry
Serur.:.l r,.,;~~nJihlc F•ciliLi.:~
('()}.1MODITIE.'>TRAOI~O
OCMADS
EliROI'E
f'ID CORPORATE fOIU::ro:-,• I:.XOIA.'.:OE
Gl.OBAL RATES
I!IGH GRADE CREDrr
lllCii!Yffil.D
lliVE.RAGIW 1"1:-JANCE
MI.':-11C'U'AL'>
l'ROf' TltAI}INCi
I:EAL E..'>TATE .~ALES.-Rr:.'i!ZAIHlll/illMIN
-~~f'liRrr!Zm> I'ROL>liC·rs
;..•onOno: R~h:~u~no.lihk•
ll11nkh~u~ .nJ >t~ho.l~l>l l!ll:llln<'llh:-<li.DIDr.x
Tnt;.\ Fin
,\i\-mRIC""AS CASII
ASIAC:ASII
C'ONVE.RTIDU":.'i PRODliCT
I;QtiiTffiS CORPORA"ffi
EQliTflr:.~ S\!I'PORT
EQliTfY STRATEGIES
f:.llltoi'E CASU
EVEt\'"I'DRIV~~
CiUlDAl.I'ORTfOI.IO
VO!.ATJI.O"Y AMUR[(""A<;
VCJI.A"nt.n·y ASL\
VOI.A.TII.Tl"YI~liiHII'E
:-;nn Tn!M\If)' f~l~nllihk~ lln;lllm1oh:Jl.lllllnx
Tn1:1IEQ
tl.EARI!\10 A:-.1l I~XECVriOI\'
EQilfi"Y FJNA.'.:c:JNG
EQ\1frY SY:>.'llmTit"S
!'Ill Ftrf1fRIO..'i
J'IRMI'JNANC1NG GJ:NERN.JST PRJ/'.IE SVCS COR
s·mtrc·nrREDTRANSACTIOI'-'.'i l!n"ll"""'t~o.l LBI Rnx
TubiC~u·s
ALTIORt'ATIVJO..~
A.'>SE1" ~lAl'IACiE~OXfi'RINC'li'Al. I~V
A.<;SET MGMT ADMtt'ISTRATJON
FIXED INC'IIMJO A'iS!;l" MGMT
!MD C0Rf'(JRA1T:.
MFI EQ\ITrY
:-.1\llDEIU";f":.R DERM..\:O:I'RIV MiST MGT
I'IM 1\SSETMGMf INTRA DIV EI.JM
l'IM l'RE·Al.LIIC'A"IlCD
I'IUVI\'IlOHQllTI"Y tln.,Unnor~J LIH lln~
Tnr~\!Mil
r>IREerr•ltJNCIPAL IN\'f:.'JT:\OXI"S
r;J.OBAI. orr•nRTLr;..:rrms GROl 'I'
r.t.OfiAL I'RII"'<'li'AL ~~A11~C";I\OS
Gl.OIML TRADINCi SrRATEGII~S
TulaiPI
SnnTrn~int:Ao~..;,;:l'(n<>l~ I)
,,..,.,,,.\ (1771
'"' DO (I) (IJ)
.'i07
'"' )0) (II)
-------------- ___ 'J!i --------- ____ 'JS -------------- ___ 1111 __ -_ -----~ .IIIII JU7 K,lm 11,71(• lUI Ill 10!
1.!11)
I,.IH I!)
l.n.l'J !.M! 1111 (.:!.'J) (!Ill Pill
-------------- ---" --------- ----'-' -------------- ---" ---- --------" I !II
)'JO
t.CJIIO (3.-112)
1.1'166 IS.-119 2.319 12.~2
~.foK6 15671
(!i'JJI {foJil) (l.mtl)
319
'"
!.l'J 507
J.771
(77~)
.\AI~
122.945
14.3311
I)H.llll
{o,ll2-l
1[.3)'))
134.122
l!f.SIU
(o\(o
19.126
(:!ll) " {H)
1.00[)
IIHl
Jl.l)
()7
ll.l)
Hill
(!H)
{.l7)
:!.177
1:'>71
tSRJ
'" ,_.
'"
(I)
flSU!)
(l.l)()(lj
1,154
1167
11111!\
" 1111!1!
lllurl,.ofrs j(trcl t«.<rl.<. $'""/hill. f>lif<"lttml /''"''· ,/,fnrrollm "'""!<. '""''' 11/l~ml:.<. J;•"' ml pnrt>trr,Mt• w····~•m•. <lm.-r ,.,Wf""""''" mw</1111111. ml<l ;,t/wr mi>r. <~«•I•. 'IH'Trtii'!'D"f"n""ol.fp•r••r\'cJOm"!alo<~>f1v•""
.uu·,,..r.,.,.,...,,'!IJ".'"'~~""'-"·1.51/u:il"swr;~rl~:r•·•··""'''""f'iluli.•·.(J.511 .
. IJuf;".< urr r.tt•r« ,.,.,,wt ,..,, $4 •• \"H" 1 J4.1.74N97.~l.~1174';o. '''l'itu/ Rt>li111: IJ/If;>. Uljllirr•l '"·""'""'~ 1!1"1 t"I>Jiillll i1 1:!11~";, ~>{lo/ul ""'fllirr<lr<IJ<itol •
. 1//nlrtr•••Jmn.r.rnlulr!t/fiiiiiRr,;TIIIflrJ,:ill);rl"'ul"l"".-hnnhurlrJmol.
- 5 -
LBEX-WGM 000271

CO
NFID
ENTIA
L TREA
TMEN
T REQ
UESTED
BY
LEHM
AN
BR
OTH
ERS H
OLD
ING
S, INC
.
r m m >< ~ G) s 0 0 0 1\) ...... 1\)
a-
.-/--
Cash Capital Usage in billions
BPM FID Real Estate Securitized Products Global Rates coo High Yield FlO Corporate 1
High Grade FX Municipals Liquid MKTS Proprietary Commodities Other Bankhaus Equity and Subdebt Unallocated LBI Box Subtotal FID Core
IBD 2
Total FID & IBD
Equity Volatility Equities Corporate Equity Strategies Convertibles Product Global Portfolio Execution Services Other Unallocated LBI Box Total Equities
CMPS IMO PI Non-Trading Assets 3
Other•
Total Other
Total Usage
Current Week 8/22/08
Cash Balance cc Capital Sheet lntensitv
33.7 60.3 56% 12.2 54.4 22% 6.2 59.3 10% 4.3 8.8 49% 7.6 11.2 68% 5.2 4.2 125% 2.8 9.7 29% 1.1 3.8 30% 0.3 6.4 5% 0.3 3.0 9% 1.9 6.8 28% 2.8 1.7 -2.1
82.2 227.9 36%
0.7 3.4 20% 82.8 231.3 36%
5.4 20.0 27% 3.3 2.6 128% 0.6 3.0 20% 0.5 1.4 35% 0.3 0.6 49% 0.7 5.4 12% 0.0 0.4 -
11.2 33.0 34%
5.8 29.6 20% 8.7 9.6 90% 6.0 8.3 72%
12.5 14.3 87% 11.3 23.9 47% 44.3 85.7 52%
138.3 350.0 40%
~\
Prior Week 8/15/08 Prior Month End 7/31/08
Cash Balance cc Cash Balance cc Capital Sheet Intensity_ Cagital Sheet Intensity
33.7 61.3 55% 34.6 62.5 55% 12.4 54.5 23% 13.6 59.8 23% 6.9 60.6 11% 7.7 76.5 10% 4.3 8.4 51% 3.7 9.0 41% 7.8 11.2 69% 8.2 12.6 65% 5.4 4.6 117% 4.8 4.5 106% 2.7 10.1 27% 2.5 10.3 25% 1.1 3.8 29% 1.4 4.3 32% 0.3 6.1 so;~ 0.9 6.1 14% 0.3 2.6 10% 0.3 4.1 8% 1.9 6.6 28% 1.9 8.6 22% 2.4 2.7 -1.7 1.7 -1.1 - 1.4
81.9 229.8 36% 85.4 258.5 33%
0.6 3.7 17% 0.6 4.1 16% 82.5 233.5 35% 86.1 262.5 33%
5.5 20.2 27% 5.9 21.5 27% 3.6 2.8 125% 3.5 3.0 119% 0.7 3.2 21%: 0.6 2.9 21% 0.5 1.4 35%] 0.3 0.5 53%
0.4 1.5 29% 0.3 0.6 46%
0.6 5.7 11% 0.8 6.2 12% 0.0 0.0 0.4 0.6
11.5 33.8 34% 12.2 35.8 34%
4.5 33.4 13% 5.8 39.1 15% 8.7 9.6 91% 8.7 9.8 89% 6.0 8.2 73% 6.0 8.6 70%
12.3 14.3 86% 12.3 14.1 88% 15.5 24.2 64% 13.8 5.2 266% 46.9 89.7 52%
' 46.6 76.8 61%
141.0 357.0 39% 144.9 375.1 39%
1) FID margin and cash at banks requirements are allocated entirely to FID Corporate. Allocation by BPM is later done by the business. 2) IBD cash capital includes Contingent Commitments which is not a balance sheet requirement.
YTD Change
Cash Balance Capital Sheet
(8.3) (10.3 (1.5) (4.2 (1.5) 11.5 (0.6) (2.2 (3.1) (3.3: (3.3) (3.9: 0.7 (1.1:
(1.2) (2.1; (0.6) (1.8; (0.4) 1.5 0.9 4.3 1.4 0.3 0.6 -
(16.6) (11.6)
(1.7) (4.0) (18.3) (15.6)
(2.4) (10.0) 1.4 (0.6)
(0.3) (1.3) 0.1 (1.4)
(0.2) (0.2) (0.1) (3.4)
(0.5) (0.2) (1.8) (17.0)
: 0.6 (18.4)
(1.0) (3.6) (1.1) (6.4) 1.4 (1.3) 8.4 20.9 8.3 (9.0)
(11.9) ' ' (41.5)
3) Includes fixed assers, goodwill, reliremem plan. deferred tax assets, cash at banks, general partnership accounts, direct cmporate investmem, and other misc. assets. -1) Includes shonjal/s, imercompanyfimding, tmcdlocated Derivative activity, gross-ups for se(ffimding trades and canting em collateralization.
02'08
Cash Balance cc Capital Sheet lntensitv
35.6 66.8 53% 14.9 59.2 25% 9.8 36.4 27% 2.9 6.5 45% 9.3 14.0 67% 8.2 6.9 119% 2.1 8.1 25% 1.4 4.2 33% 1.2 6.5 19% 0.6 1.6 35% 1.1 5.0 22% 2.3 1.7 -2.4
93.6 215.3 43%
2.3 6.2 37% 95.8 221.5 43%
5.2 22.3 23% 3.2 3.1 103% 0.4 2.3 19% 0.3 2.1 14% 0.4 1.4 31% 0.8 6.4 13% 0.0 (1.0) 0.8
11.3 37.6 30%
5.6 30.6 18% 8.4 11.5 73% 5.8 9.5 61%
11.7 15.5 75% 4.0 3.7 108%
35.5 70.8 50%
142.6 330.0 43%
01 '08
Cash Balance Capital Sheet
42.1 70.6 13.7 58.7 7.7 47.9 4.8 11.0
10.7 14.5 8.5 8.0 2.1 10.8 2.4 5.9 0.9 8.2 0.6 1.5 1.0 2.5 1.4 -1.4 -1.5
98.8 239.5
2.4 7.3 101.2 246.9
7.8 30.1 2.0 3.2 0.9 4.3 0.4 2.7 0.5 0.7 0.7 8.9 0.0 0.6
13.0 50.0
5.2 48.0 9.7 13.3 7.1 14.8
11.1 15.6 2.9 3.0
36.0 94.6
··15.0.2 · ·391c.5.· ··
cc Intensity
60% 23% 16% 44% 74%
106% 19%. 40% 11% 42% 40%
42%
33% 41%
26% 61% 22% 15% 63% 8%
26%
11% 73% 48% 71% 96% 38%
·, 38%
~'-.)
fl.
~ ~ ~ ~
~ ~ ~
~ ;::, !:> ;::,
[ ~ ::1 ;::,
~· Ro ~
~ q "' ;;;·

CONFIDENTIAL TREATMENT REQUESTED BYLEHMAN BROTHERS HOLDINGS, INC.
3. Traditional Investment Returns
Investment Returns For the Period Ending August 24, 2008 $in millions, Spread in Bps
Summarv of Excess Returns:
~c .~- .... ;:m ii~ffli~~~1~Y~"Wlif~ii1':l~~,JE~~t K~hl~tt """""'' ~~
SinMillitm.r Americas Asia Europe
Tutullnn~stl~tnt Rchu·~s US CP & Bank Loans Non-US CP &. Bank Loans
~~t~: -~t=~ ·~::·~~:~OIP~).
YTD FY2008
:HJ.(,(i $
2.17 .Dil.{l8)
2.16 o:uO)
0.17 (~1.47) $
Annunlizcd 41.76 s
2.95 (41.?8)'
2.\N {1854)
ll.22 (15~'\7.) s
(4.81
~U~lli;Fl%~Jf\~~J.Mji~~~~·~.ff:It~~!Z~~'i£~~1t SinMillimu lmpar:l rifCIIunJ.:~
Average LiQuidity '(TD_ A¥erage Sp~e~d
IChn~~-in.Exce..s Ret~rns
MoncyFunU~
Dayli:;lll Ovcn.lro!rt Deposits Syntlic;llhmPrcfum.ling Bnnt!Funtls O!hcr Extcmnllnve;tment~
Suhtotul lntcm;~\ lnve.~llnenL~
FID Revo.·uc Rcpu Ettuity Rc\'l!rse Rcpu LB B;mk Stmctw-l!tlirades EtJuitylnv~tmcnts
Other lntcm~l Invc.~tment~ Sul;{ot~l · ·
Current Week Summa.y By Region:
Is
bos
0.1
4&2 162 641
2.557 24,141
4,703 2.52K
1.1
530 36
7,1U3 31,954 (<1,742)
9,.:134 512
5,727 23,(108
1.314
17
1,331 24,1.19 (\,1\43)
Investment Return Summary- Lnst 12 Months:
"'~~~
P1:rinJ: Tnhl
~ FY :!.IX'JR 32.0 FY 2007 31.3 YoY 6 0.6
Weekly: Current 36.4 Prior 34.9 WoW6 ,_,
Munlhh·: ~4 35.3
Ju\-08 35.8 hm-OK 43.5 May.()){ 37.6 Apr-In: 29.1 M;!r·OR 24.8 Fch-f)K 25.6 J~n·OK 27.8 Dee-07 28.7 Nnv·07 31.4 Ocl-117 32.3 Sep·U7 34.8 Allt!·07 29.7
Ex Returns (0.30) 0.31 .o.oo I
Lit]tlitlitv Pun\ {BnSt CP
(5.6) (2.1) (3.5)
(2.0) (2.4) OA
(2.2) (2.5) (3.4) (5.71 (6.4) (7.0) (7.5) (8.2) (7.0) (4.4) (6.2) (1.9) (1.2)
FY 2007
Ex.CP
26.3 29.2 (2.9)
34.4 32.6 I~
33.1 33.3 40.0 31.9 22.7 17.8 18.1 19.6 21.7 27.0 26.0 32.9 28.5
8.77 0.02
(2_6:-'\9) (17.71))
0.97 1.44
115-1811 (4.911
1:1,170 .'il2
518 5,727
31,511
3,609 \,0911
17
199
4,923 36,435 {1,991)
Financial Planning & Analysis
4.Sli~
12.2.'i7 2,913
IGR (326)
214 (214)
:"iH5 (7)
7,cxn (1,276)
311,521 990
2.H50 759 1,109 (J())
17
<!(!{) {261)
4,419 SliS 3-1.940 1,4% (2,386) 394
5.736 :'i\2
5711 :'i?K 5,727
7,796 Jl,Sil
2,295 3.(ill9 1.0911 J,t)'oJR
17
IHCi 199
3,!'79 4,923
11,374 J(i,435 (J-1111 (J,IJ<JIJ
s,~,~· ~I 1\VL ~F.:UEfl' (hp.~) IWL
\'~FcdEIT
38.9 0.9 3.K7 ~.69 tl?.:l 9.6 (5.6) 5.25 :un 14.9 29.3 6.5 (1~18) {2.411 12.K
25.8 (14.7) 2.39 1.99 40.3 22.5 (14.0) 2.40 2.04 36.8 3.3 10.6) 10ll2} 10.0!''1 ,:\.9
37.3 (2.7) 2.41 2.01 40.0 37.0 (3.6) 2.42 2.02 39.9 31.8 (10.4) 2.42 2.00 42.1 62.2 17.6 2.45 1.96 47.1 38.7 (16.0) 2.83 2.28 55.6 24.8 (4.8) 2.95 2.61 33.6 41.9 24.2 3.16 2.98 17.9 30.9 8.8 4.17 3.94 23.3 40.3 (0.8) 4.69 4.24 44.6 14.3 (6.9) 4.70 4.49 21.5 29.5 10.5 4.94 4.76 18.8 24.4 (23.4) SAO 4.94 46.2 (10.2) (51.2) 5.44 5.02 41.7
- 7 -
LBEX-WGM 000273

CONFIDENTIAL TREATMENT REQUESTED BYLEHMAN BROTHERS HOLDINGS, INC.
Financial Planning & Analysis
4. Issuance Levels
Lehman Issuance Levels and Spreads:
As of: 08/22/2008 ,,.,~::VI's: ... . .·.· ··Jyrs\•·.:.- ... ·.; "4YI's:·•.:· · ... ~:_:: syfs. ·'.7hs· ···.,·• "· lOyrS. ·· /· ···20 yi'si >--3Qyrs.
Treasury Yields 2.40 2.65 2.89 3.13 3.43 3.87 4.16 4.46 Spread to Treasury's 565 540 515 490 490 460 440 450 Fixed Issuance Yield 8.05 8.05 8.04 8.03 8.33 8.47 8.56 8.96
Swap Spreads 118 98 97 90 86 65 27 39
Spreads to lml .. 447 443 418 400 404 395 413 411 '
As of: 08/15/2008 ·. 2yrs ·.···.3yrs .. 4yrs• .·· . <5yrs .. · 7'yfs. · .···. iOyfs. .· 20yrs ··· '31Jyrs
Treasury Yields 2.39 2,63 2,87 3.II 3._41 3.85 4.16 4.47 Spread to Treasury's 540 515 490 465 465 435 415 425 Fixed Issuance Yield 7.79 7.78 7.77 7.76 8.06 8.20 8.31 8.72
Swap Spreads 85 98 98 91 88 68 28 42
Spreads to lml 455 417 392 374 377 367 387 383
Week over Week Change: 2 yrs· 3 yts · 4yrs. 5 yts> .· · 7yrs IOyrs .20yrs· :30'yrs·
Treasury Yields 0.01 0.02 0.02 0.02 0.02 0.01 0.00 -0.01 Spread to Treasury's 25 25 25 25 25 25 25 25 Fixed Issuance Yield 0.26 0.27 0.27 0.27 0.27 0.26 0.25 0.24
Swap Spreads 33 0 -I -1 -2 -3 0 -3
Spreads to lml -8 25 26 26 27 28 25 28
-8-
LBEX-WGM 000274

CONFIDENTIAL TREATMENT REQUESTED BYLEHMAN BROTHERS HOLDINGS, INC.
(
5. Peer Group Benchmark Issuances
Peer Group Benchmark Issuances:
Senior/ USD Issuer Sub Ccy Principal Et1uivalent Trade Start Mature Lift:
LEH Suhtlcht USD
MS
GS
Senior GBP
Senior USD
Scnit1r SGD
Scninr USD
Suhtlcht USD
Seninr EUR
Senior USD
Scniur USD
Senior USD
Suh1lcht USD
Suhtlcht USD
Scninr USD
Senior
Senior
Senior
EUR USD
JPY
Scninr JPY
Scnim JPY
Senior USD
Scnitlr USD
Scninr USD
Scninr USD
Scninr EUR
Senior EUR
Senior GBP
SuhDcht USD
Scninr USD
Senior USD
Scninr USD
Senior CAD
Senior EUR
SuhDcht EUR
Senior CHF
Senior EUR
Senior USD
Senior USD
Scr:ltlr EUR
Senior USD
Scninr USD
Senior USD
Senior USD
Senior USD
Scninr EUR
Senior USD
Senior USD
Scnit1r JPY
Senior JPY
Senior USD
Senior
Senior
Seninr
Senior
:Senior
USD
EUR
JPY
JPY
USD
S\1hDch1 GBP
:Senior USD
S\1hDcht USD
USC Senior USD
t\IER Scni<1r GBP
Scninr USD
5cninr USD
Senior EUR
·senior USD
2.000
500
2.500
250
4,000
1.500
1.750
1.000
2.250
750
1,500
2.000
1.500
500
2.250
22.000
56.000
50.000
2,750
100
1.000
500
1.500
200
300
750
1,600
250
650
180
500
1.000
ISO
1,500
1.500
1,250
500
1.000
600
400
2.000
1.500
1.0!10
250
2.500
20.000
30.200
2.250
1,500
2.!XIO
130.200
IR.300
3.1XIO
325
2,750
2.500
3,000
xso 1.500
5.500
500
2.250
2,000 512/08 5/11/38 30.00
990 4/30/08 5/H/08 5/8/18
2.500 4117/08 4124/08
176 2115/08 2122108
4,000 1/14/08 1122108
512118
2122113
1124/13
1.500 12/17/07 12121/07 12128117
2.450 10/10/07 10/17107 10/17/12
1.000 9119/07
2.250 9/19107
750 8121/07
1.500 7/12/07
2,000 7112/07
1.500 7112107
670 6120/07
2.250 5/30/07
181 5124/07
462 5124/07
412 5124/07
2.750 5122/07
100 5122/07
1.000 5/8/07
500 5/'i./07
2.040 512107
272 4/26107
597 4/25107
750 •t24/07
1,600 3/20/07
250 3120/07
650 3120/07
207 3/16107
650 ~ 2116/07
J.Joo 2n1o1
I X6 2/6107
1.935 1/11/07
1.500 1/9/07
1.250 1/9107
6(;0 12/IX/06
9126101
9126/07
8127/07
7119107
7119/07
7/19/07
6!27/07
CJ5/07
6/5/07
0/5/07
6/5/07
5125/07
5125/07
5117/07
5117/07
5110107
5110/07
5/4107
5/1107
3123/07
3123/07
312)107
3121/07
J/5107
2115107
3/13/07
1/22/07
1112/07
1/12107
12/22106
9!1.7!27
9/26/14
9/15122
7/17137
7/19/17
7119112
6127/14
6127/13
6/5/17
6/5/12
6/5/12
5125/10
5125/10
5117/34
5/17/34
5/10/12
5/10/12
1/25113
513132
3123109
3123/09
3123/09
2/5/09
3/5110
3/14/19
3113/13
2/5/14
216/12
1/12/12
7f.W/12
10.00
10.00
5.00
5.00
10.02
5.00
20.00
7.00
15.05
29.99
10.00
5.00
7.00
6.06
10.00
5.00
5.00
3.00
3.00
27.00
27.00
5.00
5.00
5.73
25.00
2.00
2.00
2.00
1.87
3.tHI
12.08
6.00
7.04
5.07
5.00
5.58
1,000 12/JH/06 12121/06 12123/0H 2.01
600 12/IX/06 12121/06 12123/0~ 2.01
400 12/lt{/06 12121106 12123/0t-: ::!.01
2.1XIO 5128/0K 4/1/18
1.500 4/23/0K 4/.!S/OK 4/2S/15
1.580 4/9/08 4/15108 4/15/11
250 4/1/08 4/1/0R 4/1/1 K
2.501! 12120/07 12128107 1212K/17
186
2XI
2.250
1.500
2.953
1.208
170
3.000
1118108
1/IXIOH
3127/08
4122/0K
1129/0R
1123/08
1123/0K
1111/0K
1124/0K
1124/08
4/1/0K
4/29/0K
2/Ci/OK
1/311/08
1/30/08
1/18/08
1124/13
1124/13
4/1/IH
4/1/18
2/15/13
1/30/13
1/30/13
1/18/18
10.00
7.00
3.00
10.00
10.00
4.00
4.00
10.00
111.00
5.00
5.00
5.00
10.00
n36 1110/0K 1/IX/OK 1/IK/38 30.00
2.750 12/IX/07 12122/07 10/1/37 30.00
2.500 3125/0K 4/1/0K 4/1/IK 10.00
3.000 1129/0K 2/1/0X 2/1/1 K
1.6K3 -U23f{)K 4/30/0K 4/30/1 K
1.500 4/22/{)K 4/25/0X 4/25/13
5.5fXl 4/22/0K 4125/0K 412511 X
740 2/4/0K 2/l\/OK 2/!{/13
2.250 1/29/0X 215/0K 2/5113
III.IHl
10.00
5.00
10.011
5.1111
5.1111
Coupon
7.5
n8 6.875
6mL+210.8
5.625
6.75
5.375
6.2
3mL+
6.875
6.5
5.125
2.23
1.69
3m JP Lihor + 23
3mL+ 14
FFOpen+ 22
5.857
3m Eurihnr+ 34
3mL+7
lmL+7
FFOpcn+ 16
3m BBSW+ 2.5
4.625
2.875
3m Eurihnr + 30
5.25
3mL+23
3m E\:rih~lr + 25
3mL+5
lmL+S
Prime -2g5
6.625
6.5
6.625
5.95
2.18
3m JP Lihnr+ 120
6.625
6.15
5.375
3m JP Lihnr + 110
2.11
5.95
6.K75
7.149
6.15
7.25
7.75
5.45
Estimated lml Sprt:Hd
273.0
271.0
250.0
210.8
213.8
194.3
93.3
167.5
128.5
170.0
99.4
76.1
44.6
37.3
1.3
41.0
25.9
24.0
14.!\
12.3
85.0
83.0
33.3
4.0
33.0
78.8
8.0
7.0
6.0
1.0
10.0
42.7
17.0
29.0
24.3
23.3
27.0
5.9
5.0
3.9
165.0
193.3
TBD
236.0
127.0
124.0
124.0
246.5
174.0
125.0
114.0
114.0
157.5
223.0
210.0
207.0
312.0
242.0
257.0
190.0
193.0
Financial Planning & Analysis
Comments
Priced @ T + 305hps (priced tlffthe Mny '37':;
Priced @ T + 320hp:;
15yr no put5yr
13 mnnlh extemlihle ·I. nat. +I. +2. +3. +3
S:Hnumi
S::unumi
MCAPS FIXED
MCAPS FRN
13·12·13 month cxtemlih\c lml +3. +4. +5. +6. +7 :UHHml step up
25nc20 last Syrs 11oats utJmL+ 7t{
3nc2, steps up In curihnr + 22 if not c:~llcd
12nc7. steps up 10 lm eurilmr + 9-lhp:-o ifnnt called
T:.!p of!u!y '!2. rcu!Tcr 3m Eurihnr + 29
Priced (!:!l T + 240hps
Priced (!fl T + 275hps
Priced @ mitlswaps + 230hps
Priced @ T + 300hps I T:1p nl"2.25hn deal
Priced @ T + 200hps
Priced@ T + 3\2.5hps
Priced @ T + 237 .5hps
Priced @ mid swnps + 130hps
Priced @l T+215
Priced (gl mid swaps + 230hps
Priced(!!! T+260: Tap ofdc:11 originally iss11e in Sept2007@ L+ l2K.5 (T+I90)
Priced t'!!1 T + 270hp~
T + 362.5hp.~
T + 325hps
T + 320hps
priced at mid swaps +195hps
T + 262.5hps
-9-
LBEX-WGM 000275

CO
NFID
ENTIA
L TREA
TMEN
T REQ
UESTED
BY
LEHM
AN
BR
OTH
ERS H
OLD
ING
S, INC
.
r m m >< ~ G) s 0 0 0 1\) ...... en
Weekly Finance Committee MIS Loan Update -New Issue Pipeline I Closed Loans
Top Pipeline New Loans as of 08/28/08
Loan Type Deal Facility
HY Loan Waste Services R/C and Term
HY Loan Seadrift Coke. L.P. Term
HG Loan CVS Caremark Corp Bridqe
HY Loan Bonten Media Term
HY Loan Taiwan Hioh Soeed Rail
HY Loan SunGard Data Systems Incremental T/L and Bridae
Highlighted Funded Loans for the week ending 08/28/08
Loan Type Deal Facjilly
Projected Funding (Including Fronting) at
close
$37.500,000
$200 000.000
$162 500 000
$57,000,000
TBD
$30.000,000
Funded Amount
Expected Settlement Date Ideal Entity Expected Entitv
9/8/08 LBCB LBCB
9/15/08 LBCB/LBBAG TBD
9/15/08 LBCB/LBBAG LBCB/LBBAG
10/1/08 LBCB/LBBAG LBBAG or LCPI
10/1/08 TBD TBD
10/3/08 LBCB LBCB
Settlement Date Ideal Entity Entity Placed
IHG Loan lcME Grouo I I $;50,000,000 __ r::::::_ 8/:26/08 !LBCB___ ILBCB
Highlighted Fully Unfunded Loans for the week ending 08/28/08
Loan Type Deal Legal Entity Unfunded Amount Comments
IHG Loan IHSBC ILBCB I $25,000,000 I .. _____ ! ----- I
0
Comments
Best efforts deal expected to be $0 after close; this is frontng amount; Reduced from $240mm oreviously:Delayed from 8/29
Multiple banks hav come in with commitments to bring us to $325mm in comm and 50% of that funded
Bankhaus a possibility (depending on hold timing given size) :LBCB cannot take due to I payoff of existing debt; Delayed from 9/1
Existing Financing due to be paid off within 30 days of when TPA is signed (was set to be 5/20, but delayed with new Finance Minister) which is when Lehman commitment set to be approved; Com-mitment unknown but being sold down; closing and funding 4 to 6 weeks after commitmemt signing
Bridge has been fully syndicated ($70mm Lehman share); Still left with $30mm ......
Comments
- l
Expected Holdings
Funding
$0
$0
$0
$57,000,000
I
TBD
$_Q_
?'-
* ~
~ ~ Q <::>
~ :::...
~ ;:::
~
~
~ ~ ;: ..., §:
i¥ ;:
~· Ro ).. ;:
"' ~ "' ;;;·

CONFIDENTIAL TREATMENT REQUESTED BYLEHMAN BROTHERS HOLDINGS, INC.
7. a. Thrift Sources and Uses
Sources (Liabilities and Equity)
COs - Broker ( < I year maturity) COs - Broker(> I year matm·ity) Customer Deposit- LBCB Customer Deposit- LBI Customer Deposito;;- Ret..1il Customer Depositc;- Long-tenn Customer Deposit -LBHI Aurora Servicing Deposito;; Bmrowings - FHLB Sweeps Fed Ftmds Sub Debt Other Payables Equity
Total Sources
Uses (Assets)
Certified Residential Mortgages
Certified Residential 2nd Liens Non certified ResidentiaV Delinquent Loans Certified Commercial Mongages Non certified Commercial Mortgages Mortgage Warehousing Corporate Loans Leases Margin Loans
(~ SBA Loans Student Loans FHLB Stock Securities Held for Sale Short-term Investmentc;:
Cash Margin Cash and Oti1er LBCB Deposit Money Market Fund
Other A$sets
Toe'! Uses
Net Excess Sources Over Uses
Prefunding contingent commitment~
Conduit
Net Surplus/(Shortfall) after prefundings
Add back: Segregated cash in money timds
Expected Surplus/(Shortfall)
Add back: Customer CDs, deposit), and sweeps outflows
Potential Surplus/(Shortfall)
Remaining Bon·owing Capacity
Capital Ratios- Month ended 7/31
Tier-!
Tier- I Ri!>k Bn!>ctl capital (Ticr-1/Risk Weigh. A~scts)
Tutal Risk Ba.~cd capilill
( Average Capital Ratios- Month ended 7/31
Tier· I
Tier-! Ri.~k B:t.~cd capit:ll (Ticr-1/Rbk Weigh. A~sct.'\)
Tnt:1l Risk B:~scd ~.::1pilul
Lehman Brothers Bank CASH CAPITAL NET CHANGE REPORT
($millions)
Cash capital Haircut
80% 100%
0% 80% 80%
100% 0%
80% 0%
80% 0%
100% 0%
100%
44% 53%
100% 53%
100% 100% 100% 100% 100% 100% 100%
0% 5%
0% 0%
90% 0%
100%
J 14.88% 14.25% 17.09%
I 14.71% 13.58% 16.29%
15-Aug-08
Balance Sheet
2,580 4,060
0
168 0 0
213 0
852 151 300 453
1,706
10,483
1,349 602 592
1,302 869 106 266
0 0
81 465
33 628
46 (259)
0 2,150 2,253
10,483
Required
6.00% 6.00% 10.00%
Cash Capital
2,064 4,060
0 0
134 0 0
171 0
681 0
300 0
1,706
9,116
594 319 592 684 869 106 266
0 0
81 465
0 31
0 0 0 0
2,253
6,259
2,857
(720)
(550)
1,588
3.300
4,8881
763
5,651
1.657
Financial Planning & Analysis
22-Aug-08 Change
Balance Cash Balance Cash Sheet Capital Sheet Capital
2,452 1,961 (128) (103) 3,989 3,989 ("/!) (71)
0 0 0 0 0 0 0 0
164 131 (4) (3) 0 0 0 0 0 0 0 0
215 172 I 0 0 0
854 683 2 599 0 448 0 300 300 0 0 769 0 317 0
1,736 1,736 30 30
11,078 8,973 595 (144)
1,258 554 (91) (40)
596 316 (6) (3) 672 672 80 80
1,175 617 (127) (67) 948 948 79 79 106 106 0 0 262 262 (4) (4)
0 0 0 0 0 0 0 0
72 72 (10) (10) 498 498 33 33 33 0 0 0
622 31 (7) (0)
46 0 0 0 6! Q 321 0
0 0 0 0 2,!50 0 0 2.579 2,579 326 326
11,078 6.654 595 395
2,319 (539)
(472) 248
(550) 0
1,297 (291)
4,579 1,279
5,8761 9881
737 (26)
6,613 963
1,543
- I I -
LBEX-WGM 000277

CONFIDENTIAL TREATMENT REQUESTED BYLEHMAN BROTHERS HOLDINGS, INC.
7. a. Thrift Pipeline
Lehman Brothers Bank Pipeline Report as of August 15, 2008
Deal Name
ALS PmUuction
Commercial Deals LBSBF
L()ans purch:.lscd intn LBB
Bala nee Sheet as of July 31, 21Hl8
Total Remaining Activity for July Investments Change*
Projected Month End Balance Sheet
UPB 11.883,380
4,500.000
16,383,3811
10,016,000,000
(2,134,176,974) 1.393,176,974
9,175.000,0110
*Includes CD Maturities, Fed Funds Borrows, and Seg Deposits
Ledger Deal Name
Various Projected ALS Proc.luction
ADX Projected Commercial Funtlings
M7D Projected LBSBF Everhonk 2008-19-JFX Everhank 2008-20-HAR
Approved but not funded
Luaus snld our ul' LBB thus r.ar
UPB 8.116.620
15,500,000 2,400,000 6,HOO,OOO
32,816,620
Financial Planning & Analysis
Ledger Deal Name UPB Ledger Various Bayview 2008-2 (114,000.000) CWL
ADX Cup X Sole (600,000,000) CWL M7D Pacitic Premier 2008-3 (4,900,000) CWL MIA Victoria Master 21108-l (33,000,000) CWL MIA Park National (56,000,000) CWL
Novellus 2(l08-1 (5,822,907) PNMAC 2008-1 (221,712,000) Bayview :W08-l (97,160,000) CWL Fastholtl :W08-l (19,312.125) Arch Bay (113,549.581) River Funtl20m;-2 (1.536,981) RESJ second liens tn LBHI (900,000,000)
Lmms Scheduled lU b~ sold (2,160,993.594)
- 12-
LBEX-WGM 000278

CONFIDENTIAL TREATMENT REQUESTED BYLEHMAN BROTHERS HOLDINGS, INC.
Financial Planning & Analysis
7. b. LBCB Sources and Uses
(inMM) Cash capital Balance Cash Balance Cash Balance Cash Sources (Liabilities & Equity) Haircut Sheet Capital Sheet Capital Sheet Capital
CO's- Brokered < I year 80% 2,162 1,730 2,042 1,634 (120) (96) CO's - Brokered > I year 100% 3,480 3,480 3,610 3,610 130 130 Customer Deposits- MMA 0% 5 0 5 0 Committed Facilities- Drawn 100% 0 0 0 0 Committed Facilities- Undrawn 100% 0 450 0 450 Sweeps 80% 40 32 63 51 24 19 LBB Draw (Fed Funds Purchase) 90% 0 0 0 0 Forward Contract Payable 0% 95 0 78 0 (17) Unsecured- Other 0% 413 413 48 48 (365) (365) Other Payables 0% 388 0 394 0 6 Equity 100% 994 994 995 995 I
Total Sources 7,576 7,098 7,235 6,788 (341) (310)
Ui;;:.; (Assets)
Non-Certified Commercial Real Estate 100% 396 396 396 396 Certified Commercial Real Estate 60% 25 15 25 15 Multi-Family Mortgages 53% 0 0 0 Mortgage Warehousing 100% 115 115 ll5 115 Corporate Loans 100% 2,972 2,972 2,778 2,778 (195) (195) Other Interest Receivables 100% 647 647 662 662 15 15 Forward Contract Receivable 100% 0 0 0 0 CRA Investments 20% 13 3 13 (0) (0) Cash 0% 0 0 0 0
Time Deposits 0% 250 248 0 (2) Money Market Funds 0% 2.970 0 2,970 0 Treasuries 0% 0 0 0 0
(- 0~1er 0% 60 0 0 (57) Otl1er assets 100% 129 129 26 26 (103) (103) Jtal Uses 7,576 4,276 7,235 3,993 (342) (282)
Net Excess Sources Over Uses 2,822 2,794 (28) Prefunding contingent commitments (15% ALCO Min) 22% (2,006) 21% (2,241)
Pledged Corporate Loans 252 252
FHLB Advance Value on Affiliate Pledges 4
Net Surplus/(Shortfall) after prefundings 1,073 809 (264) Add back: Customer CD's, deposits, and sweeps outflows ,
Potential SuqJlus/(Shortfall) 1,073 809 (264)
Capital Adequacy Required
Tier 1 leverage ratiO 10.00% 15.10% 15.32%
Estimated Tier I risk-based capital ratio 10.00% 10.63% 10.71%
Estimated Total risk-based capital ratio 10.00% 10.63% !0.7!%
(
- 13 -
LBEX-WGM 000279

CONFIDENTIAL TREATMENT REQUESTED BYLEHMAN BROTHERS HOLDINGS, INC.
(
7. b. LB CB Pipeline
.JCB Asset Funding Pipeline- Assets Coming ihto/out of Portfolio 08/28/08
·. ··: '· ....... -:•:· .· ..... .··.· < L•'' '. ·. "': . . . . · ..... _, >'. :·\
BorrOWe-r::· . ~- { . . •.· ..... ·· .. .. ... · Deal oetails .. -: :
C&l NCAT-NEW CENTER ASSET TRUST Revolver NCAT-NEW CENTER ASSET TRUST LIQUIDITY FACILITY SLM CORP 5 YR 2BN 10/20/06 (BOA} Revolver SLM CORP 5YR 2BN 10/20/05 (BOFA) Revolver Swedbank 364 Day Revolver Duncan Energy· Term Loan Granite Ridoe Enerov. LLC Term loan
CRE Project Murphy Senior GRP Borrower HH lA, LLC (GEM Realty) Mezz lA NW Borrower HH lA, LLC (Northwood Real Estate) Mezz lA GRP Borrov.·er HH lA, LLC (GEM Realty) Mezz lA GEM HLT HFBorrower HH lA-I, LLC(GEM Realty) Mezz lA GEM HLT HF Borrower HH IA-2, LLC (GEM Realty) Mezz lA NW Borrower HH I B, LLC (Northwood Real E>tate) Mezz IB GRP Borrov.·er HH I B, LLC (GEM Realty) Mezz JB GEM HLT HF Borrower HH I B-1, LLC (GEM Realty) Mezz JB GEM HLT HFBorrower HH IB-2. LLC (GEM Realty) Mezz lB. IRP
Warehouse
Total· Note - Th1s mformat1on 1s subject to change
~!;~~j~~fl ; ' -.·.
$32,581,454.00 $217,418,546.00
$99,000,000.00 $100,000,000.00 $150,000,000.00
$17,800,000.00
($98,999,897.00} $53,972.95
$32,787,490.00 $21,913,646.28 $9,007,967.63 $9,007,967.63
$30,654,774.16 $20,538,699.45 $8,422,029.98 $8 422 029.98
: $658,608,681.07
Financial Planning & Analysis
.·..:-_. '·:<··._.,.. ·<:-:·.:_:.. .,..
·•· : • il~~:C.ail'a:C!iy · ..... .;
. '/~-~·nde~ -~~rt·i~n • · . · · .Uiillzalion ; .. ;\Jp~;~ ~~6~~) · .
$0.00 $16,290,727.00 TBD $0.00 $108,709,273.00 TBD $0.00 $49,500,000.00 TBD $0.00 $50,000,000.00 TBD $0.00 $75,000,000.00 9/5/2008
$17,800,000.00 $14,240,000.00 1/30/2009 TBD
($98,999,897.00) ($79, 199,917.60) 8/29/2008 $53,972.95 $43,178.36 8/29/2008
$32,787,490.00 $26,229,992.00 8/29/2008 $21 ,913,646.28 $17,530,917.03 8/29/2008
$9,007,967.63 $7,206,374.10 8/29/2008 $9,007,967.63 $7,206,374.10 8/29/2008
$30,654,774.16 $24,523,819.33 8/29/2008 $20,538,699.45 $16,430,959.56 8/29/2008
$8,422,029.98 $6,737,623.98 8/29/2008 $8 422 029.98 $6 737 623.98 8/29/2008
$59,608,681.07 $347,186,945 ....
- 14-
LBEX-WGM 000280

CONFIDENTIAL TREATMENT REQUESTED BYLEHMAN BROTHERS HOLDINGS, INC.
(
7. c. Bankhaus Sources and Uses
Utilisation of Bankhaus Funding Sources August 22th
Cash Capital Haircut
SOURCES (Liabilities and Equity) DEPOSITS
- GDPF covered
- Scgrcgntcd Dcpm;its (LBF, etc.)
- Scgrcg:llcd Deposits (LBIE)
-non GDPF covered Deposits
CAPITAL
-Schul(l~chcinc
-Snhon.linatcd Dcht
-Equity nnd Reserves
-P&L recharge on MTM losses on h,:m~
Cash Collateral (1)
Facility Usa~e
ECUTtnfler
Uack-to-back struclurt!S
(Jther f'ayahies
TOTAL SOURCES
USES (Assets)
LOANS
- Rc..o.;itlcntinl WnrchmLo.;c Loans
-Rct~IE.'>tntcloan"
- CorronJtc Lunns
- suh-put1 icipatcd LnR
REVERSE REPOS
-Cash Capitul illlcnxive Securities & MBS
• Uqltid Investments (2)
-QunntumPor1fnlin
· ECB REVERSE REPO
-Bm.:k-tn-huck stmcturcs
Cash al Hanks
Others!i:thililics
TOTAL USES
Net Excess Sources Over Uses
• Prc-Fundings
Cash Capital Surplus (Shortfall) after prefundings
·Add h:1t:k:
Potential Surplus/(Shortfall)
Gross Leverage (Tntal Assets over Stockholder's equity)
EXTERNAL REGULATORY LIMIT C:tpital Usage Capital Usage Ralill PI T:trgct Usage Ratio
Liquidity Ratio P2 T:tr~et Rntin
Notes (I) Cush Collatcrall'or:
-Lnan Portfolio MTM!o.s,,c..; Single lo:m.; ($hal. CASA) GDPF. Loan Lu.~s etc. LnR vs LCPI Knre:m Bmm:h
-Repo Pllrtl'olin
-ncrivativeHnsincss IRSwors Commmlitic.s
(2) Liquid (n\'cSimcnts (nf which $2.6hn nrc lock-ups)
Conuncnts
KO'Y.·
!OW$.
J(KJ%
0%
100%
100%
IOO'ft·
100';?,
100'#·
100%
0'%·
0'/!,
\J/1•
IOO'lr·
100'1r·
IOO'Ji·
100%
100%
w;;. l)fJ,.
O'h·
07r·
0%
II%
IOO'if·
lS·Aug-08
Balance Sheet
S,6R6 5.029
412
245
6,870
5,137
570
1.163
303
1,872
12,342
1,158
28,2.11
(,,Q(t4
3.092
2.972
21,445
2.KK3
4.901
161
12.342
1.15K
655
67
2R,231
I 872 1,273
314
307 I nO 330 162
3711
22~ 59
170
•Funded T:~iwml High Speed R:1il. Tnqa. 125 High St. H:mcnck :md Wyndham. rctumctllrvinc
'"'E.xtra cnlhttcr:~l drawn fur Asganl :u11\ rcpo cxpn.~urc
Cash Capital
5,436 4,024
412
1.000
6,845
5.112
570
1.163
303
1,872
2,5!1!1
16,956
fi,394
3.092
2.972
33!1
2,883
2.Kti3
9;1.77
7,679
724
6,955
6,955
25.3x
1.619 722
IH.O% 10.4'.7,.
1.2H 1.10
I 872 1,273
314 307 160 330 162
3711
229
59 170
22-Aug-08
Balance Sheet
5,780 5.131
412
237
6,916
5.194
559
1.163
303
2,341
12,171
l,I5K
6,232
2.958
3.274
21,274
2.XH3
4.901
161
12.171
1.15K
1,125
74
28,705
2::\41
1,601 314
64K 147 330 162
505
235
55 IKO
Cash Capital
5,517 4.105
412
1.000
6,H91
5.169
559
l.ln3
303
2,341
2,5110
17,552
6,562
2.95fi
3.274
330
2,SK3
2.fiS3
9,445
8,107
724
7,383
7,383
25.3x
1.619 722
1K.07" 10.4'J,
LUI 1.10
2.341 1,601
314 rwK l·l? 330 162
sus
235
55 IKU
Financial Planning & Analysis
Change
Balance Sheet
94 102
(K)
46
57
(II)
469
(171)
474
(134)
302
(171)
4711
7
474
-WJ 321!
341 (13)
135
(4) 10
Cash Capital
81 81
46
57
(II)
469
596
l6K
(134)
302
168
421!
421!
428
469 328
341 (13)
135
(4) 10
- 15 -
LBEX-WGM 000281

CONFIDENTIAL TREATMENT REQUESTED BYLEHMAN BROTHERS HOLDINGS, INC.
(
7. c Bankhaus Loan Update - Pipeline and Closed Loans
. ~ekly Finance Committee MIS Loan Update- Bankhaus Pipeline
Loans Moved Into Bankhaus in August
Loan Type Deal
EUHG T AQA (National Energy UAE)
USHG Capmark USHY cow USRE Moonlight Basin AsiaHG Taiwan High Speed Rail US SellerFinance John Hancock!MSR EF US SellerFinance Wvndham US SellerFinance 125 Hiqh EUHG Medema lnvik USHY SF Riopelle US SellerFinance CW Rakes USHG Te!e:::cm lta!!a US SellerFinance Project Murphy_ USHY Detta Airlines Total
Loans In Pi !Deline August
Loan "Type Deal
Au US! Pipeline
Commitment
Commitment
Financial Planning & Analysis
August 28st 2008
Smtn
Funded Notes
50 50 Credit Approved 13/8. Transferred 18/8 10 10 Credit Aooroved. Transferred 13/8 38 38 Credit Approved. Transferred 13/8 80 80 Credit Approved 13/8. Transferred 14/8
250 250 Cred~ Approved 2217. Transferred 18/8 54 54 Credit Approved 21/8. Transferred 2218 39 39 Credit Approved 21/8. Transferred 22/8 33 33 Credit Approved 20/8. Transferred 22/8 68 68 Credit Approved 25/8. Transferred 27/8
250 250 Credit Approved 27/8. Transferred 28/8 55 . 55 Credit Approved 28/8. Transferred 29/8
160 ~60 Credlt Aonroved 2:2/8. Trailsfa;md 26/3 237 237 Tb Credit Aooroved 29/8. Transferred 29/9
86 86 Tb Credit Approved 29/8. Transferred 29/9 1,409 1,409
Smm
Funded Notes
0 0
- 16 -
LBEX-WGM 000282

CO
NFID
ENTIA
L TREA
TMEN
T REQ
UESTED
BY
LEHM
AN
BR
OTH
ERS H
OLD
ING
S, INC
.
r m m >< ~ G) s 0 0 0 1\) co w
-.j
-~
Loan Database Summary Report Weekly Change from Aug 20 to Aug 28,2008 ($millions)
ONCOR (TXU) ELT DEL CO PQ CORPORATION 1ST LIEN MCJUNKIN RED MAN HOLDING CME GROUP INC (~!22/0~) TXU ENERGY (10/10/07) CIT! WEST CORPORATION AEI (ASHMORE ENERGY INTL) ALENCO INC. 5YR A&R 12-14-06 ICOPAL MEZZREFI (JANOS) Dclck US TIL
Esta(e · ·
IRVINE MULTIFAMILY CARLYLE
PROJECT MURPHY MEZZ I B PROJECT MURPHY MEZZ JC PROJECT MURPHY MEZZ 2B PROJECT MURPHY MEZZ 3A -PROJECT MURPHY MEZZ 3B -PROJECT MURPHY MEZZ4- BH PTG TANCO REFINANCING PTG TANCO KINGFISHER MITCO (9202311 AUSTIN EOP- FROST BANK B 681 5TH AVE SENIOR ACQU AUSTIN EOP-SAN JACINTO B
161 191 69 73 22
311 50
286 0
13R 162 70 24
243 23 27 7
22 0
568
152 135
0 13 99
0 0 0 0 0
91 78 0 0
242 271
0 113 58
276 83
255 30
166
188 95 0
267 47 50 29 0
16 1,589
261 25[1
0 0
liS 112
0 94 92 92 92 92 92 92 0 0
69 49
-XI HMH PUBLISHING MEZZANINE( 161 -~0 AUSTIN PORTFOLIO HOLDINGS 191 69 DELTA AIR LINES 1ST LIEN (4/30 69
-40 MODERNA FIN AB (PUBL) SEK40 0 -36 FIG LLC (FORTRESS) 3RD A&R (5 73 . 35 HCA INC. (11117/06) 14 -32 GMAC LLC )6-4-08) 154 31 PLAINS EXPLORATION A&R (II/ 30
-30 ONCOR (TXU) ELT DEL CO (10/10 138 ·28 PQ CORPORATION 1ST LIEN A& 68 -26 TXU ENERGY (10/10/07) CITI 207 -25 WEST CORPORATION 23 24 MCJUNKIN RED MAN HOLDING 0
-24 AEI (ASHMORE ENERGY INTL) A 27 -24 ICOPAL MEZZ REF! (JANOS) 22 -23 TYCO INTL (TOPAZ) 5· YR 4-25-07 0 -22 Dclck UST/L 0 22 CIT GROUP INC SYR (12/6/06-CIT 16
-16 VML (VENETIAN MACAU LIM! 35 _.1,021 Real Estate 662:
-261 CARLYLE 0 -250 PTG GRANDE ASSET DEB KF 152 152 VINTNERS PLACE (920282) 135 135 ORLANDO ASSETS ACQUISITIO 0
-liS 1407 BROADWAY- LBH! w 99 -99 PROJECT MURPHY MEZZ 2B 0 99 PTG TANCO REFINANCING 0
-94 PTG TANCO KINGFISHER 91 ~92 MITCO (920231 J n -92 AUSTIN EOP- FROST BANK B NO 0 -92 6815TH AVE SENIOR ACQU \ 0 -92 AUSTIN EOP-SAN JACINTO B NO 0 -92 PTG RAIMON Ill 0 -92 PROJECT MURPHY MEZZ 2A 0 91 301 HOWARD MEZZ2 WH 0 7& MITCO Ill (920283) 26
-69 681 5TH AVE SENIOR PROJ. w 0 -49 PTG NAGOYA REF! 0
)
Loans .Sanks
MODERN A AN AB 242 -81 IMPERIAL TOBACCO SF!. 18JUL07 271 -80 CME GROUP INC (8/2210!:)
0 69 ALENCO INC SYR A&R 12-14-06 62 -62 AMEREN CORPORATION A&R SYR (7/14/05)
113 -40 TRANSOCEAN INC. 5YR )11/27/07) 50 ·36 CAPMARK FINANCIAL GROUP INC. (3/23/06)
118 35 COMMONWEALTH EDISON (10/03/07) 62 -32 TYCO INTL (TOPAZ) 5-YR +25-07
166 -28 COX ENTERPRISES.INC. "7-26-06 95 -26 ENTERPRISE PRODUCTS LLC A&R (11-19·07)
232 -24 CENTERPOINT ENERGY llESOURCE 6-29-07 .n -24 YPSO SENIOR (DTD 61UN<l6) 24 -23 SOUTHERN CALI.EDISON A&R(2-23-07) 50 -23 XEROX CORPORATION A'R 4-30-07 0 22 INERGY.LP. 5-YEAR RC(IZ/17/04)
21 -21 APPLEBEE'S SERVICES. INC. VFN 16 -16 GMAC LLC [6-4-08) 0 16 CHESAPEAKE ENERGY CORP 7TH A&R(I1-02-07
23 12 DANA HOLDING TL(I/3JIC8) 984 ,322 Real Estale·· .·' ·· · · · ·
250 -250 IRVINE MULTIFAMILY PC>RTFOLIO WHOLE LO 0 152 1407 BROADWAY SR BANKHAUS WHOLELO 0 135 PROJECT MURPHY MEZZ I B WHOLE LOAN
118 -118 PROJECT MURPHY MEZZ I C WHOLE LOAN 0 99 PROJECT MURPHY MEZZ lA- BH WHOLE LOA
92 -92 PROJECT MURPHY MEZZ 3B- BH WHOLE LOA 92 -92 PROJECT MURPHY MEZZ ·I - BH WHOLE LOA 0 91 CORP- WYNDHAM PORT. MEZZ I 0 78 PROJECT MURPHY MEZZ :!A- LBB WHOLE LO
69 -69 GAGFAH (900315) 49 -49 CORP-125 HIGH MEZZ3 45 --15 CORP- JOHN HANCOCK MEZZ 2A 39 -39 CORP· JOHN HANCOCK MEZZ 2B 35 -35 PROJECT MURPHY MEZZ S • BH WHOLE LOA 26 -26 MOONLIGHT BASIN LOC WHOLE LOAN 0 26 MOONLIGHT BASIN MEZZ WHOLE LOAN
24 -24 ON THE AVENUE MEZZ WHOLE LOAN 23 -23 RITZ KAPALUA AS NOTE WHOLE LOAN
7 29 24 9 II 0 26 35 21 13 0 8
76 68 25 17 14 7 8 15
18 24 6 12
12 7 56 60
132 137 42 45
151 147 :·70i.:. ·"i 1,487 ... ; ·,. "·.,-:·· ... :--
0 261 13 112 0 94 0 92 0 92 0 92 0 92
39 0 0 38
179 215 33 0 32 22 0 7
70 74 71 70 38 39
131 130
-3 I
-I I
·I
?o >:l
f ii? ~ ~ ~ I
~ 'IS N ~
~ ;::
a ~ "' "'
~ ~ ;:,
" §:
~ ;:, ;:,
~-Ro ~ ;:, !> ~
"' 1:;•

CO
NFID
ENTIA
L TREA
TMEN
T REQ
UESTED
BY
LEHM
AN
BR
OTH
ERS H
OLD
ING
S, INC
.
r m m >< ~ G) s 0 0 0 1\) co ~ 00
ARCHSTONE-SMITH ( 10-07) WINTERGAMES (INTRA WEST) THALIA CLO_SACHER IMPERIAL TOBACCO SFA ISJULO FREENET (DEBITEL SFA 26JUL07
GMAC LLC [6-4-081 SACHER FUNDING LTD. i415n (A TXU ENERGY ( 10/10/07) CITI OZ MANAGEMENT 7/2/07 DANA HOLDING TL(I/31/08) ARINC ISTLIEN(I0/25/07) AUSTIN PORTFOLIO HOLDINGS TRlBUNE COMPANY (6/04/07) 8 B PROJECT CABALLERO B/C SENI GREENBRIER MINERALS A&R 4/ FAIRPOINT COMMUNICATIONS
Estate I
Goodwater
I CALVINO 040907 (900293)
396 396 0
311 276 35 292 291 I
2S6 255 31
255 263 -8
2-13 267 -24 121 225 -4
195 195 0
194 193 0
19.1 271 -SO
189 188 I
171 173 -2
16~ 16S 0
167 169 -2
165 165 0
162 188 -26 161 242 -81
158 158 0
5,894 5,903 -8
614 614 0 456 456 0 406 411 -5
403 403 0
393 392 I
320 320 0
314 314 0
276 276 0
274 275 -1
269 269 0
231 231 0
227 226 0 226 22l{ -2
221 221 0 217 217 0 217 217 0 213 21-l. -I
213 -I
~-\
THALIA CLO_SACHER 396 396
SACHER FUNDING LTD. 14/Sn (A 255 263 -8
TXU ENERGY (10/10/07) CIT! 207 232 -24
AUSTIN PORTFOLIO HOLDINGS 191 271 -80
PROJECT CABALLERO B/C SEN! 171 173 -2
TRJBUNE COMPANY (6/0m7l 8 B 169 168 I
GREENBRJER MINERALS A&R 4/ 168 168 0
THALIA CLO_ENDEMOL PUSHD 165 165 0
HMH PUBLISHING MEZZANINE( 161 242 -81
GMAC LLC (6-4-081 154 118 35
LEVERAGESOURCE (HMH · APO 146 146 0
ONCOR(TXU) ELT DELCO (10/10 138 166 -n TICKNOR CORNER-(HMH -G UGG 135 135 0
IMPERJAL TOBACCO SFA ISJULO 134 127 7
ICOPAL SENIOR (REFI) 129 12 118
FAIRPOINT COMMUNICATIONS 128 130 -2
US INVESTIGATION SERVICES O, 119 115 3
THALIA CLO_ENDEMOL OPCP S 102 102 0
Real Estate 5,824 5,832 -8
Ccrcp Ill 614 614 0
PLF LB SYNDICATION PARTNER 456 456 0
PROJECT GOSPEL 22 JUNE 2007 406 411 -5
Goodwntcr 403 403 0
CALVINO 040907 (900293) 322 321 I
Project Octopus 320 320 0
PROJECT MURPHY SENIOR· C 314 314 0
ROSSLYN LB SYNDICATION PA 276 276 0
KNICKERBOCKER HOTEL SENIO 274 275 -1
MARBLEHEAD HEARTLAND TE 269 269 0
GRAND PRJX SENIOR Z31 231 0
SUN & MOON (920314) 227 226 0
PROJECT TROIS BRIDGE MEZZ I 226 228 -2
25 BROAD REF! ACQUISITION 221 221 0
SUNCAL COMMUNITIES I 217 217 0
RJTZ CARLTON KAPALUA SR. 217 217 0
PTG COWBOY/K.K.TAURUS REA 213 214 -I
LODGE AT RANCHO MIRAGE 212 213 -1
PHILIP MORRIS INTERNATIONAL INC DANA HOLDING TL(I/31/~8)
SISAL(9 OCT06) STORAGEMART PARTNERS 6/i/06 GMAC LLC [6-4-08] ARJNC 1ST LIEN(I0/25/07' PECOS INVESTORS LLC (1ST LIEN 12127/07) STAPLES INCREMENTAL (7/1/08) TC GROUP INVESTMENT HOLDINGS. L.P. TELEFONICA EUROPE ( 1•1DEC06) SAAD INVESTMENTS (29JAN08) (B) PQ CORPORATION 1ST LIEN A&R (7/2/08) APOLLO MANAGEMENT HOLDINGS, LP. BEST BUY CO (9/19107) CLP HOLDINGS LLC ( l/2M8) TARGA RESOURCES !NY INC (PIK) 08-09-07 COX ENTERPRJSES,INC. 7-26-06
Real Estate 1·: ., .. ·.···· ....
GAGFAH (900315) RJTZ KAPALUA AS NOTE WHOLE LOAN 1107 BROADWAY ACQUISITION A LOWHOLE ALBERTSON II OPEN STORE LBCB WHOLE VAUGHAN PLACE WHOLE LOAN
PROJECT MURPHY SR- LBCB WHOLE LOAN
FOUNTAINEBLEU MEZZ BH WHOLE LOAN
MOONLIGHT BASIN ME2Z WHOLE LOAN
CALVINO 040907 (900293;
MOONLIGHT BASIN LOC WHOLE LOAN
CAL WEST MEZZ 3 WHOLE LOAN
ON THE AVENUESEN[Ofl WHOLE LOAN
CORP- GLENDALE CTY CTR SENIOR PARADISE HOTEL SENIOR WHOLE LOAN
1201 WALNUT WHOLE LOAN
CORP- WYNDHAM PORT. MEZZ 1 ON THE AVENUE MEZZ WHOLE LOAN
JOHN HANCOCK CENTE!l MEZZ 3 WHOLE!
UNIVERSITY TOWNE CENTRE UNIVERSITY
HOTELJEROME WHOLE LOAN
Whole loan HERITAGE FIELDS BANKHAUS WHOLE CORP- PROJECT TROIS GS CORP- ROSSLYN B-NOTE CORP- PRO! ELEVATIO~ MEZZ C CORP- HILTON MEZZ- B-7A WHOLE LOAN CORP· HILTON MEZZ- C-7A WHOLE LOAN CORP- HILTON MEZZ- B-7B WHOLE LOAN CORP-HILTONMEZZ-C-7B WHOLELOAN CORP- HILTON MEZZ- B-7D WHOLE LOAN CORP· HILTON MEZZ- 8-7C WHOLE LOAN CORP- HILTON MEZZ- C-7D WHOLE LOAN
?o ~
t-< <:::> >::. ;:::
~ s-~ >::. "' ~ I
~ ~ N <::::>
177 149 28 t-< 154 154 0 <:::>
>::. 151 147 3 ;:: 144 144 0 "tl 136 136 0 <:::> 132 137 -4 ~-120 120 0 :::t-. 114 113 0 <:::>
;:: 113 113 0 "' 107 107 101 101
98 98 94 94
86 87
85 86 85 85 so 80 76
·, "1,508_ ... 179 131 130 129 129 118 119 100 100 89 89 84 84 71 70 70 70
70 74
66 66 64 65
58 58
52 52
43 43
39 0 38 39 37 37
35 35 34 34
656 SIS 246 246
128 128 91 91
51 51 33 0
31 0 311 I~ 22 0 22
21 0 21 :::0 <"> [ "':!
" :::0
~-Ro ;l>. :::0 I> ~
"' ;:;·

CONFIDENTIAL TREATMENT REQUESTED BYLEHMAN BROTHERS HOLDINGS, INC.
LBEX-WGM 000285

CO
NFID
ENTIA
L TREA
TMEN
T REQ
UESTED
BY
LEHM
AN
BR
OTH
ERS H
OLD
ING
S, INC
.
"' ') I Term Func. , ades Outstanding
8/29/2008 Major Investment Investment Non
Index Tier H Other Grade Grade Investment Equities Equities Equities Corps ,!:on verts Grade Debt
Repo Facilities Entity Maturity Date Notional Maturity E1 E2 E3 K1 C1 K2/C2 HY Total
Bankhaus LBIE 180 Bankhaus LBIE 1,104 90 1,104 1,104 Bankhaus LBIE 736 180 736 736 Deka Bank LSIE 10/30/2008 736 62 147 147 258 37 147 736 Deka Bank LSIE 6/10/2009 221 39974 44 44 77 11 44 221 Dexia LSIE 10/31/2008 39752 Dexia LSIE 11/24/2008 39776 Dexia LSIE 11/28/2008 39780 Dresdner LBIE 12/23/2008 736 116 368 368 736 Dresdner Cayman LSI 1/13/2009 500 137 250 250 500 LSIE Regulatory Capital LBIE 2,000 90 2,000 2,000 Natexis LBIE 2/4/2009 159 OSFC LSJ 659 365 574 85 659 State Street LSI 250 120 250 250 State Street LSI 2;275 120 1,275 1,000 2,275 RSC LBIE 11/20/2008 83 RBC LSIE 11/21/2008 350 84 140 70 105 35 350 RBC LBIE 940 178 376 188 282 94 940 RBC LBIE 500 90 200 100 150 50 500 RBC LBIE 500 92 200 100 150 50 500
Total 11,507 893 1,475 3,116 2,175 250 735 3,755 - 11,507
WTDAvg Life
Upgrades I Exclusives
Bank of Ireland LBIE 10/31/2008 600 63 600 600 BGI LBI 7/2/2009 700 90 700 700 BGI LBI 3/31/2009 100 90 100 100 Dwight Asset Management LBI 12/15/2008 443 108 443 443 KAS LBIE 2,208 180 2,208 2,208 Morley LBIE 1,000 92 750 250 ___!,QQQ Total 5,051 128 3,558 800 - 250 - 443 - 5,051
WTDAvg Life 0 0 0 0 0 0 0 0 r m m Total 16,559 659 5,034 3,916 2,175 500 735 4,198 - 16,559 >< I WTDAvg Life #D/V/0!
:E G) 30% 24% 13% 3% 4% 25% 0%
s 0 0 0 1\) co en

CO
NFID
ENTIA
L TREA
TMEN
T REQ
UESTED
BY
LEHM
AN
BR
OTH
ERS H
OLD
ING
S, INC
.
r m m >< ~ G) s 0 0 0 1\) co ......
Prime B. t Committed Margin Facilities 8/29/2008
Current Position E1 E2 E3 G1 C1 K1 C2/K2 HY Total Major Non Index Tier II Other Investment Investment Investment
Equities Equities Equities Govt's Grade Conv't Grade Corps Grade Debt High Yield Total Committed Margin Facilities Committed Margin Facility Funding Requirements 5,681 6,986 800 192 892 962 2,534 114 18,162 Term Funding % 25% 100% 100% 0% 100% 25% 100% 100% 72% Term Funding Requirement 1,420 6,986 BOO - 892 241 2,534 114 12,987
Term Funding Outstanding Repo Trades 1,621 3,337 2,175 844 250 5,367 114 13,709 Upgrades I Exclusives 3,558 800 250 443 5,051
Total Term Funding Trades Outstanding 5,180 4,137 2,175 - 844 500 5,810 114 18,760
!current Liquidity Position 3,759 (2,850) 1,375 . (48) ! . 259. 3,276 . .. ·.· .5,7731
Cusip Netting Benefit 342 1,170 81 . 63 5 161 - 1,823
[Cprrelltl..iquidity Position Inc. CusipNettfllg- 4,102 (1,680) 1,456 - 15 i 265 3,437 - >' 7,596j
Wgt Avg Life of Commitments Wgt Avg Life of Term Funding Facilities
99 127

CONFIDENTIAL TREATMENT REQUESTED BYLEHMAN BROTHERS HOLDINGS, INC.
LBEX-WGM 000288

CONFIDENTIAL TREATMENT REQUESTED BYLEHMAN BROTHERS HOLDINGS, INC.
Global Treasury Liquidity Footnote- August 31,2008 Amounts in millions
1. Cash Cash at Banks Other Cash Inv Money Funds
Total Cash
2. Boxed Inventory Private Label CMO's Corporates Governments I Treasuries Asset Backed Equities Agencies Canadian
Total Boxed Inventory
C&C Et)uivs Availahle.to Holding Company (A+B}
Undrawn Committed Facilities Chase Facility European Facility
A
B
New York Inv
3,378 553 104
4,035
454 3,020
16,963 674
8 3,811
24,930
28,965 .
Pledge Value New York Inv
1,187
1,187
1,187 .
10 785
9,470 88
1,557 17 15
11,943
11,943 ...
3,378 553 104
4,035
464 3,806
27,620 762
1,565 3,828
15
38,060
42,095 ..
2,000 2,500
'- --~~--------~--~------~--~--~------------~--~--~----------~------------------------~ C&C Equivs Available to Holding Coinpimy 46,595
Notes: *Pledge value= Market Value of the collateral * normal mkt haircut for each asset class
LBEX-WGM 000289

CONFIDENTIAL TREATMENT REQUESTED BYLEHMAN BROTHERS HOLDINGS, INC.
LBEX-WGM 000290

CONFIDENTIAL TREATMENT REQUESTED BYLEHMAN BROTHERS HOLDINGS, INC.
loSmm
Source'!~:
Traditional CC Sources
LSilm:t::stmo1l in Unregulato:l Subs
lnt~Seompan)· Subdebt
Rcg-T Margin Drawn Oaruk.e Facility
Drawn Chase Committed Facility
Drawn State Stred Bank Facility
Drown RACERS Facility
Drawn Drcsdnc- Facility
Drawn Metlir~Facility Sd:urer..i £.\1t:ndibleFacilities
Total Sc>arce. ·
Jill!_
coo COMMODITIES TRADING OCMABS
FlO CORPORATE
FORE(GN EXCHANGE GLOBAL RATES
HIGH GRADE CREDIT HIGH YlELD
LEVERAGED FINANCE
MUNICIPALS
OTHER BANKING
PROP TRADING
REAL ESTATE
SECURJTIZED PRODUCTS
Non One Rate fu1endibles
Bankhaus and subdcbt UnallocatOO l.BI Box
Total FID
AMERJCAS CASH
ASIA CASH
CONY ERTIBLES PRODUCT
EQUITIES CORPORATE
E.QUlT!ES SUPPORT EQUITY STRATEGIES EUROPE CASH
EVENT DRIVEN
GLOBAL PORTFOUO VOLA TlUTY AMERICAS VOlA TIUTY ASIA
VOLA TIL.ITY EUROPE Non Treasury E:.;tmdibles Unallocated lBI Box
TofaiEQ
ClEARING AND EXECUTION EQUITY FINANCING
EQUITY SYNTHETICS FlO FUTURES
FIRM FlNANC~G
GENERAllST PRlME SVCS COR
STRUCTURED TRANSACTIONS Unallocated LBI Box
TotaiCMPS
AlTERNATIVES
ASSET MANAGEMENT PRINCIPAL INV ASSET MGMT ADMrNISTRA TION
FlXED rNCOME ASSET MGMT lMD C<lRPORATE
MFISUPPORT
NEUBERGER BERMAN PRfV ASST MGT
PIM. PRE-AllOCATED
PRJV A. TE EQUITY Unallocated LSI Box
Totaii:MD DIRECT PRINCIPAL INVESTMENTS GLOBAl OPPORlUNITIES GROUP
<?LOBAL PRJNCIPAL STRATEGIES GLOBAL TRADING STRATEGIES Unallocated LSI Box
Total PI
Non Trading Assets (note I)
Gross-up for St.ir-funding Trades Con tin gmt Collatcralization
lntaCOt"npany Subdebt
Reg-T Margin
FX Revaluation
Deri...-ativeActivity
Other Pending SetUonO"lts
lBI Group Box Adjustment
E:.;change Margin True-up
TotaiUaes .-· ..
ub ~aplta~ !"OSIUott ore
Trappe::d Cash Capital (bonus)
Other !.ntcn:ompany Cull CaPital PosiHoa:aftc"r: VC· ·
Rcpa:,.Tnent or Reg Enliry Intercompany
Total Finn Casb.Ca llal Usage
LBJ
776
740
·1.516
132
94
125
277
323
954
74
S6
35
202
317
(0)
317
4
390
i.B66
(.)
944
(594)
LBJE
7,529
10,575
18.,104. ·.
153
44
1,693
Jll 3,751
729
IS7
n 406
7,446
93 302
1,458
117 136
127
519
537
3,293
765
679
695
60
2,207
10
lSI
191
S4
28
I.OUO
1.169
· "t5.4t9
(262)
2,423
262 '·. ,;;;;,;·
Fridnv, Aul!ust 21, 2008
OtherEur RegEatlty
758
(393)
1.3S6 1.752:
7S
126 60
263
300
300
1,712
43
LBI
4,874
(1.410)
6,550
3.165
II
1,792
38
779 1.369
718
227
132
1,239
~ 8,407
81
162
736
216 10
14
I
678
21 223
lOS
339
164
~ 1,889
130
82
______ 9_5
307 539
1,441 ______ 7_8
2,057 454
(3,412)
(27)
2,31!( . l2,l72
( )
LOTC
207
250
457:
184
184
'2
LBHI
127,611
1.410
sao 91
1,000
5,000
lOS
S7S 1.414
4,025
1.823
187
1,606
797 1.594
SS8
6.218
490
69 1,477
677
33.116 10,\34
150
1,722
65.712
171
14
1,138
278 ss
4)
232 867
2.072 14
4,916
" 414
784
lSI
1.378
.1,553
10
131
507
lOS
4,792
8,109 873 516
\,343
1,039
],771
9.832
167
2.399
17.722
3.165 (1,339) 4.312
(772)
3,412
S86 616 (SS6)
630 1,081 239 (2.631)
Adjwted Tot.al (ooteJ}
141.756
800 91
1.000
s.Ouo 30S
878 2.800
152.633
4.278
1,878
187
5,223
1,146
6.219
1,811
7.104
490
296
1.477
677 33,713
12,161
150
1,712 2,101
82,843
S2 338 479
3.340
612 231
16 257
I.Q96
1,441 2,831
14 432
11,170
1,215
1.434
0 1,644
111 1,280
5.793
2,983
10 131
507
lOS
S4
4,791 95
8.716 1.412
529
1,343 2,662
7S
6,024
12,472
267 2.496
(1.339) 4.]12
228
1,141
134,122"
''"' 616 .
949· ·2,605 S07 .. ·. ·' 12,049 . ; 19,126
(630) (1,081) (239) 2.2SI
138,303
LBJ
(0)
(5)
32
(7)
(4)
(2)
(II)
(28)
(0)
(28)
(20)
(20)
14
(13)
13 (13)
WOW Aue-12 vs. Aue:-15
LBIE OtherEur Reg Entity LBI LOTC LBHI
Adjusted Total
25
21
(l71)
37 (537}
(ISS) (3)
(26}
2S (264)
(1,249)
89 (7)
25 0
(7)
(46)
(18)
(0)
26
(50)
13
(0)
(148)
IS9
344
385
(0)
(0)
(4)
19
15
II
(6)
1,000
(133)
(37)
(37)
(0)
(5)
(0)
(69)
(69)
(I)
(I)
. )]
(;!I)
330 (I)
25
(I)
42
(1.4S4)
69
.·•(1,415) ..
(10)
(I)
(0)
174
(7)
(171)
(56) (14S)
56
362
16 (19)
(1.484)
14
19 (0)
(141)
36 (7:!6)
123 (152)
56 (I)
362 16 (2)
(212)
(II) (II)
~ ------·- ------. ______ 96_5 (5) 1,376
(I)
47
(67)
m (40)
{2)
53
(ISS)
39
119
(46)
(46)
(16)
192
(7)
3 (I)
(280)
13S (186)
346
(6) 94
(9)
(215)
(72)
(40)
{20)
52 (164)
{15) (12)
-----·- ______ 2_3
(335)
(8)
II
(16S)
(12}
(367)
(8)
(324)
44
451
(0) (0)
~ -----·- _____ ._ ~ I,I6Z (16)
(0)
__(Q) -----·-
(0) (29) _____ ._ _ ____ II _____ ._
(0)
66
(IS)
(37)
(319)
2.1i7
•(60) ~
(58)
(177). 1,326
(I) (0)
(0)
(II (0)
55 55 36 12
(2) (2)
(20) (30)
69 142
(I)
(1,502)
45
(1.000)
(2.S69)
__ ____ 1_1
46
196
(I)
(1.505)
45
(452)
·.· (366)
. )
(57) (4) 61 . •(60) . (2,303) 54" l,ZIS:.: (1.118)
57 (4S) (0)
LBEX-WGM 000291

CONFIDENTIAL TREATMENT REQUESTED BYLEHMAN BROTHERS HOLDINGS, INC.
LBEX-WGM 000292

CONFIDENTIAL TREATMENT REQUESTED BYLEHMAN BROTHERS HOLDINGS, INC.
LBEX-WGM 000293

CONFIDENTIAL TREATMENT REQUESTED BYLEHMAN BROTHERS HOLDINGS, INC.
'
Monthly SEC . Finance & Risk Review Agenda
Monday, August 11,2008 1:00 to 4:00PM
745 Seventh Avenue- Conference Room 29B
1.) Financial Results Overview
2.) Regulatory Update
3.) VaR and Risk Appetite Review
4.) Market Risk Update
5.) Credit/Counterparty Risk Update
6.) Any other questions/topics
.... --~~
\
'·
LBEX-WGM 000294

CO
NFID
ENTIA
L TREA
TMEN
T REQ
UESTED
BY
LEHM
AN
BR
OTH
ERS H
OLD
ING
S, INC
.
r m m >< ~ G) s 0 0 0 1\) CD 0'1
(ODD's)
LBHI
Net Revenues Compensation & Benefits Non-Personnel Expenses Pre-tax
Taxes Net Income
Preferred Dividends Net Income to Common
Camp Ratio Tax Rate Pretax Margin ROE ROTE
Revenue Detail
Capital Markets Subtotal Investment Banking Investment Mgmt
Total
LEHMAN BROTHERS HOLDINGS INC. P/L & CAPITAL OVERVIEW
July 2008
Preliminary [JI.Ii}T'ilr=J LYTD '08 II Avg Mo '08 I
$ (670) $ 2,890 $ 540 548 5,434 741
----:-:-:':3"'"'30'-- 2, 767 370 __ -->..,;(1.:..:;,5...;.:48:.t...) (5,311) (571)
--;;:----:-:0..,:( 4-=-64:+-) ( 1 • 7 D5) ( 18 8) $ (1 ,D84) $ (3,606) $ (383)
$
I
$
$
- 231 --26 5o (1,142) $
nm 30.0%
nm nm nm
Prelimina~J:_
Jllly_'08 II
(1 ,165) $ 250 245
(670) $
(3,837)
nm 32.1%
nm nm nm
YTD '08
(1,635) 2,203 2,322 2,890
$ (4D9)
nm 33.0%
nm nm nm
II Avg Mo '08 I
$ (71) 296 315
$ 540
I
Capital Overview:
Total Long Term Capital Leverage Equity Long Term Borrowings Gross Assets
Net Assets Net Leverage
Cash Capital Excess
LBI Excess Capital
LBI (Standalone)
Net Revenues Pre-tax Taxes Equity in Subs
Net Income
Preliminary I July '08 II June. '08 II November •o7j
I
$ 151,5DO $ 155,881 $ 145,640
$
31,900 32,978 23,103 120,500 123,813 123,245 688,000 786,644 691,063
375,000 11.8x
12,800
3,085
F'relimina~J:_
July '08
(687) (876) (350) (119)
II $
429,757 13.0x
14,200
3,186
YTD '08
(136) (1,594)
(688) (115)
II $
372,959 16.1x
8,000
2,114
Avg Mo '08
84 (109)
(51) 1
_$_ (645) $ (1,022) $ (57)
I

CONFIDENTIAL TREATMENT REQUESTED BYLEHMAN BROTHERS HOLDINGS, INC.
LBEX-WGM 000296

CONFIDENTIAL TREATMENT REQUESTED BYLEHMAN BROTHERS HOLDINGS, INC.
~····-·---/
LBEX-WGM 000297

CO
NFID
ENTIA
L TREA
TMEN
T REQ
UESTED
BY
LEHM
AN
BR
OTH
ERS H
OLD
ING
S, INC
.
r m m >< ~ G) s 0 0 0 1\) CD co
DAILY RISK Ar.-t:TITE REPORT
FL'\ED INCOME IR Products Foreign Exchange
Commodities Trading
Uquid Markets Total High Grade Including P1peline
•• High Grade (EM)
-- High Grade Trading
-- High Grade Loans, Pipeline & Commitments 1•1
Htgh Yield Including Pipeline & Commitments
•• High Yield (EM)
-- High Yield Trading
·· High Yield Loans. Pipeline & Commitments " 1
CDO Credil MRrkets Tou~ol
Securitized Producls
Real Eslale
Municipals
fixed Income Corporale 111
Allematin Portfolio Solutions Fixed Income Strate~:ic lnveslmenls
TOTAL FIXED INCOME
EQUITIES
Cash Portfolio Event Driven
Volalility Flow
Systematic Trading
lM!Encution Senrices
Convertibles
VolaUliT)
Equtty Suaregy
Corporate
5)Tldtcate
Equttles Strategtc Investments Equnie:s Emergmg Markets
TOTAL EQUITIES
CAPITAL MARKETS PRIME SERVICES Firm Financmg
Fmures Equity Financing Equny Synthetics Clearing and Execution Structured Transaction
TOTAL PRIME SERVICES
PRI1-'CIPAL INVESTING PORTFOLIO GlobaJ Pnncipal Stralegaes Global Tradmg Strategies Global Opportumty Group Direct Pnnctpallnvestments
TOTAL PRINCIPAL INVESTING PORTFOLIO
INVESTMENT ~1ANAGEMENT INVESTMENT BANKING NON-CORE TOTAL FIRI\1
A~rlou
519
88
333
630
394
114
213
251 389
40
288
33t
196
698
1,045
1,028
161
14
1,981
35
40
99
123 103
75
60
78
21
239
114
20
II
8
147
77 351
307
-186
976
68 124
2,456
[UrtJ(ll'
418
154
100
463 108
90
57 216
57
78
145
286 422
299
682
186
1,214
34 17
60
14
281
37
713 IIZ008
__ 1_9 __
287
14
0
II
27
7
62
-----62
347 28
6 1,388
AJ.ia
102
87
52
160 58
58
123
123
II 153
237
382
566
37 55
57 31
89 76
143
3 506 51 69
520
29
842
/-
95"/o, Annual Risk ($Millions)
Usage
Ghtba.l
729
264
395
888 439
114
253
271
515 75
359
4-11
346
998
1,294
1,462
161
186 14
2,848
61
56 40
99
II
113 109
278
98
77
21
19
366
112
0
34
15
9
159
93 702 51
370
815
1.260 97
129 3,402
\'E 2007
Cloh•l
.1211
25K
277
6->0
JIB
" ,., 254
1,2&6
42
m l,IM
)J(,
l,JI~
(,(Ill,
1.15~
ISO
1.1
t1•
" l.JJJ
91
46
46
292
IR
368
"' 111
'" ~ti
" 711
5l
12
14
7l
Jll Slf• ;7
[.11-
(,'11
l.!t.J
" " J .. .li:'i9
ZOQ8
~~~
I.UKC.
J2LJ
J'JB
1,:!56
770
IH
m nz 1,715
. K2
5U4
\.J51
Jf(,
1,5(.-l
I.J~l
1.(.51
'11
\4
lltf·
--=.L_ 3,155
t'i
15
t05
495
G6
6RU
201
.t:!O
140
21
155
1) ,, 861
148
34
1(·
II
194
157
1,0:!.::
1(17
l7t•
I,J7J
l,.tllt.
'" ll9
J.9U
"" 1~1)
248
fiiJ
"' " t11
l7l
4)7
35
'" 4(18
22tl
792
(•:\1
1,0117
IlK
1:'1
213
)I)
915
471
9t m 271
t,OI9
56
m 9(<)
Jlfl
URI
"' 1)77
2~~
~h
117 l)h
--'"- __ ,;_ 1:,.349 1:,771
53
14
14
72
109
102
1JS
'" I)
81
37
48
211
2l
m
''" J\1
111
ll
l!
lli :!5
1J lS
J55 su
sr.
IZ
t2
73
'" 3.1.5
" 1-IJol
m
1.216
" ...!!-J)ll
"" 23
18
t25
2-l.t
"" ,,, ~,·,x
"' I.JIIJ
116
88 J,6iD
Limit
>ll
HO
170
940
675
110
480
200
850
no
"' 4ZO
295
l.:!f,j
.lfl5
7lfl
~0(1
~{1(1
J,OOO
"'"'
100
150
\lXI 71KI
'W l5U
1,11011
1,111111
'" ~

CO
NFID
ENTIA
L TREA
TMEN
T REQ
UESTED
BY
LEHM
AN
BR
OTH
ERS H
OLD
ING
S, INC
.
r m m >< ~ G) s 0 0 0 1\) CD CD
en c:: 0
:!: ~ -Q) .... ., (I) l:l. l:l. <(
~ (/)
i2
41200 _ ~_is~ APP~tit _jQi_yi~_i~~--
31900
31600
31300
31000
2,700
21400
2 100 -i I I
I 11800 -j
11500
11200
900
600
300
t;::,r:o ~r;s
~";)~
•** ***** ***** **** ***~ ~** **~ ~ ~~~~~ ~~~* *** * ***** ***** ***** ***~
. c::::::I ~~!! ·I j_.<~-l<Jililllll! lll!tlO-!L~&-_ -~ I : L I • I
• . --!& .. 111 !if 1>-IHIHIHif--- "' If If II lll • If 5 5 lll--ilf--ll--,l~Hf-- ill If .. l!HI0'-!11---·-l>--ll"--M--l!I--\1.--I<IHI-tt~ --· -·-------- -~------ .. -----------,.---.. ------------------------,-·
t;::,r:o ~r;s
<,}";)~
t;::,r:o ~r;s
~";)~
-----,...--------·--- ----·-- .. ···- . -- --.----------.
!0' ~~<::)
..... ~~
-Total Firm -Fixed Income -.-Equities --"'- GPS Total -.-GTS Total -*-INVESTMENT MANAGEMENT ----------------- -------------------------------·
2

CO
NFID
ENTIA
L TREA
TMEN
T REQ
UESTED
BY
LEHM
AN
BR
OTH
ERS H
OLD
ING
S, INC
.
r m m >< ~ G) s 0 0 0 w 0 0
4,200
3,900
3,600
3,300
3,000
- 2,700 t/) s:::: 0 -·-:E ~ -Q) ... +:I Q)
c. c. <( ~ t/)
ii:
2,400
2,100
1,800
1,500
1,200
900
600
300
~ro ~(\j
~bf.
Risk Appetitf ·Region
r~--------:
!-Global !
~-America! !
:....,.__Europe ·-'1\--. Asia
~ .. ~ .. '
• f \~~ .... ~·,. ~a~ !.,,,,.~ ... ,. .,, "'·"<.).•~----~-~ -~.,1\~-~-·-•:'il!f~.,
1':>1--·-""',tlj~-~i~»- ...,-~- .G1I- ,.....a,_._ ·.;. ·.. -:~f:lt··--~!\\·1~) -~*{*2--~~,.,~~-~.-.~~~~~-- ~'"._~ -
~ro ~(\j
~':)
~ro ~(\j
~ro
~ro ~(\j
~'\ 3

CO
NFID
ENTIA
L TREA
TMEN
T REQ
UESTED
BY
LEHM
AN
BR
OTH
ERS H
OLD
ING
S, INC
.
r m m >< ~ G) s 0 0 0 w 0 ....Jo.
VaR (95%, 1dav' -.1slness View COB: July 31, 2008 l$?tf4::lt;-~,,~;i!M\1~ l@§~f\~i¥ff~~!.~~it;:~~\:;:.t:~iitr¥~it.{liJ~i91!ir&;eQYP'Mi&~!~~;~G.l9!1JiU~iaiQJli$fi.~1
IR Products
Foreign Exchange Commodities Trading
Liquid Markets Total High Grade
High Yield
coo Credit Markets Total Securitized Products
27.6
3.5 15.9 32.3 22.7
21.2
10.1 37.3 62.3
21.1
7.7 3.2
22.7 5.8
9.1
15.2 19.0 18.8
5.2 36.6 32.1%
3.4 10.4 28.8% 3.1 16.4 26.1% 6.9 41.3 33.3% 3.3 25.2 20.8%
4.7 25.2 28.0%
0.7 17.8 31.5% 6.2 51.2 18.1% 3.2 72.6 13.9%
Real Estate 22.7 15.9 8.0 32.2 30.9% Municipals 8.6 8.6 0.0% FlO Corp 0.5 0.5 0.0% Fixed Income Strategic Investments 0.9 0.9 0.0%
;r;9~1:FI~~il'Jn~Cim.E!1t;::,~~ffi~:2i!~~:-·:~;;~~~T'::,~u:;;~it 'l:iii;,.[:::~~~i\~\t~:~1~\i:i;a~;9l_:i\:,;a!i,1~tit.l:&~~:4:£Jk?:.$9,1jili~l~:26:o$ FID Gross Risk 164.1 76.4 24.8 207.3 FID Div$ ·81.2 -39.7 -10.4 -108.2 FID Div% 49%
Cash Products 2.2 Portfolio 0.1 Volatility Flow 6.2 Systematic Trading Event Driven 1.6 Quants Latin Americas 0.8
52%
2.0 1.1
2.9
42%
2.3 3.4
0.7
LM/Execution Services 6.7 3.6 3.6
52%
3.7 3.5 6.2 0.7 1.6 2.9 0.8 6.6
43.1% 23.9%
0.0% 0.0% 0.0% 0.0% 0.0%
52.5% Convertibles 4.9 0.6 0.9 4.9 23.4% Volatility 3.5 12.3 5.4 13.6 35.8% Equity Strategies 3. 7 1.9 3.1 4.3 50.6% Syndicate 4.9 0.5 4.9 9.3% Equities Strategic Investments 1.3 1.3 0.0% Equities Emerging Markets 1.2 1.2 0.0%
1 Qt8J.J;A-Uii\i,::~f~~;fi~~;~~l~~~J~~J\f~;~~;;~~~~;~ .. l{;~:;·;.:;:\~~;~i~~;;,if~hJ~~~;.;ii<:~L~;~~;i~i;;(;r~;:;1.~~t~i~1~;~~;.~ ~-~~}t;}~i:~~~1~1~~;~:" .. t~JZ1~=~~~i~~§1i~.o/t: Equity Division Gross Risk Equity Division Div$ Equity Division Div%
25.0 -12.3 49%
20.1 -6.9
34%
13.0 -6.3 48%
36.8 -21.1 57%
Firm Financing 4.3 0.3 4.2 8.7% .Capital: M~rice:tis;:Pn.me :sE!i:vlcea,Total :: .;' '; :;,~, ... )ij: ,! ; 'i!Hi~ ,_,:).ksi11~: ';.o;3.;c ~·;;,f;;;;]".:•}) ... s4;2J1i<!]:;.;ratt;%.
Global Principal Strategies 1.7 0.2 0.2 1.8 14.3% Global Trading Strategies 21.2 3.2 32.0 42.9 23.9% Direct Principal Investments 14.6 · 4.3 18.7 1.1% Global Opportunity Group 3.1 3.1 0.0%
ifrln~lii~l'il.tlv~~«~g~~9J:tfc)li~;;rQ@lt!c·•~:;;~,.:;.,~).;;~;.;,{·.~6·,\~.;.:t>"i::~;s.;,.;~;:,~,~;~,;~.i,J~2•6.·;;;;,,t:·~;1~c\'bi2~~1$
Firm Gross Risk Firm Div$
144.6 -57.0 -26.4
A"OL 4

CO
NFID
ENTIA
L TREA
TMEN
T REQ
UESTED
BY
LEHM
AN
BR
OTH
ERS H
OLD
ING
S, INC
.
r m m >< ~ G) s 0 0 0 w 0 1\)
,r"',...
$(mm)
:I: E
~
/
140 .
eo-
60
-40' --------------- -------- =---------20'~-
09-J ul-08 11-J ul-08 13-J ul-08 15-J ul-08 17-Jul-08 19-Jul-08 21-Jul-08 23-Jul-08 25-Jul-08 27-Jul-08 29-Jul-08
Total Firm -America- VaR
Total Firm -Europe - VaR
Total Firm -Global- Limit
Total Firm 95% VaR
Total Firm -Asia - VaR
Total Firm -Global - VaR
31-Jul-08
5

CO
NFID
ENTIA
L TREA
TMEN
T REQ
UESTED
BY
LEHM
AN
BR
OTH
ERS H
OLD
ING
S, INC
.
r m m >< ~ G) s 0 0 0 w 0 w
,~
$(mm)
~
~ :>
(~
120
100 c
80 ~
.~ ~ ~ i
60.
20 i
~--------------------------------------------------------------~ ~· -----
09-J ul-08 11-J ul-08 13-J ul-08 15-J ul-08
Total Fixed Income- America- VaR
Total Fixed Income - Europe- VaR
Total Fixed Income - Global- Umit
----~---~---~---~-- ~------i 17-Jul-08 19-Jul-08 21-Jul-08 23-Jul-08 25-Jul-08 27-Ju-08 29-Jul-08 31-Jul-08
Total Fixed Income- Asna- VaR
Total Fixed Income- Global- VaR
Total Fixed Income 95% VaR
6

CO
NFID
ENTIA
L TREA
TMEN
T REQ
UESTED
BY
LEHM
AN
BR
OTH
ERS H
OLD
ING
S, INC
.
r m m >< ~ G) s 0 0 0 w 0 ~
$(mm)
.... . E
~
~~
40 --------------------. -------
35 .,. - ·- --------··-~.._,_._.,.~- ----··---··-·---- ----- ,_, ____ ,.,,..._N-~------~ .. ------·-----··-"--"' ___ ---···-•-•ooo-00,
30 -·
25 .
20 .
5 ., ------·--· -----------
09-Jul-08 11-Jul-08 13-Jul-08 15-Jul-08 17-Jul-08 19-Jul-08 21-Jul-08 23-Jul-08 25-Jul-08 27-Jul-08 29-Jul-08 31-Jul-08
Total Equity -America- VaR
Total Equity -Europe- VaR
Total Equity -Global - Umit
Total Equity 95% VaR
Total Equity -Asia - VaR
Total Equity -Global - VaR
7

CO
NFID
ENTIA
L TREA
TMEN
T REQ
UESTED
BY
LEHM
AN
BR
OTH
ERS H
OLD
ING
S, INC
.
/~
:Global Fixed Income Risk Summary
Interest Spread COB:07/31/08 DVOl Veya VaR
($'000) DV01 ($'000) ($'000) 1D95($MM)
. I Net Swap/Agy Credit Current
Global '1 914: i4 388) 1 059 17 153 36.6
IR Products America 850' ( 182) 1 059 6 092 27.6 Eurooe '1 133' 3 330' 0 '3 085' 21.1
Asia 69 (875) 0 14 146 5.2 Global 4 (200' 0 257 10.4
Foreign Exchange America 78 35 0 3 114 3.5 Europe 16 ~96) 0 '2 754) 7.7
Asia (91.\ 7139\ 0 (103\ 3.4
I Global 16.4
Commodities Trading America 15.9 Eurooe 3.2
Asia 3.1
~-~ :,,.,,Giobi!l·:· 41.3 :·!iAmeilcac;:' 32.3 Ut~Eiff.Oii"€:'~ 22.7
~~1~~1~~~;::: 6.9
Global 971 497 2,148 I 357 I 25.2
High Grade America 688 581 1 748 357 22.7
Europe 238 16 270 0 5.8
Asia 46 '100' 131 0 3.3
I Global 562 346 2,585 868 25.2
High Yield L America 181 400 1 599 867 21.2 Eurooe 66 8 670 0 9.1
Asia 315 46 317 1 4.7 Global 634 542 904 459 17.8
I America 550 61 2,054 523 10.1
coo I Europe 73 (611) (1,089) (64) 15.2
Asia 10 8 61 (I 0.7
~i~i~~,~,l~~~tt~ :::.Gfiilillt' .. 51.2
·:'1\'ihenta ·• 37.3
r ··~.Jteurob:e:~;:: 19.0
m ·J'.i1.~~ASiili~:.·_!: 6.2
m NOTES:
>< NOTE 1: Tala I VaRs reflec: diversiflcal:on effecl usmg s1mulaled P&Ls
I Interest DV01: Positive DV01 means we are net long. pes P&L In $000/bp decrease In IR" IR exposures for HY and
:E Swap Spread DV01: Positive DV01 means we rec fixed • pos P&L In $000/bp tightening in swap spreads.
G) Credit Spread DV01: Positive DV01 means we are long credit • pos P&L In $000/bp tightening In opreads.
I Vega: Positive Vega means we are long volatility • pos P&L in $000/1'k Increase In vol. s VaR: Value-at·Risk for 1 day holding period and 95th percentile (In SMM)
0 0 0 w 0 0'1
u
COB:07 /31/08
Global
Simple Sum America Eurone
Asia
Global
Diversification America
Eurooe Asia _
Interest DV01
2 008 2 399 740 348
0
0
0 0
Spread DV01 ($'000)
Credit
(10 697) 13 463 5 514 13 226 4 029 149\ 1 154 386
0 0
0 0
0 0 0 0
nl are Beta adjusted. Cap sec in HG Is not beta adjusted ..
Vega ($'000)
28 447 19 774 5 902
14 575
0
0
0 0
245.5 194.6 96.8 32.1
60%
57%
62°/o 55%
8

CO
NFID
ENTIA
L TREA
TMEN
T REQ
UESTED
BY
LEHM
AN
BR
OTH
ERS H
OLD
ING
S, INC
.
r m m >< ~ G) s 0 0 0 w 0 en
Equity Non-Equlty Beta
B1-1siness line - Summary Delta Della Adjusted
($M) (SM) Delta S(M)
Global Equities 695 71.( 59 - Ex Event Driven 504 71.( 506
Americas 534 18.( 495 ·Ex Event Driven 379 18.( 39€
L1quid Markets 227 1B.C 223 ·Ex Even! Driven 84 18.C 13(
Cash 58 75 Portfolio 2 :11
Volatility Flow 12 18.( 4! Even! Driven 144 87 Latin Amenca 11 12
Convertibles 38 sc Volatility 57 o.c 57 Equity Strategies 75 o.c 14 Syndicate 136 151 Cornorate c Europe 40 so.c (29)
• Ex Event Driven (B) 50.( (28) • Ex Even\ Driven, . • 33 50.( 1
Execution Services 81 47.( 7E - Ex Event Driven 81 47.( 7E
Cash 104 0.( 101 Portfolio 16 (1.0:: 1(
Quants (39) 47 ( (35} Even! Driven
~ Convertibles 1 Volatility {1t)8j 3.( {10Bi
·Ex Fund Denvs. ExotiCS t67) 3.( {t37)
Equity Strategies 86 34
• Ex Sarkar Event Driven 39 36 Syndicate 16 1!:
Emeroino Markets [36\ (4Tl
Asia 121 3.( 126 Execution Services 81 7E
Cash 1 (18)
Portfolio 86 112 Systematic Trading (5) (16)
Convertibles 10 3.( 11
Volatility (9) (9'
Equity Strategies 39 4~ S ndicate c
Global Total 695 71 592 ~Ex Event Driven 504 71 506
LM/ExeculiOn Services 389 65 377
·Ex Event Driven 251 65 306
Cash 163 c 159
Portfolio 104 !1) 121
Volatilily Flow 12 18 49
Systematic Trading :5i !16)
Quanls {39) 47 (3~\)
Event Driven 144 87
Latin America 11 12 Convertibles 50 3 61
Volatility (59) (59)
• Ex Fund Derivs, Core Exotics 26 v 26
Equity Strategies 200 ~ 94
• Ex Sarkar Even! Driven 153 96
Syndicate 151 166
Corporate 0
Emeroino Markets 1361 147\
·Excluding Event Driven, Sarkar Even! Driven, Fund Derivatives JV and Exolics
Beta Delta Gamma Vega
SX5E (SM) ($M) (SM)
46 30. 53 30.4
(64) (2.1) {~J3) (2 Oi ~t.Si u; :; ~:JS} !t:i 9!
( 0.2 (. OG
(~31 ~6 1)
\f) {0.1) c 0.0 2 1.5
(19) 3.1 (2) (07)
~ (30.0 4C 19.e
71.0 4( 19.E 71.( H 9.! 48.( 12 0.2 48.( 12 0.2 92.( ( 0.(
4.( (
(48 0) 0.2 I
(1.0i I 0.3 ( 108.0) H 19.(
::) 8.! 42.( ( 0.0 35.( ( 0.( 15.( (
i26.01 f 0.1 6! 12.1
2 (0.1) 2 (0.1)
; 0.(
1 0.4 4€ 10.1 2( 2.4
(
46 30.3 53 30.4
(311 (5.9}
124\ (5.8; 16 01 (Oj (OD!
(43i (6 1}
0 3 0.2
!7J ;O 1}
(0) (0.0} 3 2.3
46 32.1 7 21.7
19 1.8 19 1.8 0 0 9 0.1
. ..--
i~~~~;,g,9m:~1~~~~eel
Theta Delta Gamma Vega Theta VaR('OOO)
('000) Change Change Chango Change (SM) ($M) (SM) ('000) Usage Change Limit
(4,331 623 8. 36 15,735 (3,291 35,00( (4,3821 607 ! 8. 33( 15 201 {4 965i (2,092) 121 (24 (2.4 (294 12,700 (1,639) 21,000 i2.140) 77 (21; (2 d) (305) 11,261 {2 948i !1•1.!::; \? : ~ ;:ll {1 ~j 53 (;,664 {3 4Cl2j 17.000 ( 1 -1 t~1! IHI·ll ;1; !1 l) 38 ti.6H i8 ·:•:)~;}
(17fl} 26 ;1) oc ; 17) ~!.21E 324 8,000
0 tfll c 0{ !11 93 ;325! 4.00C ;_1.295) (1.?.3l c 11.i) 51 H,204 {13 09S; 13.50C
53 31 '2' oc 15 '1,61 220 3.000 (4) 11
•, ~ 791 797
137 101 t2) (0.81 14 •1,927 (1.443) 6,000 (8241 (31) (36'! (04) (35) :1,463 1,844 6.000
17 27 18 O.C (326) :!,70( 30S 7,500 109
~ 4,914 4,371 8,000
113\ (1,531 (2 10.a 84€ 13,152 780 16,000 (1,529) 15 4 10.8 83( 12,850 89( (2,195) 92 (76) 3. '.7,377 (571)
(118) 2 (11 O.C 103 :!,622 (922) 8,50( (1181 2 [11) Q[ 10 :!,622 (922)
(69) 102 (4) 0.( 32 ·),99! 28! 7,50( 14 (3) 1,05( 8" 2,00(
(49) (93) iS) 0.( 4( :2,87E t728) 4,00( () ·c 2.50(
c 6 0 0.1 ( 621 t:~09l 2.00( i682'1 i21i 3( 10 7 (641} .12,34! 2.552 11.00(
\1.340} 56 (~9; 3.E {368) 1;,922 976
(21 t25)
~-or 17 1.85 i0~8i 5.00(
0 18) 0.( ( \,44( 224 {·1) 53! ;124\ 8.00(
1729i 18 115' 00 1 56! 1181 1133! 3 ooc (70S 503 21 0.( (191 •5,662 (4,300) 16,00C
17 6E 0.1 (25) 3,603 831 6,00(
17 23 ~ 0.1 (25)
:'~l:~~~ (286) 5,000
52 o.c 1,742 2,000
(6) c 677 254
c (1, 0 (0 1) ( 86E (23! 3,000
(408) 104 3C 1.C (156) 5,36E (1,737) 9,000
(317) 331 (6) (1.0' (10\ 3,05€ (3,427) 7,000
0 c 5.000
(4,331) 623 7 a.3 362 15,739 (3,291) 35,000
14.382) 607 9 8.4 330 1!i,205 (4.965i
[1,522) 20 (1'1) (1.11 131 Ei.554 (7.334i
(1 5751 (7} !9) (11) 115 ti,336 (l.GGGi
t22i'i 151 121 0.1 (10) ",708 93
0 57 i3i (0 1j 30 :1,485 1.198
{1 295i (133] 0 {i 1 j 59 Ei.204 {110tJ9J
1,61 0 677 254
(48) i9:li (5) 0.0 40 :!,876 t;"2i;f;
53 33 (2i (0.0) 15 1,615 220
(4) 11 (0) 799 797
137 106 (3) (0.81 14 •1,937 (1.953)
(1.914i 52 24 11.3 (1.031) 1:1,595 615
(2.119) 145 (201 4.3 (619) 0,193 49
(302) 333 11 (1.0j (319) •1,281 (3,046)
(301) 350 12 (1.0) (336) 4,292 (2,460)
105 0 •1,867 3,993
(131 0 (729 18 i151 iO.OI 1 568 'I 181 i133)
9

CO
NFID
ENTIA
L TREA
TMEN
T REQ
UESTED
BY
LEHM
AN
BR
OTH
ERS H
OLD
ING
S, INC
.
r m m >< ~ G) s 0 0 0 w 0 ......
Sector Concentration
Sector
Basic Materials Capital Goods Consumer. Cyclical Consumer. Non·Cyclical Energy Financial Heallhcare Technology Telecommunicattons Transportation Utilities Indices Other
Industrial
Funds
Dull~ ($M)
98 (9) 94
169 121 (8)
141 172 106 (3)
108 (193)
300
0
(300!
I!! eta Delta Delta Change I$M) ($M}
94 (12, (23) 64 100 78
6 {:~4)
96 {BO; 4 312
114 6! 18( 5 84 \1 !4i
(161 98 ' [188) 153
270 345
c c (318' (1131
C1.um!ry Exposure Delta Beta Delta
Country ($M) Delta Change I$MI I$Ml
United Stales 467 36c (129) Japan 193 194 260 Europe (92) (85! 107 Great Bnla1n i6B) i~OOl r33i Germany 56 53 1'i Norway 4 47 18 Belg1um ::tC:j .·..:7) i2 1 ;
China :30) "'-'
··~~ -France 37 23 Italy :36) (39 :,:::G·; Hong Kong 3! 27 4 Denmark 3 33 (2) Other 204 162 452
0

CO
NFID
ENTIA
L TREA
TMEN
T REQ
UESTED
BY
LEHM
AN
BR
OTH
ERS H
OLD
ING
S, INC
.
r m m >< ~ G) s 0 0 0 w 0 co
ALL TOTAL
Major Currency MAJORCCY Australia Canada Switzerland Denmark Europe Great Britain Japan Norway New Zealand Sweden United States
Others OTHER CCY
United Arab Emirates Argentina Bulgaria Brazil Chilo China Colombia Czech Republic Egypt Hong Kong Croatia Hungary Indonesia Israel India Iceland Kenya South Korea Kuwait Kazakhstan Latvia Morro co Mexico Malaysia Peru Philippines Poland Romania Russia Saudi Arabia Singapore Slovak Republic Thailand Turkey Taiwan Ukraine Venezuela Vietnam Gold Oz South Africa
ALL MAJOR AUD CAD CHF DKK EUR GBP JPY NOK NZD SEK USD
ALL OTHER AED ARS BGN BRL CLP CNY COP CZK EGP HKD HRK HUF IDR ILS INR ISK KES KRW KWO KZT LVL MAD MXN MYR PEN PHP PLN RON RUB SAR SGD SKK THB TRY TWO UAH VEB VND XAU ZAR
FX Market Risk Summary Report 9-Jul-08
Delta ($MM) 433,508
PV01 ($M) Delta ($MM) 155 (212,524)
47 (30,525)
6 (48,921)
6 (58,449)
(14) 284,527
61 (636,349)
44· (37,604)
25 222,368
(11) 56,638
(33) (14,026)
2 (10,182)
23 0
PV01 ($M) Delta ($MM) (66) 706,032
0 188,671 (2) (13,924) 0 118
(3) 17,041 1 9,841
(7) (59,220) 5 (6,617)
(3) (17,519) 0 11,958
(2) 265,797 0 112 2 23
(2) 5,826 6 1,979
(4) 67,658 0 (16,151) 0 (748)
(51) (79,530) 0 36,814 0 (2.617) 0 114 0 145
38 210,754 (23) 30,127
0 (11,271) (4) (53,470) 19 14,872 7 (12.160) 1 122,117
11 102,503 (4) (124,846) 0 2,672
(14) (19,546) 0 103,954
(30) (67,339)
0 1,349
0 0 0 172 0 0
16) (3 630)
Gamma ($MM)
(717,524)
Gamma ($MM)
477,697
27,688 (357)
11,867 (15,316)
85,482
34,569
52,438
5,569
(11,420)
15,153
272,023
Gamma ($MM)
(1,195,221) 42,190 (3,136)
0 (760) 6,192:
(8,176) 2,791
(3,957) 0
(1,337,066) 0
(1,268) (26,640)
5,536 7,822
(7,606) 0
2,565 0
(91) 0 0
123,858 28,925
151 (98,797)
3,607 (1,677) 3,907
0 61,321i 1,086 130
20,589 (11,152)
0 0 0 0
(3 386)
!
Veoa ($M) VaR ($M) (6,542) 10,146
Vega ($M) VaR ($M) (272) 3,892
178 746 (265) 528
757 691 (661) 2,545
(1,106) 5,597
413 593 (276) 2,510
(73) 622
(20) 280
781 213
0 871
Veoa I$M) VaR ($M) (6,270) 3,599
360 60 (521) 154
0 1 2,358 1,370 (429) 161 (313) 940 105 139 (21) 212
0 22 (4,675) 332
0 1 87 229 167 270 217 66 (16) 835
(435) 347 0 11
(184) 1,176 0 48 0 7 0 1 0 1
(1,237) 1,451 186 197 111 90
(365) 502 172 410
(1,049) 503 (531) 579
0 1,178 558 610 35 157 13 316
256 1,530 0 1,102 0 9 0 0 0 14 0 0
!11171 392 10 .._x .sumr arv

CO
NFID
ENTIA
L TREA
TMEN
T REQ
UESTED
BY
LEHM
AN
BR
OTH
ERS H
OLD
ING
S, INC
.
r m m >< ~ G) s 0 0 0 w 0 CD
_.~-
2.000
1,800
1,600
1,400
en c g 1,200
:i 0 (/)
2. 1,000 Q) ::l iii > 41 800 .:r:: .... C'll :E
600
400
200
0 No_Lehman
Sector2
(-
Global Loan Product Origination: Loan Hold+ FRL Inventory for HY Business- 07/31/08 ($8.58 MV Committed, $3.48 MV Funded)
Basic Industry
...,.... I'-
en 0 a:> .,....
Communications
D MV Committed·
1• MV Fulflded .
Electric Natural Gas Reits
rr
Utility
11

CONFIDENTIAL TREATMENT REQUESTED BYLEHMAN BROTHERS HOLDINGS, INC.
LBEX-WGM 000310

CONFIDENTIAL TREATMENT REQUESTED BYLEHMAN BROTHERS HOLDINGS, INC.
- I _J
tn c c leo ()_
0 0 .!. ro ·- ~
:!: ~
( c
\ -ns
..0 I 0 I
(!) lgs A ...J I ~ ...J I' <
I
I I~ ·0
I~ I I
I I ~~
16. 0::: . Q) ro I(/) > I I
_.J 0 0 0 0 0 0 0 0 0 0 0 0 0 0 0 N ..- ...... <;I C")
"" l.()
I I I
LBEX-WGM 000311

CONFIDENTIAL TREATMENT REQUESTED BYLEHMAN BROTHERS HOLDINGS, INC.
_, t/) s::: I
.2
:!
~I -I
cu I .0 0
(!)
( A Q)
E 0 0 s:::
'"tJ Q)
>< u::: A ..J ..J <(
·-·--·--:-
0 0 0 0 0 0 0 0 0 0 0
""" """ N ("") '1 I I I
-1 .. I
i I
! leo !o
r~ l
co 0
I
>. co 2
co 0 o.!. co 2
r~
r--0
I
I~ I ' I
I I
I lr--IO
l" @-rw I I
I . -· r---= 0 0 l[)
I
_J c a_
.. cr: co >
LBEX-WGM 000312

CONFIDENTIAL TREATMENT REQUESTED BYLEHMAN BROTHERS HOLDINGS, INC.
-1/J c 0 ·--
:2: w-c ·--cu
.Q 0
(!)
A 1/J Q)
:+:; ::I
ail A ..J ..J <t:
i I__ _____ r--
0 N
--1 i I
0 0 0 0 'il "1 <9
I jco
I~
9 >. (l)
:a
co 0 .!. (l)
:a
I :g
I c (l) ...,
r--0
I I
r~
I
lf' ;o '6.. ! QJ
I(/) I
!
_J c
Cl..
a:: (l)
>
LBEX-WGM 000313

CONFIDENTIAL TREATMENT REQUESTED BYLEHMAN BROTHERS HOLDINGS, INC.
1ii' c 0 ·--:::! ~
c ·--n:l ..c 0 (!)
A 0 ·-0 ~
l_ 0 ll. .... c: Q)
.§ I/) Q)
> c:
n:l a. 0 c:
•t: ll.
A .J .J <(
,-----. --· - .
I i I
I
0 0
8 I
>. ro ::;:
.J c 0..
8 .!.. ro ::;:
18 c ro """)
1'-0
I
> 0 z
LBEX-WGM 000314

CONFIDENTIAL TREATMENT REQUESTED BYLEHMAN BROTHERS HOLDINGS, INC.
LBEX-WGM 000315

CONFIDENTIAL TREATMENT REQUESTED BYLEHMAN BROTHERS HOLDINGS, INC.
({
( \
Firmwiale Risk Information Weekly Update- As of August 06, 2008
Risk Appclitt' ($mm) Firm
FID Equity· l'rincipollnvcsting (000, GTS. GPS.DPI)
I MD/ :Principal JV (Priv. Equity, Minority Stnkcs, LP Stakes) ft\·ID Sccd/Wnrdumse.
IBD Total Finn RA Div% Europe Asia
VnR (Sn .. m) fo'"inn
FID
Equity.• Principal investing IMD
Total Firm VaR Div% Europe
Asia Aggrcga ted Risk Exoosures Firm To'tallntcrcst Rate PVOI($mm/bp) Credit Spread I'VOI ($mm/bp)
+I 0% Credit Sprc<id Widening P&L (Liquid+ Illiquid) {$mm) Equity Oello ($hn)' I'IH'ah! Equity Delta ($bn)• E'1uity Vcgn ($mm for 1% Volmovt!) -5% E.quity Stress Jl&L ($mm)•
-10% E~1uity S1ress P&L ($mm)• FX Jclt.a- Mujor Cl1rrencu.:s ($nun vs LIS D)
FX delta -EM Currencies ($mm vs USD) 01! Delta (Smm for 1% price move) US Natural Gas Delta (Smm for 1% price move) US Po\-4'er Delta ($mrn for 1% price move) •Exclut.hng~venl drivt!'n & pnvale cquit~
Counlc-rnHrty Credit Risk (Sbnl C'CE Investment Grade CCE N 011 lnvt:slmcnt Grac.le
Limil ~.ooo
3,000
800 1,000
750 250 1:!5
1,200
850
150
1~5
35 so 12
so 23
Equitv Surlicicnn Firm C.SETotal Capitnl Ratio (~/D) Tier I Ratio(%)
Tnrgct >10%
Risk E.c.11.1ity Requirement excess (dcflclt).stockholdcrs' equity ($bn) Equity Adequacy Frarnt!work excess (deficit) gross equity {Sbn)
Firmwi<Je flistorirnl Stress Tesl Exnusures ($hn),,..:~:d HE t•n; & Privnh: Emlll\')
EM Crisis(Augu,t1998)
HY/LBO/Deraull RISk (Sepremhcr :!00:!) Eqtuty Cmsh (Octohcr l'l87)
Firmwi Uc Hvpnlheticnl Stress Test Exposures (Sbn)!cxcl IU: l'l"li &. l'm·nlc Equil\·1
Bear Stecpemng (interest rates rise. curves steepen, risky asst!ls decline) Lilluidt ty Crunch (Central B;mks rmsc rates. curves nattt:n. risky assets dcl.·line) C'r~dlt Crunch <Fiu.dll to Quality~ mtcs fall, cun·cs steepen. nsky «sscls decline)
100 f)..-sclnsnrc hems
Avcrng-e VnR ($mm)
Firm Wcigh1t:d VnR Firm U nwctghted VaR
Comm:J!'rcinl R~nl Estnlc fSbn) Tut;tl
Cum nll!/ctal Mortgage lnvcnlnl)•
RE H cld for Sale
l~t·:>~itlt•~rl tinl !VIorlgngl' Exnusun·s !:Shu) Tulnl R4..•sidcnlial Tot:il u·s SP RcsJt.lcntml
Pnn-aciAII-A
Suhprimc Otht:er/Scratch & Dent
E11rope Asta
Other .. ~sstl Bucked (Sbn)
Non-~esidential t-.·lm1g<lgc
Other USABS
.·\l.·CJuis. it ion Finnnre F:1rilities !Shnl f:1s of 7/3112008) High (....,nde Contlll.•gent Cumm.itments
Unfun<ieJCommitmcnts Fundc~ Loans High ·~'ielu Contu~gcnt Commitments Ullftllt -c.lcd rommttrnents Fu1lclt.!=:J Lnans
08/1112008 10:49 AM
>6%
08/06/2008 3,531
:!,878
472 811
765 533 97
)9'!-'D
1 .. 195 S34
115 10:!
:'.J 43
16 43%
42 34
08/06/21108
4.9 12.4
(741.6)
2.0 9.1
32 8 (113 8) ( 116.3)
(1,078.0)
1.572.0 10.5) 3.9
(0.7)
OH/06/20118
46
4 June '08
:20 2~/11
13 5% NA NA
05/30/2008
(0.8) (I I)
(04)
~ (1.2)
( 1.5) (:! 0)
08/01>/2008
Ill 80
A \Ve-('k 62 (I)
62 (10)
:!4 (4)
-I% (21)
(5)
6
I
-2%
6. \Veck 0.6 00
(56.0) 0.2
(0.5)
1.7 (17 I)
(51.8) (221.0) (425.0)
( 1.3) 0.1
(1.0)
~ \Veck 0 0
6 Ounr1er 4.1% 2.8%
NA NA
1:1 Month 0.5 0.7 ·o.s
6 Munlh 0.3 1.1 1.2
,\ Ounrlcr
(II)
(4)
08/06/2008 ~
36.7 (3.1) 27.0 (:!.4)
0.7 (0.7)
118/lllo/211118
21.1
11.7 7.8
I 7 8.8 0.6
5.6 27 :!.q
3.2
0.6 2.:! 0.5 8.9 06 I o (\,4
t.\Ou:-~rtl'r
(3.8)
(3.:!) (2.4)
(06) (0.2)
(0.5)
(01!
(0.9)
01
(I OJ 11 Ounrll'r
(3.2)
(I. I)
1.1 (3.:!) (2.6)
0.2 (0.2) (:!.6)
~ 3,400
:'..684
506 5~3
728 554
98
38%
1.392 621
106 92 25 26 19
41% 43 20
~ 6.7
12.5 (7:!:!.0)
2.4 6.8
34.3 (10:!.0)
(27.0) 126.0
:!.020.0
08 (4.2)
5.4
~ so
~ \6.1% 10.7%
5.4
4.9
l.QQl! (:!.0) (:!0) (0 7)
l.QQl! ( 1.8) (:!.4) (3.2)
lQill!. 3,460
:!,533
555 no 759 47')
174 }7~-Q
1,)01
629
123 93
16 32 22
32% 40
17
lQill!. 5.8
::o.J (714.2)
2.4 6.3
34.3 (102,0)
(27.0) (80.0)
1.079.0
NA NA NA
lQill!. 55
3 lQill!. 106% 71%
4.3
J.O
:!QQ1 (:!.8) (:~.5)
( l'l)
:!QQ1 (I 9) (:!.5) (4.0)
:!.QQ1 3.559 :!,343
711 697
NA NA 93
}2%
1.]13 ldO
123 88
:!3 33 25
32% 44
:!.QQ1 7.5
30.7 (662.2)
2.7 NA
31.3 (116.4)
NA (460.0)
2,632.0
NA NA NA
:!.QQ1 47
:!.QQ1 10.6% 7.1%
2.5
NA
illQ1 (26) (:!.7) (2.9)
~ . (2.0)
(:!.I) (2.0!
illQ1 3,H8 i 2.531 !
491
NA i NA i
NA i 85 !
35%\ 1,030 ! m!
j
9d 7:!1 1oj
NAI IS
42%]
~I 2.1 i
:!6.1 i (469.7)!
2.3 j NAi
33.5 i . NAi NAI
(37~.0)/ 4n.o I
NA\ NAi NA!
ill!!1i 38!
I!
ill!!1: I0.5%j 7.0%;
1.6 I NA:
ill.!!Zi (IJ)i' ( 1.7);
(:!.3)!
ill.!!Z' (0 5)i ( 1.5);
NAi
lli!!1 2,894
1.715
830 NA NA NA 05
JJ% 1.0')0
656
82 44
32 NA
12 32%
30 20
lli!!1 3.2
21.8 (323 9)
5.0 NA
20 6 NA NA
(373 0)
(695 0)
NA NA NA
lli!!1 3 I
I
lli!!1 12 o~-D 8.0%
1.8 NA
.!.Q!!1 (1.4) ( 1.4) (I. 'I)
.!.Q!!1 (0.9) (1.0)
NA
~ l.QQl! :!.QQ1 illQ1 lli!!1 122 IJO 124 %: 78 83 97 100 97 . 7Q
l\"larkel V11lu~
~ 39.8 29.4
10.4
lQill!. 47.8 36 0 II 8
lliill! l.QQl! 2~.9 31.8
I.J 9 :!I c) 10.:! t~ 5 :.8 ~ 0 I 9 J I 9.3 ').5
0 7 0.7
6.5 2.6 3.0
~ 6.5 1.7
1.1 3.7
11.5 0.4
:!.I 0.0
6.()
2.t)
3 7
ill!l!! 10.9
7:! 08
17.8 3.7
11.9
.:!Q!!1 50.2 38.5
11.7
illQ1 lli!!1 ~8.2 i -42.()
35 (> 30 I
1:!.6! 1:!.5
:!.QQ1 3()117 ' 32.2 NA ' :!1.5 Ni\
12 7 NA 5 ~ NA: J 6 NA ·
10.2 NA 0.6 NA;
5.2
28 :!.J
:!.QQ1 11.9
10:!
1.7 23.9
9.7 2.7
11.5
NA: NA NA;
3()07
NA · NA NA NA NA NA NA: NA:
NA NA NA NA NA NA NA NA
1-yr llich ~.269
3.155 1,026
1,174
174
1.503 1,()')2
ICJ..t 124 40
5'l
25
50
·17
17 4
37 I
.!.Q!!1 :!8
I .!.Q!!1 13.0% 87%
2 8 NA
6J 73
NA NA NA NA NA NA NA NA
~ 2,85!'
2.176
.153 498
62 .jl)
tO
11
:!t
IJ
(0.6)
10 7
NA NA NA NA NA NA NA NA
LBEX-WGM 000316

CONFIDENTIAL TREATMENT REQUESTED BYLEHMAN BROTHERS HOLDINGS, INC.
Firm Weekly Markets Analysis
Major Market Indices & Indicators 817/2008 Weekly Q2'08 ... Ql'08 .. Q4'07. ,. Q2'07 Q4'06 Q4'05· Q4'04 . sz Week High 52 Week
Change Low 5Dfl/2!lllK 2121J/2UIIX II/JIIIU7 ll!i/JI/!17 11/)U/11(, 11/JII/11~ 11/311/1)4
Govt.·rnmcnl & Lihor Rnles US 10 Yr Govt 3.94 (0.04) 4.04 3.53 3.97 4.89 4.46 4.50 4.36 4.85 3.31
·· 10 YrGovt 4.68 (0.12) 4.98 4.46 4.65 5.25 4.51 4.22 4.59 5.29 4.28 mt~n I() Yr"Govt 4.26 (0.10) 4.39 3.89 4.14 4.41 3.69 3.44 3.79 4.68 3.69
... pan I 0 Yr Govt 1.52 (0.02) 1.75 1.36 1.47 1.75 1.65 1.44 1.45 1.88 1.25 c USD L1bor 3m spot 2.80 0.01 2.68 3.06 5.13 5.36 5.37 4.42 2.41 5.73 2.54 EUR Lihm Jn1 spot 4.97 - 4.86 4.38 4.81 4.12 3.64 2.47 2.18 4.97 4.29 Federal Funds Target 2.00 - 2.00 3.00 4.50 5.25 5.25 4.00 2.00 5.25 2.00 USD I 0 yr Interest Rate Swaps 4.69 0.01 4.69 4.22 4.62 5.46 4.93 5.05 4.77 5.53 3.94 USD IOyr Cap Vols (%) 21.6 (0.40) 21.3 26.5 22.4 14.2 18.2 20.1 21.4 28.5& 16.64 USD 5yr/10yr Swaption BP Vol 91.1 (0.88) 89.9 101.2 93.9 73.0 82.9 93.9 91.5 105.69 81.51 USD I Oyr Ag,ency Sprend (OAS) 85.6 14.17 60.4 67.6 54.3 34.0 31.2 37.3 37.3 95.84 3H.lJ5
Cornornle Rates & Credit Spreat.ls _Lehman Global Aggregate Index~ Ot\S 88 4 65 69 52 26 24 26 19 8& 34 Lchmnn US Aggregate Index- OAS 155 II 113 128 92 47 38 47 35 161 62 Lehmnn US Corporate High Yield· OAS 785 18 622 745 556 238 310 352 300 831 369 Ldumm Global Emerging Markets- OAS 325 (6) 259 303 254 133 158 277 286 344 IXO CDX IG 5yr (Series 10) 133 (4) 102 153 84 34 34 49 47 192 45 CDX HY 5yr (Series 10) 695 7 574 724 417 261 276 379 321 779 30X LCDX (Scncs 10) 393 4 349 477 314 108 NiA N/A N/A 493 176 iTraxx European IG (St!ries 9) 91 I 76 114 62 20 25 36 36 162 30
Murtgngc l>l"ri'lniCive lnclic-es: ABX 07-1 PAAA, price 62.1 (0.3) 74.6 N/A N/A N/A N/A N/A N/A 80.3 55.6 ABX 07-1 AAA, price 47.9 0.1 58.7 62.0 77.1 99.5 N/A N/A N/A 96.2 42.7 ABX 07-1 AA. price 10.2 (0.4) 14.0 26.5 46.4 99.5 N/A N/A N/A 86.2 8.6 ABX 07-1 A. price 6.2 (0.0) 6.0 12.7 28.3 94.5 N/A N/A N/A 59.0 5.8 ABX 07-1 BBB, price 5.0 (0.0) 5.3 11.6 20.2 75.7 N/A N/A N/A 38.2 4.8 ABX 06-2 PAAA, price 86.3 (0.3) 93.0 N/A N/A N/A N/A N/A N/A 93.9 80.8 ABX 06-::!. AAA. price 67.0 0.1 77.7 73.4 86.9 99.6 100.1 N/A N/A 97.5 61.0 ABX 06-::?. Ar'\., pnce 21.7 ( 1.4) 33.7 43.7 61.8 99.5 100.1 N/A N/A 93.9 17.5 t\BX 00-::!. A. pncc 7.3 (0.3) 11.3 17.5 40.3 96.2 99.7 NIA N/A 75.7 7.3 ABX 06<! BB B. price 4.9 (0.1) 5.6 13.3 20.9 83.1 97.9 N/A N/A 48.8 4.X CM13X.05-AAA 163 0 106 212 69 7 6 N/A N/A 277 15 CMBX.05-AJ 494 2 340 N/A N/A N/A N/A N/A N/A 514 314 CMBX.05-A,\ 745 35 476 676 304 28 12 N/A N/A 935 85 CMBX.05-BBB 1,864 145 1,229 1,515 928 167 49 N/A N/A 1,979 330 CMBX05-BB 2,861 140 2,214 2,000 1,492 490 179 N/A N/A 2,861 851 HEL Float,\ At\ 3 Yr 818 - 615 688 320 21 16 N/A N/A 825 100
(( IIEL Float AA 5 Yr 1.187 - 1.146 1,340 778 32 30 N/A N/A 1,710 30(1
'BS Fixed AAA 3 Yr 165 5 135 315 100 II II N/A N/A 435 40 BS Fixed AAA Jr 10 Yr 550 15 415 540 205 42 31 N/A N/A 790 79
.. ·1BS Fixed Super Duper 10 Yr 245 5 141 235 103 27 25 N/A N/A 315 45 I FNCL currcn i coupon Libor OAS 84 15 34 43 l (7) ( 19) N/A N/A H4 ('l)
ALT-A AAA Pnssthrough Price Drop 35.1 1.7 18.3 8.5 3.0 0.4 0.6 N/A N/A 35.1 I. X Jumbo At\A Pt~ssthough Price Drop 13.8 2.4 6.2 2.6 2.0 0.6 0.8 NIA N/A 13.8 I I
ElJnil:y lm.lice:s Aml·rk:L'i!
S&P 500 1,266 (0.1)~'0 1,400 I ,331 1,481 1,531 1,401 1,249 1,174 1,565 1.215 Nasdaq 100 I ,880 1.7 ~1o 2,033 1,745 2,089 1,928 1,791 1,673 1,572 2,239 1,673 Dow lndustn.als 11,431 0.5 °/~1 12,638 12,266 13,372 13,628 12.222 10,806 10,428 14.165 10.963 Russell :woo 713 (0.2)'% 748 686 768 847 786 677 634 846 644 ~ FTSE I 00 Index 5,478 I ., 0/
·- .o 6.054 5.884 6,433 6,621 6.049 5.423 4,703 6.731 5,151 (',\(' -W lnLh:;..::: 4,457 ! .-i ~'0 5.0!4 4,79! 5,671 6.104 5,3~8 4,567 3,754 5,X63 4,061 DA:X lndt:x 6,543 1.0 %, 7,097 6,748 7,871 7,883 6,309 5,193 4,126 8,076 6,082 IBEX 35 lnd'"" 11.718 ( 1.4)% 13,601 13,170 15.760 15,329 13,849 10.558 8,693 15.946 11.152 ~ N1kkei 225 13,125 (1.9)% 14,339 13.603 15.6&1 17,876 16.274 14.872 10,899 17,459 ll.nR Hang Sl!ng ln-Ucx 22,104 (2.8)'% 24,533 24,332 28,644 20.634 18,960 14,937 14.060 31,638 20,387 Korean Composite Index 1,564 (1.9)% 1.852 1,712 1,906 1.701 I 1,432 1,297 878 2.065 1.507 TOPIX lnde>< 922 (3.6)% 1,039 967 1,116 1.285 l 1.158 1,074 788 1,226 829
Volntililics: OEX lmpl \-'vlatdlty 21.5 (3.2) 18.6 28.6 24.8 12.8 104 11.8 13.6 38.9 9.-l VIX Volatility Index 21.2 ( 1.8) 17.8 26.5 24.1 13.1 10.9 12.1 13.2
,, , -'-·- 16.1
FX Japanese Yer'l- 109.51 1.32 105.40 105.78 112.36 121.53 122.43 97.08 112.36 119.60 97.0H Eum 1.54 (0.02) 1.55 1.52 1.47 1.34 1.60 1.34 1.47 1.60 1.34 Br1rsh pound 1.94 (0.03) 1.98 1.99 2.05 1.97 2.11 1.94 2.05 2.11 1.94
COS Snreatls Syr Lehman Brothers 270 (55.0) 220 220 130 140 450 52 27 450 60 Goldman Sac·hs 127 94 170 72 74 250 39 28 250 39 Morgan Stant ~y 210 (25.0) 137 210 97 75 340 40 N/A 340 40 Merrill Lynch 245 (30.0) 175 215 130 81 330 42 26 330 42
'lllnditit•s. 1pl Wfl Crude Contract($ per 8bl) 120 (4.1) 140 102 96 71 61 61 43 145 {ll)
1
.npt Naturill Gas Conlract ($per M~1BTU) 8 (0.9) 13 10 7 7 6 II 6 14 5 Acuvc (iold C .. untract ($ rcr Oz) 871 (43.2) 928 916 838 651 638 519 438.4 1,004 648 DJ.-\IG lnde>r. 196 (9.5) 233 202 I X5 130 167 171 146 238 161
(
8t'el20067 .35 PM
LBEX-WGM 000317

CONFIDENTIAL TREATMENT REQUESTED BYLEHMAN BROTHERS HOLDINGS, INC.
c
(( '-....;.
(
.. ;. . · ,·.,·.
Market Highlight
Weekly Risk Management Highlights Memo Week Ending: August 7, 2008
:'.··.·:< . :·: .· .
FOMC left the Funds rate unchanged at 2% at the 815 meeting and the statement was less hawkish than expected, signaling no action anytime soon. In Europe, the ECB kept interest rates unchanged at 4.25% as expected, however Trichet's comments post the meeting were interpreted as dovish by the market. Citing that economic growth will weaken, the markets reacted by pricing out any rate hikes until at least 02/09, and Government Bonds rallied ied by theji-ont end, with 2 Yr yields dropping -!5bp. The yield curve also steepened with 2Yr vs 30Yr now dis-inverting, goingfrom -15bp to +7bp.
..::. ~~
', :·',
Securitized Products • Freddie Mac's worse-than-expected 2Q08 earnings, a larger-than-expected impairment from its guarantee book
and the non-agency portfolio depicted a disturbing picture of the company's financial conditions. Considering the unrealized MTM impairments of $34BB, the company is technically insolvent as of2Q08 as liabilities exceeded the assets by about$ I .2BB .
• For the week, FNMA current coupon OAS widened by 21 bp and 15bp versus treasury and swaps to 148bp and 83bp respectively, suggesting a dramatic dislocation of the markets. Non-agency mortgages continued to slip lower as jumbo and Alt-A super senior AAAs were down 1.5 and 1.0 pts to 89 and 68 respectively. The pace of price decline however, has been slowed in last a few weeks, suggesting a potential improvement of market conditions .
• Americas: Prime and nonprime non-agency assets were reduced by $440MM, mainly from secondary sales, while hedges were about flat.
• Europe: $1 IOMM sale ofEurosail 07-4 AA, A and BBB notes to Patron Fund III, to be financed by Lehman with a $43MM (40%) 1 year margin loan (at L+l50bp) with recourse to the borrower. A potential sale of$136MM UK nonconforming AAA (EUMF 2008-1) to Britannia Building Society. To be financed via repo with 85% advance($ I 16MM funded) under daily MTM. LEH will also repo finance for this client $136MM of prime Dutch and UK RMBS at 85% with a daily MTM. Europe: Potential Total Return Swap with Commerzbank in which Lehman provides very deep out of the money credit protection on a $1.8b portfolio of 132 shipping loans with 43% weighted average (WA) L TV·and a year WA remaining term. This provides capitai relief benefit for the client. The revenues for the trade are $8MM over the 9 expected term of the trade (20 year stated final maturity). Except in the case where there are extreme portfolio losses in the region of 80% the client has a strong financial incentive to cancel the trade after 9 months.
Real Estate • The last two months have proven challenging for CMBS, with spreads widening dramatically across the credit
spectrum. AAA Super Dupers spreads widened by+ I 03bps to 240bps from mid May. Recent vintage BBBspreads (near 2400bps now) are beyond levels reached at the peak in mid March 2008 .
• Europe: Potential sale and financing of $514MM of the most highly rated portion of our German loan portfolio (Green) to Fortress: financed with a 90% ($463MM) 7Yr term loan from LEH, secured by the bonds. Fortress 10% investment ($51MM) subordinated to the LEH loan is expected to be rated Single A by S&P.
• Europe: Over the week there was a $230MM balance sheet reduction from paydowns on Gospel ($128MM), Palazzo ($14.3MM); Fortezza ($10.4MM) and a partial syndication ofCalvino mezz loan ($77.8MM).
Rates • Our Fannie/Freddie sub debt exposure remains unchanged at long sub debt ofFH $437K/bp ($698MM), FN
$90K/bp ($148MM) versus short senior debt FH $1.2MM/bp ($1.8BB), FN $188K/bp ($530MM) . • Asia: Interest rate risk is mainly in Japan, where the desk is net long $830Kibp. Concentrations are in super long
maturity JGB 30-40Yrs with a long position of $1.1 MM/bp. Japanese yields were down 3bp to 7bp this week.
FX • EUR continues its downward slide against the USD and is trading at 1.5370 levels (down another 1.5% for the
week). Commodity currencies tumbled last week on the back of the commodities selloff. AUD (Australian Dollar) fell 4% followed by CAD (Canadian Dollar) & NZD (New Zealand Dollar) down 2.5% & 3% respectively.
• Stress risks of$50MM to $70MM exist in the USDTRY (Turkish Lira) position. USDTRY currently trades at 1.1675 per USD (rallied from 1.33 levels in April 08). The EMG Options book in Europe has significant option strike concentration risk (Short TRY I Long USD) with $3BB notional at a $1.00 strike and $2.4BB notional at $1.10 strike levels. If TRY rallies sharply in the span of a few weeks, then the desk will have to buy back $1.00 &
LBEX-WGM 000318

CONFIDENTIAL TREATMENT REQUESTED BYLEHMAN BROTHERS HOLDINGS, INC.
G
(
Weekly Risk Management Highlights-Memo Week Ending: August 7, 2008
$1.1 0 strikes. The stress loss results from a scenario where TRY rapidly appreciates to $1.00 and the desk has no ability to hedge its exposures. The desk is evaluating the appropriate course of action to mitigate this risk.
High Grade Credit • GM Corp reported a $15.5BB Q2 loss, bringing the cumulative loss figure to $70BB since '04. GM reported that
it still has $21 BB of cash. Losses come as industry-wide auto sales have hit 15 year lows. Ford Motor Co, on the other hand, reported $8.7BB loss and claims that it has $26BB in cash at hand. Losses come amid news that the big three are pulling back from auto leases: Chrysler Financial has completely cut lease offers since Aug I st, GMAC will stop leasing vehicles in Canada, and Ford will be taking similar steps. GMAC claims that the residual losses on GM vehicle leases are $1 I Kiper vehicle on average. We are modestly long credit spread risk on this desk in the auto sector ($52K/bp)
• The desk has $825MM ofLEH cash bonds with exposure of$464K!bp.
High Yield • Americas~ Over the week HY indices were down and spreads were wider. The HY Flow US desk lightened up on
its shorts, where the net CROI moved down from short $691 K!bp to short $135K!bp (7/30-817). Additionally the business in Americas switched its equity exposures from net short -$154MM delta to net long +$1 07MM delta, driven by trades in liquid indices and futures on indices.
CDOs • The CLO desk is long $4.4BB supersenior risk ( 40- I 00, 55-l 00, 60-1 00%) in synthetic format. Positions are
marked at L+65bps to +70bps (unchanged over the past two weeks vs. I Obps to 15bps pre-crisis). While principal risk is remote due to high subordination, potential MTM risk is material. To hedge this risk, the desk recently upsized protection on narrow 40-55% slices of 15 US and European CLOs. These hedges, bought a credit hedge fund), were increased by $168MM to $368MM; we paid -135bps on average.
• Losses in the bespoke correlation book ( -$61 MM MTD up to 25 July) have been attributed to spread dispersion (wide names get wider, tight names get tighter). Valuation and risk of bespoke CDOs, which are marked-to-model, are highly sensitive to the methodology used. The recent severity of spread dispersion has led the desk to develop a separate measure, the dispersionO 1, to try to capture the risk. On a beta-adjusted basis, the bespoke book is short -$2.4MM/bp index risk vs long $0.3MM/bp single name risk
• The synthetic CDO desk ended the month +$1 OMM including the $40MM reserve release mentioned last week. The desk has already earned +$17MM in August from continued widening in IG equity tranches and indices.
Municipals • The desk is long $1.3MM/bp Muni bonds (flat on the week), 46% hedged via short $0.3MM/bp Treasury/Agency
and $0.3MM/bp Swaps
Auction Rates • Citigroup announced that they will buy back $7 .5BB in auction rate securities and agreed to pay$ I OOMM fine to
settle allegations around misrepresentations oftheir marketing and sales of auction rate securities. UBS also agreed to buy back $18.6BB of securities and pay a$ I 50MM in fines. The Firm's total auction rate exposure as of7/31 is $3.0BB, down from $3.5BB last quarter, ofwhich $1.4BB is Muni's and rest is Corporates.
Commodities • Energy markets continued their sell-off from the prior week(s), with NatGas down -5% and Crude and Products
down -3%. Commodity markets and especially energy markets have been revising downward their demand expectations in the light.ofgathering evidence of a US and Europe economic slow-down as well as dampening down of the growth projections in the emerging market economies. Complicating the downward trend in commodity prices have been (geo-political) events such as the BTC Pipe-line explosion in Turkey cutting supplies of Oil at -1 MM Barrels per day, disruptions to production in Iraq and Nigeria as well as higher than expected drawdown in US Gasoline inventories and the lower NatGas injections as reported for this week. These and the potential for significant disruption of production in the Gulf of Mexico during the Hurricane season extending through November add a high level of volatility and price swings on a day to day and week to week basis.
• Americas: At COB 8/4/08 the positions in Power are short 2.2MM MWhrs or -$50MM notional and long NatGas 7MM MMBTU's or $397MM notional. For the week, P&L was a loss of$6MM with Power and NatGas mostly flat while Oil had a model reserve adjustment of -$5MM contributing to the reported loss for the week. The
2
LBEX-WGM 000319

CONFIDENTIAL TREATMENT REQUESTED BYLEHMAN BROTHERS HOLDINGS, INC.
(:
(
Weekly Risk Management Highlights Memo Week Ending: August 7, 2008
portfolio has a I Vo!Pt vega risk of long $1.5MM for NatGas and short ($0.25MM) for Power. A stressed Vega Risk shock move for NatGas would be roughly $22MM.
• Europe: The desk had the best week so far this year and booked P&L gain of $15MM from the fall in energy prices and the desk being short UK Gas, selling German Power options and Structured Products. The falling certified emission reductions (CER) price also contributed to the MTM gain due to the short position put on to hedge the Primary Carbon transactions.
• The European Carbon business now has commitments to purchase 9.7MM tonnes from three projects in China (YangQuan, Anshan and Guodian). Settlement is on a delivery vs payment basis. We are exposed to project completion and other operational issues as well as various UN hurdles in the project lifecycle before the credits can be issued. The "investment" being made does not fit within the standard approval process for credit/market risk but is similar to making a private investment. Going forward, we will establish formal investment committee process to review new transactions
Commodities- FlO Management Book and Rates Book.Europe • FID Management Prop Book and IR Products desk reduced its long December WTI put options to 9,700 contracts·
(4.7K@ $90, 3K@ $80, and 2K@ $75). The P&L for the past week was a gain of$4MM. The vega exposure is 0.9MM/Vo1Pt and the stress loss of a 9 Vo!Pt move is -$8MM.
• Global equity markets were largely flat to somewhat positive after a volatile week. Financial institution losses, oil price and housing continue to drive the volatility in the market. Market sentiment in China still remains negative. July has been one of the more difficult months in years for hedge funds with data showing that the worst hit are popular strategies such as Long/Short equity (-5%), quants (-1 0%), and event driven (-5%).
• Risk levels in the Equity Division remain low with Beta Adjusted Equity Delta of$643MM and short 3Mos. Weighted Vega of $3.2MM/Vo!Pt. Direct commodities exposure was further reduced to a delta of $49MM from the previous high levels of $150MM-$180MM.
• Americas Syndicate desk continues to make progress on reducing the residuals from two block trades: William Sonoma $42MM (out of$135MM), Quicksilver $47MM (out of$60MM).
• Difficult to hedge positions: Long dividends globally of $6.4MM per I% relative change, short correlation risk globally of$15.5MM per correlation point from the structured books.
• Quantitative Strategies in Europe had another challenging week as momentum reversal in commodity and basic material prices continued. Our internal quantitative traders reduced their exposure significantly. Weekly P&L was a loss of$18MM.
• Europe Exotics continues to be hurt by a lack of new deal flow, dislocations in the relation between single stocks and index volatilities, correlations and dividends.
Principallnvesting· .. • Market conditions continue to be challenging with losses in Principal Investing including !MD JV were -$66MM
over the week to total -$655MM YTD. Positions were largely unchanged. Primary losses came from stake in R3 (-$35.3MM), MLf> (-$17.5MM), and GMAC (-$15.5MM). The price ofKSK was down by- 1.2% while the Indian Nifty index was up +4.73% over the week, which impacted the KSK position and its Nifty hedge negatively. The MLP market continued its trend of weakness and liquidation of positions was slow. Significant risk issues include:
• Total delta in MLP positions: $464MM including $270MM in MLP Proprietary positions and $195MM in LEH's share of the MLP Opportunity Fund. Positions lost about $17 .5MM over the week. Linn Energy~ the most significant aggregate position at a $212MM risk delta lost almost 10% on the week.
• ABX index positions of Pen AAA $272MM VoDO and AAA $127MM. • Total GMAC exposure in CDS and debt is ($287MM) VoDO, $54klbp SpreadO I. • LEH's private equity stake in TXU revalued by +$62MM to $263MM by using a multiple of 1.3 which is in line
with revaluations done by KKR and TPG.
Credit Risk Americas • Mono lines: As at July 31, total direct risk to monolines on a VoDO basis was a loss of$223MM, down from
$357MM in June. The main driver for this improvement was an increase in the VoDO value of CDS trades referencing mono lines. This is a result of recent spread contraction, which caused the value of our CDS positions
LBEX-WGM 000320

CONFIDENTIAL TREATMENT REQUESTED BYLEHMAN BROTHERS HOLDINGS, INC.
G.
(
Weekly Risk Management Highlights Memo· Week Ending: August 7, 2008
to decline while also increasing their VoDO value. In the second major monoline commutation transaction in as many weeks, Ambac agreed to pay Citibank $850MM to terminate a COO-squared transaction it had marked at $1 BB, allowing Ambac to recover $150MM of excess reserves and eliminate one of only three such transactions on its books. ACA terminated $65BB of credit default swap contracts and turned over 95% of residual interest to counterparties.
• Energy Hedge Fund Loss: A hedge fund group focused on the energy sector lost >$1 BB on leveraged, long positions in natural gas and oil in July. fhe funds have met all margin calls and reduced positions, but they remain exposed to further price declines. Lehman has sold calls and bought put spreads on oil and natural gas from the funds at concessionary margin levels, resulting in MPE of approximately $1 OOMM.
• Deal-Contingent FX Trade: The FX desk is evaluating a €448MM deal-contingent FX forward in connection with a US technology company's acquisition of a French company. Trade would mature between Oct. 2008 and Feb. 2009 and would have an MPE of -$45-$80MM. Deal-break risks include two European regulatory approvals, the possibility of a higher bidder and seller-related outs. The IBD team places deal probability at 90%.
Europe • Munich Re has ceased trading with Lehman because their exposure to LB has risen to €250MM ($385MM),
largely driven by puts they purchased to hedge their stake in a European bank. Credit is working on a solution where LEH would pledge 25% of the MTM in collateral, for a commitment from Munich Re to re-commence trading.
• Equities is working on a large equity trade with a major UK pension fund. Trade proposal includes collars of varying amounts on the FTSE100, S&P500, EuroStoxx and the Nikkei (LEH buys calls with strikes of 122-130% of spot and sells client I 00 to 75% put spreads). We will have a CSA with daily MTM.
• Russia- Georgia: Fighting broke out today between Georgian troops and separatists from the breakaway South Ossetia region after a cease-fire failed just hours after it was announced. Georgian officials said their troops have surrounded South Ossetia's capital, Tskhinvali and have clashed with Russian-backed air and ground forces. Prime Minister Vladimir Putin said from Beijing that "war has started," and he assured that, "There will be a (Russian) response, of course." Russia Country Stress exposure including equities is a loss of $90MM against a $300MM limit; LEH is long $21 klbp in credit products, mostly Gazprom and Russia sovereign, including 5yr-l Oyr steepeners in those products and long $303MM RUB delta.
• South Africa: Nearly 2 million unionized workers went on strike in South Africa Wednesday to protest against rising food and electricity prices and unemployment. The protests shut down mines, factories, ports and public transportation. The labor unions support Jacob Zuma, leader of the ruling African National Congress (ANC), who is expected to succeed President Thabo Mbeki in 2009. The strikes help Zuma lay blame on the Mbeki government for high inflation and rising rates. The rand fell to 7.439 per dollar, down over 2.5% on the week, over concerns stemming from a corruption trial against Zuma and the impact of the strikes. LEH country stress is a loss of $70MM, most of which is attributable to FX exposures. ·
• Pakistan: The ruling coalition parties said they had agreed to initiate impeachment proceedings against President Musharraf and to restore judges sacked by Musharraf during a period of emergency rule last fall. Musharraf cancelled a trip to China and remains in Pakistan where he will attempt to rally support from the military; the military is the ultimate arbiter of power in Pakistan and its reaction to the impeachment process will be critical. Equity and FX markets fell on the news. Lehman has minimal exposure to Pakistan but heightened political instability there could have a negative impact on regional markets, especially in India.
4
LBEX-WGM 000321

CONFIDENTIAL TREATMENT REQUESTED BYLEHMAN BROTHERS HOLDINGS, INC.
(
...., 0 lO uer
.t: go:>ao
th a. C1J c en 'g
th .r ~
BO!nr ~
Q) c 0 eo unr '- ::;
::I ~ eo Aew :::; BOJd\1 th ~
eo Je~ 0 g
eoqa::1 ::;
c..~ eouer ><~ lO :~;:,a
W':: LO AON
~~ LOl:JQ
lOd>s
~~ lO Bnv
m~ LOinr
Q.:g oounr ~-~ 1.0 Ae~ Q) ;:; lOJdv
~ ..... ~ LO J13W c 0 £QQ3:;1
::I ~ Lauer
0 ~ gooaa
0 !
LBEX-WGM 000322

CO
NFID
ENTIA
L TREA
TMEN
T REQ
UESTED
BY
LEHM
AN
BR
OTH
ERS H
OLD
ING
S, INC
.
r m m >< ~ G) s 0 0 0 w 1\) w
~~·........._
Top Counterparty Exposures Exposures as of July 31. 2008: Excludes Money Lines/Money Funds
TOP 10 COUNTERPARTIES BY CCE ·. ::' .. ····. •' .·.• · ...... ,··· .•• ) ·: :· .· ··.·•··· :<>
Rank Client Code Counterparty Name · .. ,.. Industry • ·•.• >. . ... 1 11302 MINISTRY OF FINANCE ITALY''' CENTRAL GOVERNMENT DEPARTMENT 2 1211976 BH FINANCE LLC ,., MISC FINANCE COMPANIES 3 1843307 PYXIS ABS COO 2007-1 LTD SPECIAL PURPOSE VEHICLE 4 1771399 LIBRA COO LIMITED SPECIAL PURPOSE VEHICLE 5 1792772 MKP VELA CBO L TO SPECIAL PURPOSE VEHICLE 6 9754 CENTRAL BANK OF NORWAY (NORGES BANK) CENTRAL BANK
7 2067061 KBC INVESTMENTS CAYMAN ISLANDS V L TO SPECIAL PURPOSE VEHICLE 8 1914744 PORTFOLIO CDS TRUST 187 SPECIAL PURPOSE VEHICLE 9 1906382 BALL YROCK ABS COO 2007-1 LTD LEHMAN SPECIAL PURPOSE VEHICLE 10 575833 AGR FINANCIAL PRODUCTS INC FINANCIAL GUARANTOR
TOP 10 COUNTERPARTIES BY MPE
". .. . :• .. .. , ..
Rank Client Code Counterparty Name ·Industry .. ; ... 1 11302 MINISTRY OF FINANCE ITALY''' CENTRAL GOVERNMENT DEPARTMENT
2 1211976 BH FINANCE LLC ,., MISC FINANCE COMPANIES 3 2794 JPMORGAN CHASE BANK NA COMMERCIAL BANK 4 4034 DEUTSCHE BANK AG COMMERCIAL BANK 5 2032 GALYON COMMERCIAL BANK "• ..
6 1843307 PYXIS ABS COO 2007-1 LTD SPECIAL PURPOSE VEHICLE 7 1219 BARCLAYS BANK PLC COMMERCIAL BANK 8 7531 KREDITANSTAL T FUR WIEDERAUFBAU COMM. BANK-GOVERNMENT CONTROL 9 12883 UBSAG COMMERCIAL BANK
~ 3033 CITIBANK NA COMMERCIAL BANK --~-------- ---~----
··• Physic:cil J~ri~dicti~~ ••·
_ ... ,, ,,_ .. ..•.• : <:;urrent Crec!)L · · .Maximum Potential . ICR·· 'Exposure·· · ·Exposure ...
ITALY iA+ 2,883,714,052 5,674,065,905 UNITED STATES iAAA 1,517,314,229 2,942,105,717 CAYMAN ISLANDS iA 1 '128,689,622 1 '143,561 ,650 CAYMAN ISLANDS iA 900,235,150 961 '1 00,000 CAYMAN ISLANDS iA 899,795,349 981,300,000
NORWAY iAAA 590,872,628 837,553,493
UNITED KINGDOM iA+ 493,007,632 560,000,000 UNITED STATES iCCC 408,581,632 552,500,000 UNITED STATEOS iA- 391,583,000 411 '133,278 UNITED STATES iAA 386,004,916 415,485,034
. ...... Current credit 1\olO!ximum PotentiOII ·
• .. · Physic!ll J~risd;ctio~··· ICR; • . 'Expo!;iurer · ·Exposure
ITALY iA+ 2,883,714,052 5,674,065,905
UNITED STATES iAAA 1,517,314,229 2,942,105,717
UNITED STATES iAA 269,628,589 1,508,444,985
GERMANY iAA 141,722,946 1,415,627,301
FRANCE iAA 93,831,476 1,291 '194,379
CAYMAN ISLANDS iA 1,128,689,622 1,143,561,650
UNITED KINGDOM iAA 40,025,180 1,114,788,119
GERMANY iAAA 189,862,324 1,096,917,602
SWITZERLAND iAA 300,528,724 1,059,558,090 UNITED STATES iA+ 183,401,094 1 ,008,825,111
(1) Exposure reported above does not reflect hedges we have against our exposure, including $2,220m of long credit protection. Actual CCE and MPE nEll of hedges was $664m and $3,454m respectively.
(2
) Exposure reported above does not reflect $769m of CDS hedges we have against our exposure. Actual CCE and MPE net of hedges was $748m and $2, 173m respectively.
Total for Top 10 Counterparts (Excluding MLIMF: PRINCIPAL ONLY):
Total for All Counterparts (PRINCIPALI~GENT) (Excluding ML/MF): Total MF /ML Total:
7/31/08 CCE 9,599,798,210
48,088,67 4,115 5,877,835,472
53,966,509,587
7/31/08 MPE 18,255,088,858
131 '704, 120,676 5,877,835,472
137,581,956,148

CO
NFID
ENTIA
L TREA
TMEN
T REQ
UESTED
BY
LEHM
AN
BR
OTH
ERS H
OLD
ING
S, INC
.
r m m >< ~ G) s 0 0 0 w 1\) ~
/ .. - r-·~ I
Top Non-Investment Grade Counterparty Exposures Expailures a5 of July 31, 2008; Excludes Money Lines/Money l;unds
TOP 10 NON-INVESTMENT GRADE CLIENTS BY CCE •/,",_."" •,,,,,',' • <'<'•' ''''·"',\'}',;,1_;'.-,,',A<'.l,", o•
Rank
2 3 I 1043721 !TEXAS COMPETITIVE ELECTRIC HOLDINGS COMPANY LLC UTILITY-INVESTOR OWNED & IND 4 11758610 !CENTRAL BANK OF EGYPT CENTRAL BANK 5 I 16318 !CHESAPEAKE ENERGY CORPORATION OIL/GAS COMPANY 6 I 2068503ICHAMPION ENERGY MARKETING LLC OIL/GAS COMPANY
7 I1910272INORTON GOLD FIELDS LIMITED METALS 8 I 1570266IBLUEPOINT RE LIMITED INSURANCE CO.-PROP/CASUALTY 9 I 943881 I PENN WEST PETROLEUM LIMITED OIL/GAS COMPANY 10 I 3192 I CONTINENTAL AIRLINES INC AEROSPACE
/ (
UNITED STATES iB+
EGYPT iBB+ 117,171,120 137,830,713
UNITED STATES iBB+ 104,523,039 811,545,833
UNITED STATES iB- 57,715,503 70,283,184
AUSTRALIA iB+ 48,515,292 188,600,000
BERMUDA iB 46,594,083 61,553,230
CANADA iBB+ 46,304,579 61,735,351
UNITED $TATES iB 46,001,779

CO
NFID
ENTIA
L TREA
TMEN
T REQ
UESTED
BY
LEHM
AN
BR
OTH
ERS H
OLD
ING
S, INC
.
r m m >< ~ G) s 0 0 0 w 1\) 0'1
Top hedge Fund & Energy Trading Counterparty Exposures Exposures a~ of July 31, 2008; Excludes Money Lines/Money Funds
TOP 10 HEDGE FUND BY MPE
Client . . . .·· •· .
· • ... • : lndu~try .• ·•·· · : . ·:. ··. :. •<.·'. • .. : · .• ,:.
Rank Code Counterparty Name .. . Physical Jurisdiction · · 1 842091 CITADEL EQUITY FUND LTD. HEDGE FUND UNITED STATES 2 1118160 BREVAN HOWARD MASTER FUND LTD HEDGE FUND CAYMAN ISLANDS 3 1235775 D.E. SHAW OCULUS PORTFOLIOS LLC HEDGE FUND UNITED STATES 4 643081 CENTAURUS ALPHA MASTER FUND LIMITED HEDGE FUND CAYMAN ISLANDS 5 1928310 GOLDMAN SACHS INVESTMENT PARTNERS MASTER FUND LP HEDGE FUND UNITED STATES 6 610675 CQS CONVERTIBLE & QUANTITATIVE STRATEGIES MASTER FUND HEDGE FUND CAYMAN ISLANDS 7 28536 QUANTUM PARTNERS LDC HEDGE FUND AUSTRALIA 8 88557 CITADEL TRADING GROUP LLC HEDGE FUND UNITED STATES 9 1086016 MOORE MACRO FUND LP HEDGE FUND UNITED STATES 10 1937643 GOLDMAN SACHS GSIP MASTER COMPANY (IRELAND) LIMITED HEDGE FUND IRELAND
--------
TOP 10 ENERGY EXPOSURES BY MPE
ICR
iBBB iBBB-iBBB-
iBB iBBB-iBBB-iBBB
iBB+ iBBB iBBB-
Client .. :· .. · .. ·.::::: :'. ..... . .· ........... ·· ... ·.· .. ,,, .· .... ."' .·. ;,";- --·:.> ",., .......
Rank Code Counterparty Name · · · Industry ·· · ·· .··.·•·•. · · .. .. Phy~i~FJ~riscliction> .. · .. ICR
1 1043721 TEXAS COMPETITIVE ELECTRIC HOLDINGS COMPANY LLC UTILITY-INVESTOR OWNED & IND UNITED STATES iB+ 2 16318 CHESAPEAKE ENERGY CORPORATION OIL/GAS COMPANY UNITED· STATES iBB+ 3 2032 CAL YON COMMERCIAL BANK FRANCE iAA 4 1751152 LINN ENERGY LLC OIL/GAS COMPANY UNITED· STATES iBB-5 1768315 CANADIAN NATURAL RESOURCES OIL/GAS COMPANY CANADA iBBB 6 1872338 CENTERPOINT ENERGY GAS TRANSMISSION COMPANY UTILITY-INVESTOR OWNED & IND UNITED STATES iBBB-7 1785867 TPF GENERATION HOLDINGS, LLC UTILITY-INVESTOR OWNED & IND UNITED STATES iB+ 8 10489 PACIFIC GAS AND ELECTRIC COMPANY DIVERSIFIED ENERGY COMPANY UNITED STATES iBBB+ 9 768 ANR PIPELINE COMPANY OIL/GAS COMPANY UNITED STATES iA 10 3192 CONTINENTAL AIRLINES INC AEROSPACE UNITED STATES iB
··- -- --------------- ----------------
: Current Credit .. ·Maximum Potential .· ... 'Exposure':·· · :Exposure · · ·
32,913,615 144,510,113
- 78,917,885
- 77,144,614
- 58,286,117
- 55,080,356
- 43,108,300
3,198,382 42,351,607
32,640,927 38,008,521
17,142,580 33,215,302
- 24,377,717
•: . Currant Cre.c:lit . .Maximum• Potential •: · .• ·Exposure : Exposure
158,243,251 842,574,456
104,523,039 811,545,833
10,709,242 683,153,848
187,017,155 651,470,439
271,501,039 356,201,878
43,248,903 191,342,395
19,723,875 188,570,482
35,599,744 169,395,556
7,211,652 128,071,230
46,001,779 ll:J,llU,U::>41

CO
NFID
ENTIA
L TREA
TMEN
T REQ
UESTED
BY
LEHM
AN
BR
OTH
ERS H
OLD
ING
S, INC
.
r m m >< ~ G) s 0 0 0 w 1\) en
/.-
Lehman Brothers Top Exposure Report Leveraged Debt- Syndication Risk
ehanges from July to August meetings (in millions USD)
COMMITMENTS
7/15/2008
New commitments SunGard Data Systems 100
Revised commitments
FX Changes (8)
Closed Deals Booz Allen Hamilton (453)
8/7/2008
(-
940
100
I
~
(453)1
579 I
,.--
FUNDED
7/15/2008 3,672
Closed Deals Booz Allen Hamilton 453
453 Changes I Booz Allen Hamilton (453)
Applebee's/IHOP (159)
I CDW Corp (118)
First Data Corp (107)
Home Depot Supply (93) TXU (69) McJunkin Corp (25) HMR Group (25) Fairpoint Communications 10
Hawaiian Telecom 3 FX Changes ~21 ~
I (1 ,057) Syndication Closed McJunkin Corp (75) COW Corp ~40~
(115)
8/7/2008 2,953
' r·

CO
NFID
ENTIA
L TREA
TMEN
T REQ
UESTED
BY
LEHM
AN
BR
OTH
ERS H
OLD
ING
S, INC
.
r m m >< ~ G) s 0 0 0 w 1\) ......
Lehman Brothers Top Exposure Report Leveraged Debt - Syndication Risk
ehangM from July to August meetings (in millions USD)
COMMITMENTS Comean~ Name Commitment
Converteam Group SAS 311 Bonten Media Group 168 SunGard Data Systems 100 TOTAL 579
FUNDED
Comean~ Name Funded
Applebee's /I HOP 585 Houghton Mifflin Riverdeep Group 375 Hawaiian Telecom Yellow Pages 309 Debitel Group 291 lcopal NS 269 First Data Corporation 150 Home Depot Supply 139 ARINC 217 Sisal 211 FairPoint Communications 153 Endemol Holdings 112 TXU Corp 46 Targa Resources 96 TOTAL 2,953
Bank Bond
212 99 168 -30 70
410 169
Bank Bond
- 585 375 -309 291 -185 84
71 -57 82
217 -166 45 153 -47 65 46 -
- 96 1,917 957
(
Egui!l Lead Seonsor Lead Bank Re£!ion
- Barclays LB Europe - Diamond Castle LB us - us
Egui!l Lead Seonsor Lead Bank Region
- LB us - HMR CSFB/LB/CITI us - Welsh Carson LB us - Permira LB, JPM EUR - lnvestcorp LB/1 NG/Mizuho EUR
79 KKR CITI/CSFB us - Bain/Carlyle/CDR MLJJPM/LB us - Carlyle LB us - Apax, Permira LB/ABN/RBS EUR - LB/BofA us
GSCP GS EUR - KKR CITI/JPM/GS/MS us - Warburg CSFB/DB l,JS
79

CONFIDENTIAL TREATMENT REQUESTED BYLEHMAN BROTHERS HOLDINGS, INC.
LBEX-WGM 000328

CONFIDENTIAL TREATMENT REQUESTED BYLEHMAN BROTHERS HOLDINGS, INC.
LBEX-WGM 000329

CO
NFID
ENTIA
L TREA
TMEN
T REQ
UESTED
BY
LEHM
AN
BR
OTH
ERS H
OLD
ING
S, INC
.
r m m >< ~ G) s 0 0 0 w w 0
/~
CSE QUARTERLY REVIE"!
Significant Transactions
IBD BUSINESS RESULTS
PRICE VERIFICATION REVIEW
LIQUlDITY & FUNDING REVIEW Liquidity Stress Scenario Bank Business Plans
July 16, 2008 Ended Mav 31 ~ 2008
G. Fox
L. Latessa
G Reiliy C. Bernard/ N. Chopra
P. Tonucci I R. Azerad
LEHMAN BROTHERS
9:30 - 9:45
9:45- 10:00
10:00 - 11:30
II :30 - II :45
11:45- 1:15
/""'\

CO
NFID
ENTIA
L TREA
TMEN
T REQ
UESTED
BY
LEHM
AN
BR
OTH
ERS H
OLD
ING
S, INC
.
r m m >< ~ G) s 0 0 0 w w ....Jo.
....... :--. ' .r / ..
(
~~ (~~. Confiri )atial
LEHMAN BROTHERS July 16, 2008
I,
Presentation to the Federal Reserve & SEC Business P·lan For Lehman Bank Entities
Confidential Presentation .

CO
NFID
ENTIA
L TREA
TMEN
T REQ
UESTED
BY
LEHM
AN
BR
OTH
ERS H
OLD
ING
S, INC
.
r m m >< ~ G) s 0 0 0 w w 1\)
Confidential ;'
· : .. Overview · ..
.'1 ; : . : : . ~
• Lehman Brothers owns:three bank entities funding $48 billion of assets as of the end''of·June 2008 . .
- Lehman Brothers Bank, a OTS-regulated Delaware-based thrift (LBB) ·
- Lehman Brothers Commercial Bank, a FDIC-regulated Utah-based industrial bank{LBCB) . . .
. . , I" Lehman Brothers Bankhaus, a BaFin-regulated German-based bank (LBBAG) ·-;.
~~·/k;}f ''l-'·
· + .. Banks provide five ben~:fits to Lehman Brothers
, · --7/ Diversification benefits by accessirig,savings pools (retail investors in the U.S., larg~ companies and government ·:.-:>
. · ..
organizations in Europe), which typically do not buy other Lehman debt products .. ·
- Access to the Fedenil Reserve discount window for LBB and LBCB and, more importantly, to the ECB and Bundesbank lending facilities for LBBAG.
- Access to FHLB advances against mortgage products for LBB and LBCB
- Reliability benefits also as a result of the insurance protection: bank deposits have proven to be extremely sticky historically
- Funding cost benefits as a result of the insurance protection offered to bank depositors by the FDIC in the U.S. and the GDPF in Germany in return for a conservative regulatory framework
+ Banks complement each other
- LBB primarily funds U.S. residential and commercial whole loans
- LBCB primarily funds U.S. corporate loans
- LBBAG primarily funds a wide range of European fixed income assets: mortgages, loans and customer collateral
l _)MAN BROTHERS -·-'
-· -.... , __
..... ~~~
... i j

CO
NFID
ENTIA
L TREA
TMEN
T REQ
UESTED
BY
LEHM
AN
BR
OTH
ERS H
OLD
ING
S, INC
.
r m m >< ~ G) s 0 0 0 w w w
r~·, • /',,C-,
i -.~ Confid/-.·~tial
Rapid Growth In Assets I + As of the end of June 2008, $48 billion of assets were funded at our bank entities -: up 1 7 billion since the end of
2006. Growth has been driven by LBBAG, up 180% over this time period. LBB balance sheet has been declining as a result of the closing of our U.S. mortgage origination platform. LBCB after growing rapidly in 2005-2007 has seen its growth constrained by its de novo restrictions, which are due to expire on August 24, 2008.
a LHBAG
D LHB
• LBCB
u
II
8: 9
2001 2002
LEHMAN BROTHERS
16
10
2003
Bank Entities Total Assets($ Billion)
-J6
-'4 -'-'
31
25
22
18 17
16 11 14 11
17
200-J 2005 2006 2007 Ql '08 Q2 '08 June '08
2

CO
NFID
ENTIA
L TREA
TMEN
T REQ
UESTED
BY
LEHM
AN
BR
OTH
ERS H
OLD
ING
S, INC
.
r m m >< ~ G) s 0 0 0 w w ~
Confidential
Business Plan For Bank Entities
+ Business plan for bank entities is to grow LBBAG and LBCB over the next 2-4 years to -$100 billion of assets, i.e.:
- Corporate loans
- Commercial and residential whole loans I,
- Margin loans
- Derivatives
+ This would reduce our cash capital usage by -33% from -$150 billion to -$100 billion, reducing our reliance on the unsecured debt market and strengthening our overall liquidity position
+ We are applying for a Regulation 23A exemption in order to accelerate this business plan.
- Lack of loan origination in the current market environment makes it difficult to grow LBCB as rapidly as we want
+ Additionally, LBBAG is the gateway through which LBIE, Lehman's European broker dealer, can access the tender auction facilities of the f:uropean Central Bank, thereby diversifying LBIE's funding ~()urces and reducing its· liquidity risk ·
- $13 billion of collateral funded today through the ECB
I ~MAN BROTHERS ~\ ,,
·' -~.--~·
I

CONFIDENTIAL TREATMENT REQUESTED BYLEHMAN BROTHERS HOLDINGS, INC.
--- / ( ,_.
(? )._
{ !( . \.~.·
-
~ c: ~
[Q -~· ·-(.) '-(1)
E E 0
(.) t/) '-CD .c +"' 0 '-
[Q
c: ~
E .c (1)
..J
LBEX-WGM 000335

CO
NFID
ENTIA
L TREA
TMEN
T REQ
UESTED
BY
LEHM
AN
BR
OTH
ERS H
OLD
ING
S, INC
.
r m m >< ~ G) s 0 0 0 w w en
Confidential
Overview
+ Excluding the possible impact of the Regulation 23A, LBCB is projected to grow assets, primarily loans, from $6.5 billion at the end of June 2008 to $9.1 billion at the end of November 2009
- Growth in assets severely constrained by subdued pace of loan origination \j'Olume
+ Growth in assets will be funded by term certificates of deposit and increase in equity
+ ROE is projected to remain stable at around 9.4%
+ Risk-based capital ratios are targeted to remain strong
- Tier 1 capital ratio of 1 0-11%
Tier 1 leverage ratio of 14%
- Risk based capital ratio of 10-11%
1- ·:MAN BROTHERS ;~_i
···:\
/ I ' •.,
I

CO
NFID
ENTIA
L TREA
TMEN
T REQ
UESTED
BY
LEHM
AN
BR
OTH
ERS H
OLD
ING
S, INC
.
r m m >< ~ G) s 0 0 0 w w .......
~- .. . ( l • I -
r·"~ i,_
-~ Confid'' ·ltial
Asset Funding in LBCB + LBCB is a Utah chartered Industrial Bank that opened in August, 2005 and is subject to all banking rules and
regulations of commercial banks. Regulated by the FDIC and the State of Utah
+ In the US, LBCB is a preferred Lehman funding entity for commercial products:
- US & European Corporate & Leveraged Loans 1 ·
- Commercial Real Estate Mortgages (US and UK)
--· Interest Rate Derivatives (US)
+ As a regulated entity LBCB is subjec:t to certain constraints .. _
The Loan To One Borrower (L TOB) limit: . ~ .. '
• Currently $150 million or equivalent
• The L TOB is dependent on the current equity base (equivalent to 15% thereof).
• Subject to borrower aggregation; -the ultimate parent company may be considered one borrower depending on circumstances of other borrowing
- Regulation 23A and 23B- Transactions with affiliates. LBCB is unable to finance loans where Lehman exercises or has the right to exercise management control over an entity and can not loan to any Lehman affiliate except LBB, FSB (sister-bank exemption)
- Credit Risk- The LBCB Board has developed a comprehensive credit risk strategy:
• Limits relating to industrial and regional sectors, facility types, maturity profile and credit quaility
• Certain financial ratios must be met
• Detailed portfolio reporting to the Board
LEHMAN BROTHERS 5
I

CO
NFID
ENTIA
L TREA
TMEN
T REQ
UESTED
BY
LEHM
AN
BR
OTH
ERS H
OLD
ING
S, INC
.
Confidential
2009 Business Plan I
''.'" ':"• : ,.,.. '' ;_ "'' •· ~r. '"·'':";::·~··.f:c :· ">-:c· ... • • ",· :~: ., :'"· ·~-· • • , ... _,, .• ., -·. · • • •• ,._ . • .,. ..... -~··· •• '"\· • -,.· - ,., ;: , •.•..•. , •• · .• • , . "::•" •.··· ~-·. ,.·.· ~--·~-, .,, ••. , :• • .., .• , •.•• : • -~ -~. . ,.". _.,_ •. _ ~c· '""'~· ·:. . .. , • , .. ·, ,. •. ··!;-> •- t··:~· ~ .··:· :• · ~")'.·~
Balance Sheet
1st Qtr 2nd Qtr 3nl Qtr 4th Qtr
Asseh
Ca-.h ' I nn::;tnh.:nts 2,126.712 2.151,712 2,176.712 2.201.712 CR!\ lnvc!'.tments 29,149 35.399 I, ~1.649 ~7.899
Othcr I nvcstml..'nt.s 50.QOO 50,000 50,000 50.000 Loan Recei,;ahles 4,681,876 5,131,879 5,581,881 6,031,8H-l IRP l'vlTM Rl..'ccivablc 633,294 633.294 633,294 633.294 Furniture. l:ixturcs & F4uip 331 331 331 331 MlM on unfuntkd wmmiuncms 15,284 15.284 15,284 15.21)4 Other Assets 148.209 153,209 158.209 163.209
Tutal Assets 7,684,854 8,171,107 8,657,359 9,143,612
Liithilities & Equity
Total Deposit~ 5,542,099 6,200,699 6,859,178 7,517.266 Tlllal Other Uornmcd Funds 648.996 448,996 .248.996 -IS. 996 Master Fon\ ard Agr~cmc111 43,233
4, .,,, J,_JJ 43,233 43.233
IRP rv1 1'1\·1 Payahl~ 2.073 2,073 2.073 2.073 MTrvt on unli.1nJcd commitments 282,028 282.028 282.028 282.028 Other l.iahilitie!'. I 11.6-14 114,144 I 16.6-14 119.1-14
Total Liabilities 6,630,072 7,091,173 7,552,152 8,012,739 Common StLlCk 100 100 100 100· Add'l l\1id In Capital 817.126 817,126 817.126 817,126 Othl..'r Comprehcnsiv~ Income (47) (47) (47) (-17)
RctaineJ Larnings 237.603 262,755 288.028 313.694 Total Equity 1,054,782 1,079,934 1.105,208 1,130,873
r Total Liahilitit.•s & Equit~ 7,684,854 8,171, I 07 8;657,359 9,143,612 m Off tlalance Sheet Items m >< l JnfunLkd Commitments 1 · I Yr) 1,729.501 1.754,501 1.779.501 l.l!0-1 . .50 I I
:E l!nt'untkJ Commitm~nl::. ( ·I Yr ) 6.245,894 6,745.S94 7,2-15.894 7.745.894 G) Leucr~ llr Credit 315.166 350,166 385.166 420.166 s Tntalllnfunded Commitments 8,290,560 8,850,560 9,410,560 9,970,560 0 0 0 w w co 1 JMAN---nROTHERS
.,,,..
·) ) -· ·' .._:,;
··---

CO
NFID
ENTIA
L TREA
TMEN
T REQ
UESTED
BY
LEHM
AN
BR
OTH
ERS H
OLD
ING
S, INC
.
r m m >< I
:E G) s 0 0 0 w w CD
------
Financial Ratios Lehman Br·others Commerchtl Bank 1U09 Key Financial Ratios
R.:turn Llll Equity
ROl\ (N.:tlncom.:.AAJ
N.:t Yidd Llll Earning A~s.:ts
Tier I lc\ .:rag.: ratio
I icr I ri~k-ba~.:d capital n\1 iLl
Tuwl RBC ratio
l'i.:r I Capital
l'iL·r I and li.:r::?. Ltpital
R i~h. \\ .:ight.:d A~~cb (!:st.)
A vcrag.: Total l::quity
A n:rag.: Assds
A v.:rag.: Interest Eaming As:-..:ts
LEHMAN BROTHERS
lst Qtr
9.46%
1.33%
2.09%
14.17%
11.74%
11.74%
I ,054,829
1,055, I 02
8.983,547
1.042,449
7.441,728
7.280.405
0') '' . (~.) .
Conf1d. 't1al
I 2nd Qtr 3rd Qtr 4th Qtr Average
9.44% 9.38% 9.33% 9.40% I,
1.30% 1.26% 1.23% 1.2H%
2.04% 1.98% 1.93~/o 2.02%
14.05% 13.94% 13.84% 13.91.)0/o
11.10% 10.55% 10.08% 11.061!1 t)
11.10% 10.55% I 0.08~1~ 11.07%
1.079,981 1.105,255 1.13'0.920 l,OS4.322
1,080.254 1.105,528 l,l3l.l93 I.08-L322
9.729.549 10.475.552 I 1.221.554 9.853.883
1.054,944 1,067,510 I ,080.182 I ,U58,5~W
7.684,854 7,927.981 S,l7Ll07 7.754.415
7,521.031 7,761,658: 8,002.284 7.589.877
7

CONFIDENTIAL TREATMENT REQUESTED BYLEHMAN BROTHERS HOLDINGS, INC.
~ c: r - ..
ca ( al tJ) .... Q) .t: ...... 0 .... al c: ca E .t: - Q) ..J
/, ·~ ..
LBEX-WGM 000340

CO
NFID
ENTIA
L TREA
TMEN
T REQ
UESTED
BY
LEHM
AN
BR
OTH
ERS H
OLD
ING
S, INC
.
r m m >< ~ G) s 0 0 0 w ~ ...,J,
0 ( \
.. ,--.. i_.r-c·, ',
.~.\ '-~
Confit atial
Overview + Capital ratios continue to remain very strong. As of May 2008,
- Tier 1 capital ratio of 13.8%
- Tier 1 leverage ratio of 12.4%
- Risk based capital ratio of 15.0%
+ Liquidity and access to funding markets continue to remain strong
I,
+ During 2007 and 2008 market dislocation contributed to reduction in balance sheet and business closures
+ Actions taken:
- Closure of sub prime origination platform (BNC Mortgage)
- Suspension of Aurora Loan Services correspondent and broker originations
- Closure of small business commercial origination platform (SBF)
+ Contemplated changes:
- Sale of distressed commercial1oan lending platform (Capital Crossing)
- Sale of student loan origination platform (Campus Door)
+ Balance sheet projected to contract from $10.5 billion in June to $9.7 billion in November due to declines in loan assets and reduction in its large liquidity position as CDs mature
- Non-performing assets have declined significantly (reduction of over $1 billion during 2008)
- $1.8 billion cash and short-term investments
- $2.7 bi!Jion borrowing capacity at the FHLB
LEHMAN BROTHERS 8
••

CO
NFID
ENTIA
L TREA
TMEN
T REQ
UESTED
BY
LEHM
AN
BR
OTH
ERS H
OLD
ING
S, INC
.
r m m >< ~ G) s 0 0 0 w ~ 1\)
Confidential
Busin:ess Structure I
Lehman Brothers Bank operates across diverse asset classes
! '
,·::;
Stu.deQt ~nding ..... :.:_)'
. -~:-J~· .·.:~· .. :: .· ~~:-.~:£~\~, '.: .. :·;~-~;i~~]~:~,;i~·~~:i;~~~-.:;~--~{;h;i.;~~-.. ~:;;:5· ~~~~~~~ti~~;~~' ~:~~"~:,~~~:;,:,.,,"··
Lehman Brothers Bank, FSB
r t•'<''
Residential Murtgage Lending.. ., '· • • ••• ..-J •
. . -. -~.:~(·~i··" :·---~{~:: ~~j~"'~:-i'-\::. :.~:-.-~~~ ·.' ;:~~i:~ ~i-i-~: -<:~~-~~: ~~-;i,.- ~-~-~;:
·-:: ;'; .--~ ~-: ~~
'"'···· .~:Z\~1~a~1~d£~::1~~:~~!~;:,;,_Jj .·L~:;\~~~L~~ill~~r~~~:;~:~:~.,.~, .. ; .... ,.
l MAN BROTHERS / ·-.. ~-

CO
NFID
ENTIA
L TREA
TMEN
T REQ
UESTED
BY
LEHM
AN
BR
OTH
ERS H
OLD
ING
S, INC
.
r m m >< ~ G) s 0 0 0 w ~ w
_ . .,..,...-.... .. ( _)_ ,0] /·'····· .. ( Confid '~tial
Business Lines • Residential Mortgage Lending .
Purchased loans are maintained on balance sheet until sale/securitization
Continue small Tetail origination presence (agency eligible)
Geographic coverage is throughout the United Sates, with concentrations primarily in the East and West Coasts
I'
+ Commercial Mortgage Lending
Loans are maintained on balance sheet until sale/securitization.
Loans are typically collateralized by multi-purpose real estate and are low LTV
+ Commercial Lending
·- The. Bank will provide commitments and act as a lender to high-grade corporate borrowers
Loans can be both secured (may be in the form of rev repos) and unsecured with maturities ranging from 364 days to 5 years
• Student Lending
The Bank, through Campus Door, continues to offer student loans
+ Servicing & Master Servicing
- Through Aurora Loan Services, the Bank acts as servicer and master servicer of residential mortgage loans
- Continue servicing small balance commercial loans through SBF
+ Banking Services
The Bank operates 2 full service retail branches located in Wilmington, Delaware and Jersey City, New Jersey
Branches are utilized by various Lehman affiliates to provide required commercial banking services
LEHMAN BROTHERS 10
I

CO
NFID
ENTIA
L TREA
TMEN
T REQ
UESTED
BY
LEHM
AN
BR
OTH
ERS H
OLD
ING
S, INC
.
r m m >< ~ G) s 0 0 0 w ~ ~
Confidential
Balance Sheet & Capital Ratios
($ in millions) Assets:
Residential Mortgage Loans Commercial Mortgages Corporate Loans Agency Securities Student Loans Cash and Short Term Investments FHLB Stock Other Assets
Total Assets·
Liabilities & Equity:
Ratios
Brokered CO's Retail Deposits Short Term Borrowings Subdebt Other Liabilities
Total Liabilities
Common Stock and PIC Retained Earnings
Stockholders Equity
Total Liabilities and Equity
Tier 1 Capital Ratio Tier 1 Risk Capital Ratio Risk Based Capital Ratio
I ~MAN BROTHERS ·~--~ ...... ·
I
I Actual I Foree~--- I Nov '07 Feb '08 May '08 Aug '08 Nov '08
6,990 2,918
657
313 3,998
67 1,490
16,433
11,075 1,634
209 300
1,085 14,303
599 1,530 2,136
16,433
11.6% 12.8% 14.6%
., . 1
5,045 2,492
685 1,449
410 2,057
52 1,703
13,893
8,857 1,900
192 300 755
12,004
599 1,290 1,889
13,893
12.2% 12.3% 14.5%
I'
3,147 2,195
731 706 430
1,449 41
2,244 10,943
6,433 1,496
265 300 750
9,244
599 1,100 1,699
10,943
13.8% 12.4% 15.0%
3,014 2,135
586 677 508 956
41 1.836 9,753
5.950 1,411
300 972
8,633
599 520
1,119
9,753
9.4% 8.5%
11.3%
~~ ..
2,834 2,135
586 677 679
1.043 41
1.836 9,831
5.990 1.411
300 972
8,674
599 558
1,157
9,831
9.7% 8.7%
11.6%

CONFIDENTIAL TREATMENT REQUESTED BYLEHMAN BROTHERS HOLDINGS, INC.
LBEX-WGM 000345

CO
NFID
ENTIA
L TREA
TMEN
T REQ
UESTED
BY
LEHM
AN
BR
OTH
ERS H
OLD
ING
S, INC
.
r m m >< ~ G) s 0 0 0 w ~ en
Confidential
Overview I
+ Lehman Brothers Bankhaus AG (LBBAG), founded in 1989, is a wholly owned subsidiary of Lehman Brothers Holdings Inc (LBHI). Headquartered in Frankfurt it has branches in London, Milan and Seoul
+ LBBAG a licensed Commercial Bank incorporated under the German Stock Corporation Act and regulated by the German Federal Regulator, the BaFin.
+ Bankhaus also benefits from:
- Participation in the German Depositors Protection Fund (GDPF), which insures deposits from nonbank customers
- Ability to access ECB' s Open Market Operations & Standing Liquidity Facility
- Access to the European 3 year $2.5bn committed facility
+ As result of the its banking license and it GDPF participation, Bankhaus and its lenders are insulated from a Lehman-specific or market liquidity event, thereby:
Increasing Lehman's funding diversification
- Providing a reliable funding source the Firm's less liquid. assets
1 \MAN BROTHERS ·. 1 .· /

CO
NFID
ENTIA
L TREA
TMEN
T REQ
UESTED
BY
LEHM
AN
BR
OTH
ERS H
OLD
ING
S, INC
.
r m m >< ~ G) s 0 0 0 w ~ ......
~ .. r--. />·--._ p)
Confid(~tial
Asset Funding in Bankhaus • Along with the US Bank entities Bankhaus is a preferred funding entity for loans:
- US & European Corporate & Leveraged Loans -- Commercial Real Estate Mortgages -- European Residential Mortgages
+ Bankhaus also provides funding flexibility for securities in the Firm's Broker-De~lers and other affiliates, by entering into reverse repos. These include: - Equities - Fixed Income Securities, both investment grade and non-investment grade:
• Convertible Bonds • Corporate Bonds • ABS, including CDOs, RMBS & CMBS
• As a regulated entity LBBAG is subject to certain constraints - The Loan To One Borrower (LTOB) limit:
• Currently $400 million or equivalent • The L TOB is dependent on the current equity base (equivalent to 25% thereof). • Subject to borrower aggregation; -the ultimate parent company is considered one borrower, and may not use
different vehicles to obtain multiple LTOBs • Any lending over the L TOB must be cash collateralised Borrower control - LBBAG is unable to finance loans where Lehman exercises or has the right to exercise management control. There are therefore limits to the amount of equity Lehman may hold in the borrower: Credit Risk- The Bankhaus Managing Board has developed a comprehensive credit risk strategy: • Addresses concentration issues and limits relating to industrial and regional sectors, facility types, maturity
profile and credit quaility • Internal Credit Limits - loans rated BB- or worse are subject to a cash collateralised loan loss provision at
LEHMAN BROTHERS 13
I

CO
NFID
ENTIA
L TREA
TMEN
T REQ
UESTED
BY
LEHM
AN
BR
OTH
ERS H
OLD
ING
S, INC
.
r m m >< ~ G) s 0 0 0 w ~ co
Confidential
Sources of Bankhaus Funding + Majority of external Bankhaus funding is comprised of:
- Long term debt:
• Primarily in the form of Schuldschein (German promisory note)
• Issued up to forty years (average term 9 years)
• Vanilla and strucutered (Equity, Credit, Interest Rate Linked)1.
• Customers include large insurance and pension firms
• EMTNs and structured notes are issued on a reverse inquiry basis at levels inside comparible LBHI notes
• Access to the European $2.5 billion 3 year committed facility
- GDPF protected deposits :
• The GDPF provides depositor protection for all non-banks up to 30% of the Bankhaus capital base.
• Current protection is EUR 285 million (-$440 million) per depositor
- ECB open market operations borrowings .
- Weekly main refinancing operations
- Long-term refinancing operations (3 month & 6 month)
+ Lehman Brothers equity and subdebt investments
- $1.2 billion of equity
- $0.5 billion of subdebt
. iMAN BROTHERS ,_j
'\4 I
.•••• >'
I

CO
NFID
ENTIA
L TREA
TMEN
T REQ
UESTED
BY
LEHM
AN
BR
OTH
ERS H
OLD
ING
S, INC
.
r m m >< ~ G) s 0 0 0 w ~ CD
~ ~
!(,--·~
I
-~. I~ Confid '•tial
Extension. of Term Funding I
In the first half of 2007 we increased both the proportion of long-term debt to short-term debt and the average tenor of Focus was to increase L TO and ~term STD
STD ($Millions) LTD a!nd Equity($ Millions)
I'
in days in USDmm in years in l S Dmm
150 7,500 II ---- 7,500 7,2111
7,002 7,000 II
7,000 138 L·-~ ,.· -~:.~ •• -~--~ \ :_,,.
145
~;:~~,?~;i;i~t~i 140 ~-=~ .. ·.
A 10
6,500 •. ~ .. , 6,500
1;1 £..1\.11
135
1311 10
6,000 ~~t~~~tt}jf~~t~;~~~'~ ~~~1ft1~~~~~: 6,11110 5,649 5,570
9 125
5,500 ....• , .. _,. ~~~filii ~-~~ 5,500 ~·;·~r -· .. ;. ,<!~-;~~ ~~i~fi~( . : .. $ .: : __ .·: .- ·l~ i~n~
~··;· ·!ifur! •.• '"'~ >· ,,.,; .•.. ~.::if\ _____ 1211 9
5,000 ;is;~~ ~~!H~ ~~~£W;~~ 5,000 .~ ~~ (~t .... ~~- If' ·~~1~i1 •
115
8 I Ill
4,500 8 t~ !\~U:<7f~ ~~! 4500
1115
lUll 4,000 7 Ill ,.,._ 1ftj&W)ii, ·UIOII FYII7 Ql 08 Q2 08 F\-'07 Ql 08 Q2 08
AAliitt: STI> -+-Tenor ~LTD -+-LTDTenur
LEHMAN BROTHERS 15

CO
NFID
ENTIA
L TREA
TMEN
T REQ
UESTED
BY
LEHM
AN
BR
OTH
ERS H
OLD
ING
S, INC
.
r m m >< ~ G) s 0 0 0 w 0'1 0
Bankhaus Cash Capital We monitor cash capital in the Bank in the same way as the Holding Company.
SOli RCES (Liabilities and Equity) DEPOSITS - GDJ>F covered
-Segregated Deposits (LBF. etc.)
-Segregated Deposits (LBJE)
- non GDPF covered Deposits
CAPITAL
-Schuldscheine
-Subordinated Debt
-Ec.tuity and Reserves
<:ash <..-ollateral (I)
Facility tJsage
ECB Tender
Bac:k-to-back str11ctures
Other Payubles
TOTAL SOURCES
USES (Assets)
LOANS
- Residential Warehouse Loans
- Real Estate Loans
- Corpo.-ate Loans
- sub-panicipated LoR
REVERSE KEPOS
- Cash Capital Intensive Securities & MBS
-Liquid Investments (2)
- Quan1u1n PonfOlio
- ECB REVERSE REPO
-Back-to-back structures
Cash al Banks
TOTAL USES
l'\lct Excess Sou.li-ces Over Uses
- Pre-Fundings
Cash Capital Surplus (Shortf"all) af"ter pref"undings
-Add back:
Potential Surplus/(Shortf"all)
)iMAN BROTHERS 16
30-May-08
Balance Sheet
7,519 5.840
1.042
637
7,0.38
5.314
561
1.163
2,15.J
9,658
2,0.J4
... 6
28,548
6,000
2.348
3.651
22,548
4.343
6.263
250
9.658
2.034
28,548
Cash Capital
I,
6,6-19 4.672
977
1,000
7 .. 002
5.278
561
1.163
2,15.J
2,500
18,.}04
6.300
2.348
3.651
300
4,.J4.J
4.343
10,643
7,662
645
7,017
7,017
Confidential
I

CO
NFID
ENTIA
L TREA
TMEN
T REQ
UESTED
BY
LEHM
AN
BR
OTH
ERS H
OLD
ING
S, INC
.
r m m >< I
:E G) s 0 0 0 w 0'1 ....Jo.
- ,.,.---... /
c::--. ?"~,1
Projected Asset Growth Through 200·9 + Areas for focused growth include:
Reverse repo • ECB eligible securities growing to $18bn in 2008 and to $2lbn in 2009 • Securities across the quality spectrum to provide flexibility to Broker-Dealers
- Loans with focus on expanding portfolio to include:
• Seller Financed SPVs • Asia loans
I'
all 1111111bers 111 $bn 30-May-08 30-Nov-08 30-May-09
Balance Cash Balance Cash Balance Cash
~ Capital ~ Capital ~ Capital
liSES
1.0.-\NS 6,000 6,000 7,000 7,000 7,500 7,500 - Residential Warehouse Loans - Real Estate Loans 2,348 2,348 3,500 3,500 3,750 3,750 -Corporate Loans 3.651 3,651 3,500 3,500 3,750 3,750
KE\'EKSE REPOS 10,856 4,343 10,510 5,000 11,01'0 5,500 -non lnv Grade Securities 4,343 4,343 5,000 5,000 5,500 5,500 - lnv Grade Securities 6,263 - 5,510 - 5,510 --Quantum Portfolio 250
E('8 Tender 9,658 - 15,000 - 18,000 -
Back-to-Rack Structures 2,034 - 1,500 1,500 -
TOTAL USIES 28,548 10,343 34,01() 12,000 38,010 13,000
LEHMAN BROTHERS 17
:'~ Confic' ...... \atial
I
30-Nov-09
Balance Cash Sheet Capital
8,000 8,000
4,000 4.000 4,000 4,000
ll,260 5.500 5,500 5,500 5.760
21,000
1,500
41,760 13,500

CO
NFID
ENTIA
L TREA
TMEN
T REQ
UESTED
BY
LEHM
AN
BR
OTH
ERS H
OLD
ING
S, INC
.
Confidential
Projecte_d_Liability Growth Through 2009 I
· • LTD growth to $7bn in 2008 and $1 Obn in 2009
• ECB borrowings $18bn in 2008 and to-$21 bn in 2009
I'

CO
NFID
ENTIA
L TREA
TMEN
T REQ
UESTED
BY
LEHM
AN
BR
OTH
ERS H
OLD
ING
S, INC
.
r m m >< ~ G) s 0 0 0 w 0'1 w
.. "fflo • ....-->~-·· ......... ( \
ECB open market operations
0; ,0 Conti~ .atial
I + The open market operations are available to Eurozone banks only. LBBAG as a German bank grants Lehman
Brothers access to these products and provides information, pricing and settlement services.
+ Key ECB criteria for collateral include:
- Type of asset must be a marketable debt instruments
-- The collateral must be EUR denominated
- Issued within the EEA (European Economic Area)
- Rating must be single A or better
- Asset-backed securities must be a senior tranche
+ Collateral Bankhaus financed:
- CMBS
- RMBS
- CLO
LEHMAN BROTHERS
I'
19

CO
NFID
ENTIA
L TREA
TMEN
T REQ
UESTED
BY
LEHM
AN
BR
OTH
ERS H
OLD
ING
S, INC
.
r m m >< ~ G) s 0 0 0 w 0'1 ~
,., .. Confidential
Lehman's utilization of ECB Funding
+ The ECB offers three types reverse repo facilities in conducting it open market operations
Main Refinancing Operations (MRO), liquidity providing 7 days term, auctioned weekly
- Longer-Term Refinancing Operations (LTRO), liquidity providing 3 months term, auctioned monthly
- Irregular tender to provide I absorb liquidity for other than the regular aucd~n dates
+ Tender auction
- All bi,ds at the highest bid rate gets allotted, followed by the second highest bid rate until the liquidity which the ECB planned for this tender "is completely allotted.
·Pricing
- 1 week tender Libor+ 1 0
-- 3 months tender Libor-10 to Libor-20
I 1MAN BROTHERS ;o ,'
I

CONFIDENTIAL TREATMENT REQUESTED BYLEHMAN BROTHERS HOLDINGS, INC.
( ,, ' ' '-.[
~
'
f/) Q) 0 ·-"'C c Q) a. a. <(
LBEX-WGM 000355

CO
NFID
ENTIA
L TREA
TMEN
T REQ
UESTED
BY
LEHM
AN
BR
OTH
ERS H
OLD
ING
S, INC
.
r m m >< ~ G) s 0 0 0 w 0'1 en
"' ... "
Funding Lehman 2008 Q2 Assets ($ billions)
Accm.Dlt Name
Cash and Cash equivalents Cash and securities segregated
Government & Aj,\cncics
Commercial l'apcr & Other Money Mkt Instruments Physical Commodities
Mortgage and Asset-Backed Securities Conuncrcial Mortl,\<lges
Loan~
Securities
Total Commercial Mortgages Residential Mortgages
Loans Securities
Total Residential Mortgages Other Asset Backed Securities
FAS 140 Gross Up
Total Mortgage and Asset-Backed Securities
Real E~"tate Held For Sale Corporate Debt and Other
Loans Bonds
T oral Corporale Debt and Other
Corporate equities Listed Privale Equtiy
Corporate equities Derivatives and other contractual agreements
lnventOI)' Suh-tol:d
Securities purchased under agreemi:nts to resell Securities bormwed
Collalemlizcd !..endings Sub-total
Receivables Property. equipment and leao;chold improvements
Oti"K!r assets Identified intangible assets and goodwill
TOTAL ASSETS
I ~MAN BROTHERS
Balance Sheet
As of5/31/08 Repo Cash Capital
6.5 2.1 13.0 -27.0 4.4
4.8 3.4 1.3 0.5 0.5
19.9 4.5 4.8 9.5 5.4 3.4
29.4 9.9 8.2
16.6 1.2 4.3 8.3 3.1 2.0
24.9 4.3 6.3 6.5 2.9 0.5
111 - -72.5 17.1 15.0
20.7 10.4
31.9 - 23.3 17.5 2.2 14.5
49.5 2.2 37.8
39.9 17.3 20.4 7.600 - 6.8
47.5 17.3 27.2 47.0 - 20.5
;269.4 40.1 117.1
·169.7 122.0 1.0 124.8 - 2.5
'294.5 122.0 3.5
41.7 - 3.7 4.3 - 4.3 5.9 - 5.7 4.1 - 4.1
639.4 162.0 140.4
'·1
Confidential
Treasul)' Total Banks Investment Other Other Explanation
0.3 4.1 - - 13.0 Client Cash
2.8 19.8
I'
9.1 1.5 0.7
9.8 1.5
11.1 1.6 1.7
12.7 1.7 3.2
- - 11.7 F AS 140 Gross up
25.6 3.1 11.7
2.3 8.0 Non-recourse financing
7.7 1.0 0.9
8.5 1.0
1.9 0.3 0.8
2.7 0.3 0.6 - 25.9 Derivative Payables
42.5 24.2 45.5
- 16.3 30.4 f A..'i 140 Gross up
- - 122.3 Shorts Co\'cring
- 16.3 152.7
1.7 - 36.3 FLDldcd Y.1th payables 0.0 0.1
44.7 44.6 247.7

CO
NFID
ENTIA
L TREA
TMEN
T REQ
UESTED
BY
LEHM
AN
BR
OTH
ERS H
OLD
ING
S, INC
.
r m m >< ~ G) s 0 0 0 w 0'1 ......
.. . ,,....---., ,,~ :~\
Conti d. -· ~tial · c:,· LEHMAN BROTHERS July 16, 2008
I'
Presentation to·the Federal Reserve & SEC Stressed Liquidity Scenario
Confidential Presentation

CO
NFID
ENTIA
L TREA
TMEN
T REQ
UESTED
BY
LEHM
AN
BR
OTH
ERS H
OLD
ING
S, INC
.
r m m >< ~ G) s 0 0 0 w 0'1 co
Confidential . .
Overview Of Lehman's Funding FrameworK: I
+ Established in the aftermath ofthe liquidity event of 1998, the Lehman Brothers Fundi~g Framework is based on a set of conservative principles guiding the funding of assets and mitigating our liquidity risl\: It has been refined and . augmented over the years as Lehman enters new businesses and as the liquidity risk:of:existing businesses changes.·.
+ At its core are the following principles
Remain in a state of constant liquidity readiness I'
- . Do not rely on asset sales, increase in operational ·effectiveness or access to the uns~cured debt market ina time of CriSIS
. . . ...... :-•., :
- Be proactive withypl.lr k~ystakeh~lders before and during a liquidity event: regul~t9rs, creditors, trading . counterparts and ra~i~g ~gencies .· .· : ·• ·. :' .
. . . ~~- . '
•• It is structured around three dimensions :< : · ... '
- Liquidity pool to cover cash outflows over a 12 month horizon at the Holdings Company
- Cash capital to cover funding of illiquid assets as well as contingent liquidity risk
- Secured funding plan to mitigate the liquidity risk associated with short-term secured funding, including the prime broker business
+ In the aftermath of the near collapse of Bear Steams and our own experience the week of March 17, we have inade a series of adjustments in our secured funding plan
- Increased average tenor ofrepo book from 22 to 35 days during the quarter
- Increased overfunding/excess collateral borrowed from $15 billion to $27 billion during the quarter
- Grew Holdings' liquidity pool from $34 billion to $45 billion during the quarter
- Introduced a stress liquidity scenario focused on a substantial loss of our repo capacity
l · "·MAN BROTHERS I

CO
NFID
ENTIA
L TREA
TMEN
T REQ
UESTED
BY
LEHM
AN
BR
OTH
ERS H
OLD
ING
S, INC
.
r m m >< ~ G) s 0 0 0 w 0'1 CD
. ,----.. /:..,-.-<·'·, ,Q! (~
Confid :~tial
Role Of Stress Funding Scenarios In Funding Framework • Stress scenarios are an integral part of how we build funding frameworks
- Liquidity pool sized to sustain a severe liquidity event
• No unsecured debt issuance for 12 months
• Rating downgrade I'
• Draw on unfunded loan commitments
- Cash capital policy built around funding assets in a stressed liquidity environment
• Inventory is funded with cash capital by default. Exceptions are made only when there exists a secured funding market for an asset class that is deep and broad in all market environments
- Secured funding plan built around a loss of liquidity in secured funding markets
• Repo assets with counterparties that know Lehman Brothers and the assets well
• Build overfunding cushion to mitigate loss of secured funding
• We constantly refine the assumptions used in our Funding Framework
- In recent n1onths, we have built a scenario modeling a significant loss of secured funding incorporating the liquidity lessons of recent market events. We have refined this scenario many
times since mid-March
- Objective is to maintain a liquidity pool of at least $10 billion during the first month without selling assets supporting client franchise or reducing client funding
LEHMAN BROTHERS 2
I

CO
NFID
ENTIA
L TREA
TMEN
T REQ
UESTED
BY
LEHM
AN
BR
OTH
ERS H
OLD
ING
S, INC
.
r m m >< ~ G) s 0 0 0 w en 0
Confidential
Liquidity Stress Funding Scenario (II) -. · "Mitigants" + Offsetting these cash outflows are $73 billion of"liquidity risk mitigants," leaving Lehman with a $13 billion
liquidity pool after one month - First and foremost, liquidity pools at Holdings, broker dealers and Lehman Brothers Bankhaus ($51
billion) • $42 billion at Holdings; $4 billion in LBIE and $1 billion in LBI, our broker d~ers; $4 billion in
Bankhaus (excluding $3.5 billion of collateral that can be pledged to the ECB) • Because of the substantial loss of secured funding in this scenario, LBiand LBIE needs to borrow from
Holdings and good quality collateral previously funded with third parties becomes available for funding with Bankhaus. As a result, liquidity becomes fungible across these entities
Draw on our committed facilities ($4.5 billion) • We draw on our committed facilities 30-50% of the time in the normal course of business, thereby
removing any signaling effect that could be associated with a draw Term overfunding and excess collateral borrowed, which mitigates the loss of secured funding ($12 billion impact) • Term overfunding = Unused term repo capacity • Excess collateral borrowed= Repo funding that does not support Firm or client activities Additional funding through the ECB tender auction facilities ($5 billion) • ECB through its tender auction faciJities fund more than $700 billion of collateral for Euro-domiciled
banks • Lehman Brothers funds $11 billion of collateral through the ECB. Even with the additional $5 billion
funding envisaged in this scenario, we would still not be in the top 10 users of these facilities. - Unwind of matched book positions supporting proprietary positions ($1 billion impact)
+ The following have not been included as "liquidity risk mitigants" in this scenario Use of the Federal Reserve's PDCF or TSLF
- Reduction of balance sheet impacting client-facing activities - Reduction of prime broker client funding
l )MAN BROTHERS
I
$17 billion secured funding
"mitigant~

CO
NFID
ENTIA
L TREA
TMEN
T REQ
UESTED
BY
LEHM
AN
BR
OTH
ERS H
OLD
ING
S, INC
.
r m m >< ~ G) s 0 0 0 w en ....Jo.
·(p,~' .~ 0 Confid' tial
Liquidity Stress Scenario Assumptions Loss of Secured Funding
• Repos
Governments & Agencies
Corporates
High Grade High Yield
Asset Backs I Private Labels High Grade High Yield
Commercial Paper Repo
Muni
Equities I Convertibles El E2 I Cl E3 I C2
%Rolled 100%
70% 0%
40% 0%
70%
40%
70% 0% 0%
• Munis TOB - 7 day put exercised on day 1
%Lost 0%
30% 100%
60% 100%
30%
60%
30% 100% 100%
Customer collateral returned /liquidated over 1 week Firn1 collateral liquidated
+ Prime broker Free credit balances withdrawn on day 1
+ Dealer-based matched book Unwound to release haircut ($1.0 bn)
• Central banks No PDCF or TSLF Able to use ECB tender facility through Bankhaus, consistent with normal practice
LEHMAN BROTHERS 4
Loss; of Unsecured Funding
• Unsecured debt - CP and LCs: 0% roll at maturity - Buybacks: $1 billion per month - Deposits at US banking affiliates: 80% roll at maturity
• In practice, no1impact on liquidity (operate with significant ex,;ess liquidity)
- Ability to draw on committed facilities
• Loan funding - Per funding schedule for leveraged loans - $2 billion Of loan commitments drawn outside ofthe bank
entities
+ Derivatives - Cash collateralization on derivative payables per CSA
requested on day 1 (paid on day 2 per industry practice) Margin disputes against us paid on day 3 and 4 2 notch downgrade during second week
I
Note: The vast majority of the credit rating downgraderelated posting requirements come from derivative transactions with structured vehicles, which have a 30 day cure period, which gives us to assign or restructure the transactions, thereby avoiding the posting of additional collateral.
• Other - $0.5 billion every other week to cover operational cash
expenses (PE and NPE) - Sale of assets at pledge value with an additional 5%
writedown

CO
NFID
ENTIA
L TREA
TMEN
T REQ
UESTED
BY
LEHM
AN
BR
OTH
ERS H
OLD
ING
S, INC
.
r m m >< ~ G) s 0 0 0 w en 1\)
Confidential
Stress Scenario Assumptions Vs. Week Of March 17
+ The assumptions used in our liquidity stress scenarios are far more severe than what we experienced during the week of March 17.
l )MAN BROTHERS
Secured Funding
Governments & Agencies
Corporates High Grade High Yield
Asset Backs I Private Labels High Grade High Yield
Commercial Paper Repo
Munis Munis TOB Program
Equities/ Converts Major Index (El) Other Index (E2 I Cl) Non Major Index (E3 I C2) Collateral Upgrade (E 1)
Prime Broker Free Credit Balances
Unsecured Funding LEH Commercial Paper
LTD Buybacks ($Billions)
Derivatives
I'
Cash Collateralization per CSA
)
%Lost
Experienced During Week of
3/17
0%
0% 13%
7% 0%
lO%
0% 0%
14%
3%
30%
29%
0.11
-25%
Stress Scenario Shown In Today's
Presentation
0%
30% 100%
60% 100%
30%
60% 100%
30% 100% 100% 30%
100%
100%
1.0
100%
I

CO
NFID
ENTIA
L TREA
TMEN
T REQ
UESTED
BY
LEHM
AN
BR
OTH
ERS H
OLD
ING
S, INC
.
r m m >< ~ G) s 0 0 0 w en w
.~.
/''
Repo Book Analysis
A, 0 Confid' tial
+ As of June 25, our tri-party repo book amounted to $298 billion- $189 billion of Government and Agency securities; I $73 billion of liquid collateral (investment-grade fixed income securities and major index equities); $37 billion of less liquid collateral (high yield fixed income securities and non major index equities). the amount ofrepo funding "af
risk" (i.e., maturing within a month) was $69 billion- $48 billion in liquid collateral and $21 billion in less liquid
collateral.
Composition Of Lehman's Tri-Party Repo Book As of 6/25 $ Billions
350 1 I
i 298.3
300 i I
i
I 250 i
200 j i
I
150 ·i
i
I
100 I I
50 4 I
I
! o .L --· -
36.9
261.5
188.7
109.6
36.9
72.8
~l ~-
---
I,
Total r.:po book Govt+ Agency sec. Repo book excl. Govt+Agy sec.
Term funding>! month
0 Liquid Collateral 0 Less Liquid Collateral
LEHMAN BROTHERS 6
68.8
21.0
47.8
At Risk Funding

CO
NFID
ENTIA
L TREA
TMEN
T REQ
UESTED
BY
LEHM
AN
BR
OTH
ERS H
OLD
ING
S, INC
.
r m m >< ~ G) s 0 0 0 w en ~
Confidential
Loss Of Secured Funding I + Stress scenarios result in a $41 billion gross loss of secured funding over one month (i.e., 59% of secured funding
being lost, 100% for the less liquid collateral). Including "mitigants" (e.g., $12 billion due to overfunding, excess
collateral borrowed, $5 billion due to pledging eligible assets to the ECB (primarily $3.5 billion of which being Bankhaus' s "dry powder") and $1 billion ·due to the unwind of our proprietary matched book), the net loss of secured funding amounts to $23 billion. The liquidity pool available to the broker-dealers of $51 bn exceeds the net secured
I' funding loss by 221 o/o.
80
Loss Of Secured · l Funding 10 i $ Billions · 1
68.8
I 59% Gross Loss Rate 60
21.0 (IOO%.For Less Liquid Collaterai)
50
40.8 17.5
401
30 i 21.0
47.8
20
10 19.8
() .L---J------L--------~----~----------------------~
34% Net Loss Rate
221% Coverage Ratio (Liq. Pool/ Net Loss)
23.2
51.2
At Risk Funding Gross Loss Of Secured Funding
Mitigants Net Loss Of Secured Funding
Liquidity Pool
D Liquid Collateral DLess Liquid Collateral
l iMAN BROTHERS ·'
'T

CO
NFID
ENTIA
L TREA
TMEN
T REQ
UESTED
BY
LEHM
AN
BR
OTH
ERS H
OLD
ING
S, INC
.
. ,,------.
( ~\
.~.
Confid ttial
Stress Liquidity Scenario: Overall Impact I
26-Jun 27-Jun 30-Jun 1-Jul 2-Jul 3-Jul 7-Jul 8-Jul 9-Jul 10-Jul Week 3 Week 4 Total
Beginning Cash Position 111 5L2 37.4 31.8 33.1 32.1 30.8 27.6 26.9 24.9 22.5 20.3 13.7 13.7 I' Q Details
Net Loss Secured Funding ( 11.0) (2.8) 1.0 (0.2) (0.7) (3.0) (0.4) (1.2) (L3) (0.0) 1.6 (5.2) (23.2) next slide
Unsecured Funding Unsecured Debt
CP (2.6) (0.7) (0.3) (0.2) (0.1) (0. I) - (0.0) (0.0) - (0.5) (0.2) (4.7) STD excluding CP (0.0) (0.0) (0.0) - (0.0) . (0.0) - (0.0) (0.0) (0.0) (1.2) - (J.3) LTD (0.0) (0.0) (0.1) 0.1 (0.0) (0.0) (0.0) (0.0) (0.0) (0.0) (0.1) - (0.2) Buy backs - (0.5) - - - - - -· - (0.5) - - (1.0) Deposits of Banking Affiliates (0.2) - - - - - - - - - - - (0.2) Committed Facility Drawdown - - 4.5 - - - - - - - - - 4.5
Net Loan Funding - - (1.4) - - - - .. (1.0) - ( 1.0) - (3.4) Derivative Activity
Posting of Uncalled Collateral - ( 1.5) (1.5) - - - - - - - - - (3.0) Downgrade (2 Notches) - - - - - - - (0.7) - - - - (0.7) Disputed Margin Payments - - (0.3) (0.3) - - - - - - - (0.6)
Cash outflows to fund operations (PE, NPE, etc.) - - - (0.5) - - - .. - - (0.5) - (0.9)
Total Net Loss Unsecured Funding (2.8) (2.7) 0.9 (0.9) (0.1) (0.1) (0.0) (0.8) (1.0) (0.5) (3.2) (0.2) ( 11.5)
Ending Cash Position 37.4 31.8 33.1 32.1 30.8 27.6 26.9 24.9 22.5 21.9 20.3 13.1 13.1
r m m >< I
:E G) s I. s~ 7:s hiliwn ti,,l~idit_):poui a.~ q( 6· :!6 SOD IS comprised of S-12.2 billion of Holdings liquidity. $/.2 billion of LBI liquidity (trapped) and $-1.1 billion of Bankhaus liquidio·. In this stress scenario. ll"hich 0 mvolv<"s stgnificant.fimding losses at the broker dealers, cash positions become practically fungible across legal entities because LBI and LB/E require additional funding from Holdmgs and Bankhaus 0 :!. .\'etloss <!f.f'!C!'!e_d.fimdmg also includes the positive impact of the reduction in the funding of prime broker clients and of balance sheet reduction 0 w en 0'1 LEHMAN BROTHERS 8

CO
NFID
ENTIA
L TREA
TMEN
T REQ
UESTED
BY
LEHM
AN
BR
OTH
ERS H
OLD
ING
S, INC
.
r m m >< ~ G) s 0 0 0 w en en
Confidential
Stress Liquidity Scenario: Loss Of Secured Funding s~curC'd 1-"unding
J.usr C. ';ap;.a ... ·rtv L.B.J
1.1 - Ma.1~u· Index l·.ttuitlcS L2 & 1::3- Nnn-Majtlr Index FqUIIICS
l"ulal I BJ
LBit; «. i11'\ c1 nnu;nt Agcru,;y So,·t.:rcign:!!.
J\s-.cr 14acks- lnvt..:suncnt (iradc <.."1 - lnvcstancnt tirad..: <.:onvc.-r•l"llcs l. "2 - Non-lnvC':,;tntcnt (f•·adc C.:onvcr11hlcs C... "oquuah.:s - lnvcsCntcnt ( iro.u.h; c..:~u-ptuatcs- Ntln-lnvcstrncnt (iradc I I - rvt~qur lndcx 1-:quitiCS 1:.2 .. ~ 1·3- Nnn-M.:.•Jnrlnc.Jcx J:quiucs l.f\..1( j
Mnnc) Markets
'lotaii.Ull::
LBI ( iovcrnrncnt Agcnl.:y MUS Suvc1c1gns AssL"I Ua..:ks ~ ln\'Cstntcnt ( irall..: i\ss..:t Backs- Non-ln":cstntcnt ( iradc ('I- lnn.:suncnt (iradc Cnnvcruhh:s (. ·z - Nun-lnvcstrncnt ( intdc (. ·unvcrtihlcs Curpnrah:s - lnvcstmcnl < irade (. ·,~rptH:..Jb.:s- Nnn-lnvcstn1cnt (Jrado.: 1·1 - M-._~,nr Index H'-luiries 1·:.."! & 1·.3- Nnn-M~iur lndc"'- 1·:4uitaes l\.-1<ut~..·y Mar·kcts l\.-1unl
Pnvalc l.ahcls- lligh Yield Prn·o1h.: l.ahds- ln.,·csrnlenl ( iraUc
Tntaii.BI
I. Bill Whnlt.:h1an 1-tcsidcntaal
Toh1ll~osc CHpllcity
MilH•ant ... and tllh..:r str..:ss clcn1.cn1s
I-DIE Pnrnc l·hc.•kcr· (. "ushnncr Free Credits Prmtt..· lhokcr Rcc..hu.:taun I :x~:css <. "nlla&cral Retur-ncJ El"ll Banl...h~1us .l·undmg ECB I:ligihk ll~ankhau!'t
Tc.llall lUI-"
LBI Prune Bn•kcr <..•usturncr Fr..:c (."r..:Liits llm.<rt.·uu.lmg. nf Muni T( Hi Prug.. ( $h hillliun gruss) IJal~uu.:c Sheet Rcdu..::ti,,n Wrlll:duwns nn halm1ct: sheet rcdw.:llnn llt..·oal..:r-haJ.-.c.J Mah..:hc..:c.lll<u,k Rct..luL:Iitln l.x~.:c:-.:.. l.",,_ll~ll..:l al Rcu.irncc.l I Cllll ( h·crfunc.Jins cxd. rsi.F
TtHall.BI
Net Luss Sc:-C"urrd l•undinl;!:
l :MAN BROTHERS __ ....
Tgtal Rrpg
llwlk
0.3 1.3
1.6
0.1
9.8 18.1 0.6 1.4 7.4 2.5 5.0 7.9 6.4 0.2
59.5
34.1 93.8 50.9
5.9 1.6 0.5 0.9 9.3 ~-2
2.5 5.8 9.9 3.9 2.1
10.2
236.5
0.6
298.3
IIU.a1.&.. .B..WI.
0.1 0.4
0.5
0.9 0.2 0.6 5.2 O.K 3.3 3.3 3.6 0.2
IM.2
-1.4 0.9 0.5 0.9 8.4 s_o 2.2 2.8 9.9 3.9 I.K 9 . .,
49.8
0.2
68.7
26-Jiun 27-Jun 30-..Jun 1-Jul 2-Jul 3-..Jul 7-Jul 8-Jul 9-..Jul 10-..Jul ''-"r~k 3 '\.-"erk 4 Total
~I
O.l)
~0
~5
~4
0.1)
~5
~7
~I
2.3
.5 ~7
~5
~9
2.4
3.H ~7
1.9
2.7 2.3 1.2 lA
20.0
0.0
22.3
(3.5)
2.1 0.1 3.2 0.1 2.1
(2.5)
4.0 7.8 9.3
(I 1.0)
)
0.0 0.0 0.2 0.0
0.2 0.1
0.4
0.0
0.0
0.0 0.6
0.7
0.0
I. I
0.2 0.2 0.3 0.0
0.7
2.5
0.2 0.0 0.1 0.3 0.1 0.1 0.3 0.4
1.5
.5
0.6 0.3
0.6 1.5
1.0
0.1 0_0
0.1 0.2 0.0
0.4
0.8 0.2
1.0
1.4
0.2 0.1
0.1 0.4
0.0 0.1 0.2 0.0 0.1 0 . .2 0.3 0.3 0.0
1.2
0.0
0.2
0.5 0.1
0.8
2.0
0.8
0.4 1.2
ll!O ).0
0.0 0.1
0.1
0.1
0.0
()
0.1
(3.0)
0.0
0.0 03 0.0 0_1
0.3 0.2
1.0
0.2
0.1
0.0 0.2
0.4
1.4
0.4 0.3
0 . .,
1.0
o.n 0.1 0.0
0.1
0. 0.1
0.0
0.1
0.2
0.2
0.6
0.1
0.0
0.1
0.0 o_., 0.2
~I
00 02 I). I
0.1 0.0 ().2
0.0
0.7
0.9
04 0.2
Ill 0.7
0.0
0.0
0.0
()()
o.u U.U
o.u 03 0'>
0.1
I 4
()()
U.l
0.1
I.U
O.U
Ol
1.3
2.7
.2
0.1 1.3
3 I)
(),f)
0 . .2
OJ.
0.1 0 I 11.1 00 0.1 0.2 0.3 1.7 CJ.U
.:!.5
O.Y
U.l
0.0
()()
3.0
~ I
6H
06 0.1
I 7 2.5
0.0 0.4
0.-1
u.s 0.2 0.6 I.S 0.8 1.0 3.2 3.6 0.1
I 1.6
2.6 0.9 0.5 0.9 2.5 s.o 0.7 2.8 3.0 2.3 1.8 s.s
28.5
0.2
-10.7
(3.5)
6.8 1.3 3.5 3.4
11.5
1.0
0.0 0.8 4.9 (~.9) _ __Q,_I (_OJH (1.!1_______:, Ill 9) 0.2 (2.-1) 1.0 0.8 0.1 (3.0) (0.8) ( 1.1) 3 0 (0.9) 6.0
(2.11) 1.0 (0.2) (0.7) (3.0) (0.4) !1.2) ( 1.3) (11.0) 1.6 (5.2) (23.2)

CO
NFID
ENTIA
L TREA
TMEN
T REQ
UESTED
BY
LEHM
AN
BR
OTH
ERS H
OLD
ING
S, INC
.
r m m >< ~ G) s 0 0 0 w en ......
. ,r--/· c::--. .~, r0.
Confid ·.ltial.
Rating Downgrade-Related Margin Postings + In June 2008, long-term ratings of Lehman Brothers were downgraded by S&P and Fitch to A and A+, respectively. I
As of a result of these downgrades, the margin posting requirements if Lehman Brothers were to be further downgraded by one or two notches would be as follows:
Margin Posting Requirements $Billions
"Standard" trades "Non standard" trades
Total
1 Notch Downgrade
0.2 2.7
2.9
I'
2 Notcm Downgrade
0.5 1.1
1.6
+ Standard trades are derivatives transactions where the margin posting requirement is equal to the mark-to-market of the positions above the rating-dependent threshold. The lower the rating, the lower the threshold: hence the ne~d for additional margin postings in case of a downgrade. This posting requirement is immediate post the downgrade.
+ Non standard trades are derivatives transactions with structured vehicles (securitization trusts, CDOs), where the margin posting requirement is primarily driven by a requirement by the rating agencies for Lehman Brothers to post an independent amount to act as a volatility buffer. This independent amount is typically calculated as a percentage of the notional of the trade. The requirement would typically kick in if Lehman Brothers were downgraded below A or A2 by S&P or Moody's, respectively.
- This requirement would not become effective immediately. Instead, Lehman Brothers would typically have a cure period to assign the transaction or renegotiate the terms, thereby avoiding the posting requirement
• Post the downgrade by S&P on June 2, we have started renegotiating a large number of these transactions as a precautionary measure. As a result to date, we have already avoided approximately $1.1 billion of posting requirements if S&P were to downgrade us to A-.
LEHMAN BROTHERS 10

CO
NFID
ENTIA
L TREA
TMEN
T REQ
UESTED
BY
LEHM
AN
BR
OTH
ERS H
OLD
ING
S, INC
.
r m m >< ~ G) s 0 0 0 w en co
Confidential
Role of the Federal Reserve's PDCF and TSLF
• Although we do not rely on the existence of the PDCF and TSLF in our stress liquidity scenario, we believe that terminating these. facilities without providing an alternative liquidity backstop facility would be perceived negatively by the markets I'
- Would increase uncertainty about how the Federal Reserve and S.E.C. would react to another Bear Stearns-type event
- Would make it more difficult to fund some asset classes- particularly asset-backed securities. This would negatively impact
I
• Price transparency, as securities firms would reduce their market making activities on these types of securities
~
• Underlying lending activities as it would make it more difficult to distribute the risk without a well functioning securitization market
}IMAN BROTHERS j 1 .··'

CONFIDENTIAL TREATMENT REQUESTED BYLEHMAN BROTHERS HOLDINGS, INC.
{ I
\ '· ,.)
en C1) (J ·-"C c C1) c. c. <(
LBEX-WGM 000369

CONFIDENTIAL TREATMENT REQUESTED BYLEHMAN BROTHERS HOLDINGS, INC.
-·--+-' c: Q)
"C '+= c: 0 u
-; '1 .. .. -; '"? ~. .. -; .., ... .. ~ ..
"ii '"? •·· -
-; '"? "'
\0 0 I·
ri 'i ri
'I <>
.,, 14'1
dd
''! ~?. 0
.,, ,,
.,.;
.,, .,, , i ri
0 <> t....; c.-;
0 .,; '=! '"
·-; •·· dO "' 00 ri ri 0 ~;
" 0
,, 0
0 ~;
C,-:;
0 0 c":t d
., ...... .,. ,,; 0 .,;
... ,.., c-.i <.-i
,,, ,., 0\ ...,.
oOO-i~; ,.. f"t
... ; ... ;
. .. ... d ~?~
t;,· (.-j e.
'' cci
,.. , en~ (. '>
c:i ~-
C") ~ ,.,
C.? CQ c.:. c.) I' ,,
/.
LBEX-WGM 000370

CO
NFID
ENTIA
L TREA
TMEN
T REQ
UESTED
BY
LEHM
AN
BR
OTH
ERS H
OLD
ING
S, INC
.
r m m >< ~ G) s 0 0 0 w ...... ....Jo.
,~
i"" t-::::::'1
Overfunding Analysis - LBIE
w Confid ltial
Asseor Caregoa:-· ~6-Jun ~7-Jun 30-Jun l..Jul ~..Jul 3-Jul 7-Jul S..Jul 9-Jul 10-Jul ll..Jul H..Jul 15-Jul · 16-Jul 17-Jul 18-Jul ~1-Jul ~~-Jul :3-Jul ~-t-Jul Total
-~55'1?[ 5acks . rn·;estment Grad~ Lost Capacny
ECB Bankha.us Liquid!~- !"ool
C 1 - im·osunem Cn-ade C onHrubl.s
O.l
0.1
Lost Capamy 0.0 Excess Collateral Rerusmd 0.0 LtquidJt:· ?ool
C~- ):on-ln,-ostmenr Cn-ade Con,·~rubles Lost Capanty
Excess Collateral Rerumed
LtqllldJty ?ool
C orporates - Innstment Grade
lost Capact~-
ECE E~coss Colla10ra! Returned ltqwdJty ?ool
Corporate>- :'\on-lm·estmem Cn-ade lost Capan~-Bankhaus L\cess C ollateta! Returned Lt~Uldlty ?ool
El - ::\:a;or ind<>. Eqwu<S
lost Capact~-Excess Collateral Rerumed
liqwdJry ?ool
E~ .5.: £3- :'\on-::\:aJor index Eqwues lost Capact~-
Exc.ss Collateral R~rumed
ltqwdlty Pool E::\:G
lost Capamy
BanJ:haus
E~cess. CoUareral RNumed Ltq.:,dJ~· ?uol"
). :oney ~ :arkets Lost Capacny
Bankhaus LiqwdJty ?ool
Total Lost Capaci~· Total Bankbaus TotaiECB Total [xcess Collateral Returned Total Liquidil'·Pool
~a
0.0
05
a~
0 • v.•
O.l
0.0
0 ,, ·"
:),)
::;_~
·' -v.
0 -
0 l ... ~
... '.J
~ ,; 0 1 G.!
~ I 0.0
C.O 00
!J.C 00
n ' v.
0.~
0.0 0.0
c ' "--0 ' "·-
0.1
0 1
0~
0.0 0.~
0.2
LEHMAN BROTHERS
0.~
n ' .... __
~-0
0.0
~-1
c 1
0 3 n-... __ ,
D.l 0.1
G.i Q.l
n\o,)
:i.3
C.l
C.3 8 1
I.: 0.6 n.
"'·"' 0.6
C.l
D.l
0.0 0.~
0.1 ::.1
a.~
n ' "·-
0.0 c.a
0~
0.1 G.1
C . .:!
0.0
0.0
0.1 0.1
0.2
0.~
0.0
0.0
0.1 0.1
0.~
0.~
0.3 0.3
0.3 0.3
0.0
0.0
L.: 0.!
O.S 0.0
00 0.0
0.0
0.0
00 0.0
0.1 0.1
0.1 0.1
0.0 0.0
0.0
0.0
0.0
0.0
03 0.3
0.0
0.0
0.1. 0.1
n -1.1 •• 1
0.3
0.2 0 ' , __
1.0 D.~
0.3 0.~
0.0
:J.C. 0.0
0.1 0.1
0.0 00
0.1 0.0
0.1
0.1 0.1
0.0 0.0
0.~
0.~
0.1 0.1
0.1 0.1
0.0 0.0
0.2 0.~
0.0 0.0
0.0
0.0
o.- o.o 0.1 02 0.~
o.c
13
0.1 0.1
00 0.0
0.0 0.0
0.1 0.0
0.1
0.0 0.0
0.0 0.0
0.0
0.0
0.0
0.0
0.1 0.1
0.~
0.~
0.! 0.1
0.5 0.1
0.!
0.0
0.0 0.0
0.0 0.0
0.1 0.1
0~
0.~
0.0 0.0
0.3
0.0
0.3
I"
0.0 0.0
' . v.•
0.~
0.0
0.0
OA 0.0
0.!
G.l
0.1
G.~
:J.J
:J.l
0.1
0.0
O.J
G.l 0.1
~-0
C.:J
o.: O.J
o.; Q9
O.J
0.0
l.~
o.;: G.! 0.1 O.J
0.1 0.1
:)Cl
00
' ' v .•
~=
0 2 0 '
0 ~ 0 ~
I:! 3.5
o.::
0.0
0.0
o _ _; 0 3
n • \./ .... o__;
0 0 \J,.:
o.:: O.J 0.~
0.0
0.~
0.1
0.6 0.6
I.:: 0.9 0.5 0.1
0.8 O • .J 0.-t 0.0
1.0 1.0 0.0
3.~
3.:
3.6
0.8
0.1 0.1 0.0
11.6 3.4
1.3 6.8 0.~

CONFIDENTIAL TREATMENT REQUESTED BYLEHMAN BROTHERS HOLDINGS, INC.
~ ...... 1:::1 e ~ ~ "" ge ~
~ -e ~ ~ .s ~ ~
'5 ~ ..... ~
~
~ :: ~
~ 1:::1
([. .s ~ l
~ .s ~ .~ ~
"" ~ "1:::1 ~ ::::t
=s ~ .~
~ ~
~ ~ .... ~ :: s E: :: ·~
1:::1
f ~ .s .~
~ ..:.: ·~ :: ~
( ~ ........ \ 8 "-" . .:.......·-""
LBEX-WGM 000372

CO
NFID
ENTIA
L TREA
TMEN
T REQ
UESTED
BY
LEHM
AN
BR
OTH
ERS H
OLD
ING
S, INC
.
rm m >< ~ G) s 0 0 0 (.)
"" (.)
Contents page
Securitized products
US prime - Alt A
US non-prime
US non-prime other
Europe
Residuals
Leveraged acquisition facilities
Roll forward analysis
Appendices
Price verification methodology
Price verification results
Recent sales activity
A - Alt A sales activity
B - Contingent acquisition facilities - movements
J -~MAN BROTHERS ,.2 ,._ ..... /
··''
I,
3
4
5
6
7
8
9
10
. ll
12-13
14
16
17-18
I
_ .... , ')

CONFIDENTIAL TREATMENT REQUESTED BYLEHMAN BROTHERS HOLDINGS, INC.
-
r:JJ ~ u :;j
'"0 0 ~
~ ([ '"0 ('fj
~ N ·~ ~ ·~ ~ :;j u ~
C/j
LBEX-WGM 000374

CO
NFID
ENTIA
L TREA
TMEN
T REQ
UESTED
BY
LEHM
AN
BR
OTH
ERS H
OLD
ING
S, INC
.
r m m >< ~ G) s 0 0 0 w ...... 0'1
Securitized Products US- Prime
L~
(in$ millions)
Prime Fixed - PL Prime Hybrid - PL NPL Other* Whole Loans
AAA
Sub Securities
Residuals
Servicing Rights
Total
Whole Loans
Securities
Residuals
· Sen·icing Rights
Q2 2008 Balance Sheet Positions Transactions Price Testing Results
Third Party and Recent
Trade Modeled Testing Balance MV Mark Sales MV AvgPx Pricing Pricing Coverage
542 486 89.67 67 94.19 100.00% 100.00% 1,317 1.185 89.98 397 94.34 100,00% 100.00%
215 106 49.30 364 49.30 100.00% 100.00% 299 278. 93.27 100.00% 100.00%
2,373 2.055 86.61 100.00%
4.988 3.904 78.27 4.869 81.67 80.70% 19.30% 100.00% 4.749 1.771 37.29 126 47.16 52.60% 47.40% 100.00% 9,737 5,675 58.29 73.10% 26.90% 100.00%
831 1.62 100.00% 100.00%
1.638 1.21 96.00% 96.00%
12,110 10.200 84.22
The performing whole loan population was price tested using a combination of recent trade activity and the average marks of other dealers. The non performing whole loan population was price tested using recent trade activity.
loss and prepayment assumptions are utilized in price testing. Spreads are determined utilizing published sources such as JP Morgan monthly report as well as spreads on ABX.
Intex Desktop using collateral specific curves and vectors obtained from either Loan performance, Inc via Lehmanlive or, developed in collaboration with Lehman Research. .
internal research model that uses prepayment speeds as well as actual cost of servicing to forecast the future cash Dow stream of the MSR.
\1AN BROTHERS ) ,.•' ·, __ .
Testing Variance
15 (49)
0 (20)
(54)
2 (Ill (8)
( 18)
43
(38)
..• ..--....., \
I

CO
NFID
ENTIA
L TREA
TMEN
T REQ
UESTED
BY
LEHM
AN
BR
OTH
ERS H
OLD
ING
S, INC
.
r m m >< ~ G) s 0 0 0 w ...... en
,.....,. __
('' ,IS',
S~curitized Products US Non-Prime (in$ millions)
Suhprime 2nd Lien
Whuk Luans
AAA Suh
Securities
Residuals
Sen·icing Rights
Tnt,d
Whole Loans
Securities
Residuals
Balance Sheet Positions
Balance
J25 u.w 1.664
I .2.~0 1.979 1·.2 I 0
-l.lC'-l
MV
167 8H5
1.052
919 i~:'i
l.t>:'-+
~=
21
2.759
Mark
51.80 66.10
H22
7-UI .~7 .I-+
51.:'-+
Q2 2008 Transactions
Sales MV
64
1.2.~X
9:'fl
AvgPx
-llUO
Xli.5.~
~lUO
Price Testing Results
Third Part~-and Recen~
Trade Modeled Testing PricinJ! PridnJ! Co~·erage
I' I 00.00'·; I OO.OO<;'r
I IHl.OWf I 00.00'7r
I 00.00''i
(15_20'•( .~-l.liO'f I oo. OO'ii -lX.OO':; 52.00'.f IOO.OO'ii-
59.59'7, -+0.41 ':'f IOO.OO<;'r
I 00.00'/'r I 00.00';}.
0.00'/'r-
The performing whole loan population was price tested using a combination of recent trade activity and the an~raJ!e marks of other dealer-S. The non performing whole loan population was price tested using recent trade activlty.
Third-party marks where available. Intex Desktop is utilized when no vendor mark is available.· Deal specific loss and prepayment assumptions are utilized in price testing. Spreads are determined utilizing published sources such as JP Morgan monthly report as well as spreads on ABX.
lntex Desktop using <:ollateral specific curves and vectors obtained from either Loan performance, Inc via Lehmanlive or, developed in collabor-<ltion with Lehman Research.
LEHMAN BROTHERS 5
I~
. - - --.
Testing Variance
17 {5~0.
(41)
12 IX
31
6
(-+)

CO
NFID
ENTIA
L TREA
TMEN
T REQ
UESTED
BY
LEHM
AN
BR
OTH
ERS H
OLD
ING
S, INC
.
r m m >< ~ G) s 0 0 0 w ...... ......
Securitized Products US Other
1 inS millions)
Scratch & Dent Reverse Mtges
Whole Loans
AAA Sub
Securities
Residuals
Servicing Rights
Total
Whole Loans
Securities
Balance Sheet Positions
Balance
889 612
1,501
273 173
446
1,947
MV
386 618
1,004
173
90
263
40
7
-1,314
Mark
43.40
99.10
66.89
63.41 60.45
58.97
Q22008 Transactions
Sales MV
95 251
AvgPx
49.30 100.24
Price Testing Results
Third Party and Recent
11rade Modeled Pricing Pricing
100.00% 100.00%
100.00%
39.46%
Testing Coverage
100.00% 100.00%
100.00%
100.00%
39.46%
79.28%
0.00%
().00%
The performing whole loan population was price tested using a combination of recent trade activity and the average marks of other dealers. The non performing whole loan population was price tested using recent trade activity.
Third-party marks where available. Intex Desktop is utilized when no vendor mark is ~vailable. Deal specific loss and prepayment assumptions are utilized in price testing. Spreads are determined utilizing published sources such as JP Morgan monthly report as well as spreads on ABX.
L:P ... T'<fAN BROTHERS {:,··.
--
I
Testing Variance
51 10
61
3 0 4
65
.~--.

CO
NFID
ENTIA
L TREA
TMEN
T REQ
UESTED
BY
LEHM
AN
BR
OTH
ERS H
OLD
ING
S, INC
.
r m m >< ~ G) s 0 0 0 w ...... co
_....--.._ ~\ /'
(
securitized Products Europe summary
(in $ millions)
UK loans (including MF08-I)
IRE loans
NL loans
IT loans
NPLs
Whole Loans
AAA Suh
Securities
Residuals
Total
Whole Loans
Securities
Residuals
Q22008 Balance Sheet Positions Transactions Price Testing Results
.,,.
Third Party and Recent
Tr!Sde Modeled Testing Balance MV Mark Sales MV A\rg Px Pricing Pricing Coverage
2,440
296
389
201
1.584
4,729
4.601
1,125
5.726
10.455
2,168
288
383
179
633
3,651
4,463-792
5.255
436
--9,342
88.85 70.00%
97.30 96.00%
98.46 100.00%
89.05 0.00% 39.96 O.OOI'k 77.21
96.98 100.00%
70.41 87.00%
93.18
Mock securitization based on average prices by region, rating and collateral type obtained from Markit Partners pricing files.
Pricing matrix compiled! using detail pricing files received from Markit Partners.
Internal model utilizing collateral specific assumptions for prepayment, loss and severity.
70.00%
- 96.00Ch·
100.009~-
0.00%
0.00%
59.63%
100.00%
87.00%
98.04%
LEHMAN BROTHERS 7
~ ' - '
I
Testing Variance
23
2
(9)
16
( 112)
78
(34)
(I X)

CO
NFID
ENTIA
L TREA
TMEN
T REQ
UESTED
BY
LEHM
AN
BR
OTH
ERS H
OLD
ING
S, INC
.
Alt-A Trading and Pricing
Residual Certificates continue to be marked to model
Our exposure is approximately $800mm mostly concentrated in Options ARMS
The remainder of Alt-A residual exposure is as follows: ALT-A- SARM ALT-B- LXS HLTV- LXS, H
I' 55 67 58
180
Performance on Option ARM Exposure is mixed, To date these positions have performed well producing cash flows in excess of $50mm per month, however, credit performance has deteriorated recently and we expect some write downs in the 3rd quarter.
They have been marked with the assumption that cash flows will cease once the negative amortization period ends and that the over collateralization will not be recovered.
· For a period of time these positions were performing better than expected as interest rates moved and the 10 extended, as the negative amortization slowed.
r The most recent performance research on this collateral shows the trend of borrowers ~ defaulting prior to full reset, by failing to even make the minimum payment.
~ G) s 0 0 0 w ...... CD Lr . -\1AN. BROTHERS Q
I

CONFIDENTIAL TREATMENT REQUESTED BYLEHMAN BROTHERS HOLDINGS, INC.
bJJ
= • '~""""!
- u
= C\j c
• '~""""!
~
c 0
• '~""""!
~ • '~""""! <f .. rJ'j • '~""""!
=' c:r u C\j
"'C) (1.) 01) C\j ~ (1.)
> (1.)
~ ~ ~ ~ ~
( ~ '
~
LBEX-WGM 000380

CO
NFID
ENTIA
L TREA
TMEN
T REQ
UESTED
BY
LEHM
AN
BR
OTH
ERS H
OLD
ING
S, INC
.
r m m >< ~ G) s 0 0 0 w co ....Jo.
Leveraged Acquisition Financing - Roll Forward Analysis + The decrease of $6.4bn from $17 .9bn to· $11.5bn in the quarter is made up of dead deals and deals done away of
$1.4bn, syndicated and paired down prior to closing of $1.1 bn, closed deals and sales of $3.9bn while only 1 new deal for $25mm was added for the quarter.
RoH Forward of Fundl'd. l"nfundl'd and ( 'ontingl'nt Commitnwnts
$24.lbn
Q4'07
~'~~ Dead/ Done Away
'"''·iia..Ynk'>l'
Syndicated ·
Paired Down
Pre Cklse Ck1sed
and Soki
1- -\1AN BROTHERS
MAt~ ~z.t
New·
Deals St7.9m
Ql'08
•q
~~~'··""'\'Itt ~.ll?., ... .,, ....... .. Jil . ~~~ ..... .
Dead!
Done Away
Syndicated
Paired Down Pre Cklse
Closed and
Sold
-0-
New
Deals $11.5bn
Q2'08
--..
I

CO
NFID
ENTIA
L TREA
TMEN
T REQ
UESTED
BY
LEHM
AN
BR
OTH
ERS H
OLD
ING
S, INC
.
r m m >< ~ G) s 0 0 0 w co 1\)
,---/_. .. ~ -- t:::l ~~-
Price Verification Methods for Acquisition Facilities • \Ve utilize 4 basic price verification methods in order of hierarchy.
External Quotes: We refer to the average bid price fromLSTA or Markit partner at month end
• (LSTA provides the average quotes from contributors with a cut off time at 3pm daily. If LSTA receives more than 3 sources, the final mark is the average of the second and third highest bid quote.)
Trading Activity: we refer to the trade price up to 1 week before month ynd. I'
CDS Matrix*: Calculate the implied price based on the yield by adding the various spreads (LCDS, CDS, or Sector) on top ofLIBOR.
CR Matrix*: Build yield using a generic credit curve for the issuers rating and industry on top of LIBOR.
+ CDS/CR Matrix input assumptions
Yield = CDS/CR Spread + Libor
Maturity: If the final maturity is less than 1 year, we use the actual maturity. If the final maturity is greater than 1 year, then 60% of the stated maturity is used._ This assumption is made the loan is quite likely to be refinanced for various
economic (ie. Favorable interest rate, ratings upgrade) and uneconomic reasons (ie. Ivf&A, desire to maintain constant
maturity, diversify debt mix).
Coupon= Weighted average of unfunded/funded amounts* unfunded/funded spreads
Primary Method Market Value Coverage + Market Value and Coverage By Method. CDS matrix 1,525 12%
CR matrix 940 7% External quotes 2,291 18% IRA Model- 2,721 22% Not Tested ( Asia ) 54 0% Other 1,592 13% Price Flex 2,996 24% Trading Activity 479 4% Grand Total 12,598 1,00%
LEHMAN BROTHERS 11
I

CO
NFID
ENTIA
L TREA
TMEN
T REQ
UESTED
BY
LEHM
AN
BR
OTH
ERS H
OLD
ING
S, INC
.
r m m >< ~ G) s 0 0 0 w co w
--- ....---o ............. .-..~,_ ........... ..., ......................... ... ..... __ ......... _......,. Y -.&.'-4'-41..&.'-'.1.·.1. ..&.. VLJII..I.IJ.5 .
May 30,2008 All figures in $ MM
Deal Name Funded Unfunded Contingent Notional MV Desk's Mark PCG's Mark Primary Method ACTS 70 22 - 93 77 83.40 81.92 External quotes Alliance Atlantis - 10 - . 10 9 90.00 96.66 CR matrix Allison 1 82 - 83 70 85.00 85.67 External quotes Archstone 2,376 155 - 2,531 2,475 97.81 I' 97.81 Price Flex ARINC 150 43 - 192 169 87.96 87.96 External quotes Arysta 48 7 - 55 54 98.00 Not Tested ( Asia ) Asurion 3 22 - 25 22 86.00 87.11 CR matrix Biomet, Inc. - 42 - 42 39 93.12 93.70 CDS matrix cow 467 29 - 496 410 82.58 82.33 External quotes Cenveo 90 - - 90 90 100.00 100.00 External quotes Chevron (Delek) 135 23 - 157 148 94.27 95.00 Agreed takover by F Dana Corporation 16 48 - 64 64 99.25 96.66 CR matrix Debitel 277 53 - 330 314 95.00 95.00 Agreed takover by F Endemol 485 138 - 622 467 75.00 75.00 Marketing at the mo FairPoint 165 102 - 267 236 88.34 87.61 External quotes First Data 583 253 - 836 724 86.65 85.59 Trading activity I CD Hawaiian Tel YP 306 5 - 311 243 78.21 71.81 CDS matrix Hawaiian Telcom 4 2 - 6 5 78.50 77.75 External quote/COS HD Supply 227 278 - 505 447 88.50 88.46 Loan and Bond - Ex Hilton {203 - - 1,203 1,112 92.44 92.45 Internal Model Houghton Mifflin 458 75 - 533 451 84.61 84.00 Trading Activity I co pal 238 33 - 271 198 73.01 73.00 Discussing with a h< Local Insight Regatta 4 2 - 6 6 95.00 94.05 CR matrix LTSB 401 48 - 449 387 86.24 86.20 Discusions with the McJunkin 158 - - 158 142 90.00 96.52 CDS matrix Metavante - 30 - 30 28 92.00 92.25 Trading Activity O'Reilly Automotive 300 300 300 100.00 100,00 CR matrix PHS 43 47 - 89 78 86.98 86.73 External quotes PO Corp 360 27 100 487 439 90.23 92.13 External quotes
LT \1AN BROTHERS , ._./
I
Variance ($mm) (1.37) 0.66 0.55 0.10 0.00
0.28 0.24
(1.24) -
1.15 (1.66) (0.00) (0.01) (1.96): (8.89)
(19.89) (0.05) (0.22) 0.17
(3.23) (0.04) (0.06) (0.19) 10.27 0.08 -
(0.23) 9.27

CO
NFID
ENTIA
L TREA
TMEN
T REQ
UESTED
BY
LEHM
AN
BR
OTH
ERS H
OLD
ING
S, INC
.
r m m >< ~ G) s 0 0 0 w co ~
--------· ,--·-··~ I . 01
-S -~.- ...... 0 ........... ... ... ..... , ..... .a. ........ .a. •·.& "-' .&. ... ...... ................... ·-"-' .. _ _.. __ "' ... ...., .....
May 30, 2008 Cont'd All figures in S .MM
IDeal Name Funded Unfunded Contingent Notional MV Desk's Mark PCG's Mark R.J. O'Brien 47 - - 47 31 67.00 66.00 Sequa 194 121 - 315 295 93.79 93.92 Sheridan HC 5 21 - 26 22 85.00 83.91 Syniverse . 1 27 - 28 26 92.40 92.68 Targa 94 - - 94 78 83.50 ~4.00 Tribune 4 36 - 40 27 67.28 72.92 TXU 303 287 - 590 540 91.54 92.96 US IS 7 51 - 59 51 87.00 86.22 Varel 9 14 - 22 20 92.91 96.00 Vertrue 78 8 - 86 68 79.67 84.00 Wesco Aircraft 25 25 25 100.00 97.50 Windstream - 4 - 4 4 95.00 9'7.52
Total High Yield I 9,004 2,143 425 11,572 10,388 89.77
Archstone Mezz 527 - - 527 521 98.86 98.86
Real Estate I 527 - - 527 521 98.86
Arch stone 2,142 - - 2,142 1,609 75.14 75.14 First Data 79 - - 79 79 100.00
Bridge Equity I 2,221 - - 2,221 1,689 76.02
Total Commitmentsl 11,752 2,143 425 14,320 12,598 87.97
LEHMAN BROTHERS 13
.~ : ~~.\
.... _..,"' ....... 0
I Primary Method Variance
LSTA Quote (0.47 CDS matrix 0.40 External quotes (0.28: CDS matrix/ CR Ma 0.08 External quotes . 0.47 External quotes 2.27 External quotes/CR 8.36 CDS matrix (0.46) External quotes 0.68 External quotes 3.71 External quotes (0.63) External quotes 0.10
-(2.03)
Price Flex (0.01)
(0.01)
IRA Model 0.01
0.01
3.97

CO
NFID
ENTIA
L TREA
TMEN
T REQ
UESTED
BY
LEHM
AN
BR
OTH
ERS H
OLD
ING
S, INC
.
HY Acquisition Financing Price Testing - Recent Sales
• In June we have seen recent sales data at or above where we had the portfolio marked
• We were able to reduce the portfolio of closed HY Acquisition facilities (funded and unfunded) in June by $1.5bn
without suffering additional losses in the overall portfolio.
• Recent data is as follows: I'
I

CONFIDENTIAL TREATMENT REQUESTED BYLEHMAN BROTHERS HOLDINGS, INC.
cr t.r) -
LBEX-WGM 000386

CO
NFID
ENTIA
L TREA
TMEN
T REQ
UESTED
BY
LEHM
AN
BR
OTH
ERS H
OLD
ING
S, INC
.
r m m >< ~ G) s 0 0 0 w co ......
Appendix A- Alt-A Trading and Pricing I
Alt-A Whole Loan Sales
We have executed a series of trades close to our marks
I,
Counter Party Loan Type Size $mm Price
Ma~ Settlement
Bank of New England Hybrid 6.4 80-00
Am Portfolio Hybrid 7.5 85-00
American Bank Hybrid . 20.0 90-00
Washington Trust Fixed 8.5 98-00
June Settlement'
Chevy Chase Hybrid 38.0 96-08
Vertical Fixed 88.0 86-00
Marks are consistent with Morgan Stanley Research·s broker/dealer survey prices
r- -... MAN BROTHERS 1._6 ..__ .... -'

CO
NFID
ENTIA
L TREA
TMEN
T REQ
UESTED
BY
LEHM
AN
BR
OTH
ERS H
OLD
ING
S, INC
.
,,------.. .. t:::'\
Appendix B - Contingent Acquisition Facilities - znd quarter movements
1Q)8 Paired Dnm/ ~ ~l})ne
Synd C(Olplete Awcty/Dead Non-Invffitmmt Grade
I'
Alliance Thta 1,309 (1,309) OReilly Autorrntive 008 (~8)
FairPoint Comm 585 (246) (339) McJunkin 350 (192) (158) Pr~s Ganey Associates 160 (160) R2Ccrp 145 (45) Gram Circle 136 (68) (68) Arysta LifeScience Corp. 88 {88) Local ~ight Regatta 73 (73) Wesco -
Total 3,654 ( 1,059) (818) (1,377)
+ O'Reilly has been syndicated down to our final hold of $5mm and is scheduled to close in July
lji + PQ Corp closed in early July.
~ + Wesco closed in early July I
~ • New deals added since May include $453mm for Booz Allen Hamilton and $316mm for Converteam. s 0 0 0 w co co LEHMAN BROTHERS 17
.~ ~· --"-,'
•• 1\ily
300
100
25 425

CO
NFID
ENTIA
L TREA
TMEN
T REQ
UESTED
BY
LEHM
AN
BR
OTH
ERS H
OLD
ING
S, INC
.
r m m >< ~ G) s 0 0 0 w co CD
Appendix B - Contingent Acquisition Facilities -June movement
2Q08 Paired Down/ Deals Deals Done Synd Complete Away/Dead
Non-Investment Grade I,
O'Reilly Automotive 300 (295) PQ Corp 100 Wesco 25 (25) Booz Allen Converteam -
Total 425 (295) (25) -
L-r -\1AN BROTHERS "·<:.!,
· ..... //
I
6/30/2008
5 100
453 316 874

CONFIDENTIAL TREATMENT REQUESTED BYLEHMAN BROTHERS HOLDINGS, INC.
... ----./
LBEX-WGM 000390

CO
NFID
ENTIA
L TREA
TMEN
T REQ
UESTED
BY
LEHM
AN
BR
OTH
ERS H
OLD
ING
S, INC
.
r m m >< ~ G) s 0 0 0 w CD ....Jo.
.. ,.··~ ;; . '·
LEHMAN BROTHERS
Operating Results
~,
Q2 2008 SEC Review July 16, 2008
~1~ !
I'
Confidential Presentation

CO
NFID
ENTIA
L TREA
TMEN
T REQ
UESTED
BY
LEHM
AN
BR
OTH
ERS H
OLD
ING
S, INC
.
r m m >< ~ G) s 0 0 0 w CD 1\)
'·
... Executive Summary· Q2 2·008 : ! ' ' ~ '
-;!
.. ·· ·:··
. . : .
+ . NetReveime of negative ($0;.7)'billion Executive Sum~ary :- Q2 20081 .
+ Net:,Loss ()f ($~.8) billion·,.:·
+ EPS of ($5.14) i:
+ ·.Compensation expens~of$2~J billion and NPE of $1.1 billion
Business Segment and Regio~~if~gbligbts I' ''·!·,
• Inye~tmEmtBanking· rev~;;riues ·of $858mm decreased -1% and ~25% versus Q 1. '08 and Q2.'07 respectively: f}dvisory revenues of $240 :rrun · dec~.ea~ed -2:7% versus Ql'Q8 and -13% versus Q2 '07, as the decrease in M&A annoUncement since Q3 :OfiJ;rtpacted deal completion activity. Debt Origil)ation revem,tes of$28'8mm, dec~eased. -11% versus Ql '08 and -4 7% verslU; Q2 '07 as the n~~ed>f Financial Sponsor related traasact1oi!is.were. minimal. EquityOrigination•p:~venues of$ 330n1rn increased 54% versus Ql'08 but fell\;'~f% v~.rsus Q2 '07, as Lehman volumes .
· were particularly strongl.n ~ecoq.qary issuance and convertibles. Iop Q2'08 transactio~ included the Wpghin~o~:Mutual PiPE, Sovereign Bancorp · follow-on, FannieMae follQw:-qn,and Conv~rtible, and CI'f Group follow~~n and Convertible. :; ·
••• Capital Markets loss of$(p,374)mm mainlydueio continued valuation adjustments in Securitized Products,:ieal Estate, and Leveraged Loall.s, as well as losses in Proprietary and Principal Investing. Weak hedging strategies in the quarter compared to significant hedging gains in Q 1. Strong customer flow activity in the quarter. Net MTM adjustments of $3. 7bn net, ($3 .6bn gross) in the quarter. Fixed· Income loss of $(2,975)mm, impacted by valuation adjustments and trading losses. Equities revenues of$601mm decreased versus Ql '08 and Q2 '07. Revenues were lower in the quarter mainly due to unprofitable trading strategies, proprietary and principal related investments (GLG) amid the highly volatile equity markets
this quarter. Weak results out ofVolatility amid a decreased investor appetite for derivative instruments, especially Internationally. Record Prime
Services revenues in the quarter.
+ Investment Management revenues of $848mm declined versus previous record Q 1 '08 by -12% but surpassed Q2 '07 by 10%. Asset Management revenues declined versus record revenues as both Traditional and Alternative Asset Management (mainly due to lower revenues on minority investments in hedge fund managers) declined. AUM of $277bn were flat versus last quarter, as net outflows were offset by market appreciation.
Net outflows were primarily in lower fee money market assets, while there were inflows in higher fee based alternative assets. Record Private Investment Management revenues of $352mm increased $1mm versus Ql '08, on record Fixed Income revenues and strong results within Equities.
+ Non U.S. accounted for 57% ofQ2 '08 total Firm losses, with losses particularly significant out of Europe due to unprofitable trading strategies, as
well as losses on principal investments.
... ")iMAN BROTHERS .. "'•1 -~,
,)

CO
NFID
ENTIA
L TREA
TMEN
T REQ
UESTED
BY
LEHM
AN
BR
OTH
ERS H
OLD
ING
S, INC
.
r m m >< ~ G) s 0 0 0 w CD w
/~',., I.
--~,_
r-~l
Net Mark to Market Adjustments
Mark to mark~t adjustments (Unaudited) Gain/(Loss) (in billions)
Res-idential mortgage-related positions Other asset-backed-related positions Commercial mortgage and real estate-related investments <31 Acquisition finance facilities (funded and unfunded)
Subtotal
Valuation of debt liabilities <41
Total
$
$
$
For the Three Months Ended Ma:i 31, 2008
Gross Net<21
(2.4) -$- (2.0) (0.4) (0.4) (0.9) (1.3) (0.3) (0.4)
(4.0) $ (4.1) .
0.4 0.4
(3.6) $ (3.7)
msubstantially all of these adjustments occurred in the twelve months ended May 31, 2008.
For the Six Months Ended Ma:i 31, 2008
Gross Netl21
$ (5.4) $ (2.8) (0.6) (0.5) (2.3) (2.3) (1.0) (0.9)
$ (9.3) $ (6.5)
1.0 1.0
$ (8.3) $ (5.5)
-~
I' Fiscal Year 2007 through
Ma:i 31, 2008 (I)
Gross Net<21
$ (10.1) $ (4.1) (1.2) (0.7) (3.7) (3.2) (2.0) (1.3)
$ (17.0) $ (9.3)
1.9 1,9
_L_j~ $ (7.4)
<21 The net impact represents the remaining impact from the components after deducting the impact of certain economic risk mitigation strategies. Gross balances shown do not reflect the impact of economic hedges. <3> Included within this category are valuation adjustments attributable to commercial mortgage-related positions, equity investments in real estate companies and debt and equity investments in
parcels of land and related physical property. · <4> Represents the amount of gains on debt liabilities for which the Firm elected to fair value under SFAS No. 159. These gains represent the effect of changes in the Firm's credit spread arid exclude any Interest income or, expense as well as any gain or loss from the embedded derivative components of these instruments. Changes in valuations are allocated to the businesses in relation to the cash generated by. or funding requirements of, the underlying positions.
LEHMAN BROTHERS 2
I

CO
NFID
ENTIA
L TREA
TMEN
T REQ
UESTED
BY
LEHM
AN
BR
OTH
ERS H
OLD
ING
S, INC
.
r m m >< ~ G) s 0 0 0 w CD ,J::Io.
Second Quarter 2008 Summary of Financial Results GAAP Lines
($in millions)
Revenues: CoiTil'issions Pril>:ipal Transactions lnvestmere Banking Gross lnlerest and Dividend Income Asset Managemenl I Other
Total Revenues
lnleresl Expense Note: Nel /merest and Di'•idends
I Net Revenues
Non-Interest Expenses: Colll'ensalion and Beneli!s
Business Development Technology and Com1U1icaoons Prolessional Fees Brokerage and Clearance Occupancy Olher
Total Non-Personnel Relaled Expenses
I Total Non-Interest Expenses
f"IllC.omel!efol"!i.'Taies · .. · ,,._,., .. ).J :·,·_,
Taxes
•Net Income ·: _,·, ·· '-"
Preferred Dividends
Net lncome.·APJ>Ucable.!o. CQJJII!IO;;-StQCk '
Earnings Per Comron Share Fi:st CaD Estimales
Comron Shares Used lOr EPS Calc
Avg Comunn Equity (in Millions) Rettm on Comron Equiy Avg Comron Tang~ble Equly (in Millions) Renm on Tangible Equity
PrelaX Margin TaxRa1e·
Headcount (period end) Colll'ensalion & Benefils Ralio · Non-Personnel Expense I Revenue Amuali2Ed NPE/ Avg Head (SThousands)
Stock Price Price to Earnings
Book Value I Share Price to Book Vah.oo
Non-US /Total ReveiUIC
T ~tiMAN BROTHERS
QZ ZOOS Tnmd
Mar'OS
221 (999) 203
2,494 136
2,055
(2,128) 365
74
558
34 105 31 78 63 22
332
Apr'OS
217 (1,943)
277 2,544
141 1,235
(2,420) 124
(1,185)
548
31 104 31 88 61 20
336
May'OS
201 (499) 379
2,733 136
2,950
(2,360) 373 591
1,219
22 100 37 86 64
117 426
891 884 1,645
... ; ''.:" ;; . (964)'-" '(,(l;068ll"._:_(l,054
(256) (558) (499)
:>",. (708>":" '.J.I~10) · : · (555)
18 39
. ·'126!?:: ".(1,!;49).
($1.31)
555.5
21,550 -40.5% 17,442 -50.0%
m1
16.5%
26,831 rm 1m
148.6
$37.64 1m
$37.51 1.0>
15%
($2.77)
559.5
20,550 -90.5% 16,449
-113.0%
rm
27.0%
26,899 1111
1111
149.8
$44.24 1m
$35.37 1.3x
39%
42
"597)
($1.06)
562.8
19,560 -36.6%1 15,458 -46.4%
nm 47.3%
26,189 nm m1
195.3
$36.81 rliT
$34.21 l.lxl
16%
Q2 '08
639 (3,442)
858 7,771
414 6,240
(6,908); 863 (668~
2,325
87 309 100 252 188 158
1,094
3,419
Ql'OS
658 773 867
9,635 437
12,370
(8,863) 771 ~7
1,841
89 302 98
253 185 76
1,003
2,844
·. ''t4.087lh i·' . ::;663.
(1,313)
.J.2,774
99
.. (2,873"
($5.14) ($0.38)
559.3
20,560 -55.9% 16,454 -69.8%
"" 32.1%
26,189 m1
nm 167.1
$36.81 lilT
$34.21 l.lx"
. S7%!
174
489 24
. 46.5
$0.81 $0.72 572.8
21,617 8.6%1
17,497 10.6%
18.9% 26.3%1
28,088 52.5% 28.6% 142.8·
$50.99 15.7x
$39.45 1.3>
62%
. ··--·<l '.V
Second Quarter 2008 - Summary of Financial Results
QuarterTn!:nd
Q4 '07 Q3 '07
688 1,776
831 11,136
459 14,890
(10,500) 637
4,390
2,164
103 311 120 240 173 .51
996
674 1,612 1,071
10,910 472
14,740
(10,432) 478
4,308
2,124
91 282 128 224 170 84
979
Q2 '07
568 2,889 1,150
10,558 414
15,579
(10,067} 491
5,512
2,718
100 287 120 201 152 55
915
I
.1% Q2 '08 VetSUS
Ql 'OS Q2 '07
-3.%
11111
-I%
-19% 15%
-SO%
-22% 12% DID
26%
-2% 2%
2% Oo/e 1%
111% 9%
12% 11111
-25%
-26% 22%
-60%
-31%
76% urn
-14%
-13% 8%
-16% 25% 23%
190% 200/o
Year to Date 6 Morths Ended
2008 2007
1,297 (2,762) 1,725
17,405 944
18,610
(15,771) 1,634 2,839
4,166
175 612 198 504 373 235
2,097
1,109 5,809 2,000
19,647 809
29,374
(18,815) 832
1~9
5,206
184 552 218 395 298 127
1,775
3,161 3,103 I 3,6331 2o% -6% 6,262 6,981
.1%
~ vs. YTD'07
17% nm
-14% -II% 17%
-37%
-16%
96% -73%
-20%
-5% II% -9% 28% 25% 84% 18'lr,
-10%
..);.l29 · '1.205'1 '!::;.' it,879:lf2c ·~·,:: '.',tiup·~;'''('' ::··~~--;.-;:c:-.. ' · ·(3,424) '. . · 3,5.78 '''.' ·::~~ '·' iun
343 319 606 rm run (1,139) 1,159
·. 88~ ' . ' ' 887L'. -1,2731''~.:,: .. '."·lll!l ,;:,,;::,::.om:'.':·: . (2;28.!11 ;. ,.,~4:19,.
17
•.'87.0''·
$1.54 $1.42 563.7
21,018 16.6%
16,901 20.6%
28.0% 27.9%
28,556 49.3% 22.7% 139.6
$62.63 IO.Ix
$39.44 1.6x
62%
171 17
870t'"'' ~''"1,256 b:;i
$1.54 . $1.47
565.8
20,336 17.1%
16,456 21.1%
28.0%
26.4%
28,783 49.3% 22.7%; 136-0
$54.83 8.9xj
$38.29 1.4x
53%'
$2.21 $1.88 568.1
19,472 25.8%
15,880 31.6%
34.1%! 32.3%i
28,323 49.3% 16.6% 129.3
$73.38
8.Jxl $37.15
2.0>
48%·
1m
·om.·
1m
1m
-2%
-5% -64% -6%
-80%
IIIII
6%
-7% 1m
1m
17%
-28% 1m
-13%
-0.2x
-5'Ao
11111 123 34
: ''' 'om::·;•i· ··~··, .(2;408):··: :>'' 2,386' ·
IVD .... -2%
6% -82%
4% -101%
IIIII
0%
-8%
nm nm
29%
-50% nm
-8%
-0.9x
9%
($4.33) $0.52 555.5
20,839 -23.1% 16,725 -28.8%
-120.6% 33.3%
26,189 146.7% 73.9% 160.1
$36.81 -4.2x
$34.21 l.lx
63%
$4.17 $3.84 571.5
19,036 25.1%
15,521 30_7%
33.9% 32.4%
28,323 49.3% 16.8% 125.4
$73.38 8.8x
$37.15 2.0x
44%
rm
.:.:.~;~:;' .. : ~\D.Iq.
·:_'•2,;
266%
.nm
nm -86%'
-3%1 9%
-48% 8%
-60%1
-154.5%
0.9%
-8%,
97.4%' 57.0%1"
28%
-50%1 -IJ.Oxl
-8%
-0.9>
19%1
-~

CO
NFID
ENTIA
L TREA
TMEN
T REQ
UESTED
BY
LEHM
AN
BR
OTH
ERS H
OLD
ING
S, INC
.
r m m >< ~ G) s 0 0 0 w CD 0'1
(0,_ ' \
Second :Quarter 2008
Income Statement
Net Revenues
Net !~come
Earnings per Common Share:
Basic
Diluted
Diluted (Before effect of accounting change)
Financial Ratios
Return on Average Common Stockholders' Equity (annualized)
Return on Average Tangible Common Stockholders' Equity (annualized)
Pre-tax Margin
Compensation and Benefits/Net Revenues
Effective Tax Rate
Financial Condition
Total Assets
Net Assets
Long-Term Debt (excluding current portion)
Common Stockholders' Equity
Total Stockholders' Equity
Total Stockholders' Equity Plus Junior Subordinated Notes
Tangible Equity Capital
Total Long Term Capital
Book Value per Common Share
Gross Leverage Ratio
Net Leverage Ratio
Other Data
Stock Price
Employees
Assets Under Management (in billions)
Common Stock Outstanding (in millions)
Basic- Weighted Average Shares (in millions)
Diluted- Weighted Aver~~ Shares (in millions)
LEHMAN BROTHERS
, I
-~
)
Selected Statistical Information At or for the
Quarter Ended
5/3112008 2/29/2008
($668) $3,507
(2,774) 489
($5.14) $0.84
($5.14) $0.81
($5.14) $0.81
NM 8.6%
NM 10.6%
NM 18.9%
NM 52.5%
32.1% 26.3%
$639,432 $786,035
327,774 396,673
128,182 128,285
19,283 21,839
26,276 24,832
31,280 29,808
27,179 25,696
154,458 153,117
$34.21 $39.45
24.3x 3l.7x
12.1 15.4x
$36.81 $50.99
26,189 28,088
$277 $277
552.7 551.4
559.3 551.5
559.3 512.8
Second Quarter 2008 - Selected Statistical Information
At or for the Quarter Ended At or for the Quarter Ended
11/30/2007 m.!lWll 5/31/2007 2/28/20!!1 11/30/2006 8/3112006 5/3112006 2/28/2006
$4,390 $4,308 $5,512 $5,04'7 $4,533 $4,178 $4,411 $4,461
886 887 1,273 1,14~, 1,004 916 1,002 1,085
$1.60 $1.61 $2.33 $2.09 $1.83 $1.66 $1.81 $1.96
$1.54 $1.54 $2..21 $1.96 $1.72 $1.57 $1.69 $1.83
$1.54 $1.54 $2.21 $1.96 $1.72 $1.57 $1.69 $1.75
16.6% 17.1% 25.8% 24.4% 22.3% 21.0% 23.7% 26.7%
20.6% 21.1% 31.6% 29.9% 27.6% 26.1% 29.5% 33.5%
28.0% 28.0% 34.1% 33.7% 32.8% 32.7% 34.0% 34.8%
49.3% 49.3% 49.3% 49.3% 49.3% 49.3% 49.3% 49.3%
27.9% 26.4% 32.3% 32.5% 32.5% 33.0% 33.1% 33.1%
$691,063 $659,216 $605,861 $562,233 $503,545 $473,737 $456,202 $439,796
372,959 357,102 337,667 300,79'7 268,936 239,424 240,719 227,048
123,150 120,331 100,819 90,775 81,178 74,034 72,520 58,731
21,395 20,638 20,034 18,911) 18,096 17,301 16,887 16,398
22,490 21,733 21.129 20,00.5 19,191 18,396 17,982 17,493
27,230 26,647 25.650 23,01~ 21,929 21.088 20,699 20,116
23,103 22,164 21,881 19,487 18,567 17,724 17,402 16,834
145,640 142,064 121,948 110,78.0 100,369 92,430 90,502 76,224
$39.44 $38.29 $37.15 $35.15 $33.87 $32.16 $31.08 $30.01
30.7x 30.3x 28.7x 28.lx. 26.2x 25.8x 25.4x 25.lx
16.1x 16.lx 15.4x 15.4>. 14.5x 13.5x 13.8x l3.5x
$62.63 $54.83 $73.38 $73.31 $73.67 . $63.81 $66.61 $72.98
28,556 28,783 28,323 27,090 25,936 24,775 23,387 22,919
$282 $275 $263 $236 $225 $207 $198 Sl88
531.9 529.4 530.2 534.9 533.4 530.3 540.3 538.3
542.6 540.4 538.2 540.9 539.2 540.9 545.1 546.3
563.7 565.8 568.1 575.4- 573.1 573.3 582.8 584.2
4

CO
NFID
ENTIA
L TREA
TMEN
T REQ
UESTED
BY
LEHM
AN
BR
OTH
ERS H
OLD
ING
S, INC
.
r m m >< ~ G) s 0 0 0 w CD en
Second Quarter 2008 - Business Segment Quarterly Trend Second Quarter 2008 - Business Segment Quarterly Trend
Segment Revenues ($ in millions)
Investment Banking: Debt Equity Advi!;ol)'
I i.;vistment Banking Revenues Pre-Tax Operating Income Pre-Tax Operating Margin%
Capital Markets: Fixed Income
uities Caf!ital Markets Revenues Pre-Tax Operating Income Pre-Tax Operating Margin%
Investment Management:
288 330 240 858 193
22.4%
(2,975) 601
(2,374) (4,509)
nm
Q4 '07
322 233 214 210 330 388 867 831 182 207
21.0% 24.9%
262 727 1,410 2,000 1,672 2,727
237 761 14.2% 27.9%
,:_ \ ~2(1 __ Q'Lii :,, Q3 '07 Q2'07 Q4'06
350 540 428 378 296 334 175 224 425 277 247 256
1,071 1,150 850 858 288 338 189 135
26.9% 29.4% 22.2% 15.7%
1,058 1,901 2,172 2,135 1,377 1,692 1,329 900 2,435 3,594 3,502 3,035
715 1,354 1,369 1,191 29.4% 37.7% 39.1% 39.2%
·-· I --· .. Full Year'\--• ....... , .. ,.
2007 2006 2005
348 289 410 1,551 1,424 1,304 183 208 199 1,015 815 824 195 I' 244 226 1,336 921 766 726 741 835 3,903 3,160 2,894 131 164 230 1,022 660 856
18.1% 22.1% 27.6% 26.2%. 20.9% 29.6%
2,010 2,200 2,102 5,859 8,447 7,334 837 878 944 6,398 3,559 2,473
2,847 3,078 3,046 12,257 12,007 9,807 1,114 1,213 1,202 4,199 4,720 3,570 39.1% 39.4% 39.5% 34.3% 39.3% 36.4%
AssetManagement 496 618 533 468 460 416 368 349 347 368 1,877 1,432 1,026 Private Investment Management 352 351 299 334 308 279 272 256 245 212 I ,220 985 903
I InvestmentManagementRevenues 848 968 832 802 768 695 640 605 592 580 3,097 2,417 1,9291 Pre-Tax Operating Income 229 245 261 202 188 141 163 122 121 119 791 525 403 Pre-Tax Operating Margin % 27.1% 25.3% 31.4% 25.2% 24.4% 20.3% 25.5% 20.1% 20.5% 20.6% 25.6% 21.7% 20.9%
I 'Total, Lehman Revenues· .. <- -· ·-- _i. ,< ·- · :;- '(668) 3;507:', :~·-< ;.&,391> '.4,308:_ ·· : 5,512 · 5,047 · -· 4,533• )·' 4,178 ' 4,411 • :4;4(!11(<: :. -'- >19,258 · ·' • 17,5~-~-14,6311 Pre-Tax Operating Income (4,087) 663 1,229 1,205 - 1,879 1,699 1,489 1,367 1,498 1,551 6,013 5,905 4,829 Pre-Tax Operating Margin% nm 18.9% 28.0% 28.0% 34.1% 33.7% 32.8% 32.7% 34.0% 34.8% 31.2% 33.6% 33.0%
- JHMAN BROTHERS ')5 -~-. :J
I

CO
NFID
ENTIA
L TREA
TMEN
T REQ
UESTED
BY
LEHM
AN
BR
OTH
ERS H
OLD
ING
S, INC
.
r m m >< ~ G) s 0 0 0 w CD .......
/-:--'·1'-,'
LEHMAN BROTHERS
~'""" . ,,
Balance Sheet Analysis 02 2008 SEC Review July 16, 2008
I'
4 ' t4 'y
Confidential Presentation

CO
NFID
ENTIA
L TREA
TMEN
T REQ
UESTED
BY
LEHM
AN
BR
OTH
ERS H
OLD
ING
S, INC
.
r m m >< ~ G) s 0 0 0 w CD co
··.'<Table of Contents 1.· Table of Contents
2. 'Statement of Financial Condition
3 .. Statement of Financial Condition (Cant)
4 .. :Eq-uity Roll-forward
5·: Balance Sheet Leverage
6. ·. Analysis of Long Inventory Owned
?.<;Analysis of Short Inventory
E( 'Analysis of Corporate [~~btand Other .Inventory (Longs and Shorts)
9. Mortgage~ and Asset-: Backed Securities· Qu~rterly Comparison .
1·0. Mo~gages and Asset-Backed Securities Quarterly Comparison (Cant)
11. Commercial Mortgage and Real Estate Investments
1i Commercial Mortgage Assets- Top 10 Holdings
13. Real Estate Held for Sale - Top 1 0 Holdings
14. Global Real Estate By Property Type
15. Analysis of Corporate Equities Inventory Analysis (Longs and Shorts)
16. Analysis of Other Secured Borrowings
17. Analysis of Short-Term Borrowings
-_~MAN BROTHERS _)
-\l /
I'
··i
-~.-· ·::-
,.-.... \ i
;'
••

CO
NFID
ENTIA
L TREA
TMEN
T REQ
UESTED
BY
LEHM
AN
BR
OTH
ERS H
OLD
ING
S, INC
.
r m m >< ~ G) s 0 0 0 w CD CD
<~~. ~ J Statement of Financial Condition
I ($Billions)
CURRENT CHANGE ACCOUNT DESCRIPTION 5/31/08 2/29/08 INC/{DEC) % EXPLANATION
CASH & CASH EQUIVALENTS 6.5 7.6 (1.1) -14% Primarily a decline in interest bearing deposits.
CASH AND SECURITIES SEGREGATED AND ON DEPOSIT 13.0 16.6 (3.5) -21% Mainly related tp· a decrease in excess cash from client, Chinalco, in FOR REGULATORY AND OTHER PURPOSES their acquisition of Rio Tinto. Seg cash and related cash dividends
were transferred back to Chinalco after transaction was completed in April.
FINANCIAL INSTRUMENTS & OTHER INVENTORY POSITIONS OWNED 269.4 326.7 (57.2) -18% $(17.8)decrease in Gov'ts, $(12.1) in Mortgages &ASS, $(10.1) in Corporate Debt, $(8.6) in Equities and $(8.6) in Derivatives.
COLLATERALIZED LENDING AGREEMENTS:
SECURITIES PURCHASED UNDER AGREEMENTS TO RESELL 169.7 210.2 (40.5) -19% Decrease is primarily driven by Global Rates and Liquid Market Financing.
SECURITIES BORROWED 124.8 158.5 (33.7) -21% Decrease driven by Liquid Market Financing and Equity Financing.
RECEIVABLES:
BROKERS, DEALERS AND CLEARING ORGANIZATIONS 16.7 11.9 4.8 40% $7.7 increase in primarily in TO accrual, offset by decrease of $(1.5) in Future margin and $(1.8) in Fail to deliver.
CUSTOMERS 20.8 37.3 (16.5) -44% $(10.0) mainly ~~ue to decrease in Fail to deliver. $(8.5) in Prime broker Margin Debits. $2.0 increase due to pending loan trades.
OTHERS 4.2 3.2 1.0 33% Increased receivables related to servicer advances and pending settlement of an Asia securitized deal in June.
PROPERTY, EQUIPMENT AND LEASEHOLD IMPROVEMENTS 4.3 4.2 0.1 2%
OTHER ASSETS 5.9 5.9 (0.0) 0%
IDENTIFIABLE INTANGIBLE ASSETS AND GOODWILL 4.1 4.1 10.0\ 0%
TOTAL ASSETS 639.4 786.0 (146.6) -19%
LEHMAN BROTHERS 2

CO
NFID
ENTIA
L TREA
TMEN
T REQ
UESTED
BY
LEHM
AN
BR
OTH
ERS H
OLD
ING
S, INC
.
r m m >< ~ G) s 0 0 0 ~ 0 0
Statement of Financial Condition (Cont.) .($Billions) I
CURRENT CHANGE ACCOUNT DESCRIPTION 5/31/08 2/29/08 INC/( DEC) % EXPLANATION
SHORT-TERM BORROWINGS AND CURRENT PORTION OF LONG-TERM 35.3 34.5 0.8 2% BORROWINGS
FINANCIAL INSTRUMENTS AND OTHER INVENTORY POSITIONS 141.5 196.9 (55.4) -28% $(45.0) decrease in Gov't and Agencies, $(11.9) in Derivatives, offset SOLD BUT NOT YET PURCHASED by $2.1 inc$ase in Coporate Equities.
COLLATERALIZED FINANCING:
SECURITIES SOLD UNDER AGREEMENTS TO REPURCHASE 127.8 197.1 (69.3) -35% l Combined Repo & Sec. len<ing '""""'' by 1{68. 7): Fioooclng SECURITIES LOANED 55.4 54.8 0.6 1% elements of Firm Balance Sheet managed in aggregate by Prime
Services.
OTHER SECURED BORROWINGS 24.7 24.5 0.1 0% Mainly driven by an increase in QSPE with derivatives for Securitized Products and Equity STG group, offset by a decrease in FAS140 Gross-up of Muni TOB program.
PAY ABLES:
BROKERS, DEALERS AND CLEARING ORGANIZATIONS 3.8 11.7 (7.9) -67% Primarily driven by a decrease in Broker dealer Fail to receive
CUSTOMERS 57.3 72.8 (15.6) -21% $(6.7) decrease in Fails to receive; $(6.7) in Prime Broker Shorts; and ${1.2) customer payables related to Futures activity.
ACCRUED LIABILITIES AND OTHER PAY ABLES 10.5 11.6 (1.1) -9% Decrease driven by a decline in Federal IRS tax accruals based on the YTD pre-tax loss.
DEPOSITS AT BANKS 29.4 28.8 0.5 2% Increase in LCBC's issuance of callable COs.
LONG-TERM BORROWINGS:
SENIOR NOTES 110.6 112.1 {1.6) -1%
SUBORDINATED NOTES 17.6 16.2 1.5 9%
TOTAL LIABILITIES· 613.9 761.2 {147.3) -19%
TOTAL STOCKHOLDERS EQUITY 25.6 24.8 0.7 3%
TOTAL LIABILITIES & STOCKHOLDERS EQUITY 639.4 786.0 (146.6) -19%
)'HMAN BROTHERS .-·-> 3 ~·-r-..... ..
\

CO
NFID
ENTIA
L TREA
TMEN
T REQ
UESTED
BY
LEHM
AN
BR
OTH
ERS H
OLD
ING
S, INC
.
r m m >< ~ G) s 0 0 0 ~ 0 ....Jo.
/iZ,_
Equity Rollforward ($ Millioans)
LBHI Cornrnon Equity- Beginning of period
/-"':- .. ~.
M-.rch 2008
April 2008
May 2008
$2'1.838 $2"1.~_63 $19.838
FIN4B Adjustment to Opening Retained Earnings (booked in Feb OS)
LBHI Cornrnon Equity- Beginning of' period
Net Income
Treasury Stock Buybacks Open Merket PurchasE'S Tenders for p"'yment of tJw- RSU's Tenders for payment of tfw - Options's Tenders for Cost of Options
Structured Share R'epurchase
Dividends - Common -Preferred Series C - Preferred Series 0 - Preferred Series F - Preferred Series G - Preferred Series J - Preferred Series P
RSU & Stock Option Arnort.iZI!IItion
F/X
Other Comprehensive Income - non-CTA hedging
Other Comprehensive Income -additional activity
Options Exercised -Tax Effect
Tax Benefit on RSU Issuances
RSU Interest Income
Other: Feb- Series J Preferred Stock Issuance costs OS
LBHI Total Common EquH:y - End o'f period
Goodwill (net of amortization)
LBHI Total Tangible Common Equity- End o'f period
LBHI Preferred Stock
LBHI Convertible Preferred - Series P
CMS I Euro Preferred Issuance
Perpetual Preferred Issuance
MCAPS Preferred Issuance
Plus preferred stock issued by Trust
21 838
(70S) (1,510) (555)
I' ( 11) (49) (~)
(3) (2) (30) (2) (0) (1) (0) 0 0
(0) (94) (1) (1) (1) (1) (1) (1) (2) (2) (2) ( 1) (1) (1)
(13) (13) (13) (22) (24)
139 134 171
(5) 1 (4)
(39) 17 15
64 19 15 9 4 (13)
(9)
(0) (0) (0)
$21,263 $1~_._!~38 _$"199283
($4,105) ($4,102) ($4,101)
$17.158 $15,736 $15.181
$2,993 $2,993 $2,993·
4,000 4,00()·
1,483 "1,474 "1,469•
818 838 8351
"1,475 1,475 1,475i
"1.225 "1,225 '1,22Si
Q2
2008 YTD 2008
2'1,838 2"1 .395
0 (178)
21E838 21;218
(2,774) (2,285)
(68) (764) (36) (83)
(3) (24) (0) (2)
0 0 5
0 (94) (188)
(4) (7) (3) (6) (6) (11) (3) (7)
(38) (46) (46) (46)
444 1,379
(9) (16)
(7) (31)
0 (3)
99 205 0 45
(9)_ (8)
(0) (0)
0 (42)
"19~283 .... 9,283
($4,101) ($4,101)
$15,181 $15,"181
2,993 2,99~
4,000 4,000
1,469 1,469
835 835
1,475 "1,475
"1.,225 1,225
Tote,l Equity $ 29.256 $ 31,842 $ 3"1,279 $ 31,279 $ 31 ,279
Total Leverage Equity $ 25 .. 151 $ 27,740 s --~7."178\ $ 27,178 $ 27.178
LEHMAN BROTHERS· 4
~-"il .· j, I
I

CO
NFID
ENTIA
L TREA
TMEN
T REQ
UESTED
BY
LEHM
AN
BR
OTH
ERS H
OLD
ING
S, INC
.
r m m >< ~ G) s 0 0 0 ~ 0 1\)
Balance Sheet Leverag_e ($Millions)
Total Assets Less:
Net Assets
Segregated Cash & Securities Rewrse Repos Securities Borrowed Identifiable intangible assets & goodwill
Preferred Equity Common Equity
Total Stockholders Equity Tangible Equity Capital
Gross Leverage Net Leverage
Q2 2008 Q1 2008 Q4 2007 Q3 2007 Q2 2007 Q1 2007 Q4 2006 Q3 2006 Q2 2006 Q1 2006 Q4 2005 Q3 2005 Q2 2005
639,432 786,035 691;063 659,217 605,861 562,283 503,545 473,737 456,202 439,796 410,063 384,295 370,595
13,031 16,569 12,743 10,579 7,154 6,293 6,091 5,736 6,810 5,569 5,744 4,531 3,935 169,684 210,166 162,635 144,774 130,953 131,896 117,490 116,427 100,901 110,005 106,209 98,855 83,278 124,842 158,515 138,599 142,653 126,435 119,766 107,666 108,786 104,475 93,892 83,430 83,439
4,101 4,112 4,127 4,108 3,652 3,531 3,362 3,SM 3,296 3,282 3,256 3,262 3,286 327,773 396,674 372,958 357,103 337,668 300,798 - 268,936 239,424 240,719 227,047 211,424 194,207 193,989 ~ ~~ 1- 1- 1- 1~ 1- 1- 1- 1- 1- 1- 1.
19,283 21,838 21,395 20,638 20,034 18,910 18,096 17,301 16,887 16,398 15,699 15,239 14,784 26,275 24,831 22,490 21,733 21,129 20,005 19,191 18,396 17,982 17,493 16,794 16,334 15,879 27,178 25,695 23,103 22,164 21,881 19,488 18,567 17,724 17,403 16,834 15,564 14,863 14,099
24.3x 12.1x
31.7x 15.4x
30.7x 16.1x
30.3x 16.1x
28.7x 15.4x
28.1x 15.4x
26.2x 14.5x
25.8x 13.5x
25.4x 13.8x
25.1x 13.5x
24.4x 13.6x
23.5x 13.1x
23.3x 13.8x
450,000 18
400,000 17
350,000 16
300,000 15
~250000 14 E '
~200,000 13 12
150,000 11
~~ll,l,l,l,l,l,l,l,l,l,l,l,li~ mm~m~moommm~m~moom~m~m~~oo~m~
1-Net Asset;--+- Netlewrage l
-~JiMAN BROTHERS -->,5 /
~----..,
) 1 /
I

CO
NFID
ENTIA
L TREA
TMEN
T REQ
UESTED
BY
LEHM
AN
BR
OTH
ERS H
OLD
ING
S, INC
.
r m m >< ~ G) s 0 0 0 ~ 0 w
.. ·~··~ /::~~ 1}1,
Analysis of Long Inventory Owned ($Millions)
Government Securities·
Corporate Debt and Other
Mortgages and Asset-backed Securities
Real Estate Held for Sale
Corporate Equities
Commercial Paper and other Money Market Instruments
Derivatives and other contractual agreements
US Treasur-Ies and Agencies US Treasuries US Agencies - Debentures US Agencies - Mortgages
Non US Countries Municipal Bonds Sub-Total Government Securities
US Securities Non-US securities US Loans Non-US Loans Commodities Sub-Total Corporate Debt and Other
Residential SP Resi America SP Resl Europe SP Resi Asia COO FAS140 Gross-up IMD Traded Securities GTS Other Businesses
Subtotal Residential Cqmmercial
i!ff!1l.
Real Estate Whole Loans Securities
Other Businesses Subtotal Commercial
SPAmerica COO AMERICA: GTS AMERICA: Other Businesses Other Asset .P-cjjustment
Subtotal ABS Sub-Total Mortgages and Asset-backed Secu,.-ities
Real Estate Held for Sale
Equities - US Equities - Foreign Sub-Total Corporate Equities
Over The Counter lnt Rate, Currency & Credit Default Swaps And Options Foreign Exchange Fwd Contracts & Options Equity Contracts (lncl Equity Swaps. Warrants. And Options) Other Fixed Income Securities Contracts (lncl TBAs & Forwards) Exchange Traded Equity Contracts (lncl Equity Swaps. Warrants. And Options) Sub-Total Derivatives and Other Contractual Agreements
I'
-~·,., --,.,
May 08 vs Feb 08 05/31/08 02/29/08 Change +/(-)
2.858 3,638 (780) 3.407 5,693 (2.286) 8.625 9,647 (1,021 ). 8.058 17,120 (9,062) 4,040 8,476 (4,436)
26,988 44,574 (17,5861
8.970 10,033 (1.063) 13.404 15,803 (2.400) 16.371 21,290 (4,919) 10,727 12,224 (1.497)
528 399 129 49,999' 59,749 '(9,750)
23.123 27.482 (4.358) 10,604 10,600 4
665 699 (33) 700 1,206 (506) 184 996 (812) 66 66
438 438 35,780 40,982 (5,202)
19,473 25,352 (5,879) 9.604 11.229 (1,625)
634 634 29,711 36,581 (6,869)
5,782 7.565 (1.783) 1.033 612 421
163 163 54 54
(62) (1,131) 1,069 6,970 Z.046 !76)
72.461 84.609 (12.148}
20,664 -- - ;!;!,562 (1.898)
26,596 31.568 (4.972) 20,952 - 24,551 (3,5~~)
47,548 56,119 (8,571)
4,757 J.433 1.324
25,648 2,383 6,022
10;341
31,082 3,087 6,330
11,856
(5.433) (704) (308)
(1.515)
2.597 3.257 (6§()) 46,991 ~5.612 (8,620}
f<:RA.-iiiDTo T .AL- 269.409 326,658 -- (57.249f]
LEHMAN BROTHERS 6
I

CO
NFID
ENTIA
L TREA
TMEN
T REQ
UESTED
BY
LEHM
AN
BR
OTH
ERS H
OLD
ING
S, INC
.
r m m >< ~ G) s 0 0 0 ~ 0 ~
Analysis of Short Inventory ($Millions)
Government and Agencies
Corporate Debt and Other
Mortgages and Asset-Backed Securities
Corporate Equities
Commerical Paper and other Money Market Instruments
Derivaitves and other Contractual Agreements
GRAND TOTAL
JHMAN BROTHERS
US Treasuries and Agencies Municpal Bonds Non-US Countries
Sub-Total Government and Agencies
US Securities Non-US Securities
Sub-Total Corporate Debt and Other
Equities - US Equities - Foreign
Sub-Total Corporate Equities
Over-the Counter Interest Rate, currency, and credit default swaps and options
Foreign exchange forward contracts and options
I'
Equity Contracts (including equity swaps, warrants, and options) Other fixed income securities contracts (including TBAs and forwards) Exchange Traded Equity Contracts (including equity swaps, warrants, and options)
Sub-Total Derivatives and other Contractual Agreements
l;7 }
May 08 vs Feb 08 05/31/08 02/29/08 Change
41,093 74,692 (33,599) 162 203 (41)
22,476 33,864 (11,388)
63,731 108,759 (45,029)
2,713 4,012 (1,298) 5,631 4,727 904
8,344 8,738 @94)
351
12,248 30,937
43,185
12
9,733
2,270
6,392
5,692
1,799
25,885
141,507
.552
11,372 29,663
41,035
12
15,248
3,679
9,309
7,827
1,744
37,807
196,902
(201)
876 1,274
2,150
(0)
(5,514)
(1 ,409)
{2,917)
(2, 136)
55
{11,922)
(55,395)
,:·J.
I

CO
NFID
ENTIA
L TREA
TMEN
T REQ
UESTED
BY
LEHM
AN
BR
OTH
ERS H
OLD
ING
S, INC
.
r m m >< ~ G) s 0 0 0 ~ 0 0'1
/ .·~-it- '"'~""'\
At:dlysis of Corporate Debt ano· jther Inventory (Longs & Shorts)
{$Millions)
1- Long - Corporate Debt & Others I I Short- Corporate Debt & Others I
May08 February 08 May08
CORPORATE BONDS CORPORATE BONDS I'
I
Domestic Domestic CONVERTIBLES 848 1,057 CONVERTIBLES 265 CORPORATE 8,122 8,976 CORPORATE 1,624
8 970 10,033 OTHERS 824 2 713
Foreign Foreign CONVERTIBLES 3,136 4,865 CONVERTIBLES 99 CORPORATE 7,807 8,250 CORPORATE 5 532 OTHERS 2 460 2 689 5,631
13,403 15,804
CORPORATE LOANS
US Corporate Loans 16,371 21,290 Grand Total (GL) 8,344
Foreign Corporate Loans 10,727 12,224
OTHERS 528 398
Grand Total (GL) 49,999 59,749
LEHMAN BROTHERS 8
-~
·'9 f
February 08
213 3,578
221 4 012
156 4 570
4J26
8,738
I

CO
NFID
ENTIA
L TREA
TMEN
T REQ
UESTED
BY
LEHM
AN
BR
OTH
ERS H
OLD
ING
S, INC
.
_Mortgages & Asset-Backed Securities Quarterly Comparison ------
I ($Millions) I May-08 I I Feb-08 I I May-08 vs Feb-08 I Actual Actual Variance
Total Balance Balance at Total Balance Balance at Total Balance Resi.dential Baiance at Risk Gross-up Sheet Risk Gross-up Sheet Risk Gross-up Sheet
SP- RES I AMERICA: Wlole Loans Wlole Loans 4,107 4,107 6,627 6,627 (2,520) (2,520)
FAS 140: OSPE will Derivalves 8,583 8,583 6,882 6,882 1,702 1,702 Sub-total Whole Loans 4,107 8,583 12,691 6,627 6,882 13,509 (2,520) 1,702 (818)
Securities Relained lnlerest (I G) 4,139 4,139 7,344 I' 7,344 (3,205) (3,205) Retained lnlerest (NIG) 1,638 1,638 1,339 1,339 299 299 TradedMBS 2,914 2,914 2,905 2,905 9 9 Traded COO 75 75 725 725 (650) (650) Sub-total Securities 8,767 8,767 12,313 12,313 (3,546)' (3,546)
Servicing Sub-total Servicing 1,666 1,666 1,660 1,660 6 6
Sub-total SP- Resi America 14,540 8,583 23,123 20,600 6,882 27,482 (6,060) 1,702 (4,358)
S P- RES I EUROPE: WloleLoa115 Wlole Loans 3,651 3,651 4,956 4,956 (1,305) (1,305)
Gross-Up 1,262 1,262 1,142 1,142 120· 120 Sub-lola/ Whole Loans 3,651 1,262 4,913 4,956 1,142 6,098 (1,305) 120 (1,185)
Securities Relained Interest (IG) 645 645 645 645 Relained lnterest(NIG) 619 619 184 184 436 436 Traded Securiles 4,426 4,426 3,673 3,673 753 753 Sub·lotal Securities 5,691 5,691 4,502 4,502 1,189 1,189
Sub•total SP- Resi Europe 9,342 1,262 10,604 9,458 1,142 10,600 (116) 120 4
SP- RES I ASIA: Wlole Loans 487 487 330 330 157 157 Securities 178 178 369 369 (191) (191)
Sub-total Rest Asia 665 665 .699 699 (33) (33)
GLOBAL SECURITIZED PRODUCTS: 24,547 9,845 34,393 30,756 8,024 38,780 (&,209) 1,821 (4,388)
COO:. FAS140 Gross-up -S~uclured Credit Trades 700 700 1,206 1,206 (506) (506)
I MD: Securities Prirre 123 123 996 996 (873) (873) Sub-prirre 61 61 61 61
184 184 996 996 (812) (812)
GTS: Securities Prirre 66 66 66 66
r Sub-prine
66 66 -·~-66 ____ -----6-6
m m MUNIS: Wlole Loans 5 5 >< Securmes 15 15 15 15 I
RATES: :E Securities 86 86 86 86
G) Prime services- Equity STG: FAS 140: QSPE witl Derivalves 333 333 333 333
s _SIJB·TOTAL RESIDEN11AL 24,902 10,878 35,780 31,752 9,230 40,982 (6,850) 1,648 (5,202)
0 0 0 ~ 0 -
]HMAN BROTHERS .. ·-·w en ,, .......... \ }

CO
NFID
ENTIA
L TREA
TMEN
T REQ
UESTED
BY
LEHM
AN
BR
OTH
ERS H
OLD
ING
S, INC
.
r m m >< ~ G) s 0 0 0 ~ 0 ......
,.,. --.. , ... . . . ~~ .~-,.,...'1-'' I
~ ,, )
Mortgages & Asset-Backed Securities Quarterly Comparison Cont. I
1- May-08 I I Feb-08
I I May-DB vs Feb-08 ($Millions) Actual Actual Variance
Total Balance Balance at Total Balance Balance at Total Balance Commerical Balance at Risk Gross-up Sheet Risk Gross-up Sheet Risk Gross-up Sheet
REAL ESTATE· Global · Wlole loans Wlole loans 19,233 19,233 24,881 I' 24,881 (5,648) (5,648)
FAS 140: QSPE wilh Derivaives 240 240 471 471 (~31) (231)
Securities Equitj & Bridge Equity 2,338 81 2,419 2,649 2,649 (311) 81 (230) Securiles 668 668 3,309 3,309 (2,641) (2,641) NPls 1,911 1,911 1,801 1,801 110 110
F AS 140: Relained lnlaresl 1,038 1,038 (1,038) (1,038) . Relained lnlarest (IG) 4,304 4,304 2,400 2,400 1,904 1,904
Relained lnlarest (NIG) 302 302 32 32 270 270 Sub-lola/ Securities 9,523 321 9,604 11,229 11,229 (1,706) (150) (1,625)
Sub-total Real Estate 28,756 321 29,on 36,110 471 36,581 (7,354) (150) (7,504) IMD·AMER: Wlole loans 561 561 - - 561 561
Securiles 5 5 5 5
SP- ASIA: Wlole loans 69 69 69 69
SUB-TOTAL COMMERCIAL 29,390 321 29,711 36,110 471 36,581 (6,720) (150) (6,869)
Asset-Backed Securities SP- AMERICA:
Wlole loans Wlole loans 2,004 2,004 2,072 2,072 (68) (68) FAS 140: QSPE witl Derivaives 488 488 493 493 (5) (5) Sub-lola/ Whole Loans 2,004 488 2,492 2,072 493 2,565 (68) (5) (73)
Securi~es Relained lnlerest (I G) 1,804 1,804 8 8 1,796 1,796 Relained lnleresl (NIG) 488 488 589 589 (101) (101) Traded Securities 967 967 4,369 4,369 (3,402) (3,402) Sub-lola/ Securities 3,259 3,259 4,966 4,966 (1,707) (1,707)
Servicing 31. 31 34 34 (3) (3)
Sub-total SP- America 5,294 488 5,782 7,072 493 7,565 (1,n8) (5). (1,783)
CDO-AMER: Securiles 1,033 1,033 612 612 421 421 GTS-AMEA: Securiies 163 163 163 163 IMD-AMER: Securiies 40 40 40 40 RATES AMER: Securiles 14 14 14 14 OTHER ASSET ADJUSTMENT: (62) - (62) (1,131) - (1,131) 1,069 . 1,069
SUB-TOTAL ASSET·BACKI;D SECURiliES 6,482 488 6,970 6,553 493 7,046 (711 (51 (76j
TOTAL MORTGAGES .&'ASSET-BACKED SECURiliES • -~:_i_r~~ ~,. :, 60,Tr4;,:. ''/;: 11,687 •• 72,4§!:_ -~I~415~ '"-- .;·.1o,1g.j.'·.c._C::_B4,609 (13,64t)i: . '•1,493 (12,148)
LEHMAN BROTHERS 10
I
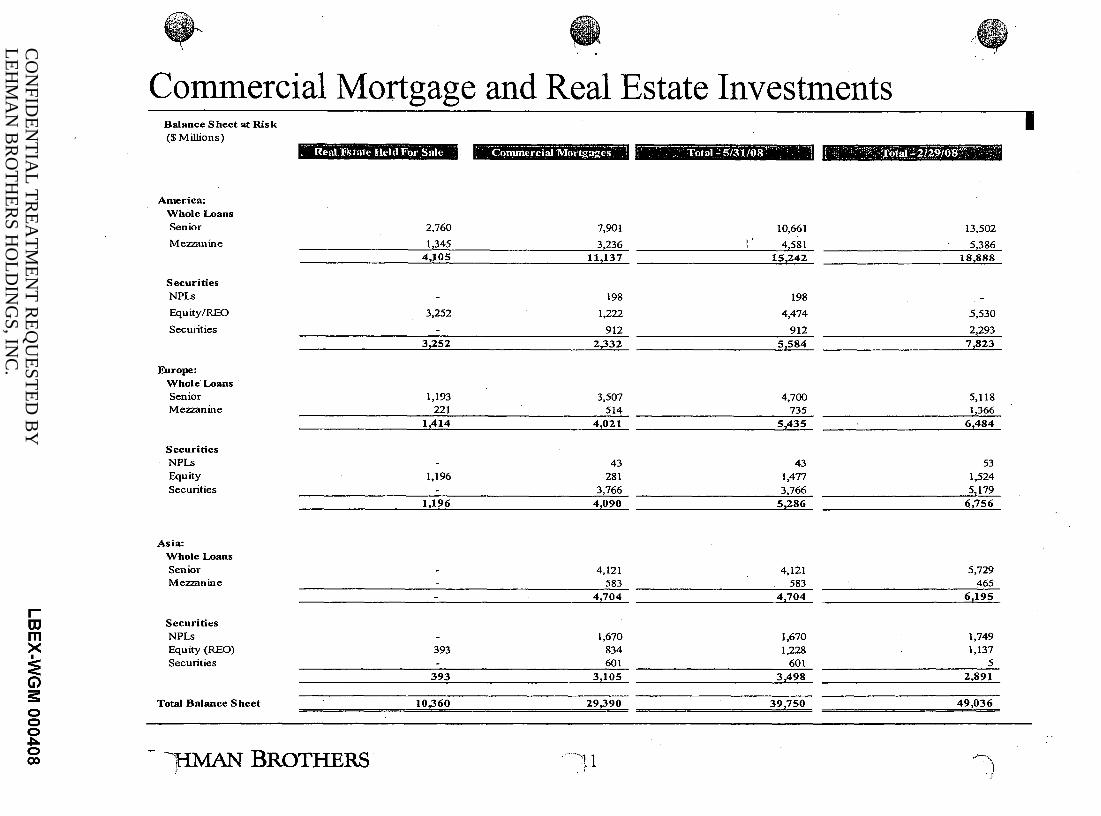
CO
NFID
ENTIA
L TREA
TMEN
T REQ
UESTED
BY
LEHM
AN
BR
OTH
ERS H
OLD
ING
S, INC
.
r m m >< I
:E G) s 0 0 0 ~ 0 co
Commercial Mortgage and Real Estate Investments Balance Sheet at Risk ($Millions)
[-- Real-Estate lleld-For-Sale -, ~-- ~-- _,_ ~---- ------ • --· -- ---~~"'!
· Commer_cial Mortgages _:
America: Whole Loans Senior 2,760 7,901
Mezzanine 1,345 3,236 4,105 11,137
Securities NPLs 198
Equity/REO 3,252 1,222
Secmities 912 3 2252 2232
Europe: Whole· Loans Senior 1,193 3,507 Mezzanine 221 514
1,414 4 021
Securities NPLs - 43 Equity 1,196 281 Securities - 3,766
1,196 4,090
Asia: Whole Loans Senior - 4,121 Mezzanine - 583
4 704 --------·
Securities NPLs - 1,670 Equity (REO) 393 834 Securities - 601
393 3,105
Total Balance Sheet 10,360 29,:J_90
- IHMAN BROTHERS ---,,1 1 •'
!
f-~-~TotnT:--5[31/os~~. -·--l r-:-:-'· _:·-~. -).'otil_;2,~?ro~"7:'
10,661 13,502 I, 4,581 5,386
15,242 18,888
198
4,474 5,530
912 2,293 5 584 7,823
4,700 5,118 735 1,366
5 435 6,484
43 53 1,477 1,524 3,766 5,179
5,286 6,756
4,121 5,729 583 465
4 704 6,195
1,670 1,749 1,228 1,137
601 5 3,498 2,891
39,750 49,036
.. ~, )
J.'
I

CO
NFID
ENTIA
L TREA
TMEN
T REQ
UESTED
BY
LEHM
AN
BR
OTH
ERS H
OLD
ING
S, INC
.
r m m >< ~ G) s 0 0 0 ~ 0 CD
;~ J ! !j, . -' \
Commercial Mortgage Assets- Top 10 ($Millions)
Name Product Type Property Type
AMERICAS
Archstone Loan Multifamily 2 Heritage Fields Loan Land/SF 3 237 Park Loan Office 4 GM Building Loan Office 5 Carillon Loan Condo 6 Austin EOP/Portfolio Loan I Equity Office 7 Ritz Kapalua Loan Hotel/Condo 8 Grand Prix (Innkeepers USA Trust} Loan Hotel
25 Broad Loan Multifamily 10 Project Deuce Loan Office
OTHER
TOTAL AMERICAS
EUROPE 1 Di\ersity Funding Securities Other PT 2 Green Securities OlherPT 3 Windemere 12 Securities OtherPT 4 Gospel Loan Mixed-Use 5 Protege Loan Retail 6 Goodwater Loan Office 7 Fortezza Loan Mixed-Use 8 Sun & Moon Loan Retail 9 Eagle I Loan Mixed-Use 10 Yellow Loan Office
OTHER
TI)TAL EUROPE
ASIA DTC9 Class A-1 Securities Other PT
2 RCC Securitization VII Loan Mixed-Use 3 Project Cowboy Debt Retail 4 Clearth Subordinate Loan SP2 Debt OtherPT 5 Crescent Heights Debt Multifamily 6 Leo Palace loan portfolio Debt Multifamily 7 Jingumae (Cannelle} Debt Land/SF 8 Pearicily Hotel Debt Retail 9 AZUSA 1 Loan Other PT 10 Project Equus TMK Bond Debt Mixed-Use
OTHER
TOTAL ASIA
[TOTAL MAY 08 COMMERICAL MORT~AGE ASSETS_ -----
[TOTAL FEB 08 COMMERICAL MORTGAGE ASSETS
LEHMAN BROTHERS 12
~ .. j ',.'' .
Holdings Region I State BS at Risk Gross Up GrossBS
I Multi Slate 530 0 530 CA 503 0 503 NY 462 0 462 NY 435 0 435 FL 192 220 412 1X
I' 402 0 402
HI 368 0 368 Multislale 368 0 368 NY 343 0 343 Multi Stal€1 312 0 312
9,554 0 9,554
13,469 220 ~689
UK 1,640 0 1,640 Gennany 764 0 764 France 520 0 520 UK 564 0 564 Sweden 491 0 491 Gennany 415 0 415 rr 267 0 267 France 223 0 223 Gennany 181 0 181 Gennany 168 0 168
2,879 0 2,879
8,111 0 ~111
Japan 320 0 320 Japan 130 81 210 Japan 206 0 206 Japan 199 0 199 Japan 195 0 195 Japan 194 0 194 Japan 169 0 169 Japan 168 0 168 Japan 161 0 161 Japan 155 0 155
5,911 20 ~ 7,809 101 7,910
29,390 321 29,711 I 36,110 471 36,581

CO
NFID
ENTIA
L TREA
TMEN
T REQ
UESTED
BY
LEHM
AN
BR
OTH
ERS H
OLD
ING
S, INC
.
r m m >< ~ G) s 0 0 0 ~ ...Jo.
0
Real Estate Held for Sale Detail- Top 10 Holdings ($Millions)
AMERICAS
EUROPE
ASIA
SECURITY Project Trois
2Prologis 3 SlDICal (excl Sw1cal Master Ill) 4 Rosslyn 5 200 Fifth Ave Syndication 6 lB Atlanta 7 Greenwich Place 8 Commons ofMcLean 9 Orlando Assets Acquisition
1 0 LB Bell Road Other(SeeNote I) TOTAL AMERICAS
SECURITY Coew· Derense
2 Devonshire House 3 Octopus 4 Vintners 5 Reva 6 Landnruk 7 E-Shelter Fmnkfin1 8 Kapiteeli 9 Kwik Save
1 0 Boultbee Radisson Other TOTAL EUROPE
SECURITY 1 Tokyo Prop - Real estate investment in Roppongi Area 2 Project Bollywood 3 Mercw-y Tower Project 4 Pacific Place 5 BannTalingNgam 6 Muang Timi Plmtm-TOP 7 Muang Timi Plmtm-COCONUT 8 Equity contribution - Yong Ye 9 Siri Phuket-Equity
10 ListMM 16 Other TOTAL ASIA
BS at Risk 560 148 374 267 259
73 75 91
117 26
620 2,610
BS at Risk 68 22 35 32 30 25 20 14 18 17
112 393
Gross Up 2,583
403 4
82
134 194 61
8 91
636 4,200
Gross Up
33
4
0 37
Gross BS 3,143
551 378 349 259 207 269 152 125 123
1,256 6,810
Gross BS 68 55 35 32 30 25 20 18 18 17
112 430
!GLosA.l. REHE"Co F6Rs"AL"E-=-shol~ - 10,36o 1o,3o5 20,665 1
[GLOBAL RE HELD FORSALE-2/29/()i! ---·- -·- ·- ---12,925 9,637 22,562 I
Note 1: Includes-Investments from Private Equity and ~ecl!ri.ti;.~!l Products
ffMAN BROTHERS ·-··-~,3
.-... ' /~~)

CO
NFID
ENTIA
L TREA
TMEN
T REQ
UESTED
BY
LEHM
AN
BR
OTH
ERS H
OLD
ING
S, INC
.
r m m >< ~ G) s 0 0 0 ~ ....Jo. ....Jo.
/~ ' \,.
~
" Global Real Estate By Property Type ($Millions)
· · Americas .. • - • ·--- t · · Europe
,- . . . • . • . ... 'l
· A~1a r
MktValue % ofTotal MktValue % ofTotal MktValue % ofTotal
Office 5,372 25.8% 2,657 24.8% 675 8.2%
Condo 1,996 9.6% 0.0% 0 0.0%
Land/SF 4,696 22.5% 317 3.0% 847 10.3%
Multifamily 3,439 16.5% 269 25% 1,139 13.9%
Retail 474 23% 1,410 13.2% . 750 9.1%
Hotel 2,464 11.8% 175 1.6% 585 7.1%
Mixed-Use 0.0% 1,817 16.9% 2,341 28.5%
Other PT 2,385 11.5% 4,075 38.0% 1,866 22.7%
Total 20,826 100% 10,720 100% 8,203 100% -
Gross-up* 6,288 4,200 138
Total 27,114 14,920 8,341
LEHMAN BROTHERS 14
-~)'\';· ,.
7
I
::: ·· ·rotai~-5/Jl/08 -- .. ,., r;:; :; '·7= '·:roiaJ12129io1r --: ··· -~·:""r
MktValue % ofTotal MktVa1ue % ofTota1
8,704 21.9"/o 12,781 26.1%
1,996 5.0% 3,071 6.3% !' 5,861 14.7% 6,190 12.6%
4,847 12.2% 4,673 9.5%
2,634 6.6% 3,451 7.0%
3,224 8.1% 3,240 6.6%
4,158 10.5% 3,260 6.6%
8,326 20,9% 12,371 25.2%
39,750 100% 49,036 100%
10,626 10,107
50,376 59,143

CO
NFID
ENTIA
L TREA
TMEN
T REQ
UESTED
BY
LEHM
AN
BR
OTH
ERS H
OLD
ING
S, INC
.
r m m >< ~ G) s 0 0 0 ~ ....Jo. 1\)
Analysis of Corporate Equities Inventory (Longs & Shorts) I
($Millions)
I Long - Corporate Equities =:=J I Short- Corporate Equities I
M~y_08 Februarv 08 Mav08 Februarv 08
tQBfQBAn; ~;Qumr::s tQBfQRATE EO!.IUJES
.!.IS .!.IS I' I
CQ~~Qt:l SIQ!:K CQMI!lQN SIQ!:K Listed OTC 8,123 8,716 Listed OTC 12,030 11,372
ETF 4,018 7,951 Others 218 -FUND UNITS 1,043 817 12,248 113721 PREFERREDS 1,806 2,617 Private Equity 3,827 5,195
I ~ I
. Funded Bridge Equity 3,087 3,043 COMMQN SIOCK Partnership 1,860 1,070 Listed OTC 29,384 27,656 ADR 1,111 771 Others (ADR, ETF, Fund Units) 1 553 2 007 Restncted Stock 789 703 30 937 29 663 Others 932 685
26,596 31568 Grand Total (GL) 43,185 . 41,035
- ---
~ !:QI!l~Qt:l SIQ!:K •.
Listed OTC 18,072 20,921 FUND UNITS 2,232 2,907 PREFERREDS 648 723
20,952 24 551
Grand Total (GL) 47,548 56,119
)HMAN BROTHERS ... ,_115 •')

CO
NFID
ENTIA
L TREA
TMEN
T REQ
UESTED
BY
LEHM
AN
BR
OTH
ERS H
OLD
ING
S, INC
.
r m m >< ~ G) s 0 0 0 ~ ....Jo.
w
,--:~--\:~~ /',~. \. \
~\
"' . Analysis of Other Secured Borrowings
($MiUions)
-'<~
' Dcscriulion GA·\1' Asset Class 05/31108 02/29/08 Re~i_Qn Entities Explanation
FAS 140
SPML
PREFERRED MORTGAGES
ELQ Hypothcken N.V. Total FAS 140 Securitized Products- Europe
Mortgage-Backed Sccwities/ABS
Mortgage-Backed Securities/ASS
SP America- QSPE with derivati\<cs Mongagc-Backcd Sccuritics/ABS
SP America (NPLs) Mongage-Backed Securities/ASS
Equiry Structured Transaction- QSPE with dcrivaJ.ives Mortgage-Backed SccuriticsiABS
Structured Credit Trades (Corporate) StruCiured Credit Trades (ABS)
Commercial Real Estate- Europe
Commercial Real Estate - America
Funds JV • Europe
Gross-up of Muni 108 Program (RJBCO)
Equity Strategy Asia
CireneSRL
Total Gross-Up due to FAS 140
FIN46
Real Estate - America Real Estate - Europe
Real Estate- A.sia
Total Real Estate
LEREP m Warehouse
FIN 46 Securitized Products- Europe (SPML)
PAM! LBREP U LLC
FIN 46 Structured Credit Trades
Muni Panncrships
Tolal Gross-U~ due to FIN 46
Corporate Obligations MortgtJge-Backed Securities/ ABS
Corporate Obligatlons
Mortgage-Backed Securities/ASS
Foreign Equi1ies
Government and Agencies
Corporate Obligations
Corporate Obligations
Real Estate Held for Sale Real Estate Held for Sale
Real Estate Held for Sale Real Estate Held for Sale
Real Estate Held for Sale
Mongage-Backed SecuritiesiABS
Real Estate Held for Sale
Corpo!ate Obligations
Go .. -cmment and Agencies
591
3H 60
985
9,039
31
333
889 700
220
594
489
184
152
13,617
6.067 4,177
81 10,325
277
•19
279
127
11,027
477
253
136
865 --7,338
34
863 1,206
374
2,854
371
149
14,053
5.180 3,539
___ 95_
8,814
897
307
18
267
118
10,420
Other 12 65
!GRAND TOTAL 24,656 24,5391
LEHMAN BROTHERS
Europe
Europe Europe
America
America
America
America America
Europe
America
Europe
America
Asia
Europe
America Europe
Asia
America
Europe
America
America
America
16
Southern Pacific Mortgage Ltd
Preferred Mongages
ELQ Hypotheken N.V.
Lehman Brothers Holdings Inc.
Lehman Brothers Holdings Inc.
Lelunan Brothers Holdings Inc.
LB Special Financing Inc. LB Special Financing Inc.
LCPI London Branch
Lehman Brothers Holdings h1c.
Anthracite SPV
Lehman Brothers h1c.
LB Asia Capital LB Commercial Corp Asia Ltd
CireneSRL
Lehman Brothers Holdings Inc. LCPI London Braoch
Edinburgh House LB UK Re Holding Ltd Harley Proeny VenturesPcnimula Golf EldOn Street Holding Ltd.
REPE LBREP ill LLC
Southern Pacific Mortgage Ltd
P AMI LBREP U LLC
LB Special Financing lnc.
Lc:lunan Housing Capital Inc.
FAS 140 Gross-up relates to Eurosaii-UK-2007-4BL. Eurosail 07-5 and Eurosail Prime 07 -I
FAS 140 Gross-up relates to Eucosaii-UK-2007-4BL and Eurosail 07-5 F.+,S 140 Gross-up relates to Eurosail2007 NL -2
LBHI- FAS l40 Gross-up
Non-Perfomiog Loan Gross Up
FAS 140 Gross-up
CDO Securitizatioos with Call Option prior to matwicy COO Securitizations wilh Call Option prior to maturity
WIND XlV is sold.
220mm FAS140 Gross up for Carillon loans in PTG Real Estate.
Failed Sales of a Blue Bay and K.BC.
MIUii TOB Gross-up
LB·Commercial Corp Asia Ltd and LB Asia Capilal- Failed Com.ocn Bonds lRS (Convertible bond asset swap gross up. The CB desk is swapping CB, v.lu'chare recallable aoytime.)
Project Palio. These are Securtization Notes issued by Cirenc SRL to the Lhird party non institutional investors. The notes arc listed on the Luxembourg Stock Exchange.
WIN XD, Coeur Defense Senior, Devonshire House, and E-Shelter Frankfurt Senior WINX, Edioburgh, Kemnore, Harley Property Ventures, Eldon Street, Rc;1umur, Battersea, Chiswia:k, Billy Wilder, Leo, Tomeo, Jnvestrev, Express, Atrium, Vicarage Oar.c, Farm Lane
Fill. 46 Balance sheet Gross-up
MJ\RS2 & MARS3
Grtlss up for Masters ill lnvcsunent
LBSF Fio46 Balance sheet Gross·up
Lehman Housing Capital Inc.- FlN 46 Gross-up of approx. 75 partnerships lo 8 Lehman Houslng Tax Credit funds.
I

CO
NFID
ENTIA
L TREA
TMEN
T REQ
UESTED
BY
LEHM
AN
BR
OTH
ERS H
OLD
ING
S, INC
.
r m m >< ~ G) s 0 0 0 ~ ....Jo.
~
Analysis of Short-Term Borrowings
($Millions)
Short-Term Borrowings ', 5/31/08
Secured 660 Unsecured
Current portion of long-term 20,991 Commercial paper 7,948 Other 5,703
Total Short-term Borrowings 35,302
1 ~MAN BROTHERS .··-.\ 7 J
/
I
. 2/29/08
510
18,510 7,751 7,753
34,524
.. ~ ( ) ,,

CO
NFID
ENTIA
L TREA
TMEN
T REQ
UESTED
BY
LEHM
AN
BR
OTH
ERS H
OLD
ING
S, INC
.
r m m >< ~ G) s 0 0 0 ~ ....Jo.
0'1
c::::'\ffi •• .:;\ -~ ~. .t;.... ...
/" ~ .. I,
LEHMAN BROTHERS
Consolidating Financial Statements 02 2008 SEC. Review July 16, 2008
~~ , l'
Confidential Presentation

CO
NFID
ENTIA
L TREA
TMEN
T REQ
UESTED
BY
LEHM
AN
BR
OTH
ERS H
OLD
ING
S, INC
.
r m m >< ~ G) s 0 0 0 ~ ....Jo.
en
Consolidating Balance Sheets Quarter Ended M:a;y 31, 2008
Details of LBHI Omsolidation
Ntuberger Lthman Brolhtrs LB . lehman lehman Brothers :: · · Letvnan Lehman -
• ·I· I I I •II J ·I: d' .. .. II J ·I I LBI B1nnanlnc HoldlngsPLC lehmanBrolhers Commercial Alllnc. Brolhe,.Bank LBCommerdal lBOTC TreaSllryCo. LehmanBrolhers . BrOther& BrolhersJapan Olhe~ Smarrons Consolidated .~nsolidaled Consolidated Ho/~ngs Inc. Corporation Consolidalsd Consolidated Bank Derivatives Inc. B.V. (luxembourg) · Ba~khaus AG LB Finance SA Inc. PCO Subsidiaries Et'lminationa
~
CASH &·CASH EQUIVALENTS CASH & SECURITIES SEGR. AND ON DEPOSIT
FINANCIAliNSTR & OTHER INVENTORY POSITIONS OWNED GOVERNMeNTS &AGENCIES TOTAI.'COMM PAPER.& OTHER MMKT INSTRUt.£NTS MORTGAGES & ASSET -BACKED SEC REALESTATEHELDFOR SALE TOTAL. CofiPORATE DEBT & OTHER TOTAL CORPORATE EQUITIES DERI\/A71VES AND OTHER CON{R. AGREEMENTS
TOTAL SECURITIES & 0Tt£R FIN INS!ii.OWNED · ... ·, .. COUATERAU~D SHORT·TERM AGREEMENTS RECEIVAB.LES . . . OTHER ASSETS INVESTMENfiN CONS. SUBS DUE FRO!,\ SU~IDIARIES
TOTAL ASSETS
UABILITIES:
S.T. BORROWINGS & CURRENT PORTION OF LT. BORROWINGS
FIN'L INSTR & OTHER INV POSNS SOLD BUT NOT PURCHASED GOVERNMENTS & AGENCIES TOTAL COMM PAPER &OTHER MMKT INSTRUMENTS MORTGAGES & ASSET-BACKED SEC TOTAL CORPORATE OEBT & OTHER TOTAL CORPORATE EQUITIES DERIV & OTHER CONTR AGREEMENTS
TOTAL SEC.& OTHER FIN.INSTR.SOLD NOT PURCH.
COLLATERLIZEO SHORT·TERM ANANCING PAY ABLES DEPOSITS AT BANKS DUE TO SUBSIDIARIES
LONG· TERM DEBT: SENIOR NOTES SUBORDINATED NOTES JUNIOR SUBORDINATED NOTES
TOTAL LONG-TERM DEBT:
TOTAL LIABIUTIES
STOCKHOLDERS EQUITY PREFERRED STOCK COMMON STOCK ADDITIONAL PAID IN CAPITAL RETAINED EARNINGS OTHER STOCKHOLDERS EQUITY, NET TOTAL sTOCKHOLDERS EQUITY .
TOTAL LIABILITIES & STOCKHOLDERS' EQUITY
1,110 1 8,669 93
53,074 1 3,721 ·321
16,959 0 '5,11D '0 21,423, 0 23,736 131 35,110 0
166,903 4,53
156,922 679 20,1n as 2,087 2~78
2&2 0 112,904 33
469,730 4,221
879 1
44,370 0 0 0
18 0 2,581 0 1,161 . 0
20,830 0 75,959 0
101,141 (0) 25,653 1,009
0 0 253,566 2.96
920 (D) 7,033 . 0
0 0 7,953 : (0) ..
465,15D 106
D D 0 0
2,241 2,755 2,323 161
16 0 4,579 2,916
46973D . 4.221
1,58 737 1 47 3,881 0 D 0
2,73D 263 0 (D) 42 695 D 0
1,166 19,369 D 2,017 0 2,JS1 0 9,199
2~12 755 0 . 1,509 7~61 1,760 '(0) 2,193
16123 4,583 1384. 234 30,411 '29.m 1,385 15,152
. 12D,617 158 D 0 15,199 954 14 95 1,698 4,249 (0) 61
0 24,136 0 0 197)95 171,787 1,953 9,058
371,159 231,797 3,352 24,412.
131 25,766 0 0
49,059 0 0 47 0 0 28 2
431 (0) 0 0 6,557 0 0 0 30~93 D D 0 15,014 955 m 373
101,654 954 801 m
86,083 9,896 0 4,6n .0,15 .. 789 34 91
0 0 0 0 121,846 79.261 2,286 19,686
821 73,233 0 0 9,137 11,858 0 0 1;39 3,765 0 0
11,197 88,855 0 D
364,065 205,522 3,121 24,876
3,003 6,993 D .D 1,245 61 D D
248 7,601 11 57
2,6~1 16,901 . 22D (549) (5,281) (0) 28
7,094 26.275 231 (464)
371,159 231,791 3,352 24,412
Note l: Refer next slides for details of LBf. Neuberger Berman , and LBHI PLC consolidation
424 3
712 D
5,761 D
565 0
165 7,2D3
6D 1,151
432 D
1,806
11,079
152
0 12 42 0 D
14 68
107 52D
8,018 186
36 30D
0 336
9.387
0 0
599 I.D93
D 1,692
11,079
T ""''\HMAN BROTHERS ...... )1 ~ I
'· 28 0 118 1 . 333 5 113 1,739 (100) D 0 0 D' 0 D 255 ·129 D
8 (0) D I" 0 D 2 6,498 890 (37,190) ID (D) 2 D 1 83 0 219 (338)
560 D D 0 '3;481 D 971 31,199 (9,023) 0 0 D D 348 0 D 3,655 0
2,748. 911 0 0. ' . 4,750 2,052 325 7,'1/3 ·. (2,896) 1 304 0 0 . .-o 13,487 8 6,517 . (8,057)
664 793 .9 0 176 7.218 353 2,i58 (22.749 3,991 2,008 11 D 8,756 22.843 8,156 52,611 (80,252)
355 D D 5,422 2,225 D 8,D74 14 D 197 '3.134 31 36 31D 1,217 399 3,759 (5.731)
8 (0) (0) D 5 1 353 3,156 (696) 0 0 0 0 0 0 9 45,344 (69,75D)
1,74D 251 36.796 33,139· ,21,263 18,986 12,115 91,618 (71D,842)
6,319 5,392 38,955 38,598 32,891 43,D53 29,474 198,370 (867,371 .,
144 187 '5,023 0 173 2 0 3,227 (383)
0 0 0 0 0 0 7,124 321 (37,190) 0 1 D 0 0 0 3 (34) 0 0 0 0 0 0 0 0 (2) (138) 0 0 0 0 0 59 28 176 (1.056) 0 2,774 0 0 0 8,026 0 1,886 (8,055)
3D1 1,127 2,573 0 321 4,832 484 1,846 ,(23.558 301 3.902 2.573 D 321 12.917 7,638 3,994 (69,99T,
715 0 0 69 2,75D 0 4.351 9.072 (11,000) 195 287 0 7 761 125 457 4,737 (7,530)
3.945 0 D 0 17,400 D D 0 (7) 4 541 11 38,510 4,259 29,130 15,523 90.790 (655,899)
D 0 27,195 0 '4.782 D D 7,218 (3.651) D 250 D 0 1,181 D 758 31,531 (49,424) D D 0 0 D D D 0 0 D 250 27,195 0 5,963 0 758 38,749 (53,075)
5.363 5,167 34,809 38,586 31,627 42,773 28727 15D,569 797,892
D D D D D 0 D 2,664 (5,667) D 0 3 4 35 4 375 15,629 (17,295)
817 100 (0) 1 719 5 479 19,008 (27.D4D) 1J9 126 2,144 6 215 268 (201) 9.651 (18.2D2)
0 0 . (01 0 295 2 93 848 (1,275 957 226 2,146 11 1.264 28D 746 47,801 (69.479)
6,319 5,392 36,955 38,598 32,891 43,D53 29,474 198,370 867,371
--:.')
LBHI Consolidated
6,513 13,031
26,988 4;757
12,m '20,664 49,999
· .• .'47,548 46991
269,409 ; .. .-
2.94,527 41,no 14,232
0 0
,639,432
35,302
&3,731 12
351 8,344
43,115 25,885
141,507
201,922 7D,888 29,355
0
11o,ss3 12,&24 5,D04
128,182
613156
6,993 61
7,6D1 ·16,901
(5,281 26,275
639,432

CO
NFID
ENTIA
L TREA
TMEN
T REQ
UESTED
BY
LEHM
AN
BR
OTH
ERS H
OLD
ING
S, INC
.
r m m >< ~ G) s 0 0 0 ~ .....Jo. ......
/~"-\
/, Consolidating Balance S~eets ~ Quarter Ended May 31, 2008
$millions
ASSETS:
CASH & CASH EQUIVALENTS CASH & SECURITIES SEGR. AND ON DEPOSIT
FINANCIAL: INSTR. & OTHER INVENTORY POSITIONS OWNED GOVERNMENTS & AGENCIES TOTAL COMM PAPER & OTHER MMKT INSTRUMENTS MORTGAGES & ASSET-BACKED SEC REAL ESTATE' HELD FOR SALE TOTAL CORPORATE DEBT & OTHER TOTAL CORPORATE EQUITIES DERIVATIVES AND OTHER CONTR. AGREEMENTS
TOTAL SECURITIES & OTHER FIN INSTR.OWNE0
COLLATERLIZED SHORT-TERM AGREEMENTS RECEIVABLES OTHER ASSETS INVESTMENT IN CONS. SUBS DUE FROM SUBSIDIARIES
TOTAL ASSETS
LIABILITIES:
S.T. BORROWINGS & CURRENT PORTION OF L.T. BORROWINGS
FIN'L INSTR & OTHER INV POSNS SOLD BUT NOT PURCHASED GOVERNMENTS & AGENCIES TOTAL COMM PAPER & OTHER MMKT INSTRUMENTS MORTGAGES & ASSET-BACKED SEC TOTAL CORPORATE DEBT & OTHER TOTAL CORPORATE EQUITIES DERIV & OTHER CONTR AGREEMENTS
TOTAL SEC.& OTHER FIN.INSTR.SOLD NOT PURCH.
COLLATERLIZED SHORT-TERM FINANCING PAY ABLES DEPOSITS AT BANKS DUE TO SUBSIDIARIES
LONG-TERM DEBT: SENIOR NOTES SUBORDINATED NOTES JUNIOR SUBORDINATED NOTES
TOTAL LONG-TERM DEBT:
TOTAL LIABILITIES
STOCKHOLDERS EQUITY PREFERRED STOCK
. COMMON STOCK ADDITIONAL PAID IN CAPITAL RETAINED EARNINGS OTHER STOCKHOLDERS EQUITY, NET TOTAL STOCKHOLDERS EQUITY
TOTAL LIABILITIES & STOCKHOLDERS' EQUITY
LEHMAN BROTHERS
Lehman Brothers Inc.
232 8,538
30,772 1,769
11,352 0
6,489 10,491 2734
63,606
156,244 13,653
413 1,354
76,811
320,850
234
29,789 0
18 2,281 7,450 1 782
41,319
85,750 21,207
0 160,727
1 7,033
0 7,034
316271
0 0
2.241 2,323
16 4,579
320,850
Details of LBI Consolidation
Lehman LB Special Commercial Paper Financing Inc. LB I Group Inc. Inc. Consolidated Consolidated Consolidated
676 40 21 (0) 122 10
20 24,877 3 1,501 88 (0) 3,470 1,056 1,081 5,090 0 0
17,357 3,806 824 1,034 9,380 5,775
986 32 615 64 29,458 71,822 7,747
564 0 114 3,399 7,004 1,575
105 506 896 225 (11) 20
31,903 35,630 1,206
66,330 115,113 11,590
454 185 7
0 17,241 0 0 0 5 0 0 0
(0) 352 0 0 4,557 1
1129 18306 0 1,129 40,457 6
13,467 1,919 5 0 6,404 729 0 0 0
51,341 62,991 10,570
0 683 236 0 0 0 0 0 0 0 683 236
66392 114638 11552
0 0 0 0 0 35
856 350 454 (941) 125 (451)
22 0 l1i (62) 475 37
66,330 115,113 11,590
2
Lohman Brothers Lehman Bros. Others Subs Financial Derivative of Lehman
Products Inc. Products Inc. Brothers Inc. Eliminations
(0) 87 55 0
I' 0 0 (0) 0
0 0 63 (2,660) 309 59 (4) 0
0 0 (0) 0 0 0 20 0 0 0 (24) (29) 0 0 903 (3,847)
221 373 (1) (1,113 530 432 957 (7,649)
0 0 (0) 0 0 8 (547} (4,220) 6 1 171 (11) 0 0 720 (2,046) 0 8 791 (33,446)
536 535 2,148 47,372
0 0 0 0
0 0 (0) (2,660) 0 0 (5) 0 0 0 (0) 0 0 0 (24) (29) 0 0 0 (3,847)
221 375 83 i1 066 221 375 54 (7,602)
0 0 (0) 0 22 39 (469) (4,279)
0 0 0 0 3 63 1,306 (33,435)
0 0 (0) 0 0 10 0 (10) 0 0 0 0 0 10 (0) (10)
246 487 890 45 326
0 0 0 (0) 0 0 5 (39)
250 25 153 (2,088) 40 22 1,110 94
0 0 (9) 13 290 47 1,258 (2,046)
536 535 2,148 (47,372)
) . .
LBI Consolidatec
1,110 8,669
53,074 3,721
16,959 5,110
28,423 23,736 35,880
166,903
156;922 20,872
2,087 262
112,904
469,730
879
44,370 0
18 2,581 8,161
20,830 \ .. 75,959
101,141 25.653
0 253,566
920 7,033
0 7,953
465150
o, 0
2.241 2,323
16 4,579',
I 469,730 1

CO
NFID
ENTIA
L TREA
TMEN
T REQ
UESTED
BY
LEHM
AN
BR
OTH
ERS H
OLD
ING
S, INC
.
r m m >< ~ G) s 0 0 0 ~ ....Jo.
co
Con~olidating Balance Sheets Quarter Ended May31, 2008
$millions
ASSETS:
CASH & CASH EQUIVALENTS CASH & SECURITIES SEGR. AND ON DEPOSIT
FINANCIAL INSTR. & OTHER INVENTORY POSITIONS OWNED GOVERNMENTS & AGENCIES TOTAL COMM PAPER & OTHER MMKT INSTRUMENTS MORTGAGES & ASSET-BACKED SEC REAL ESTATE HELD FOR SALE TOTAL CORPORATE DEBT & OTHER TOTAL CORPORATE EQUffiES DERIVATIVES AND OTHER CONTR. AGREEMENTS
TOTAL SECURITIES & OTHER FIN INSTR.OWNED
COLLA TERLIZED SHORT-TERM AGREEMENTS RECEIVABLES OTHER ASSETS INVESTMENT IN CONS. SUBS DUE FROM SUBSIDIARIES
TOTAL ASSETS
LIABILITIES:
S.T. BORROWINGS & CURRENT PORTION OF L.T. BORROWINGS
FIN'L INSTR & OTHER INV POSNS SOLD BUT NOT PURCHASED GOVERNMENTS & AGENCIES TOTAL COMM PAPER & OTHER MMKT INSTRUMENTS MORTGAGES & ASSET-BACKED SEC TOTAL CORPORATE DEBT & OTHER TOTAL CORPORATE EQUITIES DERIV & OTHER CONTR AGREEMENTS
TOTAL SEC.& OTI-IER FIN.INSTR.SOLD NOT PURCH.
COLLATERLIZED SHORT-TERM FINANCING PAY ABLES DEPOSITS AT BANKS DUE TO SUBSIDIARIES
LONG-TERM DEBT: SENIOR NOTES SUBORDINATED NOTES JUNIOR SUBORDINATED NOTES
TOTAL LONG-TERM DEBT:
TOTAL LIABILITIES
STOCKHOLDERS EQUITY PREFERRED STOCK COMMON STOCK ADDITIONAL PAID IN CAPITAL RETAINED EARNINGS OTHER STOCKHOLDERS EQUITY, NET TOTAL STOCKHOLDERS EQUITY
TOTAL LIABILITIES & STOCKHOLDERS' EQUITY
.... ~tiMAN BROTHERS
/
Neuberger Berman Inc.
0 0
0 0 0 0 0 6 0 6
0 0
2,622 699
12
3339
0
0 0 0 0 0 0 0
'·
0 290
0 134
(0) 0 0
(0)
424
0 0
2,755 161
0 2,916
3,339
Details of Neuberger Bennan and LBHI PLC Consolidation
Neuberger Other Subs of Lehm~n Berman LLC Neuberger Neuberger Berman Brothers Consolidated Berman Inc. Eliminations Inc Consolidated Holdings PLC
1 0 0 1 0 93 0 0 93 I' o
1 0 0 1 0 21 299 0 321 0 0 0 0 0 3 0 0 0 0 0 0 0 0 0 0
100 25 0 131 13 0 0 0 0 50
122 324 0 453 67
679 0 0 679 0 50 35 0 85 (0)
206 49 - 0 2,878 24 0 9 (708) 0 8,009
21 25 (26) 33 4,937
1173 443 734 4,221 13 037
1 0 0 1 0
0 0 0 0 0 0 0 0 0 0 0 0 0 0 0 0 0 0 0 0 0 0 0 0 0 0 0 . 0 0 0 0 0 0 0 0
(0) 0 0 (0} 0 553 166 0 1,009 30
0 0 0 0 0 68 120 (26) 296 1,675
0 0 0 (0) 0 0 0 0 0 2,998 0 0 0 0 1.239 0 0 0 (0) 4,237
621 286 26 1306 5942
0 0 0 0 3,003 0 0 (0) 0 1,245
377 37 (415) 2,755 248 175 119 (294) 161 2,605
0 0 0 0 (7
552 156 (708) 2,916 7,094
1,173 443 734 4,221 13,037
..... ,
uuooo ~uu~
Lehman Brothers I of lehman LB International Lehman Brothers
(Europe) Brothers Holdings Holdings PLC 1
Consolidated Europe Ltd. PLC Eliminations Consolidated
1,827 0 131 0 1,958 3,881 0 0 0 3,881
2,730 0 (0) 0 2,730 I 41 0 0 0 42'
1,160 4 6,311 (6,311) 1,16&1 0 0 0 0 0
2,882 0 1 0 2,882' 7,455 0 0 0 7,468
16067 6 (0) 0 16,123 30,335 9 6,312 (6,311) 30,411
120,617 0 0 0 120,,611 15,138 92 (11) (20) 15,199
55 42 1,576 0 1,698 0 0 14,956 (22,965) 0
196,850 502 15,781 (20,675) 197,395
368 704 646 38 744 49,971 371159
131 0 0 0 131
49,059 0 0 0 49,059 0 0 0 0 0
431 0 0 0 431 6,557 0 0 0 6,557
30,593 0 0 0 30,593 15.014 0 0 0 15,014
101,654 0 0 0 101,654
86,083 0 6,311 (6,311) 86,083 40,626 (0) 2,520 (22} 43,154
0 0 0 0 0 122,089 80 3,662 (5,660) 121,846
91 0 730 0 821 10,575 0 10,581 (15,016) 9,137
0 0 0 0 1,239 10,666 0 11,311 (15,016) 11,197
361 249 79 23803 27.009 364 065
0 0 192 (192) 3,003 6,273 500 11,750 (18,523) 1,245
0 0 1,202 (1,202) 248 1,187 66 1,660 (2.934) 2,605
(5 0 116 (111 (7 7,455 566 14,940 (22,962) 7,094
368,704. 646. 38,744 49,971 371,159
(-:I ..

CO
NFID
ENTIA
L TREA
TMEN
T REQ
UESTED
BY
LEHM
AN
BR
OTH
ERS H
OLD
ING
S, INC
.
r m m >< ~ G) s 0 0 0 ~ ....Jo.
CD
..-:::.;,·:;:~_· ', -. '·· . ·, , ~
-·'
Consolidating Income Statements -Quarter Ended May 31, 2008 Details of LBHI Consolidation
Lebmao Lehman Neuberger Brothers
Lehman Lehman Lehman Lelunan Brothers
Lelunan Lehman Lehman Lehman Lelunan Other subs LBI Brothers Brothers Ali Inc Brothers Brothers 13rothcrs Brothers Brothers Brothers Brothers ofLBHI LBHI
Consolidated Bennanloc Holdings
Holdings Comm. Consol Bank Comm. OTC
T reaswy Luxemburg Bankhaus Finance Japan Elim. Consolidated PLC
Inc. PCO Corporate Consol Bank Derivatives
CoBV SA AG SA lnc/KK Cons. Consolidated Inc
I NET REVENUES 414 242 567 (1,741) 100 (758) 206 11 55 I 559 (I) (159) Jl53) (89) 41 38
EXPENSES; COMPENSATION & BENEFITS 1,225 145 430 (116) (0) 226 52 0 (12) 0 0 (I) (0) 106 263 6
BUSINESS DEVELOPMENT 33 2 28 5 0 0 2 0 0 0 0 0 0 4 14 0
TECHNOLOGY AND COMMUNICATIONS 85 7 52 102 0 0 15 0 0 0 0 0 0 17 32 (0)
PROFESSIONAL FEES 42 2 25 5 0 I 3 0 .0 0 0 I 0 5 17 (0)
BROKERAGE AND CLEARANCE DISTRJBUTION FEE 154 25 48 0 4 0 0 0 (0) 0 0 I 13 9 8 (8)
OCCUPANCY 48 5 54 63 0 (0) 5 0 0 0 0 I 0 13 (2) 0
OTHER 31 12 3 83 0 0 9 I 0 0 0 0 0 4 19 (4)
MANAGEMENT FEES 28 14 0 273 0 (13) II (2) 0 0 0 (322) 0 5 6 0
TOTALNPE 419 66 210 53! 4 (!2) 45 (!) (0) 0 0 (319) 13 57 93 (13)
!TOTAL EXPENSES 1,644 212 640 415 4 214 97 (I) (12) 0 0 (311) 13 161 356 (7)
!PRETAX INCOME (1,230) 30 (72) (2,157) 96 (972) 109 11 67 559 (I) 162 (166) (252) (315) 45
INCOME TAXES (544) 13 (4) (820) 41 (392) 42 5 29 (0) 0 (4) 18 (100) 404 0
I NET INCOME (686) 17 (69) (1.336) 56 (580) 66 7 39 559 (I) 166 - __ {184) (152) (719) 45
LEHMAN BROTHERS 1
I
.:· ~:-.
· .. /;'_-_ ..... _!._.:; · ·_:_': I.sm< Com~liilated-
.. ::':_:_ ~--.-~·'' ··: ....
(668)
2,325
87
309
100
252
188
!58
0
1,094
3,419
(4,087)
(1,313)
_ _j2,774)

CO
NFID
ENTIA
L TREA
TMEN
T REQ
UESTED
BY
LEHM
AN
BR
OTH
ERS H
OLD
ING
S, INC
.
r m m >< ~ G) s 0 0 0 ~ 1\) 0
Consolidating Income Statements -Quarter Ended May 31, 2008 Details of LBI Consolidation
Lelunan Lelunan LB Special Lelunan· Brother Lelunan
Other subs of LBI LBI Group Brothers
Brothers Inc. Commercial Financing Inc Consol
Financial Derivative
LBI Consolidated PCO Paper Inc Consol Consol Products Inc
Products Inc Consolidated Eliminations
[NET REVENUES 857 (66) 15 (313) (9) (39) 49 (80)
EXPENSES: I'
COMPENSATION & BENEFITS 290 635 69 220 0 0 11 0
BUSINESS DEVELOPMENT 30 0 1 0 0 0 1 0
TECHNOLOGY AND COMMUNICATIONS 68 3 5 8 0 0 (2) 3
PROFESSIONAL FEES 35 0 3 2 0 0 0 0
BROKERAGE AND CLEARANCE DISTRIBUTION FEES 85 1 66 (0) 0 0 I (0)
OCCUPANCY 43 {2) 2 2 0 0 2 0
OTHER 19 0 II 0 0 1 0 0
MANAGEMENT FEES 19 8 8 0 0 0 (7) 0
TOTALNPE 301 10 95 13 0 I (4) 3
!TOTAL EXPENSES 591 645 164 232 0 1 8 3
!PRETAX INCOME 266 {711) (149) (545) (10) (40) 42 (83)
INCOME TAXES 109 {313) (61) (236) (4) (17) (22) 0
I NET INCOME 156 (397) (89) (309) (6) (23) 64 (83) --- - -- -- - -----
T )HMAN BROTHERS --\,2 !
/
I
LBI Consolidated
414
1,225
33
85
42
!54
48
31
28
419
1,644
(1,230)
(544)
(686)
·~

CO
NFID
ENTIA
L TREA
TMEN
T REQ
UESTED
BY
LEHM
AN
BR
OTH
ERS H
OLD
ING
S, INC
.
r m m >< ~ G) s 0 0 0 ~ 1\) ....Jo.
(~; •. \;..,.-_,_/(
~ ,-.-,}.·~:\ ..
•' . ' ·-......·~· .. :.·/
Consolidating Income Statements- Quarter Ended May 31,-2008 Details of Neuberger Berman and LBHI PLC Consolidation
Neuberger Od1er subs of Neuberger Neuberger Lclunan LB
Lehman Other subs of Neuberger International Berman LLC NB Bennan Inc Berman Inc Brod1ers Brothers LBHPLC Berman Inc (Europe} Consol Consolidated Elimination Consolidated Holdings PLC Europe Lid. Consolidated Consolidated
I' lNET REVENUES (4) 195 51 0 242 (IS) 823 (171) (70)
EXPENSES:
COMPENSATION & BENEFITS 24 102 20 0 145 0 167 109 153
BUSINESS DEVELOPMENT (0) 2 0 0 2 0 12 9 7
TECHNOLOGY AND COMMUNICATIONS 0 5 I 0 7 0 13 7 32
PROFESSIONAL FEES 0 2 0 0 2 0 10 4 10
BROKERAGE AND CLEARANCE DISTRIBUTION FEES 0 II 14 0 25 0 45 3 0
OCCUPANCY (0) 4 I 0 5 0 12 8 35
OTHER 7 4 0 0 12 0 (0) I 3
MANAGEMENT FEES 0 9 5 0 14 (0) 143 107 (250)
TOTAL NPE 8 36 22 0 66 (0) 234 138 . (163)
!TOTAL EXPENSES 31 138 42 0 212 (0) 402 24i (9)
!PRETAX INCOME (35) 57 8 0 30 (15) 422 (418) (61)
INCOME TAXES (15) 24 4 0 13 0 63 (28) (39)
I NET INCOME (20) 33 5 0 17 -- (15) 358 .. (390) - -- (22)
LEHMAN BROTHERS 3
., ••
Lclmian Brod1ers Lehman Brothers
Holdings PLC Holdings PLC Consolidated
E.liminations
0 567
0 430
0 28
0 52
0 25
0 48
0 54 0 3
0 0
0 210
0 640
0 (72)
0 (4)1
I
j
_()_ L_ ____ (69]]

CONFIDENTIAL TREATMENT REQUESTED BYLEHMAN BROTHERS HOLDINGS, INC.
en c 0 ·-+-' ·-en ·s ~ 0'"(1.) (.) ·- co <(5)o
~ ~0::~ ~
~ en (.) -~ (i}w<O ~
0>(/) ~ .~ L.. >.
Q)N-~ ~0~ ~ . ',
LBEX-WGM 000422

CO
NFID
ENTIA
L TREA
TMEN
T REQ
UESTED
BY
LEHM
AN
BR
OTH
ERS H
OLD
ING
S, INC
.
r m m >< ~ G)
·~~- . , Acquigition I Significant Transactions ~ Q2 2008 - Closed Deals
~ No transactions
s 0 0 0 ~ 1\)
w LEHMAN BROTHERS
/~}· jJ .•.
I
I,

CO
NFID
ENTIA
L TREA
TMEN
T REQ
UESTED
BY
LEHM
AN
BR
OTH
ERS H
OLD
ING
S, INC
.
r m m >< ~ G) s 0 0 0 ~ 1\) ~
Acquisition I Significant Transactions );> Q 1 2008 - Closed Deals
);> Van der Moolen Specialist- Lehman acquired a NYSE listed securities business with over 400 listings that is
the 4th largest specialist fi1m in terms of share volume. Lehman acquired a business comprised of staff,
technology and listed securities for approximately $2 million. Acquiring entity is Lehman Brothers Inc. The
deal closed in December 2007.
);> Tradeweb - Lehman acquired a 13% minority interest stake in Tradeweb 's electronic trading platform as part
of a consortium (9 dealers in total). Purchase price is approximately $37 million. Acquiring entity is LB 1
Group. The deal closed in January 2008.
);> Field Street Capital- Lehman acquired a 20% interest in an asset manager for $0 in exchange for a $75
million seed investment as a limited partner in addition to providing a $1 million line of credit. The General
Partner is a former Lehman employee. The deal closed in December 2007.
);> Terrawinds Resources Corp.- Lehman acquired a Terrawinds wind project riear Quebec for a total purchase
price of $83 million. Acquiring entity is LB Skypower. The deal closed in December 2007. ·
);> Sale of Marble Bar - Lehman sold its 19.99% minority interest in Marble Bar to EFG International. Total
proceeds from the sale include an initial payment of $95 million plus contingent consideration of up to $57
million, resulting in a pre-tax gain of $7 million. The deal closed in January 2008.
..,. ~HMAN BROTHERS . -··--,'\
-~ I /
I

CONFIDENTIAL TREATMENT REQUESTED BYLEHMAN BROTHERS HOLDINGS, INC.
LBEX-WGM 000425

CO
NFID
ENTIA
L TREA
TMEN
T REQ
UESTED
BY
LEHM
AN
BR
OTH
ERS H
OLD
ING
S, INC
.
r m m >< ~ G) s 0 0 0 ~ 1\) en
-4~.\ / -, ,,_\ \,
., '
LEHMAN BROTHERS
Investment Management DiXlision Q2 SEC Review July 16, 2008
/''·;"'<;"·[ 1.'
·~
·· .. ·'
Confidential Presentation

CO
NFID
ENTIA
L TREA
TMEN
T REQ
UESTED
BY
LEHM
AN
BR
OTH
ERS H
OLD
ING
S, INC
.
r m m >< ~ G) s 0 0 0 ~ 1\) ......
... .. .
. Investment Management Division Overview I
+ Reported revenues for the .quarter of $848rrnn
- Asset Management re¥enues, $496mm, decrease 20% from $6!'8mm in Ql '08 primarily driven by decrease in
minority stakes revenue of $1 OOmm due to timing and performance . , . I" ,. .
- Management fees were flat at $406:rrun, offset by $18mm decrease in incentive fees/GP Ca~ and $1 OOmm · . . . . . . . . .
decrease in Minority Stakes
- Record Private Investment Management(PIM) revenues of$352mm
+ Assets Under Managem~nt:of $277bnwere virtually flat to prior quarter
!·'
- For the quarter AUM outflows of$8.9bn (primarily liquidity) were more than offset by market appreciation of
$9.3bn 1J1 ~ [// j / B ~~ - Year-over-year AUM increased $14bn with over 57?o or $8bn c~ming from net flows and the remaining $6bn
was market appreciation
+ Transactions
- Manager lift-outs/acquisitions offJ;vid J Green an~--~beco
PE Fund closings include: Real Esta~-F~~~~~~iii:~Opportunity and Secondary
Opportunity II
~~HMAN BROTHERS I
'"ll ·, /-.. ,\
.I

CO
NFID
ENTIA
L TREA
TMEN
T REQ
UESTED
BY
LEHM
AN
BR
OTH
ERS H
OLD
ING
S, INC
.
r m m >< ~ G) s 0 0 0 ~ 1\) co
/' IMD Revenue Detail
($ in millions)
High Net Worth AM Equity AM Fixed Income Other Asset Management
Traditl~;~l As~et M~nagement 1 • 2
AM Alternatives Private Equity
Alt~r~ati;~·i~~estments2
Total Asset Management
FID
EQUITY Total PIM
Q2 '08 : Q1 '08' %.6
163 ; 93 .
41 14 .
310 .
i
87: 99
186
496:
183 : ' 169 :
'352 :
172 95 . 37. 22 i
326.
199 : 93
291 •
(5%) (2%) 10% (36%)
(5%)
(56%)
6%
(36%)
618: (20%)
167: 10%
184 . (8%)
350. 0%
·q2'07
153 . 97 28 14
291
75 94
169
460
142. 167 .
308
T!lt~-~-~-~~~s~~lent Management 848'!'1 968 f ' ----- .. ' i... ·~::::.:;.::· •. :.T---t· _ _- ..•..... ..:. ;
p~_Y,o~,. "·· , , 768 '
IMD Segment Revenue Trend
$in Millions CAGR20% 968
""""""""
,~-- -· -....:~,~
. ' ~.,~ /' 0 '~
%.6 Comments .,
7% (4%) 47% 2%
Average billable asset decreased 2% and asset mix shifted slightly towards fixed income
7%
16% 5%
10%
8%
29%
2% 14%
10%
I, Lower minority stake income (Shaw ! $49mm) Increased fees related to closing of Real Estate III and Secondary Opps II
2Q increase from muni and securitized products 1 Q contained $17mm in revenues relating to one time structured note
ll\1D Segment AUM Trend
$in Billions CAGR 18% 282. 277 277
Q2 2006 QJ 2006 Q4 2006 Ql 2007 Q2 2007 Q3 2007 Q4 2007 Ql 2008 Q2 2008 Q2 2006 Q3 200.6 Q4 2006 Ql 2007 Q2 2007 Q3 2007 Q4 2007 Ql 2008 Q2 2008
LEHMAN BROTHERS 2

CO
NFID
ENTIA
L TREA
TMEN
T REQ
UESTED
BY
LEHM
AN
BR
OTH
ERS H
OLD
ING
S, INC
.
r m m >< ~ G) s 0 0 0 ~ 1\) CD
Assets under Management Rollforward CURRENT QUARTER ROLLFORWARD BY BUSINESS
Ql'08 Net
Flo"" [ New I Lost I
Accounts , · · Accounts
SMiUions
Lehman Brothers
H;gh Net \Vorth (I' AM) 58,-147 1,482 (836) 140 786 3,481
AM Equiucs 53,783' 1,417 (2,435) 77 (941) 4,619
M1 Fi.,.ed Income 122,211 1,432 (2,074) {10,512) (11,154) 771
P£i,·alc lm'CShTlcnc Man .. gcmcnt 7,902 160 (:!,421) 83 (2,177) 135
Traditional Asse1 Management 242,343 4,492 (7,767) (10,2U) (13,486) 9,016',
Ahcmati,•cs 8,621 494 (514) 142 122 304
Private Equiq• 25;78i 4,776 ;• (340) 20 4,456 16
All:crnadve Asset Management 34,408 5,270 (854) 162 4,578 320
Total 276,751 I 9,7631 I (8,621ll I (10,050)1 (8,908) I·~
FULL YEAR ROLLFORWARD BY BUSINESS
I New I I Lost I Net Q2 '07 Accounts Accounts Flows
S Millio.
Lehman
High Nc 58,242 8,169 (2,320) (1,265) 4,584 (112)
AMEqu 57,951 5,-161 (4,961) (1,488) (988) 508
.\M Fi.xc• 99,514 13,394 (6,831) 1,758 8,321 3,993
Priva1c I 20,745 2,388 (7,236) (10,987) (15,834) 949
Traditio 236,452 29,413 (21,348) (11,982) (3,917) 5,338
,\hemal 5,742 2,366 (1,310) 1,591 2,646 659
Pci\'CUC' E 20,774 9,739 (1,275) 900 9,364 121
Altema 26,516 12,105 (2,585) 2,490 12,010 780
Total 262,968 I 41,518 1 I !23,933>1 1 !9,492!1 8,093 I 6,1191
~~HMAN BROTHERS -,)3
I
Q2'08
62,714
57,471
111,828
5,860
237,873
9,047
.·. 30,259
39,306
277,179
Q2'08
62,714
.57,471
111,828
5,860
237,873
9,047
30,259
39,306
277,179
'~---....~
)

CO
NFID
ENTIA
L TREA
TMEN
T REQ
UESTED
BY
LEHM
AN
BR
OTH
ERS H
OLD
ING
S, INC
.
r m m >< ~ G) s 0 0 0 ~ w 0
~--..
~r~·.,-.~ ~.,.
~i~ . -~
\.
LEHMAN BROTHERS
Investment Banking Division, Q2 2008 SEC Review July 16, 2008
r=~J
Confidential Presentation

CO
NFID
ENTIA
L TREA
TMEN
T REQ
UESTED
BY
LEHM
AN
BR
OTH
ERS H
OLD
ING
S, INC
.
r m m >< ~ G) s 0 0 0 ~ w ....Jo.
Q2 2008 Investment' Banking Overview ... I
. . . .. . . .
'· + Despite volatile financial markets, a decelerating global ecor1omy, and inflationary concerns, ovenillbanking segment revenue was
' .. $858mm, 4th highest on re~ord. This perfonn~ce was led by strong results in ECM and DCM which offset weakerLevera&ed_Finance, a slowdown in M&A, and llliderperformance from Europe.
Difficult conditions contiril.lein the M&A market resulting from financing constraints and a slowip.g ~?anomy, though the market did improve some in Q2'08, led by strategic M&A transactions. ·
. . . I" . . • Lehman advised on a ~uinber of marquee transactions in the quarter, including Altria' s $11 ~bn spin-off of Philip Morris
Intern:ationaland Hewlett Packard's acquisitiop of Electr()nic Data Systems. Through calendar y;T:D Lehm~ ranked #6 in global. announced M&A (up:from #9 in 20Q7), and ranked# 4 in the U.S. and #1 in Asia ex-Japan. · ·. .. , ..
; . ,
+ DehfOrigination markets~~bq4nded in th~quarter, led by IG issuance. Fixed rate issuance has surge4:thus far in 2008 from investor· ! demand for floating rate ~~!}:Heferred offerings" Investor demand has been the strongest for long~:r:dated maturitiesdue to the uncertaii1
outlook. and ciislocation in tile front end. High~r rated issuance has been strong, largely due to the"s\irge,in financial issuance. .· ..
• Lehman has led 60 transactions totalirig $97bn thus f~ in 2008 and 72 for $118bn in the first 6 ~~cal m~nths, both all time records, including a $6bn inaugural offering for Philip Morris and the $9bn offering for GlaxoSmithKline, the two largest deals of the year.
+ Equity market activity was mixed in the quarter, as continued weakness in the IPO markets was offset by strong performance in followon's and convertibles, led by financial institutions balance sheet repair transactions.
• Lehman ranked #3 in U.S. follow-on and #4 in U.S. convertibles through calendar YTD, up from# 7 and #5 respectively in 2007.
+ Continued Progress on Key Initiatives: '
- Increased YTD'08 ml;l[ket share and rank vs. CY 2007 in M&A, Convertibles, Follow-On, and IG despite very challenging markets.
- Increase in FX business on back of cross-border deals (Arysta Lifescience, CME, China Huaneng)
- Increasing presence in Asia: Advised and financed the largest LBO in Japan (Arysta Life science) and advised on the $3bn acquisition ofTuas Power by China Huaneng, ranking #1 YTD in Asia ex-Japan announced M&A.
T ~MAN BROTHERS ,l
)1 ,,~
. ) t

CO
NFID
ENTIA
L TREA
TMEN
T REQ
UESTED
BY
LEHM
AN
BR
OTH
ERS H
OLD
ING
S, INC
.
r m m >< ~ G) s 0 0 0 ~ w 1\)
!~ •. , \.
~\ .-·.~ .. ~
Q2 2008 League Tables and Market Volutnes + Global Market volumes in Q2'08 rose from the prior quarter for M&A Announced, Equity, DCM, and HY while declining for
M&A Completed and Leyeraged Loans. All product volumes however were below very robust Q2'07levels.
+ Lelunan volumes vs. Ql '08 were markedly better than the market for M&A Announced (+127%), M&A Completed (+95%) and Equity(+ 100%), though trailing significantly in Debt volumes (-19%). Lelunan Market share r:ose for M&A Announced to 19.9% from 10.4%: for M&A Completed to 30.5% from 13.3%, and for Equity to 5.8% from 4.2%, when compared to the prior quarter.
I"
M&A Announced & Completed Equity
---% Chg ---
~ MKT Ann'd Volume 855 719 1,330 19% (36%) LEH Ann'd Volume 171 75 326 127% (48%) I MKT EQ Volume 203 140 245
LEH Market Share 19.9% 10.4% 24.5%· LEH ~Q Volume 12 6 10 100% LEH EQ Market Share 5.8% 4.2% 3.9%
MKT Compl. Volume 597 701 967 (15%) (38%) LEH Compl. Volume 182 93 180 95% 1%
LEH Market Share 30.5% 13.3% 18.7%
•'
22%
---% Chg---
2'07 1 '08 2'07
MKT Debt Volume 1,413 1,148 2,179 23% (35%) MKT Lev Loans Volume 579 (32%) (76%)
LEH Debt Volume 45 56 139 (19%) (67%) LEH Lev Loans Volume 2 3 26 (11%) (90%)
LEH Debt Market Share 3.2% 4.9% 6.4% LEH Lev Loans Market Sharr! 1.8% 1.4% 4.4%
MKT IG Volume 768 468 782 64% (2%) MKT HY Volume 20 5 66 307% (69%)
LEH IG Volume 28 . 28 40 0% (31%) LEH HY Volume 1 0 4 n/m (74%)
LEH IG Market Share 3.6% 5.9% 5.2% LEH HY Market Share 5.3% 0.0% 6.3%
LEHMAN BROTHERS 2
I

CO
NFID
ENTIA
L TREA
TMEN
T REQ
UESTED
BY
LEHM
AN
BR
OTH
ERS H
OLD
ING
S, INC
.
r m m >< ~ G) s 0 0 0 ~ w w
Revenue Overview
Segment Competitor Comparison In Millions
Q2 '08 Ql '08 %L1 Q2 '07 %L1 Lehman Brothers 858 867 -1% 1,150 -25% Goldman Sachs 1,685 1,172 44% 1,72-1 -2% Morgan Stanley 875 980 -11% 1,704 -49% I,
+ IBD revenue of$858 was the fourth highest ever for the firm despite continued very challenging markets, down 1% vs, Q1 '08 and down 25% vs. Q2'07. ·. ·
- M&A revenue fell27% from Q1 '08 and 13% from Q2'07 after three consecutive strong quarters, as the decrease in announced transactions sin~e August 2007 impacted completion activity.
- FID origination revenue was 11% lower than the prior quarter and 47% below Q2'07, as lower leveraged finance and securitized products impacted results. ·
- Equity revenue was at near record levels, up 54% vs. Q1 '08 and down 1% vs. record Q2'07, driven again by issuance from depressed financial institutions looking to shore up weak balance sheets.
+ Financial Institutions and Natural Resources were our best performing industries.
+ Financial Sponsor revenue of$183mm in Q2'08 was up 211% from the prior quarter but was down 54% vs. Q2'07, with the quarter's revenue largely driven by.TPG's investmentin Washington Mutual. . . .
+ Pipeline Revenue fell once again in Q2'08, down 30% from Ql '08 and was 66% below Q2'07, with all products below both Ql '08 and Q2'07 levels.
+ In a segment revenue competitor comparison, Lehman significantly outperformed Morgan Stanley in Q2'08, though trailed Goldman Sachs performance.
lHMAN BROTHERS --~)J /J
I

CO
NFID
ENTIA
L TREA
TMEN
T REQ
UESTED
BY
LEHM
AN
BR
OTH
ERS H
OLD
ING
S, INC
.
r m m >< ~ G) s 0 0 0 ~ w ~
,>A'>,__ ~:it:\ , I
Segment Revenue Detail by Product Investment Banking
Equity Underwriting
"
Q2 '08 Q1 '08 % L1 Q2 '07 % L1
330 215 54% 333 -1%
I
+ Equity Origination revenue rose 54% vs Ql '08 but was 1% below record Q2'07. Strong Secondary, Convertibles, and Private Placement activity, mostly for financial institutions, offset continued weaker IPO revenue. Secondary issuances included Sovereign Bancorp ($4lmm in revenue), Fannie Mae ($20mm), and Petrohawk ($12mm). Convertibles included a Fannie Mae issuance ($20mm), and Private Placements included a PIPE transaction for Washington Mutual ($72mm).
Leveraged Finance 41 76 -47% 274 -85% + Leveraged Finance revenue fell47% from Ql '08 and was down 85%
Debt Capital Markets 248 246 0%
Total Debt Underwriting 288 322 -11%
Financial Advisory 240 330 -27%
Total Banking 858 867 -1% =
LEHMAN BROTHERS
265 -7%
540 -47%
277 -13%
1,150 -25%
vs. very strong Q2'07, as continued challenging liquidity markets impacted results. The quarter's revenue included an HY FX transaction for Permira Advisors ($7mm), as well as an energy flow trade for
Chesapeake Energy ($7mm).
+ Debt Capital Markets revenue was flat vs. Q 1 '08 and down 7% vs. Q2'07, with s?"ong gains in IG revenue offsetting slower hybrid and derivative transactions. Highlights for Q2'08 included a Fannie Mae Pfd ($13mm), and IGissuances for GlaxoSmithKline ($1lmm), Philip Morris ($7mm) and GECC ($6mm).
+ Financial Advisory revenue in Q2'08 was the lowest since Q3'06 as the decrease in announced transaction since August 2007 impacted completion activity. Completed transactions included Washington Mutual sale of a stake to TPG led group ($24mm), Henkel KGAA acq of adhesives business from ICI ($18mm), Hag~meyer NV sale to Rexel ($16mm), and Carlsberg acquisition of Scottish and Newcastle with Heineken ($16rnm).
4

CO
NFID
ENTIA
L TREA
TMEN
T REQ
UESTED
BY
LEHM
AN
BR
OTH
ERS H
OLD
ING
S, INC
.
r m m >< ~ G) s 0 0 0 ~ w 0'1
Segment Revenue Detail by Region Investment Banking Q2 '08 Q1 '08 % L1 Q2 '07 % L1
Americas 576
Europe 212
·Asia 70
Total Banking 858
.... lHMAN BROTHERS
541 6% 769 -25% + Americas revenue in Q2'08 rose 6% vs. Q1 '08 but was down 25% vs. Q2'07, with only Equity exceeding either prior period. The difficult liquidity markets continued to impact, which resulted in continued minimal new LBO announcements, IPO issuances, and the inability to securitize outstanding loans, offsetting the significant activity in financial institutions balanqe sheet repair deals. Equity was very strong, up 98% vs. the prior quarter led by balance sheet repair · transactions for Washington Mutual ($7:2mm) Sovereign Bancorp ($41mm) and Fannie Mae ($40mm). Debt Underwriting fel117% vs. Q1 '08 and 52% from Q2'07, highlighted by a Pfd deal for Fannie Mae ($13mm) and IG deals for Philip Morris ($7mm) and GECC ($6mm). M&A fell33% from Ql'08 and 14% vs. Q2'07, and included dealsfor Washington Mutual ($24mm) and American Stock Transfer ($1 Omm).
264 -20% 307 -31% + Europe Q2'08 revenue fell20% vs. the prior quarter and 31% vs.
62 14% 74 -5%
867 -1% 1,150 -25%
Q2'07, with all product revenues below either period. Financial Advisory fell17% trom Ql '08 and 22% from Q2'07. Highlighted M&A revenues included Henkel ($18mm), Hagemeyer ($16mm) and Carlsberg ($16mm). Equity fell 10% vs Q1 '08 and 22% vs. Q2'07, and included a derivative transaction for.Schlierbach ($14mm), a rights . offering for Carlsberg ($14mm), and a PIPE for Dockwise ($9mm). Debt Underwriting revenue continued weak, down 22% from Ql '08 and 50% lower than very strong Q2'07. Deals included IG Derivatives for Alliance & Leicester ($13mm) and SNS Reaal ($9mm) and an IG offering for GlaxoSmithKline ($11mm).
+ Asia revenue in Q2 '08 was up 14% vs. Q 1 '08 but down 5% from Q2'07. Transactions included M&A's for Arysta Lifescience ($10mm, Japan) and Huaneng Power($6mm, China), a convertible for JA Solar ($3mm, China), a derivative transaction for China Development Bank ($5mm, China), and a bank loan for Arysta Lifescience ($8mm, Japan)
-\5 )
... --· .. \ J
I

CONFIDENTIAL TREATMENT REQUESTED BYLEHMAN BROTHERS HOLDINGS, INC.
(
(:~--'\
tn Q)
~ ·-" c: Q) a. a.
<3:
LBEX-WGM 000436

CO
NFID
ENTIA
L TREA
TMEN
T REQ
UESTED
BY
LEHM
AN
BR
OTH
ERS H
OLD
ING
S, INC
.
r m m >< ~ G) s 0 0 0 ,J::Io. w .......
Investment Banking Market Volume IBD Business Planning Group Fiscal Market and Lehman Volume Tflrougfl May 31, 2008
($billiOILS)
Total Equity Incl. Rights $Value # Transactions
Equity - Comanon S~ock $Value #Transactions
Equity -!PO $Value # Transactions
Equity- Secondary ·s Value
. # Transactions Equity - Convertibles
$Value # Transa'Ctions
Total Debt $Value #Transactions
lnvestinent Grade $Value # Transactions
High Yield $Value #Transactions
Fed: Credit Agency $Value # Transactions
Agency I Sovereign $Value #Transactions
ABS $Value #·Transactions
MBS $Value # Transactions
M&A - Completed $Value # Transactions
M&A - Arutounced $Value #Transactions
Leveraged Loans $Value # Transactions
Q2'08
203.3 672
152.4 585
46.1 137
106.3 448
50.9 87
1,412.7 3,357
767.7 1,272
2o·.o 47
124.3 400
215.3 345
92.8 160
57.2 110
597.1 5,407
855.3 8,375
139.0 418
Q2 '07
245.2 1,287
182.6 1,113
77.3 375
105.3 738
62.6 174
2,178.7 5,505
782 .. 3 1,957
65.6 117
93.3 596
174.6 371
442.0 867
·467.0 479
967.2 7,625
1,330.0 11,135
578.9 911
,.1HMAN BROTHERS
Market Ql '08
140.4 714
89.1 627
34.4 222
54.7 405
s 1.3 87
1,148.0 3,571
468.0 1,034
4.9 17
165.8 697
198.8 397
71.5 .174
91.5 170
701.2 6,955
719.4 9,729
203.4 517
6mths '08
343.7 1,378
241.5 1,204
80.5 359
161.0 845
102.3 174
2,560.7 6,927
1,235.7 2,306
24.9 64
290.2 1,097
414.1 742
164.4 333
148.7 280
1,298.3 12,362
1,574.7 18,104
342.4 935
6mths '07
429.0 2,356
328.9 2,077
128.2 736
200.7 1,341
100.0 279
3,991.9 10,360
1,493.6 3,738
II 1.5 210
169.1 1,147
343.1 728
812.8 1,574
804.6 891
1,924.5 15,209
2,314.3 21,611
942.8 1,596
Q2 '08
l 1.8 28
5.4 18
0.1 I
5.3 17
6.4 10
45.4 123
27.9 45
1.1 9
2.9 13
1.7 8
3.3 6
3.8 8
181.8 29
170.5 37
2.4 9
···.,,6
Q2 '07
9.6 51
5.7 37
2.5 17
3.2 20
4.0 14
139.0 323
40.3 99
4.1 20
7.5 27
1.5 2
25.0 64
44.2 44
180.4 70
325.5 82
25.7 55
Lehman Ql '08
5.9 19
2.7 15
0.4 5
2.3 10
3.2 4
56.3 142
27.8 51
0 0
10.0 20
4.8 s
3.1 12
5.1 10
93.3 54
75.1 46
2.7 8
6mths '08
17.7 47
..>" ... 2 33
0.5 6
7.6 27
9.5 14
101.7 265
55.7 96
1.1 9
12.8 33
6.5 13
6.3 18
8.8 18
275.1 83
245.6 83
5.2 17
6mths '07
16.3 93
10.5 70
3.8 27
6.7 43
5.8 23
237.7 623
76.8 200
7.6 35
13.3 60
6.8 9
41.9 120
68.6 82
350.3 122
575.8 155
37.8 80
0/o Chg vs. Q2 '07
Market Lehman
-17% 22%
-17% -4%
-40% -95o/o
1% 67%
-19% 60%
-35% -67%
-2% -31%
-69% -74%
33% -62%
23% 16%
-79% -87%
-88% -91%
-38% 1%
-36% -48%
1 -76%. -90o/i
I 0/o Chg vs,
Ql '08 Market Lehman
45% 100%
71% 99%
34% -68%
94% 129%
-1% 101%
.23% -19%
64% 0%
307% lUll
-25% -71%
8% -64%
30% 6%
-37% -26%
-15% 95%
19% 127%
l -32% -11%1
,..--., / )
\.

CO
NFID
ENTIA
L TREA
TMEN
T REQ
UESTED
BY
LEHM
AN
BR
OTH
ERS H
OLD
ING
S, INC
.
r m m >< ~ G) s 0 0 0 ~ w co
r'::-c~:·~--
Global Banking Volume Glubal Murkct Volull'nc (S'<inun):
"foiKI Equuy (tnch.edmg right') Co,Tunon Stu<:k
IPO" $c:condKry Con,•c~rhblc:o
Tot~ Debt 111'\.'C!IIIIOC'I\1 (.ino.dc
Lcvcmp.eJ ),.o;uu
H•g,h Yidd . ·\BS ;\IBS .·\geOCIC:'I
l\.1&,-\ Cu111pl~;1cJ l\I&A Anuo<U'I.ccd
Glubul l..chtnan Vulurnc ($rnrn):
Tut .. l ElJliiiY (induo..lmg right") Comonon Stcock
I PO• Scco."udllt:-' Coln'\"Cl"tlhlcro
Tv~o .. ll')du ln.,•crollncnt C3.-:.dc
Lc,•cr.•ge.J l.o!IO!'I
I hgh '\'icld :\BS ~IBS
;\p.cncu:,
tl-1&.·\ Cuonplctc-d :'\1&:\ :\nn(JUOCC:d
l..ehrnun'• Global Morkct Shure:
Tot"! E.qui.l~· (1nc:ludmg rights) C<'-nnu>n Stoc:k I PO, Scc<.utd .. n•
Cf.ln\'eruhicll
Tut>ll l>cht
I n''c:.•ln'l.c!U (.";N.Jc
J.c'\"c"no.p;c:c.J J..c.,nll'l ll•p.h Y1cld o\.BS ,\ms .-\gcnci~::.<
i\1&:..-\ Co•nplclcd 1\1&,•\ ,-\IIOOUOC'ed
l....:hrnan'• Global llanking:
Tc.>l<'l E~uny (u1cludu1g right:~) IPO:o Sccol\du.ry
Con\'erlihle'
Toh>.IDc:lH ln\'Cl:Sllncnl GrAd&: l~e,·c.-ased l~o.n:~
lhghYield
i'I.BS MJ3S .·\ftC=IICic"
o\1&.·\ Complr:::tr:::d ?\16.:.·\ i\(lnounccd
I Reco~rd:s du.tr::: bRck to Q 1 '02
2 '08
203,331 152,405 46,104
106,301 SO,IJ26
1,-112.726 767,715
139,031 20,027 92,845
57.,216 339,59(1
597,111 855..:!6-1
~ 11,807
5,-1·-17 129
5,317
6.360
45,-tl9 27,896
2,-143 1,069 3,258 3,758 -J,SB3
181,833 170,513
2 '08
5.8•,·o 3.6°/a
0.3°/o .S.O'!.•o
12.5"'ro
).2'!.·· 3.6•,·. 1.8•/o
5.3'!·"a 3.5'!-. 6.6'!o 1.3°/a
30.5°ro 19.9~·· ..
2 '08
26
ll 10 16
Fis~al QuaHc:r ·rcc:n.:l
1'081 ~.~
140,409 89,078 34,368 54,710 51.332
1,1-17,955 -168,035
203,361
... ,920 71,523
91,506 364,663
701,153 719.-1-1-9
I '08
5,893 2,733
409 2,324 3,160
56,329 27,806
2,7-t7
0 3,061 5,091
J-t-,786
93,299 75 .. 056
01'08
-1-.2"!'• 3.1<>_..·a
1.2".-·o -1.2'!'a 6.2'!.•o
-1-.9'!··· 5.9'","<> J ..... C!··· O.O'!'o 4.3°/ .. 5.6'!'• -1.1'!'•
13.3~ ....
10.-t'!.a
1'08
" 2l 2
5 12
272,2.01 2-t0,075
99,387 140,688 32,125
1,325.17-t 600,642
285,526
3-',773 164,836
172,827
250,152
1,137,1-W 927,076
Quancr Trend
Q4 '07
4,747 -1,116 1,905 2,2.11
631
65,267 12,656
17,.316 2,960
17,575 15,043 11,693
389,99.5 78,890
Fillic:llll Quo.rter Trend
Q4 '07
1.7'!'o 1.7•.r"a 1.9C!-·., 1.6'!-'o 2.0'!·0
4.9"ror 2.1'!"• 6.1"!·. 8.5'!'a 10.7'!.•"'• 8.7'!·· 4.7<>.-.
3-.1.3'!. 8.5'!•o
Calendar '\'e:n
Q4 '07
II 9
2-W,...OO 200,506 78,698
121,808 39,894
1,69-1,360 5"'-',1:36 438,576
35,668 338,.353 -'30,558
232,913
988,576 1,239,575
QJ '07
9.05-1 6,490
3,271 3,219 2,564
85,32..4 17,598 12,437
1,977 18,151 37,930
5,98-1
116,633 158,908
Q3 '07
3.8'!'. 3.2~'<>
-l-.2'!'a
2 .. 6~·0 6.4•.-o
5.0"!· .. 3.2°!o 2 8~'o S.5°r. 5.4'!'o 8.8<>..-a 2.6•/.
11.8~ .... 12.8•.-a
Q3 '07
LEHMAN BROTHERS
2 '07
245,158 182,596 77,329
105,267 62,562
2,178,698 782,313
578,939 65,585
+42,027
467,03-1-
267,943
967,181 1,329,971
QZ'07
9,639 5,668 2,493 3,175 3,971
139,035 -10.3-f..-4 25,693
4.113 25,0 ....... 4-.1,170
8.993
H10,418 325.50.5
2 '07
3.9'!··a 3.1'!'a
3.2'!·· 3.0'!•a 6.3~··a
6 -t'!'o 5.2•/a -t.-t'!•a 6.3'!·. 5.7<>,·.
9.5"!·'<> 3.-1'!·0
18.7'!·,.
2-J .. S'!·.
12 "07
/~ ,.,
""' Q2'09 1:1".
~~ 4~'0o , .... J4~a
94 .... -1.,/a
2J<>..-. 64~
.)2"-· JO:r;. JO"<-.
-}7"'/.,
-7~4
-15~-.
1.9"=•
"'"" Q2'08 lOS ..
·17·~
-17°/o --10~~
1% ·19,..<>
-JS"-'• -2~~
-76"-a -69"-4 -7.9% -88~· .. 21"/•
-J8'ro -~6"Y•
f!!..:EL_ .....2.l.:E!. IOO<>..w .9~.
-68"-• 129~•
101 .. ~
-19•/.
0'! ..
·11~·
•I• 6~··
-26~.
-69";r.
9.5% 127~·.
"'"" Ql '08 ~~.
22'Y· --1%
-9S% 6~a
60o/.
-6rr .. ..}/._,.
-90"1"·
-74'"/•
-8~--9, .... -1.9~D
IO..·D
-48%
f!!..:EL_ .....2.l.:E!. JS"./a 16<>..-. ·76 ...
18":• 10.} ...
-J•··· ·J.9 ... JO"-;,
•I• -18.,1"• 18%
-6"7...-.
129~··
91%
7
48•1 ..
1.5"'.'• ·91"1,. 66~ .. .97",D
so,.... .Jo...-. ·60% -IS0.fa
-..ra-..~
-.J1-.o
-60%
6J"!.• -1.9'!-;,
(o Jlo.tonrhs Ending May
~ J-1.3,740 241,483
80,472
161,011 102,258
2,560,681 1,235,750 ~-12,392
2-4,94-7 16-t-,369
148,722 704,253
1,298,264 1,57-1-,713
YTD '07
-1-42,.232 342,238 131,430 210,808 99,994
3,995,357 1,-498,367
946,043 111,530 813,290 804,6121'' 510,17::i
1,922,112 2,310.-t82
(j Monlh• Ending Mo.y
~ t7,700 8,180
538 7,641
9,520
101,7-18 55,703
5,J90 1,069 6,319 8,849
19,369
275,131 245,569
YTD '07
16,273 10,494
3,75-1. 6,7-tO
5,779
237,733 76,783 37,840
7,588 41,9...0 68,584 20,115
350,292 575,786
G Mon~hlli Ending Mmy
"\"TO '08
5.1'!'a 3.4•/o 0.7'!'a 4.7°/a 9.3°/ct
4.0°/o -+.5'!' .. 1.5'% -t..3<>/• 3.8~~ .. 5.901/o
2.8•/'a
21.2°/• J5.6°/a
YI"'D '07
3.7°/• 3.1•/a 2.9"'• 3 .. 2°/p 5 .. 8•/.
6.0"/. 5.1<>/• 4 .. 0g/a 6 .. 8 11/•
5 .. 2•/a 8.s•..-a 3.9•/a
18.201/01
24.9°/•
"'"" )TD'08 I'S
}.'TD '07
-22'Y· -2.9~4
-J.9<>/•
-24% 2'!-<o
.J6~D
-18"'/• -64~~
-78•/. -80•/,.
·82 ... )8•/a
-)2%
-.J2"-•
"'"" 'liTD'08 n )TD'OT
.9~ .. -22"/a -86 01fa
IJ .. /•
65 ....
-57 ... .. -27 .. .. -86~'-
-86"-'--85~' .. -8~.
--1-":·
-21"~-
-STo/.
"'"" "'TD '08 I~ l-ro '07
-10 .... 10.,.1·
-7~ .. .J.8~.
61'"/a
.JJ<>/•
-12·/· -62".1• • .J7•r.
-2.5""/. -.JOo/• .JO'V·
16"~· .. -Jl"'·
ANN '08
645,202 454,610 1~6.011
318,599 190,593
5,526,513 2,686,008
605,821 54,908
339,158 259,739
1,554,468
2,529,-1-C-7 2.915,166
ANN'Ot\
}3,495
18,230 597
17,633
15,265
207,098 112,894
10,817 2,565
14,989 18,792 . 35,913
617,99-1. 514,662
ANN '08
5.2•/a 4.0"/• o . ..r."'/• i.5".r"o 8.0"1'.
3.7°/a 4.2~ ... 1.8•,-.
..C..7".1'• -4.-1<>/o 7.2"/o 2 .. 3•/.
24.4~"•
17 .. 7"/•
ANN '08
26 l
13 10 16
C:alcnd:t.r Yc111r
CY '07
889,238 708,978 290,291 418,687 180,.260
6,772,-1.02 2,590,516 1,631,583
165,55-4
1.187,119 1,344,658 1,019,499
3,901,627 4,4-U,592
C:dcn4ar Year
CY'U7
30,06-t-19,075 8,&78
10,197 10,989
387,263 103,324
63,821 10,955 76,952
12::!,237 42,858
756,614 777,993
Calend:u Year
CY '07
3.4 .. /. 2.7 ...... 3.1'"/o
2.4•/. 6.1 00/a
5.7'!.•· -4.0~·.
3.9•/a
6.6°/o 6.5'!."• 9 .. 1'!'• ....2•/. 19.4°/o 17.5'"/a
Calendar Year
CY'07
10 9
-=S:_::"->, '"'~§~ " ~,.
CV'06
765,206 641,7.20 257,957 383,763 123,486
7,122.55-1 2,617.260 1,212,322
184,566 1,546,.204 1,451,416
910,.502
3,061,699 3.601,-1-70
CY '06
27,500 19,92-4 7,054
12,870
7,576
-138,-1--18 117,.321 37,991
9,639 96,032
129,005 ....... ,.28~
482,01-.1 556,.220
CY'06
3.6°/• 3.t•/. ::!.7~-.
3.4°/o 6.t•.•a
6.2'!ro
-1.5"/· 3.1'"/a 5 .. 2~'<> 6.2'% 8.9'!•. 4.9<> ... .,
15.7• ... . 15.-1.0/a
CY'06
10 10
8
II 9 6
l
.. "'"" ANN·os n
.9.:..2!. -2r/. .)6";.
-$)<¥.
-Z4% 6...-.
·18'".1•
-~--6J'!·io
·67•/ • -71.,/.
-81".t•
S2%
-Js~• -J.J. ....
,,. .l'lNN'OB •!$
~ 11"Y• --1 ... ..
-9} ... .. 7..f-,.a ,,.,.
--17"'/., 9%
-8} ...... -77•/. -81 ....
-8.$'"/• -16'%
-18"<-. .J ... %
""" ANN·os ,-s a· ·o1
54'".1 .. -lj)•/.
-86-...
127o/ • ~I<>;.
.J..-..... p.-.
-i.J."'"". ·29<>_,;.
-J~.
.2o...-. -4..5%
2&-r. t•/.

CO
NFID
ENTIA
L TREA
TMEN
T REQ
UESTED
BY
LEHM
AN
BR
OTH
ERS H
OLD
ING
S, INC
.
r m m >< ~ G) s 0 0 0 ~ w CD
Lehman Pipeline Volume Global Pipeline Value ($bn): 1
Equity Levcmgcd Finance Debt Capi"'' Markets
Subtotal Debt Advisory
Total
Americas Pipeline Value ($bn): 1
Equity Lcvecagcd Finance Debt Capital Markets
Subtotal Debt Advisory
Total
Europe Pipeline Value ($bn): 1
Equity Leveraged Finance Debt Capital Markets
Subtotal Debt Advisory
Total
Asia Pipeline Value ($bn): 1
Equity Lc,rcra.gcd Finance Debt Capit:~l Markets
Subtotal Debt AdvisOC}'
Total
1 Value includes only lead managed deals
'Records date back to Q1 '00
Q2 '08 Q1 '08
32 29 12 13 23 27
34 39 215 268
--~ L_~]
Q2'08 Q1 '08
7' 12 II 11 10 14
22 25 84 105
113 141
Q2'08 Q1'08
26 17
12 13
12 13 128 158
165 187
::Q2 '08 _Q1'08
- 1 0. 2
-0 2 3 6
3 8 -
.1HMAN BROTHERS
~Trend
~ g3 '07
24 ·18 30 132 30 47
60 179 231 616
315 813
Quarter Trend
Q4'07 - Q3'07
18 16 27 126 23 35
so 161 56 274
124 451
Quar.ter Trend
Q4'07 ___g3 '07
6 2 7 12
17 168 340
183 358
~Trend
~ g3 '07
I 0 0
-0 0 !__ 2
8 4
t.% Q2 '08 /•S.
Q2'07 Q!..!!L 30 T0°io
129 ./0%
38 -15%
167 -13~.
584 -20%
781 -16%
t.%
Q2 '08 '''· Q2'07 Q0l!__
25 --13% 113 1%
23 -25%
135 -i.J.% 266 -19%
~ -20%
t.% Q2'08 ,.,_
Q2'07 ~ 3 51%
17 11{0
15 -1%
32 -1%
318 -19%
352 -12%
A%
.Q2 '08 '"-Q2 '07 Q.!..]!L_
2 -fOO%
-88%
0 11/o
0 -88% 0 -16%
3 -58%
·,, 8 ''
I 6 Months Endin!! Ma~ t.% Records
1TD '08 ,,, 02'07 YTD '08 YTD'07 1TD '07 Value Perio.d
6% 32 30 6% 33 Q2'07 -91% 12 129 -91% 173 Q2'07 -10% 23 38 -10% 173 Q2'07
-SO% 34 167 -80% 212 Q2 '07 -63% 215 584 -63% 617 QZ'07
-64% I'
282 781 -64~ 813 Q3 '07
6 Months Endin§: May 6% Recor-ds
1TD '08 I•S
f22 '07 YTD '08 YTD'07 1TD '07 Value ~ -N% 7 25 -74% 25 Q2'07 -90% 11 113 -90% 126 Q3 '07 -5-J.% 10 23 -54% 35 Q3'07
..S-1% 22 135 -8-J% 161 Q3 '07 -68% 84 266 -68% 274 Q3 '07
-74% 113 426 -74% 451 Q3'07
6 Months Endin
CO
NFID
ENTIA
L TREA
TMEN
T REQ
UESTED
BY
LEHM
AN
BR
OTH
ERS H
OLD
ING
S, INC
.
r m m >< ~ G) s 0 0 0 ~ ~ 0
i~''',ll--, \,
Lehman Pipeline Fees Global Pipeline Fees ($mm): 1
E9uity I .. c,·cragcd Finance Debt Capital Markets
Subtotal Debt Ad,·isncy
Total
Americas Pipeline Fees ($mm): 1
E9uity Leveraged Finance Debt Capital Markets
Subtoral Debt AdYisory
Total
Europe Pipeline Fees ($mm): 1
Equity l..c\·cragcd Finance Debt Capital Markets
Subtotal Debt Advisory
Total
Asia Pipeline Fees ($mm): 1
· E9uity Leveraged Finance Debt Capital Markc[s
Subtotal Debt Ad vi sol"}'
Total
_Q2 '08
212 29 45
74 249
536
Q2 '08
151 27 23
49 176
376
Q2 '08
61
23
23 59
142
~'08
2
2 15 17
!
_Q_l '08
302
46
58!
1041 340
L____ 7~
Ql 'OS
214 39 36
75 215
504
1'08
83
22
22 105
Q1'08
5 7
7 20
l --- - -- 32
1 Fcc information is for both lead and co-lead managed deals
'Records date back to Q1 '00
LEHMAN BROTHERS
~Trend
Q4'0_7_
316 54 87
141 374 ----831
Quarter Trend
-~ 285
38 70 ----
108 218 ----611
Quarter Trend
Q4'07
30 10 17
27 136
193
Quarter Trend
Q4'07
6
20 ---~-
27
QJ '07
317
Ill 61
172 501
990
~ 286 109
54
163 310
759
Q3 '07
13
184
203
Q3'07
19 2
2 8
28
11
422:
5021 115 I
616' 521
1,560:
Q2 '07
377 440 105
545 378
1,301
Q2 '07
33 62'
8
69 141
m
Q2'07·
12
2
2 I
16
9
4;;) , I .
&% 6 Mornths Endin~ May &% Records
Q2 '08 '"· rTD '08 '·"
~ r22 '07 YTD'OB YTD '07 rTD '07 Fees ~ -30% .;o% 212 422 -50% 422 Q2 '07 -37% -9+% 29 502 -9-J% 502 Q2'07 -22% -61% 45 115 -6/% 123 Q3 '06
-2!JO/o -88% 74 616 -88% 616 Q2 '07 -27% -52% :!49 521 -52% 521 Q2'07 -28'14 -66r. .~36 1,560 -66% 1,560 Q2 '07
2 A% 6 Months Ending; Mal: &% Records
Q2 '08 '"· YJD '08 '" f2.!..:2!_ Q2'07 YTD'OS YTD '07 1TD '07 -~ ~ -29% -60% 151 377 -60% 377 Q2'07 -J/% -9-1-fto 27 440 -9-1% 440 Q2''07
-38% -79% 23 105 -79't0 105 Q2'07
-J-1% -91% 49 545 -91% 545 Q2 '07 -18% -5-1~1? 176 378 -5-I% 378 Q2'07
-25" -71% :176 1,301 -71% 1,301 Q2'07
&% 6 Months Endinr; Ma~ &% 2
Records Q2 '08 ,,,_ 1TD '08 '"
/2!..:!!.!._ 02 '07 YTD'OB YTD '07 lTD'Ol -~ ~ -27% 87% 61 33 81% 112 Q2'00
11/a -100% 62 -/00% 62 Q2 '07 3% 187% 23 8 181% 26 Q1'07
3% -67% 23 69 -67% 76 Q3'06 -1+% -58% 59 141 -58% 184 Q3 '07
-32'14 -41% 142 243 -41% 243 Q2 '07
A% 6 Months Endin~ May &% Records 2
Q1 '08 111. rTD '08 t•s
f2.!..:2!_ 02 '07 ~!!..__ YTD '07 lTD '07 Fees Period
-100% -100% 12 -/00% 48 QJ'OO -68% 11/a 2 11/a 7 Q1'08 11/a -100% 2 11/tl 6 Ql'OO
-68% 15% 2 2 11/tl II Q1'00 -29% lOIS% 15 I 10/i% 33 Q4'07
-48% 8% 17 16 8% 72 Q1'00

CO
NFID
ENTIA
L TREA
TMEN
T REQ
UESTED
BY
LEHM
AN
BR
OTH
ERS H
OLD
ING
S, INC
.
r m m >< ~ G) s 0 0 0 ~ ~ ....Jo.
League Table Investment Banking Division Weekly League Tables Through May 31,2008 Calendar Year
M&A: Thomson Press Release:
Announced- Worldwide (AD I)
US Ta["gcts (AD2)
Any Involvement- US (AD41)
Any lnvolventent- Europe (AD21)
Any Involvement- Asia Ex Japan (AD25)
Any Involvement- Japan (AD19)
Completed- Woa·ldwide (AFI)
US Targets (AF2)
Any lnvolve•uent - US (AF48)
Any lnvolventent- Europe {AF3)
Any lnvolventent - Asia Ex Japan (AF32)
Any Involvement- Japan (AF23)
Lehman View: Announce4 - Americas
Announced- Europe lncl EMEA
Announced - Asia
Announced- Asia lncl Australia (ex Japan)
Completed - Americas
Completed - Europe lncl EMEA
Completed - Asia
Completed- Asia lncl Australia (ex Japan)
Pending- Worldwide
Equity (Lead): ThomsoR Press Release:
_Equity & Equity Related- Worldwide (CI}
IPO - Worldwide (C5)
Follow-On - Worldwide (C8)
Convertible- Wol"ldwide (C9)
Equity & Equity Related- US (Cia)
IPO- US (C6)
Follow-on - US (C8a)
Convertible - US (C9a)
Lehman View:
Worldwide including Rights (Clr)
Equity & Equity Related inc I Rights - Anlericas
Equity & Equity Related lncl Rights - Europe
Equity & Equity Related Inc I Rights - Asia
Equity & Equity Related lncl Rights- Japan (Cler)
Equity & Equity Related Inc! Rights - ex Japan
}HMAN BROTHERS
2008 YTD
6
6
4
6
IS
9
6
4
I
9
5
6
6
6
6
4
16
6
26
3
6
5
II
3
4
7
13
27
25
Rank 2007
CY
9 4
10
10
12
7
5
5
9
14
16
5
10
16
16
6
8
20
16
9
9
9
7
6
7
4
9
8
14
12
14
II
2006
CY
8
5
5
12
19
54
7
5
5
12
18
40
6
12
28.
21
5
12
29
24
9
10
10
8
6
5
4
7
9
6
13
21
11
26
Lehman Share
2008 2007 YTD CY
17.7
16.6
30.8
24.8
12.5
1.1
24.4
13.8
31.6
32.4
22.1
10.2
27.2
23.7
7.7
9.1
28.7
32.0
19.3
22.6
6.9
5.8
0.4
7.1
8.1
10.1
1.0
12.4
12.5
5.2
8.7
2.2
0.5
0.5
·,)10
17.5
27.1
23.3
15.9
4.0
7.0
19.4
27.6
24.5
17.3
3.9
3.8
20.3
16.0
3.8
3.4
21.7
17.5
2.9
3.1
3.6
3.1
2.8
6.2
9.2
11.7
7.8
9.6
3.4
6.8
1.4
1.9
0.2
2.1
15.4
23.4
21.6
13.2
2.7
0.1
15.7
26.7
23.6
9.3
3.3
0.1
18.9
12.8
1.7
2.2
21.4
9.6
1.5
2.0
3.9
2.7
3.9
6.2
9.3
9.8
10.1
8.0
3.6
7.7
2.5
0.5
0.7
0.4
2008 YTD
214.4
71.5
Lel:unan Value ($bn 2008 2007
ANN CY
514.7
171.7
192.s I" 462.1
778.0
436.5
417.0
366.0 151.1
22.7
0.6
257.5
41.9
167.1
209.1
25.7
6.0
193.4
151.9
22.5
21.9
167.7
215.5
39.6
33.6
125.7
13.8
0.2
7.1
6.4
12.1
0.2
6.2
5.6
14.0
12.1
1.6
0.3
0.3
362.6
54.5
1.4
618.0
100.5
401.1
501.8
61.6
14.4
464.2
364.5
54.0
52.5
402.5
517.3
95.1
80.6
33.0
0.6
17.2
15.3
29.0
0.6
15.0
13.4
33.5
29.0
3.9
0.7
0.7
17.8
10.9
756.6
467.9
507.0
310.7
12.3
5.4
480.5
388.3
36.0
27.6
510.0
326.9
18.3
15.5
29.5
8.9
9.6
11.0
21.0
5.5
6.5
9.1
30.1
21.0
4.6
4.4
0.0
4.4
2006
CY
556.2
344.4
384.7
214.2
7.9
0.1
482.0
358.7
386.4
128 .. 1
6.9
0.2
385.2
215.3
10.7
10.7
387.6
137.5
7.1
6.9
27.1
7.1
12.5
7.6
19.3
4.4
9.3
5.5
27.5
19.3
7.2
1.0
0.4
0.6
2008 YTD
1,215
430
625
609
181
54
1,054
303
529
646
116
59
712
642
292
241
585
673
205
149
1,815
235
57
101
78
120
25
50
45
269
139
73
57
6
51
I
Market Value ($bn 2008 2007
ANN CY
2,915
1,033
1,499
1,461
435
130
2,529
728
1,269
1,550
279
142
1,708
1,541
701
578
1,404
1,615
492
357
565
136
242
188
288
60
121
107
645
333
176
136
IS
122
_,,..-..._ ., .i
4,445
1,609
2,052
2,306
443
155
3,902
1,698
2,069
1,796
315
141
2,372
2,432
952
810
2,351
1,869
628
502
812
290
340
179
228
47
83
94
889
309
342
239
25
213
-2006 CY
3,601
1,470
1,785
1,619
291
149
3,062
1,346
1,636
1,377
211
133
2,039
1,681
616
478
1,815
1,438
468
341
702
258
320
123
208
45
92
69
765
251
286
228
68
160

CO
NFID
ENTIA
L TREA
TMEN
T REQ
UESTED
BY
LEHM
AN
BR
OTH
ERS H
OLD
ING
S, INC
.
r m m >< ~ G) s 0 0 0 ~ ~ 1\)
.·:·\
0,:jf, : \.
League Table (cant' d) Investment Banking Division Weekly League Tables Through May 31, 2008 Calendar Year
Fixed Income (Lead): Thomson Press Release:
Fixed Income- Worldwide (Bl)
lnvest•nelll: Grade-Long Tenn Corp01·aLe- Worldwide (B7)
High Yield- Worldwide (84)
ABS - Worldwide (B II)
MBS- Worldwide (BIO)
Agency, Sovereign and Supl'"a.Lional Bonds (B9)
Federal Credit Agency (B8)
US Market Investment Grade-Long Tenn Corporate {F9)
Lehman View: Fixed Income - Americas
Fixed Income - EU('"ope
Fixed Incon1e - Asia
Fixed Income- Japan
Fixed Income- ex Japan
Long Tenn lnv Grade - A•nericas
Long Term lnv Grade - Europe
Long Tenn lnv Grade - Asia
Long Tenn Inv Grade - Japan
Long Tem1 lnv Grade- ex Japan
High Yield- Americas
High Yield - Europe
High Yield -Asia
High Yield -Japan
High Yield- ex Japan
Debt & Equity (Lead): Thomson Press Release:
2008 YTD
13
10
8
8
20
12
4
9
16
23
14
38
7
14
83
22
Rank 2007 CY
6
10
8
6
2
17
6
6
13
27
14
44
7
17
5 I
31
48
7
9
14
13
2006 CY
9
9
6
3
18
3
6
2
13
48
25
46
6
12
46
23
43
7
9
-~ ~i~~fi1 ,,
. I
Lelunan Share(%) 2008 2007 2006 YTD CY CY
3.8
4.2
4.7
4.4
7.2
1.7
3.3
8.5
5.2
2.4
0.8
1.0
0.6
6.7
2.9
0.1
0.2
4.8
5.7
4.0
6.6
6.5
9.1
1.9
7.7
7.8
8.1
3.4
0.7
1.2
0.4
6.8
2.5
0.3
0.1
0.4
7.3
4.0
1.9
2.0
6.2
4.5
5.2
6.2
8.9
1.8
9.4
9.1
9.0
3.4
0.3
0.1
0.4
8.0
3.1
0.4
0.2
0.5
6.2
3.1
~ehman Value ($bn) 2008 2007 ANN CY
86.3
47.0
1.1
6.2
7.8
6.5
8.4
38.1
62.8
22.0
1.5
0.9
0.7
32.3
14.6
0.1
0.1
1.1
207.1
1112.9
2.6
15.0
18.8
15.7
20.2
91.4
150.6
52.8
3.6
2.0
1.6
77.5
35.1
0.2
0.2
2.6
387.3
103.3
11.0
77.0
122.2
12.1
30.8
76.8
294.9
88.6
3.7
2.4
1.3
70.9
31.6
0.8
0.1
0.7
9.8
1.0
0.1
0.1
2006 CY
438.4
117.3
9.6
96.0
129.0
9.6
34.7
84.5
340.0
97.2
1.3
0.3
1.0
71.4
45.0
0.9
0.2
0.8
8.3
1.3
2008 YTD
2,303
1,119
23
141
108
393
255
447
1,200
904
199
83
116
480
511
128
48
80
22
~
I Market Value ($bn)
2008 2007 ANN CY
5,527
2,686
55
339
260
943
611
1,073
2,881
2,169
476
198
278
1,153
1,226
307
115
192
54
6,772
2,591
166
1,187
1,345
621
398
981
3,660
2,613
500
198
302
1,044
1,266
280
101
179
134
26
0
5
2006 CY
7,123
2,617
185
1,546
1.451
542
369
929
3,796
2,850
476
189
287
893
1,462
262
98
164
135
42
8
7
Debt, Equity & Equity Related - Worldwide (A I) ~2 1 1 1 1 3.9 5.5 6.o 1 1 1oo.o 240.1 416.7 465.61 1 2,541 6,098 7,585 7,8251
Leveraged Loans (Lead): Thomson Press Release:
US Leveraged Syndicate Loans (Rll a)
Lehman View: Leveraged Loans- Worldwide
Leveraged Loa,ns - Aln!!=ricas
Leveraged Loans - Eurppe
Leveraged Loans - Asia
Leveraged Loans- Japan
Leveraged Loans - ex. Japan.
• Numbers in parenthesis refer to the Thomson League Table Code
LEHMAN BROTHERS
II
16
12
18
17
9
9
9
15
16
15
9
II
10
10
10
7
2.4
1.8
2.3
1.7
2.0
11
4.7
3.9
4.6
2.4
2.2
2.3
3.2
3.1
3.1
3.2
3.1
3.6
4.0
4.5
4.0
0.5
0.5
9.5
10.8
9.5
1.3
1.3
52.0
63.8
51.2
11.2
1.4
1.4
24.2
38.0
24.5
12.5
1.0
1.0
165
252
172.
50
31
5
26
395
606
412
120
74
II
62
1,115
1,632
1,103
465
63
3
60
752
1,212
793
386
34
5
29

CONFIDENTIAL TREATMENT REQUESTED BYLEHMAN BROTHERS HOLDINGS, INC.
LBEX-WGM 000443

CONFIDENTIAL TREATMENT REQUESTED BYLEHMAN BROTHERS HOLDINGS, INC.
LE~BROTHERSTREASURY CSE INFORMATION PACKAGE
QUARTERLY REVIEW WITH SECURITIES & EXCHANGE COMMISSION 2008 Q2
1. Liquidity policy changes introduced
2. Breaches of policy
3. Daily Treasury MIS
4. Major debt issuances
5. Long-term debt maturity profile
6. Cash capital requirement summary
7. Month end Finance Committee packages
8. Liquidity footnote disclosure
9. Firm inventory, box and liquidity pool table
LBEX-WGM 000444

CONFIDENTIAL TREATMENT REQUESTED BYLEHMAN BROTHERS HOLDINGS, INC.
•:"·. ' 1. Liquidity policy changes introduced during 2008 Q2
There were no liquidity policy changes during 2008 Q2.
( -".
\_
LBEX-WGM 000445

CONFIDENTIAL TREATMENT REQUESTED BYLEHMAN BROTHERS HOLDINGS, INC.
2. Breaches of Policy
There were no breaches of policy in Q2 2008.
r '
I
LBEX-WGM 000446

CONFIDENTIAL TREATMENT REQUESTED BYLEHMAN BROTHERS HOLDINGS, INC.
I 3. Daily Treasury MIS as of 05/30/08
LBEX-WGM 000447

CO
NFID
ENTIA
L TREA
TMEN
T REQ
UESTED
BY
LEHM
AN
BR
OTH
ERS H
OLD
ING
S, INC
.
r m m >< I
~ s 0 0 0 ~ ~ co
~.,
'')
DAILY TREASURY MIS AS OF 05/30/08
LTDSPR2ADSAS OF051l0108
= ,,. ,.,. ,.,.
,,. ,,. .,..
-~·(--)
AY&-Iipraol(llrll)
AYt-M•LC)n.) EcoiLl'A~~
US,;.JIIoiU.IiDUBOR lO.Ptlar-01 ~ ~
w rn m ~ m m m m m
E.ropcw 3M USD LIBOR
12:.l!!!:r:2! 11:M!I:!!I R.:M!I:.!!!
JJ4
"' liD
ruJ!!!! 5~17.$1 , .. ,
l.IS7
JJ4
"' JID
g; ......... "'' "'' ....
"' '" '"
1!1: 11,745.17
"' "" .... IW!Ol .........
!51.17 ,__,, ....,
COMMJRCMLPAPIR AS OF OSIJOI!!I
~ !!!:M1I:H C!!l!t!! ~
!.lU!!!ll
B!lptn Sl'!...,! (mml
T"""""' co~,
·-FHLBIIonvwV\p LBHI~
"""''"""" ,_
us 6,43' 5,156 ....... UK 1,5J7 J,Sil 1,.140
Tot•l 7~3 '·"] ',ll~
IO,'Jl6 ..,, lDOf CD IUIUOBC! Cmm)
Call .. lo: xm
" ' ' 4)l9
Non.C.Uablcu
1001mu.-
,,,., <I""
Sprud ova- UBOR
,. ,.
".l'bpl
t/SuTn:anni .. ~ 12=Mar.:!!l. ~
• • m m rn m ~ ~
IIIYrC-pctll.rSpn:aod.slalmUSD
!I!Iw!l! ~ }!:M!!:!!! GS AA.I~ 110 MS A+/MJ
JPM CHASE. A+/Aa.l CSFB A+/,lul Ll!ll A:trAI llSC AlAI
~ ClTJ M-IAAI hA A+INJ
us
~-SI,IotO.lS SJ,m."
'''"" J16.<C5 5.65 I,IJ
H.oo so.oa
~ ~
"''51 .&,Oll 1,.140 I,IJl
£,Of1 5,155
Hll! ~ , .. " "' " ,.,
" 47.lbpl' 5].11.
"' "' '" '" "' lD-Mn..DI
110
"'
on-US
ll!!ol!!!ll! n.u." ... ... ....
1 Housd!ahiCDI~I"....,.I'J"dtaiMLibL 11 S,...Sac!iwudb)'J0bplf0fiau-fas.
CASH CAPITAL I MCO
Ntl CaP C.pU .. PNithll (SlUM) TarptCwhion
to 0.1 Nr1 MCO fDIIdon (SMM) Mel back H~ Widmin1 Mdback~Hakt:w -.
LBHI 0mmt Pat~iun:> 90 "->" Caawr-Qal. Paper> 90 day. Olha'SlD>90day.
"""' TotaltiabiliJyM~
l.oMIFDityR!d,us· R~oCWCOII'IPI.aani<>LBtll
Cc- EnlityFiandin&:- LBIIJ 10 LDIILBIE l'otallial~ol'LBIECuh
NIIJVarMCOI'OIIllolo(IMM)
,.,.... 15,01]
'"" 1Hl!.r 7,515 -~ l:!:M!l:
l1,306 'l3,"Uit ],17.5 l,'l1l DS 714
(ll,liS) (2l,4D) (1,1!'6) (1,191) {6,.) (617)
' ' (jl4,l39) (14,311)
Jl,l11 JJ:IO
~ Cash£i.u.rq...,.. 7.Jl• PoA&bl...._..'"tmza...n
~ M_~...Jd!!m.!_ 7,667Pclilillll~b)'S7667!111'11
~
"' "' .141 141
"' "'' lWl:t.&!
"' "'
""""""' Sl,111.17 .... . .. .. ..
CDMol•dll!!!'nu!jl
CoDohk Non-Callable'" TCICIJM~
lll:d11rk 11 Me~h lbn1• n 1M USDUBOR
lD.oh """'
,.. 10
361 IS ... lllrluricU.MantttR.,Ie
!IIIli """' "' .. 190 50 171 31
,., " -«O 41
"' "''
SYrCrdiiDrf.ouiiSmp
LEtl OS
MEK
"' em JPMCHASE
ill!d!
" " ..
JII.M.,.-'11 l,_M•v-01 22, 216 ,.. , .. 110 110 139 139 104 104 11 11
ll!lin!h 101
Ul'i!!!!! Ill
"' "' ...
,_- ------- - - - ---~
c...IWen!WTratrnall~liDCN
YOPJDDl AS OF OS/30/0!
• 'LBHI Urpidiay(c.~~;,lllllln1 CP) LBI P•JUic 10 LDHD\'Y {uduoln& CS') LBIE.Pa)'IWelll LDHIUK(cxdo;rd.lnc.CP) LBIEAIBlidef•)'llble/(Rccci~) LBHIOrrlon~fac:iliay Carmw:rcillhpet(>'Z'II'Ceb}
thllqa!Ued c .. n Ll\'&loUIJ CP(S2-.-b) Bllfok18telandNDWG Bri~Mo(ll) Allrun.S,.OI&dl.olll LBIU Rtpo:UI>Je UquJ411y LBHI \JnlhwnC........ill&ld faciliiY N~e~llCf*t.blcTriVmtwt Loroai'(CWURWL) NDn·AIIGwl,blcllqlol1in&~ AEGIS Liquidity LBIETnppod LBIUy.ll.wty LDTCtiquidiry ==; .. hantiiDvrslmrnl• 1'' Ewope/AsillnYalrncnul.aleerlhai!DIN NYhlwuma!~si.GII&G"IhanOIN
Europclri~OINc..hhul NY lnwdtn<nt Available lo t..liquio:lakii OJN NYln~OI'NCub.Pool LBIA LOTCID-OINC:ullfool LBHI~Fdty
"""'"-
l!!:M!rill! !Ul!tiJ! l!:M!I:9! ~ rltl!rclnJ Ul..fii!!·OI
12,410 14,111 19,9U 37.69} 31,062 2,101 2,041 1,951 nl• nl• 14.]11 1'7,131 12,414 rl• nl• (4,011) (4,071) p,9511} (4,415) (4,077)
0 o 0 0 D s.•Js_ J.448_ _MI_2_ ssn 66n
o4o,J07 35,317 35,111 """ 40,00 1,n9 5.334 5.140 4,oli I.SK 1,&95 2,317 l,.UI :m 69S
0 0 0 0 100
f.I,6-IO 4J,IUT ofl,llO O.l" 4l,OIIJ .UOO , 4,SOO 4.SOO 4JOO 4.500
0 ' 0 0 0 0 US D5 llS S99 DS 16 1S 15 21 26
6,991 J,m J,971 '..Sn 1.111.!1 l'l7 1,901 1,101 190 317 0 476 476 11l 0
1,113 1.1110 2,S4l 2.110 l.lll s9,0S 55,970 St;~,n 57,5511 S9,ooJ (11,961) (10,111) (4,110) (1,666)
(0) {OJ
(3.094) (60) (26,160) (376)
{:11.7) (]17)
(4,500) (4,SOO) (2,11l_)
CashA'IIilabletob&inw:MlinNY __..W._ )_9,171
'Cash&J.B.ri:kdadcsUSbllanceSliT.~&nopc~S401..lmn.III'IIIMabaWASI4l7nwuoU.fayU,lODI
Pnjed~UnnJubiiNConlJif .. .tltr 5+1 S+1
c.n-y Btn~kohri'IZII arU.,MhliiJ (l'o1llilnp)
El/R GBP USD
"""' C'I&ITCII~ Bm~luhnm arUau141trlPn-&-p I
WR
GBP
~IIRLBUAG
U11DLBBA0 ....... "" GBP 'EI~CIP CAD usa -
LDIU.uloiiiJ ln\~ (ltduda:OOC:CMoncyfundl) ........ p
Tatll LBIIIH'at.nrnb
tiC~fiamLCPI
liCDDrntwinrrromLBIII NULBIU'fldollty
•ct~a.orLBIB..:l.o!ra
LBikl LBI MTS Bo~; (A~onablc EKduolin!=Trus) LBI TMS Box(Ao:li!lll&bh Ezduotill& Ttaa}
T""""• LBI MTS ltTM5 Box(IO!mCCAacl)
TobJLDIBal
LBfE TnPDcil Ca1b Summ•rv TroaAII)'ln~ UIIE~
EufvpcY'ICid~ NnUIHIPay.bl& UIIEan.T .. pp:d (Snvn) LBJEII!itiW~(•wa.ila.WaiObc:ultlll'alncd) LBIENdT~_ fSavn'
CuhS(U)inLBIE CashS[U)InLBI 'G!abiCashS(U)
o40,0D o4D,545
~ JUl!r.:!!! 2W!l:!!!
16.01 ll,607 IO,lll 0 1,09S 741
U.716 1!1.12' 23,711 0 l.llS 110
40,1_DJ )5,367 - ,l_$,711
41.101
"' (JJO)
' (164)
JI.UO (1.197) 1.197
' n
3~.077
(1.511) 1,,11
' (349)
0 D 0
],611 3.664 3,617 (4.llil) (6,162) (7,913)
111 rJSlil 1211 ~o..un Js.J" l$.711
l,lOO J,70S 3,47S no sn 1111
l,-410 - 4,l7_i _1,764
(9n) PUJ (Sl GIOD fl.04D (I 9m l17 UIIZ 1,1111
0 161 30-Max.DI l!:M.!x:!!! W1!I:2!
m 109 :r.6s 2,,611 l,l71 '1,7]0
71>3 " 36 ,,SS4 4,764 ,,OSJ 9,671 7,1116 1.011
JQ..P.II.]'·OI 17.ll4
(0)
'
l,_Mq..U
I'Z,SOJ 4,31&
D
18-M•7.e1 9,S10
•n• ' U4.l171 n7.nn 112.~l~l
l.!JI' (!XIl) (Ill) 4077 ~.OTI 3.')117 6.991 1.1n 3.5171
~ 13,179
' 'ili'7i
l!:M!.x::.!!l. U:Mai:P.! 14,06S 13,111
' ' lo4.06S 13.121
M<>Yillc,\•-cncca
~ m
'--'" '" ~
7.419
Marinr:A"'f!'!,!
l!!.l!!r.&< 10,194 _.!__ 10.194
,., lM.U
'"**"u'-'un·o•
],)00
"' 3,676
D
= "' W!!!.&&
'" ),171
~ 7,617
§2.l!u.A!& 9,.617
' 'fii7
~ ... 3,441
'" ).631 1~n
20:~Au -, 1,0]0
IINVISTMEBTS• ~ U;MU:!!! li:M!l:!!! J VTDA ,..Bp....ll•l W•dr.Ulr"l' -L+7.4 L+I.O L+7-'
"B....,,_T....,ILJ!Idiltr-1.......,
F~Er.""''"' •IWtci&Uitar •ll'olanlhUitor
rule!:!!! )~~!~~ ~~~!:':~' I ~
"''"' 1.411"
~ ...... 1.4JO% 2.~,.,~
~ l.Oitl" U60~
2.311% J 2.459"

CONFIDENTIAL TREATMENT REQUESTED BYLEHMAN BROTHERS HOLDINGS, INC.
4. Major debt issuances during 2008 Q2 (
-.
LBEX-WGM 000449

CONFIDENTIAL TREATMENT REQUESTED BYLEHMAN BROTHERS HOLDINGS, INC.
Long-Term Debt Issuance<1>
$Billions
Beginning Long-Term Debt Issuance Committed Facility Drawdown. Maturity I Other
Ending Long-Term Debt
.Change in Long-Term Debt
(!)Excludes cwrent portion of long term debt and hybrid equity issuances
2005 48.4 22.6
(19.1) 51.9
3.5
2006 51.9 39.3
(12.8l 78.4
26.6
2007 20081H 78.4 118.2 63.4 24.9
- -{23.7) (19.8) 118.2 123.3
39.7 5.1
LBEX-WGM 000450

CO
NFID
ENTIA
L TREA
TMEN
T REQ
UESTED
BY
LEHM
AN
BR
OTH
ERS H
OLD
ING
S, INC
.
r m m >< I
~ s: 0 0 0 ~ 0'1 ....Joo
Lehman Brothers Holdings Issuance Summary * (3/1108 - 5/30/08)
Principal Amt Principal Amount (Orig. ccy) CCY (US D) Cusip SECID Description 2,000,000,000 USD 2,000,000,000.00 5249087N4 7.5 5/11/38SUB 30YSUBDEBT
500,000,000 GBP 990,844,595.95 XS0362467150 MN10528 10YR FIXED SENIOR GBP 2,500,000,000 USD 2,500,000,000.00 5252MOFD4 MTNI787 6.875% FIXED RATE 10Y
_ .§!lj,§.4M§§.... USD -
681,643,656.00 NATURE_GAS1 PREPAID NATURE GAS AMOF
*Includes Plain Vanilla, Structured Issuances, & Hybrid Equity> $300,000,000
~ I
.. >.)
Original Settlement Maturity Term
Trade Date Date Date (Years) 5/2/2008 5/9/2008 5/11/2038 30
4/30/2008 5/8/2008 5/812018 10 4/21/2008 4/24/2008 51212018 10 4/29/2008 4/29/2008 6125/2038 30
~ ~
Swap Spread to 1 month Libor
(bps) Coupon 271.75 7.5
270 7.875 250 6.875
- ~2§ 5.6425 ----
--~)

CONFIDENTIAL TREATMENT REQUESTED BYLEHMAN BROTHERS HOLDINGS, INC.
5. Long-term debt maturity profile as of 05/30/08
LBEX-WGM 000452

CO
NFID
ENTIA
L TREA
TMEN
T REQ
UESTED
BY
LEHM
AN
BR
OTH
ERS H
OLD
ING
S, INC
.
r m m >< ~ G) s 0 0 0 ~ 0'1 w ""' \ )
Long-term Debt Maturity Profile - 05/30/2008 !• LTD 0 F.Jdeud~blcs J
$8,000
$7,500
$7,000
$6,500
$6,000
$5,500
$5,000
"' ] $4,500
'E E $4,000
$3,500
$3,000
$2,500
$2,000
$1,500
$1,000
$500 200903 200904 201001 201002 201003 201004 201101 201102 201103 201104 201201 201202 201203 201204 .201301 201302 201303 201304 201401 201402
·· .. \
)

CONFIDENTIAL TREATMENT REQUESTED BYLEHMAN BROTHERS HOLDINGS, INC.
6. Cash capital requirement summary as of 05/30/08
r \'
(' ''
LBEX-WGM 000454

CONFIDENTIAL TREATMENT REQUESTED BYLEHMAN BROTHERS HOLDINGS, INC.
CASH CAPITAL REQUIREMENTS Q2 '08 vs Ql '08 VARIANCE
I"""· c.~ Less LIQUid Asseu;•
CollUilCfdal Wholeloan/Mortgege~
Cttpon.tc Lomu
Carpon.te Bonds - Noo Rn!ed
Equity- Restrict~
Private EqWtY lnVe:stmtnll
FundUnill
l.dunan Paper A~set Backl- Non Rated
Privntc Label (Non. Rated/Non lnvcslmenl Gfnde)
MoneyMarkctJ Convertibles
Preferred~
Sovereigns • Ewobondt Sovcrcigns-Loc:ll1s
Wholcloan (R.esidtnlial)
Miscellaneous Illiquid Asscll:
Non Trndin g Assets·
Fixt:dAssell
Goodwill
Operational Cash at Bania
Deferred To As!Cll
Retirement plans
lnveslfnent io Pnrtnmhips &. Joint Venttucs
Miscellaneous Non Trading Assets
Liquid Assets·
Equity
FundUnib
Corpc:nte
Governments PrivnttLDbcl
Treasuries
Asset Backs
Convertibles
Muni
Prdcrreds
MBS Sovereigns Wmants
Agency CmoAgcnclcs
Misce!la:neoul' Liquid Assets
Margin Olainins &OTC Rea:
Guaranty Fund Dcposiu; Bl Exchanges Futures Margin Req
LCH
Eunxl..,.
CREST
Unallhueralizcd Rc:ceivablcs for OTC Derivatives
Miscellaneous Margin Md Chaining Rcq
Eauity/Subdebl. fer Self-funded Legal Entities:
Thrirt Equity
Bankhaus andsubdcbt
LBCBEqully
~ Prefuadina: ra- Loan Commltmcnu JScJ.J lo:kUp Reqs (Firm Funded)
Bnnkh11.us Collalerel ReqJ Gross·Up ror Sclf.ruading Trades
Continsenl CollelcrBlizlltion
lmcrcamp!Uiy Funding rrom HoldinJI Unallocated Box Olher
Trapped Cash Caoitelln Regulated Enlilics:
Intercompany Subdtbt
RcgTMargin
30,689
11,032
13,361
5,669
4,635
2,456
1,149
1,6551'
1,542.
61
331
281
64
(0)
154
4,18S 3,853
1,810
2,6:37
291 1,82S
2,921
152
:3,641
75
612
1,106
163
263
238
421
151 13
183
27
82
192
283
224
Bos Rc:q
l,Sil7
3,6'33
1,614
719
333
106
163
432
396
710
174
483
212
854
461
1,047
1,079
715 198
ll,067
2,8:36
Equity/ Subdebt
1,989
1.724
909
.,,,_.
158
1,784
630
1,770
92
473
1,856
1,901
17,767
2,768
TOTAL
:30,689
11,032
13,367
5,669
4,635
2,456
1,149
1,65"9
1,542
61
331 281
64
(0)
1,739
312
4,185
3,883
1,810
2,637
297
1,825
2.,921
7,2.74
15
2.,286
1,824
496
369
400
853
554
124
183
201
565 404
1,136
685
1,047
1,079
715
198
13,067
2,836
1,989
l,n4
909
1,784
630
1,770
92
473
1,856
1,901
17,767
2,768
fonfTot.l CasbOap,t.l
Us•l,~r
22%
'"' 9%
4%
3%
2%
I%
I'll> l'l&
O'l&
O'l&
O'l& ()'l(,
(0)%
l'l&
O'l&
3%
J'l(,
l'l&
2%
O'l&
I'll> 2%
5%
O'l&
2"' l'l&
O'l&
O'l& ()'l(,
'"' O'l&
l'l&
0%
()'l(,
O'l&
O'l&
l'l&
0%
l'l&
l'l&
O'l&
l'l& ()'l(,
9%
'"' l'l&
l'l&
l'l&
l'l& ()'l(,
()'l(,
O'l&
O'l&
O'l&
'"' l'l&
Ql 2001
~ 37,384
16,763
9,876
4,970
5,626
2,682
1,734
1,641
1.473
609
492
352
167
79
251
1,064
3,797
4,111
2,450
2,692
286
1,566
2,887
6,178
2,584
1,483
716
699
647
1,131
398
1,101
178
90 144
289
1,784
838
1,069
1,016
538
202
9,752
3,194
2,443
1,448
939
2,596
1.361
1,314
145 201
1.989
n6
16,291
2,815
(6,695)
(5,132)
3,491
699
(991)
(226)
(585)
18
69
(548)
(161)
(70)
(102)
(79)
1,488
(751)
388
(228)
(640)
(55)
II 259
35
1,096
70
(297)
342
(220)
(330)
(247)
(278)
156 r-·- .. , (377!"
Ill
421
116
(648)
(153)
(22)
63
177
(4)
3,315
(358)
(454)
276
(30)
(812)
(732)
455
(53)
272
(133)
1,12.5
1,476
(47)
LBEX-WGM 000455

CONFIDENTIAL TREATMENT REQUESTED BYLEHMAN BROTHERS HOLDINGS, INC.
7. Month end Finance Committee packages
LBEX-WGM 000456

CONFIDENTIAL TREATMENT REQUESTED BYLEHMAN BROTHERS HOLDINGS, INC.
Weekly Finn Financial Summary Highlights ~ April 11, 2008 Meelinc $millions
l!allliU!rul
•
Balan~ shCCI LS still not finahzcd for March mon\h-enll Dased on the latest e.stimatt.5, we are projecting to come in at 19 2x net lcver<~gc anll 3!!i.O:c GroSS lcvcrasc ~ J.Sx tums 11bovc net target and 5.1x turns above gross Ulr&eL TargCIS for Q2 net and gross leverage are ~:urn.ndy at ll.lx and 22 4x rcspcatvely
~
LBffi MCO C:uh PrnritiO! ll:MiJ: ~ ~ MCO ~ SO,ObD i•ucne Ia positio• ~portable Uquidil)' 30,140 J2,677 2,537 1 Yeur Forward 3.988 4,'1.18 230
LBHJ Cash Cupilal
llMlu: h!.m FlD 88,167 87,&32
Equities 11,291 11,339
Other to .W,I127 39,371
Net Cash Capital Position 6,957 7,510
U) Includes CMPS, IMD, GPS, GTS, UC subdebt. and non4nlding assciS.
Inmtme.l Rctum
S lnMIIUOn$
Americas A.sUI Europe
Total ]DvcstmcDt Rcbras US CP &. Bonk Loans Non-US CP &. Bank Loans
Total Excess RchlrD! Total Excess Returns (bps)
WOW Summpn rtf TotallpYcatmcnU Spread Bps
External Investments lntemallnvcstments
Total b.n!hneats Less: Sbon Term CP Issuance
Tot•l bnslmcat.!l (J•d. CP)
J..ebmn [nual!ct Lml111 01pd Srzuml! SpnadBp1
Spreads to Treasury's as of04/04 W0Wvs.03/3l Spreads to 1 Month Libar as of04/04 WOWvs.03/3l
D1:iiJ Total Assets Ca.!lh Capil81 Sources Ca.shCilpita.IUscs
Net Excess Sow-ces Over Uses Prdunding Contingent Commitments Conduit Segregated Cash in Money Funds
Expeotcd CC Swplus (Shonfall) CUstomer CD's, deposits, and sweeps outflows
Potential CC Surplus (Shortfall)
Total Assets Cash Capital Sources CIISh C11pital Uses
Net Excess Sourus Over Uses Prefundlng Contingent CommitmentS
Expr:C\cd CC Surplus (Shortfall) Pledged Corporate Loans FHLB Advance Value on Affiliate Plcdgcs CUstomer CO's, dq~Csits, and sweeps outflows
Potential CC Surplus (Shortfall)
b!!l!ml Total Asstts Cash Capital Sources Cash Capital Uses CC Surplus (Shonfall)
Rtrularnry Cavi111 LBI LBIE LBJ
1008
Yill Anllllaliu!l 22.6 s 64.3
1.2 3.5
= ~ 4.5 s 12.7 .s.s -15.6 0.8 2.3
(D.l) s (0.5) (0.2)
pn:lix I WI. Spread Week Ended Prior Week ~ ~ (44.5) 25.0 (44.9) (20.9) (44.6) 10.6 (15.8) (9.2) {40.8) 13.0
l.:D:l JJLm 350 ns (100) (125) 273 264 (!6) (122)
1J.,.Ma[ ~ 12,029 12,465 10,323 10,491 72]4 ---1J£i 3,089 3,344
(1,201) (1,301) (550) (550)
4 500 _..M.m! 5,832 5,887
873 ~ 6,705 6,&32
llMlu: ~ 6,482 5,585 5.136 5,231 5556 ~ (420) 674
0 2811 __(UW (1,701) (609)
343 343 S4S 545
---(813) 279
li=MII h!.m 26,731 28,692 )6,393 18,439 11572 --ll.W. 4.157 5,866
llil4l! h!.m 2.895 2,89:5 139% 139% 308o/• 308%
!:lw!&o (335)
48
(5,456)
554
~ s 8.8
0.0
l1Ul s (17.8)
1,0 1.4
s (15.4) (4.9)
QlilnG 436 168 (81) 255
(100)
(100) 54 73
127
!JllnG (891)
95 (999)
1.094 (2)
1,091
1,091
!JllnG 1,961 2,046
349 1,70!11
!Jlw<
0% OY,
CC • S0.6bD letrcasc h1 po.sitloD
- repnyme.ru of European committed facility (.$2.0bn)
- repayment of West LB facility ($1.lbn)
- pending JOan syndication ($3.Sbo
Retun11: WcdtO'o'crwcckmWllS fell from L+ 13to L-41 (Oat to -24 ex-bond funds)
·With libor levels eootinuing to set at August 071cvds given ercdit concerns of banks, the overnight deposits thDt we've been doio.: havo created a significant drag on the portfolio with spreads on deposits this wcdc. at L - 50
- Rctoms on UlX e.<tempt declined signiticanUy on the week from L + 2171o L + 104 -With April IS upon us, we should sec taX exempt rates back up signiflcanUy 0\ler coming weeks
Plpr:llae for April • $0.2 bn ofloans p111chascd so far • SO.O bn ofloans approved bul not yet funded • S0.3 bn ortoans sold so far • SO.O bn ofloans scheduled to be sold
LBEX-WGM 000457

CONFIDENTIAL TREATMENT REQUESTED BYLEHMAN BROTHERS HOLDINGS, INC.
Weekly Firm Financial Summary (Aprilll, 2008 Meeting)
1.
2.
Table of Contents
Balance Sheet: Reported Capital and Equity
Liquidity
a. MCO
b. Cash Capital Summary
c. Cash Capital by BPM
d. Cash Capital Usage
3. Debt Issuance Profile
a. Long Term Debt Maturities By Quarter .
b. Maturity Profile
c. Average Life of Short-Term Debt
4. Short-term Debt
5. Traditional Investment Returns
6.
i.
Issuance Levels
Peer Group Benchmark Issuances
8. New Issue/Closed Loan Update
9. Banks
a. Thrift
• Sources and Uses
• Pipeline
b. LBCB
Sources and Uses
• Pipeline
c. Bankhaus
Sources and Uses
• Pipeline
• Bankhaus Loan Update - Pipeline and Closed Loans
Financial Planning & Analysis
- I-
LBEX-WGM 000458

CONFIDENTIAL TREATMENT REQUESTED BYLEHMAN BROTHERS HOLDINGS, INC.
Financial Planning & Analysis
J. Balance Sheet, Reported Capital and Equity _ ..........
( \,
Actual Actual Actual Actual Actual Actual Actual Tarte: I (Under) I Over Tareet
ASSETS Now~06 Feb-07 Maz·D7 Au&-07 Nov-07 Feb-DB Mar-08 Mar-Oa Mar-08 21 Fixed Jacome Core
NetTanKible 17l,O'Z5 187,404 201,90~ 21%,048 131,141 14~,311 344,197 245,970 98,227 219,000 Gross 247,266 27'1.,237 279,959 283,937 315,334 368,234 470,671 332,248 138,424 321,000
Equities Core Net Tao,ible 38,116 46,800 50,922 52,364 50,74~ 48,463 43,698 54,275 (10,577) 40,000
Gross 48,412 56,562 6'1.,264 62,644 61,064 60,124 55,882 66,672 (10,790) 52,000
Capital Markets Prime Services Net Tanr,ible 32,844 35,661 42,209 40,267 44,900 48,612 54,823 54,642 181 40,000 Total Cap Mkts Prime Services Gross 147,042 167,360 181,445 224,017 220,479 260,6n 268,472 261,698 6,n5 230,000
Total Principallnvestinc; Net Tane;ible 7,444 8,667 10,1'11 12,988 11,810 14,687 14,808 17,028 (2,220) 10,000 Financing 2 084 2 330 1 981 1 869 1779 2 069 2012 2 235 (223) 2 000
Gross 9,52_8 10,996- 12,153 14,857 13,588 16,756 16,820 19,263 (2,443) 12,000
Asser Mana~:ement Net Taneible 5,663 7,576 10,782 12,604 11,872 14,258 13,2~3 13,660 (367) 10,000
Gross ·8,669 10,652 14,016 15,832 15,144 17,552 16,524 16,824 (300) 13,200
TreRSU1'1 Cash 5,237 3,433. 4,691 6,143 6,363 6,119 7,096 4,500 2,596 3,500 Liquidity Reverse Rcpo &. Borrows 30,694 23,797 26,000 30,638 37,785 35,780 18,599 32,364 (13,764) 32,000 Short Term Securities ~ 1,403 1216 ~.287 2~27 1,884 4613 4 5!!!1 !!3 3,aoo
Total Treaswy 36,978 28,633 31,906 39,568 46,375 43,893 30,309 41,364 (11,055) 39,000
Other Net Tan~iblt 7,451 9,854 15,767 17,902 13,897 13,220 14,003 15,833 (1,830) 15,600 Gross 5,650 15,842 24,118 18,361 19,078 18,798 16,800 18,073 (1,274) 18,600
Total Net Tan~:ible 268,!137 300,798 337,667 357,103 372,959 396,674 496,532 410,409 86,123 341,600
Gross 503,545 562,283 605,861 65~,216 691,063 786,035 875,479 756,142 119,337 685,800
Adjusted Net Assets Cash Shorts 107,943 123,080 144,014 113,115 117,996 159,096 100,000 100,000 100,000 Adjus_ted Net Assets 376,880 423,878 481,681 470,218 490,955 555,770 596,532 510,409 86,123 441,600 ,- ' .'
EQUITY, DEBT AND TOTAL CAPITAL Common Book Equity 18,096 18,910 20,034 20,638 21,395 21,839 21,264 21,264 19,283 Perpetual Preferred I 095 I 095 I 095 I 095 1,095 2 993 ~993 2 993 6 993
Perpehlal Preferred Issuance Stockholders' Equity 19,191 20,005 21,129 21,733 22,490 24,832 24,256 24,256 26,275 Tangitile Shareholders' Equity 15,829 16,474 17,476 17,625 18,363 20,720 20,151 20,151 22,174
Hybrid· European (Junior Subdebt) 1,218 1,226 1,243 1,114 1,203 1,218 1,257 1,257 1,239 Euro ECAPS • LB UK Capital Funding IV l 262 269 273 295 304. 315 315 311 Euro ECAPS • LB UK Capitol Funding V L 500 500 500 500 500 500 Hybrid • US ECAPS (Junior Subdebt) 296 300 300 300 255 255 229 229 255 Traditional TrustPreferfed (Junior Subdebt: 1,224 1,225 1,225 1,225 1,225 1,225 1,225 1,225 1,225 New MCAPS Issuance 1485 1 500 I 500 1475 1,475 1,475 1475
Prefened Securities Classified as Subdebt 2,738 3,013 4,522 4,911 4,978 4,976 5,001 5,001 5,004 Toto! Tangible Equity 18,567 19,488 21,998 22,537 23,341 25,696 25,152 25,152 27,178 Hybrid Seeuritil!s over Limit ---- Ul!l (J73) GJ8) Leverage Equity (Subject To Limits) 18,567 19,488 21,881 22,164 23,103 25,696 25,152 25,152 27,178
LEVERAGE RATIOS
!iwl E:xttmaiRtf.t:ll'l:
(GAAP CJ'ot.l AIRU I Sllrhldn' Eg) 26.2xl 28.txll 28.7•11 30.3xll 30.7xl 31.7xl 36.1xl 31.2xl 4.9xl 26.1xl /nrtrJUJI T2!J!r:
(rane"bk crotal Ta2§ible AssctJ I L~ 26.9xl 28.7xll 27.5xll 29.6xll 29.7xl 30.3xl 34.5xl 30.lxl 4.5xl 25.2xl
!!!,. L'EB (I'••t!bh: Jll•t ADell/ L Eq) 14.Sxl 15.4xl! 15.4xll 16.1xll 16.1•1 15.4xl 19.7ld 16.Jxl 3.4xl 12.6xl
Competitor Nst Lgerage MER 12.6x 12.7x 13.lx 16.4x 19.4x 1~7x
MS 14.9x 15.3x 15.9x 16.7x 16.5x 14.8x BSC 16.8x 18.5x 19.7x 19.2x 23.0x 22.6x GS lUll l4.b ll& lMll l4.b lS2ll Peer Average 14.5x 15.3x 15.8x 16.9x 18.5x 17.5x
22.0xll 21.2xl 21.3xl 21.6xl
-2-
LBEX-WGM 000459

CONFIDENTIAL TREATMENT REQUESTED BYLEHMAN BROTHERS HOLDINGS, INC.
1!?: \'~/
((:~ \;
Financial Planning & Analysis
2. Liquidity a. MCO
,. LBHJ WEEKL):'" MCO REPORT AS OF MARCH 31, 2008·
~ge in Sources LTDt.ssuancc LTD Roll-in LTD Buybatks LTDO!hcr Facility Rt:pa.yment
Total Chrmge In Sources
4.4 (J.Z) (0.6) I.S
(1.3)
Change in Usage Net Lonn Syndic::aUon Derivatives Clwlgc in Trapped Gopilallnjcctien/Repalriotion
Total Change In Usage
Total Change in MCO Po:rltlon
Summa of LOaD Activil :
0.9 (0.1) (0.4) (12)
Deal Business Rr:gloD Projected L-=r-~..=.! Tcb~"=~ Hilton transfer to BH Pn>logis UAC securitization E-Sbcllcr 1mnsfcr to BH Protcgo tnutsfer to BH Grand Prix lnmfcr to BH Ritz Knpalua uansfcr to BH Sumitomo PtirtiCipations F11irPoin1 Communication Project Freedom (Equity)
Olher <<SSOMM) Loan Activity
STD net issuDnCC Loan ~livity
LTD net maturlty/buybock Facility repaymebt Derivatives Chanse in Trapped Capital Injcction!Rtpatriation Others
-HYIHG Europe ""Real Estate us Rr:aiE.etc us Real Estate AsU. Real Estate Europe Real Estate Eurtlpc Real Estate us Real Es~atc us HYJHG···· us HY/HG us HY/HG us
Total Inflows
Total Oulj1aws
Total Change in Rr:portoblc Uquldity
Pcndin&: LTD Settlements Pcndins: STD Settlements
Pending Olhcr Sculcmcntl
LTD Maturity (based on expected lire) STDMaturity Secured F~iUties Maturity Contingent Commitment (Ptefunding) Deb< snd Eqwty Buyback Lcners ofCrcdit Contingent CoUateralizatioa on Derivatives LB Lux CertifiCates
12.0
10.0
8.0 .. 6.0 0 ~ 4.0 u= ::Eji
2.0 e o.o {2.01
(4.0)
Yes Yes Yes Yes Yes Yes Yes Yes Yes Yes Yes
Inflows 1.7 0.4
Outflows (0.7) (1.7) (0.1) (0.6) (1.2) (0.2)
0.7
(0.8)
(0.1)
Amount 0.3 0.3 0.2 0.2 0.2 0.1 0.1 0.1
(0.3) (0.4)
(0.6)
0.1 0.4 Net impact on Reportable Liquidity
2.2
4.8 o.s
9.7
25.2 11.4
I.S 1.4 o.s 0.8 0.1 0.4
Net impact on MCO
LBHI MCO & Reportable Liquidity
03 '07: S33.61:1n
~~ q ~n ~ nHP§n ~n n-~&: nn r; n HHs ~n !i ~ • ~niH H ~~ ~ i,. i H ~~~~~~~~ss~~~~~-~~s·~~g5~~ss~~~~~-~§~~~!~!§!E~~55S~~~~~$~~~ -MCO -R•partabl• Uquldity
40.0
~ 25.0 !I 20.0
.!:5 15.0 ~m 10.0
1:W g_-5.0 ~ o.o
- 3-
LBEX-WGM 000460

CONFIDENTIAL TREATMENT REQUESTED BYLEHMAN BROTHERS HOLDINGS, INC.
Financial Planning & Analysis
2. b. Cash Capital Summary
LBHI Cash Capital Change: 3/21-3/31 (~. ~.~};,~;,i }}'r;:::?j;';,J;~~;'· sfaffiijg~g(Jp~$.f.pt)i\•l:is::9f"$/2tfji: .•: ·::: ·~. 1'. ·,:/'' ·:;'::';;..., > ;\:,':r~:~~',?\~ )}:~f< ;;' ,.: :, ~i :> ~ .-; ' <i~ .. ? ' :::.. 6~Q~~
Sources - increase/(decrease)
CC Sources as of 3/21
New Issuance Roll in to current portion LTD Buybacks LTD Other Committed Facility FX Mise
Total Change in Sources
-=-- CC Sources as of 3/31
Uses - increase!( decrease)
Imperial Tobacco Hilton transfer to BH Prologis LJAC securitization E-Shelter transfer to BH Protego transfer to BH Grand Prix transfer to BH Ritz Kapalua transfer to BH Sumitomo Participations FairPoint Conununication Project Freedom (Equity)
Other <$0.lm Total Change in Loans
CC Uses as of 3/21
Change in Pending Settlement of Loan Syndication/Securitization Change in business usage Mise
Total Change in Uses
CC Uses as of 3/31
UC Funding - (increaseVdecrease
1/C Balance as of 3/21
Change in Eur Reg I/C Change in Bankhaus Shortfall Change in LBJ I/C Change in LBI I/C Other I/C Change
Total Change in UC 1/C Balance as of3/31
(0.3) (0.3) (0.2) (0.2) (0.2) (0.1) (0.1) (0.1) 0.3 0.4 0.6
(0.1)
(0.2)
146.9
4.4 (3.2) (0.6) 1.5
(0.6) 0.5 0.6 2.4
149.4
139.9
(0.4)
(0.5) 2.4
(0.02 1.4
141.3
(1.0)
0.1 ____ ~
(0.1) (1.1)
-/
I
-4-
LBEX-WGM 000461

CONFIDENTIAL TREATMENT REQUESTED BYLEHMAN BROTHERS HOLDINGS, INC.
Financial Planning & Analysis
2. c. Cash Capital by BPM ~--------------~::::::::::::::::M~~~·~M~o~nh~J~o~, ... ~::::::::::::::~:::::::::::::Jw~o~W~h~OoN;[o~~J•~-;.,[o::::::::::::~
""""-
'"' L1'0·D•-·"Pfc..Soll'·flllldiliiTnde
AoiJ,.IIIITotal .... {"•""$) LU
IIIJn
'"' lolt '" (1,+00)
·~ .... Toll!
(I,IU
...... ~ -----LJJa --UI ---U!J. __ui ~ _l.l.lU ----·- ----· --~ ----·- ----·-~ ~
LBir-uamtiRliN<ploiCOISDI!o
Wor=r•f""'Y~,..&o.n+!o~
"".,._,..._,.suto.w... Rq,•n.t.ualrt. Drw""'OoNbPociloly o..-FiddilyFocility OrownW..,LBFo<iliq
On-E~npQ~~Ftrility
en.-o....c--...r ... lilr OniOIISL&I.CSir_,IIW:Fod!irJ'
~:~ra .... r ...... rc...nil On10111tACERSFotllily
Dn-Cra-fO<illtJ' en .... Mcllif~F.cllilr SnwCll&seM.blrFocili,;.,
FOREIGN E.''i:QlANO'i
HIOHOA.ADE.OEDIT HIGHVJa.Q
LEVIiRAOED FlNAHCH
0'1'11EI. PROPTTV.DINO
S~afiADMIN
sttURmZI!:DPP.ODUCT! lbCinrRai.C!Naufibt.
8onldv.III ... Ooillo<lolol UNIIGc .... niUIIIIIII'
A.:IIACASH CONVO.TIZILI!5 PI.ODUCT EQllmi!.S COkPOMTE
&QUmE5SUI'PCR.T EQUTTYSTR.It.TEOW
EUROPE CASH
OLOIIAL.POII.TFOLID VOL.ATIUTY AAca!CAS
VOL.A'I"'LnYEI.MOPI NllfiTia...,.~i'lt-
8 ....... u,...,_,..,LBIIU
T•bii"Q
CI.EAIUHO loND EXECUT10H EQUJTT FIHANCINO EQUJn".IYNTHETICI
FU>FUTUlOEB flRMFIHAHCrHO GENERAIJJTPRD.m:SVCSCCia. STRUC'TlllS'DTitANSAC'OO~S Ur.aliooulftUIIIM
Al.TU.NATlVD
A:ISETMANAOIIMENTI'PJNCIPAL.INV A55ET UOJ.IT AOMINlSll\AllON
IMDCOIU'OMT& MFIEQUlrY
MFJFDCEDINC01o41> I.O'ISlMOKT ~l!llOBI\liiERMANPIUV ASn"MOT Pft.l.utti"MGMTlNI1tADSVU.D.I PD.CPR£.Al.LOCA'ti!D ,RIVAT1!EQUITY .;,.;~lJI:l!IOII
OIRECTPIJHCIPALINVESTMilN'lS OLOBAL OPPOI\TUNI.TIESOROUP OLOBALI'JJIIICU'ALS"nVr.T OLOBAL Tll.ADINOS'TI.ATEOIE5 U~UIIIa.
~-Tnol .. ,... ... (_l)
~-.. r.rrnt-~T""""' c.,.....,..~ticwl ...........,, ..... ~...,.F ........ n-.H•Idirop P.q-n.c.p. lb\.._..rrsa. o.n....tinA'~ P<IWI.qL-~
Cu CapiUI ~~- blllN&n;: Trappooolc.tr.~ilal(bo:rN) ...._ ....... ,_ ... ....., . •' CuhCIJIII\,._IItlo•dlarliC
UIC8~R
t!..~.u
'" '
IT,2.7J
"' "
""'
(l,11S)
'·"' " l.1U
1.110
lll,l47
1,71J
1.100 ..... ..... 1,110
..... 1,1JO
-1,11)1 .. ,. '-"' 1,101
IO,lH
1,107
'" I,IU
U,41J
"'
'·"' 1,110
-~'
7,~, ..
'·'~' '·"' l,-111
''·"' 1,107
l,UI
"' ~2.1145
u (Jt)
,,,
"" (10)
(U2)
'"' "' !"J
• 1,72A 1.'72~ • •
,,, ,,,
01
o;oo (175)
(100)
n (+&2)
{142)
'"'
UDD)
.. , .. {2U}
(I~J)
[Sit)
no (lOll)
I,JH
(-2:}
(oliO)
{11)
(US)
""'
.. ~.
,,~
'" " "" ... c•w
, .. ---· ----·- ·----·- ----""! ----·- ---·-~ --· ----·- ---· ____ ._ .. ----·- ----·- ____ ...
... ' ...
'" ' , "
11.10 111.311 41 (U'I) U (OJ) (I,U1) {I,_.J
n l_liJ
L121 I.U1
"' ... '" I. liP
'" . "'
{11)
"' "" " ,,, (13) .. m .. ,.,
"'' (SO)
'" "" ""' ·(I)
{IOl.)
,,, " "' " 0) ,, " (Ill)
"''
.. " en
"' • 0 ,: ..
__ : ____ : _____ : _ ____in ____ : ____ : ____ ;_, ____ : _____ : _____ :_ ~ ____ : _____ :_ ~ PI l.UI • l,nl • 1,211 IJ,$21 PI) ltl • {J:Ii) ll"l m {U7
1.01<1
I.OU l,t.n
., {ll)
,., (lOS)
" (tOl)
'" n•> (14)
O>
,. (Ill
"" __ : __ '." ____ :_ ~ ____ :_ ---~-&0 ____!!; __ : ----·-"' __ : ~ ____ :_ ----·-(1) ~
I 1,111 I 371 J 1.,)11 4,531 (IJ) (01) (I) (:U} - Ill (U7]
'·"' 1.030 (II) ••
'"
'" (II)
m
"'' '"
'" '" "'
I IS 16 (ll) (I) D) ___ : __ : ____ : ____ ·,. __ : ~ ~ ____ : _____ : ____ : ~ ____ :_ ~ ~ • I 1n J" • t,011 t,.:U • {n) .(II) (II) • (U) {LJ
117 {SO) {50 1U (U) [U
UOI Z.IOI (90) {to
• 110 II lOt • 1,111 LUl • 1• {0) (11) • 111 It
--· --· ----·- ______!.ill. ----·- ---·-~ ----·- ----·- ----·- _..!!!!) ----·- ----·-· ---l!!l) I Ul II 1.115 • ':11t I,HI S 14 {I) (371) • (111) (U'l
"'"
.......
(l.tlt)
lltS)
""
1.s.u
[711)
,,,
t.IU
II,.Stt
Llll (1.\'n)
,;,
'·'"" Ll11 (Lin)
(111)
"'' 1,0-n 11,641 (Ill
(MI) '''
......
(IJS)
{I)Jl) (I,Ul
(44')
·~· >.on
-"-·"'
'"' ,.,,
(JU) <'Ill "' '-"' 1,en
~opoymt~~t•r~~~<-'>J ''"' Moanea-.wwllio£wvp.Jl40toap(-4)
CO"f<ftw.aflea.WlaC:Siooon:follWLiffi
{l.IU) {JU) JJII (VIS) (1)1)
Jiotea:doci - P.lltl....-::£.;:.:.,~~.~ .. :.;;-,_ •-!-:-<~:-.~: .··
tfo!O: /}JttdrJuf-'J-tr...,.MIJ.,_fi,_,...~--""'·I·~··Mfiii,_Jr/,_.,..._,~N ...... _IOC._,PU."""'--2l.U~J..I.,Jj.U/6J>Ifi-1J..b,.,_d-$1UJ.,.&. WIIIWISI.I.IJ•<I'IIIU/Eruo4-IIUJ.Dk " 8 m 1etc"rCpwi!!I-Emq/Jc•Cui'•,.,,.pll4r,,•
-I.IJ~-Iur.IIIJ,..,.,!i>I..,.,.~IJ..:II~I-ro'aau..-!Afi~IISI.J._ --UII!".I..-r-~-.zsJ.I••(I.3.V1J2f111nmn,c.,t/IIIIJ.Mio}:IAJ£'.r...,.un~---•~Wuutmlt/lllllfllnflti....J"'J''IIl
l)OIIrlr&,.~IJ.•rO...,.lrocf~Hkr.n.....W•k.UL Ulil..I'J4.WII'ULO'!'tlllu. I)J~ ....... I-.IRF6T~I,_.",.,_.NuriHocbrl'•oot
-Ulli'"-IIMIQI:f.Q'~-.-.U.Q•(11UUKC.,YIR-}:UIE'I'"fl'll-rri_IMI,.1!lli>III/2MC"fiMIII""""rNQ!!IIIIA
- 5-
LBEX-WGM 000462

CO
NFID
ENTIA
L TREA
TMEN
T REQ
UESTED
BY
LEHM
AN
BR
OTH
ERS H
OLD
ING
S, INC
.
r m m >< ~ G) s 0 0 0 ~ en w
"'
Cash Capital Usage inbUIIons
Current Week 3/31/08 PriorWeekJ/21108 Prior Monlh End 2129/08 YTD Change
C•sh B•lanc• cc Cash Balanct~ cc C1sh Balance BPM Caoltal Sheet lnlen!Lif¥_ C~tal Sheet IntensitY Caoital Sheet FID Real Estate 42.9 70.4 61% 42.8 70.5 61% 42.1 70.6 Securitized Products 15.6 62.6 25% 16.0. 60.7 26% 13.7 58.7 Global ReleiJ 9.6 138.5 7% 9.1 148.4 6% 7.7 47.9 coo 5.4 11.5 47% 5.5 1f.6 47% 4.8 11.0 High Yield 10.9 14.5 75% 9.9 14.1 70% 10.7 14.5 FlO Corporate 1
7.4 7.8 95% 8.4 8.1 103% 8.5 8.0 HJgtl Grade 2.4 13.4 18% 3.0 15.7 19% 2.1 10.8 FX 1.5 5.5 26% 2.1 5.7 37% 2.4 5.9 Municipal a 1.3 10.0 13% 1.7 9.4 18% 0.9 8.2 Uquld MKTS Proprietary 0.7 7.0 10% 0.6 92 7% 0.6 1.5 ~Commodities 12 3.8 32% 1.2 3.9 31% 1.0 2.5
lf'h•r 1.5 1.6 - 1.4 Bankhaus Equity and Subdebt 1.7 1.7 1.4 Unallocated lSI Sox 2.0 1.8 1.5 'Subtobll FID Core 104.2 345.1 JOY. 105.4 357.4 zgy, 91.11 239.5
IIBD' 2.1 6.5 32% 2.9 6.8 42% 2.4 7.3 Total FlO & IBD 101i.3 351.5 30% 108.3 3642 30% ~ 246.9
~~qulty !Volatility 7.5 26.3 211% . 72 28.1 26% 7.8 30.1 Equltfes Corporate 2.2 4.4 50% 2.0 3.0 65% 2.0 3.2 Equity Strategies 0.8 3.9 21% 0.8 3.9 20% 0.9 4.3 Convertibles Product 0.3 2.5 13% 0.4 2.8 14% 0.4 2.7 Glob•l PortfoBo 0.4 0.6 69% 0.4 0.7 60% 0.5 0.7 Execution Services 0.8 6.5 12% 0.6 6.7 9% 0.7 8.9 Other 0.0 0.0 0.0 Unallocated LBI Box 0.6 1.3 0.6
otal E uities 1 .5 44.2 28'~ 12. 452 28% 13.0 50.0
CMPS 4.5 57.8 8'A 5.0 54.8 9% 5.2 48.0 liMO 9.6 13.0 74% 9.7 14.0 70% 0.7 13.3
r 7.0 14.3 49% 7.4 14.7 51% 7.1 14.8 Non-Trading Assets ) 11.9 15.5 n% 10.9 15.5 70% 11.1 15.6 Other" 4.6 6.1 75% 1.3 22.5 6% 2.9 3.0 1Tot1 Other 37.7 106.1 3&' 34.4 121.& 28•h 36.0 94.5
· J) FID ntargln a11d t:tUh Dl lianlu nqulnmtnts are allocottd rllllrrly to FID Corporate. Allocation by BPAI iJ latudonr by lht busl11us. 1) IBD cm/1 capilal"lndJidu Conlingml C0111mllmrnl.l which is not a bal1111tr sheri nqufrrmrnt.
cc Cash IntensitY Caoital
60Vo (1.6) 23% 22 16% 1.7 44% 1.8 74% 2.6
106% 1.2 19% 0.1 40% 0.2 11% 0.5 42% 0.4 40% 0.9
0.2 0.3
41%1 0.0
10.5
33% 0.5 41% 10.9
26% {1.2) 61%: 0.2 22% {0.1) 15% (0.2) 6l% 0.0
8% {021
0.0 26% (1.3)
11% {0.5) 73% 1.3 48% 0.7 71% {0.41 96% 4.0 38% 5.1
J) lncludesjlud asnts, goodwill, ntlr.r~r~rnt plan, defonYd tm: auetr, casll ol ban/a, grntrol portnl!rsl•ip IXCO/IIItJ, dine/ corporate inwstmrnl, 011d od11!t' misc. assets. .f) h1cludu shortfolb, ln/tm)ntpany fimthiw, unallocllled lkr#vallw activlly, gnw-upsfor self funding tt'tldu al/dcontlngnrt collatrrali"zlllioll.
-~ l
Balance Sheet
·\ I
/
(021 0.7
98.6 2.4 0.3 2.4 3.1
(0.9) .2 3.4 2:0
122.4
0.9 123.3
{3.9) 1.1 0.6
(1.0) (0.7) (1.3) 0.7
(4.71
10.9 0.7 2.3 1.6
{8.0 7.6
-~
Q4'07 Q3 '07
Cash Balanc:• cc Cash Balanc:e cc Ca ilal Sheet Intensity Capital She~ lntensitv
44.6 70.6 63% 40.9 I 56.4 73% 13.4 61.9 22% 11.6 65.9 18%
7.9 39.9 20% 7.6 35.6 21% 3.6 9.1 40% 4.6 12.5 37% 8.3 14.2 551% 9.1 13.2 69% 6.3 5.4 t16% 5.6 3.6 155% 2.4 10.3 23% 2.8 11.2 251~
1.3 6.4 20% 1.4 3.8 37% 0.7 5.8 12% 0.3 5.4 6% 0.4 3.6 10% 0.2 2.0 12% 0.3 1.9 18% 0.3 1.4 18% 1.3 0.3 ... 1.4 2.0 0.9
93.8 222.8 42Y, 87.1 210.9 41%
1.6 5.6 29% 1.6' 5.6 29% 95.4 228.4 42% 88.7 216.6 41%
8.6 30.3 28% 8.0 32.4 25% 2.0 2.6 76% 2.0 3.0 66% 0.9 3.4 26% 0.9 3.7 24% 0.5 3.5 14o/. 0.6 4.9 12% 0.4 1.3 30% 0.5 1.0 47% 1.0 7.9 12% 0.7 7.0 10% 0.0 0.0 0.5 ... 3.8 48.9 28% 4.0 51.9 27%
5.0 46.8 11% 5.9 38.5 15% 8.3 12.3 67% 7.5 13.5 56% 6.2 12.0 52% 4.5 13.3 34%
12.4 13.9 89% 13.9 15.7 89% 0.7 14.1 5% 7.4 3.3 90%
32.6 992 33% 39.2 89.2 44%
5." . ,. '
Q2'07
Cash Balan~:e cc Canital Sheet lntensitu
35.8 47.0 76% 10.9 66.4 16% 6.0 37.4 16% 4.4 9.0 48'"' 6.2 9.5 65% 4.8 2.5 192'.4 3.0 12.0 25% 1.5 4.0 37% 0.7 6.2 11% 02 3.1 8% 0.2 0.3 77% 0.3 1.1 1.0
76.1 197.3 39%
1.6 5.6 29% 77.7 203.0 31%
8.0 26.6 30% 2.4 32 74% 1.0 4.8 20% 0.7 5.2 13% 0.6 1.7 35% 0.3 9.4 3% 0.4 {1.7) 0.7
"14.0 50.9 28.,.
6.6 42.2 16% 7.1 10.8 56%
3.7 10.1 38%
13.0 15.0 87%
4.7 3.7 127% 36.2 11.8 43%
' J\'6
Cash Canilal
29.1 10.1 5.9 4.8 5.8 ..• 2.3 0.9 0.7 02 02
1.1 1.4
67.0
1.6 611.7
6.6 1.8 0.6 0.6 0.5 0.6
1.1 11.5
7.7 4.3 2.8
11.3 4.1
30.1
..
Q1'07
Balanc:e Sheet
39.2 61.2 36.4
9.7 8.7 2.8
1J,1 2.7 8.0 2.6 0.1
184.6
5.6 190.2
24.1 5.1 3.0 4.6
10.0
46.8
35.7 7.6 8.6
14.8 (2.8)
63.8 .
l'-J
~
~ ~
~ ~ s· -s: ~
cc lntensltv
74" 161/c 16" so·~
66% 162%
18% 34%
9% 7%
150%
36%
29% 36%
27% 35% 15% 12%
6%
25.,.
21% 57% 32% 76%
-146% 47%
/~)
~
l ~ § ~-Ro ~ s ~ .. E;•

CONFIDENTIAL TREATMENT REQUESTED BYLEHMAN BROTHERS HOLDINGS, INC.
ff ' ;
'
' f
~~ (/ \
Financial Planning & Analysis
3. Debt Issuance Profile
a. Long Term Debt Maturities By Quarter
Year 2009 and 2010 maturities are $12.88 and $17.18 respectively.
LTD MATURITY PROFILE BY QUARTER for NEXT 41 OTRS
Year 2009 and 2010 maturities are $12.8B and $17.1B respectively.
20,000
18,000
16,000
14,000
12,000
10,000
----.----------.---------·----------·-----------------.------------.----- -- . -- .. ---------------- .. --------- ----.-----------.-------.-----------.--. ·-. ----! ?~~-17
ii,Oiiii
6,000
4,000
2,000
2 Excludes FAS 133 Adjustments
b. Maturity Profile-- ($MM)
Unregulated Maturity Profile
04/04/08
Commercial Paper OtherSTD Curr Por of LTD Total STD
0/S
10,076 4,479
23,486 38,041
Regulated Maturity Profile (CD's)
04/04/08 0/S
LB Bankhaus I 7,623
LB Bank 1 2,971
LB Comm. Bank 1,426
TotalSTD 12,020
Months
0-1 1-2 2-3
970 900 241 434 359 359
2,604 847 209 4,007 2,105 809
0-1 1-2 2c3
1,722 1,256 887
171 204 158
107 !IS
1,893 1,567 1,160
I LB Bankhaus, LB Bank balances, &: LB Comm~rclal Bank are CD's (Not classified as short-ttrm d11bt on the Firm's balance shed)
c. Average Life of Short-Term Debt- Days
02/29/08
C/P OtherSTD
Total
33.57 244.24 184.05
03/07/08 27.02
243.30 167.78
3-4
122 196
1,877 2,195
3-4
435
635
369
1,439
03/21/08
45.69 289.69 226.82
4-5
30 233
1,071 1,333
4-5
350
610
360
1,319
03/31/08 26.33
280.18 217.37
5-6 >6
248 7,566 238 2,661
1,282 15,597 1,768 25,824
S-6 >6
144 2,831
92 1,101
77 398
312 4,330
04/04/08
23.95 287.80 217.91
- 7-
LBEX-WGM 000464

CONFIDENTIAL TREATMENT REQUESTED BYLEHMAN BROTHERS HOLDINGS, INC.
t 4. Short-term Debt
Short Term Debt Analysis 4/4/2008 (in millions)
Lehman: Final Final Final 0405 0406 0407
CP 1,776 1,641 3,101 Structured Notes 350 799 2,142 Bank Loans 341 Aegis 2,300 STG Trade (Bamburgh) Zero Strike Warrants/Fully funded 103 2,000 4,074 Participations 258 227 298 Overdrafts I Other 456 792 1,308 Total Previously Reported STD 2,941 7,759 11,264 Current Portion or L TO 8,410 12,878 16,801 Total Revised Reported STD 11,351 20,637 28,065
L TO (wlo Current Portion) 53,900 81,178 123,150 Total Debt 65,251 101,815 151,215
Total STD to Total Debt 5% 8% 7% Total STD (including CP) to Total Debt 17% 20% 19%
Short Term Debt Analysis 40,000
35,000
30,000
25,000
20,000
15,000
10,000
5,000
Financial Planning & Analysis
Final Final Final Dec-07 Jan-08 Feb-08
4,982 10,356 7,751 1,549 2,263 2,875
3,757 3,096 4,150 315 288 510
2,315 938 729 12,918 16,941 16,015 19,021 18,830 18,510 31,939 35,771 34,525
121,088 129,062 -128,284 153,027 164,833 162,808
8% 10% 10% 21% 22% 21%
• Current Portion or LTD
Ill Overdrafts I Other
• Participations
0 Zero Strike Warrants/Fully funded
DBank Loans
• Structured Notes
liiCP
04 05 Q406 04 07 Dec-07 Jan-08 Feb-08
-8
LBEX-WGM 000465
-------I \,
'

CONFIDENTIAL TREATMENT REQUESTED BYLEHMAN BROTHERS HOLDINGS, INC.
., (
Financial Planning & Analysis
5. Traditional Investment Returns
Javeslmeat Retaras For tbe Period Eadia& April 06, l.OOS S ia millioas, Spread ia Bps
Summary ofExew Returns:
SinMfl/foru I Amtiiic;is Is Aslo I EuroPI'
ToRI hv~t~hDclll Retunu:
i US CP & Bank Loans Non-US CP & Bank Loans
Tabi·EJCCSI RetaruS' Tot1l £:1ccuRthlnu
SinMlllioru I /mfKJt:1o Cha11 t
Average Uquidity YTO Aver~9e sPread l
Cbn eJa Elcia Retani
YJD
...
EYlliU
12.55 s 1.22
(19.33) ..... (l53) 0.8]
(0.2A) s
! : I 4.7 ..
Week oVer Week S~mmaa- Total Investments:
AnnUII)ized FV 2007 64.3-4 s 8.7J
3.48 ~02
-~ ---~d! 12.72 (17.,) os.ss 0.97
2.34 1.44 .5 's (15.39 azl ...
Ex Returns 1.19
13.69 14.88·
t~'-""-c.!~~ -~- ~· -.,., ,....~~:!'!~,',"-'~ r•~7~'f.~'t~"":-,.'1 ,•r·'~,J,-'--•~~~~-- CL.tn~nlf"h~ITD,\~~ Cl•rrcM!JiCI:l.a..!.cr.lp: Pnnr\\'~ck \\crJ!!:~ \\n\\ '\•~r.J:zc\.',m~nrc
[nlc,tm~nt T~ fl~ ;1)~R (\!<!""~ Ulllt:•Jioli \i<llll n,.,_,, ~'I') on"'""n Olr.l-11~1)1<!; \uJ ~ll ul!!l<l~) ,.q ,.,,<;:I'm!~~ o:;~
'" MIUons· S. read In bps; Exl91JIIlnygt!IICJ!!.I
Dcpusill Tax-Exempt }.A'.oru:yFGDd.s Daylishl OYcrdrBll. DcpoliiJ' Syndication Prefundiq Bond Funds Other E.ortcnallnVC51mcnll'
Sablolal ln!.qrwlln-ve;Jmmll
2,759 2,401
10,552 434 200 673
1140
FIDRevcnc:Rcpo 4,33' Equity Re-vcnc Rtpo 3,683 LBBank J0
S\n«twa!Tndco · tl Equity Investments 372 Otl!cr Jntemallm'cstmcnts
S11btaral a,ru
Current Week Snmml!y By Region;
Sprcsw:IIDIWL ISpra~dtoiWL
(13.2 • 7,011 100,0 9l7 41.0 5,434
{79.5 912 107.3 730
(1111.6) 6\7 118.4 596 11.6 16,31'
(20.5 S,'71t 0.7
\,5471 (40.2 74
9.2 l97'
(10.0) a,;u/ (\::: s lol,515
{5,'J1)
- . ..........':l.~ ··--'------
(48.0 \04.2
11.2 (90.1 (4!U
(693.6) 3.9
( ... ~ (61.1
0.1 (62.~
9~
44.9) (.4.6) (15.8 40.8
Amount tnves~cd'
4,69-4 1,250 S,IOS 2,H6
2Q0 619 567
14,551
4,033 2,257
366
6,656 11,206 (l,llll
(40.1 s 117.4
38.9 (109.7) 144.1
.426.Z 38.2 25.0
(34.5 (1.4
9.1.
(20.9)
1M S (9.2
AmoUDI Invested
2,'317 (292) 330
(1,144 l30
(2 29
SprcadloiWL
{1.9 (113.2 (27.6 18.9
(193.9 (1,119.9
3<.3 (69.
(27.2 l.l
(62.~
,0.2
(2<0) (55.2) (6.6
(~
~=-..I::~--7·-~- ---~~"'T'~- .;·~~; lnrrcnl Wed ,'l<u<~:;:C' lh ({c,:I•Jfl ( urn-nt\hd,Glnhll \lcr.ICC
lnl•lfJU>II! J•JJc \Sl\C'{IL'I' 'l•l~ f::urupc Ill l''"'"'''''l~l~•~ \r~ll.tot.:l '~'
li!Jo.flll/om·S rradlnbflJL ........ Invested
Spradlo I WL Amo""'
'"'""" I SpreadtalWL Amount
'"'""" Sprc.odlo1WL
Cxtcmg!InvqmmtJ I 1
Depo~lll 2,855 (&3.4 7:40 58.8 s 3.416 (41.6 s 1.011 I (48.0 TIX.Exempt 957 104.2 957 104.l MmcyFundl 5,434 11.2 5.1 5,434 11.2
~:1~~:;n~lilll : ~:::> i ~~ ~:::) Bandfunds I 617 (693.6 617 (693.6 0\hc:rElatmlllnves!ra~ 596 3,9 596 '3.9
S•bloltl 11,546 (17.3) 740 51.1 -1,033 (141.3) Ui,Jl9 (44.5)
-~ I FIDRevtr~eRcpo 4,672 (70.1 1,306 (32.2 5,97& (61.8 Equii)'RevcneRcpo 64 11.1 1,4&3 (0.3 1,5471 0.1 LB Bllllk (62.7 .741 (6_2:~ Slsuctu:n:dTndcs Equity lavestmmts SS 2.6 541 10.0 ~971 9.3
Olher~~Invemnco.tl ~.810 (6U) 55 2.6 3.~1 11:2) &,1~- (.U.9
Tol•llavcsiD~Cat:l 16,355 (Jl.S) 796 54,, S 7.J'.t \ (82..5) S Z.C,SI5 I <4!·~ Leu: ShoJITcnn.CP J.ssuancc (3,871 (15.l (2,04~~-- (17.0 (S,917ll (15.8
~~~"2•"'£!2-~-·---·--.·~·=~-·'-·-'-----~ '-~·----~------2'---,---~...L...........--,.Jl?·'ll---·"--.,..__~......\'!2;!l
Investment Return ~ummSI!J: • La,2t 12 Month1:
ligl!jditv Pool lBn$) f<OEI[ ~:!!:i ~ (bp)IWL
Period: Total CP Ex.CP ·-) IWL FodEIT nFedEff
Y!.!l:hc FYlOOI 26.7
_Z:4) 19.3 34.7 4.7 3.72 3.40 3~0
FY2007 31.3 1 29.2 9.8 5.6 l.1.5 s.lo 14.9 YoY6 4. 25.1 10.3 ... .71 14.8
~ C"""'l 24.5 (6,0) 18.5 24.8 (44.8) 290 2.29 69.2 Prio< 21.2 _(Ut_ 14.9
·158ik If&, 2~- -~ Ei5..:.~
WoW6 3.3 ~· 3.5 0.14 0.10 3.9 -MID416 24.7 (6.2) 18.5 37.7 (34.3) 297 2.25 71.9
""'"' 24.8 (7.0) 17.8 24,8 (4,8) 2.95 2.61 33.8 Fe1XI& 25.e (7.5) 18.1 41.9 24.2 3.18 2.98 17.9 Ju..n&. 27.8 (8.2) 19.6 30,9 8,8 11.17 3.94 23.3 0« .. 7 28.7 (7.0) 21.7 40,3 (0,8) 4.69 4.24 44.Ei Nov-07 31A (4.4) 27.0 14.3 (6.9) 4.70 4.49 21.5 Ocl-n7 32.3 (6.2) 2ao 29.5 10.5 4.94 4.78 18.8 S .... 7 :34.8 (1.9) 32.9 24.4 (23.4) 5.40 4.94 46.2 Aua-07 29.7 (1.2) 28.5 (10,2) (51.2) 5.44 5.02 41.7 Jul...(l7 28.4 (1.0) 25.-4 (2.7) (8.6) 5.32 5.28 6.0 11111-07 29.5 (1.8) V.7 7.8 • 0.9 5.32 5.25 7.0 May-07 27.2 (2.5) 24.7 12.3 6,1 5.32 5.25 6.3 Apr..n7 29.9 (2.2) 27.7 10.0 3.0 5.32 5.25 6.9
-9-
LBEX-WGM 000466

CONFIDENTIAL TREATMENT REQUESTED BYLEHMAN BROTHERS HOLDINGS, INC.
Financfal Planning & Analysis
6 .. Issuance Levels
Lehman Issuance Levels and Spreads:
As of: 04/04/2008
Treasury Yieldsl-_..:;1:.;.;.8;;:;3_-+_..;;2:.;.;.1;;:;0_-+_..;;2;;.;:.3;.;.7_-+_.::;2.:..:.6;.:;.3_+-.::;2;.:;.9..;.7_+--=-'..;;....---lf-_;;..~-+--4-:-. .;..32:;--t
Spread to Treasury'sl---:4;.::5:::;0:---+-~4;.:::2::;:5:---+-~3;..:7;:;:5:---+-~3;.::;5~0-+--;3;.:::2~5-+--;;.:::;:;---ll-_,.;;.:.:;:;.-+-~32::;:5;,;---l Fixed Issuance Yield 6.33 6.35 6.12 6.13 6.22 7.57
3.48 3.90 325 325 6.73 7.15
SwapSpreads:~~~~72~~~~~~~~7~9~~~~~~~~8~1 ~~~~~~~7~7~~~;~~~~7~8~~~~~~~~~~~;~~~~~~~~;~~~3~2~~~: Spreads to lmla.__..:;3;.;.7..;;,8 _ _.__....;;3....;;4..;..7 _ _,__....;;2;.:.9..;;.4 _ _.__....;;2..;.7;;..3 _ _,__..;;2....;;4..;..7 _ _.__~..;.._---l:--_;;..~-_._--'29;...;3 _ __.
61 39
264 286
As of: 03/28/2008 . ·--
Treasury Yieldsl-_..:;1~.6~4:---+-....;;1~.9~3--+_..;;2~.2~1--+_.::;2~.5~0-+_.::;2~.8~7-+_..;;,3':'.4~4-+-~3."::'8-::-8-+---:'4 . .;..32::---l Spread to Treasury'sl--;6;:.;5~0::---+--::6;;:;5,.;;,0,..--+--::6;.:::5:=,0--+--=4;.:::5,.;;,0-+--:::4;.:::5,.;:0,..-+--:::4;.:::5~0-+--:::4~25;;:----l---:::-42~5=---t FixedlssuanceYield ·8.J:2t 8.43 8.71 7.00 7.37 7.94 8.13 8.57
Swap Spreads~~~~~76~~~~~~~~:;:8~2~~~~~~~~:;:8~6~~~~~~~~~8~1~~~~~~~~~7~7~~~~~~~~6~4~~~~;~~~3~9~~~~~~~~3~5~~~~ Spreads to lmla.__..:;5;.;.7....;;4 _ _,__....;;5;.;;6..;;,8 _ _.__....;;5;.;;6.;;.5 _ _.__..;;3..;;,6;;..9 _ _.__..;;3..;.7;;..3 _ _,__..;;,3..;;.86;;;..._---ll--_;;..3.;;.86;;;...___. _ _;;..39....;;1;;..___.
Week over Week Change: ~
Treasury Yields 0.19 0.17 0.15 0.14 0.10 O.Q4 0.02 0.00
Spread to Treasury's -200 -225 -275 -100 -125 -125 -100 -100 Fixed Issuance Yield -1.81 -2.08 -2.60 -0.86 -1.15 -1.21 -0.98 -1.00
Swap Spreads -4 -4 -5 -4 1 -3 0 -3
Spreads to lm I -196 -221 -270 -96 -126 -122 -100 -98
- 10-
LBEX-WGM 000467
',~

CONFIDENTIAL TREATMENT REQUESTED BYLEHMAN BROTHERS HOLDINGS, INC.
tl!riij/ 7. Peer Group Benchmark Issuances
Peer Grouu Benchmark Issuances:
Senior/ USD
Issuer Sub Ccy Principal Equivaleat Trade
LEH Senior SOD 250 s 176 2115/08
Senior USD 4,000 s 4,000 1/14/08
Senior USD 1,500 s 1,500 12117/07
Senior EUR 1,750 s 2,450 10/10/07
Senior USD 1,000 s 1,000 9/19/07
SeniOr USD 2,250 s 2,250 9/19/07
Senior USD 750 s . 750 8/21/07
Subdcbt USD 1,500 s 1,500 7112107
Subdebt USD 2,000 s 2,000 7112/07
Senior USD 1,500 s 1~00 7112107
Senior EUR 500 s 670 6120/07
Senior USD 2,250 s 2.250 5130/07
Senior JPY 22,000 s 181 5!24/07
Senior JPY 56,000 s 462 5/24/07
Senior JPY 50,000 s 412 5124/07
Senior USD 2,750 s 2,750 5122/07
S~:iaiiii USD ~Q!) ~ ·100 5122107
Senior USD 1,000 s 1,000 5/8/07
Senior USD SOD s 500 5/8/07
Senior EUR 1,500 s ~040 S/2107
Senior EUR 200 s 272 4126107
Senior GBP 300 s 597 4/25107
SubDebt USD 150 s 750 4/24/07
Senior USD 1,600 $ 1,600 3{20/07
Senior USD 250 $ 250 3120107
Senior USD 650 s 650 3120/07
Senior CAD 180 s 207 3/16107
Senior EUR 500 $ 650 2116107
SubOebt EUR 1,000 s 1,300 217/07
Senior CHF 150 s 186 216107
Senior EUR 1,500 $ 1,935 1/11/07
Senior USD 1,500 s 1,500 1/9/07
Senior USD 1,250 s 1,250 1/9/07
Senior EUR 500 s 660 12111/06
Senior USD 1,000 $ 1,000 12111/06
Senior USD 600 $ 600 1211!/06
Senior USD 400 s 400 121li/06
MS Senior USD 250 s 250 411101
Senior USD 2,500 s 2,300 12120107
Senior JPY 20,000 s 186 1/18/08
Senior WY 30,200 s 281 1/li/08
Senior USD 2,250 $ 2,250 3/27108
GS Senior EUR 2,000 s 2,953. 1/29/08
Senior JPY 130,200 s 1,208 1/23/08
Senior WY 18,300 $ 170 1/23/08
Senior USD 3,000 $ 3,000 1/11/08
Sub QBP 325 $ 636 1110/0S Senior USD 2,750 s 2,750 12118107
Senior USD 2,500 $ 2,500 3125/08
B!iC Senior USD 3,000 s 3,000 1129/08
MER Senior EUR 500 s 740 214108
Senior USD 2,250 s 2,250 In9I08
Financial Planning & Analysis
Estimated lml Start Mature Life Coupo11 Spread Ccmments
'}}22108 2122113 5.00 6mL+ 210.& 210.8
1122/08 1/24/13 5,00 5.625 213.8 1'}}21/07 1'V28117 10.02 6.75 194.3
10/17107 10/17/12 5.00 5.375 93.3
9/26101 9/27127 io.oo 7 167.5 9126/07 9/26/14 7.00 6.2 128.5 8/27107 9/15/22 15.05 3mL+ 170.0 l5yr no pul Syr 7119/07 7117137 29.99 6.875 99.4 7119/07 7119/17 10.00 6.5 76.1
7119/07 7119/12 5.00 6 44.6 6/27107 6127/14 7.00 5.125 37.3 615/07 6127113 6.06 1.3 13 month ~tendiblc -I, nat. +I, +2, +3, +3
6/5/07 615111 10.00 2.23 41.0 Snmurt~i
6/5101 6/5112 5.00 1.69 25.9 Snmuni
6/5/07 6/5/12 5.00 3m JP Libor + 23 24.0 Samurai
5125101 5125/10 3.00 JmL+l4 14.8
S/25/07 5125/10 3.00 FFOpcn+22 12.3 5117107 S/17134 27.00 5.857 85.0 MCAPS l'!XED
S/17107 S/17134 27.00 83.0 MCAPSFRN
S/10/07 S/10112 5.00 3m Euribor.+ 34 33.3
S/10/07 5/10112 5.00 4.0 13-12-13 month extendible lml +3, +4, +5, +6, +7annual step up
514(01 1125113 5.73 6 33.0 511/07 513132 25.00 6 78.8 25nc20 lnst S)'!S floats at 3mL + 78
Jn.J/07 3/23/09 2.00 3mL+7 8.0 3123/07 3123/09 2.00 lmL+7 7.0
3123107 3123/09 2.00 FFOp011+ 16 6.0
3/2i/07 215109 1.87 3mBBSW+2.5 1.0 3/5/07 315110 3.00 10.0 3nc2, steps up to curibor + 22 if not called
2115101 3114119 12.08 4.625 42.7 12nc7, steps up to lm euribor + 94bps if not c:allcd
3113107 3/ll/13 6.00 2.875 17.0
1/22107 215114 7.04 3m Euribor + 30 29.0 1112107 216112 5.07 5.25 24.3
1112107 1/12112 5.00 JmL+23" 23.3 I'V22106 7120112 5.58 3m Euribor + 2S 27.0 TD.p ofJuly'\2, rcoffer 3m Euribor+29 1'}}21/06 1'}}23/08 2.01 JmL+S 5.9
I'V21/06 12/23108 2.01 lmL+S 5.0
I'V2I/06 12/23/08 2.01 Primc.2SS 3.9
4/I/08 411118 10.00 6.625 236.0 Priced@ T + 300bps I Tap of2.2Sbn deal 12128/07 1'}}21/17 10.00 5.95 127.0 Priced @ T + 200bps
1124108 1/24113 4.00 2.18 124.0
1124/08 1124113 4.00 3mJP Libor+ 120 124.0
411/08 411/18 10.00 6.625 246.5 Priced@ T+312.5bps
216/08 2115113 5.00 5.375 125.0 Priced@ mid swaps+ 130bps 1/30/08 1130113 5.00 JmJPLibor+ 110 114.0
1130/08 1/30113 5.00 2.11 114.0 1118/08 1118118 10.00 5.95 157.5 Priced@ T+215 l/!8108 l/13{38 30.00 6.875 223.0 Priecd @ mid swaps + 230bps I'V22107 1011137 30.00 7.149 210.0 Priced@ T+260~ Tap of deal originally issue in Sept 2007@ L.;. i28.5 (TTlSG)
411/08 411118 10.00 6.15 207.0 Priced @ T + 270bps
211/08 211118 10.00 7.25 312.0 T + 362.5bps
218108 218/13 5.00 190.0 priced atmidswaps +19Sbps 215/08 215/13 5.00 5.45 193.0 T+262.5bps
- 11 -
LBEX-WGM 000468

CONFIDENTIAL TREATMENT REQUESTED BYLEHMAN BROTHERS HOLDINGS, INC.
8. New Issue/Closed Loan Update
Weekly Finance Committee MIS Loan Update - New Issue Pipeline I Closed Loans
Too Pjpttline New loans as of 0~10/08
HY Loan Local tnsi ht ReQatta l-loldinns 1st Lien Term
HY Loan Jpa Cort~Dration DO Term
HY Loan O'Relllv Automotive ABL RIC Bridae
HY Loan Grand Cirde LLC 2nd lien
Highlighted Funded Loans for the 2 weeks ending 04110/08
--
HG Loan Fairpoint Term A Term B RIC
Highlighted Fullv Unfund11d Lo:ans for the 2 weeks ending 04f10tOII
HG Loan HG Loan HG Loan
Aetna Sta les Brid e American Eledric Power
LBB LCPI LBB
Financial Planning & Analysis
Proiected Funding !including Fronting) at Expected Settlement ~ .Q!!! Ideal Entity Expected Entity· ~
Expected Holdings Funding
. •67 000 000
$100 000 000
$215 300 000
$68 000 000
Funded Amount
S490 650 ooo·
Unfunded Amount
$37 SOD 000 $766 666 666
$35 OOD 000
4118108 LBCB
4130108 LBCB
5131108 LBCB
TBD LBCB
Settlement Date
3131108 LBCBILBBAG
LBCB so LBCB to take additional $35mm to
LCPI max outLTOB $65 000 000 Bank~aus reviewing; New commitment papen; to be issues so
LCPI mav ool oushed $215 300 000 Original commitment expired; New
$0 LBCB ~a~ers to be drawn un
Lehman lead M&A advtsor (tying}-no LBCB Involvement; Bankhaus came in on .. 12 to take $219.2mm of the funded hold. The rest set to be
LCPIILBB•G sundicated out shortlv.
- !:<.
LBEX-WGM 000469

CONFIDENTIAL TREATMENT REQUESTED BYLEHMAN BROTHERS HOLDINGS, INC.
-~
( '"" .. '.'
9. a. Thrift Sources and Uses
Lehman Brothers Bank CASH CAPITAL NET CHANGE REPORT
($millions)
Cash capital
Sources (Liabilities and Equity)
CDs- Broker(< 1 year maturity) COs- Broker(> 1 year maturity) Customer Deposit- LBCB Customer Deposit- LBI Customer Deposits - Retail Customer Deposits - Long-tenn Customer Deposit -LBHI Aurora Servicing Deposits Borrowings - Fln..B Sweeps-(< SIOOK) Sweeps-(> $lOOK) (as ofDeeembcr 25, 2007) Fed Funds Sub Debt Income Taxes Payables Other Payables Equity
Total Sources
Certified Residential Mortgages Certified Residential 2nd Liens Nan certified Residential/ Delinquent Loans Certified Commercial Mortgages Non certified Commercial Mortgages Mortgage Warehousing Corporate Loaru Leases Margin Loans SBALoans Student Loans FHLB Stock Securities Held for Sale Short~term Investments:
Reverse Rcpos Cash ond Other LBCB Deposit Money Market Fund
Other Assets
Totol Uses
Net Excess Sources Over Uses
Prefun.dins '='ontingcnt commitments
Conduit
Net Surplus/(Shortfall) after prefundings
Add back: Segregated cash in money funds
Expected Surplus/(Shortfall)
Add back: Customer CDs. deposits, and sweeps outflows
Potential Surplus/(Shortfall)
Remaining Borrowing Capacity
- - - - - ~ -- - - -- ~- -- --- - . - -. ri.hlll~.:' ~.:~~!~-- ·~·.:J~J~--~!..':L~::: __ "'---~
Tier-1 Tier-l Risk Based capital (Tier-IIR.isk Wdgb. Assets)
Tolal Risk Based capital
-------------- -~-~ ------ -- ------- - -~
~--~-: ·. !=:- ~~-~!<] ·_;,_!j;__~...:.::•ll_~'-·_\~1~1-· :.~·; ....
aer-1
icr-1 Risk. Based capital cr.er-1/R.isk Weigh. Assets)
otal Risk Based capitJI
Haircut
80% 100%
0% 80% 80%
100'/o 0%
80% 0%
80% 80%
0% 100%
Oo/, 0'/o
100%
44% S3o/o
100% 53%
100% 100% 100% 100% 100% 100'/o 100%
0% So/•
0% Oo/o
90'/o 0%
100%
12.20'/. 12.29¥· 14.53-J.
12.49"· 11.7&•;. 13.77%
31-Mar-08
Balanc.e Cash
~ ~
2,861 2,289 4,641 4,641
0 0 0
170 136 0 0 0
159 127 0
266 213 905 724
0 0 300 300 113 0 721 0
1,892 1,892
12,029 10,323
3,449 1,518 1,031 546
171 171 1,537 807 1,148 1,148
0 0 457 457
0 0
94 94 370 370
52 0 1,292 65
58 0 61
400 360 2ll 0
1,698 1,698
12 029 7,234
3,089
(1,207)
(550)
~
4,500
c::E§J 873
6,705
3,146
Required S.OOo/i 6.00% 10.00%
Financial Planning & Analysis
4-Apr-08 Change
Balance' Cash Balanc:e Ca.;b Sheet Capital ~ Capital
2,939 2,351 78 62 4,518 4,518 (123) (123)
0 0 0 0 0 0 0 0
428 342 257 206 0 0 0 6 0 0 0 0
167 133 8 6 0 0 0 0
92 74 (174) (139) 1,099 879 194 ISS
0 0 0 300 300 113 0 916 0 195
1,893 1,893 1
12,465 10,491 436 168
2,985 1,313 (464) (204) 896 475 (135) (72) 414 414 244 244
1,426 749 (Ill) (58) 1,276 1,276 127 127
0 0 0 0 454 454 (3) (3)
0 0 0 0 0 0
97 97 3 372 372 1 1
36 (16) 0 1,288 64 (4) (0)
57 0 (0) 16 0 (44)
400 360 0 1,175 0 964 0 1,573 1,573 (125) (125)
12465 7 147 436 (87)
3,344 255
(1,307) (100)
(550)
"1:4s7 ---1-54-
4,400 (100)
Q;ffiJ 541 945 73
6,832 127
2,770
- 13-
LBEX-WGM 000470

CONFIDENTIAL TREATMENT REQUESTED BYLEHMAN BROTHERS HOLDINGS, INC.
9. a. Thrift Pipeline
Lehman Brothers Bank Pipeline Report as of March 31,2008
Deal Name ALS Production MiniBulks Commercial Deals LBSBF Evcrb:anlc 200S-6·JX
Everbo.nk2008-6-JAR
EvcJbank 2008-6·HAR
Loans purchased into LBB
Balance Sheet as ofMan::h 31,2008
Total Remaining Activity for March Investments Change"
Projected Month End Balance Sheet
"~~~Includes CD Maturities
UPB 52,756,473
108,221,809 3,621,126
1,318,298
3,709,989
169,633,695
12,029,000,000
12,029,000,000
Ledger Varlous Various
ADX M7D MIA MIA MIA
Deal Name Projected ALS Production Projected Commercial Fundings Projected LBSBF
Approved but not funded
SARM2008-I FNMA Delivery
Loan5 sold out of LBB thua far
· UPB Ledger Various
ADX M7D MIA MIA MIA
(154,863,333) various (II9,344,536) various
(274,207,869)
Financial Planning & Analysis
( --~.
Deal Name UPB Ledger
Loans Scheduled to be sold
,- -... ,
Lehman Orignated Mortgage Backed Securities Held in Inventory
Deal Name Securitization Date Deal Size.J$mml Positions Sold ($mml CurrentlY in lnventorv /Smml Averaae Spread lbps) SARM 07-10 10/30/2007 $522 $478 $44 265.30 SASCO 07-BNC1 11/9/2007 $746 $681 $65 333.00 SASCO 07-RF2 11/30/2007 $81 $74 $7 366.90 SARM 07-11 11/30/2007 $465 $425 $40 128.70 LXS 2007-20N 11/30/2007 $459 $433 $26 358.60 LMT 07-10 11/30/2007 $643 $575 $68 318.00 SASCO 2007-SC1 11/30/2007 $603 $64 $539 150.10 BNCMT 2007-4 1/B/2008 $516 $350 $166 175.10 SASCO 2007-BC4 1/11/2008 $1 307 $1,279 $28 198.60 LMT 08-2 2/29/2008 $345 $40 $305 236.00 SARM 2008-1 3/31/2008 $145 $87 $58 310.00 Total $5832 $4486 $1346
- 14-
LBEX-WGM 000471

CONFIDENTIAL TREATMENT REQUESTED BYLEHMAN BROTHERS HOLDINGS, INC.
rVl..:
(--
Financial Planning & Analy!iis
9. b. LBCB Sources and Uses
Cash Capital . ~ ' - . - ' ~-: • • C - I " _-_. ••• • __:_. ,-' • '-- - L - ~~ ____ ....._ __ - - - ~ •- - • 0
28-Mar-08 31-Mar-08 Change
(In MM) Cash capital Balance Cash Balance Cash· Balance Cash· Sou-;.ces (Liabiiiti.S & Eqtiityf !lliJ:£Y1 ShW ~ Sheet. ~ Shm !dRM
CO's - Brokered < I year 80% 1,398 1,!18 1,398 1,118 CO's - Brokered > I year IOO% 2,357 2,357 2,249 2,249 (108) (108) Customer Deposits- MMA 0% 0 Committed Facilities- Drawn 100% 0 0 Committed Facilities- Undrawn 100% 6 450 0 450 Sy.rccps 80% 0 0 0 0 LBB Draw (Fed Funds Purchase) 90% 400 360 400 360 Forward Contract Payable Oo/o 5 0 28 0 23 Unsecured - Other 0% 0 0 0 0 Other Payab)es 0% 367 0 1,443 0 1,075 Equity 100% 957 957 959 959 2 2
Total Sources 5,49U 5.243 6,4;2 S,l-36 992 (1_06)
Uses(Assets)
Non-Certified Commercial Real Estate 100% 963 963 978 978 14 14 Certified Commercial Real Estate 60% 35 21 35 21 Multi-Family Mortgages. 53% 0 0 0 Mortgage Ware housing 100% 142 !42 142 142 (0) (0) Corporate Loans 100% 2,500 2,500 3,593 3,593 1,093 1,093 Other Interest Receivables 100% 891 89\ 757 757 (134) (134) Forward Contract Receivable 100% 0 0 CRA Investments 20% 15 IS
Cash 0%. 0 Time Deposits Oo/o 83 0 26 0 (57) Money Market Funds 0% 850 0 850 Treasuries 0% 0 0 Other 0% (9) 0 24 33
Other assets 100% 19 19 63 63 43 43 Total Uses 5,490 4539 6,482 5 556 993 1 017
Net Exceso Sources Over Uses 704 (420) (1,I24)
Prefunding contingent commitments ( 15% ALCO Min) 2I% (1,28I) 21% (1,281)
Pledged Corporate Loans 343 343
FHLB Advance Value on Affiliate Pledges 545 545
Net Surplus/(Shortfall) after prefundings 3ll (813) (1,124)
Add back: Customer CD's. deposits, and sweeps outflows
Potential Surp1usi(Shortfall) 3ll (813) (1,124)
Capital Adequacy Required
Tier 1 leverage ratio 10.00% 16.91% 15.55%
Estimated Tier 1 risk-based capital ratio 10.00% 14.37% 12.30%
Estimated Total risk-based capital ratio 10.00% 14.37% 12.30%
- IS-
LBEX-WGM 000472

CONFIDENTIAL TREATMENT REQUESTED BYLEHMAN BROTHERS HOLDINGS, INC.
• ., 9. b. LBCB Pipeline
LBCB Asset Funding Pipeline -Assets Coming into/out of Portfolio 04/10/08
C&l Dana Term Loan ($28,000,000) Dana Term Loan ($1 0,000,000) Dana Term Loan ($25,000,000) Plains Exploration A&R Revolver ($9,000,000) Herbst Gaming Revolver ($10,016,590) Duncan Energy Term Loan $20,000,000 Local Insight Regatta Holdings, Inc. (Windstream/Berry) Revolver $6,000,000 Local Insight Regatta Holdings, ln~_{Windstream/Berry) 1st Lien Term $67,000,000 Alcon Film Fund Mezzanine Note $45,000,000 PQ DO Term $65,000,000 Granite Ridge Energy, LLC Term loan Alliance Data System TERM Loan B $135,000,000 Sta les Inc Brid e Loan $1,000,000,000 CRE
Moonlight Basin ($86,664,868)
IRP
Warehouse
Financial Planning & Analysis
($28,000,000) {$22,400,000) TBD ($10,000,000) ($8,000,000) TBD ($25,000,000) ($2.0,000,000) TBD ($5,600,000) ($6,180,000) TBD ($10,016,590) ($8,013,272) 4/15/2008 $20,000,000 $16,000,000 early April $0 $3,.000,000 4/18/2008 $67,000,000 $53,600,000 4/18/2008 $45,000,000 $36,000,000 early April $65,000,000 $52,000,000 4/30/2008
TBD $135,000,000 $108,000,000 5/30/2008 $0 $500,000,000 7/31/2008
($86,664,868) ($69,331,894) 4/11/2008
'·
(
- 16-
LBEX-WGM 000473

CONFIDENTIAL TREATMENT REQUESTED BYLEHMAN BROTHERS HOLDINGS, INC.
Financial Planning & Analysis
c 9. c. Bankhaus Sources and Uses
* Utilisation ofBankhaus Funding Sources April 04th
31-Mar-08 4-Apr-08 Change
Cash Capital Balance Cash Balance Cash Balance Cash Hairc.ut Sheet Capital Sheet Capital Sheet Capital
SOURCES (Liabilities and Equity) DEPOSITS 9,728 6,419 9,856 6,507 128 88
• GDPF covered 80o/o 6,005 4,804 6,082 4,866 77 62
- Segn:gotcd Deposits (LBF, etc.) 100% GIS 615 641 641 26 26
• Scgregotc_d Deposits (LBIE) 100% 1,000 1,000 1,000 1,000
-non GDPF covered Depasi~ 0% 2,108 2,133 2S
CAPITAL 6,541 6,484 6,541 6,484
.Schuldschcine 99% 4,817 4,760 4,817 4,760
-Subordinated Debt 100% 561 561 561 561
-Equity and Reserves 100% 1,163 1,163 1,163 1,163
Totallnterc:ompany Payables (1) 100% 2,990 2,990 2,948 2,948 (42) (42)
Facility Usage 100% soo 2,500 2,000
EC!' TH~der 0% 6,259 8,134 1,875
Back-to-bade. atructures O'Yo 1,213 1,213
Other Payablu 0%
TOTAL SOURCES 26,731 16,393 28,692 18,439 1,961 2,046
USEs (Assets)
LOANS 10,6ZZ ll,OO:Z. 10,971 11,351 349. 349
- Rcsidcntiel Warchousc·Loans 100% 89 89 89 89
- Rclll Estate Loans 100% 5,661 5,661 5,714 5,714 53 53
-Corporate Loans 1000/. 4,872 4,872 5,168 5,168 296 296
- sub--pnrticipated LoR 100% 380 380
REVERSE REPOS 16,049 570 17,661 570 (263)
-Cash Co.pitallntensivc Securities&: MBS 87% 918 570 655 570 (263)
- Liquid Investments (2) 0%. 7,219 7,219
( -Quantum Portfolio 0% 440 440
- ECB REVERSE REPO O'Yo 6,259 8,134 1,875
-Bn~:k-to-back structures 0% 1,213 1,213
Cosh at Banks 0% 60 60
TOTAL USES 26,731 11,572 28,692 11,921 1,961 349
Net Excess Sources Over Uses 4,821 6,518 1,697
- Pre-Fundings 100% 664 652 (12)
Cash Capital Surplus (Shortfall) after prefundings 4,157 S,866 1,709
-Add b""k:
Potential Surplus/(Sbortfall) 4,157 5,866 1,70'
EXTERNAL REGULATORY LIMIT Capital 1,724 1,178 Usage 1,095 1,140 Capital Urae;e Ratio P1 12.6% 12.S•I. Tnrget Usage Rnlio 10.4% l0.4o/.
Liquidity Ratio P2 1.04 1.14 Terget Ratio 1.10 1.10
Notes (1) Total JntercompKny Payables 2,990 2,990 2,948 2,948 (42) (42)
LBSF swap collateral 160 160 IDS 105 (55) (55) LBF swap collateral 225 225 225 225
GDPF collateral 198 198 207 207
Lonn Loss Provisions 143 143 147 147 Collo.tcruliz.ed. LollllS 1,349 1,349 1,349 1,349
Lender of Record (LoR) 380 380 380 380
MTM Loan Losses 535 535 535 535
(2) Liquid Jnve!tment! (of which $1.1bn are lotk-ups)
Commentl
Transferred:
Raised new deposits and issued new Schuldsc:hcine which have been reinvested into rev Repos
C"' LBBAG fundec:l Fairpoint communications USD 280mm
The cash capital facility hilS been repaid nnd we participated in a new 6 months tender
\ '
I
- 17-
LBEX-WGM 000474

CONFIDENTIAL TREATMENT REQUESTED BYLEHMAN BROTHERS HOLDINGS, INC.
9. c Bankhaus Loan Update- Pipeline and Closed Loans
Weekly Finance Committee MIS Loan Update - Bankhaus Pipeline
Loans Moved Into Bankhaus In March
Loan Type Deal
USRE Grand Prix
USRE Ritz Kapalua
EU RE E-Shelter Frankfurt
USHG Project Murphy Snr
EU RE E-Shelter Berlin
EU RE Protego
US HY Fairpoint Communications
Total
Loans Moved Into Bankhaus in April
Loan Type Deal -
US HY Fairpoint Communications
EU RE Eurosail 2008
EU RE Mortgage funding liquidity facility
Total
Loans In Pipeline
Loan Type Deal
USHG Coventry Health Care (Sumi buyback)
US HG QVC (Sumi buyback) EU RE ELQ liquidity facility EUHG Lufthansa US HY Sonic US HY Americredit EU HG Carlsberg April Pipeline
Commitment
Commitment
Commitment
Financial Planning & Analysis .
Snun
Funded Notes
117 117 250 85
67 67 350 350
86 86 188 188 300 219
1,358 1,112
Snun
Funded Notes
300 206 30 0
120 0 450 206
Snun
Funded Notes
50 50 74 57 17 0 75 0
218 84 Credit review complete 137 121 310 310 Funding 4/30 881 622
(
- 18
LBEX-WGM 000475

CONFIDENTIAL TREATMENT REQUESTED BYLEHMAN BROTHERS HOLDINGS, INC.
{ .. 9. c Bankhaus Loan Update- Pipeline and Closed Loans
Corporate and Real Estate Loans
Change From 03/20/08 to 03/31/08
Loan Type Corporate and Real Estate
Corporate Real Estate
Grand Total
Total Loans
Loans in Banks
Loan Type Corporate and Real Eslate
Corporate Real Estate
0 -Grand Total
Loans
Loan Type Corporate. and Real Estate
Corporate Real Estate
Grand Total
Total Loans- To~ 20 Changes
ProductName Corporate
WOLSELEY PLC EUR1.5B SEPT 06 COW CORPORATION PROSIEBEN (26JUN07) OPCO METAVANTE CORP. (PROJECT MONTANA) $2BN 1 QVC INC. 1.5BN TL (1 014/06-WACHOVIA) ARINC 1ST LIEN(10/25107) TXU ENERGY (10/10/07) CITI ESSAR SHIPPING DELPHI - DIP REFI ARCHSTONE-SMITH (10-07) COMMUNITY HEALTH SYSTEM(7125107) PHILIP MORRIS INTERNATIONAL INC COMMONWEALTH EDISON (10/03/07) DRESSER, INC. SECOND LIEN US INVESTIGATION SERVICES 08121107 COVENTRY HEALTH C.A.RE ( 7-11-07) TRANSOCEAN INC. 364-DAY [12/03/07) DUPONT FABROS (SAFARI VENTURES) 8-07-07 TYCO INTL (TOPAZ) BRIDGE 4-25-07 GENERAL GROWTH PROPERTIES 2NDA&R 2-24-06
Coi]>Orate Total Real Eslate
PTG SUMITOMO FF 2 PROJECT MURPHY SENIOR- BANKHAWHOLE LOAN STF SFCG PROLOGISSR WHOLE LOAN PROTEGO SEK 28JUN07. (920290) TEODORA (900298) PTG TOWA BANK 1 PTG KOKURA IRON/MILLENNIUM REAL ESTATE INVESTM/LIBOR Option PTGMUFG7 PTG Y.K. LABUAN/YK LABUAN/LIBOR Option PTG MILLENIUM LP3 Y.K. MOON ISLAN/Y.K. MOON ISLAND/LIBOR Option PTG NERIMAIG.K. AQUA COMPOUND 1/LIBOR Option PTG SONOKO BUIUG.K. MK OAK/Fixed Rate Option COLONIAL GRAND AT BAYSHORE SENWHOLE LOAN LB PCF LB MEZZ WHOLE LOAN LBT LOAN FUNDING PTG MIZUHO TRUST 7 PTG KAKITSUBATAIG.K. KAKITSUBATA/Fixed Rate Option GOODWATER 300407 (920276)
Real Estate Total
FundedMV
25,572 37 857 63,429
FundedMV
7,739 6,95S 14695
FundedMV
17,833 30902 48,734
FundedMV
0 147 121 70 45 132 818
0 10
2,139 8
434 0 51 82 34
I 4 1 0 0
4,095
402 314
0 698 350
0 148
0 85 0 7 0 0 0 74 34 30 28 0
425 2,594
Financial Planning & Analysis
PriorWeek WoWChanga FundedMV FundedMV
25,649 -78 37,465 392 63,115 314
PriorWeek WoWChange FundedMV FundedMV
7,832 -92 5.47'5 481 14,306 389
PricrWeek WoWChange FundedMV FundedMV
17,818 15 30,991 -89 48,808 -74
PriorWeek WoWChange FundedMV FundedMV
78 -78 84 62 179 -58 13 56 0 45
89 43 776 42 35 -35 40 -30
2,168 -28 34 -27 408 25 I 25 -25 28 22 104 -22 13 21 25 -20 21 -19 18 -18 16 -16
4,154 -59
0 402 0 314
241 -241 914 -217 145 205 187 -187 0 148
141 -141 0 85 61 -61 60 -53 48 -48 39 -39 38 -38 37 37 0 34 0 30 0 28 24 -24
443 -18 2,379 215
- 19-
LBEX-WGM 000476

CONFIDENTIAL TREATMENT REQUESTED BYLEHMAN BROTHERS HOLDINGS, INC.
Weekly Firm Financial Summary Hiehligbts - May 0!1, 2008 Meeting $millions ·
Balance Sheet • Mo.v quarter-end balance sheet prCJ:iections wiU begin coming out next wedc.. As such, the numbers shown reflect
~ _m. __ ~_·t_y_b_•'_M_~ __ ~ __ or_M_•_r_7_m_._w_._~_·'_'~ __ "_P~-M_·_s_w_im_o_wn __ b•_n_m_•_•_b~ __ ••_~_n_ect __ w_h~ __ m __ •n_•_~_i_s_h~--·-d-on_•_•_we_M __ ~_p_ro_~_·~_·o_~ __ w_rq_•_~_u_~_n_d_b_~_._,_~---------------------------------------------------
LBHl MCO ·cash Position Reportable Liquidity IYwForward
LBHI Cash Capital
F1D
Equities
Otbcr 0 l
Net Cash Capital Position
~ 32,263
858
~ 91,770
7,476
41,618
3,682
l!b'.w: 35,035
1,906
:ll!:AJ>.t 88)41
7,078
44,422
5,630
Ill Includes CMPS, IMD, GPS, GTS,l/C subdebt, and non-trading assets.
lnvqtment Returns
Sin Millions
Americas Asia Europe
Total Investment Returns US CP & Bonk L<>ans Non-US CP &. Bank Loans
Total Ez;cess Returns Total Excess Returns (bps)
WOW Summarv of Total lnvestmegts
SpnadBps
E.'Ctemallnvcstmcnts lntcmallnvcstments
Totallavestmcats b.ss: Short Term CP Issuance
TotallDvcstmcnls (lacl. CP)
Lehmpn [ssuancc Levels and Snread!
Spread Bps
Spreads to Treasury's as of04/30 WOWvs. 04125 Spreads to I Month Libor as of 04/30 wow vs. 04125
!!!rill Total Assets Cash Capital Sources Cash Capital Uses
Net Bxecss Sources Over Uses Prefunding Contingent Conunitments Conduit Segrcgatm Cash in Money Fwuls
E.'(pcctcd CC Surplus (Shortfall) Customer CO's, deposits, and sweeps outflows
Potential CC Surplus (Shortfall)
~ Total Assets Cash Capital Sources Cash Capital Uses
Net Excess SoUrces Over Uses · Prefunding Contingent Comminnents
E.•pected CC Surplus (Shortfall) Pledged Corporate Loans FHLB Advance Value on Affiliate Pledges Customer CD's, deposits. and sweeps outflows
Potential CC Surplus (Shortfall)
~ Total Assets Cash Capital Sources Cash Capilal Uses CC Surplus (Shortfall)
Reeulaton C1ojtal LBI LBIE LBJ
2008 -ym ~
23.5 s 56.4 1.4 3.3
lZ1Q) lll.ll 1.9 4.5 -7.2 ·11.1 0.9 2.2
(4.4) $ (10.3) (3.8)
Pretax I WL Spread We.ckEnded PriorWeck
l!b'.w: ~ 40.3 (36.5) (24.1) (12.3)
. 18.8 (29.8) (17.0) (10.8) zz.o (27.6)
Ull 1Q.m 300 280 (12) (20) 228 221 (9) (17)
~ ~ 12,148 11,557 9,885 9,658 6852 ~ 3,032 2,533
(1,315) (1,321) (550) (550)
3700 ____..U2l! 4,867 4,562
9!5 __M1 5,783 5,425
.l>:ruu: ~ 5,107 6,493 4,843 6,283 4 IJJ _.til!
732 t;3o9 0 282) ___1l.llil
(550) 24 279 279 145
----(126) 303
~ 19:Aill 27,388 27,674 19,499 19,116 10490 ......__l.U2li 8,334 7,472
~ l!b'.w: 2,974 3,561 147% 146% 295% 308%
~ 2,712 1,048
~ (3,029)
(398)
2,804
1,948
.EY.ll!21 8.8 0.0
l2Ul (17.8)
1.0 1.4
(15.4) (4.9)
lJJim (591) (226) 273
(500) (6)
200 (306)
(52) (358)
~ 1,386 1,440
862 511
(3) 514
(145)
429
Qywu 286
(383) 406
(862)
!JJonG 586 -I% 14%
MC~- Sl.Obn dttreasc in position
CC - S1.6bn incre.se in position
Rc.luros: Wcckovcrwetkour global investment rctllms were up by48.6 bps, returning lwl+ll,8 bps on average.
-Bond fund yields were up 2,330 bps, which on a notional wei~ basis accounted for a 48bps increase -Tax-exempt inve!tmcnts were up 26bps week over week, which accounted for 9bps. increase -Decreased ~ms on Money Funds and FID reverse rcpo accounted for 9bps decrease
The tax-exempt sector continues to outperform and this week we continued to lncreasc our invCS1lllent into taX-exempt funds, white sUU maintaining the majority of our investments in taublc funds.
PipeliDe ror M•y • 10.00 bn of loans purchased so far • ~0.09 bn of loans approved but not yet funded • SO.O bo oflgans sold so far • SO.S bn ofloans sehcdulcd to be sold
(
LBEX-WGM 000477
(

CONFIDENTIAL TREATMENT REQUESTED BYLEHMAN BROTHERS HOLDINGS, INC.
Weekly Firm Financial Summary (May 9, 2008 Meeting) Financial Planning & Analysis
Table of Contents
1. Balance Sheet: Reported Capital and Equity
2. Liquidity
a. MCO
b. Cash Capital by Summary
c. Cash Capital by BPM
d. Cash Capital Usage
3. Debt Issuance Profile
a. Long Term Debt Maturities By Quarter
b. Maturity Profile
c. Average Life of Short-Term Debt
4. Short-term Debt
5. Traditional Investment Returns
6. Issuance Levels
7. Peer Group Benchmark Issuances
s.· New Issue/Closed Loan Update
9. Banks
a. Thrift
• Sources and Uses
• Pipeline
b. LBCB
• Sources and Uses
• Pipeline
c. Bankhaus
• Sources and Uses
• Pipeline
• Bankhaus Loan Update - Pipeline and Closed Loans
. l .
LBEX-WGM 000478

CONFIDENTIAL TREATMENT REQUESTED BYLEHMAN BROTHERS HOLDINGS, INC.
Financial Planning & Analysis
D I. Balance Sheet, Reported Capital and Equity
(~.,
Actual Actual Actual Actual Actual Actual Actual Target (Under) I Over
ASSETS Nov-06 Feb-07 Mo~-07 Aug-07 Nov-07 Feb-08 Aer-08 g1 Proj vs Tars;et Fixed Income Core
Net Tangible 171,015 187,404. 101,909 111,048 131,141 149,321 278,522 119,000 59,521
Gross 247,266 272,'237 279,959 283,937 315,334 368,'234 392,631 321,000 71,631
Equities Core Net Tangible 38,226 46,800 50,922 52,364 50,749 48,463 37,193 40,000 (2,807)
Gross 48,412 56,562 62,264 .62,644 61,064 60,124 48,024 52,000 (3,976)
Capital Markets Prime Services Net Tangible 31,844 35,661 42,209 40,267 44,900 48,612 41,382 40,000 1,382
Total Cap Mkts Prime Services Gross 147,042 167,360 181,445 224,017 220,479 260,677 254,009 230,000 24,009
Total Principal Investing Not Tangible 7,444 8,667 10,171 12,988 11,810 14,687 13,628 10,000 3,628 Financing 2 084 2 330 I 981 I 869 I 779 2 069 I 717 2 000 (283)
Gross 9,528 10,996 12,153 14,857 13,588 16,756 15,344 12,000 3,345
Asset Management Net Tangible 5,663 7,576 10,782 12,604 11,872 14,258 12,756 10,000 2,756
Gross 8,669 10,652 14,016 15,832 15,144 17,552 16,036 13,200 2,836
TreaJury Cash 5,237 3,433 4,691 6,143 6,363 6,229 7,182 3,500 3,682 Liquidity Reverse Repo &. Borrows 30,694 23,797 26,000 30,638 37,785 35,780 23,424 32,000 (8,576)
Short Term Securities !,047 !,403 1,216 2,781 2,227 1,884 10,638 3 500 7J38
Total Treasury 36,978 28,633 31,906 39,568 46,375 43,893 41,244 39,000 2,244
Other Net Tangible 7,451 9,854 15,767 d7,902 13,897 13,220 19,914 15,600 4,314
Gross 5,650 15,842 24,118 18,361 19,078 18,798 21,990 18,600 3,390
Total Net Tangible 268,937 300,798 337,667 357,103 372,959 396,674 421,215 341,600 79,615
Gross 503,545 562,283 605,861 659,216 691,063 786,035 789,278 685,800 103,478
Adjusted Net Assets Cash Shorts 107,943• 123,080 144,014 113,115 117,996 159,096 100,000 100,000 Adjusted Net Assets 376,880 423,878 481,681 470,218 490,955 555,770 521,215 441,600 79,615 ~/: -... ,
EQUITY, DEBT AND TOTAL CAPITAL Common Book Equity .18,096 18,910 20,034 20,638 21,395 21,839 19,838 19,283 555 Perpetual Preferred I 095 I 095 I 095 I 095 I 095 2993 6993 6993
Perpetual Preferred lssuance Stockholder.;' Equity 19,191 20,005 21,129 21,733 22,490 24,832 26,830 26,275 555 Tangible ShBreholdcrs' Equity 15,829 16,474 17,476 17,625 18,363 20,720 22,728 22,114 555
Hybrid - European (Junior Subdebt) 1,218 1,226 1,243 1,114 1,203 1,218 1,245 1,239 6 Euro ECAPS- LB UK Capital Funding IV I 262 269 273 295 304 312 311 2 Euro ECAPS - LB UK Capital Funding V L 500 500 500 500 500 Hybrid- US ECAPS (Junior Subdobt) 296 300 300 300 255 255 255 255 Traditional Trust Preferred (Junlor Subdcb( 1,224 1,225 1,225 1,225 1,225 1,225 1,225 1,225 New MCAPS Issuance 1485 1500 I 500 1 475 1475 1475
Preferred Securities Classified as Subdcbt 2,738 3,013 4,522 4,911 4,978 4,976 5,012 5,004 Total Tangible Equity 18,567 19,488 21,998 22,537 23,341 25,696 27,740 27,178 562 Hybrid Securities over Limit (117) (J73) (238) Leverage Equity (Subject To Limits) 18,567 19,488 21,881 22,164 23,103 25,696 27,740 27,178 562
LEVERAGE·RATIOS
~ &remal Rreprt:
lcAAP (Tobl Auetl J S .. rbldn' E9) 26.2xj 28.1xll 28.7xll 30.3xll 30.7xj 31.7xj 29.4xj 26.1xj J_3xj ln~emal Ta et:
3.ixl an iblc (fatal Till iblc Assels/ L E 26,9x 28.7x I 27.Sxll 29.6xll 29.7xj 30.3xl 28,3xl 25,2xj
~EH ('l'aa!lblt Net.Aneb/ L E9l 14.5xj 15-4xll 15.4xll 16.txll 16.lxj 15.4xj 15.2xj 12.6xj 2.6xl
Competitor Net Lcverau MER 12.6x l2,7x 13Jx 16.4x 19.4x l6,7x
MS 14.9x l5,3x ·15.9x l6,7x 16.Sx l4,8x
BSC 16.8x 18.5x 19,7x l9,2x 23,0x 22.6x GS .!ll! ~ .1M! ~ ~ 16.0x Peer Average 14.5x 15.3x 15.8x 16.9x 18.Sx 17.5x
22.0xll 21.2xjl 21.3xj 21-6xl
( ,.-- ..
-2
LBEX-WGM 000479

CONFIDENTIAL TREATMENT REQUESTED BYLEHMAN BROTHERS HOLDINGS, INC.
Financial Planning & Analysis
2. Liquidity a. MCO
LBHI WEElCL Y MCO REPORT AS OF APRIL 30, 2008
Chnnge in Sour'ccs Sl.Obn 30yrsubdcbt, Sl.Obn GBP IOyr senior LTD Issuance
LTD Roll-in LTD Buybacks Facility Paydown
3.1 (0.2) (0.0) (1.8) S(2.0)bn Chase poydown, SO.Sbn SMBC secured facility drawdown, S(0.3)bD reduction in pending facility drawd0\\'11
Net Loan Funding Derivatives Change in Tnppcd Capitallnjcction/Repatriution Others
Total Change in Sources
Change in Usage
Toral Change in Usagt
(0.1) 0.0
(0.0) (0.2) 0.3
Toral Change in MCO Posirirm
l.l
(0.0)
1.0
0.6 0.1
Refer lO the Loan Sununary below Collateral margln!
S(0.2)bn Equity Injection to LBEL
(0.1) E~pcctcd lD transfer back to Bankhaus (0.4)
Other (<S50MM! 0.2
_!L<!!•!!••!1A:!!C;J!tiVO!!.!ltrC.·------'----------------'-~1!:.;7'!.. Net impact oa Reportable Liquidity
~C~h!!'"~••!Ji!!.•f!Pe'l!n~di!!)lns~S~c!!ittl~orn~c'l!n~t o~£~Lo!!!an!!!..!!SWI!!!!!d]!;ic!!!ao!!l·o!!.!ni~SJ<!cC:l!Jun!!.!·u!!·"!!l'i!!!D!!.n ---.,.--~0!'.8~} Settlement ofS(l.J)bn Sproc:c and S(O.S)bn Thalia securitization, S(O.I)bn Prologis, offset by SO. Ibn D~Da Corp J:N!!ie!JIL~o!!"••!!.syill·<!!n,.di,.,ea.,ti!!!o!!!nl.,(llu=•d>!!i!!lnc.,_l...;·_· -~-------"----"--"(l!".lu,l Net impact oa MCO
Summary of Reportable Liquidity Pool and M:isimam Cumulative Outflows:
LTD nctiSSUIIIICe
STD net issuance Lo~mActivity
Derivatives Chnngc iD Tnpped Olhers
Committed F~~ocillty Capital Injection/Repatriation
Totallrtflows
Total Ourjlows
Total Change In Reportable Liquidity
Pending 1.. TD Settlements Pending STD Settlements Pending Olhcr Settlements
L TO Maturity (based on expected life) STDMalllrity Secured Facilities Matwity Contingent Commitment (Prefunding) Debt and Equity Buyback Letters of Credit Contingent CoUatcralization on Derivatives LB Lux Certificates
12.0
10.0
a.o ~ 6.0
8& 4.0 :E~ 2.0 ~
0.0
(2.0)
(4.0)
lnDows 0.7 0.8 1.7 0.5 0.8 0.5
Outflows (2.0) (0.2)
4.9
(2.2)
---2-.8-
$0.9bn iSSimlcc, $(0.2)bn maturities S0.8bn net CP issuance, $0.4bn Lux Certificates, offset by S(0.4)bn European bank loan maturity Refer to the Lean Summary Above Collatenl margin receipts S0.8bn 1/C 5-om LB1E SO.Sbn rduction of Asia box
S(2.0)bn Ch.asc f11eility paydown $(0.2)bn Equity Injection to LBEL
4.3 Incl. $2.0bn 30yr subdebt issuance, SO.Sbn SMBC JPY secured facility drawdown 0.1 6.5 $3,3bn C'){CCU CC in Reg entities. Sl.9bn pending loan syndications, $1.2bn Rtum ofl..Bl upslrCDIDablc balance
26.1 12.7
1.5 Incl. Sl.Obn BGJ, S0.5ba Fidelity 1.6 0.5 0.6 0.1 l.l
LBID MCO & Reportable Liquidity
-MCO -R11partabl11 Uquldlty
40.0
35.0
30.0
25.0
20.0
15.0
10.0
5.0
0.0
~ l'ii' ~~ t: o-
~
-3-
LBEX-WGM 000480

CONFIDENTIAL TREATMENT REQUESTED BYLEHMAN BROTHERS HOLDINGS, INC.
D 2. b. Cash Capital Summary
LBHI Cash Caeital Change: 4/25-4/30 .
Sources - increase!(decrease)
New Issuance Roll in to current portion LTD Buybacks Facility Paydown FX Revaluation Mise
Uses- increase!(decrease)
Spruce Securitization Thalia Securitization Prologis Dana Corp transfer from BH Spruce Mezz/Sub purchase
Other <$0 .1m Total Change in Loans
Pending Loan Syndication FX Revaluation Mise
CC Sources as of 4/25
Total Change in Sources
CC Sources as of 4/30
CC Uses as of 4/25
Total Change in Uses
CC Uses as of 4/30
Financial Planning & Analysis
(1.3) (0.6) (0.1) 0.1 0.4
(0.2)
145.6
3.1 (0.2) (0.0) (1.8) (0.1) 0.0 0.9
146.6
140.9
(1.7)
1.8 (0.1) (0.6)
. (0.6)
140.2
(
-4-
LBEX-WGM 000481

CONFIDENTIAL TREATMENT REQUESTED BYLEHMAN BROTHERS HOLDINGS, INC.
Financial Planning & Analysis
c- 2. c. Cash CapitalbyBPM
~ r-------~--------~::::::::::::::~w~-~~~-~~~~::::::::::::=+::::::::::::~~~~~.~~L:::::::::::~
L1D LTD-CI,.-(a~Solr.t...dincT .... -Ulllnw_..,.,_tlrv...,..\Od.s-.
blwi:IIWifU11FIInlirchr!.H..wa.aWo-..fMJ'S..w.bl
R.i·TMariR o.-nt>-kcf.cilio.r Drow!\F"IIIolqFociaJ DrwJr..S).(ICfKiliiJ
er.--nWoo~LBF ... LliiJ D!wrii!....,,...F.a&i~J'
DrnonO..C•IOiillcolflcllilr Orr-'l>~s-&BnFocilitJ
Droii'IIFm~~~rc..duil
er.-JI.ACERSF.dlifr O......Dn::o<Nrfaclbty llrrnNrlliCcFMi'iitJ Soundr;,.,.,dilolo-F~"'-
"''""" EURDPS ROCOII.PORAT6 FOREION EXOIAHGi. OLOB~KATU
motiGKNli'C""...&Uit \IIGK\'l'ELD
"""'"'"' OTI!D.BANKIHD
~'"""""' UALii'STAT8 .........,.....,.,...,. :si:CUJUTUEDPRODuc:ts I'ICII\Qr.cRoc.~
Brilwo••IWI ...... 1.1•1"-'--I.Biac.
""""""""" ASIA.C.UK
CDNVEilUBLES nooucr 6QU'I'liBSCCRI'OIATii EQUitlES~POA.T
EQtnTYSlltA.TaiiU EURD .. c.ull liV&NTDRlV1iH ~LOBAL POII.TFOUO VOLAnUTY .AMI!RICAS VOLATWTY ASIA. VOV..TTUTY I!.UlDPK 1'-_T......,.~"Wo.
·-~ U,.noc.,wiUIIBar.
T•,.IEQ
C.EAIUNOANDEXECUllOtl
""""""""""" EQUJTY3YNT1tEfiCS
"'""'"'"' """FDWICIHO D/ERA1.1STPIUME:JVCSCO~
STI\UCJURJiDTRANSA.CTIOI-IS u~._,une•
ALTERNAnVD ASVTUANAGEMDIT PRINCIPAL INV
ASSSTMaMT AOMINISD.AnON ~C:OUORATE
MnEQUTTY MFTFIXiDrNCOI4
"""""""' N'IMIEilOI!ItBEntANPSUVA!STMGT PIW ASSET WOMTINTM. DJV EUN PSMPiJi·AI,LOCI.TED PtiYATEBQ\lllY U.~LBIS. ,_.., DI~CTP'IUNCIPIJ.rN\'IS'Tl.aiNTS CILCBAL Oi'PORTUNtTIES OR.OUP GLOBALPIUHCIP.U.:fi'RAT&aii!S CILOBAL 'fRAIXr'O ST1VoTEOIE5 u..llrooiii.-!Ullla
N' .. TrM~rc~(-1} ar-....r ... soll'.r..-..r!Hd
'"""""''""'"""""'" ~~s..,...
~r....-.i-.~
ll&I•TMofP\ u-o,.. ... mr.a. nt,...~
D<rkl•linAMilr ~l.o;IM.$,.,..._ ~~ro.....,lwlj __
LBIGr.,.Bn,u;.-1111. thi'-..,UIBa ~W.Oi-.C.Uol...&
"""""'-~~~luiPJIIII ... _,.,IK JroppriCui!Ctfriio.l~) ~purrw..,;. .... ....._
··~
I.OTC
11~.•11 11'-10) (4) U4T :!.70 1\3 Ill (I) (I
__w ---Uil --lti2 ---liii __..J,I1 ---l!Uii:l ~ ----- --' -- --· --·- -----"' ---
'"
UO!I l67 -I.UI llJ.lM IU,:Hol
n.m
..... ~.ll-5 ... '"
(J~I)
(1,6134) 1.~
.... ""
'l.\95
" ,, ..
.... ... , ..
'"' 1.131 •• 1ll
"' 10,07~
"' 1,11]
1,1\1]
"' .tO,OI4
'·"" ·"' "' "n
-1..11~
\,]96
1,104
7,.]01
I,.UG
10~90
o.m
.... '·"' 1,.110
'"" .. (~
(ij
••
"' ., '"'' , .,
{SSJ (lj
"'
-.•
{!)
"'
(~
' "' on 0~
" (II.&)
"'"''
" ' ,., " ""' (6JS)
'"" (U)
•• (l,ll~
'"'
"'""'
'"" '" "' "
un If.!.., n.ns oo (.1) (410) CJ~~
151'1 :!50
• • • • • I.T.H 1,714 • • • • • • •
--- --- --- __.,. --· --· __B.!!---. --- --· --"'- ---- ---- __m. I,IM 1,.51<1 • (7!) (I) l'l U"l P.ntl tz,l'l'll
,.
1.010
' "' "' " "'
' no ... '·"'
" " . "' ... " "
"' "
. "'
\,Oll
... " '
"" ""
'"' ~· ,
1.1112.
"" ""
1,\lo
'·"' 1.17S
" .,
' (0)
<m US)
(14)
., 71
{IS)
on '
0)
"" 0)
"' 0)
"''
00
0)
'"" " " ' .. , on
(116)
"
., . "
"" ~ (10~
' n
'" (Ill
"
' ..
• lll • 1 • lit .UJ • (I) • 0 • ,(61) (li3 ---- ---· ------~ --- ---- ---'-" --· --· ---- --" --· ---~ Pl 2.nt •.rn ,., ns
1,76]
"
" '
l,ln
" ... .. '
,.,
(0) .. " "" ., (~
"' '"
,.,
'"
• • • • S,614 U\4 • • • • • (JO) PCI)
---- ---· ------~ --- --· --!0 --· --- -------' --- ---- __J_ '·'lll
• ~ ro ]:J.I, ]lJ
~ - ~ " ~ • :»1 II "NO· l.lM l."211 • (S) (D)IS • 01) 61
---- ---· ------~ --- --· ~ --· --- --- ---'! --- ------"
'""'
..,.
"" ... '"" .....
1,,.
,.,_ '""
(1,11'11)
'" , ... .... .....
(1,101)
,,,.
(411)
l,,.U 1»4 (U) (I) IS
II.S\1
"" (1.!101)
\1,1\1
"'
(I .Jill)
'·"' "'" .,.
. ....
"'"
(1,40\)
(m) '"
""'
'"
II,IWI)
, ...
"'" ,..,
" ol o
-..
'" ..... "'
(\,401
"'
. .... '"
/}l,.,..•fr:atl-.,~lrrfi.-UII,WO.•fimJB-*n>#o<ll • ..b.J_rwl,......n~t~,...--.n-ro-'"~ .. rl•"'"r....._u:ttll. )!llcr ....... Cee/.r,...,..Mcrqerwl•reC.fcll• '
.LJJI'4•r-~wuSJOil""";lr''~''oocn.ll",..,et¥f,.,biUa
..UIIi'•••-..,ti.II-SJ-IJJ...,(/.U..UK~lYI~·USE,~-"''"'~'',.,ulliiH.,,...,n.,.snJ..,u.L J,,,.,..........,._..,_..,,r..,...,,.,.,p3 ........ '-b,OIIl
- 5-
LBEX-WGM 000482

CO
NFID
ENTIA
L TREA
TMEN
T REQ
UESTED
BY
LEHM
AN
BR
OTH
ERS H
OLD
ING
S, INC
.
r m m >< I
~ s 0 0 0 ~ co w
Cash C•pltal Usage In bARon.
Curtent Week -4130108 Prior Week _./251011 Prior Month End 3131/08 -· Cash Balance cc Cash Balance cc CUh Balance
BPM Ca Ita! ...... lnlens_l_~ ca lhli ..... lnten1lty C.pjlol Sheet FID ReeiEitala 40.9 69.7 59% 42.3 71.3 59% 42.9 70.4 Securitized Pfoducte 17.9 84.8 28% 1a3 63.5 29% 15.6 62.6 Global Rain 10.3 80.0 13% 10.1 81.6 12.•,.(, 9.6 1311.5 coo 4.1 7.8 54% 3.8 7.7 "" 5.4 11.5 High Yield 10.8 16.8 94% 11.4 16.6 69% 10.9 14.5 FIDCorporala 1
7.3 6.0 121% 8.2 6.2 132% 7.4 7.8
&:,::e 1.0 13.4 13% 1.4 5.5 26% 1.4 0.2 17%
2.2 13.6 16•/i 1.4 5.5 28% 1.5 8.7 17%
2.4 13.4 1.5 5.5 1.3 10.0
Uquld MKTS ProprletaJY 0.7 8.2 8% 0.7 8.7 ... 0.7 7.0 CommodiHes 1.4 4.7 2 .... 1.3 4.7 20% 1.2 3.9 01hor 1.7 1.7 1.5 Bankhaus Equity and Subdebl 1.7 1.7 1.7 Unalfg~ted LBI Box 22 1.9 2.0 Subtotal FID Cor• 103.7 2U.8 36% 106.5 2811.1 m< 104.2 345.1
lBO" 2.2 6.0 36·~ 2.2 6.6 33'" 2.1 6.5 TobiiFID& BD 105.1!1 291.0 3'"' 10L 2114. 37% 100.3 J5 .6
Eqully Volatility" 7.0 24.9 28Vh 7.0 25.1 28%1 7.! 26.3 Equ!ties CoiJIOtate 2.5 3.3 74% ~qlity" Slralegi!.- 0.6 2.4 26';1 ~~rtiblu Product 0.3 2.1 13% IGiobal Portfolio 0.5 1.9 26·h Execution S.Nice• 0.9 5.8 15%
2.7 3.2 ~:1 0.8 2.4 0.3 2.4 12% 0.4 2.0 20% 0.8 5.2 15%
2.2 4.4 0.8 3.9 0.3 2.5 0.4 0.6 0.8 8.5
jOlher 0.0 0.0 0.0 (0.6) Unallocalad lBI Box 0.7 0.8 0.8
1 o IE ulies 12.4 40.5 31' 12.5 40.3 3111 12.5 44.2
CMPS 5.0 39.6 13% 4.7 3~9 13% 4.5 57.8 IMD 9.7 12.7 n•.< 9.8 12.9 75% 9.8 13.0 PI 8.9 13 .• 52% ... 13.5 51% 7.0 14.3 Non-Trading AJHls • 11.8 15,5 7 .... 11.8 15.5 76% 1U 15.5 Olher• 2.0 •.. 21•h n5 27.4 2% 4.6 6.1 alaiOth..-
·~· .... 39% 33.5 ~~ 32% 37. 106.8
I) RD '""rfill ami erulr af h•r1.b nquir-.me•rts an aflm:aktltJ!Iirt:ly loFID Corporutr. Al/ocallotr byBPMI.rfater rlm1c £y lht b..d,.~ 2) IBD r:U1 eapllrd i'ml11tlu Conti:lpl'IICOIIDIIffrlfml.r •rhld1 U wol a balrmc• s/1111 "'lflll'rwmt~lf,
cc Intensity
6"' 25% 7%
47% 75% 9511 18•Ao 26% 13% 10% 32%
30%
32% 30%
28% 50% 21% 13% ss•Ao 12%
20%
8% 74% 49%
n" 75%
""
YTD Changll c;;;---;;;nce
C.e!J!! Sh•t
(1.1) (0.9) 4.2 8.1 2.6 32.1
(0.7) (3.4) 0.1 2.3
(1.2) (2.0) (0.3) 2.6 (0.9) (0.4) 0.5 (0.0) 0.1 8.8 0.4 2.2 0.3 0.3 _0.7 ____ ... ; 45.4
0.21 (1.3 4.7 441
(0.9) (5.2) 0.! 0.1
(0.3) (1.9) (0.1) (0.6) 0.0 1.2 0.2 (3.1)
(1.0) 0.0
1°·81 (9.5)
J) /nelwdufi:~cJ tJSSIIS, podrrill. rftt"""'"' pl-. tkftrnd I(IZ IUJ&'II, f:rullal btM.b, p71en1l ptUf#rrnlrip ""COlin~ dirtl!c/ ""J'D'f~U fnWJtniG'II, and olll~ ~ttl#. assm. 4) /"r:l"dr:.r sluw(all.r, lnkn""'P"IfJ'fonrlinr. wr•llocar.d DuiYafiN •li'llly, voss-11psfcr •Uf1111din1 trGdu fllldt:ot~tinrlll colltJtm~limtiOIL
"' )
Cash CaDital
42.1 13.7
7.7 4.8
10.7 8.5 2.1 2.4 0.9 0.6 1.0 1.4 1.4 1.5
118.11
2.4 10 .2
7.8 2.0 0.9 o .• 0.5 0.7 0.0 0.6
13.0
5.2 9.7 7.1
11.1 2.9
36.0
I,
Q1'015 Q4'ffl QJ'07
Balance cc Cuh Balance CC Cosh Balance Sheet lntensJnl: ~amtll Shnl lnlensitv Ca ilal Sheet
70.6 .... 44.6 70.6 63% 40.9 58.4 56.7 23% 13.4 61.8 22% 11.6 65.9 47.9 16% 7.9 39.9 20•,.(, 7.8 35.6 11.0 44% 3.6 9.1 40% 4.6 12.5 14.5 74% 8.3 14.2 59% 9.1 13,2
8.0 106% 6.3 5.4 116% 5.6 3.6 10.8 19% 2.4 10.3 23% 2.8 112 5.0 •o% 1.3 6.4 20% 1.4 3.8 8.2 11% 0.7 5.8 12% 0.3 5.4 1.5 42•,.(, 0.4 3.8 10% 0.2 2.0 2.5 4011 0.3 1.9 18% 0.3 1.4
1.3 0.3 1.4 1.4 2.0 0.9
2311.5 42% DU 222.1 "'" 117.1 210.8
7.3 33•,.c, 1.6 5.6 29% 1.6 5.6 246.11 41% 9 228. 4 00.7 216.15
30.1 26% 8.6 30.3 28% 8.0 32.4 32 61% 2.0 2.6 76% 2.0 3.0 4.3 22% 0.0 3.4 28% 0.9 3.7 2.7 15% 0.5 3.5 14% 0.6 4.9 0.7 63% 0.4 1.3 30% 0.5 1.0 8.9 8% 1.0 7.9 12% 0.7 7.0
0.0 0.0 (1.0) 0.5 1.4
50.0 26% 13.8 8.9 2811 14.0 51.9
48.0 11% 5.0 46.8 11% 5.0 38.5 13.3 73% 8.3 12.3 67% 7.5 13.5 14.8 .... 6.2 12.0 52% 4.5 13.3
15.6 71•,4 12.4 13.9 89% 13.9 15.7 ~0 96% n7 1<1 .... 7.4 8.3
94.6 "" 32.6 99.2 33' 39.2 89.2
i .. -
~~ ¥~
02'07
cc Cash Balance CC lnlensltv Co~ ital Sheet lntensltv
73% 35.8 47.0 76% 18% 10.0 66.4 16% 21% 6.0 37.4 , .... 37% ... 0.0 .... 69% 6.2 9.5 65%
155'1< 4.8 2.5 182% 2.5% 3.0 12.0 25%
137% 1.5 4.0 37% 6% 0.7 62 11%
12% 0.2 3.1 8% 18% 02 0.3 n~<
0.3 1.1 1.0
41% 711.1 197.3 39?.
29% 1.0 5.6 29% 1% 77.7 203.0 315%
25% 8.0 26.6 30% 66% 2.4 3.2 74•,.(,
24% 1.0 4.8 20% 12% 0.7 52 13% 47% 0.6 1.7 35% 10% 0.3 9.4 311
0.4 (1.7) 0.7
2.7% 14.0 50.9 28%
15% 8.6 42.2 16•A. ..... 7.1 10.8 .... 34% 3.7 10.1 38%
89% 13.0 15.0 87% 90% 4.7 a7 127•h
" 5.2 61.8 43%
.'M ,_, ' "
Q1'07
• ~
~
~ ~
~ ~
~ ~ ~ ~
cash Balllnce cc CaDIIal Shed lnlensltv
29.1 39.2 74•A 10.1 61.2 16',
5.8 36.4 16'1< u 0.7 50% 5.8 8.7 .... 4.5 2.8 162% 2.3 13.1 18% 0.9 2.7 34% 0.7 8.0 9% 02 2.8 7% 0.2 ·u.; 1SO•A.
1.1 1.4
67.0 1846 36%
1.6 5.6 29% ... 190.2 36%
6.6 24.1 27% 1.8 5.1 35~/i
0.5 3.0 15%1
0.6 4.6 12% 0.5 0.8 10.0 8%
1.1 11.5 .... 25%
7.7 35.7 21•.4
4.3 7.6 57'• 2.8 8.6 , ...
11.3 14.8 76%
4.1 (2,8 ·146% 30.1 63.11 7%
..... ---~.
/
::!] ;:
~
~
l ~-Roo :.. i5 ~-.. !;;•

CONFIDENTIAL TREATMENT REQUESTED BYLEHMAN BROTHERS HOLDINGS, INC.
r "<¥
Financial Planning & Analysis
3. Debt Issuance Profile
a. Long Term Debt Maturities By Quarter
Year 2009 a.'ld 2010 maturities are $12.3B and $16.8B respectively.
LTD MATURITY PROFILE BY QUARTER for NEXT 41 OTRS
Year 2009 and 2010 maturities are $12.3B and $16.8B respectively.
8,000
6,000
4,000
2,000
b. Maturity Profile- ($MM)
Unregulated Maturity Profile
04/30/08
Commercial Paper
OtherSTD Curr Por ofL TD
Total STD
0/S
10,161 3,405
23,144
36,710
Regulated Maturity Profile (CD's)
04/30/08 0/S
LB Bankhaus 1 6,122
LB Bank 1 2,582
LB Comm. Bank 1,328
Total STD 10,032
Months
0-l 1-2 2-3 3-4
7,842 1,286 367 488 639 337
2,675 844 208 11,005 2,769 912
0-1 1-2 2-3 3-4
2,066 1,261 1,160
316 204 169
48 107 115
2,431 1,572 1,444
1 LB Bankhaus, LB Bank balances, &: LB Commercial Bonk are CD's (Not classified as shorMerm debt on the Firm's balance sheet)
c. Average Life of Short-Term Debt- Days
C/P Other STD
Total
04/04/08
23.95 287.80 217.91
04/11/08
20.72
282.81 209.16
04/18/08
21.15 245.57 186.02
4-5
122 61
183 219 1,876 1,071 2,181 1,350
4-5
420 382
635 610
369 365
1,424 1,357
04/25/08
25.34
240.79 184.97
5-6 >6
483 288 1,250
1,278. 15,193 2,050 16,443
5-6 >6
605
82
77
763
04/30/08
23.85
239.75 179.99
228
566
246
1,040
- 7-
LBEX-WGM 000484

CONFIDENTIAL TREATMENT REQUESTED BYLEHMAN BROTHERS HOLDINGS, INC.
t 4. Short-term Debt
Short Term Debt Analysis 4/30/2008 (in millions)
Lehman: Final Final Final Final Q405 0406 0407 ~
CP 1,776 1,641 3,101 7,751 Structured Notes 350 799 2,142 2,875 Zero Strike Warrants/Fully funded 103 2,000 4,074 4,150 Participations · 258 227 298 510 Overdrafts I Other 456 792 1,308 729 STD Excluding Current portion of L TO 2,941 7,759 11,264 16,015 Current Portion or L TO 8,410 12,878 16,801 18,510 STD Including Current Portion of L TO 11,351 20,637 28,065 34,525
LTD (w/o Current Portion) 53,900 81,178 123,150 128,284 Total Debt 65,251 101,815 151,215 162,808
Total STD to Total Debt 5% 8% 7% 10% Total STD {including CP) to Total Debt 17% 20% 19% 21%
Short Term Debt Analysis 40,000 35,000 30,000 25,000 20,000 15,000 10,000 5,000
Financial Planning & Analysis
Final Estimate Eatimate Mar-08 Apr-08 ~
9,106 10,303 10,303 1,965 1,036 1,036 2,591 2,493 2,493
257 257 257 648 1,465 1,465
14,567 15,554 15,554 21,762 21,860 22,321 36,329 37,414 37,874
126,855 125,736 127,034 163,184 163,150 164,908
9% 10% 9% 22% 23% 23%
• Current Portion or LTD
llil Overdrafts I Other
• Participations
D Zero Strike Warrants/Fully funded
• Structured Notes
li!ICP
04 05 04 06 04 07 01 08 Mar-08 Apr-08 Q2 08
(
-8
LBEX-WGM 000485
(

CONFIDENTIAL TREATMENT REQUESTED BYLEHMAN BROTHERS HOLDINGS, INC.
.... ......._ c \ \,.
Financial Planning & Analysis
5. Traditional Investment Returns l11veslmeat Returos For the Period Eadin& April30, 2008 Sin millions, Spread ia Bps
Sum~~" o~~xcess Retums;
SinAillfloru Americas ! s Asia Eurooe
;
Tot•IIIIVcslmCDI Retan1 i US CP & Bank Loans Non-US CP & Bank Loans
TollliE'I""Re:taruS · 's Tol1l Eneu RcllriiJ •l I
SfnMlffiCN [1'!9J_actDI'Cha ' Average Liquidity
YTO AveraQe SPread · Cbn~ II Esteu Roll!ra.J
vro·
bos
FY2008
23.47 I 1.37
(22.96)
1.89 (7.21>) 0.94
<•.311 •.
' I : i 1.1 !S ..
Week ovy Week Summary- Total Investment!:
Annu11lizcd I FY 2007
s~:;!i s 8.77 O.Ol , .. ·;,j (26.59
··:)1 . (17.79)
(17.06) 0.97 2.23 1.44
(10.30), S· (15.38) •.
Ex Returns 1.82 3.26 5.08
~~.~ \"it~J,:_~ CurrclllfL•fLI'iTDA•~rL~l' Cutr~nt\\~~I.AHrLI!o! • Frtr•l"W•~I-.,\'fl'r.~ \',d\'J ~·L~\o..:n~-t:
ln• C\lln~Jll T• I"-' ~111g •llr,.,r,.., !l4":!41'1BI~'I ~nJ oiL !U,:a~"'' •nr'""'"' 114'17'l<lllll '"d li41H :un~J (llJ !ti'::UI ~ , .. 04'::\':!MMo
AmoW>I ISpm.dlo I WL Invested
Amount j Spn:od. to I WL · Amaunl 1\Sptud to I WL Amount Slftld 10 I WL
a·mun~m;~n~mbEW __ ~----1----~~~~~--~~~----------~--~"'~~~=~--r-----------~--~~~--~----------~--~"'~~~=~--r---------_, E:.'(lemlllnveJlmcntl i
(29.0) 5,976 (20.9) s 101.1 2,976 76.1 ~::tmpl ~:!~ \ (~~:~) s ::~~ <i:~~: ~:~)
MoneyFunds 104831 36.5 9,196 (I,SI6) (9.9) 3,5 10,711 13.4 (65.7) 605 (76.8) Dt~ylighl Ovmlraft Deposits ,485 (77.4) 714 109 11.2
(2.8) 195 (56.1) S)'lldicutionPrefundin& 181 96.7 106 (89) 53.3 722.2 623 (1,607.6 BondFWdi. . . . 665 (786.3 619' (4) 2.329.8 146.3 386 76.0 .ao.3 11,474 (36.5)
OthcrExtcmallnvcstmm!S ----------:'I~,0!-!:16~1---------~I,.._IS~.2~--------=:C22:==-4 f----------";~1--------,-,~---------o~+-----· ~~!lr-----~706.38 Sublolal 18,675 I 7,6 20,711 , ..... Intt;nyllnyes(mentJ
FID Reverse Rcpo 4,453 (23.0) 5,986 EquityR.GvmeRcpo 3,339! 0.8 1722 LB Bank 26! .(40.3) r- I SIJ'Uet\Rd Tmdcs - ,I -~1ntn=.a~~cn~s sn I 9.5 z.:24
Swblobl
Totall11vutmcsb Lcs1: Shott Tam CP 1ssuar1=
To111Jsvcsh:neah Del.
Current Week Snmman By RegiOn;
(11.4)
1.7 s (11.6)
'·'
10,2311 30,944 (5,817)
(46.9) 1.3
9.9
(24.7)
1&8 (17.0) 22.0
4,668 (2 .. ) 1.317 (19.9
I.Sll 3.0 211 (1.7) 6 (49.6) (6) 49.6
2,040 9.8 484 0.1
8,22& (12.3)
29,700 (29.8) s 1,00& -~ 1,244 ....
(6,174) (10.8 357 (6.3)
27. 4!>.6
~==--=:--,·-: ·--::---->.:;~--::.·~~-- - --?.r~:xs· .-·~-, - -~ ..-----~~-:-- 7..,.. , ... ;----==.; (Ulnl\!\\nl. \•,r•g~n~ R<,.!lun Culrt'll!\\oni.Cinl,,l \.hrl:,!<
ln1~'1mcn1 J~pt \rmn~:<t' \'Ia Cur•l!IC ~fl..'"''"ll-"2-llu~ \".JU4 Hl31ll~l
Amo<ml Sprndtol WL Am- SprcadtoiWL Amo,.. Sprudta I WL Amouat SPR&dlolWL
lnMWftNU·SDnodinb Invested "'"'"' Invested Invested Exl:t:m!lJmlcslmenlJ
Deposits 1)40 (51.4) 683 (0.7) s 2,827 (2S.2) S 4,850 (29.0 TIX-Exanpl 5,002 102.1 5,002 102.1 MoncyFuncbr 8,933 3.6 263 (1.3) 9,196 3.5 Daylight Ovcnlmft Ocpm:its 714 (65.7) 714 (65.7 Syndiclllion Prd\!Ddlna; 10& (2.8) 106 (2.8)
BondFI.IIIdl 619 722.2 619 722.2 Other Exlcm&! lnvestmcntl 224 146.3 224 146.3
Stabklt.l 16,319 211.2 '"I (0.7) J,7D5t 101.2 20,711 40.3
lo!m!!lloYc~lmm!.l i FIDRev~:tRP.qlo 3,381 (71.0) I 2,6031
(15.5 5,986 (46.9 Equily Revmc Repo
I I &;n:z. :.3 ~.7ll 1.3
LBBank Slrul:tun:dTmda . ! EquilylnvcstmentJ .: i nl 2.6 2,494 10.0 2,524 9.9 0\hcrlntcrnallnvestmenll ~ ---To-S11blol1l 3,381 (11.0) 3il' 6,826 (1.9) 10,232 (24.7)
Tot.t bveslm .. ts · 19,701 11.1 714 (U.S) S
~~:i~J ..... s 30,944 laB
Len: Short Term CP Wuancc (3,601) (19.5) (13.0 (5,817) (17.0)
-Totallanstmcats acLC 14.7 37.1 22.0
Inveslms:nt R~tum Summgo: • Lalll2 M!!Dlh~·
Liauidjry Pool (8oS) Es£m ~ lndl:lC RltesW.) (bpo)IWL
Pc:riod: T"" CP E><.CP g.,;;;;jib,., So=dfb,;') IWL Fed EfT vsFcdEff
¥.!!r!.ti. FY200B 27.1 (7.2) 19.9 35.3 1.6 3.57 3.22 35.1
~ r---{I% ~tn--- 29.2 9.6 5.6 5.25 5.10 14.9 (9.3) 25.7 7.2 6.68)
··~ ,.,
30.9 (6.0) 24.9 72.2 18.9 2.81 2.28 53.3 Pri« 29.7 (6.3} 23.4 20.5 l~ _ .. 2.76 2.25 50.7 WoW A 1.2 0.3 1.6 51.8· 0.05 o.il 3.0
Mo•llitv: MlD4f30 28.7 16.4) 22.4 38.1 {16.6) 2.83 2.28 55.6 Mu-08 24.8 {7.0) 17.8 24.8 (4.8) 2.95 2.61 33.6 Fd>-08 25.6 {7.5) 18.1 41.9 24.2 3.16 2.98 17.9 Jm.08 27.8 (8.2) 19.6 30.9 8.8 4.17 3.94 23.3 ll«-07 28.7 {7.0) 21.7 40,3 {0.8) 4.69 4.24 44.6 Nov-07 31.4 (4.4) 27.0 14.3 (6,9) 4.70 4.49 21.5 (kt-07 32.3 16.2) 26.0 29.5 10.5 4.94 4.76 18.8 Sop-07 34,8 (1.9) 32.9 24.4 (23.4) 5.40 4.94 46.2 Aug-07 29.7 (1.2) 28.5 (10.2) {51.2) 5.44 5.02 41.7 Iul.07 26.4 {1.0) 25.4 (2.7) (8.6) 5.32 5.26 6.0 Jun.Q7 29.5 11.8) 27.7 7.8 0.9 5.32 5.25 7.0
Moy-07 27.2 (2.5) 24.7 12.3 6.1 5.32 5.25 6.3
Apr-07 29.9 (2.2) 27.7 10.0 3.0 5.32 5.25 6.9
-9-
LBEX-WGM 000486

CONFIDENTIAL TREATMENT REQUESTED BYLEHMAN BROTHERS HOLDINGS, INC.
Financial Planning & Analysis
6. Issuance Lel!els
Lehman Issuance Levels and Spreads: (
-As of: 05/02/2008
As of: 04/25/2008
Treasury Yields Spread to Treasury's Fixed Issuance Yield
Swap Spreads
Spreads to 1ml
Week over Week ~l!an~:e:
Treasury Yields Spread to Treasury's Fixed Issuance Yield
Swap Spreads
Spreads to 1m I
~ ~0l1a:~ ~~= ~~Elf~ 2.42 2,67 2.92 3.18 3.45 3.87 4.23 4.59
350 337 312 312 300 300 300 300 5.92 6.04 '. 6.04 6.30 6.45 6.87 7.23 7.5_9
82 84 82 76 76 63 39 36
268 253 230 237 224 238 261 264
·~ -li'- ='"'-.:;'-iii ""'"'~~~~~ 0,04 0.03 0.01 0.00 0.00 -0.01 -0.01 -0.02 -25 -25 -12 -12 -10 -20 -20 -20
-0.21 -0.22 -0.11 -0.12 -0.10 -0.21 -0.21 -0.22
-11 -5 -4 -3 -3 -3 0 -4
-14 -20 -9 -9 -7 -17 -20 -17
(
- 10-
LBEX-WGM 000487

CONFIDENTIAL TREATMENT REQUESTED BYLEHMAN BROTHERS HOLDINGS, INC.
Financial Planning & Analysis
7. Peer Group Benchmark Issuances
Peer Groug Benchmark Issuances:
Senior/ USD E:stimatedlml lssuer Sub Ccy Principal Eqaivaleat Trade Start Mature Life Coupon Spread Com meats
LEH Senior usc 2,000 s 2,000 512/Ui 5/li/3& 30.GO 7.5 273.0 Priced@ T + 305bps (priced off the May 137's
Senior usc 2,500. s 2,500 4117/08 4124/08 512/l& 10.00 6.875 250.0 Priced @ T + l20bps
Senior SGC 250 s 176 2115/08 2122108 2122113 s.oo 6mL+210.8 210.8
Senior usc 4,000 s 4,000 1/14/08 1/22108 1124/13 5.00 S.62S 213.8
Senior usc 1,500 $ I,SOO 12/17/07 12121107 12128/17 10.02 6.75 194.3
Senior EUR 1,750 s 2,450 10/10/07 10117/07 10/17/12 5.00 5.375 93.3
Senior usc 1,000 s 1,000 9/19/07 9/26/07 9127127 20.00 7 167.5
Senior usc 2,250 s 2,250 9/19/07 9126/07 9/26/14 7.00 6.2 128.5
Senior usc 750 $ 750 8izl/07 8/27107 9/15122 15.05 3mLt 170.0 !Syr no put Syr
Subdcbt usc 1,506 $ I, SOli 7112107 7119/97 7117137 29.99 6.815 99.4
Subdcbt usc 2,000 s 2,000 7112107 7119/07 7119/17 10.00 6.5 76.1
Senior usc 1,500 $ 1,500 711V07 1119/07 7/19/12 5.00 6 44.6
Senior EUR SOD s 670 6/20/07 6/27107 6127/14 7.00 s.us 37.3
Senior USC 2,250 $ 2,250 5130/07 6/S/01 6/27113 6.06 1.3 13 month extendible -I, flat, +l, +2, +3, +3
Senior )!"{ 22,000 s 181 5/24107 6/5/07 6/S/17 10.00 2.23 41.0 Samurai
Senior )I"{ 56,000 s 462 5/24/07 6/5/07 6/5112 5.00 1.69 25.9 Samurai
Se~!:l:- JPY 50,000 $ 4120 5124/07 6/5/07 6/5/12 5.00 3m JP Libor + 23 24.0 Samurai Senior usc 2,750 s 2, 1so-snuo1 5/25/07 5125/10 3.00 JmL+ 14 14.8
Senior usc 100 $ 100 5/22107 5125/07 5125/10 3.00 FF0pcn+22 12.3
Senior usc 1,000 s 1,000 5/8/07 5117/07 5111134 27.00 5.857 85.0 MCAPSFIXED
Senior usc 500 s 500 5/8/07 5/17/07 5/17134 27.00 83.0 MCAPS FRN
Senior EUR 1,500 s 2,040 512/07 5/10/07 5/10/12· 5.00 3m Euribor+34 33.3
Senior EUR 200 s 272 4/26/07 5/10/07 5/10/12 5.00 4.0 13-12~13 month C.'ltendible lml +3, +4, +S, .o.6, +7 annual step up
Senior GBP 300 $ 597 4/25/07 5/4/07 1125/13 5.73 6 33.0
SubDcbt USD 750 s 750 4/24/07 5/1/07 513132 25.00 6 78.8 2Snc20 last Syn: floats at 3mL + 78
St:nior USC 1,600 s 1,600 3noto7 3nJto7 3123/09 2.0G 3mL+7 8.0
Senior usc 250 $ 250 3/20/07 3/23/07 3/23/09 2.00 lmL+7 7.0
Senior usc 650 s 650 3nGto7 3/23/07 3123/09 2.00 FFOpcn+ 16 6.0
Senior CAD 180 s 207 3/16/07 3121/07 215109 1.87 3mBBSW+2.S 1.0
Senior EUR 500 s 650 2116/07 3/5/07 3/5/10 3.00 10.0 3nc2, steps up to euribor + 22 if not eallcd
SubCebt EUR 1,000 s 1,300 217107 2115/07 3114/19 12.08 4.625 42.7 12nc7, steps up to lm euribor+ 94bps if not called
Senior CHF ISO s 186 2/6/07 3/13/07 3113/13 6.00 2.875 17.0
Senior EUR 1,500 $ 1,935 1/11/07 1122107 215/14 7.04 3m Euribor + 30 29.0
Senior USD 1,500 s 1,500 1/9101 1/12107 216/12 5.07 5.25 24.3
Senior usc 1,250 s 1,250 1/9/07 1/12107 1/12112 5.00 3mL+23 23.3
Senior EUR 500. $ 660 12118/06 12122/06 7120112 5.58 3m Euribor + 25 27.0 Tnp of July '12, ru~ffcr Jm Eun'bor + 29
Senior USC 1,000 $ 1,000 12118/06 12121/06 12123/08 2.01 JmL+S 5.9
Senior USC 600 $ 600 12118/06 12121/06 12123/08 2.01 lmL+S 5.0
Senior USD 400 s 400 12118/06 12121/06 12123/08 2.01 Prime ·285' 3.9
MS Senior usc 2,000 s 2,000 5/28/08 411/18 10.00 6.625 165.0 Priced @ T + 240bps Senior USD 1,500 $ 1,500 4/23/08 4/28/08 4128/15 7.00 6 193.3 Priced@ T + 275bps Senior EUR 1,000 $ 1,580 4/9/08 4/15/08 4/15/11 3.00 6.5 lBC Priced @ midswaps + 230bps
Senior usc 250 $ 250 4/1/08 4/1/08 4/1/18 10.00 6.625 236.0 Priced@ T + 300bps I Tup of 2.25bn deal
Senior USC 2,500 s 2,500 12120/07 12128107 12128/17 10.00 5.95 127.0 Priced @ T + 200bps
Senior )I"{ 20,000 s 186 1/18/0! 1124/08 ln4113 4.00 2.18 124.0
Senior JPY 30,200 s 281 1/18/08 1/24/08 1124113 4.00 3m JP Libor + 120 124.0
Senior USC 2,250 s 2,250 3127108 4/1/08 4/1/18 10.00 6.625 246.5 Priced@ T+ 312.5bp!
GS Senior USD 1,500 $ 1,500 4/22108 4/29/08 411/18 10.00 6.15 174.0 Priced@ T+237.5bps
Senior EUR 2,000 s 2,953 1/29/08 216/08 2115/13 5.00 5,375 125.0 Priced@ mid swaps+ 130bps
Senior Jl'Y 130,200 s 1,208 1/23/08 1130/08 1130/13 5.00 3mJPLibor+ 110 114.0
Senior JPY 18,300 s 170 1/23/08 1130/08 1130/13 5.00 2.11 114.0
Senior usc 3,000 s 3,000 1111108 1118/08 1118/18 10.00 5.95 157.5 Priced@ T+215
Sub GBP 325 s 636 1110/08 1/18/08 IIJ8/38 30.00 6.875 223.0 Priced@ mid swaps + 230bps Senior USD 2,750 s 2,750 12/18/07 12122107 10/1137 30.00 1.149 210.0 Priced@ T+260; Tap of deal originally issue in Sept 2.007@ L+ 128.5 (T+\90)
Senior usc 2,500 $ 2,500 3/25/08 4/1/08 4/1/18 10.00 6.15 207.0 Priced@ T + 270bps
BSC Senior usc 3,000 $ 3,000 1/29/08 211/08 211/18 10.00 7.25 312.0 T + 362.Sbps
MER Senior GBP 850 s 1,683 4/23/08 4130/08 4130/18 10.00 7.75
Senior USC 1,500 s 1,500 4122108 4125/08 4125113 5.00 242.0 T+325bps
Senior usc 5,500 $ 5,500 4/22108 4/25/08 4/25/18 10.00 257.0 T+320bps
Senior EUR 500 $ 740 2/4/08 218/08 218/13 5.00 190.0 priced at mid swaps + 195bps
Senior usc 2,250 $ 2,250 1/29/08 215/08 215/13 5.00 5.45 193.0 T+ 262.Sbps
- II -
LBEX-WGM 000488

CONFIDENTIAL TREATMENT REQUESTED BYLEHMAN BROTHERS HOLDINGS, INC.
8. New Issue/Closed Loan Update
Weekly Finance Committee MIS Loan Update • New Issue Pipeline I Closed Loans
Too Pipeline New loans as of 05108{08
protected Funding llncfudlnq Fronting) at ~
.e.en Settlement Date Ideal Entity
HG Loan Carlsberg (already on bo Bridg' T/Ls RIC $1 981 400 000 5/9/08 N/A HY Loan McJunkin 1st Lien Term $157 700 000 5/12/08 LBCB
HYLoan PO Cornoratlon DO Term $100 000 000 5/31/08 LBCB
HY Loan O'Re!!IY _Automoll\le ABL RIC Bridoe $215 300 000 5/31/08 LCPI
HY"Loan Taiwan HlQh Saeed Rall TBD 6/20/08 TBD
Highlighted Funded Loans for the week ending 05108/01-
Funded Amount
$200 000 000
UnfLmded Amount
None
Financial Planning & Analysis
Expected Holdings Expected Entity Commenrs E!!D.!!JJlg
LCPIUK/LBBAG LBCB/LCPI
LBCBILCPI
LCPI
TBD
Bankhaus w\11 take $36Dmm (GBP 1BOmm on 5114
LBCB to take additional S65mm to max out L TOB: syndication going wetl Bankhaus to review; LBCB cannot participate due to payorr of existing holdings loan
Existing Financing due to be pakl off wtthln 30 days of 5/20 which Is When Lehman commitment set to be approved; Commitment unknown but being sold. do'l_'n; tunding yel to be determined
LBCB funded $14Dmm at LTOB llmll
$1 981 400 000 $17 700 000
$35 000 000
$215 300 000
TBD
r· - 1~
LBEX-WGM 000489

CONFIDENTIAL TREATMENT REQUESTED BYLEHMAN BROTHERS HOLDINGS, INC.
( ' '
( ~, \,__- .. ·
9. a. Thrift Sources and Uses Lehman Brothers Bank CASH CAPITAL NET CHANGE REPORT
(S millions)
Cash capital
Sources (Liabilities and Equity)
CDs • Broker ( < I year maturity) CDs • Broker (> I year maturity) Customer Deposit - LBCB Customer Deposit- LBI Customer Deposits • Retail Customer Deposits • Long-term Customer Deposit -LBHI Aurora Servicing Deposits Borrowings • FHLB Sweeps.(< $lOOK) Sweeps-(> $lOOK) (as of December 25, 2007) Fed Funds Sub Debt In co· me T axc:i Pilya.bles Other Payables Equity
Total Sources
Uses (Assets)
Certified Residential Mortgages Certified Residential 2nd liens Non certified Residential/ Delinquent Loans Certified Commercial Mortgages Non certified Commercial Mortgages Mortgage Warehousing Corporate Loans Leases Margin Loans SBALoans StUdent Loans FHLB Stock Securities Held for Sale Short-term Investments:
Cash Margin Cash and Other LBCBDeposit Money Market Fund
Other Assets
Total Uses
Net Excess Sources Over Uses
Prefunding contingent commitments
Conduit
Net Surplus/(Shortfall) after prefundings
Add back: Segregated cash in money funds
Expected Surplus/(Shortfall)
Add back: Customer CDs, deposits, and sweeps outflows
Potential Surplus/(Shortfall)
Remaining Borrowing Capacity
....----- -~ ----r-< ~- ... ---- -·- --- ----·~ _,._.....,
b.~r~l~-~:j~~--::.:J_{:~~~::._~-J_I'!.:~ ~:.~-~----~--- __ -·
ier-1
ier-1 Risk Based e11pilll (lict-1/Risk Wei£h. Assets)
otal Risk Based c11pital
,...-,-- ~--- -,---·---· -----~ -- -~- .._ -----· _:_!.__ :... . . _(-- _:.._;_~~::::_1 -~---·~c:·~---~ ~~:~~· __ ~ Jti,2 _L~~--
Tlct-1 icr-) Risk Based capilal (Ticr-1/RiskWei&h. As.J.ctJ)
otal Risk Basc:d capilli I
~
SO% 100%
0% 80% 80%
100% 0%
80% 0%
80% 80%
0% 100%
0% 0%
100%
44°/o 53%
100% 53%
100% 100% 100% 100% 100% 100% 100%
0% 5%
0% Oo/o
90% 0%
100%
14.05% 12.94% 15.25%
12.55% 11.73% 13.85%
25-Apr-08
Balance Cash
~ Capital
2,965 2,372 4,033 4,033
0 0 0 0
276 220 0 0 0 0
162 130 0 0
74 59 1,099 879
525 0 300 300 113 710 0
1,892 1,892
12,148 9,885
2,680 1,179 849 450 615 615
1.427 749 1,301 1,301
52 52 496 496
0 0 0 0
103 103 377 377
36 0 1,215 61
59 0 168 0
0 0 1,255 0 1,515 1,515
12,148 6,899
2,986
(1,315)
(550)
1,121
3,700
L1iliJ 915
5,736
2,578
Required
5.00% 6,00% 10.00%
Financial Plll!lning & Analysis
30-Apr-08
Balance Cash ~ ~
2,699 2,159 4,015 4,015
0 0 0
276 220 0 0 0 0
162 130 0 0
77 62 1,099 879
93 0 300 300 113 0 SSG 0
1,892 1,892
11,557 9,658
2,572 1,132 833 441 587 587
1,173 616 1,316 1,316
54 54 498 493
0 0
99 99 380 380
36 0 1,208 60
59 100 400 360 660 0
1,531 1,531
11557 7 126
2,533
(1,321)
(550)
---"'66Z
3,900
C§]
863
5,425
2,389
- 13-
LBEX-WGM 000490

CONFIDENTIAL TREATMENT REQUESTED BYLEHMAN BROTHERS HOLDINGS, INC.
9. a. Thrift Pipeline
Lehman Brothers Bank Pipeline Report as of May 1, 2008
Deal Name ALS Production Commercial Deals LBSBF
Loans purchased into LBB
Balance Sheet as of April30, 2008
Total Remaining Activity for May Investments Change•
Projected Month End Balance Sheet
UPB
1!,557,000,000
{453,114,000) (839,114,000)
10,264,772,000
Ledger
Various ADX M7D
*Includes CD Maturities, Fed Funds Borrows, and Seg; Deposit!
Deal Name
Projected ALS Production Projected Conunercial Fundings Projected LBSBF
Approved but not funded
Loans sold out of LBB thus far
UPB 40,000,000 25,000,000 25,000,000
90,000,000
Ledger
Various ADX M7D
Financial Planning & Analysis
Deal Name
American Portfolio Pacific Premier Bank NPL sale to LBHI SARM 2008-2
Loans Scheduled to be sold
UPB (7,000,000)
{33,000,000) (278, 114,000) (225,000,000)
{543, 114,000)
Ledger
IQA M7D
various various
( - 1
LBEX-WGM 000491
(

CONFIDENTIAL TREATMENT REQUESTED BYLEHMAN BROTHERS HOLDINGS, INC.
Financial Planning & Analysis
9. b. LBCB Sources and Uses
. Cash Capital ' < - f " - - ~- '-" \' • '' -' f T" - - ' , -, • :·~ '- I • - , " ,~ - • '- • ~~ ',
--~-~- - - ~ -- ,, - ~ --· - J ' - --- - - ' -· - - -' -
25-Apr-08 30-Apr-08 Change
(lnM/\4) · · Cas)! capital Balance Cash Balance Cash Balance Cash Sources (Liabilities & Equity) Haircut ~ ~ Sheet Capital ~ Capital
CO's- Brokered < I year 80% 1,320 1,056 1,310 1,048 (10) (8) CD's - Brokered > I year 100% 2,371 2,371 2,334 2,334 (37) (37) Customer Deposits- :tviMA 0% 5 0 0
Co>rnmitted Facilities - Drawn 100% 50 50 0 0 (50) (50) Cmnmitted Facilities -Undrawn 100% 0 400 450 50 Svveeps 80% 0 0 0
LSB Draw (Fed Funds Purchase) 90% 0 0 400 360 400 360 F<>rward Contract Payable 0% 18 0 30 0 12 Unsecured - Other 0% 0 1,124 1,124 1,124 1,124 Other Payab1es 0% 376 323 0 (53) Equity 100% 967 967 967 967 0 0
Tv2:al Sources 5,107 4,843 6,493 6,283 1 386 1440
Uses (Assets)
Non-Certified Commercial Real Estate 100% 882 882 628 628 (254) (254) Certified Commercial Real Estate 60% 35 21 35 21
Multi-Family Mortgages 53% 0 0 0 Mortgage Warehousing !00% 142 142 126 126 (15) (15) Corporate Loans 100% 2,229 2,229 3,464 3,464 1,234 1,234 Other Interest Receivables 100% 772 772 667 667 (106) (106) Forward Contract Receivable 100% 0 0 0 0
CRA lnvesnnents 20% IS 3 IS 3 (0) (0) Cash 0% 0 0 0
Time Deposits 0% 36 0 (36) Money Market Funds 0% 930 1,420 490
( Treasuries 0% 0 0
Other 0% 0 73 70 Other assets 100% 62 62 65 65 3 3
Total Uses 5,107 4111 6,493 4,974 1386 862
N" et Excess Sources Over Uses 732 1,309 577
?refunding contingent commitments (15% ALCO Min) 21% (1,282) 21% (1,28~) (3)
Pledged Corporate Loans 279 279
FHLB Advance Value on Affiliate Pledges 145 (145)
Net Surplus/(Sbortfall) after prefundings (126) 303 429
A .. dd back: Customer CD's, deposits, and sweeps outflows
Potential Surplus/(Shortfall) (126) 303 429
Capital Adequacy Required
Tier 1 leverage ratio 10.00% 17.72% 15.80%
Estimated Tier I risk-based capital ratio 10.00% 15.35% 14.60%
Estimated Total risk-based capital ratio 10.00% 15.35% 14.60%
- 15 -
LBEX-WGM 000492

CONFIDENTIAL TREATMENT REQUESTED BYLEHMAN BROTHERS HOLDINGS, INC.
Financial Planning & Analysis
9. b. LBCB Pipeline
LBCB Asset l'unding Pipeline -Assets Coming into/out of Portfolio ( '··
TBD - anytime within 90 days of Term Loan $17,800,000 $17,800,060 $14,240,000 4/18/08
Term Loan $1.0,000,000 $10,000,000 $8,000,000 5/8/2008
Term 8 and Synthetic LC ($2,992,462) ($2,992,462) ($2,393,970) 5/8/2008
Term Loan ($21,000,000) ($21,000,000) ($16,800,000) 5/8/2008 TerlnJ.oan $157,700,000 $157,700,000 $126,160,000 5/12/2008 Term Loan ($17,700,000) ($17, 700,000) ($14,160,000) 5/12/2008 DO Term $65,000,000 $65,000,000 $52,000,000 5131/2008 Term loan 5131/2008 Term Loan $100,000,000 $100,000,000 $80,000,000 6/30/2008
CRE Crow Portfolio Senior $ (40,000,000) $ (40,000,000) ($32,000~000) week of 5/12/2008 Garrison Square Senior $ (53,254,341) $ (53,254,341) ($42,603,473) week of 5/12/2008
Note - This information is subject !a change
-16-
LBEX-WGM 000493

CONFIDENTIAL TREATMENT REQUESTED BYLEHMAN BROTHERS HOLDINGS, INC.
Financial Planning & Analysis
(ff" .Banklzaus Sources and Uses 9. c. .
Utilisation of Bankhaus Funding Sources April 30th
25-Apr-08 30-Apr-08 Change
Cash Capital Balance Cash Balanee Cash Balance Casb Haircut llitl Capital Sheet Capital ~ Capital
SOURCES (Liabilities and Equity) DEPOSITS 8,838 1,291 8,147 7,159 (691) (133)
- GDPF covered 80% 6,335 5,068 6,246 4,997 (89) (71)
-Segregated Deposits (LBF, etc.) 100% 724 1,224 662 1,162 (61) (61)
-Segregated Deposits (LBIE) 100% 1,000 1,000
- non GDPF covered Deposits 0% 1,780 1,239 (541)
CAPITAL 6,884 6,814 6,800 6,747 (84) (67)
-Schuldscheine 99% 5,!60 5,090 5,076 5,023 (84) (67)
-Subordinated Debt 100% 561 561 561 561
-Equity and Reserves 100% 1,163 1,163 1,163 1,163
'Totallnlerc:ompany Pay:rt.bles (1) 100% 2,894 2,894 2,710 2,710 (1!4) (184)
Facility Usage 100% 2,500 2,500
ECBTender 0'/o 1,559 8,804 1,245
Back-to--hack structures 0% l,J:U 1,2n
Other Payab1es 0%
TOTAL SOURCES 27,388 19,499 27,674 19,116 286 (383)
USES (Assets)
LOANS 9,540 9,920 8,690 9,070 (850) (850)
-Residential Warehouse Loans 100%
- Real Estate Loans 100% 5,218 5,218 5,207 5,207 (II) (II)
- Corporate Loans 100% 4,322 4,322 3,483 3,483 (839) (839}
- sub-participated LoR 100% 380 380
REVERSE REPOS 17,848 570 18,984 1,826 (619) 1,256
-Cash Capital Intensive Securities & MBS 83% 3,436 570 2,196 1,826 (1,240) 1,256
(- - Uquid Invesbnents (2) 0% 5,200 5,986 786
-Quantum Portfolio 0% 440 275 (165)
- ECB REVERSE REPO 0% 7,559 8,804 1,245
-Back-to-back structures 0% 1,213 1,723 510
Cash at Banks 0'/o
TOTAL USES 27,388 10,490 27,674 10,896 2!6 406
Net Excess Sources Over Uses 9,009 8,220 (789)
- Pre-Fundings 100% 675 748 73
Cash Capital Surplus (Shortfall) after prefuodiogs 8,334 7,472 (862)
-Add back:
:Potential Surplus/(Shortfall) 8,334 1,472 (862)
EXTERNAL REGULA TORY LIMIT Capital 1,778 1,178 Usage !,050 1,050 CRpital UsRge Ratio Pl us•1. 15.1'~
Target Usage Ratio 10.4% 10.4%
Liquidity Ratio P2 1.32 1.32. Target Ratio 1.10 1.10
Notes (1) Total Intercompany Payables 2,894 2,894 2,710 2,710 (184) (184)
LBSF swap collateral 105 105 65 65 (40) (40} LBF swap collateral 225 225 225 225
GDPF collateral 170 170 170 170 Loan Loss Provisions 130 130 130 130 CoUateralized Loans 1,349 1,349 1,224 1,224 (125) (125)
Lender of Record (LoR) 380 380 330 330 (SO) (50)
MTM Loan Losses 535 535 566 566 31 31
(2) Liquid Investments (of which S2.6bo are lock-ups)
Comments /
·"' Transferred:
• S840m decrease in corportae loans due to Thalia securitization:
Sisal, lcopal, Endemol, Equinti, PHS md Alpha ID
• ECB collateral pending eligibility are now treated 100% cash capital
- 17-
LBEX-WGM 000494

CO
NFID
ENTIA
L TREA
TMEN
T REQ
UESTED
BY
LEHM
AN
BR
OTH
ERS H
OLD
ING
S, INC
.
r m m >< ~ G) s 0 0 0 ~ CD 0'1
Lo-a Dalabue SummiU')' Report Weekly Cll .. &e (rom. Apr l5 lo Apr JO, 2008 {SII\DIICHU)
1ST .U. FINANCIAL INC. (AU ISI:ZIItl6) TI-lE THOMSON CORP. J.64DAY 0'-17-411 DANAIIOUliNG TL{IIJIIDI) AlJ'HA IP (NOVO') FIRSTDATABJUD0'£(!1WQ1.CITI) PHD.IPMOiWS IN'TD.NATIONALINC IU!SIOENTIAL CAPrrALU.ClYR iL 1·21..05 LOCALrHS1GtfTkEGA"tTA(41'lJA)I) COVrDENTMI'L(TYCOHEAI.nQJ·YR ... 2S..o'7 !MPEIUo\L TOBACCOSFA IIJUL01 TRANsocrAN lNC RRioGE(9/lii01) INERGY.LP. S-YE.AilRC{Il/17104) WAJUIUI\0 ftmlS lRD AAI\IlC (111121!15) l.ANXESS AG (I ZNOVOT) DRESSER., INC. SECOND LreN WEST CORPORATION CiREENbiUEJl MnlEilALS AU .tf.JO.Q7 GENERAL GROWTH PllOPEilTIES lNDAAill-2....0'
PTO PSk GOLF IIPACIFJCSPORTS AoRESORTSILIBOR ~ PROLOGIS WHOLELOAN PTOTINSPI..AZA LIMITED CHARLESTON WHOLE LOAN ~TOWER. WHOL£LOAN LB WHITEFACE LODOE LLC WHOLE LOAN WHITEFA.CELOOOESENlOR WHOLELOAN PTO PSROOLFZIPACIF!C SPORTS A;RES~TSn.mORopl"" MEMF'HISRBTAILPORlFOUO WHOLELOAN BESTWESTERN-Cl.EAR.WATEil WHOLELOAN PTGSHINSEIKOSANl PARK 100- PORUOUO WHOI.£ LOAN EXCHANGESOUlH WHOLELOAN 11ASHAS COLD CANYON WHOLE LOAN WH0t.t fOODS CUPERTINO WHOIL LOAN \IJLl..AOEMAilKETPLACE WHCIULOAN TOWER.PARitiNO WHOLELOAN lACI:..!ON RETAJL PORTFOUO WHOLE LOAN
-DO -.,_ '
"' "' " "' .. ' I) . "
. "
"
" '" "' ' " " "' 71
" ,
" " . " " ,. " . " " "
H'ii'MEDIA THE THOMSON CORP. li54DAY.,.21-Q1 I'QCORPORATION ISfL'IEN(1.JD-G1) a.p HOLDINCIS U.C(II.Zitll) TC OROUP [NV£S1'J.IENT HOLDJNOS, LP. 0ZMANAOEMENT7flf01 FAD'tPOINT COMMUNICAnONS 3·31-GI ftRSTDATABRIDOE~·m-elll) (N\'gfCQRf' s ..... PEMEX RCF (I.SEP01) RE.SIDamAL~ITALUClYJ. iL 7-li..OJ TRANSOCEAN INC BIUDCii<'fliiV1J IMPERIAL TODACCO SFA IIJULIJ7 XElWX CORPO!lATION AIR.-4-3047 INTEJII:SfATE OP'ERATJNO COMPANY,LP DRESSER. TNC. SECOND UEN \VEST CORPORATION
PJOPSRGOLFIIPACJFIC SPOR.TSA.RI I'ROI..OOIS WHOI.ELOAN PTO TINS PLAZA U NJTE) CHAIU.SSTON WlfOILLOAN Sf ANDFORD PLACE I WHOI.BLOAN U WHJTEI'ACELODGELLC WHOLE LOAN WHm:FACELOOGESENJOR WHOULOAN PTG PSR GOISM'ACIFIC SPOR.TS A.J.ESORTMJBOil OpliDII PTG SHINSEI K.o5AN l BASHASOOlDCANYON WHOLE LOAN TOWERPAJU::INO WHOL:£LOAN MIIJ'rTAS ~B.Prt'AS
HUNT CLUB WHOt.ELOAN PO\.AIUSR.ETAD.. WHOLE LOAN LAUREl. BAY WliOLELOAN LB XANADU U.C WHOLE. LOAN PCCP LB ARROWHEAD MARnl WHOLE LOAN OAK KNOU..Ao DEL AMO WHOLE LOAN ROSSL"I"N-1000 I lOCI WIUCIN B NWHOJJOLOAN
,'
'" " " " " . " " "' "' " ,. " " '" ... . "
" 17 0
• , 0
" 0 " . II
' " 0 ' . ' ' .. " " . . "' "' ,.,
"'
I
HYPUEDIAHOI.OINOSLLC(ISTLIEN) ISfiUlFJNANClALJNC.(AU.6fllllll) PQCORPOP.AnoN I Sf LIEN (J'-30..07)
a.p HOLDINOS U.C (lfliOI) TCGROUI' ~HOLDINUS.LP. OZMANAOEMENTl/2101 FAIRJ'OmfCOI\IMUNICATIONS:J.-ll-411 lllANSOC&.ANINC BIUIXJ,£(Wli/Q7) ALPHA Ill (NOVOI)
tNVESTCORP S.A. PEMEXIla"(loiSEPOT) XEROXCOIU'OJtATION AIR ""30-11 SISALlNDLIEN LOCAL INSIGHT REGATTA(~ COVIDEN 1NTL (TYCO IIEALlHJ S.YR. 4-lJ-417 PHILIP MORRIS JNTEJ.NAnONAL INC TNTERSTAT£ OPEilATING CON!' ANY, Lf
WHOLE LOAN STANDFORD PLACE I WHOLE LOAN MEMPHIS RETAIL POR.TfOLtO WHOLE LOAN BEST WESRRN • Cl.£ARWATEA WHOLE LOAN PARK 100 • PORTFOUO WHOLE LOAN EXCHANGESOIRH WHOLELOAN WHOLEFOCIDSctrPD.TlJIIO WHOLELOAN Vn.LAOE MARKETPLACE WHOLE LOAN JACCSON RETAIL PORTFOLIO WHOLE LOAN FPA.·WESTPOINTSHOpPINOCENTWHOLELOAN cot.U~mus OFFICE WAREHOUSE POR.TWHOLE LOAN OIICAOO HOlD- crTY SUITES HOl'BWHOI.E LOAN CWCAGOHDTEL-MAJES'TlC WHOLELOAN CHICACiOHOJB.• WIU.OWS WHOIL LOAN FPA- FOOTHD.J.S SHOPPI~ CEN'TEWHOI.E LOAI'I AJUIOR COU!tT (AKA SKYWAY APAJlTMWHOLELOAN HOLmAYSHOPPINCiCEN'TER WHOILLOAN
<NlEWH01J< L
"' ... ,., "' 0
" 101
"' '" '" '" " " " " " " "
,. " " " " " II II
'
·'
)C
"' b-, l:l == ~ l:l ;:::
"" t'-< 0:::. §
~ !} ~ I ~ -s· ~ :::-==· ~
l:l ::z ~
Q Q
"" ~ Q.
~·I t'-< ~· 0:::. .]1 ~ ·31 :I ·-""
.~---...,
)
i ~
l ~-r<~ ::s I> ~ .. £:;•

CONFIDENTIAL TREATMENT REQUESTED BYLEHMAN BROTHERS HOLDINGS, INC.
{t'r· / . .
/' ( '
9. c Bankhaus Loan Update- Pipeline and Closed Loans
Weekly Finance Committee MIS Loan Update - Bankhaus Pipeline
Loans In Pipeline
Loan Type Deal
USHY SonicVFN USHY Dana USHG Coventry Health Care (Sumi buyback)
EUHG Lufthansa USHG Thomson
!=:UHG Carlsberg USHY Americredit VFN EURE ELQ liquidity facility USRE Project Murphy Mezz Americas Non US RE Molasses Reef Resort USRE Project Irvine (Private Equity) USRE Wintergames May Pipeline
Commitment
Financial Planning & Analysis
$mm
Funded Notes
218 84 Approved 149 149 Approved, moving in 5/13 50 50 Approved, moving in 5/13 75 0 Approved
147 90 Approved, moving in 5/13 360 360 Approved, moving in 5/14 137 121 Credit -uestlons outstanding
12 0 Closinq 5/15 20 20 Under review
127 124 Under review 275 275 247 247 Awaiting docs from GREG
1,817 1,520
- 19-
LBEX-WGM 000496

CONFIDENTIAL TREATMENT REQUESTED BYLEHMAN BROTHERS HOLDINGS, INC.
Weekly Firm Financial Summary Highlights· June 06, 2008 Meetin' $millions
Based em the latest May quarter-end balance sheet estimates, we arc estimating to come in all2.1x net ll;verage and Z4.6x gross leverage· 0.4 turns and 1.4 turns under net and gross targets respectively. f) Bslagc:c Sheet
------------------------------------------~~----~~------------------~-------------------------------------------------------------------1~-:. MCO • S7.7bn increase iD position ~ ~ ~ LBJ:Il M~Q ~B:it! PQati!i!D
Reportable Liquidity 40,199 44,640
I Year Forward 3,510 11,178
LBHI Cash Capilli
~ ~
FlO 81,727 76,131
EquitiC! 5,610 4,965
Other en 47,218 46,005
Net Cash Capital Position 7,685 15,016
Ul Includes CMPS, IMD, GPS, GTS, IJC subdcbt. and non-trading assets.
Jnn.rtmept Returns
Si11Milllom
Americas Asia Europe
Totallavestmerit Returns US CP & Bank Loans Non-US CP & Bank Loans
Total E:r.ccss Returns Total Excess Returns (bps)
WOW Summan oCTot•l IovestJn.mtl Spr~adBps
External Investments lntemallnvesttnents
Totallavestmeats Less: ShortT enn CP Issuance
Tot•llnvestmeals (lad. CP)
Lcbnuaa Jssuaace Leyels aad Sprc•ds Spread Bps
Spreads toT rea.sury's as of 05130 wow vs. 05/23 Spreads to I Month Libor as of 05/30 WOWvs.oSn3
Total Assets Cash Capital Sources Cash Capital Uses
Net Excess Sources Over Uses Prcfitnding Contingent Conunittncnts Conduit Segregated Cash in Money Funds
E>tpe<Ud CC Surplus (Shonfall) Customer CD's, deposits, and sweeps outflows
P,...tial CC Surplus (Shonfall)
IJ!Q! Total Assets Cash Capital Sources Cash Capital Uses
Net Excess Sources Over Uses Prcfimding Contingent Commitments
Expcoled CC Surplus (Shonfall) Pledged Corporate Loans FHLB Advance Value on Affiliate Pledges Customer CD's, deposits, and sweeps outflows
Potential CC Surplus (Shortfall)
!iu!!l!w Total Assets Cash Capital Sources Cash Capital Uses CC Surplus (Shonfall)
Rteutatory c.pjcal
LBI LBIE LBI
2008
YlJl ~ 29.5 $ 58.8
1.5 2.9
I1Ul ~ 7.7 s 15.3
·10.1 -19.9 0.8 1.5
(1.7) (3,1) (1.1)
£~1nSRrad WockEnded. Prior Week
;!Q:Mn l!a!ion<o 17.2 (1.7)
(15.4) (9.7) 4.4 (11.5) 6.5 14.8 3.8 (13.3)
Un .l.2..m 387 375 (13) (25) 310 341 (13)
~ ~ 11,095 10,728
9,581 9,357 6719 _____ll!2 2,802 2,937
(1,242) (1,242) (550) (550)
4500 _tiQl! 5,510 5,745
858 ~ 6,368 6,604
ll:Mn ~ 6,618 6,611 6.324 6,356 5 Q08 ~ 1,315 1,599
(I 346) _LJ.llil (31) 236 286 286
-----255 522
:u:M.Il! 19.:Mri 28,759 28,548 19,474 18,304 9 34Q ~ 9,446 7,017
:l1:MAY ~ 3,324 3,010 140% 131% 317% 299Y•
4,442 7,667
!JooB (5,596)
(645)
(1,212)
7,331
EY.lllil1 s 8.8
0.0
C1UI (17.8)
1.0 1.4
(15.4) (4.9)
lJwiG (367) (224) (359) 135
lOD 235
236
~ (7) 32
(251) 284 (17) 267
267
thi!!G (211)
(1,170) 1,303
(2,429)
ChinG (314) ~9%
-18'Yo
CC • $7 .Jba in cruse in position
Rehsro!: Week over week, returns fell from L + 15.9 to L + 4.4 (17.0 to4.7 cx.-bond funds)
1Jlc main reason for the deerease in returns was due to the R: allocation of the cash from Money Funds to
FJD reverse repo for quarter end balance sheet reasons where R:tums were sub Libor.
Following quarter end we have R:invcsted the majority of the cash back into taxable Money Funds (in NY and London) wheR: returns continue to be welt above Libor (L + 20 area).
We expect to continue to allocate available cash to taxable money funds throughout the month of June.
Pipeliae for Jaoe: • SO.I bn of loans purchased so far • SO.O bo ofloans approved but not yet funded • $0.9 bn of loans sold so far • SO.O bn of loans scheduled to be sold
LBEX-WGM 000497

CONFIDENTIAL TREATMENT REQUESTED BYLEHMAN BROTHERS HOLDINGS, INC.
( .
Weekly Firm Financial Summary (June 6, 2008 Meeting)
Table of Contents
1.
2.
Balance Sheet: Reported Capital and Equity
Liquidity
a. MCO
b. Cash Capital by Summary
c. Cash Capital by BPM
d. Cash Capital Usage
3. Traditional Investment Returns
4. Issuance Levels
5. Peer Group Benchmark Issuances
6. New Issue/Closed Loan Update
7. Banks
a. Thrift
• Sources and Uses
Pipeline
b. LBCB
• Sources and Uses
• Pipeline
c. Bankhaus
Sources and Uses
• Pipeline
• Bankhaus Loan Update -Pipeline and Closed Loans
Financial Planning & Analysis
- 1 -
LBEX-WGM 000498

CONFIDENTIAL TREATMENT REQUESTED BYLEHMAN BROTHERS HOLDINGS, INC.
Financial Planning & Analysis
1. Balance Sheet, Reported Capital and Equity /:----....
\, '
Actual Actual Actual Actual Actual Actual Actual Target (Under) I Over
ASSETS Nov-06 Feb-07 Mai-07 Aug-07 Nov-07 Feb-08 Mai-08 ~ Proj vs Target Fixed Income Core
Net Tangible 171,025 187,404 201,909 212,048 231,141 249,321 212,897 219,000 (6,103)
Gross ·247,266 272,237 279,959 283,937 315,334 368,234 280,559 321,000 (40,441)
Equities Core Net Tangible 38,226 46,800 50,922 52,364 50,749 48,463 38,862 40,000 (1,138) Gross 48,412 56,562 62,264 62,644 61,064 60,124 49,994 52,000 (2,006)
Capital Markets Prime Services Net Tangible . 32,844 35,661 42,209 40,267 44,900 48,612 29,509 40,000 (10,492) Total Cap Mkts Prime Services Gross 147,042 167,360 181,445 224,017 220,479 260,677 209,141 230,000 (20,859)
Total Prin~ipallnveJtin& · Net Tangible 7,444 8,667 10,172 12,988 11,810 14,687 9,555 10,000 (445) Financing 2084 2 330 I 981 I 869 I 779 2 069 4 674 2 000 2 675
Gross 9,528 10,996 12,153 14,857 13,588 16,756 14,229 12,000 2,230
Asset Management Net Tangible 5,663 7,576 10,782 12,604 11,872 14,258 9,722 10,000 (278)
Gross 8,669 10,652 14,016 15,832 15,144 17,552 12,965 13,200 (235)
Treasury Cash 5,237 3,433 4,691 6,143 6,363 6,229 5,393 3,500 1,893 Liquidity Reverse Repo & Borrows 30,694 23,797 26,000 30,638 37,785 35,780 47,077 32,000 15,077 Short Term Securities 1042 1,~03 1,2a ~.281 2,227 1 884 J,5B~ 3,500 BD Total Treasury 36,978 28,633 31,906 39,568 46,375 43,893 56,049 39,000 17,049
Other Net Tangible 7,451 9,854 15,767 17,902 13,897 13,220 16,916 15,600 1,316 Gross 5,650 15,842 24,118 18,361 19,078 18,798 15,155 18,600 (3,445)
Total Net Tangible 268,937 300,798 337,667 357,103 372,959 396,674 326,434 341,600 (15,166) Gross 503,545 562,283 605,861 659,216 691,063 786,035 638,093 685,800 (47,707)
Adjusted Net Assets Cash Shorts 107,943 123,080 144,014 113,115 117,996 159,096 100,000 100,000 Adjusted Net Assets 376,880 423,878 481,681 470,218 490,955 555,770 426,434 441,600 (15,166)
EQUITY, DEBT AND TOTAL CAPITAL Common Book Equity 18,096 18,910 20,034 20,638 21,395 21,839 19,283 19,283 Perpetual Prefen:·ed I 095 I 095 I 095 I 095 I 095 2 993 6 993 6 993
Perpetual Preferred Issuance Stockholders• Equity 19,191 20,005 21,129 21,733 22,490 24,832 26,275 26,275 Tangible Shareholders• Equity 15,829 16,474 17,476 17,625 18,363 20,720 22,174 22,174
Hybrid- European (Junior Subdebt) 1,218 1,226 1,243 1,114 1,203 1,218 1,239 1,239 Euro ECAPS - LB UK Capital Funding IV I 262 269 273 295 304 311 311 Euro ECAPS: LB UK Capital Funding V l 500 500 500 500 500 Hybrid- US ECAPS (Junior Subdebt) 296 300 300 300 255 255 255 255 Traditional Trust Preferred (Junior Subdebt: 1,224 1,225 1,225 1,225 1,225 1,225 1,225 1,225 New MCAPS Issuance I 485 I 500 I 500 I 475 I 475 I 475
Preferred Securities Classifacd as Subdebt 2,738 3,013 4,522 4,911 4,978 4,976 5,004 5,004 Total Tangible Equity 18,567 19,488 21,998 22,537 23,341 25,696 27,178 27,178 Hybrid Securities over Limit (111) cml (2J8) Leverage Equity (Subject To·Limits) 18,567 19,488 21,881 22,164 23,103 25,696 27,178 27,178
LEVERAGE RATIOS
lilln
26.2xl 28.1xll 28.7xll 30.Jxll 30.7xl 31.7xl 24.3xl 26.1xl -1.8xl
26.9x 28.7x I 27.5xll 29.6xll 29.7xl 30.3xl 23.3xl 25.2xl -1.9xl
14.5xl 15.4xll 15.4xll 16.lxl 16.1xl 15.4xj 12.0..1 12.6xl -0.6xl
~omne~itor Nll;t ~~vecae;e
MER 12.6x 12.7x 13.1x 16.4x 19.4x 16.7x MS 14.9x 15.3x 15.9x 16.7x 16.5x 14.8x BSC 16.8x 18.5x 19.7x 19.2x 23.0x 22.6x GS J.12ll .!till ~ li& lYll li.!!ll Peer Average 14.5x 15.3x IS.8x 16.9x 18.Sx 17.5x
22.oxll 21.2xl 21.3xl 21.6xl
(
-2-
LBEX-WGM 000499

CONFIDENTIAL TREATMENT REQUESTED BYLEHMAN BROTHERS HOLDINGS, INC.
rt: \
Financial Planning & Analysis
2. Liquidity a. MCO
L. TD Issuance LTDRoll·in l.TDBu~ac:ks Faeility rirawdoWP
Net Loan Syndication Derivatives Change in Trapped. Cnpitallnjcc:lioii/Rcpatriation IMDB/Srtduction
LBHi WEEKLY MCO REPORt AS OF MAY 30,2008
Clwlge in Sourees
Total Chang~ In Sourr:P:&
O.J (0.1) (0.1) 0.4
Change in Usage
O.J S0.4bn SMBC filcility
Rcrcr to lbe Loan Summary below SO.Sbn ~lum on KBC fund Sl.Obn Mable lonn, SO.Sbn UC from LBI, S(L2)bn ~~on in pending $0.7bn sub debt repayment from LBIE, SO.Sbn subdebt from LBI, SD.Jbn dividend from LBB Sale ofP .E. Warehouse
Dlhe<S
4.1 o.s 0.1 l.S 0.9 0.1 SOAbn updates in Lu." ccnific<~tts outslanding balanec, $(0.2)bn eontingenl coUa1cralization for Pine CLO
Total Chtmgr In Usage 7.4
Total Cht:nge In MCO Position 7.7
•Con'iDJ,'il~l!!i!l\l:eii'j!l®l5'i\'it'olisiJ~
Su m• ofLoaa Activit¥:
Dc~~ol BasiDtB-- Re~• Projected Amoaat CASARMBS RE Europe Yes l.O Pine CL.O securitization HYIHG us Yes 0.7 hnpcria! Tobacco HYJHG Eurnpo Yes 0.4 NPL securitization RE us Yes 0.4 ELQ.securit.ization RE Europe Yos 0.3 Prologis RE us Yos 0.3 200FifthAvc . RE us No 0.3 Proje~Murphy RE us y,. 0~
Project Irvine RE us Yos O.J Riverdeep HYIIIG us No 0.1
Lam!"""" RE Europe No 0.1
Summary of Jteportabk Llg•idllv Pool nd Maslmam Cumulative Outflow I: ·
Committed. Fucility Loan Activity Derivalives
Inflows
~
SoldtoSMBC
Transfer to Bankhaw TrUlsfer to Bankhau&
Net impact 0111 Reportable Liq•illity
$(0.3}bD senlcment ofPrologis: Net impact oa MCO
.S0.4bn SMBC facility Refer to lbc: Loan Summary Above SO.Sbn rctwn on KBC fund Sl.Obn Mable bonowing from LBIE, SO.Sbn UC from LBI, S(0.4)bn UC to LBIE ChDnge iD Trapped
Capital Repatriation lMD 8/S reduction Olhe"
0.4 ... 0.5 1.7 1.5 0.9 0.9
$0.7bn L.BIE sub debt repayment. SO.Sbn LBI subdcbt to holding chains, $0.3bn LBB dividend payment Sale ofP.E. Warehouse
LTD net maruritylbuyback STD net maturity
Total lnflow.r
Outflows (1.1) (3.6)
10.2.
Tolal Ourftuws (S.S)
S0.7bn return of Asia fundlng from prior week
Incl. S(2.4)bn 2yr FRN maturity S(2.8)bn net CP maturitie~, $(0.8)bn Lux certificate unwind
Total Change In Reportable Liquidity ---4-.4-
Pending L.TD Sct_l]emenlS Pending STD Settlements Pending Other Settlements
LTD Maturity (based on expected life) STDMaturity Secured FaciliUcs Maturity Contin&cnt. Committnen~ (Ptd'unding) Debt and Equity Buyback LcttCJSof<ftdit Contingent CoUatcralizatian LB Lu."< CcrtificatcsiWamnLs
14.0 12.0
0.9 0.2 5.3 Sl.6bn excess CC in Reg entities, $2.2bn pending loan syndications, Sl.lbn return of LBI upstreamable balance
24.6 10.1 1.5 Incl. Sl.ObnBGI, S0.5bn Fidelity 1.6 0.3 0.6 0.3 S0.2bn for Pine CLO, SO.lbn ror Derivatives o.s
LBIU MCO & Reportable Liquidity 02'0e: S44.61:1n .115.0 40.0
~ .. 30.0 :§
a I ::~ 2s.o !I ~i 4.0 20.0 !§ ~ 2.0 15.0 ~:
0.0 +-""""7'...---r-'"-----=="'--------'\--~--<------------'-----'""'----------t10.0 °-_ u I (4.0) ---------------------··----·--- 0.0
-MCO -ReportabhUquidity
-3-
LBEX-WGM 000500

CONFIDENTIAL TREATMENT REQUESTED BYLEHMAN BROTHERS HOLDINGS, INC.
2. b. Cash Capital Summary
LBID Cash Capital Change: 5/23-5/30 · · Starting cc position ~.of 5/2'¥
Sources - increase!( decrease)
CC Sources as of 5/23
LTD Issuance Roll in to current portion L TO Buybacks Subdebt Injection from LBI to Holdings Chain Equity Updates FX Revaluation Facility Drawdown Mise
Total Change in Sources
CC Sources as of 5/30
Uses.- increase/( decrease)
CASARMBS Pine CLO securitization Imperial Tobacco NPL securitization ELQ securitization Prologis 200 Fifth Ave Project Murphy Project Irvine Riverdeep Landmark Excalibur
Other <$0.1m Total Change in Loans
Pending Loan Syndication FX Revaluation
CC Uses as of 5/23
Subdebt Repayment From LBIE LBB Dividend Payment lMDUpdates Fund Derivative Updates (KBC) Mise
Total Change in Uses
CC Uses as of 5/30
1/C Funding- (increase)/decrease
1/C Balance as of 5/23
Total Change in 1/C 1/C Balance as of 5/30
Closiri.g cc positio:tl ail of 5/30'
(1.0) (0.7) (0.4) (0.4) (0.3) (0.3) (0.3) (0.3) (0.3) (0.2) (0.1) (0.5) (0.3)
Financial Plimning & Anarysis
7.7_,
143.7
0.3 (0.2) (0.2) 0.5
(0.4) (0.4) 0.4
(0.1) (0.1)
143.6
134.6
_(4.9)
0.3 (0.2) (0.7) (0.3) (1.4) (0.5) 0.3
(7.5)
127.1
(1.5)
(0.0) (1.5)
15.0
'
LBEX-WGM 000501
( '--
-·

CONFIDENTIAL TREATMENT REQUESTED BYLEHMAN BROTHERS HOLDINGS, INC.
Financial Planning & Analysis
~- 2. c. Cash Capital br--~-B_P_'M ____ !=========::::J~~a=======t======:iii~Oi!::i~C:=====~ ~· I Frids\' :H:ZOGI IILMn-ll
LTil LTD•O......,.ror.:stlr.f"""'int:T*-LBII,...,-..,.,U,.osalolcdSIIbo
boi........,-opollfFIII\IIini,&-MaW"'CC
11'11-II)'S..W.Iol
Rq·TMall;. On_..o-bfo•llil)l' Ot'oll'rlliMI!CFooilily
~~- S1.01o&no1. B..t FodliiJ Dr•-I\AC£RSFo"'lily DmrftDU:IOd11•F-1ily
Dr•- Mdlilc Fo~ililr
tcur"'!tEx
FlDOORPORATS
FOREIGN E."'CCHANOI. GLOB.U.RI.TES
HlGHORAD6CII.EDJT HIGHYI&JJ
PJ.OPT!t.ADINO R&Al.E.!TA.Tlt
SALE5fi!,E5tARCHIAOMIN
SECUkmttD PRODucn N~<~D..:Rel&~
B~ ... ~ U..olloo .... LBIBu
.\!ItA. CASH
CONV'D.T1BLE.S PRODUCT EQUITtEICORPOkATB.
EQUmES!UI'POI!.T
EQUm mtA1li.OIU
EUR.OPECI.SH EVENTDfliWN GLOBAL POII.TFOlJO VOU..Tilm' AMEI\IC\S
VOU.TILITV ASIA
VOUTlLnYEUI\DI'E
NCIIITnHWJ~ ..
a ... u. .... Ur>&Qoao~ .. LBIUa.~~
Tolo.IEQ
Cl.EARINO AND EXECUTION
~Um"JIIMAHCINO
~utTYS'itllliET1CI
FID""""" FIRMFINANCENO OENEAAIJSTPRJ).fllSVCSCOI.
sTR.U~TitANSM:TIONI \Jr.o~I-!IBM
ALTERtlATIWS
A~ET MAHAOEMDIT PRINC11AL lNV
,\SSETMQMr ADMINtST1'.AT10N IMDCORI'OIIA'm
MFIEQUTTY
MFlFUil!DtNCOM&
N£llBEJlOD.BeRMAt-IJ'RIV A&S'T MOT
PIMA:lnl'UCIMT~D\VELO.C
PIM PRE-ALLOCATED PRJVA.TI.EQtm'Y Ur.olloc.wdLIIBDII
T ... ollMD
DIRSCT PfUt«:'',At.INVBSn.G!NTS OLOBAL OP'POII.TVNITIES OA.OUP OLOIALPIUNCO'At.lllli.A.T&OJS,S
OL081.1. nADINO STl!.A.TEOIU U..lm-1 LBI Bn.
T•~>oiPI
l'b!Tr••llltAIIoU(...wl)
a ... ....,.ec.ScJr.J'Im.WI&,..... c...q.Colla~~
lnr.__,..,suWdol. I~F.w1 .. 6-K•1d11P 1\q;-T).Io,P Ur.o~IT'SBa.
FXI\,....~
o.ivuiw:,t,aiwtq' P ...... irct.ou.S,.olicMiool
Olbac..t.CapiloiUJIIc
LBICJr....,BaA.•~•
Olbalo•UpMus U..IIIUMdLBIBox
ll.ot.Jp..-..ollllctiai.Collolll'ol .... .,...... 1\.:ftd!DnioOIN'
C.UC.plbi...._IM51n....,. Tn,..tC .. ~(Iocc.t)
lnl~l.CarP 011\a'r.r.._..,...,. R not>d'Oir•l'lnl
C.ollc.,...IP••kiM•"-'JIC LICBSioon(.oll
8...,.._Siwtnf.ll
-'dJOI.IINTolllll UIHI (aolrl} Lal LOTC
IUJ\S IU,III (HI) (Sill
'11 91 . . . ~ ___...%J,.U --ll ---L1Jl ____.llD. __.l.l.,]JJ_ ---lJ.j11 --·-~ -·- ---·-~~.
"'
.. n
IO,S1S
uu
~.•n
"'
(]61)
. .,, (1.1U)
... , n
'"" "'
""'
1.1n
... '" ,...,
'·"' ... ,,
1,711
1,1" 1,6?1
~-'II ,..,, uu
"' 1,]7)
'" 1,0\ ..
1-'"
"-'"
!"-6.lU
... \,Citll
.a,ooo ... "'
1-'U 1,1"
'"' l,lU
.l,]tl
'·"' %,057 ,,,
"'
ol
""
(100)
"''
n
" Oil
"''
. . ""') (,., (500)
{0)
(llolo)
(10)
" , .. , "'' "'
" (17)
Q:ll)
(tD)
'" (U}
t'll}
"'' 0)
"' ,.~
(Z,OIO)
Q)
"" (lll)
"" "' '" (I!')
(61) , .. "' , .. ,
{2,101)
(1,71'1) (1,161
• • • • 1.7.1.. 1,7.11 • • • • •
--·- ---·- ---·- ----lJ!! --·- --·- ___ ,_ .. --·- ---·- --·- ---....:!!! --·- --·- __ ._,. r.n •.n• lSI t,uJ n.ue rs,rn tl'> t.a.nT) Q,un
..... ' '" '"
n .. " "
" 1,]%1 J.]ll
... " "' 1,17!1
I.SU
uu (1)
u
"'' "'' ' "" " "' ., "~
"'
. (1%)
,., " (Ill)
"' {119}
"' (61)
"' "' {\0)
' ' , . .,
C•Ul (511)
(l!l)
0)
(II)
''" '
'" 1 ,., "' (110)
'"' (1H)
. . . . . . . --·- ---·- ---·- ___ ,_ .. --· --·- --"i --·- ---·- --·-~ --· --· ~
"' 1,102
'"
.,.., 11.2" em cui) (lll) c1.1n1 ,,,..ITI
" ' UIS
1-'tS
l,tJD
"'' ., " "''
(0)
,., tm n> "'~
,,, 121'1
'" 50 0 Ul 17f • (170) D {II) (116)
--· --·- ---·- -----ll! --· --·- ___ ,_ .. --·- ---·- ---· -->! --·- --·-~
"'" 1,1ll
'" '
,.,,
' "" " '"
'" '
{If) ,., ., .. , ,.,
,,, {474)
Q)
"' ,,,
,., {Ul)
"' "' . " "
{0) (2) (0
• • ~.716 4,711 • (117) 1'\7)
--·- ---·- ---·- ----11 --·- --·- ---I! --·- ---·- ---· ~ --·- ---· ~ 7,111 ,..., ., (1,JH) .. , - - -10) 111 (I) (14) {15
1.2~6 (I) {177) (l,ltl) (l,otl)
• ltl I 1•1 • tit 1,151 • U) I t• (141) UU
--· --·- ---·- _!m --·- ---· ---'·"-' --·- ---·- --·- --2> --·- ---· ~
··~ {1,1)1)
(UK)
... ,
I,SU l,tS7 (l) (IU} (~H) (lll
(1,141)
2,401
I,IU
""' -'"
"' 17,757
Z,7U
[l.lll) ..... 1,6\1 ....
1\.SU
Q,lll)
'·"' 1.611 .... P"l
"" "'" lt,tl•
"'
n,sn
"'
"''
Ol
(ll)
"" "'" (In)
(1,.!51)
{161)
'" "'" ,., (liS)
...
'·"'
""
(liS
'" 1""' 1,111
s,m
==:~~~~~1~um I {~10) (IU) (In) I,SSI (I:W) " "'-
U.IU)
N'ot··.~ ·- l&'l ·Oki;i·:· .• :·~.., .. ·,;" uii··
N'ol.a: l}lw:ftlliU~&IHI.!,pdw!Q. ,..w-Mpl.r. ~--- ..... fll.io.Mt. .. -1~~-~..U, .....,..,IJ<OIWMI.....,-..r, ,.J•Jioooo-'-: -IE. '1Re1110'Cdl'"' Etz:=u""'C •n'r·nrun•e·
.~J .. IIdac ... n!I'I,.,~JJI'J.Uro;M'I,_.,t::Kli#Mf""''lloluS/.9,
'"" l}lmr... .. ,_y ....... r.....,lf,qT~v-•~ ...... lt..,.lt-=bfo/ML
11 ... 'iJi·· : .. u
- 5-
LBEX-WGM 000502

CO
NFID
ENTIA
L TREA
TMEN
T REQ
UESTED
BY
LEHM
AN
BR
OTH
ERS H
OLD
ING
S, INC
.
r m m >< I
~ s 0 0 0 0'1 0 w
Cash Capital Usage In billions
Current Week 5130101 Prior Week 5123101 .-- ..... Month End 4130/0 . I IU ........ 01:
Ca~;h B-.lanc• cc C•sh B;alano. cc Ce111h Belanc~
BPM CIDilal Shoot lntensltv Ca Hal Sheet lntansltv Ce ltel Sheet FID ReaiEslale 35.6 66.8 5311 37.7 68.7 55% 40.9 69.7 SIICI.Ifill:zed Produds 14.9 582 25'~ 18.6 61.6 27~ 17.9 64.8
r.baiRatn 9.~ 36.4 2711 DO 2.9 6.5 4511
9.5 48.2 20% 2.9 6.8 44%
10,3 80.0 4.1 7.6
High Yield 9.3 14.0 6711 10.4 14.2 73% 10.9 16.8 IOCorporate 1 8.2 6.9 119% 8.5 7.5 113% 7.3 6.0
High Grade 2.1 8.1 2511 FX {4 4.2 3J'Ii
2.1 11.1 19% 1.3 4.3 31'h
1.8 13.4 1.4 5.5
Municipals 1.2 6.5 1&11 1.3 6.7 19% u 9.2 UqUid MKTS Proprl•tery 0.6 1.8 35% 0.4 4.1 10% 0.7 8.2 CommoditiiiS 1.1 5.0 2211 1.1 5.0 23% 1.4 4.7 Other 2.3 1.6 1.8 Banktlaus Equity and Subdebt 1.7 1.7 1.7 Unallocated lB Box 2.4 1.9 2.2 subtotal FID Cor. B:Ui 215.3 ... 87.2 238.0 41% 03.7 214.9
IBD 11 2.3 8.2 37% 2.5 8.7 38% 2.2 6.8
ol•l ID&IBD 95.8 22. ... .7 411 05~ aa .8
Equity 23'•1 Volltility 5.2 22.3
I 8.9 22.5 31% 1
7.0 24.9 Equltlu Corporate 3.2 3.1 103'~ 3.0 3.5 as•• I 2.5 3.3 EqUity Sb•tag!ll& 0.4 2.3 19% 0.5 2.3 21%1 0.6 2.4 converllbl•• Product 0.3 2.1 14% 0.4 2.3 11'1i 0.3 2.1 Globe1Portfo1!o 0.4 1.4 31% 0.5 1.5 31% 0.5 1.9 Execution Services 0.8 6.4 13% 0.8 5.0 17% 0.9 5.8 Oltlar 0.0 0.0 D.D Unallocated LBI Box 0.8 0.6 0.7 Tolel qultlea 11.3 37.8 30% 12.7 37.2 3411 12.4 40.5
CMPS 5.6 30.6 18% 5.2 34.2 15% ~0 39.6 IMD 8.4 11.5 73% .• ,
~· 9.5 61% 9.8 12.0 81% 6.1 1Z7 48%
u 12.7 ao 1U
Non-Trading Asaeta 1 11.7 15.5 75'"" 11.8 15.5 76% 11.9 15.5 Olher• 4.0 3.7 108% 5.3 34.4 16% 2.0 8.8
ota ·olfler 35:S' 70.1 .... 31.2 101.8 35% 35.5 .... .. 5 -~. ~- - -
1) FJD '"''""" o111l ctulr iJt6anb rftpJinrMtttJ 11n •llocotcd etllfrcly to FJD C«por111c. Allocario11 lr)'BPM is fokr rhnlll by die bJUinus. 1) lBD cash r:optrt~l fncluJu CAtlttnpnrCor~~mltmclltJ 'lfh/dr Is not a 6o(tmefl shc.r rtqr.~inmcnr.
cc C•sh lnl•nsltv Coila!
59'h (6.4) 281h 1.2 13% 2.1 54% (1.0) 6411 (1.4)
1211h (0.3) 1311 (D.b) 26'. (1.0) 17% 0.3 Bill
29%: (D. OJ 0,1 0.9 0.3 0.9
3611 5.2
32% (0.1 36% (5 I
28% (2.6) 74% 1.2 26% (0.5) 13'h (0.1) 2811 (0.0) 15% 0.1
0.2 31 (1.
13'~ 0.4 n11 (1.3) 52% (1.3) 16% 0.6 23% 1.1 39'" (0.4)
J) ltrefuJujiu.JtuJcll,lf'OI/will, nrirnr~ml plarr, JcfUTcJ /lJJl ossri.J, cash at bonia, ,merr~f porlii,JMp oCC~fJIS.. tJ;rec"t CDr/orate i11IIU/Irltnt, rmJ ot/,_r nl~. o.snl.L -I) l11cltuks Jiarljoffs, intm:omponyflllltlinf. f/nallocdltd Du#Yall'" ocllvity, ~-wpsfar ... lf[lllfdiNI tnulcs am/ """'"Fnl collaiCI'alirotlatl.
' a-.
~
Balance Sheet
(3.91 0.5
(11.4] (4.4) (0.5) (1.1) (2.7) (1.7) (1.7) 0.2 2.5
24.2
1.1) 25.3)
I
(7.8)' (0.11i (2.0)•
'~::'1 (2.4) (1.0)
( 2.3)
(17.4) (1.8) (~3)
(0.1) 0.7
(2.3,8)
.. -
Cash Ca lt•J
42.1 13.7 7.7 4.8
10.7 8.5 2.1 2.4 0.9 0.6 1.0 1.4 1.4 1.5
98,!1
2.4 01.2
7.8 2.0 0.9 0.4 0.5 0.7 0.0 •..
13.0
5.2 9.7 7.1
11.1 2.9
3 .D
:J
)
I,
Q1'0B -· -- Q4'07 -· -· 03'07 - -· Balance cc C.sh Balance cc Cuh Balillnce Sheet lnlensltv ca ltal Sheet Intensity Capital She•l
70.6 60% -4.11.6 70.6 63'h 40,9 56.-4 58.7 23•h 114 61.9 2211 11.6 6~9
47.9 16% 7.8 39.9 2011 7.6 35.6 11.0 44% 18 9.1 40'-' <8 12.5 14.5 74% 8.3 14.2 59% 0.1 13.2 8.0 10S'h 6.3 5.4 H6% 5.6 3.8
10.8 1911 2.4 10.3 ., .• 2.8 112 5.9 40% 1.3 6.4 20% 1.4 3.8 9.2 11% 0.7 5.8 12% 0.3 5.4 1.5 42'h 0.4 3.6 10'-' 0.2 2.0 2.5 40% 0.3 1.9 18% 0.3 1.4
1.3 0.3 1.4 1.4 2.0 0.9
231U 4211 83.1 =· o42•t. 87.1 210.8
7.3 33% 1.6 5.6 2911 1.6 5.8 248.9 4111 •. 4 228.4 42% 11.7 216.6
30.1 2611 8.6 30.3 28°h 8.0 32.4 3.2 61'h 2.0 :;!.B 76% 2.0 3.0 4.3 22% 0.8 3.4 26·h D.B 3.7 2.7 15'h 0.5 3.5 14% 0.6 4.9 0.7 6311 0.4 1.3 30% 0.5 1.0 8.9 811 1.0 7.9 12% 0.7 7.0
0.0 0.0 (1.0) D.S 1.4
50.0 2611 13.8 .9 28% 4.0 51.9
48.0 11'h ~· 46.8 11'h 5.9 38.5 13.3 73% 9.3 12.3 67% 7.5 13.5 14.8 48% 6.2 12.0 52% •• 13.3 15.6 71% 12.4 13.9 89% 13.9 15.7 3.0 96% 0.7 14.1 611 7.4 8.3
9 .6 38% 32.6 99.2 3311 39.2 89.2
f .
Q2'07 -· cc Cash Balance cc
lntensltv Cool Ia I Sheet ln~n:sl
73% 35.8 47.0 76'" 18% 10.8 6Q4 16% 21'h 6.0 37.4 1611 37% 44 ao 48'h
6911 6.2 9.5 65'A. 155% 4.8 2.5 192%
2511 3.0 12.0 25% 37% 1.5 4.0 37% 611 0.7 8.2 11%
12% 0.2 3.1 8% 18% 0.2 D.3 n%
0.3 1.1 1.0
41% 76.1 197.3 39% .... 1.6 5.8 2911 41"/. n. iOJ.O 38%
25°h 8.0 26.6 30% 5611 2.4 3.2 74'h 24% 1.0 4.8 20% 12'h 0.7 5.2 13'h 47% 0.6 1.7 35'h 10% 0.3 9.4 311
0.4 (1.7) 0.7
27'~ 14.0 50.9 ,. .. 15% 6.6 42.2 16·~
5611 7.1 10.8 66% 3411 3.7 10.1 38% 89'.(. 13.0 15.0 87%
9011 4.7 3.7 127% 411 35.2 81.8 .,
~
Q1'0'1
Cash Balance Canltal Sheet
29.1 382 10.1 61.2
5.0 38.4 <B a7 5.8 8.7 4.5 2.8 2.3 13.1 0.9 2.7 0.7 8.0 0.2 2.6 0.2 0.1
1.1 1.4
67.0 184.6
1.6 5.6 6!.7 190.2
6.6 24:1 1.8 5.1 0.5 3.0 0.6 4.6 0.5 0.6 10.0
1.1 1IT 46.8
7.7 35.7 4.3 7.6 2.8 8.6
11.3 ~;::, 4.1 30.1 63.8
ilf!~~111B ~
~
flo
~ !;.
~ "ti
~ -Si! ~
cc Intensity
74% 1 .. ~ 16~
50% 6611
162" 18% 3411
9% 711
150"h
36%
29% 3611
27% 3511 15% 12%1
""I 25%
21"h 57'• 32% 78'/.
-146"/a 47"h
"·
/,. ............ \ I
~·i
~ ;: § §: ::l;!
~ ~-
Roo ~ ;:
~ ... ;;;·

CONFIDENTIAL TREATMENT REQUESTED BYLEHMAN BROTHERS HOLDINGS, INC.
( . ,,:._
/ 3. Traditional Investment Returns
Investment Returas For the Period Endin: May 31, 2008 S ia millions, Spread ia BPs
Summarv of Excess Returns;
., linMilfltmJ I
Ame:rlcas ; s A•la I Europe .
Tolllluvestmeat R•turlla --,
I ~=~5& :;kE Loans i Bank Loans
To111 ; s TotiiE:r.teSJRr:tuns
.SinMilllans lntDCJcf o{Chong,r
Avalllge Llquldlty I YTD Avara!le s read Clalllt:elaE:~a:iaRel•rU·· · _L
Current Week Summarv By Regiom
YID
~··
Financial Planning & Analysis
" EJ'.1.QIII Annualil.ed FV20D7
29.4~ s "·"Is 8.71 1.46 1.91 0.02
9Ell 46.-40 . 16.59 1.69 15.34 (1'7.79
(lO.Il) (19.92. 0.!>7 0.71 1.51 1.44 (1.6 • S. (15.38
1.1 '·'
I Ex Returns
: I 0.71 11.60
'·" s 12.31·
·-~·---~·-·· -- ·--,-.-·--~·.-::·-··:-i·-·-·---"-,~-----;>-·=.-,>cw--"--"'fj~-· ~<lli.W ·'-.., ,~·-.~-;::~~~~
l'un~nt .,eel, ''~' H!~ n, lh~.:•••n < ,,, n nt w,.l; r~h·h ol \•, r~~· ln•<:~tw~nll•l•t .\m,·n~~' .\11 • fur••l'l" oll<ll'-'<nu"";!"').lu~ \ood 1<"'-J""• 1~1
In Mrlllonr SrmtM! In bc.rJ Ex!empllnmtmmts
Dcporill Ta:x-Exc:mpt Money Funds Dt.yllgbl Ovcrdraf\DepoJitl SyndlcatiooPrcfundina Bond Fundi OlhcrExu:mallnvcslmcatJ
S•btotal Jnt!;mallny;dmenll
FlD Rcveae Repo Equity RC"fcne Rcpo
LBS!N(turedTmdc:l Equity IDvcstmeots Olhcr lntem.llnvcszmcntJ
S•biOtll Tolll hve~lme•tJ
Less: Short Term CP lssullllec TobllDvatmutJ~L C
AmoUIIt lnvt:st.ed
'" 4,628 10,7!n.
231 Ill
"" 21,477
·~11
9~17 30,755 (2,781
Investment Return Summuy .. Last 12 Months;
triad: Tolool fum;.
FYlOOi 28.9 FY2007 31.3 YoY4 4 -c"""'' 46.2 Prior 40.3 WoW·4 6.1"· -MIDS/31 37.5 Ap-..011 29.1 Mar-08 24.8 F.._.S 25.6 J~t~.OII 27.8 Doo-07 28.7 Nov-07 31.4 0f!.07 32.3 8.,.07 34.8 Aq-07 29.7 Jul-07 26.4
'"""1 29.5 Ml)'.(l7 27.2
Sprad.~l WL
(12.3 34,6 34.6
(154.3) s.o
S.3 l1.5
(2M
(20-4) " !.9 17.3
"'I - l 7.J
Ljqujdj'Y PpaJ <BnSl cp Ex.CP
(7.0) 22.0 2.1 29.2 4 .•
(4.7) 41.6 5.7 34.6 1.1 7.0
(5.7) 31.7 (6.4) 22.7 (7.0) 17.8 (7.5) 18.1 (8.2) 19.6 (7.0) 21.7 (4.4) 27.0 (6.2) 26.0 (1.9) 32.9 (1.2) 28.5 (1.0) 25.4 (1.8) 27.7 (l.S) 24.7
Spread to I WL Amouat 1 Invested i
16.7 s
619
Ui.'i' 5,742
7,486. 1.3761
l
25 =.o I 1.5 8,871
1<.2 s ~~~~~
""
.~ ... ·=· 41,3 5.2 ... 5.6 3],7 lO.S
31,6 4.4 52.6 15.9
L IL
62.S 17.7 38.7 (16.0) 24.8 (4.8) 41.9 24.2 30,9 8.8 40.3 (0.8) 14.3 (6.9) 29.5 10.5 24.4 (23.4) (10.2) (51.2) (2.7) (8.6) 7.8 0.9
12.3 6.1
SpnsdtD 1 WL
IWL
(B.S S
16.4
(I'M
l.l
02.5 1.8
ID.O
(ID.J (5.8)$
(10.9 ..
~
3,95 5.25 .JO
2.32 ... .... 2.45 2.83 2.95 3.18 4.17 4.69 4.70 4.94 5.40 5.44 5.32 5.32 5.32
Amouat .. ,"""
F«<Eff
~307 4,62!
13,306 l3l Ill 619
4847 28,061
16,763 1.376
3.01 5.10 .. 2.05 1.99 0.06
1.98 2.28 2.61 2.98 3.94 4.24 4.49 4.78 4.9-4 5.02 5.26 5.25 5.25
SpreadcolWL
(4.J 34.6 31.1
(lS4.3 s.o
(19.9) S.J
11.2
(16.9 1.1
4.4
(l!li.ol) ... 6.S 3.8
(bpo)IWL wFcdEIT
94.0 14.9 zu
27.D 37.3
47.1 55,6 33.6 17.9 23.3 44.6 21.5 18.8 46_2
41.7 6.0 7.0 6.3
-7-
LBEX-WGM 000504

CONFIDENTIAL TREATMENT REQUESTED BYLEHMAN BROTHERS HOLDINGS, INC.
Financial Planning & Analysis
• .
'
4. Issuance Levels
( Lehman Issuance Levels and Spreads:
As of: 05/30/2008
As of: 05/23/2008
(
- 8-
LBEX-WGM 000505

CONFIDENTIAL TREATMENT REQUESTED BYLEHMAN BROTHERS HOLDINGS, INC.
Financial Planning & Analysis
5. \.Peer Group Benchmark Issuances
Peer Groul! Benchmark Issuances:
Senior/ USD Estimated lml lssuer Sub Ccy PJ"iotipsl Equivalent Trade Start Mature Life Co~_!)n Spread Comments
LEH Subcb:bt USD 2,000 s 2,000 512/08 5111/33 30,09 7.5 273.0 Priced@ T + 30Sbps {priced off the May '37's
Senior GBP 500 $ 990 4/30/08 5/8108 5/8/18 10.00 7.88 271.0
Senior USD 2,500 $ 2,500 4/17/08 4124/08 5/2/18 10.00 6.875 250.0 P~ccd @ T + 320bps
Senior SGD 250 $ 176 2115/08 2122108 2122113 5.00 6ml.+210.8 210.8
Senior USD 4,000 $ 4,000 1114/08 1122108 "1124/13 5.00 5.625 213.8
Subdcbt USD 1,500 $ I 500 12/17/07 12121/07 12128/17 10.02 6.75 194.3
Senior ruR 1,750 $ 2,450 10/10/07 10/17/07 10117/12 5.00 5.375 93.3
Senior USD 1,000 $ 1,000 9119/07 9126/07 9127127 20.00 7 167.5
Senior USD 2,250 $ 2,250 9/19/07 9/26/07 9/26114 7.00 6.2 128.5
Senior USD 750 $ 750 8121/07 8127/07 9/15122 15.05 3m!.+ 170.0 LSyr no put Syr
Subdcbt USD 1,500 $ 1,500 7/12107 7119/07 7117137 29.99 6.875 99.4
Subdcbt USD 2,000 s . 2,000 7/12107 7119/07 7119117 10.00 6.5 76.1
Senior USD 1,500 $ 1,500 7/12107 7119/07 7/19/12 5.00 6 44.6
Senior ruR 500 $ 670 6120/07 6/27107 6127114 7.00 5.125 37.3
Senior USD 2,250 $ 2,250 5/30/07 615/07 6/27/13 6.06 1.3 13 monthc:Ucndiblc-1, Oat. +1, +2, +3, +3
Senior IPY 22,000 $ 181 S/24107 6/5/07 6/5117 10.00 2.23 41.0 Samurai Senior IPY 56,000 $ 462 0 5124/07 6/5/07 6/5112 s.oo 1.69 25.9 Samurai
Senior JPY 50,000 s 4li 5124107 6/S/07 6/S/1'1. 5.00 ::;m Jr Libor .;.. 23 Z4.0 $;;;.:.:...~
Senior USD 2,750 $ 2,750 S/22107 5125/07 5125/10 3.00 3mL+l4 14.8
Senior USD 100 $ 100 5/22107 5/25/07 5125110 3.00 FF0pen+22 12.3
Senior USD 1,000 s 1,000 S/8/07 5/17107 5/17134 27.00 5.857 85.0 MCAPSRXED
Senior USD SOD $ sao 518101 5/17/07 5117134 27.00 83.0 MCAPSFRN
Senior EUR 1,500 $ 2,040 S/2107 5/10/07 5/10/12 5.00 3m Eurib« + 34 33.3 Senior EUR zoo $ 272 4/26/07 S/10/07 5/10/12 5.00 4.0 13-12-13 month extendible lml +3, +4, +5, +6, +7nnnuDI step up
SCDior GBP 300 $ 597 4/25/07 5/4/07 1/25/13. 5.73 6 33.0
SubDebt USD 750 $ 750 4124/07 5/1/07 5/3132 25.00 6 78.8 2Snc20 IDSL Syrs Hoots at3mL + 78 ' Senior USD 1,600 s 1,600 3/20/07 3123/07 3123/09 2.00 3mL+7 8.0 Senior USD 250 $ 250 3/20/07 3/23/07 3123/09 2.00 lmL+7 7.0 Senior USD 6:50 $ 650 3/20/07 l/23/07 3/23/09 2.00 FFOpcn+ 16 6.0
Senior CAD 180 $ 207 3/16/07 l/21107 215109 1.87 3mBBSW+2.5 1.0 Senior EUR 500 s 650 2/16/07 3/5/07 3/5/10 3.00 10.0 3nc2, steps up to curibor+ 22 ihotcalled
SubDebt EUR 1,000 $ 1,300 217/07 2115/07 3/14/19 12.08 4.625 42.7 l2nc7, steps up to lm euribor+94bps if not called
( Sc:nior CHF 150 $ 186 216/07 3113/07 3/13113 6.00 2.875 17.0 Senior EUR 1,500 $ 1,935 1/11/07 1/22107 215114 7.04 3m Euribor + 30 29.0 Senior USD 1,500 $ 1,500 1/9/07 1112107 216/12 5.07 5.25 24.3 Senior USD 1,250 s 1,250 1/9/07 1112107 1112112 5.00 3mL+23 23.3 Sc.nior EUR 500 $ 660 12/18/06 12/22106 7120/12 5.58 3m Euribor.+ 2S 27.0 T11p ofJuly'12, rcoffcr3m Euribor+29
Senior USD 1.000 $ 1,000 12118/06 12121106 12123/08 2.01 JmL+S 5.9 Senior USD 600 $ 600 12118/06 12121/06 12123/08 2.01 lmL+5 5.0 Senior USD 400 $ 400 12118/06 12121106 12123/08 2.01 Primc-285 3.9
MS Senior USD 2,000 $ 2,000 5128/08 4/1/18 10.00 6.625 165.0 Priced @ T + 240bp&
Senior USD 1,500 s 1,500 4123/08 4128/08 4128/15 7.00 6 193.3 Priocd @ T + 275bps Senior EUR 1,000 s 1,580 4/9/08 4/15/08 4/IS/11 3.00 6.5 TBD Priced @ midswaps + 230bps Scniar USD 250 $ 250 4/1/08 4/1108 411/18 10.00 6.625 236.0 Priced@ T + 300bps I Tap of2.2Sbn deal Senior USD 2,500 $ 2,500 12120/07 12128/07 12128117 10.00 5.95 127.0 Priocd @ T + 200bps
Senior JPY 20,000 s 186 1/18/08 1124/08 1124/13 4.00 2.18 124.0
Senior JPY 30,200 $ 281 1118/08 1124/08 1/24/13 4.00 3m JP Libor+ 120 124.0 Senior USD 2,250 s 2,250 3/27/08 4/l/08 4/l/18 10.00 6.625 246.5 Priced@ T + 312.Sbps
GS Senior USD 1,500 $ 1,500 4/22108 4/29/08 411/18 10.00 6.15 174.0 Priced@ T + 237.5bps Senior EUR 2,000 s 2,953 1129/08 216108 2115113 5.00 5.375 125.0 Priced@ mid swaps+ 130bps Senior JPY 130,200 s 1,208 1123/08 1/30/08 1/30/13 5.00 3mJPU.bor+ 110 114.0 Senior IPY 18,300 s 170 1123/08 1/30/08 1/30113 s.oo 2.11 114.0 Senior USD 3,000 $ 3,000 1111/08 1118/08 1/18118 10.00 5.95 157.5 Priccd@T+215
Sub Debt GBP 325 $ 636 1/10/08 1118/08 1/18/38 30.00 6.875 223.0 Priced @ mid swaps+ 230bps Senior USD 2,750 $ 2,750 12118/07 12122107 1011137 30.00 7.149 210.0 Priced@ T+260; Tap of deal originaUy issue in Scp\2007 @L+ 128.5 (1'+190) Sub Debt USD 2,500 $ 2,500 3/25/0i 411/08 4/1118 10.00 6.15 207.0 Priced @ T + 270bps
BSC Senior USD 3,000 $ 3,000 1129/08 211108 211/18 10.00 7.25 312.0 T +362.Sbps
r.;IER Senior GBP 850 $ 1,683 4/23/08 4130/08 4/30/18 10.00 7.75
SC:nior uso 1;s"oo $ 1,500 4122108 4125/08 4/25/13 5.00 242.0 T+325bps Senior USD 5,500 s 5,500 4122108 4125/08 4/25118 10.00 257.0 T +320bps Senior EUR 500 $ 740 214/0i 211/08 218/13 5.00 190.0 priced nt mid swaps+ 1 ~5bps Senior USD 2,250 $ 2,250 1/29/08 215/08 215/13 5.00 5.45 193.0 T+262.5bps
-9-
LBEX-WGM 000506

CONFIDENTIAL TREATMENT REQUESTED BYLEHMAN BROTHERS HOLDINGS, INC.
6. New Issue/Closed Loan Update
Weekly Finance Committee MIS Loan Update • New Issue Pipeline I Closed Loans
Too PiPeline New Loans as of 06105/08
HY Loan PO Corooration Term.
HY Loan Wesco Term
~
HY Loan O'Reilly Automotive ABL RIC Bridae
HY Loan Taiwan Hioh Saeed Rail
· Highlighted Fynded Loans for the week ending 06/05!08
None
Projected Funding (jncludiog Fronting) at
9!!a
$100 000 000
$100 000 000
$215 300 000
TBD
Funded Amount
Highlighted Fully Unfunded Loans for the week ending 06/05/08
Legal Entity Unfunded Amount
!HG Loan !GMACLLC ILBCB $410,967,7421
~ Settlement J!!W..
Financial Planning & Analysis
Date £l!!i!l! Expected Entity Comments
Expected Holdings Fundjng
LBCB to lake additional $65mm to max out L TOB; Syndication went well and will be at zero; We will front
6/16/08 LBCB LBCB/LCPI our share at close· Hold is $0 $35 000 000 Will front $1 OOmm; $25mm hold expected; May be $0 after
6/30/08 LBCB LBCB syndication $0
LBCB cannot participate due to payoff of existing holdings loan (CSK Auto); Oversubscribed; comm due 6/6; $25mm lniHal hold expected; funding expected to not be material at close (will update as
7/1/08 LCPI LCPI we aet closer to close) $215 300 000 Existing Financing due to be paid off within 30 days of when TPA is signed (was set to be 5/20, but delayed with new Finance Minister) which is when Lehman commitment set to be approved; Commitment unknown but being sold down; funding yet to be determined; Best case is sometime In June for commllment; closing and funding 4
7/15/08 TBD TBD to 6 weeks after that TBD
Selllement Oat~ Enlitv Placed
- 10.
LBEX-WGM 000507

CONFIDENTIAL TREATMENT REQUESTED BYLEHMAN BROTHERS HOLDINGS, INC.
7. a. Thrift Sources and Uses
Lehman Brothers Bank CASH CAPITAL NET CHANGE REPORT
($millions)
Cash capital
Sources (Liabilities and Equity)
CDs- Broker(< I year maturity) CDs- Broker(> I year mablrity) Customer Deposit A LBCB Customer Deposit· LBI Customer Deposits - Retail Customer Deposits - Long-term Customer Deposit -LBHI Aurora Servicing Deposits Borrowings - Fffi..B Sweeps-(< SIOOK) Sweeps-(> SIOOK) (as of December 25, 2007} Fed Funds Sub Debt Income Taxes Payables Other Payables Equity
Total Sources
Uses (Assets)
Certified Residential Mortgages Certified Residential 2nd Liens Non certified Residential/ Delinquent Loans Certified Commercial Mortgages Non certified Commercial Mortgages Mortgage Warehousing Corporate Loans Leases Margin Loans SBALoans Student Loans FHLB Stock Securities Held for Sale ShorHcrm Investments:
Cash Margin Cash and Other LBCB Deposit Money Market Fund
Other Assets
Total Uses
Net Excess Sources Ov.:r Uses
Prcfundirig contingent commitments
Conduit
Net Surplus/(Shortfall) arter prefundings
Add back: Segregated cash in money funds
Expected Surplus/(Shortfall)
Add back: Customer CDs. deposits, and sweeps outflows
Potential Surplus/(Shortfall)
Remaining Borrowing Capacity
,....,--.---~~~~----~---~----
[.<::t._l~;- :._.i:;:-~~:.: ~_!lit<!: '~i!i(_.:'; ')~I --· ~-~-h-- -
Tier-l Tier-I Risk Based capital (Ticr-1/Risk Weigh. kscts)
To11l Risk. Based capilal
- ---- - -- ---- . -- -- - ,... ·- --- -· ~
~.:..l!~_(.Gj~~- ~ -~.:-. ~:\: ~:~·~~~~~..::.:·~- ·-
Tier-! Tier· I Risk Based c11pitl1 (Ticr-1/Risk Weigh. AsseU)
Tola1Risl::Bucdc:r.pitl1
Haircut
80% 100%
0% BOo/. 80%
100%
0% &Do/•
Oo/. &0% 80%
0% 100%
0% 0%
100%
44% 53%
100% 53%
100% 100% 100% 100% IOO'Y• 100% 100%
0% 5%
0% 0%
90% 0%
100%
14.68•;. 13.61% t6.ot•/.
14.02o/. 12.53'/• 14.76•;.
23-May-08
Balance Cosh
~ Capitol
2,490 1,992 3,912 3,912
0 0 0
367 294 0 0 0
169 135
162 130 1,099 879
(0) 300 ,nn
113 0 544 0
1,938 1,938
II 095 9,581
2,571 1,131 836 443 505 505
1,150 604 1.353 1.353
52 52 444 444
0 0 0
104 104 392 392
41 741 37
42 480 100 90 660 0
1,622 1,622
11,095 6,179
2,802
(1.242)
(550)
1,010
4,500
r::Jm 858
6,368
2,379
Required 5.00%
6.00% 10.00%
Financial Planning & Analysis
30-May-08 Change
Balance Cosh Balance Cash
~ Copitof §!!m Capital
2,451 1,961 (40) (32) 3,935 3,935 23 23
0 0 0 0 0
438 350 70 56 0 0 0 0
0 0 167 133 (2) (2)
0 0 0 136 109 (26) (21)
1.099 879 0 0 (0)
}00 ~00
Ill 0 0 400 (143) 0
1,689 1,689 (249) (249)
10,728 9.357 (367) (224)
2,176 957 (395) (174) 788 417 (49) (26) 453 453 (53) (53)
1,072 563 (78) (41) 1.306 1,306 (47) (47)
49 49 (3) (3) 443 443 (I) (I)
0 0 0 0 0 0 0
91 91 (13) (13) 391 391 (I) (I)
41 0 0 691 35 (SO) (2)
37 0 (5) 1,466 98S
100 90 0 0 0 (660)
1,624 1,624
10,728 6,419 Q67) (359)
2,937 135
(1,242)
(550)
---w;i5 135
4,600 100
c::£ill 858
6 604
2,098
- 11-
LBEX-WGM 000508

CONFIDENTIAL TREATMENT REQUESTED BYLEHMAN BROTHERS HOLDINGS, INC.
7. a. Thrift Pipeline
Lehman Brothers Bank Pipeline Report as of May 30, 2008
Deal Name ALS Production Commercial Deals LBSBF Everbank 2008-12-JFX Everbank 2008-13-HAR
Loans purchased into LBB
Balance Sheet as of Moy 30 2008
Total Remaining Activity for May Investments Change""
Projected Month End Balance Sheet
UPB 34,505,795
64,528,675 2,224,792
3,496,592
104,755,854
10,728,000
10,728,000
*Includes CD Maturities, Fed Funds Borrows, and Seg Deposits
Ledger Various
ADX M7D
Deal Name Projected ALS Production Projected Commercial Fundings Projected LBSBF
Approved but not funded
CMO Agency Securities sale SARM2008-2 RLT2008-AH2 Park National Pacific Premier FNMA Delivery
Loans sold out of LBB thUs far
UPB
(428,000,000) (184,073,000) (252,000,000) ( 42,494,674) (1 0,857,659) (79,942,860)
(917 ,425,333)
Ledger Various
ADX M7D
various various various
SBFcomm various various
Financial Planning & Analysis
( '·
Deal Name UPB Ledger
Loans Scheduled to be sold
r -.
-12-
LBEX-WGM 000509

CONFIDENTIAL TREATMENT REQUESTED BYLEHMAN BROTHERS HOLDINGS, INC.
Financial Planning & Analysis
~;r;r;-
!: \
7. b. LBCB Sources and Uses
Cash Capital
:1.3-May-08 30-May-08 Change
(inkrM} Cash capital Balance Cash Balance Cash Balance Cash Sources (Liabilities & Equity) Haircut ~ Caoital Sheet Capital ~ Capital
CD's- Brokered < I year 80% 1,506 1,204 1,480 1,\84 (25) (20) CD's- Brokered > 1 year 100% 2,498 2,498 2,459 2,459 (39) (39) Customer Deposits- 14MA 0% 0 5 0 Committed Facilities- Drawn 100% 0 0 0 Committed Facilities- Undrawn 100% 0 450 450 Sweeps 80% 0 0 0 0 LBB Draw (Fed Funds Purchase) 90% 100 90 100 90 Forward Contract Payable 0% 24 0 0 0 (24) Unsecured - Other 0% 1,109. 1,109 847 847 (262) (262) Other Payables 0% 404 0 378 (26) Equity 100% 972 972 975 975 2 2
To-tal Sources 6,618 6,324 6,244 6,005 (374) (319}
Uses (Assets)
Non-Certified Commercial Real Estate 100% 691 691 584 584 (107) (107)' Certified Commercial Real Estate 60% 35 21 . 35 21 Nulti-Farnily Mortg~ges 53% 0 0 0 Nortgage Warehousing 100% 126 126 129 129 2 2 Corporate Loans 100% 3,312 3,312 2,936 2,936 (375) (375) Other Interest Receivables 100% 727 727 565 565 (162) (162) Forward Contract Receivable 100% 0 0 5 5 5 CRA Investments 20% 15 15 (0) (0) Cash Oo/o 0 0 0
Time Deposits 0% 14 0 15 0 1 Money Market Funds 0% 1,570 0 0 0 (1,570) Treasuries 0% 0 0 1,800 0 1,800
(" Other 0% 0 0 13 0 13 Other assets 100% 128 128 147 147 19 19
Total Uses 6,618 5,008 6,244 4,390 (375} (619)
Net Excess Sources Over Uses 1,315 1,615 300
?refunding contingent commitments (15% ALCO Min) 21% (1,346) 21% (1,363) (17)
Pledged Corporate Loans 286 286
FHLB Advance Value on Affiliate Pledges 0 0
Net Surplus/(Shortfall) after prefundings 255 538 283
Add back: Customer CO's, deposits, and sweeps outflows
Potential Surplus/(Shortfall) 255 538 283
Capital Adequacy Required
Tier !leverage ratio 10.00% 15.40% 15.74%
Estimated Tier I risk-based capital ratio 10.00% 14.57% 14.52%
Estimated Total risk-based capital ratio 10.00% 14.57% 14.52%
- 13-
LBEX-WGM 000510

CONFIDENTIAL TREATMENT REQUESTED BYLEHMAN BROTHERS HOLDINGS, INC.
t ' 7. b. LBCB Pipeline
LBCB Asset Funding Pipeline -Assets Coming into/out of Portfolio miJOSJOB
Note - This information is subject to change
Financial Planning & Analysis
(
( I
- 14-
LBEX-WGM 000511

CONFIDENTIAL TREATMENT REQUESTED BYLEHMAN BROTHERS HOLDINGS, INC.
Financial Plannilrg & Analysis
cr· 7. c. Bankhaus Sources and Uses Utilisation of Bankbaus Funding Sources May 30th ;;
23-May-08 30-May-08 Change
Cash Cnpi!al BDiance Cash Balance Cash Balance Cash Haircut Sheet Capital Sheet Capital §hm Capital
SOURCES (Liabilities and Equity) DEPOSITS 8,241 6,935 7,519 6,649 (722) (286)
· GOPF covered 80% 6,417 5,134 5,840 4,672 (577) (462)
- Scgregntcd Deposits (LBF, etc.) 100"!. 801 801 1,042 977 241 176
-Segregated Deposits (LBIE) 100'1. 1,000 1,000
-non GDPF covered Deposits 0"!. 1,023 637 (386)
CAPITAL 7,00!1 6,975 7,038 7,002 29 27
-Schuldscheine 99% 5,285 5,251 5,314 5,278 29 27
-Subordinated Debt: 100"!. 561. 561 561 561
-Equity and Reserves 100"/t 1,163 1,163 1,163 1,163
Cash Collateral (1) IOOo/. 3,064 3,064 l,J53. 2,153 (911) (911)
Factlity Usage 100% 2,500 2,500
ECBTcndcr 0"/o 8,722 9,658 936
Back-to-bo.ck structures 0"1. 1,723 1.,034 311
Other hjables 0% 146 146
TOTAL SOURCES ~759 19,474 28,548 18,304 (211) (1,170)
USES (Assets)
LOANS 7,220 7,550 6,000 6,300 (1,220) (1,220)
- Residential Warehouse Loans )00%
- Reol Estate Loans 100"/o 3,426 3,426 2,348 2,348 (1,078) (1,078)
-Corporate Lonns IOD-/• 3,793 3,793 3,651 3,651 (147) (142)
• sub-participated LoR 100% 330 300 (30)
REVERSE REPOS 18,147 1,790 22,548 4,343 3,154 2,553
-Cash Capltallntcnsivc Securities &: MBS 100"/o 1,790 1,790 4,343 4,343 2,553 2,553
. Liquid Investments (2) 0'/o 5,625 6,263 638
- Quantum Portfolio 0"/o 287 250 (37)
- ECB REVERSE REPO 0'1. 8,722 9,658 936
-Bacl.:-to-back structures O'Yo 1,723 2,034 311
~=-Cash al Banks o•t. 2,735 (2,735)
Others liabililies o•;. 657 (657)
TOTAL USES 28,759 9,340 28,548 10,643 (211) 1,303
Net Excess Sources Over Uses 10,134 7,662 (2,472)
- Pre-Fundings 10(11'/. 688 645 (43)
Casll Capital Surplus (SIIortfall) after prefundings 9,446 7,017 (2,429)
-Add bnck:
Potential Surplus/(Shortfall) 9,446 7,017 (2,429)
EXT~RNAL REGULATORY LIMIT Capital 1,119 1,120 Us11gc 509 524 Capi::al Usage R1tiD Pl 17.6•/. 17.1•/. TilfgCt Usage Rntio 10.4% !0.4%
Liquidity Ratio Pl 1.23 1.30 Target Ratio l.IO 1.10
NDte.s (1) Cash Collateral for: 3038 3038 2153 2153 (88~ (88~
-Loan Portfolio 1.,273 2,273 1,308 1,308 (965) (965) MTMiosscs 611 611 611 611 (I) (I) Single loans (Siso.l, CASA) 1,114 1,114 174 174 (940) (940) GDPF, Loan Loss cl<. 218 224 224 224 6 loRvslCPl 330 330 300 300 (30) (30)
-Re.po Portfolio 455 455 525 525 70 70
-Derivative Business 310 310 320 320 10 10 lRSwaps 65 65 65 65 Commodities 245 245 255 255 10 10
(2.) Liquid Iovestme.ats (of which S2.6ba arc lock-ups)
Comments
ECB Tender up S0.9bn
c:·~ Invested $3bn in Exclaibur
Invested $l.3bn in senior F~dom note
\ Transferred SO.Sbn in loans (Irive & Miwphy)
Returned Project CASA Slbn (was cnshc ollatcralizcd)
Returned US RE loans o[$0.5bn
- 15 -
LBEX-WGM 000512

CONFIDENTIAL TREATMENT REQUESTED BYLEHMAN BROTHERS HOLDINGS, INC.
t .
'
7. c Bankhaus Loan Update- Pipeline and Closed Loans
Weekly Finance Committee MIS Loan Update - Bankhaus Pipeline
Loans Moved Into Bankhaus in May
Loan Type Deal
EUHG Carlsberg
USHY Dana
USHG Thomson
USHG Coventry Health Care (Sumi buyback)
EU HG Lufthansa
EURE Eurosail
USRE Project Murphy Mezz 1-6
US RE Project Irvine (Private Equity)
Total
Loans In Pipeline
Loan Type Deal
USHY SonicVFN EU HG Deutsche Telekom EU HY Schipol EU HY Converteam
June Pipeline
Commitment
Commitment
Financial Planning & Analysis
(
Smm
Funded Notes
360 360 Moved in 5/14 149 149 Moved in 5/14 147 90 Moved in 5/13
50 50 Moved in 5/13 75 0 Moved in 5/15 80 0 Moved in 5/30
300 300 Moved in 5/30 275 275 Moved in 5/30
1,436 1,224
$mm
Funded Notes
100 84 A_EP_roved, resolving technical issues 223 105 Approved
78 0 300 0
701 189
(
- 16-
LBEX-WGM 000513

CO
NFID
ENTIA
L TREA
TMEN
T REQ
UESTED
BY
LEHM
AN
BR
OTH
ERS H
OLD
ING
S, INC
.
rm m >< ~ G) s 0 0 0 U1 ....Jo.
~
--....,
'-"
Lou D•t•buc SumJDuy Ro::parl Weekly Cb••ae Cram May 23 to M1y Jo, liOB (JrniWtln•)
:::i
Loans (Alii
§ . MNP!Wholdoon(l.f13)
btilF Slf\IQre; Rip&~ Ofll:r_WholdoNI
HMHPU8USHINaFD\STUEN(I2:·11-07) TXU!NEKO\"(IMDIDTJc:m CHESI\f'EAia!OIERGYCOIU'mtAd(llo01-117) QU2112COil WO.uDDIP lfll/'01 ClTCIN'I'miNATlONALFn'AHCIALIIOLDIHOS I'INNACIZFOODS FlNANCEU.C TRJ'BUNECOtJPANY (SII7m) Ra.A'TEOCOI-!J'AM!!', LP, 512.JIOI ~IUBADALA DEYEI..CIPMENl'CO. nBN'-11-01 CAIUSIIUO (170CTQ7) IICIL[NC.(II/17105) W1lCiaACI!a.CO..CONN. SBASENIOR FINANCE(Ifll/01) l:oUJ'INECOIIJ'EXITlflU,I LOAN Dill IIIli SRAM»£NERaY ISTUEN{l·T.07J sutiCALCO~I.LLC
MtOLOOI! WHOLE LOAN rAVINE)JULllFAM!l..Yl'OI\'JR)tJO WIIOLE.LOAN ROSSLYN-IDOD IIOOWJLSONB HWUOlELOAN PROJECTCAli'A211KAHEMIA PI.OJ'ECTCASAl 1¥:.AMiMEA C'I.EAI\iHsnLOAN Pl\OIECT CASA 4 ~.\ Nnii!A PR0r£CTCASA.IIIKAMMEA PTO.U.USAI CLE.U.nl UF1 11/KX.. Cfi.EAnii..IFMJDOI\Orli<P111 t..'IND~ti.:IIKSENIOR(9l0ln)
Gl.fNOAl.ECJTYCbnUSR. WIIOI..ELOAN CR£..\TliMSHISHIIK.K.Cp.EATHUFE/UtiOR OpiiM PROrECTMURPifY'MI!ZZI WIIOLELOW PROJEC'TMliRJ'triMEZZ7 WHOLELOAN PSlOIECTMUIU'HVME2Z~ WHOLE.LOAH PJI.OJ2CTMUP.1'KYME221·DH WHDLELOAN Pll01!CI'MVRI'K\'~7·DII WIIC)LELOAN
..... U,IID 7,21l ..... m
. " " "' " u ,,,5, .. '" "
. . "' .
n.n~ ... ,., '·"' '·"' _ _ll!l
.,, .. " .. " "' " " ..... " ..
"' "' . '" "" '" '" '" " ,. " " "
·I.NJi
~:!:~1 u
Loan& outside of Banks
E'"";:.
KaWdill WMidoan.(Mt'S) ~c5cro'ldlw~
Clllr~W!I.kloon
IJ.ftJUAL T08ACCO SFA lli1JLD1 l'XUENI!IlOY(IG'IMl1)cm $01 Pt.IIUSlUNOFJJniJEN(I1·1l-01J lfCAilfC.(II/17101) QtJEli'ECOR WOIU.DDIPinl/01 Cll1C DIJUW..\noNALfJNANOALIIot.lliH05 Pll<IN.u::t.EI"'OD!FINANCEU.C 11UDUNI!.CCIMPAHY(SII71Q11 IW..ATED ca.tPANtES, LP. ~I J.fllliADo\I.ADEVU.a'MiiNJ'CO. nBH .._.11-GJ
PTUAZOSA1 t'1.EAAlHUfli.noc.J.:.G£AntUFEJUDOI\Of!lklo CllEA1HNISHJSHJ.II::..K.Cft£AntLIFEIUBOilOpli011 PKOJ'ECTMURPH\"M!l%1 WHOLELO/IN I'I\OJECTMIJRPHYMD:Z'J 'fflCt.ELOAN PAOJEC'Tt.IUIU'KYNEU' WHOI.ELOAH DELTA COVE SDIOA WHOLE 1..0-'N PR.OJ2CTOAGFAH MTZ C.UU.TONPHILADWIPA fHDT'I"HHU LOAN SffUNO),fOUNTAJNI\ANCH~IEUMilNLOAN
Plt0JECTEl.EVAl10NMEU4 WHOI..ELOAN 1'2SHIOifi1'1!.E£T'-IEZZl \VMOU.LOAN PROJECT 'TROIS ~BI!....U.STlGZZWHOU! LOAN MCCAJCILE.SS1'0WEII.SM£ZZ WHOI..El.OAN
~ '/ --~.
I
..... u,sn 1,70 ,,,., -"'
" " . .. " "' " " '" " ' ' '" " ''" ill • "' . '"
. ... '"
':I:I,IU ll.lll ,m '·"' :ill__
'" " " " " "' »
" " . " " '" "
'" . '" '" " , " " "' '" .. " " "
•1,111
"''" .... "
.. .. ... .. ... " ... " " ,,. ... ,, ...
.,, "' ....
·161 44 ... ., ... .. ... ... ... ... "'
I,
Loans Banks
I~:: ,lkoi.lcNiolWhgldotni~CTS
Dl!t.SPA DESTBUY Cll(911"""1 YPSO:IENIOI).CDTD6JIIND6) n'COUliL(11l"AZJ 5•\'A 1·1~-uJ R£atll.A11!D utnn1ES(A.aR. IVMSJ(C7T!Bh:l lrriCJUNKIN liED MAN RlLDtt«l COIU'ORA110H lnl'MEDIAfiWJI«i3 U.CClMl LIEN! DANA JIQU)jHG tl.(llll/01) ALE NCO JNC. SYR A1tR 11-14-IMi TESORO COJ!PORA110N A!IL. 5·JI-Q7 (CH.Uil ARMMRA;.COIIJ'ORA110N 1•26-07 ELPASOA.t.RGl'·ll~ DITUI'RJSEPRODUcJ'SU.C Ad.(ll•lf.lln
PllOJ'ECTC,-SAJ~NiM!A
PROJECT CAJA 4 o\IU\ NEMEA PROI!CTC.UA I AkANI:"G:A LANDMA~II'EN101l(9lln12)
GlENDALE CITY CiN1U. !R \\110L&LOAN PRO.IECTMUUH\'MUZI·BH WHou;:LOAN rROJECTMURPII\"hiEZZ7·BII WHOLELOAN JDHNHAN<'OCKC&tllERMEZZ1 WHOU!.LOAN PlLOIE.CT~MEZ%6·8H WHOLZLOAN PII.OJMartl7Yil.MEZZBANtatAUS \VHol.iLOAN COUJlVOI!IERMEZZ _WIIOL!LOAN PROIBCT DE.UCE 10 UCP WHOL£LDAN PROIGC'I'if.E\'Al10N).IEZZ3 MIOLiiLOAN PROIECTmCMs IOD CAUFOP.NIA ),[\VIIOLE lOA)'.! ONE. FEDEP.ALINJEJIMEDI.\lJiMEU WHOlE LOAN cotmNlNI'ALGRANDIMa.ZZ WHOl.ELOAH
"'
'"' 3,'-4J MOD
. n . n
" . . rn . m
" .
" .. " "
., .... ''"
" . . . . n u
-. rn u
'" "' "' '" " . ' '" . " " "
~
·HI ·I,OD5
.,~2
;--1 I")
b; § ~ § "' t'-< ~
§
~ §~ I
"\:I .;a· ~ ::::-;::" ~ 1::. ;:: ~
Q
i ~ § ...
SJ § " §:
~ .. ~· Ro :.. "' I> .;:-.. ;;;·

CO
NFID
ENTIA
L TREA
TMEN
T REQ
UESTED
BY
LEHM
AN
BR
OTH
ERS H
OLD
ING
S, INC
.
rm m >< ~ G) s 0 0 0 U1 ....Jo.
U1 -00
IMI'Q.IAL TOIIACCO EQT BJJOOE IIMD"t FDI.STPATA BJUDGE 1m.WT-CIT1) MNIEJI.OAMU (INJRAWI!s:t] IB-06 TXUEWEIIGY(IOIIIII'OJ)aD lt.tPEIUAL TOBACCO If A ltiUL07 llCKHCJR.CQJtNaf."{HMH.oGtl<iGENtWM)l-31-DI HMHPUIIUSKINONEZZANINE(PIK)I%-11-07 CotnnRVWml S•Yit.IPM(SIIIWI) DPIDL!IPAl6JUt07 PQ CCIUOI!.ATION 1sT UEN (1'-30-~17) SAtKERPUI'IliNGL1D.I41517(A) FJRSTDATA!IUUI,IIUDG6(,n41D7-CIT1) CDWSR.IJUlXIli IG-11-07(AilN1-411)
TIUBUNECOMI'ANY(51171DI)
l'llOJiiCTOOSI'£L2llliNE1007 CALWN0040!10'1' (900ZJ:J) PJtO'It:GOIEX.UIUJM(9~ PLF LD Sl'MitCAllON PAil'I'M!Illl.CWHOt.! LOAN GOODWA'IE\ 100407 (nD'17') rtO SUMITOMO'FF1 OCTOPUS SZNIOII.IMAilO'I' (nol!7J fROJEcr MURPK'i !ENIOil· CDD WHOLE LOAN I'ROJECf'POJSBIJDGEM£zz:l WHOLELOAN fOilTUZAs..u..t.(tODlOQ
"'""""' WHOU:lDAN llOSSI.YN' LB SYNDICAnoN fAA'INER.WJIOl£ LOAN KN~CUMocm. HOlEL :!!IDliOI\ WH0l£1DAN MAJUSL.!Hlo\DH2Ail11.A!«<TERM WHOLELOAN lllVINEM\.Il.llFMGLVPOilTI'OUO WHOLE LOAN HUITAOEf'IElDS WHOl.ELOAN HEIUTAGElJEWSBM'KHAUS· WHOU"lDAN DAOi'Rt:E."JERM C'MNDPIUXSEN'IOil WIIOI.ELOAN
\
l,ltl!i ., "' "' "' "' '" '" '" "' 111
"' "'
"' "' I"
"' '" "' "' '" "' '" "' "' "' 111
"' "' "' "' '" "'
C.W..UEJ.O (UOCT07) l,lll
_, IMP&IUAL TOIACC'O~BRIDOE.I&Jlli.D1
IU ~ FIRSTDATABIUDCi£(911.1107-cm)
"' _,. WINln(;AME$ (D'fTlL\\I(ESl) JG-01
ns _, D.IP!RJAL TOBACCO SFA 1Utll.D7
711 ... l10."NNO\ CORN211.-(tD.Gi -GUCNENIIEI.f) J-l 1-111
"' ' HMH PUBUSHIHGMEZZAMNE(PJJ.:) 11-ll.aJ
'" . iXUE.NEP.aY(IotiCW1)Cil1
'" " !ACHEilnn«HNGLlD.Iti517(A)
"' . mtST DATA SR.Stlli.BRIDG£(M4107.an)
"' ' COW $11..!11UD0l! ID-Il.aJ (Aill·IUI)
'" ... CBD INVUTOil INC. &JUDGE , .. ' PtU.MDALEHILLS(lU'rfB.RIINCifJ
"' ' SUNCALCOMMUNrms I, U..C
"' ' PQ CORPORAllON ISTUEN(1-3o.G1] 1HAUACLO_SACJ£Jl 11UIIUN!COMI'ANT(m71117) COUIITR.l'WlDI5-Yl\IPM(5nWD'l
"2 .,. AACHSTONE DEVELQPMa
, .. ·I rROrecT GOSPEL U JUNE l
"' ., rAOTF.GO SEX nmN07tno'l50J
"' ' PI.J' LB SYNDIC"TlONP.ut.TNEJI. Ll.CWHOf.E IDAN ... ., CALVDIOGIOSIOT (VOODl)
"' ' GOODW A 1U.l00407 (91027'1
"' ., f'TIJS\JMil'OMOFFl
"' ' OCrDrU.! SiMIOR IMARD1 (91D'n7)
'" " fllOJECT"'IUIU'HV SENIOit·CDO WHOl.£ LOAN
"' ·2 PlOiiCfl'ROIS BlmG! MEZZ I WHOLE LOAN
"' ~ fOJ\lU.ZAS..U..LpDOUIQ
"' ·lU PllOLOOJS WHOL!LDAN
"' ·10 ROSSLYN UI.SYNDICAllOH fAATNER'NHOU LOAN 211 ' lanCXfJUI:OCUII. HOTiLSEHTOR WHOLE LOAN
'" ·2 MARBLEHiADHEAJl'JI..ANDTSJ,I \YJW.ELOAN
' "' HWr""fiEUI$ WHOI.IiLOAN
'" ' DAOFFICE'JDU.I
"' ' GR.UiDfiUX:SEMOR WHOt.ELDAN
'" ·I IUTZCARLTON~ALUASJl. WHOU.LOAN
"' ' SIJNAWMOOMI7UJ20CII
.,, "' 171 "' rHUJJ' ""AAIS INJERNAllDMU. INC
"' "' DAN,O.HOl.DIN01l(IIJ11111}
"' "' SI5AL(90CT06}
"' '" STOAAGEMAJtTfAJtllfERS6111o&
"' "' PECO:Smvut'ClllSU.C(ISTUEN 1112.1/!17)
"' '" t.fCJUI«<NUOJdAN HOI.DtNCI CORIOR.AllON
"I "' COumllYWIDE ~Yilm.l (SIIIWC)
"' "' TC GROUP rtn'UtMENT HOLDINO:S. LP • Ul '" 'rEU.ftiNICA E~OPE 114DEI:O'I
COXCCIMJ.fl.INICAnONS,(NC.H&-oli lliOMSOMREIJJUS CI'KA THOMSONCOaP) ~ .SMDINVE.SJ).JENn;(ltJANOI)(B) CITGROUPINC.SYli.(UVI.a/03) CK.\S£ Af"'UDJ.IANAG!MENTHOI.DfNQ, U".+:za.G1 ,....,
:UO WHOLE LOAN ....._.LOAN
'HOI.£1.0.\N Ghiii.DO WHCLELOAN
"' "' GMIU.OOSli.LBCB WHOL£LOAN
"' "' 1107 BROADWA\" ACQWillOH A LOWHOU:: LOAN
"' '" lt.lliERTSOHnOfENSJORELBCB •'HOLE LOAN
'" '" PROIECTt.MU'HY SR.• LBCD WHOI.£ LOAN 2" '" SUNSf.TGOWERBMltalAlm . WHOLELOAN
'" "' U118k0ADWAY SA.IIANI\HAUS WHOLE LOAN
"' 110 VAUGtiANfi.ACE ;~LbAN
"' "' RfT2.1{AfALUAAfNOTE WIIOULOAN
"' "' PROJECT MURnl\" f,.£Z2: I • BK WHOLE LOAN
"' fROJECf MURJ'HY MEZ2. 7- BH WIIOI.Ii LOAN FOurli"AittEDLEUMEZZBH WHOLE LOAN CALVIN00111907 p!)Ol!J) rJl.CliiCfr.ruJI.fK\"MEZl'·BK WHOU:.LOAN a.IOONUGHTDASIN 1o1E2Z WJWu:l.OAt-1 CALWESTMEZZ.l WHOLE LOAN
'" '" '" on
'" '" "' '" '" '" '" "' "' '" '" '" '" "' '" '" '" " " " '" ' "" "' u• "' "' "' '" "' '" "' '" '" "' '" "' "' '" "' ... "' .. " " ' "'
•
,.---, I \
;-..\
'"" t-< c § ~ IOl s ~
~ 11:1 I ~ ~
t-< ;::.
~ ~ .... ~ ;::. ;:: ...
:-!1 ;: .. [ ., iS" ::0 ;:
~· R:... s ~ .. t;·

CONFIDENTIAL TREATMENT REQUESTED BYLEHMAN BROTHERS HOLDINGS, INC.
8. Liquidity footnote disclosure
(f .. / .
\
LBEX-WGM 000516

CONFIDENTIAL TREATMENT REQUESTED BYLEHMAN BROTHERS HOLDINGS, INC.
Global Treasury Liquidity Footnote- May 31,2008 Amounts in millions
I Investment Type
1. Cash Bank Deposits Other Cash Inv Money Funds
Total Cash
2. Boxed Inventory Private Label CMO's Corporates Governments I Treasuries Asset Backed Equities Agencies
Total Boxed Inventory
C&C Equivs Available to Holding Company (A+B)
Undrawn Committed Facilities Chase Facility European Facility
C&C Equivs Available to Holding Company
Notes:
A
B
Pledge Value NewYorklnv
2,122 583 116
2,821
1,473 974
12,430 1,453
11,828
28,157
30,977
*Pledge value = Market Value of the collateral * normal mkt haircut for each asset class
1,300
1,300
1,793
1,793
3,093
197 53
8,801 5
272 1,241
10,569
10,569
3,422 583 116
4,121
1,670 1,027
23,025 1,458
272 13,069
40,520
44,640
2,000 2,500
49,140
(
LBEX-WGM 000517

CO
NFID
ENTIA
L TREA
TMEN
T REQ
UESTED
BY
LEHM
AN
BR
OTH
ERS H
OLD
ING
S, INC
.
rm m >< ~ G) s 0 0 0 U1 ....Jo.
00
-~-
_}
Global Treasury Liquidity Footnote- May 31, 2008 vs. February 29, 2008 Amounts in S millions
(::~:~;;;G·.f;·;~;J~;L~;~G::~:=~-!~E~I l.Cash
Time Deposits Other Cash I Ext. Investments Money Funds
Toto! Cash
l. Boxed Inventory 2 1 Iri-pany eligjblc
Asset Backed Corp orates Governments I Treasuries Private Label CMO's Munis Money Markets Convertibles Agencies Equities AgencyMBS
Sub-tot1l Tri-party eligit»le Jloxed inventory
A
B
2,122 583 116
2,821
1,453 974
12,430 1,473
11,828
28,157
1,300
1.300
1,793
5 53
8,801 197
1,241 272
-~~
3,422 583 116
~I
1,458 1,027
23,025 1,670
13,069 272
1,'79~ - 10,56? ~0,520
,C&C;!i;qniv•-·A.vailablo .to. Boldin£> (A.+B)-, .. ;-. · • ', !.- ·;• - -~;t;)~·?;"' ;~. '---.· '3~,977 ::,; f,:;,}';;,?3,093.~·',:.::''.l.0;56~1:;:-:+''<14;MO
~ *Pledge value= Market Value of the collateml • nonnal mkt haircut for each asset class
675 724 123
380
1,522 J~U,
13,510
10,762
3,334
27,606
Ill 677
619
164 1,261 1,282
2 648
1,407 3.356
1,054 724 123
1,90Z
275 15,448
1,282
10,764 1,267 3,334
32,369
· ··29,12.'l'·. • .. ~f~-. ·1,40.'1: ' :~.-::·-~.-. 3,736~·~~-=~"1:~·- ...... l,;z'{O~l
l{"''fc•. ~i~
1,447 1,300 (380) 2,368 (141) (141}
(7} (7}
1,199 1,300 (380) 1,219
1,453 5 1,458 974 (Ill) (Ill) 752
(1,079) 1,116 7,540 7,577 1,473 (1,084) 388
1,066 1,240 2,305 (619} (376) (995)
(3,l34} (3,334)
551 386 7,213 8,!51
- . _._,:_:i;sso·- -. ·. '--<·t,6ao.'•- "·'':: .6,834 · • • · ··xo,J70

CONFIDENTIAL TREATMENT REQUESTED BYLEHMAN BROTHERS HOLDINGS, INC.
!Total NY Liquidity 33,487,949,654 I
t . ' NY LBHI CFU Investments Reportable I YES Mset. caie~onr 1' I Asset Category 2 . S!lin ofMI!rliitValu~; : . Average of Normal Mkt Haircut Sum of Pledge Value: ASSET BACKS lA 1,529,050,000 5:00% I ,452,597,500
~-----.....
( ASSET BACKS.Totill :·. ' t,529;1iso;ooo 5.00% 1 452,597,500' CORPORATE lA I ,025 000,000 5.00% 973,750,000 CORPORATE Total. t,li25;ooo,ooit ;~ ·. __ , .. .. s.oo%· 973~150,0011' .. PRN ATE LABEL lA 1,550,000,000 5.00% 1,472,500,000
. PRIVATE.LABEL Total . 1,550 ooo;ooo. .. - ·,.· 5.00% 1,472,500 000 TREASURIES
I:ONDS 2,332,729,114 1.50% 2,297,738,177
NOTES 4,885,332,273 1.50% 4,812,052,289 TIPS 4 650,711,913 1.50% 4,580,95 I ,234
UU:ASURIES Total-· ll,868i773,300 ·. ... 1.50% ..' 11690,741 700. AGENCY I~OUPON 9,108,371,160 1.50% 8,971,745,593
DISCOUNTS 2,899,383,011 1.50% 2,855 892,266 AGENCY Total:• ..
:-.- .. 12,001;75'4 171' 1.50% 11 827;637 858 STRIPS I;INT 472,241,956 2.00% 462,797,117
PRIN 28i;608;596 2.00% 276,956,424 STRIPS total,..-'. .. ... :c,:.: 7S4;8S0;55l·: ·.·.· ... . . 2.0'0°/o' ..
.,., . 139753,54:1'· .. . ..
Grand Total 28 735,428,023 28 1 56 980,600
NY LBHI Time Deposits
BankNanie . .,
Pledge Value-.. ... . ' .
JPMChase I ,748,000,000 Citibank DOD Depo 374,000 000 Totat ·· 2,122 ooo;ooo .
US Money Funds
BankName ... ·. Pledge Value · .. · .... ..
Blaclcrock Cash Strategies 42,769,119 Lehman Enhanced Cash Fund 800,000 Lehman Government Portfolio 6,000,000 Lehman Government Reserves Portfolio 7,000,000 Lehman Money Market 7,000,000 Lehman Prime Fund 7,000,000 Lehman Treasury Portfolio 6,000,000 Lehman Tax-Exempt Portfolio 7,000,000 Lehman Municipal Portfolio 7,000,000 Leh CA Tax Free Money Fund 25,000,000
Tiltal::''!•-_-_, .. . ;: ·! -:;. . 115,569,11~ -'.· ·,,•y•
LBI CFU Investments
Reportable YES As$e(c~tegory t• ... ···· .... ·
Normal Mki Haircut ..... PledteValue• :. -.... ' . -·
TREASURIES BILLS I 802,411,995 0.50% 1,793,399,935 'l'REASuRIESTotai, o.5o%:· 1,793,399,935:i. Grand Total 1,802,411 995 1,793 399 935
US LBI Deposits
BankName.· ... ··. JPMChase
Totak .. ·: .. /, .. · _
(
LBEX-WGM 000519

CONFIDENTIAL TREATMENT REQUESTED BYLEHMAN BROTHERS HOLDINGS, INC.
er· !Total Europe Liquidity u,152,299,ssz.65 I
LBHIUK Investments
·. _; ...
Bond Funds Money Funds
Europe Investments
. . --- • i . ' ~ . Market Vallie
6!3,534,096 88,21 I
Reportable YES
EQUITY COMMON STOCK
E_QUITY Totalc GOVERNMENTS M
AM
MMJ GOVERNM.ItNT:Sl.'otal . · ... . -... . ,.·. -~ . ."<, .. - ..
AGENCY I COUPON AGENCYTotaf.. . · . . .. -~. -~ . " .
CORPORATE- NON G7 lA
AAMJ CORP,ORATE;" NON G7 Totak. :: . . :: ~-- :· .
CMO AGENCIES LAM IGNMA
CMOAGENCIES Total -_!.
ASSET BACKS lA ASSET BACKS Total· TREASURIES !BONDS
I NOTES TREASURIES Total Grand Total
Normal Mkt Haircut. · . '· _Pled~~ Value .
El E2
G7 Gl G7 G7 G7
IGI
ICI let tel
ICI _ICI
ICI
_IGI IG!
5.00% 0.00"/o
. '
582,857,391 88,211
. 582,945,603·
77,165,281 208 758,539
... . 285;923;820 I 280 838 290 5,440,533,858 2 130 633,951
95029185-2 257,203
I ,260,362 710 '.1;260;362710 ". . .. ·.
20 048 !56 12 551 556 22,971,641
..... 55.571;353. :.- ':-.'. . . ..... . ; .....
9 914 891 191 502,221
. 201,41"7 112 .. 5,699 851 5 699 851 7 585 783 5,532.376
. . 13;118 159 ) · .... 10 771,385,492
5.00% 5.00%
-5.00% •·. 1.50% 2.00% 1.50% 1.50% 1.50%
1.50% · ... r.5o%: ..
73,307,017 198 320 612 271,62'1629
I 261 625 716 5,331,723,181 2 098,674,442
93 603,747 2,223,345
1,241,457 269 1241'457;269>
5.00% 19 045 748 5.00% 11,923 978 5.00% 21,823 059
3.00% 9,617 444 2.00% !87672!77 2.04.% . .. 197,289,621'. 5.00% 5,414,858
. · .. ·: ·. 5.00% ' 5 414;858. 1.50% 7,471 996 1.50% 5 449 390 1.50%': 12 921;387
10 569,353 980
LBEX-WGM 000520

CONFIDENTIAL TREATMENT REQUESTED BYLEHMAN BROTHERS HOLDINGS, INC.
• J/1 9. Firm inventory, box and liquidity pool table
LBEX-WGM 000521

CO
NFID
ENTIA
L TREA
TMEN
T REQ
UESTED
BY
LEHM
AN
BR
OTH
ERS H
OLD
ING
S, INC
.
r m m >< ~ G) s 0 0 0 0'1 1\) 1\)
_...,, /•., LEHMAN BROTHERS
5/30/2008 FIRM INVENTORY, BOX, & LIQUIDITY POOL
Inventory Owned
M:IJI. 31 2008 (in million~_ Market Value Mortgages, mortgage-backed and real estate inventory positions 93,125 Government and agencies 26,988 Derivatives and other contractual agreements 46,991 Corporate debt and other 49,999 Corporate equities 47,549 Certificates of deposit and other money market instruments 4 757 Total 269,409
Cash & Deposits
TOTAL LIQUIDITY
Inventory Owned
February 29 2008 (in millions) Market Value Mortgages, mortgage-backed and real estate inventory positions 107,171 Government and agencies 44,574 Derivatives and other contractual agreements 55,612 Corporate debt and other 59,750 Corporate equities 56,118 Certificates of deposit and other money market instruments 3 433 Total 326,658
Cash & Deposits
TOTAL LIQUIDITY
Inventory Owned
'Qo_QVariance (in millions) Market Value Mortgages, mortgage-backed and real estate inventory positions (14,046) Government and agencies (17,586) Derivatives and other contractual agreements (8,621) Corporate debt and other (9,751) Corporate equities (8,569) Certificates of deposit and other money market instruments I 324 Total (57,249)
Cash & Deposits
TOTAL LIQUIDirrY
Firm Box*
Market Value 27,289 5,349
46,991 35,917 19,897 I 240
136,683
Firm Box*
Market Value 31,086
5,312 55,612 56,662 22,783
1,249 172,705
Firm Box
Market Value (3,798)
37 (8,621)
(20,745) (2,886)
(10
. (36,023
*Note: Firm Box includes derivatives, which are not included in the FAS 140 box disclosure.
/~
Reverses I Borrows Box Market Value
6,086 47,316
-17,017 20,758
63 91,241
Reverses I Borrows Box Market Value
3,999 35,687
-15,791 20,218
27 75,722
Reverses I Borrows Box Market Value
2,087 11,629
-1,226
541 36
15,518
~~
Total Boxed Inventory Liquidity Pool Liquidity Pool %
or Boxed Inventory
Market Value Pledge Value Market Value Pledge Value Market Value Pledge Value 33,374 3,436 3,085 2,931 9% 85% 52,665 41,912 36,858 36,291 70% 87ro 46,991 - . - - nla nla 52,935 28,924 1,081 1,027 2% 4% 40,655 22,062 286 272 Io/o Io/o
1,303 10,3191 729 699 56% 7% 227,923 106,653 42,038 41,218 18% 39%
3,422 3,422
45,460 44,640
Total Boxed Inventory Liquidity Pool Liquidity Pool %
Of Boxed Inventory Market Value Pledge Value Market Value Pledge Value Market Value Pledge Value
35,086 17,627 ' 4,726 4,615 13% 26% 40,999 38,529 26,614 26,212 65% 68% 55,612 - - - n/a nla 72,454 10,531 941 894 1% 8% 43,000 26,953 682 648 2% 2%
I 277 I 339 878 847 69% 63% 248,428 94 980 33,840 33,216 14% 35%
I,054 1,054
34,895 34,;!70
Total Boxed Inventory Liquidil}' Pool Liquidity Pool %
Of Boxed Inventll_l2 Market Value Pledge Value Market Value Pledge Value Market Value Pledge Value
(1,711) (14,191) (1,642) (1,685) -4% 59% 11,666 3,383 10,244 10,079 5% 19% (8,621) - - nla nla
(19,519) 18,392 140 133 1%. -5% (2,346) (4,891) (396) (376) -1% -1%
26 8,980 (148) (149) -13% -56% (20,504 11,672 8,198 8_&03 5% L_ -- 4~
2,368 2,368
10,566 10,370

CONFIDENTIAL TREATMENT REQUESTED BYLEHMAN BROTHERS HOLDINGS, INC.
LBEX-WGM 000523

CO
NFID
ENTIA
L TREA
TMEN
T REQ
UESTED
BY
LEHM
AN
BR
OTH
ERS H
OLD
ING
S, INC
.
r m m >< ~ G) s 0 0 0 0'1 1\) ~
···~~"',;;. ~~·i'~i .. /,0 ·;
''·
LEHMAN BROTHERS
/;...-~
Capital Markets Finance 2Q SEC Review July 16, 2008
I'
-~
I
Confidential Presentation

CO
NFID
ENTIA
L TREA
TMEN
T REQ
UESTED
BY
LEHM
AN
BR
OTH
ERS H
OLD
ING
S, INC
.
r m m >< ~ G) s 0 0 0 (11 1\) (11
'
Capital Mark.ets Over-view .. -(;~;~ .. \;_;{-~\ -:~ ... : ~-;·._:-.~~gm~n~-~ _:,.:. :: ;._;;:;f: .. :\_;~~;tE1\~ii-:!li-;:f;};. ·
Ca~ital Mar·kets Overview Q2'08 Q1'08 %Ll Q2'07 " %Ll
. Fixed Income (2,975) 262 -1235% 1,902. -256% I'
Equities 601 1,410 -57% 1,692 -.-64%
Capital Markets (2,374) 1,672 -242% 3,594-- -166%
i~:~~~i!:;;i-l:J:!i:;; ;_ ,;; .. ;:~ ,; :,,).j_~;t~i~*~~~~j~~c~.;;;;~,;.;,;,. ;::• -_.. . .. ,. -,,_ ~:;·.t'~~KDil.~~~J.~i~i~1,;i,jl.J~,:~:b~,.~"-;;~~J~t~~~i~itiliL[;,;,}:,~;:.~ .;;~ .. ,,.-i' ,.-j~'- .';~~~.~~~~.,~i~i~i; ~ Capital Markets revenues are down from Q4'2007 and Ql '2007levels
~ FID Revenues of$(2,975mm) are down (1,235%) vs. Ql '2008 and down (256%) vs. Q2'2007
• Excluding MTM adjustments, related hedges and structured note liability gains, client activity in Securitized Products,
Municipals and Commodities remained strong, while Credit, Interest Rates and Financing were down from last quarter but up
versus the year ago period.
~ Equities revenues of$601mm are down (57%) from Ql '2008 and down (64%) vs. Q2'2007
• Principal losses in the quarter from GTS I GPS I GOG $(134)mm, down $(504)mm vs. Ql '08
• Private Equity losses of $(121)mm, driven by GLG $(150)mm
• Difficult markets for Structured derivatives led to losses in Europe and Asia Volatility
T~BROTHERS ""''\1 I
1'-..., \
' _I
I

CO
NFID
ENTIA
L TREA
TMEN
T REQ
UESTED
BY
LEHM
AN
BR
OTH
ERS H
OLD
ING
S, INC
.
r m m >< ~ G) s 0 0 0 0'1 1\) en
~~-'\ ' :.l
FID Review (w/ Detail) I
Q2 '08 versus Q2'08 Q1'08 Q2'07 Q1'08 Q2'07 Comments
FIXED INCOME Interest Rate Products (267) 962 364 n/a n/a Losses on Euro Steepener as inflation concerns flattened the curve by 88 bps, offset by strong client revenues. Foreign Exchange 8 218 58 -96% -86%
Liquid Markets Proprietary " " n/a n/a LiQuid Markets (259 I,180 422 n/a nla
I'
coo 54 36 177 51% -70% High Grade Credit 90 SIS 79 -83% 13% Stong client revenues offset by losses on short credit position, spreads tightened 50bps Emerging Markets " " " n/a n/a High Yield (390) (140) 210 178% n/a Desk short credit, spreads tightened over 200bps. Additional writedowns on CAF portfolio.
Credit Products _{246\ 410 466 n/a nla
Securitzed Products Trading (1,466) (247) 172 493% n/a Although gross writedowns decreased quarter over quarter, hedge effectiveness decreased, resulting in larger net writedowns. Securitzed Products Origination (147) (60\ 41 144% n/a Securitized Products (1,612) (307) 213 425% nla
Real Estate (1,43S) (1,027) 487 40% n/a Desk took significant writedowns during the quarter Municipal Bonds 318 (241) g n/a n/a Strong client revenues-were augmented by gains on. widening of Muniffreasury spread. Energy Trading 154 52 16 193% n/a Strong results in Power and Gas sales and trading as business gains momentum FID Corporate (73 (146) (92) -50% -21%
Fixed Income Subtotal (3,154) (77) 1,519 n/a n/a FID Prime Services 276 360 157 -23% 75% Revenues down from record Ql, but Financing business still strong due to high li(juidity premiums in the market
I FID Including Prime Services (2,877) 283 1677 n/a nla Global Principal Strategies (160) (163) 109 -2% n/a Global Trading Strategies· Distressed (12) (82) 5 -86% n/a Direct Principal Investments - FID " " " n/a n/a Global Opportunities Group- FID - " - nla n/a
Private Equity· FID (149) (9) " n/a n/a Asset Management Principal - FID (312) (440) " -29% n/a FID Other 535 674 112 -21% 379% FID Attributable (0) (0) {_0 20% -03%
I Total Fixed Income Capit:I!Markets _ -
(2,975) 262 1,901 n/a n/a ·--~~ ------~-
LEHMAN BROTHERS 2

CO
NFID
ENTIA
L TREA
TMEN
T REQ
UESTED
BY
LEHM
AN
BR
OTH
ERS H
OLD
ING
S, INC
.
r m m >< ~ G) s 0 0 0 0'1 1\) ......
Equities Review (w/ Detail) I
Q2 '08 versus I Qz ·o8 I Qt'o8 I Qz •o1 I Qt'o8 Q2 •o1 Comments
EQUITIES
Execution Services Execution Services - Americas 331 401 233 -17% 42% Solid client flows were offset by lower trading results Execution Services - Europe 150 151 239 -1% -37% Weaker client flow and facilitation were offst;~ by stronger principal trading Execution Services'- Asia 47 104 54 -55% -13% Continued strong client flows were offset bylprincipal trading losses
Total Execution Services 528 657 525 -20% 1%
Convertibles (7) (4) 12 104% nla Difficult credit envirorunent resulted in trading losses in Europe and Asia Volatility (161) 267 435 n!a nla Difficult trading envirorunent and slowdown in Corporate Derivatives activity can be attribute to QoQ decline . Event Driven - - - n!a n!a Equity Strategies 53 14 140 285% -62% Underperformance in Americas was offset by strong results in Asia and record perfonnance in Europe Equities Corporate (76) (145) (22) -47% 248% Equity Division Subtotal 336 789 1,090 -57% -69% Equity Prime Services 390 271 371 44% 5% Outperformance driven by seasonally higher European activity
I Equity Including Prime Services 726 1,060 1,461 -31% -50% Global Principal Strategies - Equity 2 3 2 -41% -25% Globiil Trading Strategies - Equity (195) 417 112 n!a nla Direct Principal Investments - Equity 33 (5) 23 n!a 48% Global Opportunities Group - Equity 26 43 - -40% nla Private Equity - EQ 29 (2ll) 76 n!a -61% Asset Management Investments (151) (87) 49 73% nla Equities Odter 130 190 (31) -31% nla Equities Attributable 0 (0) (0) n/a n/a
I Total Equities Capital Markets 601 1,410 1,692 -57% -64% -·-
~-lHMAN BROTHERS ./
···"··,, 3 i
' I
_,....-.. \ )
I r.•'

CO
NFID
ENTIA
L TREA
TMEN
T REQ
UESTED
BY
LEHM
AN
BR
OTH
ERS H
OLD
ING
S, INC
.
r m m >< ~ G) s 0 0 0 (11 1\) co
'-.,_
. Capital Markets. Graphical Trends
~ _I; ' ' ~ . '~ .....
. . . .. .. . . . · · .. ;:;· : ::~·,,:":,,'::! ::,;·Jr~~c;l:tJJ~~Rm~:r(1Im),;:,Q.~~r:·t~:,r~Y~~§~gm~,~t::~~¥~~Yc~<lR~-~tli.t~l.g;Q~i(~}~<:i::~,Q~9~;;,~~~~\"t,: .;i,;.i.~_:;.;;,;~Li.2!:ii\i;~.;;;;~ 1 3,000 ,---------------------------------\
2,068 1 889 2,102 2,200 2 010 2 135 2,172 1,753 • 1,624 - • _·-- 1,902
1,500
(1,500) +-----------------------·--------1
FlO Revenue (mm's)
(3,000) +---------------,...-------------------'
(4,500) -'---------------'---------------------"-1'
;;;~i!.:~Q-Q.~1\~~~;[lj!,~:f~L~wi;;;~~t;;J;::;j~i~ir,;~~~\~iE 2,500 ~-------------------------------------------------------------~
EQ Reyenues (mm's) 2,000
1,250
01'04 01'05 01'06 01'07 01'08
LEHMAN BROTHERS 4

CO
NFID
ENTIA
L TREA
TMEN
T REQ
UESTED
BY
LEHM
AN
BR
OTH
ERS H
OLD
ING
S, INC
.
r m m >< ~ G) s 0 0 0 0'1 1\) CD
Significant Events
02 '2008 quarterly topics
Fixed Income
+ Strong client revenues continued the positive momentum from Q 1. Global1Credit
Products, Liquid Markets and Commodities were particularly strong.
+ Net write downs of($3.6bn) driven by market events. Hedge positions did not
translate into significant reductions in. gross write downs.
+ Significant losses on macro hedge positions in Rates on Euro Steepener I Long Delta and Credit on Short Credit and Basis
Equities
+ To be discussed at meeting
..... ~MAN BROTHERS .... \5 !
·'
I
~
!"'"""' )

CONFIDENTIAL TREATMENT REQUESTED BYLEHMAN BROTHERS HOLDINGS, INC.
LBEX-WGM 000530

CO
NFID
ENTIA
L TREA
TMEN
T REQ
UESTED
BY
LEHM
AN
BR
OTH
ERS H
OLD
ING
S, INC
.
r m m >< ~ G) s 0 0 0 (11 w ....Jo.
Q2'2008 Market Themes Fixed Income I + Federal Reserve Bank: Fed Funds rate was lowered to 2.00%, a (100) bps reduction in Q2, while the ECB and BOJ held their rates
steady at 4.00% and 0.50%. Meanwhile, Prime declined to 5% and 1 M~nth Libor decreased to 2.54%, down (62bps) over the
quarter.
- Treasury Spread between 2s and 1 Os tightened to 141 bps over the quarter. The 2 year note increased 1 03 bps while the 1 0 year note increased 55 bps during this period.
. I'
+ Commodity Prices:
- Oil prices'increased 25% to $127.35 per barrel on continued inflation concerns and worry of a slowdown in the US economy.
- Gold prices dropped (9%) over the quarter to close at $886.50 per ounce.
+ Dollar: The dollar weakened by (3%) versus the Euro. However, However the USD gained 2% vs the Yen and traded slightly up on
thePound. Year to date, the Euro has gained almost 18% on the Dollar, out pacing the Yen, up 9%, and the Pound, down (1 %).
+ Credit spreads: As concerns of the worst in the credit crisis seemed to subside with the demise of Bear Steams, credit market
spreads tightened over the quarter. High Yield spreads tightened by 1 72bps, Investment grade spreads tightened by 64bps, and Emerging Markets spreads tightened by 64bps.
Equities
+ Global Equity markets ended the quarter higher as decreased volatility and US FED easing pushed indices higher.
+ Major U.S. equity indices ended higher from year end, with the S&P 500 up 5%, the Dow Jones Industrial Average up 3% and the
NASDAQ up 11%. The VIX index decreased (33%) during the quarter while in Europe the VXN volatility index declined (27%) over the quarter.
+ The market rebound occurred across continents as Europe and Asian markets ended higher as well most likely caused by the
covering of short sales. The FTSE closed up 3% to 6,054 and the German DAX closed up 5% at 7,097. Asian markets closed higher,
with the Nikkei up 5% to 14,339 and the Hang Seng inching up 1% to 24,533.
T '"'\HMAN BROTHERS )
·.,)6 ,-----.._, )

CO
NFID
ENTIA
L TREA
TMEN
T REQ
UESTED
BY
LEHM
AN
BR
OTH
ERS H
OLD
ING
S, INC
.
r m m >< ~ G) s 0 0 0 0'1 w 1\)
~'{~·-..
};-.-.....-::::.:,~: \. , ·r~·
'
Market Data c;iJRiJfi!(.Marke~~ · R~rlorm,~.D.(;fiJ;Pf!Jf!:.j.:> · .:--:· "i,
Equities and Related Capital Markets ·· ·· · · ·· :~~ '1' ··· •'·'f. ·.:;! .·:··: ·· .. ,._.._,,:,
Indices 513012008 QIQ % II YIY% II 2129/2008 QIQ% II 11.'3012007 YIY% II 11/3012006 DJIA 12,638 3.0% - 3.4% Jlllilll:21illiil 12,266 -8.3% 13,372 9.4% ~ 12,222 S&P 500 1,400 5.2% ....... 0.0% - 1,331 -10.2% 1,481 5.7% -- 1,401 NASDAQ 2,523 11.1% --- 3.7% --- 2,271 ·14.6% 2,661 9.4% ..... 2,432 FTSE 6,054 2.9% -·- 0.1% ---- 5,884 ·8.5% 6,433 6.3%
-·~ 6,049
DAX 7,097 5.2% ·-=- 12.5% ...... 6,748 -14.3% 7,871 24.7% ~ 6,309 Nikkei 14,339 5.4% •..:- -11.9% - 13,603 -13.2% ,15,681 -3.6".4 - 16,274
128.644 Hang.Seng 24,533 0.8% ·-- 29.4% .... 24,332 -15.1% 61.1'/o _,,,.. 18,960 EuroTop 100 2,783 0.9% W.W -7.4% - 2,757 -14.1% 3,209 6.7% ll!llllttil!lll 3,007 MSCI Wortd 1,526 4.8% -- 4.8% ·-- 1,456 -9.6% 1,611 10.7% ,., .. 1,455
Volatility 5/30/2008 QIQ " fl. YIY% II 2129/2008 QIQ % II 11/30/2007 YIY% II 11/30/2006 VIX 17.83 -32.8% 63.4% ~ 26.54 16.0% ~ 22.87 109.6% ~ 10.91 VXN 20.85 -26.7% 26.1% --- 28.44 ..0.7% - 28.65 73.3% llli&Jm 16.53
PeerS tock Prices 5130/2008 QIQ % II YIY% II 2/29/2008 QIQ % II 11130/2007 Y/Y% II 11130/2006 LEH 36.81 -27.8% -50.0% 50.99 -18.6% -- 62.63 -15.0% 73.67 GS 176.41 4.0% -9.4% 169.63 -25.2% --- 226.64 16.3% 194.80 BSC 9.33 -88.3% -93.9% 79.86 -19.9% - 99.70 -34.6% 152.48 MS 44.23 5.0% -30.0% 42.12 -20.1% === 52.72 -16.6% 63.22 MER 43.92 -11.4% -49.8% 49.56 -17.3%
_.._ 59.94 -31.4% 87.43
Fixed Income, Currencies and Commodities :· · ·'c:·eo·• ·'> "' ....
Money Rates 513012008 QIQ bps 11 Y/Ybpsll 2/29/2008 Q/Q bps t. 11130/2007 YIY bps II 11/30/2006 Federal Funds- Target 2.00 (100) (325) 3.00 (150) 4.50 (75) 5.25 Libor Ovemight 2.54 (62) (279) 3.16 (155) 4.72 (61) 5.33 2~year Treasury Note 2.65 103 (197) 1.62 {136} 3.00 (161) 4.61 10-year Treasury Bond 4.06 55 (40) 3.51 (43) ·3.94 (52} 4.46 30-year Treasury Bond 4.72 31 15 4.40 2 4.38 (18} 4.56 Euro 1 ()..year Benchmark 4.41 51 71 3.89 (24} 4.13 43 3.70 UK 1 0-year Gilt 4.99 52 47 4.47 (17} 4.64 12 4.51 Japan 10-year JGB#1B2 1.76 39 10 1.37 (11} 1.48 (18} 1.66
IG on the run (Markll) 101.48 (54} 68 lilllllt1111111 165.50 89 ~ 76.42 42 Mr!l!!lil!l 33.97 EM on the run (Markil) 207.05 (44} 83 -- 250.76 68 -illlltll 182.74 59 -:a~~ 123.78 HY on the run (Markit) 568.27 (172} 293
_ .. 740.46 248 ...... 492.96 217 .... 275.52
Currencies (vs USD) 5130/2008 QIQ % II YIY% II 2129/2008 QIQ % II 11/30/2007 YIY% II 11130/2006 Pound£ 1.9822 -0.3% - 0.8% .. l .. 1.9891 -3.3% -mr 2.0564 4.6% ~ 1.9661 Euro€ 1.5554 2.5% -- 17.5% ~~- 1.5180 3.7% -- 1.4633 10.5% .... 1.3243 Yen¥ 105.51 1.7"/o -- ..S.9% - 103.74 ·6.7% -- . 111.23 --3.9% - 115.80
Commodities 5130/2008 QIQ % II YIY% II 2129/2008 QIQ % II 11130/2007 Y/Y% II 11130/2006 Gold· 886.50 ·9.0%
~--J&.so;. lii1ilDIIII 974.17 24.3% lfllfilnilllll 783.75 20.9'/o ~ 648.00
Oil 127.35 25.0% ..... 101.7'Y. -- 101.84 14.8% liiEW 88.71 40.5% llillllt :Rill 63.13
Prime Brokerage Related
DJ Hedge Fund Indices 513012008 QIQ % II YIY% 11 2129/2008 QIQ % II 11/30/2007 Y/Y% II 11130/2006 Convertible Arb 126.91 ·5.i"'/o 134.59 ..0.6% 135.36 3.8% l&'ltDl1ill 130.42 Merger Arb 146.21 1.0% 144.74 0.1% 144.63 17.W/o lltilllllk:J!I!IIIII 123.01 Event Driven 153.91 4.1% 147.80 -1.5% 150.07 7.1% -L11!1a' 140.09 Distressed Sec's 169.84 0.3% 169.33 -4.8% 1n.80 3.2% --- 172.25 Equity Market Neutral 109.92 ..0.1% 110.00 0.5% 109.49 1.8% -- 107.57 Equity Long/Short 140.02 7.1% 130.73 -3.3% 135.14 18.6"/o llililll::tlliliill 113.92
LEHMAN BROTHERS 7
1~ .II
: f
I

CONFIDENTIAL TREATMENT REQUESTED BYLEHMAN BROTHERS HOLDINGS, INC.
LBEX-WGM 000533

CONFIDENTIAL TREATMENT REQUESTED BYLEHMAN BROTHERS HOLDINGS, INC.
e--\t
LBEX-WGM 000534

CO
NFID
ENTIA
L TREA
TMEN
T REQ
UESTED
BY
LEHM
AN
BR
OTH
ERS H
OLD
ING
S, INC
.
r m m >< I
~ s: 0 0 0 C1'l w C1'l
·Executive Summary. (in millio11s) ·o5t31/08 02/29/08
Lehman Brothers Holdin2s Inc. {LBHD Total Allowable Capital 34,865 35,139
Total Market Risk Allowance 7,286 11,874 * Total Operational Risk Allowance 2,574 2,574
Total Credit Risk Allowance '5,953 8,639 * .,
Total Other Assets Risk Allowance '1,513 1,218 *
Total Risk Allowance ..
17,326 24,305
Total Risk Weighted Assets 216,575 303,813
Total Rlsk Based Capitat'Rado 16.1% 11.6%
CSE Capital Ratio 201.2% 144.6%
• Note: February29 data has been reclassified retroactivdy forcompam.tivepurposes to represent Principal investrnmts
(previously classified in bod1 Credit Risk Allowance and Oth~r Assets Risk Allowance as Private Equity and
Investments in Partnerships and JVs, respt£tively) in Market Risk Allowance.
Variance
(274).
(3,050)
10
(2,686)
295
(5,441)
(87,238}''
45%
56.6%
* The decrease in Allowable Capital is plimarily due to the f1m1's losses in Q2, and the deduction of gains arising from the application
offair value accounting ofd!e firm's debt liabilities which were attnbutable to changes in d!e finn's own credit spread.
This decrease was mostly offset by the issuance of$4 billion of additional non-cumulative perpeb.lal securities in April.
* Market Risk allowance decreased due to the implementation ofd!e Holistic Trading book review, which impacted
various Market risk categories (Scenario/stress, Specific risk addons (JTDIJTG) and Principal investments}.
* Credit Risk allowance decreased due to the implementation of the Holistic Trading book review, which also impacted Retained
interests (now incorporated as part of JTG specific risk addon), and d!e reclassification of certain eligible corporate loans as Trading book
In addition, further decreases were due to d!e sale of certain Real estate assets dwing the quarter, and reduction in derivatives exposures.
* Od1er Assas charge increased primarily due to lluctuations in the customer fails.
JERMAN BROTHERS ) I
--~--·-~
'.
.(~1
)

CO
NFID
ENTIA
L TREA
TMEN
T REQ
UESTED
BY
LEHM
AN
BR
OTH
ERS H
OLD
ING
S, INC
.
r m m >< ~ G) s 0 0 0 0'1 w en
p~
c "'
Executive Summary
(in milli.o ns)
Lehman Brothers Inc. ~LBI) Gross Regulatory Capital Deductions Excess Capital
Debt to Debt/Equity Ratio
·~ ]A
continued
05/31108
11,480
8,381 3,099
53%
02/29/08 Variance
10,836 644 8,300
I, 81
2,536 563 48% 5%
* Gross Capital increased $644 mil mainly due to $900 mil net subordinated debt issuance ($1.2 bil subordinatecl
debt revolver drawdown in 3/08 less $300 mil4/08 maturing external tranche), $450 mil LBI Equity infusion from LBill in 3/08 to fund subsidiary negative equity and Consolidated LBI quarterly P&L of $687 millos.s. The $687 mil
loss was comprised of a subsidiary's loss of $843 mil offset by gains from the parent company of $156 mil. The sub losses can be attributed to poor performance in hedging activities,mostly in the debt markets and compensation expense true-up in subs to actual economics.
* Non Allowable Assets decreased $338 mil, $843 mil due to subsidiary losses, $500 mil due to sub dividends, offset by $950 mil increase in investments in subs. Securities Not Readily Marketable charges decreased $241 mil
due to retirement of Equity Linked Notes. Finance Charges increased $310 mil, primarily due to increase charges on Reverse Repo deficits with Central Banks resulting from higher interest rates. VaR charges increased $687 mil due to increased
volatility in fixed income, primarily in securitized pro ducts. This was offset by reductions of $202 mil in the Reg-Y add on charge duy to decreased levels ofNon-lnvestment grade Inventory (i.e. Reduction in balance sheet leverage) and $111 mil decrease in Scenario Stress charge from reduced Risk Arb activity. Credit Risk increased $119 mil mainly related to retained
interests on residential mortgages and increase in counterparty credit risk charges.
LEHMAN BROTHERS 2
""\
I

CO
NFID
ENTIA
L TREA
TMEN
T REQ
UESTED
BY
LEHM
AN
BR
OTH
ERS H
OLD
ING
S, INC
.
r m m >< ~ G) s 0 0 0 0'1 w ......
Executive Summary continued
(in nrillio11s) 05/31/08 02/29/08 Variance
Lelunan Brothers International Euro~e (LBIE} Total Financial Resources 16,313 16,429 I' (116) Deductions 12,269 13,025 (756) Excess Capital 4,044 _1404 640
Capital Ratio 133% 126% 7% Minimum Regulatory Ratio 110% 110%
* Tier 3 decrease due to repayment of $300 mil subordinated debt offset by a reduction in deposits with ABS Bank of China of$150 mil. In addition, interest rate issuer risk has decreased during the period .
. * ·Mainly due to a reduction in the position risk requirement resulting from a decline in debt securitisation charges
as the securitisation business moved out ofLBIE. In addition, ~xposure charges related to foreign excharige risk declined for the period due to a reduction in AED and KRW exposures. Also, concentration risk charges against
Lehman affiliates has decreased due to a decrease in exposures on credit derivatives and rates products.
--JERMAN BROTHERS ; 3
I
,........._,
)

CO
NFID
ENTIA
L TREA
TMEN
T REQ
UESTED
BY
LEHM
AN
BR
OTH
ERS H
OLD
ING
S, INC
.
r m m >< I
~ s 0 0 0 0'1 w co
;-~~ / . }'
' '
Executive Summary (ill millio 11s)
Lehman Brothers Japan (LBJ) I KK Total Net Capital Deductions Excess Capital
Actual Capital Ratio Minimum Regulatory Ratio
: /"~-..",
continued 05/31/08
1,179 868 -311 --
272% 200%
- - --- - - - - - - - - -- -, 02/29/08 Variance
1,423 (244) 870 (2) 553 I, (242)
327% -55% 200% 0%
* Total Net Capital decreased primarily due to the decrease in Transfer Pricing revenue especially in Equity Derivatives and IBD.
Neuberger Berman LLC (NBLLq Gross Regulatory Capital 552 519 33 Deductions 2% 315 (19) Excess Capital 256 204 52
* Accumulated 3 months P&L of$33 mil.
* Decrease of $26 mil related to non allowable advisory fees receivable.
Lehman Brothers OTC Derivatives, Inc. (LOTC) Gross Regulatory Capital 437 437 Deductions 156 154 2 Excess Capital 281 283 (2)
LEHMAN BROTHERS 4

CO
NFID
ENTIA
L TREA
TMEN
T REQ
UESTED
BY
LEHM
AN
BR
OTH
ERS H
OLD
ING
S, INC
.
Lehman Brothers Holdings (LBHI) - - - -.
(ill millions) 05/3lf08 02/29/08 Variance
Lehman Brothers Holdin2s Inc. (LBHD Total Allowable Capital 34,865 35,139 (274)
Market Risk Allowance VaR Based 2,458 2,408 50 Scenario I Stress 226. 327 (101) I'
Specific Risk Add-on 2,561 5,560 (2,999) Principal Investments 2,041 3,579 (1,538)
Total Market Risk Allowance .. 7,286 11,874 (3,050)
Total Operational Risk Allowance 2,574 2,574 0
Credit Risk Allowance Counterparty Credit Risk 2,722 2,833 (111) Real Estate Investments. and Loans 2,551 2,694 (143) Municipal Real Estate & Loans 2 19 (17) Mortgage Warehouse & Principal Finance 329 264 65 Corporate Loans & Securities 326 743 (417)
Insurance Entities 23 24 (1)
Retained Interests 0 2,062 (2,062)
Total Credit Risk Allowance 5,953 8,639 (2,686)
Total Other Assets Risk Allowance 1,513 1,218 295
Total Risk Allowance 17,326 24,305 (5,441)
Total Risk Weighted Assets 216,575 303,813 (87,238) r m m Total Risk Based Capital Ratio • 16.1% 11.6% 4.5% >< I
:E CSE Capital Ratio 201.2% 144.6% 56.6% G) s 0 0 0 (11 w )HMAN BROTHERS CD .······ \ 5 ,,..-.,,
} '.'

CO
NFID
ENTIA
L TREA
TMEN
T REQ
UESTED
BY
LEHM
AN
BR
OTH
ERS H
OLD
ING
S, INC
.
r m m >< ~ G) s 0 0 0 0'1 ~ 0
;:~ ' ~~
Lehman Brothers Inc. {ill milfiOIIS)
Gross Regulatory Capital: Stockholders Equity Subordinated Debt Total
Deductions and /or Charges: Non-allowable Assets Securities Not Readily Marketable Conunodity Charges Finance Charges Marl<et Rei a ted & Opera tiona! Charges Total
Tentative N,et Capital
Market & Credit Risk: VaRBased Scenario Stress
·Reg. Y Add-0 n Credit Counterparty Risk Total
Net Capital
Minimum Capital Requirement
Excess Net Capital
LEHMAN BROTHERS
~ ''--<:"7~ . ·~
,.
(LBI) 05/31/08
4,583 6,906
11,489
2,006 735 153 603 332
3,829
7,660
2,560 133 732 497
3,922
3,739
728
_3,!111
6
-~~
- -- -- -------- --. 02/29/08 Variance
4,830 (247) 6,006 900
10,836 653 I'
2,683 (677) 891 (156) 156 (3) 148 455 420 (88)
4,298 (469)
6,538 1,122
1,872 688 175 (42) 732 (0) 470 27
__ 3,249 673
3,289 450
753 -25
2,536 475

CO
NFID
ENTIA
L TREA
TMEN
T REQ
UESTED
BY
LEHM
AN
BR
OTH
ERS H
OLD
ING
S, INC
.
r m m >< ~ G) s 0 0 0 0'1 ~ ....Jo.
Lehman Brothers International Europe (LBIE) (ill milliolls) 05/31108
Capital: Tier I 6,765 Tier2 3,382 Deductions form Tier 1/2 (180) Tier3 7,193 Deductions form Total Capital (847) Total Financial Resources 16,313
Risk Haircuts: Position Risk Requirement 3,171 Foreign Exchange Risk Requirement 135 Credit Risk 66 Counterparty Risk Requirement 2,021 Large Exposures Requirement 738 Basel IT Model Reserve and Pillar 2 Add-on 570 Operational Risk 327 Basel I Floor 5,241 Total Financial Resources Requirement 12,269
Excess Net Capital 4,044
Actual Capital Ratio 133% Minimum Ratio 110%
.... )HMAN BROTHERS / .
···"··'. 7 )
02/29/08
6,765 3,382 (171)
7,460 (1 ,007) 16,429
3,736 207 136
1,931 594 610 327
5,484 13,025
3,404
126% 110%
Variance
(9) (267)
I' 160 __ (116)
(565) (72) (70) 90
144 (40)
(243) (756)
640
7%
,,......... ' I
I

CO
NFID
ENTIA
L TREA
TMEN
T REQ
UESTED
BY
LEHM
AN
BR
OTH
ERS H
OLD
ING
S, INC
.
r m m >< ~ G) s 0 0 0 0'1 ~ 1\)
~l::r. .... ' 1 ~~
Lehman Brothers Japan (LBJ I KK)
(in millio11s)
Capital: Primary Capital Utilized Supplemental Capital Non-allowable Assets Total Net Capital
Risk Haircuts: Ma1ketRisk Credit Risk Basic Risk Total Risk Haircuts
Net Capital Requirement at 200% : BOJ, JGBCC warning level Excess Net Capital
Net Capital Requirement at 140% : FSA early warning level Excess Net Capital
Actual Capital Ratio Minimum Ratio: BOJ (Bank of Japan) warning level Minimum Ratio: FSA early warning level
LEHMAN BROTHERS
05/31/08
993 799
(613) 1,179
96 121 217 434 -868 311
608 571
272% 200% 140%
8
I~ .1~
I 02/29/08 Variance
1,195 (202) 778 21 (54~) (64)
1,423 (244)
97 {l)
117 4 222 (5) 435 (1)
870 (2) 553 (242)
609 (2) 814 (242)
327% -55% 200% 0% 140% 0%

CONFIDENTIAL TREATMENT REQUESTED BYLEHMAN BROTHERS HOLDINGS, INC.
_.,.--·-(
LBEX-WGM 000543

CONFIDENTIAL TREATMENT REQUESTED BYLEHMAN BROTHERS HOLDINGS, INC.
f
~-'.
((!.
L.EHKAN BROTHERS L.IQUI DITY EXECUTIVE SUMMARY
$billions 10-Sep
L.BHI Uquidity Pool 37.6
CP ou tstanding U.S. 2.1 Europe 0.4
Total 2.4
L.Bil5c3 Lockup (Weekly-Excluding PAIB) 3.7 LBIE Prime Broker Customer Free Credit 0.7
Repo book (Excl. Tsy, Agcy, & Agcy MBS) Asia 1.6 Europe 45.9 u.s. 39.5
Total 87.0
%0/N 42% %<=1 wk 10% %> 1wk 48%
ST Debt maturities (incl. CP and current portion of L. TD) Next day <=I wk 1wk-lmth > lmth
Total
Available Undrawn Committed Facilities U.S. Europe
0.2 2.2 2.7
21.5
26.5
2.0 2.5
9-Sep
40.6
3.2 0.7
3.9
3.7 0.8
1.6 46.1 47.7
95.4
44% 9%
47%
2.0 2.3 1.8
22.1
28.2
2.0 2.5
8-Sep
41.7
3.6 0.8
4.4
3.7 1.0
1.6 45.3 48.2
95.2
43% 11% 46%
2.1 2) 1.8
22.3
28.6
2.0 2.5
5-Sep
41.5
2.8 0.9
3.8
5.0 1.0
1.6 46.5 48.3
96.5
44% 10% 46%
1.9 2.4 1.2
22.5
28.1
2.0 2.5
4-Sep
41.9
2.9 0.9
3.8
5.0 1.0
1.6 46.4 48.0
96.1
44% 10% 46%
1.9 0.7 3.0
22.5
28.1
2.0 2.5
CONFIDENTIAL TREATMENT REQUESTED
NOT FOR DISTRIBUTION 9/11/2008, 10:45 AM
Changevs. 9-Sep 8-Sep
(3.0) (4.1)
( 1.1) (1.5) (0.4) (0.5)
(1.5) (2.0)
(0.1) (0.4)
0.1 0.0 (0.2) 0.5 (8.3) (8.7)
(8.4) (8.2)
( 1.8)pp (0.7)pp +0.7pp (1.7)pp +l.lpp +2.4pp
(1.9) (2.<i) (0.1) (0.1) 0.9 0.9
(0.6) (0.8)
( 1.7) (2.1)
LBEX-WGM 000544

CO
NFID
ENTIA
L TREA
TMEN
T REQ
UESTED
BY
LEHM
AN
BR
OTH
ERS H
OLD
ING
S, INC
.
r m m >< ~ G) s 0 0 0 0'1 ~ 0'1
I
!
.·~·
Global Rep .• ty Schedule
as of September I Oth, 2008 By Collateral Allocation
~ . ···-· -- ... ¥•-·• -
Region Collateral Allocated Summary ASIA EMG
EMGTotal EQUITIES
EQUITIES Total ASIA Total EUROPE ASSET BACKS - INVESTMENT GRADE
ASSET BACKS- INVESTMENT GRADE Total ASSET BACKS -NON-INVESTMENT GRADE
ASSET BACKS -NON-INVESTMENT GRADE Total Cl -INVESTMENT GRADE CONVERTIBLES
Cl -INVESTMENT GRADE CONVERTIBLES Total C2 -NON-INVESTMENT GRADE CONVERTIBLES
C2- NON-INVESTMENT GRADE CONVERTIBLES Total CORPORA TES - INVESTMENT GRADE
/~)
ICounterparty Group DRESDNER
DRESDNER JP MORGAN CHASE MlTSUBISHI OSAKA SECURITIES FINANCE THE TOKYO TANSHI CO.,LTD.
BANK AUSTRIA BANKHAUS CAL YON CITIBANK DEK.ABANK ECB KBC RZB STATE STREET
BANKHAUS CITIBANK DEKABANK
BANK AUSTRIA BANKHAUS DEKABANK DEXIA DRESDNER DZBANK EXXON MOBIL FINANCIAL SERVICES BV USD KBC NATIXIS RBC STATE STREET
BANK AUSTRIA BANKHAUS DEK.ABANK DEXIA DRESDNER DZBANK KBC NATJXIS RBC RZB STATE STREET
BANK AUSTRIA BANKHAUS CACEIS BANK CAL YON CITIBANK
Confidential Treatment Requested
-~ '
11 Sep 12 Scp 15 Sep 16 Sep 17 Sep 18 Sep to 09 Dec >= 10 Dec Grand Total 0.0 0.0 0.0 0.0 0.3 0.3
0.2 0.2 0.3 0.3
0.7 0.7 0.2 0.2
0.5 0.5 0.7 1.6 0.5 0.5 0.7 1.6
I 0.0 0.0 3.2 0.0 3.2
0.0 0.0 0.3 0.3 0.0 0.0 0.0
10.9 10.9 0.0 0.0 0.0 0.0 0.0 0.0 0.0 0.0 0.0 3.2 0.0 0.0 11.2 0.0 14.4 0.0 0.0
0.0 0.0 0.0 0.0 0.0
0.0 0.0 0.0 0.0 0.0 0.0.
0.0 0.0 0.0 0.0 0.0 0.0 0.0 0.0 0.0 0,0 0.0
0.0 0.0 0.0 0.0
0.0 0.0 0.1 0.1 0.1
0.0 0.0 0.0 0.0 0.0 0.1 0.1 0.3
0.0 0.0 0.0 0.0 0.0 0.1
0.0 0.0 0.0 0.0 0.0 0.1 0.1 0.1 0.1
0.2 0.0 0.2 0.1 0.1 I
0.0 0.0 0.0 0.0 0.1 0.1 0.0 0.2.
0.0 0.0: 0.3 0.1 0.0 0.0 0.3 0.2 0.8
0.3 0.3 i
0.2 0.0 0.1 0.3 0.0 0.0 0.1 0.1
0.2 0.2 1.1 1.1

CO
NFID
ENTIA
L TREA
TMEN
T REQ
UESTED
BY
LEHM
AN
BR
OTH
ERS H
OLD
ING
S, INC
.
r m m >< ~ G) s 0 0 0 0'1 ~ en
-~ .<~\ r::R-e-gi-on---,,·· ·.·· .era! Allocated Summary !Counterparty Group ""' :'---------.-~--:-::-~--,--::--.,....,.-,:--....,-:c-::-----,,-:-:o--to-:Oc:-9-::D:-e-c->-=-,1:-:-0
DEKABANK 0.4 0.0
CORPORA TES - INVESTMENT GRADE Total CORPORA TES - NON-INVESTMENT GRADE
CORPORA TES- NON-INVESTMENT GRADE Total EMG
EMGTotal EQUITIES
DEXIA 1.0
DRESDNER Q.l Q,Q
DZBANK 0.0 EXXONMOBIL FINANCIAL SERVICES BY USD KBC LCH RBC ROYAL BANK OF SCOTLAND PLC STATE STREET
BANK AUSTRIA BANKHAUS CAL YON CJTJBANK
DANMARKS NATIONALBANK DEKABANK DEXIA DRESDNER DZBANK JP MORGAN CHASE
KBC NAT!XIS RBC ROYAL BANK OF SCOTLAND PLC
RZB STATE STREET
ABNAMRO BANK AUSTRIA
BANKHAUS CACEIS BANK CAL YON CITIBANK DEKABANK
DEXIA DRESDNER DZBANK EXXONMOBIL FINANCIAL SERVICES BY USD HSBC KBC LCH NATIXIS NOMURA RBC ROYAL BANK OF SCOTLAND PLC
RZB STATE STREET
BANKHAUS CAL YON DEKABANK DRESDNER DZBANK EXXONMOBIL FINANCIAL SERVICES BY USD
FORTIS
HSBC
ConfidentiP.I Treatment Requested
0.3 0.2 0.0
0.4
0.1
0.1
0.5 0.2 0.4 0.1 0.3 1.2 0.3 0.8 0.2 0.5
_0.3
0.0
0.0 0.0
0.0 0.0 0.3 0.7 0.0
0.0
I'
0,0
0.0
0.0 0.0 0.1
3.0 0.:1
0.0 0.0
0.0 0.0
0.0 0.0
0.0 0.0
0.2
0.0 0.1 0.1
0.1
0.0
0.0
0.0 0.1 0.0
0.1 . 0.1 0.0 0.0
0.1 0.0 0.0 0.0 0.0 0.4 0.0 0.0 0. I 3.8 0.8 0.1 0.2 0.3 0.1 0.6 0.3
0.5 0.2 0.1
0.2
0.1 0.2
0.1
0.8 0.1 0.1 4.0 0.0 0.2 0.0 0.1
0.1 0.5 0.1 0.3
0.0
0.0 0.1
0.0 1.4
0.1
0.0 0.3 0.4 0.3
0.1 0.0
0.3
0.0
0.1 0.4 0.4
0.0 2.5
1.2
0.4
0.5 0.8
0.2
0.4
0.1
0.0
0.0 0.0
0.2
0.2
0.0
0.2
0.0
0.4
0.8 1.2
0.1 0.5
---,··
.nd Total
0.4 1.0
0.1 0.0
0.1 0.4 0.4 1.5 0.1 1.5 7.4 o.o. 0.7 0.0 0.1 0.0 0.2 0.5 ·o.1 0.3'
0.0 0.1 0.0 0.0 0.1 0.0 0.3 2.4 0.0 o.f 3.5 0.1 0.0 0.3
0.5 0.3 0.4 0.0 0.0 0.5 0.1 0.1 0.0 0.2 0.8 0.5 0.0 0.7 8.3 1.5 0.1 2.2
0.5 0.4 0.2 0.5
1.7
2

CO
NFID
ENTIA
L TREA
TMEN
T REQ
UESTED
BY
LEHM
AN
BR
OTH
ERS H
OLD
ING
S, INC
.
r m m >< ~ G) s 0 0 0 0'1 ~ ......
~ __.c"".-.,
Region .era! Allocated Summary
EQUITIES Total MONEY MARKETS
MONEY MARKETS Total PRIVATE LABELS - HIGH YIELD PRIVATE LABELS - HIGH YIELD Total PRIVATE LABELS - INVESTMENT GRADE
PRIVATE LABELS - INVESTMENT GRADE Total EUROPE Total u.s. ASSET BACKS - INVESTMENT GRADE
ASSET BACKS - INVESTMENT GRADE Total ASSET BACKS - NON-INVESTMENT GRADE .
ASSET BACKS- NON-INVESTMENT GRADE Total C I - INVESTMENT GRADE CONVERTIBLES Cl -INVESTMENT GRADE CONVERTIBLES Total C2 -NON-INVESTMENT GRADE CONVERTIBLES C2 - NON-INVESTMENT GRADE CONVERTIBLES Total CORPORATES -INVESTMENT GRADE
;~ Counterparty Group HYPO VEREINSBANK KBC
NATIXIS NOMURA RBC RZB SOCIETE GENERALE WESTLB
BANKHAUS DRESDNER KBC STATE STREET
IBANKHAUS.
BANKHAUS CITIBANK
BONY/MELLON FEDERAL RESERVE FEDERATED FIDELITY .IP MORGAN CHASE KEYBANK MET WEST STATE STREET
BANKHAUS BGI BONY/MELLON FEDERATED FIDELITY FIELD STREET MASTER FUND, LTD. KEY BANK STATE STREET
!STATE STREET
!STATE STREET
BONY/MELLON CONSORCIO CSFB DWIGHT A.M. FEDERATED FIDELITY FROST BANK GOLDMAN SACHS & CO KEY BANK MET WEST METLIFE NORTHERN RACERS STATE STREET TELEMEX
Confidential Treatment Requested
··~ ll Sep 12 Sep 15 Sep 16 Sep 17 Sep 18 Sep to 09 Dec >= 10 L uuil Total
0.3 0.3 0.1 0.2 0.3
0.1 0.1 0.2. 0.1 0.5 0.8
0.2 1.8 1.2 3.1 0.1 0.1 0.1 0.3
0.2 0.2 0.0 0.0 1.7 0.& 0.4 0.3 0.2 5.6 3.2 12.1 0.0 0.0
0.0 0.0 0.1 0.1
0.0 0.0 0.1 0.0 0.0 0.1 0.0 I' 0.0 0.0 0.0 0.0 0.0
0.0 0.0 0.0 0.0 0.0
11.1 2.1 1.3 0.7 0.8 25.2 4.7 45.9 0.2 0.4 0.6
0.5 0.5 0.1 0.1
0.1 0.2 0.3 0.2 0.2
0.0 0.0 0.0 0.0 0.8 0.8 1.2 0.1 .o.o 0.2 0.9 2.5
0.2 0.2 0.0 0.0
0.1 0.1 0.4
0.41 0.4 0.3 0.7 0.0 0.0
0.0 0.0 I
0.0 0.0 0.4 0.2 0.4 0.0 0.3 0.1 1.4 0.2 0.2 0.4 0.2 0.2 0.4 0.3 0.1 0.3 0.3 0.1 0.3
0.0 ° 0.0 0.0 0.0
0.3 0.3 0.6 0.6
0.0 0.0 0.0 0.0
0.2 0.2 0.0 0.0
0.1 0.1 0.4 0.4
0.0 0.0 2.1 2.1
0.0 0.0 1.9 0.2 2.1
o .. o 0.0
3

CO
NFID
ENTIA
L TREA
TMEN
T REQ
UESTED
BY
LEHM
AN
BR
OTH
ERS H
OLD
ING
S, INC
.
r m m >< ~ G) s 0 0 0 0'1 ~ co
,. ~------,
Re!!ion
~ ... , ,.-,---
_,eral Allocated Summary
CORPORATES- INVESTMENT GRADE Total
CORPORA TES -NON-INVESTMENT GRADE
CORPORA TES - NON-INVESTMENT GRADE Total EQUITIES
EQUITIES Total MONEY MARKETS
MONEY MARKETS Total MUNI
MUNITotal PRIVATE LABELS- HIGH YIELD
PRIVATE LABELS- HIGH YIELD Total PRIVATE LABELS - INVESTMENT GRADE
1PRIY ATE LABELS - INVESTMENT GRADE Total WHOLELOAN RESIDENTIAL
""~'\ Counterparty Group TENSOR TRIARA.COM UBO('
BANKHAUS BGI FEDERATED FENWAY FUNDING LLC FIDELITY GOLDMAN SACHS & CO MANULIFE FINANCIAL NORTHERN STATE STREET
BANK OF TOKYO BGI DRESDNER FENWAY FUNDING LLC FIDELITY GREAT WEST LIFE NORTHERN SKANDINAVISKA ENSKlLDA BANKEN CORPORATION STATE STREET
BONY/MELLON CSFB DRESDNER NORTHERN NOR WEST STATE STREET
DRESDNER FORTIS STATE STREET
BONY/MELLON FEDERAL RESERVE FEDERATED FIDELITY FIELD STREET MASTER FUND, LTD. NORTHERN ROWAN STATE STREET
BANKHAUS BONY/MELLON FEDERAL RESERVE FEDERATED FIDELITY KEY BANK STATE STREET
DANSKEBANK GREAT WEST LIFE ROWAN STATE STREET SWEDBANK
Confidential Treatment Requested
-s~. II Sep 12 Sep IS Sep 16 Sep 17 Sep 18 Septo09 Dec >= 10 l '.d Total ---
0.0 0.0 0.0 0.0
0.1 0.1
4.8 0.1 0.0 0.2 0.9 5.9 0.1 0.1
0.1 0.1 0.0 0.0
0.2 0.2 0.0 0.0
0.2 0.2 0.0 0.0 0.2 0.2 1.9 0.0 2.0 2.4 OJ 0.0 0.2 0.0 2.7 0.6 I' 0.6 0.2 0.8 1.0 0.3 0.5 0.5 1.3
0.1 0.1 1.7 1.7
0.0 0.0 1.3 1.3 0.5 0.5 0.1 1.2 1.3 4.6 0.0 0.5 0.9 1.7 7.8 3.0 3.0 0.1 0.1 1.3 1.3 1.0 1.0 0.2 0.::!
1.0 1.0 5.6 1.0 6.6 0.9 0.9 0.5 0.5 1.7 0.5 2.2 3.0 0.5 3.5 I
0.0 1.0 1.0 0.0 0.0
0.0 0.0 0.3 0.3
0.0 0.0 0.0 0.0
0.0 0.0 0.3 0.3 0.4 0.3 0.0 1.0 1.7
1.0 1.0 0.3 0.2 0.5
2.4 2.4 0.0 0.0
0.1 0.0 0.1 0.0 0.0
2.0 2.0 2.4 0.1 0.0 1.0 2.6 6.1
0.3 0.3 0.0 0.0
0.0 0.0 0.2 0.2
0.1 0.1
4

CO
NFID
ENTIA
L TREA
TMEN
T REQ
UESTED
BY
LEHM
AN
BR
OTH
ERS H
OLD
ING
S, INC
.
r m m >< ~ G) s 0 0 0 0'1 ~ CD
Reeion
U.S. Total
Gmna TOIUI
~~. /~\
.d1eral Allocated Summarr lcounter~ar~ Grou~ I WHOLELOAN RESIDENTIAL Total
Confidential Treatment RequP.sted
-~
11 Sep 12 Sep 15 Sep 16 Sep 17 Sep 18 Sep to 09 Dec >= 101 · .JTotal 0.0 0.1 0.) I 0.5
25.2 0.4 1.0 0.2 2.0 7.4 3.3 I 39.5 36.8 2.5 2.3 0.9 2.8 33. I 8.7 I 87.0
I'
5

CONFIDENTIAL TREATMENT REQUESTED BYLEHMAN BROTHERS HOLDINGS, INC.
Global Repo Maturity Schedule as of Sept:ember lOth, 2008 By Collat:eral Allocation
V ..
--znc1pa in ns $8 ,
-Ounteroarty Group ABNAMRO BANK AUSTRIA BANK OF TOKYO BANKHAUS BGI BONY/MELLON CACEIS BANK CAL YON CITIBANK CONSORCIO CSFB DANMARKS NA TIONALBANK DANSKE BANK DEKABANK DEXIA --DRESDNER DWIGHT A.M. DZBANK ECB EXXONMOBIL FINANCIAL SERVICES BV USD FEDERAL RESERVE FEDERATED FENW A Y FUNDING LLC FIDELITY FIELD STREET MASTER FUND, LTD.
/ - l:'ORTIS
((; 'OSTBANK \ JLDMA.N SACHS & CO
1 GREAT \-VEST LIFE HSBC HYPO VEREINSBANK · JP MORGAN CHASE KBC KEYBANK LCH MANULIFE FINANCIAL MET WEST METLIFE MITSUBI .SHI NATIXIS NOMURA NORTHERN NOR WEST OSAKA SECURITIES FINANCE RACERS RBC ROWAN ROYAL BANK OF SCOTLAND PLC RZB SKANDINAVISKA ENSKILDA BANK EN CORPORATION SOCIETE GENERALE STATE STREET SWEDBA.NK TELEME.X
..,NSOR !
C:: TOK. YO TANSHI CO.,LTD, \ · , rdARA.COM UBOC WESTL~
Grand Tot.al
I I Sep 12 Sep 15 Seo 16 Seo I 7 Sep 18 Sep to 09 Dec >= I 0 Dec Grand Total 0.0 0.0
0.4 0.4 0.6 0.6 7.1 0.8 1.0 0.2 1.5 10.6 0.2 0.8 1.0 3.5 1.6 5.1 0.0 0.0 0.1 0.1 0.1 0.3 0.4 0.0 1.9 1.9
0.0 0.0 0.4 0.4 0.0 0.0
0.3 0.3 0.6 0.4 2.1 0.2 3.3
1.8 1.8 2.6 0.3 0.5 0.6 1.2 5.1
0.6 0.6 0.9 0.9
10.9 10.9 0.2 0.2
2.9 2.9 0.6 0.6
0.2 0.2 1.7 1.0 0.5 3.2 0.0 0.0 0.5 0.5 1.0
0.2 0.2 0.2 0.2
0.1 0.1 0.6 0.3 0.1 1.J 2.1
0.3 0.3 0.4 0.4 0.8 0.4 1.2
0.1 0.1 0.3 0.1 0.2 0.5 0.0 0.0 0.4 0.4
0.0 0.0 0.3 0.3
0.3 0.3 0.2 0.2 0.6 1.0
4.5 4.5 0.2 0.2
0.7 0.7 0.0 0.0
0.4 0.2 3.1 1.9 5.6 0.0 0.0 0.0
0.1 0.0 0.5 0.6 0.2 0.2 0.1 0.5 0.5 0.5
0.2 0.2 10.4 0.2 0.4 0.2 0.4 1.6 1.9 15.1
0.1 0.1 0.0 0.0
0.0 0.0 0.2 0.2
0.0 0.0 0.1 0.1 0.0 0.0
36.8 2.5 2.3 0.9 2.8 33.1 8.7 87.0
Confidential Treatment Requested
LBEX-WGM 000550

CO
NFID
ENTIA
L TREA
TMEN
T REQ
UESTED
BY
LEHM
AN
BR
OTH
ERS H
OLD
ING
S, INC
.
r m m >< ~ G) s 0 0 0 0'1 0'1 ....Jo.
-~
Global Ovt. . Jnder) Funding Summary as of September lOth, 2008
Princioal in $B--' --- --- -- -
Region Shell Booked Summary ASIA EQUITIES
ASIA Total EUROPE ASSET BACKS - INVESTMENT GRADE
ASSET BACKS -NON-INVESTMENT GRADE Cl -INVESTMENT GRADE CONVERTIBLES C2- NON-INVESTMENT GRADE CONVERTIBLES
CORPORA TES - INVESTMENT GRADE CORPORATES- NON-INVESTMENT GRADE EMG EQUITIES GOVERNMENT AGENCY MONEY MARKETS OTHER
SOVEREIGNS EUROPE Total U.S. ASSET BACKS - INVESTMENT GRADE
ASSET BACKS -NON-INVESTMENT GRADE
CORPORATES- INVESTMENT GRADE CORPORATES- NON-INVESTMENT GRADE EQUITIES GOVERNMENT AGENCY MBS MONEY MARKETS MUNI
PRIVATE LABELS -HIGH YIELD PRIVATE LABELS - INVESTMENT GRADE SOVEREIGNS WHOLELOAN COMMERCIAL WHOLELOAN RESIDENTIAL
U.S. Total Grand Total
/~\
Principal Region Collateral Allocated Summary 1.6 ASIA EQUITIES
EMG 1.6 ASIA Total
15.6 EUROPE ASSET BACKS - INVESTMENT GRADE 0.0 ASSET BACKS -NON-INVESTMENT GRADE 0.3 CI - INVESTMENT GRADE CONVERTIBLES 0.9 C2 -NON-INVESTMENT GRADE CONVERTIBLES 5.8 CORPORATES- INVESTMENT GRADE 7.1 CORPORA TES- NON-INVESTMENT GRADE 5.0 EMG
11.0 EQUITIES 0.0 GOVERNMENT AGENCY 0.0 · MONEY MARKETS 0.0 OTHER
PRIVATE LABELS- HIGH YIELD PRIVATE LABELS - INVESTMENT GRADE
8.8 SOVEREIGNS 54.6 EUROPE Total 6.8 u.s. ASSET BACKS - INVESTMENT GRADE 1.8 ASSET BACKS- NON-INVESTMENT GRADE
CI -INVESTMENT GRADE CONVERTIBLES C2- NON-INVESTMENT GRADE CONVERTIBLES
2.7 CORPORA TES - INVESTMENT GRADE 5.5 CORPORATES- NON-INVESTMENT GRADE 8.4 EQUITIES
23.2 GOVERNMENT AGENCY 44.6 MBS
7.3 MONEY MARKETS 3.4 MUNI
OTHER 0.6 PRIVATE LABELS- HIGH YIELD
17.3 PRIVATE LABELS - INVESTMENT GRADE 33.2 SOVEREIGNS.
6.2 WHOLELOAN COMMERCIAL 0.3 WHOLELOAN RESIDENTIAL
161.3 U.S. Total 217.5 Grand Total
·-·-
Confidential Treatment Requested
-·~
Over I (Under) Principal Funding
1.6 0.0 0.0 (0.0) 1.6 -
14.4 1.2 0.0 (0.0) 0.3 (0.0) 0.8 0.1 7A (1.6) 2.4 4.7 8.3 (3.3)
12.1 (1.1) 0.0 (0.0) 0.1 (0. I) 0.0 (0.0) 0.0 (0.0) 0.0 (0.0) 8.7 0.1
54.6 (0.0) 2.5 4.3 1.4 0.4 0.4 (0.4) 0.3 (0.3) 5.9 (3.3) 2.7 2.8 7.8 0.6
22.4 0.8 56.0 (I I .4) 6.6 0.7 3.5 (0.1) 0.0 (0.0) 1.7 (I. I) 6.1 11.2
37.7 (4.5) 5.7 0.5 0.5 (0.2'
161.3 -217.5
7

CONFIDENTIAL TREATMENT REQUESTED BYLEHMAN BROTHERS HOLDINGS, INC.
f \
1 __ · ~ ~~~
--g ~ ;;~~
~ --~~
I #.;?B. ~ ::;~~
J ;~~ ] ~::~
I I ;:~~ ~ ~E~
((( ! ~ۤ: ~~~ -
I ..
~: I . . •. '-=;i
-~ i ""' ~ ~ -
~
~ ~
t ;
l f
~~e~ ~~;
iEEi'ii'l~o
~ ~ ! ~
::!-
~:!
i ::!- •.
~ ~! ~
~ 5 ~ "'
~ ~~ ~
:II~ ~ :..;.J
" j
~
f"~"
!~a~
r ~
~ !~~
I j J ~ji .
~~~ 05~ ·I~~~~~
~=~ o5· ·In~§~
5~~"~""~
~ ~
f , ~
i i I
1 p5 l ~~ 3 .5-c;-.
i
.!-
[~ i
H
i5e>c3
~ i ] II <
' 1 ~
I . r
I I
L! !p . ~ h~ .... ....;~
1 ! l 1 s
h ,~
l1 i~ i::'G "iiZ :SCi 55
r-!r--
l!=s i ]
• '! I: • ... <. ~ c;; 1:--~
ho~ !! ~~H
~~-s ~~ ~~H
i~· ~: i ;
" ' ' 1
~=:~ ~
~H :::!::!·. r ~~~ -' -:7\'!ll''i < Hi - ~ ]::~ ~ '-"-- ~
LBEX-WGM 000552

CONFIDENTIAL TREATMENT REQUESTED BYLEHMAN BROTHERS HOLDINGS, INC.
-f----,
Global Liquidity Projection 9/1112008
LBIE SOD Core Liquidity (Smm)
1,011-: FID
lnb:rc.::ump~~ony
Other
j,l!c1X
j, Su~t:k l..11:111 E:qnsure
~11rim~:llrok!!r('a.~hS(UJ
Olhd'
A Unx
6/\ulubl:nn'IWS
Oll1.:r
9-Sep
814
(2,782)
2,548"
Tollll L.RIE F.tjuiliu {234)
'ful•l LBIE FlO
108
108
Tot11II.BJE 1/C (232)
OthcrCbv.ul(u 11
0MIIy Cb•u~e __ (,::;33:.:7.!..) _
LBIE EOD Core Liquidity (Smm) _ __:;47'-'7 __
LBIE Uuprcadviscd Cash (Smm) 317
LBI£ PB Free Cash (Smm) {788)
LBIE EOD Reportable Liquidity (Smm) ---,--
Other UK Regulated Eotitics Net Liquidity (Smm) 6S2
LBHI SOD Core Liquidity (Smm)
I. HIE .\ ufFunJinte. li.1r l.lllli Shun
O!hcrUCrllilni,!.:S
LCPI
I. B.'.:!. U I Smui.~
I.RI
).fllble
l.l11bilillu
.\{'llllat.:r-.~IMa~in
tJ. sv.~dp h.1"icy
/:r.Ro."gTfl:xcltung.o::lllllrgin
I.UO;IJC 0\lll:l'
!J. Fwuling.ofRWL'CWL b Fundinl!- ofCurp.lrdlc luans 0\h.:r
!.BAll :sunri.~c
I.BU:I!C Otl\I.T
I.IU:
l.A!El'C Othr.:r
l.lll.u.x:Cayman
I.IJIE UC
C..:n~ & W~mnn lssui!S
[.1(' fwnlin~I\.'\.IUin:mo..'flt
Tohd LBIE 1/C
TatMILBS ...
Tlitlll LBAII/Sunrb.:
' Tulad 1.8 l.ux/C11ym11n
Tohdi.BI
Totlll:\bblc
Totllll.iMbllltlu
39,191
(I'J)·
(19)
({)90)
(lUI)
:!04
(587)
I)
(51)
0
(51)
HII 211
u l7Z
65
65
(101)
"' (IUS)
(0)
(33)
(JS)
(149)
D~~.lly Cb.nr;u _ _cr:7cc4,2)'--
Treasur}'_ EOD Core Liquidity (Smm) -:,:38::,,4~4;..9 _
Short-term CP I Baoklincs ($ 2 weeks) --;;2;-;,1;,;3S;,-Treasury EOD Reportable Liquidity (Smm)_,;;40;,:;,S;,;;8;;,3 _
Priu.a- D•>•',•clh'itk:J
~ ·f.B..,..Y1 im:l S21Jnunstt1ck h!Jn with I.BIE
~-·l.U::SFin!l S(fi'J\1) .:oUah:rdl n~<~!1utiS(404)mm {ioiJman Sachs and
S(]riU}111liii.HIEI and S( lllO)rmn n~w1 ~11.·ap pa}mo..'111S, paniallytr11Sr..1 hy
S2t:4nunR'-1!·1 mUJ!inn:c.:!pl'i .(.IJ l.u~indS('Jll}nun pirlll....,_"''p;l)rn.:nt
-Oth..._'TVIciS(:!OIIJmm I.\1(.'\J.:.pilalilrja.1iun
-LBAII ind S 115nun LDIE ~1ror.:k klall n::c\!}pt
Outflows:
-LH!W inc! :S(4-IU)nun R~··l ntargin paym .. :nts
-I.CPI inc! :S{50U)mm 1-'o.."'lway CWI. n:po n1U on·
-Uah incl S(J2fi)mm M'IN maturitii!S
-<Jtho:r inc I S(J25)mnt Eun'f'II2JI runduil paydliWn
IO.Sep
477
0
(5,1111)
(5,811)
0
(36fi)
(366)
(114)
6.2B5
24
SOl
291 (788)
• 652
38,449
0
(IJR)
(98)
(51)
'" (4-10)
0
(310)
{JI))
(0)
0
(313)
" 11:5 0
205
(14)
0
(14)
IS
CUI
(16}
tiZ)
(326)
(439)
(1.323)
37,126 434 .
37,S60 7H
Treaaury Core liquidity Po•ltion $.41,000 .-----------~~:..:..~=.:..:...:.:.==--------
c:::=:lProj-.;I!DIJ -Adual
1o-OayMov Avg
$40.000
$39.000
s.~e.ooo
s.::n.ooo 536.000
!i-35,000
--~"
:;~:::: ~- n ·:n n n s -31.000 -1-l...IL,.J...IL...,J...IL..,JLJ._~-'---+-.L.-L,..L..L.-r-L.L._,..L.L._,..L-L->--'-n,_-1
9/312008 Qt4/200B ersnoo8 e1anaoe 9/9/2008 9/10/20os 9/11/2008 9t12/20oa e/15/2008 9/16/2008 9/17t2008
11-Sep
SOl
1,240
1.2-10
(1,242)
II
II (1,242)
(0)
(0)
__ (Z_)_
499
291 (788)
September
. 736
(3,877)
')00
ll.•rn
(2,571i) (2.576)
(73)
S,J92
(23S)
SOl
291 (788)
Augu5t
634
"' "' 1,471
{5,517) (3,067)
1,122
{II)
2,611.8
3.795
(4::!:0)
(207)
102
736
QTD
736
(J,8TI)
'J<!O (2,977)
(2.576)
(2.576)
(7:\)
5,392
(23S)
SOl
Q3 2008
6,993
1,4112
4,102
(9,386)
(9,946)
(13,748)
'" {211)
4,723
:5.~61
111,9_97 (8.968)
(6,2S8)
736
230 291 230 (966) (788) (966)
2 __ <O_)- 4 - (0) _
652
(21J4) ]5
0
0
0
(260)
0
(0)
(0)
HR)
{48)
41
"
(2.!.'2S)
(U)
~
33,934 --3-05--
-2:!£!,._
Tomum•w'' projedluu•
lnRow•:
OutRIIv.·.-
39,738
0
1"1
(!16)
(JKJ)
(27)
(706)
(1.116)
(433)
'" (37)
(366)
:!.07
204
0
411
16
l6
(:\7)
(ICJ\)
0
(1211)
(U)
(lSD)
(6!19)
(3'13)
(2,612)
37,126 434
37,S60
37,182
(0)
494 ... {JI6} (291)
(141))
127 0
(629)
1,3:!)
2,379 (::!.8)
3.674
1,57-1 516
240
2.330
I@
l6U
200
0'14)
" (153)
433
(3.19-1)
(559)
2.556
39,738 2,3S7
42,09S
39,738
(96)
(96)
08~)
(27)
(706)
0 0
(1.116)
(4JJ)
1114
07} (36.6)
207
:!U~
411
"' I)
l6
{37)
(1\JI)
{2211}
(U)
'(151))
(6'11'1)
{39J)
(2.61.!!_
37.126 434
37,S60
-I.BSF inc! S(290)mm cnUah:nl n\iiJll.in ~ym.:ni!.!S(219)mm Nminchukin Uankl
-l.ia\1 inc\ :S( l.fi)bn Strmy l'uinl, S( I )bulh-I!S!lm .. "!' n.,._, maturity, ;urll S(J2S)mm
J:un,p.::~n Cunduit raaytlclwn
Proj~r:tr:d ''er.onu ,\(hiYb
Pn111X!I.:a.l ( 'nn! l.i!luidity fur So..'f'lr:mlu In, :!IJIIX wa.'
I.BSF J,{'l'l
J.BI I.UAIL'Sunrise
M~hlc
U3f
Various011ro:r/\r:li\'ilic:s
/u:lwd Crrl'l: Liquidity ll.rr S~.-pt~nlu Ill, 2U!IR was:
(3011)
(liiO)
1:511
)UO
(655)
41,472
(0)
9,422
(2,045)
(1,769)
(484)
(:5,576) {114)
(9.988)
\,625
4,')82
276
6.883
1,1116
1::!:4
:!-10
2,181
129 (3,666)
110
(3,427)
2,2:\7 (1,01'7)
!SiiR)
651
.. o (5.663)
(Z,06.jj)
(1,734
39,738 2,3S7
42,09S
LBEX-WGM 000553

CONFIDENTIAL TREATMENT REQUESTED BYLEHMAN BROTHERS HOLDINGS, INC.
LBI Liquidity Projection
hn·l!.~tm~nl.'>
0('(." Mun,.·y FunJs
l'r.:!UnJings: TotDILB/Itttlt.\'tlru!nLo;
L·C Uc•mn~o·ing from I..CP l a· Burrowing lh•m UU £I
Ntt LSI Liquidity
Required Box U.tan wilh ( • hiue Opt:n~lit•ttsiC~~.o~h(iu:IJ!'!>.d FLut.l)
MTSHux TMSDox
Tre11.~uiesin!ht:Bux
IOt,-·~AssclsinBtlX
I.Bif. Prbnc Bruk"r C~o~..-.ib s~uro:a (t:•M~c): C'asiiS(ll) ini.Bil! C'a~hS(U) inl.BI
Gklh•ICW~bSfl.:
UH FlriQ Box hy t'b.•t=l C.:: ~o~lc~ury:
.uun-.~p
,\o;tlna•blo: Boz ,\GENCY ASSET 8ACKS-(AI. .~:!.A.l) ASSET BACK.<; -1Jwc~"ttn:l1 Grade A.'iSET BACKS -Nun lnves~n:ll!'lll Grade ('MO AGENCIE.<; CONVERTUU.f:S ('ORJ'ORAll:- (AI, A2'. AJI ('ORPORATE • lrll:c:."11I'lc'll Gtudc ('C)RPORA fF.. • Nun h,..·~smll!lt Gn11le EQlRlY -··•l:RNMENTS -lrr.·c:.1n~~;nl Grzulc
1-NM!;N rS- N"'"~ hr.'1::>1nlal Gt:nl~
MRKE"CS- -.'\.t..\2.Al f.... ~AI,A2.•\l) r .. nJNI • hr.·.:!lotn~:r• <i1a~ Mtuai. Nt•n llr.·c~IIIICIII ~--~r.~dc I'KHJiRREDS I'RlV 1\'ff. I.ABF.L • lln.·c.:::.tn~tR tinulc SOV!:RI:IGNS- ElrRC!"·.J=JONDS Sllt.II'S WARRANTS MntL")' M~rkL1S -lrn·.:~l~"tl tinulc
TRI-:,\."il'HJt:S
1110~. Cub C"pilllliltcd llu A:;~ct nuck:i • Nt•n hr.·c:.o.._m!lf Gn.dc lu:St!t D1cks • NlVNA C"Ml) 1\g.:n::ks ("unvcniblt:~
{'urptm!.le·lli\'CSirliCII.;:~ndC C'III'JKln!.I~·NIInlli\'I!SU:·"M:tltilllllC
Ct•rpt.•llltc- NR/NA Equity Equity-l.imit.:tl11ar1n.T:!::I'hip li<jtily·Pri\'lltt:Equil)' liquity·R!!.~Iril:tcJ
l"ta~ llniLo; Out'l:nlfi1Cib- Nunllw...- -'tm.-11! <ir~dc (itwcnm.:ats- NR INA I dnno1111'11pcr MMI'S Mt•JI:\" M1rkcb • NK/N~ Mlllli:IAI.A"!,A.l) Mtl'li-lm·cs!n'L"IItirutlt.!:' Muni-NRINA
l'ri'•"tt:l..a~l-lm-c,mc~•lintlc l'ri~·•t-= l..11.b=l· Nun lll\·c '""""ll:lf. <iradc l'ri111IC l..ahcl· NH:NA
l'm<lu:Lab.:l(l0s)
Rcstdcrtiill Wlu•L:Iuan(zo....t.ISI
W~~Jtaru·R.:slrictctl
•..
Toru/LHIHu.t
8-S<p
:!,994
290
~
(3.:!79) ----s
lllH
K25 1.565
------z:l90 Ill')
1 . ..151 --r.9SiJ
2.5!11
1.501
:\ITS
10') 19
0
II JJ 66
,,
l1U
H7
5I
l:!J
" i-1-1
'
]U
2!13
"
1..423
I.BHO
!1-Scp
!.4US
'" --r.s60
(::!,556) ---.-
"' ]10
-~ 1.9115
" -----+m-5.286
c.!HIJ
281
H1S
164 "!77
1,0011 0
17
"
l,ti15
159
" 121 Ill
112
" !7
Jl7
:!5'J
0
" 1,790
~
10-.ltolp
8.915
:!93 ---;:loS
(9.::!.06) ---2-
N•A
'X/A
TOTAL
10'1 JU
" II 197 HJ
1,008 0 J
77 53
"' '" '
1,985
87
5I
511"! ,,,
l"!l II)
JS9 "'K"!
" 127
1SIJ
JU 1Ul
16
" -----r.m-
5,286
11-Scp
8,915
:!5 -----a:940
~ 2
9/11/2008
LBII.iQuidityCh"oga:
Prit1rDay Tpday Pmjectiun MlDO QID4 QlllftL'f")
,,o;q. 10-.~p 11-Scp Scpt£mbcr Q•lOU8 lDOS
SOD LBI Liquldi'J' ' 4 ----' ---'-
___ .,_. Jl7
6ADBox
t:.EQLJ&~e
~FU"Ilh:'qllaircULS
.O.PrimcBn•kcrllsa[!e 6.LBSFILDF Rei- T ~FX!Cumtnutlily Rcl!tu:d Fla•w• .U.Extlwf\!cMwgin ,· ~Ctro1umcr free <:redit ~ISGJ-ll.nck-up
60p.'flltitlrul Cull ~MIInl!lll!C 1'&1 RI."CCi\'otble L.lrJcn:llnlpiUI)'I'•ytl•lll'll OthcrA.:ti\"iti.:s
F.ODI.BII.iqukli'J'
"' (I]
::!,0:!1
("!lO) (215) (MOl) s (415) {1,526) 18Y
1,162 112
71 " C::!:,IJ51J 1.7115
----l!!1. ________& ----
----!. ----=- ----'
1,240 1,2-10 "' (51) (51) (2.575) (3,1M8) (!,188) 1,0)6
{178) (278} (liS II) (65) (65) Jl
(l,liYB) (3.6!.111) (IIA-17) (.164) (JM) 1,071 ()~) {390) Ill ., -10 5(olf
131 JJJ (655) -I.SSO -l,5SO ll,tilJ
___QJ_ _______lml_ ----2:!2..
---1. ----=- ___ ._7._
'·""" ---------------------------'-----
'-"""
·10.11110
-~-----------------
'"' '"' c:::::::J!o.fi"SIJ<Ix(in:IWiu~,:hoJ<Io•n)
- rrg.,-uyt~nntntU..Jlft'llniT\I\llrc:"
'" -n.lSBo:r.
-l.llllloaiOD•i"~'la"''O.:"''"cnlt'>'
'" 911
r:::::::J:~w111tlllox1.oan
Conl1dential Trcalment Requested
LBEX-WGM 000554

CO
NFID
ENTIA
L TREA
TMEN
T REQ
UESTED
BY
LEHM
AN
BR
OTH
ERS H
OLD
ING
S, INC
.
r m m >< ~ G) s 0 0 0 (11 (11 (11
~-
LBHI Reportable Liquidity as of September 10, 2008 Bv Investments:
-Deposits/MMF
-New York 13,785
-London 2,634 16,419 -Boxed Inventory in LBHI 3,995
-Boxed Inventory in LBI 9,206
-Boxed Inventory in LBIE 7,941 -Boxed Inventory in LBAH -
Reportable Liquidity 37,560
Bv Region:
-New York 26,986 -London 10,575
Reportable Liquidity 37,560
/-~\ -~ I
LBHI Reportable Liquidity as of September 09, 2008 DoD Changes By Investments: Bv lnves/menls:
-Deposits/MMF -Deposits/MMF
-New York 20,376 -New York (6,591)
-London 5,519 25,894 -London (2,885) ·(9,475) -Boxed Inventory in LBHI 3,995 -Box•:xl Inventory in LBHI
-Boxed Inventory in LBI 3,806 I'
5,400 -Boxt:xllnventory in LBI
-Boxed Inventory in LBIE 6,889 -Boxed Inventory in LBIE 1,052 -Boxed Inventory in LBAH - -Boxed Inventory in LBAH
Reportable Liquidity 40,583 Reportable Liquidity (3,023)
BvRegion: By Region:
-New York 28,176 -New York (1,190)
-London 12,407 -London (I ,833)
Reportable Liquidity 40,583 Reportable Liquidity (3,023)
Confidential Treatment Requested

CONFIDENTIAL TREATMENT REQUESTED BYLEHMAN BROTHERS HOLDINGS, INC.
\.
=== .= g.e
·S'a
--·=:S.
=~ ...... , . . e:.
-- . ;;; <:i <:i
LBEX-WGM 000556

CO
NFID
ENTIA
L TREA
TMEN
T REQ
UESTED
BY
LEHM
AN
BR
OTH
ERS H
OLD
ING
S, INC
.
r m m >< ~ G) s 0 0 0 0'1 0'1 .......
,/'~
Commercial Paper
London Beginning BaL
Maturing Roll Ending SaL !:J,
New York Beginning SaL
Maturing Roll Ending SaL !:J,
Global Beginning Bal.
Maturing Roll
Ending Bal.
25-Aug
782
90 872
90
2,870
(1,005) 1,249 3,114
244
25-Aug 3,652
(1,005) '1,339
3,986
26-Aug 27-Aug
872 923
(336) (387) 387 402 923 938
51 15
3,114 3,299
(1,327) (1,335) 1,512 1,208 3,299 3,171
185 (127)
26-Aug 27-Aug 3,986 4,222
(1,663) (1 ,722) 1,899 1,610
4,222 4,109
/~\
28-Aug 29-Aug 30-Aug 31-Aug 1-Sep
938 939 911 911 911
(402) (403) (375) 403 375 402 939 911 911 911 938
1 (28) - 27
3,171 3,411 2,875 2,875 2,875
(1,408) (1,445) 1,648 909 3,411 2,875 2,875 2,875 2,875
240 (536) - -
28-Aug 29-Aug 30-Aug 31-Aug 1-Sep 4,109 4,350 3,786 3,786 3,786
(1,810) (1,848) - (375) 2,051 1,284 - 402
4,350 3,786 3,786 3,786 3,813
Confidential Treatment Requested
')
2-Sep 3-Sep 4-Sep 5-Sep 6-Sep 7-Sep 8-Sep
938 931 919 920 918 918 918'
(402) (395) (383) (384) (472) 395 383 384 382 389 931 919 920 918 918 918 835
(7) (12) 1 (2) - (83)
2,875 2,99~· 3,007 2,853 2,847 2,847 2,847
(1,138) (1,344) (1,548) (1,414) (1,303) 1,261 1,353 1,394 1,408 2,057 2,998 3,007 2,853 2,847 2,847 2,847 3,601
123 9 (154) (6) - 754
2-Sep 3-Sep 4-Sep 5-Sep 6-Sep 7-Sep 8-Sep 3,813 3,929 3,927 3,773 3,765 3,765 3,765
(1,540) (1,739) (1,931) (1,798) - - (1,775) 1,656 1,736 1,778 1,790 - 2,446
3,929 3,927 3,773 3,765 3,765' 3;755 4,436

CO
NFID
ENTIA
L TREA
TMEN
T REQ
UESTED
BY
LEHM
AN
BR
OTH
ERS H
OLD
ING
S, INC
.
r m m >< ~ G) s 0 0 0 0'1 0'1 co
/'~
26-Sep 27-Sep 28-Sep 29-Sep
87 87 87 87
87 87 87 87
961 961 961 961
961 961 961 961
26-Sep 27-Sep 28-Sep 29-Sep 1,048 . 1,048 1,048 1,048
1,048- -1,048- 1,0~ 1,048-
30-Sep 25-0ct 26-0ct
87 87 87
87 87 87
961 715 715
(20)
941 715 715 (20)
30-Sep 25-0ct 26-0ct 1,048 802 802
(20) -
1,028 802--
802
,,-~\
~
27-0ct 28-0ct 29-0ct 30-0ct 31-0ct Nov 1 and beyond
87 87 87 87 87 87
(87)
87 87 87 87 87 0 (87)
715 515 515 280 280 I, 280
(200) (235) (280)
515 515 280 280 280 (0) (200) - (235) - - (280)
27-0ct 28-0ct 29-0ct 30-0ct 31-0ct Nov 1 and beyond 802 602 602 367 367 367
(200) (235) - (367) - -
602 602 367 367 367 {0)
Confidential Treatment Requested 3

CO
NFID
ENTIA
L TREA
TMEN
T REQ
UESTED
BY
LEHM
AN
BR
OTH
ERS H
OLD
ING
S, INC
.
r m m >< ~ G) s 0 0 0 0'1 0'1 CD
~--.
9-Sep 10-Sep
835 744
(476) (385) 385 744 359 (91) (385)
3,601 3,161
(1 ,557) {1,124) 1,117 20 3,161 2,057 (440) (1,104)
9-Sep 10-Sep 4,436 3,905
(2,033) (1,509) 1,502 20
3,905 2,416
11-Sep
359
(92)
268 (92)
2,057
(30) 285
2,312 255
11-Sep 2,416
(121) 285
2,579
12-Sep 13-Sep 14-Sep 15-Sep
268 268 268 268
(152)
268 268 . 268 116
- (152)
2,312 2,005 2,005 2,005
(306) (433)
2,005 2,005 2,005 1,572 (306) - (433)
12-Sep 13-Sep 14-Sep 15-Sep 2,579 2,273 2,273 2,273
(306) (585)
2,273 2,273 2,273 1,688
~ .... ~":"; I
16-Sep 17-Sep 18-Sep 19-Sep 20-Sep 21-Sep 22-Sep 23-Sep 24-Sep 25-Sep
116 116 116 116 116 116 1'16 116 116 87
{29)
116 116 .. 116 116 116 116 116 116 87 87 - (29)
1,572 1,572 1,572 1,572 1,462 I, 1,462 1,462 961 961 961
(110) (502)
1,572 1,572 1,572 1,462 1,462 1,462 961 961 961 961 (110) (502)
16-Sep 17-Sep 18-Sep 19-Sep 20-Sep 21-Sep 22-Sep 23-Sep 24-Sep 25-Sep 1,688 1,688 1,688 1,688 1,578 1,578 1,578 1,076' 1,076 1,048
- (110) - - (502) - (29)
. 1,688 1,688 1,688 1,578 1,578 1;518. 1,076~ - 1,016 ~048 1,048
Confidential Treatment Requested 2