proceedings from the bushfire and natural hazards crc & afac ...
386
AFAC18: PROCEEDINGS FROM THE BUSHFIRE AND NATURAL HAZARDS CRC & AFAC CONFERENCE 2018 Perth, Australia, 5 – 8 September 2018
-
Upload
khangminh22 -
Category
Documents
-
view
1 -
download
0
Transcript of proceedings from the bushfire and natural hazards crc & afac ...

AFAC18: PROCEEDINGS FROM THE BUSHFIRE AND NATURAL HAZARDS CRC & AFAC CONFERENCE 2018
Perth, Australia, 5 – 8 September 2018

AFAC18: PROCEEDINGS FROM THE BUSHFIRE AND NATURAL HAZARDS CRC & AFAC CONFERENCE 2018 | REPORT NO. 367.2018
2
Version Release history Date
1.0 Initial release of document 03/09/2018
All material in this document, except as identified below, is licensed under the
Creative Commons Attribution-Non-Commercial 4.0 International Licence.
Material not licensed under the Creative Commons licence:
• Department of Industry, Innovation and Science logo
• Cooperative Research Centres Programme logo
• Bushfire and Natural Hazards CRC logo
• All photographs.
All content not licenced under the Creative Commons licence is all rights
reserved. Permission must be sought from the copyright owner to use this
material.
Disclaimer:
The Bushfire and Natural Hazards CRC advise that the information contained in
this publication comprises general statements based on scientific research. The
reader is advised and needs to be aware that such information may be
incomplete or unable to be used in any specific situation. No reliance or actions
must therefore be made on that information without seeking prior expert
professional, scientific and technical advice. To the extent permitted by law, the
Bushfire and Natural Hazards CRC (including its employees and consultants)
exclude all liability to any person for any consequences, including but not limited
to all losses, damages, costs, expenses and any other compensation, arising
directly or indirectly from using this publication (in part or in whole) and any
information or material contained in it.
Publisher:
Bushfire and Natural Hazards CRC
September 2018
Citation: J. Bates (Ed.), AFAC18: Proceedings from the Bushfire and Natural
Hazards CRC & AFAC Conference 2018. Melbourne: Bushfire and Natural
Hazards CRC.

AFAC18: PROCEEDINGS FROM THE BUSHFIRE AND NATURAL HAZARDS CRC & AFAC CONFERENCE 2018 | REPORT NO. 367.2018
3
TABLE OF CONTENTS
PEER REVIEWED PAPERS 5
UTILISING GRASSROOTS ENGAGMENT TO DRIVE CULTURAL CHANGE 6
J. Robinson
NON-PEER REVIEWED EXTENDED ABSTRACTS 26
EXTREME FIRE BEHAVIOURS: SURVEYING FIRE MANAGEMENT STAFF TO DETERMINE BEHAVIOUR
FREQUENCIES AND IMPORTANCE 27
A. Filkov, T. Duff, T. Penman
SIMULATIONS OF THE EFFECT OF CANOPY DENSITY PROFILE OF SUB-CANOPY WIND SPEED PROFILES 33
D. Sutherland, R. Wadhwani, J. Phillip, A. Ooi, K. Moinuddin
PYROCONVECTIVE INTERACTIONS AND DYNAMIC FIRE PROPAGATION 45
J. Hilton, R. Badlan, A. Sullivan, W. Swedosh, C. Thomas, J. Sharples
SIMULATIONS OF THEE WAROONA FIRE WITH THE ACCESS-FIRE COUPLED FIRE ATMOSPHERE MODEL 52
M. Peace, J. Kepert, H. Ye
AUSTRALIA'S FUTURE NATIONAL HEATWAVE FORECAST AND WARNING SERVICE: OPERATIONAL
CONSIDERATIONS 62
J. Nairn, R. Fawcett, L. Anderson-Berry, B. Ostendorf, P. Bi, C. Beattie, M. Cannadine
MENTAL HEALTH AND WELLBEING IN THE POLICE AND EMERGENCY SERVICES SECTOR 73
D. Lawrence, W. Rikkers, J. Barttlett
PREVALENCE AND PREDICTORS OF MENTAL HEALTH IN FIREFIGHTERS 75
H. Bancroft
DISASTERS AND ECONOMIC RESILIENCE: INCOME EFFECTS OF THE BLACK SATURDAY BUSHFIRES ON
DISASTER-HIT INDIVIDUALS 84
M. Ulubasoglu
APPLYING UNHARMED FOR RISK REDUCTION PLANNING - COMPARING STRATEGIES AND LONG-TERM
EFFECTIVENESS 96
G. Riddell, H. van Delden, G. Dandy, H. Maier, A. Zecchin, J. Newman, R. Vanhout
RISK MODELLING AS A TOOL TO SUPPORT LOCAL GOVERNMENT EMERGENCY MANAGEMENT 102
M Crawford
FILLING THE GAPS: HOW ECONOMICS CAN HELP MAKE IMPORTANT DECISIONS WHEN INFROMATION IS
MISSING 113
A. Rogers, V. Florec, A. Hailu, D. Pannell
A SYSTEMATIC EXPLORATION OF THE POTENTIAL FOR BUSHFIRE RISK MITIGATION WITH PRESCRIBED
BURNING 127
H. Clarke, B. Cirulis, R. Bradstock, M. Boer, T. Penman, O. Price
A LIDAR-DERIVED FUEL MAP FOR THE ACT 132
A. Leavesley, A. Van Dijk, M. Yebra
PERFORMANCE OF FIRE DETECTION ALOGRITHMS USING HIMAWARI-8 152
C. Engel, S. Jones, K. Reinke
EXPERIENCES IN THE IN-FIELD UTILISATION OF FUELS3D 163
L. Wallace, K. Reinke, S. Jones, S. Hillman, A. Leavesley, S. Telfer, R. Bessel, I. Thomas
GET READY NSW – FOSTERING ALL-HAZARDS RESILIENCE IN LOCAL COMMUNITIES 169
S. Anderson
COMMUNITY PREPAREDNESS AND RESPONSES TO THE 2017 NSW BUSHFIRES 182
J. Whittaker

AFAC18: PROCEEDINGS FROM THE BUSHFIRE AND NATURAL HAZARDS CRC & AFAC CONFERENCE 2018 | REPORT NO. 367.2018
4
DIVERSITY AND INCLUSION: BUILDING STRENGTH AND CAPABILITY 190
C. Young, J. Pyke, N. Maharaj, C. Cormick, B. Rasmussen, R. Jones
A SYSTEMATIC APPROACH TO EMBEDDING SAFETY, WELL-BEING AND RISK MANAGEMENT WHEN
RESPONDING TO INTERSTATE AND INTERNATIONAL DEPLOYMENTS 200
J. Smith, G Dudley, A. Stanios, D. Sayce, A. Collins
COMMUNITY STRATEGY DEVELOPMENT FOR REDUCING EARTHQUAKE RISK IN WESTERN AUSTRALIA 211
S. Gray, P. Martin, M. Edwards, M. Griffith, H. Derakhshan
REDUCING BUSHFIRE RISK TO VULNERABLE COMMUNITY MEMEBERS THROUGH HEALTH AND COMMUNITY
SERVICES AGENCIES- BUSINESS CONTINUITY APPROACH 213
S. Blyth
TRANSFORMATIVE CULTURE OF DISASTER RISK MANAGEMENT AS AN ENABLER TO RESILIENCE 222
J. Rolfe
IMPROVED PREDICTIONS OF EXTREME SEA LEVELS AROUND AUSTRALIA 234
C. Pattiaratchi, Y. Hetzel, I. Janekovic
REAL PEOPLE, REAL STORIES-IF IT'S FLOODED FORGET IT 256
S. Karmel
LARGE DAMAGE BILLS TO BUILDINGS FROM CYCLONES AND STORMS CAN BE REDUCED BY SMALL ACTION263
D. Henderson, J. Ginger, D. Smith
IMPACT BASED FORECASTING FOR THE COASTAL ZONE 269
H. Richter, C. Arthur, S. Schroeter, M. Wehner, J. Sexton, B. Ebert, M. Dunford, J. Kepert, S. Maguire,
R. Hary, M. Edwards
INSIGHTS FROM THE DEVELOPMENT OF A PYROCUMULONIMBUS PREDICTION TOOL 279
K. Tory, J. Kepert
EVALUATION AND CALIBRATION OF A LAND SURFACE BASED SOIL MOISTURE FOR FIRE DANGER RATING 289
V. Kumar, I. Dharssi, P. Fox-Hughes
PLANNING AND CAPABILITY REQUIREMENTS FOR CATASTROPHIC AND CASCADING EVENTS 297
A. Gissing, M. Eburn, J. McAneney
EMERGENCY VOLUNTEERING 2030: A SECTOR-WIDE, MANAGEMENT PERSPECTIVE 308
B. McLennan, T. Kruger
THE EMERGING IMPERATIVE OF DISASTER JUSTICE 317
A. Lukasiewicz
HOW CAN BUSINESS SHARE RESPONSIBILITY FOR DISASTER RESILIENCE 330
S. Hunt, M. Eburn
WORKING FROM THE INSIDE OUT TO IMPROVE RESEARCH UTILISATION IN DECISION MAKING 337
C. Young
ENHANCING COMMUNITY RESILIENCE THROUGH THE EARLY CHILDHOOD EDUCATION AND CARE
WORKFORCE 346
S. Keleher
TEACHER-DELIVERED CHILD-CENTRED DISASTER RESILIENCE EDUCATION PROGRAM: A STUDY IN
BANGLADESH 356
M. Rashid, K. Ronan, JC. Gillard
VOLUNTEERING INTO THE FUTURE- DISASTER EVENTS, LOCAL GOVERNMENTS & COMMUNITIES 364
T. Kruger, B. McLennan
EMERGENCY MANAGEMENT OPPORTUNITIES FOR REMOTE INDIGENOUS COMMUNITIES IN NORTHERN
AUSTRALIA 372
K, Sangha, A. Edwards, J. Russell-Smith

AFAC18: PROCEEDINGS FROM THE BUSHFIRE AND NATURAL HAZARDS CRC & AFAC CONFERENCE 2018 | REPORT NO. 367.2018
5
THE HAWAII NUCLEAR ALERT: HOW DID PEOPLE RESPOND? 382
A Gissing, A Avci

AFAC18: PROCEEDINGS FROM THE BUSHFIRE AND NATURAL HAZARDS CRC & AFAC CONFERENCE 2018 | REPORT NO. 367.2018
6
PEER REVIEWED PAPERS
AFAC18: PROCEEDINGS FROM THE BUSHFIRE AND NATURAL HAZARDS CRC & AFAC CONFERENCE 2018 | REPORT NO. 367.2018
7
UTILISING GRASSROOTS ENGAGEMENT TO DRIVE CULTURAL
CHANGE
Peer reviewed research proceedings from the Bushfire and Natural Hazards CRC &
AFAC conference
Perth, 5 – 8 September 2018
Joanne Robinson
Queensland Fire and Emergency Services
Corresponding author: [email protected]

AFAC18: PROCEEDINGS FROM THE BUSHFIRE AND NATURAL HAZARDS CRC & AFAC CONFERENCE 2018 | REPORT NO. 367.2018
8
ABSTRACT The Queensland Fire and Emergency Services (QFES) has undergone significant change over
recent years. This level of change within the department has proven challenging from a cultural
perspective. In effect, QFES is an amalgam of cultures from three very different services, with staff
identifying strongly with their service of origin. For many, the potential loss of cultural identity and
the feeling of ‘constant change’ has been challenging to accept.
Given the extent of change, it has been imperative for QFES to better understand how its staff
are managing through these changes. Since 2013, assessments have been undertaken into
workplace climate through the annual Queensland Government Working for Queensland
Employee Opinion Survey. To complement these, in 2015, the Commissioner’s Future of QFES
survey was also conducted to gauge elements of QFES’ culture. Both surveys provide valuable
information on the workplace pre- and post-merger, however do not necessarily provide a full
assessment.
In 2015 and 2017, to supplement the surveys, QFES conducted extensive staff consultation
throughout the department to unpack the survey results, better understand the causes, effects
and possible solutions to issues staff are confronting. This research has been invaluable for
management to develop actions and initiatives to make QFES a better place to work. Areas of greatest concern for staff include:
• Relationship and communication with QFES management;
• Equity in, and accessibility to, performance management, recruitment, promotion and training opportunities;
• Integration of, and communication amongst, QFES services;
• Harassment and bullying;
• Workload and its effect on staff health and wellbeing;
• Change and contract management practices; and
• Approval processes and red tape.
Over the last four years, there has been increased understanding by management at all levels,
regarding the importance of both the survey results and consultation findings, and consequently
more commitment to working with staff to improve the workplace. Learnings have resulted in
greater understanding across the department regarding the importance of workforce
engagement and communication, both for attracting and retaining valued and capable staff,
and for building a positive, inclusive and empowering culture.
The consultation process was not without challenges including issues due to a diverse and
distributed workforce, change resistance and fatigue, competing priorities across the
department, maturity in understanding the benefits of workforce consultation and difficulty in
maintaining momentum to address issues.

AFAC18: PROCEEDINGS FROM THE BUSHFIRE AND NATURAL HAZARDS CRC & AFAC CONFERENCE 2018 | REPORT NO. 367.2018
9
INTRODUCTION Since 2013, the Queensland government has surveyed its workforce to gauge their views on
issues such as workplace climate, job satisfaction, leadership and management. This is done
through the Working for Queensland Employee Opinion (WfQ) survey, conducted by an
independent provider and facilitated by the Public Service Commission (PSC).
The survey is an opportunity for Queensland Fire and Emergency Services (QFES) staff to have
their say and make a difference in their workplace. It provides insight into the QFES workforce
and the issues that matter to them. Results are analysed at an organisational and strategic level
through strategic and organisational factors, and at a local level through workplace indices
(refer to Appendix A). Feedback is taken on board by management and helps shape the future
direction of the department.
To support this work, biennially QFES conducts regional and state office consultation to further
unpack the results of the survey and work with staff to look at solutions to issues they are
confronting. Staff consultation was first conducted in 2015 with the first summary report produced
in March 2016. Fifty-five recommendations were contained in the report. A recent review found
approximately half have been implemented in full or part, demonstrating the workforce’s insight
into resolving workplace issues.

AFAC18: PROCEEDINGS FROM THE BUSHFIRE AND NATURAL HAZARDS CRC & AFAC CONFERENCE 2018 | REPORT NO. 367.2018
10
BACKGROUND The benefits of undertaking employee consultation and feedback are widely established
including improved workplace engagement, productivity and effectiveness of change
(MacLeod & Clarke, 2009). Organisational development theory (Griffin, Saville, Smith & Alsop,
2011), change management practice (Kotter, 2012, Prosci, 2018) and workforce engagement
specialists (Bersin, 2014; Romans & Tobanen, 2016, Saks, 2006), demonstrate the key role
employees have in any change strategy. They recognise that people and collaboration are key
features of any change and realise the importance of staff involvement in change, including
how change will be implemented.
Working from these theories it was determined in 2015 that in addition to the administration of
surveys, QFES would conduct workforce consultation through staff forums and other workforce
meetings, across the organisation. This represented an opportunity to have as many staff as
possible involved in suggesting the nature of changes to QFES operations and business, and how
these would be implemented. It ensured a cross section of the workforce was consulted prior to
the implementation of any workplace change initiatives and provided leverage to staff
commitment to change. This process was repeated in 2017.
AFAC18: PROCEEDINGS FROM THE BUSHFIRE AND NATURAL HAZARDS CRC & AFAC CONFERENCE 2018 | REPORT NO. 367.2018
11
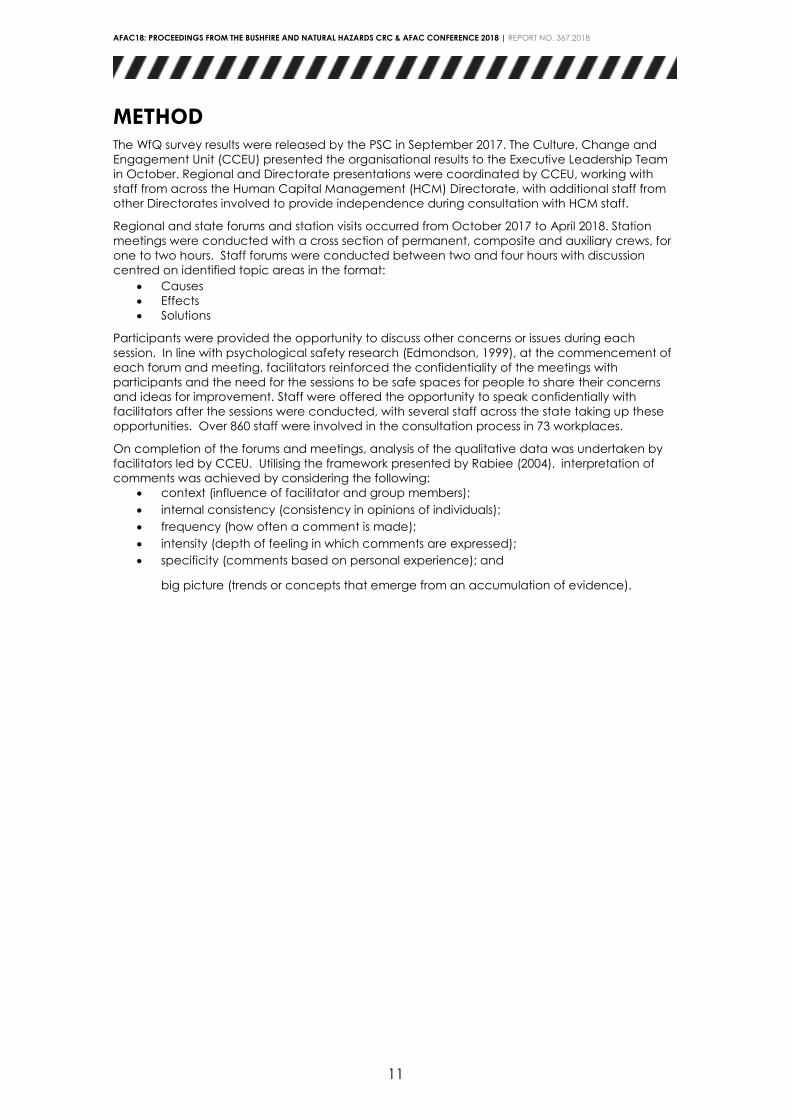
METHOD The WfQ survey results were released by the PSC in September 2017. The Culture, Change and
Engagement Unit (CCEU) presented the organisational results to the Executive Leadership Team
in October. Regional and Directorate presentations were coordinated by CCEU, working with
staff from across the Human Capital Management (HCM) Directorate, with additional staff from
other Directorates involved to provide independence during consultation with HCM staff.
Regional and state forums and station visits occurred from October 2017 to April 2018. Station
meetings were conducted with a cross section of permanent, composite and auxiliary crews, for
one to two hours. Staff forums were conducted between two and four hours with discussion
centred on identified topic areas in the format:
• Causes
• Effects
• Solutions
Participants were provided the opportunity to discuss other concerns or issues during each
session. In line with psychological safety research (Edmondson, 1999), at the commencement of
each forum and meeting, facilitators reinforced the confidentiality of the meetings with
participants and the need for the sessions to be safe spaces for people to share their concerns
and ideas for improvement. Staff were offered the opportunity to speak confidentially with
facilitators after the sessions were conducted, with several staff across the state taking up these
opportunities. Over 860 staff were involved in the consultation process in 73 workplaces.
On completion of the forums and meetings, analysis of the qualitative data was undertaken by
facilitators led by CCEU. Utilising the framework presented by Rabiee (2004), interpretation of
comments was achieved by considering the following:
• context (influence of facilitator and group members);
• internal consistency (consistency in opinions of individuals);
• frequency (how often a comment is made);
• intensity (depth of feeling in which comments are expressed);
• specificity (comments based on personal experience); and
big picture (trends or concepts that emerge from an accumulation of evidence).

AFAC18: PROCEEDINGS FROM THE BUSHFIRE AND NATURAL HAZARDS CRC & AFAC CONFERENCE 2018 | REPORT NO. 367.2018
12
RESULTS
Strengths Results in several factors and workplace indices demonstrate consistently high positive scores and
improved satisfaction over the years. Figure 1 demonstrates this trend since 2015.
Figure 1: Yearly trend data for factors
Organisational Engagement QFES scored very highly on questions related to organisational engagement. At 74%, QFES
scored 15 percentage points higher than the average for the Queensland Public Sector (QPS).
Staff believed it was the ‘nature of the organisation’ and the ‘type of people who work for QFES’
that make people feel engaged with the organisation. They believed most joined the
department to assist the community. It is their values, beliefs and sense of purpose in the roles,
that gives them passion for the job and the organisation.
My job Many respondents were highly satisfied with their current job; 83% were positive, five percentage
points above the QPS score and a 1% increase on 2016 data. Various reasons were provided for
these positive scores including enjoyment of work, job security, satisfaction with salary and job
benefits, loyalty to the organisation and workgroup; opportunities to work with the wider
community, rewarding work, helping people and making a difference.
Research (PSC, 2018) suggests people who find purpose in their roles are more engaged and
likely to report positive sentiments towards their work, the people they work with and their
organisation. Ensuring staff find purpose in their work is a key to QFES continuing to have an
engaged and committed workforce.
My Manager The results of the survey suggest many staff (74%) are satisfied with their direct supervisor or
manager, with 80% believing their manager treats them with dignity and respect and 79%
believing their manager demonstrates honesty and integrity. As demonstrated in Figure 1, there
has been a steady increase in perceptions of management since 2015.
The key role a manager plays in creating an engaged workforce cannot be underestimated
(Gruman & Saks, 2011; Shuck, Rocco & Albornoz, 2011). For those who felt treated well by their
manager, survey results show engagement and job satisfaction is significantly higher (Figure 2).
Having managers that understand the importance of supporting staff by treating them with
respect, understanding their work and creating purpose, will ensure QFES continues to deliver
quality services to our communities and stakeholders.
40%
45%
50%
55%
60%
65%
70%
75%
80%
85%
90%
2015 2016 2017
Agency engagement My job My manager

AFAC18: PROCEEDINGS FROM THE BUSHFIRE AND NATURAL HAZARDS CRC & AFAC CONFERENCE 2018 | REPORT NO. 367.2018
13
Figure 2: Job satisfaction and agency engagement x treatment by manager
Opportunities for Improvement
Leadership Results from the WfQ survey and commentary from staff indicate some dissatisfaction with QFES
leadership. Although survey results show a slight improvement in satisfaction with leadership (1%),
satisfaction remains low at 52%, with 21% of staff dissatisfied with organisational leadership.
Several causes for dissatisfaction with leadership were provided by staff including inconsistent
decision making and a lack of visibility and communication with leaders. Staff observed
managers being ‘too busy’ and struggling because they were not receiving support from their
managers. There were perceptions managers have insufficient training in administrative
functions.
New questions were included in the WfQ survey in 2017 concerning the attributes staff currently
observe and want to see in their leaders. The results were analysed across four management
levels: team leader, program manager, senior officer and senior leader; based on the Workforce
Capability Success Profiles (PSC, 2017). They provide valuable information on skills needing
development in our leaders and managers at all levels.
It is clear from the data staff want leaders to demonstrate a range of skills, however staff
specifically require:
• Ethical leadership;
• Effective and confident decision making;
• Managers that give staff the tools, information and authority to do their job well;
• Support for new ideas and business improvement; and
• Managers who actively seek feedback from staff to improve their skills.
Fairness and Trust Survey questions regarding fairness in decision making, anti-discrimination and related topics,
highlight that many staff do not see clear, transparent processes being followed. Staff observed
decision making that does not align with policies or values, inconsistent recruitment and
promotion processes, and a lack of appropriate performance reviews, and training for supervisors
in people management.
Operational staff voiced concerns regarding current recruitment processes and perceived
reverse discrimination in favour of minority groups. Concerns from non-operational staff centred
around a lack of fairness regarding opportunities for learning, development, awards and
entitlements. Administrative staff commented there were few opportunities for promotion unless
they left the department. This was particularly evident outside the south-east corner of the state.
Communication
Results from the survey indicate 60% of staff receive the information they need to do their job.
Results also demonstrate the importance of good communication to improving engagement,
perceptions of leadership and organisational trust (Figure 3).
91
33
85
40
Agree Disagree
Per
cen
tage
My manager treats me with respect and dignity
Job satisfaction Agency engagement

AFAC18: PROCEEDINGS FROM THE BUSHFIRE AND NATURAL HAZARDS CRC & AFAC CONFERENCE 2018 | REPORT NO. 367.2018
14
Figure 3: Influence of effective communication on workplace factors
Despite these positive results, staff consistently expressed concern regarding the effectiveness
and means of communication across the department. Issues contributing to poor
communication included the existence of silos and lack of communication around initiatives,
achievements and unit capabilities. Staff identified a need for more communication between
teams, to reduce confusion about responsibilities.
Staff identified a lack of communication pathway for innovation and ideas, along with a lack of
clear communication around changes to work practices. There was a consensus that handovers
between incoming and outgoing staff could be better managed to reduce duplication of work
and reduce staff frustration.
Effectiveness and Innovation
Survey results indicate a high level of dissatisfaction with bureaucracy and approval processes,
which is consistent across the public service. Only 16% of staff believe approval processes are not
excessive and there is not too much ‘red tape’. Questions concerning new ideas and
implementing better ways of working indicate staff are feeling stifled. 59% are encouraged to
make suggestions about improving work processes and services, however only 46% believe
management are willing to act on their suggestions, and 47% feel QFES is open to new ideas.
Staff expressed frustration with excessive approval processes; processes that are convoluted and
are not introduced well, slowing change and limiting effectiveness. Some noted not
acknowledging when things are not working properly, stifled innovation. Others described the
level of bureaucracy to implement new programs and courses, as unnecessary.
Forum comments suggest QFES needs to improve change management, including consultation
with impacted staff and training to enhance understanding and managing resistance to
change. Staff felt change management principles could be better incorporated into project
management, and contract management could be improved to ensure service level
agreements and contract requirements are met.
Safety, Health and Wellness
47% of staff responded positively to workload and health questions however, 18% felt overloaded
with work and 23% felt work had a negative impact on their health. New questions concerning
staff wellbeing and flexible work arrangements, indicate only half of respondents felt senior
leaders consider staff wellbeing important. Regarding flexibility, 70% believe their workgroup
assists them to ensure flexible work arrangements meet their needs, however only half had
proactive discussions with their manager regarding flexibility. 38% felt their commitment wouldn’t
be questioned if they chose to use flexible work options.
During consultation there was a perception staff across the department didn’t understand
stressors in other work areas, while some felt they have responsibility for fixing problems out of their
control along with feelings of personal commitment which lead to exhaustion.
Other staff experience confrontational stress with customers, while others were frustrated with the
‘excessive requirement’ for briefing notes and felt overwhelmed because there were few
opportunities for ‘catch up time’.
0%
10%
20%
30%
40%
50%
60%
70%
80%
90%
100%I am well informed about what is happening in QFES
Strongly disagree Disagree Neither agree nor disagree Agree Strongly agree

AFAC18: PROCEEDINGS FROM THE BUSHFIRE AND NATURAL HAZARDS CRC & AFAC CONFERENCE 2018 | REPORT NO. 367.2018
15
Staff felt clear communication was required regarding role requirements, both for role clarity and
motivation. The importance of supportive managers and co-workers and positive teamwork was
also highlighted. Another topic that resonated with most groups was the need for performance
plans to provide an avenue for regular feedback to staff, and to develop skills and confidence.
Workplace Conduct
Of those who responded, 76% had not witnessed harassment or bullying in the last 12 months,
while 84% had not experienced harassment or bullying in the last 12 months. These figures are an
improvement on 2016 and a steady improvement since 2015.
Issues raised in forums concerned possible lack of understanding of performance conversations
compared to bullying which could potentially be addressed through training and
communication. The amount of time taken, the stress and a lack of transparency in the
complaints management and discipline processes, were identified as deterrents to reporting
behaviour. People recognised the need for staff to have confidence to speak up but that this
was not always evident. Figure 4 demonstrates the importance of an environment where people
feel confident to raise complaints.
Figure 4: Workplace factors as a function of confidence in raising complaints
Discussions were held on the inappropriateness of the current Workplace Behaviour Training
package. A review of this was identified as a possible improvement opportunity.
Performance Management
Survey results suggest staff are dissatisfied with performance management. 46% are confident
poor performance will be appropriately addressed and 48% agree performance is assessed
against clear criteria. Only half of staff felt they had productive conversations with their manager
on their performance or received useful feedback on their performance.
Feedback highlighted several concerns around performance management. These included a
lack of action over under performance, role descriptions that needed reviewing and a lack of
role and responsibility clarity. Many identified an absence of performance plans which was
disempowering as staff were unable to identify how to improve their performance or reach their
potential. Staff noted some managers did not have the skills, or knowledge to manage
performance and could benefit from additional training or coaching in this area. As managers,
there was concern they would have complaints made against them if they managed poor
performance.
Learning & Development
Results indicate opinions vary regarding the management of learning and development. 73% of
staff agree there are opportunities to develop their skills and knowledge, 65% are satisfied
learning and development activities completed in the past 12 months have helped improve their
performance and 67% believe they are able to access relevant opportunities; however only 58%
believe QFES is committed to developing its employees and 55% are satisfied with opportunities
available for career development.
0%
10%
20%
30%
40%
50%
60%
70%
80%
90%
100%If I raised a complaint, I feel confident that it would be taken seriously
Strongly disagree Disagree Neither agree nor disagree Agree Strongly agree

AFAC18: PROCEEDINGS FROM THE BUSHFIRE AND NATURAL HAZARDS CRC & AFAC CONFERENCE 2018 | REPORT NO. 367.2018
16
This topic resulted in much discussion and suggestions for improvement. Some feedback was
positive, particularly from auxiliary firefighters who were extremely satisfied with training
opportunities provided by their managers. Others felt they would benefit from more opportunities
however, for a variety of reasons, including budget constraints, distance, workload and personal
restrictions, felt unable to access them.
Issues with communication of opportunities and access to training in local areas and facilities at
the Academy, were identified. Staff also recognised the need for human resources, finance and
business management skills training across the department.
Improvement Suggestions
Forums and meetings also focused on improvement ideas and suggestions to address the issues
identified. In total, over 600 ideas were presented by staff. A sample of these according to
organisational/strategic factors and workplace indices are listed in Appendix B.

AFAC18: PROCEEDINGS FROM THE BUSHFIRE AND NATURAL HAZARDS CRC & AFAC CONFERENCE 2018 | REPORT NO. 367.2018
17
DISCUSSION The QFES’ culture is at the core of our operational success. Our people are extremely dedicated
and capable of dealing with the multitude of emergency incidents and disasters that face the
Queensland community on a seemingly more regular basis.
From a non-operational perspective, despite reviews that highlight areas of concern within the
workforce, our findings demonstrate much of the workforce are satisfied with QFES as a
workplace and highly engaged with their job. Staff consistently provide positive feedback
regarding their pride in working for QFES, the valuable contributions they make to keep their
communities safe and how effectively they work with others in their teams. Many aspects of
QFES’ operations and business should be celebrated to ensure they continue and are built upon.
We cannot however, ignore findings that highlight opportunities for improvement. Based on
consultation, initiatives (refer to Appendix B) informed by our people and supported by our
leaders, have been incorporated into business plans to provide oversight and tracking of
progress. The main benefit of these initiatives is their focus on solutions from the workforce.
Through their ownership and internalisation of the problems and solutions, we will see the
workforce engaged and QFES cultural transformation realised (Robinson, Perryman & Hayday,
2004; Romans & Tobanen, 2016).
Through our research, common improvement opportunities or ‘levers for change’ (Department of
Defence, 2012) have been identified. These levers have been assessed as the most critical to our
workforce and will support QFES’ move to a more effective, culturally dynamic and inclusive
organisation.
1. Leadership and governance
Strengthening QFES leadership will drive workforce engagement and create an environment
where appropriate workplace conduct is an expectation. Inclusive leaders will engender trust
and reinforce an integrated approach to service delivery. Effective governance, policy and
performance frameworks will ensure business strategy is translated into meaningful actions for all
staff.
2. Vision and strategy
Creating a shared vision with supporting principles and strategies will see QFES transform into an
inclusive, contemporary workplace, where staff are supported to be high performers, achieve
desired outcomes and provide valued services to our communities and partners.
3. Communication and engagement
The development and review of workforce engagement and communication strategies will
provide guidance on the most effective ways to engage with paid and volunteer staff and
inform them of issues and initiatives that impact them; promoting trust, constructive workplaces
and leading to increased engagement and performance.
4. Systems and processes
Developing effective systems and processes across QFES will assist paid and volunteer staff to
gain a better understanding of their roles and responsibilities and create more efficient
workplaces where excellence in service delivery and demonstration of exemplary workplace
behaviour is an expectation.
Since the consultation was completed, it is heartening to see that several initiatives have already
been implemented or have commenced implementation. These include:
• Communication via the QFES Gateway of outcomes of complaints and disciplinary
action.
• A number of new policies have been updated or developed to address harassment.
• Talent Acquisition Unit have begun speaking with regions about the basegrade firefighter
recruitment process. They are developing a program of visits to regions to share more
information and improve understanding about the recruitment process.
• The use of independent members in recruitment and selection.
• Blind recruitment process for initial stages of Basegrade Firefighter recruitment.
• Commencement of organisational cultural assessment.
• Review Officer Development program to include training on complaints management
and people management.
• Provide training in resume writing, interviewing and presenting self at interviews.

AFAC18: PROCEEDINGS FROM THE BUSHFIRE AND NATURAL HAZARDS CRC & AFAC CONFERENCE 2018 | REPORT NO. 367.2018
18
• A revised Combined Conduct training program is being developed, incorporating Code
of Conduct, QFES values, workplace behaviour training and diversity and inclusion
awareness module.
Research identifies the key role leaders play in creating engaged workforces, implementing
successful change and promoting cultural change. It is their role to ensure engagement is a
fundamental tenet of what we do as a department, and that they have the necessary skills to
manage change (Kavanaugh, 2006). ‘Organisations that have strong engagement cultures are
populated with senior leaders that make everyday – and everyone – count daily…(They) are not
afraid of tough questions, comments or challenges. They seek out those who will engage in the
tough conversations to build their capability and that of the organisation.’ (Romans & Tobanen,
2016, p. 78). Line managers too, have an important role to play, ‘through their daily behaviour
toward their staff, which sends signals about the extent of the value placed upon them’ (Alfes,
Truss, Soane, Rees & Gatenby, 2013, p. 852).
By our leaders focusing on initiatives that will drive change through the four levers of change, we
will potentially see the biggest impact on workforce engagement and our culture. Supporting
and using suggestions from our people, changing a few critical behaviours at a time that support
targeted and integrated cultural change, can engage the workforce and enable them to
participate more fully in the change process.
Limitations of the current study
It is noted that the approach adopted for this consultation process tended towards a deficit
approach to investigation and it is proposed that in future, the department consider appreciative
enquiry (Cooperrider & Whitney, 2006) or strength-based approaches (Beckett, Field, Molloy, Yu,
Holmes & Pile, 2013, p.599) to draw out and focus more fully the strengths, capabilities, and
resources of the department which can result ‘in a greater level of creative problem solving and
a more optimistic atmosphere’ and be used to further improve our workplaces.
AFAC18: PROCEEDINGS FROM THE BUSHFIRE AND NATURAL HAZARDS CRC & AFAC CONFERENCE 2018 | REPORT NO. 367.2018
19
CONCLUSION Many theories on cultural change and workforce engagement suggest that pockets of activity,
whilst making a small difference, can never achieve full cultural change or a long term engaged
workforce. Katzenbach, Steffen & Kronly (2012) note that leaders often see culture change as a
last resort. For QFES to develop the desired culture and a fully engaged workforce, we need a
coordinated approach that is led from the top through establishing clear vision and values
(Markos & Sridevi, 2010), modelling required behaviours (Romans & Tobanen, 2016), making
engagement a priority (Seijts & Crim, 2006) and utilising effective communication to enhance
engagement (Mishra, Boynton & Mishra, 2014).
Complex change doesn’t happen in isolation. Many issues identified in the survey and forums
are linked. Improving one area, will likely see positive impacts in other areas (PSC, 2018).
Empowering leaders to make decisions through effective governance, will potentially produce
improvements in staff perceptions of leaders, streamline approval processes and potentially
increase organisational trust and job satisfaction. Working on identified levers in a coordinated
and planned manner, will mean a holistic approach is adopted when implementing change. If
we work on those issues that will create more satisfied staff, we will inevitably create our desired
culture (Childers, 2016).
QFES faces challenges that will test our ability and determination to implement the initiatives
outlined in this paper. For QFES to continue its cultural transformation, these challenges and
drivers for change must be kept in the front of our minds. If we are cognisant of issues that may
hinder progress, we will be in the best position to find solutions that minimise their impact.
This is an exciting time for QFES and one in which all staff can be involved. With an engaged
workforce and an open leadership team, QFES can continue to provide operational excellence
to our communities and strive to be a department that exemplifies ethical leadership,
professionalism, inclusion, efficiency and innovation.

AFAC18: PROCEEDINGS FROM THE BUSHFIRE AND NATURAL HAZARDS CRC & AFAC CONFERENCE 2018 | REPORT NO. 367.2018
20
REFERENCES Alfes, K., Truss, C., Soane, E.C., Rees, C. & Gatenby, M. (2013). The Relationship Between Line
Manager Behaviour, Perceived HRM Practices, And Individual Performance: Examining the
Mediating Role of Engagement. Human Resource Management, Vol. 52, No. 6, pp. 839-859.
Beckett, P., Field, J., Molloy, L., Yu, N., Holmes, D. & Pile, E. (2013). Practice What You Preach:
Developing Person-Centred Culture in Inpatient Mental Health Settings through Strengths-Based,
Transformational Leadership. Issues in Mental Health Nursing, Vol. 34, pp. 595-601.
Bersin, J. (2014). The Simply Irresistible Organization. Oakland, CA, USA: Bersin by Deloitte.
Childers, J. (2016). The Focus of Culture Change is not Culture. Accessed at
https://blog.johnrchildress.com/2016/10/12/the-focus-of-culture-change-is-not-culture/
Cooperrider, D. & Whitney, D. (2006), Appreciative Inquiry: a positive revolution in change. In
Holman, P., Devane, T., Cady, S. and Associates. (2006). The Change Handbook. Berrett-Koehler
Publishers, Inc., San Francisco, CA.
Department of Defence (2012). Pathway to Change: Evolving Defence Culture. A Strategy for
Cultural Change and Reinforcement. Commonwealth of Australia, Canberra.
Edmondson, A. (1999). Psychological safety and learning behaviour in work teams. Administrative
Science Quarterly, Vol. 44, No. 2, pp. 350-383.
Exceed Global (2016). How to achieve your goals. Accessed at
https://www.exceedglobal.com/single-post/2016/08/18/How-to-achieve-your-goals
Griffin, E, Saville, M, Smith, G & Alsop, M (eds) (2011). A Field Guide for Organisation
Development: Taking Theory into Practice. Routledge, London.
Gruman, J.A. & Saks, A.M. (2011). Performance management and employee engagement.
Human Resource Management Review, Vol. 21, pp. 123-136.
Katzenbach, J.R, Steffen, I, & Kronly, C. (2012). Cultural Change that Sticks. Harvard Business
Review, July 2012, no 6.
Kotter, J. (2012) Leading Change. Harvard Business Review Press, Boston.
Kuznetsova S. (2011). The Transformation of Accounting Systems in the Chaotic Economy
Structuring: The Synergetic Approach. “Risk and Decision Analysis”, Vol. 2, No. 3, pp. 151-160.
MacLeod, D & Clarke, N. (2009). Engaging for success: enhancing performance through
employee engagement. Department for Business, Innovation and Skills, London.
Markos, S and Sridevi, M.S. (2010). Employee engagement: the key to improving performance.
International Journal of Business and Management, Vol. 5, No. 2, pp.89-96.
Mishra, K., Boynton, L. & Mishra, A. (2014). Driving employee engagement: the expanded role of
internal communications. International Journal of Business Communication Vol. 51, No. 2, pp. 183-
202.
Prosci (2018). Avoid these change management obstacles. Accessed at
http://blog.prosci.com/avoid-these-change-management-obstacles
Prosci (2018). Best Practices in Change Management, Prosci Benchmark Report Executive
Summary. Prosci Inc.
Public Service Commission (2017). Workforce Capability Success Profiles. Accessed at
https://www.forgov.qld.gov.au/workforce-capability-success-profile
Public Service Commission (2018). Positive and healthy workplace cultures guide. Queensland
Government, Brisbane.
Rabiee, F. (2004). Focus-group interview and data analysis, Proceedings of the Nutrition Society,
63, pp. 655-660.

AFAC18: PROCEEDINGS FROM THE BUSHFIRE AND NATURAL HAZARDS CRC & AFAC CONFERENCE 2018 | REPORT NO. 367.2018
21
Robinson D., Perryman S., and Hayday S. (2004). The Drivers of Employee Engagement Report 408,
Institute for Employment Studies, UK.
Romans, J & Tobaben, J. (2016). Our take: building engagement cultures. Strategic HR Review,
Vol. 15 Issue: 2, pp.76-82.
Saks, A. M. (2006). Antecedents and consequences of employee engagement. Journal of
Managerial Psychology, 21, pp. 600–619.
Seijts, G. & Crim, D. (2006). What engages employees the most or, the Ten C’s of
employee engagement. Ivey Business Journal Online. Mar/Apr, 2006: 1 – 5.
Shuck, M.B., Rocco, T.S. & Albornoz, C.A. (2011). Exploring employee engagement from the
employee perspective: implications for HRD. Journal of European Industrial Training, Vol. 35, No. 4,
pp. 300-325.

AFAC18: PROCEEDINGS FROM THE BUSHFIRE AND NATURAL HAZARDS CRC & AFAC CONFERENCE 2018 | REPORT NO. 367.2018
22
Appendix A – Working for Queensland Employee Opinion Survey Results overview

AFAC18: PROCEEDINGS FROM THE BUSHFIRE AND NATURAL HAZARDS CRC & AFAC CONFERENCE 2018 | REPORT NO. 367.2018
23

AFAC18: PROCEEDINGS FROM THE BUSHFIRE AND NATURAL HAZARDS CRC & AFAC CONFERENCE 2018 | REPORT NO. 367.2018
24
Appendix B – Sample of proposed actions for improvement
The following actions were provided by staff during staff forums and meetings, as solutions to
issues within their workplaces. It is a sample of proposed actions and are listed according to
organisational/strategic factors and workplace indices.
Organisational leadership
Suggested actions:
• Regular senior executive regional visits.
• Focus on the development of middle management especially in people management and
business skills.
• Support better understanding of services across QFES.
• Use evidence-based decision to align initiatives and departmental priorities.
• Create effective, ongoing consultation and communication to firmly establish, implement and
embed agreed operational protocols across the Services.
• Continue promotion and availability of 360-degree feedback for all staff and investigate
implementing mentoring and coaching for interested staff.
• Review leadership results from workforce surveys as a basis for the design of leadership training
programs.
Fairness and trust
Suggested actions:
• Rotate Auxiliary Captain/Lieutenant roles to increase staff development opportunities.
• Implement a blind application process for training and roles to encourage independent,
transparent, open processes.
• Review industrial awards to create more equity across services.
• Investigate opportunities for dual classification of positions where appropriate to allow an
increased diversity of staff across the services.
• Conduct a review to ensure reward and recognition programs are equitable across QFES
services and decision making is robust.
• Investigate the option of decentralising functions to provide regional staff opportunities for
professional development.
• Review service delivery models to ensure QFES is delivering the services based on local risk.
Communication
Suggested actions:
• Communicate the new QFES Structure including the role and responsibilities of each business
unit.
• Release a summary report for the Working for Queensland Survey which links the initiatives
being undertaken to the results of the survey.
• Review use of technology e.g. Facebook, messenger apps, to communicate training events
and other information to staff.
• Communicate recruitment processes to promote transparency and accountability in decision
making and improve staff understanding of the process.
• Conduct review of the QFES Gateway to assess effectiveness and functionality.
Effectiveness and innovation
Suggested actions:
• Continue to develop an effective lessons learned strategy and utilise lessons learned to ensure
learning and continuous improvement is promoted and harnessed and benefits from learnings
are realised.
• Engage auxiliary and volunteer staff and tap into the whole workforce to access skills.
• Review the auxiliary service delivery model to assess its sustainability and effectiveness in
meeting community expectations and needs.
• Investigate feasibility or escalate to the appropriate body, the suggestion that auxiliary staff
not pay tax on their pay.
• Recognise and reward staff who are instrumental in the implementation of innovative ideas.
Policy/process
• Ensure effective consultation between state units and regional staff, in policy review and
development.

AFAC18: PROCEEDINGS FROM THE BUSHFIRE AND NATURAL HAZARDS CRC & AFAC CONFERENCE 2018 | REPORT NO. 367.2018
25
• Ensure documentation on the Gateway is up to date, accurate and easily accessible,
particularly regarding policies and doctrine.
Equipment
• Provide update on appliance replacement program.
• PSBA to investigate internet access in rural and regional areas to improve connectivity.
• PSBA to conduct ICT review to check on the replacement schedule for current computing
equipment.
• Decide on a response/turnout app and implement across the department.
• Consider a review of OMS functionality. OMS team consult more widely with regions to gain
feedback on system improvements.
Safety, health and wellness
Suggested actions:
Workload
• Review business/service delivery models to investigate more effective ways of delivering
services.
• Undertake review of roles to gain a better understanding of role requirements and
training/development needs of staff and update role descriptions as required.
• Review regional administration roles to ensure staff are working at position levels.
• Ensure that flexible work practices are communicated to provide all staff an understanding of
the Government Directive regarding flexible work arrangements.
• Consider different roles for auxiliary and permanent firefighters who reach retirement age and
want to continue employment or are medically unable to undertake operational roles e.g.
community safety/engagement activities.
• Undertake assessment of community and organisational expectations to determine alignment
of work practices with expectations.
Health and wellness
• Review role of FESSN to support staff impacted by PTSD or having difficulty coping with
demands of the role of firefighter.
• QFES to consider a secular option for chaplaincy.
• Investigate the reintroduction of the wellness program across the department.
• Investigate wellness options for non-operational staff or providing access to station gyms to
staff working outside of stations.
• Managers to be role models for flexibility and support staff who request flexible work
arrangements in line with legislation.
Workplace Conduct
Suggested actions:
• Communicate the role of Workplace Conduct Branch and its units across the department.
Conduct a regional roadshow to promote the work of the Branch and raise staff
understanding of its role.
• Review Code of Conduct and Workplace Behaviour Training to meet needs of organisation
and maintain relevancy.
• Provide communication of outcomes of complaints and disciplinary issues to wider QFES.
• Make values relevant to staff by identifying behaviours associated with values to provide staff
with greater understanding of what the values mean in the workplace.
• Provide management with effective, practical training to address workplace conduct issues
and continue with provision of training in difficult conversations.
Performance management
Suggested actions:
• Ensure there are clear, structured and consistent guidelines for performance reviews which will
assist in improving performance and identifying development opportunities.
• Review effectiveness of Total Station Workload Targets to assess whether they are measuring
what needs to be measured and ensure they add value to organisational objectives.
• Investigate the use of ‘Case Management Teams’ when dealing with protracted or
complicated performance related matters.
Learning and development

AFAC18: PROCEEDINGS FROM THE BUSHFIRE AND NATURAL HAZARDS CRC & AFAC CONFERENCE 2018 | REPORT NO. 367.2018
26
Suggested actions:
• Implement feedback mechanism for state and regional training courses.
• Investigate more practical training relating to HR and people management and financial
responsibilities, for Station Officers and Senior Officers.
• Review access to Live Fire facilities for regional personnel to make it more accessible.
• Provide on-line application for training that goes directly to the Academy.
• Review Recognition of Prior Learning requirements to recognise training, skills and experience
from other workplaces and training institutions.
• QFES to consider incorporating Domestic & Family Violence ‘Recognise, Respond, Refer’
package into the Core Skills program.
• Continue to promote the Learning Cache to all staff.
• Promote SARAS (financial assistance for study opportunities) more widely with the workforce.
• Incorporate communication styles into leadership training.
• Investigate a QFES skills database to contain information on personnel’s
degrees/qualifications/strengths that can be tapped into to assist with working smarter.
• Provide training in resume writing, interviewing and presenting self at interviews.
• Provide training in having difficult conversations and performance management.
• Investigate reintroduction or expanding auxiliary RCR competitions.
• Conduct training needs analysis for all staff and incorporate into the Performance
Achievement and Development Plan (PADP) process.
• Consider options that allow personnel who are looking to move away from operational
activities, to focus on other duties such as MIRs, BA repairs etc.
• When systems are introduced or upgraded, ensure consistent training is provided across the
state.
• Where possible, conduct training/refresher courses in local areas to allow more opportunities
for attendance.
Change, Project and Contract Management
Suggested actions:
• Project teams to consult more widely with regional staff impacted by changes to better
understand needs and barriers to implementation and determine the best approaches to
implementation, including regional training requirements.
• Review project management effectiveness including implementing opportunities for
improvement.
• Track cultural change over the next 12 months and trending over years including initial
measure of current organisational culture and desired culture.
• Develop and implement a change management strategy/framework that includes training
and development in change and project management to all staff responsible for managing
and implementing change.
Other issues
Suggested actions:
• Review auxiliary recruitment process to streamline and create efficiencies including providing
feedback to unsuccessful applicants.
• Investigate developing regional/organisational recruitment campaigns for auxiliary firefighters.
• Develop strategies to recognise local employers of auxiliaries and volunteers.
• Establish Emergency Service Units rather than three separate services in small regional towns
struggling to keep SES groups, RFS brigades and auxiliary stations running.
• Review legislation to ensure all staff are covered and all relevant activities/tasks are
incorporated.

AFAC18: PROCEEDINGS FROM THE BUSHFIRE AND NATURAL HAZARDS CRC & AFAC CONFERENCE 2018 | REPORT NO. 367.2018
27
NON-PEER REVIEWED EXTENDED ABSTRACTS

AFAC18: PROCEEDINGS FROM THE BUSHFIRE AND NATURAL HAZARDS CRC & AFAC CONFERENCE 2018 | REPORT NO. 367.2018
EXTREME FIRE BEHAVIOURS: SURVEYING FIRE MANAGEMENT STAFF TO DETERMINE BEHAVIOUR FREQUENCIES AND IMPORTANCE Non-peer reviewed research proceedings from the Bushfire and Natural
Hazards CRC & AFAC conference
Perth, 5 – 8 September 2018
Alexander Filkov1,2, Thomas J. Duff1,2, Trent D. Penman1,2 1Bushfire and Natural Hazards CRC 2University of Melbourne
Corresponding author: [email protected]

AFAC18: PROCEEDINGS FROM THE BUSHFIRE AND NATURAL HAZARDS CRC & AFAC CONFERENCE 2018 | REPORT NO. 367.2018
28
ABSTRACT
EXTREME FIRE BEHAVIOURS: SURVEYING FIRE MANAGEMENT STAFF TO DETERMINE BEHAVIOUR FREQUENCIES AND IMPORTANCE
Alexander Filkov12, Thomas J. Duff2, Trent D. Penman2, 1Bushfire and Natural
Hazards CRC, 2The University of Melbourne, VIC
An understanding how bushfires cause damage is important if they are to be
effectively managed. Extreme fire behaviours (EFBs) are phenomena that occur
within intense fires that have been shown to contribute greatly to their to impacts.
However, there exists little understanding regarding how often particular EFBs
occur, how these contribute to fire behaviour and what importance should be
allocated to each in the development of models for decision support. To address
this problem, we surveyed fire fighters from fire and land management agencies
in Australia regarding their experiences with EFBs. All fires greater than 1000 ha in
the period 2006-2016 were considered in the survey. Representatives were asked
which, if any, EFBs they had observed and whether there was any
documentation to support these observations. We found that EFBs are common
in large fires. In more than 60 % of case studies, each bushfire had two and more
EFBs simultaneously (or one after another). Our survey indicated that Spotting,
Crown fires, Pyro-convective events, Eruptive fires and Conflagrations are the
most commonly observed EFBs, and so should be a priority for research. The
relative commonness of direct evidence available for EFBs is indicative that there
should be the potential for further study of these phenomena.

AFAC18: PROCEEDINGS FROM THE BUSHFIRE AND NATURAL HAZARDS CRC & AFAC CONFERENCE 2018 | REPORT NO. 367.2018
29
INTRODUCTION
Extreme bushfires create conditions that have disproportionate risk to
environmental and human assets. These fires can have significant
consequences, particularly relating to the loss of life. In 2017 alone, 11 people
were killed in Chile (1); 64 people were killed in Portugal (2); and 42 people were
killed in California, USA (3). The trend for extreme bushfires - fires that require more
people, more equipment, and greater commitment of financial resources -
appears to be increasing every year (4–7).
Extreme fire behaviours (EFBs) are localised phenomena that occur during
bushfire that are greatly alter their behaviour. These can include mass spotting,
pyro-convective events and conflagrations. EFBs can significantly influence the
intensity, rate of growth and impact of bushfires (8–11). They are anecdotally
common in large fires, however there has been limited research quantifying their
nature, importance and occurrence. In part, this may be due to the challenges
with observing rare complex phenomena that occur under dangerous
conditions.
A lack of a clear understanding of the importance of EFBs in defining damaging
fire behaviour has provided challenges in how to prioritise their research. To
understand the importance of EFBs in fire behaviour, we initially need to
understand how frequently they occur in order to prioritise future research effort.
We use an expert elicitation approach to determine the frequency of
occurrence of nine recognised extreme fire behaviours in Australian fires larger
than 1000ha.
METHODS
EFBs have been reported to be a feature of extreme fires. To collect data on
these, we considered all fires greater than 1,000 ha in Australia that occurred
between 2006 and 2016. We approached representatives from management
agencies responsible for fire response in each state (in Australia forest and fire
management is predominantly done at a state level) via email and telephone
and asked them to complete a guided survey. For each fire, we asked which (if
any) EFBs had been observed (Table 1) and what data there may be to support
this. The EFBs we asked about were: Spotting, Crown fires, Pyro-convective events
(PyroEvs), Eruptive fires, Conflagrations, Jump fires, Fire tornados/whirls, Fire
channelling and Downbursts.
EFB Definition
Spotting Spotting is a behaviour of a fire producing sparks firebrands or embers that are carried by the wind and which
start new fires beyond the zone of direct ignition by the main fire (12).
Fire
tornado/whirls
A fire tornado/whirl is a spinning vortex column of ascending hot air and gases rising from a fire and carrying
aloft smoke, debris, and flame. Fire whirls range in size from less than one foot to over 500 feet in diameter. Large
fire whirls have the intensity of a small tornado (12).
Fire
channelling
Fire channelling is a rapid lateral fire spread across a steep leeward slope in a direction approximately transverse
to the background winds, in addition to the usual downwind direction (13).

AFAC18: PROCEEDINGS FROM THE BUSHFIRE AND NATURAL HAZARDS CRC & AFAC CONFERENCE 2018 | REPORT NO. 367.2018
30
Jump fires Jump fire/Junction zones are associated to the merging of the fire fronts making a small angle between them
producing very high rates of spread and with the potential to generate fire whirls and tornadoes (Viegas 2012).
Eruptive fires Eruptive fires is are a fires that occur usually in canyons or steep slopes and are characterised by a quick rapid
acceleration of the head fire rate of spread (14).
Crown fires Crown fire are fires that advances in the tree crowns (NWCG 2017).
Conflagrations Conflagration are raging, destructive fire s. Often used to connote such a fire with a moving front as
distinguished from a fire storm (NWCG 2017).
Downbursts
Downbursts are downdrafts associated with pyro- cumulus clouds that induces an outburst of damaging strong
winds on or near the ground. These winds spread from the location of the downburns and may result in fire
spread into the prevailing wind direction (15).
PyroEvs A Pyro-convective event is an extreme manifestation of a pyrocumulus cloud, generated by the heat of a
wildfire, that often rises to the upper troposphere or lower stratosphere (16).
TABLE 1 EXTREME FIRE BEHAVIOURS FOCUSED ON IN THIS STUDY
Data were categorised into three types: direct measurements (linescans,
images, video, etc.), indirect data (weather records, etc.) and the data based
on anecdotal evidence (observations recorded in situation reports, etc.).
The survey was structured to include all fires >1000 ha that had occurred in the
relevant state.
Obtained data were analysed regarding to frequency of EFBs, quantity of EFBs
per fire and confidence level of data.
RESULTS AND DISCUSSION
Responses were received from New South Wales (NSW), Victoria (VIC), South
Australia (SA) and Tasmania (TAS). Information on EFBs was received for a total
of 96 fires among 934 fires surveyed (~10 %) (Table 2). It should be noted, that it
was impossible to accurately calculate the percentage of fires with EFBs,
interviewees could only answer for fires that they were familiar with. Therefore, a
10 % is likely to be a conservative estimate.
Data type Spotting Fire
tornado/whirls Fire channelling Jump fires Eruptive fires
Crown
fires Conflagrations Downbursts PyroEvs Total
Direct 32 3 2 4 13 22 14 2 27 119
Indirect 22 0 1 7 13 20 4 2 5 74
Anecdotal 18 2 1 1 4 18 6 1 4 55
Total 72 5 4 12 30 60 24 5 36 248
TABLE 2 EXTREME FIRE BEHAVIOURS. TALLY OF EXTREME FIRES IN DEPENDS ON THE DATA TYPE
All EFBs were recorded at least four times with spotting being observed most
frequently (72 times). Table 1 shows that the Fire tornado/whirls (n=5), Fire
channelling (n=4) and Downburst (n=5) were observed the fewest times.
Analysis of the relative frequency of various EFBs showed that the percentage of
occurrence of each EFB per fire. Spotting and Crown fires were the most frequent
EFBs, making up a total of 53 % of all EFB observations. PyroEvs, Eruptive fires and
Conflagrations were observed to have similar frequencies of occurrence,
accounting for 37 % of the remaining observations. Jump fires, Fire

AFAC18: PROCEEDINGS FROM THE BUSHFIRE AND NATURAL HAZARDS CRC & AFAC CONFERENCE 2018 | REPORT NO. 367.2018
31
tornado/whirls, Fire channelling and Downbursts combined accounted for 11 %
of EFBs in total.
Spotting, Crown fires, PyroEvs, Eruptive fires and Conflagrations were the most
frequent EFBs observed. They can be more easily identified and detected and
fire managers are more likely to be familiar with them in contrast to less frequently
occurring EFBs. One third of fires in this study had at least one EFB observed. Two
and more EFBs were recorded in 64 % of these fires. Therefore, their interactions
could have complimentary effects on fire behaviour, e.g. PyroEvs can facilitate
long distance Spotting and Fire tornados/whirls. Consequently, the potential
interactions of these phenomena should be a focus of further investigation.
Roughly half of all observations were recorded as direct data; 48 %. Indirect and
anecdotal data were less common but similar proportions (30 % and 22 %
respectively). For each EFB, the percentage of direct data observations was
higher in all cases than anecdotal data. Despite this, there have been few studies
devoted to analysis of EFBs. The number of events where EFBs are supported by
direct data indicate that there is great potential for future quantitative study.
SUMMARY
More effort is required to understand, describe and utilize EFBs. We found that
EFBs occur frequently in fires greater than 1000 ha and often with multiple EFBs
per fire. Given their commonness, the recognition of EFBs in fire behaviour
modelling may be important if we want to accurately estimate fire impacts. Our
survey indicated that Spotting, Crown fires, PyroEvs, Eruptive fires and
Conflagrations are the most commonly observed EFBs, and so these should be
the highest priority in determining which EFBs to research. The relative
commonness of direct evidence available for EFBs is indicative that there should
be data available for the development of models.

AFAC18: PROCEEDINGS FROM THE BUSHFIRE AND NATURAL HAZARDS CRC & AFAC CONFERENCE 2018 | REPORT NO. 367.2018
32
REFERENCES 1. Martinez-Harms MJ, Caceres H, Biggs D, Possingham HP. After Chile’s fires, reforest private land. Science
[Internet]. 2017;356(6334):147.1-148. Available from:
http://www.sciencemag.org/lookup/doi/10.1126/science.aan0701
2. Seymat T. Deadly wildfires: a devastating year for Portugal [Internet]. Euronews.360; 2017. Available from:
https://www.youtube.com/watch?v=-grgdZonjgw&feature=youtu.be
3. October 2017 Northern California wildfires [Internet]. Wikipedia, the free encyclopedia. 2017 [cited 2017
Oct 19]. Available from: https://en.wikipedia.org/wiki/October_2017_Northern_California_wildfires
4. Lydersen JM, Collins BM, Brooks ML, Matchett JR, Shive KL, Povak NA, et al. Evidence of fuels management
and fire weather influencing fire severity in an extreme fire event: Ecological Applications.
2017;27(7):2013–30.
5. Jain P, Wang X, Flannigan MD. Trend analysis of fire season length and extreme fire weather in North
America between 1979 and 2015. International Journal of Wildland Fire. 2017;26(12):1009–20.
6. Jolly WM, Cochrane MA, Freeborn PH, Holden ZA, Brown TJ, Williamson GJ, et al. Climate-induced
variations in global wildfire danger from 1979 to 2013. Nature Communications. 2015;6.
7. Gómez-González S, Ojeda F, Fernandes PAM. Portugal and Chile: Longing for sustainable forestry while
rising from the ashes. Environmental Science and Policy. 2017;
8. Cruz MG, Sullivan AL, Gould JS, Sims NC, Bannister AJ, Hollis JJ, et al. Anatomy of a catastrophic wildfire:
The Black Saturday Kilmore East fire in Victoria, Australia. Forest Ecology and Management. 2012;284:269–
85.
9. Peace M, Mattner T, Mills G, Kepert J, McCaw L. Coupled fire-atmosphere simulations of the Rocky River
fire using WRF-SFIRE. Journal of Applied Meteorology and Climatology. 2016;55(5):1151–68.
10. Viegas DX, Simeoni A. Eruptive Behaviour of Forest Fires. Vol. 47, Fire Technology. 2011. p. 303–20.
11. McRae RHD, Sharples JJ, Wilkes SR, Walker A. An Australian pyro-tornadogenesis event. Natural Hazards.
2013;65(3):1801–11.
12. NWCG. Glossary of Wildland Fire Terminology [Internet]. 2017. Available from:
https://www.nwcg.gov/glossary/a-z
13. Sharples JJ, McRae RHD, Wilkes SR. Wind-terrain effects on the propagation of wildfires in rugged terrain:
Fire channelling. International Journal of Wildland Fire. 2012;21(3):282–96.
14. Viegas DX. Extreme Fire Behaviour. In: Bonilla Cruz AC, Guzman Correa RE, editors. Forest Management:
Technology, Practices and Impact. Nova Science Publishers, Inc.; 2012. p. 1–56.
15. Haines DA. Downbursts and Wildland Fires: a Dangerous Combination. Fire Management Today.
2004;64(1):59–61.
16. American Meteorological Society. AMS glossary of meteorology [Internet]. Online glossary. 2014. p. 1–250.
Available from: http://glossary.ametsoc.org/?s=A&p=1

AFAC18: PROCEEDINGS FROM THE BUSHFIRE AND NATURAL HAZARDS CRC & AFAC CONFERENCE 2018 | REPORT NO. 367.2018
33
SIMULATIONS OF THE EFFECT OF CANOPY DENSITY PROFILE ON SUB-CANOPY WIND SPEED PROFILES
Non-peer reviewed research proceedings from the Bushfire and Natural
Hazards CRC & AFAC conference
Perth, 5 – 8 September 2018
Duncan Sutherland1,2, Rahul Wadhwani1,2, Jimmy Philip1,4, Andrew Ooi1,4
and Khalid A. M. Moinuddin1,2 1 Bushfire and Natural Hazards CRC 2 University of New South Wales 3 Victoria University 4 University of Melbourne
Corresponding author: [email protected]

AFAC18: PROCEEDINGS FROM THE BUSHFIRE AND NATURAL HAZARDS CRC & AFAC CONFERENCE 2018 | REPORT NO. 367.2018
34
ABSTRACT
Duncan Sutherland, School of PEMS, University of New South Wales, Canberra
Rahul Wadhwani, Institute for Sustainable Industries and Liveable Cities, Victoria
University
Jimmy Philip, Department of Mechanical Engineering, University of Melbourne
Andrew Ooi, Department of Mechanical Engineering, University of Melbourne
Khalid A. M. Moinuddin, Institute for Sustainable Industries and Liveable Cities,
Victoria University
In computational simulations for weather prediction and fire simulation, forest
canopies are often modelled as regions of aerodynamic drag. The magnitude
of the drag term depends on the Leaf Area Density (𝑳𝑨𝑫) of the forest. For most
forests LAD varies strongly with height; trees typically have more vegetation at
the top of the canopy than at the bottom. Dupont, and Brunet (Agricultural and
forest meteorology, 148(6), pp.976-990. 2008), simulated the flow through three
very different profiles of 𝑳𝑨𝑫 measured from three different Canadian forests,
and Moon, Duff, and Tolhurst (Fire Safety Journal, 2016), recently measured the
sub-canopy winds and 𝑳𝑨𝑫 for seven different Australian forest types. Thus
although, Large-Eddy Simulations (LES) of flow through idealised forests are now
computationally tractable, a systematic study of different 𝑳𝑨𝑫 profiles is missing,
which motivates our investigation. Here we assume that the 𝑳𝑨𝑫 can be
modelled by a Gaussian profile with two parameters representing the mean and
variance of the distribution of 𝑳𝑨𝑫. The total vegetation density is maintained
constant as the 𝑳𝑨𝑫 profile changes. We present preliminary simulation results
showing how the mean and variance of 𝑳𝑨𝑫 affects the sub-canopy wind
velocity, and we discuss a potential modelling approach for sub-canopy wind
velocity.
INTRODUCTION
Understanding sub-canopy wind profiles is of crucial importance to
parameterising the atmospheric boundary layer above a forest canopy and also
estimating wind reduction factors for fire spread models. An analytic model exists
for large, uniform canopy. That is, the occupied volume fraction, or leaf area
density (𝑳𝑨𝑫) of the canopy is constant over the whole canopy. The model of
Inoue [1963] is based on a balance between turbulent stresses and the drag
force of the canopy assuming a uniform canopy. Harman and Finnigan [2007]
significa ntly extended the Inoue model to include the above canopy flow and
non-neutral atmospheric conditions.

AFAC18: PROCEEDINGS FROM THE BUSHFIRE AND NATURAL HAZARDS CRC & AFAC CONFERENCE 2018 | REPORT NO. 367.2018
35
In nature, there is strong variation 𝑳𝑨𝑫 in all three spatial directions; the variation
is most prominent in the vertical direction because trees typically have more
vegetation at the top of the canopy than at the bottom. A limited investigation
of the effect of vertical distribution of 𝑳𝑨𝑫 on the sub-canopy wind profiles was
conducted byDupont et al. 2008. Three different observed profiles of 𝑳𝑨𝑫 from
different forests were used, and the profiles were scaled to give a range of five
different leaf area indices (integrated 𝑳𝑨𝑫). Dupont et al. drew several important
conclusions from this study: the gross features of the above canopy flow are
unchanged by canopy profile; increasing the total 𝑳𝑨𝐷 makes the features of
the canopy flow more pronounced; finally there is considerable variation in the
mean flow and turbulent profiles in the sub-canopy space. That is, close to the
ground the difference in flow and turbulence profiles caused by different 𝑳𝑨𝑫
profiles are seen more clearly.
Recently, Moon [2016] performed field measurements of sub-canopy wind
speeds in Australian vegetation. The measurements of 𝑳𝑨𝑫 by Moon et al. [2016],
and similar measurements made by Amiro [1990], show considerable variability
in the 𝑳𝑨𝑫 profiles for different forest types around the world. Dupont et al. [2008]
conduced simulations of canopy flow with three distinct 𝑳𝑨𝑫 profiles similar to
the spruce, pine, and aspen forests measured by Amiro [1990]. Here we
parameterise forests with a Gaussian 𝑳𝑨𝑫, systematically vary the mean and
variance of the 𝑳𝑨𝑫 distribution, and analyse the resulting sub-canopy flow with
an eye towards constructing simplified models of the sub-canopy wind profile.
NUMERICAL MODEL
We use Fire Dynamics Simulator (FDS) [McGrattan et al., 2013] to perform large
eddy simulations (LES) of canopy flow. In LES, the continuity and Navier-Stokes
equations are spatially filtered to retain the dynamically important large-scale
structures of the flow. In FDS, the filtering operation is implicit at the grid scale. The
largest eddies contain the most energy and therefore make the largest
contribution to momentum transport. The diffusive effect of the unresolved small
scales on the resolved large scales is non negligible. The constant Smagorinsky
Figure 1: The simulation domain showing the canopy region, shaded in green.
The boundaries in the 𝑥 − and 𝑦 −directions are periodic, the top boundary is free
slip and the bottom is a no-slip boundary.

AFAC18: PROCEEDINGS FROM THE BUSHFIRE AND NATURAL HAZARDS CRC & AFAC CONFERENCE 2018 | REPORT NO. 367.2018
36
sub-grid-scale stress model (see, for example, Pope, 2001) is used in this work with
the Smagorinsky constant set to 𝐶 = 0.1. The flow is maintained by a pressure
gradient equal to 0.005 Pa/m. The fluid is assumed to be air with density 𝜌 = 1.225
kg/m3 and viscosity 𝜈 = 1.8 × 10⁻⁵ m2s-1.
The overall domain size is 600 × 300 × 100 m (30ℎ × 15ℎ × 5ℎ), where the
height of the canopy is taken as ℎ = 20 m. The streamwise and spanwise
boundary conditions are periodic. The bottom (ground) boundary condition is
enforced using the log-law of the wall [Bou-Zeid et al., 2004]. The resolution of the
simulation 5 m in the horizontal directions and 0.5 stretched to 4 m at the top of
the domain. The resolution is approximately three times finer than the resolution
used by Bou-Zeid et al. [2009]. A sketch of the simulation domain and the canopy
location is shown in figure 1. The flow is allowed to develop to a statistically
stationary state over approximately 3600 s and statistics are sampled every 2 s
for 7200 s.
Following Dupont et al. [2011] the canopy of height ℎ is modelled as an
aerodynamic drag term of the form
𝐹𝐷,𝑖,𝑘 (𝑥, 𝑧) = 𝜌𝑐𝐷𝜒(𝑧; ℎ, 𝜇, 𝜎, 𝐴, 𝐵)(𝑢𝑗𝑢𝑗)1 2⁄
𝑢𝑖,
where the velocities are 𝑢𝑗 .The value of the drag coefficient is taken to be 𝑐𝐷 =
0.25 roughly consistent with the measurements of Amiro [1990] and the study of
Cassiani et al. [2008]. The function 𝜒(𝑧, ℎ, 𝜇, 𝜎, 𝐴, 𝐵), defines the spatial location of
the canopy. The canopy is assumed to have a constant height across the whole
domain. Below the canopy height there is some LAD profile. In this study the LAD
is assumed to be a Gaussian with some specified geometric mean 𝜇 and some
variance 𝜎. Physically, 𝜇 corresponds to the height at which the canopy is most
dense; 𝜎 roughly measures the width of the leafiest part of the tree crowns.
The LAD profile is:
𝜒(𝑧; ℎ, 𝜇, 𝜎, 𝐴, 𝐵) = {A exp (−
(𝑧 − 𝜇)2
𝜎2 ) + 𝐵 , 𝑧 ≤ ℎ
0 , 𝑧 > ℎ
,
We firstly assume that ℎ = 20 m is constant. The Leaf Area Index (LAI), that is
integral of LAD with respect to z over the canopy, is also fixed and for this report
we consider only 𝐿𝐴𝐼 = 1. We use this constraint to determine:
𝐴 =1 − 𝐵ℎ
∫ exp (−(𝑧 − 𝜇)2
𝜎2 ) 𝑑𝑧ℎ
0
.
Because A is considered to be positive, 𝐵 <1
ℎ. We somewhat arbitrarily assumed
that 𝐵 contributes approximately 10% of the LAD and therefore we fixed 𝐵
𝐴= 0.1.
This assumption was justified by fitting profiles to the measurements of Moon et
al. Profiles of LAD are shown in figure 2 and the simulation cases are tabulated in
table 1.

AFAC18: PROCEEDINGS FROM THE BUSHFIRE AND NATURAL HAZARDS CRC & AFAC CONFERENCE 2018 | REPORT NO. 367.2018
37
Table 1: Simulation LAD parameters for all cases. 𝐿𝐴𝐼 𝜇 𝜎2 𝐴 𝐵/𝐴
1.000 0.700 0.050 0.104 0.100
1.000 0.700 0.142 0.075 0.100
1.000 0.700 0.233 0.065 0.100
1.000 0.000 0.325 0.084 0.100
1.000 0.233 0.325 0.064 0.100
1.000 0.467 0.325 0.057 0.100
1.000 0.700 0.325 0.061 0.100
RESULTS AND DISCUSSION
The simulated mean wind profiles are shown in figure 3. The profiles are all
normalized by the value of the wind speed at the top of the canopy at 𝑧/ℎ = 1.
In figure 3(b) there is a significant local maximum at approximately 𝑧/ℎ = 0.3 for
the profile with 𝜇 = 0.7, 𝜎2 = 0.05 (red). The local maximum of velocity is likely to
be a consequence of using an imposed pressure gradient to drive the mean flow
through the domain.
The Harman and Finnigan [2007] model for neutral flow over a canopy with
known LAI and drag coefficient relies on three parameters: 𝛽 the ratio of friction
velocity to 𝑢(𝑧 = ℎ) −velocity at the canopy top, 𝑧0 the equivalent roughness
length of the canopy, and 𝑑 the displacement height of the canopy (defined
below). These three parameters may be measured from our simulations. The
computed 𝛽 are shown in figure 4, 𝑑 in figure 5, and 𝑧0 in figure 6 all plotted
against the canopy parameters 𝜇 and 𝜎2. 𝛽 shows weak linear growth with is
Figure 2: LAD profiles used in this study. In (a) 𝜎2=0.325 is held constant and 𝜇=
0.00 (red), 0.233 (green), 0.467 (blue), and 0.700 (black). In (b) 𝜇=0.70 is constant
and 𝜎2=0.325 (black – the same curve as in (a)), 0.233 (blue), 0.142 (green), and
0.050 (red).
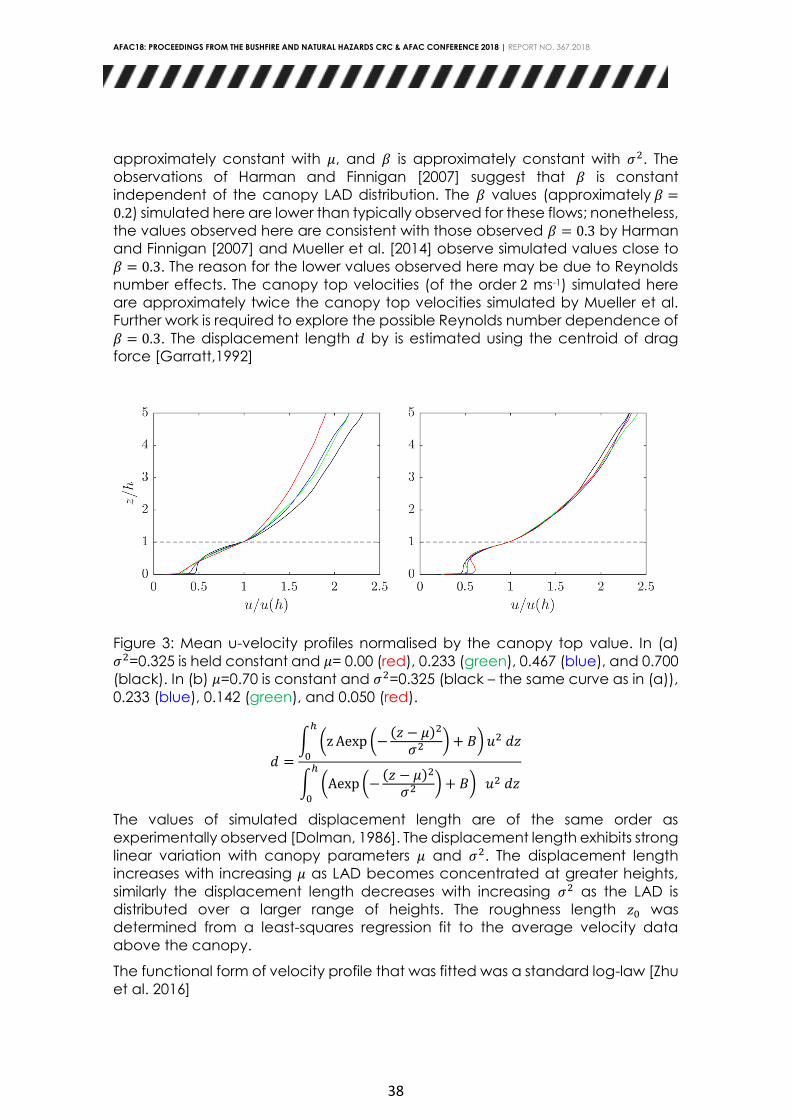
AFAC18: PROCEEDINGS FROM THE BUSHFIRE AND NATURAL HAZARDS CRC & AFAC CONFERENCE 2018 | REPORT NO. 367.2018
38
approximately constant with 𝜇, and 𝛽 is approximately constant with 𝜎2. The
observations of Harman and Finnigan [2007] suggest that 𝛽 is constant
independent of the canopy LAD distribution. The 𝛽 values (approximately 𝛽 =0.2) simulated here are lower than typically observed for these flows; nonetheless,
the values observed here are consistent with those observed 𝛽 = 0.3 by Harman
and Finnigan [2007] and Mueller et al. [2014] observe simulated values close to
𝛽 = 0.3. The reason for the lower values observed here may be due to Reynolds
number effects. The canopy top velocities (of the order 2 ms-1) simulated here
are approximately twice the canopy top velocities simulated by Mueller et al.
Further work is required to explore the possible Reynolds number dependence of
𝛽 = 0.3. The displacement length 𝑑 by is estimated using the centroid of drag
force [Garratt,1992]
𝑑 =
∫ (z Aexp (−(𝑧 − 𝜇)2
𝜎2 ) + 𝐵) 𝑢2 𝑑𝑧ℎ
0
∫ (Aexp (−(𝑧 − 𝜇)2
𝜎2 ) + 𝐵) 𝑢2 𝑑𝑧ℎ
0
The values of simulated displacement length are of the same order as
experimentally observed [Dolman, 1986]. The displacement length exhibits strong
linear variation with canopy parameters 𝜇 and 𝜎2. The displacement length
increases with increasing 𝜇 as LAD becomes concentrated at greater heights,
similarly the displacement length decreases with increasing 𝜎2 as the LAD is
distributed over a larger range of heights. The roughness length 𝑧0 was
determined from a least-squares regression fit to the average velocity data
above the canopy.
The functional form of velocity profile that was fitted was a standard log-law [Zhu
et al. 2016]
Figure 3: Mean u-velocity profiles normalised by the canopy top value. In (a)
𝜎2=0.325 is held constant and 𝜇= 0.00 (red), 0.233 (green), 0.467 (blue), and 0.700
(black). In (b) 𝜇=0.70 is constant and 𝜎2=0.325 (black – the same curve as in (a)),
0.233 (blue), 0.142 (green), and 0.050 (red).

AFAC18: PROCEEDINGS FROM THE BUSHFIRE AND NATURAL HAZARDS CRC & AFAC CONFERENCE 2018 | REPORT NO. 367.2018
39
𝑢 =𝑢∗
𝜅log
𝑧 − 𝑑
𝑧0 ,
where 𝜅 = 0.38 is von Karmann’s constant. The fitted values for 𝑧0 are in
agreement with the observations of Dolman [1986] and the values obtained for
𝑧0 do not exhibit

AFAC18: PROCEEDINGS FROM THE BUSHFIRE AND NATURAL HAZARDS CRC & AFAC CONFERENCE 2018 | REPORT NO. 367.2018
40
Figure 6: 𝑧0 roughness length variation with (a) 𝜇, and (b) 𝜎2
Figure 5: 𝑑 displacement length variation with (a) 𝜇, and (b) 𝜎2
Figure 4: 𝛽 displacement length variation with (a) 𝜇, and (b) 𝜎2

AFAC18: PROCEEDINGS FROM THE BUSHFIRE AND NATURAL HAZARDS CRC & AFAC CONFERENCE 2018 | REPORT NO. 367.2018
41
strong variation with the canopy parameters. These results suggest that 𝜇, the
geometric mean of LAD, is the only parameter that significantly influences the
above-canopy flow through the displacement length.
Inoue [1963] developed a momentum-balance model to determine the
sub-canopy wind profiles deep within a canopy. The Navier-Stokes
equations may be averaged in time and in space for a LAD that is
constant in the 𝑥 −, 𝑦 −, and 𝑧 −directions. The canopy is thought of as
infinitely deep. The pressure gradient term is also assumed to be
negligible relative to the turbulent stress term 𝜏𝑥,𝑧 and the drag term. The
momentum balance is then 𝜕𝜏𝑥,𝑧
𝜕𝑧+ 𝐹𝐷,𝑥 = 0 .
The turbulent stress term may then be modelled using the mixing length
approximation. The drag term is modeled as before, however, we
assume that the canopy has uniform leaf area index. This gives the
following ordinary differential equation
𝜕
𝜕𝑧(𝑙
𝜕𝑢
𝜕𝑧)
2
+ 𝑐𝐷𝐿𝐴𝐼𝑢2 = 0 ,
Boundary conditions are that the velocity derivative vanishes as 𝑧 → −∞
and the canopy top velocity 𝑈ℎ is known. The equation has solution:
𝑢 = 𝑈ℎ exp𝛽(𝑧 − ℎ)
𝑙 ,
Scaling arguments which depend on a constant 𝐿𝐴𝐷 profile show that
the mixing length 𝑙 = 2𝛽3 𝑐𝑑𝐿𝐴𝐼⁄ . Harman and Finnigan [2007] that the
exponential profile agrees sufficiently well with observed sub-canopy
profiles. The most commonly violated assumption of the Inoue model is
the canopy has finite depth. In practical terms, the Inoue model works
for the top part of the canopy and progressively makes poor predictions
near the ground. In these simulations there is the presence of a driving
pressure gradient and 𝐿𝐴𝐷 is not constant in the 𝑧 −direction. Hence we
expect that the model of Inoue [1963] will give poor agreement through
the canopy.
The model of Inoue is tested by comparing the simulated sub-canopy
velocity profiles with the modelled profiles using the firstly the simulated
values of 𝛽 (figure 4) and the value 𝛽=0.3 observed by Harman and
Finnigan [2007]. The comparison between the simulated and modelled
profiles are shown in figure 7(a) and (b). The modelled profiles with the
simulated value of 𝛽 do not agree well with the simulated profiles.
However, using the value of 𝛽=0.3 observed by Harman and Finnigan
[2007] improves the agreement in the top half of the canopy. To reduce
the discrepancy between the modelled and simulated profiles we
attempt to address the assumption of a constant LAD profile. Because
the displacement length is the only quantity that varies significantly with
the canopy parameters, it is hypothesised that 𝑑 is a more relevant
length scale than the constant canopy height ℎ. Therefore we define the
displacement length Leaf Area Index (𝑑𝐿𝐴𝐼) as

AFAC18: PROCEEDINGS FROM THE BUSHFIRE AND NATURAL HAZARDS CRC & AFAC CONFERENCE 2018 | REPORT NO. 367.2018
42
𝑑𝐿𝐴𝐼 = ∫ A exp (−(𝑧 − 𝜇)2
𝜎2 ) + 𝐵 𝑑𝑧
𝑑
0
,
that is, the leaf area index computed from 𝑧 = 0 to 𝑧 = 𝑑 instead of 𝑧 = ℎ.
The 𝑑𝐿𝐴𝐼 is then used in place of LAI in the Inoue model. The modified
model predictions, using the simulated values of 𝛽, are compared to the
simulated profiles in figure 7(c) and (d). Agreement between the
modeled and simulated profiles in the top half of the canopy is
significant but far from perfect. The modelled profiles do not agree with
the simulated in the bottom half of the canopy and further work is
required to improve the Inoue model in the near ground region.
CONCLUSIONS
The effect of LAD distribution on flow over a tree canopy was
investigated using LES. The geometric mean 𝜇 and variance 𝜎2 of the
LAD distribution were varied independently. The sub-canopy mean flow
profile was found to be sensitive to both 𝜇 and 𝜎2, with the emergence
of a prominent sub-canopy peak of 𝑢 −velocity. The parameters of the
above canopy flow, namely 𝛽 the ratio of shear stress to 𝑢 −velocity at
the canopy top and 𝑧0 the equivalent roughness length of the canopy,
and 𝑑 the displacement length, were found to be largely independent
of 𝜎2. 𝛽 exhibits a weak dependence on 𝜇 but 𝑧0 appears to be
independent of both 𝜇 and 𝜎2. The displacement length exhibits strong
linear dependence 𝜇 and a weaker linear dependence on 𝜎2. Finally
the sub-canopy 𝑢 −velocity model of Inoue [1963] was improved by
including the displacement length.
Acknowledgements
The authors are grateful to the administrators of Spartan, a high-performance
computing cluster at the University of Melbourne.
REFERENCES
B.D. Amiro. Comparison of turbulence statistics within three boreal forest canopies.
Boundary-Layer Meteorology, 51(1-2):99–121, 1990.
E. Bou-Zeid, C. Meneveau, and M.B. Parlange. Large-eddy simulation of neutral
atmospheric boundary layer flow over heterogeneous surfaces: Blending height and
effective surface roughness. Water Resources Research, 40(2), 2004.
E. Bou-Zeid, J. Overney, B. D. Rogers, and M. B. Parlange. The effects of building
representation and clustering in large-eddy simulations of flows in urban canopies.
Boundary-layer meteorology, 132(3):415–436, 2009.
M. Cassiani, G.G. Katul, and J.D. Albertson. The effects of canopy leaf area index on
airflow across forest edges: large-eddy simulation and analytical results. Boundary-
layer meteorology, 126(3):433–460, 2008.
A.J. Dolman, Estimates of roughness length and zero plane displacement for a foliated
and non-foliated oak canopy. Agricultural and forest Meteorology, 36(3), pp.241-248,
1986.
S. Dupont, and Y. Brunet, Influence of foliar density profile on canopy flow: a large-eddy
simulation study. Agricultural and forest meteorology, 148(6), pp.976-990, 2008.

AFAC18: PROCEEDINGS FROM THE BUSHFIRE AND NATURAL HAZARDS CRC & AFAC CONFERENCE 2018 | REPORT NO. 367.2018
43
S. Dupont, J-M. Bonnefond, M. R. Irvine, E. Lamaud, and Y. Brunet. Long-distance edge
effects in a pine forest with a deep and sparse trunk space: in situ and numerical
experiments. Agricultural and Forest Meteorology, 151(3):328–344, 2011.
J. Finnigan, Turbulence in plant canopies. Annual review of fluid mechanics, 32(1),
pp.519-571, 2000.
I.N. Harman and J. J. Finnigan. A simple unified theory for flow in the canopy and
roughness sublayer. Boundary-layer meteorology, 123(2):339–363, 2007.
E. Inoue. On the turbulent structure of airflow within crop canopies. Journal of the
Meteorological Society of Japan. Ser. II, 41(6):317–326, 1963.
C. Jin, I. Potts, and M.W. Reeks. A simple stochastic quadrant model for the transport and
deposition of particles in turbulent boundary layers. Physics of Fluids, 27(5), p.053305.
2015
K. McGrattan, S. Hostikka, and J.E. Floyd. Fire dynamics simulator, users guide. NIST special
publication, 1019, 2013.
K. Moon, T.J. Duff, and K.G. Tolhurst. Sub-canopy forest winds: understanding wind profiles
for fire behaviour simulation. Fire Safety Journal, 2016.
E. Mueller, W. Mell, and A. Simeoni. Large eddy simulation of forest canopy flow for
wildland fire modeling. Canadian Journal of Forest Research, 44(12):1534–1544,
2014.
S. B. Pope, Turbulent Flows, Cambridge University Press, Cambridge, U.K., 2000,
X. Zhu, G.V. Iungo, S. Leonardi, and W. Anderson. Parametric study of urban-like
topographic statistical moments relevant to a priori modelling of bulk aerodynamic
parameters. Boundary-Layer Meteorology, 162(2), pp.231-253, 2017.

AFAC18: PROCEEDINGS FROM THE BUSHFIRE AND NATURAL HAZARDS CRC & AFAC CONFERENCE 2018 | REPORT NO. 367.2018
44
Figure 7 Modelled and simulated sub-canopy 𝑢 −velocity profiles. (a and b)
contain the modelled profiles using the simulated 𝛽(triangle symbols) and the
observed 𝛽 (circle symbol) of Harman and Finnigan [2007] and a constant mixing
length based on 𝐿𝐴𝐼. The modelled profiles in (c and d) use the simulated 𝛽 and 𝑑𝐿𝐴𝐼.
(a) 𝜎2=0.325 is held constant and 𝜇= 0.00 (red), 0.233 (green), 0.467 (blue), and
0.700 (black). In (b) 𝜇=0.70 is constant and 𝜎2=0.325 (black – the same curve as
in (a)), 0.233 (blue), 0.142 (green), and 0.050 (red). (c) and (d) are the same
curves as (a) and (b) respectively.

AFAC18: PROCEEDINGS FROM THE BUSHFIRE AND NATURAL HAZARDS CRC & AFAC CONFERENCE 2018 | REPORT NO. 367.2018
45
PYROCONVECTIVE INTERACTIONS AND DYNAMIC FIRE PROPAGATION Non-peer reviewed research proceedings from the Bushfire and Natural
Hazards CRC & AFAC conference
Perth, 5 – 8 September 2018
J.E. Hilton1,2, R.L. Badlan4, A.L. Sullivan3,4, W. Swedosh2, C.M. Thomas1,3, J.J. Sharples1,4
1 Bushfire and Natural Hazards CRC 2 CSIRO Data 61 3 CSIRO Land and Water 4 School of Physical, Environmental and Mathematical Sciences, UNSW.
Corresponding author: [email protected]
AFAC18: PROCEEDINGS FROM THE BUSHFIRE AND NATURAL HAZARDS CRC & AFAC CONFERENCE 2018 | REPORT NO. 367.2018
46
ABSTRACT
Pyroconvective interactions and dynamic fire propagation
Modelling the dynamic propagation of wildfires remains a significant challenge.
Pyroconvective interactions between the fire and the atmosphere, or between
different parts of the fire itself, can produce distinctly non-steady modes of fire
propagation that cannot be accounted for using current operational models.
While sophisticated three-dimensional models (e.g. computational fluid
dynamics (CFD) models or coupled fire-atmosphere models) have been
successfully applied to wildfires, their computational requirements render them
impractical for operational usage.
Here we discuss a computationally efficient two-dimensional propagation
model, which can accurately replicate dynamic features of fire spread that
cannot be simulated using existing two-dimensional models. These features
include the development of a wind-driven fire line into a parabolic shape,
attraction between nearby fires and the observed closing behaviour of junction
fires. The model is compared to experimental results with good agreement.
The model incorporates a simple sub-model to account for the inflow of air
generated by a fire, which allows the model to run orders of magnitude faster
than full physical models, while still capturing many of the essential features of
dynamic fire propagation. We argue that such a model could lead to
significant improvements in operational wildfire prediction.
In addition, we will highlight some recent insights in to how the geometry of a
fire line and the flaming zone influences development of the pyroconvective
plume above a fire. In particular, we present evidence that the geometry of
the burning region can affect plume development in a way that is comparable
to the effect of total energy release.

AFAC18: PROCEEDINGS FROM THE BUSHFIRE AND NATURAL HAZARDS CRC & AFAC CONFERENCE 2018 | REPORT NO. 367.2018
47
INTRODUCTION
Computer modelling of wildfire behaviour is needed and used for a number of
purposes. These range from risk management and operational predictions of a
potential or actual wildfire in progress, to complex physics-based models
investigating the complex processes and dynamics of wildfires. Currently, many
operational prediction systems use rapid two-dimensional perimeter
propagation models, which are based on empirical rate-of-spread models for
various fuel types. Perimeter propagation models use a range of different
computational algorithms such as cellular automata, front-tracking techniques
and level set methods [1]. Generally, these methods track or model the fire
perimeter and advance the perimeter based on local fuel, weather and
topographic information to provide a prediction of the wildfire’s extent at
future times. Although very fast (taking on the order of seconds to minutes to
complete a prediction of several simulated hours) they are limited by the
nature of the perimeter propagation algorithm. In contrast, three-dimensional
physics-based wildfire models can model the entire combustion and air flow
dynamics around a wildfire to a high degree of accuracy as they are based on
discretisation and solution of the fluid and thermo-dynamic equations [2].
Currently, however, these models are too slow to be used in operational
predictions (taking on the order of hours to days to complete a prediction on a
supercomputer).
MODELLING WITH NEAR-FIELD TECHNIQUES
We introduce a two-dimensional perimeter propagation model that
incorporates aspects of a full three-dimensional physics-based model using
near-field approximations to fire-induced flows. Specifically, the model
comprises a two-dimensional perimeter propagation approach with an
additional physics-based component allowing new types of fire behaviour to
be predicted rapidly enough for operational usage. The additional component
is a nearfield approximation to the ground-level fire-induced flow 𝒖, which is
represented using a Helmholtz decomposition in terms of a local scalar
potential, 𝜓, and a vector potential, 𝝌 (see Eq. (1)). The scalar potential is,
essentially, the ground-level pressure field in the presence of any fires and the
vector potential arises from any large-scale sources of vorticity present around
the fire
𝒖 = ∇𝜓 + ∇ × 𝝌. (1)
This new near-field model requires two additional computational steps in
comparison to a standard perimeter propagation model. The first is the
calculation of the source terms for the near-field and the second is the
calculation of the field itself requiring the solution of a two-dimensional Poisson

AFAC18: PROCEEDINGS FROM THE BUSHFIRE AND NATURAL HAZARDS CRC & AFAC CONFERENCE 2018 | REPORT NO. 367.2018
48
equation for the scalar potential and a solution of set of two-dimensional
Poisson equations for the vector potential:
∇2𝜓 = −𝜕𝑧𝑤, ∇2𝝌 = 𝝎, (2)
where 𝑤 is the vertical air flow and 𝝎 is a specified vorticity. From comparison
and investigation to experimental fires the vector potential appears to be
negligible in most cases, although may be important in certain situations where
wind interacts with topography to form lateral vortices.
Once the set of Poisson equations, Eq. (2), are solved, the local wind field due
to near-field effects can be calculated using Eq. (1) and added to the global
(ambient) wind field. In this work, all simulations were carried out in the Spark
framework [5], a level set based perimeter propagation solver. The Poisson
equations, Eq. (2), were solved using a multigrid technique.
FIGURE 1 – ISOCHRONES FROM TWO FIRES SIDE-BY-SIDE WITHOUT NEAR-FIELD COUPLING (LEFT) AND WITH NEAR-FIELD COUPLING (RIGHT). THE NEAR-
FIELD COUPLING THE TWO FIRES TO ATTRACT, AS IS OBSERVED IN EXPERIMENTS.
The use of near-field techniques permits modelling of aspects of fire behaviour
that were previously difficult, or impossible, to simulate in two-dimensional
perimeter propagation approaches. This includes the attraction between
nearby fires, as shown in Fig. 1, which has been observed in experimental fires.
A second behaviour is the parabolic rounding exhibited by a wind-driven fire
line. Fig. 2 shows an example of the progression of a fire line lit in uniform wind
conditions and a comparison to the near-field model. There is an excellent
match between the simulation and experimental results, and the parabolic
rounding arises naturally when using the near-field approach.

AFAC18: PROCEEDINGS FROM THE BUSHFIRE AND NATURAL HAZARDS CRC & AFAC CONFERENCE 2018 | REPORT NO. 367.2018
49
FIGURE 2 – COMPARISON OF NEAR-FIELD MODEL TO EXPERIMENTAL RESULTS (LEFT) AND SIMULATION ISOCHRONES SHOWING PARABOLIC ROUNDING
ARISING NATURALLY FROM THE MODEL (RIGHT). FIGURE ADAPTED FROM [3].
The expression for the source term in Eq. (2) is dependent on a vertical
displacement of air from the fire. This is mathematically identical to a forcing
term from lifting of air over terrain, and this can easily be incorporated into the
model (Fig. 3, left) resulting in a mass-correcting wind behaviour with minimal
additional computational overhead. The simulated fire in this example is started
downwind of a ridge (elevation is shown as shaded grey in the image, with
black high elevation) and can be seen to accelerate on the windward slope
and decelerate on the lee slope of the ridge. Vorticity terms (if present) can
easily be incorporated into the model (Fig. 3, right). This image shows an
example of a vortex source in the ground plane (a single component of 𝝎,
representing circulation in the ground plane), where the vertical component of
the vector potential is shown in greyscale.
FIGURE 3 – INCORPORATION OF TERRAIN INTO THE NEAR-FIELD MODEL AS A SOURCE TERM FOR THE SCALAR POTENTIAL (LEFT). EXAMPLE OF FIRE
PROPAGATION IN THE PRESENCE OF A VORTEX POINT SOURCE (RIGHT).

AFAC18: PROCEEDINGS FROM THE BUSHFIRE AND NATURAL HAZARDS CRC & AFAC CONFERENCE 2018 | REPORT NO. 367.2018
50
The method potentially allows fire line interaction, wind and terrain effects, fire
shape development and vortex sources to be incorporated in perimeter
propagation using a single computational approach. In particular, it could
accommodate dynamic modes of fire propagation such as vorticity-driven
lateral spread [5] within two-dimensional fire simulators.
Although the near-field model has been implemented here using a level set
solver, the process could be applied to other perimeter propagation methods.
The near-field approach may improve the accuracy of rapid computational
models with low additional overhead suitable for operation usage.
FIRE COALESCENCE AND DEEP FLAMING
When multiple spot fires form ahead of the main fire front in reasonably close
proximity, they can coalesce in such a way that expansive zones of active
flame are formed. Such instances have been referred to as ‘deep flaming’
events.
Deep flaming has been hypothesised as being a necessary part of firestorm
development – the core of the convective plume above a deep flaming event
is quasi-isolated from the entrainment of ambient air that occurs on the plume
boundary. As a consequence, deep flaming is more likely to result in plumes
that penetrate deeper into the atmosphere. This means that the common
notion that pyroconvective potential is driven by the total energy release of a
fire is in error, and that the geometry and spatial expanse of the flaming zone
are additional factors that must be considered.
Effect on pyroconvective plume development
In research funded by the Australian Research Council, the effect of the spatial
expanse of a surface heat source was investigated using the Weather
Research and Forecasting (WRF) model. Specifically, WRF simulations using
idealised surface heat fluxes were used to examine how the maximum plume
height was affected by the spatial configuration of the surface heating.
Figure 4 shows the results for plumes emanating from a circular heat source, a
broad rectangular heat source and a thin rectangular heat source. The thin
rectangular heat source is more representative of a normal linear fire front,
whereas the circular source is more like a deep flaming event. As can be seen,
despite each heat source having exactly the same total energy release, the
plume emanating from the circular heat source penetrates above the
tropopause at 12 km, while the thin rectangular heat source only reaches a
height of about 6-7 km.

AFAC18: PROCEEDINGS FROM THE BUSHFIRE AND NATURAL HAZARDS CRC & AFAC CONFERENCE 2018 | REPORT NO. 367.2018
51
FIGURE 4 – THE EFECT OF THE SPATIAL CONFIGURATION OF SURFACE HEAT FLUX ON PYROCONVECTIVE PLUME DEVELOPMENT. THE FIGURES IN THE
TOP ROW SHOW THE GEOMETRY OF THE HEAT FLUX. THE TOTAL ENERGY RELEASE IS THE SAME IN EACH CASE.
REFERENCES 1 Sullivan, A.L. (2009). Wildland surface fire spread modelling, 1990-2007. 3: Simulation and mathematical
analogue models. International Journal of Wildland Fire 18, 387-403.
2 Sullivan, A. L. (2009). Wildland surface fire spread modelling, 1990-2007. 1: Physical and quasi-physical
models. International Journal of Wildland Fire 18, 349-368.
3 Hilton, J. E., Sullivan, A. L., Swedosh, W., Sharples, J., Thomas, C. (2018). Incorporating convective feedback
in wildfire simulations using pyrogenic potential, Environmental Modelling and Software 107, 12-24.
4 The Spark wildfire simulation framework: research.csiro.au/spark/
5 Simpson, C. C., Sharples, J. J., Evans, J. P., McCabe, M. F. (2013) Large eddy simulation of atypical wildland
fire spread on leeward slopes. International Journal of Wildland Fire 22, 599-614.

AFAC18: PROCEEDINGS FROM THE BUSHFIRE AND NATURAL HAZARDS CRC & AFAC CONFERENCE 2018 | REPORT NO. 367.2018
52
SIMULATIONS OF THE WAROONA FIRE WITH THE ACCESS-FIRE COUPLED FIRE ATMOSPHERE MODEL Non-peer reviewed research proceedings from the Bushfire and Natural
Hazards CRC & AFAC conference
Perth, 5 – 8 September 2018
Mika Peace1,2, Jeffrey Kepert1,2 and Harvey Ye2 1 Bushfire and Natural Hazards CRC 2 Bureau of Meteorology
Corresponding author: [email protected]

AFAC18: PROCEEDINGS FROM THE BUSHFIRE AND NATURAL HAZARDS CRC & AFAC CONFERENCE 2018 | REPORT NO. 367.2018
53
ABSTRACT
SIMULATIONS OF THE WAROONA FIRE WITH THE ACCESS-FIRE COUPLED FIRE ATMOSPHERE MODEL
Mika Peace, Jeff Kepert and Harvey Ye, High Impact Weather, Bureau of
Meteorology, Australia.
The Australian Community Climate and Earth-System Simulator (ACCESS)
Numerical Weather Prediction (NWP) model has been coupled to a fire spread
prediction model called ACCESS-Fire (Monash and Melbourne universities,
publication in preparation). The ACCESS-Fire model presents a coupled fire-
atmosphere modelling capability that is linked to the Australian Bureau of
Meteorology's operational weather forecasting system.
The fire spread code in ACCESS-Fire is implemented by a level set solver and
includes several fire spread models, including options for Rothermel, McArthur
and CSIRO forest and grassland. It uses high-resolution topography and
detailed fuel maps can be included as available. The sensible and latent heat
energy fluxes from the fire are passed back to the atmospheric code through
the land-surface scheme JULES. The fire model has been built into the ACCESS
high-resolution nested suite using an advanced graphical user and scheduler
interface.
ACCESS-Fire simulations have been run on the Waroona fire, which burnt over
68,000 ha south of Perth in January 2016. Over 160 homes were destroyed and
there were two fatalities. During the first two days of the fire, there were four
episodes of extreme fire behaviour. Two separate pyrocumulonimbus events
developed and two evening ember storms occurred. The fire behaviour at the
Waroona fire was driven by three dimensional fire-atmosphere interactions, and
such processes can be examined using a coupled fire-atmosphere model.
This paper will describe key features of the coupled fire-atmosphere model
ACCESS-Fire and present results from simulations of the Waroona fire. Features
of the simulations include fire-modified winds in the environmental flow,
dynamic plume effects near steep topography and exploration of
pyrocumulonimbus processes.

AFAC18: PROCEEDINGS FROM THE BUSHFIRE AND NATURAL HAZARDS CRC & AFAC CONFERENCE 2018 | REPORT NO. 367.2018
54
EXTENDED ABSTRACT
INTRODUCTION Bushfires are a part of the Australian landscape. Periodically, during significant
fire events, they burn with devastating consequences to the community and
environment. Such fires release significant amounts of energy during the
combustion process, and this energy modifies the structure of the surrounding
atmosphere. The local three-dimensional wind fields surrounding the fire are
altered from their background state, and this can then affect how the fire
evolves. The vertical atmospheric stability structure will also influence the depth
of the fire plume and the circulation within it, as well as development of pyro-
convective cloud.
Traditional approaches to assessing fire risk and anticipating fire behavior do
not take into account the atmospheric structure and feedback processes.
Internationally, evidence suggests that fires are increasing in size and
frequency, with greater impacts to human populations. Consequently, there is
a growing emphasis on understanding the underlying science driving fire and
atmosphere interactions, with investment towards developing predictive tools
that will assist fire managers to anticipate and mitigate against the impacts of
large, dynamic fires.
Coupled fire-atmosphere models are one mechanism through which this can
be achieved. Coupled fire-atmosphere models link an empirical (or dynamical)
fire spread model to a numerical weather prediction system. Several coupled
models are in use internationally and, in view of the impacts of fire on the
Australian community, an Australian coupled modelling capability is prudent
and consistent with the objectives of other countries with fire-prone landscapes.
The aim of our project is to develop an Australian capability for coupled fire-
atmosphere modelling that lies on the same platform as our operational
numerical weather prediction systems, and to test the model on a set of case
studies of actual events.
COUPLED FIRE-ATMOSPHERE MODELLING Coupled fire-atmosphere models link an atmospheric model with a fire spread
model. There are two main approaches in use, the first is a numerical weather
prediction atmospheric models linked to an empirical fire spread model, as in
WRF-Fire (Coen et. al, 2013). ACCESS-Fire follows the same approach as WRF-
Fire, with a different NWP framework. The second approach to coupled
modelling employs dynamical rather than empirical fire spread (e.g. FireTec
(Linn et. al, 2007) and ForeFire (Filippi et. al, 2018)). The dynamical approaches
are currently limited to a research capability due to the computational
requirements, however future upgrades and refinements may reduce the
current restrictions. Dynamical approaches have had limited uptake in Australia
to date, however investigation of this method would be worthwhile.

AFAC18: PROCEEDINGS FROM THE BUSHFIRE AND NATURAL HAZARDS CRC & AFAC CONFERENCE 2018 | REPORT NO. 367.2018
55
An advanced international application of coupled fire modelling has been
implemented in the USA state of Colorado, where their operational fire
prediction project uses the WRF-Fire model (Coen et. al, 2013) as a component
of the system (WRF-Fire has a similar operational NWP and empirical fire
approach as ACCESS-Fire).
There are known limitations when using empirical approaches to calculate fire
spread. However, it is beyond the scope of this project to investigate and refine
the methodologies for solving fire spread.
Although there are challenging and unresolved research questions to address
regarding the best approach to modelling interactions between a fire and
atmosphere, previous studies using coupled fire-atmosphere (empirical and
NWP) models have demonstrated that the results provide useful insights into the
physical processes and reconcile well with observations (e.g. Kochanski et. al.,
2013 and others). This is consistent with our initial simulations using ACCESS-Fire.
Our results are promising as they capture features including plume dynamics,
fire modified winds extending some distance from the fire, vorticies on the fire
front, pyro-convective cloud condensation processes and enhanced vertical
motion adjacent to the topographic discontinuity of the Darling Scarp.
ACCESS-FIRE ACCESS-Fire is an empirical fire model coupled to the ACCESS framework.
ACCESS is the Australian Community Climate and Earth Systems Simulator and is
the national high-resolution numerical weather prediction (NWP) modelling
system.
The ACCESS model operates under the UK Unified Model (UM) framework,
developed by the UK Met Office. ACCESS can be considered as an Australian
adaptation of the UM model.
ACCESS is Australia's premier operational weather forecasting model and is also
our national model for climate simulations. Our coupled simulations are made
with the ACCESS system run in research mode on the National Computing
Infrastructure (NCI) supercomputer "raijin".
The fire code component of the ACCESS-Fire model was developed in a
collaboration between Monash and Melbourne universities and has been
provided to the Bureau of Meteorology and the BNHCRC.
The fire code interfaces with the NWP model through the land surface scheme
JULES (Joint UK Land Environment Simulator) (Best et. al, 2011, Clark et. al. 2011).
After each time step of the atmospheric model, wind and other required input
variables are passed to the fire model, which then calculates a fire perimeter
advance by level set mathematical method using empirical algorithms for fire
spread. From the change in fire perimeter, the quantity of fuel consumed and
resulting sensible and latent heat fluxes are calculated, which are passed back
to the atmospheric model. These heat and moisture fluxes then modify the

AFAC18: PROCEEDINGS FROM THE BUSHFIRE AND NATURAL HAZARDS CRC & AFAC CONFERENCE 2018 | REPORT NO. 367.2018
56
surrounding wind fields at subsequent time steps, which creates the coupling
process.
The current fire model includes code for CSIRO grassland and forest, McArthur
and Rothermel empirical models.
ACCESS-Fire has been configured as a high resolution 'nested suite'. Current
runs include nests run at resolutions of 4 km, 1.3 km, 400 m and 100 m. The initial
and boundary conditions are currently set using ACCESS-G archived grids, but
may be modified to accept a range of NWP models. The fire suite is
relocatable across Australia to run any new event when boundary conditions
are available. Current settings use a constant value to describe fuel state, but
high resolution variable fuel grids may be included. Topography data is from
SRTM (Shuttle Radar Topography Mission); the 90 m and 30 m DEM (digital
Elevation Models) datasets have been tested.
Further development planned for the coming year includes: implementation of
national fuel grids; steps towards inclusion of the fire model in the main
UM/ACCESS release, which will make the model available to a range of users;
and further refinements to the fire code to increase resolution between the
inner meteorological nest and the fire grid, which can current be set at a 1:1 or
1:2 ratio.
THE WAROONA FIRE The Waroona fire burnt 69,000 ha south of Perth on 6 and 7 January 2016, with
devastating consequences for the towns of Waroona and Yarloop and the
broader community of Western Australia. During the first two days of the fire
there were four periods of particular interest. Pyrocumulonimbus developed
over the fire on the evening of 6 January and around midday 7 January.
Destructive ember showers driven by downslope winds occurred two evenings
running; the first over the town of Waroona on 6 January, then the town of
Yarloop was destroyed during early evening on 7 January. None of the four
episodes of extreme fire behaviour matched the time of highest fire danger as
measured by fire danger indices.
ACCESS-FIRE SIMULATIONS OF THE WAROONA FIRE Simulations have been run of the Waroona fire, noting that the model is under
continuing development. The results shown here are experimental and
configurations are still being tested; full simulation details will be reported in due
course. Three different fire models have been tested, with significant
differences seen in the resulting fire spread and perimeter using the McArthur
forest, CSIRO forest and Rothermel options (see Fig. 1). Rothermel produces the
fastest fire spread (a known factor with this model), while McArthur and CSIRO
simulations produce fire spread that is much slower than expected compared
to the observations and fire reconstruction. These differences will be
investigated further as the study progresses and calibrations may be included in

AFAC18: PROCEEDINGS FROM THE BUSHFIRE AND NATURAL HAZARDS CRC & AFAC CONFERENCE 2018 | REPORT NO. 367.2018
57
order to facilitate investigation of dynamic processes. It is not an objective of
this study to validate or improve the empirical fire-spread models that are
implemented in the coupled model, therefore calibration of fire spread to
match observations so that fire-atmosphere processes can be explored is
considered to be an acceptable approach.
Figure 1. ACCESS-Fire simulations of the Waroona fire using the fire
spread models CSIRO forest, Rothermel and McArthur forest as labelled.
Simulation period varies slightly due to computational restrictions.
Following the results of the Waroona case study (Peace et. al., 2017), there are
two main processes that the investigation with the coupled model may explore.
These are 1) the ability of the model to resolve and develop pyrocumulonimbus
and associated dynamics and 2) the interactions between downslope winds
and the fire plume and resulting potential to enhance ember storms.
Experiments modelling pyrocumulus clouds have had mixed success. LES
idealized studies (e.g. Thurston et. al., 2016) have produced good and insightful
results, and the very highly idealized study of Cunningham and Reeder (2009)
produced a pyrocumulonimbus and fire tornado. However, experiments in a
real atmosphere with coupled fire-atmosphere models that attempt to
reproduce observed pyrocumulonimbus in "real" cases have had more limited
success (personal communications and lack of published evidence in the
literature). Therefore, in setting the objective of these simulations, it has been
determined to focus on the processes of downslope wind interaction with the
fire plume. This approach is appropriate as the timing of downslope wind onset
resulted in the greatest impacts to the community; due to loss of lives and

AFAC18: PROCEEDINGS FROM THE BUSHFIRE AND NATURAL HAZARDS CRC & AFAC CONFERENCE 2018 | REPORT NO. 367.2018
58
homes destroyed. In addition, the downslope wind risk is known to affect other
locations around Australia as well as other fire prone countries and evidence
from simulations will make a valuable contribution towards informing
operational tools.
Figure 2 shows results of the Rothermel simulations when the fire is near the base
of the scarp. In the simulation shown, the temporal conditions do not match the
time of the observed ember shower, however, it is encouraging that the
coupled model does resolve fire-modified winds and interactions with
topographic features. Also apparent are vortices along the fire front and a
deeper fire line near the base of the scarp.
Figure 2. ACCESS-Fire simulations showing fire perimeter and (left)heat
flux and wind vectors and (right) topography.
Figure 3 shows a vertical cross-section from west to east across the coastal plain
and scarp. The fire is located near the base of the scarp (the edge of the
topography profile) and the features and discontinuities seen in the vertical
cross sections arise from the fire plume interacting with the vertical atmospheric
structure. There are several features of interest. The vertical extent of the plume
is considerable, extending above the depth of 4 km shown in the plots, with the
plume structure showing significant perturbations from the atmospheric
background state. The perturbations in potential temperature are confined to a
relatively narrow column above the simulated fire, indicating limited extent of
mixing and entrainment in the horizontal direction. The vertical velocity shows
maximum speed near 30 m/s, with the maxima elevated a considerable
distance above the surface, rather than just above the heat flux. This elevated

AFAC18: PROCEEDINGS FROM THE BUSHFIRE AND NATURAL HAZARDS CRC & AFAC CONFERENCE 2018 | REPORT NO. 367.2018
59
maxima is consistent with the results of Charney et. al. (2018). Horizontal wind
speed is highest over the scarp to the east of the fire, however the
perturbations are highly asymmetrical with stronger winds on the (eastern)
upstream side of the plume and much lighter winds on the (western)
downstream plume. The cloud water is indicative of cloud development and
the skill of the model in resolving these cloud processes will continue to be
explored.
Figure 3. ACCESS-Fire simulation showing vertical cross section west to
east across the Waroona fire. Top left: potential temperature. Top right:
vertical velocity. Bottom left: horizontal wind speed. Bottom right: cloud
water.
As this study progresses, we aim to vary initial conditions and fire-line timing in
order to examine the temporal variation in fire activity near the base of the
scarp with time of day. As the downslope winds, or scarp winds are a known
evening and overnight process, this approach will provide a series of simulations
that allow an investigation of how a fire in a particular location responds to
varying atmospheric stability and vertical wind profile due to diurnal temporal
conditions.
Improved understanding of the processes will inform development of predictive
tools and support future fire management activities and planning decisions
(e.g. Kepert et. al. 2016). Downslope winds often develop at a time of day
when traditional measures of fire behaviour indicate a decrease in fire risk due
to lowering of temperatures overnight. Exploring the sensitivities of downslope
winds and fire behaviour as they can be captured in the model framework, will

AFAC18: PROCEEDINGS FROM THE BUSHFIRE AND NATURAL HAZARDS CRC & AFAC CONFERENCE 2018 | REPORT NO. 367.2018
60
provide a theoretical basis to develop practical operational tools that will
enhance decision making in similar environments and may enable mitigation of
impacts in future events.
FUTURE PROJECT WORK - SIR IVAN FIRE Parallel to these simulations of the Waroona fire, our CRC project is working on
ACCESS-Fire simulations of the Sir Ivan fire. The Sir Ivan fire burnt on a day of
'catastrophic' fire risk in NSW at the end of a heatwave and during extended
drought. Fire risk was enhanced by an unstable atmosphere and a northwest
to southerly wind change during the afternoon. Pyrocumulonimbus developed
coincident with the passage of the wind shift. RFS NSW collected an
unprecedented set of observational data during the event, which presents an
opportunity for detailed verification against simulation results. Simulations of the
Sir Ivan fire are underway (see poster at AFAC 2018) and the continuing analysis
will examine the fire environment in detail and produce a detailed comparison
of the observational data and the results of simulations.
FUTURE PROJECT WORK - COUPLED FIRE-ATMOSPHERE MODELLING IN AUSTRALIA Following the preparation of the two case studies currently in progress on the
Waroona and Sir Ivan fires, the project will report on current status of coupled
fire-atmosphere modelling in Australia and overseas and present an objective
assessment of the various opportunities for the path forwards for this avenue of
fire predictive services. The planned report will examine current capabilities
internationally, the pros and cons of the varying modelling approaches, the
benefits of coupled modeling, the context of current and future computing
capabilities, the enhanced capability enabled by robust user interfaces, data
availability, initialisation and real-time data integration. Ensuing discussion will
mesh with requirements for timely operational decision making and other
factors. Input will be requested from a range of Australian stakeholders; please
contact the project team if you would like to contribute to the discussions.

AFAC18: PROCEEDINGS FROM THE BUSHFIRE AND NATURAL HAZARDS CRC & AFAC CONFERENCE 2018 | REPORT NO. 367.2018
61
REFERENCES Best et al. (2011): The Joint UK Land Environment Simulator (JULES), model description – Part 1:
Energy and water fluxes. Geosci. Model Dev. 4:677–699
Clark et al. (2011): The Joint UK Land Environment Simulator (JULES), model description – Part 2:
Carbon fluxes and vegetation dynamics. Geosci. Model Dev. 4:701–722.
Charney J. J., Goodrick, S. L., Heilman, W. E., Keyser, D., Potter, B., Ruthford, J., and Srock A. F.
(2018). The effect of static stability on the atmospheric response to a wildland fire, 12th Fire and
Forest Meteorology Symposium
Coen, J. L., Cameron, M., Michalakes, J., Patton, E. G., Riggan, P. J. and Yedinak, K. M. (2013).
WRF-Fire: Coupled Weather–Wildland Fire Modeling with the Weather Research and Forecasting
Model, Journal of Applied Meteorology and Climatology, Vol 52, 1
Cunningham, P., and Reeder, M. J. (2009). Severe convective storms initiated by intense wildfires:
Numerical simulations of pyro-convection and pyro-tornadogenesis, Geophysical Research
Letters, Vol. 36, L12812, doi:10.1029/2009GL039262, 2009
Filippi, J-B., Bosseur, F., Mari, C. and Lac, C. (2018). Simulation of a Large Wildfire in a Coupled Fire-
Atmosphere Model. Atmosphere, 9, 218.
Kepert, J., Tory, K., Thurston, W., Ching, S., Fawcett, R. and Yeo, C. (2016). Fire Escalation by
Downslope Winds, BNHCRC Hazard Note, Issue 24.
Kochanski, Adam & Jenkins, Mary & Mandel, Jan & D. Beezley, Jonathan & Clements, Craig &
Krueger, Steven. (2013). Evaluation of WRF-SFIRE performance with field observations from the
FireFlux experiment. Geoscientific Model Development. 6. 1109–1126. 10.5194/gmd-6-1109-2013.
Linn, R., Winterkamp, J., Edminster. C., Colman, J.J. and Smith, W. S. (2007). Coupled influences of
topography and wind on wildland fire behaviour, International Journal of Wildland Fire, 16, 183-
195.
Peace, M., McCaw, L., Santos, B., Kepert, J., Burrows, N. and Fawcett, R.. (2017). Meteorological
drivers of extreme fire behaviour during the Waroona bushfire, Western Australia, January 2016,
Journal of Southern Hemisphere Earth Systems Science, Vol. 67/2, pp 79-106.
Thurston, W., Tory, K., Fawcett, R. J. B., and Kepert, J. (2016). Large-eddy simulations of pyro-
convection and its sensitivity to moisture. 5th International Fire Behaviour and Fuels Conference

AFAC18: PROCEEDINGS FROM THE BUSHFIRE AND NATURAL HAZARDS CRC & AFAC CONFERENCE 2018 | REPORT NO. 367.2018
62
AUSTRALIA'S FUTURE NATIONAL HEATWAVE FORECAST AND
WARNING SERVICE: OPERATIONAL CONSIDERATIONS.
Non-peer reviewed research proceedings from the Bushfire and Natural Hazards
CRC & AFAC conference
Perth, 5 – 8 September 2018
John Nairn1,, Robert Fawcett2, Linda Anderson-Berry2, Bertram Ostendorf3, Peng Bi3, Chris
Beattie4, Mark Cannadine5
1. Bureau of Meteorology, Adelaide, South Australia, Australia
2. Bureau of Meteorology, Melbourne, Victoria, Australia
3. University of Adelaide, Adelaide, South Australia, Australia
4. State Emergency Service, Adelaide, South Australia, Australia
5. Department of Health, South Australia, Australia
Corresponding author: [email protected]

AFAC18: PROCEEDINGS FROM THE BUSHFIRE AND NATURAL HAZARDS CRC & AFAC CONFERENCE 2018 | REPORT NO. 367.2018
63
ABSTRACT
Heat wave is Australia's deadliest natural hazard. It is responsible for more hazard-related deaths than all other natural hazards combined. The incidence of severe and extreme heatwaves in Australia has been considerable and is projected to increase. Recent efforts to mitigate the impact of this rising frequency and severity of heatwave events across the nation has witnessed State and Territory authorities warning for impacts across human health, infrastructure, utilities, community events and business activities whilst the Bureau of Meteorology introduced a national heatwave service. Consultation across emergency services, health and media sectors has established the requirement for a national heatwave warning framework. Within the health sector separate calls have been made for a nationalised approach to heatwave warnings.
We describe an operational partnership model for emergency and health agencies community information and warnings facilitated by the Bureau's future heatwave forecasts and warnings in a multi-hazard warning framework.
Epidemiological studies have demonstrated that the Bureau's severity scale has skill in predicting health impacts in Western Australia, South Australia and New South Wales. The UK Meteorological Office has included the Bureau's heatwave and coldwave methodology in their Global Hazard Map project where it is also demonstrating acceptable levels of accuracy in identifying high impact events around the world.
The Bureau has supplied a national warm season heatwave severity service since January 2014 in the form of seven continental scale severity maps, updated once a day. Predictive skill and heatwave event severity characterisation reports for summers 2013-14, 2014-15, 2015-16 and 2016-17 have been circulated to the Bureau's internal Heatwave Services Reference Group to enable consideration and validation of the current heatwave service. This verification work is scheduled to continue with upgraded diagnostics included here for the 2017-18 season.
Future emergency services and human health information and warning services are prototyped using recently developed gridded heatwave service data. Heatwave forecast and warning services are demonstrated to characterise how each partner's information and warning services would have been supported during the 2017-18 summer.
EXTENDED ABSTRACT
Heatwave is now clearly understood to be Australia's deadliest natural hazard. Where once it
was difficult to directly and accurately attribute deaths to discrete periods of extreme heat,
(heatwaves), robust methodologies can now be applied to define and measure the direct and
indirect, and tangible and intangible impacts of heat on human health and wellbeing (including
mortality and morbidity), livelihoods, industry (including energy) infrastructure and agriculture.
Since the late 1800's extreme heat events have killed at least 5332 people and throughout the
twentieth century heatwaves have been responsible for more than the sum of all other hazard
related fatalities. More recently, in the period 2000 to 2010, 475 deaths are directly attributed to 8
events, including 435 from the 2009 Southern Heatwave, and 2 other events where over 10
deaths occurred (Risk Frontiers).
The entire Australian community is at some risk of suffering some level of harm or loss related to
heat. The Australian Business Roundtable Report (p18) identified that in the 30 years between
1987 and 2016, 509 deaths; 2,800 injuries; and a total of 4,603,00 people were affected. They
noted that during heatwaves generally there are more hospital admissions for mental health
issues, workplace accidents and injuries, power outages and transport interruptions; which disrupt
supply chains, businesses and community services and increase both the direct and indirect
economic costs.

AFAC18: PROCEEDINGS FROM THE BUSHFIRE AND NATURAL HAZARDS CRC & AFAC CONFERENCE 2018 | REPORT NO. 367.2018
64
Heatwaves trends and projections exhibit an increase in frequency and intensity under
a warming climate (Alexander et al., 2009; Kiktev, Sexton, Alexander, & Folland, 2004; Meehl & Tebaldi, 2004; Perkins, Alexander, & Nairn, 2012; Russo et al., 2014; Tollefson, 2012). Heatwaves extract a heavy toll upon vulnerable communities and on rarer occasions high intensity impacts spread to healthy people through failure of infrastructure, utilities and inadequate adaptation strategies (Department of Human Services & Victorian Government Department of Human Services Melbourne, 2009; Le Tertre et al., 2006; Mechler, Hochrainer, Aaheim, Salen, & Wreford, 2010; Yates, 2013).
Historically, human communities at greatest direct risk and most vulnerable to the health impacts
during heatwaves have usually been considered to be the elderly, the very young and those
working outdoors. However, in recent times death rates have decreased in the very young, most
likely due to the wide availability of air conditioning and good monitoring of hydration and infant
health. In the over 75 age bracket both mortality and morbidity rates are now marginally
increasing. This may be related to increased opportunity for underlying health conditions that
make them more susceptible. Australia's population is aging and this will increase the numbers in
this at-risk cohort. Based on medium-level growth assumptions, the Australian Bureau of Statistics
(ABS) projects the population to grow to 28.8 million by 2030 with the number of people aged 65
and over to rise by 91% and those aged 85 and over to more than double (ABS, 2008b). The
elderly are also more likely to be increasingly living alone in urban dwellings where security
concerns encourage keeping windows and doors closed, thus reducing ventilation, and
economic concerns discourage the use of air-conditioning. Risk relating to exposure, on the other
hand, is decreasing and with effective early warning can continue to decrease. Those working
outdoors and exposed to the elements in relation to work such as farming, mining, labouring and
travelling and those engaging in extreme sporting activities can reduce their exposure and thus
their risk with effective risk mitigation actions.
With or without climate warming, climatic extreme warning systems are required to
reduce the risk of disasters, (Kovats & Kristie, 2006; Zia & Wagner, 2015). Choice of heatwave indices suitable for use in these systems must satisfy the following criteria:
1. Extreme values match user experience, 2. Useful as indicator of impact , 3. Seamless services across climate records, 7-day, multi-week, seasonal and
climate projection forecasts, 4. Ease of interpretation, and common to both policy and operational users 5. Mapped to provide timely and locally specific guidance, and 6. Operate within a multi-hazard warnings framework
Agencies tasked with generating the necessary environmental assessments, forecasts
and warnings must also consider how policy-makers across the health sector, infrastructure and utilities can prepare and adjust to future climate scenarios. National meteorological agencies now consider seamless services as an achievable standard. Weather service infrastructure is easier to sustain and maintain, and enables clearer forecast and warnings messages consistent with a common protocol. A common message used in climate assessments and projections is more readily adopted when coupled with seamless daily, weekly and even seasonal forecast schemas. Policies that are replicated in operational practices will improve adoption and communication, and allow better partnerships within and between agencies.

AFAC18: PROCEEDINGS FROM THE BUSHFIRE AND NATURAL HAZARDS CRC & AFAC CONFERENCE 2018 | REPORT NO. 367.2018
65
Effective mitigation and response requires a negotiated national heatwave warnings framework in which the national weather service, emergency services and health agencies coordinate messages. The diversity of Australian extreme heat hazard lead-agencies across state and territory jurisdictions mandates the development of this framework to ensure a consistent service for the Australian community.
Recent investigations have focused on the need to understand and measure heatwave
intensity in a manner that is meaningful for each location. Percentiles-based heatwave metrics are recommended to satisfy the locality criteria (Perkins & Alexander, 2013), whilst the development of an intensity calculation that is meaningful to any sector has produced the Heat Wave Magnitude Index (HWMI) and its daily derivative HWMId (Russo, Sillmann, & Fischer, 2015). Similar to HWMI, the Excess Heat Factor (EHF) (Nairn & Fawcett, 2014) measures heatwave intensity at each location with an additional component to account for adaptation. Whilst similar in principle to HWMI, EHF has distinctions worthy of note. Rather than the use of maximum temperature alone, daily temperature is considered important due to minimum temperature compounding extremes through modification of the diurnal heating cycle (Black, Blackburn, Harrison, Hoskins, & Methven, 2004; Chen & Zhai, 2017). EHF’s assembly from long and short-term daily temperature anomalies creates a power-law time series that permits a novel normalization technique to build a dimensionless severity index (see Appendix A for derivation and supporting examples). Severity analyses have spatial and temporal consistency that has enabled the development of heatwave services.
The Bureau of Meteorology in Australia(the Bureau) and National meteorological
agencies, the UK and United States have either put into operation or under evaluation the Excess Heat Factor (Nairn & Fawcett, 2014) for heatwave severity analysis and forecasts. The Bureau’s heatwave service has published 7-day heatwave severity maps on the internet since 2014 (Bureau of Meteorology, 2014). The UK Met Office is evaluating 7-day probability maps of heatwave (and coldwave) within their Global Hazard Map (GHM) project (Helen A. Titley and Joanne C. Robbins, 2013) whilst the Bureau (Hudson & Marshall, 2014) and NOAA (personal communication, University of Maryland) have funded experimental multi-week probability maps. The Bureau is also contributing EHF heatwave severity maps to the Copernicus project (Gobron et al., 2016) for users to envisage meaningful heatwave climate change scenarios.
Percentile-based heatwave indices can be spatially constrained as their scaling against
local climate variability can inhibit sensible inter-site comparisons and spatial analysis. They are reliable for time-series analysis at each location and spatially analysed for climate change purposes when rates of change are investigated (Perkins et al., 2012). Converting EHF intensity [°C2
L] to dimensionless EHF severity enables heatwave magnitude spatial analysis.
Epidemiological studies (Hatvani-Kovacs, Belusko, Pockett, & Boland, 2015; Herbst et
al., 2014; Jegasothy, McGuire, Nairn, Fawcett, & Scalley, 2017; Langlois, Herbst, Mason, Nairn, & Byard, 2013; Scalley et al., 2015; Xiao et al., 2017) have demonstrated EHF severity dose/response skill for morbidity and mortality in Australia for both city and regional communities. These multidisciplinary studies have formed the basis for partnership discussions between health agencies, emergency services and the Bureau for development of a national heatwave forecast and warning framework. EHF severity has been shown to be useful as an exposure index that scales well against human health impact for and

AFAC18: PROCEEDINGS FROM THE BUSHFIRE AND NATURAL HAZARDS CRC & AFAC CONFERENCE 2018 | REPORT NO. 367.2018
66
between exposed locations. EHF severity is an effective dimensionless impact index for Australia. As a percentile-based index, constructed on statistics of extremes principles it is being tested in real-time on global platforms (GHM, NOAA) and developed on climate projections (Copernicus). Forecasts for the Australian 2017-2018 summer are demonstrated, with examples of decision support products that would enable dialogue between warning agencies. Forecast skill must also be considered when using this guidance for message generation. An assessment of the 2017-2018 summer forecast skill is presented as part of this discussion.
1. Summer 2017-2018 Heatwave Forecasts
Since the start of the Bureau's heatwave service in January 2014, it has prepared annual reports (e.g., Fawcett, 2015; Fawcett, 2016) on the performance of the service, focussing on the months of the heatwave season (typically November to March, but with October and/or April able to be included according to the observed heatwave activity). As the heatwave service is based on forecasts of the EHF, current verification efforts are focussed on assessing the performance of the EHF forecasts. This involves comparing the forecasts against analysed EHF via (i) integrated positive EHF across the heatwave season, (ii) number of heatwaves (three-day periods with positive EHF), (iii) number of severe heatwaves, (iv) number of extreme heatwaves and (v) time series of percentage area in heatwave, severe heatwave and extreme heatwave. Time series of percentage area overlap between observed and forecast heatwave, severe heatwave and extreme heatwave can also be calculated. Figure 1 shows one of these forecast verification products for the 2017/2018 heatwave season. It shows a comparison of the time series of percentage area of Australia observed to be in heatwave with the percentage areas forecast at each of the five operational forecast lags. The percentage areas are calculated for all three-day periods in the five months in the heatwave season (day 1 in the plot is the three-day period from 29 October to 1 November 2017). While this plot does not show whether or not the forecast heatwaves were in the same places as the observed heatwaves, it does show that to a large extent the forecast system was generating heatwaves of an appropriate magnitude at the right times, and that no large-scale heatwaves went unforecast.
Figure 1: Percentage area of Australia in heatwave conditions (black line) and as forecast
(coloured lines), November 2017 to March 2018. Day 1 is the three-day period 29 October to 1

AFAC18: PROCEEDINGS FROM THE BUSHFIRE AND NATURAL HAZARDS CRC & AFAC CONFERENCE 2018 | REPORT NO. 367.2018
67
November 2017. Coloured lines above (below) the black line indicate over-forecasting (under-
forecasting).
The three-day EHF forecasts are themselves derived from forecasts of daily maximum and
minimum temperature, which are combined to generate forecasts of daily temperature. The
performance of those temperature forecasts can be assessed directly and has been reported on.
2. Heatwave Warning Decision Support (2017-2018)
The following discussion considers how the Bureau heatwave service data can be used to
support warning messages. Message content is not discussed in this extended abstract.
Figure 2 (inset) shows observed three-day EHF severity for 12 February 2018 for Australia and
Queensland utilising severity thresholds used by the Bureau of meteorology's heatwave service.
Figure 2. Observed (Day 0) EHF Severity map for Queensland, Central West District, 12 February
2018.
Figure 2 shows the weather districts used by the Bureau for issue of forecasts and warnings
across Australia. The Central West weather district is shown in detail with principle cities and towns
displayed. The sequence of observed heatwave severity maps for 8 to 15 February in Figure 3
shows growing heatwave severity as it moved up from New South Wales, with peak severity over
central Queensland on 12 February.

AFAC18: PROCEEDINGS FROM THE BUSHFIRE AND NATURAL HAZARDS CRC & AFAC CONFERENCE 2018 | REPORT NO. 367.2018
68
Figure 3. Observed (Day 0) EHF Severity maps, 8 to 15 February 2018. Central West weather district
(Queensland) stippled.
Throughout summer seven heatwave severity maps were issued, corresponding to any row
in Table 1.
Observed heatwaves for Longreach and Isisford shown in column 'Day0' correspond to the
values mapped in Figures 2 and 3. Forecasts shown in Table 1 are shown with the date of issue
(Date), which corresponds to Today(0). Columns labelled Day-2, Day-1, Today (0), Day+1, Day+2,
Day+3 and Day+4 correspond to the seven heatwave service maps (not shown) issued on that day
(Date) by the Bureau.

AFAC18: PROCEEDINGS FROM THE BUSHFIRE AND NATURAL HAZARDS CRC & AFAC CONFERENCE 2018 | REPORT NO. 367.2018
69
Date Town Day(0) Day-2 Day-1 Day0 Day+1 Day+2 Day+3 Day+4
2018-02-
03
Longrea
ch 0 0.09 -0.45 -0.75 -0.82 -0.66 -0.57 -0.43
Isisford 0 0.01 -0.55 -0.70 -0.70 -0.53 -0.46 -0.32
2018-02-
04
Longrea
ch 0 -0.46 -0.74 -0.80 -0.61 -0.58 -0.46 -0.17
Isisford 0 -0.62 -0.76 -0.67 -0.49 -0.44 -0.31 -0.04
2018-02-
05
Longrea
ch 0 -0.75 -0.80 -0.54 -0.50 -0.44 -0.28 0.04
Isisford 0 -0.74 -0.64 -0.46 -0.42 -0.34 -0.17 0.12
2018-02-
06
Longrea
ch 0 -0.79 -0.54 -0.49 -0.45 -0.30 -0.02 0.98
Isisford 0 -0.64 -0.46 -0.44 -0.39 -0.24 0.03 0.88
2018-02-
07
Longrea
ch 0 -0.51 -0.47 -0.46 -0.36 -0.11 0.39 2.07
Isisford 0 -0.44 -0.41 -0.39 -0.30 -0.06 0.54 2.19
2018-02-
08
Longrea
ch 0 -0.47 -0.44 -0.33 -0.07 0.66 2.63 3.81
Isisford 0 -0.42 -0.39 -0.27 -0.01 0.74 2.39 3.24
2018-02-
09
Longrea
ch 0 -0.44 -0.30 -0.02 0.86 2.66 2.66 1.98
Isisford 0 -0.38 -0.24 0.05 1.22 2.89 2.76 1.89
2018-02-
10
Longrea
ch 0.25 -0.37 -0.09 0.82 2.64 2.81 2.34 1.60
Isisford 0.80 -0.31 -0.02 1.18 2.89 2.81 2.02 1.12
2018-02-
11
Longrea
ch 2.29 -0.20 0.34 2.43 2.86 2.39 1.54 1.22
Isisford 3.53 -0.12 0.62 2.66 2.86 2.06 1.32 0.81
2018-02-
12
Longrea
ch 3.19 0.20 2.16 3.67 3.36 2.44 1.29 0.51
Isisford 3.62 0.51 2.53 3.53 3.01 2.11 1.05 0.42
2018-02-
13
Longrea
ch 2.52 2.06 3.70 3.16 2.50 1.06 0.52 0.33
Isisford 1.97 3.08 4.14 2.86 1.90 0.81 0.43 0.41
2018-02-
14
Longrea
ch 1.15 3.88 3.21 2.22 1.08 0.87 0.55 0.16
Isisford 0.59 4.72 3.16 1.56 0.63 0.46 0.30 0.13
2018-02-
15
Longrea
ch 0.90 2.16 1.16 0.52 0.38 0.28 0.15 0.02
Isisford 0.62 2.13 0.64 0.26 0.16 0.18 0.13 0.02
2018-02-
16
Longrea
ch 0.49 1.05 0.51 0.62 0.32 0.11 -0.04 -0.20
Isisford 0.55 0.67 0.34 0.37 0.20 0.07 -0.09 -0.28
2018-02-
17
Longrea
ch 0.74 0.22 0.27 0.34 0.13 -0.11 -0.33 -0.43
Isisford 0.82 0.25 0.19 0.19 0.03 -0.17 -0.41 -0.50
2018-02-
18
Longrea
ch 0.20 0.56 0.86 0.19 -0.14 -0.46 -0.63 -0.58

AFAC18: PROCEEDINGS FROM THE BUSHFIRE AND NATURAL HAZARDS CRC & AFAC CONFERENCE 2018 | REPORT NO. 367.2018
70
Isisford 0.21 0.45 0.69 0.11 -0.15 -0.46 -0.61 -0.57
Table 1. EHF Severity values for Queensland, Central West District towns of Longreach and Isisford,
7 to 13 February 2018.
On 12 February 2018 the Bureau's heatwave service forecast an extreme heatwave (>3) for
Longreach and Isisford (Day0: 3.70, 4.14) which verified as an extreme heatwave (Day(0): 3.19,
3.62). The long-range forecast (Day+4) issued on 8 February forecast an extreme event (3.81, 3.24),
although subsequent forecasts included lower values (lowest 2.66). The example provided in Table
1 shows the evolution of forecast guidance for the strongest heatwave observed over Australia for
the 2017/2018 warm season. In this instance a severe/extreme heatwave worthy of community
warning messages was sustained throughout the development and easing of the heatwave event
that moved into the Central west forecast district. Further analysis is warranted for weaker
heatwave events that are closer to the recommended heatwave warning threshold (severity 1).
Community consultation/research is required to understand how warnings would be received if
communicated as a State, Weather District or Township impact event, whilst considering the spatial
characteristics of forecast skill. This consultation must also consider appropriate warning lead-time
and the development of standardised operating procedures for multi-hazard message
construction amongst partner warning agencies.
3. Multi-Agency Heatwave Warnings
Whilst the appetite from the Bureau and emergency and health services across the jurisdictions
for a national approach to heatwave warnings and messaging is clear, the challenges of
establishing a coordinated nationwide methodology in a federated system are equally apparent.
Neither emergency or health services are exclusively the control or lead agency for heatwave
across Australia's jurisdictions. Consequently, each jurisdiction is locked into existing nomenclature
and process. There is undoubtedly efficiency in governance and systems currently in place for
mitigation and response to heatwaves by jurisdictional lead agencies. However, heat health
impacts are just one consideration. Heat related impacts on infrastructure, continuity of utilities,
efficiency of transport systems and industry impacts also require management. Contemporary
governance in public policy, including disaster management, must evolve from a hierarchical
command-and-control focus developed from central/national government-led programs focused
on response and recovery. International and intergovernmental collaboration and coordination
on disaster risk reduction, mitigation and preparedness has evolved through the United Nations
International Strategy for Disaster Reduction’s Sendai Framework. The Sendai Framework aspires to
achieve “substantial reduction of disaster risk and losses in lives, livelihoods and health and in the
economic, physical, social, cultural and environmental assets of persons, businesses, communities
and countries”. The framework places primary responsibility for reducing disaster risks on nation
states and recommends they share this responsibility with local governments, the private sector,
academia, civil society and other stakeholders (UNISDR, 2015). The Australian Government in turn
has established the National Resilience Taskforce to reduce the impacts of natural disasters on the
Australian community, including establishing a national disaster risk information capability to equip
decision-makers and Australians with the knowledge they need to prepare for natural disasters
(Ministry of Home Affairs, 2018).
Greater collaboration and coordination is required to change our approach to health impacts
of heatwave. Incorporation of a national heatwave warning framework to inform clear and
consistent community messages, requires new governance considerations. A more adaptive
governance must address more than Federal, State and Local Government responsibilities. The
operational partnership must include the Bureau, emergency and health agencies, non-

AFAC18: PROCEEDINGS FROM THE BUSHFIRE AND NATURAL HAZARDS CRC & AFAC CONFERENCE 2018 | REPORT NO. 367.2018
71
government, business and community sectors. Meaningful community messaging must be
mapped backward from the community we aim to inform and not focus on existing biases and
assumptions. At the international and national levels our commitment to reducing disaster risk and
providing information to help people and communities prepare is clear. We need to listen to those
communities and understand the language and messages that makes sense to them and build a
path back to the existing and effective national heatwave warnings, adapting and flattening out
our governance along the way.
REFERENCES Alexander, L. V, Tapper, N., Zhang, X., Fowler, H. J., Tebaldi, C., & Lynch, A. (2009). Climate
extremes: progress and future directions. International Journal of Climatology, 29(3), 317–
319. https://doi.org/10.1002/joc.1861
Black, E., Blackburn, M., Harrison, G., Hoskins, B., & Methven, J. (2004). Factors contributing to the
summer 2003 European heatwave. Weather, 59(8), 217–223. Retrieved from
http://search.proquest.com/docview/20985311/abstract/embedded/WOY0TUJ6YL5SGXRJ?
source=fedsrch
Bureau of Meteorology. (2014). pilot heatwave forecast service. Retrieved from
http://www.bom.gov.au/australia/heatwave/index.shtml
Chen, Y., & Zhai, P. (2017). Revisiting summertime hot extremes in China during 1961–2015:
Overlooked compound extremes and significant changes. Geophysical Research Letters.
https://doi.org/10.1002/2016GL072281
Department of Human Services, & Victorian Government Department of Human Services
Melbourne, V. (2009). January 2009 heatwave in Victoria: an assessment of health impacts.
Retrieved from
http://docs.health.vic.gov.au/docs/doc/F7EEA4050981101ACA257AD80074AE8B/$FILE/heat
_health_impact_rpt_Vic2009.pdf
Gobron, N., Adams, J. S., Cappucci, F., Lanconelli, C., Mota, B., & Mélin, F. (2016). Joint research
centre copernicus climate change service (C3S) fitness for purpose (F4P) platform. In
European Space Agency, (Special Publication) ESA SP.
Hatvani-Kovacs, G., Belusko, M., Pockett, J., & Boland, J. (2015). Can the Excess Heat Factor
Indicate Heatwave-Related Morbidity? A Case Study in Adelaide, South Australia.
EcoHealth. https://doi.org/10.1007/s10393-015-1085-5
Helen A. Titley and Joanne C. Robbins. (2013). Met Office Global Hazard Map – a prototype GIS
Web Map Service for forecasting high-impact weather across the globe for the week
ahead. EMS Annual Meeting Abstracts, 10(EMS2013–256,2013), 1. Retrieved from
http://meetingorganizer.copernicus.org/EMS2013/EMS2013-256.pdf
Herbst, J., Mason, K., Byard, R. W., Gilbert, J. D., Charlwood, C., Heath, K. J., … Langlois, N. E. I.
(2014). Heat-related deaths in Adelaide, South Australia: Review of the literature and case
findings - An Australian perspective. Journal of Forensic and Legal Medicine, 22, 73–78.
Retrieved from http://www.scopus.com/inward/record.url?eid=2-s2.0-
84891792363&partnerID=40&md5=11d50c1217089a88bb497aa5f05ea80f
Hudson, D., & Marshall, A. G. (2014). Extending the Bureau of Meteorology’s heatwave forecast to
multi-week timescales.
Jegasothy, E., McGuire, R., Nairn, J., Fawcett, R., & Scalley, B. (2017). Extreme climatic conditions
and health service utilisation across rural and metropolitan New South Wales. International
Journal of Biometeorology, 61(8). https://doi.org/10.1007/s00484-017-1313-5
Kiktev, D., Sexton, D., Alexander, L., & Folland, C. (2004). Comparison of modeled and observed
trends in indices of daily climate extremes (vol 16, pg 3560, 2003). Journal of Climate, 17(12),
2489. https://doi.org/10.1175/1520-0442(2004)017<2489:c>2.0.co;2
Kovats, R. S., & Kristie, L. E. (2006). Heatwaves and public health in Europe. European Journal of
Public Health. https://doi.org/10.1093/eurpub/ckl049
Langlois, N., Herbst, J., Mason, K., Nairn, J., & Byard, R. W. (2013). Using the Excess Heat Factor
(EHF) to predict the risk of heat related deaths. Journal of Forensic and Legal Medicine,
20(5). https://doi.org/10.1016/j.jflm.2012.12.005

AFAC18: PROCEEDINGS FROM THE BUSHFIRE AND NATURAL HAZARDS CRC & AFAC CONFERENCE 2018 | REPORT NO. 367.2018
72
Le Tertre, A., Lefranc, A., Eilstein, D., Declercq, C., Medina, S., Blanchard, M., … Ledrans, M. (2006).
Impact of the 2003 heatwave on all-cause mortality in 9 French cities. Epidemiology, 17(1),
75–79. Retrieved from http://www.ncbi.nlm.nih.gov/pubmed/16357598
Mechler, R., Hochrainer, S., Aaheim, A., Salen, H., & Wreford, A. (2010). Modelling economic
impacts and adaptation to extreme events: Insights from European case studies. Mitigation
and Adaptation Strategies for Global Change, 15(7), 737–762.
https://doi.org/10.1007/s11027-010-9249-7
Meehl, G. A., & Tebaldi, C. (2004). More intense, more frequent, and longer lasting heat waves in
the 21st century. Science, 305(5686), 994–997.
Ministry of Home Affairs. (2018, April 10). Reforms to reduce impact of natural disasters in Australia.
Retrieved from The Hon Angus Taylor MP:
http://minister.homeaffairs.gov.au/angustaylor/Pages/reforms-to-reduce-impact-of-natural-
disasters-in-australia.aspx
Nairn, J., & Fawcett, R. (2014). The Excess Heat Factor: A Metric for Heatwave Intensity and Its Use
in Classifying Heatwave Severity. Int J Environ Res Public Health, 12(1), 227. Retrieved from
http://www.mdpi.com/1660-4601/12/1/227
Perkins, S. E., Alexander, L. V., & Nairn, J. R. (2012). Increasing frequency, intensity and duration of
observed global heatwaves and warm spells. Geophysical Research Letters, 39(20).
https://doi.org/10.1029/2012GL053361
Perkins, S. E., & Alexander, L. V. (2013). On the Measurement of Heat Waves. Journal of Climate,
26(13), 4500–4517. https://doi.org/10.1175/jcli-d-12-00383.1
Russo, S., Dosio, A., Graversen, R. G., Sillmann, J., Carrao, H., Dunbar, M. B., … Vogt, J. V. (2014).
Magnitude of extreme heat waves in present climate and their projection in a warming
world. Journal of Geophysical Research Atmospheres, 119(22).
https://doi.org/10.1002/2014JD022098
Russo, S., Sillmann, J., & Fischer, E. M. (2015). Top ten European heatwaves since 1950 and their
occurrence in the coming decades. Environmental Research Letters, 10(12), 124003.
https://doi.org/10.1088/1748-9326/10/12/124003
Scalley, B. D., Spicer, T., Jian, L., Xiao, J., Nairn, J., Robertson, A., & Weeramanthri, T. (2015).
Responding to heatwave intensity: Excess Heat Factor is a superior predictor of health
service utilisation and a trigger for heatwave plans. Australian and New Zealand Journal of
Public Health, 6. https://doi.org/10.1111/1753-6405.12421
Tollefson, J. (2012). Heatwaves blamed on global warming. Nature, 488(7410), 143–144.
UNISDR. (2015). Sendai Framework. Geneva: UNISDR.
Xiao, J., Spicer, T., Jian, L., Yun, G. Y., Shao, C., Nairn, J., … Weeramanthri, T. S. (2017). Variation in
population vulnerability to heat wave in Western Australia. Frontiers in Public Health, 5(APR).
https://doi.org/10.3389/FPUBH.2017.00064
Yates, A. (2013). Death modes from a loss of energy infrastructure continuity in a community
setting. Journal of Homeland Security and Emergency Management.
https://doi.org/10.1515/jhsem-2012-0048
Zia, A., & Wagner, C. H. (2015). Mainstreaming Early Warning Systems in Development and
Planning Processes: Multilevel Implementation of Sendai Framework in Indus and Sahel.
International Journal of Disaster Risk Science. https://doi.org/10.1007/s13753-015-0048-3

AFAC18: PROCEEDINGS FROM THE BUSHFIRE AND NATURAL HAZARDS CRC & AFAC CONFERENCE 2018 | REPORT NO. 367.2018
73
MENTAL HEALTH AND WELLBEING IN THE POLICE AND EMERGENCY SERVICES SECTOR Non-peer reviewed research proceedings from the Bushfire and Natural
Hazards CRC & AFAC conference
Perth, 5 – 8 September 2018
David Lawrence1,2, Wavne Rikkers1,2 and Jennifer Bartlett1,2 1 The University of Western Australia 2 Bushfire and Natural Hazards CRC
Corresponding author: email

AFAC18: PROCEEDINGS FROM THE BUSHFIRE AND NATURAL HAZARDS CRC & AFAC CONFERENCE 2018 | REPORT NO. 367.2018
74
ABSTRACT
While work in the emergency services sector is vital to the wellbeing of our communities, it can
often be demanding and stressful. People who work or volunteer for ambulance, fire and rescue,
police and state emergency services can face life and death challenges and at times respond
to very distressing situations. Supporting and protecting the wellbeing of police and emergency
service employees and volunteers is a key priority across the sector.
beyondblue is currently undertaking the National Mental Health and Wellbeing Study of Police
and Emergency Services, with support from the Bushfire and Natural Hazards CRC. Phase two of
this study involves the first nationally representative survey of police and emergency services
workers and volunteers in Australia. This survey, called Answering the Call, is being conducted by
The University of Western Australia and Roy Morgan Research on behalf of beyondblue. With
participation from over 30 agencies from all Australian states and territories, the survey is
investigating the prevalence of wellbeing and mental health conditions, the use of support
services and programs, stigma, workplace culture and dynamics and other factors that impact
on the wellbeing of police and emergency services personnel.
While results from the survey are expected to be released later in 2018, this presentation will
discuss the approach that was taken to measure issues affecting mental health and wellbeing,
the challenges faced in conducting the survey; and barriers and opportunities in engaging with
agencies across the sector. An overview of what is already known from previous research in
police and emergency services agencies and related sectors both in Australia and internationally
will also be provided.

AFAC18: PROCEEDINGS FROM THE BUSHFIRE AND NATURAL HAZARDS CRC & AFAC CONFERENCE 2018 | REPORT NO. 367.2018
75
PREVALENCE AND PREDICTORS OF MENTAL HEALTH IN FIREFIGHTERS Non-peer reviewed research proceedings from the Bushfire and Natural
Hazards CRC & AFAC conference
Perth, 5 – 8 September 2018
Heather Bancroft1,2 1Bushfire and Natural Hazards CRC 2Phoenix Australia – Centre for Posttraumatic Mental Health, University of
Melbourne, Victoria
Corresponding author: [email protected]

AFAC18: PROCEEDINGS FROM THE BUSHFIRE AND NATURAL HAZARDS CRC & AFAC CONFERENCE 2018 | REPORT NO. 367.2018
76
ABSTRACT
PREVALENCE AND PREDICTORS OF MENTAL HEALTH IN FIREFIGHTERS Firefighters’ role in emergency management exposes them to a range of
stressors. It is recognised that a small but sometimes significant proportion of
firefighters will develop mental health problems that may create significant
distress and costs to the individual and the fire service. However, the literature is
inconclusive not only about the prevalence of the commonly experienced
mental health disorders associated with exposure to potentially traumatic
events (Heinrichs et al., 2005; Del Ben et al., 2006; Regehr et al., 2003), but also
about the range of factors associated with their development (Marmar et al.,
2006; Meyer et al., 2012; Di Gangi et al., 2013).
This paper presents the findings of a longitudinal study of mental health in
Australian firefighters that is being conducted in the course of a PhD. 335
firefighters from four Australian fire services completed a self-report survey
twice, 12 months apart, and 300 firefighters participated in a structured clinical
interview. The purpose of the study was to establish the prevalence rates, and
the factors which contributed to the development of posttraumatic stress
disorder, depression, anxiety and alcohol disorder in this sample of career and
volunteer firefighters.
The presentation will address the following key questions:
• What is the prevalence of the most common posttraumatic mental
health problems, namely - posttraumatic stress disorder, depression,
anxiety and alcohol use disorders, amongst this sample of Australian
firefighters?
• How does the mental health of volunteer and career firefighters in
this sample differ?
• What is the relative contribution of demographic factors, exposure to
traumatic events, operational and organisational factors to poor
mental health outcomes?
• Which factors are most significant in contributing to firefighters’
better and worse mental health?
• What are the implications of these findings for fire services?
End User Statements ‘I believe what you are proposing will be of great use to our industry ... ACT Fire
and Rescue would be very keen to be involved in your study.’ Paul Swain AFSM
Chief Officer ACT Fire and Rescue
‘AFAC can see great value in this project and are very supportive and willing to
be consulted as required.’ Stuart Ellis AM CEO AFAC

AFAC18: PROCEEDINGS FROM THE BUSHFIRE AND NATURAL HAZARDS CRC & AFAC CONFERENCE 2018 | REPORT NO. 367.2018
77
INTRODUCTION
Firefighters’ role in emergency management exposes them to a range of
stressors. It is recognised that a small but sometimes significant proportion of
firefighters will develop mental health problems that may create significant
distress and costs to the individual and the fire service. However, the literature is
inconclusive not only about the prevalence of the commonly experienced
mental health disorders associated with exposure to PTEs (Wagner et al., 1998;
Heinrichs et al., 2005; Del Ben et al., 2006; Regehr et al., 2003), but also about
the individual, operational and organisational risk and protective factors
associated with their development (Marmar et al., 2006; Meyer et al., 2012; Di
Gangi et al., 2013).
BACKGROUND
The existing literature has examined the impact of four contributing factors on
psychological outcomes. The most commonly recognised and researched are
the risks associated with attendance at potentially traumatic events (PTEs)
including fire, hazardous material, accidents, and natural and human made
disasters. Secondly, a range of individual factors have also been investigated,
including prior trauma, prior psychological adjustment, family history of
psychopathology (Ozer et al, 2003), negative and critical self-appraisals (Bryant
& Guthrie, 2007), sense of helplessness, unemployment and younger age
(Bryant & Harvey, 1995; 1996), low levels of perceived support (Meyer et al,
2012), coping styles and personality. Thirdly, and less researched are those
aspects of firefighters’ daily work that involve the impact of more routine
operational variables such as role, shift work, time critical responses, ‘command
and control’ leadership, autonomy and control, fatigue, and working in
uncomfortable conditions, downtime between jobs, and attendance at non-
emergency jobs. The fourth and least researched factor, involves the impact of
firefighters’ working in an organisation, such as culture, leadership capability,
relationships, staffing and resourcing, red tape and dealing with change.
The aims of this research were to establish the prevalence rates of
posttraumatic stress disorder (PTSD), depression, generalised anxiety disorder
(GAD)and alcohol use disorder (AUD), and explore the relative predictive
ability of individual, PTE exposure, operational and organisational factors on
these four mental health disorders.
METHOD
335 career and volunteer firefighters from four Australian fire services
participated in the longitudinal study, which incorporated the completion of an
on-line self-report survey at baseline and follow-up, 12 months apart. 297

AFAC18: PROCEEDINGS FROM THE BUSHFIRE AND NATURAL HAZARDS CRC & AFAC CONFERENCE 2018 | REPORT NO. 367.2018
78
firefighters participated in a diagnostic interview. This design was chosen as it
best addressed the aims of the study. The survey included seven main sections
comprising background information and consent, demographic and personal
information, firefighter service details, mental health and other health
measures, operational and organisational checklist and psychological safety
measure, exposure to acute stressor list, and satisfaction with health section.
The mental health measures used were the PCL-5 for PTSD, Patient Health
Questionnaire (PHQ-9) for depression, Generalised Anxiety Disorder (GAD-7) for
generalized anxiety disorder (GAD), and Alcohol Use Disorders Identification
Test (AUDIT-C) for alcohol use disorder (AUD). Survey data was imported from
Survey Monkey into SPSS-22 where it was screened, exploratory data analyses
were conducted on all main variables, and reliability analyses were conducted
on the measures used in the study.
To address the aims of the study as outlined above, frequencies (percentages)
for the prevalence rates for each mental health disorder and the results of a
series of hierarchical multiple regressions conducted to develop best fit models
to explain the specific mental health outcomes will be presented.
RESULTS
Prevalence rates for PTSD, depression, GAD and AUD
Overall, around a sixth of career and a seventh of volunteer firefighters met
criteria for any psychiatric disorder in the previous 4 weeks. The following
percentages of career firefighters met criteria for PTSD, depression, GAD,
alcohol abuse and alcohol dependence respectively: 3.3%, 5.5%, 3.3%, 3.3%
and 5.5%. While for the volunteer firefighters, 1.9%, 4.4%, 6.8%, 2.4% and 3.4%
met criteria for PTSD, depression, GAD, alcohol abuse and alcohol
dependence respectively.
Predictors of PTSD, depression, GAD and AUD
For the career firefighters, the baseline measure of PTSD was the greatest
predictor of PTSD (beta .493, p ≤.001). This was followed by low job satisfaction
associated with operational aspects of their job (beta=-.480, p ≤.005) and
exposure to more potentially traumatic events (PTEs) in the previous 12 months
(beta=.353, p ≤.003). For the volunteer firefighters the only statistically significant
predictor was the baseline measure of PTSD (beta = .540, P≤.000).
For the career firefighters, low job satisfaction associated with operational
aspects of their job was the greatest predictor of depression (beta=-.548, p
≤.001), followed by the baseline measure of depression (beta=.390, p ≤.006),
and then exposure to more PTEs in the previous 12 months (beta=.381, p≤.004).
For the volunteer cohort, the baseline measure of depression was the greatest
predictor of depression (beta=.573, p≤.001), followed by experiencing more
recent life events (RLEs) in the previous 12 months (beta=.151 p≤.017).

AFAC18: PROCEEDINGS FROM THE BUSHFIRE AND NATURAL HAZARDS CRC & AFAC CONFERENCE 2018 | REPORT NO. 367.2018
79
The only significant predictor for GAD for both career and volunteer firefighters
was the baseline measure of anxiety (career: beta .547, p≤.001; volunteer: beta
.637, p≤.001).
For the career cohort, the baseline measure of alcohol use was the greatest
predictor of alcohol use (beta = .544, p≤.001). This was followed by rank, where
being a firefighter as opposed to a manager (beta = -.244, p≤.003) and
experiencing more RLEs in the previous 12 months (beta = .204, p≤.009)
predicted greater alcohol use. The baseline measure of alcohol use was the
only significant predictor of alcohol use for the volunteer cohort (beta = .831,
p≤.000).
DISCUSSION
Prevalence rates of PTSD, depression, GAD and AUD
The prevalence rates for having any current psychiatric disorder in this sample
are 16.5% for career firefighters and 14.1% for volunteer firefighters. This
compares with approximately 20% in the general population and 17.1% in a
South Australian Metropolitan Fire Service (MFS) study (Van Hooff et al, 2017)
who had any disorder in the past 12 months, and 13.1% in the Fire and Rescue
New South Wales (FRNSW) study (Harvey et al, 2016) who had any current
psychiatric disorder. Table 1 summarises the prevalence rates for the four
mental health disorders and provides a comparison with the rates found in the
general population The prevalence rates for PTSD in the career and volunteer
firefighters are low in comparison with the Australian general population
(National Survey of Mental Health and Wellbeing, 2007) and with other
Australian firefighter studies (Bryant & Harvey, 1995; 1996; Dean et al, 2003;
McFarlane & Papay, 1992; Harvey et al, 2016; Van Hooff et al, 2017). There is
controversy in the literature as to whether being in a voluntary firefighting role is
a risk or protective factor (Wagner and O’Neill, 2012; Dean et al, 2003). The
results from this study indicate that they were less impacted that the career
firefighters. The prevalence rates for depression in both cohorts of firefighters is
higher than in the general population but very similar to that found in two
recent Australian career firefighter studies (Harvey et al, 2016; Van Hooff et al,
2017). The prevalence rates for GAD in both the career and volunteer
firefighters are higher than both those found in the general population and
found in the recent MFS study. The alcohol abuse prevalence rates for the
career and volunteer firefighters were lower than those found in the general
population, but higher than that found in the MFS study, however, alcohol
dependence rates for both cohorts were higher than those found in the
general population and in the SA study. In both cases, the rate was more than
double that found in the general population.
The most common disorders identified were depression and alcohol
dependence in the career firefighters, and depression and GAD in the
volunteer firefighters.

AFAC18: PROCEEDINGS FROM THE BUSHFIRE AND NATURAL HAZARDS CRC & AFAC CONFERENCE 2018 | REPORT NO. 367.2018
80
Table 1 Prevalence of PTSD, depression, generalised anxiety disorder and alcohol use disorder
Diagnosis Career
N %
91 31%
Volunteer
N %
206 69%
General population
Males Total pop
Any psychiatric diagnosis 15
16.5
29
14.1
20%
PTSD 3
3.3
4
1.9
4.6% 6.4%
Depression 5 5.5 9
4.4
3.1% 4.1%
GAD 3
3.3
14
6.8
2.0% 2.7%
AUD
Alcohol abuse
Alcohol dependence
3
3.3
5
5.5
5 2.4
7 3.4
3.8% 2.9%
2.2% 1.4%
Note: All disorders were assessed using the MINI Neuropsychiatric Interview (n=297), except PTSD, which was assessed by the
CAPS interview (n=297). CAPS = Clinician-Administered PTSD Scale; PTSD = Posttraumatic stress disorder; GAD = General
Anxiety Disorder; AUD = Alcohol Use Disorder; Rates in general population are based on diagnosis within previous 12 months.
As all career firefighters were male, comparison is made with rates from males in general population, while volunteer
firefighters rates are compared with rates from total population (National Survey of Mental Health and Wellbeing, 2007).
Predictors of PTSD, depression, GAD and AUD
It was somewhat unexpected for both career and volunteer firefighters that no
individual predictors such as gender, age, education or amount of personal
support received were statistically significant in predicting any of the mental
health outcomes. However, the baseline measures for PTSD, depression, GAD
and AUD always predicted the follow-up measure for both career and
volunteer firefighters and this finding supports the regular assessment of such
disorders so as to identify and treat them as early as possible.
Greater exposure to PTEs in the previous 12 months for career firefighters
predicted both PTSD and depression, indicating the need for firefighters and fire
services to monitor and manage as best they can the number of PTEs that
firefighters attend, and to provide appropriate support services.
Experiencing more RLEs in the previous 12 months predicted depression for
volunteer firefighters and alcohol use for career firefighters. Firefighters should
be mindful that stressful life events increase their vulnerability to develop these
mental health disorders. It was unexpected based on previous literature that
RLEs were not found to be a significant predictor of PTSD, as cumulative life
stress has been found to contribute to the development of PTSD (Breslau et al,
1999; Brewin et al, 2000).

AFAC18: PROCEEDINGS FROM THE BUSHFIRE AND NATURAL HAZARDS CRC & AFAC CONFERENCE 2018 | REPORT NO. 367.2018
81
For the career firefighters low job satisfaction associated with operational
aspects of the job predicted PTSD and depression. In fact, for depression, it
contributed a greater amount of the total variance in depression than did
exposure to PTEs, and for PTSD almost contributed as much variance. Thus, it is
important for firefighters to develop self-awareness as to when their operational
job satisfaction is poor and for managers to have conversations with their staff
which help to identify any negative changes in attitude to their work. Not
addressing this issue has the potential to have significant and deleterious
effects on career firefighters’ mental health.
Given that career firefighters were identified at greater risk than managers of
developing alcohol use disorder, targeting alcohol management programs for
this group of staff would be beneficial. It was somewhat surprising that no other
operational factors such as rank or length of service (LOS) were not significant
predictors, as holding a supervisory rank in the fire service has been linked with
the development of PTSD (Armstrong, 2014) and LOS has been identified as a
predictive factor in mental health outcomes, including posttraumatic stress
(Chamberlain and Green, 2010).
It was also surprising that the organisational variables including low job
satisfaction resulting from organisational aspects of the role or level of
psychosocial safety climate in the fire service were not predictors, as these
factors have previously been identified as predictors of poor mental health
(Corneil et al, 1999; Meyer et al, 2012; Tuckey and Hayward, 2010; Bailey et al,
2015).
CONCLUSION
Although the prevalence rates for PTSD in both the career and volunteer
firefighters in this study were low in comparison with other firefighter studies, a
focus still needs to be maintained by fire services as well as firefighters on
identifying and managing the known predictors which include the baseline
measure of PTSD for both cohorts of firefighters, and additionally for career
firefighters, PTE exposure and low job satisfaction associated with operational
aspects of the firefighting role. The most common disorders identified were
depression and alcohol dependence in the career firefighters, and depression
and GAD in the volunteer firefighters. For the career firefighters, in addition to
baseline measure of depression, low job satisfaction because of operational
aspects of firefighting and exposure to more PTEs in the previous year predicted
depression, and being a firefighter as opposed to a manager and experiencing
more RLEs in the previous year predicted greater alcohol use disorder. The only
additional predictor to the baseline measures for the volunteer firefighters was
number of stressful life events (RLEs) experienced in the previous year which
predicted depression.
The results highlight the need for a joint approach by fire services and
firefighters to take responsibility for creating a culture within fire services that

AFAC18: PROCEEDINGS FROM THE BUSHFIRE AND NATURAL HAZARDS CRC & AFAC CONFERENCE 2018 | REPORT NO. 367.2018
82
encourages and supports the early identification and appropriate
management of changes in work attitudes such as job satisfaction and mental
health symptoms.
Acknowledgements
The author would like to express gratitude to the following: BNHCRC, for
providing funding for this research; ACT Fire and Rescue, ACT Rural Fire Service,
CFS South Australia and NT Fire and Rescue for actively supporting and
encouraging the research within their fire services; all the firefighters who
participated in the research; AFAC for providing ongoing support and access
to forums which enabled the dissemination of information about the research;
and the constant and vital guidance provided by my two supervisors at
Phoenix Australia.
REFERENCES 1. Armstrong, D., Shakespeare-Finch, J., & Shochet, I. (2014). Predicting post-traumatic growth and
post-traumatic stress in firefighters. Australian Journal of Psychology, 66(1), 38-46.
2. Australian Bureau of Statistics (2008). 2007 National Survey of Mental Health and Wellbeing: Summary
of Results, Canberra: Australian Bureau of Statistics.
3. Bailey, T. S., Dollard, M. F., & Richards, P. A. (2015). A national standard for psychosocial safety
climate (PSC): PSC 41 as the benchmark for low risk of job strain and depressive symptoms. Journal
of occupational health psychology, 20(1), 15.
4. Breslau, N., Davis, G. C., Andreski, P., & Peterson, E. (1991). Traumatic events and posttraumatic stress
disorder in an urban population of young adults. Arch Gen Psychiatry, 48(3), 216-222.
5. Brewin, C. R., Andrews, B., & Valentine, J. D. (2000). Meta-Analysis of Risk Factors for Posttraumatic
Stress Disorder in Trauma-Exposed Adults. J Consult and Clin Psychol, 68(5), 748-766.
6. Bryant, R. A. & Guthrie, R.M. (2007). Maladaptive Self-Appraisals Before Trauma Exposure Predict
Posttraumatic Stress Disorder, J Consult Clin Psychol, 75(5), 812-815.
7. Bryant, R.A.& Harvey, A.G. (1996). Posttraumatic Stress Reactions in Volunteer Firefighters Predictors
of Distress. Journal of Traumatic Stress, 9 (1):51-2.
8. Chamberlain, M.J.A. & Green, H.J. (2010). Stress and coping strategies among firefighters and
recruits. Journal of Loss and Trauma, 15(6):548-560.
9. Corneil, W., Beaton, R., Murphy, S., Johnson, C., & Pike, K. (1999). Exposure to traumatic incidents
and prevalence of posttraumatic stress symptomatology in urban firefighters in two countries.
Journal of Occupational Health Psychology, 4(2), 131-141.
10. Dean, P. G., Gow, K. M., & Shakespeare-Finch, J. E. (2003). Counting the cost: psychological distress
in career and auxiliary firefighters. Australasian Journal of Disaster and Trauma Studies 2003-1.
11. Del Ben, K., Scotti, J., Chen, Y., & Fortson, B. (2006). Prevalence of post-traumatic stress disorder
symptoms in firefighters. Work & Stress, 20, 31-48.
12. Di Gangi, J.A., Gomez, D., Mendoza, L., Jason, L.A., Keys, C.B. & Koenen, K.C. (2013). Pretrauma risk
factors for posttraumatic stress disorder: A systematic review of the literature. Clinical Psychology
Review, 33:728-744.
13. Harvey, S.B., Milligan-Saville, J.S., Paterson, H. M., Harkness, E. L., Marsh, A. M., Dobson, M., Kemp, R.,
& Bryant, R.A. (2016). The mental health of fire-fighters: An examination of the impact of repeated
trauma exposure. Australian & New Zealand Journal of Psychiatry 2016, Vol. 50(7) 649 –658.

AFAC18: PROCEEDINGS FROM THE BUSHFIRE AND NATURAL HAZARDS CRC & AFAC CONFERENCE 2018 | REPORT NO. 367.2018
83
14. Heinrichs, M., Wagner, D., Schoch, W., Soravia, L.M., Hellhammer, D.H. & Ehlert, U. (2005). Predicting
Posttraumatic Stress Symptoms from Pretraumatic Risk Factors: A 2-Year Prospective Follow-Up Study
in Firefighters. American Journal Psychiatry, 162(12), 2276-2286.
15. Kroenke, K., R.L. Spitzer, & J.B. Williams. The PHQ-9: validity of a brief depression severity measure.
Journal of general internal medicine, 2001. 16(9):606-13.
16. Marmar, C. R., McCaslin, S. E., Metzler, T. J., Best, S., Weiss, D.S., Fagan, J., Liberman, A., Pole, N., Otte,
C., Yehuda, R., Mohr, D. & Neylan, T. (2006). Predictors of Posttraumatic Stress in Police and Other
First Responders. Ann N Y Acad Sci, 1071, 1-18.
17. McFarlane, A.C., & Papay, P. (1992). Multiple Diagnoses in Posttraumatic Stress Disorder in the
Victims of a Natural Disaster, The Journal of Nervous and Mental Disease, 180(8):498-504.
18. Meyer, E.C., Zimering, R., Daly, E., Knight, J., Kamholz, B.W. & Gulliver, S.B. (2012). Predictors of
Posttraumatic Stress Disorder and Other Psychological Symptoms in Trauma-Exposed Firefighters.
Psychological Services, 9(1), 1-15.
19. Ozer, E.J., Best, S.R. & Lipsey, T.L. & Weiss, D.S. (2008). Predictors of Posttraumatic Stress Disorder and
Symptoms in Adults: A Meta-Analysis, Psychological bulletin, 129(1), 52.
20. Regehr, C., Hill, J., Knott, T., & Sault, B. (2003). Social Support self-efficacy and trauma in new recruits
and experienced firefighters. Stress and Health 19; 189-193.
21. Saunders, J.B., Aasland, O.G., Babor, T.F., de le Fuente, J.R. & Grant, M. WHO Collaborative Project
on Early Detection of Persons with Harmful Alcohol Consumption-II. Development of the alcohol use
disorders identification test (AUDIT): Addiction, 1993. 88(6):791-804.
22. Spitzer, R.L.K., K. Williams, J.B.W. & Lowe, B. A brief measure for assessing generalized anxiety
disorder: the GAD-7. Arch Intern Med, 2006. 166: 1092-1097)
23. Van Hooff, M., McFarlane, A., Lawrence-Wood, E., Abraham, M., Bryant, R & Sim, M. MFS Health and
Wellbeing Study, Executive Report, 2017.
24. Wagner, D., Heinrichs, M., & Ehlert, U. (1998). Prevalence of symptoms of posttraumatic stress
disorder in German professional firefighters. American Journal of Psychiatry, 155, 1727-1732.
25. Tuckey, M.R. & Hayward, R. (2010). Global and Occupation-Specific Emotional Resources as Buffers
against the Emotional Demands of Fire-Fighting. Applied Psychology: An International Review,
60(1):1-23.
26. Weathers, F.W., Litz, B.T., Keane, T.M., Palmieri, P.A., Marx, B.P., & Schnurr, P.P. (2013). The PTSD
Checklist for DSM-5 (PCL-5). Scale available from the National Center for PTSD.

AFAC18: PROCEEDINGS FROM THE BUSHFIRE AND NATURAL HAZARDS CRC & AFAC CONFERENCE 2018 | REPORT NO. 367.2018
84
DISASTERS AND ECONOMIC RESILIENCE: INCOME EFFECTS OF THE BLACK SATURDAY BUSHFIRES ON DISASTER-HIT INDIVIDUALS Non-peer reviewed research proceedings from the Bushfire and Natural
Hazards CRC & AFAC conference
Perth, 5 – 8 September 2018
Mehemet Ulubasoglu 1,2 1 Centre for Energy, the Environment and Natural Disasters, Deakin University 2 2
Bushfire and Natural Hazards CRC
Corresponding author: [email protected]

AFAC18: PROCEEDINGS FROM THE BUSHFIRE AND NATURAL HAZARDS CRC & AFAC CONFERENCE 2018 | REPORT NO. 367.2018
85
ABSTRACT
DISASTERS AND ECONOMIC RESILIENCE: THE VICTORIAN BLACK SATURDAY BUSHFIRES
Mehmet Ulubasoglu, Department of Economics, Centre for Energy, the
Environment and Natural Disasters, Deakin University, VIC
Using the rich and extensive Australian Longitudinal Census Dataset (ALCD) of
2006 and 2011, this study investigates the effects of the Victorian Black Saturday
Bushfires (BSB) 2009 on the incomes of individuals living in disaster-hit areas. In a
unique approach, we compute the share of burnt areas in the total surface
area of the Statistical Area-2 (SA2) to measure the geographical variations in
disaster severity, and match this measure with the individuals’ income and
demographics data in the ALCD. Our methodology is based on a difference-
indifferences approach, whereby we compare the incomes of individuals living
in disaster-hit SA2s before and after the catastrophe with those of individuals
who live in the neighbouring SA2s with no bushfire exposure. Our results are
novel, informative, and have significant policy implications. We find that the
average income effect of the BSB was negative and statistically significant for
individuals who lived in the disaster-hit SA2s between 2006 and 2011. Our
estimates suggest that an individual living in an SA2 with average bushfire
severity measure experienced an estimated 14% to 21% income loss following
the disaster. An additional crucial finding is related to the income differences
between those who stayed in the disaster-hit areas following the disaster and
those who moved out of the burnt areas. The negative income effect is not
only significant for non-movers, but also greater in magnitude for those who
migrated out of the disaster-hit SA2s following the catastrophe. This finding
suggests that individuals might have made their out-migration decisions based
on severe income losses after the disaster. We conclude that migration
decisions of individuals into or out of disaster-hit areas is an important future
avenue of research that could offer substantial policy implications for
community resilience and economic recovery post disasters.

AFAC18: PROCEEDINGS FROM THE BUSHFIRE AND NATURAL HAZARDS CRC & AFAC CONFERENCE 2018 | REPORT NO. 367.2018
86
END-USER STATEMENT
Ed Pikusa:
This project has illustrated the potential to use the national accounts and
Australian Bureau of Statistics to determine a richer understanding of how
disasters affect sectors of the economy, with potential utility to better plan and
target relief and recovery programs. The analysis is one of the first examples
revealing which parts of the economy are impacted, and which ones are
stimulated. This work is unique to the CRC, based on the fundamental
population and economics data of Australia.

AFAC18: PROCEEDINGS FROM THE BUSHFIRE AND NATURAL HAZARDS CRC & AFAC CONFERENCE 2018 | REPORT NO. 367.2018
87
INTRODUCTION
It would be a mistake to treat Black Saturday as a ‘one-off’ event. With
populations at the rural–urban interface growing and the impact of climate
change, the risks associated with bushfire are likely to increase (Parliament of
Victoria, 2010)
Natural disasters in Australia are very costly, and often have devastating
socioeconomic effects on impacted communities.
The 2009 Victorian Black Saturday Bushfires were the worst bushfire weather
condition ever recorded globally; equivalent to 1500 Hiroshima style atom
bombs going off (SMH, 2009). 173 people died; over 2,100 houses and 3,500
structures were destroyed, with thousands more suffering damage (Parliament
of Victoria, 2010). The total area destroyed was around 400,000 square
kilometres (Victorian Government DELWP, 2012), an area slightly larger than
Japan.
With the severity and frequency from natural disasters set to increase
(Intergovernmental Panel on Climate Change, 2014), there is a need—now
more than ever—for Australia to have a sustainable disaster recovery model
that: • incorporates an evidence-based and disaster-specific assessment of
potential damages and impacts of natural disasters on Australian communities,
and • helps build resilience within Australian communities to such disasters.
An important dimension of resilience to natural disasters is economic resilience
(Rose, 2007). At an individual level, economic resilience can be defined as the
ability to return to the pre-disaster income trajectory. This can happen if the
individual has the necessary labour market skills, education and/or experience,
the economy is sufficiently diverse to withstand firm/industry-specific losses, or if
the government assists the individuals during the recovery and assistance
period. As income stream represents the economic resilience of individuals to
external shocks, it is important to understand how natural disasters influence the
income trajectory of individuals. Indeed, Victorian BSB studies have found that
other stressors, not just the bushfire event itself, affected both resilience and
recovery from these disasters. These include experiencing changes of income,
changes in accommodation and changes in personal relationships (Gibbs et
al, 2016).
Thus, the aims of this research paper are to investigate the impacts of the VIC
BSB on individuals’ income and identify vulnerable groups that were most

AFAC18: PROCEEDINGS FROM THE BUSHFIRE AND NATURAL HAZARDS CRC & AFAC CONFERENCE 2018 | REPORT NO. 367.2018
88
particularly hit by the disaster according to the individuals’ demographic,
socio-economic backgrounds and employment sectors.

AFAC18: PROCEEDINGS FROM THE BUSHFIRE AND NATURAL HAZARDS CRC & AFAC CONFERENCE 2018 | REPORT NO. 367.2018
89
METHODS
INDIVIDUAL DATA
The research exploits individual level economic information as retrieved from
the 2006, 2011 and 2016 Australian Census Longitudinal Dataset. This dataset
brings together a nationally representative 5% sample from the 2006 Census
with records from the 2011 and 2016 Censuses. The availability of such data
provides a unique opportunity to explore how Australian citizens are affected
over time due to natural disasters, i.e. changes to the individual incomes of the
disaster affected individuals as compared with the unaffected cohort, by
economic sector. The richness of this data enables investigation of both social
and economic dimensions as shown below:
Table 1 Individual data collected, by dimension

AFAC18: PROCEEDINGS FROM THE BUSHFIRE AND NATURAL HAZARDS CRC & AFAC CONFERENCE 2018 | REPORT NO. 367.2018
90
MODELLING
We use difference-in-differences modelling to determine the difference
between the incomes of bushfire-hit groups before and after the natural
disaster, do the same for comparator groups, and see if there is any difference
between the two differences (hence, “difference-in-differences”).
By incorporating a:
• Disaster severity measure, we consider the effect of the magnitude of the fires
on affected groups
• Vulnerability dimension, we consider the possible differences in the effect of
the fires on different subsets within the affected groups
As comparator groups, we use the neighbouring SA2s, which typically have
similar characteristics to bushfire-hit areas, including:
• topography
• economically.
The comparator groups allow us to pinpoint the specific income effect of
the natural disaster on the affected group.
Figure 1 Victorian Bushfires groupings

AFAC18: PROCEEDINGS FROM THE BUSHFIRE AND NATURAL HAZARDS CRC & AFAC CONFERENCE 2018 | REPORT NO. 367.2018
91
BUSHFIRE SEVERITY
In a unique approach, we identify the geographical variations in bushfire
severity by computing the share of the Statistical Area-2 (SA2) that was
burnt, and then match this measure with the individuals’ income and
demographics data in the ALCD. To compute the bushfire severity, we
use ArcGIS mapping and calculate the share of burnt areas in the total
surface area of the SA2.
In our ArcGIS mapping, we followed the steps below.
Step 1: Determine bushfire areas by overlaying official bushfire maps
with SA2s
Step 2: Determine disaster severity, that is, share of burnt area in SA2
Figure 2 summarises our mapping exercise: the darker the orange, the
more burnt the area is, while the blue area is neighbouring SA2s of the
burnt SA2s.
There were 12 different pockets of bushfires in the case of the Black
Saturday Bushfires 2009. We found the average share of burnt area in
SA2 was 15%.
Figure 2. Construction of groups using ARGIS mapping

AFAC18: PROCEEDINGS FROM THE BUSHFIRE AND NATURAL HAZARDS CRC & AFAC CONFERENCE 2018 | REPORT NO. 367.2018
92
RESULTS
We find that the average income effect of the BSB was negative and
statistically significant for individuals who lived in the disaster-hit SA2s between
2006 and 2011. Post-disaster, we found significant declines in the income of
individuals residing in bushfire-hit areas by 11%. In addition, low income earners
were the worst hit among income groupings, while those who migrated out to
unaffected areas were severely affected (22.5% decline in their income).
Moreover, unemployed income changes were not statistically significant, likely
because income sources (e.g. Centrelink) were not disrupted during this time.
Figure 3 VIC BSB’s impacts on individual income, by demographic group (%)
As for sectors of employment, of the 19 economic sectors, six were significantly
and mostly negatively affected by the bushfires. Incomes of individuals
employed in retail showed the most decline (-15%), while incomes in the rental
and real estate sector were the only positively affected (10.5%).
Figure 4 VIC BSB’s impacts on individual income, by sector of employment (%)

AFAC18: PROCEEDINGS FROM THE BUSHFIRE AND NATURAL HAZARDS CRC & AFAC CONFERENCE 2018 | REPORT NO. 367.2018
93
A crucial finding
of this research is the income differences between those who stayed in
the disaster-hit areas following the disaster and those who moved out of
the burnt areas. The negative income effect is not only significant for
non-movers, but also greater in magnitude for those who migrated out of
the disaster-hit SA2s following the catastrophe. This finding suggests that
individuals might have made their out-migration decisions based on
severe income losses after the disaster. This may subsequently affect
perceived recovery of communities impacted by these disasters.

AFAC18: PROCEEDINGS FROM THE BUSHFIRE AND NATURAL HAZARDS CRC & AFAC CONFERENCE 2018 | REPORT NO. 367.2018
94
CONCLUSIONS
The Victorian Black Saturday Bushfires had a significant negative effect
on individual income (average of -11%) in disaster-hit areas. In the short
term, some groups are more vulnerable to disruptions to their income
level than others. In particular, low income earners, those employed in
retail sector, and those who made the decision to migrate out of the
bushfire-hit area were the most negatively affected by the bushfire
disasters. These results confirm the need, when investigating disaster
resilience and recovery, to dig deeper beyond aggregate and
community trends and investigate the effects of such disasters at the
individual level. In particular, the outward migration of the most
affected by the disaster may mask the true effects of such disasters on
community recovery. We conclude that migration decisions of
individuals into or out of disaster-hit areas is an important future avenue
of research that could offer substantial policy implications for the
economy and society.

AFAC18: PROCEEDINGS FROM THE BUSHFIRE AND NATURAL HAZARDS CRC & AFAC CONFERENCE 2018 | REPORT NO. 367.2018
95
REFERENCES
1 Gibbs L, Bryant R, Harms L, Forbes D, Block K, Gallagher HC, Ireton
G, Richardson J, Pattison P, MacDougall C, Lusher D, Baker E,
Kellett C, Pirrone A, Molyneaux R, Kosta L, Brady K, Lok M, Van
Kessell G, Waters E., Beyond Bushfires: Community Resilience and
Recovery Final Report. November 2016, University of Melbourne,
Victoria, Australia
2 Intergovernmental Panel on Climate Change, 2014, Climate
Change 2014 – Impacts, Adaptation and Vulnerability: Regional
Aspects, Cambridge University Press.
3 Parliament of Victoria, 2010, The 2009 Victorian Bushfires Royal
Commission, ISBN 978-0-9807408-1-3, Victoria.
4 Rose A., 2007, Economic resilience to natural and man-made
disasters: Multidisciplinary origins and contextual dimensions,
Environmental Hazards, Vol 7 (4), pp. 383–398.

AFAC18: PROCEEDINGS FROM THE BUSHFIRE AND NATURAL HAZARDS CRC & AFAC CONFERENCE 2018 | REPORT NO. 367.2018
96
APPLYING UNHARMED FOR RISK REDUCTION PLANNING – COMPARING STRATEGIES AND LONG-TERM EFFECTIVENESS.
Non-peer reviewed research proceedings from the Bushfire and Natural
Hazards CRC & AFAC conference
Perth, 5 – 8 September 2018
Graeme A. Riddell1,2 , Hedwig van Delden1,3, Roel Vanhout1,3, Holger R. Maier1,2,
Jeffrey P. Newman1,2, Aaron C. Zecchin1,2, Graeme C. Dandy1,2
1 Bushfire and Natural Hazards CRC 2 The University of Adelaide 3 Research Institute for Knowledge Systems
Corresponding author: [email protected]

AFAC18: PROCEEDINGS FROM THE BUSHFIRE AND NATURAL HAZARDS CRC & AFAC CONFERENCE 2018 | REPORT NO. 367.2018
97
ABSTRACT
APPLYING UNHARMED FOR RISK REDUCTION PLANNING – COMPARING STRATEGIES AND LONG-TERM EFFECTIVENESS.
Natural hazards are an unavoidable component of life in Australia. Analysis
shows the average cost of natural hazards in 2015 totalled $9.6billion, and this
figure is projected to increase to $33billion by 2050 (Deloitte Access Economics
2015). These figures correspond to a substantial impact and coupled with the
social and environmental impacts of disasters, paint a bleak picture. However,
as tomorrow’s risk is a function of today’s decisions with effective risk reduction
planning there is significant scope to minimise tomorrow’s impacts. The
challenge though exists in that ex-ante analysis on the long term effectiveness
of risk reduction strategies, the type of analysis required to justify significant
investment and policy decisions, is challenging given the dynamic, complex
nature of disaster risk, and the length of assessment period required to consider
returns. In response to this and to support improved understanding of future risks
and ex-ante testing of risk reduction solutions a tool was developed between
researchers and Australian government agencies.
The tool – UNHaRMED - consists of a dynamic, spatial land use change model
and multiple hazard models to consider how risk changes into the future both
spatially and temporal. UNHaRMED was developed through an iterative,
stakeholder-focussed process to ensure the system was capable of providing
the analysis required by policy and planning professionals in emergency
management and risk fields. The process involved a series of interviews and
workshops with members of the various State Government agencies, aligning
risk reductions to be included, policy relevant indicators and future
uncertainties, such that the system can sit within existing policy processes. This
resulted in a tool that considers how land use changes into time, how various
hazards interact with these changes, and what the effectiveness of a variety of
risk reduction measures is.
Its design was tailored to specifically account for the challenges around
developing and implementing risk reduction options. These include the difficulty
of convincing decision makers of the advantages of spending money on
mitigation works compared with the short-term benefits offered by other
potential projects and activities. In addition, because disasters are relatively
infrequent, the people influencing risk reduction activities may have little
personal experiences to guide their evaluation of risk, or the relative benefits of
alternative risk reduction options. Furthermore, risk reduction budgets are
generally limited, and given the difficulties mentioned above, the selection of
an optimal set of risk reduction options is very difficult when many alternative
options are available.
UNHaRMED has been designed to assist in addressing these challenges by
(1)being transparent and quantifying the expected benefits of risk reduction

AFAC18: PROCEEDINGS FROM THE BUSHFIRE AND NATURAL HAZARDS CRC & AFAC CONFERENCE 2018 | REPORT NO. 367.2018
98
investment across multiple criteria, enabling strong arguments for the selection
of particular options to be made, (2) it can be used to assess the likelihood and
consequences of natural hazards across multiple criteria, resulting in less bias
when assessing the relative benefits of risk reduction options, and (3) can make
use of formal optimization techniques to find optimal or near-optimal portfolios
of risk reduction options.
It includes the assessment of risks from multiple natural hazards, currently
bushfire, earthquake, coastal and riverine flooding, over extended temporal
horizons, looking at how the average annual losses from each of these hazards
changes each year. Along with the assessment of how risks change into the
future for each of these hazards, importantly, the system also allows the
modeller to implement various risk reduction options including changes to the
building code, property retrofits, land use planning strategies, land
management strategies and structural flood reduction methods, to assess their
effectiveness.
FIGURE 1 - SCREENSHOT SHOWING EXPOSED VALUES, INUNDATION FROM COASTAL FLOODING, AND
ASSOCIATED AVERAGE ANNUAL LOSSES FROM THE GREATER ADELAIDE APPLICATION OF UNHARMED.
UHaRMED begins with considering how external drivers such as population and
economic change impact the exposure components of risk. This is achieved via
a land use and building stock model that translates projections into a spatial
grid of land use type and associated building stock types and finally values per
cell per year. This represents the values at risk per year. Hazard models are also
impacted by these external drivers such as population growth impacts on the
ignition potential considered with bushfire hazard model, climatic factors are
also external drivers that impact on the likelihood and severity of natural

AFAC18: PROCEEDINGS FROM THE BUSHFIRE AND NATURAL HAZARDS CRC & AFAC CONFERENCE 2018 | REPORT NO. 367.2018
99
hazards. Vulnerability functions are used to determine the losses based on the
severity of hazard events and the values at risk. This follows the concept of the
‘risk triangle’ considering elements of hazard, exposure, and vulnerability for risk
assessment.
By considering each of these elements individually risk reduction strategies can
be devised that utilize the full range of options instead of more traditionally
focusing on hazard management, through land management or structural
flood defenses for example. Figure 2 highlights this idea by showing the
potential for commercial development in Adelaide. This potential is a function
of existing commercial developments, and its relationship to other land uses
such as distance to residential areas or the CBD, accessibility in terms of
transport access and the zoning of land based on South Australian Local
Government zoning schemes. For policy-makers to influence future risk they
can improve the accessibility of an area, or change the zoning (either
stimulating or restricting particular land use) to see the shift the growth of
commercial development into less risky areas. Property developers could
similarly use UNHaRMED to consider which areas currently are comparable in
terms of development potential but elect to develop on one not exposed to
future coastal flooding issues.
FIGURE 2 – OVERVIEW OF POTENTIAL FOR COMMERCIAL DEVELOPMENT IN ADELAIDE AND FUTURE COASTAL
INUNDATION RISK FROM A 1IN200 YEAR EVENT IN 2050 UNDER CLIMATE CHANGE SCENARIO RCP 8.5
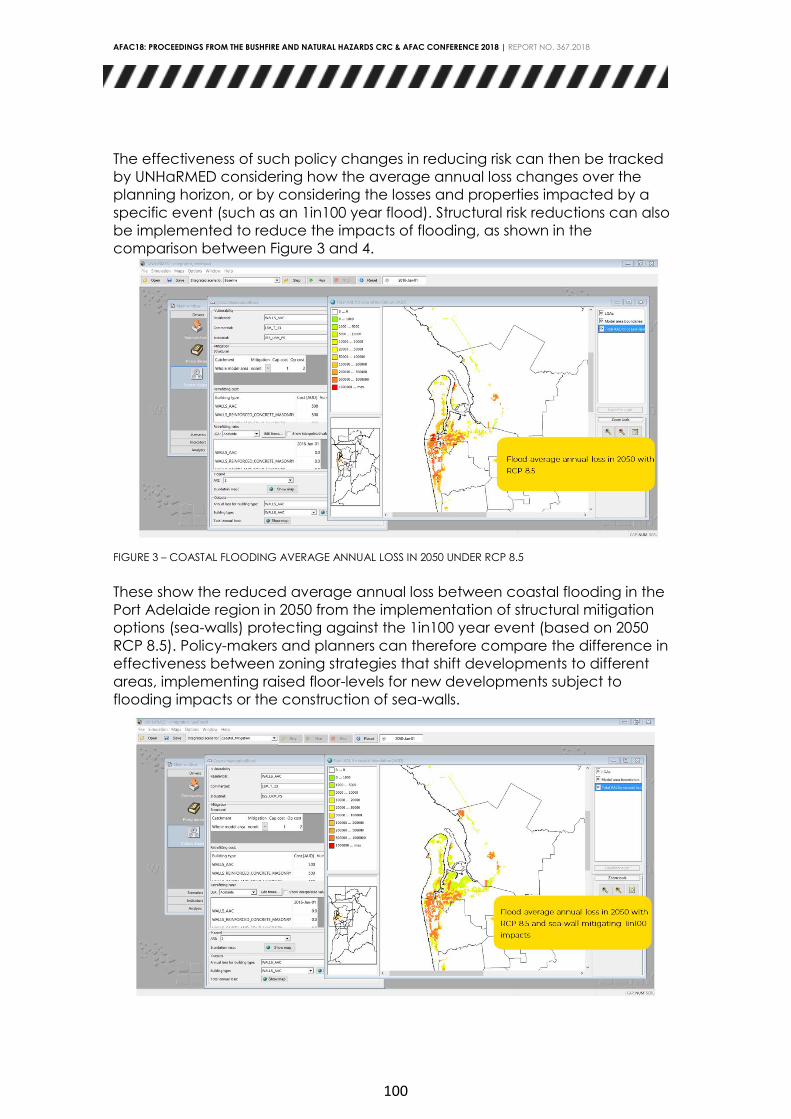
AFAC18: PROCEEDINGS FROM THE BUSHFIRE AND NATURAL HAZARDS CRC & AFAC CONFERENCE 2018 | REPORT NO. 367.2018
100
The effectiveness of such policy changes in reducing risk can then be tracked
by UNHaRMED considering how the average annual loss changes over the
planning horizon, or by considering the losses and properties impacted by a
specific event (such as an 1in100 year flood). Structural risk reductions can also
be implemented to reduce the impacts of flooding, as shown in the
comparison between Figure 3 and 4.
FIGURE 3 – COASTAL FLOODING AVERAGE ANNUAL LOSS IN 2050 UNDER RCP 8.5
These show the reduced average annual loss between coastal flooding in the
Port Adelaide region in 2050 from the implementation of structural mitigation
options (sea-walls) protecting against the 1in100 year event (based on 2050
RCP 8.5). Policy-makers and planners can therefore compare the difference in
effectiveness between zoning strategies that shift developments to different
areas, implementing raised floor-levels for new developments subject to
flooding impacts or the construction of sea-walls.

AFAC18: PROCEEDINGS FROM THE BUSHFIRE AND NATURAL HAZARDS CRC & AFAC CONFERENCE 2018 | REPORT NO. 367.2018
101
FIGURE 4 – COASTAL FLOODING AVERAGE ANNUAL LOSS IN 2050 UNDER RCP 8.5 WITH STRUCTURAL MITIGATION
FOR 1IN100 YEAR FLOOD EVENTS
UNHaRMED is now being provided to multiple state agencies across South
Australia, Victoria, and Tasmania to support transparent and robust decision-
making for risk reduction activities. The software takes risk analysis and risk
reduction planning into a more complex and comprehensive space. It
achieves this by coupling the analysis of risk reduction with cost-benefit analysis
and socio-economic-environmental values and impacts to provide a more
holistic view of the various mixes of risk reduction measures. Given risk reduction
and resilience planning has very strong social and environmental dimensions, it
is intended UNHaRMED can lead to more transparent and robust policy settings
and decision-making in an integrated and holistic manner. The software is
continuing to be developed and implemented in three states in Australia across
emergency services, planning and environmental protection agencies.
REFERENCES 1 Deloitte Access Economics, 2013. Building our nation's resilience to natural disasters. Australian Business
Roundtable for Disaster Resilience and Safer Communities.

AFAC18: PROCEEDINGS FROM THE BUSHFIRE AND NATURAL HAZARDS CRC & AFAC CONFERENCE 2018 | REPORT NO. 367.2018
102
RISK MODELLING AS A TOOL TO SUPPORT LOCAL GOVERNMENT EMERGENCY MANAGEMENT Non-peer reviewed research proceedings from the Bushfire and Natural
Hazards CRC & AFAC conference
Perth, 5 – 8 September 2018
Miles Crawford1,2 1 Bushfire and Natural Hazards CRC 2 Joint Centre for Disaster Research, Massey University, Wellington, New
Zealand
Corresponding author: [email protected]

AFAC18: PROCEEDINGS FROM THE BUSHFIRE AND NATURAL HAZARDS CRC & AFAC CONFERENCE 2018 | REPORT NO. 367.2018
103
SHORT ABSTRACT
Miles Crawford, Joint Centre for Disaster Research, Massey University, New
Zealand and Bushfire Natural Hazards CRC.
Due to our growing exposure and vulnerability to natural hazards, it is
increasingly important for local government to have tools to better understand
natural hazard risk and enable effective emergency management. One such
tool is risk modelling, an innovative way for local government to assess,
prioritize, communicate and manage its natural hazard risks. The Sendai
Framework for Disaster Risk Reduction 2015-2030 reflects the importance of risk
modelling, where it calls for the development, application and strengthening of
models for disaster risk management at the global and regional level. A variety
of natural hazard risk modelling tools have been developed, which are
increasingly used by government and private organizations. However, to date
little research has gone into how effective risk modelling is as a tool to support
local government emergency management. This presentation shares the results
from recent research on understanding the perceptions that local government
emergency managers have on the value of risk modelling tools. While
emergency managers see the value in the use of risk modelling relating to
communication, decision-making, planning and emergency response
purposes, they also see a number of challenges. Challenges identified for the
use of risk modelling relate to how emergency management and natural
hazard risk is perceived and managed, issues with connecting information and
developing data, and the capability of risk modelling software. However, with
ongoing mutual engagement, risk modelling can become an effective tool to
communicate natural hazard risk and better inform emergency management
policy and procedure.

AFAC18: PROCEEDINGS FROM THE BUSHFIRE AND NATURAL HAZARDS CRC & AFAC CONFERENCE 2018 | REPORT NO. 367.2018
104
EXTENDED ABSTRACT
Due to our growing exposure and vulnerability to natural hazards, it is
increasingly important for local government to have tools to better understand
natural hazard risk and enable effective emergency management. One such
tool is risk modelling, an innovative way for local government to assess, prioritise,
communicate and manage its natural hazard risks. The Sendai Framework for
Disaster Risk Reduction 2015-2030 reflects the importance of risk modelling,
where it calls for the development, application and strengthening of models for
disaster risk management at the global and regional level (UNISDR, 2015). A
variety of natural hazard risk modelling tools have been developed, which are
increasingly used by government and private organizations. However, to date
little research has gone into how effective risk modelling is as a tool to support
local government emergency management. Literature on end-user perception
of modelling and decision support systems (DSS) is scarce in general, and is
even more so for natural hazard risk, and emergency management.
Komendantova et al. (2014) discuss how the feedback from stakeholders is
important for informing the usability of natural hazard models and how they are
applied; Reiter et al. (2017a) report that DSS have a positive influence on end-
user adaptation activities for climate change, but then add how this positive
influence is limited (Reiter et al., 2017b); Newman et al. (2017) stress the
importance of end-user participation for natural hazard DSS development and
use; and Crawford et al. (2018) find that while natural hazard risk modelling is
useful for the end-user, there are a number of policy and organisational
challenges that limit its effectiveness.
As part of further exploring this gap in research, this extended abstract refers to
interviews held with emergency managers on their perceptions of risk modelling
and its use. It briefly explains how emergency management is achieved in New
Zealand and how risk modelling is used as a tool for natural hazard risk
management. It sets out the results from the interviews, showing that while
emergency managers see the value in the use of risk modelling relating to
communication, decision-making, planning and emergency response
purposes, there are also a number of challenges inhibiting its use. We discuss
these benefits and challenges, and conclude with some recommendations on
how these challenges can be managed in order to better enable risk modelling
for emergency management.
Emergency management in New Zealand, commonly referred to as CDEM
(Civil Defence Emergency Management), is devolved from central government
legislation down to local government for application. It promotes the
sustainable management of hazards and encourages communities to manage
natural hazard risk via a framework of Reduction, Readiness, Response and
Recovery, known as the 4R's (New Zealand Government, 2002). CDEM is
expected to follow a risk-based approach to achieving the 4R’s:
The requirement to practice sound risk management is implicit
throughout the CDEM Act. CDEM Groups are required to apply risk

AFAC18: PROCEEDINGS FROM THE BUSHFIRE AND NATURAL HAZARDS CRC & AFAC CONFERENCE 2018 | REPORT NO. 367.2018
105
management to their planning and activities. Whilst planning is not
a linear process and may involve many iterative steps, it is
expected to follow a risk management based approach (MCDEM,
n.d.).
By assessing the consequences of these hazards, the focus can move to
measures for reducing the risks and for proactively managing residual impacts.
However, emergency management sits within a complex structure for natural
hazard governance in New Zealand (Basher, 2016; LGNZ, 2014). This results in a
misperception of CDEM as primarily an emergency response role (Petak, 1985;
Britton & Clark, 2000; Waugh & Streib, 2006), which then impacts on how
enabled emergency management is to access and use risk modelling data
and software.
The use of natural hazard risk modelling software has developed over the past
few decades as decision-makers seek to better understand the potential loss
from disasters. Quantitative risk modelling combines deterministic or
probabilistic hazard models, with exposure data and vulnerability models to
assess loss, most often depicting economic loss but can also depict
infrastructure or societal impacts depending on risk management objectives.
Figure 1 sets out the risk modelling framework for how natural hazard data is
combined to produce quantitative risk information.
Figure 1: Natural hazard risk modelling framework. Source: RiskScape Model
Framework (n.d.)

AFAC18: PROCEEDINGS FROM THE BUSHFIRE AND NATURAL HAZARDS CRC & AFAC CONFERENCE 2018 | REPORT NO. 367.2018
106
Pondard and Daly (2011) illustrate how risk modelling can give a more
comprehensive insight into natural hazards and their socioeconomic
consequences, setting out three key benefits:
1. A clearer overview of geographical concentrations of natural hazard
risks, across different frequencies and magnitudes;
2. Quantification of potential physical damage, business interruption and
casualties; and
3. Identification of key risk drivers.
Decision-makers and communities can then use this information as a starting
point for how they manage risk reduction measures and respond to actual
events (Donovan & Oppenheimer, 2015; Edwards et al., 2012; Eiser et al., 2012;
King & Bell, 2009; UNISDR, 2015).
As part of understanding the needs of the New Zealand CDEM sector within
local government for risk modelling, we held interviews in five local government
regions across New Zealand to understand how emergency managers
perceived and used risk modelling. These areas were: Wellington, Hawke's Bay,
Canterbury, Nelson/ Tasman (combined CDEM Group) and The Bay of Plenty.
Following this research, Crowley, et al. (2016) identify five common areas of
CDEM risk information and data needs. Figure 2 sets out these areas, where red
is for response related information needs, blue is for pre-event communication,
orange is for lifelines information, green is for land use planning and grey is for
socio-cultural information. Whilst multi-hazards and economic losses cross cut
the needs identified.

AFAC18: PROCEEDINGS FROM THE BUSHFIRE AND NATURAL HAZARDS CRC & AFAC CONFERENCE 2018 | REPORT NO. 367.2018
107
Figure 2: Most common risk data and information needs identified by CDEM
Groups. Source: Crowley et al. (2016).
Results show that emergency managers see the outputs from risk modelling as
beneficial for managing emergency events, increasing natural hazard
awareness for the public, and for communicating risk to decision-makers for
cost-benefit analysis, risk reduction and land use development measures:
We can use it as a response tool … as long as the data is
available.
Managing development …making sure that we don’t develop in
risky places. Being aware and making sure the right rules are in
place.
[It] would be a huge benefit for us to be able to show [modelling
results] to our politicians, to our community members, so they
could understand what the impacts of these events might be so
that they are encouraged to take those mitigation options that we
believe they need to take now.
As such, emergency managers agree that risk modelling can provide valuable
information for emergency management.
In saying this however, emergency managers report that in general, they don’t
use risk modelling. Current research by the author reveals that the emergency
management function is not very well enabled to use it. This is because of how
well the emergency management function is integrated within the council,
how well resourced emergency management is to access and use risk

AFAC18: PROCEEDINGS FROM THE BUSHFIRE AND NATURAL HAZARDS CRC & AFAC CONFERENCE 2018 | REPORT NO. 367.2018
108
modelling data, and how emergency management maintains a response
focus for risk modelling.
Results show that emergency management is commonly misperceived as an
emergency response function and is therefore marginalised from being
integrated into holistic council planning and policy-making for hazards and risk
management.
… usually civil defence is the ‘gimp’, if you remember that movie,
usually they sit in a box and they only bring the gimp out when
things get really, really bad…when it's over they put civil defence
back in the box. So I think the challenge is for civil defence to be
out of the box all the time and actually be working with other parts
of local authorities.
[Emergency management] tends to operate much more on the
response and recovery side and try as you might there's not
actually a lot of crossover between, and dialogue between the
emergency management and the planning and policy people.
Given that emergency management is in general not well integrated into the
holistic council hazard and risk management, they are not well resourced to
access and use data for hazard and risk management purposes. As such,
Crowley et al. (2016) report that emergency management is the ‘gatherers’ of
risk information rather than the instigators.
We pull this information from various consultancies, research, local
authority information and science.
[The data] was never really designed for CDEM. We can use it …
as long as the data is available.
While emergency management is trying to break away from misperceptions
that it is only a response function, emergency managers primarily see value in
risk modelling for emergency response. Taking into consideration that risk
models are more capable of assessing risk before an event, as opposed to
during an event, it seems that current models may not be suitable for
emergency management objectives.
In terms of CDEM we need information that is as up to date as
possible. We can use it as a response tool as long as the data is
available.
I know that … the [emergency management] people weren't too
keen on it. Maybe because that is just too hard to use in an event.
This extended abstract paints a thought provoking picture for risk modelling’s
use as a tool to support emergency management. The challenges associated
with this are not just how risk modelling is perceived and used by emergency
management, but also how the emergency management function is
perceived and used within New Zealand local government.

AFAC18: PROCEEDINGS FROM THE BUSHFIRE AND NATURAL HAZARDS CRC & AFAC CONFERENCE 2018 | REPORT NO. 367.2018
109
There are a multiple ideas and opportunities for how these challenges can be
managed in order to better enable risk modelling for emergency
management. Crowley et al. (2016) focus on making risk modelling more
usable, recommending:
• The development of new vulnerability functions for risk modelling that are
more closely aligned with emergency management information needs.
• Giving risk models capability to have shorter run-times, enabling risk
models to run scenarios quickly and to produce a tailored real-time
report.
• Improved ability for risk models to inter-connect across existing tools
containing hazard information.
• More frequent interaction between risk model developers and
emergency managers to better understand their modelling needs and
to provide training.
Crawford et al. (2018) focus on better enabling the surrounding governance
system to support risk modelling, recommending:
• Stronger legislated mandate for how natural hazard risk management,
and risk modelling is achieved in New Zealand local government
• Greater focus on building capacity and capability for collecting,
managing and using natural hazard risk data so that it is well known,
available, and usable.
• Effective and meaningful participatory approaches for crossing the
‘science to policy gap’, improving natural hazard risk management
policy, and better enabling the use of risk modelling.
Building on these previous recommendations, we focus on how perceptions of
risk modelling could be improved so that risk modelling is seen as more of a
valued tool for emergency management, recommending:
• Further development of shared mental models that give greater
connectivity, advocacy and significance for emergency management
initiatives, like risk modelling, across different council roles.
• Participatory co-development of risk modelling through a bottom-up
approach to enhance understanding of the capability of risk models,
develop confidence in the information that they provide, and build the
value of risk modelling across the council.
• Regular risk management workshops to review levels of exposure and
vulnerability to hazards and how risk modelling can help clarify and
prioritise reduction options, and aid decision making.
While risk modelling is a valued tool to support local government emergency
management, in the whole, it is not used. Through a better understanding for
how emergency management perceives and uses risk modelling, we can more
clearly acknowledge and work to overcome challenges that currently inhibit its

AFAC18: PROCEEDINGS FROM THE BUSHFIRE AND NATURAL HAZARDS CRC & AFAC CONFERENCE 2018 | REPORT NO. 367.2018
110
use. With enhanced usability of risk modelling, stronger legislated support for its
application, and improved perceptions on how it adds value for emergency
management, our communities are safer, better enabled, and more resilient.

AFAC18: PROCEEDINGS FROM THE BUSHFIRE AND NATURAL HAZARDS CRC & AFAC CONFERENCE 2018 | REPORT NO. 367.2018
111
REFERENCES 1 Basher, R. (2016). High stakes: disaster risk in New Zealand. Policy Quarterly, 12(3).
2 Britton, N.R. & Clark, G.J. (2000). From Response to Resilience: Emergency Management Reform in New
Zealand: Natural hazards review, 1(3), 145-150.
3 Crawford, M. H., Crowley, K., Potter, S. H., Saunders, W. S. A., & Johnston, D. (2018). Risk modelling as a tool
to support natural hazard risk management in New Zealand local government. International Journal of
Disaster Risk Reduction.
4 Crowley, K.; Crawford, M.; Potter, S. (2016) Risk Tool and Data Needs: Civil Defence and Emergency
Management in New Zealand. NIWA Client Report No: 2016011WN
5 Donovan, A. R., & Oppenheimer, C. (2015). Modelling risk and risking models: The diffusive boundary
between science and policy in volcanic risk management. Geoforum, 58, 153-165.
6 Edwards, S., Fearnley, C., Lowe, C., Wilkinson, E. (2012). Disaster risk reduction for natural hazards: Putting
research into practice. Environmental hazards, 11(2):172-176.
7 Eiser, J. R., Bostrom, A., Burton, I., Johnston, D. M., McClure, J., Paton, D., ... & White, M. P. (2012). Risk
interpretation and action: A conceptual framework for responses to natural hazards. International Journal
of Disaster Risk Reduction, 1, 5-16.
8 King, A., Bell, R. (Programme Managers) (2009). RiskScape Project: 2004 - 2008, NIWA Science Report
2009/75. 172p.
9 Komendantova, N., Mrzyglocki, R., Mignan, A., Khazai, B., Wenzel, F., Patt, A., & Fleming, K. (2014). Multi-
hazard and multi-risk decision-support tools as a part of participatory risk governance: Feedback from civil
protection stakeholders. International Journal of disaster risk reduction, 8, 50-67.
10 Local Government New Zealand (LGNZ), (2014). Managing natural hazard risk in New Zealand – towards
more resilient communities. A think piece for local and central government and others with a role in
managing natural hazards.
11 MCDEM. (n.d.). National Hazard Risk Reduction. Retrieved from http://www.civildefence.govt.nz/cdem-
sector/cdem-framework/the-4rs/reduction/nationalhazard-risk-reduction/ (Accessed 13 November 2015).
12 New Zealand Government. (2002). Civil defence emergency management act 2002. Wellington: Published
under the Authority of the New Zealand Government.
13 Newman, J. P., Maier, H. R., Riddell, G. A., Zecchin, A. C., Daniell, J. E., Schaefer, A. M., ... & Newland, C. P.
(2017). Review of literature on decision support systems for natural hazard risk reduction: current status and
future research directions. Environmental Modelling & Software, 96, 378-409.
14 Petak, W. J. (1985). Emergency management: A challenge for public administration. Public Administration
Review, 45, 3-7.
15 Pondard, N., Daly, M. (2011). Hazards risk modelling: An approach providing risk management solutions for
local government. GNS Miscellaneous Series 38.
16 Reiter, D., Meyer, W., Parrott, L., Baker, D., & Grace, P. (2017a). Increasing the effectiveness of environmental
decision support systems: lessons from climate change adaptation projects in Canada and Australia.
Regional Environmental Change, 18(4), 1173-1184.
17 Reiter, D., Meyer, W., & Parrott, L. (2017b). Why do NRM regional planning processes and tools have limited
effect? Presenting the perspective of the end user. Climate Risk Management, 18, 66-74.
18 UNISDR (United Nations Office for Disaster Risk Reduction). (2015). Sendai framework for disaster risk
reduction 2015–2030. Geneva: UNISDR. http://www.unisdr.org/files/43291_sendaiframeworkfordrren.pdf.
Accessed 08 June 2016.
19 Waugh, W. L., & Streib, G. (2006). Collaboration and leadership for effective emergency management.
Public administration review, 66(s1), 131-140.

AFAC18: PROCEEDINGS FROM THE BUSHFIRE AND NATURAL HAZARDS CRC & AFAC CONFERENCE 2018 | REPORT NO. 367.2018
112
FILLING THE GAPS: HOW ECONOMICS CAN HELP MAKE IMPORTANT DECISIONS WHEN INFORMATION IS MISSING Non-peer reviewed research proceedings from the Bushfire and Natural
Hazards CRC & AFAC conference
Perth, 5 – 8 September 2018
Veronique Florec1,2, Abbie Rogers1,2, Atakelty Hailu1,2, David Pannell1,2 1 Bushfire and Natural Hazards CRC 2 The University of Western Australia
Corresponding author: [email protected]

AFAC18: PROCEEDINGS FROM THE BUSHFIRE AND NATURAL HAZARDS CRC & AFAC CONFERENCE 2018 | REPORT NO. 367.2018
113
ABSTRACT
FILLING THE GAPS: HOW ECONOMICS CAN HELP MAKE IMPORTANT DECISIONS WHEN INFORMATION IS
MISSING
Veronique Florec, Abbie Rogers, Atakelty Hailu, David Pannell
Agricultural and Resource Economics, School of Agriculture and Environment, The University of Western
Australia, WA
When natural hazard managers need to make decisions about the allocation of
resources, there is often information missing that cannot be rapidly obtained. In
many cases, these decisions have to be made without waiting for the information to
become available. But how can natural hazard managers know that their chosen
allocation of resources generates good value for money when there is data missing?
There are economic tools available that can support decision making in such cases.
We explain how economic analyses cope with missing data and uncertainty.
Through case studies, we illustrate how economic tools are used to rank the
importance of different pieces of information and to find thresholds where the
optimal decision changes. We also demonstrate how these tools can fill-in the gaps
when there is little knowledge about a topic, for example, how to explicitly represent
intangible values in decision making. The ability of economic tools to manage
missing data and uncertainty can provide a wealth of information to natural hazard
managers that can help them make better decisions.

AFAC18: PROCEEDINGS FROM THE BUSHFIRE AND NATURAL HAZARDS CRC & AFAC CONFERENCE 2018 | REPORT NO. 367.2018
114
INTRODUCTION
Emergency and land management agencies have to deal with the management
of multiple natural hazards in multiple locations and decide where to implement
mitigation measures. They have limited budgets that often cannot allow for all the
mitigation measures to be implemented. Therefore, they have to evaluate their
options and decide which ones to go ahead with. To make sure that the mitigation
measures selected are those that benefit society (and the environment) the most,
governments need to ensure that the benefits justify the cost and that they are
getting the best value for money out of the investments in the mitigation options
selected. The ideal situation is one where the level of mitigation chosen balances
the cost of mitigation with the value of avoided losses (Stein and Stein, 2014). With
tighter budgets at both State and national levels, natural hazards managers are
increasingly under pressure to justify the use and allocation of resources for
mitigation efforts.
To make a decision about the allocation of resources for mitigation activities, it is
necessary to know all the benefits (tangible and intangible) that could be
generated and compare that to the costs of implementing the mitigation strategy.
However, managers do not always know all the benefits that can be generated and
there is often information missing that cannot be rapidly obtained to do a full
assessment.
In many cases, these decisions have to be made without waiting for the information
to become available. Because natural hazards tend to be relatively rare events
(albeit becoming more and more frequent in recent years), both their probabilities
and the resulting losses are hard to estimate (Stein and Stein 2014). There can be
uncertainty or data missing at different levels of the decision process:
1. the future occurrence of natural hazard events,
2. the things that could be affected,
3. and the value of those things.
Which then leads to uncertainty in:
4. the probable resulting losses,
5. the difference that mitigation measures would make to the impact of natural
hazards
But how can natural hazard managers know that their chosen allocation of
resources generates good value for money when there is data missing or high
uncertainty about these parameters?

AFAC18: PROCEEDINGS FROM THE BUSHFIRE AND NATURAL HAZARDS CRC & AFAC CONFERENCE 2018 | REPORT NO. 367.2018
115
ECONOMIC TOOLS FOR MISSING OR UNCERTAIN DATA
Economists are still able to model decision outcomes even when there may be a
lack of data for a particular parameter or the data has high levels of uncertainty.
There are economic tools available that can support decision making in such cases.
More importantly, it has been shown that using uncertain information is better than
dismissing a piece of information because it has high levels of uncertainty attached
to it (Pannell and Gibson, 2016). The outcome of an analysis and the decisions it
leads to are generally better with uncertain information compared to incomplete
information.
Economic analyses can cope with missing data and uncertainty in many ways and
still provide valuable insights. Conceptualising the process provides a wealth of
information with regards to the factors involved. In many cases, even a simple and
approximate comparison of costs and benefits show whether a policy option is
worth discarding or considering further (Stein and Stein 2014).
One of the most common ways in which economists deal with uncertainties and
missing data is through sensitivity analysis. In a sensitivity analysis, the information
entered into an economic model is changed and the impact of these changes is
evaluated. Thus an economist assesses how changes to the data entered into the
economic analysis change the results and the conclusions that can be drawn from it
(Pannell 1997). There is a wide range of uses for sensitivity analyses, including
decision making, communication, increased understanding, and economic model
development (see Table 2).
When there is uncertainty, sensitivity analysis is very helpful for making decisions and
policy recommendations. If there is uncertainty regarding a particular piece of
information, a sensitivity analysis can provide information on:
1. how much confidence can be attributed to the potential value for money of
a particular policy decision (Use 1 from Table 1),
2. what information is needed and in what order it needs to be acquired to
improve the confidence in a particular decision (Use 19),
3. under what circumstances would the optimal decision change (Uses 2, 3, 5
and 11),
4. what society would lose (how much worse off society would be) if the
change in circumstances is ignored and the original optimal strategy is kept
(Uses 4 and 6).
If the optimal strategy does not change when the data entered is changed, it is
considered robust (insensitive to parameters changes) and there can be
confidence in implementing or recommending it. If the strategy is not robust,
however, sensitivity analysis can be used to indicate what is potentially gained or lost
with the implementation of different strategies.
When data is missing, economists tend to fill the gaps in economic analyses with
expert knowledge (even if considered uncertain) and perform sensitivity analysis to

AFAC18: PROCEEDINGS FROM THE BUSHFIRE AND NATURAL HAZARDS CRC & AFAC CONFERENCE 2018 | REPORT NO. 367.2018
116
evaluate the robustness of the results and how critical it is to invest in the collection
of the data missing.

AFAC18: PROCEEDINGS FROM THE BUSHFIRE AND NATURAL HAZARDS CRC & AFAC CONFERENCE 2018 | REPORT NO. 367.2018
117
TABLE 2. USES OF SENSITIVITY ANALYSIS
Decision making
1. Testing the robustness of an optimal solution
2. Identifying critical values, thresholds or break-even values where the optimal
strategy changes
3. Identifying sensitive or important variables
4. Investigating sub-optimal solutions
5. Developing flexible recommendations which depend on circumstances
6. Comparing the values of simple and complex decision strategies
7. Assessing the 'riskiness' of a strategy or scenario
Communication
8. Making recommendations more credible, understandable, compelling, or
persuasive
9. Allowing decision makers to select assumptions
10. Conveying lack of commitment to any single strategy
Increased understanding
11. Estimating relationships between input and output variables
12. Understanding relationships between input and output variables
13. Developing hypotheses for testing
Model development
14. Testing the model for validity or accuracy
15. Searching for errors in the model
16. Simplifying the model
17. Calibrating the model
18. Coping with poor or missing data
19. Prioritising acquisition of information
Source: adapted from Pannell (1997).

AFAC18: PROCEEDINGS FROM THE BUSHFIRE AND NATURAL HAZARDS CRC & AFAC CONFERENCE 2018 | REPORT NO. 367.2018
118
Example: increasing resilience for a coastal highway
To illustrate our point, we have selected an example of infrastructure betterment
after a flood event. Betterment, that is, rebuilding an asset to a more disaster-resilient
standard, is still rarely undertaken in Australia. Here we analyse a betterment
proposal for a highway in a coastal area connecting a metropolitan area and a
major mining and tourism region (adapted from Fleming et al 2016).1 In 2010, the
region and adjacent areas experienced extensive flooding during 8 days, during
which many segments of the road had to be closed. Some segments had to be
closed for 15 days.
A damage assessment indicates that the total cost for repair and reinstatement of
the highway is approximately AUD 15 million (Table 3). In addition to these repair
costs, the 2010 flood event resulted in private costs associated with road closure of
AUD 10.26 million, public agency costs of AUD 580,000 (clean up and increased
maintenance) and social costs of AUD 1.13 million (damage to vehicles and private
assets). This amounts to a total of about AUD 12 million in damages. Thus, the total
sum of repair costs and damages caused by a flood of this magnitude (repairing the
highway plus other flood impacts) amounts to AUD 27 million per flood event.
A betterment option is proposed that would prevent catastrophic failures in the
infrastructure (which cause prolonged closure periods and costly repair works) and
reduce closure periods in the event of another flood. The betterment upgrade
would cost AUD 8 million as a one-off investment (Table 2). It is assumed that the
betterment works will be undertaken at the same time as the repair works after an
initial flood event2. Thus, the total cost of the initial flood event with the betterment
option would be AUD 35 million ($15m in repair costs, $12m in damages, $8m in
betterment works), relative to the total cost of the initial flood event without the
betterment option of AUD 27 million ($15m repair costs, $12 damages).
Implementing the betterment option would mean the repair costs and damages
from future floods of this magnitude would be reduced. Subsequent floods would
result in an estimated AUD 9 million per flood event for damages and repair costs
with the betterment option, compared to the AUD 27 million per flood event without
betterment.
The 2010 flood event was considered to have a 10 years average recurrence
interval (ARI); that is, an event of this magnitude is likely to occur once every 10
years. Therefore, the expected average annual costs of flooding are AUD 2.7 million
without betterment (i.e. sum of repair costs and damages x event probability), and
AUD 900,000 with betterment. All of these costs, the benefits of betterment, and the
net present value (NPV) and benefit-cost ratio (BCR) of the betterment option are
summarised in Table 3. In a Benefit-Cost Analysis, a positive NPV (i.e. >0) and a BCR
1 This example is adapted from a case study presented in Fleming et al. (2016). In this paper the authors
develop and illustrate a method for advancing proposals for the betterment of public assets. Due to
confidentiality issues and political sensitivities, the authors had to de-identify the case studies in their
paper and further information on their location or the source of the data cannot be provided. 2 If the betterment works were undertaken at some other time (e.g. in between flood events), they may be more expensive given that equipment, personnel, etc. are not already on-site undertaking the repair works.

AFAC18: PROCEEDINGS FROM THE BUSHFIRE AND NATURAL HAZARDS CRC & AFAC CONFERENCE 2018 | REPORT NO. 367.2018
119
greater than one indicate that a project is a worthwhile investment; that is, the
benefits outweigh the costs.

AFAC18: PROCEEDINGS FROM THE BUSHFIRE AND NATURAL HAZARDS CRC & AFAC CONFERENCE 2018 | REPORT NO. 367.2018
120
TABLE 3. COSTS, BENEFITS AND NET PRESENT VALUE OF HIGHWAY BETTERMENT
Flood damage Cost (AUD)
Private costs associated with road closure 10,260,000
Public agency costs 580,000
Social costs 1,130,000
Total damages 11,970,000
Repair costs Cost (AUD)
Standard repair costs 15,000,000
Betterment 8,000,000
Total costs of future flood events Cost (AUD)
Total repair costs and damages without betterment 26,970,000
Total repair costs and damages with betterment 9,000,000
Total costs of future flood events Cost (AUD)
Total repair costs and damages without betterment 26,970,000
Total repair costs and damages with betterment 9,000,000
Event recurrence prob.
Probability flood event 0.1
Economic estimates Cost (AUD)
Expected average annual cost of flooding without betterment 2,697,000
Expected average annual cost of flooding with betterment 900,000
Expected annual benefit of betterment 1,797,000
Present value of benefits of betterment (over 30 years) 24,735,402
Present value of costs of betterment (over 1 year) 7,547,170
Net Present Value of betterment 17,188,232
Benefit-cost ratio 3.3
Source: adapted from Fleming et al. (2016).

AFAC18: PROCEEDINGS FROM THE BUSHFIRE AND NATURAL HAZARDS CRC & AFAC CONFERENCE 2018 | REPORT NO. 367.2018
121
The results of the Benefit-Cost Analysis presented in Table 3 show that the betterment
option yields a positive BCR that is above 1: for every dollar invested in betterment,
there is a gain of $3.3. Thus in this case, it is worth investing in betterment of the road
infrastructure. But what if the decision makers did not have enough information on
the total damage caused by the flood, or the costs and damages with betterment,
or if there is a high level of uncertainty on the probability of the flood event?
Let's assume that experts in the area estimate total damages of the 2010 flood to be
somewhere between AUD 5 to 20 million, rather than being certain they will amount
to AUD 12 million. These same experts believe that with betterment, total repair costs
and damages could range between AUD 5 and 26 million, rather than AUD 9 million;
that is, in the worst of cases with the betterment option, the total repair costs and
damages could reach almost the same total as the current estimate of repair costs
and damages without betterment (AUD 27 million).
We can conduct a sensitivity analysis on this information. Table 4 shows the changes
in NPV and BCR for different flood probabilities when damage estimates of the 2010
flood vary between AUD 5 to 20 million and Table 5 shows the changes in NPV and
BCR for different flood probabilities when total repair costs and damages after
betterment range between AUD 5 and 26 million.
As it would be expected, if the flood event occurs much less often, the value of
doing betterment works is reduced. However, what is of high interest to decision
makers from the sensitivity analysis in Table 4 is that the frequency of the flood event
has to be significantly reduced for the investment in betterment to become
inefficient; that is, if the ARI is reduced from once every 10 years to once every 50
years. The betterment investment is worthwhile if the flood has a probability of up to
0.5 (once every 20 years), unless the damage caused by a flood of this magnitude is
lower than about AUD 10 million.
Something that is less obvious in this sensitivity analysis is the total variation in NPV
and BCRs. As the flood probability decreases, the variation between the lowest NPV
(or BCR) and the highest NPV becomes smaller (Table 4). This indicates that, the
lower the chance of a flood occurring in this coastal highway, the more important it
becomes to have a good idea of the total damages that the flood would cause to
make better decisions about the resilience levels needed for the road infrastructure.
The sensitivity analysis in Table 5, looking at changes in the results with variations in
the impact of betterment, shows an even more glaring disparity. For an ARI of up to
30 years, what is known about the impacts of betterment could make the decision
of betterment either a very worthwhile one, or a completely foolish one. This result
indicates to decision makers that to make a good decision regarding betterment for
this coastal highway, it is important to collect more information on the impacts of
betterment on future costs and damages.
Nevertheless, with the current probability estimates for the 2010 flood (i.e. 0.1
probability, or once every 10 years), the reduction in future costs and damages
achieved by betterment can be a lot more modest but the investment would still be
worthwhile over a wide range of cost reductions (Table 5). If betterment achieves a
reduction in total flood costs and damages of only AUD 6 million (as opposed to a

AFAC18: PROCEEDINGS FROM THE BUSHFIRE AND NATURAL HAZARDS CRC & AFAC CONFERENCE 2018 | REPORT NO. 367.2018
122
reduction of AUD 18 million as estimated in the original model), it would still be
sensible to proceed with the investment.

AFAC18: PROCEEDINGS FROM THE BUSHFIRE AND NATURAL HAZARDS CRC & AFAC CONFERENCE 2018 | REPORT NO. 367.2018
123
TABLE 4. SENSITIVITY ANALYSIS: VARYING ESTIMATED FLOOD DAMAGE
Total estimated
damage of 2010
flood event
(AUD million)
Net Present Value and BCRs
Flood probability
0.20 0.10 0.05 0.03 0.02 0.01
Flood ARI (years)
5 10 20 30 50 100
5
Net Present Value of
betterment (AUD million) 22.7 7.6 0.0 - 2.5 - 4.5 - 6.0
Benefit-cost ratio 4.0 2.0 1.0 0.7 0.4 0.2
8
Net Present Value of
betterment (AUD million) 31.0 11.7 2.1 - 1.1 - 3.7 - 5.6
Benefit-cost ratio 5.1 2.6 1.3 0.9 0.5 0.3
12
Net Present Value of
betterment (AUD million) 41.9 17.2 4.8 0.7 - 2.6 - 5.1
Benefit-cost ratio 6.6 3.3 1.6 1.1 0.7 0.3
16
Net Present Value of
betterment (AUD million) 53.0 22.7 7.6 2.5 - 1.5 - 4.5
Benefit-cost ratio 8.0 4.0 2.0 1.3 0.8 0.4
20
Net Present Value of
betterment (AUD million) 64.0 28.2 10.3 4.4 - 0.4 - 4.0
Benefit-cost ratio 9.5 4.7 2.4 1.6 0.9 0.5

AFAC18: PROCEEDINGS FROM THE BUSHFIRE AND NATURAL HAZARDS CRC & AFAC CONFERENCE 2018 | REPORT NO. 367.2018
124
TABLE 5. SENSITIVITY ANALYSIS: VARYING IMPACTS WITH BETTERMENT
Total costs and
damages with
betterment
(AUD million)
Net Present Value and BCRs
Flood probability
0.20 0.10 0.05 0.03 0.02 0.01
Flood ARI (years)
5 10 20 30 50 100
5
Net Present Value of
betterment (AUD million) 52.9 22.7 7.6 2.5 - 1.5 - 4.5
Benefit-cost ratio 8.0 4.0 2.0 1.3 0.8 0.4
9
Net Present Value of
betterment (AUD million) 41.9 17.2 4.8 0.7 - 2.6 - 5.1
Benefit-cost ratio 6.6 3.3 1.6 1.1 0.7 0.3
16
Net Present Value of
betterment (AUD million) 22.7 7.6 0.0 - 2.5 - 4.5 - 6.0
Benefit-cost ratio 4.0 2.0 1.0 0.7 0.4 0.2
21
Net Present Value of
betterment (AUD million) 8.9 0.7 - 3.4 - 4.8 - 5.9 - 6.7
Benefit-cost ratio 2.2 1.1 0.5 0.4 0.2 0.1
26
Net Present Value of
betterment (AUD million) - 4.9 - 6.2 - 6.9 - 7.1 - 7.3 - 7.4
Benefit-cost ratio 0.4 0.2 0.1 0.1 0.0 0.0

AFAC18: PROCEEDINGS FROM THE BUSHFIRE AND NATURAL HAZARDS CRC & AFAC CONFERENCE 2018 | REPORT NO. 367.2018
125
CONCLUSION
The example shown here demonstrates that with a very simple analysis using
ranges of values for uncertain data, a wealth of information can be obtained
that can help decision makers with the allocation of resources and investment
decisions for natural hazard management. The changes in the results with
different values can indicate how much confidence they can have in their
decision, or if they need more information in a particular area to improve the
confidence in the decision. In some cases, just the process of conducting a
sensitivity analysis can raise new important questions and change the course of
a strategy. The ability of economic tools to manage missing data and
uncertainty can be very helpful to natural hazard managers and help them
make better decisions.

AFAC18: PROCEEDINGS FROM THE BUSHFIRE AND NATURAL HAZARDS CRC & AFAC CONFERENCE 2018 | REPORT NO. 367.2018
126
REFERENCES 1 Fleming, C.M., Manning, M. and Smith, C. (2016) Evaluating betterment projects, Disasters, vol. 40,
issue 2, pp. 365−384.
2 Pannell, D.J. (1997) Sensitivity analysis of normative economic models: theoretical framework and
practical strategies, Agricultural Economics, vol. 16, pp. 139-152.
3 Pannell, D.J. and Gibson, F.L. (2016) Environmental cost of using poor decision metrics to prioritize
environmental projects, Conservation Biology, vol. 30, issue 2, pp. 382-391.
4 Stein J. and Stein J. (2014) Playing Against Nature: Integrating Science and Economics to Mitigate
Natural Hazards in an Uncertain World. Somerset, Wiley.

AFAC18: PROCEEDINGS FROM THE BUSHFIRE AND NATURAL HAZARDS CRC & AFAC CONFERENCE 2018 | REPORT NO. 367.2018
127
A SYSTEMATIC EXPLORATION OF THE POTENTIAL FOR BUSHFIRE RISK MITIGATION WITH PRESCRIBED BURNING Non-peer reviewed research proceedings from the Bushfire and Natural Hazards
CRC & AFAC conference
Perth, 5 – 8 September 2018
Brett Cirulis1,2, Hamish Clarke1,2,3, Ross Bradstock2,4, Matthias Boer3,4, Trent Penman1,4,
Owen Price2,4 1 University of Melbourne, 2 University of Wollongong, 3 Western Sydney University 4 Bushfire and Natural Hazards CRC
Corresponding author: [email protected]

AFAC18: PROCEEDINGS FROM THE BUSHFIRE AND NATURAL HAZARDS CRC & AFAC CONFERENCE 2018 | REPORT NO. 367.2018
128
ABSTRACT
A SYSTEMATIC EXPLORATION OF THE POTENTIAL FOR BUSHFIRE RISK MITIGATION WITH PRESCRIBED BURNING
Brett Cirulis1, Hamish Clarke2,3, Ross Bradstock2, Matthias Boer3, Trent Penman1,
Owen Price2, 1 School of Ecosystem and Forest Sciences, University of
Melbourne, VIC, 2 Centre for Environmental Risk Management of Bushfires,
University of Wollongong, NSW, 3 Hawkesbury Institute for the Environment,
Western Sydney University, NSW
Fire regimes vary widely across Australian ecosystems as a function of climate,
fuel, terrain and ignition variations. Fundamentally such variation will not only
shape the way that prescribed burning can reduce risk to human and
environmental assets but also the scope for effective treatment. While many
agencies are moving toward planning systems based on risk assessment,
knowledge of the best way to use prescribed fire to reduce risk to key values is
generally lacking. The BNHCRC Project, “From hectares to tailor-made solutions
for prescribed burning”, combines simulation and empirical approaches to
improve our understanding of how risk to any particular management value will
respond to variations in the spatial location and rates of treatment. Here, we
present the modelling framework and key results for two landscapes, Tasmania
and the Australian Capital Territory. We run a large number of simulations using
the PHOENIX RapidFire model, investigating the interaction between fuel
treatment and location under various weather scenarios. Key outputs for risk
assessment include area burnt, house loss, life loss, roads and powerlines
damaged, environmental cost and economic cost. Across both case study
landscapes, greater levels of prescribed burning tend to result in reduced
wildfire impacts on all risks. However, there is considerable variation in the rate
of reduction in risk, including the amount of treatment required to achieve key
targets. Further, the particular combination of weather factors underpinning
given fire weather conditions (e.g. temperature vs wind driven) can
substantially impact the overall level of risk, as well as the response to
prescribed burning.
BACKGROUND Prescribed burning in Australia, currently stands at a cross roads. The 2009
Victorian Bushfires Royal Commission recommended an annual treatment
target of 5% of public land in Victoria. Subsequently, concerns have been
formally raised (e.g. Bushfires Royal Commission Implementation Monitor 2013
Annual Report) that such an area-based target may not deliver the most
effective levels of risk reduction for people and property in Victoria.
Concurrently, some other States have adopted such a prescribed burning
target, but formal attempts to evaluate its effects on risk to people, property

AFAC18: PROCEEDINGS FROM THE BUSHFIRE AND NATURAL HAZARDS CRC & AFAC CONFERENCE 2018 | REPORT NO. 367.2018
129
and environmental values across different jurisdictions are lacking. Such
extrapolation of the 2009 BFRC recommendation pre-supposes that there is a
“one-size fits all” solution to the problem. While many agencies are moving
toward planning systems supposedly based on risk assessment, knowledge of
the best way to use prescribed fire to reduce risk to key values is generally
lacking.
General principles need to be developed about how to apply a risk-based
approach across widely varying environments, human communities and
combinations of key management values. In essence, the use of prescribed fire
for risk mitigation involves understanding how risk to any particular
management value will respond to variations in the spatial location and rates
of treatment. Managers and policy-makers need to know how these
fundamental elements of prescribed burning can be tailor-made to suit the
environmental and human context of their local jurisdictions. A variety of
fundamental problems need to be overcome in order to deliver effective,
tailor-made prescribed burning solutions across different Australian
environments.
The Bushfire and Natural Hazards CRC project “From hectares to tailor-made
solutions: systems to deliver effective prescribed burning across Australian
ecosystems” is designed to address these challenges.
FIRE SPREAD SIMULATIONS A large number of fire spread simulations were carried out using the PHOENIX
RapidFire model. Case study landscapes were selected to sample variation in
human and natural systems across southern Australia. Fires were modelled
under a range of weather conditions, at 1,000 high probability ignition points
per landscape. A range of fuel treatments were investigated: edge vs
landscape treatment, and overall treatment levels of 0, 1, 2, 3, 5 10 and 15%
p.a. Close to 1,000,000 simulations were carried out in each case study
landscape. A full description of the simulations can be found in the 2016-2017
Annual Report.
RISK ESTIMATION The fire spread simulations were used as input for risk estimation. Wildfire
impacts on range of direct and indirect values were calculated, either directly
from model output or by using asset loss functions, which relate model outputs
to management values. These include area burnt, house loss, life loss, powerline
loss, road loss and area burnt within minimum tolerable fire interval (TFI). A full
description of the values and associated loss functions can be found in the
2016-2017 Annual Report.

AFAC18: PROCEEDINGS FROM THE BUSHFIRE AND NATURAL HAZARDS CRC & AFAC CONFERENCE 2018 | REPORT NO. 367.2018
130
In order to translate impact estimates into risk estimates, a Bayesian Decision
Network model was used which incorporated the relative frequency of
weather conditions at each case study landscape, as well as other influences
in the network between model outputs and management values (Marcot et al.
2006). This allowed an estimate of the risk reduction afforded by prescribed
burning, as well as the relative risk mitigation across different management
values, allowing a comparison to be made between them.
RESULTS The risk estimation was based on the large scale fire behaviour simulations we
undertook in case study regions across Southern Australia. Here we present
results for two key regions: the ACT (Figure 1) and Tasmania (Figure 2). We
found that regardless of weather conditions, prescribed burning tended to
decrease impacts on key values such as area burnt, house and life loss, but
that the amount of area burnt within minimum TFI increased. Conversely,
stronger fire weather conditions were more important in altering impacts on
these values than strong increases in treatment rate (e.g. area burnt in
Tasmania, Figure 3). Risk did not respond uniformly to treatment, with a greater
relative impact in the ACT for some values (area burnt, powerline loss and road
loss) and a greater relative impact in Tasmania for others (house loss, life loss).
Prescribed burning seemed to have similar effects on the relative increase in
area burnt within TFI in each region. In general prescribed burning was not able
to achieve a halving of risk for the values studied here in these two regions. This
analysis gives us confidence that we are on track to deliver a systematic
assessment of the potential to use prescribed burning to achieve wildfire risk
mitigation across the varied landscapes of southern Australia.

AFAC18: PROCEEDINGS FROM THE BUSHFIRE AND NATURAL HAZARDS CRC & AFAC CONFERENCE 2018 | REPORT NO. 367.2018
131
FIGURE 1 EFFECT OF DIFFERENT RATES OF PRESCRIBED BURNING ON SIMULATED WILDFIRE RISK ACROSS KEY MANAGEMENT VALUES IN THE ACT CASE
STUDY LANDSCAPE

AFAC18: PROCEEDINGS FROM THE BUSHFIRE AND NATURAL HAZARDS CRC & AFAC CONFERENCE 2018 | REPORT NO. 367.2018
132
FIGURE 2 EFFECT OF DIFFERENT RATES OF PRESCRIBED BURNING ON SIMULATED WILDFIRE RISK ACROSS KEY MANAGEMENT VALUES IN TASMANIA CASE
STUDY LANDSCAPE.
FIGURE 3 EFFECT OF DIFFERENT RATES OF PRESCRIBED BURNING AND DIFFERENT FFDI CATEGORIES ON SIMULATED WILDFIRE IMPACTS ON BURNT AREA

AFAC18: PROCEEDINGS FROM THE BUSHFIRE AND NATURAL HAZARDS CRC & AFAC CONFERENCE 2018 | REPORT NO. 367.2018
133
IN TASMANIA CASE STUDY LANDSCAPE.
REFERENCES 1 BRCIM, 2013. Implementation Monitor: Annual Report. Bushfires Royal Commission Implementation Monitor.
2 Clarke H, Price O, Boer M, Cirulis B, Penman T, Bradstock R (2017) From hectares to tailor-made solutions for
risk mitigation: systems to deliver effective prescribed burning across Australian ecosystems. Bushfire and
Natural Hazards CRC, Melbourne

AFAC18: PROCEEDINGS FROM THE BUSHFIRE AND NATURAL HAZARDS CRC & AFAC CONFERENCE 2018 | REPORT NO. 367.2018
134
A LIDAR-DERIVED FUEL MAP
FOR THE ACT Non-peer reviewed research proceedings from the Bushfire and Natural
Hazards CRC & AFAC conference
Perth, 5 – 8 September 2018
Adam Leavesley1,2, Albert Van Dijk2,3 and Marta Yebra2,3
1. Parks and Conservation Service of the Australian Capital Territory
2. Bushfire and Natural Hazards CRC
3. Fenner School of Environment and Society, Australian National
University
Corresponding author: [email protected]

AFAC18: PROCEEDINGS FROM THE BUSHFIRE AND NATURAL HAZARDS CRC & AFAC CONFERENCE 2018 | REPORT NO. 367.2018
135
ABSTRACT
A LIDAR-DERIVED FUEL MAP FOR THE WHOLE ACT Many Australian fire managers rely on fuel maps derived from vegetation classifications and time-
since-fire via an accumulation curve (e.g. Phoenix Rapidfire). However fuel maps derived using
this method lack potentially critical information about pockets of high and low fuel loads. This is
important because a poor understanding of fuels was found to be a critical factor in
investigations of both the Margaret River and Lancefield prescribed burn escapes.
A potential solution for this problem is the use of LiDAR to create spatially-explicit fuel information.
A LiDAR dataset covering the whole of the ACT was flown over a number of months in 2015-16
using the LAS 1.4 format. The density of returns was 8ppm over the urban area and 4ppm over
the remainder of the territory including a large alpine national park that covers 45 percent of the
ACT. Bushfire & Natural Hazards Cooperative Research Centre (BNHCRC) research partners
arranged for the dataset to be included in feasibility analyses conducted by the Terrestrial
Ecology Research Network (TERN) AusCover Landscape Observatory project. A number of fuel-
related layers were created based on the Overall Fuel Hazard Assessment (OFHA) and inputs to
Project Vesta.
The fuel layers were created at resolutions of 1m, 2m, 5m and 25m in the NetCDF file format. The
25m data were selected for initial assessment because these were the only whole-of-territory
datasets easily manipulated in ArcGIS 10. Qualitative assessments indicate: 1) a discernible
pattern of fuel variation related to topography; 2) good agreement between LiDAR-derived
elevated and near-surface fuel layers and OFHA data collected during the LiDAR acquisition;
and 3) good agreement between the LiDAR and fire severity assessments made on burns that
were conducted a short time before the acquisition. The next step is to conduct quantitative
assessments.

AFAC18: PROCEEDINGS FROM THE BUSHFIRE AND NATURAL HAZARDS CRC & AFAC CONFERENCE 2018 | REPORT NO. 367.2018
136
GLOSSARY
ANU Australian National University
ANZLIC Australia and New Zealand Land Information Council
DEM Digital Elevation Model; a representation of the earth’s surface.
FIREMON A fire severity method based on the Normalised Burn Ratio (NBR)
developed by the United States Forest Service.
ICSM Intergovernmental Committee on Surveying and Mapping; ICSM
levels are defined as: 0) = undefined, unclassified; 1) = Automated
or semi-automated classification; 2) = ground surface
improvement; 3) = ground correction; 4) = detailed classification
and correction.
LAS Laser file format; a public file format for exchange of 3-
dimensional point cloud data. Version 1.4 was released in
November 2011.
LiDAR Light Detection and Ranging; an active remote sensing method
which uses light from a pulsed laser to measure distance to the
earth.
NBR Normalised Burn Ratio: a method for estimating fire severity using a
combination of near-infrared (NIR) and shortwave infrared (SWIR)
wavelengths.
NEDF National Elevation Data Framework; an Australian cross-sectoral
initiative to advance the availability of digital elevation data
NetCDF Network Common Data Form; a set of software libraries and self-
describing, machine-independent data formats that support the
creation, access, and sharing of array-oriented scientific data
TERN Terrestrial Ecology Research Network; Australia’s land ecosystem
observatory tasked with producing standardized, integrated,
model-ready data for detecting and interpreting land ecosystem
change
ppm pulses per metre2

AFAC18: PROCEEDINGS FROM THE BUSHFIRE AND NATURAL HAZARDS CRC & AFAC CONFERENCE 2018 | REPORT NO. 367.2018
137
INTRODUCTION
The Australian bushfire sector predominantly characterises forest fuel for
operational purposes in terms of vegetation type and time-since-fire (eg
Phoenix RapidFire). This reflects what is usually known about Australian forests
and woodlands - the dominant tree species, what is known about how fuel
load and structure varies with time-since-fire and the historical necessity for
data to be collected by humans at a human scale and extrapolated to larger
scales. Fuel information derived in this way does not provide spatially explicit
information about pockets of high or low fuel. Instead the variation is
encompassed in a statistical format (eg standard deviation) which is not
spatially explicit and hence less useful for operations.
The advent of remote sensing removes the need to collect data at a human
scale and can deliver spatially-explicit information. However early investigation
of the utilisation potential of remote sensing for assessing forest fuels in Australia
identified shortcomings compared to the information that was collected at a
human scale and the models that used that information. For example, the
FIREMON Normalised Burn Ratio (NBR) procedure for estimating fire effects (Key
and Benson, 2006) varies depending on the amount of unburnt overstorey
vegetation, so that the same numeric value can represent a range of fire
effects depending on the ratio of burnt to unburnt vegetation (De Santis and
Chivieco, 2009). Similarly, LiDAR cannot easily assess the surface litter or bark
components of the fuel array nor separately identify the dead component of
the near-surface, elevated and canopy fuels. Bushfire managers appear to
have focused on the shortcomings of the technology and as a result there has
been relatively little uptake of remote-sensing for gathering fuel information, but
see Lhuede et al. (2017).
Improved knowledge of fuels is important for at least two reasons. Poor spatial
information of fuels was found to be a critical factor in investigations of both the
Margaret River (Keelty, 2012) and Lancefield (Carter et al. 2015) prescribed
burn escapes. Improved knowledge of fuels also has the potential to reduce
the amount of unpredictable fire behavior especially during elevated fire
danger, to which variation in spatial arrangement of fuel may have
contributed.
In this paper we present some experimental forest fuel mapping of the
Australian Capital Territory derived from LiDAR. We summarise the specifications
of the data acquisition and processing methods and provide a qualitative
accuracy assessment. We also describe the findings of an operational trial.

AFAC18: PROCEEDINGS FROM THE BUSHFIRE AND NATURAL HAZARDS CRC & AFAC CONFERENCE 2018 | REPORT NO. 367.2018
138
METHODS
DATA CAPTURE AND PREPROCESSING A project to capture LiDAR over the whole of the ACT, Queanbeyan and
Googong Dam, a project area of 3272km2 was implemented under contract by
the ACT Government during 2015 and 2016 (RPS – MAPPING, 2016; Figure 1).
Most of the data were acquired between 18 May and 29 July 2015. But
completion of the full dataset was delayed to 2016 due to airspace restriction
over the Canberra Deep Space Communication Complex.
The data were captured using a Trimble AX60 system which coupled a Riegl
LMS-Q780 scanning instrument with a Trimble AP50 GPS. The nominal density
was four outgoing laser pulses per square metre across the greater ACT region
and eight pulses per square meter over Canberra’s urban area (Figure 2). The
average pulse density across the project area was 7.9ppm and estimated
vertical accuracy was 0.20m.
Processing by the contractor included production of classified LAS 2km x 2km
tiles to ICSM (see Glossary) specifications. Metadata were produced to comply
with Australian standards (ANZLIC and NEDF specifications; see Glossary). The
point cloud was used to create a ground classification to ICSM level 3.
Automated algorithms were then used to classify the remaining points to: 1) low
vegetation; 2) medium vegetation; 3) high vegetation; 4) buildings; and 5)
water. Further processing improved the buildings classification to ICSM level 3.
The other products remained ICSM level 1.

AFAC18: PROCEEDINGS FROM THE BUSHFIRE AND NATURAL HAZARDS CRC & AFAC CONFERENCE 2018 | REPORT NO. 367.2018
139
Figure 1. Flight trajectories for LiDAR acquisition.

AFAC18: PROCEEDINGS FROM THE BUSHFIRE AND NATURAL HAZARDS CRC & AFAC CONFERENCE 2018 | REPORT NO. 367.2018
140
Figure 2. Density assessment of first return pulses.
PROCESSING FOR VEGETATION STRUCTURE The TERN AusCover facility engaged the Australian National University (ANU) to
conduct a feasibility analysis and production of some LiDAR-derived products
from preprocessed airborne LiDAR (Van Dijk, 2017). The contract was executed
in collaboration with the University of Queensland, Royal Melbourne Institute of
Technology and CSIRO. The aim of the project was to: 1) develop products that
could be used relatively easily by ecosystem managers, researchers and other
stakeholders; and 2) develop a prototype data specification and processing
methodology for consultation and review. ACT Parks bushfire managers
requested evaluation of inputs to the Overall Fuel Hazard Assessment (Hines,
2010) and to this were added inputs to Project Vesta (Gould et al. 2007).
The ANU project produced 14 experimental LiDAR products. Three products, the
digital elevation model, fraction building footprint and fraction water surface
were essentially unchanged from the work conducted by the ACT Government
contractor. To this were added six products analogous to inputs to the Overall
Fuel Hazard Assessment version 4 (Table 1) and Project Vesta. A further five
products were developed that characterise vegetation structure in other ways.
All products were delivered at four resolutions: 1m (in the 8ppm capture area),
2m (in the 4ppm capture area), 5m and 25m in the NetCDF format. The 1m and

AFAC18: PROCEEDINGS FROM THE BUSHFIRE AND NATURAL HAZARDS CRC & AFAC CONFERENCE 2018 | REPORT NO. 367.2018
141
2m data were stored as tiles, while the 5m and 25m data were stored as single
territory-wide files.
A key bushfire behavior input that was not feasible from LiDAR was an analog
of the surface litter fuel hazard. In principle, this could be obtained from the
intensity and spread of ground and near-surface LiDAR returns. In practice, the
vertical error (0.20m) was too great to reliably perform this analysis. It was also
noted that information about vegetation on the ground was more easily
obtained from optical imagery. Other products relevant to bushfire
management that could not be easily derived from LiDAR were: 1) standing
volume or biomass which could be useful for determining fuel load; 2) species
mapping which could assist with prediction of bark hazard; 3) coarse woody
debris which could not be reliably distinguished from the near-surface fuels.
These products are likely to be possible in principle but require considerably
more research and are unlikely to work satisfactorily in all conditions.
Table 1. Products derived from LiDAR for a variety of fire management, land
management and ecological research purposes.
Product description Use Notes
Canopy top height Overall fuel hazard assessment Height of vegetation >2m.
Canopy base height Overall fuel hazard assessment The 10% quantile of returns from height
>2m.
Leaf cover fraction – elevated fuel Overall fuel hazard
assessment/Vesta
An estimate of the cover fraction from
height 0.5m – 2m
Leaf cover fraction – near surface fuel Overall fuel hazard
assessment/Vesta
An estimate of the cover fraction from
height 0.05m – 0.5m
Leaf cover fraction – overstorey Vesta An estimate of the cover fraction of the
top canopy
Leaf cover fraction – understorey Vesta An estimate of the cover fraction of the
intermediate canopy
Canopy layer index Experimental surrogate for leaf
area index
Leaf cover fraction – canopy fuel Vegetation structure, habitat
assessment, carbon accounting
An estimate of the cover fraction >2m in
height
Leaf cover fraction – herbaceous layer Vegetation structure, habitat
assessment, carbon accounting
An estimate of the cover fraction from
height 0.05m – 1m
Vegetation cover fraction Vegetation structure, habitat
assessment, carbon accounting
An estimate of the cover fraction derived
from first returns not originating from the
ground
Vegetation height Vegetation structure, habitat
assessment, carbon accounting
Height of vegetation

AFAC18: PROCEEDINGS FROM THE BUSHFIRE AND NATURAL HAZARDS CRC & AFAC CONFERENCE 2018 | REPORT NO. 367.2018
142
RESULTS
The experimental LiDAR-derived bushfire products were reviewed by ACT Parks
and trialed during the 2018 autumn burn program.
DATA MANAGEMENT Territory-wide NetCDF files at 5m resolution had file sizes in the order of 300MB
(extent ~3,300km2). The equivalent information at 25m resolution was in the
order of 15MB. The 25m resolution was easier to use in ArcGIS 10 and was
therefore selected for further review and trial.
QUALITATIVE ACCURACY ASSESSMENT The LiDAR capture commenced within a month of the Cotter River burn which
was ignited on 30 March 2015 and escaped containment on 1 April generating
a broad range of fire severity effects from unburnt, to full canopy consumption.
A detailed fire severity analysis was conducted following the FIREMON
Normalised Burn Ratio (NBR; Key and Benson, 2006) procedure using data from
Landsat 8 (Leavesley et al. 2015). Ground-truthing of the NBR returned an
overall accuracy of 81 percent and showed strong effects of fire on vegetation
structure (Figure 3). For a more detailed account of the fire severity assessment
of the Cotter River burn see Leavesley et al. (2015). Careful comparison of the
fire severity map and the LiDAR-derived elevated fuel cover map, showed
good agreement (Figure 4).
PRESCRIBED BURN PLANNING AND EXECUTION An important use for spatially explicit fuel maps is prescribed burn planning and
execution. Delivery of the experimental LiDAR-derived fuel maps was too late
for burn planning for the autumn 2018 season, however it was available to the
Incident Management Team to assist with operations. The fuel maps showed
considerable variation in near-surface and elevated fuels that was not
explained by vegetation type or time-since-fire (Figure 5). This supported the
conclusions of previous work in the ACT which compared Overall Fuel Hazard
Assessments with modelled estimates (Leavesley et al. 2016). The burn could not
be contained along the planned soft containment line on the western edge
but was kept within the contingency containment lines (Figure 6). The final
extent coincided with the extent of dense elevated fuels (Figures 6-7).

AFAC18: PROCEEDINGS FROM THE BUSHFIRE AND NATURAL HAZARDS CRC & AFAC CONFERENCE 2018 | REPORT NO. 367.2018
143
A)
B)

AFAC18: PROCEEDINGS FROM THE BUSHFIRE AND NATURAL HAZARDS CRC & AFAC CONFERENCE 2018 | REPORT NO. 367.2018
144
Figure 3. Photographs representing the fire severity classes identified in the NBR; A) = unburnt, B) =
low severity and C) = high severity.
a)
C
)
a)

AFAC18: PROCEEDINGS FROM THE BUSHFIRE AND NATURAL HAZARDS CRC & AFAC CONFERENCE 2018 | REPORT NO. 367.2018
145
Figure 4. Comparison of the fire severity analysis (a) and LiDAR-derived elevated fuel map (b)
showed good agreement.
b)
a)

AFAC18: PROCEEDINGS FROM THE BUSHFIRE AND NATURAL HAZARDS CRC & AFAC CONFERENCE 2018 | REPORT NO. 367.2018
146
Figure 5. Experimental LiDAR-derived fuel maps for the Piccadilly burn: a = elevated fuel; b =
near-surface fuel. The distribution of fuel varied considerably across the fire ground, particularly
the elevated fuel. Note the dense patch of elevated fuels adjacent to the soft containment line
on the western end; indicated by arrow.
Figure 6. Fire severity analysis of the Piccadilly burn inserted into a template of the Piccadilly burn
maps to aid comparison with figure 5. The burn could not be contained along the planned soft
containment line at the south-western end. The final extent coincided with the extent of dense
elevated fuels, indicated by arrow.
b)

AFAC18: PROCEEDINGS FROM THE BUSHFIRE AND NATURAL HAZARDS CRC & AFAC CONFERENCE 2018 | REPORT NO. 367.2018
147
Figure 7. Looking south along the western edge of the Piccadilly burn at a large patch of high fire
severity burning coincidental with dense elevated fuels (see figure 5). The burn was contained on
the obvious fire trail and a dormant trail on the spur top.
DISCUSSION
The use of LiDAR collected at 8ppm and 4ppm for fuel mapping was found to
be feasible for all the strata of forest and woodland except for the surface litter
(Van Dijk, 2017). In principle it is possible to derive some of this information from
LiDAR but it requires a greater vertical accuracy than achieved during LiDAR
data acquisition. Excluding the surface litter layer, the height classes for which
vegetation cover can be estimated are easily varied.
A qualitative accuracy assessment of the LiDAR-derived fuel maps of elevated
and near-surface fuels delivered promising results. The LiDAR appeared to
agree well with a coinciding fire severity assessment that achieved an overall
accuracy of 81 percent (Leavesley et al. 2015). The next step in this project is to
conduct a quantitative accuracy assessment. Datasets that can be applied
are: 1) the ground-truth data from the Cotter River burn; and 2) the annual fuel
monitoring OFHA data (Hines et al. 2010.
An operational trial of the LiDAR-derived fuel maps for command of prescribed
burning operations met with excellent feedback from Divisional Commanders
and Incident Management Team staff. Fuel maps assisted understanding of
unexpected fire behavior at the Piccadilly burn and allowed field commanders
to focus resources at points where the maps showed fuel density was greater.
Burn planning staff were unable to use the maps for their role in operations, but

AFAC18: PROCEEDINGS FROM THE BUSHFIRE AND NATURAL HAZARDS CRC & AFAC CONFERENCE 2018 | REPORT NO. 367.2018
148
the feedback was that it could potentially lead to operational changes at the
planning level.
The fuel maps used during the 2018 autumn burning season were derived from
LiDAR which was acquired in 2015. Nonetheless, the pattern of elevated fuel
across the landscape appeared to reflect reality. This raises the possibility that a
LiDAR forest fuel map can be confidently used for prescribed burn planning
without major adjustment for years after acquisition. This is important because if
correct, it would reduce the rate of depreciation of the investment
considerably.
An intermediate step in the transition to spatially-explicit fuel maps is the
production of hybrid, fuel curve-derived maps combined with LiDAR-derived
maps to deliver the best possible representation of fuel at any given point in the
landscape. For example, if Phoenix Rapidfire could accept raster data, then it
could potentially be run with surface litter and bark fuel maps derived from a
fuel curve and with near-surface and elevated fuel derived from LiDAR.
The present focus with remote-sensing data is to produce analogues of inputs
for existing fire models that were developed for inputs that were readily
available from human-scale visual field assessment. In our opinions this is only an
intermediate step necessitated by existing systems and understanding. We are
essentially retrofitting a method designed for visual field assessment to work with
a more modern data acquisition method that has different strengths (eg
spatially explicit) and weaknesses (eg cannot estimate surface litter or bark
fuels). As remote-sensing expertise improves and if confidence in the
technology within the bushfire sector is achieved, a more logical approach is to
develop robust fire behavior models using parameters easily derived from
remote sensing. The irony here is that the task of retrofitting LiDAR data to
MacArthur or Project Vesta, is an endeavor potentially more difficult and
ultimately of less use than developing a new remote-sensing enabled
technique. We pose the question: “What is holding back development of
remote-sensing enabled bushfire behaviour techniques?”

AFAC18: PROCEEDINGS FROM THE BUSHFIRE AND NATURAL HAZARDS CRC & AFAC CONFERENCE 2018 | REPORT NO. 367.2018
149
CONCLUSION
1) LiDAR data are generally suitable for bushfire fuel mapping except for:
a) the surface litter which to achieve requires a level of vertical
accuracy which is challenging; and b) bark.
2) Ground vegetation is more easily characterised using optical imagery
than LiDAR.
3) The height classes for which vegetation cover is estimated can be easily
varied.
4) Low frequency collection of LiDAR data is useful for bushfire
management for pin-pointing areas of high and low fuel loads. This is
likely to be especially useful to prescribed burn planners.
5) If LiDAR becomes cost effective at higher frequency, it has good
potential for chararacterising changes in fuel load, carbon stocks and
post-burn changes to water quality and quantity.
6) A number of other uses for LiDAR were investigated such as delineation
of tree crowns, estimation of standing volume or biomass, species
identification and detection of coarse fuels (woody debris) but these
uses require development of specific models or more detailed
understanding of the study site.
7) The development of remote-sensing methods to collect parameters
developed for human-scale data collection methods may ultimately be
a dead-end in the transition to remote-sensing enabled techniques.
Such systems could be designed to use parameters easily derived from
remote sensing to drive robust fire behavior models.

AFAC18: PROCEEDINGS FROM THE BUSHFIRE AND NATURAL HAZARDS CRC & AFAC CONFERENCE 2018 | REPORT NO. 367.2018
150
ACKNOWLEDGEMENTS
Andreia Siqueira, John Lee, Bethany Dunne, Norman Mueller, Ryan Lawrey,
Mick Ivill, Mark Beech and Matt O’Brien provided valuable input to the ACT
Parks fire severity program. ACT Parks fire crews skillfully implemented the Cotter
River burn and collected the ground-truthing data. Kristy Van Putten supervised
the acquisition of LiDAR for the ACT Government and RPS Mapping conducted
the collection. The Terrestrial Ecology Research Network funded processing of
the data which was undertaken by CSIRO Centre for Earth Observation. Jen
Smits provided advice on the use of LiDAR products in ArcGIS.

AFAC18: PROCEEDINGS FROM THE BUSHFIRE AND NATURAL HAZARDS CRC & AFAC CONFERENCE 2018 | REPORT NO. 367.2018
151
REFERENCES
Carter, M., Howard, T., Haylock, K., Philpotts, V. and Richards, J. 2015b, Lancefield-
Cobaw Fire Investigation: Issues not within the terms of reference, Department of
Environment, Land, Water and Planning, Melbourne.
De Santis and Chuvieco (2009) GeoCBI: A modified version of the Composite Burn
Index. Remote Sensing of Environment 113: 554-562.
Gould, J. S., W. McCaw, N. Cheney, P. Ellis & S. Matthews. 2007. Field guide: fuel
assessment and fire behaviour 743 prediction in dry eucalypt forest. Commonwealth
Scientific and Industrial Research Organization (CSIRO).
Hines F, Tolhurst KG, Wilson, AAG, McCarthy, GJ. 2010 Overall fuel hazard assessment
guide, 4th edition. Fire and adaptive management, report no. 82. Department of
Sustainability and Environment, Melbourne.
Keelty, M.J. 2012, Appreciating the Risk: Report of the Special Inquiry into the November
2011 Margaret River Bushfire, Government of Western Australia, Perth.
Key and Benson (2006) FIREMON: Fire effects monitoring and inventory system. General
Technical Report RMRS-GTR-164-CD. Fort Collins, CO: USDA Forest Service, Rocky
Mountain Research Station.
Leavesley AJ, Siqueira, A, Lee, JW, Dunne, B, Mueller, N. 2015 Assessing planned burn
severity in forest and woodland using Landsat 8 Operational Land Imager (OLI).
Proceedings of the AFAC/BNHCRC conference, Adelaide, 1-3 September.
Leavesley AJ, Kenny B, Dunne, B, Cooper, N. 2016. A comparison of observed and
modelled estimates of bushfire fuel hazard in the ACT. Proceedings of the
AFAC/BNHCRC conference, Brisbane, 30 August - 1 September.
Lhuede, N. Sandin, E. Willis, N. (2017) Applying location based analytics and LiDAR to
model Bushfire Attack levels. Proceedings of the BNHCRC/AFAC Conference, Sydney,
4-7 September.
RPS – Mapping 2016 Final report: Acquisition of LiDAR and Imagery for the Australian
Capital Territory. Brisbane, Queensland.
Van Dijk A. 2017 Feasibility analysis: Deriving products for TERN AusCover sites from
preprocessed airborne and ground data, TERN AusCover. Consultation Report – Not for
Publication.

AFAC18: PROCEEDINGS FROM THE BUSHFIRE AND NATURAL HAZARDS CRC & AFAC CONFERENCE 2018 | REPORT NO. 367.2018
152
PERFORMANCE OF FIRE DETECTION ALGORITHMS USING HIMAWARI-8
non-peer reviewed research proceedings from the Bushfire and Natural
Hazards CRC & AFAC conference
Perth, 5 – 8 September 2018
Chermelle Engel1,2, Simon Jones1,2, Karin Reinke1,2 1RMIT 2Bushfire and Natural Hazards CRC
Corresponding author: [email protected]

AFAC18: PROCEEDINGS FROM THE BUSHFIRE AND NATURAL HAZARDS CRC & AFAC CONFERENCE 2018 | REPORT NO. 367.2018
153
ABSTRACT
A fire-hotspot detection algorithm tuned for Australian bio-geographical
regions
Chermelle Engel, Remote Sensing, RMIT, VIC
Accuracy is an important aspect of fire hotspot detection. Errors in the H8-AHI
WF-ABBA fire hotspot detection can lead to a loss of trust in a fire hotspot
detection product. Compared to MODIS and VIIRS polar-orbiting satellites
hotspot detections, the WF-ABBA hotspot detection product over Australia 0400
UTC had minimum commission error rates of 31% (Winter), 35% (Summer), 48%
(Spring) and 54% Autumn over 1 Dec 2015 – 30 Nov 2016. The WF-ABBA
algorithm was originally developed for America and was not tuned specifically
for the Australian continent. Here we create a new Himawari fire-hotspot
algorithm tuned dynamically for 419 Australian bioregions. The new algorithm
0400 UTC had minimum commission error rates, in comparison to MODIS/VIIR
hotspot detections, of 6% (Summer), 8% (Spring), 20% (Winter) and 41%
(Autumn) over 1 Dec 2015 – 30 Nov 2016. These commission rates are a
considerable improvement over the currently available (WF-ABBA) fire hotspot
product.

AFAC18: PROCEEDINGS FROM THE BUSHFIRE AND NATURAL HAZARDS CRC & AFAC CONFERENCE 2018 | REPORT NO. 367.2018
154
INTRODUCTION
Fires when viewed from space produce positive anomalies in middle Infrared
(MIR) satellite channel data. But, in order to correctly and accurately identify if
a MIR value is a positive “anomaly”, researchers try to capture the “normal”, or
“background” MIR value. Capturing a “normal” clear-sky MIR distribution is
non-trivial because MIR values are sensitive to both thermal radiation and solar
radiation reflected from clouds. Therefore, to capture a “normal” clear-sky MIR
distribution it is important to remove data containing clouds.
Detecting clouds in geostationary satellite data is a complicated process.
Clouds vary in form from Cumulonimbus through to Cirrus. And clouds change
in properties such as height, optical thickness and amounts of water, graupel,
ice, etc. As such, accurate cloud-detection using geostationary satellite
information is an active area of research. Attempts to estimate clouds using
simple techniques for active fire applications1 use experimentally determined
thresholds that delineate clear-sky from cloudy sky2. While simple thresholds
hold in temperate areas such as the Brazilian Amazon where they were
originally developed, the thresholds do not hold over all of Australia.
Imprecise assumptions regarding thresholds that delineate clear- from cloudy-
sky can lead to either clouds getting into the dataset or more than necessary
clear-sky or fire pixels being left out of the dataset. Cloud-contaminated
datasets have the potential to have lower the “background” TIR and higher
“background” MIR expected values. A lowered background TIR value could
lead to more pixels being deemed as fires, and an increased background MIR
could lead to more fire-pixels being treated as clear-sky pixels. Therefore, it is
important to pre-process the dataset for cloud as accurately as possible.
This work asks: what are the “clear-sky” conditions for biogeographic sub-
regions over Australia. And, can simple clear-sky statistics be used to detect
fires in each of the biogeographical sub-regions?

AFAC18: PROCEEDINGS FROM THE BUSHFIRE AND NATURAL HAZARDS CRC & AFAC CONFERENCE 2018 | REPORT NO. 367.2018
155
BACKGROUND
Clear-sky satellite observations are linked to variables such as daytime
radiation, atmospheric conditions and the underlying landscape
characteristics. The amount of incoming radiation and hence heating of the
ground can vary with time of day, season, proximity to the equator or pole and
weather conditions. Landscape conditions can vary greatly across the
Australian-continent. Hence not all areas of Australia can be representative of
each other.
Statistical estimations increase in accuracy when the errors are small or the
sample size is larger. The Himawari sensor has fixed accuracy specifications,
and Himawari started archiving data in 2015. These cannot be changed. So,
to increase the accuracy of the active fire detection we can only increase the
sample area upon which the statistics are based. Normally-distributed
populations have samples that are drawn from one single population.
Variations in the underlying population can lead to a non-normal statistics and
therefore inaccurate statistical estimations. To increase the sample size without
distorting the statistic, we can group regions in terms of pixels that are
representative of each other.
Biogeographic regions are regions of land that are representative of each
other in terms of certain biological, ecological and climatic conditions. Version
7 of the Interim Biogeographic Regionalization for Australia has broken up
Australia in 89 regions and 419 sub-regions3,4. These 419 sub-regions can be
used to group representative areas of Satellite data.
METHOD
In this work, we created IBRA sub-region specific dynamically-varying definitions
of clear-sky albedo, MIR and TIR. We used these “clear-sky” albedo, MIR and
TIR definitions to detect potential fires in Himawari data.
For this exploratory study, we gathered 0400 UTC data from 1 Dec 2015 up to
and including 30 Nov 2016. We defined sub-seasons for: early-summer, late-
summer, early-autumn, late-Autumn, early-winter, late-winter, early spring and
late-spring. For each IBRA sub-region, sub-season (and time-point) we did the
following for albedo, MIR and TIR data:
1. Grouped the regional data for each individual day.
2. Filtered out all values where albedo was greater than 0.4 if albedo, or
greater the 50th percentile clear-sky albedo value (as defined in step 8) +
0.05 if MIR or TIR.
3. Clipped each individual day sample at its 5% and 98% percentile values.
4. Calculated the median values of the clipped day samples.

AFAC18: PROCEEDINGS FROM THE BUSHFIRE AND NATURAL HAZARDS CRC & AFAC CONFERENCE 2018 | REPORT NO. 367.2018
156
5. Calculated the sub-seasonal mean and standard deviation across all
daily median values.
6. Discarded any daily samples where the daily median was lower than the
sub-seasonal median mean – sub-seasonal median standard deviation.
7. Collated all remaining values into a single sub-seasonal sample.
8. Calculated the sub-seasonal 1%, 50% and 99% percentile value from the
“clear-sky” data.
We then reprocessed the unfiltered grouped (from step 1) dataset and
identified suspect fire-detection spots where:
a. MIR > 99% clear-sky MIR,
b. TIR > 50% clear-sky TIR and,
c. albedo < (50% clear-sky albedo + 99% clear-sky albedo)/2.
Lastly, we characterized our confidence in these “suspect” points by analyzing
their MIR- 99th percentile MIR clear-sky value.
We compared these “suspect” points and the WF-ABBA hotspots against
MODIS and VIIRS hotspots available from Sentinel, where the confidence
estimate was greater than 50.

AFAC18: PROCEEDINGS FROM THE BUSHFIRE AND NATURAL HAZARDS CRC & AFAC CONFERENCE 2018 | REPORT NO. 367.2018
157
RESULTS
The albedo, MIR and TIR clear-sky values differed greatly between IBRA sub-
regions, and within individual sub-region sub-seasons. For example, the maps
on figure 1 show the spatial variation in clear-sky 99th percentile MIR values.
Suspected hotspots identified using IBRA method had spatial patterns that
varied with sub-season. The hotspot spatial patterns were similar to MODIS and
VIIRS hotspot detections over each sub-season (not shown).

AFAC18: PROCEEDINGS FROM THE BUSHFIRE AND NATURAL HAZARDS CRC & AFAC CONFERENCE 2018 | REPORT NO. 367.2018
158

AFAC18: PROCEEDINGS FROM THE BUSHFIRE AND NATURAL HAZARDS CRC & AFAC CONFERENCE 2018 | REPORT NO. 367.2018
159
FIGURE 2 SUB-SEASONAL AND IBRA REGION CLEAR-SKY MIR DISTRIBUTION 99TH PERCENTILE VALUES ON BACKGROUND PLOT, WITH SUSPECT
HOTSPOTS WITH MIR VALUES 6K AND 20K ABOVE THE CLEAR-SKY MIR 99TH DISTRIBUTION VALUE. The percentage of IBRA hotspots that occurred within 20km of a MODIS/VIIRS
hotspot (with MODIS/VIIRS confidence greater than 50% and on the same
date) was highest in Summer (up to 94%) and Spring (up to 92%), and lowest in
Winter (up to 80%) and Autumn (up to 59%) (figure 2). These statistics were
encouraging in comparison to the WF-ABBA hotspots that had greatest
matches for Winter (up to 69%) and Summer (up to 65%), and lower Spring (up
to 52% -- with a peak in lower fire radiative power) and Autumn (up to 46%)
(figure 3).
FIGURE 3 PERCENTAGE OF IBRA HOTSPOTS FOUND WITHIN 20KM OF MODIS/VIIRS (CONFIDENCE > 50) HOTSPOTS, FOR EACH SEASON AND MIR –
CLEAR-SKY 99TH PERCENTILE THRESHOLD.

AFAC18: PROCEEDINGS FROM THE BUSHFIRE AND NATURAL HAZARDS CRC & AFAC CONFERENCE 2018 | REPORT NO. 367.2018
160
FIGURE 4 AS IN FIG.2, EXCEPT FOR WF-ABBA HOTSPOTS THRESHOLDED BY FIRE RADIATIVE POWER AS A MEASURE OF CONFIDENCE.
DISCUSSION
The MIR, TIR and albedo clear-sky characteristics varied between IBRA sub-
regions. Individual IBRA sub-regions also varied between different sub-seasons.
Preliminary results from 89 IBRA regions also showed significant variation over
the diurnal cycle (not shown). These results indicate that a single “clear-sky”
threshold across Australia is not appropriate either for an entire diurnal period or
an individual time, (although some sub-regions may be more temperate).
The IBRA comparisons against MODIS and VIIRS were particularly encouraging
during Summer and Spring. But, the results during Winter and Autumn indicate
that our dynamic-threshold IBRA technique may be sensitive to raised MIR
values against cooler background brightness temperature values. Whether or
not these are valid fire-detections needs to be investigated further.
The inter-comparison was complicated by the higher temporal resolution data
of the geostationary satellites and the higher spatial resolution of the polar-
orbiting satellites. To make results ours more robust we need to increase the
number of time-points analyzed. To do this we also need to expand the
algorithm into the night-time period when albedo observations are not
available. We also need to use the larger time-point dataset to investigate
rates of omission errors. That will be included in the next phase of our study.
Lastly, this study uses sub-seasonal grouping of data. The next logical step
would be to compute real-time hotspot statistics using a running window. Real-
time dynamic IBRA based fire hotspot detection may have the potential to be
fast, efficient and accurate and most important tuned specifically for Australia.

AFAC18: PROCEEDINGS FROM THE BUSHFIRE AND NATURAL HAZARDS CRC & AFAC CONFERENCE 2018 | REPORT NO. 367.2018
161
CONCLUSION
Clear-sky MIR, TIR and albedo differ significantly across between IBRA regions,
and for individual IBRA sub-regions between sub-seasons. Australia-wide clear-
sky MIR, TIR and albedo estimates cannot not reflect this level of variability.
Dynamic characterization of clear-sky conditions for MIR, TIR and albedo can
be achieved across IBRA sub-regions. These dynamic clear-sky statistics can be
used to form a simple fire hotspot algorithm that has lower rates of commission
errors than the currently available WF-ABBA algorithm.

AFAC18: PROCEEDINGS FROM THE BUSHFIRE AND NATURAL HAZARDS CRC & AFAC CONFERENCE 2018 | REPORT NO. 367.2018
162
REFERENCES 1 Xu W, Wooster MJ, Roberts G, Freeborn P. New GOES imager algorithms for cloud and active fire detection
and fire radiative power assessment across North, South and Central America. Remote Sensing of
Environment, 2010;114:1876-1895
2 Schroeder W, Csiszar I, Morisette J Quantifying the impact of cloud obscuration on remote sensing of active
fires in the Brazilian Amazon. Remote Sensing of Environment, 2008;112:456-470.
3 Thackway R, Cresswell ID (Eds). An Interim Biogeographic Regionalisation for Australia: a framework for
establishing the national system of reserves, Version 4.0. Australian Nature Conservation Agency, Canberra;
1995.
4 Environment Australia. Revision of the Interim Biogeographic Regionalisation of Australia (IBRA) and the
Development of Version 5.1. - Summary Report. Department of Environment and Heritage, Canberra; 2000.

AFAC18: PROCEEDINGS FROM THE BUSHFIRE AND NATURAL HAZARDS CRC & AFAC CONFERENCE 2018 | REPORT NO. 367.2018
163
EXPERIENCES IN THE IN-FIELD UTILISATION OF FUELS3D Non-peer reviewed research proceedings from the Bushfire and Natural
Hazards CRC & AFAC conference
Perth, 5 – 8 September 2018
Luke Wallace1,2, Karin Reinke1,2, Simon Jones1,2, Samuel Hillman1,2, Adam
Leavesley3, Simeon Telfer4, Rachel Bessel5, Ian Thomas1
1 RMIT University
2 Bushfire and Natural Hazards CRC
3 ACT Parks and Wildlife Service
4 SA Department for Environment and Water
5 CFA Victoria
Corresponding author: [email protected]

AFAC18: PROCEEDINGS FROM THE BUSHFIRE AND NATURAL HAZARDS CRC & AFAC CONFERENCE 2018 | REPORT NO. 367.2018
164
ABSTRACT
EXPERIENCES IN THE IN-FIELD UTILISATION OF FUELS3D Fuels3D provides a rapid method to collect quantified information describing fuel hazard using a smartphone. The method requires users to collect a number of photos along a transect within a fuel hazard environment. The photos are processed using photogrammetric algorithms to provide a three-dimensional representation of the fuel, and subsequently estimates of fuel hazard metrics including fuel height, cover and fate (dead/alive). This paper reports on the initial large scale utilisation trial of the Fuels3D fuel hazard workflow. Project end-users from Victoria, South Australia and ACT were provided with a smartphone app (iOS or Android) that allowed photos to be easily collected following the Fuels3D method. End-users were instructed to collect samples within a variety of fuel types and hazards in order to test the potential and limitations of the app. These photos were transferred utilising the cloudstor research infrastructure to a processing PC, where estimates of fuel hazard metrics were derived and reported back to end-users. Initial results of this trial indicate that Fuels3D is capable of quanitifed estimates of fuel hazard metrics that are more precise than those achieved with visual fuel hazard assessments.

AFAC18: PROCEEDINGS FROM THE BUSHFIRE AND NATURAL HAZARDS CRC & AFAC CONFERENCE 2018 | REPORT NO. 367.2018
165
INTRODUCTION The Overall Fuel Hazard Assessment Guide (OFHAG) provides an excellent resource and
reference for monitoring fuel hazard across south-east Australian landscapes1. In using this guide,
the assessment of vegetation attributes such as cover, height and proportion live/dead, that are
used to calculate hazard rating of a plot is achieved visually. Visual assessments such as these
provide only qualitative information on some metrics and have been demonstrated within the
literature to be subjective, meaning assessments are often not repeatable2,3.
The Fuels3D app (Figure 1) has been developed to provide a low cost, and repeatable method
to collect fuel hazard information. Fuels3D utilizes images captured on a smartphone and
computer vision algorithms to provide a 3D representation of the fuel structure. From the resultant
point cloud, representation of structural metrics such as height and cover can be extracted for
use in conjunction with the OFHAG in assessing the hazard present in a landscape.
The app has undergone rigorous testing to ensure the metrics derived from the 3D representation
of the landscape are repeatable and accurate 2,4. This abstract provides insight into the steps
undertaken towards the first in industry trial of the app. This includes a description of fuels3D
architecture and workflow, as well as, initial outcomes of the on-going trial.
FUELS 3D WORKFLOW
Figure 1 provides a graphical illustration of the three stages of the Fuels3D workflow; the fuels3D
app and data capture by the user, data transfer and point cloud processing and metric
reporting. This section outlines these stages.
FIGURE 1. THE FUELS3D WORKFLOW
THE FUELS3D APP The fuels3D app has been developed in-house at RMIT University for use on both android and iOS
devices. In consultation with various end-users and through an initial in-field trial the app has
been developed to be easy to use. Key improvements since the in-field trial include; the
development of an iOS version of the app, enhanced user experience through the inclusion of
forward and back buttons and a photo guide to allow users to more easily capture images
suitable for use in the fuels3D processing step (Figure 2).
FIGURE 2. THE ENHANCED IMAGE CAPTURE SCREEN DEPICTED WITHIN THE IOS VERSION OF THE FUELS3D APP

AFAC18: PROCEEDINGS FROM THE BUSHFIRE AND NATURAL HAZARDS CRC & AFAC CONFERENCE 2018 | REPORT NO. 367.2018
166
Guides for both image capture and image upload have been also developed. These guides
include pictorial steps that allow the images captured using the new transect data capture
approach. The transect approach, developed to allow a greater area to be rapidly captured,
requires users to establish a transect using the fuels3D color coded markers (Seen in figure 3). The
user then follows a path around these markers capturing images every 30 – 50 cm at three
heights by raising and lowering the camera in a zig-zag motion, allowing depth and structural
information can be collected. The red line seen in Figure 2 provides a guide as to how to
compose each image in relation to the transect.
FIGURE 3. THE FUELS3D APP TRANSECT CAPTURE APPROACH
FUELS3D PROCESSING
Fuels3D processing occurs on a server housed at RMIT University. The images and associated data
are transferred to the server through a semi-automatic. Firstly, the user transfers data from the
smartphone to a PC. The folder of data is then zipped and then uploaded to CloudStor.
CloudStor is a free service enabling researchers to quickly and securely sync, share and store files
using the high-speed AARNet network5. It operates similar Dropbox and other cloud based
services allowing for the process to be moved off research infrastructure in the future. Once the
data is uploaded it will is automatically be downloaded by the server.
For the period of the utilization trial the processing of the data occurs on a semi-automatic basis.
Once the server identifies that new data exists a notification is sent to an operator who then
initiates a python script that controls the creation of a point cloud. The 3D point cloud is created
using Agisoft Photoscan with the colour coded target automatically identified and used to
provide scale and orientation.
Once the point cloud creation process is finished the operator will check the quality of the output
and initiate the fuel metric extraction stage. Metric extraction from the 3D point cloud using
scripts developed specifically for Fuels3D.
FUEL HAZARD METRICS The fuel hazard metrics, including height, cover and status of the fuel in the surface and near
surface, are returned to the user as text-based information. The requirements for how this occur
are being handled on an agency by agency basis.

AFAC18: PROCEEDINGS FROM THE BUSHFIRE AND NATURAL HAZARDS CRC & AFAC CONFERENCE 2018 | REPORT NO. 367.2018
167
UTILISATION TRIALS The development of Fuels3D has moved from concept to end-user trials with the first end-user
field day held in July 2016. Participants included staff from SA DEWNR, ACT Parks and Wildlife, VIC
DELWP, VIC CFA, Melbourne Water and Parks Victoria. The field day aimed to introduce end-
users to the Fuels3D collection protocol and to assess its ease of use and repeatability between
data collectors in comparison to traditional visual assessment techniques. Participants were
asked to undertake a visual assessment as well as use the Fuels3D app. At the completion of the
day, the data collection participants were asked to complete a survey evaluating the Fuels3D
data collection workflow providing an early insight into the potential for uptake by end-users.
The survey indicated that the participants found the Fuels3D protocol easy to follow. This was
further indicated by the collected data of which more than 90% of the image sets were able to
be used in the Fuels3D processing method. From the results of this study several areas of
improvement in the data collection and processing methods were identified and incorporated
into the ongoing development of the Fuels3D solution.
Since the first workshop, improvements in user interface have been implemented and in-field
scaling methods have been assessed for accuracy, reliability and user friendliness resulting in a
sampling technique that couples with the Fuels3D app to provide a complete in-field mapping
approach for surface and near-surface fuels. The Fuels3D app is available for both Android and
iPhone devices and in-field trials are currently underway with end-users from Victorian CFA,
Victorian Department of Environment, Land, Water and Planning, South Australian Department
for Environment and Water, and ACT Parks and Conservation. End users are provided with
access to the Fuels3D app (Android and iPhone supported) and provided with portable vertical
targets necessary for image scaling. Quick Guide documents have been provided to instruct
end-users through the solution, and an open spreadsheet for end-user feedback and issue
reporting is also given. The next step following this trial will be to return the fuel hazard metrics –
as calculated from the data collected – back to the end-user, thus completing the end-to-end
solution.

AFAC18: PROCEEDINGS FROM THE BUSHFIRE AND NATURAL HAZARDS CRC & AFAC CONFERENCE 2018 | REPORT NO. 367.2018
168
REFERENCES 1 Gould JS, McCaw WL, Cheney NP, Ellis PE, Matthews S. Field Guide-Fuel assessment and fire behaviour
prediction in dry eucalypt forest.
2 Spits C, Wallace L, Reinke K. Investigating surface and near-surface bushfire fuel attributes: a comparison
between visual assessments and image-based point clouds. Sensors. 2017 Apr 20;17(4):910.
3 Watson PJ, Penman SH, Bradstock RA. A comparison of bushfire fuel hazard assessors and assessment
methods in dry sclerophyll forest near Sydney, Australia. International Journal of Wildland Fire. 2012 Oct
3;21(6):755-63.
4 Wallace L, Hillman S, Reinke K, Hally B. Non‐destructive estimation of above‐ground surface and near‐
surface biomass using 3D terrestrial remote sensing techniques. Methods in Ecology and Evolution. 2017 Nov
1;8(11):1607-16.
5 Rosolen B, Aben G. AARNet CloudStor--transporting oversize data loads. IneResearch Australasia 2010 2010
Aug 16.

AFAC18: PROCEEDINGS FROM THE BUSHFIRE AND NATURAL HAZARDS CRC & AFAC CONFERENCE 2018 | REPORT NO. 367.2018
169
GET READY NSW- FOSTERING ALL-HAZARDS RESILIENCE IN LOCAL
COMMUNITIES
Non-peer reviewed research proceedings from the Bushfire and Natural Hazards
CRC & AFAC conference
Perth, 5 – 8 September 2018
Sarah Anderson
Office of Emergency Management NSW
Corresponding author: [email protected]

AFAC18: PROCEEDINGS FROM THE BUSHFIRE AND NATURAL HAZARDS CRC & AFAC CONFERENCE 2018 | REPORT NO. 367.2018
170
INTRODUCTION
The NSW Government’s Get Ready NSW program is designed to promote all-
hazards preparedness and build capabilities for disaster resilience in local
communities. The program delivers a suite of tools and resources and fosters
community-led preparedness. The involvement of a broader range of
organisations across multiple sectors is a key mechanism for building
community-wide resilience (Council of Australian Governmnents [COAG] 2011).
All communities face multiple hazards; and the 2017 NSW State Level
Emergency Risk Assessment (SLERA) (NSW Government 2017) identified a
need to develop consistency in all-hazards community preparedness activities
at the local level.
Managed by the NSW Office of Emergency Management (NSW OEM),
Get Ready NSW addresses these priorities. It is a coordinated program that
includes a suite of tailored tools and resources designed for key sectors where
all-hazards information is disseminated -— local government, business and
community service organisations. The program builds organisational capability
to strengthen disaster preparedness in their communities. Importantly, these
sectors are direct channels for reaching the people who often experience the
greatest impacts from disasters. The program also incorporates
communications products, under the Get Ready banner, which provides a
consistent call-to-action to link and amplify messages across preparedness
initiatives.
The program reflects NSW OEM’s priority of improving resilience in local
communities by building the capacity and capability of councils and local
leadership organisations to be active participants in whole-of-community
emergency management planning, preparedness and recovery. It includes a
number of related projects such as the community resilience network initiative
which provides a forum for local business and community organisations to
contribute to emergency planning activities, including developing local recovery
plans.
AFAC18: PROCEEDINGS FROM THE BUSHFIRE AND NATURAL HAZARDS CRC & AFAC CONFERENCE 2018 | REPORT NO. 367.2018
171
METHOD
Get Ready NSW program approach
The program was developed in consultation with the NSW Community
Engagement Stakeholder Group (which includes emergency service
organisations (ESOs), government agencies, local government and community
organisations). The program’s products are developed collaboratively with
government and community partners such as the Local Community Services
Association of NSW (LCSA). They complement hazard-specific community
engagement activities and information from the NSW ESOs and provide an
additional gateway for people to connect with ESOs about individual hazards.
A theory of change has been developed for the Get Ready NSW
program:
Tailored all-hazards preparedness tools and messages delivered locally by
trusted sources via familiar channels are effective in raising individuals’
awareness of disaster risk and increasing their preparedness actions.
This approach is informed by international and national disaster risk reduction
strategies and is supported by preparedness and risk communications
research.
All-hazards approach
Every community is exposed to multiple hazards. The Sendai Framework for
Disaster Risk Reduction (United Nations 2015) promotes all-hazards disaster
risk reduction; and the NSW SLERA (NSW Government 2017) recommends an
all-hazards approach to community engagement. There are a number of
common actions that people can take to prepare for any hazard. They are
foundation-level activities that can be built upon with hazard-specific actions. A
community that is prepared for all hazards will be better prepared for individual
hazards (Perez-Fuentes et a 2016l).
Localisation
Get Ready tools and resources enable local leadership organisations,

AFAC18: PROCEEDINGS FROM THE BUSHFIRE AND NATURAL HAZARDS CRC & AFAC CONFERENCE 2018 | REPORT NO. 367.2018
172
particularly councils, to localise preparedness activities for their community. The
importance of tailored local-level risk reduction initiatives is promoted in the
Sendai Framework (United Nations 2015). The National Strategy for Disaster
Resilience (Council of Australian Governmnents [COAG] 2011) highlights the
importance of individuals having information about local hazards and risks.
Every community is unique with specific hazard profiles as well as particular
geographic, demographic, social and economic contexts, and given these
differences, communities require communications that are tailored to their
composition (Boon 2014; (Hicks et al 2017) and local geographic and hazard
contexts (Fairbrother et al 2014; (McLennan et al 2015; Otto et al 2018).
Using key sectors as channels
The delivery of tailored Get Ready resources and messages via pertinent
channels is central to the program’s implementation. The community services
and business sectors have been identified as channels to reach people who are
often the most heavily impacted by disasters; and councils work cross many
sectors. Improving disaster preparedness in communities requires a variety of
engagement activities and communications (Paton 2013; Webber et al 2017),
(NSW Rural Fire Service 2017). Research literature ascertains that using a
relevant delivery channel is a crucial element in preparedness communications
(Wood 2012; Romo-Murphy and Vos et al 2014; Levac et al 2012).
Trusted local sources
Get Ready NSW engages local actors (such a council staff or business
advisors) to disseminate the tools and messages in their communities. Trust in
the message and its deliverer is identified as a key factor in successful risk and
preparedness communication (Paton 2008; Wachinger et al 2013; Longstaff
and Yang 2008; Sharp 2013 et al; Tyler and Sadiq 2018). Trust determines how
risk messages are perceived and interpreted as well as how they are acted
upon (Eiser et al 2012). Local actors are more likely to be relied upon for
disaster risk communications than external sources (Stewart and Rashid 2011;
Steelman and McCaffrey 2013).
AFAC18: PROCEEDINGS FROM THE BUSHFIRE AND NATURAL HAZARDS CRC & AFAC CONFERENCE 2018 | REPORT NO. 367.2018
173
Implementation through partnerships
Promoting disaster preparedness is a complex practice area. It sits at the
intersection between emergency management, hazard mitigation, risk
communications and community engagement. The impacts of disasters cross
many sectors, and building resilience should be shared throughout those
sectors (COAG 2011). Partnerships with organisations such as the NSW
Department of Industry (NSW DOI) are instrumental to identifying, developing
and disseminating the Get Ready resources. This approach ensures tools are
developed to meet the needs of the sectors and are promoted and distributed
via the relevant channels to local organisations to implement at the local level.
These partnerships ensure the program takes a whole-of-community, joined-up
approach. NSW OEM has identified partner agencies that have shared
objectives regarding community resilience. The partnerships afford
opportunities to promote disaster preparedness and embed resilience
capabilities within government agencies and peak bodies in key sectors,
enabling them to address their organisational objectives.
Get Ready NSW is in the early stages of implementation and the program
team are actively exploring opportunities to partner with other organisations. For
example, the potential to work with NSW DOI to develop materials to support
businesses in disaster recovery. Grant programs provide other avenues for
partnerships where funded projects align with the Get Ready NSW program
aims.
Key program elements
There are three components of the program: tools and resources designed for
specific sectors; an all-hazards communications package, and research pilot
investigating community-lead approaches to local preparedness.
Tailored resources and tools to build capacity in key sectors
Get Ready resources are developed collaboratively with government and
community partners to meet the specific needs of various sectors. For example,
NSW OEM has partnered with NSW DOI to develop the Get Ready Business

AFAC18: PROCEEDINGS FROM THE BUSHFIRE AND NATURAL HAZARDS CRC & AFAC CONFERENCE 2018 | REPORT NO. 367.2018
174
toolkit to raise awareness of disaster risk for business and to embed disaster
preparedness for all hazards into business planning. Developed using
behavioural economics, Get Ready Business encourages business owners to
take action in the best interest of their business. The tool is delivered to small-
medium businesses via NSW DOI’s Business Connect Advisors — local
advisors working with businesses in their local communities. It is also available
for local council’s economic development officers and business chambers to
use in their areas. The toolkit is designed to raise awareness among these
trusted local actors of the importance of businesses preparing for disasters and
to increase their capacity to assist businesses to prepare for disasters and
improve their recovery after an event.
Ideally, by engaging with the tailored Get Ready tools, these key
community members and organisations will become champions of disaster
resilience in their local area.
Some of the tools are relevant to organisations in multiple sectors and can
be combined by an organisation, such as a local council, to build a tailored
preparedness program for their community. Current products include: Get
Ready Business; Get Ready communications package for local councils; and an
online resource for community service organisations.
Local communications package
Another component of the Get Ready NSW program is an all-hazards
communications package that includes:
• five preparedness messages that apply across any emergency (which
were developed in consultation with NSW ESOs and the NSW
Behavioural Insights team, and were approved by Cabinet in 2014); and
• an umbrella brand – a logo with the call-to-action (‘get ready for
disasters’).
The Get Ready messages and logo provide action- or decision-oriented advice
(offering a ‘call to action’) which can positively influence preparedness decisions
(Wood 2012; Árvai 2014; Nicholls 2012).

AFAC18: PROCEEDINGS FROM THE BUSHFIRE AND NATURAL HAZARDS CRC & AFAC CONFERENCE 2018 | REPORT NO. 367.2018
175
The communications package was designed to be adopted by local
councils and other leadership organisations for them to adapt to their area. The
logo can be localised for individual communities, e.g., Get Ready Maitland.
A specific communications package developed for local councils offers a
‘starter kit’ for building preparedness communications which, when combined
with other tools (e.g. Get Ready Business), can create momentum within a
community.
Figure 5: Get Ready NSW logo, including the call-to-action and an example of a localised
version of the Logo
The Get Ready call-to-action provides an umbrella to link and amplify
messages across preparedness initiatives — from locally developed projects to
communications from NSW government agencies. Get Ready has been
adopted as the communication banner for broad public awareness activities by
Infrastructure NSW and NSW SES as part of the Hawkesbury-Nepean Valley
Flood Risk Management Strategy. Consistency of communications across these
activities and channels will further reinforce and strengthen those messages.
Get Ready Community-led preparedness research pilot
To effectively support communities to build their capability and capacity to
develop local preparedness activities, it is important to know more about the
processes involved in building and sustaining communities’ resilience
capabilities and adaptive capacity; how they work together to build
preparedness; and how and why community energy is built or blocked.
The NSW Community Engagement Stakeholder group recognised the
need to investigate community-led approaches to resilience building in NSW via

AFAC18: PROCEEDINGS FROM THE BUSHFIRE AND NATURAL HAZARDS CRC & AFAC CONFERENCE 2018 | REPORT NO. 367.2018
176
a rigorous research approach to build a solid evidence base about the types of
community-led preparedness initiatives that are effective in increasing risk
awareness and preparedness capability of NSW communities.
NSW OEM has partnered with the Foundation for Rural and Regional
Renewal (FRRR) to trial an all-hazards, co-designed, community-led, place-
based approach to disaster preparedness. FRRR is a non-profit organisation
focused on building economic and social strengths in rural communities. FRRR,
through their Disaster Resilient Future Ready program, has shared objectives
with those identified by the stakeholder group. A research team from the
University of Sydney and Newcastle University has been engaged to evaluate
the pilot using an action research methodology.
Three communities have been selected as pilot locations: Ocean Shores
(coastal), Wee Waa (rural) and North Richmond (peri-urban). They face a range
of hazards, have different experiences of disasters and diverse community
profiles. The pilot has three phases:
1. engaging with each community to develop community maps;
2. co-designing with communities plans for preparedness; and
3. supporting communities to develop their actions and initiatives.
Phase one is currently underway and the pilot is scheduled for completion in
June 2019.

AFAC18: PROCEEDINGS FROM THE BUSHFIRE AND NATURAL HAZARDS CRC & AFAC CONFERENCE 2018 | REPORT NO. 367.2018
177
DISCUSSION
NSW OEM provides connections to emergency services and emergency
management agencies, as well as links with other projects. FRRR is
undertaking community engagement activities in the pilot sites using a
community development approach. The research team works alongside FRRR
to evaluate the methods, tools and approaches used in project. The
researchers are embedded in the communities and act as a resource for them,
providing feedback across the duration of the project.
The involvement of local emergency services and local councils is vital to
providing local emergency management context and to building and
strengthening linkages between community groups and emergency
management organisations.
The pilot will provide intelligence to improve the design of community
engagement programs and preparedness initiatives to enable community-led
activities. The findings will inform future developments in the Get Ready NSW
program; and will have relevance for emergency services, local councils and
community organisations. It goes beyond preparedness and will have
application for emergency planning and disaster recovery operations.

AFAC18: PROCEEDINGS FROM THE BUSHFIRE AND NATURAL HAZARDS CRC & AFAC CONFERENCE 2018 | REPORT NO. 367.2018
178
CONCLUSION
Get Ready NSW provides organisations in key sectors with all-hazards
preparedness tools, resources and messages that they can localise and adapt
for their communities. The Get Ready call-to-action provides a banner to link
and amplify messages across preparedness initiatives. Through these
mechanisms, Get Ready NSW should raise awareness of disaster risk and
increase capabilities in local organisations and communities to create
preparedness activities. Ideally, it will foster community-led approaches to
resilience building.
The program’s approach is supported by research evidence and aligns
with key actions identified in the National Strategy for Disaster Resilience
(COAG 2011) — partnering with those who affect change; empowering
individuals and communities to exercise choice and take responsibility; and
supporting capabilities for disaster resilience within communities. The research
pilot will provide rigorous research regarding bottom-up preparedness-building
methods to inform the development of the Get Ready NSW program. The
current resources and partnerships are a foundation for future development of
the program; and new initiatives and partnership opportunities are being
investigated. NSW OEM recognises the importance of involving local
community groups, such as sporting clubs or school associations, in the
program. These groups are integral to the Get Ready research pilot, and
findings from the pilot will inform the strategy for including them in the program.
Get Ready NSW reflects NSW OEM’s priority for building capacity for disaster
resilience in local communities.
AFAC18: PROCEEDINGS FROM THE BUSHFIRE AND NATURAL HAZARDS CRC & AFAC CONFERENCE 2018 | REPORT NO. 367.2018
179
REFERENCES
Árvai, J. (2014). "The end of risk communication as we know it." Journal of Risk
Research 17(10): 1245-1249.
Boon, H. (2014). "Investigation rural community communication for flood and
bushfire preparedness." The Australian Journal of Emergency
Management 29(4).
Council of Australian Governments. (2011). National Strategy for Disaster
Resilience. Canberra, ACT, Australia, Commonwealth of Australia.
Eiser, R., Bostrom, A., Burton, I., Johnston, D. M., McClure, J., Paton, D., van
der Pligt, J., and White, M. P. (2012). "Risk interpretation and action: A
conceptual framework for responses to natural hazards." International
Journal of Disaster Risk Reduction 1: 5-16.
Fairbrother P, Mees B, Tyler M, Phillips R, Akama Y, Chaplin S, Toh K and
Cooper V, 2014. Effective Communication: Communities and Bushfire,
Bushfire CRC, Australia, ISBN: 978-0-9925684-0-5
Hicks, A., Armijos, M. T., Barclay, J., Stone, J., Robertson, R. and Cortés, G. P.
(2017). "Risk communication films: Process, product and potential for
improving preparedness and behaviour change." International Journal of
Disaster Risk Reduction 23: 138-151.
Levac, J., Toal-Sullivan, D. and O'Sullivan, T. L. (2012). "Household Emergency
Preparedness: A Literature Review." Journal of Community Health 37(3):
725-733.
Longstaff, P. H. and Sung-Un, Y. (2008). "Communication Management and
Trust: Their Role in Building Resilience to "Surprises" Such As Natural
Disasters, Pandemic Flu, and Terrorism." Ecology and Society 13(1): 1-
14.
McLennan J., Paton, D. and Wright, L. (2015). "At-risk householders'
responsest o potential and actual bushfire threat: An analysis of findings
from sevenAustralian post-bushfire interview Studies 2009-2014."
International Journal of Disaster Risk Reduction 12: 319–327.

AFAC18: PROCEEDINGS FROM THE BUSHFIRE AND NATURAL HAZARDS CRC & AFAC CONFERENCE 2018 | REPORT NO. 367.2018
180
Nicholls, S. (2012). "The Resilient community and communication practice." The
Australian Journal of Emergency Management 27(1).
NSW Government (2017). 2017 State Level Emergency Risk Assessment.
Sydney, NSW, Australia.
NSW Rural Fire Service (2017). Community Engagement Strategic Directions
2017-2021. Lidcombe, NSW, Australia.
Otto, P, Aisha. M., Liu, B. (2018). "mind the gap: towards and beyond impact
messaging to enhance tropical cyclone risk communication, " Tropical
Cyclone Research and Review 7(2).
Paton, D. (2008). "Risk communication and natural hazard mitigation: how trust
influences its effectiveness." International Journal of Global
Environmental Issues 8(½): pp.2-16.
Paton, D. (2013). "Disaster Resilient Communities: Developing and testing an
all-hazards theory." Journal of Integrated Disaster Risk Management
3(1).
Perez-Fuentes, G., Verrucci, E. and Joffe, H. (2016). A review of current
earthquake and fire preparedness campaigns: What works? Springer
Proceedings in Mathematics and Statistics.
Romo-Murphy. E. and Vos, M. (2014). "The role of broadcast media in disaster
preparedness education: Lessons learned in the scientific literature
2002–2012." Media Asia41(1): 71-85,.
Sharp, A., Thwaites. R., Curtis, and A. Millar, J. (2013). "Factors affecting
community-agency trust before, during and after a wildfire: An Australian
case study." Journal of Environmental Management 10e19: 10-19.
Steelman, T. A. and McCaffrey, S. (2013). "Best practices in risk and crisis
communication: Implications for natural hazards management." Natural
Hazards 65(1): 683-705.
Stewart, R. M. and Rashid, H. (2011). "Community strategies to improve flood
risk communication in the Red River Basin, Manitoba, Canada."
Disasters 35(3): 554.

AFAC18: PROCEEDINGS FROM THE BUSHFIRE AND NATURAL HAZARDS CRC & AFAC CONFERENCE 2018 | REPORT NO. 367.2018
181
Tyler, J. and Sadiq, A. A. (2018). "Friends and family vs. government: who does
the public rely on more to prepare for natural disasters?" Environmental
Hazards: 1-17.
United Nations (2015). Sendai Framework for Disaster Risk Reduction 2015 -
2030. Geneva, Switzerland
Wachinger, G., Renn, O., Begg, C. and Kuhlicke, C. (2013). "The risk
perception paradox--implications for governance and communication of
natural hazards." Risk Analysis 33(6): 1049-1065.
Webber, D. Gissing, A., Dufty, N., and Bird, D. (2017). "Community
participation in emergency planning: NSW State Emergency Service
case study." Australian Journal of Emerrgency Management 32(2): 28-
34.
Wood, M., Mileti, D., Kano, M., Kelley, M., Regan. R., and Bourque, L. (2012).
"Communicating Actionable Risk for Terrorism and Other Hazards." Risk
Analysis 32(4).

AFAC18: PROCEEDINGS FROM THE BUSHFIRE AND NATURAL HAZARDS CRC & AFAC CONFERENCE 2018 | REPORT NO. 367.2018
182
COMMUNITY PREPAREDNESS AND RESPONSES TO THE 2017 NEW SOUTH WALES BUSHFIRES Non-peer reviewed research proceedings from the Bushfire and Natural
Hazards CRC & AFAC conference
Perth, 5 – 8 September 2018
Josh Whittaker1,2 1 Bushfire and Natural Hazards CRC 2 University of Wollongong
Corresponding author: [email protected]

AFAC18: PROCEEDINGS FROM THE BUSHFIRE AND NATURAL HAZARDS CRC & AFAC CONFERENCE 2018 | REPORT NO. 367.2018
183
ABSTRACT
BACKGROUND
January and February 2017 saw a number of destructive bushfires in New South
Wales, some of which occurred during Catastrophic fire weather conditions.
These fires damaged and destroyed a range of assets including houses,
outbuildings, community halls, livestock, machinery, fences and other
agricultural assets. Fortunately no human lives were lost.
RESEARCH SCOPE AND METHODS
The NSW Rural Fire Service (NSW RFS) commissioned the Bushfire and Natural
Hazards Cooperative Research Centre to undertake research into community
preparedness and responses to bushfires in NSW in 2017. The University of
Wollongong and Macquarie University were engaged by the Bushfire and
Natural Hazards CRC to conduct this research. The NSW RFS Statement of Work
identified the following themes for investigation:
THEME 1: INFORMATION AND WARNINGS
The effectiveness of warnings delivered to the community during fire events
and the resulting actions taken
• Did the warnings and information provided assist people to reduce the risk to
agricultural assets?
• The delivery of Catastrophic fire danger messages to areas which were not
impacted by fire, to investigate whether this may have an effect on future
responses during fire events
• How people sought out information relating to the fires
• What were the drivers and motivators for those people who sought to reenter
fire grounds? What was their perception of the risks associated with doing so?

AFAC18: PROCEEDINGS FROM THE BUSHFIRE AND NATURAL HAZARDS CRC & AFAC CONFERENCE 2018 | REPORT NO. 367.2018
184
THEME 2: PLANNING AND PREPAREDNESS MEASURES
• An understanding of the perception of risk, particularly in the farming
communities affected by fires
• Responses by the community and how people prioritised their protective
responses (such as livestock, machinery and housing)
• The perception of risk to and value of agricultural assets vs homes • What
influence previous fire history had on their planning, preparedness and
decisions • Identified intervention strategies
• What information or advice people sought out in the lead up to the specific
fire event Investigation and analysis of firefighting responses and building
impact assessments are outside the scope of this research.
The research involved 113 interviews with people affected by the Currandooley
(n=36), Carwoola (n=38) and Sir Ivan (n=39) fires and an online survey of people
(n=549) threatened or affected by bushfires throughout NSW in 2017. Survey
results should be interpreted with caution due to biases associated with
selfselected (non-random) samples.
KEY FINDINGS
Warnings
Key insight – A majority of survey respondents found warnings easy to
understand, up-to-date and useful. Survey respondents and interview
participants expressed a preference for highly localized information.
• Survey respondents most often identified Fires Near Me as their most useful
information source. Fires Near Me was seen as easy to understand (88%), useful
(82%) and sufficiently localised (76%). Two-thirds (66%) felt the information was
up-to-date. Interviewees commonly expressed strong support and a high
degree of satisfaction with Fires Near Me.
• Compared to SMS warnings, landline telephone warnings were more often
seen as useful (78% v 67%), up to date (72% v 66%) and timely (68% v 66%).
Nevertheless, survey respondents most often identified SMS as their preferred
mode for delivery of warnings. Most people expect to receive warnings from
multiple sources.

AFAC18: PROCEEDINGS FROM THE BUSHFIRE AND NATURAL HAZARDS CRC & AFAC CONFERENCE 2018 | REPORT NO. 367.2018
185
• Limited mobile phone coverage, particularly in the Sir Ivan and Currandooley
fires, meant that some people did not receive SMS warnings.
Catastrophic Fire Danger Warnings
Key insight – Most people do not intend to leave before there is a fire on days
of Catastrophic Fire Danger. Those who intend to leave will wait until there is a
fire, and others intend to stay and defend.
• Survey respondents considered Catastrophic Fire Danger warnings to be easy
to understand (88%), timely (83%) and useful (78%).
• Receipt of an official warning about Catastrophic Fire Danger prompted
survey respondents to discuss the threat with family, friends or neighbours (63%)
and look for information about bushfires in their area (62%). Equal proportions
began preparing to defend (39%) or leave (39%) and a smaller proportion
(12%) left for a place of safety.
• When asked what they would do if they received a message about
Catastrophic Fire Danger next summer, 12% said they would leave before there
is a fire and 24% said they would wait until a fire started, then leave. 27%
reported that they would get ready to stay and defend, while 24% said they
would wait for a fire before deciding what to do.
• Analysis of interview data highlights that many people believe it is impractical
to leave on days of Catastrophic Fire Danger before there is a fire. Many are
also committed to defending, despite being aware of the increased risks to life
on such days.
How people accessed information
Key insight – In addition to internet, social media and other sources, people
sought information about the fire itself through direct observation. Observing
the fire appears to have helped people ready themselves to defend, or
confirmed the need to leave.
• Half of all respondents accessed information via the internet (53%). They most
commonly sought information about the location of the fire (91%), roads (e.g.
traffic and road blocks) (64%) and weather conditions (60%). Around half
looked for information about firefighting activities (54%) and the likely time of
impact (43%). Websites most commonly used included Fires Near Me, the NSW
RFS, Bureau of Meteorology and various Facebook pages (including NSW RFS
and local community pages). Almost two-thirds (62%) of all survey respondents
used social media during the fires.

AFAC18: PROCEEDINGS FROM THE BUSHFIRE AND NATURAL HAZARDS CRC & AFAC CONFERENCE 2018 | REPORT NO. 367.2018
186
• Interviewees and survey respondents often sought information about the fire
through direct observation. Consistent with findings from past research, many
residents left their homes and properties to go and look at the fire. For some
people, observing the fire appears to have helped ready themselves to defend
and, for others, confirmed the need to leave.
Drivers and motivators for returning
Key insight – The need to protect houses and property, rescue or assist
vulnerable people, and protect animals are the main drivers for returning. Some
interviewees passed through road blocks, or circumvented them, to return
home.
• The majority of survey respondents were at home when they found out about
the bushfire (60%). Of those who were not at home, 71% indicated that they
tried to return to their house or property.
• The drivers for returning to fire affected areas are many, but most often
revolve around the desire to protect houses and property, rescue or assist
vulnerable people, and protect animals.
• While some interviewees complied with roadblocks, others described passing
through or circumventing roadblocks in order to return. Some interviewees used
backroads or gates through private property to return, sometimes on foot or in
vehicles that were unsuitable for roads, tracks and paddocks. There was a
perception that some people were exposed to more danger than if they had
passed through the roadblock.
Perceptions of risk
Key insight – Some people may underestimate the risks to life and property if fire
danger is not Catastrophic.
• Analysis of interviews with people affected by the Carwoola and
Currandooley fires suggests that some may have underestimated the risks to life
and property because fire danger conditions were not Catastrophic.
• Many interviewees affected by the Sir Ivan fire did not anticipate the size or
severity of the fire. References to experience with smaller fires were common.
Many felt that they were prepared to respond to smaller, ‘normal’ fires, but
there was little they could have done to prepare for a fire of the size and
severity of Sir Ivan.

AFAC18: PROCEEDINGS FROM THE BUSHFIRE AND NATURAL HAZARDS CRC & AFAC CONFERENCE 2018 | REPORT NO. 367.2018
187
Prioritisation of protective responses
Key insight – Many hobby farms, small acreages and large farm properties were
significantly underinsured. Interviewees often discussed prioritisation of
insurance, with many seeing insurance as cost-prohibitive.
• 48% of survey respondents left or were away from their house or property
during the fire; 47% stayed to defend; and 6% sheltered inside a house or
somewhere outside. Those who left prioritised the protection of life, even if that
meant losing a house or property: 48% left because they felt it was too
dangerous to stay; 33% left to remove household members or visitors from
danger; and 31% left because it was a day of high fire danger. Those who
stayed usually did so to protect property, and most (81%) did not feel their life
was endangered at any point. Common reasons for staying were to protect
the house and property (63%) and to protect livestock and other animals (43%).
• Rates of house insurance were high for houses on residential blocks, hobby
farms/small acreages and large farm properties (all 92%). However, only half of
all large farms and hobby farms/small acreages were fully insured (55% and
47% respectively). Affordability of insurance was an issue for many agricultural
landholders. Interviewees discussed their decisions to insure some assets but not
others. Insuring fences and livestock were seen as particularly cost-prohibitive.
Perception of risk to and value of agricultural assets vs homes
Key insight - Perceptions of value and risk to agricultural and domestic assets
are complex. Economic value is important in decisions about what to protect,
but is balanced against utility and sentimental values.
• Many farm properties were large with a wide distribution of assets. Some
landholders also had additional blocks that came under threat. They often did
what they could to prepare, for example by ploughing fire breaks and moving
livestock, then fell back to protect what was manageable, typically the house
and nearby paddocks and sheds. This appears to have been based on an
assessment of what was possible with available resources and not necessarily
what was valued most.
• Although there may be more financially valuable assets than houses, homes
often have utility values that exceed their direct financial worth. For example,
one farmer explained how the houses on his large farm property provided
accommodation for workers, without which the business would be unable to re-
establish. Houses also have sentimental or emotional values that also influence
the prioritisation of protective responses.

AFAC18: PROCEEDINGS FROM THE BUSHFIRE AND NATURAL HAZARDS CRC & AFAC CONFERENCE 2018 | REPORT NO. 367.2018
188
Public expectations of the NSW RFS
Key insight – While limitations to NSW RFS support due to resource constraints
are generally well understood (e.g. there are not enough fire trucks for every
property), there is less appreciation of operational constraints imposed by Fire
Danger conditions, fire behaviour and health and safety obligations.
• Most interviewees affected by the Currandooley and Carwoola fires praised
the efforts of firefighters and did not expect to receive personal firefighting
support. Residents in Carwoola were particularly cognisant of the limits to NSW
RFS support, which had been clearly communicated by the local brigade over
time.
• Some interviewees affected by the Sir Ivan fire were critical of the firefighting
response. It is important to recognise that these criticisms reflect interviewees’
personal views and, whether they are factual or not, or warranted or not, they
provide insights into people’s understandings of firefighting and their
expectations of the NSW RFS and other emergency services. Criticisms varied in
detail but typical reflected a belief that the NSW RFS prioritised the protection
of houses over agricultural properties and assets; and that firefighting strategy
was bureaucratic, directed from afar, and overly risk averse. These criticisms
should also be viewed in the context of a large, destructive bushfire that burnt
under Catastrophic conditions.
Implications and opportunities
The findings presented in this report have numerous implications and present
opportunities for NSW RFS communications and community engagement. These
include:
• The research confirms the tendency for people to observe the fire directly to
ready themselves to defend or confirm the need to leave. This behaviour
presents opportunities for emergency service personnel to meet people at a
time when they are seeking and receptive to information and advice. Such
meetings could occur at locally known observations points, or at locations
designated by emergency services.
• There is a need to more clearly communicate the risks posed by fires burning
under non-Catastrophic Fire Danger conditions. Such messages could be
incorporated into community education and engagement resources, as well as
emergency warnings and information.
• There is potential to develop additional resources to assist agricultural
landholders to plan and prepare for bushfire. Resources are needed to help
businesses more systematically identify assets and values, prioritise, and plan for
their protection. These materials could include ‘Best practice’ case studies and
information about insurance.

AFAC18: PROCEEDINGS FROM THE BUSHFIRE AND NATURAL HAZARDS CRC & AFAC CONFERENCE 2018 | REPORT NO. 367.2018
189
• There is a need to more clearly communicate the limits to NSW RFS response
capacity. In addition to limitations due to resource constraints, which are
generally well-understood, there is potential for enhanced communication of
operational constraints imposed by Fire Danger conditions, fire behaviour and
associated imperatives such as Occupational Health & Safety requirements.
Findings suggest that local brigades can be effective in communicating these
messages; however, this may require considerable engagement and training at
a time when some NSW RFS members are finding training and time
commitments challenging.
AFAC18: PROCEEDINGS FROM THE BUSHFIRE AND NATURAL HAZARDS CRC & AFAC CONFERENCE 2018 | REPORT NO. 367.2018
190
DIVERSITY AND INCLUSION: BUILDING STRENGTH AND CAPABILITY Non-peer reviewed research proceedings from the Bushfire and Natural
Hazards CRC & AFAC Conference
Perth, 5–8 September 2018
Celeste Young1,3, Joanne Pyke1,3, Neelam Maharaj1, Craig Cormack2,3, Bruce
Rasmussen1,3 and Roger Jones1,3 1Institute of Sustainable Industries and Liveable Cities, Victoria University 2 Outofthebox Consulting 3 Bushfire and Natural Hazards CRC
Corresponding author: [email protected]

AFAC18: PROCEEDINGS FROM THE BUSHFIRE AND NATURAL HAZARDS CRC & AFAC CONFERENCE 2018 | REPORT NO. 367.2018
191
ABSTRACT
DIVERSITY AND INCLUSION: BUILDING STRENGTH AND CAPABILITY
Author Name, Celeste Young, Joanne Pyke, Craig Cormack, Neelam Maharaj,
Bruce Rasmussen, Roger Jones
Institute of Sustainable Industries and Liveable Cities, Victoria University, VIC
Diversity and inclusion: Building strength and capability
Although diversity and inclusion (D&I) is not a new concept or area of practice, for the
Emergency Management sector there has been little clarity of what effective D&I looks like for
the sector. This includes how it is implemented within the emergency management (EM) context,
how that context itself is changing due to increasingly dynamic social, environmental and
economic drivers and how D&I is best measured and implemented. In its first year, the project
Diversity and inclusion: Building strength and capability, has undertaken a number of activities
with end users, involving developing a detailed project plan, undertaking a literature review, and
conducting three case studies and a community survey. The case studies involved desktop
studies of organisational capabilities and histories, and interviewing people within each
organisation and in three different communities. This presentation covers the case studies,
community interviews and community survey.
Using a systemic analysis that focuses on decision making, it examines the key synergies and
differences found in each organisation in relation to past and present practice. Barriers, needs,
opportunities and benefits for D&I in each organisation as seen by their employees have been
collated. It also examines how each organisation has evolved. Their capacity to serve the
changing agenda that D&I needs to operate within, and how D&I can help develop that
capacity is also examined. Views from the community of the EM sector are also canvassed. These
findings have been used to develop a draft diversity and inclusion framework to guide the next
stage of this research.

AFAC18: PROCEEDINGS FROM THE BUSHFIRE AND NATURAL HAZARDS CRC & AFAC CONFERENCE 2018 | REPORT NO. 367.2018
192
INTRODUCTION EMOs are diverse and complex. Their scope of activity spans the prevention, preparedness,
response and recovery (PPRR) spectrum, and requires a range of activities that contribute to the
wellbeing of communities. “Unacceptably low levels of diversity” in emergency services and a
recognition that emergency services need to better reflect the communities they work to serve
(National Strategy for Disaster Resilience 2011), is driving the need for EMOs to diversify both their
skills, workforce and services to meet the changing needs of their communities.
The context in which many of these organisations operate is changing due to:
• The increasing intensity and frequency of events due to climate change, and the
increasing costs associated with these events.
• Changing demographics.
• New technologies, particularly digital.
• Resource constraints and decreasing volunteer numbers.
• The need to build resilience within organisations and their communities, to reduce future
costs and impacts of future events.
These dynamic and systemic drivers are changing the focus of EMOs activities from shorter-term
tactical approaches across the PPRR spectrum, to long-term strategic approaches that focus on
future outcomes. These drivers are also facilitating the need for innovation across the Emergency
Management Sector, and the development of new services that aim to increase resilience of the
organisations and their communities. It is also fundamentally changing the nature of the
relationship EMOs have with their communities, from delivering a service to them to working with
them. Effective implementation of diversity requires inclusion which is a relatively new area of
practice and knowledge (Young et al., 2018).
Due to specific changing nature of EMOs service and policy requirements, it is important to assess the system that this encompasses.
This paper presents a summary of key findings from four different areas of work undertaken in the first year of the project to understand the organisational, economic and community context in relation to diversity and inclusion which has provided the basis for the development of a draft framework for diversity and inclusion.

AFAC18: PROCEEDINGS FROM THE BUSHFIRE AND NATURAL HAZARDS CRC & AFAC CONFERENCE 2018 | REPORT NO. 367.2018
193
BACKGROUND The project Diversity and inclusion: Building strength and capability, aims to assist understanding
and practice of diversity and inclusion (D&I) in the EMOs through the identification of current
measurement, strengths, barriers, needs and opportunities in EMOs and the community.
The key need identified in the scoping phase of this project was to understand what effective D&I
is, and what this means for EMOs in terms of practice and measurement. As a primary focus to
guide the project, we have developed the following definition of effective diversity:
“The result of interactions between organisations and individuals that leverage, value and build
upon characteristics and attributes within and beyond their organisations to increase diversity
and inclusion, resulting in benefits that support joint personal and organisational objectives and
goals, over a sustained period of time.” (Young et al. 2018, p19.)
Using case studies, the project examines D&I systemically through a values, narratives and
decision-making context across organisational, community and economic themes. Aspects of
diversity being examined are: culture and ethnicity, gender, demographic status (age and
education), and disability (physical).
The participating organisations are Queensland Fire and Rescue (QFES), Fire and Rescue New
South Wales (FRNSW), and South Australian State Emergency Services (SASES). The community
case studies selected are Bordertown in South Australia, Bendigo in Victoria and South-western
Sydney in New South Wales, representing rural, regional and urban communities.
The project has three stages:
• Understanding the context in which D&I exists in EMOs and the community.
• Development of a D&I framework suitable for the EMOs.
• Testing and utilisation of the framework.
The aim of this research is to develop a practical framework tailored to the EMOs context that
builds upon and leverages current strengths and expertise within the EMOs. This will be developed
collaboratively with our end-user group as part of our research process. Its purpose is to support
better management and measurement of D&I by providing a basis for more effective evidence-
based decision making and provide a foundation that can be built upon by EMOs as practice
progresses.

AFAC18: PROCEEDINGS FROM THE BUSHFIRE AND NATURAL HAZARDS CRC & AFAC CONFERENCE 2018 | REPORT NO. 367.2018
194
SUMMARY OF COMMUNITY, ECONOMIC AND ORGANISATIONAL CONTEXTS
ORGANISATIONAL CASE STUDIES Thirty-three semi structured interviews and a desk top review of publicly available materials were
undertaken across three EMOs; Queensland Fire and Emergency Services, Fire and Rescue New
South Wales and South Australian State Emergency Services. These were examined to ascertain
the key synergies and also the different nuances found in each organisation in relation to
practice in this area using a systemic analysis of their organisations focused on decision making.
Key findings from this study were:
• Diversity and inclusion (D&I) was present in all organisations, but it was not currently well
integrated into organisational systems and processes or connected to day-to-day
decision making.
• The largest barrier for D&I was culture and the largest need was in the area of
management.
• EMOs lack an overarching framework or process to work within, which has resulted in
shorter term, reactive approaches to implementation in many areas.
• Response-based and hierarchical cultures and tactical decision making are
predominant in all organisations, and are often at odds with the more strategic-based
softer skills required for D&I. There is a need to identify, build, value and reward specific
D&I capability, skills and attributes.
• Many activities to date have not been well socialized or communicated and this has
resulted in confusion, fear, resistance and difficult behaviours. There is also a lack of
awareness of appropriate language use and behaviours in relation to diverse
communities and individuals.
• Much implementation to date was felt to have polarized the issues between men and
women across EMOs and resulted in a focus on “obtaining diversity quotas” rather than
creating an inclusive culture.
• Effective inclusion requires the creation of an environment which is safe for diverse
individuals to be their “authentic selves”.
• There was a diversity of organisational cultures present in each organisation and cultural
gaps between these, particularly between upper management and brigades and units
which were seen to create an “us and them” attitude.
• D&I needs to be understood and framed as a business imperative that enhances
organisational performance as well as a moral imperative.
• There are deeply entrenched organisational and personal identities that are often linked
to heroism and response. These can be both positive and negative and need to be
proactively managed during the transformation process.
Strong organisational and individual identities and the changing nature of EMOs presented a
particular challenge in this area. The lack of current visions and narratives of future diverse
organisations and the predominant visual narrative of response-based men of men of Anglo
Saxon appearance were also found to have compounded this. There was limited understanding
of the benefits and opportunities that D&I have to offer and the specific skills, attributes and
knowledge of diverse communities have and how these can enhance EMOs activities.
There were indications that D&I attributes and skills are already present in areas of organisations
and also that some agencies contain a higher level of these skills and attributes. Measurement in
this area is still developing but there was a lack of consistent D&I data, measurement and
analysis. There is a need to build specific measurement models that are tailored to EMOs context.

AFAC18: PROCEEDINGS FROM THE BUSHFIRE AND NATURAL HAZARDS CRC & AFAC CONFERENCE 2018 | REPORT NO. 367.2018
195
Examples of effective practice were found in all case study organisations but it was also widely
acknowledged that there was still considerable work to be done in this area to achieve effective
practice across organisations.
ECONOMIC CASE STUDY: CHANGING CAPABILITIES
The economic case study focused on changing capabilities and tasks. It also identified the
following from annual reports and strategy documents:
• Intended changes in capabilities which respond to the changing context in which EMOs
operate.
• Actual changes which have been described in annual reports.
• Changes in tasks and the way in which these are a response to the changing context.
This was undertaken through a review of strategy documents and annual reports of the EMOs to
track their changing capabilities over the last decade.
In 2004-05, QFES strategic challenge was primarily enhancing its rural/remote and indigenous
capacity. By 2016-17, QFES became increasingly focused on its diverse customer base. Key
drivers for this were:
• an increase in the severity and frequency of natural disasters;
• changing community expectations;
• changes in the volunteer landscape; and
• an increase in crime and safety threats due to technological advancements,
globalisation and violent extremism (QFES, 2017c, p10).
QFES worked to address these challenges through training, recruitment of a more diverse and
capable workforce, and technological advancements.
To support its diverse workforce, QFES developed strategies to improve its workplace culture. It
also instigated a new human resources management system (NEXUS) to recruitment and
retention of a diverse workforce and more flexible work arrangements.

AFAC18: PROCEEDINGS FROM THE BUSHFIRE AND NATURAL HAZARDS CRC & AFAC CONFERENCE 2018 | REPORT NO. 367.2018
196
Key challenges for FRNSW 2004–05 were;
• drought
• terrorism
• global warming
• aging population
• natural disasters.
By 2011–12, FRNSW identified particular areas of activities to address these challenges, such as
strengthening community resilience. Specific areas of consideration were the impacts and
increasing costs service delivery and the need for more environmentally sustainable fighting
methods.
It also extended its community focus beyond an ageing population to include:
• the increased risk of social dislocation among the increasing proportions of single person
households
• demographic changes due to increased migration
• increases in coastal communities; and
• decline in rural communities.
Advances in technology, the high costs of such technology and the need for upskilling the
workforce were also specified.
By 2016–17, the FRNSW tightened it focus on its communities and its workplace culture following
investigations into its operations by KPMG and ICAC. Key steps to improve this were; retraining its
existing workforce and recruiting staff from diverse backgrounds. In particular it has:
• Developed programs and specifically targeted recruitment from Aboriginal and Torres
Strait Islander communities, women.
• Developed closer ties with CALD communities.
• Improved its response capability through new technologies.
• Diversified services to include assistance to the Ambulance Service at medical
emergencies.
• Improved the capability of its workforce through targeted training.
The SASES has experienced difficulties in relation to its volunteer training and retention. It
undertook a review of its staffing arrangements in 2011–12 and developed a new workforce plan
in 2012–13. Since then it has a significant workforce mapping project. Its Strategic Directions 2017–
2020 report mentions the need to promote diversity and inclusion in its workforce, and also the
need to develop and implement a flexible volunteering model, volunteer retention strategies and
improving skills to manage volunteers.
COMMUNITY VALUES AND ATTITUDE SURVEY
Values are the basis of decision-making and are the beliefs that determine what is most
important and what motivates action (Schwartz, 2016, p4).
Understanding differing and similar values is increasingly being used by organisations as a way to
understand gaps between their organization, clients and communities they serve. For emergency
management services to better represent the diversity of the communities they work, they need
to not just understand the demographics of those communities, but also the values across their
communities, particularly in relation to diversity.
This study undertook a community survey across 539 community members to ascertain values
and attitudes in relation to the EMOs. The survey used Schwartz’s measurement of values which
comprises of ten different values, based around four key areas: openness to change, self-

AFAC18: PROCEEDINGS FROM THE BUSHFIRE AND NATURAL HAZARDS CRC & AFAC CONFERENCE 2018 | REPORT NO. 367.2018
197
transcendence, conservation and self-enhancement, as a basis. Questions from the Schwartz
values study were amalgamated with the World Values Survey to develop the survey. The
demographic varied across age, gender and cultural spectrums.
Key findings were:
• 25% of survey respondents in this study spoke a language other than English at home.
Twenty-seven different languages were cited as being used, with the most common
being Chinese, Hindi and Italian.
• While women-only answers to some gender-based questions elicited significant
differences to the general community, there were indications that there may be some
strongly-ingrained gender stereotypes that exist amongst both men and women, that
may need further research.
• Findings from younger people did not reveal vast differences between general
community values across the study, indicating that studying the nuances in responses will
be important, and relying on stereotypes of ‘Millennials’ may be very misleading.
• How the community viewed emergency services workers, and their expectations of skills
needed at different times relating to an emergency, was of significant interest.
The data from this survey provided a baseline for the diversity of community values that exist
which can be potentially be compared to the values of EMOs and their staff. This has potential to
help discern where there may be significant differences of both diversity and also values
between EMOs and the community.
COMMUNITY CASE STUDIES Three case studies were undertaken to explore diversity and inclusion in communities. The
locations included Bordertown (SA), Bendigo (Vic.) and the City of Parramatta (NSW). Objectives
included to: understand the changing nature of diversity and inclusion in communities; identify
community perceptions of EMOs; identify barriers and opportunities for community inclusion in
EMOs; and, provide examples of how diverse communities relate to EMOs. The case studies were
informed by secondary data and in-depth interviews with informed community stakeholders.
Each of the case study areas are being shaped in the larger context of economic transformation,
changing settlement patterns and increasing population size, diversity and mobility. Social
inequality was widening and systemic disadvantage faced by specific groups within communities
was entrenched. Community perceptions of EMOs were diverse and ranged from them being seen as respected
to being “taken for granted” by many parts of the community. Others were either unaware,
disconnected from, or fearful of EMOs. Some newly arrived communities believed their cultures
and languages were not recognised. People with disabilities believed that there are few
opportunities for participation. There was a wide perception EMOs are a “closed shop” with few
opportunities for engagement. The image of EMOs held by many interviewees was one that was male, heroic and
predominantly “white” which was alienating for many women and those from culturally diverse
backgrounds. A lack of understanding of cultural diversity also created a disconnection and
limited modes of communication preventing the building of community relationships. The
increasing mobility of the population was also a barrier with place-based services not keeping
apace of their changing community demographics. Declining resources for community agencies
was also an issue. Despite barriers, there are many examples of EMOs and community engagement particularly in
relation to community education. For example, EMOs are actively involved in settlement services
for newly arrived communities and the joint production of community resources and engage in
community liaison programs. Strategies that were based on long-term relationship building,

AFAC18: PROCEEDINGS FROM THE BUSHFIRE AND NATURAL HAZARDS CRC & AFAC CONFERENCE 2018 | REPORT NO. 367.2018
198
mutual understanding, respect and collaboration, were regarded as most sustainable and
productive. These initiatives can be built upon and there is a need to address gaps such as.
• Visible representation of women and men from diverse backgrounds to provide
aspirational role models for young people. • The expansion of the modes of communications to diverse communities to more clearly
articulate and encourage the possibilities for engagement with community members. • To identify and understand new communities such as temporary migrants and new
refugee communities more broadly. • The need for closer understanding of, and connections between, EMOs and community
sectors.
Overall, communities welcomed EMOs engagement to improve safety and participation
of community members with their agencies. Many interviewees raised that there was a key
opportunity to improve the effectiveness of EMOs activities through harnessing the skills and
knowledge that diverse communities possess.
CONCLUSION “change is coming we need to be ready for it”
Although D&I is not new to EMOs, effective implementation in this area has often remained
elusive. It is clear from the research undertaken that the context in both the organisations and
communities is highly dynamic, complex, fragmented and disconnected. The synergies of
themes that have arisen across these areas of work highlight the need for organisations to work
more systemically, inclusively and strategically in this area. It also highlights the opportunities in this
area, particularly in relation to identification and leveraging of community skills and knowledge
to enhance services and increase community resilience.
Effective D&I requires persistence, long-term commitment and planning and allocation of
resource. It also requires a systemic approach to implementation that reaches beyond the
organisations and includes their communities and external stakeholders.
Innovation and change are key aspects of D&I, so it is an uncomfortable and difficult process
where not everything will work. Ongoing learning and adjustment are critical to the process.
Currently there is a need for EMOs to stop and reflect on where their organisations are now and
where they wish to be in the future. This way they can plan more effectively plan their transition
towards the diverse organisations they wish to become.
How opportunities are capitalized on and whether they are realised will be very dependent upon
how well organisations connect and leverage the skills, knowledge and attributes both within
their organisations and their diverse communities. Also, how well they persist down the difficult
and challenging road towards inclusion.
Reports pertaining to this research can found at: https://www.bnhcrc.com.au/research/hazard-
resilience/3392

AFAC18: PROCEEDINGS FROM THE BUSHFIRE AND NATURAL HAZARDS CRC & AFAC CONFERENCE 2018 | REPORT NO. 367.2018
199
REFERENCES 1. AFAC. (October, 2016). Diversity and inclusion within AFAC. Discussion Paper, Australasian
Fire and Emergency Service Authorities Council, Melbourne. Davidson, M. J. and Fielden, S. L.
(2004). Individual diversity and psychology in organizations. John Wiley.
2. National Emergency Management Committee (NEMC). (2011). National Strategy for Disaster
Resilience. Commonwealth of Australia, Canberra, at:
https://knowledge.aidr.org.au/media/2153/nationalstrategyfordisasterresilience.pdf
3. Young, C., Pyke, J., Maharaj, N., Rasmussen, B., and Jones, R. (2018).
Diversity and inclusion: building strength and capability literature review.
Bushfire and Natural Hazards CRC.

AFAC18: PROCEEDINGS FROM THE BUSHFIRE AND NATURAL HAZARDS CRC & AFAC CONFERENCE 2018 | REPORT NO. 367.2018
200
A SYSTEMATIC APPROACH TO EMBEDDING SAFETY, WELL-BEING AND RISK MANAGEMENT WHEN
RESPONDING TO INTERSTATE AND INTERNATIONAL DEPLOYMENTS
Non-peer reviewed research proceedings from the Bushfire and Natural Hazards
CRC & AFAC conference
Perth, 5 – 8 September 2018
Julian Smith, Graeme Dudley, Andrew Stanios, David Sayce, and Andrew Collins
Forest Fire Management Victoria
Department of Environment, Land, Water, and Planning
Corresponding author: [email protected]

AFAC18: PROCEEDINGS FROM THE BUSHFIRE AND NATURAL HAZARDS CRC & AFAC CONFERENCE 2018 | REPORT NO. 367.2018
201
ABSTRACT The State of Victoria is a signatory to a variety of mutual aid arrangements to support partner
agencies both interstate and internationally, during times of emergency.
The Department of Environment, Land, Water and Planning (DELWP), Parks Victoria, Melbourne
Water, and VicForests, as Forest Fire Management Victoria (FFMVic), contribute to an overall
Victorian deployment group when requests are made.
Notwithstanding, DELWP, and its FFMVic partners, has legislative obligations to ensure, as far as is
reasonably practicable, the health and safety of our workforce including whilst deployed interstate
and internationally under the control of partner agencies.
Working in strange landscapes with different people, systems, practices and equipment present a
range of heightened risks for FFMVic personnel. Additionally, deployments frequently transpire
when the requesting state / country has been managing protracted and large-scale events
associated with widespread natural disasters and impacts on local communities.
Sound and comprehensive deployment planning and processes are the foundations to begin to
mitigate those increased risks. Additionally, it has been recognised that planning for the wellbeing
and safety of our staff extends well beyond the deployment window.
High level systems for managing emergencies fall under the Australasian Interservice Incident
Management System (AIIMS). This system is nationally recognised and relatively consistent across
Australia.
Yet, for on-ground management, control agencies have agency-specific safety systems,
operational protocols, plant, equipment and tactics. These are best reviewed in advance of a
specific deployment request to ensure that they are understood and are of an acceptable
standard. If FFMVic believe them to be insufficient, additional mitigations and controls may need
to be considered to ensure FFMVic staff are deployed into a safe workplace.
This paper presents a risk based approach and methodology to comparing partner agencies’
safety systems. FFMVic has already carried out comparisons with a range of partner agencies and
high-level learnings from these reviews will be presented.

AFAC18: PROCEEDINGS FROM THE BUSHFIRE AND NATURAL HAZARDS CRC & AFAC CONFERENCE 2018 | REPORT NO. 367.2018
202
INTRODUCTION
The Department of Environment, Land, Water and Planning (DELWP) is a signatory to a variety of
mutual aid arrangements that provide support to partner agencies both interstate and
internationally.
DELWP (and other FFMVic partner agencies) has a requirement under the Victorian Occupational
Health and Safety Act 2004 to ensure, so far as is reasonably practicable, that it provides and
maintains a working environment that is safe and does not pose risks to the health and safety of
people under its management and control.
This paper summarises a risk based methodology and comparative work that has been carried out
to support the deployment of FFMVic personnel in support of interstate and international partner
agencies.

AFAC18: PROCEEDINGS FROM THE BUSHFIRE AND NATURAL HAZARDS CRC & AFAC CONFERENCE 2018 | REPORT NO. 367.2018
203
BACKGROUND
DELWP currently has 13 different partnership agreements with other organisations which include
interstate and international multi agency arrangements through the Forest Fire Management
Group (FFMG), Emergency Management Victoria (EMV), Emergency Management Australia
(EMA) and National Aerial Firefighting Centre (NAFC) including the National Resource Sharing
Centre (NRSC).
The purpose of these mutual aid agreements and arrangements are to promote and facilitate
exchange of emergency management resources between partner agencies and organisations
for the delivery of emergency management in Victoria as well as providing mutual support and
aid during the emergency management activities in other Australian States, New Zealand,
Canada and United States.
These mutual aid arrangements are managed on behalf of the State of Victoria by EMV. DELWP,
Parks Victoria, Melbourne Water, and VicForests, as Forest Fire Management Victoria (FFMVic)
contribute to overall Victorian deployments when requests are made and dispersed across
Victorian emergency agencies.
While FFMVic staff are working interstate or internationally and under the control of the interstate
and international agency, the host agency has a requirement under local occupational health
and safety legislation to ensure a safe workplace. However, DELWP (and FFMVic partner agencies)
also has a responsibility to ensure that our staff are being placed into a safe workplace, so far as is
reasonably practicable.
High level systems for managing bushfires or for undertaking planned burning falls under the
Australasian Interservice Incident Management System (AIIMS). This system is the nationally
recognised system of incident management for the nation's fire and emergency service agencies
structure and this is consistent across Australia. Hence, when it comes to overall management
systems, there is a common doctrine and these are well established.
When it comes to the on-ground management of emergencies, individual agencies have different
conditions and hazards which may require different operational protocols, plant, equipment and
tactics. These protocols must be reviewed in advance to ensure that they are of an acceptable
standard, or if DELWP believe them to be insufficient or significantly different, allow the department
time to implement additional controls to ensure their staff are so far as is reasonably practicable
placed in a safe workplace.
It is now common place across emergency management policies and procedures in all agencies
that safety of responders is top priority. However, working in unfamiliar landscapes interstate or
internationally with different people, systems, practices and equipment present a range of
heightened risks for FFMVic personnel.
Interstate and international deployments frequently transpire when the requesting state / country
has been managing protracted and large-scale events associated with widespread natural
disasters and impacts on local communities. The emergency sector has seen a real growth in the
interest and management of psychological wellbeing with well reported cases of post-traumatic
stress being documented and discussed in mainstream and social media. Thus, there is increasing
interest and need in ensuring that agencies account for not only the safety but also the wellbeing,
particularly psychological, of personnel under their control.
Feedback and reported data tell us that key risks for FFMVic personnel when deployed interstate
and internationally are:
1. Driving to and from events
2. Tree hazard risks
3. Fatigue
4. Working in isolation
5. Psychological wellbeing

AFAC18: PROCEEDINGS FROM THE BUSHFIRE AND NATURAL HAZARDS CRC & AFAC CONFERENCE 2018 | REPORT NO. 367.2018
204
METHOD
A risk based approach was used to identify the criteria for the safety systems comparison
methodology:
1. Working alone or in isolation procedures.
2. Hazardous tree management processes.
3. Briefings, information and communication procedures.
4. Dynamic risk assessment policies and application.
5. Incident reporting and investigation procedures.
6. Deployment suitability procedures and guidelines.
7. Medical classifications and fit for fire procedures.
8. Fatigue management protocols.
9. Hydration policies.
10. Personal protective equipment standards.
11. Mobile plant operation and management.
12. Vehicle operation and management.
13. Radio operation.
14. Hand tools and equipment operation and standards.
Interstate reviews were initiated with identified agencies that DELWP regularly works with or
receives assistance requests from. Contact was made to introduce the reviews and to provide
additional context.
Once initial contact took place, arrangements were made for DELWP staff to travel to the relevant
agency, review documentation and obtain further clarification and context. Often advanced
copies of management systems and operational procedures were sent to the review team which
allowed for a more in-depth review beforehand and more time for face-to-face discussion.
A spreadsheet was then populated with information against each of the review elements which
were being assessed. It must be noted that this was not a compliance audit or a review of the
entire management system. Only key elements of the agencies’ systems were reviewed via a
desktop exercise which focused on key operational topics. No field inspections or audits were
completed on compliance to interstate agencies systems.
The review spreadsheet was also shaded as a traffic light document for the benefit of all agencies.
• Green identified that the system element was assessed as equal to that of DELWP’s
and no additional controls are required for staff on deployment.
• Yellow identified there were differences in the agencies’ policies and that additional
control measures should be considered for DELWP staff while on deployment.
• Red identified that there were significant differences and that DELWP must implement
additional controls for staff while on deployment.
Assumptions were made on the strength of the agencies’ documentation. No field visits were
made to validate how well procedures had been implemented and how well they are adhered
to.
Copies of the review spreadsheets were then shared between agencies to confirm their contents
and to provide details of DELWP systems. Copies of documents were also exchanged in the interest
of information sharing and, where possible, to strive towards a common operating doctrine within
Australia.
PARTICIPATING AGENCIES AND STRUCTURE Depending on the structure and responsibilities of the individual agency, it is possible that DELWP
would be deployed to the lead agency i.e. Department of Environment, Water and Natural
Resources (DEWNR) South Australia, however be under the management and control of the South
Australian Country Fire Service (SNCFS) in an operational sense.

AFAC18: PROCEEDINGS FROM THE BUSHFIRE AND NATURAL HAZARDS CRC & AFAC CONFERENCE 2018 | REPORT NO. 367.2018
205
In such circumstances, all attempts were made to review the doctrine of the organisation that
DELWP staff would be under the management and control of, however this often included a
mixture of both agencies documentation. This is another element to be considered when planning
and mobilising interstate and international deployments.
The following agencies were reviewed as part of this project.
• Tasmania Fire Service, Tasmania
• National Rural Fire Authority, New Zealand
• Department of Conservation, New Zealand
• Department of Parks and Wildlife, Western Australia
• Department of Environment, Water and Natural Resources, South Australia
• Country Fire Service, South Australia
• New South Wales Rural Fire Service, New South Wales
Meetings were also held, however no formal reviews were undertaken, with the Australian Capital
Territory Parks and Conservation Service.
Additional agencies are also mentioned in agreements and arrangements for DELWP to potentially
be deployed and assist, however such deployments were deemed to be unlikely and as such no
reviews were undertaken.
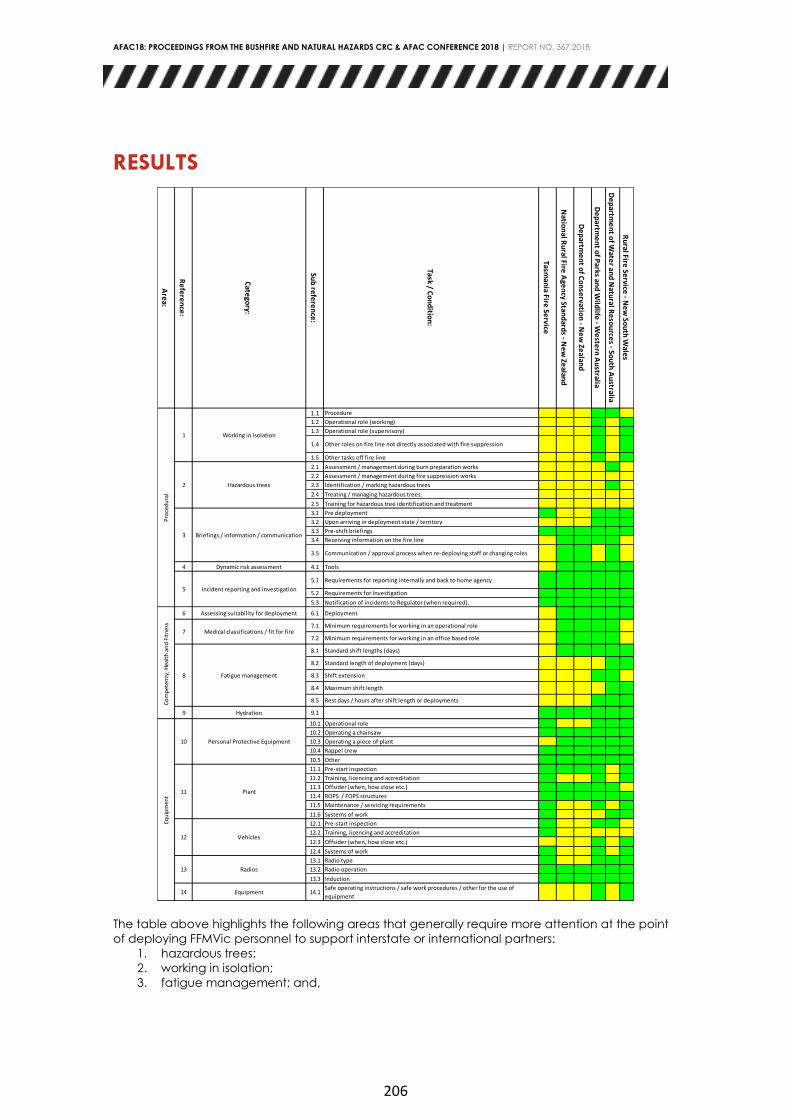
AFAC18: PROCEEDINGS FROM THE BUSHFIRE AND NATURAL HAZARDS CRC & AFAC CONFERENCE 2018 | REPORT NO. 367.2018
206
RESULTS
The table above highlights the following areas that generally require more attention at the point
of deploying FFMVic personnel to support interstate or international partners:
1. hazardous trees;
2. working in isolation;
3. fatigue management; and,
Are
a:
Re
fere
nce
:
Cate
gory:
Sub
refe
ren
ce:
Task / Co
nd
ition
:
Tasman
ia Fire Se
rvice
Natio
nal R
ural Fire
Age
ncy Stan
dard
s - Ne
w Ze
aland
De
partm
en
t of C
on
servatio
n - N
ew
Zealan
d
De
partm
en
t of P
arks and
Wild
life - W
este
rn A
ustralia
De
partm
en
t of W
ater an
d N
atural R
eso
urce
s - Sou
th A
ustralia
Ru
ral Fire Se
rvice - N
ew
Sou
th W
ales
1.1 Procedure
1.2 Operational role (working)
1.3 Operational role (supervisory)
1.4 Other roles on fire line not directly associated with fire suppression
1.5 Other tasks off fire line
2.1 Assessment / management during burn preparation works
2.2 Assessment / management during fire suppression works
2.3 Identification / marking hazardous trees
2.4 Treating / managing hazardous trees.
2.5 Training for hazardous tree identification and treatment
3.1 Pre deployment
3.2 Upon arriving in deployment state / territory
3.3 Pre-shift briefings
3.4 Receiving information on the fire line
3.5 Communication / approval process when re-deploying staff or changing roles
4 Dynamic risk assessment 4.1 Tools
5.1 Requirements for reporting internally and back to home agency
5.2 Requirements for investigation
5.3 Notification of incidents to Regulator (when required).
6 Assessing suitability for deployment 6.1 Deployment
7.1 Minimum requirements for working in an operational role
7.2 Minimum requirements for working in an office based role
8.1 Standard shift lengths (days)
8.2 Standard length of deployment (days)
8.3 Shift extension
8.4 Maximum shift length
8.5 Rest days / hours after shift length or deployments
9 Hydration 9.1
10.1 Operational role
10.2 Operating a chainsaw
10.3 Operating a piece of plant
10.4 Rappel crew
10.5 Other
11.1 Pre-start inspection
11.2 Training, licencing and accreditation
11.3 Offsider (when, how close etc.)
11.4 ROPS / FOPS structures
11.5 Maintenance / servicing requirements
11.6 Systems of work
12.1 Pre-start inspection
12.2 Training, licencing and accreditation
12.3 Offsider (when, how close etc.)
12.4 Systems of work
13.1 Radio type
13.2 Radio operation
13.3 Induction
14 Equipment 14.1Safe operating instructions / safe work procedures / other for the use of
equipment
Radios
Hazardous trees2
Personal Protective Equipment10
Plant 11
Pro
ced
ura
lC
om
pet
ency
, Hea
lth
an
d F
itn
ess
Equ
ipm
ent
1 Working in isolation
Fatigue management8
Incident reporting and investigation5
Briefings / information / communication3
Medical classifications / fit for fire7
12 Vehicles
13

AFAC18: PROCEEDINGS FROM THE BUSHFIRE AND NATURAL HAZARDS CRC & AFAC CONFERENCE 2018 | REPORT NO. 367.2018
207
4. vehicles and plant.
DISCUSSION
Throughout the reviews there were many similarities and quite a few differences in approach
regarding the operational protocols. A summary of some of the key topics is presented below and
a comprehensive document capturing the reviews of individual agencies was formulated to inform
future interstate or international deployments.
1. WORKING ALONE OR IN ISOLATION PROCEDURES All agencies have an implemented process when staff are working on a fire line in an operational
role to work minimum of 2-up. Crews have hand held and vehicle mounted radios as well as mobile
phones and other means of communication where required.
Some roles require staff to work one-up on the fire line however, these are for roles such as Divisional
/ Sector Commander, Safety Officer or to complete other specialist tasks such as ground truthing.
In such circumstances, there are requirements to maintain communications with their supervisor as
per the fire chain of command.
Most agencies did not have a policy document to capture requirements for working alone or in
isolation. All agencies did have a basic practice to monitor staff whereabouts. This was either via
a ‘T-card’ system or other process for calling in.
2. HAZARDOUS TREE MANAGEMENT PROCESSES There was an inconsistent approach amongst agencies when it came to hazardous tree
management.
All agencies had a dynamic element of hazardous tree identification and management
implemented, however this is where the similarities ended. Most agencies relied upon this rather
than actively identifying and treating hazardous trees prior to igniting a planned burn or a back
burn as part of fire suppression.
There were also inconsistencies in the level of training provided to staff on hazardous tree
management.
The inconsistencies should be considered and interim arrangements put into place to ensure the
risk is appropriately managed when on interstate and international deployments.
3. BRIEFINGS, INFORMATION AND COMMUNICATION PROCEDURES It was established that information is provided to incoming staff when they are first deployed. This
generally consisted of reaffirming behavioural expectations, accommodation arrangements and
an overall situation update.
Agencies could confirm that briefings were provided throughout the deployment process and then
via an incident shift plan / incident action plan document format that is relevant to the incident.
Where this differs amongst agencies is the level of detail that is provided in these documents and
how well it is explained to staff at the start of any shift.
In relation to providing information on the fire line, the chain of command was used to pass
information up and down the chain of command. It was also confirmed that Red Flag warnings
were used to pass on important information such as significant changes to weather, across all
agencies.
4. DYNAMIC RISK ASSESSMENT POLICIES AND APPLICATION The dynamic risk assessment process was an element of all agencies systems and was seen to be
an important tool for identifying and managing risks in an uncontrolled environment, such as fire

AFAC18: PROCEEDINGS FROM THE BUSHFIRE AND NATURAL HAZARDS CRC & AFAC CONFERENCE 2018 | REPORT NO. 367.2018
208
suppression activities. There were different variations of the dynamic risk assessment process with
L.A.C.E.S and Take 5 being the most common in use.
The application of the dynamic risk assessment process varied amongst organisations with some
relying on it more than others in the absence of systems of work.
The heavy reliance some agencies have on the dynamic risk assessment process is something
DELWP is now aware of and need to consider implementing additional controls when deploying
staff.
5. INCIDENT REPORTING AND INVESTIGATION PROCEDURES All agencies had sound processes in place for incident reporting, investigation and notification to
their Regulator should it be required.
All processes allowed for timely reporting and for information to be relayed back to the supporting
agency via incident reporting systems or via Departmental Liaison Officers.
There was also provision for joint investigations to be undertaken in the event of a significant
incident or near miss.
6. DEPLOYMENT SUITABILITY PROCEDURES AND GUIDELINES The selection of staff for deployment is an area that is left to the supporting agencies systems and
processes.
When DELWP provides staff, the process is relatively straightforward as there are medical and fitness
requirements for each role that staff are deployed to. Where this process requires further
management is if staff are redeployed into different roles whilst on deployment. In this scenario the
Department Liaison Officer must be made aware and ensure that redeployed staff are
undertaking roles within their medical and fitness classifications.
If DELWP are the host agency, the department must ensure that staff who are deployed to work
under DELWP’s management and control are of an appropriate and equivalent medical and
fitness standard. This becomes problematic when agencies do not have a fit for fire program.
7. MEDICAL CLASSIFICATIONS AND FIT-FOR-FIRE PROCEDURES The medical and fitness program differed between most agencies. Some agencies were
equivalent to DELWP’s process, others had fitness and medical requirements for certain roles, and
other agencies did not have a process.
This difference in medical and fitness requirements between agencies should not be an issue for
DELWP staff when they are deployed to work under another agency as internally we can ensure
these staff hold an appropriate medical and fitness clearance for the roles they are being
deployed into. As mentioned above, where it becomes an issue is when DELWP is the host agency
and the requirement to ensure that staff are at an equivalent medical and fitness level is the
responsibility of the support agency.
8. FATIGUE MANAGEMENT PROTOCOLS The management of fatigue via restricted deployment lengths and specified rest periods was an
area that differed between agencies.
There was a level of consistency in the standard shift length being scheduled, which is 12 hours.
Shifts can be extended to 14 or 16 hours (excluding first attack) with varying levels of approvals
depending on the agency. Rest breaks in between shifts are also agency specific however are
generally a minimum of eight hours, this may increase depending on how long the previous shift
was.
Deployment lengths vary from anywhere between four to seven days plus travel on either side.
Rest days between deployments are generally two days minimum.
Managing the length of deployments should be considered well before the departure to ensure
that adequate rest is provided between shifts and deployments.

AFAC18: PROCEEDINGS FROM THE BUSHFIRE AND NATURAL HAZARDS CRC & AFAC CONFERENCE 2018 | REPORT NO. 367.2018
209
9. HYDRATION POLICIES The management of hydration is consistently well managed by all agencies.
All agencies had available guidance which reaffirmed the requirement to manage hydration, and
included aids such as urine colour charts.
There is also the provision of ample water, electrolytes and meals available to staff to ensure that
they can stay well hydrated.
10. PERSONAL PROTECTIVE EQUIPMENT STANDARDS Personal protective Equipment (PPE) is relatively consistent between agencies.
11. MOBILE PLANT OPERATION AND MANAGEMENT The management and utilization of mobile plant is different depending on the agency and also
the environment they operate in.
Some agencies do not have an internal fleet of mobile plant and as such this is outsourced.
Contractors may be engaged from a central panel or register, or this may be managed locally.
Other agencies do have both an internal fleet and engage external plant from a well-established
and high-quality panel arrangement.
Operationally there are also differences in the expectations of how plant is managed. All plant is
expected to be accompanied by a water carrying appliance as an off-sider. However, only some
agencies dictate that Roll Over Protective Structures (ROPS) and Falling Object Protective
Structures (FOPS) are mandatory.
The variances in requirements in the management of both internal and external plant should be
considered when deploying staff to assist interstate and international agencies as there is potential
for staff to be working near mobile plant.
12. VEHICLE OPERATION AND MANAGEMENT The operation and management of vehicles is another element that differs amongst the agencies
that were reviewed.
All agencies had a minimum requirement for staff to hold a valid driver’s license for their State or
Country, however there were differences in the required levels of training thereafter. Some
agencies had no requirement for additional training, others had training that was not aligned to
National Units of Competency (NUC) and some had additional endorsements required to operate
a vehicle under lights and sirens.
The differences in requirements to operate vehicles should be considered on a case by case basis
when providing staff to other agencies for interstate or international deployments.
13. RADIO OPERATION Radios used by agencies consisted of either Motorola, Tait, Sargin or Simoco. Generally, an
induction is provided to the incoming agency to ensure they are familiar with their use.
General information on radio channels is provided during incoming inductions and is documented
specifically for each event in the Incident Shift or Incident Action plan.
14. HAND TOOLS AND EQUIPMENT OPERATION AND STANDARDS Hand tools and equipment that are used by agencies were similar and generally consisted of rake-
hoes, shovels, Pulaskis, chainsaws and other tools.
Staff are generally inducted on how to use the equipment or undergo formal training in their
operation prior to use.

AFAC18: PROCEEDINGS FROM THE BUSHFIRE AND NATURAL HAZARDS CRC & AFAC CONFERENCE 2018 | REPORT NO. 367.2018
210
STRENGTHS AND LIMITATIONS The methodology allows for a systematic review of safety and work systems in advance of
deployment requests that frequently transpire under intense pressure.
The method implemented is not a full audit of safety systems as implemented in field operations. It
is a desk based review of the doctrine and procedures of partner agencies to reveal differences
in approach to safe work systems between agencies and allow advance thought about where
we might target additional mitigations and controls for FFMVic personnel when deployed under
another agency’s control.
Aircraft operations were excluded in the initial review because it was considered that national
processes were in place to manage aviation safety. However, future risk assessments may need to
consider how aircraft operations interact with ground crews and the processes involved across
agencies.
This advanced thinking and application of a systematic review has led to additional mitigations
and control measures being implemented for FFMVic personnel whilst away on recent interstate
and international deployments.
CONCLUSION
Some high-level challenges have been identified by the study:
1. Challenges of different cultural approaches to safety and safe work systems between
agencies.
2. The reliance on and use of dynamic risk assessment rather than documented safe work
systems.
3. How to get nationally consistent approaches to safety and wellbeing that facilitates
sharing of personnel resources between agencies under times of duress. An example of
this under development is the AFAC led national process for hazardous tree management.
4. In addition to incident reporting, there is a need for improving reporting of near-misses and
hazards in the field to better understand real risks in the landscape and between different
geographies in Australia and internationally.
5. There is a need for some critical roles for any interstate and international deployment
including:
a. strengthening the role of the FFMVic liaison officer to include specific safety and
wellbeing responsibilities; and,
b. potential need to deploy home agency safety officers.
This methodology is a starting point and is not exhaustive. Any deployment and the taskings
required are unique to that specific incident or event. Therefore, the methodology and risk
assessment needs to be undertaken at the point of any deployment. However, by comparing
safety systems in advance, the deployment risk assessment is truncated to changes and marginal
differences specific to that deployment or to capture any changes in safety systems since the initial
assessment.
The methodology presented has been written up to support future interstate and international
deployments. It is published in the FFMVic Bushfire Management Manual 2 Preparedness as a
Standard Operating Procedure and supporting work instructions:
• 2.7.2 SOP – Interstate and International Deployments – Outbound
• 2.7.2.1 WI – Interstate and International Deployments – Safety Systems Comparison
• 2.7.2.2 WI – Interstate and International Deployments – Risk Assessment

AFAC18: PROCEEDINGS FROM THE BUSHFIRE AND NATURAL HAZARDS CRC & AFAC CONFERENCE 2018 | REPORT NO. 367.2018
211
COMMUNITY STRATEGY DEVELOPMENT FOR REDUCING EARTHQUAKE RISK IN WESTERN
AUSTRALIA
Non-peer reviewed research proceedings from the Bushfire and Natural Hazards
CRC & AFAC conference
Perth, 5 – 8 September 2018
Stephen Gray1,3. Paul Martin5, Mark Edwards1,2, Mike Griffith1,4, Hossein Derakhshan1,4 1 Bushfire and Natural Hazards CRC
2 Geoscience Australia 3 Department of Fire and Emergency Services WA
4 The University of Adelaide 5 Shire of York
Corresponding author: [email protected]

AFAC18: PROCEEDINGS FROM THE BUSHFIRE AND NATURAL HAZARDS CRC & AFAC CONFERENCE 2018 | REPORT NO. 367.2018
212
ABSTRACT
While the earthquake hazard in Australia is generally low by world standards, its severity does
include higher hazard in some regions. This is the case in the Yilgarn region east of Perth as
highlighted by the 1968 Meckering Earthquake and the observed seismic activity of the region in
the last seventy years. Where building construction has not considered earthquake hazard the risk
to communities can be significant. This is an issue for the township of York which is WA’s oldest
inland settlement and has a high proportion of heritage buildings that are vulnerable to
earthquake. The presence of high risk buildings of this type is a challenge for local government,
emergency management and other government agencies with a role in community recovery
after disasters. In the Bushfire and Natural Hazards CRC (BNHCRC) a project called Cost-effective mitigation
strategy development for building related earthquake risk is developing information on cost
effective strategies for retrofitting vulnerable buildings. The project scope has been augmented
to examine the effectiveness of a range of strategies for addressing high risk structures. This is a
collaborative study involving a partnership approach between state and local government along
with academic and government researchers under the BNHCRC. The project will utilise the
mitigation approaches developed by the CRC within a range of potential roll-out options to
virtually retrofit the town of York. The net benefits of each will be assessed considering avoided
damage, impacts on occupants, lost rental income, and disruption to business activity and
households.
In this presentation the motivation for this collaborative effort will be discussed in the context of an
improved understanding of natural hazard risk in WA, the increasing focus on investing in risk
mitigation as opposed to response and recovery, and the shared interest of both State and Local
government to promote resilience in vulnerable communities. The outcomes of a broad
stakeholder workshop convened in York on the 9th August 2018 will be described in which strategies
for providing incentives for risk reduction were identified. The importance of risk information in
informing property owners and communities is discussed and the need to address their
apprehension in addressing vulnerability with heritage listed structures. Finally, the value of broader
measures of avoided community impacts beyond the direct monetary in decision making is
highlighted and the linkages being made to another BNHCRC project called Economics of natural
hazards that will enable intangible (non-market) values to be included in a quantitative manner.

AFAC18: PROCEEDINGS FROM THE BUSHFIRE AND NATURAL HAZARDS CRC & AFAC CONFERENCE 2018 | REPORT NO. 367.2018
213
REDUCING BUSHFIRE RISK TO VULNERABLE COMMUNITY
MEMBERS THROUGH HEALTH AND COMMUNITY SERVICES AGENCIES – BUSINESS CONTINUITY APPROACH
Non-peer reviewed research proceedings from the Bushfire and Nat ural Hazards
CRC & AFAC conference
Perth, 5 – 8 September 2018
Suzanne Blyth
Department of Fire and Emergency Services
Corresponding author: [email protected]

AFAC18: PROCEEDINGS FROM THE BUSHFIRE AND NATURAL HAZARDS CRC & AFAC CONFERENCE 2018 | REPORT NO. 367.2018
214
INTRODUCTION
The Department of Fire and Emergency Services’ (DFES) At Risk Communities
Program was developed as a result of findings from the 2009 Victorian Bushfire
Royal Commission and the Keelty Inquiry into the 2011 Perth Hills Bushfires.
Both the Royal Commission and Inquiry identified service gaps around people
considered most vulnerable (being at risk) in a bushfire, and a need to address
this gap. The At-Risk Communities program targets vulnerable members of the
community who may be at greater risk of injury or death due to their inability to
receive, understand or act on information during a bushfire emergency. It aims to
address the gaps in service delivery by targeting the ageing population and those
living with disabilities who live in their own homes that may be considered
vulnerable due to the above. The program’s purpose is to help at risk people to
be better prepared for bushfire emergencies, by working with the Health and
Community Services Agencies (Agencies) that provide a critical link to these
community members, who often live in isolation.
While DFES recognises that Agencies and their staff are a trusted conduit for
bushfire preparedness information, there are also significant challenges that limit
an Agency’s involvement in a client’s bushfire preparedness. To achieve a
greater buy-in from Agencies, DFES has worked with the Chamber of Commerce
and Industry WA (CCIWA) to develop Guidance and Program Resources that suit
industry needs.

AFAC18: PROCEEDINGS FROM THE BUSHFIRE AND NATURAL HAZARDS CRC & AFAC CONFERENCE 2018 | REPORT NO. 367.2018
215
EXTENDED ABSTRACT
CHALLENGES
When first piloted in 2014 and subsequently implemented in 2015, the At-Risk
Communities Program consisted of Agency training that was available in two
formats:
• A face-to-face workshop that was 3 hours in duration and had a
geographic focus on high bushfire risk areas and;
• An online training module that took approximately 30 minutes to complete.
The objective of the training was to ensure that Agencies were:
• Familiar with DFES’ advice, concepts and terminology
• Knew how to access and use DFES resources
• Aware of the questions they may be asked by clients on bushfire
preparedness, and where to get assistance
• Aware of their role in providing assistance to clients and the limitations to
their assistance in a bushfire emergency.
Through regular monitoring and evaluation of the program, a number of
recommendations for improvement were identified including the need to consider
changes to the sector in relation to the introduction of new funding models for
Agencies and clients.
INDUSTRY CHALLENGES
There have been a number of significant challenges for organisations to
participate in the At-Risk Communities program. It was paramount for DFES to
understand the care industry from the perspective of both upper, Occupational
Health and Safety and risk managers who manage staff training priorities and
budgets, as well as on-the-ground staff who are driving and providing care for
clients in high bushfire risk areas.

AFAC18: PROCEEDINGS FROM THE BUSHFIRE AND NATURAL HAZARDS CRC & AFAC CONFERENCE 2018 | REPORT NO. 367.2018
216
The main challenges as communicated by industry included:
• The introduction of Consumer Direct Care (CDC) in July 2015 and a shift from
state government funding to commonwealth government funding in 2016
(National Disability Insurance Scheme - NDIS) has greatly impacted the
program’s level of buy-in.
The introduction of CDC and NDIS has seen dramatic changes to the industry
which have led to huge pressures on organisations to compete for their
funding and clients – further limiting their capacity/interest to undertake
training.
• Care organisations have limited funding and resources to pay staff to attend
training
While DFES do not charge an organisation to participate in the training,
organisations do need to pay their direct carers (who are generally paid by
the hour) to attend. With so many changes and uncertainty in the care
industry, many organisations have held off committing to the training until their
organisations “general business” changes are complete.
In 2016, top-up funding that the government provided (which seems to be a
standard for all HACC providers) was not distributed. This was an amount that
was not guaranteed, but often relied upon by organisations. Many
organisations did not have the extra funding available to pay staff overtime to
participate in training, in particular coming to the end of the financial year.
• Time poor service providers
Service providers who completed the 3 hour training often felt they needed to
pass on all information to their clients (not just the client specific information)
and believed they did not have the time to do this. Developing tailored
resources for both service providers and clients would address this.
AFAC18: PROCEEDINGS FROM THE BUSHFIRE AND NATURAL HAZARDS CRC & AFAC CONFERENCE 2018 | REPORT NO. 367.2018
217
• DFES’ At-Risk Training often raised more questions for staff about their own
organisation’s policies and procedures for creating a safe working
environment for both staff and clients. Often, smaller organisations in
particular did want to adopt processes for staff to follow, but weren’t sure
where to start.
Staff were asked at the training which policies and procedures their
organisation followed in the event of a bushfire emergency. Most staff were
generally unclear about their own organisation’s processes. It was identified
that this would work best if it was communicated and discussed prior to the
training, and gaps identified before staff attended training.
• Face to face workshops ran for three hours. This was a barrier for both staff
and organisations to participate
The training covered information that wasn’t always relevant for all
participants. This created a long training session for all instead of breaking
relevant information down for different participants (such as OHS/Upper
Level, Client Managers, and Direct Carers).
Through Industry consultation, a review recommended a business continuity
approach in emergency management to ensure a greater buy-in by Agencies, to
at-risk bushfire preparedness.
PROGRAM DIRECTION
Based on recommendations from reviews and evaluations of the At-Risk
Program, it was revised to focus on assisting organisation to ensure business
continuity in a bushfire emergency.
It was determined that developing workplace guidelines and supporting
educational resources that promote business continuity processes and greater
staff awareness would increase the uptake by organisations – many of whom
don’t understand the bushfire risk to their direct care workers and clients located
in bushfire risk areas.

AFAC18: PROCEEDINGS FROM THE BUSHFIRE AND NATURAL HAZARDS CRC & AFAC CONFERENCE 2018 | REPORT NO. 367.2018
218
The revised program focuses on firstly increasing the bushfire risk knowledge of
upper level, OHS and client managers, and includes access to training resources
that they can use to educate and train their staff.
The business continuity framework (in emergency management) will looks at the
following process:
WHAT’S IN IT FOR ME?” – CARE INDUSTRY

AFAC18: PROCEEDINGS FROM THE BUSHFIRE AND NATURAL HAZARDS CRC & AFAC CONFERENCE 2018 | REPORT NO. 367.2018
219
At a time when organisations are competing for funding, clients and retention of
staff, simply offering a program that can “better educate and enable their clients
and staff to be better prepared for an emergency” isn’t enough.
As a result, DFES worked with the Western Australian Chamber of Commerce
and Industry (CCIWA) to link the program’s resources and information back to
relevant WA’s Occupational Safety and Health laws (OSH) and care industry
policies and procedures – this encourages greater buy-in from organisations who
are trying to keep and/or gain accreditation from their overarching funding bodies.
It is expected that the uptake by organisations in the revised program will be
greater due to the development and extensive promotion of simple and user
friendly processes and templates for organisations to embed into their own
policies and procedures. In addition, a range of role specific, self-paced training
and resources for staff, and tailored resources for clients and their families will
contribute to the uptake of the program.
The revised program:
• Works with organisations to ensure they understand relevant OSH laws and
care industry policies and procedures relating to both staff and clients living
and working in high bushfire risk areas
• Ensures organisations have a clear understanding of their own organisation’s
current policies and procedures (in this space) and provides advice to those
with any gaps
• Includes a range of self-paced education and awareness tools/resources to
suit the needs of the different audiences (i.e. upper management, client
managers and direct carers)
• Includes tailored tools, templates and information around workplace
processes for organisations to
- easily capture their client’s bushfire plan information
- communicate with staff, clients and client families
- communicate with staff around bushfire risk areas and what to do in
the event of a bushfire emergency.

AFAC18: PROCEEDINGS FROM THE BUSHFIRE AND NATURAL HAZARDS CRC & AFAC CONFERENCE 2018 | REPORT NO. 367.2018
220
PARTNERSHIP WITH CHAMBER OF COMMERCE AND INDUSTRY WA
Having developed a Business Continuity and Disaster Recovery Workbook,
CCIWA were identified as a valuable partner in developing guidance documents
that would be suitable for Agencies from a business continuity perspective.
Having the existing knowledge of business continuity best practice, CCIWA
provided advice on employer legislative obligations in an emergency,
responsibilities under OSH Laws and existing guidance in place on assisting
businesses with how to identify high-risk hazards to their business. In
collaboration with CCIWA, DFES produced an Agency Guide to assist Agencies
in preventing injury or illness to their Direct Care Workers and clients from the
effects of a bushfire when working in a client’s homes. It will also assist Agencies
to prepare for and respond to bushfire emergencies affecting their in-home
clients. Implementing the processes of the Agency Guide forms part of business
continuity planning that helps Agencies prepare for a disruptive event.
The success of the At-Risk Communities Program relies heavily on Agencies’
participating. It requires their commitment to sharing the responsibility to assist
in-home clients to be better prepared for bushfires, in turn, reducing the risk from
exposure to bushfire emergencies to Direct Care Workers assisting clients in their
homes. If an Agency is aware that the client’s home is in a bushfire risk area, they
must then have systems in place for their Direct Care Worker to understand the
risks attributed to them when working in or travelling to that home. This result
must then be recorded and managed by the Agency/Client Manger, and be
available to all Direct Care Workers attending to the client in their home.
Collecting this information should be considered as part of a client’s initial OSH
assessment.
To ensure that the At-Risk Communities Program and its resources are used and
valued by Agencies, DFES will be implementing an extensive marketing and
communications strategy. This will raise the awareness amongst Agencies of
their responsibilities from an OSH perspective, but also highlight the critical link

AFAC18: PROCEEDINGS FROM THE BUSHFIRE AND NATURAL HAZARDS CRC & AFAC CONFERENCE 2018 | REPORT NO. 367.2018
221
that they provide to some of the most at-risk members of our community. The
benefits to Agencies is not only the assistance they provide to their in-home
clients, but also the health and safety of their workers and the continuity of their
core business during an emergency. DFES will continue to monitor and evaluate
the At-Risk Communities program to ensure that it is meeting the needs of
Agencies and evolves to be reflective of industry requirements.
.

AFAC18: PROCEEDINGS FROM THE BUSHFIRE AND NATURAL HAZARDS CRC & AFAC CONFERENCE 2018 | REPORT NO. 367.2018
222
TRANSFORMATIVE CULTURE OF DISASTER RISK MANAGEMENT AS
AN ENABLER TO RESILIENCE
Non-peer reviewed research proceedings from the Bushfire and Natural Hazards
CRC & AFAC conference
Perth, 5 – 8 September 2018
John Rolfe
Queensland Fire and Emergency Services
Corresponding author: [email protected]
AFAC18: PROCEEDINGS FROM THE BUSHFIRE AND NATURAL HAZARDS CRC & AFAC CONFERENCE 2018 | REPORT NO. 367.2018
223
ABSTRACT
Queensland Fire and Emergency Services (QFES) reviewed international disaster
risk methodology with the view to developing a fit for purpose application that
could be applied at the local as well as State level and would literally inform risk-
based planning. The review focused on the three international tenants of disaster
risk management: avoiding the creation of new risk; reducing existing risk; and
managing residual risk. This review also specifically examined vulnerability
assessment, determining residual risk and prioritisation for planning across the
three levels of government that comprise Queensland’s Disaster Management
Arrangements.
Subsequently QFES developed the Queensland Emergency Risk Management
Framework (QERMF) and undertook a concept trial of this risk methodology. In
conjunction with the maturation of the methodology, QFES is leading a
supported integration program. The supported integration program facilitates
collaborative risk workshops aimed at supporting Local Disaster Management
Groups and District Disaster Management Groups to undertake the QERMF
approach to complete their disaster risk assessments holistically.
As Queensland matures its approach to disaster risk management some key
themes need to be considered collectively to assist those involved with
managing risk on a broad scale and within systems of government. These are:
• scientifically led understanding of hazard characteristics and their
associated impacts;
• exposure and vulnerability assessments of broad areas and the essential
infrastructure systems;
• linking disaster risk management with emerging industry pressures; and
• linking risk assessments to planning.
Key benefits in embracing an approach similar to the QERMF will enhance:
• community shared awareness of risk;
• the interconnectedness of systems;
• collaborative problem solving; and
• risk-based planning and the management of residual risk.
QFES is continuing to mature the QERMF approach and is undertaking research
currently to refine assessments across socio-natural and anthropogenic hazards.

AFAC18: PROCEEDINGS FROM THE BUSHFIRE AND NATURAL HAZARDS CRC & AFAC CONFERENCE 2018 | REPORT NO. 367.2018
224
INTRODUCTION
Queensland Fire and Emergency Services (QFES) has responsibility under the
Queensland State Disaster Management Plan to prepare the State Natural
Hazard Risk Assessment. In addition, all Australian States and Territories agreed
via the Law, Crime and Community Safety Council to conduct State level risk
assessments by 30 June 2017 for collaboration and discussion at the national
level. Leading up to the requirement, QFES had been extensively reviewing
international best practice in natural hazard risk assessment. This research led to
the development of a methodology, the Queensland Emergency Risk
Management Framework (QERMF). The QERMF harnesses scientific data relating
to each hazard and uses geospatial information systems to analyse historical
and/or projected impacts to identify exposures, vulnerabilities and subsequently
risk. Such a complex task required novel approaches and methods, and perhaps
most importantly, a progressive mindset (QFES 2017a).
The QERMF also promotes sense-checking between scientific data, mapping
and modelling with local knowledge during the risk analysis stage, which is of
paramount importance. A proof-of-concept was assessed at the Disaster District
level across Queensland in 2016 and this methodology was found to be effective
in the identification of risk and, more specifically, in the identification of residual
risk (QFES 2017a).
In November 2016, the Queensland Disaster Management Committee endorsed
the continued development of the QERMF methodology to facilitate enhanced
risk-based planning so that we may better prevent, prepare for, respond to and
recover from disaster events. Concurrently, in 2016 the United Nations Office for
Disaster Risk Reduction (UNISDR) commissioned the development of guidelines
on National Disaster Risk Assessment as part of a series of thematic guidelines
under its “Words into Action” initiative to support implementation of the Sendai
Framework for Disaster Risk Reduction 2015-2030. The guidelines, to which
Queensland contributed, are the result of the collaboration between more than
100 leading experts from national authorities, international organisations, non-
governmental organisations, academia, think tanks and private-sector entities
(QFES 2017b).
The QERMF focuses on the Sendai Framework’s first and second priorities for
action. Like the United Nations Words in Action guidelines, the QERMF is intended
to provide consistent guidance in understanding disaster risk that would act as a
conduit for publicly available risk information and action. This approach would
also assist in the establishment and implementation of a framework for
collaboration and sharing of information in disaster risk management, including
for risk-informed disaster risk reduction strategies and plans. The QERMF
encourages holistic risk assessments that provide an understanding of the many
different dimensions of disaster risk (hazards, exposures, vulnerabilities, capability
and capacities). The assessments would include diverse types of direct and
indirect impacts of disaster, such as physical, social, economic, environmental
and institutional. Both the United Nations ‘Words into Actions’ Guideline and the
QERMF will take several years to mature. However, by keeping abreast with
scientific and technological advancements and by also remaining connected
AFAC18: PROCEEDINGS FROM THE BUSHFIRE AND NATURAL HAZARDS CRC & AFAC CONFERENCE 2018 | REPORT NO. 367.2018
225
at the local level, they are achievable and will produce tangible enhancements
to the safety and resilience of the community (QFES 2017a).
SCIENTIFICALLY LEAD UNDERSTAND OF HAZARD CHARACTERISTICS AND THEIR ASSOCIATED IMPACTS
The Disaster Risk Management Knowledge Centre (DRMKC) of the European
Union acknowledges that a greater focus on transformative processes is
essential to improve our understanding of disaster risk. Cross sectoral
partnerships and networks are required to improve the better use and uptake
of research and knowledge including innovative tools and practices for risk
management. Organisations such as the DRMKC, the Australian Bureau of
Meteorology, Commonwealth Science Industrial Research Organisation
(CSIRO) and Geoscience Australia lead and or support the translation of
complex scientific data and analyses into usable information and provide
science-based advice regarding the use of hazard characteristic
data/information optimally within risk assessments. The approach adopted
within the QERMF deliberately harnesses innovative practices in the
communication of scientific outputs that contribute to the management of
disaster risks at a jurisdictional and local level (Poljansek, Marin Ferrer, De
Groeve & Clark 2017).
Presenting scientifically based hazard characteristics in a format that is
understandable, relevant and useful to the stakeholders is paramount to the
success of a risk assessment. It is important to reemphasize that exposure and
vulnerability information drive the true understanding of impacts, risks and
consequences (Global Facility for Disaster Reduction and Recovery 2014). The
World Bank, through the Global Facility for Disaster Reduction and Recovery,
have also noted that innovation and collaboration are necessary to improve the
translation of technical information into transferable and useful information for
decision makers and practitioners (United Nations Institute for Disaster Risk
Reduction 2017).
More hazard data and models are available for identifying, analysing and
managing risk and risk data generally is increasingly becoming more freely
available as part of a global trend toward open data (Global Facility for Disaster
Reduction and Recovery 2014). This is evidenced jurisdictionally and with recent
focus on risk information by the recently formed National Resilience Taskforce.
Risk information is often sensitive information as it requires government, private
sector, communities and individuals to decide on action to reduce the impacts
of a potential hazardous event. One such example would be the consideration
to relocate a community from a flood plain. The chance of risk information
translating into action depends to a large extent on sensitive negotiations.
(Global Facility for Disaster Reduction and Recovery 2014)
In addition to the scientific inputs, effective natural disaster risk assessment
requires consultation, engagement and contribution from a wide range of
stakeholders. Many of whom are owners of risk and in positions to manage that
risk. As each has a different and often conflicting understanding of disaster risk,
they communicate disaster risk information differently, have different

AFAC18: PROCEEDINGS FROM THE BUSHFIRE AND NATURAL HAZARDS CRC & AFAC CONFERENCE 2018 | REPORT NO. 367.2018
226
organisational and legal requirements, and different levels of financial resources
to engage within disaster risk assessments (United Nations Office for Disaster Risk
Reduction 2017). The QERMF assessment method very deliberately steps through
how hazards manifest within an area of interest both spatially and temporally.
This is of importance for practitioners to understand hazard manifestation in this
manner as it can significantly assist in developing graduated mitigation options
and assist in developing and maintaining situation awareness of disaster
management groups during actual disaster events.
Arguably, an aspect of change management the QERMF is addressing relates
to a compliance driven culture of practice. A culture of practice has developed
over time whereby practitioners would begin their assessments by generating a
list of risks then focus on the intersecting axis of likelihood and consequence
matrices to then list risk treatments/controls in registers. The word ‘control’ is often
overused regarding risk management because it can convey the wrong
message. It implies that complex situations can be more easily controlled that
what they can be. But this can sometimes be a dangerous oversimplification.
With regards to controlling nature often the best treatment options will aim to
create a set of conditions that improves the probability that a desirable rather
than an undesirable outcome will occur. Alberts (2007) notes that control is an
emergent property, not a simplistic risk treatment selection.
Operationalised risk assessment is focussed on understanding disaster risk through
more detailed understanding of hazard characteristics and exposure and
vulnerability analysis. The analysis provides insight into the interaction of single
and or multi-hazards with all elements of exposure such as essential infrastructure,
access/resupply, community and social, medical, significant industries and
environment then subsequently examines the vulnerability of those elements
across both spatial and temporal dimensions (QFES 2017b).
All natural disasters, but cascading disasters in particular, have serious
implications that can be overlooked in risk assessments due to a lack of scientific
understanding of the manifestation and interaction of multiple hazards.
Unfortunately, modelling such complex phenomena requires a significant
amount of data and complex modelling tools and expertise, which often makes
it impractical or not financially viable to conduct as common practice.
Nevertheless, possible cascading effects of major hazards should be explicitly
sought but with rapidly advancing technology the difficulty may well lay in
discerning which is the most appropriate to use (United Nations Office for Disaster
Risk Reduction 2017).
QFES staff facilitating the QERMF assessments deliberately and regularly liaise
with scientific organisations to improve their own knowledge but to also keep
abreast of the advancements with analysis, mapping and modelling for use
within risk assessment processes. This information is then shared with all
stakeholders such as emergency managers, government and nongovernment
organizations, the private sector and community members. This approach also
assists the scientific organisations who obtain a greater understanding of priority
information requirements with regards to disaster risk reduction decision making.

AFAC18: PROCEEDINGS FROM THE BUSHFIRE AND NATURAL HAZARDS CRC & AFAC CONFERENCE 2018 | REPORT NO. 367.2018
227
EXPOSURE AND VULNERABILITY ASSESSEMENTS OF BROAD AREAS AND ESSENTIAL INFRASTRUCTURE SYSTEMS
Another component of disaster risk assessment this paper will discuss is
understanding the availability and or effectiveness of existing capability and
capacity for managing the risk. Understanding the inherent risk associated with
hazard manifestation through science is a pivotal first step and then assessing the
availability of fit for purpose local capability and the capacity of that capability
is critical for identifying residual risk. This is the crux of Queensland’s Disaster
Management Arrangements – local government have primary responsibility for
the management of disaster with support provided by Disaster Districts and or
the State upon request for assistance as per the Disaster Management Act 2003.
Visibility of the support requirements is obtained through the identification of
residual risk within QERMF assessments and passed through the governance of
Local Disaster Management Groups to District Disaster Management Groups
then to the State and Commonwealth if required (QFES 2018).
One critical aspect of disaster risk that may or may not be able to be managed
at a local level pertains to addressing the vulnerabilities inherent within our
infrastructure and associated systems and networks. This must be addressed in a
proactive manner as what further exaggerates the complexities of infrastructure
is that they are highly interconnected and mutually dependent (Johansson
2010). Arguably, the increasing interconnectedness amoung infrastructure
systems have made them more vulnerable. Once the systems are disturbed by
external shocks and or failures they can spread rapidly to other infrastructure
networks which may in turn lead to broad system failure (Wang, Hong & Chen
2012).
When assessing broad areas such as a local government area, interdependent
infrastructure systems vulnerability analysis becomes increasingly important.
Vulnerability and disruption related risk analysis are basic tools for infrastructure
owners and operators when assessing their own systems however the application
of the impacts to broader society varies considerably between sectors. Broad
area risk analysis requires an interdisciplinary and cross institutional perspective
(Wang, Hong, Chen, Zhang, & Yan 2011).
Therefore, broad area risk assessments must seek out inter-dependent features
of the infrastructure systems that are within, intersect and or effect the area of
interest (Wang, Hong & Chen 2012). The modelling from the real system to its
representation is a crucial step prior to conducting a risk assessment. Modelling
is important from a systems-based view which focuses on how the system itself
may fail and the other is the event-based view which considers the effect of the
severity and frequency of events (Kamissoko, Peres, Zarate & Gourc 2015).
Owners and operators of critical/essential infrastructure are specifically
requested to attend QERMF assessments and or to contribute pre/post workshop
at a minimum as their expertise is pivotal in not only understanding impact and
risk but also in determining viable solutions and risk treatment strategies both for
short and longer-term planning horizons.

AFAC18: PROCEEDINGS FROM THE BUSHFIRE AND NATURAL HAZARDS CRC & AFAC CONFERENCE 2018 | REPORT NO. 367.2018
228
LINKING DISASTER RISK MANAGEMENT WITH EMERGING INDUSTRY PRESSURES
It is important to define the time horizon to be considered in natural hazard risk
assessments. The selection of a time-horizon depends on the type of decisions
that rely on the risk assessment outputs. Disaster risk assessments may not have a
time horizon stipulated however are to be reviewed annually. Some
preparedness and emergency management plans, whilst also reviewed
annually, often address a time horizon of three to five years. A disaster risk
assessment process that informs development planning should use longer time
horizons, especially in the context of understanding longer-term risk trends from
population growth and urbanization. A longer time horizon is especially critical
when it comes to evaluating the benefits of investment in new development and
in reducing vulnerability of infrastructure (United Nations Office for Disaster Risk
Reduction 2017). The Queensland Government State Planning Policy 2017 does
endeavour to address longer term horizons with state interests and strongly links
to natural hazard risk assessment processes.
Recent developments proving to be most pressing with regards to changing risk
assessment approaches is the requirement to address climate risk. Recent
guidance from the Australian Prudential Regulation Authority identified climate
risks as distinctly financial in nature with many risks foreseeable and actionable
now (Wilder, Venuti & Chatterjee 2017). One facet demanding attention from
government and business alike is the threat of climate litigation. Wilder, Venuti &
Chatterjee (2017) note that there is an increasing trend in litigation concerning
climate risk disclosure. It is conceivable that company directors who fail to
consider climate change risks, could be found liable for breaching their duty of
care and diligence in the future (Wilder, Venuti & Chatterjee 2017). With the
actioning of climate risk initiatives such as Queensland’s Climate Adaptation
Strategy, and whilst concurrently facilitating natural hazard risk assessments it has
become apparent that some risk practitioners are having difficulty distinguishing
climate change from climate variability.
Understanding the difference between climate variability and climate change
projections is a key point of clarification at present to ensure natural hazard risk
assessments and climate risk assessments are complementary and not
conducted in siloes. Climate projections are a necessary assessment and
planning tool, the distinction with climate variability, particularly when using
projections to make plans for the next 10–20 years must be taken into
consideration. Informed natural hazard risk assessments consider climate
variation, the complementary aspect of climate change assessments is assisting
risk practitioners understand how climate change is affecting the manifestation
of natural hazards in addition to climate variation. This is distinctly a gap in
understanding which QERMF is seeking to address through close collaboration
with the scientific community and to then communicate this information in a
relatable form to stakeholders through initiatives such as the recently completed
Emergency Management Sector Adaptation Plan (QFES 2018).
When using climate projections to 2030, the CSIRO (2018) through the Earth
Systems and Climate Change Hub note it is important to:

AFAC18: PROCEEDINGS FROM THE BUSHFIRE AND NATURAL HAZARDS CRC & AFAC CONFERENCE 2018 | REPORT NO. 367.2018
229
• understand climate variability;
• understand the range of projections – use the Climate Futures tool to
explore ranges of change for the relevant climate variables; and
• put variability and change in perspective, and what this means for the
area of interest that is the subject of the disaster risk assessment.
LINKING RISK ASSESSMENTS TO PLANNING THROUGH COLLABORATIVE PROBLEM SOLVING
Conducting risk assessments and planning to address complex endeavours can
be seen through the lens of participating stakeholders and or from the
perspective of the endeavour as a whole. When considering an endeavour, the
tendency is to impose a solution on others (Alberts 2007). This is evidenced with
some historical risk assessment efforts being driven from a top down perspective
but failing to convert to reciprocation at a local level other than compliance-
based outputs versus truly useful information with a clear line of sight through
hazard – exposure – vulnerability – risk and the generation of risk-based plans.
The disaster risk assessment process requires an apolitical lens – the focus of
bringing individuals and organisations together and leveraging the available
information and expertise to create synergies toward action that may otherwise
not be attainable (Alberts 2007). How a collective achieves focus and the
degree to which that focus has been successful is evidenced through the
creation of common intent and its transformation into coordinated action.
Arguably, there is not only one ‘right’ approach to constrain our thinking and the
risk assessment processes employed. The successful application of focus is not
associated with a particular profession nor policy agenda and should be free
from any baggage that this may entail (Alberts 2007).
Cognitive biases play an important role in any human endeavour. We focus on
our goals, anchor our plans and neglect relevant information which give rise to
a raft of unconscious bias giving greater rise to what is referred to as the planning
fallacy (Kahneman 2011). In explaining the past, and more so in predicting the
future it is difficult to think beyond our own frames of reference and we are prone
to the illusion of control because we have worked through ordered processes,
our risk registers/reports are neat and colourful and seem very logical. The main
obstacle is that subjective overconfidence is determined by the coherence of
the stories we tend to construct, not necessarily the quality and amount of
information and scientific evidence that supports it (Kahneman 2011). Best
practice risk assessment aspired to by QERMF seeks a convergence between the
stories embodied at a local level with the most contemporary scientific
information that is fit for purpose.
Convergence, when combined with focus it is about moving in the right direction
both as individual entities and as a collective. Most significantly convergence
does not imply control of one entity by another (Alberts 2007). Disaster risk
assessments need to be recognised for what the endeavour is, collaborative

AFAC18: PROCEEDINGS FROM THE BUSHFIRE AND NATURAL HAZARDS CRC & AFAC CONFERENCE 2018 | REPORT NO. 367.2018
230
problem solving. Within collaborative problem-solving individuals pool their
understanding and effort and work together with common intent toward a
stated purpose or goal. Collaboration has distinct advantages over individual
organisational problem solving because it allows for:
• effective division of labour;
• incorporation of information from multiple perspectives, experiences and
sources of knowledge; and
• enhanced creativity and quality of solutions stimulated by the ideas of
other group members.
Bringing different stakeholders together is vital but is an insufficient condition for
true collaborative problem solving because some social interactions do not
involve commitment to shared goals, the accommodation of different
perspectives and or sustained commitment over time to achieve the stated
goals (Organisation for Economic Cooperation and Development 2015).
Collaboration from the perspective of problem solving can be defined as the
activity of working together towards a common goal, in this instance is the
conduct of natural hazard risk assessments. There are several elements included
in the definition. The first element is communication, the second element is
cooperation which involves contributions to planning and problem analysis. A
third element is responsiveness, implying active and insightful participation
(Organisation for Economic Cooperation and Development 2015).
From this definition, collaborative problem-solving means approaching a
problem responsively by working together and exchanging ideas and is
particularly useful when problems are complex. Collaborative problem solving is
a joint activity where small groups within an appropriate authorising
environment transform current states into desired goal states. The difference
between individual and collaborative problem solving is that in collaboration
each of these steps is directly observable and actionable risk reduction plans
are produced (Hesse, Care, Buder, Sassenberg & Griffin 2015)

AFAC18: PROCEEDINGS FROM THE BUSHFIRE AND NATURAL HAZARDS CRC & AFAC CONFERENCE 2018 | REPORT NO. 367.2018
231
CONCLUSION
The conduct of Natural Hazard Risk Assessments such as within the QERMF can
be transformative and are a key enabler toward resilience. The use of
scientifically based hazard characteristics in a manner that is accessible to
stakeholders is paramount to the success of a risk assessment. Operationalised
risk assessments focus on understanding disaster risk through detailed hazard,
exposure and vulnerability analysis. Vulnerability analysis of exposed elements,
including infrastructure, across both spatial and temporal dimensions when
assessing broad areas such as a local government area is increasingly important
for shared understanding.
Time-horizons considered in natural hazard risk assessments are a key point of
clarification to ensure climate risk assessments are complementary and to also
discern climate variability from climate change when determining disaster risk.
The disaster risk assessment process requires an apolitical focus of bringing
individuals and organisations together and leveraging the available information
and expertise to create synergies that are otherwise not attainable to achieve
something that individuals and organisations on their own could not achieve.
Collaborative problem-solving means approaching a problem responsively by
working together and developing shared solutions which is particularly useful
when problems are complex. Collaborative problem solving is a joint activity
within an appropriate authorising environment that can transform current
problem states into desired goal states through the medium of risk assessment.
The role of QERMF facilitators is therefore one of transformational leadership.
Transformational leadership describes the ability of team members to secure the
commitment of stakeholders to work toward the attainment of goals, amongst
competing daily business as usual priorities, and take on the complex,
challenging, but ultimately rewarding endeavour that is natural hazard risk
assessment and risk-based planning. Such efforts are directly enabling a basis
from which future resilient communities emerge.

AFAC18: PROCEEDINGS FROM THE BUSHFIRE AND NATURAL HAZARDS CRC & AFAC CONFERENCE 2018 | REPORT NO. 367.2018
232
REFERENCES
Alberts, DS 2007, ‘Agility, Focus and Convergence: The Future of Command
and Control’, The International C2 Journal, vol. 1, no. 1, pp. 1-30.
Commonwealth Scientific and Industrial Research Organisation, 2018 Earth
Systems and Climate Change Hub. Available from:
https://www.csiro.au/en/Research/OandA/Areas/Assessing-our-climate/ESCC-
Hub
Global Facility for Disaster Reduction and Recovery 2014, Understanding Risk in
an Evolving World: Emerging Best Practices in Natural Disaster Risk Assessment,
TheWorld Bank.
Hesse, FW, Care, E, Buder, J, Sassenberg, K, & Griffin, P 2015, ‘A Framework for
Teachable Collaborative Problem-Solving Skills’ in P. Griffin & E. Care, (eds.),
Assessment and Teaching of 21st Century Skills, pp. 37-56. Springer: New York.
Johansson, J 2010, Risk and Vulnerability Analysis of Interdependent Technical
Infrastructures – Addressing Socio-Technical Systems, PhD thesis, Lund University.
Kahneman, D 2011, Thinking Fast and Slow, Penguin Books, Maryborough
Victoria.
Kamissoko, D, Peres, F, Zarate, P, & Gourc, D 2015, ‘Complex system
representation for vulnerability analysis’, International Federation for
Automatic Control-Papers Online, 48(3), pp. 948-953. Available from:
https://www.sciencedirect.com/science/article/pii/S2405896315004449
Organisation for Economic Cooperation and Development 2015, Collaborative
Problem- Solving Framework, available from:
https://www.oecd.org/pisa/pisaproducts/Draft%20PISA%202015%20Colla
borative% 20Problem%20Solving%20Framework%20.pdf
Poljansek, K, Marin Ferrer, M, De Groeve, T & Clark, I 2017 Science for Disaster
Risk Management 2017: Knowing Better and Losing Less, European Commission.
Queensland Fire and Emergency Services 2017a, Queensland State Natural
Hazard Risk Assessment, State of Queensland.
Queensland Fire and Emergency Services 2017b, Queensland Emergency RisK
Management Framework – Risk Assessment Process Handbook, State of
Queensland.
Queensland Fire and Emergency Services 2018, Emergency Management
Sector Adaptation Plan (EM-SAP) for Climate Change, State of Queensland.
United Nations Office for Disaster Risk Reduction 2017, Words into Action
Guidelines –National Disaster Risk Assessment, Governance System

AFAC18: PROCEEDINGS FROM THE BUSHFIRE AND NATURAL HAZARDS CRC & AFAC CONFERENCE 2018 | REPORT NO. 367.2018
233
Methodologies and Use of Results, viewed 30 June 2018,
https://www.unisdr.org/we/inform/publications/52828
Wang, S, Hong, L, & Chen, X 2012 ‘Vulnerability analysis of interdependent
infrastructure systems: A methodological framework’, Physica A: Statistical
Mechanics and its Applications, 391, pp. 3323-3335. Available from:
https://www.sciencedirect.com/science/article/pii/S0378437111009794
Wang, S, Hong, L, Chen, X, Zhang, J & Yan, Y 2011’Review of interdependent
infrastructure systems vulnerability analysis’, Proceedings of the 2nd International
Conference on Intelligent Control and Information Processing, pp. 446-451.
Available from:
https://ieeexplore.ieee.org/document/6008284/?reload=true
Wilder, M, Venuti, S, & McAdam, S 2017 Recommendations of the Task Force on
Climate-related Financial Disclosures – Review of Local Relevance Australia,
Baker McKenzie, viewed 1 July 2018, https://www.unpri.org/policy-and-
regulation/tcfd-recommendations-country-reviews--Australia/2886.article

AFAC18: PROCEEDINGS FROM THE BUSHFIRE AND NATURAL HAZARDS CRC & AFAC CONFERENCE 2018 | REPORT NO. 367.2018
234
IMPROVED PREDICTIONS OF EXTREME SEA LEVELS AROUND AUSTRALIA Non-peer reviewed research proceedings from the Bushfire and Natural
Hazards CRC & AFAC conference
Perth, 5 – 8 September 2018
Charitha Pattiaratchi1,2, Yasha Hetzel1,2, Ivica Janekovic1,2 1 Oceans Graduate School & UWA Oceans Institute, The University of Western Australia 2 Bushfire and Natural Hazards CRC
Corresponding author: [email protected]

AFAC18: PROCEEDINGS FROM THE BUSHFIRE AND NATURAL HAZARDS CRC & AFAC CONFERENCE 2018 | REPORT NO. 367.2018
235
ABSTRACT
IMPROVED PREDICTIONS OF EXTREME SEA LEVELS AROUND
AUSTRALIA
Charitha Pattiaratchi, Yasha Hetzel, Ivica Janekovic, Oceans Graduate School
& UWA Oceans Institute, The University of Western Australia, WA
The major hazard in coastal regions is inundation through extreme water levels generated in the ocean through different mechanisms such as storm surges and tsunamis or through a combination of effects such as a relatively small storm surge coinciding with high astronomical tides. With rising in sea level, given water levels will be exceeded more and more frequently as progressively less severe storm conditions are required to achieve that water level.
Therefore, it is critical that the exceedance probabilities of extreme water levels are accurately evaluated to inform flood and erosion risk-based management and for future planning. To address this concern, this study estimated present day extreme sea level exceedance probabilities due to storm surges, tides and mean sea level around the whole coastline of Australia through the application of a numerical model. The SCHISM hydrodynamic model, forced by TPXO tides and JRA55 atmospheric reanalysis (wind and air pressure), was successfully applied to produce a 59 year sealevel hindcast (1958-2016) for the entire Australian region. The outputs provide uninterrupted hourly sea level records at <1 km resolution around the Australian coast. Improvements compared to the previous Haigh et al. [1] dataset included: extending the hindcast by six years including several record storm surge events, higher spatial resolution, improved meteorological forcing, and 3-D hydrodynamic model implementation. Other physical processes, missing from earlier studies, were also examined in detail including: effects of surface gravity waves, continental shelf waves, and meteorological tsunamis.
Extreme value analysis was applied to the sea level data to predict Average Recurrence Intervals (ARI) at ~2km spacing around the entire Australian coastline including islands. These statistics and relevant plots and time series data have been made available to the public via an interactive web tool, providing a consistent, accessible, up-to-date dataset for use by coastal planners and emergency managers.

AFAC18: PROCEEDINGS FROM THE BUSHFIRE AND NATURAL HAZARDS CRC & AFAC CONFERENCE 2018 | REPORT NO. 367.2018
236
INTRODUCTION
The major hazard in coastal regions is inundation through extreme water levels generated in the ocean through different mechanisms such as storm surges and tsunamis or through a combination of effects such as a relatively small storm surge coinciding with high astronomical tides [2]. The impacts of seismic tsunamis (generated through underwater earthquakes) have been highlighted by the recent mega-tsunamis in the Indian Ocean (2004) and Pacific Ocean (2011). These events were accompanied by large loss of life and extreme damage to coastal infrastructure. Similarly, the effects of storm surges have had significant affects such as those due to major storms: Sandy in New York City [3], Haiyan in the Philippines [4], and Hurricanes Harvey, Irma, and Maria in the Caribbean during 2017 [5].
With rising sea levels, damaging water levels will be exceeded more and more frequently as progressively less severe storm conditions are required to achieve that water level [8]. In some coastal regions, extreme water levels could be amplified further by changes in storminess, such as more intense tropical cyclones, although there are still significant uncertainties regarding possible future changes in tropical and extra-tropical storm activity [9].
Therefore it is important that the exceedance probabilities of extreme water levels are accurately evaluated to inform flood and erosion risk-based management and for future planning—particularly for Australia where a majority of the population and infrastructure exist at the coast. Motivated by this need, this project built upon previous studies [1, 8] with the aim of producing more accurate estimates of present day extreme sea level exceedance probabilities due to storm surges, tides and mean sea level around Australia.
The SCHISM hydrodynamic model, forced by TPXO tides and JRA55 atmospheric reanalysis (wind and air pressure), was successfully applied to produce a 59 year sealevel hindcast (1958-2016) for the entire Australian region. The outputs provide uninterrupted hourly sea level records at <1 km resolution around the Australian coast. Improvements compared to previous the Haigh et al. [1] dataset included: extending the hindcast by six years including several record storm surge events, higher spatial resolution, improved meteorological forcing, and 3-D hydrodynamic model implementation. Other physical processes, missing from earlier studies that were also examined in detail included: effects of surface gravity waves, continental shelf waves, and meteorological tsunamis.
Analysis of the sea level data included application of Extreme Value Theory to predict Average Recurrence Intervals (ARI) at ~2km spacing around the entire Australian coastline including islands. These statistics and relevant plots and time series data have been made available to the public via an interactive web tool, providing a consistent, accessible, up-to-date dataset for use by coastal planners and emergency managers.
AFAC18: PROCEEDINGS FROM THE BUSHFIRE AND NATURAL HAZARDS CRC & AFAC CONFERENCE 2018 | REPORT NO. 367.2018
237
This extended abstract provides an overview of the methodology, including model setup, validation, extreme value analysis, and describes the final data available to the end-users and public.
METHODOLOGY
MODEL SETUP
Model Description We used the full 3D finite element hydrodynamic modeling system SCHISM [1, 2] has successfully simulated circulation and storm surges in a broad range of coastal environments [3-6]. Other applications of the model include tsunami inundation [7] oil spill [8], and ecological studies [9]. The model uses a semi-implicit finite element Eulerian-Lagrangian algorithm to solve the Navier-Stokes momentum equations and naturally incorporates wetting and drying of tidal flats. The numerical algorithm is stable, computationally efficient and does not suffer from numerical stability constraints (e.g. the Courant-Friedrich-Lewy (CFL) condition) that restrict the maximum allowable timestep, as is an issue in many other ocean modeling codes (e.g. ROMS, POM, ADCIRC) [1]. The benefits of using SCHISM for cross scale modeling are described in detail in [2]. An earlier version of SCHISM (previously named SELFE) was evaluated to have equal skill (both coupled/ uncoupled) compared to leading unstructured coastal hydrodynamic models (e.g., ADCIRC, FVCOM) for simulating water levels for a tropical cyclone in the Gulf of Mexico, and outperformed the official National Weather Service operational storm surge forecast SLOSH model that has a structured framework [10]. The SCHISM model was run in 3D mode, allowing for improved representation of vertical current structure, tide-current interactions, and improved storm surge predictions. The model was run with both tidal and atmospheric forcing resulting in 59-year hourly time series of total water levels over the entire domain. The total model domain included all oceanic waters surrounding Australia, spanning between 93.6oE to 171.5oE and -49.7oS to -7oS with a curved outer boundary (Figure 1). The horizontal spatial resolution of the unstructured triangular mesh grid increased from ~10 km in the open ocean to between 100 and 800m at the coast.

AFAC18: PROCEEDINGS FROM THE BUSHFIRE AND NATURAL HAZARDS CRC & AFAC CONFERENCE 2018 | REPORT NO. 367.2018
238
FIGURE 6. SCHISM NUMERICAL MODEL DOMAIN WITH SUBSETS ILLUSTRATING HIGHER RESOLUTION AT THE COAST. SPATIAL RESOLUTION AT THE COAST
RANGED FROM 100 TO 800 METRES AND DECREASED OFFSHORE.
Forcing The recently released Japanese Reanalysis JRA-55 reanalysis atmospheric model [11-15] provided wind and mean sea level (MSL) pressure fields at 0.5 degree resolution at 3-hour intervals. JRA-55 data were obtained from the NCAR Research Data Archive [12] dataset (1958-present) accurately reproduces broad scale synoptic and climate variability [15]. The eight primary harmonic tidal constituents (M2,S2,K2,N2,K1,O1,P1,Q1) from the 1/30 degree TPXO08 Atlas [16] (http://volkov.oce.orst.edu/tides/tpxo8_atlas.html) were assigned to the outer boundaries of the model grid, and sea levels were calculated by SCHISM. Direct gravitationally forced tides, or tidal potential, were also calculated internally within the SCHISM model. Waves were not included in the 59-year simulations due to computational constraints. Wave effects were investigated for a number of specific events around the Australian coast and these results are presented in Hetzel et al. [17].Multi decadal simulations (1958-2016)
Multi-decadal model runs Model simulations, in parallelised mode, were performed on the supercomputer Magnus at Pawsey Supercomputing Centre (https://www.pawsey.org.au) using between ~200-700 computational cores. Overlapping yearly simulations were completed with time series of sea level saved at hourly intervals for the entire domain and every 10-minutes at tide gauge locations. Hourly data were archived in yearly netCDF files.

AFAC18: PROCEEDINGS FROM THE BUSHFIRE AND NATURAL HAZARDS CRC & AFAC CONFERENCE 2018 | REPORT NO. 367.2018
239
POST PROCESSING
Due to the very large size of the total dataset, 31,479 data points were extracted
from raw model output for post-processing. The data consisted of 59-year sea
level time series evenly spaced at 2 km intervals along the entire coastline of
Australia including islands. These total sea level data were adusted to include
accurate seasonal variations using satellite altimetry and were validated against
tide gauge observations. The data were archived for each coastal data point as
individual netCDF files available through the website.
Extreme value analysis Extreme value theory is a statistical method that allows for the calculation of the probability of the occurrence of extreme events. Total predicted hourly sea levels (tide + storm surge), at 31479 coastal locations, were detrended and annual maximum water levels were extracted used for extreme value analysis. The classical Annual Maximum method with a Generalised Extreme Value (GEV) distribution [18] was used to determine Average Recurrence Intervals (ARI) all around the coast using MATLAB functions contained in the statistics toolbox. The same analysis was applied to tide gauge data at 28 sites.
The final extreme sea level products contained ARI levels that merged ARI values from Haigh et al. 2014 [19] in tropical cyclone affected areas with ARIs derived directly from the SCHISM model. Combining the two datasets in this way allowed for best estimate of extreme values all around Australia (Figure 5).

AFAC18: PROCEEDINGS FROM THE BUSHFIRE AND NATURAL HAZARDS CRC & AFAC CONFERENCE 2018 | REPORT NO. 367.2018
240
RESULTS
TIME SERIES A subset of the data from around the continent is shown here to illustrate the model results (Figure 7). Main outputs are total sea levels that include tides, storm surges, and longer term sea level variability. Sea level extremes, are relative to the each site, with the coincidence of tide and storm surge often critical. Tidal analyses of the total water level data allowed for the separation into tidal and non-tidal residuals. The non-tidal residuals (e.g. Figure 7) enable the identification of individual storm surge events, i.e. higher periods of water levels caused by high winds and reduced air pressure.
The final year of the simulation (2016) proved to be exceptionally stormy with high and storm surges over the south half of the continent, including notable damaging storms in NSW and South Australia. Whilst the accuracy of the model at individual sites and for individual storms varied varied due to many factors, in general, both the total water levels (Figure 8) and non-tidal residuals (Figure 9) were well represented when compared to tide gauge data.
The complete dataset of simulated sea levels available through the website will allow for the identification of vulnerable areas, specific conditions causing extreme sea levels, and probabilities of those levels being exceeded at all areas around the coastline.

AFAC18: PROCEEDINGS FROM THE BUSHFIRE AND NATURAL HAZARDS CRC & AFAC CONFERENCE 2018 | REPORT NO. 367.2018
241
FIGURE 7. PREDICTED NON-TIDAL RESIDUAL SEA LEVELS AT A SELECTION OF SITES, STARTING IN PORT HEDLAND, WA AND MOVING ANTICLOCKWISE AROUND THE COAST. DATA ARE PLOTED WITH AN ARBITRARY OFFSET AND TICK MARKS AT1 M INTERVALS ON THE Y-AXIS.

AFAC18: PROCEEDINGS FROM THE BUSHFIRE AND NATURAL HAZARDS CRC & AFAC CONFERENCE 2018 | REPORT NO. 367.2018
242
FIGURE 8. PREDICTED (BLUE) AND OBSERVED (ORANGE) TOTAL SEA LEVELS FOR 2016 PLOTTED WITH ARBITRARY OFFSET STARTING AT DARWIN AND
MOVING ANTICLOCKWISE AROUND THE COAST. DATA ARE PLOTED WITH AN ARBITRARY OFFSET AND TICK MARKS AT 4 M INTERVALS ON THE Y-AXIS.
THE EXTREME TIDAL RANGE VARIABILITY AROUND THE COAST CAN BE SEEN CLEARLY IN THE PLOT.

AFAC18: PROCEEDINGS FROM THE BUSHFIRE AND NATURAL HAZARDS CRC & AFAC CONFERENCE 2018 | REPORT NO. 367.2018
243
FIGURE 9. PREDICTED (BLUE) AND OBSERVED (ORANGE) NON-TIDAL RESIDUAL SEA LEVELS (STORM SURGE) FOR 2016 PLOTTED WITH ARBITRARY
OFFSET STARTING AT DARWIN AND MOVING ANTICLOCKWISE AROUND THE COAST. DATA ARE PLOTED WITH AN ARBITRARY OFFSET. 2016 WAS ONE
OF THE STORMIEST YEARS ON RECORD FOR SOUTH AUSTRALIA, THE HIGH AMPLITUDE AND FREQUECY OF STORM SURGES BETWEEN THEVENARD AND
VICTOR HARBOUR. NOISE IN THE SIGNAL FOR NORTHERN AUSTRALIAN SITES RESULTS FROM CHALLENGES IN HARMONIC TIDAL ANALYSIS DUE TO
EITHER INCOMPLETE TIDA GAUGE DATA OR MODEL DATA POINTS THAT WERE SHALLOWER THAN LOWEST WATER LEVELS AND IS NOT INDICATIVE OF
INACURACIES IN PREDICTIONS OF HIGHEST WATER LEVELS. AVERAGE RECURRENCE INTERVALS AROUND AUSTRALIA.

AFAC18: PROCEEDINGS FROM THE BUSHFIRE AND NATURAL HAZARDS CRC & AFAC CONFERENCE 2018 | REPORT NO. 367.2018
244
AVERAGE RECURRENCE INTERVALS Analysis of the sea level data included application of Extreme Value Theory to predict Average Recurrence Intervals (ARI) at ~2km spacing around the entire Australian coastline including islands (Figure 5). These results are publicly available though a website described in the following section.
FIGURE 10. ESTIMATES OF 1YEAR AND 100 YEAR TOTAL SEA LEVEL ARI AROUND THE AUSTRALIAN COASTLINE DERIVED FROM THE
NUMERICAL MODEL (COLOURED DOTS) AND TIDE GAUGE OBSERVATIONS (BLACK BORDERED CIRCLES).

AFAC18: PROCEEDINGS FROM THE BUSHFIRE AND NATURAL HAZARDS CRC & AFAC CONFERENCE 2018 | REPORT NO. 367.2018
245
WEBSITE The major outcome from the BNHCRC extreme sea level project is a website (www.ozsealevelx.org) (Figure 11) aimed at making the extreme sea level statistics and data easily available to a broad range of end users. The website consist of an interactive map showing the 100 year ARI as coloured dots spaced at 1 km around the coastline, including islands. The user can click on any of these 31479 points (e.g. Figure 12) to access 1 and 100 year ARI levels as well as a number of plots showing more details of the extremes, including: ARI curves (Figure 13); seasonal variability (Figure 14); monthly histograms (Figure 15); and submergence curves (Figure 16) showing the percentage of time certain levels are exceeded. Combined pdf files containing all plots are also available for download. Equivalent plots are also available at select tide gauge sites (blue markers) so that the user can compare the statistics derived from the model with those based on observations (Figure 17). Finally, hourly sea level time series data (model) can be downloaded as netCDF files by clicking on the link provided (Figure 18).
FIGURE 11 SCREEN SHOT OF THE EXTREME SEA LEVEL WEBSITE DEVELOPED DURING THE BNHCRC PROJECT “ IMPROVED PREDICTIONS OF EXTREME SEA
LEVELS. THE INTERACTIVE MAP ALLOWS FOR THE USER TO EXTRACT EXTREME SEA LEVEL STATISTICS, VIEW PLOTS AND DOWNLOAD TIME SERIES DATA AT
31479 COASTAL DATA POINTS.

AFAC18: PROCEEDINGS FROM THE BUSHFIRE AND NATURAL HAZARDS CRC & AFAC CONFERENCE 2018 | REPORT NO. 367.2018
246
FIGURE 12. ZOOM VIEW OF SOUTH AUSTRALIA SHOWING THE INTERACTIVE MAP AVAILABLE ON THE UWA/BMHCRC EXTREME SEA LEVEL WEBSITE
ILLUSTRATING AVAILABLE STATISTICS AND PLOTS AT EACH COASTAL DATA POINT.

AFAC18: PROCEEDINGS FROM THE BUSHFIRE AND NATURAL HAZARDS CRC & AFAC CONFERENCE 2018 | REPORT NO. 367.2018
247
FIGURE 13. EXAMPLE PLOT OF ARI CURVE AVAILABLE FOR EACH COASTAL DATA POINT ON UWA/BNHCRC EXTREME SEA LEVEL WEBSITE WITH
EXPLANATION OF CONTENTS.
FIGURE 14. EXAMPLE PLOT OF SEASONAL VARIABILITY AND LIKELYHOOD OF OCCURRENCE AVAILABLE FOR EACH COASTAL DATA POINT ON
UWA/BNHCRC EXTREME SEA LEVEL WEBSITE.

AFAC18: PROCEEDINGS FROM THE BUSHFIRE AND NATURAL HAZARDS CRC & AFAC CONFERENCE 2018 | REPORT NO. 367.2018
248
FIGURE 15. HISTOGRAM AVAILABLE ON THE UWA/BNHCRC WEBSITE INDICATING WHEN ARI LEVELS WERE EXCEEDED BETWEEN 1958-2016 IN THE
SCHISM NUMERICAL MODEL SEALEVEL HINDCAST.

AFAC18: PROCEEDINGS FROM THE BUSHFIRE AND NATURAL HAZARDS CRC & AFAC CONFERENCE 2018 | REPORT NO. 367.2018
249
FIGURE 16. EXAMPLE SUBMERGENCE CURVE PLOT AVAILABLE FOR EACH COASTAL DATA POINT ON UWA/BNHCRC EXTREME SEA LEVEL WEBSITE. THE
CURVE APPROXIMATES THE PERCENTAGE OF TIME THE SEA LEVEL WILL BE ABOVE VARIOUS LEVELS BASED ON NUMERICAL MODEL RESULTS.

AFAC18: PROCEEDINGS FROM THE BUSHFIRE AND NATURAL HAZARDS CRC & AFAC CONFERENCE 2018 | REPORT NO. 367.2018
250
Comparison with tide gauge data at select sites:
FIGURE 17. EXAMPLE POP-UP INFORMATION BOX SHOWING EXTREME SEALEVEL STATISTICS BASED ON TIDE GAUGE DATA AT SELECT SITES ENABLING
THE USER TO COMPARE MODEL WITH OBSERVATIONS.
Data download option for model time series:
FIGURE 18. EXAMPLE TIME SERIES HOURLY DATA AVAILABLE FOR DOWNLOAD AT EACH COASTAL DATA POINT FROM THE UWA/BNHCRC WEBSITE.
HERE, TIDAL ANALYSIS HAS BEEN PERFORMED ON THE DATA AND PLOTTED ARE: MSL ADJUSTED TOTAL WATER LEVELS (BLACK), PREDICTED TIDES (DARK
BLUE), AND NON-TIDAL RESIDUALS (RED), AND RAW MODEL DATA (CYAN).

AFAC18: PROCEEDINGS FROM THE BUSHFIRE AND NATURAL HAZARDS CRC & AFAC CONFERENCE 2018 | REPORT NO. 367.2018
251
CONCLUSION
In order to protect life and property coastal planners and emergency managers require accurate estimates of flood risk. Providing reliable predictions of extreme sea levels for this purpose represents a significant challenge due to the range of complex processes that vary from beach to beach, town to town, and state to state around the entire Australian continent. As a result, a reliable comprehensive dataset of extreme sea levels for the entire coastline does not yet exist. Recent technological advances have allowed us to develop a high-resolution numerical model capable of analysing ocean dynamics to better understand how storms will impact local beaches on an Australia-wide scale over the past 59 years. The advanced, high-resolution (in the coastal zone ~100m) 3D finite element hydrodynamic model (SCHISM) was used to predict 59 years of hourly sea levels. Extreme value statistical analyses were then applied to determine Average Recurrence Intervals all around the coast. These data have been archived and made publicly available via a web portal, which can be practically applied to inform planning and emergency management.

AFAC18: PROCEEDINGS FROM THE BUSHFIRE AND NATURAL HAZARDS CRC & AFAC CONFERENCE 2018 | REPORT NO. 367.2018
252
REFERENCES
1. Zhang, Y.J. and Baptista, A.M., SELFE: A semi-implicit Eulerian–Lagrangian
finite-element model for cross-scale ocean circulation. Ocean
Modelling, 2008. 21(3–4): p. 71-96.
2. Zhang, Y.J., Ye, F., Stanev, E.V., and Grashorn, S., Seamless cross-scale
modeling with SCHISM. Ocean Modelling, 2016. 102: p. 64-81.
3. Bertin, X., Li, K., Roland, A., Zhang, Y.J., Breilh, J.F., and Chaumillon, E., A
modeling-based analysis of the flooding associated with Xynthia, central
Bay of Biscay. Coastal Engineering, 2014. 94: p. 80-89.
4. Bertin, X., Li, K., Roland, A., and Bidlot, J.-R., The contribution of short-
waves in storm surges: Two case studies in the Bay of Biscay. Continental
Shelf Research, 2015. 96(0): p. 1-15.
5. Fortunato, A.B., Li, K., Bertin, X., Rodrigues, M., and Miguez, B.M.,
Determination of extreme sea levels along the Iberian Atlantic coast.
Ocean Engineering, 2016. 111: p. 471-482.
6. Krien, Y., Testut, L., Islam, A.K.M.S., Bertin, X., Durand, F., Mayet, C., Tazkia,
A.R., Becker, M., Calmant, S., Papa, F., Ballu, V., Shum, C.K., and Khan,
Z.H., Towards improved storm surge models in the northern Bay of Bengal.
Continental Shelf Research, 2017. 135: p. 58-73.
7. Zhang, Y.J., Witter, R.C., and Priest, G.R., Tsunami-tide interaction in 1964
Prince William Sound tsunami. Ocean Modelling, 2011. 40(3-4): p. 246-
259.
AFAC18: PROCEEDINGS FROM THE BUSHFIRE AND NATURAL HAZARDS CRC & AFAC CONFERENCE 2018 | REPORT NO. 367.2018
253
8. Azevedo, A., Oliveira, A., Fortunato, A.B., and Bertin, X., Application of an
Eulerian-Lagrangian oil spill modeling system to the Prestige accident:
trajectory analysis. Journal of Coastal Research, 2009: p. 777-781.
9. Rodrigues, M., Oliveira, A., Queiroga, H., Fortunato, A.B., and Zhang, Y.J.,
Three-dimensional modeling of the lower trophic levels in the Ria de
Aveiro (Portugal). Ecological Modelling, 2009. 220(9-10): p. 1274-1290.
10. Kerr, P.C., Donahue, A.S., Westerink, J.J., Luettich, R.A., Zheng, L.Y.,
Weisberg, R.H., Huang, Y., Wang, H.V., Teng, Y., Forrest, D.R., Roland, A.,
Haase, A.T., Kramer, A.W., Taylor, A.A., Rhome, J.R., Feyen, J.C., Signell,
R.P., Hanson, J.L., Hope, M.E., Estes, R.M., Dominguez, R.A., Dunbar, R.P.,
Semeraro, L.N., Westerink, H.J., Kennedy, A.B., Smith, J.M., Powell, M.D.,
Cardone, V.J., and Cox, A.T., US IOOS coastal and ocean modeling
testbed: Inter-model evaluation of tides, waves, and hurricane surge in
the Gulf of Mexico. Journal of Geophysical Research-Oceans, 2013.
118(10): p. 5129-5172.
11. Ebita, A., Kobayashi, S., Ota, Y., Moriya, M., Kumabe, R., Onogi, K.,
Harada, Y., Yasui, S., Miyaoka, K., Takahashi, K., Kamahori, H., Kobayashi,
C., Endo, H., Soma, M., Oikawa, Y., and Ishimizu, T., The Japanese 55-
year Reanalysis “JRA-55”: An Interim Report. SOLA, 2011. 7: p. 149−152.
12. Japan Meteorological Agency, J., JRA-55: Japanese 55-year Reanalysis,
Daily 3-Hourly and 6-Hourly Data. 2013, Research Data Archive at the
National Center for Atmospheric Research, Computational and
Information Systems Laboratory: Boulder, CO.

AFAC18: PROCEEDINGS FROM THE BUSHFIRE AND NATURAL HAZARDS CRC & AFAC CONFERENCE 2018 | REPORT NO. 367.2018
254
13. Murakami, H., Tropical cyclones in reanalysis data sets. Geophysical
Research Letters, 2014. 41(6): p. 2133-2141.
14. Kobayashi, S., Ota, Y., Harada, Y., Ebita, A., Moriya, M., Onoda, H.,
Onogi, K., Kamahori, H., Kobayashi, C., Endo, H., Miyaoka, K., and
Takahashi, K., The JRA-55 Reanalysis: General Specifications and Basic
Characteristics. Journal of the Meteorological Society of Japan. Ser. II,
2015. 93(1): p. 5-48.
15. Kobayashi, S., Ota, Y., Harada, Y., Ebita, A., Moriya, M., Onoda, H.,
Onogi, K., Kamahori, H., Kobayashi, C., Endo, H., Miyaoka, K., and
Takahashi, K., The JRA-55 Reanalysis: Representation of atmospheric
circulation and climate variability Journal of the Meteorological Society
of Japan. Ser. II, 2016.
16. Egbert, G.D. and Erofeeva, S.Y., Efficient Inverse Modeling of Barotropic
Ocean Tides. Journal of Atmospheric and Oceanic Technology, 2002.
19(2): p. 183-204.
17. Hetzel, Y., Janekovic, I., Pattiaratchi, C., and Haigh, I.D., The role of
wave-setup on extreme water levels around australia. Progress in
Oceanography, under review.
18. Coles, S., An Introduction to Statistical Modeling of Extreme Values. 2001,
London: Springer Verlag.
19. Haigh, I., MacPherson, L., Mason, M., Wijeratne, E.M.S., Pattiaratchi, C.,
Crompton, R., and George, S., Estimating present day extreme water
level exceedance probabilities around the coastline of Australia: tropical

AFAC18: PROCEEDINGS FROM THE BUSHFIRE AND NATURAL HAZARDS CRC & AFAC CONFERENCE 2018 | REPORT NO. 367.2018
255
cyclone-induced storm surges. Climate Dynamics, 2014. 42(1-2): p. 139-
157.

AFAC18: PROCEEDINGS FROM THE BUSHFIRE AND NATURAL HAZARDS CRC & AFAC CONFERENCE 2018 | REPORT NO. 367.2018
256
REAL PEOPLE, REAL STORIES- IF IT’S FLOODED FORGET IT
Non-peer reviewed research proceedings from the Bushfire and Natural Hazards
CRC & AFAC conference
Perth, 5 – 8 September 2018
Samantha Karmel
NSW State Emergency Service
Corresponding author: [email protected]

AFAC18: PROCEEDINGS FROM THE BUSHFIRE AND NATURAL HAZARDS CRC & AFAC CONFERENCE 2018 | REPORT NO. 367.2018
257
ABSTRACT Between 2000 and 2015, 178 people died from floods in Australia. Despite the strong messaging from
emergency services, people continue to drive or walk through floodwater, putting their lives at risk. In
response, the NSW State Emergency Service has developed a range of video stories depicting people’s
decision making processes and experiences entering floodwater and activated them as part of a
comprehensive social media campaign - thereby incorporating a modern day approach to engage with the
community about the dangers of entering floodwater. The videos present the real people recounting their
decision to drive through floodwater, the consequences of their actions and the take home message.
Evidence from commissioned research and research from the Bushfire and Natural Hazards Cooperative
Research Centre determined the themes of these stories. The stories include: Sonya, a mother that crossed a
flooded river due to peer pressure from her passengers; Peter, a farmer who nearly drowned after entering
floodwater to rescue cattle; Tom, a young man that entered floodwater to impress girls in the car and Jaime,
a mother who turned around for fear of putting the lives of her children at risk. During the 6 week campaign,
the content was seen over 800,000 times, and videos were viewed more than 400,000 times. The campaign
reached over 150,000 individual young men in NSW, and over half a million more people outside of the target
group. Engagement with the campaign was also high, with 28,000 people liking, sharing, or commenting. In
2016 the project was awarded the Government section of the NSW Resilient Australia Awards.
EXTENDED ABSTRACT
Australia’s increase in population, along with where people are choosing to live, makes us more vulnerable to
the impact of severe weather events. Relying on emergency management organisations to provide all the
required resources to respond to these weather events is not sustainable. The National Strategy for Disaster
Resilience emphasises the importance of shared responsibility between governments, business, communities
and individuals and promotes a shift from Government intervention to developing community resilience.
People need to take greater responsibility for their own safety and act on information, advice and other cues
provided before, during and after a disaster to protect themselves, their family, friends and property.
In April 2015, the Hunter region was affected by wild weather, which brought heavy rainfall and storms
resulting in significant infrastructure damage and the deaths of four people. In 2016, the NSW State Emergency
Service was funded as part of the NSW Office of Emergency Management’s State Emergency Management
Projects Program grant funding round to undertake the Post Disaster Research and Innovation Project.
This project gathered evidence to develop a better understanding of community response behaviour and
attitudes to the April 2015 superstorm, well as the decision making processes and risk perception people
experience when confronted with warnings and key risks during floods. The research also expected to
determine the factors that contribute to positive community action and safe decision-making. The project
engaged the University of Newcastle to undertake this research; 79 one-onone interviews and four focus
groups were conducted with residents of the Hunter region, focusing primarily on Dungog, Millers Forest,
Gillieston Heights and Hinton. Furthermore, observations and interviews were completed with residents in two
communities where community-led disaster planning was taking place at the time. This research has resulted
in the Stronger for the Storm report; this report consolidates the growing evidence of the importance of
communities and emergency management organisations working together when planning for and
responding to natural disasters. Furthermore, it highlights the desire for communities to embrace the shared
responsibility ethos. It is important that emergency management organisations continue to work effectively
with communities to harness this desire to achieve positive outcomes for both Government and communities.
An additional component of this project was to develop a range of “survivor” video stories of people who had
entered floodwater with the intention of using them as part of a community engagement program as well as
to support safety messaging through online platforms such as Facebook. The focus of the stories was to
further explore the decision making process from the perspective of a community member. Using real
people’s true stories can act as a great catalyst for developing an emotional human connection and result in
authentic engagement with an audience. It provides an opportunity to encourage people to share their own
stories and this in turn can add much more depth to the message.
The NSW SES worked with Why Documentaries, a Wollongong based video production company that
specialises in creating stories that audiences can connect with to create public awareness campaigns. The
stories selected were based on the themes that emerged from the Stronger for the Storm report as well as
complementary research from the Bushfire and Natural Hazards Cooperative Research Centre: “An analysis of
human fatalities from flood hazards in Australia, 1990-2015”. These reports provide insights into the “who” and
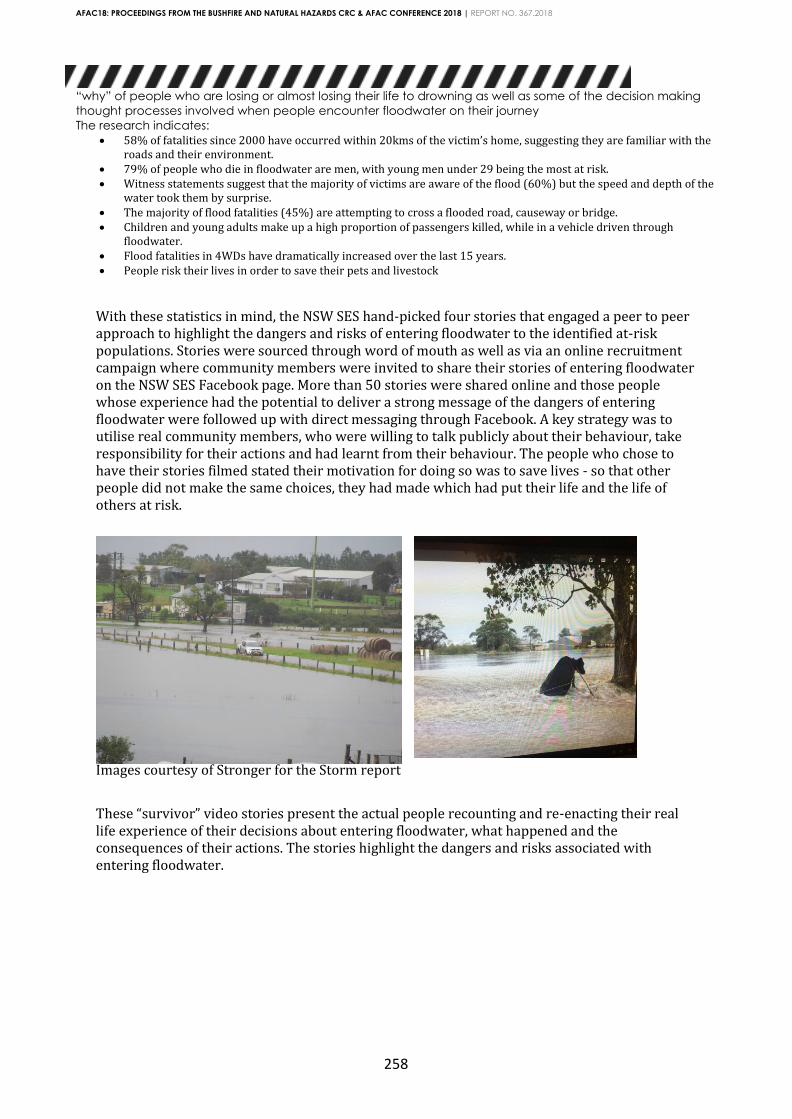
AFAC18: PROCEEDINGS FROM THE BUSHFIRE AND NATURAL HAZARDS CRC & AFAC CONFERENCE 2018 | REPORT NO. 367.2018
258
“why” of people who are losing or almost losing their life to drowning as well as some of the decision making
thought processes involved when people encounter floodwater on their journey
The research indicates:
• 58% of fatalities since 2000 have occurred within 20kms of the victim’s home, suggesting they are familiar with the roads and their environment.
• 79% of people who die in floodwater are men, with young men under 29 being the most at risk. • Witness statements suggest that the majority of victims are aware of the flood (60%) but the speed and depth of the
water took them by surprise. • The majority of flood fatalities (45%) are attempting to cross a flooded road, causeway or bridge. • Children and young adults make up a high proportion of passengers killed, while in a vehicle driven through
floodwater. • Flood fatalities in 4WDs have dramatically increased over the last 15 years. • People risk their lives in order to save their pets and livestock
With these statistics in mind, the NSW SES hand-picked four stories that engaged a peer to peer approach to highlight the dangers and risks of entering floodwater to the identified at-risk populations. Stories were sourced through word of mouth as well as via an online recruitment campaign where community members were invited to share their stories of entering floodwater on the NSW SES Facebook page. More than 50 stories were shared online and those people whose experience had the potential to deliver a strong message of the dangers of entering floodwater were followed up with direct messaging through Facebook. A key strategy was to utilise real community members, who were willing to talk publicly about their behaviour, take responsibility for their actions and had learnt from their behaviour. The people who chose to have their stories filmed stated their motivation for doing so was to save lives - so that other people did not make the same choices, they had made which had put their life and the life of others at risk.
Images courtesy of Stronger for the Storm report
These “survivor” video stories present the actual people recounting and re-enacting their real life experience of their decisions about entering floodwater, what happened and the consequences of their actions. The stories highlight the dangers and risks associated with entering floodwater.

AFAC18: PROCEEDINGS FROM THE BUSHFIRE AND NATURAL HAZARDS CRC & AFAC CONFERENCE 2018 | REPORT NO. 367.2018
259
The stories are:
Always that unknown risk. By Sonya.
Sonya is a mother who crossed a flooded river causeway in her 4WD, due to peer pressure from the passengers in the car - her four children.
Plan Ahead. By Peter
Peter is a farmer, who nearly drowned after entering floodwater to rescue cattle but was saved by his son; sadly his pet dog drowned.
A costly decision. In more ways than one … By Tom
Tom, a young man that drove through floodwater to impress his girlfriend. His car was a write off and a few weeks later his girl “dumped” him.
Go the long way. By Jaime
Jaime is a mother that turned around based on a fear of putting the lives of her children at risk.
Statistics from the Bushfire and Natural Hazards Cooperative Research Centre: “An analysis of human fatalities from flood hazards in Australia, 1990-2015” were included in the videos to provide an evidence base to the risks of entering floodwater.
In addition to the four “survivor” stories, three further video stories have been created; one that shares the experience and knowledge of “Mad Matt” a YouTuber and 4WD enthusiast; one of a SES volunteer, who responds to triple 000 callouts when people are either stuck or missing in
AFAC18: PROCEEDINGS FROM THE BUSHFIRE AND NATURAL HAZARDS CRC & AFAC CONFERENCE 2018 | REPORT NO. 367.2018
260
floodwater and the final video is a montage of community people pledging not to enter floodwater themselves or encourage a driver to do so.
These stories were then used as the basis to deliver a comprehensive six week social media flood safety campaign in early 2017. The NSW SES sought permission to use the Queensland
Government’s floodwater-safety campaign “IF IT’S FLOODED FORGET IT” messaging1 - but also target at risk populations including young men under 29 and farmers through real-life community story-telling. Each story comprises of the following collateral: a 3-minute video, a 1-minute video, 15- second video tiles, word tiles, Tweets and Facebook posts (see Appendix A).
This collateral was rolled out along with communication messaging on Facebook and Twitter to engage with the online community, placing paid advertising to target the at- risk populations. All video stories were captioned and the 3-minute videos were also translated with subtitles into 5 other prominent languages – Arabic, Chinese, Dari, Hindi and Thai. The video stories currently sit on the NSW SES You Tube channel. They were also uploaded onto a flash drive and distributed to more than 100 organisations, who work with culturally and linguistically diverse communities in NSW.
Local and national media helped contribute to the success of the project. Radio and print stories appeared in ABC Country Hour, Northern Star [https://www.northernstar.com.au/news/half-metre-deep-flood-flowing-like-being-hit- byan/3158405/], Maitland Courier and Town and Country Farmer.
During the campaign, the NSW SES Real People True Stories content was seen over 800,000 times, and videos were viewed more than 400,000 times. The campaign reached over 150,000 individual young men in NSW, and over half a million more people outside of the target group. Engagement with the campaign was also high, with 28,000 people liking, sharing, or commenting on the content with most comments being supportive of these people sharing their entering floodwater story.
The flood-safety campaigns videos and social media content is now stored on the NSW SES resource portal and available for use as required on social media. If there is a severe weather event, when flooding over roads and properties may happen, the NSW SES can use these online resources to affect awareness among the community. Peter's story delivers a powerful message to other farmers: if you have livestock plan ahead and prepare early- get them up on higher ground as soon as the weather warning is announced. Sonya's story highlights that even if the water on the road looks still and shallow, the road may have disappeared. Tom’s story highlights how a poor decision can affect your hip pocket as well as your relationships. Jaime’s story promotes making the decision that keeps you and your family safe by taking an alternative route.
These suite of video stories aim to target at-risk groups who are known to engage in the risk-taking behaviour of entering floodwater. They offer a platform to explore the decision-making process that precedes an individual entering floodwater and highlight the impacts of these decisions on real people’s lives. Each story provides an opportunity to stimulate discussion about people’s thought processes and accompanying behaviours to enable shared learnings of what happens when entering floodwater. The Real People True Stories videos provide both an understanding of how people can find themselves entering floodwater as well as strong messaging to reinforce better and safer decision making. It is hoped that this will follow on with individuals and communities exercising choice and taking responsibility for their actions. As a result of the success of these true stories, the NSW SES has
AFAC18: PROCEEDINGS FROM THE BUSHFIRE AND NATURAL HAZARDS CRC & AFAC CONFERENCE 2018 | REPORT NO. 367.2018
261
developed two more true stories of people entering floodwater due to flash-flooding events in urban settings
1 Permission was sought and granted by Queensland Fire and Emergency Services to use this tagline
AFAC18: PROCEEDINGS FROM THE BUSHFIRE AND NATURAL HAZARDS CRC & AFAC CONFERENCE 2018 | REPORT NO. 367.2018
262
REFERENCES
Council of Australia Governments (2011), national Strategy for Disaster resilience: Building the
resilience of our national to disasters. Available at
https://www.ag.gov.au/EmergencyManagement/Documents/NationalStrategyforDisa
sterResilience.PDF
Haynes, K., Coates, L., Dimer de Oliveira, F., Gissing, A., Bird, D., van den Honert, R., Radford, D.,
D’Arcy, R, Smith, C. (2016). An analysis of human fatalities from floods in Australia 1900-2015.
Report for the Bushfire and Natural Hazards CRC
Howard, A., von Meding, J., Allison, J., Heinsch, M., Blakemore, T. & Cavaliere, S. (2017) Stronger
for the Storm Research Report: Impacts of the 2015 superstorm on communities in the Hunter.
(Commissioned by NSW State Emergency Service and funded by the NSW Government under
the State Emergency Management Projects Program)
Why real people make for better brand marketing campaigns, The Guardian, Friday 20 June 2014
accessed 26th June 2018 and available at: https://www.theguardian.com/media-
network/media-network-blog/2014/jun/20/real- people-brand-marketing-skype-kooples
AFAC18: PROCEEDINGS FROM THE BUSHFIRE AND NATURAL HAZARDS CRC & AFAC CONFERENCE 2018 | REPORT NO. 367.2018
263
LARGE DAMAGE BILLS TO BUILDINGS FROM CYCLONES CAN BE REDUCED BY SMALL ACTIONS
BY THE AUTHOR Non-peer reviewed research proceedings from the Bushfire and Natural
Hazards CRC & AFAC conference
Perth, 5 – 8 September 2018
David Henderson1,2, John Ginger1,2, Daniel Smith1,2
1 Cyclone Testing Station, James Cook University 2 Bushfire and Natural Hazards CRC
Corresponding author: [email protected]

AFAC18: PROCEEDINGS FROM THE BUSHFIRE AND NATURAL HAZARDS CRC & AFAC CONFERENCE 2018 | REPORT NO. 367.2018
264
ABSTRACT
LARGE DAMAGE BILLS TO BUILDINGS FROM CYCLONES CAN BE REDUCED BY SMALL ACTIONS
David Henderson, John Ginger, Daniel Smith, Cyclone Testing Station, James
Cook University, QLD
Recent severe tropical cyclones and storms impacting Australian cities and
towns have resulted in large financial losses due to damaged buildings and
property. Disruption to livelihoods during the repair/rebuilding prolongs
recovery for the community. Damage investigations by the Cyclone Testing
Station estimate the wind speeds for the majority of the regions investigated
were less than the design wind speeds for contemporary construction (i.e. for
buildings less than 35 years old). The damage building assessments show a
significant proportion of the losses are due to contemporary buildings. This
raises issues as to appropriateness of our building construction, Codes,
engineering design practices, and ongoing maintenance.

AFAC18: PROCEEDINGS FROM THE BUSHFIRE AND NATURAL HAZARDS CRC & AFAC CONFERENCE 2018 | REPORT NO. 367.2018
265
BACKGROUND
Findings from damage investigations following severe weather events provide
critical information for understanding building performance. CTS damage
investigations following cyclones such as Cyclone Yasi [1] and Cyclone Debbie
[2], have clearly shown a significant improvement in structural performance of
housing built after the introduction of the engineered provisions introduced in
the early 1980s. The damage investigations did however highlight issues with
contemporary construction (post mid-80’s) such as loss of soffits and poor
performance of ancillary items and roller doors which led to some damage.
Notwithstanding improved structural performance of buildings, the damage
investigations detailed wind driven rain water ingress damage in residential
construction. There were cases of wind-driven rain entering through the
building envelope at openings such as windows and doors (even if closed),
around flashings, through linings or where the envelope had been damaged.
The Insurance Council of Australia (ICA) engaged the Cyclone Testing Station in
2013 to conduct a review of insurance claims on strata properties that resulted
from recent cyclones. The aim of this study was to identify factors that may be
contributing to insurable losses.
That pilot study scope examined the ICA provided data for strata properties
with claims and those without claims in the NQ/FNQ region during 2010/11. The
claims have been taken following Cyclone Yasi. The claims data was related
to the impacting local wind speeds which are influenced by terrain and
topographic features as well as shielding. By incorporating these factors in
concert with the loss data, and property information, damage levels relating to
building form may then be compared.
One of the findings of the study was the trend of higher claims in relation to their
sum insured for newer properties than pre-80s properties. It was postulated that
the losses of the contemporary might be associated with the introduction of
different building materials and styles which could include plaster board linings,
metal fascia, larger openings, minimal eaves, large partly enclosed living areas,
and complex roof shapes (lots of valleys and ridges). These different features
may increase susceptibility to wind driven rain water ingress as well as not being
designed or constructed in appropriate manner. The data contained within the
claims did not allow an assessment of the various components. However, in
analysing available text descriptors from the clams, the study did highlighted
that 80% of the claims mentioned rain water ingress damage [3].
To combat these losses, a two prong approach for mitigation of damage
through both (a) updates to current Australian building standards and equally,
(b) a set of simple strategies/tasks for building and home owners (maintenance,
envelope checklist, and opening protection), is required.
The National Construction Code of Australia’s [4] stipulated structural
objectives, with respect to wind loads, include;

AFAC18: PROCEEDINGS FROM THE BUSHFIRE AND NATURAL HAZARDS CRC & AFAC CONFERENCE 2018 | REPORT NO. 367.2018
266
• Safeguard people from injury caused by structural failure,
• Safeguard people from loss of amenity caused by structural behavior,
• Protect other property from physical damage caused by structural
failure,
The NCC also prescribes the societal risk for the ultimate limit state strength of a
structure. The level of risk is evaluated depending on the location and type of
structure. For typical residential building this is 1:500 year probability of
exceedance.
The wind speed at ultimate limit state is the design level that the structure is
meant to withstand and still protect its occupants. For a residential building in
Region C, the 1:500 probability of exceedance wind speed is 69 m/s (0.2
second gust at 10 m height in open terrain). It is interesting to note that this
regional gust wind speed of 69 m/s is in the range of gust wind speeds for a
Category 4 cyclone.
The regional design speed is further modified for the building location and
geometry using factors from AS/NZS1170.2. These factors can either increase or
decrease the local wind speed (i.e. building height, terrain, topography,
shielding from other structures, suburban terrain, etc). Therefore a building in an
exposed location (e.g. on top of a hill), that is designed without proper
consideration for the increase in wind speed, is at an increased risk of failure.
Structures designed according to Australian building standards load
combinations should have a negligible probability of failure (i.e. < 0.001 or as a
percentage, < 0.1 %) at ultimate limit state loads. Therefore failures of structural
elements would not be expected to occur at the ultimate limit state design
load.
However, for recent impacts of Tropical Cyclone Marcia and Tropical Cyclone
Debbie, structural damage was detailed by CTS for wind speeds less than the
design level. Examples of damage included roof structural beams, cladding,
flashings, fascia, soffits, and failed roof top equipment. Wind driven rain water
ingress damage was greatly exacerbated by the damage to these buildings’
envelopes.

AFAC18: PROCEEDINGS FROM THE BUSHFIRE AND NATURAL HAZARDS CRC & AFAC CONFERENCE 2018 | REPORT NO. 367.2018
267
CONCLUSION
Damage investigations have shown that Australian building regulations in terms
of the structural objectives generally appear to be appropriate with respect to
wind loading. However, issues such as poor construction practice and/or
design results in significant damage to properties. Lack of ongoing
maintenance is also a factor.
Water ingress from wind driven rain has been identified as a key factor in
insurance claims. As structural issues have been identified and acted upon, the
damage from wind driven rain ingress and the damage to ancillary
components are a major factor on losses for events with wind speeds less than
design level.
We are all a part of disaster mitigation. The resilience of our communities is up
to all of us. It is recommended that education and awareness of consequences
of such failures (e.g. damage to property and risk to life) is required in all steps
of the building process (regulation, design, construction, certification and
maintenance) and by all parties (designer, builder, certifier, and owner).
ACKNOWLEDGEMENT
The Cyclone Testing Station would like to acknowledge the support from the
Queensland Government Department of Housing and Public Works, Bushfire
and Natural Hazards CRC, Suncorp, and Insurance Australia Group for
supporting this research.

AFAC18: PROCEEDINGS FROM THE BUSHFIRE AND NATURAL HAZARDS CRC & AFAC CONFERENCE 2018 | REPORT NO. 367.2018
268
REFERENCES 1. Boughton, G. N., D. J. Henderson, J. D. Ginger, J. D. Holmes, G. R. Walker, C. Leitch, L. R. Somerville, U. Frye,
N. C. Jayasinghe and P. Kim., Tropical Cyclone Yasi Structural Damage to Buildings, Cyclone Testing
Station, James Cook University, Townsville. TR 57. 2011
2. Boughton, G.N., Falck, D.J., Henderson, D.J., Smith, D.J., Parackal, K., Kloetzke, Mason, R. Krupar III, M.
Humphreys, S. Navaratnam, G. Bodhinayake, S. Ingham, and J.D. Ginger, Tropical Cyclone Debbie;
Damage to buildings in the Whitsunday Region, TR63, Cyclone Testing Station, James Cook University,
Townsville. 2017
3. D. J. Henderson, D. J. Smith, and J. D. Ginger, Strata Title and wind storms, Strata and Community title in
Australia Conference, Gold Coast, 2015.
4. NCC. National Construction Code. Australian Building Codes Board. Australia, 2016.
AFAC18: PROCEEDINGS FROM THE BUSHFIRE AND NATURAL HAZARDS CRC & AFAC CONFERENCE 2018 | REPORT NO. 367.2018
269
IMPACT-BASED FORECASTING FOR THE COASTAL ZONE Non-peer reviewed research proceedings from the Bushfire and Natural
Hazards CRC & AFAC conference
Perth, 5 – 8 September 2018
Harald Richter1,3, Craig Arthur2,3, Serena Schroeter1,3, Martin Wehner2,3, Jane
Sexton2,3, Beth Ebert1,3, Mark Dunford2,3, Jeff Kepert1,3, Shoni Maguire1,3, Russel Hay2,3,
Mark Edwards2,3 1 Bureau of Meteorology 2 Geoscience Australia 3 Bushfire and Natural Hazards CRC
Corresponding author: [email protected]

AFAC18: PROCEEDINGS FROM THE BUSHFIRE AND NATURAL HAZARDS CRC & AFAC CONFERENCE 2018 | REPORT NO. 367.2018
270
ABSTRACT
IMPACT-BASED FORECASTING FOR THE COASTAL ZONE Harald Richter1, Craig Arthur2, Serena Schroeter1, Martin Wehner2, Jane Sexton2, Beth Ebert1, Mark
Dunford2, Jeff Kepert1, Shoni Maguire1, Russel Hay2, Mark Edwards2 1 Bureau of Meteorology, Melbourne VIC 2 Geoscience Australia, Canberra ACT
Strong surface wind gusts and heavy rain are meteorological hazards that are
predominantly produced by storms such as east coast lows, tropical cyclones
or thunderstorms. Interest in these hazards from a response agency point of
view lies in their impact on the natural and built environment. At present,
weather forecast models still predict mostly 'raw' meteorological output such as
surface wind speeds at certain times, or rain accumulations over a specified
period. This model output needs to be combined with exposure and
vulnerability information to translate the forecast hazard into predicted impact.
The Bushfire and Natural Hazards CRC project Impact-based forecasting for the
coastal zone: East-Coast Lows attempts to demonstrate a pilot capability to
deliver impact forecasts for residential housing from an ensemble of weather
prediction models runs. The project is a collaborative effort between the
Australian Bureau of Meteorology and Geoscience Australia.
The project is initially focusing on the wind and rainfall impact from the 20-22
April 2015 east coast low event in NSW. The wind and rainfall hazard data are
provided by a 24-member ensemble of the ACCESS model on a 1.3 km grid,
with damage data acquired from NSW State Emergency Services (SES) and the
Emergency Information Coordination Unit (EICU) for the 2015 event.
We will show that the multi-hazard nature of an east coast low event makes
attributing the observed building damage to a single hazard difficult. Wind
damage to residential housing in this case is largely due to tree fall. This
'damage-by-intermediary' mechanism requires not just the knowledge of
building properties in an exposed area, but also additional knowledge of the
surrounding vegetation and its response to strong winds. We will discuss
enhancements to the SES/EICU damage survey templates that would lead to
improvements in the development of the hazard-damage relationships.
EXTENDED ABSTRACT
INTRODUCTION Weather Services around the world have gradually been shifting their focus
from the delivery of weather and hazard information to value-added
information that better characterises the impacts that such hazards can have.
Weather impact forecasts have matured or are maturing to the point of

AFAC18: PROCEEDINGS FROM THE BUSHFIRE AND NATURAL HAZARDS CRC & AFAC CONFERENCE 2018 | REPORT NO. 367.2018
271
operational delivery. One such example is the impact and likelihood matrix
employed by the Met Office Severe Weather Warning Service in the UK (Neal
et al. 2014).
The prediction of weather impacts can be accomplished on many levels. A
simple approach to estimate impacts is to recast weather variables produced
by a numerical weather prediction model in terms of how unusual a specific
forecast is relative to a reference climatology (Perry 2017). The implication is
that the more unusual an event the more likely it is that the event has an
appreciable impact. The other end of the spectrum is marked by impact
prediction models where the effect of a hazard (or interacting hazards) is
quantified. Examples of impact models are the Vehicle Overturning Model
(Hemingway and Gunawan 2018) or the Surface Water Flooding Model
(Aldridge et al. 2016). Both impact models are at a pre-operational stage of
development at the UK Met Office as of April 2018. In-between these two types
of impact estimation approaches are various levels of hazard, exposure and
vulnerability specifications that, to a varying extent, invites the user to
subjectively integrate the various impact drivers (hazards, exposure,
vulnerability) in an attempt to estimate the resulting impact.
As part of the three-year Bushfire and Natural Hazards CRC Project “Impact
forecasting in the coastal zone: East coast lows”, we integrate the wind and
heavy rain hazards with information on vulnerability and exposure to estimate
the impact on residential properties. The study aims to produce a proof-of-
concept system to demonstrate that high-resolution weather forecast models,
exposure data and vulnerability relationship estimates have reached a stage of
maturity that allows for the production of meaningful spatial impact estimates
for residential buildings. The project is developing these impact forecasts in the
first instance for Bureau weather forecasters as they work alongside and
provide advice to emergency response agencies.
The study will draw on available data from recent extratropical and tropical
cyclone events, notably, the Dungog east coast low event in 2015.
Observations and insights into the quality, scale and extent of available
damage and exposure data to drive impact models will be made and
contrasted with the detailed impact models in development at the UK Met
Office. This paper describes aspects of the data, methods and findings during
the first year of this three-year project.
DATA AND METHODOLOGY At the most general level, the project will adopt the standard workflow of
estimating impact, i.e. combine hazard with exposure data and vulnerability
models. This workflow, from the raw high-resolution model output to the final
spatial impact estimate on residential buildings, is shown in Fig. 1. High-
resolution weather forecast model output for wind and rainfall is first produced
on a spatial grid with 1.5 km grid spacing by the Australian Community Climate
and Earth System Simulator – City Model (ACCESS-C; Bureau of Meteorology
2018). Basic model wind output, such as the 10 m mean wind U10m, is not the
most suitable estimator for wind damage, given wind damage is more closely
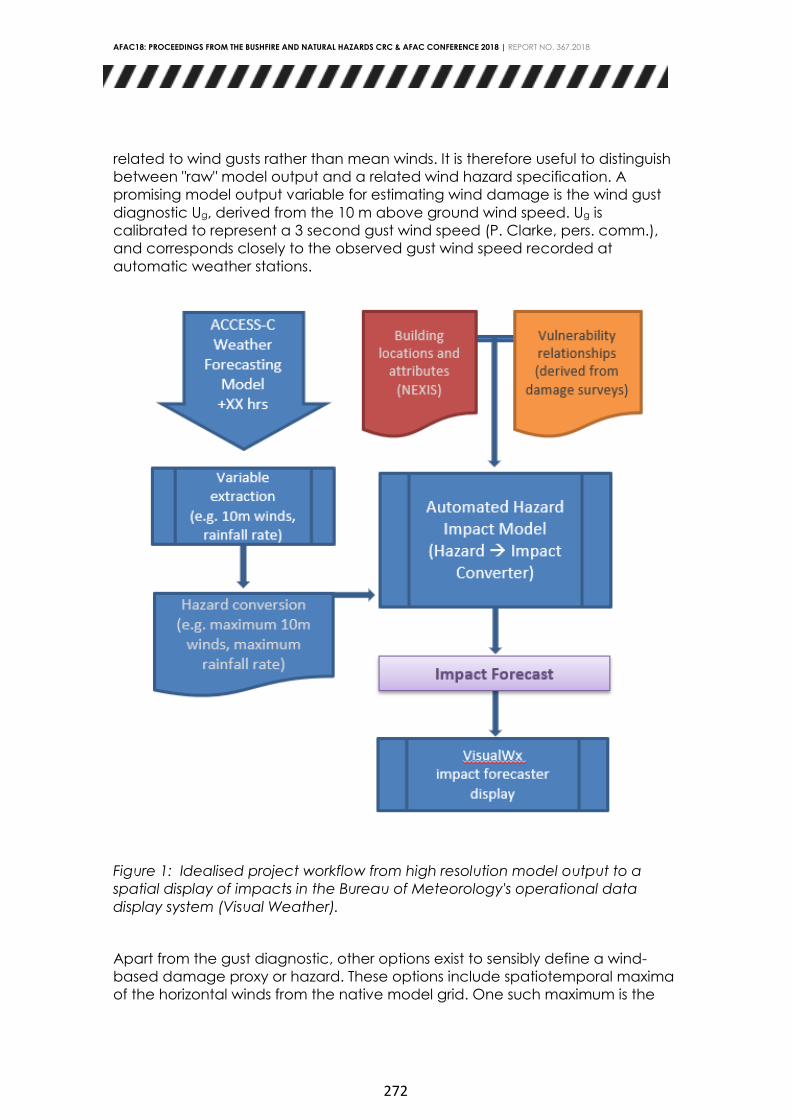
AFAC18: PROCEEDINGS FROM THE BUSHFIRE AND NATURAL HAZARDS CRC & AFAC CONFERENCE 2018 | REPORT NO. 367.2018
272
related to wind gusts rather than mean winds. It is therefore useful to distinguish
between "raw" model output and a related wind hazard specification. A
promising model output variable for estimating wind damage is the wind gust
diagnostic Ug, derived from the 10 m above ground wind speed. Ug is
calibrated to represent a 3 second gust wind speed (P. Clarke, pers. comm.),
and corresponds closely to the observed gust wind speed recorded at
automatic weather stations.
Figure 1: Idealised project workflow from high resolution model output to a
spatial display of impacts in the Bureau of Meteorology's operational data
display system (Visual Weather).
Apart from the gust diagnostic, other options exist to sensibly define a wind-
based damage proxy or hazard. These options include spatiotemporal maxima
of the horizontal winds from the native model grid. One such maximum is the

AFAC18: PROCEEDINGS FROM THE BUSHFIRE AND NATURAL HAZARDS CRC & AFAC CONFERENCE 2018 | REPORT NO. 367.2018
273
hourly maximum field (or HMF) which is an attempt to capture the grid point
maximum wind speed across all dynamical model time steps within a given
hour (Kain et al. 2010).
Exposure information is sourced from the National EXposure Information System
(NEXIS) developed by Geoscience Australia (Nadimpalli 2007). NEXIS contains
information on building locations, including structural, economic and
demographic attributes at the building level. The quality of the NEXIS data is
spatially variable; it is reliant on the quality and availability of building specific
input data. Where local building survey data is available, the quality of the
NEXIS data, at the building level, is better compared to areas where attributes
need to be derived statistically. The statistically derived data areas are
representative at an aggregated level but less likely to represent the exact
building specific attributes, on the ground.
Vulnerability relationships were originally intended to be derived from two
damage assessment datasets, one provided by the State Emergency Services
in NSW (the BEACON data), and the other by the Fire and Rescue NSW
Emergency Information Coordination Unit (the EICU data). Both damage
datasets cover the 20-22 April 2015 East Coast Low impact around the Dungog
NSW area. Vulnerability relationships are derived by plotting the degree of
damage reported for residential buildings against the wind and rain hazard
specification based on the ACCESS-C model output.
The automated generation of a spatial impact estimates through Geoscience
Australia's open source HazImp software requires input information on exposure
and vulnerability relationships in addition to the ACCESS-C-based hazard inputs.
Finally, the spatial impact estimates are primarily (but not exclusively) intended
to be made available to Bureau of Meteorology forecasters through Visual
Weather, their primary operational data display system. This way, severe
weather forecasts and warnings can be augmented with impact information to
enhance their utility to a variety of end users, including the emergency
response agencies.
EARLY PROJECT FINDINGS One year into the three-year project our findings focus on the complexity and
usability of the available exposure and vulnerability data in relation to the
resolution of the weather forecasts. The properties and limitations of the
available datasets largely shape our ability to produce meaningful impact
forecasts. However, this knowledge importantly provides the project with the
opportunity to showcase how improvements in data collection can improve
the quality of impact forecasts and critically, provide the evidence to
emergency services to amend damage recording practices for their long-term
benefit.
The key impediments to the derivation of vulnerability relationships for the
Dungog event were twofold. First, only the EICU data contained a categorical
degree of damage (none, minor, major, severe and destroyed). Such a

AFAC18: PROCEEDINGS FROM THE BUSHFIRE AND NATURAL HAZARDS CRC & AFAC CONFERENCE 2018 | REPORT NO. 367.2018
274
categorisation is needed to relate the damage severity to the magnitude of
the associated hazard. Second, the wind speeds produced by the Dungog
event mostly stayed well below the design wind speeds for newer housing in
the Hunter area (34-40 m s-1) and therefore cannot be expected to define the
full wind vulnerability relationship. In addition, whilst damage was reported in
the BEACON and EICU data it was not possible to determine which hazard(s)
caused the damage, i.e. wind or rain or other hazards. The wind-related
damage that did occur was mostly due to tree fall, rather than direct wind
impact on buildings. This 'damage by intermediary' causality chain greatly
complicates the derivation of vulnerability relations given tree response to
strong winds depends on a multitude of other factors.
An outcome from these findings has been a recommendation to amend the
damage reporting detail in BEACON to include damage categories and to
relate all reported damage to the underlying hazard(s).
Figure 2: 20-22 April 2015 EICU damage data for the town of Dungog (NSW).
The recorded building damage, categorised into five classes (none, minor,
major, severe, destroyed), is shown in relation to the matching 48-hour
maximum 10 m mean wind speed from one individual ensemble member
(member 12) of a 24-member high resolution model run on a 1.3 km grid. The
coloured boxes show the inner two quartiles of the model wind distribution for
each damage category.

AFAC18: PROCEEDINGS FROM THE BUSHFIRE AND NATURAL HAZARDS CRC & AFAC CONFERENCE 2018 | REPORT NO. 367.2018
275
The detailed examination of the damage data for the Dungog event also
confirmed a well-established view that most impacts are multi-hazard in nature.
Fig. 2 demonstrates that the reported total damage in the EICU dataset is not
sensibly related to the model-derived wind speed alone, but is the aggregated
product of interacting hazards including wind, heavy rain and overland
flooding. Particularly the damage reports in the 76-100% (destroyed) category
are related to flooding as a nearby creek rose beyond its banks (Wehner et al.
2015).
The derivation of vulnerability relationships from damage assessment data
either requires an unambiguous link between the reported damage and a
single underlying hazard that caused the damage, or it will be necessary to
explore the use of multi-hazard predictors to estimate the spatial event-
integrated damage pattern in a more statistical sense.
Akin to the vulnerability relationships, the available exposure information has
also been tested for its level of uncertainty. For the township of Dungog, the
NEXIS information is statistically derived from known point source data in
equivalent nearby towns. The building attributes "wall material" and "roof
material" in NEXIS for houses in Dungog are derived from exposure survey results
in Newcastle (Dhu and Jones 2002) and Alexandria (Maqsood et al. 2013). The
"age" attribute for houses built pre-1982 are sourced from NSW cadastral parcel
registration date. The "age" attribute for houses built 1982 and onwards is
sourced 75% from NSW median suburb year and 25% from cadastral parcel
registration date.
We examined all 856 dwellings in Dungog in a desktop exposure survey (using
Google Streetview, aerial and other imagery) and compared the surveyed
(actual) wall and roof types to the statistically derived attributes within NEXIS.
Fig. 3 shows the degree of agreement between the surveyed and statistically
derived house types (a house type is defined as a specific combination of one
of ten possible roof types and one of six possible wall types).

AFAC18: PROCEEDINGS FROM THE BUSHFIRE AND NATURAL HAZARDS CRC & AFAC CONFERENCE 2018 | REPORT NO. 367.2018
276
Figure 3: Relationship of statistically derived NEXIS and surveyed house types for
all post-1982 houses in the town of Dungog NSW. A "house type" is defined as a
combination of wall material (10 categories) and roof material (6 categories).
Note that only a small number out of all 60 possible house types is actually
present in Dungog.
Fig. 3 implies that the statistically derived residential building attributes for
Dungog do not agree well with the actual attributes on the town scale. This
suggests that in areas where residential building attributes need to be derived
statistically due to lack of in-situ survey data, wind and rain impacts on such
housing can only be meaningfully considered on scales larger than the town
scale. This observation is well understood by the NEXIS data custodians.
Implementation of an impact forecasting system nationally will require a
nationally consistent exposure system which in turn relies on what data each
jurisdiction collects and the quality of that data. This decision will become a
cost-benefit analysis for each government.
SUMMARY This study ultimately aims at deriving useful multi-day spatial impact forecasts for
residential buildings based on wind and rain forecasts from high-resolution
numerical models. Damage assessment data for the 20-22 April 2015 Dungog
NSW east coast low event was sourced and its relationship to the wind strength
and rainfall rate explored.

AFAC18: PROCEEDINGS FROM THE BUSHFIRE AND NATURAL HAZARDS CRC & AFAC CONFERENCE 2018 | REPORT NO. 367.2018
277
We found that the damage data available were lacking critical information
needed to establish vulnerability relationships of residential houses with respect
to wind and rain. The reported damage needs to be categorised and linked to
the hazard or hazards that caused it. The observed damage was often due to
more than one hazard, raising the prospects that vulnerability relations might
have to be crafted based on multiple interacting hazards. In regard to the
available exposure data, areas where local building attributes need to be
derived from surveyed housing attributes elsewhere (e.g., Dungog NSW) have
significant errors in their exposure data. Currently this does not allow meaningful
impact estimates at town scales or smaller.
The project plans to extend our severe weather data collection to multiple
tropical and extra-tropical cyclone cases for which high-resolution model data
and high quality damage assessment data are jointly available. These datasets
will be used to derive statistically more robust vulnerability relationships that will
employ multi-hazard predictors for the impact on residential buildings.
However, starting this project using the Dungog example as a case-study is
highly instructive as it allows many of the data issues to be identified and
highlights the reality in the varied quality and extent of damage and exposure
data. Without this example, the impact forecast user community may see this
as a trivial problem, when it simply is not.
In the meantime, we will employ interim vulnerability relations that have been
used by Geoscience Australia for scenario impact assessments for emergency
management planning purposes to demonstrate the full end-to-end workflow
in a pseudo-operational environment – from high-resolution weather model
output to spatial impact data.
REFERENCES
Bureau of Meteorology, 2018: APS2 Upgrade to the ACCESS-C Numerical
Weather Prediction System (22 February 2018). Operations Bulletin 114.
http://www.bom.gov.au/australia/charts/bulletins/BNOC_Operations_Bulletin_1
14.pdf.
Dhu, T., and T. Jones, 2002: Earthquake Risk in Newcastle and Lake Macquarie.
Geoscience Australia Record 2002/15.
Hemingway, R., and O. Gunawan, 2018: The Natural Hazards Partnership: A
public-sector collaboration across the UK for natural hazard disaster risk
reduction. Int. J. Disaster Risk Reduct., 27, 499–511, doi:10.1016/j.ijdrr.2017.11.014.
https://doi.org/10.1016/j.ijdrr.2017.11.014.
Kain, J. S., S. R. Dembek, S. J. Weiss, J. L. Case, J. J. Levit, and R. A. Sobash, 2010:
Extracting unique information from high-resolution forecast models: Monitoring
selected fields and phenomena every time step. Wea. Forecast., 25, 1536-1542.

AFAC18: PROCEEDINGS FROM THE BUSHFIRE AND NATURAL HAZARDS CRC & AFAC CONFERENCE 2018 | REPORT NO. 367.2018
278
Maqsood, T., M. Wehner, N. Corby, and M. Edwards, 2013: Urban Stormwater
Climate Change Impact Study: Alexandra Canal. Geoscience Australia.
Nadimpalli, K., M. Edwards, and D. Mullaly, 2007: National Exposure Information
System (NEXIS) for Australia: Risk Assessment Opportunities, Proceedings of
MODSIM07 Conference, Christchurch, New Zealand.
Neal, R. A., P. Boyle, N. Grahame, K. Mylne, and M. Sharpe, 2014: Ensemble
based first guess support towards a risk-based severe weather warning service.
Meteorol. Appl., 21, 563-577.
Perry, M., 2017: Understanding Weather and Climate Risk. What is risk in a
weather and climate context?
https://www.geolsoc.org.uk/~/media/shared/documents/Events/Past%20Meeti
ng%20Resources/Sharing%20an%20Uncertain%20World/Perry%20Matthew.pdf
Wehner, M. and T. Maqsood, 2015: Dungog Flood, 20-21 April, 2015 Post-Flood
Damage Survey. Geoscience Australia Record 2015/21.

AFAC18: PROCEEDINGS FROM THE BUSHFIRE AND NATURAL HAZARDS CRC & AFAC CONFERENCE 2018 | REPORT NO. 367.2018
279
INSIGHTS FROM THE DEVELOPMENT OF A PYROCUMULONIMBUS PREDICTION TOOL Non-peer reviewed research proceedings from the Bushfire and
Natural Hazards CRC & AFAC conference
Perth, 5 – 8 September 2018
Kevin J. Tory1,2 and Jeffrey D. Kepert1,2 1 Bushfire and Natural Hazards CRC 2 Bureau of Meteorology
Corresponding author: [email protected]

AFAC18: PROCEEDINGS FROM THE BUSHFIRE AND NATURAL HAZARDS CRC & AFAC CONFERENCE 2018 | REPORT NO. 367.2018
280
ABSTRACT In favourable atmospheric conditions, large hot fires can produce pyrocumulonimbus (pyroCb)
cloud in the form of deep convective columns resembling conventional thunderstorms, which
may be accompanied by strong inflow, dangerous downbursts and lightning strikes. These in turn
may enhance fire spread rates and fire intensity, cause sudden changes in fire spread direction,
and the lightning may ignite additional fires. Dangerous pyroCb conditions are not well
understood and are very difficult to forecast.
In a previous study of the thermodynamics of fire plumes, the authors investigated the influence
of a range of environment and fire property factors on plume condensation. A method was
proposed to identify on an atmospheric sounding the minimum plume height (𝑧𝑓𝑐) and plume
buoyancy (𝑏𝑓𝑐) at which free moist convection can develop. The larger these two numbers the
deeper and hotter the plume needs to be for pyroCb to form. This information is in itself very
useful for pyroCb prediction since it gives qualitative insight into the relative fire size and intensity
(total heat flux) required for the initiation of in-plume convection with the potential to initiate
pyroCb.
In this paper the substantial impact of the plume environment on the shape and buoyancy of
plumes is incorporated, using the Briggs analytical plume model to account for the effect of wind
speed on plume rise and plume buoyancy. Applying 𝑧𝑓𝑐 and 𝑏𝑓𝑐 to the Briggs solutions, the net
buoyancy flux and total heat flux (often expressed as “fire power”) required for pyroCb formation
can be estimated from a single atmospheric sounding. While the Briggs plume model assumes
neutral stability, the effect of a stable capping inversion (often present during pyroCb events) is
incorporated in the calculation of 𝑧𝑓𝑐 and 𝑏𝑓𝑐.
The equations offer valuable insight into how environmental parameters limit or favour pyroCb
formation, and how they impact the plume shape; in general, less favourable conditions require
hotter fires with more upright plumes.
INTRODUCTION Pyrocumulus (pyroCu) clouds are produced by intense heating of air from fire or volcanic activity
that leads to ascent and subsequent condensation when the rising air becomes saturated due to
cooling from adiabatic expansion and dilution from entrained (cooler) air from outside the
plume. In large fires with an intense convection column, the cloud may resemble towering
cumulonimbus with updrafts that penetrate into the stratosphere (e.g., Fromm et al. 2010). We
refer to these clouds as pyroCb.
The ability to predict pyroCb activity is important because it can have a significant impact on fire
behaviour, including: (i) the amplification of burn- and spread-rates (Fromm et al. 2006,
Trentmann et al. 2006, Rosenfeld et al. 2007, Fromm et al. 2012), (ii) enhanced spotting due to
larger, taller and more intense plumes (e.g., Koo et al. 2010), and (iii) ignition of new fires by
pyroCb lightning (Dowdy et al. 2017).
Current prediction methods include the use of conventional thunderstorm formation diagnostics,
such as the Convective Available Potential Energy (CAPE), which essentially measures the
integrated buoyancy of an air parcel on its rising path through a hypothetical cumulus or
cumulonimbus cloud. It is assumed that the parcel must be lifted by some external forcing until it
becomes buoyant, or surface heating provides sufficient buoyant lifting, or a combination of
both. The integrated buoyant energy is a function of the thermodynamic properties of the air
parcel (measured below the cloud) and the temperature profile of the environment
(atmospheric stability). Parcel thermodynamics (temperature and moisture) determine at what
height cloud forms and latent heating begins to reduce the parcel’s negative buoyancy, while
atmospheric stability determines both the rate of reduction in negative buoyancy and the height
at which the parcel becomes positively buoyant (i.e., free convection begins).
In a large fire, the smoke plume provides both a lifting mechanism and surface-based heating
with the potential to raise plume parcels sufficiently for cloud to form within the plume. The main
difficulty using diagnostics such as CAPE for pyroCu/Cb prediction is the unknown
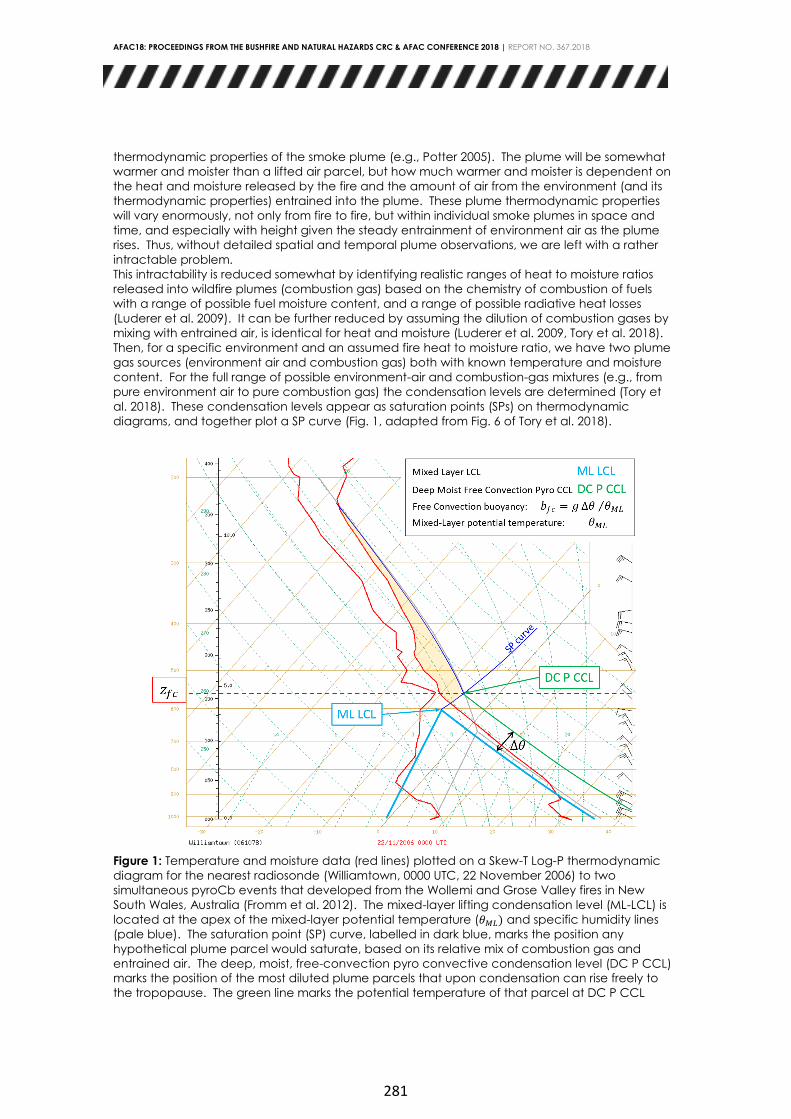
AFAC18: PROCEEDINGS FROM THE BUSHFIRE AND NATURAL HAZARDS CRC & AFAC CONFERENCE 2018 | REPORT NO. 367.2018
281
thermodynamic properties of the smoke plume (e.g., Potter 2005). The plume will be somewhat
warmer and moister than a lifted air parcel, but how much warmer and moister is dependent on
the heat and moisture released by the fire and the amount of air from the environment (and its
thermodynamic properties) entrained into the plume. These plume thermodynamic properties
will vary enormously, not only from fire to fire, but within individual smoke plumes in space and
time, and especially with height given the steady entrainment of environment air as the plume
rises. Thus, without detailed spatial and temporal plume observations, we are left with a rather
intractable problem.
This intractability is reduced somewhat by identifying realistic ranges of heat to moisture ratios
released into wildfire plumes (combustion gas) based on the chemistry of combustion of fuels
with a range of possible fuel moisture content, and a range of possible radiative heat losses
(Luderer et al. 2009). It can be further reduced by assuming the dilution of combustion gases by
mixing with entrained air, is identical for heat and moisture (Luderer et al. 2009, Tory et al. 2018).
Then, for a specific environment and an assumed fire heat to moisture ratio, we have two plume
gas sources (environment air and combustion gas) both with known temperature and moisture
content. For the full range of possible environment-air and combustion-gas mixtures (e.g., from
pure environment air to pure combustion gas) the condensation levels are determined (Tory et
al. 2018). These condensation levels appear as saturation points (SPs) on thermodynamic
diagrams, and together plot a SP curve (Fig. 1, adapted from Fig. 6 of Tory et al. 2018).
Figure 1: Temperature and moisture data (red lines) plotted on a Skew-T Log-P thermodynamic
diagram for the nearest radiosonde (Williamtown, 0000 UTC, 22 November 2006) to two
simultaneous pyroCb events that developed from the Wollemi and Grose Valley fires in New
South Wales, Australia (Fromm et al. 2012). The mixed-layer lifting condensation level (ML-LCL) is
located at the apex of the mixed-layer potential temperature (𝜃𝑀𝐿) and specific humidity lines
(pale blue). The saturation point (SP) curve, labelled in dark blue, marks the position any
hypothetical plume parcel would saturate, based on its relative mix of combustion gas and
entrained air. The deep, moist, free-convection pyro convective condensation level (DC P CCL)
marks the position of the most diluted plume parcels that upon condensation can rise freely to
the tropopause. The green line marks the potential temperature of that parcel at DC P CCL

AFAC18: PROCEEDINGS FROM THE BUSHFIRE AND NATURAL HAZARDS CRC & AFAC CONFERENCE 2018 | REPORT NO. 367.2018
282
(𝜃𝐷𝐶𝑃𝐶𝐶𝐿) and the red dashed line marks the free-convection height (𝑧𝑓𝑐). The difference in
potential temperature between 𝜃𝑀𝐿 and 𝜃𝐷𝐶𝑃𝐶𝐶𝐿 (∆𝜃) is used to define the free-convection
buoyancy (𝑏𝑓𝑐).
It is assumed that the plume entrains air from all levels of the environment through which it rises,
and thus mixed-layer values of potential temperature (𝜃𝑀𝐿) and specific humidity (Fig. 1, pale
blue lines) are used, together with assumed fire properties, to define the SP curve (Tory et al.
2018). The bottom end of the SP curve represents the limit at which the plume has become so
dilute that it is comprised of 100% entrained air from the environment. The SPs of increasingly less
dilute plume parcels are positioned further up the SP curve. The lowest position on the SP curve
that a condensing plume parcel can rise freely to the tropopause is defined as the deep, moist,
free-convection pyro convective condensation level (DC P CCL, green label, Fig. 1), which also
defines the free-convection height, 𝑧𝑓𝑐. The buoyancy of a plume parcel at DC P CCL relative to
𝜃𝑀𝐿 is defined as the free convection buoyancy, 𝑏𝑓𝑐 = 𝑔 ∆𝜃 𝜃𝑀𝐿⁄ . These are the theoretical
minimum values for free convection to occur.
By focussing on the theoretical minimum height and buoyancy that a plume must achieve for
pyroCb formation, the intractability of the pyroCb prediction problem is further reduced, by
removing the focus from individual fires to a hypothetical weakest possible fire. This latter focus
helps identify relative favourability of pyroCb formation (Tory et al. 2018).
In this paper the concept is extended to identify a theoretical minimum total heat flux required
for pyroCb formation, using the Briggs (1975) analytic plume-rise model, which incorporates the
substantial impact of the background wind speed on plume rise.
DERIVATION OF BRIGGS MODEL FROM THE PLUME FLUX GRADIENT EQUATIONS
Plume models have traditionally sought solutions to four dependent differential equations that
describe the rate of change of mass (volume), momentum and buoyancy fluxes with distance
along the plume axis through cross-sections perpendicular to the plume axis (e.g., the green
circle in Fig. 2). Briggs found analytic solutions to the set of equations after introducing several
simplifications and assumptions. The main simplification is to solve for mean-plume quantities (i.e.,
a single mean value per position along the plume axis; the so-called top-hat profile). The main
assumptions are that the fluid is approximately Boussinesq (volume is conserved) and that the
plume vertical cross-sectional geometry is circular (purple circle in Fig. 2).
This reduces the problem to finding solutions for the vertical rate of change of fluxes through
vertical plume cross-sections (purple circle, Fig. 2) in which the horizontal plume flow moves with
the constant background cross-wind 𝑈. The simplification eliminates the horizontal momentum
flux equation.

AFAC18: PROCEEDINGS FROM THE BUSHFIRE AND NATURAL HAZARDS CRC & AFAC CONFERENCE 2018 | REPORT NO. 367.2018
283
Figure 2: Schematic representation of the plume geometry with the plume centre-line marked in
yellow and the plume edges in dark blue. In general solutions are sought to the rate of change
of plume flux quantities with distance along the plume centre-line through a circular plume cross-
section perpendicular to the plume axis (green circle). The Briggs simplified geometry considers
fluxes through vertical circular plume cross-sections (purple circle), transported by the mean
background wind 𝑈. The radius increases linearly with height governed by the constant
entrainment parameter 𝛽. The shaded area labelled 𝛼 is proportional to the fraction of the
plume area that must rise above the free convection height, 𝑧𝑓𝑐 , before deep, moist free-
convection can develop. 𝑧𝑐 is the plume centre-line height at this downstream position.
A linear entrainment assumption provides a simple solution to the volume flux equation, 𝑑
𝑑𝑧[𝑉𝑓𝑙𝑢𝑥] =
𝑑
𝑑𝑧[(𝜋𝑅2)𝑈] = (2𝜋𝑅)𝑈𝛽, 1.
where 𝛽 is a constant entrainment parameter, yielding 𝑅 = 𝛽𝑧, and 𝑉𝑓𝑙𝑢𝑥 = 𝜋(𝛽𝑧)2𝑈. Note: this
volume flux encompasses the rising plume gases plus the volume of ambient air displaced by the
rising plume gases. It is termed the dynamic volume flux, in which 𝑅 and 𝛽 are the dynamic
radius and entrainment rate respectively. An internal radius and entrainment rate that only
incorporates the plume gases is also required 𝑅′ = 𝛽′𝑧, for consideration of quantities emitted by
the fire (e.g., concentration of smoke particles, chemicals, or heat), with a corresponding internal
volume flux, 𝑉′𝑓𝑙𝑢𝑥 = 𝜋(𝛽′𝑧)2𝑈. The two entrainment parameters have been determined from
numerous experiments and observations resulting in 𝛽 = 0.6, and 𝛽′ = 0.4.
The forcing term on the RHS of the vertical momentum flux equation (Eq. 2 below) applies to both
the plume gases and the displaced ambient air, so that the vertical momentum flux is defined by
the product of the dynamic volume flux and plume vertical velocity, 𝑊𝑓𝑙𝑢𝑥 = 𝑉𝑓𝑙𝑢𝑥𝑤. The vertical
momentum flux equation is then: 𝑑
𝑑𝑧[𝑊𝑓𝑙𝑢𝑥] =
𝑑
𝑑𝑧[𝜋(𝛽𝑧)2𝑈𝑤] =
𝐵𝑓𝑙𝑢𝑥
𝑤. 2.
Plume heat is only contained in the internal plume volume, so that the buoyancy flux is defined
by the product of the internal volume flux and plume buoyancy, 𝑏, i.e., 𝐵𝑓𝑙𝑢𝑥 = 𝑉′𝑓𝑙𝑢𝑥𝑏. Then, 𝑑
𝑑𝑧[𝐵𝑓𝑙𝑢𝑥] =
𝑑
𝑑𝑧[𝜋(𝛽′𝑧)2𝑈𝑏] = 𝑁2(𝛽′𝑧)2𝑤. 3.
Here 𝑁2 is the Brunt-Väisälä frequency. 𝐵𝑓𝑙𝑢𝑥 is the total buoyancy flux at the fire source, which is
directly proportional to the area-integrated heat flux, sometimes referred to as the "fire-power",
𝐻𝑓𝑙𝑢𝑥 =𝜌𝐶𝑝𝑑𝜃𝑀𝐿
𝑔𝐵𝑓𝑙𝑢𝑥. 4.
For brevity, we will hereafter refer to 𝐵𝑓𝑙𝑢𝑥 when discussing total fire heat or fire-power.
Solutions to Eq. 2 yield the Briggs plume-rise equation that describes the plume centre-line height
𝑧 with distance 𝑥 downstream,
𝑧 = [(3
2𝛽2)𝐵𝑓𝑙𝑢𝑥
𝜋𝑈3 ]
1
3𝑥
2
3. 5.
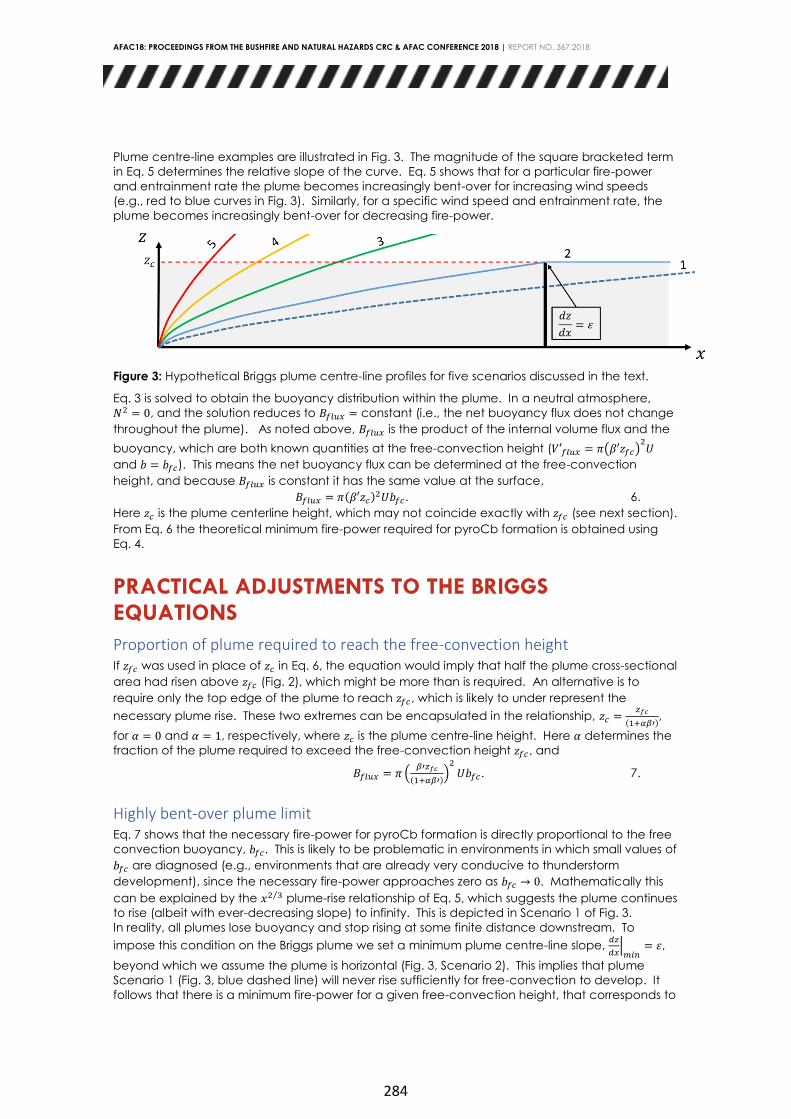
AFAC18: PROCEEDINGS FROM THE BUSHFIRE AND NATURAL HAZARDS CRC & AFAC CONFERENCE 2018 | REPORT NO. 367.2018
284
Plume centre-line examples are illustrated in Fig. 3. The magnitude of the square bracketed term
in Eq. 5 determines the relative slope of the curve. Eq. 5 shows that for a particular fire-power
and entrainment rate the plume becomes increasingly bent-over for increasing wind speeds
(e.g., red to blue curves in Fig. 3). Similarly, for a specific wind speed and entrainment rate, the
plume becomes increasingly bent-over for decreasing fire-power.
Figure 3: Hypothetical Briggs plume centre-line profiles for five scenarios discussed in the text.
Eq. 3 is solved to obtain the buoyancy distribution within the plume. In a neutral atmosphere,
𝑁2 = 0, and the solution reduces to 𝐵𝑓𝑙𝑢𝑥 = constant (i.e., the net buoyancy flux does not change
throughout the plume). As noted above, 𝐵𝑓𝑙𝑢𝑥 is the product of the internal volume flux and the
buoyancy, which are both known quantities at the free-convection height (𝑉′𝑓𝑙𝑢𝑥 = 𝜋(𝛽′𝑧𝑓𝑐)2
𝑈
and 𝑏 = 𝑏𝑓𝑐). This means the net buoyancy flux can be determined at the free-convection
height, and because 𝐵𝑓𝑙𝑢𝑥 is constant it has the same value at the surface,
𝐵𝑓𝑙𝑢𝑥 = 𝜋(𝛽′𝑧𝑐)2𝑈𝑏𝑓𝑐. 6.
Here 𝑧𝑐 is the plume centerline height, which may not coincide exactly with 𝑧𝑓𝑐 (see next section).
From Eq. 6 the theoretical minimum fire-power required for pyroCb formation is obtained using
Eq. 4.
PRACTICAL ADJUSTMENTS TO THE BRIGGS EQUATIONS
Proportion of plume required to reach the free-convection height If 𝑧𝑓𝑐 was used in place of 𝑧𝑐 in Eq. 6, the equation would imply that half the plume cross-sectional
area had risen above 𝑧𝑓𝑐 (Fig. 2), which might be more than is required. An alternative is to
require only the top edge of the plume to reach 𝑧𝑓𝑐 , which is likely to under represent the
necessary plume rise. These two extremes can be encapsulated in the relationship, 𝑧𝑐 =𝑧𝑓𝑐
(1+𝛼𝛽′),
for 𝛼 = 0 and 𝛼 = 1, respectively, where 𝑧𝑐 is the plume centre-line height. Here 𝛼 determines the
fraction of the plume required to exceed the free-convection height 𝑧𝑓𝑐 , and
𝐵𝑓𝑙𝑢𝑥 = 𝜋 (𝛽′𝑧𝑓𝑐
(1+𝛼𝛽′))
2
𝑈𝑏𝑓𝑐. 7.
Highly bent-over plume limit Eq. 7 shows that the necessary fire-power for pyroCb formation is directly proportional to the free
convection buoyancy, 𝑏𝑓𝑐. This is likely to be problematic in environments in which small values of
𝑏𝑓𝑐 are diagnosed (e.g., environments that are already very conducive to thunderstorm
development), since the necessary fire-power approaches zero as 𝑏𝑓𝑐 → 0. Mathematically this
can be explained by the 𝑥2 3⁄ plume-rise relationship of Eq. 5, which suggests the plume continues
to rise (albeit with ever-decreasing slope) to infinity. This is depicted in Scenario 1 of Fig. 3.
In reality, all plumes lose buoyancy and stop rising at some finite distance downstream. To
impose this condition on the Briggs plume we set a minimum plume centre-line slope, 𝑑𝑧
𝑑𝑥|
𝑚𝑖𝑛= 𝜀,
beyond which we assume the plume is horizontal (Fig. 3, Scenario 2). This implies that plume
Scenario 1 (Fig. 3, blue dashed line) will never rise sufficiently for free-convection to develop. It
follows that there is a minimum fire-power for a given free-convection height, that corresponds to

AFAC18: PROCEEDINGS FROM THE BUSHFIRE AND NATURAL HAZARDS CRC & AFAC CONFERENCE 2018 | REPORT NO. 367.2018
285
a minimum total buoyancy flux, 𝐵𝑓𝑙𝑢𝑥,𝑚𝑖𝑛. To determine 𝐵𝑓𝑙𝑢𝑥,𝑚𝑖𝑛 a replacement variable for 𝑏𝑓𝑐, or
a separate condition to define 𝐵𝑓𝑙𝑢𝑥, needs to be found. The maximum plume centre-line height,
𝑧𝑚𝑎𝑥 (defined by the truncated plume centre-line depicted in Scenario 2 of Fig. 3) can be
derived by finding the downstream distance, 𝑥𝑚𝑎𝑥 (where the plume centre-line has slope 𝜀) and
substituting into Eq. 5:
𝑑𝑧
𝑑𝑥|
𝑧𝑚𝑎𝑥
= 𝜀 =2
3[(
3
2𝛽2)
𝐵𝑓𝑙𝑢𝑥
𝜋𝑈3]
1
3𝑥𝑚𝑎𝑥
−1
3, 8.
∴ 𝑥𝑚𝑎𝑥
2
3 = (2
3𝜀)
2[(
3
2𝛽2)
𝐵𝑓𝑙𝑢𝑥
𝜋𝑈3]
2
3. 9.
𝑧𝑚𝑎𝑥 = (2
3(𝜀𝛽)2)𝐵𝑓𝑙𝑢𝑥
𝜋𝑈3 . 10.
Setting 𝑧𝑐 to 𝑧𝑚𝑎𝑥 and rearranging to make 𝐵𝑓𝑙𝑢𝑥 the subject we get an equation for 𝐵𝑓𝑙𝑢𝑥,𝑚𝑖𝑛,
𝐵𝑓𝑙𝑢𝑥,𝑚𝑖𝑛 = 𝜋3
2
(𝜀𝛽)2
(1+𝛼𝛽)𝑈3𝑧𝑓𝑐. 11.
PLUME STRUCTURE INSIGHT FROM THE BRIGGS EQUATIONS
Qualitative relationship between variables and fire-power Eqs 7 and 11 offer valuable insight into plume behaviour and the potential for pyroCb formation.
We anticipate that for the majority of cases 𝐵𝑓𝑙𝑢𝑥 > 𝐵𝑓𝑙𝑢𝑥,𝑚𝑖𝑛 and Eq. 7 should describe the
sensitivity of pyroCb producing plumes to the environment the plume develops in.
In a specific thermodynamic environment, the parameters 𝑧𝑓𝑐 and 𝑏𝑓𝑐 are set (Fig. 1) so that the
minimum fire-power required for pyroCb formation is sensitive only to the background wind
speed 𝑈 and the internal entrainment parameter 𝛽′. The direct proportionality between 𝐵𝑓𝑙𝑢𝑥
and 𝑈 in Eq. 7 shows, for example, that only half the fire-power is required if the background wind
is halved (i.e., pyroCb formation is more favourable in lighter background winds). Reduced
entrainment (smaller 𝛽′) is likely in highly rotating plumes, which means less fire-power is required
for pyroCb formation.
Eq. 7 also provides insight into pyroCb formation favourability if there is a change in the
thermodynamic environment that results in changes to 𝑧𝑓𝑐 , 𝑏𝑓𝑐 or both (e.g., with the passage of
a wind change). For example, if a cool and moist wind change was to halve 𝑧𝑓𝑐, then the
minimum fire power required for pyroCb formation would be quartered. The same wind change
might increase the capping inversion at the top of the wind-change layer, increasing 𝑏𝑓𝑐, but
unless it increases 𝑏𝑓𝑐 by four times or greater, the net effect is still a reduction in necessary fire
power for pyroCb formation. PyroCb are often observed to form on wind changes.
In conditions where the diagnosed minimum fire-power would produce a highly bent-over plume,
𝐵𝑓𝑙𝑢𝑥 < 𝐵𝑓𝑙𝑢𝑥,𝑚𝑖𝑛, and Eq. 11 describes the sensitivity of pyroCb producing plumes to their
environment. Such conditions are more likely to occur when the environment is already highly
favourable for thunderstorm development (when 𝑏𝑓𝑐 and 𝑧𝑓𝑐 are relatively small). Compared
with Eq. 7, the minimum fire-power has become much more sensitive to the background wind
speed (proportional to the cube of 𝑈), but less sensitive to 𝑧𝑓𝑐 (i.e., it is directly proportional to 𝑧𝑓𝑐 ,
rather than the square of 𝑧𝑓𝑐). The equation suggests that in highly favourable thunderstorm
environments, it would be pertinent to monitor closely any reduction in wind speed, when
considering pyroCb threat.
Plume structure prediction The shape of pyroCb plumes can vary considerably from case to case. The Briggs equations
allow for an exploration into what causes differences in plume slope at the height of free
convection (i.e., how bent-over the plumes are). Eq. 10 can be re-arranged to make 𝜀 the
subject, in which 𝜀 now represents the theoretical minimum plume centre-line slope at 𝑧𝑐,
𝜀2 = (2
3𝛽2)𝐵𝑓𝑙𝑢𝑥
𝜋𝑈3𝑧𝑐. 12.

AFAC18: PROCEEDINGS FROM THE BUSHFIRE AND NATURAL HAZARDS CRC & AFAC CONFERENCE 2018 | REPORT NO. 367.2018
286
Using Eq. 7 the plume centre-line slope at 𝑧𝑐can be expressed as a function of the free-
convection height and buoyancy, and background wind,
𝜀 =1
𝑈(
𝛽′
𝛽) [(
2
3)
𝑏𝑓𝑐𝑧𝑓𝑐
(1+𝛼𝛽′)]
1
2. 13.
Eq. 13 shows that the greater the free-convection buoyancy and free-convection height, the
steeper the pyroCb plume, and stronger winds correspond to a more bent-over plume.
This relationship is supported by two pyroCb cases presented in Fig. 4, from which rough estimates
of 𝜀 can be obtained.

AFAC18: PROCEEDINGS FROM THE BUSHFIRE AND NATURAL HAZARDS CRC & AFAC CONFERENCE 2018 | REPORT NO. 367.2018
287
Figure 4: PyroCb photos and corresponding thermodynamic diagrams for (top) the Bald Fire
(Lareau and Clements 2016) and (bottom) the Sedgerley fire. The most significant difference
between the two environments is the free-convection buoyancy, inferred from the relative sizes of
∆𝜃, which impacts the plume slope (see text for details).
The top row shows a photo of a very upright pyroCb plume that formed above the Bald Fire
(Lareau and Clements 2016) in an environment with large 𝑏𝑓𝑐 (~0.23 𝑚𝑠−2) and large 𝑧𝑓𝑐 (~4000
𝑚), with a moderate background wind speed (~5 𝑚𝑠−1). Using 𝛽 = 0.6, 𝛽′ = 0.4 and 𝛼 = 1,
𝜀𝐵𝑎𝑙𝑑𝐹𝑖𝑟𝑒~2.8. The bottom row shows the highly bent-over plume that led to the development of
pyroCb over the Sedgerley fire (from southeast Queensland, Australia, 2016) in an environment of
very small 𝑏𝑓𝑐 (~0.01 𝑚𝑠−2) and moderate 𝑧𝑓𝑐 (~3000 𝑚), with a moderate background wind
speed (~5 𝑚𝑠−1), which yields 𝜀𝑆𝑒𝑑𝑔𝑒𝑟𝑙𝑒𝑦~0.5. Given the many assumptions and considerable
simplifications underpinning the Briggs equations, and the rough estimates of parameter values
from the thermodynamic diagrams, these 𝜀 values are quite encouraging. Finally, we note that
these estimated 𝜀 values represent a theoretical minimum slope corresponding to the weakest
possible fire able to produce deep, moist free-convection. Eqs 5 and 12, show that hotter fires in
the same environment will produce steeper plumes.
SUMMARY PyroCb can be very dangerous, contributing to unexpected fire-spread and are difficult to
predict. Previous work identified a method for determining, from an atmospheric sounding, the
minimum plume buoyancy and plume height that a plume must achieve before deep moist free-
convection (pyroCb) can develop (Tory et al. 2018). In this paper the work is extended to identify
a theoretical minimum fire-power (total heat or buoyancy flux of a fire) for pyroCb to develop,
using the Briggs plume-rise equations.
The fire-power, or total heat flux of the fire, is proportional to the total buoyancy flux of the fire,
𝐵𝑓𝑙𝑢𝑥. Eq. 7 shows that 𝐵𝑓𝑙𝑢𝑥 is directly proportional to the background wind speed and the plume
free-convection buoyancy, and is proportional to the square of the free convection height.
For conditions that are highly favourable for thunderstorm development, very small values of the
free-convection buoyancy are diagnosed, for which the Briggs plume geometry is probably too
steep. Assuming plumes are effectively flat beyond a minimum Briggs plume slope, introduces an
additional 𝐵𝑓𝑙𝑢𝑥 relationship (Eq. 11) that is much more sensitive to the background wind speed
and much less sensitive to the free-convection height.
Observations of contrasting very upright and very bent-over pyroCb producing plumes can be
explained by a plume-slope equation (Eq. 13). PyroCb that form in less favourable environments
are associated with upright plumes that require greater fire-power and greater buoyancy.
Relatively weak fires can produce highly bent-over plumes that trigger pyroCb in environments
that already favour thunderstorm development.
Work is currently underway to generate forecast maps of 𝐵𝑓𝑙𝑢𝑥 and 𝐻𝑓𝑙𝑢𝑥 that will be used to
provide an indication of the relative threat of pyroCb formation.

AFAC18: PROCEEDINGS FROM THE BUSHFIRE AND NATURAL HAZARDS CRC & AFAC CONFERENCE 2018 | REPORT NO. 367.2018
288
ACKNOWLEDGEMENTS Thanks to reviewers Mika Peace and Serena Schroeter for helpful suggestions, and to Nick
McCarthy for the Sedgerly fire image and thermodynamic diagram.
REFERENCES
Briggs, G. A., 1975: Plume rise predictions. Lectures on Air Pollution and Environmental
Impact Analyses, D. A. Haugen, Ed., Amer. Meteor. Soc., 59—111. Dowdy, A. J., M. D. Fromm and N. McCarthy, 2017: Pyrocumulonimbus lightning and fire ignition on
Black Saturday in southeast Australia. J. Geo. Res. Atmos., 122, 7342—7354. doi:10.1002/2017JD026577
Fromm, M. D., A. Tupper, D. Rosenfeld, R. Servranckx and R. McRae, 2006: Violent pyro-
convective storm devastates Australia’s capital and pollutes the stratosphere.
Geophys. Res. Lett., 33, L05815, doi:10.1029/2005FL025161.
Fromm, M. D., D. T. Lindsey, R. Servranckx, G. Yue, T. Trickl, R. Sica, P. Doucet and S.
Godin-Beekman, 2010: The untold story of pyrocumulonimbus. Bull. Amer. Met.
Soc., 1193—1209
Fromm, M. D.,R. H. D. McRae, J. J. Sharples and G. P. Kablick III, 2012:
Pyrocumulonimbus pair in Wollemi and Blue Mountains National parks, 22
November 2006. Aus. Met. Ocean J., 62, 117—126.
Koo, E., P. J. Pagni, D. R. Weise and J. P. Woycheese, 2010: Firebrands and spotting
ignition in large-scale fires. Int. J. Wild. Fire, 19, 818—843.
Lareau, N. P. and C. B. Clements, 2016: Environmental controls on pyrocumulus and
pyrocumulonimbus initiation and development. Atmos. Chem. Phys., 16, 4005—
4022. doi:10.5194/acp-16-4005-2016.
Luderer, G., J. Trentmann and M. O. Andreae, 2009: A new look at the role of fire
released moisture on the dynamics of atmospheric pyro-convection. Int. J. Wild.
Fire, 18, 554—562.
Potter, B. E., 2005: The role of released moisture in the atmospheric dynamics associated
with wildland fires. Int. J. Wild. Fire, 14, 77—84.
Rosenfeld, D., M. D. Fromm, J. Trentmann, G. Luderer, M. O. Andreae and R. Servanckx,
2007: The Chisolm firestorm: observed microstructure, precipitation and lightning
activity of a pyro-cumulonimbus. Atmos. Chem. Phys., 7, 645—659.
Tory, K. J., W. Thurston and J. D. Kepert 2018: Thermodynamics of pyrocumulus: A
conceptual study. Mon. Wea. Rev., Accepted. DOI: 10.1175/MWR-D-17-0377.1
Trentmann, J., G. Luderer, T. Winterrath, M. D. Fromm, R. Servranckx, M. Herzog, H.-F.
Graf and M. O. Andreae, 2006: Modeling of biomass smoke injection into the
lower stratosphere by a large forest fire (Part I): reference simulation. Atmos.
Chem. Phys., 6, 5247—5260.

AFAC18: PROCEEDINGS FROM THE BUSHFIRE AND NATURAL HAZARDS CRC & AFAC CONFERENCE 2018 | REPORT NO. 367.2018
289
EVALUATION AND CALIBRATION OF A LAND SURFACE BASED SOIL MOISTURE FOR FIRE DANGER RATINGS Non-peer reviewed research proceedings from the Bushfire and Natural Hazards
CRC & AFAC conference
Perth, 5 – 8 September 2018
Vinod Kumar1,2, Imtiaz Dharssi1 and Paul Fox-Hughes1 1Bureau of Meteorology 2Bushfire and Natural Hazards CRC
Corresponding author: [email protected]
AFAC18: PROCEEDINGS FROM THE BUSHFIRE AND NATURAL HAZARDS CRC & AFAC CONFERENCE 2018 | REPORT NO. 367.2018
290
ABSTRACT
EVALUATION AND CALIBRATION OF A LAND SURFACE BASED SOIL MOISTURE FOR FIRE DANGER RATINGS
Vinodkumar, Science to Services, Bureau of Meteorology, Melbourne
We present the evaluation of high-resolution, JASMIN soil moisture analysis
developed for Australia. The prototype JASMIN system has been developed
primarily for use in fire and land management. JASMIN produce hourly soil
moisture estimates over four soil layers at 5 km horizontal resolution. We evaluate
JASMIN against three ground-based networks in Australia. Among the results, the
median Pearson’s correlation obtained for surface soil moisture across the
observation networks for JASMIN is between 0.78 and 0.85. JASMIN generally has
a better skill than the Keetch-Byram Drought Index and Soil Dryness Index models
used operationally in Australia.
We also apply and evaluate a few rescaling approaches to the JASMIN soil
moisture to facilitate its use in the current operational fire danger rating system.
Minimum-maximum matching, mean-variance matching, and cumulative
distribution function (CDF) matching are the rescaling approaches applied.
Validation of the rescaled products is performed using ground-based
observations and MODIS fire radiative power data.
The rescaling readily enables fire agencies to utilize the JASMIN product in their
existing fire prediction models. However, the potential of JASMIN is greatest in the
National Fire Danger Rating System (NFDRS), currently being prototyped across
Australia. Particularly, the ability of JASMIN to estimate soil moisture at several
levels is expected to be advantageous in the NFDRS. For example, the Spinifex
fuel model implemented in the current NFDRS prototype uses 0-10cm soil
moisture as an input. This soil moisture information is available natively in JASMIN.
AFAC18: PROCEEDINGS FROM THE BUSHFIRE AND NATURAL HAZARDS CRC & AFAC CONFERENCE 2018 | REPORT NO. 367.2018
291
INTRODUCTION
Accurate estimation of soil moisture is of great importance in fire danger
assessment, given the close relationship between soil moisture and fuel dryness.
To that extent, the operational fire danger rating system in Australia employs soil
moisture deficit models to estimate fuel availability (McArthur, 1967). Soil moisture
exhibits high variability in space and time, driven by several parameters, such as
vegetation, soil type, topography, and meteorology. The current operational soil
moisture deficit models, the Keetch-Byram Drought Index (KBDI; Keetch and
Byram, 1968) and the Mount's Soil Dryness Index (SDI; Mount, 1972), are rather
simplified methods that neglect most of these influencing factors.
Rapid scientific progress has been made in the past few decades on
accurate soil moisture estimation using modern techniques like satellite remote
sensing and land surface modelling. Land surface models (LSMs) provide a
detailed representation of thermal and hydrological processes (Best et al., 2011).
Soil wetness from LSMs within a numerical weather prediction system (NWP) is
found to provide more accurate estimates than that from KBDI or SDI
(Vinodkumar et al., 2017). However, soil moisture analysis from operational,
global NWP systems run by the Bureau of Meteorology have a coarser resolution
(~25 km). Also, their skill can be limited by the large uncertainties that exist in NWP
forcing - especially precipitation. Hence, a high resolution offline land surface
modelling system that will be driven mainly by observation based meteorological
forcing has been developed.
The new soil moisture analyses system, referred to as the JULES based
Australian Soil Moisture INformation (JASMIN; Dharssi and Vinodkumar, 2017), is
based on the Joint United Kingdom Land Environment Simulator (JULES; Best et
al. 2011) land surface model. The JASMIN system covers whole Australia at a
spatial resolution of 5 km. The system is run with an hourly time step and output is
stored at every third time step. The soil column in JASMIN is 3 m deep and is
divided into four layers of 0.1, 0.35, 0.65 and 2 m depth from the surface. The
present study briefly describes the verification of JASMIN against ground
observations and comparisons with current operational methods.
We apply three rescaling methods to calibrate the native JASMIN soil
moisture outputs so that they are compatible for use in fire prediction models
used by the fire agencies. The rescaling approaches applied and validated are:
minimum-maximum (MM) matching, mean-standard deviation (μ–σ) matching,
and cumulative distribution function (CDF) matching. Validation of the rescaled
products is performed here using the MODIS fire radiative power data.

AFAC18: PROCEEDINGS FROM THE BUSHFIRE AND NATURAL HAZARDS CRC & AFAC CONFERENCE 2018 | REPORT NO. 367.2018
292
RESULTS AND DISCUSSION
VERIFICATION OF JASMIN AGAINST GROUND OBSERVATIONS
The skill of JASMIN, KBDI and SDI is assessed using ground observations from the
CosmOz, OzNet and OzFlux networks. Figure 1 represents each model's skill over
different land use / land cover (LULC) for shallow soil layers. The LULC
classification is made based on the types over which the observation sites are
located. We broadly classify the land cover types into forests, woodlands,
grasslands and croplands. The northern Australian savannahs are classified as
woodlands. All pasture and grazing paddocks are included under grasslands. Of
the 81 sites in total across three networks, 16 are classified as croplands, 11 as
forests, 9 under woodlands and the remaining 45 under grasslands.
From a forest fire prediction perspective, it is interesting to note that KBDI
and SDI show a strong correlation with observations over forested sites (Fig 1a).
Forested regions generally receive a high annual rainfall total, which explains the
better performance of KBDI in terms of correlation. However, KBDI exhibits a
relatively large wet bias over these forested sites (Fig 1c). Also, the median
anomaly correlation of KBDI is less than 0.60 (Fig. 1d). This highlights the moderate
skill of KBDI in capturing the high frequency changes in moisture of forest litter
layer. SDI skill is generally better than KBDI for all land cover types. The most
probable reason for this is the use of a vegetation classification in SDI to estimate
soil dryness. Also, the assumption of evapotranspiration (ET) water loss as a linear
function of maximum temperature seems to be a more reasonable one than that
used in KBDI.

AFAC18: PROCEEDINGS FROM THE BUSHFIRE AND NATURAL HAZARDS CRC & AFAC CONFERENCE 2018 | REPORT NO. 367.2018
293
Figure 1. Skill of each model over various land cover types: a) Pearson’s correlation, b)
unbiased RMSD, c) bias, and d) anomaly correlation. The red, blue and green boxes and
whiskers represent JASMIN, KBDI and SDI respectively. The grouping is done based on the
land cover type of the observing site. The outliers are marked as diamonds.
JASMIN performs consistently better overall land cover types considered
here. The skill of JASMIN over grasslands is quite remarkable. The median
correlation between JASMIN and observations over grassland is about 0.83. The
corresponding anomaly correlation is 0.78. It also has better skill in simulating
moisture regimes over woodlands and croplands. Though KBDI and SDI have
slightly higher median correlation than JASMIN over forest sites (Fig. 1a), JASMIN
has lower unbiased RMSD (Fig. 1b), lower bias (Fig. 1c) and higher anomaly
correlation (Fig 1d) than the traditional models. These results arguably underline
the potential of JASMIN to be used in a variety of land related applications.
CALIBRATION OF JASMIN SOIL MOISTURE
The key aim of rescaling methods is to calibrate JASMIN outputs in units of
moisture excess to moisture deficit values with a dynamic range from 0 – 200 mm
in depth. As a demonstration of each calibration technique, a qualitative
evaluation of KBDI and rescaled JASMIN products against Moderate resolution
Imaging Spectro-radiometer (MODIS) fire radiative power (FRP) data are
presented in Fig. 2. The JASMIN product corresponds to the 0 – 350 mm soil profile.

AFAC18: PROCEEDINGS FROM THE BUSHFIRE AND NATURAL HAZARDS CRC & AFAC CONFERENCE 2018 | REPORT NO. 367.2018
294
The evaluation against MODIS FRP product reveals some characteristics
of each soil dryness datasets. For example, the MM method (Fig. 2b) generally
produces a drier soil than KBDI and other two methods. This causes the fires with
high intensity to correspond to drier soils One of the features of μ-σ (Fig. 2c) and
CDF (Fig. 2d) techniques is that they preserve the climatology of the dryness
index to which they are matched. This is apparent from the scatter plots (Fig. 2).
Some of the systems which use the soil dryness products may be tuned to offset
the bias in traditional indices. For such systems, μ-σ and CDF techniques thus offer
a product with improved correlations while preserving the climatology of the
traditional dryness index. The scatter plot of KBDI (Fig. 2a) shows that higher FRP
values occur over wet soils as well as dry soils. Generally, large intense fires are
associated with sufficiently dry live fuels and larger dead fuels. The drying of these
large fuel loads is associated with prolonged drought and hence large soil
moisture deficit. In that respect, it could be argued that the drier soils in MM
method corresponding to large FRP values present a more realistic scenario.
The results from the correlation analysis (Table 1) indicate that MM
matching, μ–σ matching and CDF matching methods have similar skill. The
Figure 2. Scatter plot depicting MODIS FRP product against a) KBDI, JASMIN rescaled using b)
MM, c) μ–σ, and d) CDF matching methods. The selected area corresponds to the state of
Victoria. JASMIN products correspond to 0-350 mm model soil profile. The datasets span from
January 2010 to February 2015.

AFAC18: PROCEEDINGS FROM THE BUSHFIRE AND NATURAL HAZARDS CRC & AFAC CONFERENCE 2018 | REPORT NO. 367.2018
295
negative values indicate that the model fields are in deficit form whereas
observations are given as soil moisture contents. The correlations of JASMIN
products decrease when the 0 – 1 m soil profile is used. This highlights the
representativity differences in model and observation soil horizons. CosmOz
observation depths are usually below 400 mm. Also, about 42% of the "deeper"
probes in OzFlux are located at 500 mm. Only 16% of the total sites have probes
located at 1 m. This possibly made the 0 – 350 mm model profile more
representative of observations than the 1 m profile.
In situ network Correlation Anomaly correlation
KBDI MM μ – σ CDF KBDI MM μ – σ CDF
0-350 mm profile
CosmOz
(Surface) -0.69 -0.84 -0.82 -0.79 -0.47 -0.66 -0.61 -0.59
OzFlux (Surface) -0.75 -0.80 -0.80 -0.79 -0.58 -0.70 -0.68 -0.66
OzFlux (Root
zone) -0.86 -0.85 -0.85 -0.85 -0.65 -0.63 -0.63 -0.62
0-1 m profile
CosmOz
(Surface) -0.69 -0.73 -0.70 -0.67 -0.47 -0.57 -0.55 -0.54
OzFlux (Surface) -0.75 -0.74 -0.73 -0.71 -0.58 -0.64 -0.61 -0.60
OzFlux (Root
zone) -0.86 -0.82 -0.82 -0.82 -0.65 -0.63 -0.62 -0.60
Table 1. Pearson’s product-moment correlations of KBDI and JASMIN based soil moisture
deficit products against in-situ soil moisture observations. The values represent a network
average.
SUMMARY
The present study underlines some of the limitations of traditional soil dryness
indices in producing accurate soil moisture estimates, particularly for a shallow
soil layer. One limitation of the traditional indices is that they use a single soil
horizon to represent variations in both surface and root zone layers. The new
JASMIN system can address gaps in the present operational methods by
providing accurate soil moisture information in different layers. The JASMIN has
shown to provide good skill in estimating soil moisture at both surface and root
zone layers.
Considering the significant effort required to adopt any new source of
information in operations, the calibration provides an opportunity to make a
substantial improvement to the existing system with the least amount of
resources. However, in the longer term, we envisage the adoption of JASMIN soil
moisture in its native form for operational fire danger ratings. This will potentially
reduce the loss of information arising from any form of calibration. The new
Australian national fire danger rating system plans to incorporate JASMIN soil
moisture information in its native form to estimate fuel availability.

AFAC18: PROCEEDINGS FROM THE BUSHFIRE AND NATURAL HAZARDS CRC & AFAC CONFERENCE 2018 | REPORT NO. 367.2018
296
REFERENCES
Best, M. J., Pryor, M., Clark, D. B., Rooney, G. G., Essery, R. L. H., Menard, C. B.,
Edwards, J. M., Hendry, M. A., Porson, A., Gedney, N., Mercado, L. M., Sitch,
S., Blyth, E., Boucher, O., Cox, P. M., Grimmond, C. S. B., and Harding, R. J.,
2011: The Joint UK Land Environment Simulator (JULES), model description -
Part 1: Energy and water fluxes, Geoscientific Model Development, 4(3), 677–
699. doi:10.5194/gmd-4-677-2011.
Dharssi, I., and Vinodkumar, 2017: A prototype high resolution soil moisture
analysis system for Australia, Bureau of Meteorology Research Report, No.
026.
Keetch, J. J. and G. M. Byram, 1968: A drought index for forest fire control.
Research Paper SE-38, USDA Forest Service: Asheville, NC, USA.
McArthur A. G., 1967: Fire Behaviour in Eucalypt Forest, Australian
Commonwealth Forestry and Timber Bureau Leaflet, 107, pp. 25.
Mount, A., 1972: The derivation and testing of a soil dryness index using run-off
data. Technical report, Tasmanian Forestry Commission, Hobart, Tasmania.
Vinodkumar, Dharssi, I., Bally, J., Steinle, P., McJannet, D., and Walker, J., 2017:
Comparison of soil wetness from multiple models over Australia with
observations. Water Resources Research, 53, doi:10.1002/2015WR017738.

AFAC18: PROCEEDINGS FROM THE BUSHFIRE AND NATURAL HAZARDS CRC & AFAC CONFERENCE 2018 | REPORT NO. 367.2018
297
PLANNING AND CAPABILITY REQUIREMENTS FOR CATASTROPHIC AND CASACADING EVENTS Non-peer reviewed research proceedings from the Bushfire and Natural
Hazards CRC & AFAC conference
Perth, 5 – 8 September 2018
Andrew Gissing1,4, Michael Eburn2,4 and John McAneney1,4 1 Risk Frontiers 2 Australian National University 3 Macquarie University 4 Bushfire and Natural Hazards CRC
Corresponding author: [email protected]

AFAC18: PROCEEDINGS FROM THE BUSHFIRE AND NATURAL HAZARDS CRC & AFAC CONFERENCE 2018 | REPORT NO. 367.2018
298
ABSTRACT
Catastrophic events pose unique challenges and are inevitable. Previous reviews
have highlighted gaps in Australia’s preparedness for catastrophic disasters.
Australia has no recent experience of a catastrophe, with the Spanish Flu (1918-
1919) and Cyclone Tracey (1974) being perhaps two historic examples that have
overwhelmed systems of management. Catastrophic events require the
adoption of a whole of community approach. However, this is challenged by the
culture of emergency services and wider community apathy. This report provides
insights into building increased preparedness to reduce the occurrence of
catastrophic disasters based upon a review of the global literature. Implications
for practitioners are discussed.
INTRODUCTION
Natural disasters are a significant risk globally (World Economic Forum, 2018). The
extreme end of possible disasters, so called catastrophic disaster risks, however,
attract limited attention compared with either more frequent smaller and thus
manageable events, or previous historical events. This is certainly the case in the
context of the Australian emergency management sector, which remains
strongly response-focused. Previous reviews into the preparedness of the
Australian emergency management sector have recognised this limitation
(Council of Australian Governments, 2002, Catastrophic Disasters Emergency
Management Capability Working Group, 2005, Crosweller, 2015, Australian
Government, 2016, Government of Western Australia, 2017) and the same is true
for many other western nations (9/11 Commission, 2004, Davis, 2006, US
Government Accountability Office, 1993, State of Oregon, 2018).
In what follows we review literature, policies and plans in order to identify key
attributes of catastrophic events and to define key elements crucial to better
inform planning and preparedness efforts to minimize the occurrence of
catastrophic events. Implications for practitioners are discussed.

AFAC18: PROCEEDINGS FROM THE BUSHFIRE AND NATURAL HAZARDS CRC & AFAC CONFERENCE 2018 | REPORT NO. 367.2018
299
DEFINING CATASTROPHIC DISASTER CHARACTERISTICS
The term catastrophe is widely used and numerous definitions exist, though in
many regards the true scale of a catastrophe is largely contextual. Common
listed attributes allude to their extraordinary impacts that overwhelm the normal
functioning of societies and require different approaches to their management
(Quarantelli et al., 2006). In this sense they are different from more routine events
which do not interfere with the normal functioning of the community.
For the Australian Emergency Management Committee, a catastrophe has to
be:
beyond our current arrangements, thinking, experience and imagination.
In other words, a catastrophe is an event so big that it overwhelms our social
systems and resources, and degrades or disables governance structures and
strategic and operational decision-making.
The hallmarks of catastrophes are death and destruction, large-scale disruption,
displacement of populations and public anxiety. Often these occur with little to
no warning (such as large earthquakes), although they may also onset slowly,
growing in size and duration, as in the case of droughts, disease and food
shortages. After events that overwhelm the capacity of institutions and the
community to cope, we may see emergency systems, communications and
plans all failing and leaving leaders out of touch with what is happening on the
ground. Local emergency response personnel maybe directly impacted
themselves, and thus unable to perform their professional roles. Resources from
neighbouring regions may also be impacted or unavailable. Emergency leaders
are confronted with overwhelming issues, of a scale of complexity and
uncertainty they may never have experienced nor imagined. Information about
impacts and needs of affected communities maybe limited for days after an
event, meaning that decisions will often have to be made in the absence of
complete information. The event becomes subject to significant national and
international media scrutiny, and inevitably, political involvement.
Some catastrophic events may be cascading in nature, escalating in their
impacts as interconnected systems fail successively yielding yet further impacts
and making recovery more complex and prolonged. Essential infrastructure --
water, gas, sewage, power, healthcare, banking, transport, emergency
response and communication -- becomes severely disrupted. Restoration may
take months and disease and fires may wreak further havoc. In some events,
disruptions may reach global proportions.
Catastrophic events will typically impact large areas (Barnshaw et al., 2008) and
may not respect borders or boundaries resulting in unclear accountabilities

AFAC18: PROCEEDINGS FROM THE BUSHFIRE AND NATURAL HAZARDS CRC & AFAC CONFERENCE 2018 | REPORT NO. 367.2018
300
amongst responding agencies, and conflicting public messaging. Such
disruption and confusion can reach global scales.
The recovery of communities may take many years, with the impacted
population displaced, some choosing to re-locate to other areas permanently.
Many of those affected may suffer long lasting psychological trauma. Economic
losses can be severe as industry and agriculture is disrupted, businesses close
down or make yet further demands on Government for recovery support.
Recent examples of catastrophic disaster include: September 11 Terrorist attacks
(2001), Indian Ocean Boxing Day tsunami (2004), Hurricane Katrina (2006),
Cyclone Nargis, Myanmar (2008), Russian heatwave (2010), Haiti earthquake
(2010), Christchurch earthquake sequence (2011) and Japanese earthquake
and tsunami (2011). For Australia, the Spanish flu pandemic (1918-19) stands out
as one example of an event that overwhelmed Australia’s management systems
and which resulted in extraordinary impacts (12000 deaths). Tropical Cyclone
Tracey in 1974 also serves as an example of an event to completely overwhelm
an Australian city, leaving only 6% of the city’s housing stock habitable (Stretton,
1975).
Crosweller (2015) believes a catastrophe in Australia is inevitable with many
scenarios such as extraordinary floods, bushfires, tsunami, cyclones, pandemics,
infrastructure failures and heatwaves all having annual probabilities of less than
1-in-500 years on average. Solar storms, large earthquakes and global volcanic
mega-eruptions also pose a risk but at even less frequent or uncertain
probabilities. Our nation may also be susceptible to a series of smaller damaging
events whose impacts compound into a much larger catastrophe. In some
instances, however, the interactions between complex systems (Masys, 2012, t
Hart, 2013, Cavallo and Ireland, 2014, Boin and t Hart, 2010) or knowledge gaps
due to poor information sharing (Government Office for Science, 2012,
Alexander, 2010) may yield unimagined and unpredictable consequences.
Almost no Australian emergency manager will have experienced a nationally
significant catastrophe event.
While many catastrophic disaster risks are either known or can be imagined, they
are largely unappreciated as was illustrated in the cases of Hurricane Katrina
(Comfort, 2005) and the Fukushima nuclear disaster (Funabashi and Kitazawa,
2012).

AFAC18: PROCEEDINGS FROM THE BUSHFIRE AND NATURAL HAZARDS CRC & AFAC CONFERENCE 2018 | REPORT NO. 367.2018
301
MANAGEMENT OF CATASTROPHE
It’s doubtful whether a catastrophe event is manageable but emergency
managers can act to reduce loss of life and property and help sustain the
continuity of affected communities (Harrald, 2006). Response strategies that work
for smaller, more frequent events will be quickly overwhelmed and prove
ineffective. By necessity, community members become first-responders (Tierney,
1993, Whittaker et al., 2015). Often the success of the response is reliant upon the
capacities already present in communities. Social research has shown that rather
than panic or be shocked and dazed, communities impacted by catastrophe
typically act proactively and work to assist others forming groups often based on
pre-disaster ties (Tierney, 1993). Emergent groups typically arise when the
demands of the community are not being met by government or officials; when
existing traditional structures are inadequate; or when the community feels it is
necessary to become involved (Drabek and McEntire, 2003). Emergent groups
often have the advantage of real time situational awareness, knowledge of
specific community vulnerabilities and can configure their responses to best
meet local needs (Whittaker et al., 2015).
No one organisation alone is capable of responding to all aspects of a
catastrophe (Benini, 1999, Fugate, 2017a). In the case of Hurricane Katrina some
535 organisations, ranging from non-government, commercial, infrastructure,
emergent, interest and faith-based organisations, were involved (Comfort and
Haase, 2006). There is a need to integrate and coordinate operations of such a
large number of disparate organisations (Boin and Bynander, 2015). This
approach is embodied in the whole of community approach philosophy
adopted by FEMA in the US.
Traditional command and control methods of incident management that do not
attempt to collaborate with communities are unlikely to be effective (Nohrstedt
et al., 2018, Quarantelli, 1988, Drabek and McEntire, 2003, Tierney, 1993, Boin and
t Hart, 2010). For example, Ellis and MacCarter (2016) concluded that the
Incident Command System did not integrate well with groups that emerged
following the Christchurch earthquakes in 2010 and 2011. A review of Australian
emergency management plans revealed that rarely do these plans detail
methods for the integration of community responses in the immediate aftermath
of an event. One exception is the Victorian State Flood Plan, which outlines a
strategy for the deployment of community liaison officers to support community
groups with logistics and risk management.
Recognising the capacity of the community itself to respond, it is essential to
adopt a more flexible and collaborative approach to inspire, integrate, support
and coordinate community efforts and allow for improvisation. Bureaucratic
structures and processes such as disaster declarations and mandatory
registration of spontaneous volunteers will only hinder community-led efforts
(Kapucu and Van Wart, 2006). For example following September 11 there was
little time or desire to develop a controlling structure over the flotilla of craft that

AFAC18: PROCEEDINGS FROM THE BUSHFIRE AND NATURAL HAZARDS CRC & AFAC CONFERENCE 2018 | REPORT NO. 367.2018
302
spontaneously assisted the evacuation of some 300,000 to 500,000 people from
lower Manhattan; attempting to do so may have only slowed and undermined
the response (Wachtendorf and Quarantelli, 2003).
It must be recognised that the capacities of communities are not infinite and that
there will still be a need for external supporting resources from across
government, defence, humanitarian, infrastructure, non-government,
community, faith based and private sector organisations. For example following
Hurricane Sandy (2012) some 70,000 utility workers were mobilised to restore
infrastructure through mutual aid agreements and logistical support from the
defence force (Kaufman et al., 2015).
An enhanced management model for response and recovery would be
enabled by decentralised locally-based decision-making. It would need to
acknowledge emergent community groups, local innovations and existing
networks (Dynes, 1990, Kapucu and Van Wart, 2006, Boin and McConnell, 2007)
and be supported by higher-level coordination efforts (Carayannopoulos, 2017).
At times to inform wider resource mobilisation and overcome dysfunctional local
relationships it may be necessary to supplement this approach with the forward
deployment of a senior emergency management controller. This happened
after the Christchurch earthquake (2011) and Cyclone Tracey (1974). Such a
model, however, may be at odds with the wishes of politicians who wish to be
seen as ‘taking control’ placing at-risk networked and decentralised models
(Nohrstedt et al., 2018).
Success requires proactive responses to ensure that significant support can be
provided to assist and mobilise the community when it is at its most vulnerable,
often within the first 72 hours after a catastrophe when the scale of an event may
still be influenced. The early movement of significant resources, however, is
complex, and there may be inevitable delays leaving impacted communities on
their own. Decision-making to commit significant outside resources will take
place under great uncertainty and in anticipation of catastrophic
consequences (Fugate, 2011). In some instances Australia is further challenged
in mobilizing support to remote areas. For this reason it is vital that planning to
support communities be integrated with logistical components often managed
by different organisations.
Understanding supply chains for key commodities will be time well spent. In many
cases the private sector can be more efficient. During the response to Hurricane
Sandy, for example, the private sector was able to move eight times the amount
of food into affected areas compared with the combined responses of
government and other non-government organisations (Kaufman et al., 2015).

AFAC18: PROCEEDINGS FROM THE BUSHFIRE AND NATURAL HAZARDS CRC & AFAC CONFERENCE 2018 | REPORT NO. 367.2018
303
DISCUSSION AND CONCLUSIONS
Though the importance of integrating emergency response with community
capacity emerges as a clear theme through the research literature, this is
challenged by the reality that many communities tend to be disinterested in
preparing for frequently occurring risks such as floods, bushfires and heatwaves,
let alone risks that may occur much more rarely (FEMA, 2017a). Such disinterest
operates within the wider background of increasing community expectations
placed upon emergency services. This is evidenced by the blame game of
public inquires held after each significant natural hazard event.
There needs to be a shift in emergency management culture from rhetoric to
honest dialogue with communities. There is a real limit to what emergency
managers can achieve in the face of natural catastrophes. As the first
responders, citizens need to be encouraged to develop a greater degree of self-
reliance. In New Zealand citizens are told to expect that for the first 72 hours they
may be on their own after a significant event. Similar messaging needs to be got
across to the Australian public.
There is a need to identify measures that incentivise community participants to
get involved. In the United States, the sharing of situational awareness
information has been shown to incentivise large businesses to become involved
and to utilise such information to better direct their own efforts to service
impacted areas (Gissing, 2017).
From a practical perspective, our research has revealed the following insights for
emergency managers:
• Consideration of realistic disaster scenarios and the sharing of this
knowledge beyond the emergency management sector, should
improve risk assessments. The realism of such scenarios will always be
challenged by data availability and decision makers must appreciate
the uncertainties involved. Some of this uncertainty arises from using
short historical records.
• Emergency management planners may choose to adopt quantitative
approaches to scenarios modelling as utilised in the insurance sector.
• Planning must focus on developing a thorough understanding of the
community and its capabilities and capacity. To assist in integrating
community capabilities planners should map key community networks
and identify organisations best suited to assist in the leadership,
coordination and support of community-based capabilities (Dynes,
1990, Tierney, 1993, Wachtendorf and Quarantelli, 2003). Emergency
managers should then build relationships and trust with these
organisations.
• Recognising the limitations of Australia’s catastrophic disaster
experience there is a need to consider frameworks for building
experience perhaps through international exchanges, and to

AFAC18: PROCEEDINGS FROM THE BUSHFIRE AND NATURAL HAZARDS CRC & AFAC CONFERENCE 2018 | REPORT NO. 367.2018
304
leverage experience that may rest in Australia’s humanitarian and
defence sectors. Training and exercising specific to possible
catastrophes should be delivered.
Overall, preparing for catastrophes must accept the inevitability of catastrophic
events and move towards an inclusive emergency management model that
embraces the whole of community. Such thinking must be championed by
leaders to inspire cultures that are both focused on collaboration and
preparedness in the context of catastrophic events.

AFAC18: PROCEEDINGS FROM THE BUSHFIRE AND NATURAL HAZARDS CRC & AFAC CONFERENCE 2018 | REPORT NO. 367.2018
305
REFERENCES
9/11 COMMISSION 2004. Final report of the national commission on terrorist
attacks upon the United States. Washington, DC: US Government.
ALEXANDER, D. E. 2010. The L'Aquila earthquake of 6 April 2009 and Italian
Government policy on disaster response. Journal of Natural Resources
Policy Research, 2, 325-342.
AUSTRALIAN GOVERNMENT 2016. A capability roadmap: enhancing
emergency management in Australia 2016. Canberra: Attorney-
General's Department.
BARNSHAW, J., QUARANTELLI, E. & LETUKAS, L. 2008. The characteristics of
catastrophes and their social evolution: An exploratory analysis of
implications for crisis policies and emergency management procedures.
BOIN, A. & T HART, P. 2010. Organising for effective emergency management:
lessons from Research. Australian Journal of Public Administration, 69,
357-371.
CATASTROPHIC DISASTERS EMERGENCY MANAGEMENT CAPABILITY WORKING
GROUP 2005. Review of Australia's Ability to Respond to and Recover
From Catastrophic Disasters. Canberra: Australian Emergency
Management Committee.
CAVALLO, A. & IRELAND, V. 2014. Preparing for complex interdependent risks: a
system of systems approach to building disaster resilience. International
journal of disaster risk reduction, 9, 181-193.

AFAC18: PROCEEDINGS FROM THE BUSHFIRE AND NATURAL HAZARDS CRC & AFAC CONFERENCE 2018 | REPORT NO. 367.2018
306
COMFORT, L. K. Fragility in disaster response: Hurricane Katrina, 29 August 2005.
The forum, 2005.
COUNCIL OF AUSTRALIAN GOVERNMENTS 2002. Natural Disasters in Australia.
Canberra, Australia.
CROSWELLER, M. 2015. Improving our capability to better plan for, respond to,
and recover from severe-to-catastrophic level disasters. Australian
Journal of Emergency Management, 30, 41.
DAVIS, T. 2006. Select Bipartisan Committee to Investigate the Preparation for
and Response to Hurricane Katrina. Final Report. US House of
Representatives, February, 15.
FUNABASHI, Y. & KITAZAWA, K. 2012. Fukushima in review: A complex disaster, a
disastrous response. Bulletin of the Atomic Scientists, 68, 9-21.
GOVERNMENT OF WESTERN AUSTRALIA. 2017. Emergency Preparedness Report
2017. Available:
https://www.oem.wa.gov.au/Documents/Publications/PreparednessRep
orts/2017SEMCEmergencyPreparednessReport.pdf.
GOVERNMENT OFFICE FOR SCIENCE 2012. High impact low probability risks:
Blackett review. Government Office for Science.
MASYS, A. 2012. Black swans to grey swans: revealing the uncertainty. Disaster
Prevention and Management: An International Journal, 21, 320-335.
QUARANTELLI, E., LAGADEC, P. & BOIAN, A. 2006. Handbook of Disasater
Research, New York, Springer.
STATE OF OREGON 2018. The State Must Do More to Prepare Oregon for a
Catastrophic Disaster.

AFAC18: PROCEEDINGS FROM THE BUSHFIRE AND NATURAL HAZARDS CRC & AFAC CONFERENCE 2018 | REPORT NO. 367.2018
307
STRETTON, A. 1975. Darwin Disaster: Cyclone Tracey. Canberra: Natural Disasters
Organisation.
T HART, P. 2013. After Fukushima: reflections on risk and institutional learning in
an era of mega‐crises. Public Administration, 91, 101-113.
US GOVERNMENT ACCOUNTABILITY OFFICE 1993. Disaster Management:
Improving the Nation's Response to Catastrophic Disasters.
WORLD ECONOMIC FORUM. 2018. The Global Risk Report 2018 - 13th Edition.
Available: http://www3.weforum.org/docs/WEF_GRR18_Report.pdf.

AFAC18: PROCEEDINGS FROM THE BUSHFIRE AND NATURAL HAZARDS CRC & AFAC CONFERENCE 2018 | REPORT NO. 367.2018
308
EMERGENCY VOLUNTEERING 2030: A SECTOR-WIDE, MANAGEMENT PERSPECTIVE Non-peer reviewed research proceedings from the Bushfire and Natural
Hazards CRC & AFAC conference
Perth, 5 – 8 September 2018
Blythe McLennan1,2 and Tarn Kruger1,2 1 School of Global, Urban and Social Studies, RMIT University 2 Bushfire and Natural Hazards CRC
Corresponding author: [email protected]

AFAC18: PROCEEDINGS FROM THE BUSHFIRE AND NATURAL HAZARDS CRC & AFAC CONFERENCE 2018 | REPORT NO. 367.2018
309
ABSTRACT
EMERGENCY VOLUNTEERING 2030: A SECTOR-WIDE, MANAGEMENT PERSPECTIVE
Blythe McLennan and Tarn Kruger
School of Global, Urban and Social Studies, RMIT University, VIC
What is emergency volunteering going to look like in 2030? How (and by whom)
is it going to be organised? How can the emergency management sector best
enable the value of this volunteering for communities - before, during and after
emergencies? Researchers at RMIT University are seeking answers to these
questions in a three-year project for the Bushfire and Natural Hazards CRC.
This presentation shares insights from the first stage of this project. It provides a
sector-wide, management perspective on what the sector most needs to do to
adapt to the future of volunteering. It is based on interviews with 27 managers
in volunteerism from across Australian government and non-government
emergency management organisations (EMOs).
Volunteerism managers paint a strong picture of the preferred future as being
one where volunteering and management approaches are more flexible and
adaptive to the needs of both communities and volunteers, where EMOs have
stronger cultures of volunteerism, and where the sector is far more outward-
looking and collaborative in its service delivery than it is today. While past
research on the sustainability of emergency volunteering has mostly focused on
activity at the level of specific management practices, volunteerism managers
earmark changes needed at organisational and sector levels. These changes
even extend into potential redesign of the ways in which emergency
management services are provided to communities in different settings, as well
as who is involved in providing them.
INTRODUCTION
What is emergency volunteering going to look like in 2030? How (and by whom)
is it going to be organised? How can the emergency management sector best
enable the value of this volunteering for communities - before, during and after
emergencies? Researchers at RMIT University are seeking answers to these
questions in a three-year project for the Bushfire and Natural Hazards CRC.
This paper summarises insights from the first stage of this project. It provides a
sector-wide, management perspective on what the sector most needs to do to
adapt to the future of volunteering. It is based on interviews with 27 managers
in volunteerism from across Australian state government and non-government
emergency management organisations (EMOs). Quotes from interviews used in
AFAC18: PROCEEDINGS FROM THE BUSHFIRE AND NATURAL HAZARDS CRC & AFAC CONFERENCE 2018 | REPORT NO. 367.2018
310
this report have been de-identified and are referred to with a unique ID number
preceded by either GV (governmental EMO) or NG (non-governmental EMO).
VIEWS FROM VOLUNTEERISM MANAGERS
WHAT HAS CHANGED IN THE EMERGENCY VOLUNTEERING LANDSCAPE OVER THE LAST 5-10 YEARS? When asked what has changed in the last five to ten years in emergency
volunteering, managers painted a picture of a sector that has become more
rigid, regulated and slow-to-change while the external environment has
become more dynamic, empowered, and fast-paced:
One of the challenges I was just talking about then is the bureaucracy,
because there will come a point where, and we experience that now,
where emergent forms of volunteering go against the government
and the risk averse attitude we have. We don’t want to take risks. We
like doing things slowly and we have got to change. We have got to
move more quickly if we want to remain the leading people who
respond to storm and flood and bushfires and everything else the
sector does (GV2).
Regarding the internal environment within the emergency management
sector, managers described increasing professionalisation combined with
growing government regulation of volunteering, as well as mounting
administrative and training burdens on affiliated emergency volunteers. They
also referred to organisational restructures that have occurred, and increases in
capacity in volunteer management in recent years, particularly at more
strategic levels.
Regarding changes in the external environment, all managers referred to
changes in the way people volunteer and the growth of shorter-term and more
informal volunteering. Many, particularly government managers, also described
changes in communities that impact on volunteering, particularly urbanization,
rural decline and depopulation, increased mobility of people, and greater
diversity within and between communities. Another external change
emphasised by government managers in particular, was increasing
governmental and societal expectations of, and demands on, volunteers and
emergency management organisations.
WHAT ARE THE KEY VOLUNTEERING ISSUES THE SECTOR IS CURRENTLY FACING? There was unanimous agreement amongst managers that the key volunteering
issue the sector currently faces is volunteer sustainability in the face of the
changing landscape of volunteering. Addressing the implications of the rise of
spontaneous volunteering was a second challenge highlighted by many
managers.

AFAC18: PROCEEDINGS FROM THE BUSHFIRE AND NATURAL HAZARDS CRC & AFAC CONFERENCE 2018 | REPORT NO. 367.2018
311
Managers revealed several layers to the volunteer sustainability challenge (see
Table 1). These included the well-known recruitment and retention challenges,
but they also reached more deeply into the nature of volunteer management
models, the ways that emergency management services are designed and
delivered, relationships between the sector and the communities it serves, and
culture in emergency service agencies and across the sector.
Layers within the volunteer
sustainability challenge
Example quotes
Recruitment and retention
practices are out-of-date
Our issues are the standard ones about - how do we maintain
and sustain our volunteer workforce, given we can’t pay
them? What roles do we need them to perform? How do we
match the expectations of people wanting to volunteer with
the kind of roles we have available? How do we maintain
motivation and commitment over time (GV1)?
Organisational volunteer models
are too rigid and narrow
I think if we continue our old way of thinking that volunteers
sign up for life, we are not going to survive […] Our current way
of doing it is not sustainable (NG1).
A culture of volunteerism is not
well-embedded in emergency
service agencies
You walk around the organisation, and not with all people, but
you’ll hear things like “oh, volunteers are really difficult to work
with. You can’t engage them. They’re not interested.” There’s
a mythology which turns into attitude which is reflected in
behaviour around volunteers and what they are (GV9).
Service delivery models are overly
bureaucratic and inward-looking
The fundamentals of the business [are not working] as in how
do we do what we do with what we’re actually provided to
do that work? How do we use the resources? How do we use
the fire services? How do we actually apply that in the smartest
way, the most innovative way, but particularly, most
importantly, that meets the end users’ needs (GV8)?
Organisations are not well-
connected to their communities
When we’ve got an organisation now where volunteers are
openly admitting they’ve got no connection with their
community, many do but there are many that don’t, then you
need to look at that and go, “well, what are we doing here
and why are we existing as an organisation?” (GV12)
The command-and-control
culture of the sector is
exclusionary
Culture [is the biggest challenge for volunteer sustainability
moving forward]; changing the emergency service
organisation culture to be inclusive and collaborative (GV11).
TABLE 1: THE MULTIPLE LAYERS OF THE VOLUNTEER SUSTAINABILITY CHALLENGE RAISED BY VOLUNTEERISM MANAGERS

AFAC18: PROCEEDINGS FROM THE BUSHFIRE AND NATURAL HAZARDS CRC & AFAC CONFERENCE 2018 | REPORT NO. 367.2018
312
WHAT IS HAPPENING TO ADDRESS THESE ISSUES? Two key activities currently happening at the level of management practices to
address these issues were:
• Implementing youth and diversity programs, particularly those targeting
recruitment of young people, women and people from culturally and
linguistically diverse communities (e.g. CFS cadet program, NT PFES
communications translated into local indigenous languages); and
• Improving mechanisms for volunteer engagement and training,
particularly through the introduction of new technology (e.g. DFES and St
John Ambulance WA volunteer portals), and streamlining volunteer
induction and training (ACT ESA’s Recruit Colleges).
At the organisational level, a number of organisations are developing and
trialing new volunteer models focused on greater flexibility and diversity in
volunteering roles (e.g. NSW SES Volunteering Reimagined Strategy, CFA
Flexible Volunteering Pilot, QFES Volunteerism Strategy, DFES On-boarding
Project with UWA, St John Ambulance Vic Community Transport Program).
Three areas of sectoral level activity emphasised by managers were:
• Planning and collaborating for the coordination of spontaneous
volunteering (e.g. with volunteering peak bodies);
• Integrated delivery of services, particularly in less densely populated and
smaller jurisdictions (e.g. SAFECOM integrating youth programs with St
John Ambulance and Scouts, WA Volunteer Fire and Emergency
Services, Ambulance Victoria/St John Ambulance MOU), and;
• Sharing learning and undertaking research (e.g. EMV 3Vs project, AFAC
groups, DFES-UWA projects, informal exchange of information and
learning).

AFAC18: PROCEEDINGS FROM THE BUSHFIRE AND NATURAL HAZARDS CRC & AFAC CONFERENCE 2018 | REPORT NO. 367.2018
313
WHAT DOES THE PREFERRED FUTURE LOOK LIKE? Questions about potential and preferred futures are difficult to answer as they
require thinking beyond current experiences, contexts and structures.
Notwithstanding, as Box 1 shows, managers painted a strong picture of a future
where volunteering and management approaches are more flexible and
adaptive to the needs of both communities and volunteers, where EMOs have
stronger cultures of volunteerism, and where the sector is far more outward-
looking and collaborative than it is today.
Notably, there was strong consistency amongst the elements that managers
prioritised for the future. One point of difference, however, was the extent to
which they emphasised the importance of regulating versus enabling
community-based and emergent (i.e. spontaneous) volunteering that is not
affiliated with EMOs.
BOX 1: A PICTURE OF THE PREFERRED FUTURE PAINTED BY VOLUNTEERISM MANAGERS
Formal volunteering and volunteer management practice
• Flexible, lower-commitment, & life-cycle volunteering opportunities exist.
• Volunteers come from all segments of society, and volunteering is appealing and
accessible to a wide range of people.
• It is easy for people to become a volunteer, get fit-for-purpose training, and
continue to volunteer.
Organisational culture & structures
• Community-based & emergent volunteering is supported & (digitally) enabled by
EMOs to co-deliver EM services.
• Volunteers are supported and empowered by EMOs to connect with their
communities.
• Volunteers and volunteer management are valued and appropriately resourced,
and a culture of volunteerism is embedded across EMOs.
The sector and its relationship with communities
• There is deep collaboration across the sector that enables more coordinated,
integrated, and efficient service delivery.
• Service delivery is adaptive to, and directly shaped by, community risks, needs
and priorities.
• The emergency management sector is agile, forward-looking, open and
externally-focused.
• Emergency management services are collaboratively delivered with
communities and the organisations that support them.

AFAC18: PROCEEDINGS FROM THE BUSHFIRE AND NATURAL HAZARDS CRC & AFAC CONFERENCE 2018 | REPORT NO. 367.2018
314
WHAT NEEDS TO HAPPEN TO MOVE TOWARDS THIS FUTURE? Managers identified numerous priorities for what needs to happen to move the
sector towards this preferred future for volunteering. A selection of key priorities
identified are described in tables below. While some of these sat at the level of
volunteer management practices to improve recruitment and retention (Table
2), many involved organisational (Table 3) and sector level change (Table 4).
Formal volunteering & volunteer
management practice
Example quotes
Continue to increase mobility,
diversity and flexibility in formal
volunteering
As more and more people move into like city centres and may
lose some of that geographic communities and as their idea of a
community starts to change and our appreciation that people’s
communities are not just about who their neighbour is but who
they see on a regular basis. And that we have to be responsive to
that, we have to see how we can adapt our model and what we
can offer volunteers to ensure that it meets their needs and meets
their motivations (NG13).
Engage volunteers deeply in
solving problems and designing
solutions
“In terms of day-to-day, I don’t care what anyone says, the future
of the organisation depends on putting frameworks in place to
allow our staff to get out and talk to the volunteers. If they can’t
get out and openly engage and problem-solve with the
volunteers on the ground then we will continue to have the
problems we’ve always had (GV12).
Streamline, target and tailor
recruitment, training, and
deployment of volunteers,
including greater recognition of
prior skills
[Our organisation] has said that they would like to have in place,
and it exists in other countries, that we are able to on-board a
volunteer in 10 minutes. That is what should be happening in 2030.
And that would mean we could be very proactive and by 2030
we would be far more sophisticated in acknowledging pre-
existing skill sets (NG1).
TABLE 2: KEY MANAGEMENT PRACTICE PRIORITIES FOR CHANGE IDENTIFIED

AFAC18: PROCEEDINGS FROM THE BUSHFIRE AND NATURAL HAZARDS CRC & AFAC CONFERENCE 2018 | REPORT NO. 367.2018
315
Organisational culture and
structures
Adequately resource and staff
volunteer management and
support
[Volunteer sustainability] has never really been looked at in the
[organisation] apart from it has been someone’s side job to do.
But now every rock I lift up there is work here, and there is more
work to do there, and there is just so much work to do in the
different spaces and not enough people to do it (GV2).
Carefully, sensitively and
actively manage cultural
change
…then you need to, through a comprehensive engagement
program, analyse and put in ways to mitigate or reduce
resistance to cultural change, which will be required to ensure
that change can run as smoothly as possible (GV12).
Develop mechanisms to
engage and coordinate with
new volunteer-led groups and
emergent volunteering
We are trying to engage with people when they spring up
following an emergency; to talk with them, to work with them, to
let them know what we do and help them and they can help us,
rather than see them as competition (NG2).
Build deeper relationships with
corporates and the private
sector
“I really see volunteering as a very opportune gateway for […]
people to get corporates involved with the organisations (NG5).
TABLE 3: KEY ORGANISATIONAL PRIORITIES FOR CHANGE IDENTIFIED
The sector and its relationship with
communities
Build a strong evidence base for
the value of volunteering and of
what works in adapting to the
changing landscape
The stories that are based on evidence-based outcomes are
going to be the ones that are going to sell in future. We need
to be able to: one, better understand where those potential
good stories are, and then two, actively do those pilots or
programs to demonstrate that they will work (GV12).
Implement mechanisms to better
understand community risk, needs
and priorities
It’s very simple to say community-centred, community-
focused. I’d prefer to actually get a bit more descriptive about
what that is. It’s about understanding that all community, it has
a whole lot of people in there that are end users that have
specific needs (G8).
Implement more integrated and
locally-tailored service delivery in
collaboration with communities,
particularly in rural & remote areas
To make it [the preferred future] happen, a pragmatic
conversation on: What are the risks in community? What are
the risks in rural areas? And what are the resources required to
meet these risks? And then work as one to break down the
organisational barriers to achieve this (GV3).
TABLE 4: KEY SECTOR LEVEL PRIORITIES FOR CHANGE IDENTIFIED
CONCLUSION AND FURTHER RESEARCH
Past research on the sustainability of emergency volunteering has mostly
focused on activity at the level of specific management practices. By contrast,
the picture painted by volunteerism managers reveals that ensuring volunteer

AFAC18: PROCEEDINGS FROM THE BUSHFIRE AND NATURAL HAZARDS CRC & AFAC CONFERENCE 2018 | REPORT NO. 367.2018
316
sustainability and enabling the value of volunteering for communities into the
future is likely to involve organisational and sector level changes. The changes
earmarked even extend into potential redesign of the ways in which
emergency management services are provided to communities in different
settings, as well as who is involved in providing them.
In the next stages of this project, researchers will bring together the views of
volunteerism managers with local government managers, community
engagement managers, volunteer leaders, and community and voluntary
sector organisations. The combined findings will be presented to an expert
panel to distil and identify key themes and priorities to inform and enrich
decision-making about what is an uncertain and contested, but fast-
approaching, future for emergency volunteering and volunteer management.

AFAC18: PROCEEDINGS FROM THE BUSHFIRE AND NATURAL HAZARDS CRC & AFAC CONFERENCE 2018 | REPORT NO. 367.2018
317
THE EMERGING IMPERATIVE OF DISASTER JUSTICE
Peer reviewed research proceedings from the Bushfire and Natural Hazards CRC &
AFAC conference
Perth, 5 – 8 September 2018
Dr Anna Lukasiewicz & Emeritus Professor Stephen Dovers
The Fenner School of Environment and Society, Australian National University
Corresponding author: [email protected]

AFAC18: PROCEEDINGS FROM THE BUSHFIRE AND NATURAL HAZARDS CRC & AFAC CONFERENCE 2018 | REPORT NO. 367.2018
318
INTRODUCTION
Disaster justice, a term coined by Verchick (2012), is an emerging field of study
focusing on the role of societies, specifically their governing structures, in
creating and perpetuating vulnerabilities, inequalities and injustices that are
magnified by natural hazards. Disaster justice is a problem of governance,
rather than nature or luck, that elicits moral claims for effective and fair disaster
management (Douglass & Miller, 2016). Verchick makes this point succinctly:
“In the Anthropocene, there is no such thing as a natural disaster.
Anthropogenic carbon emissions amplify the force and frequency of many
environmentally triggered events. Land-use planning decisions squeeze some
populous communities into the unsafe places where those escalated forces are
more likely to land” (Verchick, 2016, p. 6). This emerging field thus draws heavily
on the related concepts of environmental justice and climate justice.
In this review paper, we first outline how disaster management constitutes a
justice issue. We then briefly introduce the different justice concepts applicable
to disaster management and finally propose what the concept of disaster
justice can do for disaster management.
WHY TALK ABOUT DISASTER MANAGEMENT IN TERMS OF JUSTICE? There are three reasons why justice should be a concern for disaster
management. First, disasters are not natural (Lauta, 2015), they result from
social vulnerability (Clark, Chhotray, & Few, 2013), which is largely caused by
decisions over the distribution of resources, rights and political power : “natural
disasters are in fact social disasters waiting to happen that may be triggered by
a particular natural force” (Pelling, quoted in Verchick, 2012, p.34). Second,
disasters impact on broadly agreed human rights such as the right to life, health
and shelter (Valentini, 2013). Third, disasters generate injustices which demand
accountability (Verchick, 2012).
Disaster impacts are largely the result of both deliberate and unintentional
decisions
Disaster impact are a function of social vulnerability and physical exposure
being impacted upon by a natural hazard. While humans cannot do much
about the existence of natural hazards, we can control factors that lead to
vulnerability and which determines the severity of disaster impact at local,
regional or systemic scales (Lauta, 2015; Verchick, 2012).
Large-impact disasters such as Hurricane Katrina in the US highlight existing
ineqalities in health and well-being of vulnerable populations: the poor, working
class, and minority communities (Allen, 2007). These groups tend to suffer
disproportionally from disasters due to their physical, social and financial
vulnerabilities (United Nations, 2015; Vance, 2008; Verchick, 2012; Weibgen,
2015). The scale of Hurricane Katrina’s impact was more due to the political
economy of the disaster area than the hurricane’s strength (Bullard & Wright,
2008, p. 244). For example, Hurricane Katrina destroyed public health clinics
and hospitals – support systems relied upon by the poor (Vance, 2008). The
majority of deaths from Hurricane Katrina (as well as the European heatwaves

AFAC18: PROCEEDINGS FROM THE BUSHFIRE AND NATURAL HAZARDS CRC & AFAC CONFERENCE 2018 | REPORT NO. 367.2018
319
and the Fukushima disaster) were among the elderly, due to their low mobility
and poor health. After Hurricane Katrina, the median income for women fell as
jobs in traditionally female-dominated industries (hospitality, education and
healthcare) disappeared and most public housing closed down,
disproportionally affecting female-headed households (Verchick, 2012). The
injustices of a disaster are thus rooted in already existing injustices (Finger, 2014).
Disasters (and their management) impact on peoples’ rights (and
responsibilities)
As disasters become normalized, societal expectations about disaster
management increase: proper management of disasters is now recognized as
a human right in the European Union (Lauta, 2015). Climate-driven disasters
impact fundamental human rights, to life, health and subsistence. Sudden-
onset events such as hurricanes, heatwaves and flash floods cause massive loss
of life and are set to increase in frequency and spread. Human health is
impacted by slow-onset events such as droughts which can lead to declining
food security and lead to malnutrition while the spread of vector-borne
diseases results in increased exposure and spread to previously unaffected
populations (International Bar Association, 2014). The right to subsistence is
similarly threatened by mass displacement of peoples following sudden large
scale disasters, such as Hurricane Katrina in the US or Typhoon Haiyan in the
Philippines (International Bar Association, 2014).
Disasters constitute a disruption to everyday life, lasting for months or years.
Hurricane Katrina, for example, severely impacted the criminal justice system in
New Orleans where over 6,000 hastily evacuated prisoners from the local jail
were kept in prison for longer than their sentences due to lost paperwork
(Vance, 2008). Disaster management balances public interest and private
property rights: emergency services can deny access to disaster-affected
areas in the interest of public health, while the actions (and inactions) of private
individuals can affect public safety. The balance between individual and
government responsibility is not yet established and continually contested,
especially after major events (Lukasiewicz, Dovers, & Eburn, 2017). An
examination of the different types of rights (negative and positive -protecting
from and entitling to things, as well as basic and non-basic) (Ziervogel et al.,
2017) can aid in clarifying the debate.
Disasters require action and accountability
As mitigation of and protection from disasters is now part of everyday life
(Lauta, 2015), disasters are followed by enquiries to find where systems and
people responsible failed and how future harm might be avoided (Friedman &
Thompson, 2003). Whether these inquiries achieve anything useful is another
matter (Eburn & Dovers, 2016). Responding to disasters as an injustice goes
beyond claims for compensation, it also calls for accountability of those
responsible for a disaster (Goldberg, 2012).
Theories of justice devote much time to the issue of enforcement, responsibility
and accountability (Valentini, 2013). Injustice occurs when actors who are
entitled to certain goods or rights are denied them or when actors with specific
obligations fail to fulfill them (Harris & Symons, 2010). Debates over who has
what rights and responsibilities are, for example, very prominent in the field of

AFAC18: PROCEEDINGS FROM THE BUSHFIRE AND NATURAL HAZARDS CRC & AFAC CONFERENCE 2018 | REPORT NO. 367.2018
320
climate justice, where natural disasters (slow and sudden) remain the most
prominent consequential injustice (Harris & Symons, 2010). Valentini (2013,
p.500) makes the case that the 2010 Haiti earthquake is an issue of justice
(rather than charity) since Haiti was “made poor” – its vulnerability to disasters
caused by the exploitative actions of western countries and international
financial organisations. Haiti’s vulnerability has been highlighted with Hurricane
Matthew in 2016 causing at least 1,000 deaths, severely impacting public
services, infrastructure and homes, triggering an outbreak of cholera and
reversing years of economic growth (Ahmed, 2016).esults

AFAC18: PROCEEDINGS FROM THE BUSHFIRE AND NATURAL HAZARDS CRC & AFAC CONFERENCE 2018 | REPORT NO. 367.2018
321
DISCUSSION: HOW IS JUSTICE CONCEPTUALISED IN DISASTER MANAGEMENT?
While disaster justice is a recent concept, justice theories have always been directly and
indirectly applied to all aspects of disaster management. Since the field of justice research
is broad, interdisciplinary and fragmented (similar to the field of disaster management),
this section highlights the most common and dominant ways of thinking about justice in
disaster management: distributive justice, compensatory justice, environmental justice,
the capability approach, procedural justice and the newer conceptualization of restorative
justice.
Justice is about what individuals are owed by others and by public institutions
(Moellendorf, 2015), what benefits and resources they have access to, what risks and
burdens have been allocated to them (Lebel, Foran, Garden, & Manuta, 2009), and how
resources, participation and recognition are allocated across members of a society (Thaler,
Zischg, & Keiler, 2018). The reason why there are so many justice conceptualisations is
because they align with different values. Thus while justice is an underlying goal of public
policy, its realization is often muddled due to the lack of a mainstream value set that
would dictate what justice ought to look like (Zhang, 2014). Managing for justice before,
during and after disasters strike, inevitably involves compromises between different
justice metrics (Goldberg, 2012). However, any commitment to justice (of whatever form)
suggests a “moral desire” to minimize suffering (Clark et al., 2013).
Utilitarianism
In terms of disasters, utilitarianism would support private insurance schemes, since the
insurance industry ensures the greatest return to the shareholders. Utilitarianism would
also mean that those areas where the benefits offer greatest overall gain (typically using
some form of a cost benefit analysis tool) would be targeted for public flood mitigation
(Thaler & Hartmann, 2016). However, it may also translate into a policy of attempting to
save the greatest numbers of lives during an evacuation, which could lead to not
prioritizing care for the disadvantaged if those individuals would require disproportionate
amount of resources (Weibgen, 2015).
Libertarianism

AFAC18: PROCEEDINGS FROM THE BUSHFIRE AND NATURAL HAZARDS CRC & AFAC CONFERENCE 2018 | REPORT NO. 367.2018
322
The main principles espoused by libertarianism revolve around the free market:
competition, availability of full information, equilibrium in market process and economic
freedom (Hayek 1991; Johnson et al. 2007). A libertarian approach to disasters, for
example, favours non-governmental adaptation activities, insurance schemes and
provision of information on flood hazards zones, rather than public risk management
works (Thaler and Hartmann, 2016). The success of the ‘beneficiary pays’ approach is
linked to individual capacities, disenfranchising poor and marginalized individuals
(Kaufmann, Priest, & Leroy, 2018).
Egalitarianism
Egalitarianism focuses on the equal and fair distribution of goods, services, and burdens
between citizens. There is much philosophical variation in egalitarianism literature (Clark
et al., 2013; Doorn, 2015), however the focus is largely on improving the lot of the worst-
off. In terms of disaster risk mitigation, egalitarianism aims to equalise burdens and would
focus on the most vulnerable. In terms of flood mitigation, for example, it would lead to
actions such as implementing flood storages in the upper part of the catchment to protect
downstream communities, vulnerability reduction and public-funded flood risk
management strategies for disadvantaged communities (Thaler and Hartmann, 2016).
Compensatory justice
Compensatory justice is about compensating those whose interests have been harmed by
the actions of another (Klinsky & Dowlatabadi, 2009). Methods of compensating for
disaster risks include private insurance, litigation against responsible private parties and
obtaining compensation from government. An emerging post-disaster trend in democratic
societies is for disaster victims to litigate against public institutions (Lauta, 2015)
although that is not the norm everywhere (Eburn & Dovers, 2012). Regardless of the
method of compensation, key questions exist: ‘Who owes compensation to whom?’ and
‘How much compensation is owed?’ (Goldberg, 2012). Answers to these questions are
strongly linked to different and often incompatible values.

AFAC18: PROCEEDINGS FROM THE BUSHFIRE AND NATURAL HAZARDS CRC & AFAC CONFERENCE 2018 | REPORT NO. 367.2018
323
The capability approach
The capability approach focuses on opportunities that individuals can realise rather than
resources that they are allocated. It aims to ensure that people achieve the goals that they
see as valuable to them, either through political empowerment or capability development
(Doorn, 2015). It was developed by Amartya Sen (2009) and later expanded on by Martha
Nussbaum (2007) as a rejection of the focus on equal distribution of resources, since
different people will accomplish different things when presented with the same amount of
primary goods. The capability approach is a concept that resonates strongly with
resilience, which focuses on what people can do, rather how they are vulnerable, and has
become prominent in disaster management (Doorn, 2015).
Procedural justice
Procedural justice refers to decision-making processes and claims that the procedures
used to arrive at the decision matter in their own right, and influence perceptions of
decision outcomes (Törnblom & Vermunt, 2007). In terms of disaster management, the
call to increase public participation in decision-making comes from many quarters,
including the 2015 Sendai Framework for Disaster Risk Reduction (United Nations, 2015,
p. 10). Without a voice in the prevention and preparation phases, vulnerable people’s
needs may not be catered for. This was the case during Hurricane Sandy’s impact on the
Northeastern United States in 2012, when people with disabilities were essentially
forgotten about during city-wide evacuations in a case of “benign neglect,” rather than
deliberate discrimination (Weibgen, 2015, p. 33).
The push for procedural justice is thus partly motivated by the desire to prevent new and
compounded injustices that could occur during and after disasters. To develop evacuation
plans that cater to the needs of people with disabilities, or the poor, those people need to
actively participate in planning (Doorn, 2015). Procedural justice is also asserted as an
intrinsic value (eg. Sen (2001) who sees disaster risk reduction as being fundamentally
about democratic values such as transparency, accountability, and the right to participate
in decision-making. Whether procedural justice is argued for in terms of rights or as a
practical way of preventing further injustices, its importance to disaster management
continues to be highlighted.

AFAC18: PROCEEDINGS FROM THE BUSHFIRE AND NATURAL HAZARDS CRC & AFAC CONFERENCE 2018 | REPORT NO. 367.2018
324
Restorative justice
Restorative justice recognises the harm done to an individual and the damage to a
community and focuses on repairing the harm (Cooper, 2008), not through the assignation
of blame or punishing the offender, but rather by bringing the victim and offender
together, under the facilitation of a trained mediator, to express their feelings, talk about
the impact of the crime and come to an agreement about restitution (Johnstone, 2011).
Although it focuses on criminal justice, its potential in disaster justice is increasingly
recognised (Volpe, 2007). In discussing better approaches to conducting post-event
inquiries into Australian disasters, Eburn and Dovers (2016), point out that while
disasters are not crimes, there have victims and accountable parties which make
restorative justice principles very applicable (Eburn & Dovers, 2016, p. 51). The
application of restorative justice to disaster management is still a proposition rather than
a reality.

AFAC18: PROCEEDINGS FROM THE BUSHFIRE AND NATURAL HAZARDS CRC & AFAC CONFERENCE 2018 | REPORT NO. 367.2018
325
Environmental justice
Environmental justice is a broad academic research field (see Lukasiewicz, Dovers, Robin,
et al., 2017) as well as a more narrow an activist movement linked to civil rights in the
United States (Schlosberg, 2013) which focuses on the perceived injustice experienced by
already marginalized and disadvantaged groups (Clark et al., 2013) and has focused the
unequal application of environmental law between different social groups especially in the
allocation of environmental burdens to communities of colour in the United States (Colten,
2007).
Disaster justice is in many ways an extension of environmental justice as the main
proposition – that the marginalized and vulnerable suffer disproportionally – is the same.
Over many decades, predominantly US-based research has confirmed that the poor and
marginalized (individuals as well as communities) are more vulnerable at every stage of
disaster management: they are less likely to be prepared by having essentials such as first
aid kits, emergency food supplies, fire extinguishers or insurance. They are less likely to
receive warnings for evacuation, to believe them and to be able to act on them, as
evacuation requires resources (private transportation, ready cash and alternative places
to stay) (Verchick, 2012). In the response phase, poor people suffer more damage, injury
and death, partially due to lack of preparation but also because they tend to live in older,
more densely populated, more disaster-prone neighbourhoods with low standards of
housing and services. In the recovery phase minorities and low-income individuals
recover slower as they have less insurance, less financial cushioning, they tend to less
information, fewer loans, and less government relief and are more likely to encounter bias
in obtaining long-term housing (Wright, 2011). While the focus on vulnerability is being
superseded by a focus on resilience, environmental justice offers important insights into
disaster justice.
Climate justice
As a field of academic inquiry, climate justice considers how climate burdens are shared
and how they can be avoided (Caney, 2014). As an activist movement, it has become a
powerful discourse (Chatterton, Featherstone, & Routledge, 2012) and can be seen as a
form of applied ethics (Schlosberg & Collins, 2014), focusing on the international climate
change negotiations. While most debates within climate justice focus on mitigation, the
justice implications of adaptation are increasingly recognised (Fisher, 2014). Many issues
of climate justice arise out of traditional environmental justice concerns: (that burdens are
disproportionally distributed to the poorest while benefits from greenhouse gas emissions
accrue to those well-off.

AFAC18: PROCEEDINGS FROM THE BUSHFIRE AND NATURAL HAZARDS CRC & AFAC CONFERENCE 2018 | REPORT NO. 367.2018
326
CONCLUSION: HOW CAN DISASTER JUSTICE HELP IN DISASTER MANAGEMENT?
At its core it is an extension of environmental justice applied to disaster
management. However, what use is a focus on justice to policy-makers and
practitioners?
Democratisation of disaster management
Disaster management is replete with multiple actors: governments at multiple
scales, regional organisations, international finance institutions, international
governmental agencies (such as the UN disaster agencies), non-governmental
actors, multi-actor partnerships, scientific and academic communities, and the
media (Lauta, 2015). Non-governmental actors include volunteer organisations
and spontaneous volunteers, community-based organizations and businesses
(United Nations, 2015). Groups identified as being particularly vulnerable to
disasters include women, children and young people, persons with disabilities,
older persons, indigenous peoples and migrants (United Nations, 2015). While all
these groups have a role to play in disaster management, the main
responsibility for ensuring justice in the wake of a disaster rests with governments
(United Nations, 2015). This is not just because governments play a vital
coordinating role in responding to disasters. They also coordinate the political
processes that create, contribute to and alleviate vulnerabilities, including the
planning processes that build and maintain human infrastructure, and
negotiations over individual rights and duties, thresholds for assistance, policies
regarding action on climate change, and land use and development in the
country (Harris & Symons, 2010). Governments, through legislation, also oversee
the processes by which individuals assert their fundamental rights, and are
recognized as having primary responsibility in disaster risk reduction by
international agreements (United Nations, 2015).
While the centrality of the government’s role cannot be denied, there are
equally loud calls for the ‘democratisation’ of disaster management (Alexander
& Davis, 2012). International agreements, such as the Sendai Framework call for
partnerships, collaboration and stakeholder engagement in all stages of
disaster management, as does Australia’s National Strategy for Disaster
Resilience, which aims to ‘empower’ stakeholders. Ensuring procedural justice,
especially during policy and plan preparation, remains elusive however as
there is real tension between the primacy of government institutions in disaster
management and the call for shared responsibility (Lukasiewicz, Dovers, &
Eburn, 2017). A focus on procedural justice, along with the capability
approach, could help navigate this tension by focusing on the different aspects
of procedural justice: representation (who gets to speak for identified
stakeholders); level of power (how much power do stakeholders have within
the decision-making process); and process rules (what rules govern the
structure and process of decision-making) (see Lukasiewicz, 2017).
Overcoming the pitfalls of ‘resilience’ through a justice lens
Resilience is the new solution for everything from disaster risk reduction to
climate change adaptation. However the implementation of resilience tends to

AFAC18: PROCEEDINGS FROM THE BUSHFIRE AND NATURAL HAZARDS CRC & AFAC CONFERENCE 2018 | REPORT NO. 367.2018
327
entrench disadvantage (Ziervogel et al., 2017), is either neutral or detrimental to
poverty alleviation (Béné, Wood, Newsham, & Davies, 2012), obscures power
relations and disguises trade-offs in the distribution of costs and benefits before,
during and after disasters (Fainstein, 2015). For example, a resilience approach
might sensibly advocate a ‘return to open spaces’ in built-up areas, however as
the most flood-prone built-up areas tend to be inhabited by the lowest socio-
economic groups, the removal of housing and infrastructure from floodplains
creates an injustice (Fainstein, 2015). By focusing on what individuals can do
and increasing people’s capacity to respond to difficult situations (such as a
disaster), resilience can take the focus away from why difficult situations are
happening in the first place. It can (unintentionally) obscure systemic and
structural injustices and re-direct efforts away from removing these injustices.
Considering disaster risk management through a justice lens, particularly a
combination of procedural justice and a capability approach, can, we
propose, clarify our focus on the reasons why vulnerabilities and differential
impacts exist, and incorporating multiple views into identifying solutions.
.
REFERENCES
Ahmed, A. (2016, October 10). In Haiti, a City’s Race Into the 21st Century Is Ruined by a
Hurricane. New York Times, p. online. Retrieved from
https://www.nytimes.com/2016/10/11/world/americas/jeremie-haiti-hurricane-matthew.html?_r=2
Alexander, D., & Davis, I. (2012). Disaster risk reduction: An alternative viewpoint. International
Journal of Disaster Risk Reduction, 2, 1-5.
Allen, B. L. (2007). Environmental justice, local knowledge, and after-disaster planning in New
Orleans. Technology in Society, 29, 153-159.
Béné, C., Wood, R. G., Newsham, A., & Davies, M. (2012). Resilience: New Utopia or New Tyranny?
Reflection about the Potentials and Limits of the Concept of Resilience in Relation to Vulnerability
Reduction Programmes. Retrieved from Brighton, UK:
http://www.reachingresilience.org/IMG/pdf/resilience_new_utopia_or_new_tyranny.pdf
Bullard, R. D., & Wright, B. (2008). Disastrous Response to Natural and Man-Made Disasters: An
Environmental Justice Analysis 25 Years After Warren County. Journal of Environmental Law, 26,
217-253.
Caney, S. (2014). Two Kinds of Climate Justice: Avoiding Harm and Sharing Burdens. The Journal
of Political Philosophy, 22(2), 125-149.
Chatterton, P., Featherstone, D., & Routledge, P. (2012). Articulating Climate Justice in
Copenhagen: Antagonism, the Commons, and Solidarity. Antipode, 45(3), 602-620
doi:10.1111/j.1467-8330.2012.01025.x
Clark, N., Chhotray, V., & Few, R. (2013). Global justice and disasters. The Geographical Journal,
179(2), 105–113.
Colten, C. E. (2007). Environmental justice in a landscape of tragedy. Technology in Society, 29,
173-179.

AFAC18: PROCEEDINGS FROM THE BUSHFIRE AND NATURAL HAZARDS CRC & AFAC CONFERENCE 2018 | REPORT NO. 367.2018
328
Cooper, D. (2008). Thinking about justice "outside of the box": Could restorative justice practices
create justice for victims of international disasters? New England Law Review, 42, 693-700.
Doorn, N. (2015). Resilience indicators: opportunities for including distributive justice concerns in
disaster management. Journal of Risk Research. doi:10.1080/13669877.2015.1100662
Douglass, M., & Miller, M. (2016). Disaster justice in anthropocene Asia and the Pacific. Paper
presented at the Disaster justice in anthropocene Asia and the Pacific, Singapore.
Eburn, M., & Dovers, S. (2012). Australian wildfire litigation. International Journal of Wildland Fire,
21(5), 488-497.
Eburn, M., & Dovers, S. (2016). Discussion paper: Learning for emergency services, looking for a
new approach. Retrieved from Canberra: http://www.bnhcrc.com.au/publications/biblio/bnh-
3054
Finger, D. (2014). 50 Years After The “War On Poverty”: Evaluating The Justice Gap In The Post-
Disaster Context. Boston College Journal of Law & Social Justice, 34, 267-282.
Fisher, S. (2014). The emerging geographies of climate justice. The Geographical Journal, 181(1),
73-82 doi:10.1111/geoj.12078
Friedman, L. M., & Thompson, J. (2003). Total Disaster and Total Justice: Responses to Man-made
Tragedy. DePaul Law Review, 53, 251-287.
Goldberg, J. C. (2012). Doing Justice In The Face Of A Disaster. Akron Law Review, 45, 583-589.
Harris, P. G., & Symons, J. (2010). Justice in adaptation to climate change: cosmopolitan
implications for international institutions. Environmental Politics, 19(4), 617-636.
doi:10.1080/09644016.2010.489716
International Bar Association. (2014). Achieving Justice and Human Rights in an Era of Climate
Disruption. Retrieved from London, UK:
Johnstone, G. (2011). Restorative Justice: Ideas, Values, Debates (2nd ed.). London and New
York: Routledge.
Kaufmann, M., Priest, S., & Leroy, P. (2018). The undebated issue of justice: silent discourses in
Dutch flood risk management. Regional Environmental Change, 18, 325–337. doi:10.1007/s10113-
016-1086-0
Klinsky, S., & Dowlatabadi, H. (2009). Conceptualizations of justice in climate policy. Climate
Policy, 9, 88-108.
Lauta, K. C. (2015). Disaster Law. London and New York: Routledge.
Lebel, L., Foran, T., Garden, P., & Manuta, J. B. (2009). Adaptation to Climate Change and Social
Justice: Challenges for Flood and Disaster Management in Thailand. In F. Ludwig, P. Kabat, H. van
Schaik, & M. van Der Valk (Eds.), Climate Change Adaptation in the Water Sector (pp. 125-142).
London and Washington, DC: Earthscan.
Lukasiewicz, A. (2017). The Social Justice Framework: Untangling the maze of justice complexities.
In A. Lukasiewicz & S. Dovers (Eds.), Natural Resources and Environmental Justice: Australian
Perspectives (pp. 233-251). Clayton, Victoria: CSIRO Publishing.
Lukasiewicz, A., Dovers, S., & Eburn, M. (2017). Shared responsibility: the who, what and how.
Environmental Hazards, 16(4), 291-313. doi:10.1080/17477891.2017.1298510

AFAC18: PROCEEDINGS FROM THE BUSHFIRE AND NATURAL HAZARDS CRC & AFAC CONFERENCE 2018 | REPORT NO. 367.2018
329
Lukasiewicz, A., Dovers, S., Robin, L., McKay, J., Schilizzi, S., & Graham, S. (Eds.). (2017). Natural
Resources and Environmental Justice: Australian Perspectives. Clayton, Victoria: CSIRO Publishing.
Moellendorf, D. (2015). Climate Change Justice. Philosophy Compass, 10(3), 173-186.
Nussbaum, M. (2007). Human Rights and Human Capabilities. Harvard Human Rights Journal, 20,
21-24.
Schlosberg, D. (2013). Theorising environmental justice: the expanding sphere of a discourse.
Environmental Politics, 22(1), 37-55.
Schlosberg, D., & Collins, L. B. (2014). From environmental to climate justice: climate change and
the discourse of environmental justice. WIREs Climate Change, 5(3), 359-374 doi:10.1002/wcc.275
Sen, A. (2001). Development as Freedom. Oxford: Oxford University Press.
Sen, A. (2009). The Idea of Justice. London, UK: Penguin Books.
Thaler, T., & Hartmann, T. (2016). Justice and flood risk management: reflecting on different
approaches to distribute and allocate flood risk management in Europe. Natural Hazards, 1-19.
doi:10.1007/s11069-016-2305-1
Thaler, T., Zischg, A., & Keiler, M. F., Sven. (2018). Allocation of risk and benefits—distributional
justices in mountain hazard management. Regional Environmental Change, 18, 353-365.
doi:10.1007/s10113-017-1229-y
Törnblom, K. Y., & Vermunt, R. (2007). Towards an integration of distributive justice, procedural
justice, and social resource theories Social Justice Research, 20(3), 312-335. doi:10.1007/s11211-
007-0054-8
United Nations. (2015). Sendai Framework for Disaster Risk Reduction 2015-2030. Retrieved from
<http://www.preventionweb.net/files/43291_sendaiframeworkfordrren.pdf>
Vance, S. S. (2008). Justice After Disaster-What Hurricane Katrina Did to the Justice System in New
Orleans. Howard Law Journal, 51(3), 621-649.
Verchick, R. (2012). Disaster Justice: The Geography of Human Capability. Duke Environmental
Law and Policy Forum, 23, 23-71.
Verchick, R. (2016). Diamond in the Rough: One City’s Quest for Disaster Justice. Paper presented
at the Disaster justice in anthropocene Asia and the Pacific, Singapore, November 18-19.
Volpe, M. R. (2007). Restorative justice in post-disaster situations: Untapped potential. Cardozo
Journal of Conflict Resolution, 8, 611-621.
Weibgen, A. A. (2015). The Right To Be Rescued: Disability Justice in an Age of Disaster. The Yale
Law Journal, 124(7), 2202-2679.
Wright, B. (2011). The Post-Disaster Struggle For Equity And Justice In Communities Of Color Along
The Gulf Coast. Florida A&M University Law Review, 6(2), 197-199.
Zhang, H. (2014). Explaining the perceived justice of disaster relief policy: An empirical study
based on the 2008 Wenchuan Earthquake in China. International Journal of Social Welfare, 23,
150-164.
Ziervogel, G., Pelling, M., Cartwright, A., Chu, E., Deshpande, T., Harris, L., . . . Zweig, P. (2017).
Inserting rights and justice into urban resilience: a focus on everyday risk. Environment &
Urbanization, 29(1), 123-138. doi:10.1177/0956247816686905

AFAC18: PROCEEDINGS FROM THE BUSHFIRE AND NATURAL HAZARDS CRC & AFAC CONFERENCE 2018 | REPORT NO. 367.2018
330
HOW CAN BUSINESS SHARE RESPONSIBILITY FOR DISASTER RESILIENCE? Non-peer reviewed research proceedings from the Bushfire and Natural
Hazards CRC & AFAC conference
Perth, 5 – 8 September 2018
Susan Hunt1,2 and Michael Eburn1,2
1 Australian National University 2 Bushfire and Natural Hazards CRC
Corresponding author: [email protected]

AFAC18: PROCEEDINGS FROM THE BUSHFIRE AND NATURAL HAZARDS CRC & AFAC CONFERENCE 2018 | REPORT NO. 367.2018
331
ABSTRACT
HOW CAN BUSINESS SHARE RESPONSIBILITY FOR DISASTER RESILIENCE?
Susan Hunt and Michael Eburn, Fenner School of Environment and Society and College of Law,
Australian National University, Canberra, ACT.
In Australia, business makes a significant contribution to disaster relief and recovery. Even so,
there are unexplored opportunities to enhance the role of business in disaster resilience,
particularly through partnerships with government.
This paper proposes measures to strengthen partnerships between government and the business
sector to enhance national disaster resilience.
The extent that state, regional and local level disaster plans engage business in disaster relief and
recovery is described and ways to formalise these relationships to enhance the role of business
are suggested.
Business has a relatively less prominent involvement in disaster resilience. The capacity to
strengthen disaster resilience by influencing business practices in disaster prevention,
preparedness and risk mitigation is outlined and discussed.
INTRODUCTION
Business is major stakeholder in disaster resilience and it currently makes a significant contribution in Australia to disaster relief and recovery. There is unrealised potential for business to become even more involved across the whole spectrum of disaster preparedness, planning, response, recovery and mitigation. Closer cooperation and partnerships between business and government are needed to realise opportunities that will benefit business, government and the community alike.
Small to medium enterprises account for 55 % of Australian business economic output and employ 70% of the Australian workforce(Connelly et al. 2012:3) while large businesses contribute 50% of total revenues in Australia and employ more than 80% of people currently in work (Rouse 2011). The preservation and restoration of business activity after a disaster strengthens disaster resilience. When businesses directly donate their goods and services to disaster relief and recovery this helps get people back to work which creates demand and spending to stimulate local economies. What is less prominent is the donation of business time and resources to activities designed to prepare and plan for disasters and to mitigate disaster risks and impacts before they occur. This lies at the heart of disaster resilience.
Investment in disaster resilience makes good business sense for commercial enterprises and for government. In line with global trends the incidence and severity of natural disasters in Australia is predicted to increase in the future (Commonwealth

AFAC18: PROCEEDINGS FROM THE BUSHFIRE AND NATURAL HAZARDS CRC & AFAC CONFERENCE 2018 | REPORT NO. 367.2018
332
Scientific and Industrial Research Organisation and Australian Bureau of Meteorology, 2016; Intergovernmental Panel on Climate Change (IPCC) 2014). Already showing signs of being unsustainable, this will further drive up the costs of post disaster recovery and reconstruction. As well as offering potential for government to contain and/or reduce expenditure on programs of disaster assistance, cost benefit analyses that factor in disaster resilience show that disaster mitigation is a cost effective investment (Deloitte Access Economic 2016a; Gissing 2017a, 2017b.)
BACKGROUND
Business has a long tradition of stepping in to support communities affected by disasters. Most business altruism occurs spontaneously (Australian Institute of Disaster Resilience (AIDR) 2018: 114) in the aftermath of a disaster and is, in many circumstances undertaken independent of government. Non-government organisations are formally included in some state and territory response and recovery plans but the role of business in disaster plans remains largely ad-hoc.
In the area of preparedness and planning, many businesses have developed business continuity plans that aim to effectively maintain and/or restore business
function after a disaster or other disturbance. While this is a valuable disaster resilience activity, there is scope to increase the value of the contribution made by business by expanding its focus beyond immediate business continuity.
The shared stake that business and government have in disaster resilience underpins the need to operationalise policy to promote investment in disaster preparedness and mitigation. Public-private partnerships, both formal and informal that are facilitated by a commitment to information sharing and the development of mutual trust will increase the chance of success.
Relief and recovery
Business regularly supports disaster relief and recovery. For example, following the Victorian bushfires in 2009, some banks and other corporations made donations to the official Victorian government disaster appeal, and provided mortgage relief for homeowners (Commonwealth of Australia 2010). Other big companies granted free telephone calls (Telstra 2009), provided donations of food, other supplies and logistics (Wesfarmers 2010).
The benefits of business involvement in disaster relief and recovery could be enhanced by the explicit inclusion of business into all state and territory government disaster plans. These would also include a requirement that local businesses be given preference to supply relief and recovery assistance, wherever possible. The degree to which this currently occurs varies across jurisdictions and some gaps remain.
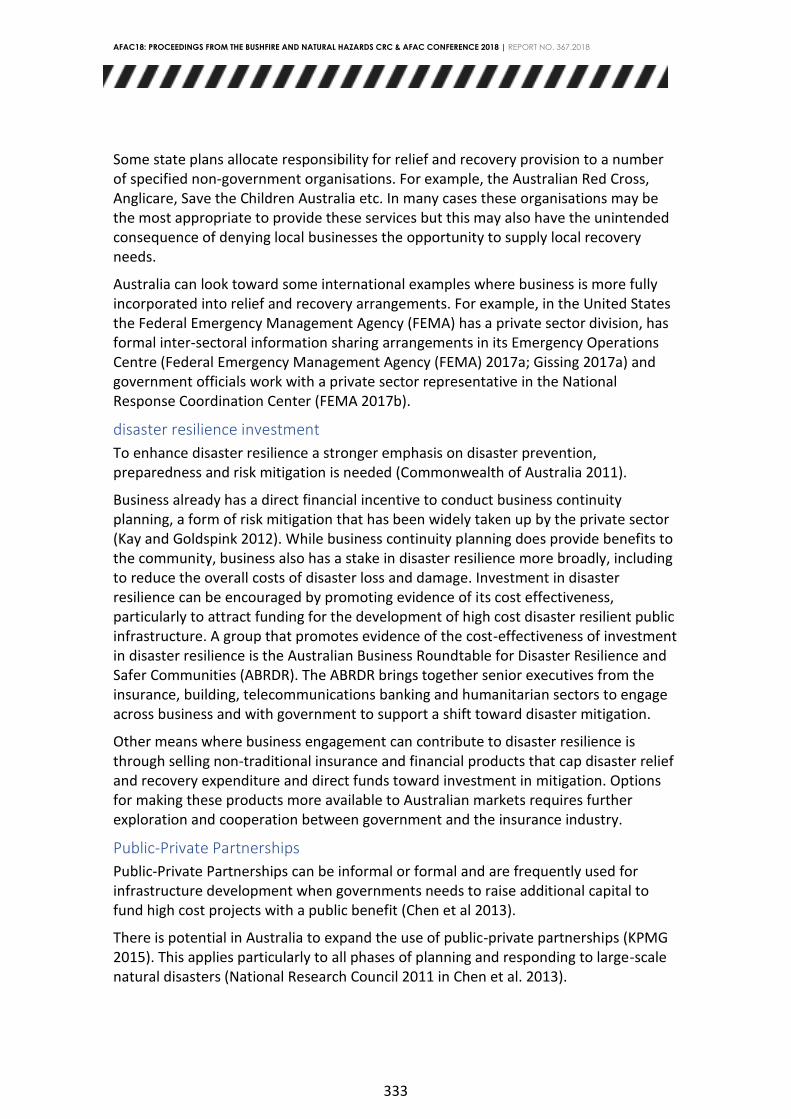
AFAC18: PROCEEDINGS FROM THE BUSHFIRE AND NATURAL HAZARDS CRC & AFAC CONFERENCE 2018 | REPORT NO. 367.2018
333
Some state plans allocate responsibility for relief and recovery provision to a number of specified non-government organisations. For example, the Australian Red Cross, Anglicare, Save the Children Australia etc. In many cases these organisations may be the most appropriate to provide these services but this may also have the unintended consequence of denying local businesses the opportunity to supply local recovery needs.
Australia can look toward some international examples where business is more fully incorporated into relief and recovery arrangements. For example, in the United States the Federal Emergency Management Agency (FEMA) has a private sector division, has formal inter-sectoral information sharing arrangements in its Emergency Operations Centre (Federal Emergency Management Agency (FEMA) 2017a; Gissing 2017a) and government officials work with a private sector representative in the National Response Coordination Center (FEMA 2017b).
disaster resilience investment
To enhance disaster resilience a stronger emphasis on disaster prevention, preparedness and risk mitigation is needed (Commonwealth of Australia 2011).
Business already has a direct financial incentive to conduct business continuity planning, a form of risk mitigation that has been widely taken up by the private sector (Kay and Goldspink 2012). While business continuity planning does provide benefits to the community, business also has a stake in disaster resilience more broadly, including to reduce the overall costs of disaster loss and damage. Investment in disaster resilience can be encouraged by promoting evidence of its cost effectiveness, particularly to attract funding for the development of high cost disaster resilient public infrastructure. A group that promotes evidence of the cost-effectiveness of investment in disaster resilience is the Australian Business Roundtable for Disaster Resilience and Safer Communities (ABRDR). The ABRDR brings together senior executives from the insurance, building, telecommunications banking and humanitarian sectors to engage across business and with government to support a shift toward disaster mitigation.
Other means where business engagement can contribute to disaster resilience is through selling non-traditional insurance and financial products that cap disaster relief and recovery expenditure and direct funds toward investment in mitigation. Options for making these products more available to Australian markets requires further exploration and cooperation between government and the insurance industry.
Public-Private Partnerships
Public-Private Partnerships can be informal or formal and are frequently used for infrastructure development when governments needs to raise additional capital to fund high cost projects with a public benefit (Chen et al 2013).
There is potential in Australia to expand the use of public-private partnerships (KPMG 2015). This applies particularly to all phases of planning and responding to large-scale natural disasters (National Research Council 2011 in Chen et al. 2013).

AFAC18: PROCEEDINGS FROM THE BUSHFIRE AND NATURAL HAZARDS CRC & AFAC CONFERENCE 2018 | REPORT NO. 367.2018
334
trust and sharing information
Trust supports the formation of effective partnerships which underpin the development of social capital, a determinant of disaster resilience (Norris et al. 2018). Lack of trust hinders the sharing of information which is vital for disaster risk management (Gissing 2017a). Close informal cooperative relationships generate trust and need to be valued and prioritised for investment as an essential element of all partnership approaches (Hunt 2005).
Unless there are national security and/or privacy reasons for not doing so, government can build trust with inter-sectoral stakeholders, including business by supporting access to publicly funded data. A long standing partnership between government and business is the Trusted Information Sharing Network (TISN) (Commonwealth Attorney-General’s Department 2003). The TISN is an IT platform to share information between government and the water, food, transport communications, energy, health, banking and finance sectors to prevent, prepare and mitigate risks to their continued provision of essential services. The high level of the TISN and its operational focus makes it unsuitable as a mechanism to incorporate economic enterprise at smaller scales. The importance of local economic activity and resources may be considered equally critical to some, particularly for the protection of livelihoods (Steele et al. 2017). This is a gap where further work would be worthwhile.
Commercial and legal barriers to sharing information have also been identified. A reluctance by the insurance industry to disclose its pricing methodology (Australian Productivity Commission 2014) can discourage consumers from investing in building mitigation works on a property they are seeking to insure. Thus, further research on how the insurance sector can be encouraged to communicate risk and encourage mitigation is warranted.
Multiple and inconsistent ownership arrangements in relation to flood maps and flood risk information and management plans was problematic for the implementation by Geoscience Australia (GA) of the National Flood Risk Information Project (Interview with M. Hazelwood 2 May 2016). Solutions being implemented by GA aim to change procurement practices for new contracts so that ownership of hazard risk information is unambiguous. GA is also working toward changing existing ownership of flood information to an open access licensing arrangement using Creative Commons Attribution 4.0 (Creative Commons 2018).

AFAC18: PROCEEDINGS FROM THE BUSHFIRE AND NATURAL HAZARDS CRC & AFAC CONFERENCE 2018 | REPORT NO. 367.2018
335
REFERENCES
1 Connelly E, Norman D, and West, T. 2012, p 3. Small business: an economic
overview, Small Business Roundtable, Reserve Bank of Australia. Available at:
https://www.rba.gov.au/publications/workshops/other/small-bus-fin-
roundtable-2012/pdf/01-overview.pdf (accessed 16 November 2017).
2 Rouse, A., 2011. Mr Rouse's Online Classroom, Available
at: https://mrrouse.com/2011/05/24/role-of-business/ (accessed 1 July 2016).
3 Deloitte Access Economics, 2016a. Building resilient infrastructure, Australian
Business Roundtable for Disaster Resilience and Safer Communities. Available
at: http://australianbusinessroundtable.com.au/Our-Papers (accessed 14
July 2016).
4 Gissing, A., 2017a. Disaster risk management: insights from the US, Australian
Journal of Emergency Management, 32(3): 5. Available at:
https://ajem.infoservices.com.au/items/AJEM-32-03-02 (accessed 20 October
2016)
5. Gissing, A., 2017b. Disaster risk management: Australian challenges, Available
from: https://apfmag.mdmpublishing.com/disaster-risk-management-
australian-challenges/ (accessed 20 October 2017)
6. Australian Institute for Disaster Resilience (AIDR). 2018. Community Recovery:
Handbook 2. Available from
https://schools.aidr.org.au/media/5634/community-recovery-handbook.pdf
[accessed 24 May 2018].
7. Commonwealth of Australia, 2010. Commonwealth response and recovery
document, prepared for the Victorian Bushfires Royal Commission
by the Department of Families, Housing, Community Services and Indigenous
Affairs. Available at: http://www.royalcommission.vic.gov.au/Commission-
Reports/Final-Report/Volume-2/Chapters/Relief-and-Recovery.html.
(accessed 14 August 2014).
8. Telstra, 2009. Telstra in the community Telstra. Available at:
https://www.telstra.com.au/content/dam/tcom/about-us/community-
environment/pdf-e/2009-telstra-in-the-community-report.pdf (accessed 14
August 2016).
9. Wesfarmers, 2010. ‘Queensland floods: Supporting a community in crisis’.
Strategic Entrepreneurship Journal, 2(3): 243-257. Available
at: https://www.wesfarmers.com.au/about-us/our-stories/item/178-
queensland-floods.html (accessed 14 July 2016).
10. KPMG 2015. Private Public Partnerships: Emerging global trends and the
implications for future infrastructure development in Australia, Available at
: https://home.kpmg.com/au/en/home/insights/2015/06/public-private-
partnerships-global-trends.html (accessed 16 November 2017).
11. Federal Emergency Management Agency (FEMA), 2015a. Private Sector
Representative Inside FEMA. Available at https://www.fema.gov/private-
sector/90-day-private-sector-representative-program (accessed 10 August
2016).
12. Federal Emergency Management Agency (FEMA), 2015b. Public-Private
Partnerships. Available at https://www.fema.gov/public-private-

AFAC18: PROCEEDINGS FROM THE BUSHFIRE AND NATURAL HAZARDS CRC & AFAC CONFERENCE 2018 | REPORT NO. 367.2018
336
partnerships (accessed 10 August 2016).
13. Commonwealth of Australia, 2011. National Strategy for Disaster Resilience:
Building the resilience of our nation to disasters, Council of Australian
Governments, Available
at:http://www.em.gov.au/Documents/1National%20Strategy%20for%20Disast
er%20Resilience%20-%20pdf.PDF (accessed 12 August 2017).
14. Kay, R. and Goldspink, C, 2012. CEO perspectives on organisational resilience,
Commonwealth of Australia.
15. Australian Business Roundtable for Disaster Resilience and Safer Communities
(ABDR), http://australianbusinessroundtable.com.au/ (accessed 9 July 2018)
16. Chen, J., Chen, T. H. Y., Vertinsky, I., Yumagulova, L. and Park, C., 2013. Public–
Private Partnerships for the Development of Disaster Resilient Communities,
Journal of Contingencies and Crisis Management, 21(3): 130-143. Available
at: http://dx.doi.org/10.1111/1468-5973.12021 (accessed August 2017).
17. Norris, F H., Stevens, S P, Pfefferbaum, B, Wyche, K F. and Pfefferbaum, R L,
2008. 'Community Resilience as a Metaphor, Theory, Set of Capacities, and
Strategy for Disaster Readiness'. American Journal of Community
Psychology, 41(1-2): 127-150.
18. Hunt, S, 2005, Whole-of-Government: does working together work? ANU
Research Publications, Working/technical paper. Available from:
https://openresearch-repository.anu.edu.au/handle/1885/43012 (accessed
16 November 2017).
19 Australian Government Attorney-General’s Department (AGD), 2003. Trusted
Information Sharing Network. Available at:
http://www.tisn.gov.au/Pages/default.aspx, (accessed 30 March 2017).
20 Steele, W., Hussey, K. and Dovers, S.. 2017. What’s critical about critical
infrastructure? Urban Policy and Research 35 (1):74-86.
21 Australian Government Productivity Commission (APC), 2014. Inquiry into
natural disaster funding, Volumes 1 and 2. Available at:
http://www.pc.gov.au/projects/inquiry/disaster-funding (accessed 14 August
2017)
22 Hazelwood, M. 2 May 2016. (Ed, Hunt. S). Research interview. ‘Implementing
disaster resilience policy in the Australian Federation’. Doctor of Philosophy
thesis (unpublished).

AFAC18: PROCEEDINGS FROM THE BUSHFIRE AND NATURAL HAZARDS CRC & AFAC CONFERENCE 2018 | REPORT NO. 367.2018
337
WORKING FROM THE INSIDE OUT TO IMPROVE UTILISATION OF RESEARCH IN DECISION MAKING
NON-PEER REVIEWED RESEARCH PROCEEDINGS FROM THE BUSHFIRE AND
NATURAL HAZARDS CRC & AFAC CONFERENCE Perth, 5 – 8 September 2018
Celeste Young 1,2 1 Institute of Sustainable Industries and Liveable Cities, Victoria University,
Victoria 2 Bushfire and Natural Hazards CRC
Corresponding author: [email protected]

AFAC18: PROCEEDINGS FROM THE BUSHFIRE AND NATURAL HAZARDS CRC & AFAC CONFERENCE 2018 | REPORT NO. 367.2018
338
ABSTRACT
WORKING FROM THE INSIDE OUT TO IMPROVE RESEARCH UTILISATION IN DECISION MAKING
Celeste Young, Institute of Sustainable Industries and Liveable Cities, Victoria
University, VIC
The most common model for research is still often one where research is
produced largely by researchers and delivered to users in the form of data,
reports and papers. However if research is to be used it requires the blending of
two very different knowledge systems: those of research and practice. Their
integration in a transdisciplinary research environment is absolutely necessary if
research is to be usable and serve the implementation needs of practitioners
and policy makers. Implementation of research in the field of natural hazards is
complex because it is a systemic issue and requires a highly collaborative
model; one where diverse parties work together to achieve common goals. This
can be an uncomfortable space particularly for researchers because this
process starts in a fundamentally different place. It requires researchers to
develop understanding from inside end user contexts rather than develop
knowledge from outside it. It is a process of matching the knowledge to the
need and tailoring information so end users can use it. Communication is a key
part of this and active listening and negotiation are crucial.
The inside out methodology was developed in 2006 and has since been used to
develop a number of practitioner frameworks including the Risk Ownership
Framework for Policy and Practice. These frameworks integrate research into
decision making systems through co-designing solutions that evaluate end users
context, their decision making systems and the drivers that inform them. It is
however not without its challenges. This paper outlines some of the key
components that are part of this research model.
WORKING FROM THE INSIDE OUT
INTRODUCTION The world in which we make decisions is rapidly changing and becoming more
complex. Drivers such as changing technologies and social, environmental and
economic stressors are impacting the type of knowledge needed to address
emerging issues and the way it is needed. This has ramifications particularly in
relation to research. Much of the focus of research to date in many areas has
been to develop highly specialized areas of knowledge which give information
to a targeted group. However, over the last decade pressing issues facing
society coming to the fore such as climate change and natural hazards, are
systemic, multifaceted and require multilayered approaches which are
connected and result in action in broader society. One of the key needs

AFAC18: PROCEEDINGS FROM THE BUSHFIRE AND NATURAL HAZARDS CRC & AFAC CONFERENCE 2018 | REPORT NO. 367.2018
339
arising is for research to be accessible, actionable and salient to end user
contexts in a way that supports new ways of thinking and social transformation.
Practice often travels ahead of research and has its own knowledge base
which has been developed and tested over time and is built through ‘doing.’
This knowledge is often excluded by conventional research. This can result in
some projects failing to achieve use and uptake of research if the research is
not able to be understood and applied practically. To achieve this requires
researchers to step back and work collaboratively with practitioners in a way
that supports and values all areas of knowledge and contributes to a process
of research, rather than leading it. It also requires understanding of and
assessment of how decisions are made and why, the systems that shape and
supports this and the values and narratives that inform these decisions.
The ‘inside out’ methodology is a flexible process which guides activities as the
work progresses. It requires specific skills, attributes and knowledge to apply
effectively. Its key purpose is to integrate research into decision making as part
of a process of ongoing learning for both end users and researchers. The key
feature of this research is the systemic analysis it undertakes of decision making
systems.
Its main application to date has been in relation to the development of
decision making frameworks for practitioners and organisations. This paper
presents an overview of some of the key aspects of this methodology.
BACKGROUND
The inside out methodology was initially developed in 2006 to analyse decision
making systems in BAE systems to provide the basis for an climate change
program, Smart Sustainable Secure. As the purpose of the program was to bring
about understanding, actions and behaviour change in the organisation, new
knowledge needed to be embedded as part of a process of ongoing change.
It became very clear in initial meetings that how the research was being
communicated and undertaken was often not accessible or useful for the
organisation and that a new approach that worked from an end user
perspective was needed.
The approach was developed to address this, worked on the premise that
complex issues needed an holistic approach and required understanding the
organisation from ‘the inside out’ rather than more convention approach to
viewing it ‘from the outside in’. It also required understanding the organisational
knowledge needs and context. Using a top down bottom up process,
knowledge from within the organisation and research was combined,
contexualised and integrated it into the decision making processes within the
organisation. Communication, co-design and collaboration were critical
aspects of the program.

AFAC18: PROCEEDINGS FROM THE BUSHFIRE AND NATURAL HAZARDS CRC & AFAC CONFERENCE 2018 | REPORT NO. 367.2018
340
This methodology has been further developed by the author, tested and used
in numerous research projects to develop decision making frameworks that
support practice. Aspects of this methodology have also informed other
research activities undertaken with the research group at VU. Frameworks
developed using this methodology include: The Problem Solution Frameworks
for Adaptation Practice and Policy (Young 2014), The Green Infrastructure
Economic Framework for Local Government (VISES 2015) and a Risk Ownership
Framework for Emergency Management Policy and Practice (Young et al,
2017). It is currently being used to develop a framework for managing and
measuring Diversity and Inclusion in Emergency Management Sector
organisations.
MAKING RESEARCH THAT IS USEFUL
“There is a lot of really interesting research out there but it is difficult to implement, what we need is research we can implement”
Mark Allan, Chairman Property Council of Australia (VIC) Sustainable Buildings
Committee Associate Director Billard Leece Partnership – Architect (Young and
Jones 2014)
Working from the inside differs from many conventional research methods as it
is not driven by the discovery of theory driven ideas that are peer reviewed but
provides an evidence base through combining different forms of knowledge
and integrating these into the decision making systems as part of the process.
Its key focus is on the needs and context of those making the decisions and
how they will be using the research. To understand this, researchers need to
think from ‘inside’ the end users context.
Stages of end user research are shown in Figure 1 as a series of tasks and the
process starts with ascertaining the end user need and working outwards
through the different tasks. The ultimate goal is the integration of the research
into the end user’s decision making context to enable uptake and use. A key
aspect of this process is defining the boundaries for the decision making system
and the key social, environmental and economic drivers and influences, so
they can be assessed. A key aim of this assessment is to understand what
decisions people are making and what is shaping this. It also defines the
boundaries of the system and the focus and scope of the assessment and helps
ascertain what research is needed and how it needs to be undertaken.

AFAC18: PROCEEDINGS FROM THE BUSHFIRE AND NATURAL HAZARDS CRC & AFAC CONFERENCE 2018 | REPORT NO. 367.2018
341
FIGURE 1: KEY TASKS UNDERTAKEN DURING (YOUNG. C 2016)
USING RESEARCH TO CREATE NEW KNOWLEDGE
Use of research requires some sort of action or investment and people cannot
act if they do not understand the issue or how it relates to them and what they
do.
Inside out is a process of discovery where methodologies and approaches are
selected to suit the task at hand and it incorporates aspects of innovation and
transformation. It is important when working with end users for them to
understand what the different types of research are (Table 1) and how they
work, so they form realistic expectations of the research process.
It uses a transdisciplinary approach where different types of knowledge are
blended together “to create new knowledge” (Nicolescu 1996). Researchers
guide and participate as partners in the research, rather than direct and lead.
Integration into end user context
Review and testing
Development of output
Knowledge
collection & synthesis
Co-design
End user context
Enduser
need

AFAC18: PROCEEDINGS FROM THE BUSHFIRE AND NATURAL HAZARDS CRC & AFAC CONFERENCE 2018 | REPORT NO. 367.2018
342
Areas of knowledge used often include:
• Expert knowledge
• Research knowledge
• Local/ tacit knowledge
• Documented knowledge (e.g, formal, grey literature or organisational
documents)
Key questions for considering what knowledge is needed and how it can be
used during this process are:
• What knowledge is already in use by the end user that is relevant to the
research task and outcome?
• What new knowledge is relevant to the research task and outcome?
• What new knowledge might be useful for the end users?
• What is needed to ensure uptake and use of research by the end user?
TABLE 1: RESEARCH METHODS AND USE (YOUNG. C 2014, P 54)
CREATING THE RIGHT RESEARCH ENVIRONMENT
A key part of the success of this method relies on creating the right environment
for interactions between researchers and end users. Knowledge exchange,
flexibility to adjust, ongoing review and co-learning by end users and
researchers are central to creating the healthy collaborative working
relationship needed. This can very uncomfortable for people who are not used
to working in this way.
Managing expectations during this process is critical, so it is important to ensure
that both end users and researchers are clear about what the aim of the
research is and to ensure that there are appropriate governance
arrangements, from the onset of projects. Also to ensure time and resources

AFAC18: PROCEEDINGS FROM THE BUSHFIRE AND NATURAL HAZARDS CRC & AFAC CONFERENCE 2018 | REPORT NO. 367.2018
343
are allocated to communication and engagement activities to support the
process.
Key aspects of that create the right environment are:
• Active listening and negotiation
• Translation and contextualization of research between all the different
stakeholders in the project
• Mechanisms for reaching shared agreement and resolving conflicts
• Sense making and socialisation of new concepts and research
• Co- learning for both researchers and end users
• Respect and valuing all types of knowledge.
Knowledge belongs to people in different ways so how end user concepts and
expertise are used and acknowledged in the research process and outputs is
important. This should be negotiated and agreed upon at the beginning of
each project to avoid possible conflicts or IP issues (Young 2015). Maintaining
trust and respectful conduct between different parties during the research
process is critical. This can be particularly challenging for people who are used
to hierarchical knowledge structures which can often place lesser value on
non-academic areas of knowledge.
USING WHAT IS OF VALUE
Effective end user based research requires the growth of multiple sources of knowledge and understanding. How to develop structures that identify and enable the consolidation and growth of knowledge is key to this process. Above all, frameworks and structures which result from this research need to enable practitioners to continue to build new layers of knowledge that support deeper understanding and empower ownership and use of the research. Identifying and assessing pre-existing frameworks, methodologies and tools which can support this process to avoid ‘reinventing the wheel’ is part of the process. This provides the basis for identifying specific points in the decision making process, where research can be embedded. It is particularly important not to ‘rebrand’ established ideas, tools or concepts that may be used to make them ‘unique’ as this can confuse people and cause disengagement from the process if they feel their knowledge is no longer their own.
Values also play a role in this process. They are an important aspect of decision
making and provide the basis for how people think and act. There are many
different types of values but in terms of decision making but they fall broadly into
two categories; [1] those that can be seen as “relating to the beliefs that
determine what is most important and what motivates action” (Swartz, 2012 p5)
and [2] those things we value as important as a result of these (e.g., social,
environmental and economic values).
This makes values-based approaches to research useful as they also provide the
basis for understanding what is likely to be most effective in terms of framing

AFAC18: PROCEEDINGS FROM THE BUSHFIRE AND NATURAL HAZARDS CRC & AFAC CONFERENCE 2018 | REPORT NO. 367.2018
344
communication and management of stakeholders. Values based approaches
are also useful as basis for the development of narratives which shape and direct
decision making.
COMMUNICATION
Inside outside is an iterative process of ‘deep engagement’ where research is
socialized and made sense of collaboratively as part of the process. As a result,
it is important to understand and work with stakeholder communication
systems, whether it is at a micro level such as a group, or a larger level such as a
large organisation or a community. Identifying pre-existing communication
systems and leveraging them requires skills and experience. Transparent and
open communication is needed to ensure trust is built and maintained for the
duration of the project.
Social networks are a key part of this as they are often the pathway to
identifying what different stakeholders offer in terms of knowledge and who the
key knowledge holders are. When starting this process it is helpful to identify
who disseminates information, how this is done and who makes decisions.
Questions that can assist this process are:
• Who is responsible for making decisions?
• Who is responsible for disseminating information and how?
• What is the most commonly used form of communication medium (eg.
verbal, written, internet, informal) and how is it used?
THE CHALLENGE
Inside out requires co-designing and working collaboratively in research so it is
not a straightforward process. It requires higher levels of interaction with end
users than conventional approaches and there are often surprises along the
way. Researchers have to be prepared to be challenged and end users have
to be prepared to work to discover answers rather than being given them.
What you don’t know in the process is much more important than what you do
know. It can also be hard to measure impact and this research is often seen as
lesser value than conventional research. The higher transaction costs needed
for collaboration means it can also take longer to achieve some outcomes. This
can be challenging in a world that is increasingly becoming accustomed to
immediate responses. These challenges need to considered and proactively
managed.
CONCLUSION
End user based methodologies are increasing in popularity in areas of research
and skills are growing in this area. Inside out is one of the many new

AFAC18: PROCEEDINGS FROM THE BUSHFIRE AND NATURAL HAZARDS CRC & AFAC CONFERENCE 2018 | REPORT NO. 367.2018
345
approaches which work in a participatory way with end users. Although there
may be challenges, for those who persevere and embrace the discomfort of
‘not knowing’, these methods can provide a tangible pathway between
research and practice that leads to understanding and better utilisation of
research.
REFERENCES
Nicolescu.B (1996).La Transdisciplinarité. Paris, France: Rocher.International
Congress What university for tomorrow?Towards transdisciplinary an evolution of
the university. Locarno, Switzerland, April 30 - May 2, 1997.
Schwartz, Shalom H. (2012). An Overview of the Schwartz Theory of Basic
Values. Online Readings in Psychology and Culture, 2(1). Doi:10.9707/2307-
0919.1116
Victoria Institute of Strategic Economic Studies (VISES). (2015). Green
Infrastructure Economic Framework. Victoria University, Melbourne
Young, C. K., Jones, R. N., Kumnick, M., Christopher, G. and Casey, N. (2017).
Risk Ownership Framework for Emergency Management Policy and Practice.
Bushfire and Natural Hazards Cooperative Melbourne, Victoria Institute of
Strategic Economic Studies (VISES), Victoria University
Young. C. ( 2016) Working from the inside out: Implementation based research,
Poster, NCCARF Climate Change Adaptation Conference 2016, Adelaide,
South Australia. 5 - 7 July 2016.
Young, C. (2014). The problem solution framework: process guidance for
adaptation practitioners. VISES Climate Change Working Paper No. 19, Victoria
Institute of Strategic Economic Studies, Victoria University, Melbourne.
Young, C. K. and Jones, R. N. (2013) Building Bridges: Supporting Adaptation in
Industry Think Tank Context Paper. Victorian Centre for Climate Change
Adaptation Research, Melbourne.
.

AFAC18: PROCEEDINGS FROM THE BUSHFIRE AND NATURAL HAZARDS CRC & AFAC CONFERENCE 2018 | REPORT NO. 367.2018
346
ENHANCING COMMUNITY RESILIENCE THROUGH THE EARLY
CHILDHOOD EDUCATION AND CARE WORKFORCE
Non-peer reviewed research proceedings from the Bushfire and Natural Hazards
CRC & AFAC conference
Perth, 5 – 8 September 2018
Sharleen Keleher
Queensland Health

AFAC18: PROCEEDINGS FROM THE BUSHFIRE AND NATURAL HAZARDS CRC & AFAC CONFERENCE 2018 | REPORT NO. 367.2018
347
INTRODUCTION
In 2011 the clinicians at the Zero-to-Four Child and Youth Mental Health Service
identified an increasing number of children entering the service after experiencing
severe weather events. The United Nations International Strategy for Disaster
Reduction declared children to be the group most affected by disasters (B.
Pfefferbaum, Pfefferbaum, & Van Horn, 2018). During that same year, there were
332 major weather events around the world. In this period alone, 244.7 million
people were impacted by a natural disaster at a cost of USD$366.1 billion (Guha-
Sapir, Vos, Below, & Ponserre, 2012). For five nations, this was their most expensive
year for natural disaster. Australia experienced significant flooding and a cyclone,
Brazil had a flash flood followed by a mudslide, New Zealand had two significant
earthquakes within 6 months, Japan had a major earthquake and tsunami, the US
experienced at least 17 separate weather events, South Africa had significant
flooding, severe hailstorms were recorded in China, while Philippines experienced
33 separate weather events, and Europe experienced 18 separate events (Guha-Sapir
et al., 2012).

AFAC18: PROCEEDINGS FROM THE BUSHFIRE AND NATURAL HAZARDS CRC & AFAC CONFERENCE 2018 | REPORT NO. 367.2018
348
EXTENDED ABSTRACT
According to Lieberman and Knorr (2007) over their lifetime infants and young
children are frequently exposed to traumatic events, including natural disasters.
Infants and young are particularly vulnerable because they are yet to develop a wide
range of coping skills (Hamiel, Wolmer, Pardo-Aviv & Laor, 2017; Karr, 2009;
Lieberman & Knorr, 2007). Trauma becomes evident when the physical or
psychological demands overwhelm the child and their ability to cope. However,
there are several factors that influence a child’s response to a traumatic event. These
include the child, the event itself and the direct implications to the environment
around the child, the availability of support systems, and the meaning the child
associates to the event (Lieberman & Knorr, 2007; Murray, 2006). Lieberman and
Knorr state that given the myriad of research available, it is no longer plausible to
consider that a child has the internal capacity to tolerate adverse experiences.
Particularly given that infants are able to distinguish emotional states in others, and
use the information to guide their responses to people and situations. Wolmer et al.
(2017) highlight that developmental theories, clinical and empirical evidence
demonstrate that children are at greater developmental risk to traumatic events than
adults. As such, past assumptions suggesting children will not understand what is
happening, and will not be as severely impacted as an adult, given their cognitive
maturity are not appropriate. External events will often increase the age appropriate
developmental fears in children, and given that some of these include fear of losing a
caregiver (Lieberman & Knorr, 2007) or having misunderstandings about their own
role in the causation of events (Kar, 2009; Lieberman & Knorr, 2007; Wolmer et al.,
2017), severe weather events can be particularly distressing. According to Kar
(2009), up to 43% of children who experience a natural disaster can experience

AFAC18: PROCEEDINGS FROM THE BUSHFIRE AND NATURAL HAZARDS CRC & AFAC CONFERENCE 2018 | REPORT NO. 367.2018
349
PTSD symptoms, in addition to acute stress reactions, adjustment disorders, anxiety,
depression and other psychiatric disorders. Following a natural disaster, pre-school
children are susceptible to separation anxiety, developing specific fears which can be
associated with situations, animals or monsters, or may become pre-occupied with
words or symbols that may or may not be associated with an event. The effects of
PTSD can overlap to other childhood disorders such as conduct disorder (CD),
oppositional defiant disorder (ODD), and attention deficit hyperactivity disorder
(ADHD) (Kar, 2009). This indicates enduring consequences for children who
experience natural disasters. Furthermore, trauma can impact development in other
ways, including chronic long term impacts on cognitive, social, and emotional
functioning (Lieberman & Knorr, 2007). Biological and physiological changes have
been found in children exposed to traumatic experiences, and given the rapid
development of the brain throughout early childhood this has been demonstrated to
influence the development of empathy and social reciprocity in children (Hamiel,
Wolmer, Pardo-Aviv, & Laor, 2017).
Not all children experience negative outcomes following a natural disaster, in
fact some children tend to adapt quite well, particularly those who are provided
with support and time (Mooney, Tarrant, Paton, Johal, & Johnston, 2017). It is
evident that all infants, children and families need to be supported, but that the
support style can vary based on needs (Murray, 2006). Of utmost importance is for
those with the most direct access to the children to have the knowledge and skills
required to support at the right level and when the signs and symptoms are more
severe (Murray, 2006; Wolmer et al., 2017). Research clearly identifies that parents
and caregivers including teachers are best placed to identify symptoms of persistent
PTSD, but they often underestimate the duration and severity of the symptoms or
miss them completely (Kar, 2009; Wolmer et al., 2017). Others emphasize the need
for professionals who may have the first contact with the child to become trained in

AFAC18: PROCEEDINGS FROM THE BUSHFIRE AND NATURAL HAZARDS CRC & AFAC CONFERENCE 2018 | REPORT NO. 367.2018
350
age appropriate assessment techniques and be acutely aware of the ways that
children indicate all is not as it should be (Murray, 2006; Wolmer et al., 2017).
Building a support network of calm and caring adults has been shown to have
beneficial outcomes for children who have experienced natural disasters (Murray,
2006). Younger children are more reliant on adult support, even more so in times of
distress. Children look to adults to identify how to react to a situation or event
(Mooney et al., 2017). Continually research highlights the influence of relationships
with adults having a position influence on the outcomes for children and young
children who have experienced a natural disaster (Kar, 2009; Lieberman & Knorr,
2007; Midtbust, Dyregrov, & Djup, 2018; Mooney et al., 2017; Murray, 2006;
Wolmer et al., 2017). Specifically, Mooney, Tarrant et al. (2017) cite that in their
study, children highlighted that when teachers are calm, the children feel calm.
Several researchers have identified that as children’s coping resources
increase, they are better able to cope with their own experience of the natural
disaster (Kar, 2009; Lieberman & Knorr, 2007; Mooney et al., 2017). Other studies
have demonstrated that children who perceive their parents to be more distressed
will demonstrate lower coping strategies following a natural disaster (Midtbust et al.,
2018). Further, children are often exposed to natural disasters in a variety of ways,
such as directly through the event, hearing it on the radio, in adult discussions, or
through television broadcast. Evidence supports that discussing the event is
beneficial to children. When discussions have not occurred with an adult, young
children are found to develop inaccurate perceptions about an event, resulting in an
increased level of anxiety. Interaction between caregivers and young children is
encouraged, when appropriately supported by their caregivers’ children tend to
demonstrate an increase in problem focused coping strategies. If the caregivers are
unable to provide this support, engagement with another adult may assist children
to obtain the information required to develop an understanding of the event and

AFAC18: PROCEEDINGS FROM THE BUSHFIRE AND NATURAL HAZARDS CRC & AFAC CONFERENCE 2018 | REPORT NO. 367.2018
351
correct any misunderstandings they have developed (Midtbust et al., 2018). Adults
can assist young children to understand that their response is appropriate. When
children are well supported their thoughts and feelings are validated and
demonstrate increases in self-competency (Cryder, Kilmer, Tedeschi, & Calhoun,
2006). Kar (2009) highlights that children may not report their feelings or reactions
unless they are specifically asked about the event itself.
Engagement with caregivers, and the opportunity to vocalise their
experience is beneficial with older children, however infants and very young
children are yet to develop the language skills for these strategies to be entirely
effective. Children are able to express themselves verbally and non-verbally through
various play approaches including drawing, stories, and others (Kar, 2009). While
there have been several interventions developed for responding to natural disaster in
older children, the response to the emotional wellbeing of the infant or young child
and their family can be overlooked. To date there have been no resources developed
to address families with children under school age, and the signs and symptoms
displayed are largely unknown to the general population. Families themselves can
become overwhelmed with their own emotional experience, and while they are
focussing on rebuilding their lives, they may not identify when their child or infant
is not recovering well. Ronan and Johnston (2003) cite research that suggests that an
increase in caregiver difficulties intensifies the likelihood that the young child will
also struggle. They then postulate that it may be beneficial to provide an
intervention to caregivers. Pfefferbaum et al. (2014) suggests universal disaster
programs should be run across multiple community sites including schools,
childcare centres, and primary health sites especially given these sites are often the
first to be restored. They further cite studies with successful outcomes for children
who have experienced disasters, run in schools, by school staff.

AFAC18: PROCEEDINGS FROM THE BUSHFIRE AND NATURAL HAZARDS CRC & AFAC CONFERENCE 2018 | REPORT NO. 367.2018
352
Acknowledging the distinctive opportunity for early childhood educators to
make a difference for families who experience natural disaster events, the
Queensland Centre for Perinatal and Infant Mental Health (QCPIMH), developed
resources so that educators can start early, working towards building resilient
communities. Recognizing that infants and young children are more likely learn and
process through play, storytelling, and creative strategies, a curriculum for early
education and care settings has been developed. Kar (2009) cites many strategies for
working with families post disaster, these include assisting children to make sense of
their experience and follow the child’s lead. The Natural Disaster Recovery
Resources childcare curriculum provides a scaffold for early childhood education
and care staff to introduce areas for exploration with infants and young children,
while allowing them to add their own narrative, experience, or play based response
to the event. Kar (2009), Ronan and Johnston (2003), and others recommend
involving parents and families in the process. A series of resources have been
developed to acknowledge common experiences of a natural disaster for the
caregiver, and highlight some strategies to assist their infant and child. As part of the
caregiver resources, a brief story is included to start the conversation and encourage
the interaction between caregiver and child. The resources also include a series of
children’s books; fact sheets and information for parents and educators.
Furthermore, an interactive online game based on the book characters has been
developed for use independently or with the other resources. These resources draw
attention to signs and symptoms an infant or young person may display when they
need further support. They aim to build resiliency in the face of natural disaster,
first by preparing children about what might happen in the event of a natural
disaster, including how the community may be impacted, before highlighting ways
for caregivers, and the community to respond.

AFAC18: PROCEEDINGS FROM THE BUSHFIRE AND NATURAL HAZARDS CRC & AFAC CONFERENCE 2018 | REPORT NO. 367.2018
353
This presentation will showcase the development of the Natural Disaster
Recovery Resources, including the Recovering Together After Natural Disaster:
Resource Guide for Early Childhood Education and Care Services. The aim of the
package is to develop resilience and skill-set of early childhood educators to support
infants and young children to process the emotional impacts of experiencing natural
hazards and disaster, and to enhance the readiness of infants, young children, and
their families by increasing their resilience prior to a traumatic or severe weather
event. Finally, we will overview the planned evaluation of the Recovering Together
After Natural Disaster Resource Guide and training package. This evaluation will
incorporate process, resource and outcome evaluations, and undertake a mixed
methods triangulation research approach to develop an understanding of the impact
of these resources and training on capacity building in the early childhood education
and care workforce.

AFAC18: PROCEEDINGS FROM THE BUSHFIRE AND NATURAL HAZARDS CRC & AFAC CONFERENCE 2018 | REPORT NO. 367.2018
354
REFERENCES
Cryder, C. H., Kilmer, R. P., Tedeschi, R. G., & Calhoun, L. G. (2006). An
exploratory study of posttraumatic growth in children following a natural
disaster. American Journal of Orthopsychiatry, 76(1), 65-69.
doi:10.1037/0002-9432.76.1.65
Guha-Sapir, D., Vos, F., Below, R., & Ponserre, w. S. (2012). Annual Disaster
Statitical Review 2011: The Numbers and Trends: CRED. Retrieved from
http://www.cred.be/sites/default/ADSR_2011.pdf
Hamiel, D., Wolmer, L., Pardo-Aviv, L., & Laor, N. (2017). Addressing the Needs of
Preschool Children in the Context of Disasters and Terrorism: Clinical
Pictures and Moderating Factors. Curr Psychiatry Rep, 19(7), 38.
doi:10.1007/s11920-017-0793-7
Kar, N. (2009). Psychological impact of disasters on children: review of the
assessment and interventions. World Journal of Pediatrics, 5(1).
doi:10.1007/s12519-009-0001-x
Lieberman, A. F., & Knorr, K. (2007). The impact of trauma: A development
framework for infancy and early childhood. Psychiatric Annals, 37(6), 416-
422. Retrieved from
https://search.ebscohost.com/login.aspx?direct=true&AuthType=ip,athens&d
b=psyh&AN=2007-09342-009&site=ehost-live
Midtbust, L. G. H., Dyregrov, A., & Djup, H. W. (2018). Communicating with
children and adolescents about the risk of natural disasters. European Journal
of Psychotraumatology, 9(Suppl 2). doi:10.1080/20008198.2018.1429771
Mooney, M., Tarrant, R., Paton, D., Johal, S., & Johnston, D. (2017). Getting
through: Children’s effective coping and adaptation in the context of the
Canterbury, New Zealand, Earthquakes of 2010-2012. Australasian Journal of
Disaster and Trauma Studies, 21(1), 19-30. Retrieved from

AFAC18: PROCEEDINGS FROM THE BUSHFIRE AND NATURAL HAZARDS CRC & AFAC CONFERENCE 2018 | REPORT NO. 367.2018
355
https://search.ebscohost.com/login.aspx?direct=true&AuthType=ip,athens&d
b=psyh&AN=2018-19991-002&site=ehost-live
Murray, C. J. S. (2006). Addressing the Psychosocial Needs of Children Following
Disasters. Journal for Specialists in Pediatric Nursing, 11(2), 133-137.
doi:10.1111/j.1744-6155.2006.00055.x
Pfefferbaum, B., Pfefferbaum, R. L., & Van Horn, R. L. (2018). Involving children in
disaster risk reduction: the importance of participation. European Journal of
Psychotraumatology, 9(2). doi:10.1080/20008198.2018.1425577
Pfefferbaum, B., Varma, V., Nitiéma, P., & Newman, E. (2014). Universal Preventive
Interventions for Children in the Context of Disasters and Terrorism. Child
and Adolescent Psychiatric Clinics of North America, 23(2), 363-382.
doi:http://dx.doi.org/10.1016/j.chc.2013.12.006
Wolmer, L., Hamiel, D., Pardo-Aviv, L., & Laor, N. (2017). Addressing the needs of
preschool children in teh context of disasters and terrorism: Assessment,
Prevention, and Intervention. Curr Psychiatry Rep, 19(40).
doi:10.1007/s11920-017-0792-8

AFAC18: PROCEEDINGS FROM THE BUSHFIRE AND NATURAL HAZARDS CRC & AFAC CONFERENCE 2018 | REPORT NO. 367.2018
356
TEACHER-FACILITATED CHILD-CENTRED DISASTER RESILIENCE EDUCATION PROGRAM: A STUDY IN BANGLADESH Non-peer reviewed research proceedings from the Bushfire and Natural
Hazards CRC & AFAC conference
Perth, 5 – 8 September 2018
Mayeda Rashid1,2, Kevin R. Ronan1,2, JC Gaillard3
1 Central Queensland University 2 Bushfire and Natural Hazards CRC 3 University of Auckland
Corresponding author: [email protected]

AFAC18: PROCEEDINGS FROM THE BUSHFIRE AND NATURAL HAZARDS CRC & AFAC CONFERENCE 2018 | REPORT NO. 367.2018
357
ABSTRACT
TEACHER-FACILITATED CHILD-CENTRED DISASTER RESILIENCE EDUCATION PROGRAM: A STUDY IN BANGLADESH
Mayeda Rashid, School of Health, Medical and Applied Sciences, Central
Queensland University, Melbourne VIC
Kevin R. Ronan, School of Health, Medical and Applied Sciences, Central
Queensland University, Rockhampton QLD
JC Gaillard, Faculty of Science, University of Auckland, New Zealand
Over the last decade, a number of studies have been conducted on different
types of disaster education programs for children. These studies suggest that
such programs enable children to be more resilient not only in terms of
increased knowledge on disaster risk reduction (DRR) but also increased
preparedness and confidence, at both the individual and household levels.
However, despite the positive findings, significant challenges still prevail. In spite
of generating effective DRR outcomes, the area of program development and
evaluation lacks a guiding model. This includes one that speaks to both the
effectiveness and sustainable implementation. On the other hand, disaster
education programs for children are mostly designed and implemented by
non-formal educators like development and humanitarian agencies. As a
result, the literature here is primarily based on the evaluation of programs, such
as those of NGOs, many of which have been identified with significant
methodological limitations. Besides, in terms of positive outcomes, the studies to
date typically rely on DRR knowledge indicators and, further, do not identify the
explicit elements of the programs responsible for generating specific positive
outcomes. This study aims to conduct rigorously designed research focused on
DRR education for children, particularly those that involve children’s active
input and participation. In doing so, it has the aim of identifying the specific
elements of the DRR education programs that produce the best DRR and
resilience outcomes. Additionally, another aim is to examine implementation
factors, including those structural and process factors that facilitate or impede
sustainable implementation of such programs in the classroom and school
settings. Thus, the study is focused on designing and testing a teacher-
facilitated, child-centred disaster resilience education program that consists of
theory, research and stakeholder-identified elements thought to be responsible
for generating effective DRR and resilience outcomes and what underpins
effective implementation.

AFAC18: PROCEEDINGS FROM THE BUSHFIRE AND NATURAL HAZARDS CRC & AFAC CONFERENCE 2018 | REPORT NO. 367.2018
358
INTRODUCTION
By participating in disaster resilience education (DRE) programs, children can
learn how to cope with disasters and become more resilient. Over the last
decade, a large number of studies have been conducted on different types of
disaster education programs for children that indicate positive outcomes. These
studies advocate that such programs enable children to be more resilient with
increased knowledge on disaster risk reduction (DRR), preparedness and
confidence. However, in spite of the positive findings, still, there are significant
challenges. Although such programs are reported to generate effective
outcomes, the area of development, implementation and evaluation lack a
guiding model. Moreover, DRE programs for children are typically designed
and implemented by non-formal educators like development and
humanitarian agencies. As a result, literature found on this ground is largely
based on the evaluation of programs, such as those conducted by NGOs,
many of which have been identified with significant methodological limitations.
Furthermore, concerning positive outcomes, the studies to date mostly rely on
DRR knowledge indicators and, further, do not identify the explicit elements of
the programs responsible for generating specific positive outcomes. Therefore,
this study aims to conduct a rigorously designed research on DRR education for
children. In doing so, the study will identify the specific elements of the DRR
education programs that produce the best DRR and resilience outcomes. Thus,
the study is focused on designing and testing a teacher-facilitated, child-
centred disaster resilience education program thought to be responsible for
generating effective DRR and resilience outcomes and at the same time
strengthening effective implementation.
BACKGROUND
Disasters are common around the world. In many cases, they cause loss of
human lives and property and typically leave economic damage in their wake.
Children have been identified as one of the most vulnerable demographic
groups in disasters: they account for 30-50 per cent of deaths and experience
the most severe psychosocial reactions (World Health Organisation [WHO],
2011). Every year, around 66 million children are affected by disaster (Nikku,
2012). In 2011 alone, this number went beyond 100 million (Bild & Ibrahim, 2013).
Many children also experience separation from families, violence and abuse
during and after disasters, including physical, emotional and sexual violence,
and human trafficking (Peek, 2008). Moreover, because of the uniqueness of
children's physiology, psychology, and developmental attributes, they typically
experience more psychosocial reactions compared to adults when disasters
occur, including where they live or where they play and learn (Peek, 2008).
Therefore, building children’s resilience and reducing their vulnerability to
disasters is essential.

AFAC18: PROCEEDINGS FROM THE BUSHFIRE AND NATURAL HAZARDS CRC & AFAC CONFERENCE 2018 | REPORT NO. 367.2018
359
Preliminary research to date shows that by participating in disaster resilience
education programs, children can learn how to cope with disasters and
become more resilient: including increased DRR knowledge, reduced anxieties
and fears, and increased preparedness at both the individual and household
levels (Ronan & Johnston, 2001; Ronan, Alisic, Towers, Johnson & Johnston, 2015;
Ronan, Haynes, Towers et al., 2016). Over the last decade, a growing number
of studies have been conducted on different types (e.g. school-based,
community-based program) of disaster education, climate change adaptation
and resilience programs for children that indicate positive outcomes. These
studies suggest that such programs enable children to be more resilient not only
in terms of increased DRR and climate change knowledge but also increased
preparedness and confidence (Mitchell, Haynes, Choong, Hall & Oven, 2008;
Mudavanhu, 2016, Mudavanhu, Manyena & Collins, 2016; Mudavanhu,
Manyena & Collins et al., 2015; Ronan & Johnston, 2005).
On the other hand, despite the positive findings, significant challenges still
prevail. Recently published systematic reviews focusing on disaster resilience
education programs for children to date indicate some serious limitations
(Johnson, Ronan, Johnston & Peace, 2014a; Ronan et al., 2015). Reviewing 35
studies, Johnson et al. (2014a) recommended improved design and
methodological rigour in future research, which a number of those studies
lacked. With a view to exploring the effect of disaster resilience education
programs on children’s knowledge about hazards and risk reduction, risk
perceptions, motivation and behaviour, Ronan et al. (2015) extended from this
systematic review, including a critique of these and additional studies done.
This includes a growing database on the general effectiveness of DRR
education programs. By contrast, studies to date largely have not identified
‘which specific ingredients3 are responsible for producing which benefits’
(Ronan et al., 2015). Thus, based on studies done to date, further rigorously
designed research is needed to identify specific elements of these programs
and how such elements can generate optimal outcomes regarding DRR and
resiliency benefits.
Moreover, despite a rich array of disaster resilience education programs done
in Australia, Bangladesh and internationally, various reviews have also identified
that despite generating effective outcomes by reducing children's vulnerability
and increasing resilience, the area of development and evaluation lacks a
guiding model. This includes one that speaks to both the effectiveness and
implementation of programs. That is, the lack of scaled, sustainable
implementation generally, but also of programs known to be effective, is a
significant problem (Lopez et al., 2012; Mitchell, Tanner & Haynes, 2009; Ronan
et al., 2015).
3 Here ‘ingredients’ refers to elements/components of a DRR education program.
AFAC18: PROCEEDINGS FROM THE BUSHFIRE AND NATURAL HAZARDS CRC & AFAC CONFERENCE 2018 | REPORT NO. 367.2018
360
Following initial research in New Zealand (Johnson, Ronan, Johnston & Peace,
2014b), a most recent study conducted in Jakarta using a multi-informant (child
participants, school personnel and non-governmental organisations - NGOs)
and mixed methods approach by Amri et al. (2016) identified a number of
obstacles in the delivery and sustainable implementation of DRR programs for
children. These include one-off program delivery reflecting a pilot and ‘project'
mentality (versus a scaled implementation mentality), funding and curriculum
limitations and teachers' lack of capacity owing to a lack of training getting in
the way of their view of these programs as desirable and useful for children.
Therefore, it is evident that to obtain the best results from DRR education
programs for children, programs are needed to be i) effective in reducing
children’s vulnerabilities and increasing their resilience, and at the same time, ii)
able to be scaled up and sustainable. However, this requires building capacity
within school systems, such that schools themselves and their teachers, can
overcome obstacles to implementing and delivering them effectively.
Thus, based on the research and reviews to date, this study aims to conduct a
rigorously designed research focused on DRR education for children,
particularly those that involve children’s active input and participation. In doing
so, it has the aim of identifying the specific elements of the DRR education
programs for children that produce the best outcomes in reducing children’s
vulnerabilities and increasing resilience among children, within their schools,
households and communities. Additionally, another aim is to examine
implementation factors, including those structural and process factors that
facilitate versus impede sustainable implementation of such programs in a
classroom and school setting. Thus, the study is focused on designing and
testing a teacher-facilitated, child-centred disaster resilience education
program consisting specific, theory, research and stakeholder-identified
elements thought to be responsible for generating effective DRR outcomes and
effective implementation.
RESEARCH DESIGN AND METHODOLOGY
The study has been designed within an action research framework (Kemmis,
1980; Stringer, 2013; Zuber-Skerrit, 1991) aligning with a child-centred disaster risk
reduction (CC-DRR) ethos using bottom-up and top-down design strategies.
The whole study has been divided into two phases: designing and testing.
Through these phases, data will be collected from Dhaka, Bangladesh using an
array of mixed qualitative and quantitative methods.
i) Phase one- designing the program: At this phase, the primary data
collection methods involve focus groups with children, interviews with
CC-DRR practitioners from implementing agencies and representatives
from Ministry of Education and Ministry of Disaster Management and
Relief in Bangladesh. The data will be used in designing the teacher-
facilitated child-centred disaster resilience education program.

AFAC18: PROCEEDINGS FROM THE BUSHFIRE AND NATURAL HAZARDS CRC & AFAC CONFERENCE 2018 | REPORT NO. 367.2018
361
ii) Phase two- testing the program: At this stage, the designed program will
be tested and evaluated in a school setting in Bangladesh.
RESEARCH PROGRESS
The study is currently ongoing. The first phase of primary data has been
collected in Dhaka, Bangladesh through focus group discussions with 42
children; interviews with 10 child-centred DRR practitioners from international
NGO (e.g., Save the Children, Plan International and Community Participation
and Development Bangladesh); and interviews with 10 government officials
from the Department of Disaster Management (DDM), the Ministry of
Education, National Curriculum and Textbook Board (NCTB), Department of
Primary Education, Department of Secondary Education; and observation of
several CC-DRR program activities implemented by different NGOs in
Bangladesh. At this stage, the collected data is being analysed using a
framework analysis approach (Rabiee, 2004; Ritchie & Spencer, 1994, 2002;
Srivastava & Hopwood, 2009). From these findings, the teacher-facilitated child-
centred disaster resilience education program will be developed. The designed
program is expected to be tested in November 2018.
From the first phase of data collection, the study has identified a set of program
elements, e.g., drill, cultural performance and competition, group discussion,
student council, tree planting etc. responsible for generating the best DRR
outcomes. These elements will serve as the components of the target program.
In designing the program, the study is following the new evidence-infused tool,
Disaster Resilience Education (DRE) Practice Framework (Towers, Ronan, Haynes
et al., 2016) which was developed to guide design, development, delivery,
evaluation and implementation of DRE programming. This tool speaks to both
top-down and bottom-up design, delivery and evaluation approaches, both of
which are to be used here. Alongside this tool, other research literature on
sound development and delivery of educational programming, and
particularly DRR education and participatory child education approaches, will
serve as a basis for incorporating findings from phase one of this research and
for infusing theory-driven elements in the development, and evaluation, of the
program.

AFAC18: PROCEEDINGS FROM THE BUSHFIRE AND NATURAL HAZARDS CRC & AFAC CONFERENCE 2018 | REPORT NO. 367.2018
362
CONCLUSION
As the research is the first of its kind, it will provide an evidence-base to assist in the development
and implementation of CC-DRR-focused, participatory education programs. The government
organisations (GOs) and NGOs, emergency management agencies, schools, teachers and, in
particular, and ultimately, children would be thought to benefit as a consequence of this study.
With more than 2.2 billion people under the age of 18 in the world, successful implementation of
effective child-centred DRR initiatives is thought to have significant potential for ensuring child-
rights and DRR at family, local, national and international levels (Ronan, 2015; Towers et al., 2014;
Haynes, Lassa & Towers, 2010; Plan UK, 2010). It will also constitute a major contribution to the
international literature on DRR, and on children’s role in DRR.
ACKNOWLEDGEMENTS The funding supports from i) Australian Government Research Training Program Scholarship and ii)
Australia’s Bushfire and Natural Hazards Cooperative Research Centre (BNHCRC) are gratefully
acknowledged.
Process
Elements of the
Program
Identifying the
different elements
of the program, e.g., Drill, Child club,
etc.
Objectives
Identifying the
learning objectives
for the particular program element
Activities
Designing the
learning activities/assessment
tools.
Output
Setting the
guidelines for
teachers to
facilitate the
activities
Intermediate outcomes
Increased resilience &
preparedness sustained over
time
Long-term Impact
More resilient
and better DRR
Short-term outcomes &
feasibility
Increase in children’s
knowledge, skills,
motivation and
preparedness
Outcomes
Teacher-facilitated Child-centred Disaster Resilience Education Program
Figure 1: Structure of the program

AFAC18: PROCEEDINGS FROM THE BUSHFIRE AND NATURAL HAZARDS CRC & AFAC CONFERENCE 2018 | REPORT NO. 367.2018
363
REFERENCES 1. Amri, A., Bird, D. K., Ronan, K. & Towers, B. (2016). Disaster Risk Reduction Education in Indonesia: Challenges and
Recommendations for Scaling up. Nat.
2. Bild, E. & Ibrahim, M. (2013). Towards the resilient future children want: a review of progress in achieving the
children’s charter for disaster risk reduction. World Vision UK.
3. Haynes, K, Lassa, J. & Towers, B. (2010). Child-centred disaster risk reduction and climate change adaptation-
Roles of Gender and Culture in Indonesia. Children in a Changing Climate.
4. James, A., Jenks, C. & Prout, A. (1998). Theorizing Childhood. Cambridge: Polity Press.
5. Johnson, V.A., Ronan, K.R., Johnston, D.M. & Peace, R. (2014a). Evaluations of disaster education programs for
children: A methodological review. International journal of disaster risk reduction, 9, 107-123.
6. Johnson, V.A., Ronan, K.R., Johnston, D.M. & Peace, R. (2014b). Implementing disaster preparedness education
in New Zealand primary schools. Disaster Prevention and Management, 23(4), 370-380.
7. Kemmis, S. (1980). Action Research in Retrospect and Prospect.
8. Lopez, Y., Hayden, J., Cologon, K. & Hadley, F. (2012). Child participation and disaster risk reduction.
International Journal of Early Years Education, 20(3), 300-308.
9. Mitchell T., Tanner, T. & Haynes, K. (2009). Children as agents of change disaster risk reduction: lessons from El
Salvador and the Philippines. Working paper No.1. Brighton: Children in a Changing Climate, Institute of
Development Studies.
10. Mitchell, T., Haynes, K., Choong, W., Hall, N. & Oven, K. (2008). The role of children and youth in communicating
disaster risk. Children, Youth and Environments, 18(1), 254-279.
11. Mudavanhu, C. (2016). A review of children’s participation in disaster risk reduction. Jàmbá: Journal of Disaster
Risk Studies, 8(1). 6-pages.
12. Mudavanhu, C., Manyena, B. & Collins, A. E. (2016). Disaster risk reduction knowledge among children in
Muzarabani District, Zimbabwe. Natural Hazards, 84(2), 911-931.
13. Mudavanhu, C., Manyena, S. B., Collins, A. E., Bongo, P., Mavhura, E. & Manatsa, D. (2015). Taking children’s
voices in disaster risk reduction a step forward. International Journal of Disaster Risk Science, 6(3), 267-281.
14. Nikku, B.R. (2012). Children’s rights in disasters: Concerns for social work: Insights from South Asia and possible
lessons for Africa. International Social Work 56(1): 51–66.
15. Peek, L. (2008). Children and disasters: understanding vulnerability, developing capacities, and promoting
resilience—an introduction. Children Youth and Environments, 18(1), 1-29.
16. Plan UK (2010). Child-Centred Disaster Risk Reduction: Building resilience through participation–Lessons from Plan
International. London: Plan UK.
17. Rabiee, F. (2004). Focus-group interview and data analysis. Proceedings of the nutrition society, 63(4), 655-660.
18. Ritchie J & Spencer L (1994). Qualitative data analysis for applied policy research. In Analysing Qualitative Data,
173–194 [Bryman A. and Burgess G.R. editors]. London: Routledge.
19. Ronan, K. R. (2015). Advances and continuing challenges towards HFA2 and post-2015: Background chapter
prepared for the 2015 Global Assessment Report on Disaster Risk Reduction. UNESCO/UNICEF. Retrieved June 13,
2015, from
http://www.preventionweb.net/english/hyogo/gar/2015/en/bgdocs/UNICEF%20and%20UNESCO,%202014.pdf.
20. Ronan, K. R. & Johnston, D. M. (2001). Correlates of Hazard Education Programs for Youth. Risk Analysis: An
International Journal, 21(6), 1055-1064.
21. Ronan, K. R., & Johnston, D. M. (2005). Promoting community resilience in disasters: the role for schools, youth,
and families. New York: Springer. New York: Springer.
22. Ronan, K. R., Alisic, E., Towers, B., Johnson, V. A. & Johnston, D. M. (2015). Disaster preparedness for children and
families: a critical review. Current psychiatry reports, 17(7), 1-9.
23. Ronan, K. R., Haynes, K., Towers, B., Alisic, E., Ireland, N., Amri, A., ... & Petal, M. (2016). Child-centred disaster risk
reduction: Can disaster resilience programs reduce risk and increase the resilience of children and households?
The Australian Journal of Emergency Management, 31(3), 49-58.
24. Sayer, A. (1992). Method in Social Science: A realist approach (2nd Ed.). London: Routledge.
25. Spencer, L., & Ritchie, J. (2002). Qualitative data analysis for applied policy research. Analyzing qualitative data,
187-208. [Bryman A. and Burgess G.R. editors]. London: Routledge.
26. Srivastava, P., & Hopwood, N. (2009). A practical iterative framework for qualitative data analysis. International
journal of qualitative methods, 8(1), 76-84.
27. Stringer, E. T. (2013). Action research. Sage Publications.
28. Tanner, T. & Seballos, F. (2012). Children, Climate Change and Disasters, IDS in Focus Policy Briefing, 23. Brighton:
IDS.
29. Towers, B., Haynes, K., Sewell, F., Bailie, H., & Cross, D. (2014). Child-centred disaster risk reduction in Australia:
progress, gaps and opportunities. The Australian Journal of Emergency Management, 29(1), 31-38.
30. Towers, B., Ronan, K. R., Haynes, K., Petal, M., Davie, S., … Mackay, A. and Noonan, R. (2016). Disaster resilience
education: a practice framework for Australian emergency management agencies. Bushfire and Natural
Hazards CRC.
31. World Health Organization (WHO) (2011). Disaster risk management for health fact sheets: Disaster risk
management for health: Children health. Global Platform-May 2011.
32. Zuber-Skerrit, O. (1991). A theoretical framework for action research.

AFAC18: PROCEEDINGS FROM THE BUSHFIRE AND NATURAL HAZARDS CRC & AFAC CONFERENCE 2018 | REPORT NO. 367.2018
364
VOLUNTEERING INTO THE FUTURE – DISATER EVENTS, LOCAL GOVERNMENTS & COMMUNITIES Non-peer reviewed research proceedings from the Bushfire and Natural Hazards
CRC & AFAC conference
Perth, 5 – 8 September 2018
Tarn Kruger1,2 & Blythe McLennan1,2
1 RMIT University 2 Bushfire and Natural Hazards CRC
Corresponding author: [email protected]

AFAC18: PROCEEDINGS FROM THE BUSHFIRE AND NATURAL HAZARDS CRC & AFAC CONFERENCE 2018 | REPORT NO. 367.2018
365
ABSTRACT
VOLUNTEERING INTO THE FUTURE - DISASTER EVENTS, LOCAL GOVERNMENTS & COMMUNITIES
Tarn Kruger & Blythe McLennan School of Global, Urban & Social Studies, Centre
for Urban Research, RMIT University, VIC This century presents us with many environmental challenges and the various types of hazardous
events can impact urban, rural and remote communities in different ways. In Australia, councils
are the closest level of government to community and many are planning and trialing a range of
options to better deal with future disaster events.
The paper reports on findings from RMIT University researchers’ first stage of a Bushfire and Natural
Hazards CRC project. The research looks at how the emergency management sector over the
next decade can best enable the value of volunteering for communities before, during and after
emergencies. It explores local governments’ experiences with volunteering around disaster
recovery and their views about a preferred future for this volunteering. It describes some of the
ways councils work together with community groups and volunteers both trained and those who
come forth in response to a disaster, to enhance resilience and recovery.
The research considers ideas about the emergency management (EM) sector and the need to shift and draw upon different perspectives to involve different people to broaden approaches. Improving governance structures, particularly at the state level was considered essential for moving towards the preferred future. There is a need for on-going investment in the provision of a supportive and enabling infrastructure for volunteering such as state-wide data-bases. These can enable engagement, recruitment and preparation of volunteers from across regions to support local government and communities. Interviewees highlighted the need for reform in disaster funding for the recovery process as critical and the need for ratification between state and federal government so local governments and communities have confidence in the EM space. This paper will provide a picture of what the future might look like as local governments strive to adapt to the challenges of the 21st century.

AFAC18: PROCEEDINGS FROM THE BUSHFIRE AND NATURAL HAZARDS CRC & AFAC CONFERENCE 2018 | REPORT NO. 367.2018
366
INTRODUCTION This paper explores local governments’ experiences with volunteering around disaster recovery
and their views about a preferred future for this volunteering. It is based on findings from the first
stage of RMIT University research for the Bushfire and Natural Hazards CRC that looks at how the
emergency management sector can best enable the value of volunteering for communities
before, during and after emergencies over the next decade4
Research on the future of volunteering around emergencies is particularly timely at the moment.
An inexorable link exists between volunteerism and community capability and resilience with
respect to disaster risk [1]. Communities and governments increasingly expect emergency
management organisations (EMOs) to actively enable and enhance the value of volunteering for
communities with respect to building community capability and resilience. This is strongly reflected
in disaster management policy in Australia, embodied in the National Strategy for Disaster
Resilience [2].
At the same time, the landscape of emergency and disaster volunteering is transforming [3-5].
Socioeconomic changes and the social impact of new technology have led to a decline in the
‘traditional’ model of formal, long-term, high commitment volunteering with a single organisation
that currently forms the foundation of emergency management volunteer models. Alongside this
decline there is a rise in ‘new’ or ‘non-traditional’ styles of volunteering that are more diverse, fluid,
episodic and digitally-enabled. There is also a corresponding increase in self-organised emergency
and disaster volunteering that is not formally affiliated with, or directly managed by, EMOs [6].
This situation presents significant challenges to current volunteer management and engagement
practices, particularly in recruitment and retention. The 2012 National Emergency Management
Volunteer Action Plan, for example, stated that the changing landscape presented “a significant
challenge for the recruitment and retention of emergency management volunteers”, and labelled
it “an issue of national importance that impacts on all levels of government and all Australian
communities” [7, p.6].
RESEARCH APPROACH This paper is based on interviews with 17 local government representatives from across the states
of Australia. The interviews are a part of a broad, exploratory study of key stakeholder views on
changes that have occurred, are occurring and need to happen in volunteer management and
engagement across disaster preparation, response and recovery.
The first phase of the study entailed 50 interviews with 57 key people from Australian emergency
management organisations (EMOs), including non-government originations (NGOs), community
groups and local governments. This is an environmental scan – an exploratory study – and
therefore the local government representatives interviewed are not an exhaustive sample.
This paper presents findings from 11 interviews with 17 local government representatives
completed in late 2017 and early 2018. The 17 interviewees represented nine councils and two
local government associations. They included six participants from Victoria; three from
Queensland; two from Western Australia; South Australia and New South Wales; and one from
Tasmania. Interviewees in the Northern Territory were invited, but no interviews were secured
during the fieldwork period. We sought interviewees from local government areas that had
4 See https://www.bnhcrc.com.au/research/resilience-hazards/3533

AFAC18: PROCEEDINGS FROM THE BUSHFIRE AND NATURAL HAZARDS CRC & AFAC CONFERENCE 2018 | REPORT NO. 367.2018
367
experienced a major disaster within the last five years or who were currently actively planning for
future disaster recovery volunteering.
The purpose of the interviews was to find out more about local government in relation to
emergency volunteering and to explore their ideas about preferred futures. The interview guide
followed a set of discussion points and this was sent to participants prior to the interview. The
interviews were conducted via the telephone and were audio-recorded, transcribed, and
returned to the participant for review. The findings presented are the broad themes and ideas
that emerged from across the interviews. We used QSR NVivo11 software to assist in the
analysis of the data.
Interviewees’ comments/quotes used in this paper are indicated by a unique ID number to
deidentify participants. Exerts from the interviews, ‘the data’, unless otherwise stated, reflect the
majority of interviewees’ experiences.
KEY FINDINGS During interviews, participants described the activities and functions of their council and what
can happen when impacted by a disaster, such as a bushfire, flood, storm or cyclone. When a
disaster hits their region, local government is in situ and experiences the impacts along with their
community. They are the closest level of government to community and have much insight into
how council with community can prepare, respond and recover from a disastrous event. On one
hand local government is there to assist community but at the same time it can struggle to
organise. The scale of the disaster can disrupt and directly impact staff or council’s equipment
and resources and dramatically curtail recovery.
WHAT HAS CHANGED IN THE EMERGENCY MANAGEMENT VOLUNTEER LANDSCAPE OVER THE LAST 5-10 YEARS? Interviewees noted the change in volunteering as many people no longer sign up for long-term
involvement. In some areas there are more transient communities and people are not able to or
cannot dedicate as much time as they previously did to training and preparedness, but when a
community is impacted by disaster, many will come to the fore:
…the on-going time commitment that scares people. But I think when there is an
identified serious need, then they will come out of the woodwork (LG3).
In more regional and remote areas, there is the challenge to maintain volunteer numbers.
Interviewees identified issues of ageing volunteers and difficulties attracting younger people or
people less inclined to volunteer for roles which can demand on-going time commitments,
particularly in the emergency services. Many interviewees talked about the changing ways
people volunteer and the decrease in retention rates in emergency services in their area. They
described some of the deterrents for participation, such as training requirements, regular
meetings and travel. The requirements of training and the obstacles of distance and remoteness has in part been
overcome with the introduction of the internet and on-line training courses, which can reduce
time demands and travel for volunteers. However, it can also isolate individuals and lessen the
camaraderie that can be essential for team work, particularly for emergency response teams.
Furthermore, on-line learning may not suit everyone and in some remote areas access issues
remain problematic:
Not everyone has access to internet and some of these old cockeys aren’t going to
register on-line (LG11).
Internet training can achieve things, but …it takes away the social aspect, instead of
having a classroom of people (LG15).

AFAC18: PROCEEDINGS FROM THE BUSHFIRE AND NATURAL HAZARDS CRC & AFAC CONFERENCE 2018 | REPORT NO. 367.2018
368
Across Australia, areas and regions experience different types of hazardous events that can
impact urban, rural and remote communities and the various demographic settings adds to the
complexities. Communities are changing some are experiencing rural decline, others increasing
urbanisation, and in other areas the population is becoming more diverse. And so the setting in
which volunteering takes place is changing:
I think we need to acknowledge every community is different, so one size doesn’t fit
all (LG16).
Part of the impetus to broaden the roles of volunteers and bolster councils’ ability and capacity
to prepare, respond and recover, is climate change. Interviewees acknowledged the likelihood
of more frequent large-scale events that are likely to impact their area.
WHAT ARE THE KEY VOLUNTEERING ISSUES THE SECTOR IS CURRENTLY FACING? A major issue highlighted by interviewees is inadequate financial assistance to support volunteer
programs. They often described the never-ending battle to secure more funds. As additional roles
and responsibilities are often tasked to local government, this can increase the strain on their
limited resources and capacity to deliver. A lack of sure federal and state government funds, for
in particular, regional councils with lower populations and a smaller rate-base, to address human
and financial resourcing difficulties in these areas for preparation, response and recovery
projects.
The ability to harness the spontaneous response was seen as an opportunity to assist in recovery.
However, some interviewees noted that volunteers can have misguided expectations of their
involvement and this can be further curtailed when the disaster site is hazardous. The changing
landscape of volunteering means organisations such as councils are exploring more adaptive
ways that serve both the needs of organisations and the volunteers.
In a somewhat ironic way, one of the biggest hurdles for councils is the infrequency of disasters. While there is recognition of the consequences of climate change and the increasing frequency of events, it can be difficult to plan for and keep staff and volunteers motivated, trained and ready. When a disaster happens, it can have the effect of reinvigorating people for their time spent training and planning.
Staff-turnover and change in volunteers can mean that when the next disaster hits, there can be
many new people who have not experienced the previous event. It is imperative that information
is documented and passed on and more experienced people can share their knowledge and
skills:
We don’t have disasters that often and people change and so for new officers, here
is what happens in this part of the world and these are the plans we have place
(LG16).
WHAT IS HAPPENING TO ADDRESS THESE ISSUES? It was clear from the interviewees that because councils are the closest level of government to
community and because most local governments are the key organisation responsible for
recovery, many are planning and trialing a range of volunteer management options to better
deal with future disaster events. The development of different management approaches can
happen as a result of a disaster event, where processes have proven to be inadequate and
therefore change is essential.
One council has recruited ‘volunteers’ from their workforce and trained staff to operate at the
recovery centre after a disaster. This means the council is primed to respond with the confidence
they have a well-trained team of approximately 100 ‘volunteers’. In this example, interviewees
described when a major cyclone hit their area, the response and recovery for the council and
community was vastly improved.

AFAC18: PROCEEDINGS FROM THE BUSHFIRE AND NATURAL HAZARDS CRC & AFAC CONFERENCE 2018 | REPORT NO. 367.2018
369
Many local governments host a range of community services supported by volunteers. Councils
are beginning to explore options for utilising volunteers across services, as it is not an automatic
process or presumption that ‘regular volunteers’ will or can step into emergency volunteering.
We drew upon our existing pool of volunteers to help us with things such as helping
out at community meetings … so for things like providing psychological first aid, we
were relying on the Red Cross and their volunteers (LG13).
Interviewees talked about community development processes for EM and they recognise that
flexibility is key in the way they have to adapt for volunteers and the potential that lies within their
community:
I have a very strong belief that because these things impact the community, we
probably need to start from that point, not the other way around. When we look
forward as hard as it is to know, there has got to be that flexibility and adaptability
(LG11).
WHAT DOES A PREFERRED FUTURE LOOK LIKE? Interviewees described enablers, like state-wide databases and technology that has
sophisticated operating systems as important features in a preferred future for disaster recovery
volunteering. Databases would have up-to-date information about volunteers; team leaders;
and managers of volunteers; who can be quickly tasked to support impacted communities to
speed up recovery. The registration and deployment of volunteers would be a simple and
straightforward process and it would be easy for people to participate and for organisations to
capture their interest. Information sharing at a local level would be widespread and an important
avenue to build self-reliance within a community, just as telephone-trees once did (in some areas
still continue). It would also enable volunteers from outside the area to be aligned to tasks and
locally directed to help.
In a preferred future, local governments would be sufficiently funded to develop programs
around preparation, response and recovery. They would have the mechanisms to support and
enable volunteering and provide community education and engagement programs to raise
awareness about hazards and how local people can prepare and be involved:
When it comes to volunteers by 2030, I would like to see a much more organised
structure around volunteer and plans locally and regionally and to make better use
of the potential of the so called spontaneous volunteers (LG17),
WHAT NEEDS TO HAPPEN TO MOVE TOWARD THIS FUTURE? Improving governance structures, particularly at the state level was considered essential for
moving towards the preferred future. Interviewees emphasised the importance of funding to
support programs developed by their state’s volunteer peak organisation. There is a need for on-
going investment in the provision of a supportive and enabling infrastructure for volunteering such
as state-wide data-bases. These can enable engagement; recruitment and preparation of
volunteers from across regions to support local government and communities:
The other challenge we have is to see the surety of the funding for the state-wide
programmes, because it is fundamental to our processes. …we will be able to
engage volunteers more quickly because all of the background work has been done
(LG1).
Interviewees also highlighted the importance of reform in disaster funding for the recovery
process, and the ratification required between state and federal government so local
governments and communities have confidence in the surety of funding in the EM space. One
interviewee emphasised the EM sector is primed to respond and wait for the event to happen,
whereas more attention on prevention and preparedness is critical:

AFAC18: PROCEEDINGS FROM THE BUSHFIRE AND NATURAL HAZARDS CRC & AFAC CONFERENCE 2018 | REPORT NO. 367.2018
370
I think the EM sector, the volunteer sector, needs to be much more aware of its
capacity to assist in the prevention, preparedness and the building of resilience of
community rather than waiting for an event to happen. Much more work in the space
of the preparedness of local areas than simply waiting for local areas to fall over
(LG12,).
Many interviewees talked about the EM sector – within council and across other EMOs – and the
need to shift and draw upon different perspectives and involve different people. The
collaboration across council’s community development and EM teams can broaden
approaches to working with volunteers and communities in preparation, response and recovery:
Volunteering in general can provide really good surge capacity to support recovery
in communities. If we are talking a large scale disaster, that is where the state’s EM
sector hopefully understands it, and the challenge is being able to tap into and
activate the volunteers when needed (LG6,).
Fast changing and ever-improving technology was recognised as something that will continue to
assist the EM sector. At the same time, it presents a challenge to keep abreast of technological
developments and in particular, social media. One of the tasks for local government will be keep
up-to-date with technology and cater for a range of ways of communicating with their
community, particularly during a disaster.
CONCLUSION Local government is in situ, the closest level of government to community, it is the site of the
disaster. On one hand it is there to assist community, but at the same time can struggle to
function when the scale of the disaster can disrupt and directly impact staff and/or council’s
equipment and resources and dramatically curtail recovery.
In a preferred future, local governments would be sufficiently funded to develop programs around preparation, response and recovery and keep pace with social and technological changes. There would be mechanisms like state-wide databases to support and enable volunteering and provide community engagement programs to raise awareness about hazards and how people can prepare and be involved. Importantly, governance structures, policies and frameworks at the national and state level were considered essential to provide local governments guidance and establish consistent processes. Moreover, reform in disaster funding for the recovery process would be ratified between state and federal governments so local governments and communities have confidence in the surety of funding in the EM space.
It was evident from interviewees’ comments and ideas about volunteer management that local governments are considering a range of ways to best adapt to the challenges of the 21st century.
It can’t look like it looks at the moment (LG10).
AFAC18: PROCEEDINGS FROM THE BUSHFIRE AND NATURAL HAZARDS CRC & AFAC CONFERENCE 2018 | REPORT NO. 367.2018
371
REFERENCES
1. Lough, B.J., Literature review for the State of the World’s Volunteerism
Report 2018. 2017, UN Volunteers: New York.
2. COAG, National strategy for disaster resilience: building our nation’s
resilience to disasters. 2011: Canberra, ACT.
3. McLennan, B.J., J. Whittaker, and J.W. Handmer, The changing
landscape of disaster volunteering: opportunities, responses and gaps in
Australia. Natural Hazards, 2016. 84(3): p. 2031–2048.
4. Oppenheimer, M. and J. Warburton, Introduction, in Volunteering in
Australia, M. Oppenheimer and J. Warburton, Editors. 2014, Federation
Press: Sydney. p. 2-12.
5. Hustinx, L. and F. Lammertyn, Collective and reflexive styles of
volunteering: a sociological modernization perspective. Voluntas, 2003.
14(2): p. 167-187.
6. Whittaker, J., B.J. McLennan, and J. Handmer, A review of informal
volunteerism in emergencies and disasters: Definition, opportunities and
challenges. International Journal of Disaster Risk Reduction, 2015. 13: p.
358-368.
7. Commonwealth of Australia, National emergency management volunteer
action plan. 2012, Attorney-General's Department: Canberra.

AFAC18: PROCEEDINGS FROM THE BUSHFIRE AND NATURAL HAZARDS CRC & AFAC CONFERENCE 2018 | REPORT NO. 367.2018
372
EMERGENCY MANAGEMENT OPPORTUNITIES FOR REMOTE INDIGENOUS COMMUNITIES IN NORTHERN AUSTRALIA Non-peer reviewed research proceedings from the Bushfire and Natural
Hazards CRC & AFAC conference
Perth, 5 – 8 September 2018
Kamaljit K. Sangha1,2, Andrew Edwards1,2 and Jeremy Russell-smith1,2
1Darwin Centre for Bushfire Research, Charles Darwin University 2Bushfire and Natural Hazards CRC
Corresponding author email: [email protected]

AFAC18: PROCEEDINGS FROM THE BUSHFIRE AND NATURAL HAZARDS CRC & AFAC CONFERENCE 2018 | REPORT NO. 367.2018
373
ABSTRACT Despite frequent exposure to severe natural hazards including extensive bushfires, tropical cyclones
and floods, remote Indigenous communities across northern Australia typically have little engagement
in managing, mitigating or planning for such hazards. The BNHCRC scenario planning project explores
how remote communities can effectively and sustainably mitigate the risks of natural hazards, and
develop effective partnerships with emergency management (EM) decision-making processes. This
research integrates and analyses EM resources and services available through various agencies
responsible for remote locations, and related EM costs. The project provides opportunities for
responsible agencies to engage and plan with remote communities to deliver efficient, cost-effective
and culturally appropriate EM services. Scenario planning workshops, applying business as usual and
enhanced risk mitigation scenarios, are underway involving active participation of multiple stakeholders
including rangers from remote locations namely, Borroloola, Hermannsburg and Yuendumu,
representatives from emergency services in the Northern Territory (NT Emergency Services, Fire and
Rescue Services, Bushfires NT), the Northern and Central Land Councils, and other local organizations.
Initial discussions with rangers and Traditional Owners from the selected remote communities,
representatives from the relevant EM agencies, and other interested parties have indicated keen
interest for participating in the project. Workshop discussions and associated data analyses will be
presented, offering new insights into the delivery of cost-effective and improved EM services that can
empower vulnerable remote communities.
Keywords: Natural hazards, Indigenous communities, Emergency services, Northern Australia, Rangers.
INTRODUCTION Northern Australia, the region north of the Tropic of Capricorn, is at risk from extensive wildfires,
cyclones, storms, and floods (Fig. 1a,b; Bushfire & Natural Hazards Cooperative Research Centre
(BNHCRC) 2015). The average cost (from 2007-2016) of all the major natural hazard events across
Australia is estimated at $13.2bn per annum (the Australian Business Roundtable for Disaster Resilience
and Safer Communities (ABR DRSC) 2017). For northern Australia, the average costs roughly equate to
~$11bn/yr across the NT, WA and Qld for those natural hazards that occur mostly in the north i.e.
cyclones costing about $3.4bn/yr, floods $7.3bn/yr and bushfires $0.13bn/yr (the latter accounted for
from WA only). These costs are expected to grow multi-fold over the coming years with an increase in
frequency and severity of natural hazards (ABR DRSC 2017). Thus, the ABR DRSC (2017) has
recommended a nationwide need to address mitigation of natural hazards and build community
resilience.
To build resilience, an understanding of regional social and biophysical contexts is critical. Northern
Australia supports about one million people, of whom ~14% are Indigenous (ABS 2016 census). Outside
of major towns, Indigenous people comprise a much greater proportion of the total population (Fig. 2).
In the Kimberley and Top End, about half of the population is Indigenous, and in very remote regions
generally, more than 90% (Taylor 2006). Average population density in the region of about 0.75
persons/km2 is low by Australian (3.0 persons/km2) and global standards (Archer et al. 2018). Moreover,
the non-Indigenous population is mostly concentrated in coastal towns, mainly Broome, Darwin, Cairns,
Townsville and Mackay.

AFAC18: PROCEEDINGS FROM THE BUSHFIRE AND NATURAL HAZARDS CRC & AFAC CONFERENCE 2018 | REPORT NO. 367.2018
374
Fig.1. Frequent natural hazards in the north:
a. Long-term fire frequency (2000-2017) across the north.
b. Cyclone tracks (from 1970-2015) within 300 km radius from Darwin (source: Bureau of
Meteorology).
a.
b.

AFAC18: PROCEEDINGS FROM THE BUSHFIRE AND NATURAL HAZARDS CRC & AFAC CONFERENCE 2018 | REPORT NO. 367.2018
375
Fig. 2. Distribution of Indigenous discrete communities in northern Australia (ABS 2016).
There is a distinct and seasonal distribution of cyclones and wildfires across the northern landscape. On
average (1981/82-2012/13), coastal areas experience ~11 tropical cyclones every wet season (Dowdy
et al. 2014) which are often associated with catastrophic wind speeds, storm surges and heavy flooding
(Fig. 3). Sub-coastal and inland areas experience wildfires spreading over extensive areas (Fig. 1). Unlike
more populous regional centres with the ready availability of emergency services and associated
infrastructure, most isolated and remote communities lack emergency management (EM) amenities
and, as such, are at heightened risk in the event of significant hazardous events (NAILSMA 2014 ab,
Sangha et al. 2017, Sithole et al. 2017). These issues are well recognized in national policy (CoA 2007,
COAG 2011).
Fig. 3. Severe and non-severe tropical cyclones from 1970-2017 (Source: Bureau of Meteorology 2018)
To address this, we suggest that building the capacities of and empowering remote communities
affords an obvious solution for better preparing for and managing natural hazard events. In particular,
the existence of and substantial Government investment in Indigenous Ranger Groups (IRGs), for
example through Working on Country and Indigenous Protected Area programs, provides a ready
framework for utilizing and developing that capacity. Here, we report preliminary case study findings
from three remote communities in the NT—Borroloola in the NT Gulf region; Hermannsburg and
Yuendmu in central Australia—which explore these opportunities.

AFAC18: PROCEEDINGS FROM THE BUSHFIRE AND NATURAL HAZARDS CRC & AFAC CONFERENCE 2018 | REPORT NO. 367.2018
376
BUILDING RESILIENCE IN REMOTE INDIGENOUS COMMUNITIES
2.1 CASE STUDIES Each of the case study community (Fig. 4) is vulnerable to natural hazards, especially wildfires. Yuendumu
and Hermannsburg are respectively located about 300km and 130km from Alice springs. Borroloola,
about 900km from the capital city Darwin, is also highly vulnerable to cyclones and associated flooding.
Each community comprises 500-800 people.
Fig. 4. Selected remote communities (marked in red box) in the NT and their relative distance from the
capital city, Darwin, and another main town Alice Springs in the south.
2.2 APPROACH We have engaged with IRGs from each community, commencing in September 2017. Respective IRG
members are experienced and skilled in managing a variety of fire and other emergency related
situations (e.g. land searches, vehicle break-downs). Initially, informal discussions were held with the
Waanyi-Garawa IRG at Borroloola, our pilot case study. As a means for identifying key EM issues relevant
to that local community, a questionnaire was developed collaboratively with the Waanyi-Garawa
rangers for surveying the views of Borroloola community members, which were further discussed in a focus
group meeting (FGM). Subsequently, preliminary FGMs were also held with IRG members in Yuendumu
and Hermannsberg. An ethics approval was granted by Charles Darwin University, Darwin.
2.2 RESULTS - FOCUS GROUP MEETING OUTCOMES FGMs with IRG members in all the three communities revealed that typically there is little involvement of
local community members in managing or mitigating natural hazards, EM related decision-making
processes, or services delivery. An exception concerns Hermannsburg (Table 1), where the Tjuwanpa
women rangers are trained Northern Territory Emergency Services (NTES) volunteers and conduct

AFAC18: PROCEEDINGS FROM THE BUSHFIRE AND NATURAL HAZARDS CRC & AFAC CONFERENCE 2018 | REPORT NO. 367.2018
377
preventative prescribed burning around the community. Details of identified emergency related issues
and available resources are provided in Table 1.
There are limited infrastructure resources available for mitigating and managing natural hazards or
emergency situations in respective communities (Table 1). Community access to these resources is
restricted, and limited to agency personnel (police, NTES, Northern Territory Fire & Rescue Service (NTFRS)).
IRG members also possessed limited knowledge about the content, or existence even, of respective
community EM plans; in any event, these are not readily accessible given that they are available at local
police stations (Table 1). Importantly, IRG and other local community members showed interest in being
more involved with addressing fire, flood and related EM issues.
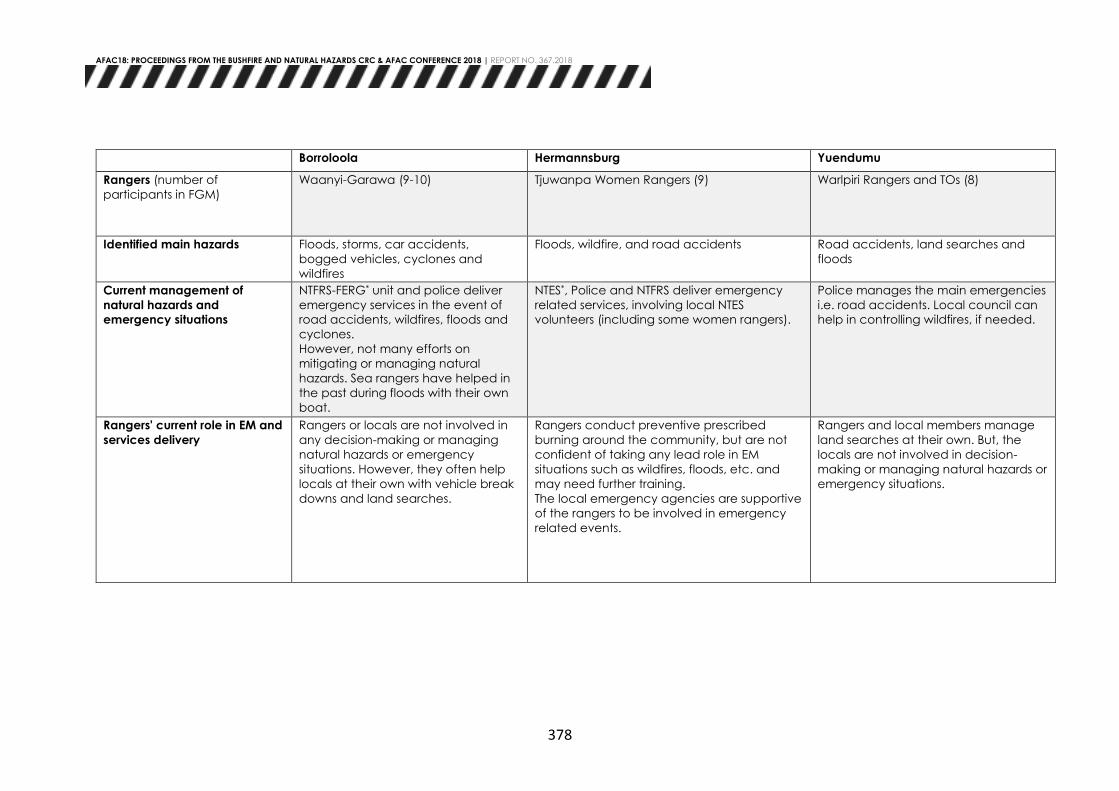
AFAC18: PROCEEDINGS FROM THE BUSHFIRE AND NATURAL HAZARDS CRC & AFAC CONFERENCE 2018 | REPORT NO. 367.2018
378
Borroloola Hermannsburg Yuendumu
Rangers (number of
participants in FGM)
Waanyi-Garawa (9-10) Tjuwanpa Women Rangers (9) Warlpiri Rangers and TOs (8)
Identified main hazards Floods, storms, car accidents,
bogged vehicles, cyclones and
wildfires
Floods, wildfire, and road accidents Road accidents, land searches and
floods
Current management of
natural hazards and
emergency situations
NTFRS-FERG* unit and police deliver
emergency services in the event of
road accidents, wildfires, floods and
cyclones.
However, not many efforts on
mitigating or managing natural
hazards. Sea rangers have helped in
the past during floods with their own
boat.
NTES*, Police and NTFRS deliver emergency
related services, involving local NTES
volunteers (including some women rangers).
Police manages the main emergencies
i.e. road accidents. Local council can
help in controlling wildfires, if needed.
Rangers' current role in EM and
services delivery
Rangers or locals are not involved in
any decision-making or managing
natural hazards or emergency
situations. However, they often help
locals at their own with vehicle break
downs and land searches.
Rangers conduct preventive prescribed
burning around the community, but are not
confident of taking any lead role in EM
situations such as wildfires, floods, etc. and
may need further training.
The local emergency agencies are supportive
of the rangers to be involved in emergency
related events.
Rangers and local members manage
land searches at their own. But, the
locals are not involved in decision-
making or managing natural hazards or
emergency situations.

AFAC18: PROCEEDINGS FROM THE BUSHFIRE AND NATURAL HAZARDS CRC & AFAC CONFERENCE 2018 | REPORT NO. 367.2018
379
Rangers/Indigenous
community members'
willingness to participate in EM
in the future
Willing to join NTFRS volunteer
brigade, to mitigate bushfires in the
community and help in other
emergency events. Rangers had their
first meeting with the NTFRS local area
volunteer brigade personnel.
Three women rangers are already NTES
volunteers, others are planning to join.
Ranger or the Elders themselves do not
want to join. However, the youth, as
suggested, needs to be involved in EM.
Engagement of local
communities in managing or
planning for emergency
situations
Little or no formal involvement to
date.
Some degree of engagement exists among
the Emergency Agencies and the Tjuwanpa
women rangers.
Little or no formal involvement to date.
Rangers help their community
members at their own especially in land
searches.
Awareness of EM plan EM plans are typically kept at the police station, and the locals have little idea of what they are about.
Existing EM related resources NTFRS has a FERG unit and NTES a
rescue boat. Waanyi Garawa
Rangers have a fire truck and Sea
Rangers a boat.
NTES/NTFRS/Police have their own resources,
with NTES having an established unit in the
community. Tjuwanpa Rangers were also
planning to buy a Grassfire Unit.
NTES established unit was reported to
be non-functional. The local council
owns a fire truck, but there are no other
available emergency resources.
Rangers' EM and local area
knowledges
Rangers and TOs have local knowledge especially of people and areas prone to wildfire, floods, etc., and know how to manage
wildfires, floods and vehicle break downs. Moreover, community members confide in them.
*NTFRS – Northern Territory Fire and Rescue Services; FERG – Fire and Emergency Response Group; NTES – NT Emergency
Services.
AFAC18: PROCEEDINGS FROM THE BUSHFIRE AND NATURAL HAZARDS CRC & AFAC CONFERENCE 2018 | REPORT NO. 367.2018
380
DISCUSSION Building community resilience in remote locations is a stated key requirement of the national ‘Keeping
our mob safe’ policy framework addressing EM issues in remote Indigenous communities (CoA 2007).
However, effective engagement of and partnership with local Indigenous communities is on ongoing
challenge for NT EM agencies (NAILSMA 2014 ab, ABR DRCS 2017, Sangha et al. 2017). The BNHCRC-
funded Scenario Planning project offers a significant opportunity for exploring options to engage with
and empower remote communities with respect to mitigating natural hazards and managing
emergency situations. Our initial FGMs clearly demonstrate the willingness and capabilities of respective
IRGs to participate in local EM planning and decision-making processes. The next stage of this project
includes facilitating discussions among all the stakeholders, i.e. local EM agencies, IRGs, local
communities, and responsible Aboriginal Corporations to examine how and where rangers could be
involved and what resources and training are required to support them.
Frequent exposure to natural hazards with limited EM-related resources in remote communities demand
urgent attention at the state/territory and national level (COAG 2011). For example, in the NT, EM
resources are largely limited to main towns (Darwin, Katherine and Alice springs) and a few
communities (Fig. 5; NTPFES 2016-17). Whereas, many remote communities, including large populations
living in communities such as Daly River, Borroloola, and Robinson River, are exposed to significant
flooding events, evacuations, or cut-off for months during the wet season. Alternatively, provisioning
appropriate EM resources and involving community members at a local scale can offer long-term
feasible on-site solutions (ABR DRSC 2017). A prime example concerns Arnhem Land IRGs whose fire
management programs provide both effective wildfire management and deliver multi-fold socio-
economic benefits and reduce government costs (Russell-Smith et al. 2013, Sangha et al. 2017).
Development of locally inclusive, participatory EM models, backed by cost-benefit assessments, is
required to enhance effective EM preparedness and manag

AFAC18: PROCEEDINGS FROM THE BUSHFIRE AND NATURAL HAZARDS CRC & AFAC CONFERENCE 2018 | REPORT NO. 367.2018
381
REFERENCES 1. Australian Bureau of Statistics, 2016. Census 2016.
http://www.abs.gov.au/websitedbs/censushome.nsf/home/2016, accessed on May 24, 2018.
2. Archer, S., Russell-Smith, J., Kerins, S., Costanza, R., Edwards, A., Sangha, K.K., 2018. Change and
continuity: the North Australia cultural landscape, in: Russell-Smith, J., Pedersen, H., James, G.,
Sangha, K.K. (Eds.), Sustainable land sector development in Northern Australia: Indigenous rights,
aspirations, and cultural responsibilities. In press. CRC Publishing, Florida, USA.
3. Australian Business Roundtable for Disaster Resilience and Safer Communities (ABR DRSC), 2017.
Building resilience to natural disasters in our states and territories. Australian Business Roundtable for
Disaster Resilience and Safer Communities and Deloitte Access Economics, p. 120.
4. BNHCRC (Bushfire & Natural Hazards Cooperative Research Centre), 2015. Annual Report: Scoping
Remote North Australian Community Resilience. Charles Darwin University, Darwin. URL:
http://www.bnhcrc.com.au/publications/biblio/bnh-2450, accessed on 20 Jan 2018.
5. Bureau of Meteorology, 2018. Tropical cyclone trends.
http://www.bom.gov.au/cyclone/climatology/trends.shtml, accessed on 21 June 2018.
6. Commonwealth of Australia (CoA), 2007. Keeping our mob safe: A national emergency
management strategy for remote Indigenous communities. Commonwealth of Australia.
7. Council of Australian Governments (COAG), 2011. National strategy for disaster resilience: Building
the resilience of our nation to disasters. Commonwealth of Australia.
8. Dowdy, A. J. 2014. Long-term changes in Australian tropical cyclone numbers. Atmospheric
Science Letters, doi: 10.1002/asl2.502.
9. NAILSMA (North Australian Land and Sea Management Alliance Ltd.), 2014a. Literature Review on
Community Resilience in Remote North Australia. Published by the North Australian Land and Sea
Management Alliance.
10. NAILSMA, 2014b. NAILSMA - Scoping Community Resilience Project: Community Asset Mapping
Report. Published by the North Australian Land and Sea Management Alliance.
11. NTPFES, 2017. Northern Territory Police, Fire & Emergency Services 2016–17 Annual Report., Darwin.
NT Government.
12. Russell-Smith, J., Cook, G.D., Cooke, P.M., Edwards, A.C., Lendrum, M., Meyer, C.P., Whitehead,
P.J., 2013. Managing fire regimes in north Australian savannas: applying Aboriginal approaches to
contemporary global problems. Frontiers in Ecology and the Environment 11, e55-e63.
13. Sithole, B., Hunter-Xenie, H., Daniels, C., Daniels, G., Daniels, K., Daniels, A., Daniels, G., al., e., 2017.
Chapter 15: Living with Widdijith – protocols for building community resilience in remote
communities in northern Australia, in: Paton, D., Johnson, D.M. (Eds.), Disaster resilience: an
integrated approach (Second edition). Springfield, Illinois Charles C Thomas, Publisher, Ltd.
14. Taylor J (2006) Population and diversity: policy implications of emerging Indigenous demographic
trends. CAEPR Discussion Paper No. 283/2006. Centre for Aboriginal Economic Policy Research,
Australian National University, Canberr

AFAC18: PROCEEDINGS FROM THE BUSHFIRE AND NATURAL HAZARDS CRC & AFAC CONFERENCE 2018 | REPORT NO. 367.2018
382
The Hawaii nuclear alert: how did people respond?
Non-peer reviewed research proceedings from the Bushfire and Natural Hazards
CRC & AFAC conference
Perth, 5 – 8 September 2018
Andrew Gissing & Ashley Avci
Risk Frontiers
Bushfire and Natural Hazards CRC
Corresponding author: [email protected]

AFAC18: PROCEEDINGS FROM THE BUSHFIRE AND NATURAL HAZARDS CRC & AFAC CONFERENCE 2018 | REPORT NO. 367.2018
383
ABSTRACT Nuclear tensions between the United States and North Korea have been extensively reported as
both sides postured via threats and propaganda and North Korea conducted missile tests. North
Korea’s leader Kim Jong-Un had promised to decimate the US and was referred to by President
Trump as mentally ‘deranged’. A story in the New York Times in late 2017 based upon
consultations with leading security experts suggested that the chance of war breaking out was
between 15 and 50 percent (Kristof, 29/11/2017). Given the threat of an attack, U.S. government
officials encouraged residents to be prepared and commenced monthly drills to test warning
systems.
Within this environment of heightened geopolitical tensions, a single text message was sent in
error to people in Hawaii on the 13th of January at 8.07am, warning of an imminent ballistic
missile strike.
The alert presents an opportunity to improve the understanding of how people react to warnings
of extreme events. Risk Frontiers researchers conducted an analysis of media interviews with 207
individuals (respondents) who received the warnings to identify people’s attitudes and responses
after the alert was received. Interview responses were coded, analysed and are reported in this
paper.
INTRODUCTION
Nuclear tensions between the United States and North Korea have been extensively reported as
both sides postured via threats and propaganda and North Korea conducted missile tests. North
Korea’s leader Kim Jong-Un had promised to decimate the US and was referred to by President
Trump as mentally ‘deranged’. A story in the New York Times in late 2017 based upon
consultations with leading security experts suggested that the chance of war breaking out was
between 15 and 50 percent (Kristof, 29/11/2017). Given the threat of an attack, U.S. government
officials encouraged residents to be prepared and commenced monthly drills to test warning
systems.
Within this environment of heightened geopolitical tensions, a single text message was sent in
error to people in Hawaii on the 13th of January at 8.07am, warning of an imminent ballistic
missile strike. The message read:
Emergency Alert. BALLISTIC MISSLE THREAT INBOUND TO HAWAII. SEEK IMMEDIATE SHELTER. THIS IS
NOT A DRILL.
Officials alerted the public to the error via social media 13 minutes later, but it took 38 minutes to
send a follow-up text message. In the meantime, the community was left to react as if a real
missile was to strike Hawaii within twelve to fifteen minutes. It has been revealed that the delays
were the result of local officials believing they required federal approval to cancel the alert.
The alert presents an opportunity to improve the understanding of how people react to warnings
of extreme events. Risk Frontiers researchers conducted an analysis of media interviews with 207
individuals (respondents) who received the warnings to identify people’s attitudes and responses
after the alert was received. The media interviews were sourced from a search of global online
media outlets that had reported on the false alarm. Interview responses were coded, analysed
and are reported in this paper.
RESULTS
Respondents commonly spoke of where they were when they received the alert. Locations
varied, highlighting the importance of considering the many likely locations of people when an
alert is issued. Most frequently respondents were in a hotel (n=39) or awake at home (n=38).
Others were at home, but in bed (n=11); at work (n=10), in a car (n=10), at the beach (n=7) or in
the ocean (n=3).
Most respondents received the alert via the official text message issued by the State (n=89), but a
minority were informed by someone else: for example, a family member (n=17). Some

AFAC18: PROCEEDINGS FROM THE BUSHFIRE AND NATURAL HAZARDS CRC & AFAC CONFERENCE 2018 | REPORT NO. 367.2018
384
respondents, however, spoke of being spared the stress of the false alarm as they did not receive
the initial warning (Hawaii News Now, 16/1/2018).
Respondents often spoke about how they had trusted the alert because they had interpreted it
in the context of existing North Korea and United States tensions (n=36) and therefore believed
the alert to be plausible.
Those that chose to validate the warning did so through a multitude of different channels
including social media (n=26), making contact with others (n=15), searching websites (n=16),
listening for sirens (n=16), watching TV (n=11) or calling authorities (n=3). Based on interview
statements in which residents stated how they had immediately responded to the warning, we
estimate that a large number of residents may not have attempted to validate the warning
(n=64).
Respondents often spoke about how they felt when they received the alert. Most often people
described their emotions as fearful (n=51), concerned (n=23), panicked (n=21), upset (n=13) or
calm (n=13).
Most respondents undertook protective actions in response to the warning (n=136), most often
stating that they attempted to seek shelter within the building they were located in (n=43); called
or texted others to alert them (n=23) or called or texted others to express their emotions (n=22).
Other actions included packing emergency items (n=17); gathering family members (n=16);
attempting to leave a building to seek shelter elsewhere (n=15) and leaving an open space to
seek shelter (n=12). Eighteen respondents stated that they did not know what to do when they
received the alert.
Respondents also commented on what they observed other people doing. Most commonly
others were observed attempting to seek shelter (n=50), crying (n=26), running (n=25) or calling or
messaging others (n=13).
When seeking shelter, respondents most often stated that they had attempted to seek shelter
within their home (n=34), frequently within the bathroom (n=18). In addition nineteen respondents
spoke about sheltering within their hotel. Some commented that they did not know where to seek
shelter (n=18).
A small number of respondents stated that they did not take any action (n=16). Reasons for not
responding were that respondents thought that there was nothing that could be done (n=7); the
warning was false as sirens did not sound (n=4); the missile would be shot down or would miss
(n=2); or the warning was a joke or hoax (n=2).
Those that mentioned how they had discovered the alert was false found this information through
social media (n=21) or via a text message from authorities (n=12). On discovering that the alert
was a false alarm, respondents described their emotions as relieved (n=23), concerned (n=7) or
upset (n=7).
Respondents commented on how the situation was handled or how warnings could be improved
in the future. Most often, respondents were concerned about the lack of safeguards to avoid
such a false alarm and that it took too long for authorities to notify the public that the alert was
false. In some cases, respondents reflected on their own personal disaster preparedness, noting
specific actions that they had not undertaken to be prepared.

AFAC18: PROCEEDINGS FROM THE BUSHFIRE AND NATURAL HAZARDS CRC & AFAC CONFERENCE 2018 | REPORT NO. 367.2018
385
DISCUSSION AND CONCLUSION
The Hawaii missile false alarm provides numerous insights into how people behave when
warned of an extreme event. Practitioners should note the importance of social media as a
communications mechanism, particularly for people to validate warnings and share with
others.
The case study demonstrates the role of informal networks in both communicating and
validating warnings. Hotels were clearly an important node of communication with their
guests, and should always be considered an important network in communicating
warnings in at-risk areas with large tourist populations.
Interestingly, it would appear that the population had been primed to respond to such an
alert by their knowledge or concerns regarding tensions between North Korea and the
United States. This demonstrates the importance of communicating long range forecasts to
build the community’s awareness of a risk so that individuals will recognise and respond
to a warning when it occurs.
Given that the official advice as to what to do in the event of a real alert is for “all residents
and visitors to immediately seek shelter in a building or other substantial structure”, it
appears that most respondents reacted appropriately. However, consistent with previous
Risk Frontiers research on community responses to warnings, not everyone responded or
knew how to respond. This is a further demonstration that even in extreme circumstances,
emergency warnings cannot be relied on to achieve full compliance by communities. This
finding should be considered when relying on warning systems to justify the permitting of
development in high risk locations.
As for improving warning technologies, the Hawaiian Emergency Management Agency has
suspended all future drills until a review of the event has been completed; instituted a
two-person activation/verification rule for all tests and actual alarms and instigated a
cancellation command that can be activated within seconds of a false alarm.
REFERENCES
HAWAII NEWS NOW. 16/1/2018. If you didn’t get the false alert about an inbound missile, this
might be why. Available: http://www.hawaiinewsnow.com/story/37269695/if-you-didnt-get-the-
false-missile-alert-this-might-be-why [Accessed 27/1/2018].
KRISTOF, N. 29/11/2017. Are we headed toward a new Korean war. New York Times.