
Differences in Situational Awareness and How to Manage Them in Development of Complex Systems
Upload
khangminh22Category
view
0download
0
Bushfire Situational Awareness & SystemsA U S E R - L E D C O N C U R R E N T D E S I G N S T U D Y O F B U S H F I R E M A N A G E M E N T S Y S T E M S I N A U S T R A L I A
V 1 N O V E M B E R 2 0 2 1

Use of Fire Spread Prediction in Practise
Fire ‘Line’ Scans from Aerial Assets
Water Resources and Point Maps
Communications: The System Backbone
Response to the 2019 Fires
Government Agency Restructure
PART 2: DATA, TECHNOLOGY & OPPORTUNITIES FOR THE FUTURE 108
Map of the Opportunity Space
Future Communications
A ‘Mini-COP’ for Fireground Use
Intelligence on the Edge
Digital Twins for Bushfire Management
Roadmap to active cyber-infrastructure
Contents
INTRODUCTION 4
CONTEXT OF THIS REPORT 6
AUTHORS AND REVIEWERS 8
ABOUT TRILLIUM TECHNOLOGIES 10
PART 1: CURRENT PRACTISE 12Overview of Rural Firefighting
VIEW FROM THE GROUND 18Organisation of the Fireground
User Stories: Ground Crew
Firefighting Timeline & Tactics
Perspective: A Shift on a Truck
Data Flow: Observations and Requests from the Fireground
VIEW FROM THE INCIDENT MANAGEMENT TEAM 40User Stories: The Incident Management Team (IMT)
The Incident Action Plan
Information Flow Analysis of a Firefighting Effort
Scaling Command in the IMT: The AIIMS System
AIIMS Beyond the Fireground
Supporting and Surrounding Agencies
IMT Situational Intelligence: The Common Operating Picture
The Logistics of Fighting Fires
Tracking Personnel and Equipment: The T-Card System
INTELLIGENCE AND DATA 70Data to Support Firefighting: National & State Providers
Profile: Geoscience Australia
Case Study: DEA Hotspots
International Satellite Imagery Support
Profile: The Bureau of Meteorology
Intelligence and Data - continued
Intelligence Layers for Firefighting
Fire Spread Prediction
Fire Risk Assessment
Current Workhorse Prediction Tools
Other Fire Intelligence Tools and Systems
Many of the images from used in this
report come from the work of ACT RFS
photographer Gary Hooker.
We are deeply grateful for permission
to use them.
The images form part of a new book
illustrating the catastrophic fires in
Australia during 2019 and 2020.
Ablaze.The Long, Hot Summer 2019-20
actvolunteerbrigadesassociation.com/shop
© Trillium Technologies 2021. All rights reserved. Except as permitted by the copyright
law applicable to you, you may not reproduce or communicate any of the content in this
report without permission of the copyright owner. The Australian Copyright Act allows
certain uses of content from the internet without the copyright owner’s permission. This
includes uses by educational institutions and by Commonwealth and State governments,
provided fair compensation is paid. For more information, see www.copyright.com.au.
2 3B U S H F I R E S I T U AT I O N A L A W A R E N E S S B U S H F I R E S I T U AT I O N A L A W A R E N E S S

We strongly believe that the first step in
developing any system is to listen to the
end-users. This report stems from a user-led
concurrent design workshop on bushfire
systems organised by Trillium Technologies
in February 2021. The workshop brought
together active firefighters with data
and technology experts to define current
best practices, and to identify strategic
opportunities for applying new technology
with maximum impact.
In this report, we present a system-
level overview of bushfire management
in Australia, with a particular focus
on fireground operations. We identify
challenges and significant pain points
experienced by active firefighters, and show
how technology might solve issues in the
near future.
We are releasing this work as an open
resource in the hope it proves useful to a
broad range of stakeholders - organisations
seeking to understand fire management
processes and the needs of ground crew,
companies developing technical solutions,
government departments who want
to understand possible applications of
technology, firefighters at different levels,
and the general public who want a broad
overview of the firefighting effort.
Introduction
The bushfires experienced during the 2019/2020 Australian summer were bigger and more intense than any in fires in living memory. Blazes like the Gospers Mountain Fire burned for months, destroying homes and livelihoods, reducing pristine wilderness to ash and submerging vast areas under thick smoke clouds. The task of fighting these ‘megafires’ fell to the rural fire and emergency services - most of whom are volunteers from local communities. These courageous men and women battled exhaustion, choking air and dangerous conditions to control the fires, saving people, property and environment. We are deeply grateful for their efforts and want to make their work easier in the future by building modern tools for situational awareness and decision support.
A REPORT FOR THE COMMUNITY
This document remains a work in progress. We are keenly aware that procedures and capabilities differ significantly between states, and that these differences may not yet be captured here.
Please get involved to make this report more useful - send a correction, clarify a point or make an edit. We would be delighted to hear from you!
Workshop participants at the Australian National Concurrent Design Facility. This was the first use of the UNSW facility for a purpose other than designing satellite missions. Left to right: Garry Hooker (ACT RFS), Jan-Christian Meyer (UNSW), Rob Gore (ACT RFS), Cormac Purcell (Trillium Technologies) and Sheida Hadavi (ARDC). Other attendees participated via videoconference links. Image Credit: Rob Gore.
DISCLAIMER:The contents of this report should not be construed as an endorsement of any particular
product or service. The authors have reached out to public and private organisations to
capture the views of a broad range of bushfire stakeholders. We welcome feedback and
further engagement - please contact [email protected]
4 5B U S H F I R E S I T U AT I O N A L A W A R E N E S S B U S H F I R E S I T U AT I O N A L A W A R E N E S S

WHO IS THIS REPORT FOR?
We hope this report is generally useful for a wide range of groups and organisations:
• Technology developers seeking to understand current firefighting
practices in Australia and New Zealand.
• Emergency management personnel from other jurisdictions
seeking a ‘systems level’ overview of how fires are fought and
managed in Australia.
• Firefighters who would like to understand how increasingly
connected sensors and remote-sensing data could benefit
firefighting operations.
• Organisations seeking insight into the major ‘pain points’
experienced by firefighters occupying different roles on the rural
fireground.
• Academics undertaking technology or fire related research, who
want to understand how their results might have practical impact.
• The general public who are interested in the positive use of
artificial intelligence in a ‘cyber-infrastructure’ for disaster response.
• The broad emergency response ecosystem: insurance and risk
experts, land management agencies, infrastructure, logistics
and utility companies, heritage custodians, local government
departments, and data management agencies.
Context of this Report
WHAT IS THE PURPOSE OF THIS REPORT?
This report seeks to help shape the future development of bushfire management systems by capturing a common perspective of current practices and identifying opportunities to enhance capabilities by employing new and emergent technologies.
• Record the current systems and operating procedures employed by the
personnel and agencies that play an essential role in combating bushfires.
• Identify the needs and challenges of:
- Firefighters at tactical (crew) and strategic (management) levels;
- Data and technology specialists who service firefighters;
- Broader emergency management organisations surrounding the
firefighting cohort.
• Identify and describe potential technology, systems, or components that
address these needs.
This report has been prepared using a ‘fireground up’ approach by first
listening to the experiences of active firefighters, before considering and
discussing technological possibilities. This iterative approach has the
advantage of validating ideas against field-users, while building community
consensus on potential future strategic directions. The report aim to
complement recent reports and initiatives in Australia:
Reports:• Bushfire Earth Observation Taskforce Report
• Royal Commission into Natural Disaster Arrangements
• The NSW Bushfire Inquiry
• The CSIRO Report on Climate and Disaster Resilience
Initiatives:• The ARDC Bushfire Data Challenges
• The Minderoo Foundation Fire Shield Mission
• Resilience NSW executive agency
• Natural Hazards Research Australia
• Bushfire & Natural Hazards CRC
6 7B U S H F I R E S I T U AT I O N A L A W A R E N E S S B U S H F I R E S I T U AT I O N A L A W A R E N E S S

This work would not have been possible without the contributions of our authors and reviewers from the organisations below. Special thanks go to the Rural Fire Service in the Australian Capital Territory (ACT RFS) and the AFAC Predictive Services group, who went beyond the call of duty to provide insight into the processes and technology used to fight fires in Australia.
REPORT AUTHORS
Cormac Purcell, James Parr (Trillium Technologies)
SIGNIFICANT CONTRIBUTORS
Nick Bolan, Tony Xu (ATC RFS), Dylan Kendall (Zirkarta).
WORKSHOP PARTICIPANTS
Robert Gore, Gary Hooker, Rohan Scott, Tony Xu, Paul Murphy (ACT RFS), Greg Esnouf , Mike Wouters (AFAC, SA), Hugh Wallace, Kate Melnik, Ilze Pretorius (Scion Research), Hudson David (GA), Gottfried Lechner (UniSA, SmartSat CRC), Ehsan Abbasnejad, Mahdi Kazemi Moghaddam (AIML), Rania Poullos (The Minderoo Foundation), Sheida Hadavi (ARDC), Jan-Christian Meyer (ANCDF).
REPORT DESIGNERS
Leo Silverberg, Izzy Way (Trillium Technologies)
Authors and Reviewers8 9B U S H F I R E S I T U AT I O N A L A W A R E N E S S B U S H F I R E S I T U AT I O N A L A W A R E N E S S
About Trillium Technologies
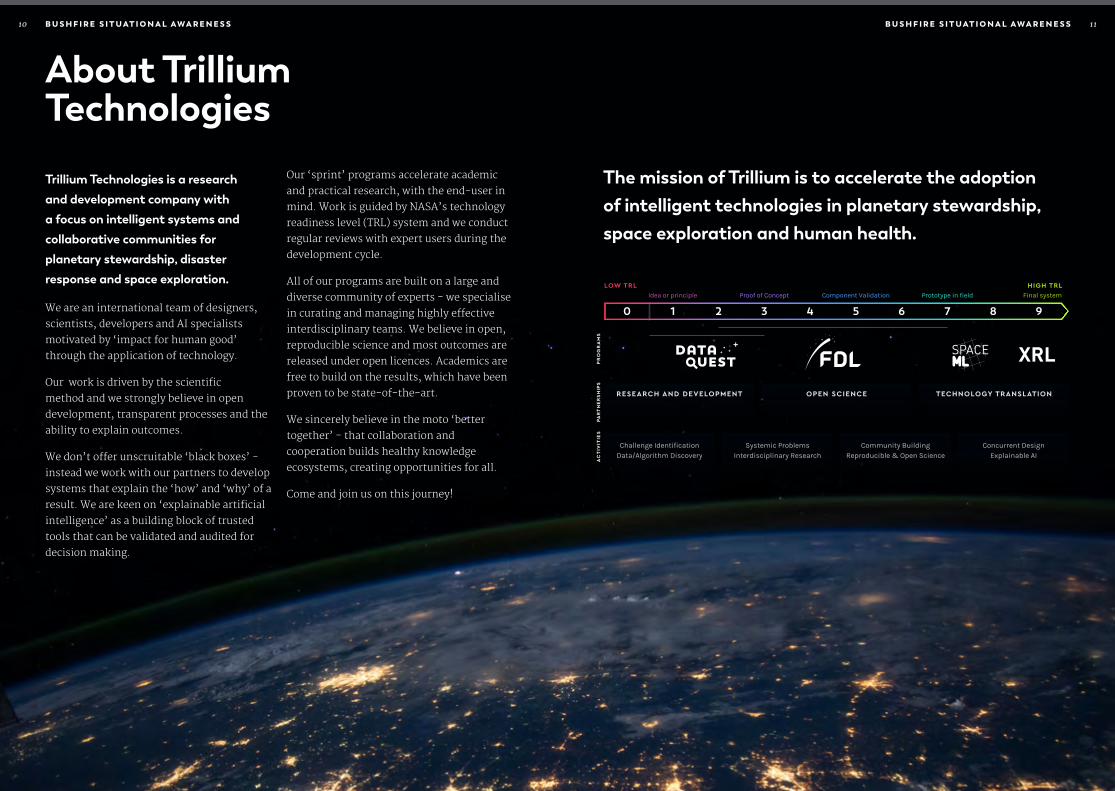
Our ‘sprint’ programs accelerate academic
and practical research, with the end-user in
mind. Work is guided by NASA’s technology
readiness level (TRL) system and we conduct
regular reviews with expert users during the
development cycle.
All of our programs are built on a large and
diverse community of experts - we specialise
in curating and managing highly effective
interdisciplinary teams. We believe in open,
reproducible science and most outcomes are
released under open licences. Academics are
free to build on the results, which have been
proven to be state-of-the-art.
We sincerely believe in the moto ‘better
together’ - that collaboration and
cooperation builds healthy knowledge
ecosystems, creating opportunities for all.
Come and join us on this journey!
Trillium Technologies is a research and development company with a focus on intelligent systems and collaborative communities for planetary stewardship, disaster response and space exploration.
We are an international team of designers,
scientists, developers and AI specialists
motivated by ‘impact for human good’
through the application of technology.
Our work is driven by the scientific
method and we strongly believe in open
development, transparent processes and the
ability to explain outcomes.
We don’t offer unscruitable ‘black boxes’ -
instead we work with our partners to develop
systems that explain the ‘how’ and ‘why’ of a
result. We are keen on ‘explainable artificial
intelligence’ as a building block of trusted
tools that can be validated and audited for
decision making.
The mission of Trillium is to accelerate the adoption of intelligent technologies in planetary stewardship, space exploration and human health.
LOW TRL
AC
TIV
ITIE
SP
RO
GR
AM
SPA
RT
NE
RS
HIP
S
XRL
0
Idea or principle Proof of Concept Component Validation Prototype in field Final system
1 2 3 4 5 6 7 8 9
HIGH TRL
Challenge IdentificationData/Algorithm Discovery
Systemic ProblemsInterdisciplinary Research
Community BuildingReproducible & Open Science
Concurrent DesignExplainable AI
RESEARCH AND DEVELOPMENT OPEN SCIENCE TECHNOLOGY TRANSLATION
10 B U S H F I R E S I T U AT I O N A L A W A R E N E S S 11B U S H F I R E S I T U AT I O N A L A W A R E N E S S

PA R T 1
Current PractiseAn overview of current firefighting practise - from the fireground to the Incident Management Team.
Photo Credit: Gary Hooker, ACT RFS.
12 B U S H F I R E S I T U AT I O N A L A W A R E N E S S : PA R T O N E 13B U S H F I R E S I T U AT I O N A L A W A R E N E S S : PA R T O N E

Each Australian state maintains fire and emergency services whose remit
is to fight fires in rural areas. Most fire services rely on a large contingent
of volunteers in addition to career firefighters, especially during the annual
fire season in the southern hemisphere summer. As our climate warms,
fire seasons are predicted to span more time each year and catastrophic fire
seasons become more common.
Overview of Rural Firefighting
Fighting fires in rural Australia is uniquely challenging for a number of reasons:
· Fires are often ignited in remote locations,
most commonly because of lightning strikes.
· Wild terrain can make fireground access difficult.
· Water is often a scarce or contested resource,
especially during times of drought.
· Eucalypt forests are highly flammable and shed
combustible bark that is easily ignited.
· Airborne firebrands are a common feature of Australian
bushfires and can ignite new fires up to 30 km away.
ORGANISATION MEMBERSHIP
Tasmania Fire Servicefire.tas.gov.au Mix of volunteer and career firefighters.
ACT Rural Fire Serviceesa.act.gov.au/rural-fire-service Volunteer firefighting service covering rural areas.
NSW Rural Fire Servicerfs.nsw.gov.au
Largest volunteer firefighting organisation in the
world, with professional senior roles.
Victorian Country Fire Authority (VIC)cfa.vic.gov.au
Volunteer fire service covering rural areas in
Victoria alongside the FFMV.
Forest Fire Management Victoriaffm.vic.gov.au
The FFMV manages fire risk and hazard reduction
burns on Victorian public land.
NT Fire and Rescue Servicefes.nt.gov.au/fire-and-rescue-service
Mix of career of volunteer firefighters, with some
fire stations staffed entirely by volunteers.
Queensland Rural Fire Serviceruralfire.qld.gov.au
Volunteer firefighting arm of the Queensland Fire
and Emergency Services.
Queensland Fire and Rescue Servicesqfes.qld.gov.au
Professional firefighting arm of the Queensland Fire
and Emergency Services.
South Australia Country Fire Servicecfs.sa.gov.au
Volunteer firefighting service covering rural and
occasionally urban areas.
Western Australian Department of Fire and Emergency Services (DFES) dfes.wa.gov.au
The WA Department of Fire and Emergency Services
coordinates emergency services for a range of
natural disasters and incidents.
AFACafac.com.au
Peak body of fire-related organisations in Australia
and New Zealand.
The Australasian Fire and Emergencies
Authorities Council (AFAC) is the peak body
that supports collaboration between fire,
emergency and land management agencies
in Australia and New Zealand. It promotes
knowledge transfer and development of
common best-practice techniques, and
operational standards.
There are also many other organisations,
like the State Emergency Services (SES), who
support operational firefighting. We map
these out later in this report [TODO: REF
PAGE].
14 15B U S H F I R E S I T U AT I O N A L A W A R E N E S S : C U R R E N T P R A C T I S E B U S H F I R E S I T U AT I O N A L A W A R E N E S S : C U R R E N T P R A C T I S E

In every state, land management agencies deploy firefighters and firefighting equipment as part of their normal duties. In most states, land managers, rather than rural fire services, are responsible for managing the majority of fires on the land under their control. The exception is the Australian Capital Territory, where the RFS is responsible for fire suppression, irrespective of land tenure.
L A N D M A N A G E M E N T A G E N C I E S A N D G O V E R N M E N T D E PA R T M E N T S
ORGANISATION MEMBERSHIP
NSW Parks and Wildlife Servicesnationalparks.nsw.gov.au
Part of the NSW Department of Planning, Industry
and Environment. Maintains fire history data at
data.nsw.gov.au
Resilience NSWnsw.gov.au/resilience-nsw
Resilience NSW leads disaster and emergency
efforts from prevention to recovery. Part of the
Department of Premier and Cabinet.
Bushfires NTnt.gov.au/emergency/emergencies/about-emergency-services/bush
Division of the NT Department of Environment and
Natural Resources (DNER). Chartered to reduce the
risk of wildfires in rural and remote communities.
Fire data can be found at firenorth.org.au/nafi3
NT Department of Environment, Parks and Water Security (DEPWS)depws.nt.gov.au
DEPWS includes the key functions that foster and
protect the environment and natural resources
in the Northern Territory, including hosting
environmental and geospatial data layers at
nrmaps.nt.gov.au
SA Department for Environment and Water (DEW)environment.sa.gov.au/Home
The SA Department for Environment and Water
helps South Australians manage and conserve
environmental and cultural resources, including
performing prescribed burns. Geospatial maps can
be accessed at data.sa.gov.au, naturemaps.sa.gov.au
and naturemaps.sa.gov.au
Tas Department of Primary Industries, Parks, Water and Environment (DPIPWE)dpipwe.tas.gov.au
DPIPWE is Tasmania’s lead natural resources
agency. Open data, including fire history, can be
accessed at thelist.tas.gov.au/app/content/data/
index.
Vic Department of Environment, Land, Water and Planning (DELWP)delwp.vic.gov.au
The Victorian Department of Environment,
Land, Water and Planning contains Forest Fire
Management Victoria, which includes staff from
Parks Victoria, VicForests and Melbourne Water.
DEWLP manages bushfire risk and prescribed
burns. Fire data is available from data.vic.gov.au
Department of Biodiversity, Conservation and Attractionsdbca.wa.gov.au
Promote biodiversity and conservation through
sustainable management of Western Australia’s
species, ecosystems, lands and attractions. Data
available at data.wa.gov.au
16 17B U S H F I R E S I T U AT I O N A L A W A R E N E S S : C U R R E N T P R A C T I S E B U S H F I R E S I T U AT I O N A L A W A R E N E S S : C U R R E N T P R A C T I S E

Organisation of the FiregroundThis report covers firefighting practices
and systems at scales that span individual
firefighters to the incident management
team (IMT) responsible for managing large
fires. Command and control structures at
higher levels (e.g., regional and state levels)
replicate and expand on the fireground IMT
using the AIIMS paradigm (see page REF).
The figure below illustrates the command
structure on the fireground, showing the
staging area where the IMT is usually located
and how the perimeter control lines are
broken into divisions and sectors.
Small fires are managed locally by the first
crews on the scene (level 1 incident - L1).
Larger fires (L2+) require a more coordinated
response: the proposed control lines for the
fire are broken into divisions and sectors and
an incident management team is created at
the staging area. The divisional commander
(DivCom) is a key liaison between the IMT
and fire crews, while the sector commanders
coordinate crew shift changes every 12 hours.
Staging AreaINCIDENT MANAGEMENT TEAM
INCIDENT CONTROLLER
PLANNING OFFICER
INTELLIGENCE / MAPPING
OPERATIONS OFFICER
AIR OPERATIONS
LOGISTICS OFFICER
STAGING AREAS
PUBLIC INFORMATION OFFICER
FIREGROUND OPERATIONS
OPERATIONS OFFICER ( IMT)
DIVISION COMMANDER 1
SECTOR COMMANDER A
STRIKE TEAM (5x trucks/crews)
APPLIANCE
TASK FORCE (Truck/Crews)
SECTOR COMMANDER B
SECTOR COMMANDER Z
DIVISION COMMANDER 2
. . .
DCSA
DC SA
Control Line
Spotting
Fire
Per
im
eter
Credit: Adapted from a figure created by the NSW Rural Fire Service.
18 19B U S H F I R E S I T U AT I O N A L A W A R E N E S S : V I E W F R O M T H E G R O U N D B U S H F I R E S I T U AT I O N A L A W A R E N E S S : V I E W F R O M T H E G R O U N D

INITIAL DISPATCH AND TRAVEL
On-call firefighters notified of:• Incident location.
• Incident type (e.g., bushfire, flood).
Pager, BART App.
15 minutes to gather
Situation update en-route:• Fire extent
• Weather currently
• Weather forecast
• Resources available.
Route-planning to access a fire can be a big issue.
Radio Voice, MDT, Mobile apps.
MDT (when available):• Navigation to fireground.
• Road maps.
• Registered crew.
• Truck status (proceeding, responding, …).
Crew ‘attached’ to job using firefighter ID
numbers (manual entry).
ARRIVAL AND FIRST ASSESSMENT
Assess situation by driving and observing. ITASC:• Incident
• Threat
• Access
• Safety
• Comms
Personal observations, Notebook
Identify or create access points (gate, fence to cut):• Map fireground
• Point of origin
• Boundary
• Landscape features
• Key assets
• Dangers
First crew on the ground fends for themselves and establishes a local command structure using the AIIMS principles:• Work out plan-of-attack
• Which trucks where?
• Communications channels on radios.
Fire Detected
USER STORIES
Ground Crew
COMPLEX FIRE INCIDENT (≥ 1 DAY) FORMAL IMT ESTABLISHEDFires that take more than 12 hours (1 shift) to deal with will require a formal IMT to be established (L2):• Command structure on fireground changes.
• Initial IC becomes a division commander
(DivCom).
• Staging ground established.
• IMT usually based out of an Incident Control
Centre,
chosen for good comms.
Information handover:• Assessment from 1st crew to formal IMT.
• Incident Action Plan (IAP) document created
and distributed.
• Crews tasked and receive a printed IAP
(or link/QR-code). One per vehicle or person.
• IAP includes maps with features of interest,
fire extent and in limited instances fire spread
predictions.
Information flowing down:• Crews are briefed by DivCom at staging area.
• Crews tasked and deployed from staging area,
and return to staging area when done.
Information flowing up:• Hourly situation report from crew leader to
DivCom.
• Crews report safety issues to DivCom
(can include photos and GPS coords).
• Crews annotate IAP maps with changes.
• Annotated IAP facilitates handover to new
shift and updates to IMT (12 hours),
In this section we provide a general overview of the fire fighting process from the perspective of crew on the fireground. Australian fire crews commonly deploy in trucks and are typically comprised of a Crew Leader and 3-4 Firefighters. They are first on scene an provide support as part of a rotational shift pattern which endures until the fire has been extinguished..
Fire Extinguished
20 21B U S H F I R E S I T U AT I O N A L A W A R E N E S S : V I E W F R O M T H E G R O U N D B U S H F I R E S I T U AT I O N A L A W A R E N E S S : V I E W F R O M T H E G R O U N D

MAPPING
PRIOR ACCESSGaining access to maps ahead of time can be difficult – need to pre-load the
files.
ANNOTATION LAGThere is often no mechanism for the annotations made on IAP maps by fire
fighters to transfer to the IAP map for the next shift. Where this is possible
these annotations are often passed to the incoming shift of fire fighters
which results in fire fighters and the IMT having a different versions of the
truth. This shift change typically takes 12 hours which means the map the
IMT has access to is often 12 hours behind reality. Sharing KML or pdfs is
manual and time consuming and slows the tempo of operations.
INFORMATION SHARINGThere is currently no simple way to share mapping and other information;
i.e. dangerous trees, fire perimeter. Fire fighters can share KML /annotated
PDFs etc. using Avenza however this only works on apple devices and
depends on the availability of 4G network.
SITUATIONAL AWARENESS
FEATURE IDENTIFICATIONFire fighters do not know anything about the features in the fire location
(e.g. hazards, assets, completed prevention activities that do not appear
on standard maps) until they see them with their own eyes – they may not
be able to see them due to smoke/darkness. The existence of such features,
which are spatial, must be shared by radio – it is extremely difficult to
describe spatial dynamic features by radio.
STRAW TUBE PERSPECTIVEEach fire fighter can only see a small part of the fire – the person initially in
charge of the fire must mentally piece together a number of unique verbal
descriptions to create a map of the fire in their head. Developing this mental
image is extremely challenging and cannot be shared with others.
U S E R S TO R I E S
Ground Crew Pain Points
Photo Credit: Gary Hooker, ACT RFS.
INFORMATION FLOW
VOICE COMMUNICATIONRadio voice communication is the main technology in use (GRN/TRN).
Information is passed by radio from one hierarchical level to the next and
from that level to the next and so on. This results in a ‘Chinese Whispers’
scenario.
HANDOVER BETWEEN SHIFTSPoor information flow from previous crew to next crew. Debrief currently
happens at the staging area, but better done on the fire ground.
REASONING AND DOCUMENTATION OF DECISIONSNeed to record damage to property (e.g cut fence) and amount of water
extracted and reasons for decision in consistent way. All decisions need
to be documented (e.g. decided asset was undefendable, locals warned of
danger but decided not to evacuate).
22 23B U S H F I R E S I T U AT I O N A L A W A R E N E S S : V I E W F R O M T H E G R O U N D B U S H F I R E S I T U AT I O N A L A W A R E N E S S : V I E W F R O M T H E G R O U N D

Firefighting Timeline & TacticsINITIAL RESPONSE TO AN INCIDENT
When first dispatched to a fire, the first arriving crew leader will assume command of the incident and provide a briefing to the relevant Fire Command or Communications Centre. This will include;
• Assessment of the size and ferocity of the
fire.
• List of threatened assets nearby.
• The resources at hand, actions to be taken
by the crew and the firefighting strategy to
be adopted.
• Whether further support will likely be
needed (e.g., a request for a divisional
commander and further strike teams).
• The basic command and communications
structure on-site.
• Assessment of relevant access routes and
water points.
The first responding resources will then
proceed with the elected firefighting
strategy.
Photo Credit: Gary Hooker, ACT RFS.
MAIN FIREFIGHTING RESPONSE
When resources are deployed to an ongoing incident, most often firefighters are organised into shifts. In NSW, generally the day is divided into three twelve-hour shifts. These are the morning shift (0900-2100), swing shift (1200-0000), and night shift (2100-0900).
Start of a Shift - BriefingsCrews starting a firefighting shift will
often receive a briefing, generally held at
a designated staging area. The briefing
will be conducted in a SMEACS format and
accompanied by the incident action plan.
Personell will be briefed in a stepwise
manner down the chain of command, with
the IMT briefing divisional commanders,
who then brief sector commanders, followed
by sector/crew leaders, and then crew leaders
brief crew members.
However, this briefing process is not always
available - for example, early on when the
command structure has not yet been fully
established, or if the situation is changing
rapidly. In such instances, briefings may
not be conducted at all, or done in a highly
condensed manner.
Photo Credit: Gary Hooker, ACT RFS.
24 25B U S H F I R E S I T U AT I O N A L A W A R E N E S S : V I E W F R O M T H E G R O U N D B U S H F I R E S I T U AT I O N A L A W A R E N E S S : V I E W F R O M T H E G R O U N D

During the ShiftA shift can entail a variety of firefighting
activities. These can be broadly categorised
into the firefighting strategy to be employed
- offensive or defensive.
Within an offensive firefighting strategy,
there are three predominant tactics which
may be used depending on the fire’s
intensity: direct attack, parallel attack, and
indirect attack.
Direct attack: Firefighters directly attack the
fire’s edge with either heavy plant or water/
wetting agents. Used for low intensity fires.
Parallel Attack: Firefighters create a control
line (a fire-break) using hand tools or heavy
plant along the sides the fire, and clear the
fuels between the control line and the fire by
igniting them, or simply patrolling the lines
to put out spot-over fires. Eventually the
two flanks join to ‘pinch off’ the fire. This
strategy is used for low-moderate intensity
fires. Variations of this strategy can seek to
use pre-identified control lines and attempt
to ‘hold’ them by prevent spot-overs from
crossing those points.
Indirect Attack: Firefighters use control
lines away from the fire’s edge (e.g., existing
roads) to ignite fuels and `back-burn’ the
intervening fuels. This is used for high-
intensity fires, however care must be taken
to maintain control over the back-burn and
not ‘lose it’.
When offensive strategies are infeasible due
to resource limitations, or the intensity,
location, or size of the fire, then defensive
strategies are implemented. These include
property protection, backstop defence, and
patrolling a fire.
Aside: Out-Of-Fire-Seasons TasksFirefighters conduct a variety of out-
of-season fire management work.
Most pertinently, this includes hazard
reduction burns, ecological burns,
and indigenous burns. As with most
planned firefighting operations, these
are conducted in accordance with a
prepared IAP. Taskings generally
involve a number of resources,
generally ranging between 5-20 trucks,
creating a perimeter when necessary
and then igniting fuels in accordance
with a burn plan.
Photo Credit: Gary Hooker, ACT RFS.
Property Protection: Firefighters protect
individual assets by employing direct attack
methods, extinguishing spot-fires that
are generated by embers, and applying
backburning tactics around the asset, whilst
letting the fire burn past.
Backstop Defence: Firefighters prepare
endangered assets as best as possible
before the fire front arrives by removing
inflammable materials around the asset,
applying foam, or other risk-reducing
activities. Consequently, firefighters will
retreat to a safety-zone until the firefront
passes. As soon as the front passes,
firefighters return to assets and extinguish
any fires that have started. This tactic is used
for exceptionally high intensity fires.
Patrol: Firefighters observe and monitor a
fire. Used when a fire is inaccessible, or does
not need to be suppressed.
After a Fire has Passed: Mop Up After a fire has passed, firefighters ‘mop-up’
the burnt area. This involves extinguishing
any smouldering material, extinguishing
hot spots, and ensuring that there is no
possibility of further embers being generated
that could be blown over control lines to
ignite new fires.
After a ShiftFirefighters will seldom debrief with
oncoming crews. If a debrief does occur,
firefighters will do so with their sector
leader, passing information up the command
chain. They are then released from the
fireground to return back to their home
station or camp.
Photo Credit: Gary Hooker, ACT RFS.
26 27B U S H F I R E S I T U AT I O N A L A W A R E N E S S : V I E W F R O M T H E G R O U N D B U S H F I R E S I T U AT I O N A L A W A R E N E S S : V I E W F R O M T H E G R O U N D

FIREFIGHTING ACTIVITIES
Firefighting Operations can generally be classed into ‘wet’ and ‘dry’ firefighting.
Wet Firefighting: Firefighters employ
various hoses and pumps, or coordinate with
aerial assets, to deliver wetting agents onto
the fire, or to establish control lines.
Coordinating with aerial assets will often
involve directing a helicopter to deliver water
onto identified targets - for example a large
burning tree or a fire flare-up. Fixed wing
aircraft may also be directed to deploy their
water on specific ‘hot-spots’ or to lay down
control lines.
Dry Firefighting: Firefighters use hand tools
or heavy plant to remove fuel in a specific
area, creating control lines as required by the
IAP. In inaccessible terrain this is often done
by ‘hand-crews’ using various hand-tools.
Firefighters may also conduct back-
burning to remove fuel before the firefront
approaches. Generally, the back-burn is
initiated from a control-line (pre-existing or
newly created) using drip-torches where a
crew will be tasked to ignite a length of one
side of a control line. However, incendiaries
may also be deployed from helicopters if
appropriate.
During mop-up or blacking out firefighters
employ a variety of hand-tools and hoses
to systemically extinguish and cool any
material that is still hot. Following a fire-
front’s passing, many large logs are not
fully consumed and still remain alight.
Similarly, seemingly innocuous patches of
ground may actually have a temperature in
excess of 500 C. If these hot-spots and fires
are not extinguished they can oftentimes
remain alight for weeks, or even months.
Subsequently, any material that comes
in contact with them may ignite and be
carried over control lines, igniting new fires.
Therefore, mopping up and blacking out is
essential.
Relevant hot-spots and areas that require
mopping up may be marked on the IAP. This
activity represents the largest portion of
firefighting activities.
Photo Credit: Gary Hooker, ACT RFS.
28 29B U S H F I R E S I T U AT I O N A L A W A R E N E S S : V I E W F R O M T H E G R O U N D B U S H F I R E S I T U AT I O N A L A W A R E N E S S : V I E W F R O M T H E G R O U N D
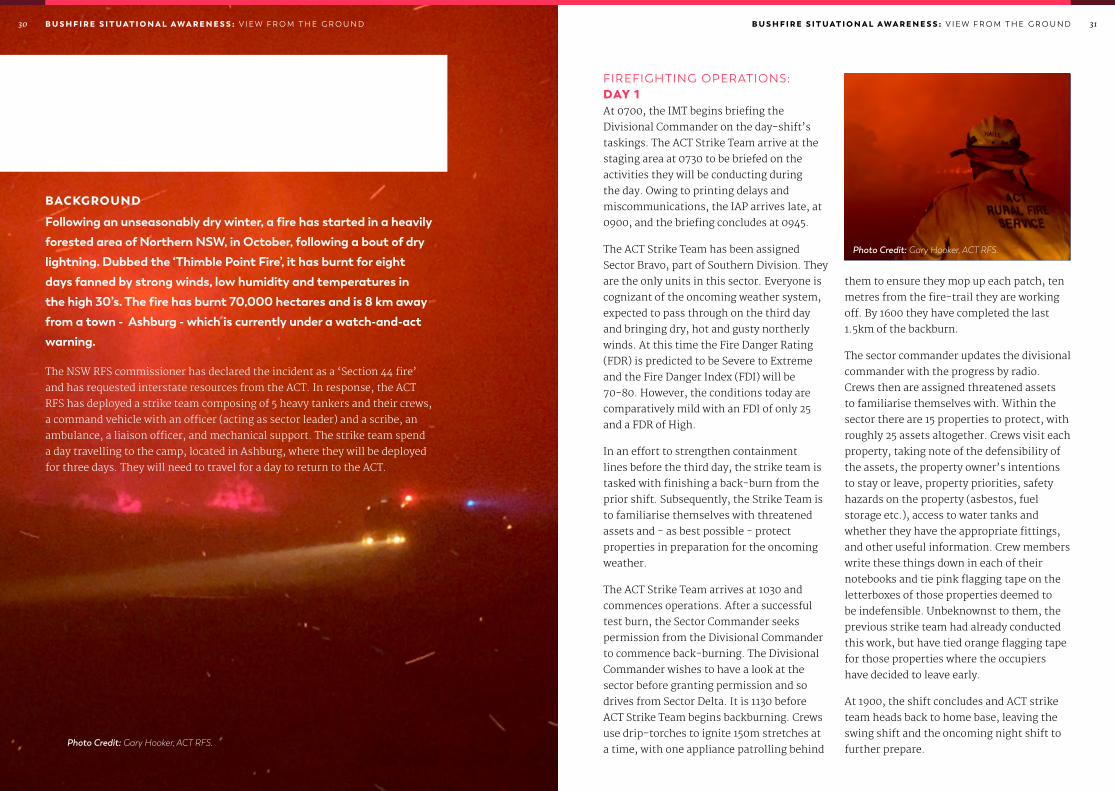
BACKGROUND
Following an unseasonably dry winter, a fire has started in a heavily forested area of Northern NSW, in October, following a bout of dry lightning. Dubbed the ‘Thimble Point Fire’, it has burnt for eight days fanned by strong winds, low humidity and temperatures in the high 30’s. The fire has burnt 70,000 hectares and is 8 km away from a town - Ashburg - which is currently under a watch-and-act warning.
The NSW RFS commissioner has declared the incident as a ‘Section 44 fire’
and has requested interstate resources from the ACT. In response, the ACT
RFS has deployed a strike team composing of 5 heavy tankers and their crews,
a command vehicle with an officer (acting as sector leader) and a scribe, an
ambulance, a liaison officer, and mechanical support. The strike team spend
a day travelling to the camp, located in Ashburg, where they will be deployed
for three days. They will need to travel for a day to return to the ACT.
P E R S P E C T I V E
A Shift on a TruckTony Xu, ACT Rural Fire Service
them to ensure they mop up each patch, ten
metres from the fire-trail they are working
off. By 1600 they have completed the last
1.5km of the backburn.
The sector commander updates the divisional
commander with the progress by radio.
Crews then are assigned threatened assets
to familiarise themselves with. Within the
sector there are 15 properties to protect, with
roughly 25 assets altogether. Crews visit each
property, taking note of the defensibility of
the assets, the property owner’s intentions
to stay or leave, property priorities, safety
hazards on the property (asbestos, fuel
storage etc.), access to water tanks and
whether they have the appropriate fittings,
and other useful information. Crew members
write these things down in each of their
notebooks and tie pink flagging tape on the
letterboxes of those properties deemed to
be indefensible. Unbeknownst to them, the
previous strike team had already conducted
this work, but have tied orange flagging tape
for those properties where the occupiers
have decided to leave early.
At 1900, the shift concludes and ACT strike
team heads back to home base, leaving the
swing shift and the oncoming night shift to
further prepare.
FIREFIGHTING OPERATIONS: DAY 1At 0700, the IMT begins briefing the
Divisional Commander on the day-shift’s
taskings. The ACT Strike Team arrive at the
staging area at 0730 to be briefed on the
activities they will be conducting during
the day. Owing to printing delays and
miscommunications, the IAP arrives late, at
0900, and the briefing concludes at 0945.
The ACT Strike Team has been assigned
Sector Bravo, part of Southern Division. They
are the only units in this sector. Everyone is
cognizant of the oncoming weather system,
expected to pass through on the third day
and bringing dry, hot and gusty northerly
winds. At this time the Fire Danger Rating
(FDR) is predicted to be Severe to Extreme
and the Fire Danger Index (FDI) will be
70-80. However, the conditions today are
comparatively mild with an FDI of only 25
and a FDR of High.
In an effort to strengthen containment
lines before the third day, the strike team is
tasked with finishing a back-burn from the
prior shift. Subsequently, the Strike Team is
to familiarise themselves with threatened
assets and - as best possible - protect
properties in preparation for the oncoming
weather.
The ACT Strike Team arrives at 1030 and
commences operations. After a successful
test burn, the Sector Commander seeks
permission from the Divisional Commander
to commence back-burning. The Divisional
Commander wishes to have a look at the
sector before granting permission and so
drives from Sector Delta. It is 1130 before
ACT Strike Team begins backburning. Crews
use drip-torches to ignite 150m stretches at
a time, with one appliance patrolling behind Photo Credit: Gary Hooker, ACT RFS.
Photo Credit: Gary Hooker, ACT RFS.
31B U S H F I R E S I T U AT I O N A L A W A R E N E S S : V I E W F R O M T H E G R O U N D30 B U S H F I R E S I T U AT I O N A L A W A R E N E S S : V I E W F R O M T H E G R O U N D

previous day by another 500m, and then
turning to defend containment lines as
the weather picks up. This is also the
containment line that provides access to
neighbouring Sector Charlie.
The strike team arrives at Sector Bravo at
0830, however, the weather is not currently
conducive to conducting the burn, so they
wait. The Sector Commander discovers
that the mountainside the back-burn
is to be conducted across has no GRN
signal. Moreover, owing to a bend in the
trail, line-of-sight radio communications
are not possible without a relay too.
The Sector Commander makes note of
the communications issues and passes
the information on to the Divisional
Commander.
FIREFIGHTING OPERATIONS: DAY 2Again at 0700, the Divisional Commander
begins a briefing with the IMT on the tasks
for the day shift. The strike team arrive at
the staging area at 0730 and meet with the
Divisional Commander. The briefing goes
smoothly and concludes at 0800.
The hot, dry weather has begun to pick up
ahead of the anticipated weather system.
The day is forecast to have an FDI of 30-40,
FDR of Very High, wth NE winds blowing
at a sustained 25kph. Peak fire weather is
expected from 1430 onwards. The next day’s
forecast remains at a FDI of 70-80 and FDR
of Severe to Extreme.
In view of the weather, the strike team
have again been attached to Sector Bravo,
Southern Division, and have been tasked
with extending the back-burn from the
Consequently, the location of the smoker is
difficult to convey accurately.
Simultaneously, a 000 call reporting a fire
approaching at 1085 Jones Street, within
Sector Bravo, is passed onto the Sector
Leader. The Sector leader tasks two trucks
to attend the fire call, and goes to inspect
the smoker themselves. However, in doing
so, the relay communications link between
the trucks are now severed. The two trucks
navigate using Google Maps as best they can,
however without further instructions on
how to access the property, they promptly
become lost. At this time, they realise that
they can no longer contact the Strike Team
Leader, and are out of range of the GRN.
After 20 minutes of searching, the trucks
eventually find the caller who reported the
fire. Thankfully, it is a false alarm, the caller
simply being concerned about the growing
smoke column. However, they are not able
to inform the Sector Leader or the divisional
commander, and thus head back to the
Sector leader to relay that information.
Upon returning to the Sector Leader, the
situation has deteriorated with the spotover
fire rapidly growing in size. Aviation assets
are deployed to support operations, in
conjunction with crews dragging hose all
the way from the fire trail. Crews coordinate
with the aviation assets by directing them
with hand signals and via the radio channel
listed in the IAP. Seeing that the resources
are not enough, the Sector Leader requests
additional assets from the Divisional
Commander, and is allocated another three
tanker trucks. These tankers are CFA trucks,
and consequently do not have interoperable
radio communications with the ACT
personnel. The strike team gives the CFA
tankers spare hand-held radios to allow for
Whilst waiting for appropriate weather to
continue the back-burn, the ACT strike team
blacks out the previous days backburning.
At 0930, a successful test burn is conducted,
and the team begins operations burning. The
Sector Commander stays put at the trail-
bend, acting as a radio relay for the trucks
between the two sides. Otherwise, operations
progress smoothly, with crews mopping
up the burn by 1330. Just in time too - the
weather is beginning to deteriorate and the
fire activity on the mountain has markedly
increased.
At 1430 a crew member notices a small
column of smoke about 150m into the
unburnt side of the fire trail. They pass the
information onto the crew leader who relays
it on to the Sector leader. The crew leader
is only able to give an approximate location
of the smoke. This is communicated by
providing a six-figure grid reference, which
outlines a 100m x 100m square location.
Photo Credit: Gary Hooker, ACT RFS.
Photo Credit: Gary Hooker, ACT RFS.
32 33B U S H F I R E S I T U AT I O N A L A W A R E N E S S : V I E W F R O M T H E G R O U N D B U S H F I R E S I T U AT I O N A L A W A R E N E S S : V I E W F R O M T H E G R O U N D

channel, the operations channel, the
aviation channel, and the heavy plant
channel. Nevertheless, the spotfire is
eventually contained, and soon the swing
shift arrives to take over.
It is on this basis that the IAP warns of
possible pyrocumulonimbus formation. The
fire behaviour has not eased throughout
the night, with new spot fires breaching
containment lines and growing quickly.
Unfortunately there has not been time for
communication. The sector leader requires
heavy plant to assist in the extinguishing of
the fire, and coordinates their arrival. At this
point, the Sector leader is communicating
on 4 different radio channels: the tactical
FIREFIGHTING OPERATIONS: DAY 3On the final rostered day of the deployment,
the ACT strike team is once again briefed at
0700. The fire weather forecast has remained
at a predicted FDI of 70-80 and FDR of
Severe to Extreme. The Haines Index is at is
12, indicating a very unstable atmosphere.
At 1100 a radio warning sounds on the
operations channel that a pyrocululonimbus
has formed. Weather conditions on one side
vary greatly from the other; different wind
directions, lightning, and hailstones present.
However, at the fire front, none of this is
visible as the whole area is clouded in smoke
and haze. The only situational awareness
afforded is the already obsolete map, and
information the sector leader passes on. The
fire is moving quickly now, with no defined
front, but rather a large area that is ablaze
as spot fires are ignited ahead and coalesce.
Moreover, because of the lack of situational
awareness, no one knows clearly where the
fire has progressed to, and owing to the
weather, there is no aviation support for
firefighting or line scans.
The ACT strike team has classified the
properties and positioned themselves at
vulnerable exposure sites. A number of
homeowners have decided to stay and
a line-scan to be conducted on the fireline
overnight. Accordingly, crews are provided
with maps showing only rough estimates of
where spot-fires are likely located. Finally,
the increased fire weather and new spot-
fires mean resources are very stretched.
The strike team has been assigned to Sector
Alpha and is responsible for defending
twenty assets.
Given the fire danger and scarcity of assets,
a property protection strategy is employed.
Upon arriving on the fireground at 0800, the
crews begin area familiarisation. It is unclear
what the pink ribbons tied to the front
letterboxes are, and crews once again need
to identify who is staying, what structures
are defendable, and where the local water
sources are. The smoke column can be seen
growing steadily, and now is a bronze-copper
colour. Already, the weather is deteriorating,
with winds sustained at 40km/h and a
temperature of 34C.
Photo Credit: Gary Hooker, ACT RFS.
34 35B U S H F I R E S I T U AT I O N A L A W A R E N E S S : V I E W F R O M T H E G R O U N D B U S H F I R E S I T U AT I O N A L A W A R E N E S S : V I E W F R O M T H E G R O U N D

can be relocated to a safer environment.
However, the closest are the CFA crews,
who have incompatible radios. All messages
between these two crews (until radios are
exchanged) need to be relayed through the
Divisional Commander - further filling the
radio space. Despite these difficulties, the
CFA crew arrives and helps evacuate Ashburg
10 and its crew. Paramedics begin treating
the injured crew members at the nearest safe
area.
Unknown to the treating professionals,
the unconscious Crew Leader is on a wide
range of medications already, potentially
complicating what treatment should be
applied. Only through good fortune do no
further medical complications arise during
their treatment and subsequent transport to
the hospital.
The remainder of strike team, continue to
protect properties and livelihoods. The shift
continues and ACT strike team return to
their accomodation at 2300 that night.
defend too. However, there is no way to
communicate more broadly which of the
houses these are.
Upon receiving information of a 000 call, one
fire truck, Ashburg 10, is dispatched to assist.
Whilst driving there, crews drive along a
road lined with fire damaged trees. Suddenly,
a tree falls onto the road in front of the
truck. Ashburg 10 is unable to stop in time
and collides with the tree, injuring the crew
leader and driver. The two crew in the back
begin to administer first aid within the cabin
and radio in a ‘Red Emergency’ call (the
highest priority radio code). They give their
grid reference, a brief summation of what
has happened and the required support. Due
to the lack of GRN connection, they are only
able to use the local simplex radio, which
thankfully reaches the Sector Leader.
Following this the Sector leader seeks further
medical assistance, and paramedics in a
four-wheel-drive ambulance are dispatched.
Additional fire-trucks are sent scene to
provide another driver so that the crew
Photo Credit: Gary Hooker, ACT RFS.
Photo Credit: Gary Hooker, ACT RFS.
36 37B U S H F I R E S I T U AT I O N A L A W A R E N E S S : V I E W F R O M T H E G R O U N D B U S H F I R E S I T U AT I O N A L A W A R E N E S S : V I E W F R O M T H E G R O U N D

Data Flow Observations and Requests from the Fireground
Observations by people on the fireground and in the local community are incredibly valuable. They serve to:
• Validate assumptions made up the
chain-of-command.
• Provide first-hand intelligence on the
location of fire, local weather conditions,
sources of water, difficulty of terrain and
access routes, locals staying to defend
property, location of vehicles (including
private vehicles, for instance, bulldozers
operating on farms to clear firebreaks).
• Provide information on changes as they
happen (e.g., a fallen tree blocks a route, or
makes it impassable in one direction).
• Report on current fire behaviour and predict
spread (assessed by experienced crew),
taking into account local wind patterns.
• Give timely warnings of threats to safety,
such as fuel stores or dangerous trees.
• Identify threatened assets and whether
they should be prioritized for protection
(e.g., if they are of significant cultural
value, or are essential to security, or to
someone’s livelihood).
• Provide ground-truth data to mapping, fire
and smoke modelling teams so they can
make more accurate predictions.
Information flowing from the fireground can also be operational in nature as systems are created to manage the firefighting effort:
• Rules to manage traffic flow, e.g., one-way
systems on tracks.
• Locations of staging points and services
like refueling depots, food stations,
accommodation and equipment drops.
• Reports of 4G mobile network coverage and
radio dead zones.
• Requests for assistance and resources.Possibility:Devices capable of recording geo-tagged pictures and videos can provide valuable
information on all of the above. Intelligent algorithms are capable of automatically
extracting actionable information, such as fire extent, flame-height and fuel load, or
landscape features can be detected and de-projected onto a map.
Photo Credit: Gary Hooker, ACT RFS.
38 39B U S H F I R E S I T U AT I O N A L A W A R E N E S S : V I E W F R O M T H E G R O U N D B U S H F I R E S I T U AT I O N A L A W A R E N E S S : V I E W F R O M T H E G R O U N D

MONITORING MODE
Pre-fire situational awareness: duty officer monitoring local area or skeleton IMT active:• Current weather in region.
• Weather forecast for 3 days
• Fuel condition: load and
moisture maps.
These drive fire risk maps (fire danger index). Also monitor resources and adjacent fires.• Active fires in adjacent
regions.
• Available resources locally
and in-use at active incidents,
or seconded elsewhere.
Note: BoM are the only agency
permitted to provide an official
WARNING of fire weather.
FIRE DETECTED
Fire detected:• Fire-tower(s) report smoke.
• Public 000 emergency phone call reporting smoke.
• Hotspots must be confirmed by aerial or space assets.
Initial assessment by duty officer:• Local duty officer has unique information and ability to
assess risk due to fire.
• Remit to use whatever resources necessary and
available.
• First-pass fire spread model: ‘gut feeling’ assessment
from experience or McArthur prediction.
• If enough information available, run modelling tools
like Aurora .
• Assess access routes and initial deployment capabilities.
• Decide on how big an effort is needed to fight the fire.
Reports from fireground / crew:• Crews report flame-height, size of fire, direction and
confirm location.
• Crew suggest suppression strategy and relay what
resources are needed.
• Everyone using radio voice comms.
Further actions:• Officer requests detailed site weather forecast from BoM.
• May deploy an aircraft for monitoring.
Monitoring Mode Fire Detected
U S E R S TO R I E S
The Incident Management Team
THE COP
The Common Operating Picture:• Real-time situational
awareness mapping software
at the IMT.
• Positions of trucks,
bulldozers, aircraft
(automated).
• Breadcrumb trails - position
history (for some vehicles).
• Sometimes deeper data on
deployed personnel and
skills.
• Multiple base layers for map:
topography, vegetation type,
flammability index,
• Weather information.
SUSTAINED ACTIONTransition to IMT-controlled effort:• Decisions move from fireground to the IMT
(initial crew advise on actions).
• Formal Incident Action Plan created.
• Full AIIMS team convened, including intelligence /
mapping role.
Longer-term planning:• Detailed risk analysis.
• Understand overall probability of success better.
‘Can we fight this (part of) the fire successfully’?
• Strategic planning on timescale of a week, depending
on weather forecast and available resources.
• Monitoring upwards & sideways - what is happening at
the regional level and in adjacent firegrounds?
Adjacent services:• Work with stakeholders from other organizations:
police, medical, defence, utility providers, state
emergency service, cultural organisations.
• Representatives in the room next door to IMT
(called Emergency Management Team in Victoria and
Emergency Control Centre in ACT).
• Provides an interface to requirements - understanding
risks to important threatened assets (e.g., critical
telecoms infrastructure).
• A briefing officer from some services can also be
embedded in IMT.
SHIFT CHANGEInformation refresh cycle and hand-over:• Situation reports hourly from
fireground via the division
commanders.
• The IMT is where all the
information comes together
- critical node.
• Hand-over between teams
changing shift is critical. This
is planned at the IMT level for
the crews on the fireground.
• Sector-commanders
coordinate handovers between
shifts on the fireground.
• Fire crews change shift
at a different time to
IMT personnel to preserve
continuity of information
during the handover process
(ensures overlap)
The incident management team (IMT) is responsible for planning the response to a fire that requires sustained action to fight (more than one day). During a fire season, a local IMT may be ‘spun up’ in monitoring mode, waiting for a report of fire.
Fire Extinguished
40 41B U S H F I R E S I T U AT I O N A L A W A R E N E S S : V I E W F R O M T H E I N C I D E N T M A N A G E M E N T T E A M B U S H F I R E S I T U AT I O N A L A W A R E N E S S : V I E W F R O M T H E I N C I D E N T M A N A G E M E N T T E A M

U S E R S TO R I E S
The Incident Management Team Pain Points
SITUATIONAL AWARENESS
DISPERSED INFORMATION SOURCESThe use of multiple, different systems which often contain conflicting
information or information from different times ensures that there is no
single version of truth within the IMT. Every room will have a map on the
wall with someone drawing critical information on it, resulting in a different
map in every room.
MANUAL DEVELOPMENT OF THE FIRE GROUND PICTUREHaving to piece together descriptions from different parts of the fire (Sectors,
Divisions) to get an overall picture of the fire is extremely difficult owing due
to the difficulty of creating a visual picture based on verbal descriptions.
ANNOTATION LAGBecause of the delay in features annotated on maps by fire fighters getting
onto maps in the IMT, the maps available in the IMT are not the same
as those being used by fire fighters, there is a consistent lack of shared
situational awareness.
INFORMATION FLOW
HANDOVERHandover and communications of detailed information from the fireground.
RESOURCE MANAGEMENT
DECISION MAKING.Making decisions about where to position resources and managing fire
fighter availability, food, water deployment etc.
Photo Credit: Gary Hooker, ACT RFS.
42 43B U S H F I R E S I T U AT I O N A L A W A R E N E S S : V I E W F R O M T H E I N C I D E N T M A N A G E M E N T T E A M B U S H F I R E S I T U AT I O N A L A W A R E N E S S : V I E W F R O M T H E I N C I D E N T M A N A G E M E N T T E A M

I N F O R M AT I O N F LO W A N A LY S I S O F C U R R E N T P R AC T I C E :
The Incident Management Team / Ground Crew
DUTY OFFICER / COMMS CENTRE
FIRE DETECTEDSTART
INITIAL ATTACK SUSTAINED ATTACKINITIAL DISPATCH
IMT
DIVCOM
SECTOR / CMD STRIKE TEAM LEAD
CREW LEADER
CREW MEMBER
Prepare andsend Incident Notification
Recieve Incident Notification
Distributemeeting
arrangements
Drive tothe incident
location
Arrive atincident
InitialRecce
EstablishComms
Channels
EstablishCommand
Arrangements
Implement fire fighting
activities
Providesituation
report
Establish IMT
Manuallyassemble separate
division maps
Receivesituation report
Providesituation report
Receivesituation report
Providesituation report
ApproveIAP
Brief Div Coms
Receive briefing from IMT
Receive briefing from Div Coms
Brief crews at staging area
including distributing
individual tasks
Receivebriefing from
Sector Leaders
Deploy to Fire Ground
Execute Tasks - implementfire fighting
activities
Brief SectorLeaders
Map Fire
Supervise fire fighting activities
ProvideSituation
Report
Assemblecrews
Receive meeting arrangements
BART SYS / PAGER
FIRE MAPPER/ AVENZA
Map Division
FIRE MAPPER/ AVENZA
Crew registersitself to job
MDT
Crew attachedto job
CAD
View map of fire
ESRI / PDF
View map of fire
ESRI / PDF
Update IAPCreate IAP
WORD ICON
ReceiveSituation
Report
RADIO
Receivesituation report
RADIO
Crew on-route to incident: may
receive updates from other
groups/crews already on scene
RADIO
TRAVEL TO STAGING
AREA
= PAIN POINT
Credit: Thanks to Dylan Kendal of Zirkarta for help and insight preparing this diagram.
44 45B U S H F I R E S I T U AT I O N A L A W A R E N E S S : V I E W F R O M T H E I N C I D E N T M A N A G E M E N T T E A M B U S H F I R E S I T U AT I O N A L A W A R E N E S S : V I E W F R O M T H E I N C I D E N T M A N A G E M E N T T E A M

The Incident Action Plan (IAP) is a formal static document drawn up by the Incident Management Team in response to a significant event - a fire that will require more resources than the first responding team. Typically, this is put together within 12 hours of a fire igniting.
The IAP is given to each crew chief at the
fireground and handed over at every shift
change. It represents:
• an agreed plan on how to manage the fire,
• a record of responsibilities and personnel,
• a lookup table of communication
frequencies and the best intelligence on
the situation.
The Incident Action Plan
SMEACS layout of the IAP: Situation, Mission, Execution, Administration Communications and Safety.Example of an anonymised Incident Action Plan (IAP) showing the SMEACS system of information. Static maps of the fireground may also be attached to the IAP, presenting critical information and location of assets. This example was kindly provided by the ACT RFS.
The front page of the IAP is laid out in blocks
according to the SMEACS system: Situation,
Mission, Execution, Administration,
Communications and Safety. Subsequent
pages may present maps of the fireground,
annotated with fire extent, fire spread
predictions, weather forecast, location of
assets and other important information.
As the situation on the ground changes,
the fireground copy of the IAP is updated
with new information. Updates can include
annotations on the map (new fire edge,
spot-fires, dangerous trees, assets of
different type, control lines, etc.), weather
observations, changes in personnel,
redeployment information and records of
tasks completed.
IAPs are often printed for distribution (e.g.,
on A5 paper), but increasingly are being
distributed as PDF files electronically.
Firefighting personnel rely on personal
devices to download and view the IAP, often
triggered by scanning a QR-code. Photo Credit: Gary Hooker, ACT RFS.
46 47B U S H F I R E S I T U AT I O N A L A W A R E N E S S : V I E W F R O M T H E I N C I D E N T M A N A G E M E N T T E A M B U S H F I R E S I T U AT I O N A L A W A R E N E S S : V I E W F R O M T H E I N C I D E N T M A N A G E M E N T T E A M

MOBILE DATA COVERAGE
Electronic IAPs can be difficult for fireground personnel to obtain if
mobile data coverage is poor.
SHIFT CHANGE
Changes at the fireground must propagate to the IMT before
shift change to included on the next version.
HAND-HELD RADIOS & VOICE REPORTS
Communication of information from the fireground usually
relies on hand-held radios and voice reports, which are prone to
distortion and miscommunication.
SPEED OF CHANGES TO IAP
Changes to the IAP require approval by a senior officer and maps
must be validated. This can take up to four hours, meaning that
the information on the IAP may be significantly out of date for
large, fast-moving fires.
UPDATING THE IAP
The official IAP is updated at every shift change (i.e., every 12
hours) and must incorporate the latest annotations from the
fireground. This is a large task, incorporating changes reported
by the crew through the sector and division commanders.
The Incident Action Plan Challenges
Photo Credit: Gary Hooker, ACT RFS.
48 49B U S H F I R E S I T U AT I O N A L A W A R E N E S S : V I E W F R O M T H E I N C I D E N T M A N A G E M E N T T E A M B U S H F I R E S I T U AT I O N A L A W A R E N E S S : V I E W F R O M T H E I N C I D E N T M A N A G E M E N T T E A M

The Incident Action Plan Example
Example of an Incident Action Plan, courtesy of the ACT RFS.
50 51B U S H F I R E S I T U AT I O N A L A W A R E N E S S : V I E W F R O M T H E I N C I D E N T M A N A G E M E N T T E A M B U S H F I R E S I T U AT I O N A L A W A R E N E S S : V I E W F R O M T H E I N C I D E N T M A N A G E M E N T T E A M

The Incident Action Plan Example map
Typical map attached to an Incident Action Plan, courtesy of the ACT RFS.
52 53B U S H F I R E S I T U AT I O N A L A W A R E N E S S : V I E W F R O M T H E I N C I D E N T M A N A G E M E N T T E A M B U S H F I R E S I T U AT I O N A L A W A R E N E S S : V I E W F R O M T H E I N C I D E N T M A N A G E M E N T T E A M

The Australian Inter-Service Incident Management System (AIIMS) is a set of organisational principles and team structures used across emergency agencies in Australia and New Zealand.
The system is designed to facilitate easy cooperation between different agencies, presenting
familiar management roles across all organisations. It establishes a common terminology,
clearly defined lines of communication, uses risk-aware planning methods and is adaptable
to a wide variety of situations beyond fires.
AIIMS is based on five key principles:
Scaling Command in the IMT: The AIIMS System
PRINCIPLE EFFECT
Management by objective
Agreed objectives set out in the Incident Action Plan.
Objectives should be Specific, Measurable, Achievable,
Relevant and Time-framed (SMART). Good objectives specify
what, when and where.
Functional Management
Five to eight functional areas within a management team,
depending on size of incident (see table at right).
Span of control One supervisor should ideally control only up to five groups
or individuals. The span of control may exceed this 5:1
ratio for very complex incidents, but should be continually
reviewed and scaled down when appropriate.
Flexibility Flexibility to scale the reporting structure across multiple
agencies and for different types of incident spanning a wide
range of duration.
Unit of Command Each individual reports to only one supervisor. There is
only one incident controller, one set of objectives and one
incident action plan.
The Span of Control principle means that
the branches of the command tree should
not grow beyond five people at each level and
that there are clear lines of responsibility.
However, the size of the IMT should be
reviewed and always reflect the scale of the
incident and the stage of the response cycle.
The functional areas within the incident
management team are colour-coded as in the
table below. Managers wear appropriately
coloured vests to be readily identifiable and
easily found.
FUNCTIONAL AREA DESCRIPTION
Control Management and oversight of the firefighting process.
Planning Develop objectives, strategies and plans for resolving the
incident. Evidence-based.
Intelligence Subset of planning dedicated to analysing data in support of
decision making. Includes predictive modelling.
Public Information Provide warnings and advice to community, liaise with
media.
Operations Tasking of teams and application of resources.
Logistics Acquire and provide resources of all kinds: human, material,
facilities and services.
Finance Manage accounts: purchases, insurance, compensation and
cost-estimates for incident.
5:1
54 55B U S H F I R E S I T U AT I O N A L A W A R E N E S S : V I E W F R O M T H E I N C I D E N T M A N A G E M E N T T E A M B U S H F I R E S I T U AT I O N A L A W A R E N E S S : V I E W F R O M T H E I N C I D E N T M A N A G E M E N T T E A M

NATIONAL LEVEL AIIMSOverview of states’ commitments and external resource requirements
REGIONAL / STATE IMT
INCIDENT 1 IMT INCIDENT 2 IMT
Gathers resources
Allocates resources
Directscurrent resources
Requests additional resources
Notifiesabout surplus resources
STATE LEVEL AIIMSOverview of state agencies’ commitments and external resourcing
REGIONAL LEVEL AIIMSOverview of multiple incidents within a defined region
LOCAL OR INCIDENT LEVEL AIIMSManagement of actions on the fireground and resolution of current incident
Directscurrent resources
AIIMS is primarily designed to facilitate control at a local or incident level, however, higher levels of government also maintain an overview of ongoing incidents, especially with regard to directing resources.
Regional and state level IMTs are responsible
for allocating resources like air-support,
large vehicle appliances and fire crews
seconded from other regions. They need to
have a view of what resources are available
across multiple jurisdictions so they can
respond to requests for help from local IMTs.
Timescales for managing these resources
are longer, so higher level IMTs have the
challenging job of predicting need and
matching available resources, days or weeks
in advance.
AIIMS Beyond the Fireground
NATIONAL LEVEL AIIMSOverview of states’ commitments and external resource requirements
REGIONAL / STATE IMT
INCIDENT 1 IMT INCIDENT 2 IMT
Gathers resources
Allocates resources
Directscurrent resources
Requests additional resources
Notifiesabout surplus resources
STATE LEVEL AIIMSOverview of state agencies’ commitments and external resourcing
REGIONAL LEVEL AIIMSOverview of multiple incidents within a defined region
LOCAL OR INCIDENT LEVEL AIIMSManagement of actions on the fireground and resolution of current incident
Directscurrent resources
Aircraft and heavy plant equipment from state, national or even international sources can be requested during a catastrophic bushfire season. Credit: Garry Hooker, ACT RFS.
56 57B U S H F I R E S I T U AT I O N A L A W A R E N E S S : V I E W F R O M T H E I N C I D E N T M A N A G E M E N T T E A M B U S H F I R E S I T U AT I O N A L A W A R E N E S S : V I E W F R O M T H E I N C I D E N T M A N A G E M E N T T E A M

Fire services need to coordinate with a broad range of other agencies that provide
complementary services, hold relevant information, manage critical threatened
assets in the landscape, or should be consulted during the decision-making process.
Representatives from other agencies are often found in a room next to the IMT (called the
Emergency Management Team in Victoria and Emergency Control Centre in ACT).
Supporting & Surrounding Agencies
WESTERN AUSTRALIA
WA Police Force WA Parks and Wildlife Service
Dept. of FIre and Emergency Services (DFES) Water Corporation WA
DFES State Emergency Service Western Power, Synergy and Horizon Power
St. John Ambulance Telstra
Dept. of Primary Industries and Regional Development Mainroads WA
Dept. of Water and Environmental Regulation
NORTHERN TERRITORY
NT Police Force Dept. of Industry, Tourism and Trade
NT Emergency Service Telstra
ST. John Ambulance NT Power and Water Corporation
NT Transport Group (Dept. of Infrastructure, Planning and Logistics)
Western Power, Synergy and Horizon Power
Dept. of Environment, Parks and Water Security
SOUTH AUSTRALIA
South Australia Police SA Water
Dept. for Environment and Water SA Power Networks
Dept. of Primary Industries and Regions Telstra
SA Ambulance Service Dept. for Infrastructure and Transport
SA State Emergency Service ForestrySA
National Parks and Wildlife SA
TASMANIA
Tasmania Police Tasmania State Emergency Service
Dept. of Primary Industries, Parks, Water and Environment TasWater
Dept. of State Growth TasNetworks
Transport Tasmania Tas Gas Newworks
Ambulance Tasmania Telstra
NEW SOUTH WALES
NSW Police Force National Parks and Wildlife Service
Dept. of Planning, Industry and Environment Water NSW
Dept. of Primary Industries Ausgrid, Essential Energy, Endeavour Energy
Forestry Corporation Telstra
NSW Ambulance Roads and Maritime Services
NSW State Emergency Service
VICTORIA
Victoria Police Parks and Wildlife
Dept. of Environment, Land, Water and Planning Water Corporations (19)
Agriculture Victoria Electricity (5) and Gas (3) Distributers (See Australian Energy Regulator)
VicForests Telstra
Ambulance Victoria VicRoads
Victoria State Emergency Service
AUSTRALIAN CAPITAL TERRITORY
ACT Police Icon Water
ACT Government: Environment Directorate, Emergency Services Agency, Transport Canberra
Evoenergy
Telstra
ACT Ambulance Service ACT State Emergency Service
QUEENSLAND
Queensland Police Service Queensland department of Transport and Main Roads
State Emergency Service QLD Energy Queensland
Queensland Ambulance Service Telstra
Dept. of Environment and Science (Parks, Forest, and Wildlife Service)
Dept. of Resources (Water Authorities, land maps)
58 59B U S H F I R E S I T U AT I O N A L A W A R E N E S S : V I E W F R O M T H E I N C I D E N T M A N A G E M E N T T E A M B U S H F I R E S I T U AT I O N A L A W A R E N E S S : V I E W F R O M T H E I N C I D E N T M A N A G E M E N T T E A M

IMT Situational Intelligence: The Common Operating Picture
A single Common Operating Picture (COP) providing a detailed overview of the fireground is a key AIIMS principle. In practise, this is implemented as mapping software that provides real-time situational awareness of the fireground for the IMT.
It plots critical asset locations over base
mapping layers, overlaid with the latest
weather information. Whilst referred to
as the Common Operating Picture, it is
important to recognize that this is only
shared within the IMT as it does not provide
shared situational awareness between
firefighters on the fire ground and the IMT.
Different COP software is used by each
fire service, however, they have the same
purpose and many features in common:
• Live vehicle and aircraft locations - if GPS
trackers are fitted.
• Breadcrumb trails for vehicles and aircraft.
• Critical weather data and warnings.
• A wide range of base mapping layers,
including topography, trails and roads,
vegetation type, fuel moisture and historic
burn scars.
• Dynamic layers, including current fire
perimeter, spot fires, fire spread predictions,
wind vector fields and weather fronts.
CHALLENGES
The capabilities of the COP software vary between organisations and opportunities exist for integrating fireground data in a much more seamless fashion:
• The live IAP and up-to-date fireground
maps could be much better integrated
into the COP and automated:
- Annotations and data flowing up
from the fireground.
- Automated information to replace
radio updates.
• Some instances of the COP interface
could be improved:
- Better display of small-scale
deployments (clustered symbols
can obscure crew and truck
deployments).
The manual processes involved in
adding new information to the COP
means the COP does not keep pace
with incident development. As a result
individual officers in the IMT annotate
their own paper maps resulting in
there being no single source of truth
within the IMT.
Two examples of COP software running on a screen at the IMT. The maps are interactive: the zoom factor can be changed, maps panned and layers hidden. On some implementations drill-down information is available on deployed assets. Credit: Garry Hooker, ACT RFS.
The ACT RFS COP
The NSW RFS COP
60 61B U S H F I R E S I T U AT I O N A L A W A R E N E S S : V I E W F R O M T H E I N C I D E N T M A N A G E M E N T T E A M B U S H F I R E S I T U AT I O N A L A W A R E N E S S : V I E W F R O M T H E I N C I D E N T M A N A G E M E N T T E A M

Fighting large fires is a logistically challenging operation - not unlike a military campaign. Significant planning goes into keeping the flow of resources moving in order to ensure that the firefighting effort can continue without interruption until the fire has been successfully contained and suppressed.
The bill of resources required by those at the
front line of the firefighting operations is
extensive and includes everything from the
fuel required to keep vehicles mobile, to the
food and water needed to keep firefighters
active, well equipped and able to fulfill their
duties.
Significant geographic separation often
exists between firefighting command-and-
control entities - easily span 1000’s of km.
This introduces information barriers and
time-lags between decision makers and
decision executors, and demands that a
successful firefighting operation identifies
resource needs and potential shortfalls well
in advance of supplies being exhausted.
The impact of a lack of resource could be
catastrophic.
In order to maintain a healthy supply
of essential resources the firefighting
crews provide periodic reports on their
supply status throughout their shift to the
IMT. This accounts for fuel, water, food,
medical supplies and all other items which
are deemed essential to mission success.
The IMT will in turn work to coordinate a
constant re-supply effort to ensure that
stocks are quickly replenished to safe
minimum levels, whilst also working to
overcome immediate real-world factors
which threaten the supply chain during a
bushfire event; e.g., routes to firefighters
being blocked by fire, shortages in
equipment due to increased or prioritized
demand in other areas, or breaks in the
communication grid due to fire damage.
The Logistics of Fighting Fires
Temporary accommodation for personnel fighting a large fire campaign. The tents are owned by the NSW RFS and are fully equipped with air conditioning and purifiers.
Photo Credit: Gary Hooker, ACT RFS.
Photo Credit: Gary Hooker, ACT RFS.
62 63B U S H F I R E S I T U AT I O N A L A W A R E N E S S : V I E W F R O M T H E I N C I D E N T M A N A G E M E N T T E A M B U S H F I R E S I T U AT I O N A L A W A R E N E S S : V I E W F R O M T H E I N C I D E N T M A N A G E M E N T T E A M

The Logistics of Fighting FiresChallenges
HANDOVER BETWEEN SHIFTS
Currently the process of reporting what is needed and planning
a re-supply effort is heavily dependent upon conventional voice
comms and the T-Card system. Whilst this is functional, it
presents inherent risks as the availability of the comms network
can be unreliable and/or intermittent and equally the availability
of dynamic data to support the detailed planning required to
coordinate the resupply effort is often limited; i.e. problems in
delivering equipment or kit will only be identified and reported
when they are encountered on the ground.
SHARING INFORMATION
Managing resources for fighting a large bushfire is a wicked
problem, requiring the incident commander to juggle competing
priorities and make decisions based on imperfect knowledge
and a limited view of the future. Incident commanders need
integrated decision-support tools that melt knowledge of many
areas:
• Availability of skilled personnel and their expertise.• Knowledge of deployment locations and access routes.• Real-time monitoring of fatigue levels, adjusted for difficulty.• Accurate predictions of fire spread based on accurate weather
and fuel information. Decision support for firefighting strategy.
• Agile resource management tools that adjust for dynamic data.
Photo Credit: Gary Hooker, ACT RFS.
64 65B U S H F I R E S I T U AT I O N A L A W A R E N E S S : V I E W F R O M T H E I N C I D E N T M A N A G E M E N T T E A M B U S H F I R E S I T U AT I O N A L A W A R E N E S S : V I E W F R O M T H E I N C I D E N T M A N A G E M E N T T E A M

Incident controllers track the assignment of personnel, equipment, appliances, vehicles and aircraft via the paper-based T-Card system.
to track which trucks and appliances are
members of each group. The T-cards are
passed to a fireground supervisor and
collated at the IMT. Often the necessary
information is communicated over the radio
or via phone, which can take a lengthy period
of time.
Below are two examples of T-cards from the
NSW RFS:
Crew T-Card showing details of personnel deployed to a truck. Credit: NSW RFS.
Strike Team T-Card showing which trucks are deployed to a Strike Team. Credit: NSW RFS.
When RFS personnel respond to an incident
each crew manually fills out a T-card
detailing who is on the fire truck, their rank,
what skills they possess, where they are
deploying to and the crew leader’s contact
details (phone & radio information). Trucks
and appliances often operate in groups (e.g.,
in NSW, typically a 5-truck strike team,
or a more diverse task force containing
appliances) and a similar T-Card is used
Tracking Personnel and Equipment – The T-Card System
At the IMT staging area, the T-Cards are organised into slotted folders,
grouped by categories such as deployment location and shift status.
For ease of access folders are often mounted vertically on an incident
command board, as shown below.
T-Cards on a portable incident command board. Credit: bigredtruck.com.au
66 67B U S H F I R E S I T U AT I O N A L A W A R E N E S S : V I E W F R O M T H E I N C I D E N T M A N A G E M E N T T E A M B U S H F I R E S I T U AT I O N A L A W A R E N E S S : V I E W F R O M T H E I N C I D E N T M A N A G E M E N T T E A M

HAND-WRITTEN INFORMATION
Hand-written information is often incomplete, garbled or prone
to errors - doubly so if communicated over radio link.
MISSING INFORMATION
Vital information (such as medical advice) is omitted altogether
and available information on skills and experience is very sparse.
SEARCHING
Searches are hard! Physical cards cannot easily be re-ordered to
search for people matching a profile (e.g., skill, time-deployed).
REVIEWING CARDS
Reviewing cards to monitoring for fatigue is highly laborious.
POST-FIRE AUDITS
Post-fire audits are prone to errors and take significant time.
Tracking Personnel and Equipment – The T-Card System Challenges
Photo Credit: Gary Hooker, ACT RFS.
68 69B U S H F I R E S I T U AT I O N A L A W A R E N E S S : V I E W F R O M T H E I N C I D E N T M A N A G E M E N T T E A M B U S H F I R E S I T U AT I O N A L A W A R E N E S S : V I E W F R O M T H E I N C I D E N T M A N A G E M E N T T E A M

Data to Support Firefighting: National & State Providers
The national providers of data to support firefighting include: • Geoscience Australia (GA). • The Bureau of Meteorology (BoM). • State environment, land and water management agencies. • Private companies.
Data organisations provide access to multiple
types of data at different levels of processing.
Raw data need to be corrected for systematic
effects (e.g., atmospheric or diurnal effects)
and packaged into a usable format in easily
digestible chunks. Raster image data needs
to be co-registered and reprojected onto
a common grid. Time-series data may be
updated at varying cadences. For all data
types, quality, resolution and uncertainty
can vary with both space and time, meaning
significant effort is needed to prepare these
for analysis and create insight for users.
Most data can be accessed or queried
programmatically through application
programming interfaces (APIs) or dedicated
web portals. However, some high-
quality data are restricted to accredited
organisations, or require paid subscriptions
(e.g., lightning strike data currently). The
challenge is how to map each data source to
the appropriate user, and how to visualise
just enough information without causing
cognitive overload.
Fire services deploy dedicated mapping
teams at the IMT to support firefighting.
During a campaign fire they operate at
full capacity to synthesize a overview of
the fireground daily. They integrate data
from aircraft, local sources and the big data
providers. However, the next few years
will bring a tenfold increase in available
information, meaning smart new tools will
be essential to make sense of the available
intelligence.
Key pointCare is needed to distil data to a sparse
representation tuned for firefighting crews
on the ground. Information overload is a
real danger on the fireground.
ORGANISATION DESCRIPTION
Geoscience Australia (GA)ga.gov.au
National provider of remote sensing data from satellites
and ground-based sensor networks. Risk management
for natural disasters (fire, flood, earthquake, tsunami)
and intelligence for land management.
Bureau of Meteorology (BoM) bom.gov.au
Australia’s national weather, climate and water agency.
Provides regular weather forecasts, climate and weather
data, hydrological and oceanography services.
Landgatelandgate.wa.gov.au
Landgate is the business name for the Western
Australia Land Information Authority, the
government authority responsible for property and
land information in WA. See landgate.wa.gov.au/
about-us
Landgate Satellite Remote Sensing Service
(SRSS) offer remote sensing data products and
services for managing fires, floods, agriculture
and environment. For bushfires they provide the
following tools:
• FireWatch (& Pro): Satellite hotspot mapping
service.
• Aurora: National fire monitoring and spread
simulation.
Federal Government Open Data Portaldata.gov.au
Central source of Australian open government data.
Anyone can access the anonymised public data
published by federal, state and local government
agencies.
State and Territory Government Data Portals
Individual Australian states maintain open-access
portals that serve a wide range of interesting data -
for example, burn scars and fire history.
data.nsw.gov.au
firenorth.org.au/nafi3
nrmaps.nt.gov.au
data.sa.gov.au
naturemaps.sa.gov.au
thelist.tas.gov.au
data.vic.gov.au
data.wa.gov.au
D ATA A G E N C I E S A N D T O O L P R O V I D E R S
70 71B U S H F I R E S I T U AT I O N A L A W A R E N E S S : V I E W F R O M T H E I N C I D E N T M A N A G E M E N T T E A M B U S H F I R E S I T U AT I O N A L A W A R E N E S S : V I E W F R O M T H E I N C I D E N T M A N A G E M E N T T E A M

VULNERABILITYMODELS
IMPACTHazImp (no fires, yes)
RISK
EVENT CATALOGUESHotspots database
FOUNDATIONAL DATAElevation, land cover, hotspots, fire boundaries
NATIONAL HAZARDASSESSMENTS
EXPOSUREAEIP
RISK
VULNERABILITY
EXPOSUREHAZARD
P R O F I L E
Geoscience Australia
Geoscience Australia (GA) takes an all-hazards approach to providing trusted and actionable information to support decision-making around bushfires and other natural hazards.
Fundamentally, GA provides end-to-end risk analysis
for different types of event, including: Tropical Cylcones,
Earthquakes, Tsunami. To do this requires a deep
understanding of the processing steps between foundational
data and risk maps.
The process of creating a risk map for a natural hazard can be
visualised as pyramid, with each layer having its own tools.
In the specific case of fires, tools for most layers are still
under development.
When disaster strikes, access to information is equally important as access to food and water”THE RED CROSS (2005)
IMPORTANT TOOLS DEVELOPED OR SUPPORTED BY GA INCLUDE:Australian Information Exposure Platform (AIEP):This is a web tool is used to create exposure risk reports for assets (e.g., buildings) and
populations (e.g., senior citizens, children) in a chosen geographic area.
portal.aeip.ga.gov.au
Digital Earth Australia (DEA):This is a mapping platform delivering information useful for assessing, responding to
and recovering from natural hazards.
ga.gov.au/dea/products
Elvis:One-stop mapping platform serving topology and elevation data globally. These are
fundamental data necessary for most risk models.
elevation.fsdf.org.au
HazImp:Natural hazard impact assessment tool. Combines hazard map (e.g., flooding map)
and asset or infrastructure maps (e.g., buildings) with damage models for types of
construction materials to arrive at an impact map. Currently does not support fires.
github.com/GeoscienceAustralia/hazimp
EM-Link:Online catalogue of emergency management services collating 145 web services and used
by 60 organisations (restricted).
emlink.net.au
72 73B U S H F I R E S I T U AT I O N A L A W A R E N E S S : V I E W F R O M T H E I N C I D E N T M A N A G E M E N T T E A M B U S H F I R E S I T U AT I O N A L A W A R E N E S S : V I E W F R O M T H E I N C I D E N T M A N A G E M E N T T E A M

C A S E S T U DY
DEA Hotspots
Digital Earth Australia (DEA) Hotspots is a national bushfire monitoring system provided as a service by Geoscience Australia in partnership with the Bureau of Meteorology. It collates and processes satellite data to produce a map of possible fire locations, detected through their high levels of infrared radiation. The diagram on the right illustrates how the system works.
Input data is provided by satellites that pass
overhead several times per day, or in the case
of Himawari-8 are stationary over Australia
and transmit images every ten minutes.
Multi-band images from instruments on
the satellites arrive via a ground station at
Alice Springs, where they are processed into
analysis-ready data.
The hotspot extraction algorithms are
different for each instrument and optimised
for the different sensors used. These sensors
cover the visible and near-infrared bands,
meaning that separate algorithms must be
used during the night - when optical data is
poor quality or noisy.
Conflicts in the data are resolved and
detected hotspots are written to the Australia
Reference Hotspot Database on Amazon
Web Services, where they are available
for collection by apps and services. Public
hotspot information is updated every
few hours, while the internal catalogue is
updated in near real time - up to 140 times
per day.
More Information:
DEA Hotspots Product Description PDF.
Variable Usage Across Territories:DEA Hotspots are used as a decision
support tool in populous states where
ignitions are likely to be first reported
by other methods (e.g., 000 calls). In
NSW the satellite hotspot data is used
to confirm geolocation within 1-2
km. However, WA and NT rely on the
hotspots service as a first detection
tool. Victoria also uses aircraft for
spotting fires.
HOTSPOT VISUALISATION APPS AND SERVICESQuery Reference Database over the internet via WMS or WFS
SOUMI NPPVIIRS Instrument
HIMARWARI-8AGI Instrument
NOAA-20AVHRR Instrument
AQUA & TERRAMODIS Instrument
GA ALICE SPRINGS SATELLITE GROUND STATIONga.gov.au/news-events/features/40-years-of-landsat-in-australia
Satellite Downlinks
Query Serve
Aurora Fire Spread PredictionIn WA, hotspots automatically trigger
fire spread modelling using Aurora
Bushfire.io GA Hotspots Portalhotspots.dea.ga.gov.au
CALIBRATED LEVEL-0 DATAHDF | Raw Data Record
Internet HOTSPOT EXTRACTIONDay / Night Detection Algorithms
AUSTRALIA REFERENCE HOTSPOT DATABASEWeb Map Service (WMS) | Web File Service (WFS)
Public Data Bucket
74 75B U S H F I R E S I T U AT I O N A L A W A R E N E S S : V I E W F R O M T H E I N C I D E N T M A N A G E M E N T T E A M B U S H F I R E S I T U AT I O N A L A W A R E N E S S : V I E W F R O M T H E I N C I D E N T M A N A G E M E N T T E A M

International Satellite Imagery SupportGroups of satellite operators have agreements to provide assistance during natural disasters.
The International Charter for Space and Major Disasters is
a worldwide collaboration involving 17 space agencies and
commercial satellite companies. It provides free access to
data from expensive satellites in the event of a disaster
(e.g., high resolution optical and synthetic aperture radar
instruments).
disasterscharter.org
The Copernicus Emergency Management Service provides
early warning and monitoring services and on-demand
mapping to support selected emergencies. Examples are
impact-maps and extent-maps created using the European
Space Agency (ESA) Copernicus satellite resources.
emergency.copernicus.eu
ESA Sentinel 2, Credit: European Space Agency.
CASE: INTERNATIONAL SATELLITE SUPPORT ACTIVATION 631EMSR408: Wildfires in New South Wales, Australia
Activated: 2019-11-13, 06:55 UTC
emergency.copernicus.eu/mapping/list-of-components/EMSR408
10 COUNTRIES FROM 13
CONTRIBUTING ORGANISATIONS
22 SATELLITES USED, 18 OF WHICH WERE SPECIFICALLY
TASKED
2073 IMAGES SUPPLIED AND 28
DETAILED MAPS GENERATED
Example of Copernicus EMS map provided by David Hudson, Geoscience Australia
“This activation […] represents one of the most important ones in terms of the analysis produced. […]. [It] helps first responders on the field in order to make decisions, it’s not only showing the burnt area.”JUAN ESCALANTE, AT THE EU’S EMERGENCY RESPONSE COORDINATION CENTRE IN BRUSSELS SPEAKING TO 7-NEWS AUSTRALIA.
76 77B U S H F I R E S I T U AT I O N A L A W A R E N E S S : V I E W F R O M T H E I N C I D E N T M A N A G E M E N T T E A M B U S H F I R E S I T U AT I O N A L A W A R E N E S S : V I E W F R O M T H E I N C I D E N T M A N A G E M E N T T E A M
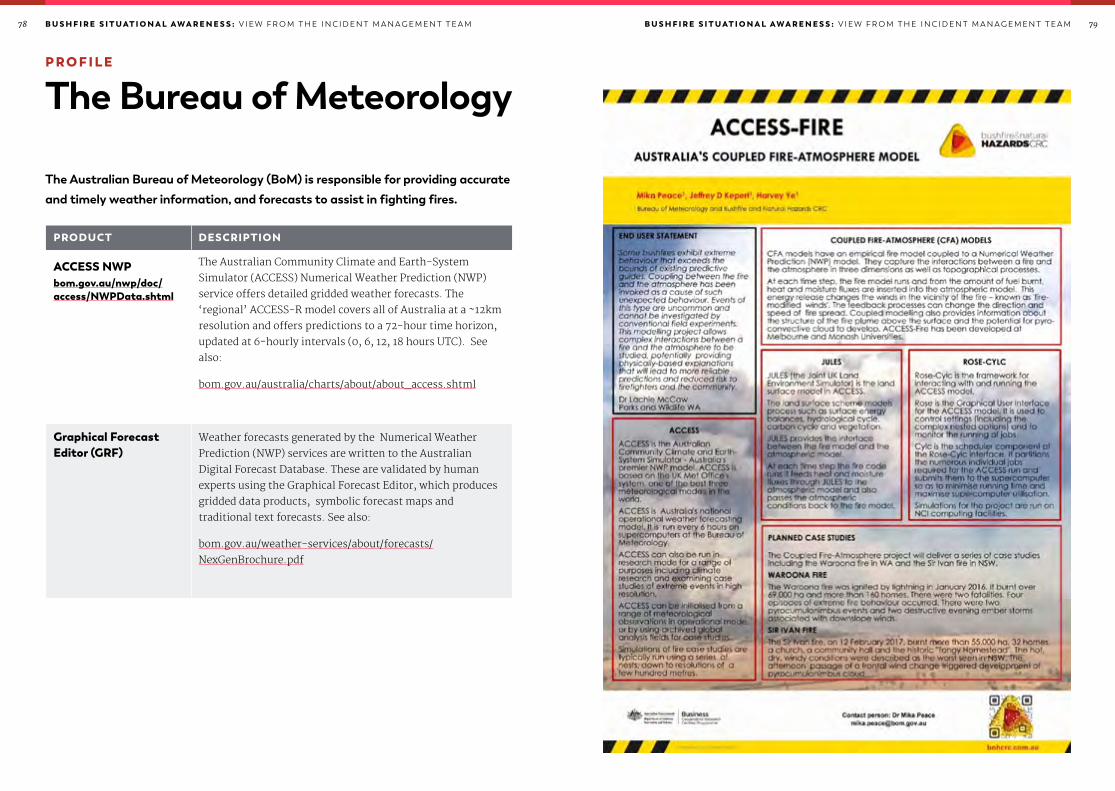
The Australian Bureau of Meteorology (BoM) is responsible for providing accurate and timely weather information, and forecasts to assist in fighting fires.
P R O F I L E
The Bureau of Meteorology
PRODUCT DESCRIPTION
ACCESS NWPbom.gov.au/nwp/doc/access/NWPData.shtml
The Australian Community Climate and Earth-System
Simulator (ACCESS) Numerical Weather Prediction (NWP)
service offers detailed gridded weather forecasts. The
‘regional’ ACCESS-R model covers all of Australia at a ~12km
resolution and offers predictions to a 72-hour time horizon,
updated at 6-hourly intervals (0, 6, 12, 18 hours UTC). See
also:
bom.gov.au/australia/charts/about/about_access.shtml
Graphical Forecast Editor (GRF)
Weather forecasts generated by the Numerical Weather
Prediction (NWP) services are written to the Australian
Digital Forecast Database. These are validated by human
experts using the Graphical Forecast Editor, which produces
gridded data products, symbolic forecast maps and
traditional text forecasts. See also:
bom.gov.au/weather-services/about/forecasts/
NexGenBrochure.pdf
78 79B U S H F I R E S I T U AT I O N A L A W A R E N E S S : V I E W F R O M T H E I N C I D E N T M A N A G E M E N T T E A M B U S H F I R E S I T U AT I O N A L A W A R E N E S S : V I E W F R O M T H E I N C I D E N T M A N A G E M E N T T E A M

Intelligence Layers for FirefightingIntelligence layers are geo-located data products that offer insight into the current and future situation on the fireground. They consist of calibrated primary data and derived products, such as fire risk maps.
MAPS AND GEO-LOCATED DATA
National provider State provider Private provider Local provider
FUEL TYPES & FUEL
CHARACTERISTICS (FIRE RISK )
WEATHER MAPS
FIRE & BURN HISTORY
COMMUNICATION COVERAGE & TOWER MAPS
LIGHTNING STRIKES
CIVIL INFRASTRUCTURE
MAPS
WATERCOURSE MAPS
BUILDING USE MAPS (NEXUS)
ROAD CLOSURE STATUS
WATER RESOURCE
MAPS
ELEVATION & TOPOGRAPHY
POPULATION DEMOGRAPHIC
MAPS
UTILITIES STATUS MAPS
WEATHER PREDICTION
MAPS
AGRICULTURAL VALUE MAPS
RESOURCE LOCATION &
HISTORY
FIRE PROPERTY
MAPS
Maps showing real-time information on
the active fires are critical for safety and
planning daily fireground operations.
Modern simulations can predict the
spread of the fire in response to fuel and
weather conditions, informing strategic
decisions over several days. However, the
accuracy of these models depends closely
on the uncertainty associated with weather
forecasts and measured fuel properties. Fire
spread prediction is covered in more detail in
the following pages.
All of these primary and tertiary data
products feed into the difficult decision-
making process around how to fight the
fire. At a fundamental level this involves
acquiring and directing resources in a highly
uncertain and dynamic environment. Most
processes have a lag of at least a day (e.g.,
transporting personnel or fuel), meaning
that predicting spikes in demand for
resources is a very desirable capability. In
the following pages we cover important
intelligence layers in detail.
ACTIVE FIRE HOTSPOTS
FIRE SPREAD PREDICTION
CURRENT FIRE AREA
SMOKE MODELLING
& PREDICTION
FIRE PROPERTY MAPS
STRATEGIC DECISION SUPPORT
“Only 20% of firefighting personnel will be available for deployment at any one time.”ACT RFS
FIRE SUPRESSION MODELLING
RESOURCE DEPLOYMENT SUGGESTIONS
EVACUATION MODELLING
RESOURCE ALLOCATION
SUPPORT
RESOUCE ROUTING (TRUCKS,
PLANT)
CONSUMABLES PREDICTIONS (FOOD, FUEL, WATER ETC.)
80 81B U S H F I R E S I T U AT I O N A L A W A R E N E S S : V I E W F R O M T H E I N C I D E N T M A N A G E M E N T T E A M B U S H F I R E S I T U AT I O N A L A W A R E N E S S : V I E W F R O M T H E I N C I D E N T M A N A G E M E N T T E A M
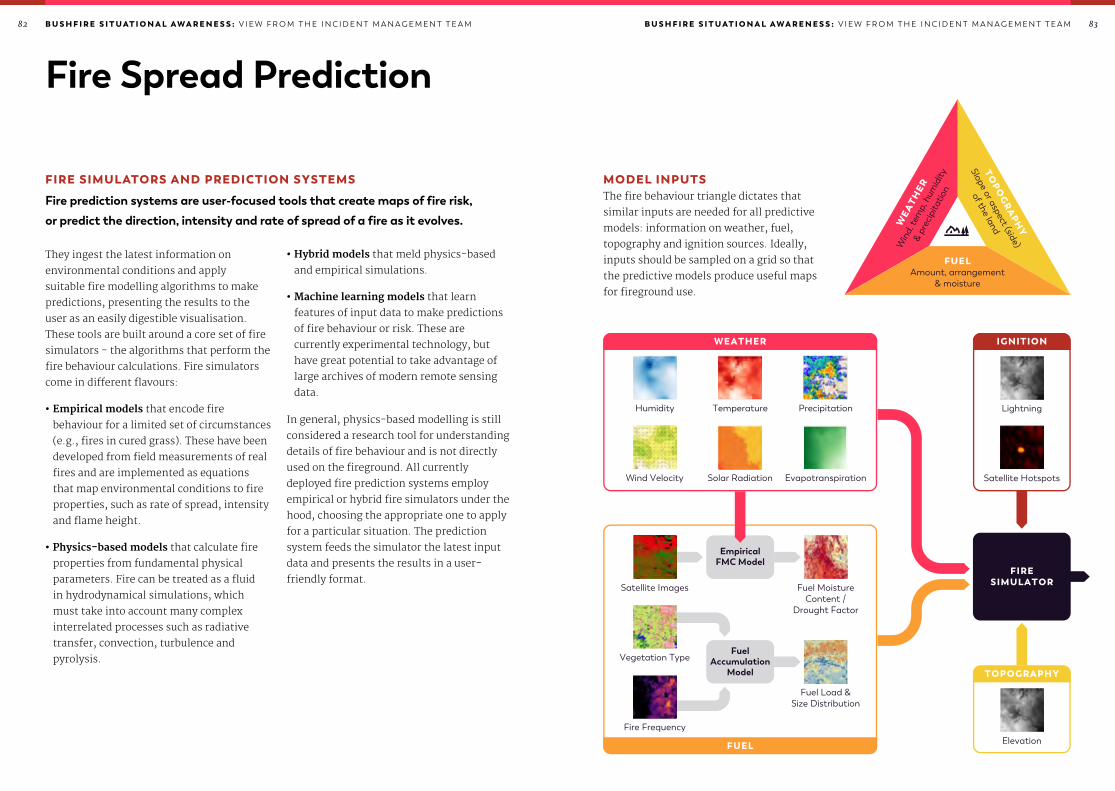
Fire Spread Prediction
• Hybrid models that meld physics-based
and empirical simulations.
• Machine learning models that learn
features of input data to make predictions
of fire behaviour or risk. These are
currently experimental technology, but
have great potential to take advantage of
large archives of modern remote sensing
data.
In general, physics-based modelling is still
considered a research tool for understanding
details of fire behaviour and is not directly
used on the fireground. All currently
deployed fire prediction systems employ
empirical or hybrid fire simulators under the
hood, choosing the appropriate one to apply
for a particular situation. The prediction
system feeds the simulator the latest input
data and presents the results in a user-
friendly format.
They ingest the latest information on
environmental conditions and apply
suitable fire modelling algorithms to make
predictions, presenting the results to the
user as an easily digestible visualisation.
These tools are built around a core set of fire
simulators - the algorithms that perform the
fire behaviour calculations. Fire simulators
come in different flavours:
• Empirical models that encode fire
behaviour for a limited set of circumstances
(e.g., fires in cured grass). These have been
developed from field measurements of real
fires and are implemented as equations
that map environmental conditions to fire
properties, such as rate of spread, intensity
and flame height.
• Physics-based models that calculate fire
properties from fundamental physical
parameters. Fire can be treated as a fluid
in hydrodynamical simulations, which
must take into account many complex
interrelated processes such as radiative
transfer, convection, turbulence and
pyrolysis.
FIRE SIMULATORS AND PREDICTION SYSTEMS
Fire prediction systems are user-focused tools that create maps of fire risk, or predict the direction, intensity and rate of spread of a fire as it evolves.
Humidity Temperature Precipitation
Wind Velocity Solar Radiation Evapotranspiration
Satellite Images
EmpiricalFMC Model
FuelAccumulation
Model
Fuel Moisture Content /
Drought Factor
Vegetation Type
Fuel Load &Size Distribution
Fire Frequency
Lightning
Satellite Hotspots
FIRESIMULATOR
WEATHER IGNITION
Elevation
TOPOGRAPHY
FUEL
FUELAmount, arrangement
& moisture
TOPO
GR
APH
Y
Slope or aspect (side)
of the landWEA
THER
Win
d, te
mp,
hum
idity
& pr
ecip
itatio
n
MODEL INPUTSThe fire behaviour triangle dictates that
similar inputs are needed for all predictive
models: information on weather, fuel,
topography and ignition sources. Ideally,
inputs should be sampled on a grid so that
the predictive models produce useful maps
for fireground use.
Humidity Temperature Precipitation
Wind Velocity Solar Radiation Evapotranspiration
Satellite Images
EmpiricalFMC Model
FuelAccumulation
Model
Fuel Moisture Content /
Drought Factor
Vegetation Type
Fuel Load &Size Distribution
Fire Frequency
Lightning
Satellite Hotspots
FIRESIMULATOR
WEATHER IGNITION
Elevation
TOPOGRAPHY
FUEL
FUELAmount, arrangement
& moisture
TOPO
GR
APH
Y
Slope or aspect (side)
of the landWEA
THER
Win
d, te
mp,
hum
idity
& pr
ecip
itatio
n
82 83B U S H F I R E S I T U AT I O N A L A W A R E N E S S : V I E W F R O M T H E I N C I D E N T M A N A G E M E N T T E A M B U S H F I R E S I T U AT I O N A L A W A R E N E S S : V I E W F R O M T H E I N C I D E N T M A N A G E M E N T T E A M

MODEL OUTPUTSThe outputs of fire simulators include estimates of intensity at the fire front, flame height,
ember density and rate of spread.
The irregular grid used by the Australis model (Johnston et al. 2008)
Basic fire simulators produce one-dimensional
outputs, however, simulators like Australis
(Johnston et al. 2008, UWA) also model the
spread of fire by propagating it on an irregular
grid. Such cell-based spread simulators have
proven to be effective when fed with accurate
and timely data - a significant challenge in
itself. Fire prediction systems further process
these outputs into a variety of maps that
address different needs, depending on the task
at hand. These can be broadly sorted into two
categories:
Managing Active Fires• Predicting the path and intensity of an
active bushfire as a function of time, taking
into account the weather forecast.
• Planning ‘backburning’ to control an
existing fire. This is where a new fire is
lit between an active bushfire and an
established control line to remove fuel and
halt the spread.
• Planning the firefighting strategy during a
campaign fire.
Managing Fire RiskAssessing the predicted impact of fire on
infrastructure, assets, communities and
populations.
• Planning hazard reduction burns to remove
fuel from the landscape (also called
prescribed burns).
• Creating and updating fire risks maps,
including calculating the fire danger rating
for a region.
Flame Dimension
Fireline Intensity
Fire Spread Rate
Ember Density
Computational fire modelling is a large field
of study and also includes fuel property
models, fire ignition models and models of
fire effects. The outputs of fire prediction
systems include maps of fire risk and
fire danger index, temporal maps of fire
spread, damage estimates to property and
ecosystems, and ensemble simulations of
fire suppression scenarios. Covering these in
detail is beyond the scope of this report, but
we show examples of commonly used tools
on the following pages.
A map of fire danger index for the state of Victoria on a particular day.
A fire spread prediction map showing showing isochrones - contours outlining the burnt area at equal time intervals. The ignition point is marked by a red dot. Credit: Jackson Parker, DFES (WA).
Isochrones of a wildfire in Ittri, Sardinia, Italy as modelled by Trucchia et al. 2020.
Increase in annual sum of Forest Fire Danger Index 1978-2017. Source: BoM.
84 85B U S H F I R E S I T U AT I O N A L A W A R E N E S S : V I E W F R O M T H E I N C I D E N T M A N A G E M E N T T E A M B U S H F I R E S I T U AT I O N A L A W A R E N E S S : V I E W F R O M T H E I N C I D E N T M A N A G E M E N T T E A M

Fire Risk AssessmentThe current Fire Danger Index (FDI) system has six levels that describe the potential level of danger should a fire start in vegetated areas.
kilometers and updated hourly (daily updates
to public) as new weather information is
received. The
For emergency services, the AFDRS will
provide high-resolution maps of fire risk
via a web portal. An editor interface will be
available to change fuel types, as these data
can be inaccurate or out-of-date.
Further in information can be found on the
following links:
https://www.aidr.org.au/news/
understanding-the-australian-fire-danger-
rating-system/
https://www.afac.com.au/initiative/afdrs/
afdrs-publications-and-reports
https://www.afac.com.au/initiative/afdrs
These are posted on the familiar roadside
signs, shown at right. The Fire Danger Index
is evaluated in two fuel types - grassland
and eucalypt forests - using the McArthur
empirical fire behaviour models (e.g., the
circular slide-rule MK4 and MK5 fire danger
meters). There are well known problems
with the models, including over-sensitivity
to input values and poor performance at
higher danger ratings
The FDI system is being replaced (rollout
2022) by the Australian Fire Danger Rating
System (AFDRS), which as been developed
in a project led by the NSW RFS working
with AFAC and the Bureau of Meteorology.
The new system will be more accurate and
spatially granular, and is evaluated in eight
different fuel types: grassland, woodland,
spinifex, buttongrass, forest, mallee,
heath, shrubland and pine. It is designed
to be calculated on a grid resolution of 1.5
Low
Moderate High Very High Severe Extreme Catastrophic
A roadside Fire Danger Index sign. Source: WikiMedia Commons.
86 87B U S H F I R E S I T U AT I O N A L A W A R E N E S S : V I E W F R O M T H E I N C I D E N T M A N A G E M E N T T E A M B U S H F I R E S I T U AT I O N A L A W A R E N E S S : V I E W F R O M T H E I N C I D E N T M A N A G E M E N T T E A M

FIREWATCH AURORAOnline fire prediction tool and ArcGIS plugin
aurora.landgate.wa.gov.au
Developed by Landgate
with University of WA.
Use:
• ●Simulate bushfires in
real time and offline.
• ●Test fire suppression
strategies.
Aurora leverages the
Australis fire simulator
developed by the
University of Western Australia. It offers the following capabilities:
• ●Predict and map the spread of active fires in real time from ignition sources, using
latest weather forecasts.
• ●Run custom fire spread scenarios with user-defined ignition sources and alternative
weather conditions.
• ●Test the effect of fire suppression actions, such as creating firebreaks in the landscape.
C U R R E N T ‘ W O R K H O R S E ’ P R E D I C T I O N T O O L S
Aurora and PHOENIX Rapidfire are the workhorse tools of prediction efforts during normal operations. The new CSIRO Spark framework is destined to replace both tools, however, the operational version is still being developed, with support by The Minderoo Foundation.
The main interface of Firewatch Aurora showing hotspots (points) and predicted fire spread (grey shaded isochrones). Source: Landgate / DFES.
CSIRO SPARKFlexible Web- and Cloud-Based Prediction tool
research.csiro.au/spark
Use:
• ●Simulate bushfires in
real time and offline.
• ●Test fire suppression
strategies.
• ●Create risk maps.
Latest-generation fire
modelling tool that wraps
up many fire simulation
models. Spark aims to
supersede Phoenix and
Aurora, offering a highly
customisable user interface for adding new gridded data inputs, integrating new models
as scripts and specifying time-series variables. Runs on CPUs and GPU (faster).
Model uncertainties can be explored by performing multiple runs (ensemble modelling)
and some highly experimental models are offered for testing, such as spot fires from
firebrands, or disruptions to fire spread from barriers (roads, firebreaks). Highly
customizable and can integrate live data feeds (e.g., satellite hotspots).
Back-end service and API for integration with other tools.
PHOENIX RAPIDFIREStand-alone prediction tool for MS Windowsfirepredictionservices.com.au
Use:
• ●Simulate bushfires in real time and
offline.
• ●Test fire suppression strategies.
• ●Create risk maps.
Stand-alone fire spread prediction
software incorporating multiple empirical
models internally. Outputs include spatial
maps of flame height, intensity, size, and
ember density, and also projected impact
on assets.
Suppression scenarios can also be tested,
such as firebreaks and water bombing.
The CSIRO Spark interface presenting a map of predicted flame height. Source: Spark Applications User Guide.
88 89B U S H F I R E S I T U AT I O N A L A W A R E N E S S : V I E W F R O M T H E I N C I D E N T M A N A G E M E N T T E A M B U S H F I R E S I T U AT I O N A L A W A R E N E S S : V I E W F R O M T H E I N C I D E N T M A N A G E M E N T T E A M

O T H E R F I R E I N T E L L I G E N C E T O O L S A N D S Y S T E M S
FORESIGHT (VIC)An online bushfire risk visualisation tool.foresight.help.ffm.vic.gov.au/introduction
Developed by Victoria Predictive Services Victoria with DELWP.
Use:
• Assessing fire risk risk based on latest weather data.
• Victoria Only.
• Interactive map of key bushfire risk variables across Victoria.
• Selectable layers and time-series data from spatial cells (meteograms).
• Forecast 1 week in advance.
• Designed for bushfire managers to assess fire risk in the landscape (not for predicting
path of a bushfire in progress).
Data & Models:
• BoM Gridded Weather product, produced by the Graphic Forecast Editor (GFE) system
@ 3km res.
• FireMod System by DEWLP for fire behaviour and risk predictions.
• FireCast system, running Phoenix fire simulator under the hood. 1km grid across entire
state.
• Weather information updates twice per day.
• FireCast predictions are created after morning weather update. Based on ~288K test
ignitions.
A number of other tools exist (or are in development) to query, visualise, or otherwise process information relevant to bushfires:
NAFI (NT, QLD)Online bushfire risk visualisation and active fire monitoring tool.firenorth.org.au/nafi3/views/help/Info_hub.htm
Developed by the Darwin Centre for Bushfire Research.
Use:
• Tracking active fires.
• Visualising burnt areas.
• Reporting on historic burn patterns and gas emissions.
• Aggregating data (WMS).
• NT and QLD focused.
• Display active fires using hotspots, including visualisation of hotspot timings and
spread.
• Display historical fire scars, including how recently areas were burnt (proxy for fuel
load).
• Display latest satellite images & lightning strikes.
• Create formal reports on polygon-selected area: 1) Fire History, 2) Fire Scar By Year, 3)
Species Booklet (threatened species and pests in NT only).
• Set otspot email alerts for custom area.
• Capabilities offered as a web map service (WMS)
Data:
• Firescars: Darwin Centre for Bushfire Research (NT), Cape York Sustainable Futures
(QLD).
• Hotspots: Geoscience Australia and Landgate.
CSIRO AMICUSInteractive map of Western Australia showing warnings for fires, floods, tsunami, earthquakes, storms, cyclones and hazardous materials. Also shows the current fire danger rating map.emergency.wa.gov.au
EMERGENCY WAOlder fire simulation software that wraps empirical models. Outputs are 1D time-dependent graphs.
90 91B U S H F I R E S I T U AT I O N A L A W A R E N E S S : V I E W F R O M T H E I N C I D E N T M A N A G E M E N T T E A M B U S H F I R E S I T U AT I O N A L A W A R E N E S S : V I E W F R O M T H E I N C I D E N T M A N A G E M E N T T E A M

Initial AttackIf available immediately, fire spread
predictions can aid the first responding
crew in planning initial attack on fire. These
crews have limited access to technology and
so tend to use low-tech solutions, such as
the MacArthur Forest Fire Danger Meter or
rules-of-thumb.
Ongoing Operations During ongoing operations of a campaign
, fire spread predictions are created by
the dedicated mapping team embedded
within the IMT, or attached to a regional
hub of a fire service. These teams collate
the static map layers, recent fuel and
weather information, and dynamic
fireground data as inputs to the models.
They run the simulations and produce fire
spread maps to include with the incident
action plan. These are updated as new
information becomes available (e.g., from
the fireground as manual fuel moisture
content measurements, hand-held weather
measurements, or from the upstream
providers like GA and BoM).
Australian bushfires in eucalyptus forests can propagate through ‘spotting’. This is where bark or other burning fuel is lofted into the air and deposited on an unburnt site in font of the main fire front. These secondary fires pose a significant danger, often starting up to 30 km away and merging into significant fires in their own right.
U S E O F F I R E S P R E A D P R E D I C T I O N S I N P R A C T I S E
The current technology models could be improved by:
• Relying on very uncertain data as inputs.
• Input data on fuel conditions coarse and sparse for Aurora & Phoenix Rapidfire.
• Results can be inaccurate because uncertainties in input data and empirical models
compound each other.
• Note that computational power not a limit (was for smoke modelling in 2020?).
• Australian fires are unique in ability to propagate via spotting - lofting of
firebrands to start fires up to 30km away.
At left: Figure from Milne et al. 2014 comparing final fire perimeters estimated by Australis (black line) and the ground truth fire scar (shaded area). The region marked ‘Y’ on the leftmost plot was under-predicted due to vegetation mapping inaccuracies, while the region marked ‘Z’ on the rightmost plot was over-predicted due to inaccurate weather data. Accurate input data is a key requirement of predictive models.
Spotting during a fire in Victoria. Source Storey et al., 2020 & DEWLP
The McArthur Mk5 Forest Fire Danger Meter
C H A L L E N G E S A N D L I M I TAT I O N S
92 93B U S H F I R E S I T U AT I O N A L A W A R E N E S S : V I E W F R O M T H E I N C I D E N T M A N A G E M E N T T E A M B U S H F I R E S I T U AT I O N A L A W A R E N E S S : V I E W F R O M T H E I N C I D E N T M A N A G E M E N T T E A M

Fire spread prediction map from the NSW Rural Fire Service. Photo Credit: Gary Hooker, ACT RFS.
94 95B U S H F I R E S I T U AT I O N A L A W A R E N E S S : V I E W F R O M T H E I N C I D E N T M A N A G E M E N T T E A M B U S H F I R E S I T U AT I O N A L A W A R E N E S S : V I E W F R O M T H E I N C I D E N T M A N A G E M E N T T E A M

Water Resource & Point Maps
Aside from natural water sources,
firefighters may be able to draw from
standpipes and water tanks if permission is
granted by the owners. Water is a precious
resource in rural areas and the fire services
undertake to replace water used to fight
fires. This means that crews who take water
from a farm or community resource must
estimate the volume extracted so it can be
replaced later.
The intelligence layers below show where
water is available and suitable (blue
background) and what factors influence
access (yellow background).
Up-to-date hydrology and water resource maps provide essential information for fighting fires. Water is used to suppress fires directly by spraying the active fire front: from the ground using trucks and hoses, and from the air using helicopters and aerial water-bombers.
Trucks and helicopters remain at the
fireground after deployment, and refill
locally by dipping into nearby water sources,
such as ponds and dams. They need to know
which sources are clean, available for use,
have sufficient depth, and are accessible by
ground or air.
Water availability
map (surface area + history)
Water occupancy
(near real-time)Water depth
Suitability / use / pollution
Stand-pipes, Tanks &
Hydrants
Elevation & DEM Maps
Power line locations
LIDAR derived canopy maps
Roads & tracks Obstructions & access routes
Examples of suitable and unsuitable sources are below.
CHALLENGES:• Not easy to assess access routes in
advance, so this information needs to be
communicated from the fireground.
• Access to water for helicopters is assessed
by ground crew and pilots together,
including landing sites.
• Remote sensing from satellites and drones
can help show where water lies, but can lag
current conditions by up to a week. Also
difficult to determine water occupancy and
depth accurately.
S U I TA B L E Rivers, creeks
Private reservoirs
(permitted)
Pool at staging ground
Bulk water tanker
U N S U I TA B L E Sewage ponds
Private reservoirs
(denied permission)
Runoff ponds
The image shows the percentage of time since 1987 that water was observed by the Landsat satellites on the floodplain around Burketown and Normanton in northern Queensland. The water frequency is shown in a colour scale from red to blue, with areas of persistent water observations shown in blue colouring, and areas of very infrequent water observation shown in red colouring. The image is part of the Water Observations from Space product, available for all of Australia. Source: Geoscience Australia
96 97B U S H F I R E S I T U AT I O N A L A W A R E N E S S : V I E W F R O M T H E I N C I D E N T M A N A G E M E N T T E A M B U S H F I R E S I T U AT I O N A L A W A R E N E S S : V I E W F R O M T H E I N C I D E N T M A N A G E M E N T T E A M

Communications: The System BackboneThe communications layer is the backbone of fireground operations. Every operation relies on the ability to reliably pass information around the fireground, between all levels of the emergency management apparatus.
Firefighters currently rely on the following systems in order of reliability:
Government Radio Networks(GRN, TRN, NTESTN, GWN, SAGRN, RMR, TasGRN)
Voice communications to
appliances, between IMT and
division commanders.
Limited data traffic to mobile
data terminals.
Covers a high percentage of
each state (> 90% typically), but
also has poor coverage in some
areas.
Can link to the telephone/4G
network and be enhanced by
mobile repeaters on, or adjacent
to, the fireground.
CB Radio Voice comms between crew
on the fireground and to crew
leaders.
Used generally for local comms
within teams - most carry a CB
in addition to a GRN-capable
radio.
4G Mobile Network
Voice communications.
Almost all high-capacity digital
data services for downloading
maps and documents.
Poor coverage in rural areas and
drops out rapidly away from
urban areas.
Satellite Phones(Iridium)
Voice communications.
Limited and slow data rate.
Worldwide coverage, but very
expensive and so reserved
for areas with no other
communication options.
The deeply integrated data-rich system advocated by this report is reliant on a reliable wide-bandwidth communications system. The data-rate is only met by the current 4G mobile network, which is highly unreliable in the rugged rural areas where fires are fought.
CHALLENGES/SHORTFALLS:• Ad-hoc/organic system design and
development, driven by what is available as
opposed to what is needed.
• Staggered degradation, whilst a multi
layered system provides levels of
redundancy failure is not seamless and
requires operator input/effort to coordinate
transition between primary to fallback
comms..
• Low data rate/throughput creates high
reliance on voice comms demands
significant operator input and engagement
to report on routine activity - detracts from
core duties?
• Reliance on systems designed for terrestrial
environments to be employed in remote
settings, poor connectivity increases risk
to life of operators and reduces fire fighting
effectiveness.
Source: http://arcia.org.au/wp-content/uploads/2019/03/economic-_report_-on_-the_-value_-of_-lmr_-services_-in_-australia.pdf
98 99B U S H F I R E S I T U AT I O N A L A W A R E N E S S : V I E W F R O M T H E I N C I D E N T M A N A G E M E N T T E A M B U S H F I R E S I T U AT I O N A L A W A R E N E S S : V I E W F R O M T H E I N C I D E N T M A N A G E M E N T T E A M

C O M M U N I C AT I O N S N E T W O R K : C U R R E N T S Y S T E M P R A C T I C E A N D I N T E R O P E R A B I L I T Y
IMT
DIVCOM
SECTOR / CMD STRIKE TEAM LEAD
SECTOR / CMD STRIKE TEAM LEADDIVCOMIMT AIRCRAFTCREW MEMBERCREW LEADER
CREW MEMBER
CREW LEADER
AIRCRAFT
Government Radio (Duplex channel), 4G Cell or
Satellite Phone
Government Radio(Simplex channel)
CB Radio
Government Radio(Simplex channel)
Government Radio(Duplex channel)
Airbandradio
Government Radio(Simplex channel)
Government Radio(Duplex channel)
Airbandradio
Airbandradio
100 101B U S H F I R E S I T U AT I O N A L A W A R E N E S S : V I E W F R O M T H E I N C I D E N T M A N A G E M E N T T E A M B U S H F I R E S I T U AT I O N A L A W A R E N E S S : V I E W F R O M T H E I N C I D E N T M A N A G E M E N T T E A M
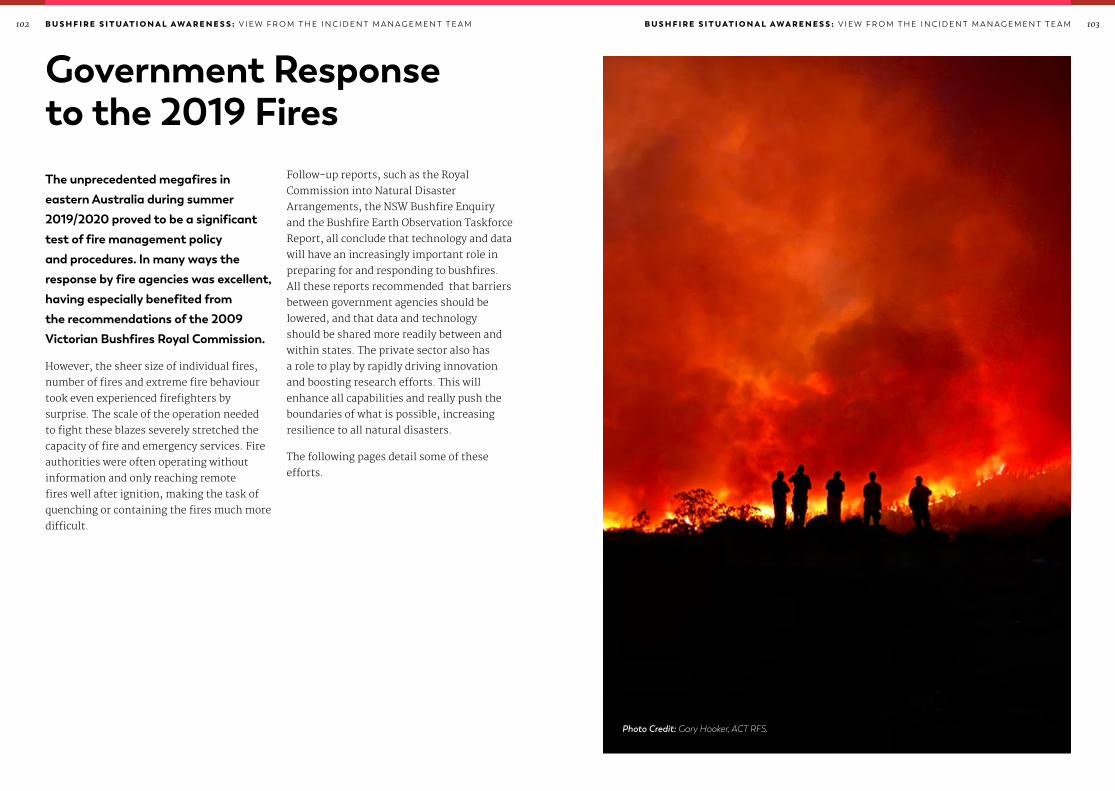
Government Responseto the 2019 FiresThe unprecedented megafires in eastern Australia during summer 2019/2020 proved to be a significant test of fire management policy and procedures. In many ways the response by fire agencies was excellent, having especially benefited from the recommendations of the 2009 Victorian Bushfires Royal Commission.
However, the sheer size of individual fires,
number of fires and extreme fire behaviour
took even experienced firefighters by
surprise. The scale of the operation needed
to fight these blazes severely stretched the
capacity of fire and emergency services. Fire
authorities were often operating without
information and only reaching remote
fires well after ignition, making the task of
quenching or containing the fires much more
difficult.
Follow-up reports, such as the Royal
Commission into Natural Disaster
Arrangements, the NSW Bushfire Enquiry
and the Bushfire Earth Observation Taskforce
Report, all conclude that technology and data
will have an increasingly important role in
preparing for and responding to bushfires.
All these reports recommended that barriers
between government agencies should be
lowered, and that data and technology
should be shared more readily between and
within states. The private sector also has
a role to play by rapidly driving innovation
and boosting research efforts. This will
enhance all capabilities and really push the
boundaries of what is possible, increasing
resilience to all natural disasters.
The following pages detail some of these
efforts.
Photo Credit: Gary Hooker, ACT RFS.
102 103B U S H F I R E S I T U AT I O N A L A W A R E N E S S : V I E W F R O M T H E I N C I D E N T M A N A G E M E N T T E A M B U S H F I R E S I T U AT I O N A L A W A R E N E S S : V I E W F R O M T H E I N C I D E N T M A N A G E M E N T T E A M

CSIRO
GA
BOM
ABS
REAL-TIME FEED
NATIONALRECOVERY &
RESILIENCE AGENCYResilience, Relief, Recovery
EMERGENCY MANAGEMENT
AUSTRALIAPreparedness, Response,
Transition to Recovery
UNIFIED HAZARD, RISKAND IMPACT INFORMATION:Exposure and vulnerability dataNational physical hazard modellingRisk and impact modelling, and informationSocio-economic modelling of damage, loss, value and opportunityModelling of cost-benefit analysis feeding risk reduction decisionsTactical and strategic modelling focus JOINT COMMON
OPERATING PICTURE (JCOP)
JOINT TSNUAMI WARNING
CENTRE
FORECAST & WARNING
PRODUCTS
WEATHER MODELLING
TSUNAMI
GEOHAZARD PRODUCTS
GEOLOGICAL HAZARDS
AUSTRALIAN CLIMATE SERVICES ( ACS)acs.gov.auThe ACS (initially called CaRSA) was established in 2020 in response to recommendations
made by the Royal Commission into Natural Disaster Arrangements as a ‘virtual agency’
with the mission of integrating “Australia’s extensive climate and disaster risk information
into a new single national view to meet the significant information challenges in managing
natural disasters”. It presents information from four major government agencies, as in the
diagram below.
Initial work is happening in federal government, with two agencies as internal clients of ACS:Emergency Management Australia lead the federal government disaster and emergency
management response.
The new National Recovery and Resilience Agency incorporates the National Drought and North
Queensland Flood Response and Recovery Agency and the National Bushfire Recovery Agency.
Tools and services are offered through a new Natural Hazards Information Hub web page,
similar to the existing EM-Link page.
Credit: Based on a diagram presented by Brian Foo at the EMSINA Capability Meeting 2021
104 105B U S H F I R E S I T U AT I O N A L A W A R E N E S S : V I E W F R O M T H E I N C I D E N T M A N A G E M E N T T E A M B U S H F I R E S I T U AT I O N A L A W A R E N E S S : V I E W F R O M T H E I N C I D E N T M A N A G E M E N T T E A M

EMERGENCY MANAGEMENT AUSTRALIA (EMA )Emergency Management Australia (EMA) is an agency that sits within the Department
of Home Affairs and is the central coordinator for disaster response. It works to prevent,
prepare and respond to disasters and emergencies.
THE NATIONAL RECOVERY AND RESILIENCE AGENCY (NRRA )The National Recovery and Resilience Agency (NRRA) supports resilience, relief and
recovery efforts in the community. It has a strong focus on locally-led programs to support
communities affected by disasters, and also delivers initiatives to reduce risk and lessen
impact of future events.
JOINT COMMON OPERATING PICTURE• Unified data services• Near-real time information• Strategic modelling• Unified risk intelligence• Trusted advice
CLIMATE SERVICES AUSTRALIA
GOVERNMENT AGENCY INFORMATION
OPEN SOURCE INTELLIGENCE
STATE CRISIS CENTRES
RESEARCH ORGANISATIONS
PRIVATE SECTOR NGOS ETC
COMMONWEALTH GOVERNMENT
STATE/TERRITORY GOVERNMENTS
AUSTRALIAN DEFENCE FORCE
NATIONAL RECOVERY & RESILIENCE AGENCY
CRITICAL INFRASTRUCTURE OPERATORS
PRIVATE SECTOR
INSURANCE INDUSTRY
ENHANCED EMA
Coordination for all emergency management interactions to support near-real-time decision making.• Coordination• Analysis & planning• Tasking• Briefings• Decision Support
NATIONAL CRISIS COORDINATION &
MANAGEMENT CENTRE
Priorities for both agencies include:• Creating a Joint Common Operating Picture (JCOP) at the federal level.
• Looking at how to better use automation to draw data from CSA, states and territories.
• Integrating civilian and military operating pictures; the military are involved with disaster
response in a ‘search and rescue’ role.
• Conducting national exercises for training and preparation.
• Engagement with private sector via the Australian Government Crisis Management
Framework.
Key questions for the Joint Common Operating Picture (JCOP):• What is the current situation, short term forecast and likely impacts?
• What are the broader community and strategic consequences?
• What actions are being taken by the commonwealth government?
• What is the response capacity at State and Territory levels.
• What is the projected effort needed for the next 3, 7, 14 or 21 days?
• What assistance or support might be required on those timescales?
Credit: Based on a diagram presented by Brian Foo at the EMSINA Capability Meeting 2021
106 107B U S H F I R E S I T U AT I O N A L A W A R E N E S S : V I E W F R O M T H E I N C I D E N T M A N A G E M E N T T E A M B U S H F I R E S I T U AT I O N A L A W A R E N E S S : V I E W F R O M T H E I N C I D E N T M A N A G E M E N T T E A M

PA R T 2
Data, Technology & Opportunities for the FutureThe data and technology revolution in firefighting and where investment will have the greatest impact
Photo Credit: Gary Hooker, ACT RFS.
B U S H F I R E S I T U AT I O N A L A W A R E N E S S : PA R T T W O108 109B U S H F I R E S I T U AT I O N A L A W A R E N E S S : PA R T T W O

Gro
und
Spac
e
Map of the Opportunity Space
Local, Regional & State IMTCrew / TruckFireground
REMOTE-SENSING,WEATHER & GIS DATA
FIRE IGNITION DETECTION
CHANGE TRACKING:FIRE & SMOKE SPREAD
IMPACT & RECOVERY MAPPING
FUEL TYPE AND STATE MAPPING
FIRE RISK PREDICTION
ML & PHYSICS-INFORMED FIRE SPREAD MODELS
FIREFIGHTING RESOURCE MANAGEMENT & PREDICTION
INTELLIGENT WARNINGS FOR FIREGROUND PERSONNEL
EDGE DEVICE COMPUTING
PROBABILISTIC FIRE SUPPRESSION MODELLING
AUTOMATED REPORT GENERATION
FIREGROUND DATA FEEDS & SENSORS
REAL-TIME SITUATIONAL AWARENESS
LOCAL UPDATE OF MAPS AND MODELS
COMMUNICATIONS ROUTING & INTEROPERABILITY
STRUCTURED & BESPOKE FIREGROUND INFORMATION
DEPLOYMENT AND CREW HEALTH TRACKING
FAST INTEGRATION OF NEW DATA TO PRACTICAL MAPS
Over the next decade, technology, machine learning and data services will have an enormous impact on how fires - and other disasters - are managed. Intelligent tools and data-systems will inform risk assessment, preparation for fire seasons, firefighting activities and recovery. We call this ‘cyber-infrastructure’ for disaster management.
110 111B U S H F I R E S I T U AT I O N A L A W A R E N E S S : D ATA & O P P O R T U N I T I E S F O R T H E F U T U R E B U S H F I R E S I T U AT I O N A L A W A R E N E S S : D ATA & O P P O R T U N I T I E S F O R T H E F U T U R E
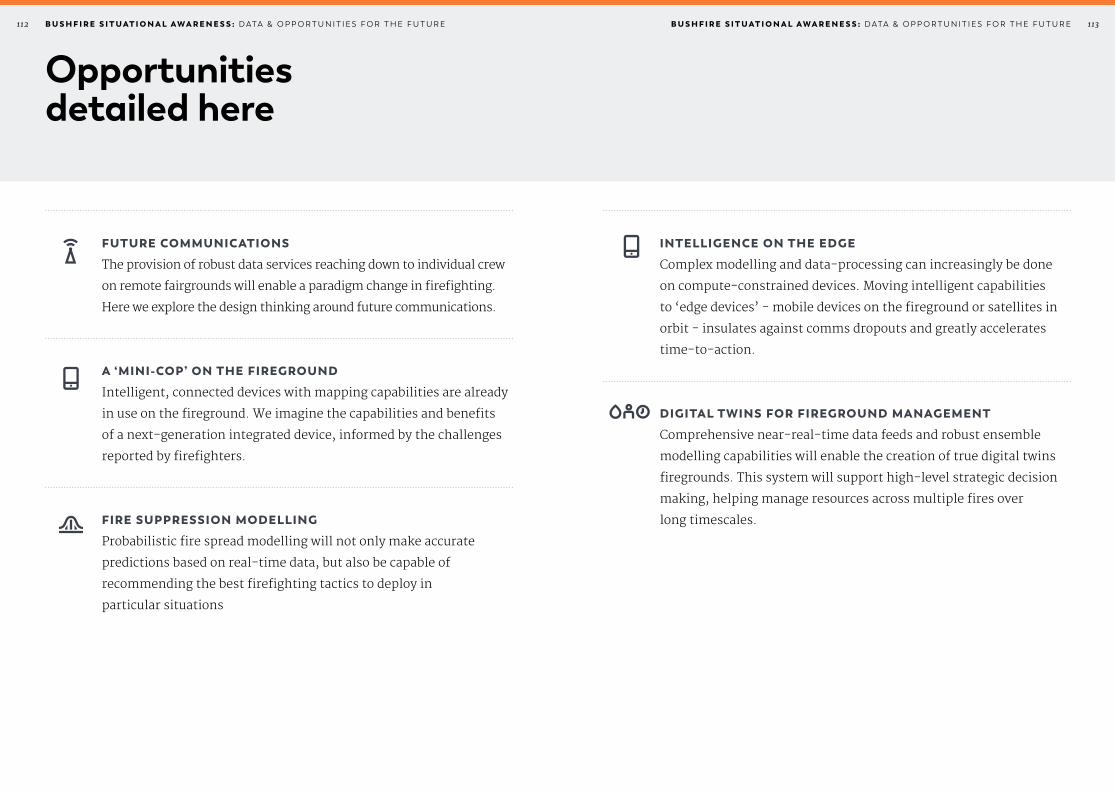
Opportunities detailed here
FUTURE COMMUNICATIONS
The provision of robust data services reaching down to individual crew
on remote fairgrounds will enable a paradigm change in firefighting.
Here we explore the design thinking around future communications.
A ‘MINI-COP’ ON THE FIREGROUND
Intelligent, connected devices with mapping capabilities are already
in use on the fireground. We imagine the capabilities and benefits
of a next-generation integrated device, informed by the challenges
reported by firefighters.
FIRE SUPPRESSION MODELLING
Probabilistic fire spread modelling will not only make accurate
predictions based on real-time data, but also be capable of
recommending the best firefighting tactics to deploy in
particular situations
INTELLIGENCE ON THE EDGE
Complex modelling and data-processing can increasingly be done
on compute-constrained devices. Moving intelligent capabilities
to ‘edge devices’ - mobile devices on the fireground or satellites in
orbit - insulates against comms dropouts and greatly accelerates
time-to-action.
DIGITAL TWINS FOR FIREGROUND MANAGEMENT
Comprehensive near-real-time data feeds and robust ensemble
modelling capabilities will enable the creation of true digital twins
firegrounds. This system will support high-level strategic decision
making, helping manage resources across multiple fires over
long timescales.
112 113B U S H F I R E S I T U AT I O N A L A W A R E N E S S : D ATA & O P P O R T U N I T I E S F O R T H E F U T U R E B U S H F I R E S I T U AT I O N A L A W A R E N E S S : D ATA & O P P O R T U N I T I E S F O R T H E F U T U R E

The need to ensure a seamless flow of information between management levels spanning operational firefighters and the IMT undoubtedly remains as prevalent today as it will be tomorrow.
The communication systems that are
currently in use are predominantly based
on single network, standalone voice comms
systems with limited ability to distribute
data dynamically, this technology is rapidly
becoming outdated and is subject to significant
bandwidth and coverage restrictions.
These limitations collectively restrict the
effectiveness and efficiency of current systems
and therefore present a critical risk to the lives
and safety of the firefighting community.
The rapid development of high-speed
wireless communications networks ensures
that the future firefighting architecture
has the potential to integrate and exploit
a range of highly capable technologies
that have previously existed as standalone
entities. These developments present the
opportunity to deliver a range of benefits
that could significantly enhance the speed
and effectiveness of current processes whilst
also greatly increasing resilience in the
communications layer, and therefore the
safety afforded to those who are placed in
harms way.
A future communications architecture that
can deliver these benefits will require a
range of core attributes: Capacity, Coverage,
Concurrency, Control, Availability,
Resilience, Mobility, Interoperability and
Security (C4ARMIS).
CapacitySignificant order of magnitude increases
in the useable bandwidth available across
user networks is required to allow rapid
distribution of data (both static and real
time) between firefighters and the IMT.
CoverageAccess to the network across all geographic
areas of operation is needed. Current and
legacy solutions are prone to ‘black spots,
i.e. intermittent areas of connectivity due to
physical obstacles and working outside of the
range of network access points.
O P P O RT U N I T Y
Future Communications
Break down cultural communications
barriers by regularly sharing staff
between organisations, outside of the
stressful fire seasons.
ConcurrencyAn expectation for an increased number
of users on the network implies a need for
a proportional increase in the concurrent
number of active network connections.
ControlEnhanced network capability inherently
gives rise to greater network complexity
which could offer management trade-offs
depending upon the needs of the operational
situation at a given time. I.e. the coverage
spot beam of a SATCOM network could be
traded for bandwidth in the event that users
are operating within a smaller footprint. The
extent to which end users wish to actively
manage the network must be considered.
AvailabilityThe seasonal nature of bushfire activity could
give rise to a network architecture that has
variable performance attributes throughout
the year. A higher likelihood of requiring
greater bandwidth during the bushfire
season could present an opportunity to tailor
network access with suppliers accordingly.
ResilienceOverarching network resilience can be
considered to be a product of:
a. Redundancy. The number of discrete
links available in the event that primary
bearers fail
b. Reliability. The likelihood of a single
link failing and the need for redundant
links to be employed.
c. Robustness. The effective power or
signal strength above the noise floor
utilized in wireless signal transmission.
Greater transmission power increases the
ability to communicate in environments
where the network could be degraded due
to electromagnetic interference.
d. Reconstitution. The ability to actively
switch between network links in the event
that bearers fail due to poor reliability
attributed to poor robustness.
MobilityDifferent wireless network access
technologies; i.e. 5G, SATCOM have variable
thresholds for network connectivity to be
maintained whilst a user is mobile. The
extent to which users require on the move
connectivity will influence network design
and the employment and integration of land
and space-based networks.
InteroperabilityEmployment of open protocols to maximize
user interoperability between firefighting
communities which may otherwise be
separated by differing technologies
and standards. This will also provide a
foundation for future system coherence and
expansion through providing a growth path
for network scalability.
SecurityThe extent to which access to the network
is protected must be considered in order
to prevent network distribution and data
breaches which may be caused either
deliberately or accidentally.
114 115B U S H F I R E S I T U AT I O N A L A W A R E N E S S : D ATA & O P P O R T U N I T I E S F O R T H E F U T U R E B U S H F I R E S I T U AT I O N A L A W A R E N E S S : D ATA & O P P O R T U N I T I E S F O R T H E F U T U R E

AIR AND SPACE DOMAINSatellite Communications (SATCOM)SATCOM technology has developed
significantly over the past decade and is
expected to continue to grow at pace in order
to meet the predicted demand for broadband
network connectivity across the globe, both
in established and remote locations.
Strong industrial competition between
SATCOM service providers has ensured that
network performance has increased at pace
whilst the cost/bit has reduced dramatically
owing to strong market demand and
decreasing satellite launch costs. A range
of service providers exist to meet market
demand, these include established service
providers, operators and manufacturers
such as ViaSat, IntelSat, EutelSat, Avanti and
Airbus and also includes new entrants to the
market such as Starlink and OneWeb.
High Altitude Pseudo Satellites (HAPS)Whereas conventional SATCOM systems
operate in space, the opportunity to
employ lower cost alternatives pseudo
satellites employing high altitude
balloons or unmanned drones as
airborne communications nodes is being
explored across industry and a number
of governments. HAPS broadly operate
between 20,000ft and the stratopause
(~50Km) and can establish high bandwidth
spot beams over an area of operations
to act as either a primary or secondary
network to augment user traffic needs
alongside conventional SATCOM systems.
Whilst still in comparatively early stages
of development, programmes such as the
Airbus Zephyr initiative are underway to
support the development of this technology.
The implementation of a future communications architecture that is capable of meeting the needs of the firefighting community is achievable through adopting and integrating a range of existing technologies that are already in use across Space, Air and Ground domains.
E N A B L I N G T E C H N O L O G I E SGROUND DOMAINTerrestrial NetworksThe ability to rely upon conventional
terrestrial telecoms networks that offer 3g
– 5g performance is greatly dependent upon
availability in the area of operations. Whilst
investment in satellite-based solutions
can reduce the reliance on conventional
telecoms, the low cost of cell phones ensures
that they offer a cost effective backup or
complementary solution in the event that
access to a satellite network is degraded.
Portable 4G / GRN RepeatersGround Radio Network Repeaters enable
ad-hoc hot-spots to be established,
enabling point-to-point communications
between users operating either in the same
coverage area or through utilizing terrestrial
networks to link separate user bubbles that
are geographically separated. Repeaters
are available in a range of sizes and
configurations offering wide area coverage in
open areas (~1 km radius) and/or the ability
to ‘bread crumb’ repeaters in confined areas;
i.e. caves and valleys.
Key PointData communications must be robust
and systems designed to rely on data
should degrade gracefully. Different
technology is likely appropriate for
different regions, but modules or
system components should be agnostic
to which technology is in use (self-
governing). Security and cost also a
concern at all levels.
116 117B U S H F I R E S I T U AT I O N A L A W A R E N E S S : D ATA & O P P O R T U N I T I E S F O R T H E F U T U R E B U S H F I R E S I T U AT I O N A L A W A R E N E S S : D ATA & O P P O R T U N I T I E S F O R T H E F U T U R E

GROUND DOMAIN
USER NETWORK
FIREGROUND IMT
AIR/SPACE DOMAIN
HIGH ALTITUDE PSEUDO SATELLITES (HAPS). The use of high altitude balloons or unmanned drones as airborne communications nodes can create the ability to establish areas of high throughput, assured network coverage at short notice.
HIGH THROUGHPUT SATELLITES (HTS) (SATCOM OVERLAY)A new generation of LEO satellite constellations providing end user data throughput in the region of hundreds of Mb/s up/down link speeds are under development by companies such as OneWeb and Starlink. Network access is provided via a subscription service that is expected to be extremely low cost in comparison to conventional legacy SATCOM service providers
TERRESTRIAL WIDE AREA NETWORK
SATCOM/HAPS GROUND STATIONS
As the cost of access to space reduces the opportunity to utilise both the air and space domain as an operating environment for communications nodes within a network grows. HTS and HAPS represent two major capabilities that offer cost effective,
resilient, high performance network connectivity between fixed and remote users.
Comms layer network interconnectivity between fire crews operating remotely of the IMT is achieved via the terrestrial internet and assured connectivity delivered as an end to end service by SATCOM/HAPS providers. Fire crews operating in
remote locations would reach back to the IMT via a vehicle mounted antenna incorporated into the fire truck.
HAPSSubscription service to HTS provider delivering enhanced voice services and significant uplift in data sharing capabilities
DIRECT USERUsers operating outside of range of the fire truck hotspot would connect to the network directly either via HAPS or HTS bearers depending upon coverage, network availability and mobile handset functionality.
HOTSPOT USERFire trucks would provide a local wireless hotspot allowing a crews within range to communicate with one another and send and receive data to and from the IMT via the HTS link .
Network connectivity between the IMT and terrestrial WAN is achieved via standard commercial internet bearers. If this are not available the IMT would be equipped with a dedicated HTS/HAPS terminal and Local Area Network (LAN).
WAN
C O N C E P T U A L F U T U R E C O M M S A R C H I T E C T U R EThe Future Bushfire Communications Architecture integrates a range of low-cost network bearers to achieve throughput performance that is orders of magnitude beyond current capabilities with unprecedented levels of end to end resilience.
118 119B U S H F I R E S I T U AT I O N A L A W A R E N E S S : D ATA & O P P O R T U N I T I E S F O R T H E F U T U R E B U S H F I R E S I T U AT I O N A L A W A R E N E S S : D ATA & O P P O R T U N I T I E S F O R T H E F U T U R E

Through the contribution provided by the participants of the Concurrent Design Workshop, it has been possible to clearly document how today’s processes and practices of fighting bushfires are shaped by the availability of information that is exchanged between fire crews and the IMT.
The ability of fire fighters and the IMT to
combat bushfires today is deemed to be
greatly restricted by a reliance on outdated
and legacy stove piped technologies which
offer limited information flow and prevent
accurate, timely and informed decision
making. These inefficiencies present a
critical and unnecessary risk to the lives of
communities affected by bushfires and to
the lives of those people who work to combat
them.
The overall efficiency of the user processes
that are underpinned by this information
exchange is greatly determined by the
available functionality of the supporting
technology. Whilst today’s heavy reliance
on voice comms systems (either stand-
alone radio or mobile phones) and static
mapping technologies provides a basic form
of direct communication and situational
awareness between users, these systems are
not equipped to enable future technologies
which could greatly enhance the information
flow through providing high fidelity,
resilient, real time communications systems
to enable advanced decision support tools.
Future development and investment in tool
sets and underpinning technologies used to
counter bushfires must seek to achieve the
maximum possible benefit for a given level
of investment. The relationship between a
level of financial outlay in future systems
and the benefits delivered to the fire fighting
community is complex, in order to begin to
bound this relationship a series of high-level
future concept architectures are proposed
with a preliminary assessment of the relative
value of each. In this context ‘Value’ is
defined as the cost of realizing a benefit
and hence the cost benefit matrix seeks to
consider which concept could deliver the
greatest relative benefit for lowest possible
cost.
Fireground Intelligence Communications Concepts
The Communications Concepts that have been considered are:
1. Enhanced Current State (Voice Only) A basic uplift of current voice systems to offer a marginal benefit against current ways of
working, i.e. greater coverage and network availability.
2. Enhanced Integrated Data (Voice and Data)An uplift of voice and data systems enabled by advanced performance low-cost satellite
and terrestrial networks. This would offer significant improvements in the availability and
reliability of voice and data products.
3. Augmented and Enhanced Integrated DataA further development of Concept 2 incorporating added air and ground repeater nodes (i.e.
HAPS) to further enhance network resilience.
4. Sole Source National PlatformA further development of Concept 3 incorporating a bespoke sovereign disaster/fire fighting
capability; i.e. dedicated SATCOM network, incorporating Augmented and Enhanced
Integrated Data.
VALUE: Cost vs. Benefits Matrix
BE
NE
FIT
S
COST
OP
TIM
AL
MIN
IMA
LEXCEPTIONALMARGINAL
1
2
34
120 121B U S H F I R E S I T U AT I O N A L A W A R E N E S S : D ATA & O P P O R T U N I T I E S F O R T H E F U T U R E B U S H F I R E S I T U AT I O N A L A W A R E N E S S : D ATA & O P P O R T U N I T I E S F O R T H E F U T U R E

Small scale subscription uplift to commercial satcoms services, including provision of personal devices that connect with the latest generation of satellite network service providers (e.g., Inmarsat, Viasat). Effectively a better stand-alone radio.
PROS• High performance voice coverage,
enhanced reliability.
• Relatively cheap compared to roll-your-
own solutions (e.g., big government
projects).
CONS• Limited ability to integrate with other
fireground devices, or to act as a network
hub.
• Proprietary standards.
• Inability to intelligently exploit the
network to compensate for issues
(e.g., by forming a local mesh).
GROUND DOMAIN
USER NETWORK
AIR/SPACE DOMAIN
SATCOMEnhanced satellite subscription package delivering increasedvoice coverage and reliability over current capabilities
CREW IMTDIVCOM
WANSATCOMGROUND STATION
ENABLING TECHNOLOGIES
U S E R N E E D S
Data Fusion
App
s/in
terf
ace Netw
ork
C2
Information Flow
Decisio
n Su
ppor
t
CO M M S CO N C E P T 1
Enhanced Current State (Voice Only)
GROUND DOMAIN
USER NETWORK
AIR/SPACE DOMAIN
SATCOMEnhanced satellite subscription package delivering increasedvoice coverage and reliability over current capabilities
CREW IMTDIVCOM
WANSATCOMGROUND STATION
ENABLING TECHNOLOGIES
U S E R N E E D S
Data Fusion
App
s/in
terf
ace Netw
ork
C2Information Flow
Decisio
n Su
ppor
t
Apps / Interface: No enhancements
Data Fusion: No enhancements
Network: Enhanced voice-comms, no
enhancement on data comms.
C2: Enhanced verbal intent and instructions.
No enhancement of visual data richness.
Information Flow: Limited by direct voice. No enhanced
meta-data.
Decision Support: No enhancement of situational
awareness (e.g., with mapping etc.)
IMPACT ON ENABLING TECHNOLOGIES
IMPACT ON USER NEEDS
122 123B U S H F I R E S I T U AT I O N A L A W A R E N E S S : D ATA & O P P O R T U N I T I E S F O R T H E F U T U R E B U S H F I R E S I T U AT I O N A L A W A R E N E S S : D ATA & O P P O R T U N I T I E S F O R T H E F U T U R E

GROUND DOMAIN
USER NETWORK
AIR/SPACE DOMAIN
SATCOMSubscription service to HTS provider delivering enhanced voice services and significant uplift in data sharing capabilities
CREW IMTDIVCOM
WANSATCOMGROUND STATION
ENABLING TECHNOLOGIES
U S E R N E E D S
Data Fusion
App
s/in
terf
ace Netw
ork
C2
Information Flow
Decisio
n Su
ppor
t
Subscription to high throughput commercial satcoms services (HTS), integrating personal radios and data hubs/uplinks (e.g., Starlink, OneWeb, Viasat).
PROSAs per Concept 1, plus the following:
• High throughput data service (●100 MB/s).
• Significantly enhanced network resilience
and availability (especially when accessing
satellite constellations, compared to
monolithic satellites).
• Accessing and maintaining continuous
connectivity.
• Devices that can act as local wireless data
routing hubs.
• More expensive than Concept 1, but greater
value delivered to end-users;
i.e. greater benefit for comparative costs
(mid-range cost).
• Scalable to higher bandwidth with little
investment.
CONS• Cost - more expensive than Concept 1.
• May need to supplement with local
networks for last mile (depends on whether
crews have satellite handsets as nodes).
• Proprietary standards and interoperability
may be a concern.
CO M M S CO N C E P T 2
Enhanced Integrated Data (Voice and Data)
GROUND DOMAIN
USER NETWORK
AIR/SPACE DOMAIN
SATCOMSubscription service to HTS provider delivering enhanced voice services and significant uplift in data sharing capabilities
CREW IMTDIVCOM
WANSATCOMGROUND STATION
ENABLING TECHNOLOGIES
U S E R N E E D S
Data Fusion
App
s/in
terf
ace Netw
ork
C2Information Flow
Decisio
n Su
ppor
t
Apps / Interface: Enables local common operating picture
(enhanced, near-real-time dynamic
mapping).
Data Fusion: Enhanced flow up/down to IMT and big
data providers (mapping, prediction).
Network: Enhanced voice, maps and meta-data to
and from fireground.
C2: Ability to define and direct tasks and
monitor progress in real time.
Information Flow: Enhanced geospatial data from IMT,
ground-truth data from firefighters.
Decision Support: IMT ingesting real-time information
on deployment, status, conditions and
supplies. Processed at IMT (limited
autonomy on fireground because of lack
of sideways communications).
IMPACT ON ENABLING TECHNOLOGIES
IMPACT ON USER NEEDS
124 125B U S H F I R E S I T U AT I O N A L A W A R E N E S S : D ATA & O P P O R T U N I T I E S F O R T H E F U T U R E B U S H F I R E S I T U AT I O N A L A W A R E N E S S : D ATA & O P P O R T U N I T I E S F O R T H E F U T U R E

GROUND DOMAIN
USER NETWORK
AIR/SPACE DOMAIN
SATCOMSubscription service to HTS provider delivering enhanced voice services and significant uplift in data sharing capabilities
HAPSSubscription service to HTS provider delivering enhanced voice services and significant uplift in data sharing capabilities
IMT
DIVCOM
CREW
CREW
WANSATCOM / HAPSGROUND STATION
PORTABLE REPEATERS (VEHICLE/MANPACK)
ENABLING TECHNOLOGIES
U S E R N E E D S
Data Fusion
App
s/in
terf
ace Netw
ork
C2
Information Flow
Decisio
n Su
ppor
t
Satellite communication network, further enhanced by local repeaters. These may include a high altitude pseudo-satellites (HAPS) platforms, for example drones or balloons, and/or vehicle-mounted or backpack repeaters.
PROSSame as Concept 2, plus the following:
• Higher degree of local network control.
• Greater robustness to satellite network
issues; (although unlikely).
• Enhanced coverage in difficult terrain
(e.g., canyons such as in parts of the Great
Dividing Range in NSW).
• Mitigates against possible atmospheric
interference and issues due to solar activity.
CONS• Increased up-front costs.
• Considerable cost associated with
maintenance, training, deployment,
software and general support costs.
CO M M S CO N C E P T 3
Augmented and Enhanced Integrated Data
GROUND DOMAIN
USER NETWORK
AIR/SPACE DOMAIN
SATCOMSubscription service to HTS provider delivering enhanced voice services and significant uplift in data sharing capabilities
HAPSSubscription service to HTS provider delivering enhanced voice services and significant uplift in data sharing capabilities
IMT
DIVCOM
CREW
CREW
WANSATCOM / HAPSGROUND STATION
PORTABLE REPEATERS (VEHICLE/MANPACK)
ENABLING TECHNOLOGIES
U S E R N E E D S
Data Fusion
App
s/in
terf
ace Netw
ork
C2Information Flow
Decisio
n Su
ppor
t
Apps / Interface: Enables local common operating picture
(enhanced, near-real-time dynamic
mapping).
Data Fusion: Enhanced flow up/down to IMT and big
data providers (mapping, prediction).
Network: Enhanced voice, maps and meta-data to
and from fireground.
C2: Ability to define and direct tasks and
monitor progress in real time
Information Flow: Enhanced geospatial data from IMT,
ground-truth data from firefighters.
Decision Support: IMT ingesting real-time information
on deployment, status, conditions and
supplies. Processed at IMT (enhanced
autonomy on fireground due to increased
sideways communications).
IMPACT ON ENABLING TECHNOLOGIES
IMPACT ON USER NEEDS
126 127B U S H F I R E S I T U AT I O N A L A W A R E N E S S : D ATA & O P P O R T U N I T I E S F O R T H E F U T U R E B U S H F I R E S I T U AT I O N A L A W A R E N E S S : D ATA & O P P O R T U N I T I E S F O R T H E F U T U R E

GROUND DOMAIN
USER NETWORK
AIR/SPACE DOMAIN
SATCOMSovereign capability delivering assured enhanced voice services in data sharing capabilities
HAPSSubscription service to HTS provider delivering enhanced voice services and significant uplift in data sharing capabilities
IMT
DIVCOM
CREW
CREW
WANSATCOM / HAPSGROUND STATION
PORTABLE REPEATERS (VEHICLE/MANPACK)
ENABLING TECHNOLOGIES
U S E R N E E D S
Data Fusion
App
s/in
terf
ace Netw
ork
C2
Information Flow
Decisio
n Su
ppor
t
Sole sourced or substantial share in a dedicated purpose built satcom system, owned and operated by the Australian Government.
PROSSame as Concept 2 - 3, plus the following:
• Sovereignty: High security for sensitive
data.
• Optimal assurance of security.
• Significant benefits for up-skilling the
Australian workforce via training and
experience.
• In-house skills and future capabilities for
R&D (May be worth a separate paragraph).
CONS• Significantly higher costs.
• Marginal increase in immediate benefit.
• May be less performant.
CO M M S CO N C E P T 4
Sole Source National Platform
GROUND DOMAIN
USER NETWORK
AIR/SPACE DOMAIN
SATCOMSovereign capability delivering assured enhanced voice services in data sharing capabilities
HAPSSubscription service to HTS provider delivering enhanced voice services and significant uplift in data sharing capabilities
IMT
DIVCOM
CREW
CREW
WANSATCOM / HAPSGROUND STATION
PORTABLE REPEATERS (VEHICLE/MANPACK)
ENABLING TECHNOLOGIES
U S E R N E E D S
Data Fusion
App
s/in
terf
ace Netw
ork
C2Information Flow
Decisio
n Su
ppor
t
Apps / Interface: Enables local common operating picture
(enhanced, near-real-time dynamic
mapping).
Data Fusion: Enhanced flow up/down to IMT and big
data providers (mapping, prediction).
Network: Enhanced voice, maps and meta-data to
and from fireground.
C2: Ability to define and direct tasks and
monitor progress in real time
Information Flow: Enhanced geospatial data from IMT,
ground-truth data from firefighters.
Decision Support: IMT ingesting real-time information
on deployment, status, conditions and
supplies. Processed at IMT (enhanced
autonomy on fireground due to increased
sideways communications).
IMPACT ON ENABLING TECHNOLOGIES
IMPACT ON USER NEEDS
128 129B U S H F I R E S I T U AT I O N A L A W A R E N E S S : D ATA & O P P O R T U N I T I E S F O R T H E F U T U R E B U S H F I R E S I T U AT I O N A L A W A R E N E S S : D ATA & O P P O R T U N I T I E S F O R T H E F U T U R E

Situational awareness on the fireground at the crew level is supported primarily by the incident action plan (IAP) and a ad-hoc mix of mobile applications running on personal devices (apps commonly in use are listed in the Appendix).
Annotating changes on the fireground can
be cumbersome and sharing these updates
is difficult because of technological and
operational barriers. Paper maps can be
drawn on and shared during handover at the
staging ground at end of shift, and apps like
Avenza and FireMapper support sharing of
digital annotations via sharing of KML files.
While these systems work well, there is
huge benefit to be gained from much closer
integration and automation.
We propose a fully integrated digital
mapping system should be available to each
crew and appliance operator. This would
be equivalent to the Common Operating
Procedure (COP) system at the IMT, but with
a simplified user interface - a Mini-COP.
Only essential information would be exposed
by default, with detailed (or ancillary)
information available via a ‘drill down’
interface.
Ideally, the Mini-COP would be fully
connected to other devices via a robust
communication network. Changes made
on an individual device would propagate
instantly to other devices on the fireground
and to the IMT, and beyond.
O P P O RT U N I T Y
The Future ‘Mini-COP’For Fireground Use
Photo Credit: Gary Hooker, ACT RFS.
130 131B U S H F I R E S I T U AT I O N A L A W A R E N E S S : D ATA & O P P O R T U N I T I E S F O R T H E F U T U R E B U S H F I R E S I T U AT I O N A L A W A R E N E S S : D ATA & O P P O R T U N I T I E S F O R T H E F U T U R E

Pre-emptive and automatic updates
Automated fireground weather measurements
T H E F U T U R E ‘ M I N I - C O P ’F O R F I R E G R O U N D U S E
Personal beacons / locatorsRestricted permissions to view and user-
controlled with a physical on/off switch.
Digital T-CardsDrill-down information on personnel
and equipment next-of-kin, contact
information, skills, medical notes,
qualifications & training (restricted access).
T-Card system also manages assignment of
crews, like BART system.
Route and access marking, ad-hoc one-way systems for fireground vehicles.
Editable Standard annotations(e.g., control lines, fire boundary, spot-
fires, fire spread predictions, staging areas,
resources).
Base Mapping LayersTopo, Fuel Moisture, hydrology,
Fuel Load, 4G / Radio Coverage
Protected Mapping Layers: Critical Assets & Utilities
Electricity, water, communications
and military infrastructure;
cultural sites. (Privacy issues).
Fast updates (< 1 hr)
Annotations and local weather information
Vehicle Tasking and StatusIf vehicles are flagged for your sector or
incident and estimated time of arrival.
Map zooms to multiple scalesAbility to zoom to different scales
is essential and game-changing.
Detail is often obscured by symbols.
Auto vehicle location with breadcrumb trailto indicate access. Sync to other local
devices.
Annotations as queriese.g., crew marks tentative helicopter
landing site to be confirmed by pilot or other
authority.
Distributed StorageRedundant online data store
(local cache to protect against comms drop)
Dynamic mapping layersFire spread prediction, smoke prediction,
weather forecast, Hydrology masks with
status (suitable, unknown …), access routes
132 133B U S H F I R E S I T U AT I O N A L A W A R E N E S S : D ATA & O P P O R T U N I T I E S F O R T H E F U T U R E B U S H F I R E S I T U AT I O N A L A W A R E N E S S : D ATA & O P P O R T U N I T I E S F O R T H E F U T U R E

T H E F U T U R E ‘ M I N I - C O P ’F O R F I R E G R O U N D U S E
Hydrology & waterWater sources marked with occupancy,
availability, pollution (suitable/unsuitable
for dipping), access routes + locations of
hydrants, standpipes, tanks. Depth estimates.
Weather Monitor PointsSet smart monitor points on weather information: “Warn me if the
wind changes to southerly at this location”. This type of warning
can let personnel know to leave before being overrun by a firefront.
Dropped pins, annotations and notesEnter notes and attach photos, mark assets,
dangerous trees, record damage to property,
flag repair necessary.
Estimate how much water taken for
replenishment. Mark a possible water source
and access routes. Mark safe retreat spaces
along route. Mark route constraints (wash-
away, one-way travel, no-turning circle).
Occupancy of house and intentions of
residents (evacuate, stay to fight fire).
General note-taking functionThat allows embedding of images, video and
map cutouts. Pages would be immutable after
creation, and date-stamped for auditing.
Automatic backup to server
Annotated staging area mapInset map of staging areas showing locations
of resources and services.
Reports on small firesThere can be 400 fires in one day, but most do
not transition to using an IMT. Could automate
or flag how long to completion, freeing up
resources for use elsewhere.
Public Warning SystemMonitor public warning system for locally
relevant information.
OTHER FEATURES:
Tasking from IMT and DivComGraphical/mapping tasking tool. DivCom can
allocate sectors to trucks. First responders
should have permission to do this for
trucks arriving at small fires (designated as
leadership).
Mark areas to be burnt, roads to be closed etc.
User can confirm tasks and set status. How has
work progressed? IMT can receive updates.
Device Reports status of crews (like current
MDT), but add a confirmation of receipts and
status (like WhatsApp ticks).
PermissionsUsers at crew, sector and division level would
have different default permissions for viewing
and editing. However, these could be changed
by leadership.
Selected annotations default to ‘Crew Chief’
‘Sector’ and ‘Division’ level - hidden by default
unless requested/turned on (this show level is
separate to permissions).
Context CameraGeo-tagged photos with orientation for
deprojection
Manual Weather Report FormInformation flows up to IMT and modelling
team
134 135B U S H F I R E S I T U AT I O N A L A W A R E N E S S : D ATA & O P P O R T U N I T I E S F O R T H E F U T U R E B U S H F I R E S I T U AT I O N A L A W A R E N E S S : D ATA & O P P O R T U N I T I E S F O R T H E F U T U R E

K E Y D E S I G N P R I N C I P L E S : D E G R A D E G R A C E F U L LY A N D P R E S E N T O N LY N E E D E D I N F O R M AT I O N
The ideal ‘Mini-COP’ fireground mapping tool would be fully integrated into operations and would operate with several principles in mind:
• Minimal mapping display should be the default view
- ‘Profiles’ for different user roles
- Only relevant data is given to specific users.
• Defend against role-creep and ‘firefighting by data’.
• Resilience built in - failures should not disable core functionality due to simplicity and
redundancy.
- Lightweight needs for core functionality
• Aggregated data
- Simple output, but complexity available as drill-down request.
IDEA - RESIDENTIAL BEACON:
A simple rotary-dial device, or app, for registering residents who are staying to defend their properties. Advanced versions might have:
• Ability to assign assets a protection priority order that would transmit to Mini-COP.
• Register own plant and firefighting plans.
EVACUATED
PREPARING TO LEAVE
ELSEWHERE ON SITE
STAYING TO DEFEND
B E N E F I T:E A S I E R , M O R E R E L I A B L E H A N D O V E R
The core goal of the Mini-COP and surrounding systems is to facilitate the flow in information horizontally around the fireground and vertically to-and-from the IMT. The systems should aim to do the bulk of this work automatically, without adding significantly to the workload of the ground-crew.
One major advantage of the Mini-COP is
to significantly improve the experience of
information handover and shift change on
the fireground. Shift change is where most
information is exchanged between crews,
sector and division commanders ,and the
IMT. Managers should be able to interrogate
the reasons decisions were made and adjust
plans to support residents staying to fight
the fire, or who are evacuating in a particular
direction.
For crews de-briefing, reflections by crew
and commanders on how the efforts went
should be based in evidence and data.
An integrated Mini-COP system linked
to a data archive would make analysis of
firefighting strategy easier, and be a treasure
trove of information fueling future research.
Finally, insurance companies and claimants
could access a validated account of the fire
progression, backed by significant evidence.
Power and batteriesThe ability to recharge devices is a
significant concern in a campaign fire.
This is partially solved if the staging
area is near a town, however, the in
an extreme fire the infrastructure of
towns may be overrun and may not be
relied on.
136 137B U S H F I R E S I T U AT I O N A L A W A R E N E S S : D ATA & O P P O R T U N I T I E S F O R T H E F U T U R E B U S H F I R E S I T U AT I O N A L A W A R E N E S S : D ATA & O P P O R T U N I T I E S F O R T H E F U T U R E

Retrospective analysis of firefighting performance is essential to improve future firefighting efforts. Fire agencies want to know What interventions were successful?, What safety issues occurred and why? and How can we improve our efforts next time?
Fireground staff currently record and report
their actions, and this information is collated
by the sector and division commanders.
Some time after the fire, a whole-of-fire
report is compiled emphasizing:
• conditions faced and the evolution of the
fire;
• work done and interventions made, and;
• the outcomes from those interventions.
This information is often recorded in ways
that cannot be communicated easily (e.g.,
in a handwritten notebook). Digitizing this
information close to the fireground and
automating the reporting would:
• Subtract from the workload of the ground
crew, allowing them to concentrate on
more important tasks.
• Homogenize the type of information
gathered and the standard of reporting.
• Facilitate the post fire analysis by making
the intervention-outcome information
accessible.
A large database of fire events could be better
interrogated for subtile patterns that would
not otherwise be obvious, with the intent of
improving future firefighting policy.
• Data archive should be build to be archived
and searchable for post-action review and
research.
B E N E F I T:A U TO M AT E D R E P O R T G E N E R AT I O N
EXISTING SYSTEMSIn the ATC RFS, the Mobile Data Terminal
(MDT) fulfills some of the roles of a Mini-
COP (basic maps and road navigation, crew
names, coarse real-time operational status).
However, current MTDs have relatively small
screens and are fixed to the centre-console
of the fire trucks, which severely limits their
usefulness.
Personal devices carried by individual
firefighters are used to access broadcast
mapping information, but not fireground-
collected information, which remains a real
gap. The table below presents some of the
more notable systems.
APPLICATION DESCRIPTION
Avenza Mapsavenzamaps.com
Map display application used to load or download GeoPDF
format topographic maps.
Features: GPS location; annotate with polygons, line and
symbols; import/export KML files, offline use supported.
FireMapperfirefront.com.au
Fireground Application (10 users)IMT application (enterprise licence))
Mapping application tailored for firefighting that supports
annotation and sharing.
Features: annotations and fire symbology, geotagged photos,
pins with notes, automated vehicle tracks, syncs to a central
server and with other users.
Zirkartazirkarta.com
Real-time map-based project management.
Features: Real-time map and annotation sharing across
the fireground and to the IMT. Browser based, but works in
offline mode with opportunistic connections.
Bushfires.iobushfire.io
Free web-based national fire and weather map.
Features: integrates official alerts and warnings (hotspots,
fire locations, road hazards), weather information, historic
burn areas.
Heroiqheroiq.io
Resource and personnel management application for iOS
devices.
Features: a virtual and connected ‘battleboard’ with digital
T-cards to track deployment of resources and people,
including fatigue and skills. Full search capability.
138 139B U S H F I R E S I T U AT I O N A L A W A R E N E S S : D ATA & O P P O R T U N I T I E S F O R T H E F U T U R E B U S H F I R E S I T U AT I O N A L A W A R E N E S S : D ATA & O P P O R T U N I T I E S F O R T H E F U T U R E

Currently, dedicated mapping teams work at the IMT level or above to generate predictions of how a fire will spread over the next 24 hours.
Such maps typically show isochrones
outlining the extent of the burnt area and the
firefront at set time intervals (see example
at right). The predictions are used to plan
firefighting actions and also to create fire
spread maps for public consumption.
Modern modelling tools, like CSIRO Spark,
have the ability to run collections of models
to interrogate (for example) the impact of
a fire igniting at alternative locations, or
see the effect of creating a fire break, or
the effect of dropping fire retardant at a
particular place.
However, this capability is manually driven
and during busy fire seasons the mapping
teams lack the capacity to model an
ensemble of scenarios including alternative
interventions to control active fires.
WHAT IF WE COULD BUILD A ‘SIRI’ FOR TACTICAL FIREFIGHTING?A fire suppression modelling system could
quickly and automatically model hundreds
of interventions, sampling parameter space
to determine the most effective firefighting
tactic.
• To be robust and effective it must:
• Be easy to use in a chaotic environment.
• Be tunable to optimise for different
outcomes.
• Understand the latest remote-sensing and
environmental data.
• Understand resources and interventions.
• Suggest and triage range of intervention
tactics.
• Be transparent in how it makes decisions.
• Be auditable after fire events.
O P P O RT U N I T Y
Fire Suppression Modelling
Spark is a next-generation fire simulation
platform that already integrates many
of the capabilities for fire suppression
modelling.
The system can automatically choose
appropriate empirical fire-spread models
to apply in particular situations and
can be controlled via a command line
interface, making it suitable for running
in batch mode on a server.
It is designed to be highly configurable
in support of new fire spread models
and data, and already includes advanced
physics-based models for firebrand
spread. It is also capable of modelling the
impact of a fire on the landscape (e.g., the
effect of radiant heat), and - critically -
running ensembles of models.
Rainbow-shaded isochrones for a simulated fire near Hobart, Tasmania, generated by the CSIRO Spark wildfire simulation toolkit. Credit: CSIRO Spark web page.
S PA R KA WILDFIRE SIMULATION TOOLKIT
The Minderoo Foundation is supporting a project to develop Spark
Operational - a version of Spark tailored for deployment with the fire
agencies. Ideally, this will be connected to real-time data feeds of
weather, fuel state and ingitions, and produce maps suitable for use
140 141B U S H F I R E S I T U AT I O N A L A W A R E N E S S : D ATA & O P P O R T U N I T I E S F O R T H E F U T U R E B U S H F I R E S I T U AT I O N A L A W A R E N E S S : D ATA & O P P O R T U N I T I E S F O R T H E F U T U R E

AUDIT REPORT• Dispersion of scenarios• Outlier scenarios• PCA analysis of input and outputs (which inputs were most important and what outputs were most affected?).
SATELLITE IMAGES
FUEL STATE MAPS
IGNITIONS
GROUND TRUTH MEASUREMENTS
FIREFIGHTING RESOURCES
WEATHER PREDICTIONS
PRIORITISEDFIREFIGHTING
STRATEGIES
TOPOLOGY LAYERS
OPERATOR NEEDS• Critical threatened assets to prioritise• Cultural resources• Civilians remaining on properties to fight fires• Endangered environments• What to prioritise?
RESOURCE CARDS• Capability• Location
• Fuel capacity, or fatigue• Other constraints
FIRE SUPRESSION MODELLING SYSTEM
SC
EN
AR
IO G
EN
ER
AT
OR
LIV
E D
AT
A F
EE
D F
RO
M E
NH
AN
CE
D C
OP
(IN
ID
EA
L C
AS
E)
MODEL 1
MODEL 2
MODEL 3
MODEL 4
...
INTELLIGENTMODEL RANKER
EXPLAINABILITYENGINE
• Critical inflection points(e.g., when do actions become too late?)
• Resource timeline reports
• Deployment recommendations
• Alternative plans
Fire break before 2pm
2x crews mop-up
Time
Amou
nt
WaterFuel
H O W I T C O U L D W O R KWe imagine a tool that is available to the IMT and can make use of available real time feeds that inform the common operating picture. The system would use the best uncertainty estimates to generate a range of likely scenarios and possible solutions, before ranking and sorting. Explainability and auditing would be built into the heart of the system.
An interim system without real-time data access would still be incredibly useful as a decision support tool.
142 143B U S H F I R E S I T U AT I O N A L A W A R E N E S S : D ATA & O P P O R T U N I T I E S F O R T H E F U T U R E B U S H F I R E S I T U AT I O N A L A W A R E N E S S : D ATA & O P P O R T U N I T I E S F O R T H E F U T U R E

Up until recently, the advanced processing required to convert satellite data into practical maps would be done on supercomputers, or high-powered desktop computers.
Similarly, creating simulations with
sufficient complexity to describe the natural
world and sufficient fidelity to be useful
required hours, or even days. This is still
the case for the gold standard of detailed
hydrodynamic fire propagation models,
so that all practical tools are based on
approximate empirical relationships.
However, the recent advent of dedicated
machine learning processors (see box at
right) has opened up amazing opportunities
to change where and how advanced data
processing is done.
MOVING INTELLIGENCE ONTO THE FIREGROUNDThe processors on most modern mobile
phone and tables are more than capable
of rendering complex visualisations.
Firefighters in the field often make use of
situational awareness maps like the ones
from Zirkarta and bushfires.io at right.
When trained and validated correctly,
machine learning will be capable of
replicating the processor-intensive parts of
fire spread models (amongst others). Work
on planetary scale weather simulations has
already shown that hybrid physics-informed
ML can even deliver the best of both world:
the accuracy of detailed physical calculations
with the speed of accelerated neural
networks.
Machine learning modules may also enhance
field-based measurements, by analysing
visual scenes or calibrating complex data.
O P P O RT U N I T Y
Intelligence on the Edge
Cheap and highly parallelised tensor maths processors have made it possible to embed
capable neural networks on devices in power-constrained environments. Machine
learning on the ‘edge’ is making advanced processing possible on personal mobile
devices and on small satellites in Low Earth Orbit.
H O W I T C O U L D W O R K
Intel Movidius X NVIDIA Jetson TX2 Google Tensor Processor
Initial information & settings from IMT
No further connection required!
Local aerial measurements
Local moisture measurements
Local weather measurements
F I R E G R O U N D M O B I L E D E V I C E
Updating model with local measurements ...
Assessing fuel state ...
Detected tree hazard ...
144 145B U S H F I R E S I T U AT I O N A L A W A R E N E S S : D ATA & O P P O R T U N I T I E S F O R T H E F U T U R E B U S H F I R E S I T U AT I O N A L A W A R E N E S S : D ATA & O P P O R T U N I T I E S F O R T H E F U T U R E

MOVING INTELLIGENCE INTO ORBITHigh-resolution multispectral data cubes from bus-sized satellites like ESA’s Sentinel 2 can
take up to 48 hours to acquire and process. This is because the raw data are large (typically GB
in size) and take time to download, but also because the data require careful calibration onto a
physically intensity scale to enable meaningful comparisons with complementary data.
The WorldFloods Machine Learning Payload was
developed during Frontier Development Lab Europe
2019 and in June 2020 was launched aboard the D-Orbit
Wild Ride mission. It successfully demonstrated that a
ML system could routinely analyse large data in orbit
and return highly compressed flood-extent products.
Project Parters
TIME TODATA
48 H
O
URS
25% MAP PRODUCTION
4.2% DATA VERIFICATION
4.3% REQUEST HANDLING
66.6% SATELLITE OPERATIONS
MAP PRODUCTION
SENTINEL 2 IMAGE CUBE
13 BANDS
ML PAYLOADNEURAL NETWORK
VECTOR WATER MASK
EXAMPLE: THE WORLDFLOODS ML PAYLOAD IN-ORBIT DEMONSTRATOR
There is also a high overhead associated with satellite operations and availability of ground stations. Moving downstream data processing steps on-board satellites in Low Earth Orbit presents significant advantages:
• Calibrated data products can be created in orbit without waiting to download raw data.
• Some secondary data products are significantly smaller in size, especially for complex
instruments like multispectral cameras.
• Useful data products can often be encoded in sparse formats opening the possibility of
rapidly sending small data packets directly to the fireground from orbit - supporting fast
decisions..
• Analysis Ready Data (ARD) enables autonomous decision-making in orbit based
on physical thresholds. For example, the satellite could choose to task follow-up
observations, or trigger an alert.
H O W I T C O U L D W O R K
IMPACT &RECOVERY
FIRE SPREAD
FUEL STATE &FIRE RISK
IGNITIONS
MODELLING & SITUATIONAL AWARENESS
INTELLIGENT CONSTELLATION MANAGEMENT Processing load and data shared between satellites. Clusters of satellites autonomously decide how to acquire and buffer data, for optimised results.
ANALYSIS READY DATA Vector maps suitable for use on fireground created in-situ.
COMPRESSED DATA SENT DIRECTLY TO THE FIREGROUND.
TIP & CUE Events trigger enhanced monitoring by other satellites
146 147B U S H F I R E S I T U AT I O N A L A W A R E N E S S : D ATA & O P P O R T U N I T I E S F O R T H E F U T U R E B U S H F I R E S I T U AT I O N A L A W A R E N E S S : D ATA & O P P O R T U N I T I E S F O R T H E F U T U R E

The Australian Black Summer fires have been intrinsically linked to climate change (e.g., see Canadell et al. 2021, Nature Communications) and we can expect more ‘megafire years’ - and worse to come.
Managing the effort and resources to fight
such campaigns is a wicked problem that will
stretch the capabilities of all organisations
that help fight and prepare for bushfires.
However, individual technologies in this
report connected together as part of a
digital twin for fire management will greatly
increase our capabilities.
Most Australian states and territories
are implementing spatial digital twins to
visualise and query the built and natural
environments. For example, features in the
NSW Spatial Digital Twin are specifically
aimed at telecommunications providers to
help protect critical infrastructure during
bushfires and other disasters. However, the
opportunity in the future will be to integrate
near-real-time views of the fireground
alongside knowledge of available firefighting
resources.
We imagine intelligent tools that will be
capable of assessing the current situation
across many firegrounds and marshaling
predictive models to recommend where,
and when, to deploy resources in response
to quantified risk.
O P P O RT U N I T Y
Digital Twins for Bushfire Management
What is a Digital Twin?The term ‘digital twin’ originated in
the engineering world to describe
a computer-simulated copy of a
device, or system, that is updated
in near-real-time to reflect the real
world. They are used for operational
awareness and planning, to predict
future events, and to simulate the
effect of changes and interventions.
Photo Credit: Gary Hooker, ACT RFS.
148 149B U S H F I R E S I T U AT I O N A L A W A R E N E S S : D ATA & O P P O R T U N I T I E S F O R T H E F U T U R E B U S H F I R E S I T U AT I O N A L A W A R E N E S S : D ATA & O P P O R T U N I T I E S F O R T H E F U T U R E

AERIAL SENSOR PLATFORMS Real-time fire front tracking, burnt area measurements, wind & weather measurements, smoke & aerosol assessment, fuel load (via LIDAR), fuel moisture (multi-spec).
CENTRALISED PROCESSING NODESNational computing platforms (NCI, Pawsey ...)Cloud computing and data storage services (GCP, AWS ...)Institute clusters and desktop computers
LIVE DEPLOYMENT INFORMATION:Personnel + statusAppliances + statusConsumables + status
ON-DEVICE CAPABILITIESFire spread predictions,shared fireground annotations,weather forecast and warnings,personal status (help needed),tasks and confirmations.
SPATIAL DIGITAL TWIN CAPABILITIESThe bushfire digital twin will aggregate information from the fireground, remote-sensing feeds and static data layers. Predictive AI modelling tools will support decisions on directing resources days in advance.
MAP LAYERSUtilitiesCultural assetsTerrain InformationHydrologyAccess routesWeather forecastsFire risk forecastsFire prediction modelsReal time fire information
FIRE MODELLINGTemporal fire risk Fire spread predictionFuel & drying behaviourImpact of fire & recovery in advance.
TEMPORAL RESOURCE MODELLINGPersonnel availabilityCritical resource bottlenecks (fuel, water, accomodation, food, fatigue, skills & qualifications)
PERSONNEL MANAGEMENT APPAvailability & roster,Skills & qualifications.
FAR-FIELD COMMS4G networkGround Radio NetworkSatellite Comms
FIRE TRUCKSFireground weather station, processing node, comms node, sensor platform.
PERSONAL DEVICES:Processing node, weather measurements, map annotations & notes, camera feed, AI-driven scene analysis, wearable sensors.
RADIO FREQUENCY LIGHTNING DETECTOR NETWORK
AIR QUALITYSENSOR
SMOKE DETECTIONCAMERAFUEL
MOISTURE SENSOR
WEATHERSTATION
IN-ORBIT PROCESSINGSparse data prdics, direct to the fireground in real-time.
REMOTE-SENSING FEEDSatellite data products,fire hot spots, water locations & occupancy,fuel load & moisture content.
H O W I T C O U L D W O R K150 151B U S H F I R E S I T U AT I O N A L A W A R E N E S S : D ATA & O P P O R T U N I T I E S F O R T H E F U T U R E B U S H F I R E S I T U AT I O N A L A W A R E N E S S : D ATA & O P P O R T U N I T I E S F O R T H E F U T U R E

Digital twins are enormously valuable outside of fire season to support risk mitigation and resilience planning, and to manage and monitor recovery operations.
A system incorporating current vegetation-
type, land use and fuel state maps, combined
with fine-grained weather forecasts,
could be used to predict temporal fire risk
maps to support fuel removal. Windows
of opportunity for conducting prescribed
burns will be shorter in the future, and the
possibility of a burn escaping control lines
greater. An integrated digital twin will
include information on infrastructure and
environmental assets to support detailed risk
and impact assessment.
The success of recovery and rebuilding
efforts can also be assessed in a digital
twin. The obvious measurement is regrowth
of vegetation for the natural world ,and
reconstruction of buildings for the built
environment. However, a digital twin may
also encode economic recovery via dynamic
activity such as vehicular traffic, pedestrian
and bicycle motion, wifi hotspot activity and
many more digital footprints.
B E F O R E A N D A F T E R T H E F I R E S
Volunteer Management, Call-Up and AlertsThe ACT RFS uses the BART application (bartapp.com.au) to alert, manage and
communicate with volunteer firefighters. Volunteers can indicate availability,
receive alerts and information about incidents, and respond with status information.
Managers can view geospatial information on a dashboard.
However, volunteer availability is always a challenge and situational awareness relies
on volunteers updating their availability daily, which sometimes is difficult to do.
Similar systems are in use by the other state and territory fire agencies.
Photo Credit: Gary Hooker, ACT RFS.
152 153B U S H F I R E S I T U AT I O N A L A W A R E N E S S : D ATA & O P P O R T U N I T I E S F O R T H E F U T U R E B U S H F I R E S I T U AT I O N A L A W A R E N E S S : D ATA & O P P O R T U N I T I E S F O R T H E F U T U R E

Key ML Technology: Federated LearningTraditionally, machine learning models are trained on a centralised computer
connected to a large data storage system. Models learn slowly and so highly parallel
processors (e.g., graphics processing units - GPUs) are used to accelerate the training
process.
The federated learning concept decentralises this process by moving the training task
to ‘edge’ devices. Each mobile device trains a copy of the model on a small local dataset
and the results are transmitted to a central server for aggregation.
This has great benefits for security and privacy, because the central server never sees
the data, only the results of the training for each model instance. The focused updates
transmitted from each mobile devices are tiny can be uploaded opportunistically and
impose much less of a burden on communications networks.
The federated learning concept is ideal for deploying predictive models on the
Key Concept: Analysis Ready Data (ARD)Many promising data science and ML tools are hobbled by the relative availability
of analysis ready data. This means data that has well-characterised uncertainties,
few biases (or biases that are well-documented), is encoded in an open format (or
accessible via a validated tool), and has sufficient metadata on the context in which it
was acquired and where it might be suitable for use.
Key Concept: ML-Ops / Model-OpsMachine learning operations (ML-Ops) is the set of procedures and practices around
deploying ML models in the real world. Model efficacy tends to degrade over time
as real world situations differ from what the model expects. This means that the
performance of ML systems should be monitored and the models re-trained as
necessary. New software tools are emerging to support this work.
Key ML Technology: Active LearningMachine learning predictions are only as good as the data used to train them. However,
all datasets contain biases of one kind or another and usually represent a static
snapshot of the real world. To be truly robust and useful, machine learning models
must be continuously updated and tuned to reflect the conditions into which they are
deployed.
Active learning schemes attempt to correct for data and model drift - the performance
of ML models degrading over time. This often means re-training the model, but with a
greater emphasis on the most difficult data.
Key Concept: Human-in-the-Loop ValidationBoth data and algorithms that feed into any digital twin for disaster management must
have a human in the loop to validate their use. This includes validating that data is
internally consistent and fit for purpose, validating that the algorithm is suitable in
context and is stable in the expected parameter space, and that user-facing tools are
suitable for their intended audience.
Emerging concepts in intelligent systems
154 155B U S H F I R E S I T U AT I O N A L A W A R E N E S S : D ATA & O P P O R T U N I T I E S F O R T H E F U T U R E B U S H F I R E S I T U AT I O N A L A W A R E N E S S : D ATA & O P P O R T U N I T I E S F O R T H E F U T U R E

Roadmap to active cyber-infrastructure
INC
RE
AS
ING
IN
TE
GR
AT
ION
AN
D C
ON
FID
EN
CE
SHORT TERM (NEXT 12 MONTHS) MEDIUM TERM (2 YEARS)
ITERATIVE UNCERTAINTY REMOVAL, ACCURACY, SPEED-UP
AND EXPLAINABILITY
LONG TERM (3-5 YEARS)
PHASE (1) BASIC STRUCTURE PHASE (2) MAKE IT DYNAMIC PHASE (3) OPTIMIZED AND TRUSTED
ML-ENHANCED MEASUREMENTS
DOMAIN DATA ALIGNMENT IN
REAL-TIME
ML ANOMALY DETECTION
AND PROXIES
REAL-TIME SCENARIO
EXPLORATION
LOCAL FIREGROUND COMMS NODES AND
ACTIVE LEARNING
FIREGROUND SENSOR MODEL
CALIBRATION
ACCURATE REAL-TIME
PREDICTIONS
INTERPRETABILITY AND UNCERTAINTY
MITIGATION
IMPROVED SPATIO TEMPORAL
RESOLUTION / HYBRID OBSERVATION
PHYSICS-INFORMED ML MODELING
DIGITAL TWINOF SYSTEM
FEDERATED LEARNING
Getting to a trusted system will require a holistic perspective; complex
dynamic combinations of ML models, data gathering and users in the loop to
calibrate insights in real time.
156 157B U S H F I R E S I T U AT I O N A L A W A R E N E S S : D ATA & O P P O R T U N I T I E S F O R T H E F U T U R E B U S H F I R E S I T U AT I O N A L A W A R E N E S S : D ATA & O P P O R T U N I T I E S F O R T H E F U T U R E

T R I L L I U M A U S T R A L I A .T E C H
T E A M @T R I L L I U M .T E C H
Copyright © 2022 FDOKUMEN