kwazulu-natal situational overview - KZN Planning Commission
194
KWAZULU-NATAL SITUATIONAL OVERVIEW Kwazulu-Natal Provincial Growth and Development Strategy (PGDS) AUGUST 2011
-
Upload
khangminh22 -
Category
Documents
-
view
1 -
download
0
Transcript of kwazulu-natal situational overview - KZN Planning Commission

KWAZULU-NATAL
SITUATIONAL OVERVIEW
Kwazulu-Natal Provincial Growth
and Development Strategy (PGDS)
AUGUST 2011

Page 2 of 194
Table of Contents
1 INTRODUCTION ......................................................................................................................... 5
2 KWAZULU-NATAL IN THE SOUTH/SOUTHERN AFRICAN AND GLOBAL CONTEXT ..................... 7
3 THE PHYSICAL LANDSCAPE ...................................................................................................... 9
3.1 INTRODUCTION ................................................................................................................................ 9
3.2 TOPOGRAPHY................................................................................................................................ 10 3.2.1 Elevation ..................................................................................................................... 10
3.2.2 Slope ........................................................................................................................... 11
3.3 GEOMORPHOLOGY ....................................................................................................................... 12
3.4 SOILS............................................................................................................................................. 13 3.4.1 Soil Depth .................................................................................................................... 13
3.5 MINERAL RESOURCES ..................................................................................................................... 15
3.6 HYDROLOGY ................................................................................................................................. 17
3.6.1 Water Catchments .................................................................................................... 17
3.6.2 Rivers and Dams within KwaZulu-Natal ..................................................................... 19
3.6.3 Water Demand Management .................................................................................. 22
3.6.4 Vulnerability of Community due to Dependence on Open Water Sources .......... 23
3.7 VEGETATION AND LAND COVER ..................................................................................................... 24 3.7.1 Vegetation ................................................................................................................. 24
3.7.2 Forestry ........................................................................................................................ 26
3.7.3 Land Cover ................................................................................................................. 27
3.7.4 Agriculture, Agri-processing and Land Reform ....................................................... 29
3.8 CLIMATOLOGY .............................................................................................................................. 30
3.8.1 Precipitation ............................................................................................................... 30
3.8.2 Evaporation ................................................................................................................ 34
3.9 CLIMATE CHANGE ......................................................................................................................... 35 3.9.1 Potential Impacts of Climate Change in South Africa............................................. 37
3.9.2 Responses to Climate Change in South Africa ........................................................ 38
3.9.3 Rural Development and the Impact on the Physical Landscape .......................... 40
3.10 SYNOPSIS: STRATEGIC PHYSICAL LANDSCAPE ISSUES ......................................................................... 41
4 THE ENVIRONMENTAL LANDSCAPE ........................................................................................ 43
4.1 INTRODUCTION .............................................................................................................................. 43
4.2 ECOLOGICAL BIOMES .................................................................................................................... 45
4.3 BIODIVERSITY ................................................................................................................................. 46
4.4 WETLANDS .................................................................................................................................... 47 4.4.1 Integrity of Wetlands .................................................................................................. 50
4.5 MARINE AND COASTAL ENVIRONMENT ........................................................................................... 51
4.6 PRESERVATION OF NATURAL RESOURCES ......................................................................................... 52
4.6.1 Sensitive Features ....................................................................................................... 52
4.6.2 Sensitive Species ........................................................................................................ 52
4.6.3 Vegetation Classes Remaining Intact ...................................................................... 53
4.6.4 Protected Areas ......................................................................................................... 57
4.7 ENERGY RESOURCES ...................................................................................................................... 58 4.7.1 Air Quality ................................................................................................................... 60
4.7.2 Wind Energy ............................................................................................................... 61
4.7.3 Solar Energy ................................................................................................................ 62

Page 3 of 194
4.7.4 Hydro Energy .............................................................................................................. 63
4.7.5 Biomass Energy ........................................................................................................... 65
4.8 HUMAN FOOTPRINT ........................................................................................................................ 67
4.9 SYNOPSIS: STRATEGIC ENVIRONMENTAL ISSUES ................................................................................. 68
5 THE ADMINISTRATIVE LANDSCAPE ......................................................................................... 69
5.1 COMPLEX TERRAIN OF GOVERNANCE ............................................................................................ 69
5.2 OVERVIEW OF PROVINCIAL GOVERNMENT...................................................................................... 69
5.3 OVERVIEW OF LOCAL GOVERNMENT .............................................................................................. 71
5.4 TRADITIONAL COUNCILS ................................................................................................................. 76
5.5 SYNOPSIS: STRATEGIC ADMINISTRATIVE ISSUES .................................................................................. 77
6 THE DEMOGRAPHIC LANDSCAPE ........................................................................................... 78
6.1 INTRODUCTION .............................................................................................................................. 78
6.2 POPULATION GROWTH AND DISTRIBUTION ....................................................................................... 78
6.3 DENSITY ......................................................................................................................................... 80
6.4 LEVELS OF EDUCATION ................................................................................................................... 81
6.5 AGE DISTRIBUTION ......................................................................................................................... 82
6.6 GENDER ........................................................................................................................................ 83
6.7 MIGRATION ................................................................................................................................... 84
6.8 SYNOPSIS: STRATEGIC DEMOGRAPHIC ISSUES .................................................................................. 86
7 THE SOCIAL LANDSCAPE ........................................................................................................ 87
7.1 INTRODUCTION .............................................................................................................................. 87
7.2 QUALITY OF LIFE ............................................................................................................................. 91
7.3 HUMAN RELATIONSHIPS .................................................................................................................. 94
7.4 EDUCATION ................................................................................................................................... 98
7.5 HEALTH ....................................................................................................................................... 100
7.6 SAFETY AND SECURITY .................................................................................................................. 101
7.7 SUSTAINABLE HUMAN SETTLEMENTS ................................................................................................ 102
7.8 SYNOPSIS: STRATEGIC SOCIAL SECTOR ISSUES ................................................................................ 103
8 THE ECONOMIC LANDSCAPE ............................................................................................... 107
INTRODUCTION ......................................................................................................................................... 107
8.1 OVERVIEW OF KZN ECONOMY IN NATIONAL CONTEXT ................................................................. 108
8.2 OVERVIEW OF KZN DISTRICT ECONOMIES ..................................................................................... 117 8.2.1 Ugu ............................................................................................................................ 121
8.2.2 uMgungundlovu ....................................................................................................... 121
8.2.3 uThukela.................................................................................................................... 121
8.2.4 uMzinyathi ................................................................................................................. 121
8.2.5 Amajuba ................................................................................................................... 121
8.2.6 Zululand .................................................................................................................... 121
8.2.7 uMkhanyakude ........................................................................................................ 122
8.2.8 uThungulu ................................................................................................................. 122
8.2.9 iLembe ...................................................................................................................... 122
8.2.10 Sisonke .................................................................................................................. 122
8.2.11 eThekwini .............................................................................................................. 122
8.3 OVERVIEW OF KZN ECONOMIC NODES ....................................................................................... 122 8.3.1 Durban ...................................................................................................................... 123
8.3.2 Pietermaritzburg ....................................................................................................... 123

Page 4 of 194
8.3.3 Richards Bay ............................................................................................................. 124
8.3.4 Summary of the City Economies ............................................................................. 124
8.3.5 Other Centres of Economic Activity in KwaZulu-Natal .......................................... 125
8.4 DETAILED ECONOMIC SECTOR REVIEW ......................................................................................... 126 8.4.1 Agriculture ................................................................................................................ 126
8.4.2 Manufacturing ......................................................................................................... 130
8.4.3 Tourism ...................................................................................................................... 133
8.4.4 Finances and Services ............................................................................................. 136
8.4.5 Wholesale and Retail Trade, Hotels and Restaurants (Trade and Commerce) ... 137
8.4.6 Mining and Quarrying .............................................................................................. 138
8.4.7 The Green Economy ................................................................................................ 138
8.4.8 Property .................................................................................................................... 141
8.4.9 Logistics and Communications ............................................................................... 142
8.4.10 Informal Economy ................................................................................................ 143
8.5 INVESTMENT IN KZN ..................................................................................................................... 144
8.5.1 Domestic Fixed investment ...................................................................................... 144
8.5.2 Foreign Direct Investment ........................................................................................ 146
8.6 SYNOPSIS: STRATEGIC ECONOMIC ISSUES ...................................................................................... 150
9 THE INFRASTRUCTURE LANDSCAPE ....................................................................................... 153
9.1 INTRODUCTION ............................................................................................................................ 153
9.2 TRANSPORT OF FREIGHT ................................................................................................................ 154
9.2.1 Freight Logistics ........................................................................................................ 154
9.2.2 Harbours and Ports ................................................................................................... 158
9.2.3 Road Transport of Freight......................................................................................... 160
9.2.4 Rail Transport of Freight ............................................................................................ 167
9.2.5 Air Transport .............................................................................................................. 170
9.2.6 Pipelines .................................................................................................................... 172
9.3 PUBLIC TRANSPORT ...................................................................................................................... 173
9.3.1 Road and Rail Public Transport .............................................................................. 173
9.3.2 Rural Transport Strategy ........................................................................................... 176
9.4 WATER AND SANITATION .............................................................................................................. 177
9.4.1 Backlogs in Water Provision ..................................................................................... 177 The quality of water is also an area that demands attention both nationally as well as in the
province. ........................................................................................................................................ 177
9.5 ENERGY AND ELECTRICITY ............................................................................................................ 180
9.5.1 Backlogs in Electricity Provision ............................................................................... 180
9.5.2 Diversified Energy Sources ....................................................................................... 182
9.6 INFORMATION AND COMMUNICATION TECHNOLOGIES (ICT) ........................................................ 183 9.6.1 Overview .................................................................................................................. 183
9.6.2 Limited and expensive bandwidth ......................................................................... 184
9.6.3 ICT education in the province is severely underdeveloped ................................. 184
9.7 SYNOPSIS: STRATEGIC INFRASTRUCTURE ISSUES ................................................................................ 184
10 INSTITUTIONAL AND POLICY LANDSCAPE ........................................................................ 186
11 FUNDING CHALLENGES .................................................................................................... 188
12 CONCLUSION ................................................................................................................... 194

Page 5 of 194
1 Introduction
The statement is often made that although significant progress has been made in the
development of our Country and Province since the inception of the new democratic
dispensation in 1994, most of our people are still not enjoying the fruits of this freedom. It is
against this backdrop that the KwaZulu-Natal Provincial Government initiated a process to
review the Growth and Development Strategy of the Province. This Provincial Growth and
Development Strategy (PDGS) is intended to:
Promote vertical, horizontal and spatial alignment;
Focus on a clear vision for the Province;
Mobilise all development partners to achieve predetermined development
objectives and targets;
Build on the strengths, weaknesses, opportunities and threats of the Province;
Set a long term (20 year +) vision and direction for development in the province;
Serve as the overarching strategic framework for development in the Province
applying the 80/20 principle (that the PGDS is not an inventory of all we do);
Spatially contextualise and prioritise (not just what, but also where and when);
Guide the activities and resource allocation of provincial government and other
spheres of government, business sectors, organised labour and other role players from
civil society that can contribute to development in the province;
Develop a clear institutional arrangements to secure buy-in and ownership, through a
structured consultation process with all sectors and development partners;
Define clear targets and indicators;
Direct commitment to the allocation of resources to manage and implement this
strategy;
Capitalise on the wealth of information available, which should be drawn on during
the preparation of the new PGDS, and that
Building a strong centre with decisive leadership roles to achieve the desired
outcomes.
It was with this in mind that the Premier and Provincial Cabinet appointed the KwaZulu-Natal
Provincial Planning Commission (PPC) in February 2011 tasked this PPC to guide the review of
the KwaZulu-Natal PGDS, and to submit a first version of this revised strategy for adoption to
the Provincial Cabinet Lekgotla in August 2011.

Page 6 of 194
Structure of this Report
The “Situational Overview Report” is intended to be a prelude to the Strategic Analysis and
drafting of the revised Provincial Growth and Development Strategy. This report captures, in
summary form, the key data and analysis of the Province as it relates to growth of the
economy, the development of its people and the state of the environment. The situational
overview focuses on what the needs of the people of the Province are, and points to the
state of the key sectors making up the economy. Thereafter, using this as a basis, a Strategic
Analysis Report is developed that attempts to go beyond mere reporting of the status quo – it
provides analysis of recent trends, shifts in policy and strategy, emergence of new needs and
relationships between stakeholders that impact on the growth and development trajectory.
With such analysis and data, the report can then form the basis for more informed strategy
development, which will be the next phase of the PGDS Review process.
The situational overview in this report was undertaken using a sectoral analysis methodology,
i.e. the state of each key sector of the Province’s growth and development framework was
assessed in turn and within this sectoral framework, the main cross-cutting issues which
impact on virtually all sectors were analysed.
The Situational Overview Report is structured according to the sections identified below,
namely:
KwaZulu-Natal in the South/ Southern African and Global context;
The Physical Landscape;
The Environmental Landscape;
The Administrative Landscape;
The Demographic Landscape;
The Social Landscape;
The Economic Landscape;
The Infrastructure Landscape;
The Institutional and Policy Landscape
Funding Challenges
Each section captures the current relevant profile of KZN, identifying the potential areas of
backlog, constraints and vulnerability in relation to growth and development. Thereafter,
opportunities for growth and possible high level prioritisation are highlighted.

Page 7 of 194
2 KwaZulu-Natal in the South/Southern African and Global
Context
The global economy has undergone significant change in the past decade. Growth
has been driven by new technological production processes and global trading
markets, shifting economic and financial systems, as well as the impact of climate
change.
Global production markets have been driven largely by the development of new
production processes and sophisticated supply chains. South Africa, and specifically
KwaZulu-Natal, has not kept in pace with these global changes which has lead to a
relative decline in productivity. This is partially due to a lack of investment (domestic
and foreign) which has seen a reduction in investment into new technology,
equipment and machinery, and skills.
In addition, there has been a substantial shift in economic power towards emerging
Asian economies. High levels of growth and production achieved by countries such
as China have placed pressure on countries who seek to compete in international
markets. Additionally, many European countries now face increasing pressure to
reduce government spending in an effort to balance trade accounts and reduce
public debt. These shifts have had a major impact in that new trading partnerships
are being formed. South Africa has recently entered the BRICSA agreement, and
therefore seeks to strengthen its relationship with other BRICSA nations. Additionally,
there is expected to be a global shift towards investment into Africa in the next
decade, and the province must ensure that the correct fundamentals are in place to
take advantages from this and other global economic shifts.
Climate change has altered the way in which countries view economic growth, in
that nations are increasingly being held accountable regarding their carbon
emissions and thus must explore cleaner sources of energy. This has caused a shift
towards new ‘green’ production processes and renewable energy generation, and a

Page 8 of 194
new way of thinking with regards to economic growth and development planning.
The relevance for South Africa and KwaZulu-Natal lies in the need to invest in new
renewable energy sources, and to attract investment that applies green principles
and employs ‘green’ technologies. This also has major implications for the province in
that food security, as well as sustainable resource management, will have an ever-
increasing role to play, and the province needs to position itself to take advantage of
the opportunities presented by moving towards a green economy.
KwaZulu-Natal’s role in the broader integration of South Africa into the African and
global economy is set to grow. This is largely due to the Province’s location, ports and
infrastructure which position KZN as a gateway to Southern Africa. This position has
been strengthened through further developments such as the aerotropolis, Dube
Trade Port. Therefore, in its’ long-term development planning, KwaZulu-Natal must
be mindful of both the impact of and the opportunities in growing linkages with
southern Africa and Africa as a whole.
In terms of the global economy, the National Planning Commission reports that in the
short term, the impact of the recent international downturn will continue to affect
South Africa’s large trading partners in Europe and North America. In the longer term,
however, it is likely that a substantial shift in global economic power will continue with
rapid growth in Brazil, Russia, India and China and other middle-income countries.
These changes will have significant direct implications for South Africa’s economy as
well as for the wider African region.
It is noted that Sub-Saharan Africa has posted strong rates of economic growth in
recent years, although much of this growth is off a low base. If current trends
continue, South Africa’s regional dominance will decline over the planning period.
Already, competing sub-regional development poles are emerging in Nigeria,
Angola and the East African community.
KwaZulu-Natal’s development strategy over the next 20 years must therefore
carefully select the economic and development drivers which will enhance the
benefits of growing integration into Africa and the global economy. Trade and
tourism will remain the lead instruments of this integration process, but many new
areas of opportunity must also be fully explored and developed. As a major
manufacturing hub, KZN business has new opportunities for export into Africa.
Already some of the leading sectors in the local economy, such as the automotive,
aluminium smelting and sugar manufacturing, are highly integrated into the global
economy, and need to stay globally competitive. Many further opportunities for new
global integration are developing for the commercial sector, information and
communication technology sector, and many sectors related to human and
community development. This new context provides challenges but more
importantly new opportunities. Africa, as an emerging and growing economic block,
and as a voice for development and greater global equity, is set to rise. KwaZulu-
Natal, as a leading province of South Africa, must rise too. That is one of the key
challenges of the new KwaZulu-Natal growth and development strategy.

Page 9 of 194
3 THE PHYSICAL LANDSCAPE
3.1 Introduction
South Africa lies at the southern tip of the African continent. Physically it is larger than
Germany, France, Italy, Belgium and Holland combined. The country is dominated by a
plateau of over 1 200 meters and a narrow coastal belt washed by the cold Benguela
current on the west and the warm Mozambique current on the east. It has a coastline of
over 2 900 kilometres, from the Indian Ocean on its eastern shores to the Atlantic on the west.
Within its borders, the large variety of climatic zones allows a wide diversity of plant and
animal kingdoms to flourish.
The province of KwaZulu-Natal, on the eastern coast of the country, is bordered by the warm
Indian Ocean to the east and the escarpment of the Drakensberg, separating it from the
mountain kingdom of Lesotho, to the west. It covers almost 8% of the country’s geographic
area. The relatively low-lying coastal strip rises to rolling hills in the Midlands before reaching
the high altitudes of the mountains and escarpment. The province boasts two of the
country’s major natural harbours at Durban and Richards Bay. It also boasts two World
Heritage Sites – The Greater St Lucia Wetland Park and the uKhahlamba Drakensberg Park.
KwaZulu-Natal can be described as a province of contrasts. The topography differs from
mountains and hills to a coastal plain which broadens considerably to the north and
contains important wetlands such as the St Lucia System, Lake Sibaya and the Kosi Bay
System. The vegetation varies from alpine veld in the high-lying areas of the Drakensberg on
the border with Lesotho to subtropical coastal forests along the Indian Ocean. A very
prominent characteristic of this province is the deeply cut parallel valleys and ridges formed
by a large number of short, fast-flowing rivers which can be seen as the result of a large
variation in altitude over a very short distance: from Mont-aux-Sources (3,282 meters), on the
border with Lesotho and the Free State to sea level over a distance of just 200 kilometers.
The very character of KwaZulu-Natal, combined with the large-scale poverty experienced
within the rural areas as well as the acknowledged vulnerability of rural communities to
variable economic conditions, service delivery and even climate variability, suggests that
any spatial planning and growth and development interventions will have a significant focus
on rural development. It is currently estimated that 50% of the all rural households within
KwaZulu-Natal live in poverty while the largest portion thereof do not have access to
acceptable levels of sanitation. The rural development focus should extend beyond
development planning and include practical interventions such as facilitating the transition
from non-sustainable traditional agricultural methods towards more sustainable methods
within a sustainable livelihoods approach.
Much of the landscape of KwaZulu-Natal is characterised by dispersed rural settlements in
terrains where infrastructure service delivery is particularly challenging. The under-resourced
rural communities are however at the heart of the history and culture of the province. A
unique attribute of land within the province is the fact that almost 40% of the land within
province falls under the custodianship of the Ingonyama Trust Board and as such
accommodates a large portion of the population of the province, mainly in the form of rural
and communal villages, which are amongst the most vulnerable in the province. The
communal nature of the land and the vast extent thereof has, in the past, impacted on the
development investments intended by both government and private sector. Effective

Page 10 of 194
investment towards growth and development will require a more streamlined approach
toward spatial planning and development investment on the Ingonyama Trust Land.
3.2 Topography
3.2.1 Elevation
The elevation of KwaZulu-Natal varies from the interior to the coast. The height above sea
level ranges from 3,448m on the escarpment of the Drakensberg, to 0m at the coast, as
illustrated by the map below.
Map 1: KwaZulu-Natal Elevation Map
Source: NASA, 2010
The elevation character of the province impacts on human settlement and production
patterns. Firstly, the scattered settlement pattern in many part of the more rural areas of the
province is the result of the undulating hills and the tendency of households in communal
and rural areas to settle either on the crests of the hills or (where more even slopes occur)
near the rivers as source of water for consumption and/or agricultural production. Secondly,
the elevation of the various biological production regions impacts especially on agriculture
and the crops that could be cultivated within specific regions. Thus the primary economic
base for the various regions will differ based on their specific landscape.
Page 11 of 194
The resulting scattered nature of settlements and production practices impacts on the cost-
effectiveness of infrastructure development in certain areas and contributes to the
vulnerability of communities as a result.
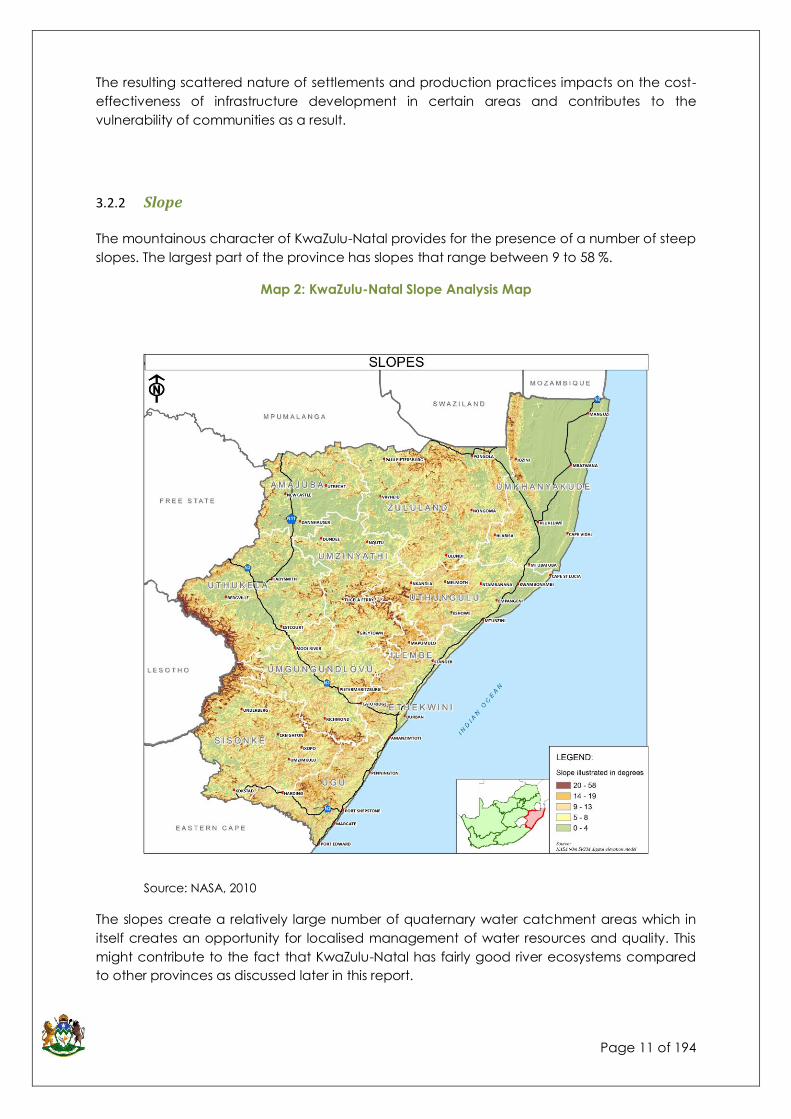
3.2.2 Slope
The mountainous character of KwaZulu-Natal provides for the presence of a number of steep
slopes. The largest part of the province has slopes that range between 9 to 58 %.
Map 2: KwaZulu-Natal Slope Analysis Map
Source: NASA, 2010
The slopes create a relatively large number of quaternary water catchment areas which in
itself creates an opportunity for localised management of water resources and quality. This
might contribute to the fact that KwaZulu-Natal has fairly good river ecosystems compared
to other provinces as discussed later in this report.
Page 12 of 194
The steep slopes impact on construction options and cost and further contribute to the
scattered development pattern of the rural areas, where traditional construction practises
situate the uMuzi’s on top of the hills and ridges. The map below depicts the slopes across the
province. On certain slopes (> 12 degrees) planned development should take visual
sensitivities into account as well as the reduction of cut-and-fill construction that might cause
erosion and loss of topsoil.
At a localised level the slope would impact on the cost of the provision of services (due to
the need for addition pump facilities) as well as the feasibility of commercial agricultural
production which uses mobile equipment such as tractors which can only be operated on
slopes of less than 12 degrees.
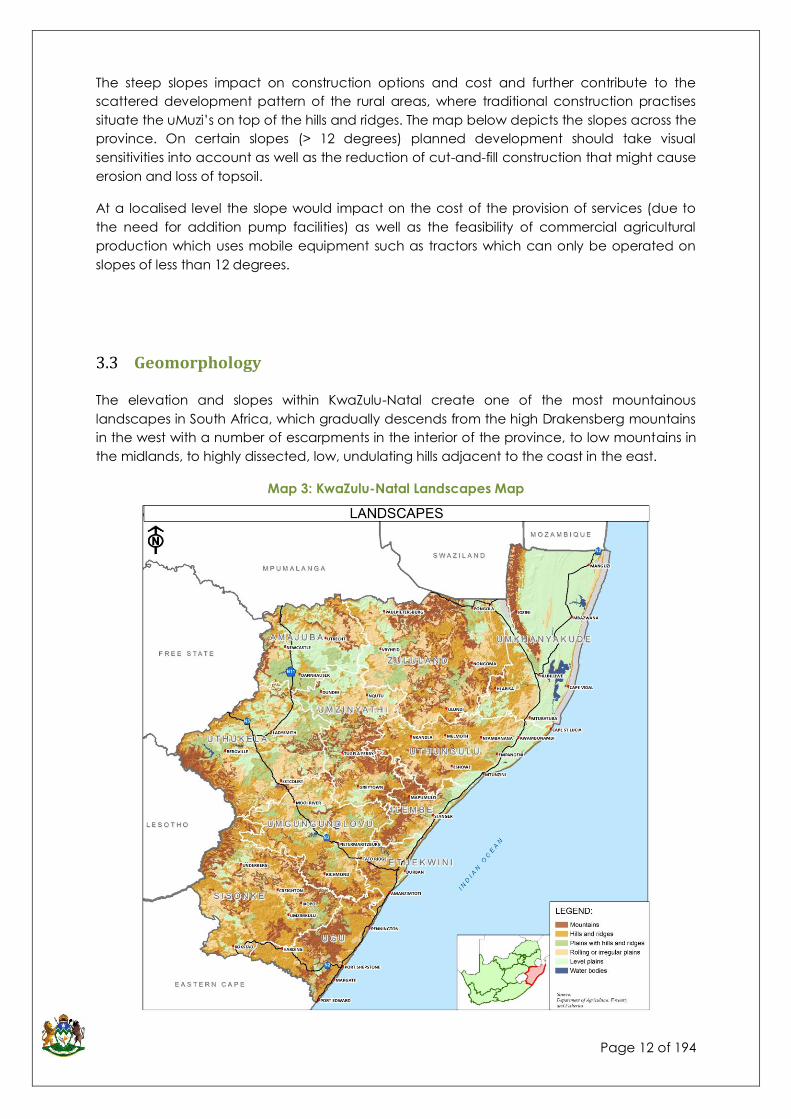
3.3 Geomorphology
The elevation and slopes within KwaZulu-Natal create one of the most mountainous
landscapes in South Africa, which gradually descends from the high Drakensberg mountains
in the west with a number of escarpments in the interior of the province, to low mountains in
the midlands, to highly dissected, low, undulating hills adjacent to the coast in the east.
Map 3: KwaZulu-Natal Landscapes Map

Page 13 of 194
The landscapes give form to the terrain morphological units illustrated by the map below. The
evidently highly dissected, low, undulating mountains pose a number of challenges with
regards to planning. This terrain form is oriented with waterways running towards the ocean
with the exception of the Pongola area where waterways turn northwards as they reach the
sandy plains of the lakes region. These geo-morphological units result in most regional roads
routing mainly in an east-west direction between the high-lying areas to the low lying coastal
areas. Due to high construction costs and natural settlement patterns, there is very little
north-south cross connectivity between communities and between economic production
areas, which makes some areas inaccessible and difficult to service.
Map 4: Terrain Morphological Units - KwaZulu-Natal
3.4 Soils
3.4.1 Soil Depth
There appear to be a direct correlation between the soil depth profile of KwaZulu-Natal and
the distribution of biological productivity within the province. Due to mountainous terrain, the
largest parts of KwaZulu-Natal are characterised by medium to shallow soil depths, with only
the northern regions of the province, north of Richards Bay displaying substantial soil depths

Page 14 of 194
as illustrated by the map below. A high volume of rainwater therefore cannot be absorbed
by the ground and flows to the rivers and eventually to the sea. The relatively shallow soil
depths impact on the potential for erosion and increases the risk of floods to communities.
Map 5: KwaZulu-Natal Soil Depth and Variance
Source: Department of Water Affairs, 2002
The province has high biological production potential, but its varied soil conditions do not
make the production of all types of products viable within the province. Although sugarcane
is well suited to the soil and climate conditions, recent studies indicated that a large portion
of the sugar market in South Africa is being filled by imported sugar and that farms within
KwaZulu-Natal, previously utilised for cane production are now laying fallow. Alternative
agricultural crops which might thrive within KwaZulu-Natal’s soil types need to be researched
and produced to adapt to market and cost impacts.
The above soil depths and general soil conditions are echoed by the generalised soil
descriptions as illustrated by the map below.

Page 15 of 194
Map 6: Generalised Soil Description within KwaZulu-Natal
Source: Environmental Protection Atlas of South Africa, 2002
The more fertile soils are situated north from Richards Bay and are comparable to the deeper
soil depths prevalent in this area. Soil depth and soil classification, compared with
precipitation, should be utilised to identify the types of agricultural products that will be best
suited for production within the province.
3.5 Mineral Resources
The main mineral and/or mining commodities in KwaZulu-Natal consist of coal deposits and
are located mainly within the north western parts of the province. The map below depicts
the coal deposits within the Province.

Page 16 of 194
Map 7 – KwaZulu-Natal Coal Fields and Mines
The number of closed coal mines indicated on the above map is evidence of coal deposits
being depleted at an alarming rate. The number of abandoned mines within the coal fields
of the province is anticipated to have contributed to firstly the high levels of poverty
recorded in these regions and secondly to the influx of people to urban centres such as
Madadeni, Emondlo and Ezakheni. Rehabilitation of abandoned mines is critical if the
province is to avoid the negative effects of acid drainage and contamination of aquifers.
KwaZulu-Natal can arguably not compete competitively with the mineral mining of Gauteng
and North West Provinces, and the focus needs to be on growing sectors where the province
has a competitive advantage, such as the forestry sector.
Mineral extraction from coastal dunes might impact on the environmental quality and
amenity and compete with conservation, tourism and lifestyle development options along
especially the northern coastal areas.

Page 17 of 194
3.6 Hydrology
3.6.1 Water Catchments
The province’s water resources are driven by four main catchment areas, namely
Mzimvubu River Catchment
Mkomazi River Catchment
Tugela River Catchment
Mfolozi/Pongola River Catchment
The extent of the above-mentioned catchment areas is depicted by the maps below:
Map 8: KwaZulu-Natal Primary Catchment Areas
The majority of the provinces population and economic activities are concentrated within
the Umvoti-Umzimkulu and Usutu-Mhlathuze Primary Catchment areas and at a provincial
level, it is imperative that these catchments are managed to address water demand, system
health and potential pollution.

Page 18 of 194
The quaternary catchments (illustrated below) provide a clearer indication of the locality of
the “water factories” within the province. Evidently the catchments with the highest mean
annual runoff are found in Sisonke District, attributed to the Drakensberg as well as the
northern parts of Amajuba District and the larger part of the Umkhanyakude District from St
Lucia northwards.
Map 9 - KwaZulu-Natal Catchment Runoff
Source: Department of Water Affairs, 2010
It is critical that the high run-off quaternary catchments be well managed to avoid water
shortages to communities living downstream. Spatial and development planning at a
quaternary catchment level is most vital towards managing the impact of land use and
extraction from these critical water distribution units. Such planning and management
interventions will need to address:
Impact of land use on water quality.
Soil erosion and sedimentation of water courses (including sand and gravel extraction) and stability of banks.

Page 19 of 194
Salinity caused by land clearing
Loss of habitat.
Floodplain management (including flood mitigation).
Effect of land and water management on coastal and marine environments.
Spread of noxious organisms (weeds and blue-green algae).
Competition for resources and water availability.
3.6.2 Rivers and Dams within KwaZulu-Natal
The map below illustrates the overall status of the river ecosystems within South Africa.
Map 10: River Ecosystem Status within South Africa
The map above provides a perspective on the quality of rivers within KwaZulu-Natal in
comparison the rest of the South Africa. It illustrates that the eastern part of the country,
including Mpumalanga, KwaZulu-Natal and the northern portions of the Eastern Cape
general has the least threatened river ecosystems when compared to the central provinces
of Gauteng, Free State, Western Cape and the southern portions of the Eastern Cape.
The map below highlights the status of river ecosystems within KwaZulu-Natal specifically.

Page 20 of 194
Map 11: KwaZulu-Natal River Ecosystem Status
Source: Department of Water Affairs
In broad terms the map above illustrates that the river eco systems within KwaZulu-Natal are
mostly considered vulnerable, although there are river eco systems within Sisonke and
uMkhanyakude Districts especially, which are considered endangered and the river systems
within the northern regions of Amajuba District are considered to be critically endangered.
Furthermore a number of river systems traverse local and regional boundaries and thus the
quality of the rivers are determined by adjoining districts, provinces and even countries.
It is evident that the quaternary catchments with the highest runoff, i.e. those within Amajuba
and uMkhanyakude Districts, also have some of the most critically endangered river eco-
systems in the province and could be considered priority areas for water catchment
management.
Within the rural context of the province it is further imperative to protect the riverine areas, to
ensure that health risks such as cholera do not contaminate the water sources.
The KwaZulu-Natal State of the Environment Report (2004) evaluates the “health” of the rivers
by evaluating the number of species (endemic to the environment) that are present. The
index that is being used is the South African Scoring System (SASS).

Page 21 of 194
Map 12: Health of rivers as indicated by aquatic invertebrates
Source: KwaZulu-Natal State of the Environment Report, 2004
The above alternative perspective on the health quality of the rivers differs extremely from
one tributary to the other. Very few river systems are still in their natural state.
There are at least fifteen major dams within the province serving as water storage areas for
potable water, irrigation, recreation and hydroelectricity, as listed below.

Page 22 of 194
Table 1 –KwaZulu-Natal Major Dams and their Capacity
Dam Maximum
Capacity
(mil.cub.m)
River
Albert Falls Dam 288.1 Mgeni River
Craigie Burn Dam 22.5 Myamvubu River/Mooi River/Buffels River/Tugela
River
Driel Barrage Dam Thukela River (Tugela)
Goedertrouw Dam 301.3 Mhlatuze River
Hazelmere Dam 24 Mdloti River
Hluhluwe Dam 25.9 Hluhluwe River
Inanda Dam 241.7 Mgeni River
Midmar Dam 235.4 Mgeni River
Ntshingwayo Dam 194.6 Ngagane River/Buffels River/Tugela River
Pongolapoort Dam 2267.1 Pongola River
Qedusizi Dam
Spioenkop Dam 270.6 Tugela River
Woodstock Dam 373.3 Tugela River
Wagendrift Dam 55.9 Boesmans River/Tugela River
Zaaihoek Dam 184.6
Source: www.ewisa.co.za
As far as could be determined, only Pongolapoort Dam, Inanda Dam and Hazelmere Dam
have formal Resource Management Plans to guide development around and access to the
water resource. Other major dams such as Albert Falls, Goedertrouw, Spioenkop, Midmar
and Woodstock Dams would also benefit from Resource Management Plans to ensure
sustainable community utilisation of these water resources.
Implementation of management plans for the mentioned dams will ensure more equal
distribution of water, less wastage of resources, and subsequently higher availability of water
to the various industries and communities.
3.6.3 Water Demand Management
In general terms water demand for any region is primarily driven by demographics, land use
and development planning trends. As the PGDS intends to stimulate economic growth, it is
important to consider that in a growing economy there is a tendency to use more water
which in turn impacts on sustainability.

Page 23 of 194
3.6.4 Vulnerability of Community due to Dependence on Open Water Sources
The map below provides a multi-level analysis combining areas of poor river health,
communities with high dependency on unprotected water sources, poor sanitation services
and the incidence of cholera. The highest incidence of cholera occurs in Amajuba,
uMkhanyakude, uThukela, iLembe & uMzinyathi District Municipalities.
Map 13 - Vulnerability of Households to Water-Borne Diseases
Source: KwaZulu-Natal State of the Environment Report, 2004
The above map indicates that the highest concentrations of vulnerable households as a
result of inadequate water sources and the prevalence of water borne diseases are located
in Nongoma, Hllabisa, Msinga, Nkandla, uMlalazi, Maphumulo, Ubuhlebezwe and Ezinqoleni
Local Municipalities. It should be noted that the base study informing the above map was
conducted prior 2004, and education and public information campaigns might have
reduced the severity of the situation since then.

Page 24 of 194
Map 14: Groundwater Vulnerability within KwaZulu-Natal
Source: CSIR
Education campaigns which make communities aware of the dangers related to water
borne diseases and the treatment of water only address symptoms of a larger problem and
are not solutions to the real problem of contamination. The real solutions lie in water
management planning. Contamination of water sources affects not only the health of
communities, but also raises the costs of treatment of water, which again increases
operating budgets of the water services authorities thus using funds which could inter alia
have been used for improving or installing additional infrastructure to meet the rising
demand for development and expansion.
3.7 Vegetation and Land Cover
3.7.1 Vegetation
KwaZulu-Natal has a wide variety of vegetation types. It is clear that the vegetation changes
systematically as one moves the further away from the coast. The main type of vegetation
types includes the Ngongoni Veld, and the Coastal Forest & Thornveld. To a limited extent
the following vegetation types are spread throughout the province:

Page 25 of 194
Natal Sour Sandveld
Ngongoni Veld of the Natal Mist belt
North eastern sandy Highveld
Northern Tall Grassveld
Southern Tall Grassveld
Valley Bushveld
Zululand Thornveld
Themeda Festuca Alpine Veld
Map 15: KwaZulu-Natal Vegetation Zones Map
Vegetation types may impact to a certain extent on the livelihood of communities as it
determines the carrying capacity of the field in terms of livestock units. The scarcity of
vegetation again determines whether crop production or livestock farming should be
practised.
Page 26 of 194
3.7.2 Forestry
Commercial plantation forestry in South Africa encompasses large planted forests
established to supply raw materials to satisfy mining, construction and industrial markets. The
main species planted in South Africa are pine (52, 2 %) eucalyptus (38, 92 %) and wattle (8, 3
%), which are all grown with success within KwaZulu-Natal. The figure below depicts the
locality of the forestry activities within South Africa. Northern KwaZulu-Natal and
Mpumalanga produce the largest quantities of wood annually.
KwaZulu-Natal accounted for 356,355 hectares of hardwood and 183,554 hectares softwood
in 2005. The forestry industry in KwaZulu-Natal covers approximately 740,000 hectares (8.2% of
the total area of the province). The locality of these forestry plantations is illustrated as part of
the land cover map following in the next section.
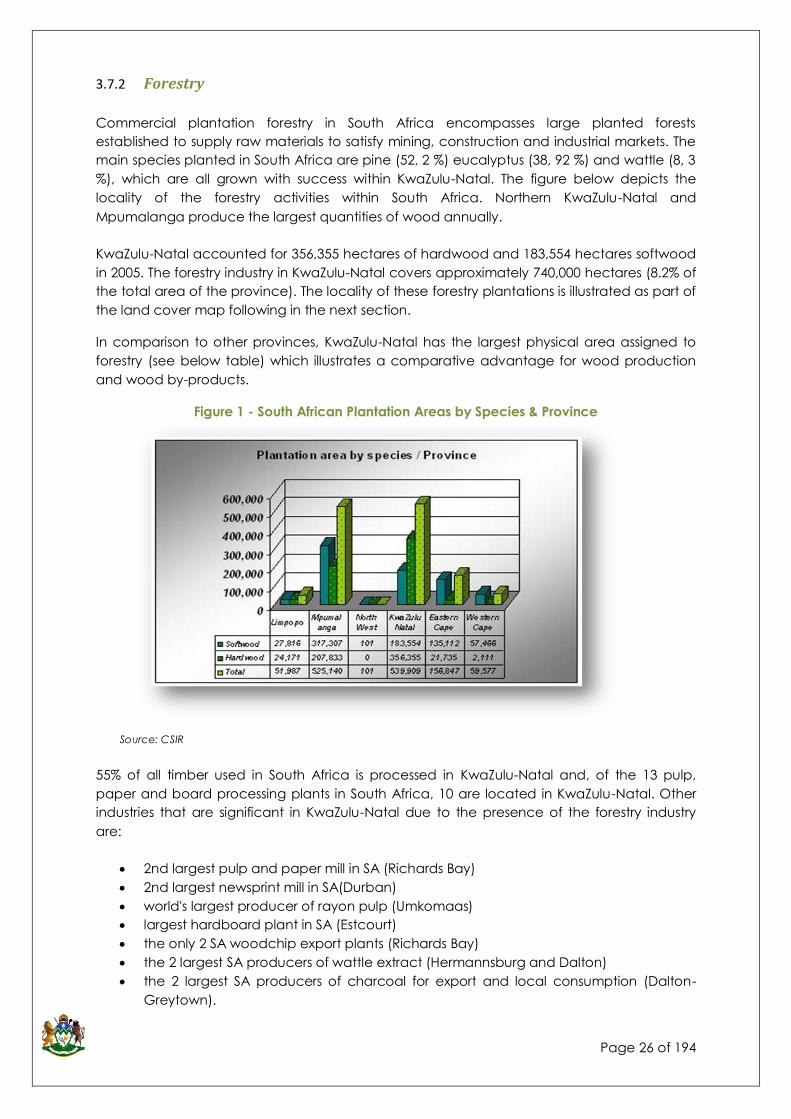
In comparison to other provinces, KwaZulu-Natal has the largest physical area assigned to
forestry (see below table) which illustrates a comparative advantage for wood production
and wood by-products.
Figure 1 - South African Plantation Areas by Species & Province
Source: CSIR
55% of all timber used in South Africa is processed in KwaZulu-Natal and, of the 13 pulp,
paper and board processing plants in South Africa, 10 are located in KwaZulu-Natal. Other
industries that are significant in KwaZulu-Natal due to the presence of the forestry industry
are:
2nd largest pulp and paper mill in SA (Richards Bay)
2nd largest newsprint mill in SA(Durban)
world's largest producer of rayon pulp (Umkomaas)
largest hardboard plant in SA (Estcourt)
the only 2 SA woodchip export plants (Richards Bay)
the 2 largest SA producers of wattle extract (Hermannsburg and Dalton)
the 2 largest SA producers of charcoal for export and local consumption (Dalton-
Greytown).

Page 27 of 194
KwaZulu-Natal has a comparative advantage over the rest of the country (in terms of
forestry) through the area assigned to the forestry industry. A large amount of the area
earmarked for forestry has, however, not been planted. A large portion of this land is in
private ownership. Still KwaZulu-Natal has the opportunity to provide in South Africa’s timber
need by ensuring resources are optimally used, and that processes in timber production are
streamlined.
Important to note however, is the fact that an increase in forestry activities have a direct link
to the reduction of water. Despite the possible opportunities for communities’ livelihoods and
greater economy of the province, the advantages need to be weighed against the loss in
regard to this most important resource.
3.7.3 Land Cover
The land cover across the province was derived from satellite imagery during 2000-1 and is
illustrated by the map below. This clearly indicates the settlement pattern within the province
as well as the areas being used for agricultural production and forestry.
Map 16 - KwaZulu-Natal Settlement Distribution and Land Cover
Source: CSIR
Page 28 of 194
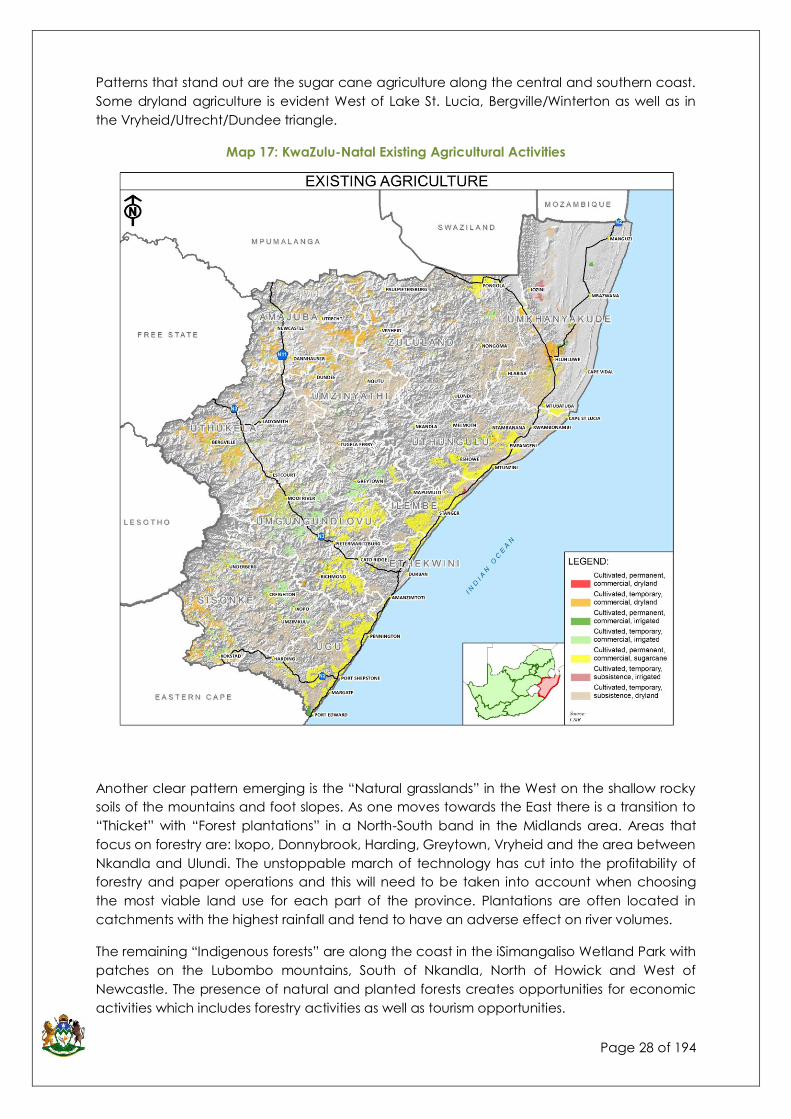
Patterns that stand out are the sugar cane agriculture along the central and southern coast.
Some dryland agriculture is evident West of Lake St. Lucia, Bergville/Winterton as well as in
the Vryheid/Utrecht/Dundee triangle.
Map 17: KwaZulu-Natal Existing Agricultural Activities
Another clear pattern emerging is the “Natural grasslands” in the West on the shallow rocky
soils of the mountains and foot slopes. As one moves towards the East there is a transition to
“Thicket” with “Forest plantations” in a North-South band in the Midlands area. Areas that
focus on forestry are: Ixopo, Donnybrook, Harding, Greytown, Vryheid and the area between
Nkandla and Ulundi. The unstoppable march of technology has cut into the profitability of
forestry and paper operations and this will need to be taken into account when choosing
the most viable land use for each part of the province. Plantations are often located in
catchments with the highest rainfall and tend to have an adverse effect on river volumes.
The remaining “Indigenous forests” are along the coast in the iSimangaliso Wetland Park with
patches on the Lubombo mountains, South of Nkandla, North of Howick and West of
Newcastle. The presence of natural and planted forests creates opportunities for economic
activities which includes forestry activities as well as tourism opportunities.

Page 29 of 194
Subsistence agriculture affects quality of the soil/land cover/environment and
although important for survival, poses a threat to endangered species.
Subsistence agriculture is evident in the densely populated rural areas with surrounding
degraded land. Where these areas increase in density even further one notices the start of
more formal areas, which in terms of land cover is called “Built-up (informal)” These could be
seen as areas requiring social and infrastructure support.
Map 18: KZN Land cover: Commercial and Subsistence Agriculture
3.7.4 Agriculture, Agri-processing and Land Reform
This sector is key to addressing poverty in the province since the poorest people lin KZN live in
the rural areas. Agriculture’s contribution to the provincial economy is currently small but it
has the potential to increase significantly if its full potential were realised. The commercial
agriculture sector is the major employer in the majority of municipalities and forms the
economic anchor of these municipalities. Subsistence agriculture is by far the most important
source of sustenance for rural households. In order to achieve a reduction of unemployment
and poverty the challenge is twofold: to grow and transform the commercial agricultural
sector by assisting the development of emerging commercial farmers and to stimulate the
development of subsistence agriculture towards more sustainable practices thereby

Page 30 of 194
increasing food security. A range of infrastructural necessities will be required eg. irrigation
schemes, transport routes and market structures. The Agricultural Revolution and the Land
Reform Programme are key instruments for the achievement of these objectives and they
need to be aligned.
The Provincial Department of Agriculture and Environmental Affair’s Agrarian Revolution
programme and Land Reform’s New Strategic Framework, focusing on integrated
development models based on area-based planning, partnership, and empowerment of
beneficiaries at a local level, are both aimed at making a positive impact on commercial
agriculture. With about 1 250 000 ha of the province’s white-owned agricultural land due to
be transferred to black owners by 2014, the Department of Land Affairs acknowledges that
an integrated approach is needed to scale up delivery and maximize positive impact on
poverty alleviation, job creation and economic growth. An economic strategy that links
land reform projects to key provincial agrarian revolution programmes and projects will
capitalise on the transfer of agricultural land into an economic growth opportunity for the
province.
In spatially locating areas of agricultural potential in the province emphasis is placed on the
need to release latent potential which exists in the lands under custodianship of the
Ingonyama Trust Board, and the resolution of the land reform initiatives in the province.
3.8 Climatology
3.8.1 Precipitation
From the map below it is clear that the coastal regions and the western mountainous regions
have the highest annual precipitation: ranging between 913mm and 1,251mm per annum.
The more evenly-sloped areas situated in the north western parts of the province record the
least amount of rain with a maximum of 721mm per annum. The province receives most of its
rainfall during the summer months with some parts of the coast in the Richards bay area
receiving some winter rainfall.
Due to the varied topography of the province and the unavoidable interaction between
waterways and settlements, occasional flooding occurs, threatening both property and lives.
It is subsequently necessary to develop reaction plans/disaster management plans to deal
with such instances. Although policies exist, it is necessary to implement proper
policing/enforcement of policies to prevent human and commercial development in
dangerous localities. Due to dependency on the water source, communities will always settle
as close as possible to water sources.

Page 31 of 194
Map 19: KwaZulu-Natal Average Annual Precipitation
Source: CSIR
A number of municipalities record “water shortage” as a reason for not being able to
provide potable water to communities. This can be ascribed to a number of factors, of which
water management is probably the most significant reason. A substantial number of
municipalities cannot account for substantial water losses. The term “water losses” in this
instance refers to water that is processed through the water provision and reticulation system,
but does not reach the intended consumers due to loss of water at unknown locations in the
water infrastructure. Subsequently water service providers and authorities cannot be
remunerated for the provision of water. A number of communities therefore receive water
only for a short period of the day, as reservoirs run dry very quickly.
On a provincial level, strategies need to be devised to assist the municipalities to upgrade
infrastructure, and be accountable for the loss of water. The difference in precipitation
between summer and winter is quite significant, where the maximum rainfall drops from
195mm in the summer to 71mm in the winter.

Page 32 of 194
Map 20: KwaZulu-Natal Winter Rainfall Distribution Map
Source: CSIR
Map 21: KwaZulu-Natal Summer Rainfall Distribution

Page 33 of 194
Map 22: KwaZulu-Natal Winter Temperature Minimum Averages
Map 23: KwaZulu-Natal Summer temperature Maximum Averages

Page 34 of 194
3.8.2 Evaporation
The annual rainfall distribution within the province needs to be considered along with the
actual evaporation within the various biological regions. The map below illustrates the
average annual evaporation recorded within the various regions of the province. From the
map it is evident that the northern portion of the province includes most part of
uMkhanyakude, Zululand and Amajuba Districts experiences the highest average annual
evaporation with areas such as Pongola and Newcastle recording more than 2000 mm
evaporation per annum. This natural occurrence has an impact on the number of crop
growing days per year available to farmers.
In contrast, the southern coastal areas within the UGu District as well as the mountainous
regions of uThukela and Sisonke Districts experience the lowest average annual evaporation
rates. These evaporation rates have a significant influence on the type of agricultural
production suited to various regions.
Map 24: KwaZulu-Natal Average Annual Evaporation

Page 35 of 194
3.9 Climate Change
Popular media, thousands of scientific papers and a series of reports from the International
Panel on Climate Change all report that greenhouse gas emissions, often expressed through
increases in atmospheric CO2 concentrations are increasing and with that global
temperatures and sea level as indicated below.
Figure 2 - Indicators of Global Climate Change
Source: International Geosphere-Biosphere Program, 2010
These and other evidence of climate change have been used by the International
Geosphere-Biosphere Program to produce a composite climate change index, similar to
composite stock exchange indices, and the figure overleaf shows the clear rise in this index
since 1980.
According to Professor Roland Shulze (Shulze, 2010) further projected changes in global
climates in the future, will result in changes in the South African water production and
agriculture sector. Although it is not exactly known what the resultant consequences of future
global climate change will be in South Africa. According to Shulze, South Africa lies in one of
the regions of the world that is most vulnerable to climate variability and change. The impact
of climate change will thus drastically impact on the communities, their livelihood and the
food source of KwaZulu-Natal and South Africa as a whole.

Page 36 of 194
Figure 3 - Composite Climate Change Index
Source: International Geosphere-Biosphere Program, 2010
The potential impacts from a changing climate on South Africa can be considerable and
different regions of the country will likely be affected in many different ways.
A recent study aimed at mapping the
South African Farming Sector’s Vulnerability
to Climate Change and Variability,
conceptualized vulnerability to climate
change is as a function of three factors:
exposure, sensitivity, and adaptive
capacity as illustrated by the figure below.
Analyses of vulnerability of various
provinces in South Africa to climate
variability demonstrate vast diversity in
environmental and socioeconomic
conditions. The coastal provinces such as
KwaZulu-Natal, Eastern Cape and the
Western Cape exhibit the highest
frequency of extreme events (droughts
and floods) over the past century, whereas
the desert region of the Northern Cape
and the steppe arid regions of the North
West and Free State provinces exhibit the lowest frequency.

Page 37 of 194
The most agriculturally sensitive provinces—mainly due to their high proportion of smallholder
subsistence farmers—are the KwaZulu-Natal, Eastern Cape and Limpopo. Smallholder
farmers constitute 70 percent of the farming population in the Eastern Cape, KwaZulu-Natal,
Mpumalanga, and the North West province, and inappropriate land uses in these regions
have severely degraded land and reduced production capacity. Combining the indicators
for sensitivity and exposure, KwaZulu-Natal, Limpopo, and the Eastern Cape are predicted to
suffer the largest impacts of climate change and variability. With the exception of Limpopo,
these provinces have both the largest exposure and the highest sensitivity. A resulting ranking
of the relative vulnerability of the various provinces to climate change and variability is
illustrated by the figure below. It is evident that KwaZulu-Natal is considered to be the third
most vulnerable province after Limpopo and the Eastern Cape. Subsequently in order to
prevent possible loss of life, and ensure continuous food source for the province, KwaZulu-
Natal needs to prepare disaster management plans as well as strategies to systematically
change agricultural crops and productions methods along with weather patterns.
Figure 7 - Vulnerability Ranking in South Africa by Province
Source: International Food Policy Research Institute, 2009
3.9.1 Potential Impacts of Climate Change in South Africa
This section is extracted and adapted from a recent publication on the effects of climate
change by the Department of Social Development.
Climate Change and Variability may result in significant impacts on various sectors of South
African society and the economy. The South African Country Studies Programme identified
the health sector, maize production, plant and animal biodiversity, water resources, and
rangelands as areas most vulnerable to climate change. In brief summary the following
impacts could be expected:
• The geographic range of malaria could more than double in the next 50 years, putting
almost 8 million people at risk of whom 5 million did not previously live in areas at risk from
malaria;
Page 38 of 194
• Biophysical impacts will be most severe in the western part of the country, with a
projected complete loss of the unique Succulent Karoo.
• Mortalities and increased incidence of infectious diseases and respiratory diseases due to
increased surface temperatures.
• The incidence of malaria could increase with the expansion of habitats suitable for
mosquitoes that transmit malaria.
• Climate change may also alter the magnitude, timing, and distribution of storms that
produce flood events.
• Climate change could affect the frequency and spatial extent of livestock disease
outbreaks, such as foot and mouth disease.
• An increase in pests and diseases attributed to climate change, would also have a
detrimental effect on the agricultural sector, and invasive plants could become a
greater problem.
• The KwaZulu-Natal forestry industry is highly sensitive to climate change and the general
aridification in some areas, due to lower rainfall and higher air temperatures, could affect
the optimal areas for the province’s major tree crop species, and raise the marginal costs
associated with planting in sub-optimal areas.
• Climate change scenario modelling indicates that the area in South Africa covered by
the current biomes will decrease by 38–55% by the year 2050.
3.9.2 Responses to Climate Change in South Africa
In August 1997 South Africa ratified the United Nations Framework Convention on Climate
Change (UNFCCC) as well as the Kyoto protocol. It is the objective of the UNFCCC is to
achieve stabilisation of the concentrations of the greenhouse gases in the atmosphere at a
level that would prevent dangerous anthropogenic interference with the climate system.
The Department of Environmental Affairs and Tourism has been nominated to serve as the
lead department responsible for co-ordination and the implementation of South Africa’s
commitments and related matters in terms of the Convention.
The National Committee on Climate Change (NCCC) was established to act as an advisory
body to the Minister of Environmental Affairs and Tourism. Representatives from relevant
government departments, as well as representatives from business and industry, mining,
labour, community based organisations and non-governmental organisations constitute the
NCCC.
At government level a similar structure in the form of the Government Committee on Climate
Change (GCCC) was established. The purpose of the GCCC is to advise the directorate
climate change and ozone layer protection on matters relating to national responsibilities
with respect to climate change, and in particular in relation to the United Nations Framework
Convention on Climate Change and the Kyoto protocol. The GCCC does not advise the
National Committee for Climate Change (NCCC), but participate equally in the NCCC to
strengthen Government’s position
One of the first responses by the committee was the Initial National Communication on
Climate Change (2000) prepared in accordance with Article 12 of the UNFCCC. As required,
the Communication reported on: the national circumstances; the national inventories of

Page 39 of 194
greenhouse gases for 1990 and 1994; South Africa’s vulnerability to climate change and its
potential to adapt; the systematic observation and research undertaken in this field;
education, training and public awareness programmes required; projections and policies
made and measures taken; mitigation options and possibilities for adaptation; and a
preliminary needs assessment.
In 2002 South Africa hosted the World Summit on Sustainable Development (WSSD) or Earth
Summit in Johannesburg, convened to discuss sustainable development and related action
plans at a global level. During the summit the impacts of climate change on sustainable
development was acknowledged and reiterated within the resulting Johannesburg
Declaration on Sustainable Development as commitment by signatories to address this and
other sustainability factors.
In 2004 South Africa published a National Climate Change Response Strategy to serve as
framework for both public and private roleplayers. The strategy assists in guiding the key
research and response areas to climate change. The strategy further highlighted the need
for more detailed research in the South African context as well as the potential impacts of
climate change on key vulnerable regions and sectors within the country.
The result has been a number of research publications both scientific and awareness
oriented and included, inter alia:
South African Risk & Vulnerability Atlas, published by the Department of Science and
Technology in 2010,
Atlas of Climate Change and the Agricultural Sector in South Africa, published by the
Department of Agriculture, Forestry and Fisheries in 2011,
Atlas of Climate Change and Water Resources within South Africa, currently being
prepared by the Department of Water Affairs.
Since the UNFCCC entered into force, the parties have been meeting annually in
Conferences of the Parties (COP) to assess progress in dealing with climate change, and
beginning in the mid-1990s, to negotiate the Kyoto Protocol to establish legally binding
obligations for developed countries to reduce their greenhouse gas emissions. The 2011 COP
17 will be hosted by Durban in November 2011. At the World Economic Forum on Africa in
2010, President Jacob Zuma commented that “There are parts of the world where the
challenge [of climate change] is very severe. For some, it is a question of life or death. The
question that faces all of us is how we respond: Are we ready to have a legally binding
agreement that would try to accommodate all of us?”
Meeting the overall Millennium Development Goals (MDGs) by 2015 is highly challenged.
However, with the recent food, fuel and financial crises there is now more unlikely that these
target will be met, especially those related to health, education, and food security. As
gender equality, a critical element in achieving all MDGs cuts across all these key livelihoods
indicators, the threat of losing out on achieving gender equality and women’s
empowerment is much greater than ever before.
Added to this is the increased threat of climate change which is further likely to compromise
the limited gains made with regards to women’s role in food security and natural resources
management. The recent food crisis has resulted in calls for a clear focus on mitigating the
impact of climate change for increased and sustainable food security in support of rural
livelihoods. This has created a clear opportunity for addressing some of the constraints faced

Page 40 of 194
by women such as ensuring access to safe drinking water as well as sustainable
management of water resources, reducing land degradation, increasing forest conservation
and sustainable natural resources management. These have a direct impact on women’s
capacity to generate income and maintain livelihoods at the household level.
3.9.3 Rural Development and the Impact on the Physical Landscape
The Physical Landscape of the Province as illustrated in the preceding section has
highlighted a number of times that the province’s rural nature is firstly established by its
landscapes but also that the rural areas of the province is vulnerable due to the sensitivity of
the physical environment. For this reason it is imperative to consider the current focus on rural
development. The Ingonyama Trust Land within the province is briefly highlighted here as
any assessment of the physical environment has to consider the nature of land tenure which
impacts on land use and management of physical resources.
The map below illustrates the distribution of Ingonyama Trust Board (ITB) land within the
province. The trust is by far the largest private land holder in the Province: 40% of KZN’s total
land cover is under the custodianship of the ITB. This land is predominantly rural in context in
areas where high poverty levels prevail. This land is also in areas of high vulnerability in terms
of environment and water systems. The requirement of service provision and socio-economic
development in these areas is clear.
Map 25: Ingonyama Trust land within KwaZulu-Natal

Page 41 of 194
It is imperative that The Board operate in a strategic fashion in the development of these
areas if agricultural and development potential is to be unlocked in a responsible and
sustainable manner.
Issues of land tenure and release for development remains a vital aspect to address in order
to increase the tempo of service delivery and economic investment within rural areas. The
relatively low process productivity in accessing infrastructure delivery and development
options on Ingonyama Trust land especially needs to be improved and streamlined in order
that the communities within these areas benefit from public development programmes and
private sector investments.
Related to this is the need for increased pace in the Rural Land Reform process and the
necessity of establishing ownership rights and obligations on productive agricultural land. This
will include the empowerment of local farmers through skills development, equipment,
access to markets, capital finance and other support measures.
These rural areas are however still characterised by poor rural infrastructure and services
development due to a variety of reasons, ranging from inaccessibility and the sparse nature
of the settlements to a lack of maintenance and a shortage of skills.
3.10 Synopsis: Strategic Physical Landscape Issues
From the brief analysis of the Physical Landscape the following key challenges and impacts
have been identified as issues to be considered during the further phases of the PGDS
process:
KwaZulu-Natal is well endowed with water resources, however increasing demand
coupled with population and economic growth is leading to added pressure on the
water sources.
The quantity of surface water is under pressure due to the demands by forestry,
agriculture (irrigation), domestic and industrial users, which leads to decreasing
ecological health of water sources.
Water demand exceeds availability in two of the three Water Management Areas in
the Province (uThukela, uMvoti and uMzimkhulu) and these areas thus become
susceptible to drought.
Pressures for urban settlement, economic growth and associated infrastructure which
results in the permanent loss of prime arable land.
Declining returns from agriculture is driving farmers to sub-divide and transform their
land to other more profitable, non-farming uses.
There is an alarming decline in the area of high potential land which is under
cultivation.
KwaZulu-Natal is rated as one of the two provinces within South Africa with the most
serious levels of land degradation.
The area of eroded land in the Province increased by 57% from 1994 to 2000.

Page 42 of 194
The fertility of arable soils has declined as a result of continual agricultural production
that removes nutrients and causes other impacts such as soil acidification and
compaction. This results in increased production costs.
KwaZulu-Natal's coastal environment is under threat from increasing demand for
supply facilities for shipping, mining, poor catchment management, water
abstraction, invasive alien species and climate change.
Exploitation of coastal resources along the KwaZulu-Natal coast is mounting with the
growing global demand for seafood products which is a strong economic
inducement for fisheries.
There are four designated Marine Protected Areas along the KwaZulu-Natal coast.
Current Protected Areas do not meet the minimum necessary for the protection of
estuaries or fish and there are no open or deep water Protected Areas.
Climate Change is anticipated to have a significant impact on weather variability
and agricultural production within KwaZulu-Natal which will in turn impact on the
most vulnerable rural communities.

Page 43 of 194
4 THE ENVIRONMENTAL LANDSCAPE
4.1 Introduction
The diversity of the natural resources in the province of KwaZulu-Natal is enormous. The
topography ranges in elevation from sea level to over 3 000 m, resulting in a considerable
range in temperature, while the topography varies from the undulating coastal plains of
Maputoland to the rugged, broken terrain of the Valley of a Thousand Hills and the
precipitous mountains of the Drakensberg. The rainfall also varies considerably, from
approximately 580 mm to over 2 000 mm per annum. The geological formations of the
Province run roughly north to south across an eastern-sloping terrain while the river systems
run west to east, resulting in deeply incised valleys, cutting through the geological layers.
With this great variation in topography, climate and geology, one could expect a wide
variation in soil patterns and this is indeed so. Deep sands are found along the northern
coastal belt, young weathering soils in the steep valleys, well-drained, deep soils are a
feature of the midlands and the highland areas and poorly drained and duplex soils are
common in the upland areas where the rainfall is below 750 mm per year.
In turn, the vegetation is affected by the changes in topography, rainfall and soils. Bushveld
is found in the low-lying hot and dry areas of northern KwaZulu-Natal and in most of the river
systems. In the high rainfall areas of the coastal belt, the midlands mistbelt, highland sourveld
and the mountains of the Drakensberg, different forms of forest are found in areas which are
protected from fire. In the northern plains of the province a tall grassveld is characteristic
while in the cold highland areas the grassland is typically short.
The importance of the correct use of the natural resources to the overall economy of the
KwaZulu-Natal region cannot be over-emphasised. The degradation of the natural resources
is also a matter of grave concern and both this and the economic pressures placed on
agriculture indicate the urgent necessity for matching crop and animal requirements with
the production potential of the natural resources.
This great variation in the natural resources in turn leads to variations in the type of farming
and levels of production throughout the province. It can be seen that the challenge of
providing for sound ecologically based development planning in agriculture and other fields,
is a major problem when the complexity of the KwaZulu-Natal natural resources is
considered.
The long term Environmental Integrity of KwaZulu-Natal is dependent on addressing the
anticipated impacts of not only the strategic growth and development interventions
envisaged by the Provincial Growth and Development Strategy, but also the existing
unsustainable practices and survivalist strategies employed by communities. Recent studies
has further revealed that KwaZulu-Natal is both largely dependent on its natural resources for
growth and development, as well as arguably the most vulnerable province to
environmental degradation from both the human and external factors such as climate
change and variability.
Compared to most of the central and western provinces of South Africa, KwaZulu-Natal has
productive land. The land productivity is however constantly being affected by land use
change and land degradation resulting in long term threats. The province however still have
the potential to ensure food security for its vulnerable rural communities as well as its growing

Page 44 of 194
urban populations through effective and sustainable land management to properly
development the land potential while drastically reducing land degradation.
The rivers, dams and freshwater sources within KwaZulu-Natal accounts for almost 40% of all
the water within South Africa. However, the quality and availability of these water resources
to communities and economic activity is questionable. The demand for the provinces water
resources further increases with the demand for improved standards of living envisaged
within the provinces growth and development path. This implies that planning for the
development of the province, need to be balanced with the improvement and
management of water resources as well. Especially the riverine areas area anticipated to
hold the key to improved water management within KwaZulu-Natal. It is along the 400 000
km of river frontage within the province where the largest impact on the extraction and
pollution of water occurs.
An evaluation of the status of the river eco systems revealed that all of the major rivers within
KwaZulu-Natal are vulnerable, including the Mzimkulu, Mkomazi, Mgeni, Tugela and Pongola
Rivers and these will need to be rehabilitated and managed as key environmental corridors
within the province. Apart from the vulnerability of the major rivers, the Slang / Bivane river
(between Volksrust & Utrecht ) as well as the Mzinene, Wya & Nyalazi rivers flowing into Lake
St. Lucia are recorded as the most endangered river eco systems within the province and will
require intervention.
The biodiversity of KwaZulu-Natal represents some of the most unique systems in the country
and need to be protected for countless potential benefits in terms of food security,
environmental health, variability resilience as well as the vast economic potential it holds for
all sectors of the economy from agriculture to tourism. There exist a fine interaction and
interdependency between development and biodiversity and as the demand for
development increase, so too does the need to better manage the province’s biodiversity.
Although various public and private roleplayers are actively dedicated to protecting and
managing the balance between biodiversity and development within KwaZulu-Natal, these
efforts are still widely un-coordinated and will need to be addressed to achieve a singular
effort towards integrated sustainable development. As a number of the eco-systems of the
province crosses its borders, it is vital that effective partnerships towards sustainable
development is forged not only by internal roleplayers, but with the provinces of the Eastern
Cape, Free State and Mpumalanga as well as with the three international neighbours of
Swaziland, Mozambique and Lesotho. The further strengthening and management of the
existing Trans Frontier Conservation Areas (TMCAs) could play a vital role in this regard and
provide a vehicle for such international co-operation and partnerships.
The province does not currently produce its own electrical power and the economy has an
energy intensive coal based nature. The growth and development of KwaZulu-Natal is
believed to require that the province becomes more self-sufficient in its electricity production
as well as to use its unique environment towards the production of electricity form alternative
and more renewable resources. The province has some of the highest hydro-electrical
potential within South Africa due to the velocity of the water flow in its rivers as well as the
escarp of the Drakensberg providing the best localities. Both Macro and micro hydro-
electricity production has a significant potential in the province. Other forms of alternative
energy production such as Wind, Solar and Biomass generation has also shown potential
within the province and could further be explored.

Page 45 of 194
4.2 Ecological Biomes
Ecological Biomes can be defined as the major ecological communities of the world,
classified according to their predominant vegetation and characterised by adaptations of
organisms to that particular environment. The 8 Biomes in South Africa includes the
Succulent Karoo, Savannahs, Fynbos, Grasslands, Forests, Nama-Karoo, Marine and Coastal
Ecosystems and Wetlands.
For KZN, the biomes of Savannah, Grasslands, Forests, Marine and Wetland biomes are
important. Biomes are composed of several ecosystems and represent a regional community
of organisms named after the dominant vegetation.
Map 26: KwaZulu-Natal Vegetation Bioregions
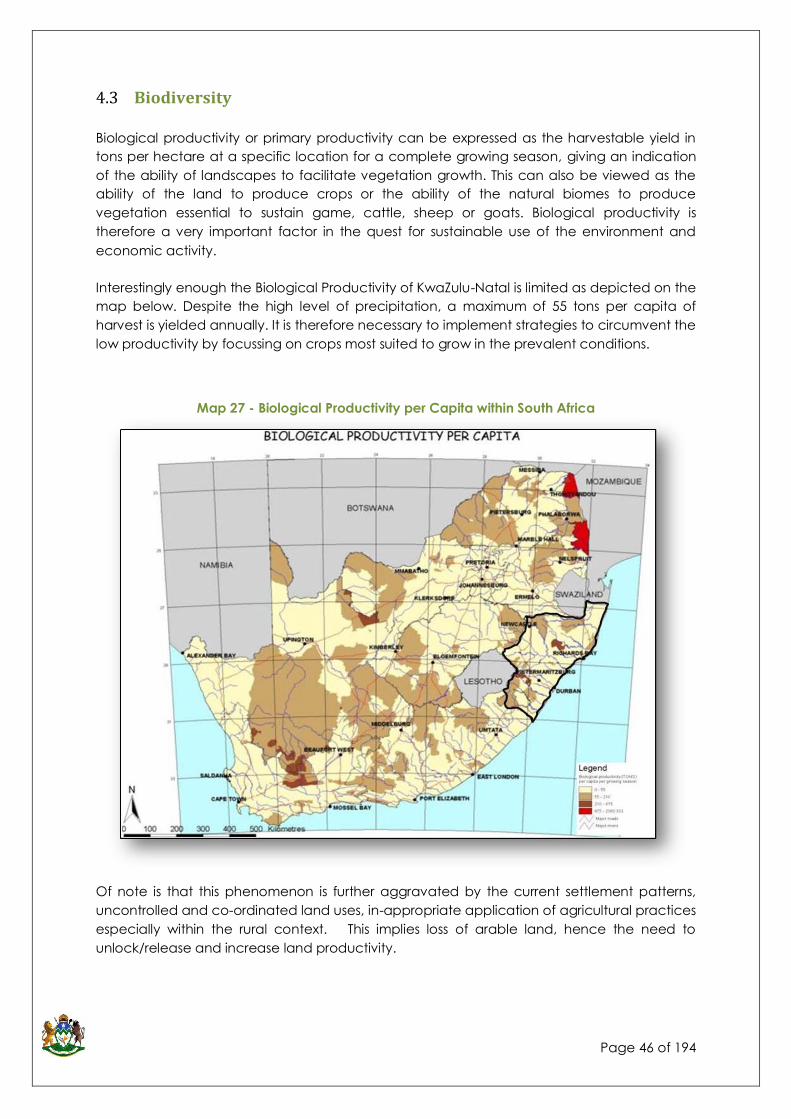
Page 46 of 194
4.3 Biodiversity
Biological productivity or primary productivity can be expressed as the harvestable yield in
tons per hectare at a specific location for a complete growing season, giving an indication
of the ability of landscapes to facilitate vegetation growth. This can also be viewed as the
ability of the land to produce crops or the ability of the natural biomes to produce
vegetation essential to sustain game, cattle, sheep or goats. Biological productivity is
therefore a very important factor in the quest for sustainable use of the environment and
economic activity.
Interestingly enough the Biological Productivity of KwaZulu-Natal is limited as depicted on the
map below. Despite the high level of precipitation, a maximum of 55 tons per capita of
harvest is yielded annually. It is therefore necessary to implement strategies to circumvent the
low productivity by focussing on crops most suited to grow in the prevalent conditions.
Map 27 - Biological Productivity per Capita within South Africa
Of note is that this phenomenon is further aggravated by the current settlement patterns,
uncontrolled and co-ordinated land uses, in-appropriate application of agricultural practices
especially within the rural context. This implies loss of arable land, hence the need to
unlock/release and increase land productivity.

Page 47 of 194
4.4 Wetlands
The 24 wetlands identified and addressed in the KwaZulu-Natal State of the Environment
Report, are depicted in the table below:
Table 2 - Wetland Goods & Services within KwaZulu-Natal
Wetland Name Comments Concerning goods & services
Pongola Floodplain
Easily the largest subsistence fishery from a natural inland wetland in South Africa. Also very
extensive grazing lands, although both have been reduced through the effects of the
upstream dam and through extensive on-site cultivation.
Muzi Swamp Extensive harvesting of Phragmites reed beds, particularly within the Tembe Elephant
Reserve.
Mkuze Swamp An extremely important role in trapping sediment that would otherwise enter Lake St Lucia.
Multiple resource use, including papyrus for weaving.
Mfolozi Swam Provide very productive land for what is probably the most extensive wetland area in
south Africa which has been drained and planted to commercial sugar cane.
Aloeboom Performs a critical function in the trapping and retention of pollutants from coal mine
drainage in the wetlands catchment.
Mvamanzi Pan Prior to its desiccation it was important for subsistence fishing. Now is an important source
of grazing and SchoenopIectus corymbosus for weaving.
Stilwater
Pre-dominantly temporary to seasonal nature of the wetland makes it readily accessible
for agriculture.
Mhlatuze Swamp
The strategic location of the wetland around lake Mzingazi (which is a water source for
Richards Bay Town) and the Mhlatuze estuary makes the wetland very important for waste
assimilation.
Blood River 0ne of SA's largest inland wetlands providing extensive and very important grazing lands.
Paddavlei
Very important grazing lands. Entire wetland 1s accessible to livestock.
Boschoffsvlei Important for livestock grazing & cutting hay
Groenvle
Important for livestock grazing
Wakkerstroom One of the most important wetlands in south Africa for bird watching,

Page 48 of 194
Nyamvubu Important breeding site for red data Species
Hlatikulu Important for environmental education, being located next to an environmental
education centre.
Boschberg Important for livestock grazing
Ntabamhlope One of the best hydrologically monitored wetlands in south Africa, making it of high
research value.
Stillerus Site for breeding red data species – the most endangered ?
Mvoti One of the largest natural permanent reed marshes in SA
uMngeni “Sponge” Very Important site for breeding red data species
Franklin A high level of agricultural activity, sewerage and other waste disposal from the town of
Franklin adjacent to the wetland. The wetland is assimilating pollutants that could
potentially contaminate the water supply to Kokstad. Also supports Red Data bird species.
Kromrivier Vlei Important for grazing / very scenic
Ntsikeni Site for breeding Red Data bird species.
The Swamp Cyperus marginatus growing in the wetland-used as a fibre source for weaving a variety of
traditional and new products.
Source: State of Environment report KZN, 2004
Of the indicated wetland areas, seven of these are major wetlands, with four of the seven
registered as RAMSAR sites. RAMSAR refers to the Convention on Wetlands which is an
intergovernmental treaty that provides the framework for national action and international
cooperation for the conservation and wise use of wetlands and their resources. It was
adopted in the Iranian City of Ramsar in 1971 and came into force in 1975, and it is the only
global environmental treaty that deals with a particular ecosystem. The Convention's
member countries cover all geographic regions of the planet.

Page 49 of 194
Table 3 - RAMSAR and Wetlands International Sites within KwaZulu-Natal
Site Information RAMSAR Summary Description
St. Lucia System
RAMSAR No: 1ZA006
Designation date: 02-10-
1986
Coordinates: 28°04'S
032°28'E
Elevation: 0 m - 130 m
Area: 155,500 ha
St. Lucia System. 02/10/86; Kwazulu/Natal; 155,500 ha; 28º04S 032º28E. Added to the
Montreux Record, 4 July 1990, removed from the Record, 11 March 1996. Wetland
Park, State Forest Reserve. Coastal wetlands system associated with Lake St. Lucia
and consisting of several principal habitat types. Supports the largest estuarine
prawn nursery area in South Africa. An important migratory bird staging area,
feeding ground for flamingos, and spawning and nursery area for many of the 82
species of fish supported. It is also a breeding area for crocodiles. Large mammals
include hippopotamus and black rhino. Human activities have included cattle
grazing, slash and burn cultivation, and the planting of Pinus elliottii. The site is an
important recreational area offering many facilities and activities. The site was
threatened by large-scale mining for heavy metals but spared. Subject of a Ramsar
Advisory Mission in 1992. A case study is available. Ramsar site no. 345. Most recent
RIS information: 1998.
Kosi Bay
RAMSAR No: 1ZA011
Designation date: 28-06-
1991
Coordinates: 27°01'S
032°48'E
Elevation: 0 m - 102 m
Area: 10,982 ha
Kosi Bay. 28/06/91; Kwazulu/Natal; 10,982 ha; 27º01S 032º48E. Nature Reserve.
Composed of four interconnected lakes subject to tidal influence, an estuarine
channel, and three extensive swamps. Fresh water is derived from three permanent
rivers. Principal habitats include swamp and mangrove forest, reedbeds, dune
systems with associated woodland, and coastal grassland. The site supports a diverse
bottom-dwelling invertebrate fauna (30 species) and a rich fish fauna, including
eight endangered species. Several birds, mammals, butterflies, and plants are
endemic, threatened or endangered. Large areas of swamp forest have been
subjected to non-sustainable slash and burn cultivation practices. Human activities
include subsistence farming and fishing. Ramsar site no. 527. Most recent RIS
information: 1988.
Lake Sibaya
RAMSAR No: 1ZA012
Designation date:28-06-1991
Coordinates: 27°20'S
032°38'E
Elevation: 20 m - 20 m
Area: 7,750 ha
Lake Sibaya. 28/06/91; Kwazulu/Natal; 7,750 ha; 27º20S 032º38E. The largest natural
freshwater lake in South Africa, separated from the ocean by forested dunes;
includes areas of swamp forest and wet grassland. A large variety of endangered or
endemic species of reptiles, fish, birds, mammals and plants occur. The site is
important for numerous species of breeding birds and supports the second largest
population of hippopotamus in Kwa Zulu. The lake supports a diverse zooplankton
fauna, 15 species of aquatic and 43 species of terrestrial molluscs, as well as flora
and fauna unique to South Africa. A research station is located within the site. The
lake provides water for Mbazwane and Vasi. Human activities consist of livestock
grazing and cultivation. Ramsar site no. 528. Most recent RIS information: 1988.
Natal Drakensberg Park
RAMSAR No: 1ZA013
Designation date:21-01-1997
Coordinates: 29°30'S
029°45'E
Elevation: 1300 m - 3377 m
Area: 242,813 ha
Natal Drakensberg Park. 21/01/97; Kwazulu/Natal; 242,813 ha; 29º30S 029º45E.
Wilderness Area, Nature Reserve, Game Reserve, Provincial Park, State Forest. Set in
an extremely rugged area that includes three altitudinal zones along the border
between South Africa and the Kingdom of Lesotho, The Drakensberg is regarded as
the most important mountain catchment in South Africa due to its high yield and
water quality, supplying rural, agricultural, urban and industrial users downstream.
Conserved since the turn of the century, the entire wetland system is in near-pristine
state. The three largest rivers in Kwa Zulu-Natal originate here, supporting extensive
wetlands of various types within the Afro-alpine and Afromontane belts. The area
supports numerous endemic and endangered plant and animal species. Human
activities include nature conservation and a variety of outdoor recreation activities.
There are a research station and a conservation education center available. The site
is renowned for the quantity, quality and variety of prehistoric rock art. Many parts
are declared wilderness areas. Ramsar site no. 886. Most recent RIS information: 1996.
Ndumo Game Reserve
RAMSAR No: 1ZA014
Ndumo Game Reserve. 21/01/97; Kwazulu/Natal; 10,117 ha; 26º53S 032º16E. Nature
Reserve. Situated at the junction of the Usuthu and Pongolo floodplain systems, the
site forms the largest floodplain system in South Africa, consisting of five wetland
types, from fresh to brackish, permanent to ephemeral lakes, marshes and pools, as

Page 50 of 194
Designation date:21-01-1997
Coordinates: 26°53'S
032°16'E
Elevation: 18 m - 170 m
Area: 10,117 ha
well as riparian and gallery forest. Well known for its abundant bird life and diversity
of species, internationally important numbers of several species are supported,
including many that are rare or vulnerable. Human activities include controlled
harvesting of reeds and sedges, low-density tourism, an important fishery, illegal
black and white rhinoceros hunting, and collecting river water for sale in nearby
communities. A large agricultural irrigation scheme is operating erratically south of
the reserve in the catchment area. Ramsar site no. 887. Most recent RIS information:
1996.
Source: Department of Environmental Affairs & Tourism (DEAT)
Each of these areas represents both a significant ecological resource as well as a major
tourism opportunity.
4.4.1 Integrity of Wetlands
The KwaZulu-Natal State of the Environment Report depicts the “health” of wetlands and
rivers by evaluating the number of species (endemic to the environment) that are present.
Wetland integrity is measured in terms of the number of Wattled Crane Breeding Pairs
present. Wattled cranes are the rarest of the Crane species, and will only thrive in optimal
conditions. Subsequently it is a very good indicator of the condition of a wetland.
Map 28: Number of breeding pairs of wattled cranes
Source: KwaZulu-Natal State of the Environment Report

Page 51 of 194
The above figures depicts that wetlands in the western region of KwaZulu-Natal are better
preserved than in other areas. These are also the least densely populated areas within the
Province. This indicates that aggressive strategies should be implemented in order to protect
the remaining wetland areas, which fulfil environmental roles such as water storage, stream-
flow regulation, flood attenuation, sediment trapping, waste assimilation, wildlife protection,
recreation and education, crop production, livestock grazing, fish (food), and fibre (building
material/weaving).
4.5 Marine and Coastal Environment
The coastline of KwaZulu-Natal stretches for 640km and encompasses two bio-geographical
zones (Natal and Delagoa) and supports a greater number of marine species than any other
equivalent length of the South Africa Coast. In total, 73 estuaries enter the sea in the
province and the coast is heavily ultilised for a variety of purposes.
Worldwide, growing population and industrialisation have made oceans increasingly
susceptible to damage; to the extent that all human activities impact on the coast.
Urbanisation places increasing burdens on the storm water drainage of cities, with sanitation
systems also contributing to pollution and damage of the coastal environment. The
following potential impacts will need to be considered during the further consideration of
development strategies within the province:
• Increasing demand for extension of port operations: facilities for freight-handling and
increased accommodation of vessels leads a port to become an industrial zone – with
potential threats to the environment. In the case of Durban Port – a delicate balance will
have to be sought as the port is also supposed to cater for the tourist trade.
• Mining, poor catchment management, illegal and unplanned water abstraction,
invasive alien species and the effects of climate change in temperature, rainfall can
result in serious habitat loss. This not only affects the positive natural balance of
biodiversity but also threatens the tourist trade.
• Property development of any type on the coast results in land transformation which
interrupts sand replenishment of beaches and dunes and sediment flow through
estuaries. Coastal pollution and poor water quality in the ocean is also inhibiting various
ecological processes and the delivery of associated goods and services.
• Up to 50% of the estuaries in the Province are likely to be negatively affected by pollution,
to the extent that their functioning as estuarine ecosystems may be impaired. Others may
be unfit for human recreation. Of particular concern is the cluster of estuaries
immediately south of Durban Bay.
• Exploitation of coastal resources along the KwaZulu-Natal coast is mounting with the
growing global demand for seafood products which is a strong economic inducement
for fisheries. Marine and coastal biodiversity is therefore declining and stocks of several
resource species have collapsed or are severely over-exploited.
• There are four designated Marine Protected Areas along the KwaZulu-Natal coast.
Current Protected Areas protocols do not meet the minimum requirements necessary for
the effective protection of estuaries or fish, and neither are there open or deep water
Protected Areas as part of the protocol. Overall coastal protection in the Province is
Page 52 of 194
relatively high, however the distribution of services (shore patrols and boat inspections)
along the coast is uneven.
4.6 Preservation of Natural Resources
The following discussion on the preservation of KZN’s natural environment considers both the
identification of sensitive / vulnerable landscapes and species and it considers the current
conservation and protection status of these areas. The information is presented in some
detail to provide the basic information about how preservation can be managed but also to
illustrate that it is a complex process which requires strict regulation and this is where the
authority of the Province should be directed.
4.6.1 Sensitive Features
The Environmental Potential Atlas of South Africa depicts the total number of all sensitive
features. These features include Wetlands, Sandstone, Residential Areas. Each item has been
assigned a value of 1 (sensitive) or 0 (not sensitive), thereby identifying whether a specific
feature is considered environmentally sensitive.
The areas with the highest number of sensitive features are on the western boundary of the
province, North Eastern part of the province, and on the boundary between KwaZulu-Natal
and Mozambique. This is also where the two RAMSAR sites are situated. As with biologically
sensitive areas, methods need to be devised to ensure minimal negative impact to these
sensitive features from human activity.
4.6.2 Sensitive Species
For biodiversity conservation to be effective, actions for the conservation of regional species
should be representative of the biodiversity found within the particular region. This approach
provides a basis for determining priority within regional conservation action plans.
These species are identified on the following basis:
Range found within a region (relative endemism),
Regional occupancy (density of distribution),
Taxonomic distinctiveness (uniqueness)
Threat of local extinction in terms of their vulnerability, based on Red Data Book status
The map below represents the total number of sensitive species of fauna found in a specific
area.

Page 53 of 194
Map 29 - Concentration of Total Number of Sensitive Species
Subsequently it is required to implement measures that will ensure the safety and survival of
the mentioned species. This can be done through sensitive and formalised land use planning,
and the implementation of development procedures to minimise the uncontrolled impact of
human activity onto habitats. Especially relevant in this case is the planning and land use
management of the land under the jurisdiction of traditional authorities, where settlement of
the population is uncontrolled from the point of view of sustainable environmental practise –
based on larger strategic planning and land use management principles.
4.6.3 Vegetation Classes Remaining Intact
The map below illustrates the percentage of each vegetation class remaining intact after
human impacts. Here is presented information on the naturally-occurring vegetation classes
which remain intact today after the impact of human and commercial development. It is
important from the point of view of preserving bio-diversity and for creating / maintain
pleasant conditions in and around development nodes.

Page 54 of 194
Map 30 - Vegetation Classes Remaining Intact within KwaZulu-Natal
In correlation with the population distribution of the province, the vegetation classes
remaining intact are least around the populated areas of eThekwini and Pietermaritzburg. In
addition, the entire central and southern coastal region of the province has limited intact
vegetation classes within only about 45% of the vegetation classes remaining intact.
As could be expected, the terrain within the mountainous western portions of the province as
well as the northern portions of Amajuba and uMkhanyakude districts are some of the most
intact areas within the province. The concentration of eco-tourism within these areas are a
testimony to this and hence also dependant on the retention of these vegetation classes
and ecosystems.
Similar to the percentage of vegetation classes remaining intact, the observed conservation
status refers to the level to which habitats are threatened due to the presence of human
activity and the subsequent impact made on the vegetation in the region are illustrated by
the map below (using the standardise IUCN classification). As with the previous map, this
layer was scored by a panel of botanists from the South African National Biodiversity
Institute).

Page 55 of 194
Map 31 - Need for Conservation Map
From the map above it is evident that selected areas on the coastal region are critically
endangered, especially to the north on the more evenly sloped areas in uThungulu and
uMkhanyakude Districts. One specific vegetation type that stands out is the “Sand Forests”
that occur on high terraces inside and to the South of Tembe Elephant Park.
Most of the coastal areas are considered endangered and this could be ascribed to the
high impact that the population densities and settlement patterns have on these areas.
Presently about 40% of the world’s population live along the coast. Sensitive dune habitats
will there for always require protection. The interior of the province is largely classified as
vulnerable. It must be noted, that although previous impact on the environment is the cause
of the vegetation being classified as endangered, currently these areas are properly
managed. It should however also be noted that there is often less land use management in
the interior and highly rural areas of the province which needs to be monitored carefully.
When comparing the Need for Conservation to the Protection Status map, it is clear that the
critically endangered vegetation do receive protection. This is in the form of formally
managed parks but also community conservancies where the hosts of the land choose
conservation and ecotourism as the most viable land use with the conservancy being
managed for their benefit. In this communities could manage their land sustainably as it is

Page 56 of 194
seen as a land use option that unlocks the potential of their resources, and this is a model
which could be replicated with great advantages.
The map below illustrates the vegetation types classified according to the current level of
formal protection they enjoy under the national conservation estate. The number of hectares
in which each vegetation type is protected in the national conservation estate is calculated
as a percentage. The higher percentages point to a sufficient level of protection. The effect
of the uKhahlamba Drakensberg Park is evident with some of the local vegetation types
being up to 90% protected. The lower the percentage, the higher the priority to afford some
level of protection becomes. Similar areas where formal protection affects this calculation
positively is the iSimangaliso Wetland Park with Tembe Elephant Park, Ndumo Game Reserve
and the Usuthu Gorge Community Conservation area which all contribute to the protection
of the internationally recognised Maputaland Biodiversity Hotspot. These areas are also world
heritage sites, and attract large volume of international tourists within the Province.
Areas highlighted as requiring further protection are the southern parts of the Indian Ocean
Coastal Belt and the Sub-escarpment savanna. These are places where community
conservation areas could be investigated if found to be the ideal land use given the
biophysical conditions and parameters of access and development.
Map 32 - KwaZulu-Natal Protection Status Map

Page 57 of 194
4.6.4 Protected Areas
The map below depicts the current provincial conservation estate in a broad range of
protection classes from provincial nature reserves, community conservancies and partnership
parks. It also highlights as focus areas to possibly be included as part of the National
Protected Areas Expansion Programme (NPAES) within KwaZulu-Natal based on keeping
biodiversity corridors intact.
It is further important to note that the potential expansion areas identified as part of the
National Protected Areas Expansion Programme can further be prioritized at a provincial
level by considering the scientific conservation worthiness of areas outside of the national
conservation estate with specific consideration of areas playing a role in connecting other
areas of important and high biodiversity. The result is an identification of the conservation
worthy areas according to a Critical to Low scale set as illustrated by the map below.
Map 33: KZN Conservation-worthy potential Expansion Areas

Page 58 of 194
Transfrontier Conservation Areas
KwaZulu-Natal is partial hosts to two Trans-Frontier Conservation Areas (TFCA) namely the
Moluti/Drakensberg TFCA, as well as the Lubombo TFCA.
The Maloti-Drakensberg Transfrontier Conservation Area is a collaborative initiative between
the Governments of the Kingdom of Lesotho and the Republic of South Africa. The main
objectives of the project are to conserve the globally significant biodiversity that occurs in
the catchments of the 300km border straddling the Maloti and the Drakensberg mountains,
and to stimulate integrated nature-based tourism development with maximum participation
of local communities. The two components are in stark contrast as the KwaZulu-Natal side is
actively managed for conservation while the Lesotho side is communal land where stock
grazing is one of the few activities that takes place.
The Lubombo TFCA is a unique and complex TFCA, consisting of five smaller TFCAs. The
Lubombo Transfrontier Conservation and Resource Area (TFCA) Protocol was signed
between the Governments of Mozambique, South Africa and Swaziland on 22 June 2000. It
also hosts a strong marine component with many turtle nesting sites present with popular
diving and other ecotourism destinations. These smaller TFCAs are as follows:
Ndumu-Tembe-Futi TFCA, between Mozambique and South Africa (SA).
Ponto do Ouro-Kosi Bay Marine and Coastal TFCA, between Mozambique and SA.
Nsubane-Pongola TFCA, between SA and Swaziland .
Lubombo Conservancy-Goba TFCA, between Mozambique and Swaziland
Songimvelo-Malolotja TFCA, between SA and Swaziland (recently incorporated into
Lubombo TFCA.
The maps below depict the locality of the TFCA, as well as the three accompanying border
posts situated near the Conservation areas, but do not form part of the conservation areas.
An important aspect to consider is that tourists can cross international borders with minimal
effort (so called “soft” border posts). It is therefore necessary to ensure proper management
of the movement of people. It is also necessary to ensure that complete memoranda of co-
operation and agreement are entered into between the two governments and that
responsibilities are clearly defined.
Another important consideration is that wildlife, domestic animals, and people are coming
into contact more frequently and formal policies and more importantly, practice, on animal
disease control are required otherwise there will be negative impacts on public health,
agriculture and commerce if not managed correctly.
4.7 Energy Resources
A global phenomenon and challenge that South Africa is continually faced with is the issue
of cost effective and renewable energy. Energy is critical to virtually every aspect of the
province’s economic and social development, contributing to about 15% to the country's
gross domestic product (GDP). Depending on the manner in which it is produced,
transported and utilised, it can contribute to environmental degradation, such as air

Page 59 of 194
pollution, impact on biodiversity, global warming and other related environmental problems,
principally effecting climatic change.
Providing affordable, adequate, and reliable modern energy supplies remains a major
challenge, even though access to electricity has increased from one-third to two-thirds of
the population since 1994. (Winkler, 2003)
Ensuring affordable energy is within reach of everyone is a key national goal and due to
large coal deposits, South Africa is able to offer cheap (by international standards) electrical
power to its residents and industries. At the same time, planning ensures that this key driver of
economic growth is delivered reliably and cost-effectively to industry, commerce and
agriculture. The Department of Minerals and Energy’s Energy Policy is based on the following
key objectives:
attaining universal access to energy by 2012
ensuring accessible, affordable and reliable energy, especially for the poor
diversifying primary energy sources and reducing dependency on coal
practising good governance, which must also facilitate and encourage private-sector investments in the energy sector
providing energy in an environmentally responsible manner.
Investment in renewable energy and energy efficiency is important to reduce the negative
economic, social and environmental impacts of energy production and consumption in
South Africa. The aim of renewable and sustainable energy refers therefore to the
generation of electricity whilst the carbon footprint of the operation is reduced. Potential
sources of renewable energy includes wind, bagasse, wood, hydro, solar, agricultural waste,
wood waste, to name a few. Apart from the availability of resources, it is also necessary to
reduce the carbon footprint of operations on the environment, whilst considering the
following:
Researching sources, applicability and cost effectiveness of the different types of
renewable energy
Waste recovery and recycling
Considering and implementing “Green Economy” principles
The different types of Food for Work and Food for Waste programmes
As indicated before, there is a strong dependency within the province on coal based
energy generation. It is therefore prudent that the province investigates, considers and
commit to potential alternative sources of energy as a matter of priority to ensure a more
sustainable energy mix by 2030. Fossil fuel generation will undoubtedly still be a substantial
part of the equation. However, it is clear that any future low carbon energy infrastructure will
have to include a significant proportion of energy generated from renewable sources – most
scenarios showing the proportion of primary energy having to reach 40-50% by 2050. Some of
the leading technology contenders are emerging and, in some cases have begun to build
significant experience.

Page 60 of 194
4.7.1 Air Quality
Air pollution can be classified as the emission of chemical compounds into the air as a result
of anthropogenic and natural activities, which have the potential to impact negatively on
air quality and the environment.
Closely related and very involved with global warming and the search for alternative energy
sources, the below images depicts how the present level of smoke as well as sulphur dioxide
in the air increased during the period 1950 to 1999.
Map 34: Mean Winter Smoke Concentration
Source: Data obtained from CSIR National Survey of Smoke and Sulphur Dioxide

Page 61 of 194
Map 35: Mean Winter Sulphur Dioxide Concentration
Source: Data obtained from CSIR National Survey of Smoke and Sulphur Dioxide
It is clear that emissions into the air peaked during the 1980’s. With the growing awareness of
global warming, as well as improved technology, the emissions declined slightly towards the
end of the century. Presence of smoke and sulphur dioxide is still very high, and measures
need to be implemented to reduce emissions harmful to the environment.
4.7.2 Wind Energy
Wind Energy can effectively be categorised into two main areas, namely:
Offshore Wind: When the best sites for onshore wind have been snapped up, the next
place to look for large quantities of renewable energy is offshore. Offshore wind offers
enormous potential, with stronger more predictable winds and almost unlimited
space for turbines. Planning permission can be easier to obtain than onshore, farms
can be built at cost effective scales impossible on land, and the availability of space
is almost unlimited if deep waters are mastered.

Page 62 of 194
Onshore Wind: The most mature of the renewable energy sectors, the onshore wind
industry saw 21GW built in 2007, bringing installed capacity to over 100GW.
Within KwaZulu-Natal, the highest wind energy potential is mainly concentrated within the
northern coastal areas of uMkhanyakude District as illustrated adjacent.
Map 36 - Wind Power Potential within South Africa
4.7.3 Solar Energy
Solar Energy can also effectively be categorised into two main areas, namely:
Solar Photovoltaic Power: Photovoltaic (PV) technology has made very rapid strides in
the past four years, in terms of reducing the cost of crystalline silicon (its main
component) and commercializing thin film technology.
Solar Thermal Electricity Generation: While PV is ideal for smaller projects and
integrated into buildings, the technology of choice for big solar plants in the world’s
deserts looks set to be Solar Thermal Electricity Generation (STEG): concentrating the
heat of the sun to generate steam, which can be used in conventional and highly
efficient turbines.
Productive solar energy requires sufficient annual shortwave radiation in order to be deemed
feasible. The annual direct and diffuse solar radiation for South Africa is mapped below.

Page 63 of 194
Map 37: Annual Solar Radiation within South Africa
From the map above it is evident that the western and north western regions of South Africa,
mainly the Northern Cape and North West Provinces receive the highest annual solar
radiation and are thus best suited to the production of solar energy. The KwaZulu-Natal coast
from Durban southward represents an area with the least recorded annual solar radiation
and subsequently the least potential for the large scale production of solar energy. This
comment does not exclude the micro-scale installations on individual buildings – which still
remains a cost effective option for the user. The only possible areas suitable for large scale
solar energy generation are within the western inland areas of the province within the
uThukela District.
4.7.4 Hydro Energy
The CISR, Eskom Corporate Technology, and the Department of Minerals & Energy, jointly
conducted a study to determine the possibility of hydroelectricity as an alternative means to
generate electricity. They distinguish between macro hydro-electricity schemes which
generate electricity for regions, as well as micro hydro-electricity schemes which generate
electricity for localised areas to supplement existing and more traditional means of electricity
generation.
Macro power potential was determined using the cumulative mean annual flow volume
along a river length. Due to the topography and the high rainfall, KZN provides ample
opportunity to implement macro hydro electrical schemes.

Page 64 of 194
Map 38 - South African Macro Hydro Power Potential
In comparison, micro power potential is modelled using the mean annual flow volume for a
one kilometre stretch along a river. This approach gives a better estimate of local energy
potential and highlights the potentials of fast flowing water (steep gradients) as opposed to
large volumes of water. The map above depicts the areas with potential to establish Micro
Hydro Power plants. Small plants refer to less than 10MW, hydropower plants.
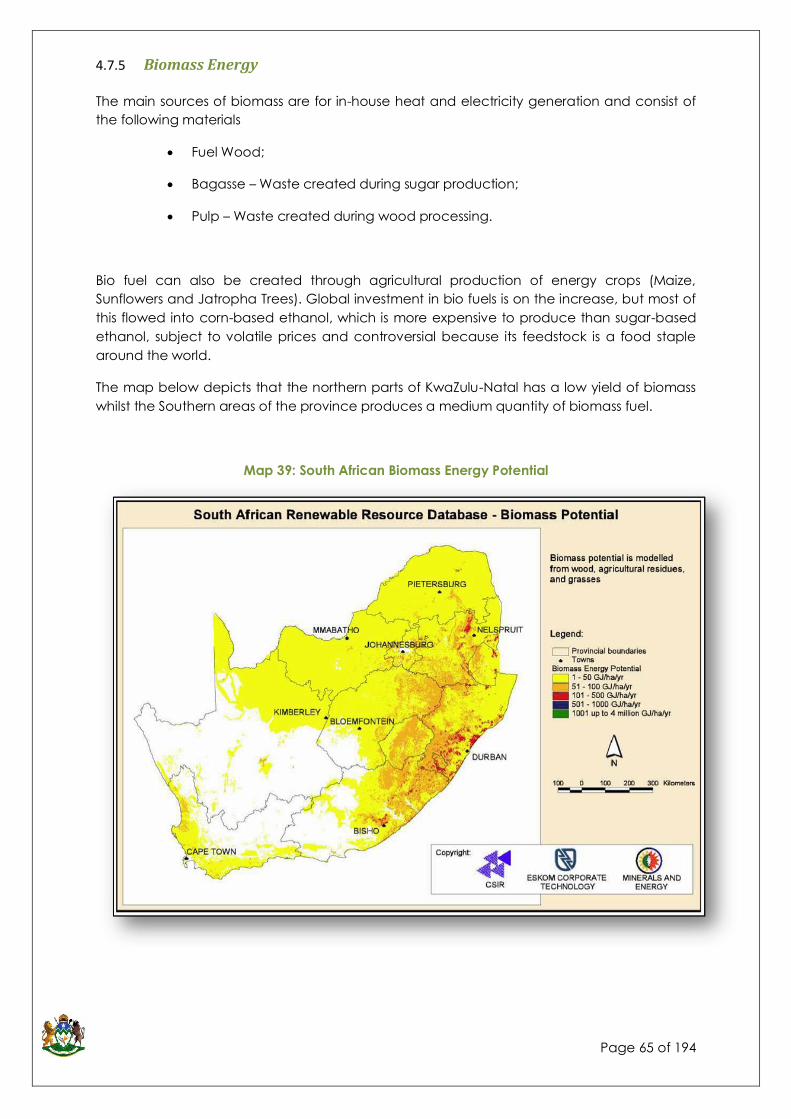
Page 65 of 194
4.7.5 Biomass Energy
The main sources of biomass are for in-house heat and electricity generation and consist of
the following materials
Fuel Wood;
Bagasse – Waste created during sugar production;
Pulp – Waste created during wood processing.
Bio fuel can also be created through agricultural production of energy crops (Maize,
Sunflowers and Jatropha Trees). Global investment in bio fuels is on the increase, but most of
this flowed into corn-based ethanol, which is more expensive to produce than sugar-based
ethanol, subject to volatile prices and controversial because its feedstock is a food staple
around the world.
The map below depicts that the northern parts of KwaZulu-Natal has a low yield of biomass
whilst the Southern areas of the province produces a medium quantity of biomass fuel.
Map 39: South African Biomass Energy Potential

Page 66 of 194
Summary of Environmental Challenges
KwaZulu-Natal faces two critical environmental challenges, namely the effects of climate
change, as well as the environmental degradation within the province. The figure overleaf
clearly illustrates that the majority of the ecosystems in KZN are deemed to be vulnerable to
degradation from human activity with the most populated coastal areas being the most
endangered.
Within recent times the province experienced an anomaly in weather patterns, whereby
unusually high levels of precipitation was measured for the time period in which it occurred,
resulting is loss of lives and significant damage to properties and infrastructure investments.
The significance of this is that the province needs to respond to the possible recurrence of
such an environmental disaster by implementing mitigating measures to prevent such loss.
The province is currently undergoing a project whereby considering climate changes and
consequential impacts as a result of such through projections and analysis that relates to
flood risk areas. Six pilot projects are underway and have proven valuable to prevent and
mitigate potential impacts. The said study will eventually cover the entire province and will
assist and guide future public and private investment and will assist with pro-active response
to any disaster events.
Environmental degradation is still happening on a daily basis, whether intentional by
developers, or unintentional by over grazing communal land, or over population and
settlement within sensitive environmental areas. In general the trends of ignorance towards
environmental protection depict a need for better management and enforcement of
environmental legislation. According to the Wildlife and Environment Society of SA (WESSA),
there are many environmental concerns which need to be addressed, which inter alia
include:
Pipelines along the KwaZulu-Natal coast appear to be showing a trend of increasing
pollution.
On-going escalation of unlawful incursions into Game Reserves, especially the
Ndumo Game Reserve
Illegal reduction flow activities which affect fresh water biomes
Applications in contradiction to National and Provincial Legislation and Guidelines.
There are numerous environmental committees tasked to manage and promote protection
of specific environmental aspects, which should be included and consulted, to assist
government efforts, or either be provided with capacity to monitor environmental status.
These committees inter alia include:
Provincial Coastal Committee
KwaZulu-Natal Stream Flow Reduction Activities Licence Assessment Advisory
Committee
Licence Advisory Forums and stakeholder forums for marine outfall pipelines
KwaZulu-Natal Wetland Forum
KwaZulu-Natal has a lot to offer in terms of Environmental Tourism, and the environment
needs to be protected as a strategy towards revenue generation - the means of attracting
tourism.
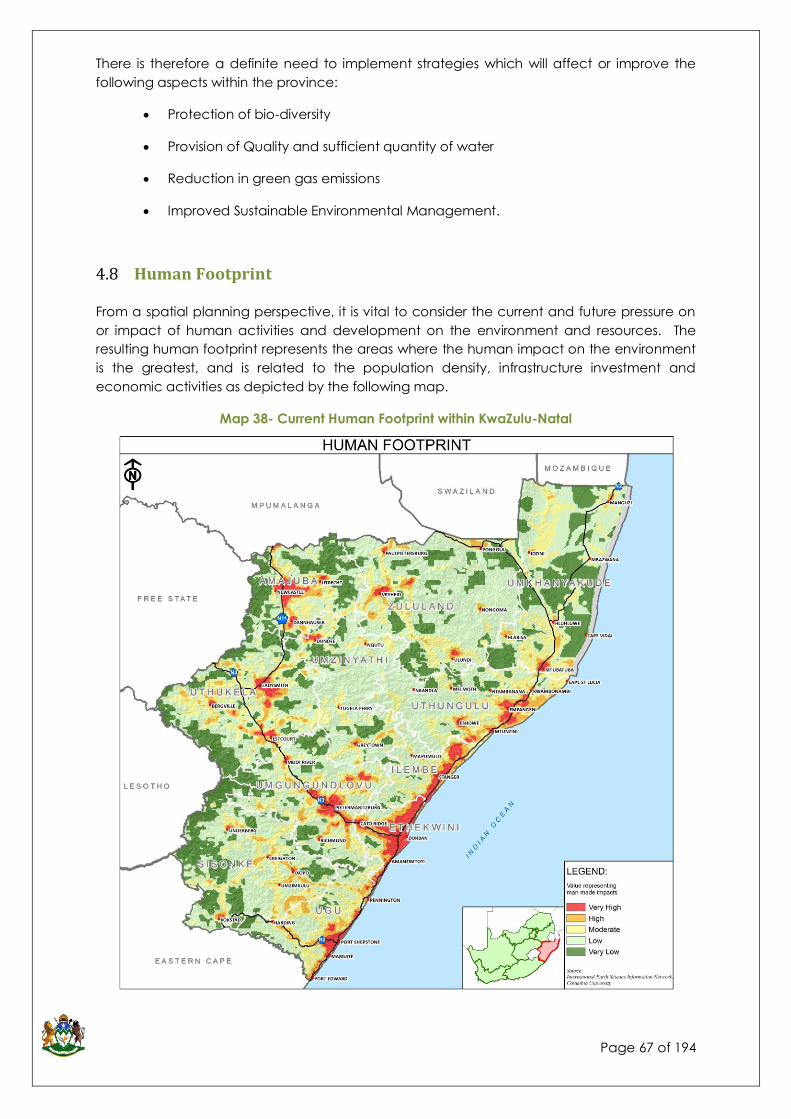
Page 67 of 194
There is therefore a definite need to implement strategies which will affect or improve the
following aspects within the province:
Protection of bio-diversity
Provision of Quality and sufficient quantity of water
Reduction in green gas emissions
Improved Sustainable Environmental Management.
4.8 Human Footprint
From a spatial planning perspective, it is vital to consider the current and future pressure on
or impact of human activities and development on the environment and resources. The
resulting human footprint represents the areas where the human impact on the environment
is the greatest, and is related to the population density, infrastructure investment and
economic activities as depicted by the following map.
Map 38- Current Human Footprint within KwaZulu-Natal

Page 68 of 194
The most intensive interaction between humans and the natural environment is around the
movement corridors, namely the N3, and the N2 National Roads. Impact in these regions is
classified as high to very high. When new roads are constructed it is therefore imperative
that the specific rural area first compiles a land use plan that sets aside areas for
development as well as areas for ecotourism which requires relatively untouched natural
landscapes.
4.9 Synopsis: Strategic Environmental Issues
From the brief analysis and overview of Environmental Landscape described above, the
following key challenges and impacts have been identified as issues to be considered during
the formulation of strategies in support of growth and development within the province:
Loss of biodiversity eventually reaches a tipping point from where it cannot recover,
further compounded by current climate changes;
Loss in Biodiversity will impact on agricultural production ability, in turn affecting a
variety of processing and manufacturing processes on which the provincial economy
is dependant.
Inland regions (associated with most rural communities) of the province are
considered environmentally vulnerable, hence the need to preserve and protect
through creating harmonious balance;
Negative impact from the lack of reporting on International treaties and protected
areas;
The conservation status of broad vegetation types is declining, with four critically
endangered and 17 endangered;
The conservation status of birds in the Province has declined over the last 20 years;
The Province has a disproportionately high number of extinct and critically
endangered plants when compared with other provinces;
Increasing demand for electricity and energy production outweighing traditional
production methods and will impact on natural resources;
Household quality of living and commerce directly affected by availability of
electricity;
Potential investment is directly influenced by the availability and cost of electricity;
and
Increased localised deforestation for fuel wood associated with most rural
communities.
In conclusion, the identification of potential programmes to guide public and private
investment, research, policy directives, partnerships and other strategic interventions will
need to address the dynamics of Environmental Integrity with the province.

Page 69 of 194
5 THE ADMINISTRATIVE LANDSCAPE
5.1 Complex Terrain of Governance
In terms of Government and the institutional framework of government, KwaZulu-Natal has a
complex environment. For the growth and development strategy process, the following key
features of the governance framework, and the inter-relationship between these features,
become relevant :
A provincial government administration with 16 separate departments,
At least eight provincial public entities/agencies,
A number of national departments who implement their programmes locally,
A number of key national state-owned enterprises such as Transnet and Eskom, as
well as regionally-based water boards,
The metro of Ethekwini, which is by far the most strategically important node for KZN,
10 District Municipalities which are meant to coordinate and support local
municipalities,
50 local municipalities with varying degrees to viability and of capacity to fulfil their
developmental mandate,
The Ingonyama Trust Board, appointed custodian of traditional land, holding about
40% of the land of the Province,
A number of local development agencies.
A KwaZulu-Natal House of Traditional Leaders and nine local houses of traditional
leaders (at District level) and a large number of traditional councils at local level.
5.2 Overview of Provincial Government
Provincial Government is constituted of 16 Departments:
1. Agriculture, Environmental Affairs and Rural Development
2. Arts & Culture
3. Economic Development & Tourism
4. Education
5. Health
6. Human Settlements
7. Office of the Premier
8. Legislature
9. Provincial Treasury

Page 70 of 194
10. Royal Household
11. Community Safety & Liaison
12. Social Development
13. Sport & Recreation
14. Cooperative Governance and Traditional Affairs
15. Transport
16. Public Works
Each of the departments are expected to develop and facilitate implementation of plans to
develop all of the areas of KwaZulu-Natal, and to work collaboratively with other spheres of
Government and relevant agencies in their respective sectors. The work of these
departments is coordinated mainly through the Cabinet Clusters, with there being four
clusters into which the departments area arranged :
Economic Sector and Infrastructure Development
Social Protection, Human and Community Development
Governance and Administration
Justice, Crime Prevention and Security.
In addition to the departments, there are also a number of provincial public entities which
are meant to provide specialised capacity and support to the Province, to local government
and to civil society in their respective fields of mandate. Some of the key public entities
which are particularly relevant to growth and development planning, include :
Ezemvelo KZN Wildlife
Amafa Heritage KZN
Ithala Development Finance Corporation
KZN Growth Fund
KZN Tourism Authority
Trade and Investment KZN
KZN Agricultural Development Agency
Dube Tradeport Corporation
These entities report to the Provincial Legislature through their respective parent
departments, but in many cases develop independent strategies and structures for planning
and coordination of their work with relevant municipalities and/or other institutions.

Page 71 of 194
5.3 Overview of Local Government
The province is divided up into 10 districts and one metropolitan (eThekwini) municipality.
Additionally the province has what are termed District Management Area’s (DMA’s) which
are the two World Heritage Sites: the ukaHlamba Drakensberg Transfrontier Park and the
iSimangoliso Wetland Park. The two northernmost district municipalities, Zululand an
Umkhanyakude are the largest and combined make up 30% of the total land area of the
province. As a general trend, the closer one goes to centres of economic development the
smaller the district municipality is. The two district municipalities immediately north and south
of the eThekwini Metropole (iLembe and Ugu) only make up a combined total of 8,7% of the
total land area. The localities of the above mentioned district municipalities are depicted on
the map below.
Map 39 KZN District Municipalities and Metro
The District Municipalities are further broken down into 50 local municipalities.
District and Local Municipalities fulfil a broad range of functions from integrated
development planning, electricity provision, sewerage and waste disposal, health services to
the promotion of regional tourism.

Page 72 of 194
Map 40 Metro and Local Municipalities
The above map illustrates the fact that the province is adjoined by three international
countries with associated border posts as listed below:
Lesotho: Sani Pass International Border Post within Sisonke District,
Swaziland: Golela International Border Post within Zululand District, and
Mozambique: Manguze International Border Post within uMkhanyakude District.
Apart from these international neighbours, it should be remembered that the entire coastline
of the KwaZulu-Natal serves as an international boundary of the Republic of South Africa.
Domestically, the province also shares borders with the provinces of Mpumalanga, Free State
and Eastern Cape.
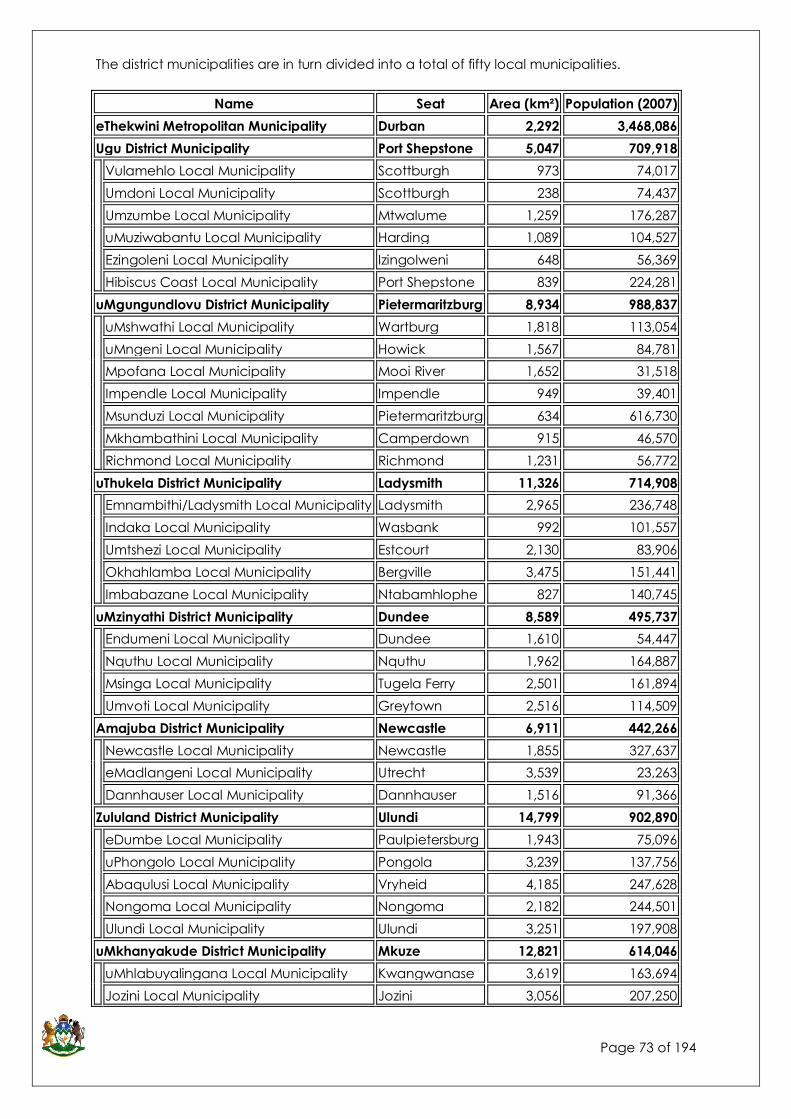
Page 73 of 194
The district municipalities are in turn divided into a total of fifty local municipalities.
Name Seat Area (km²) Population (2007)
eThekwini Metropolitan Municipality Durban 2,292 3,468,086
Ugu District Municipality Port Shepstone 5,047 709,918
Vulamehlo Local Municipality Scottburgh 973 74,017
Umdoni Local Municipality Scottburgh 238 74,437
Umzumbe Local Municipality Mtwalume 1,259 176,287
uMuziwabantu Local Municipality Harding 1,089 104,527
Ezingoleni Local Municipality Izingolweni 648 56,369
Hibiscus Coast Local Municipality Port Shepstone 839 224,281
uMgungundlovu District Municipality Pietermaritzburg 8,934 988,837
uMshwathi Local Municipality Wartburg 1,818 113,054
uMngeni Local Municipality Howick 1,567 84,781
Mpofana Local Municipality Mooi River 1,652 31,518
Impendle Local Municipality Impendle 949 39,401
Msunduzi Local Municipality Pietermaritzburg 634 616,730
Mkhambathini Local Municipality Camperdown 915 46,570
Richmond Local Municipality Richmond 1,231 56,772
uThukela District Municipality Ladysmith 11,326 714,908
Emnambithi/Ladysmith Local Municipality Ladysmith 2,965 236,748
Indaka Local Municipality Wasbank 992 101,557
Umtshezi Local Municipality Estcourt 2,130 83,906
Okhahlamba Local Municipality Bergville 3,475 151,441
Imbabazane Local Municipality Ntabamhlophe 827 140,745
uMzinyathi District Municipality Dundee 8,589 495,737
Endumeni Local Municipality Dundee 1,610 54,447
Nquthu Local Municipality Nquthu 1,962 164,887
Msinga Local Municipality Tugela Ferry 2,501 161,894
Umvoti Local Municipality Greytown 2,516 114,509
Amajuba District Municipality Newcastle 6,911 442,266
Newcastle Local Municipality Newcastle 1,855 327,637
eMadlangeni Local Municipality Utrecht 3,539 23,263
Dannhauser Local Municipality Dannhauser 1,516 91,366
Zululand District Municipality Ulundi 14,799 902,890
eDumbe Local Municipality Paulpietersburg 1,943 75,096
uPhongolo Local Municipality Pongola 3,239 137,756
Abaqulusi Local Municipality Vryheid 4,185 247,628
Nongoma Local Municipality Nongoma 2,182 244,501
Ulundi Local Municipality Ulundi 3,251 197,908
uMkhanyakude District Municipality Mkuze 12,821 614,046
uMhlabuyalingana Local Municipality Kwangwanase 3,619 163,694
Jozini Local Municipality Jozini 3,056 207,250

Page 74 of 194
The Big Five False Bay Local Municipality Hluhluwe 1,061 34,991
Hlabisa Local Municipality Hlabisa 1,417 150,557
Mtubatuba Local Municipality Mtubatuba 496 46,596
uThungulu District Municipality Richards Bay 8,213 894,260
Mbonambi Local Municipality KwaMbonambi 1,210 118,081
uMhlathuze Local Municipality Richards Bay 793 332,156
Ntambanana Local Municipality Empangeni 1,083 94,190
uMlalazi Local Municipality Eshowe 2,214 175,372
Mthonjaneni Local Municipality Melmoth 1,086 47,010
Nkandla Local Municipality Nkandla 1,828 127,451
iLembe District Municipality KwaDukuza 3,269 528,198
Mandeni Local Municipality Mandeni 582 122,665
KwaDukuza Local Municipality KwaDukuza 633 162,055
Ndwedwe Local Municipality Ndwedwe 1,157 134,322
Maphumulo Local Municipality Maphumulo 896 109,157
Sisonke District Municipality Ixopo 11,127 500,082
Ingwe Local Municipality Creighton 1,991 114,116
KwaSani Local Municipality Himeville 1,213 14,281
Greater Kokstad Local Municipality Kokstad 2,680 46,724
Ubuhlebezwe Local Municipality Ixopo 1,604 80,905
Umzimkhulu Local Municipality Umzimkhulu 2,435 243,242
The goals of the local government system are to: provide democratic and accountable
government for local communities; ensure the provision of services to communities in a
sustainable manner; promote social and economic development; promote a safe and
healthy living environment; and encourage the involvement of communities and community
organisations in the matters of local government.
Integrated Development Plans
All development in the province needs to be developed in accordance to national and
provincial plans. These include the:
Accelerated and Shared Growth Initiative for South Africa (ASGISA)
National Spatial Development Perspective (NSDP)
KZN Provincial Growth and Development Strategy (PGDS)
Provincial Spatial Economic Development Framework (PSEDS)
These strategies have been tabled to all municipalities in the province and form the basis for
a series of municipal development and growth summits that have been held. While urban
areas in the province have good infrastructure and service delivery, past inequalities have
left a legacy of problems, particularly in rural areas with low population densities.
In order to plan for interventions to address municipal needs, local municipalities in South
Africa use "integrated development planning", as a method to plan and deliver future
development in their areas. An Integrated Development Plan (IDP) is a wide-ranging plan for
an area that gives a general framework for development. The plans aims to co-ordinate the
Page 75 of 194
work of local and other spheres of government in a coherent manner in order to improve the
quality of life for all the people living in an area.
The district municipalities are mandated to play the lead role in coordinating and supporting
local municipalities in executing their developmental mandate. Although for a have been
established to facilitate such coordination, they have had limited success, as has been
noted in assessment reports of the Provincial and National departments of Cooperative
Governance.
Provision of Water services
The district municipalities also hold the status of “water service authorities”, along with the
local municipalities of Ethekwini, uMhlatuze, uMsunduzi and Newcastle. However there seems
to be some disjuncture between the alignment of these water service authorities and the
appointed water service providers in the Province, the leading providers being Umgeni
Water (southern KZN & Midlands areas), Mhlutuze Water (northern KZN) and uThukela Water
(north western KZN).
Provision of Electricity
As regards electricity provision, there are 25 local municipalities who are holders of electricity
distribution licenses. These take responsibility for the onward distribution/sale of electricity
from Eskom (the national electricity supplier) to the areas within their jurisdiction. For other
municipal areas, Eskom is the direct supplier to consumers, and uses its own planning and
financial frameworks to decide on prioritisation of reticulation of electricity supply to un-
serviced areas.
Provision of Housing
As regards housing provision, each local municipality has a mandate to plan housing
development and to then liaise with the Provincial and National departments of Human
Settlements to have these proposed developments approved and funded. Often such
developments are done without a properly integrated plan for the provision of other key
services, such as appropriate roads, water, sanitation and electricity provision plans being in
place. These inconsistencies in the planning and distribution of the core services to
communities point to the need to greatly improve the level of coordination amongst the
spheres of Government, service and support institutions at Provincial and National level, and
communities who have particular expectations of Government with regard to the nature
and timeframes for service delivery or project implementation.
Local Economic Development
Local Economic Development (LED) has been identified as one of the key options that
compel local areas to become more pro-active in developmental terms.Some local and/or
district municipalities have also established their own local development agencies, with most
being given a mandate to promote inward investment and local economic development.
Some of these include :
Durban Investment Promotion Agency (Ethekwini Metro)
Enterprise Ilembe (Ilembe District)
Hibiscus Coast Development Agency (Hibiscus Coast Municipality

Page 76 of 194
Umhlosinga Development Agency (Umkhanyakude District Municipality)
Midlands Investment Initiative (Umgungundlovu District Municipality)
Sisonke District Municipality is also in the process of establishing its local
development agency.
Many districts and local municipalities also have local tourism promotion agencies which
work with the local private sector to promote tourism in their respective areas. Additional
support for development is given to municipalities through KwaZulu-Natal Local Government
Association (Kwanaloga). From national level, support is also given, albeit in an inconsistent
manner, by agencies such as the Development Bank of Southern Africa (DBSA) and the
Industrial Development Corporation (IDC).
5.4 Traditional Councils
A KwaZulu-Natal House of Traditional Leaders and eleven local houses of traditional leaders
(at District level) and 265 traditional councils at local level.
The Ingonyama Trust Board, appointed custodian of traditional land, holding about 40%
of the land of the Province

Page 77 of 194
5.5 Synopsis: Strategic Administrative Issues
For the purposes of this analysis, three specific challenges stand out and need to be
addressed in the PGDS:
a) In terms of the legislative framework, there are a number of competencies which are
shared amongst national, provincial and local spheres of government. Whilst this is
fully supported by all as a principle, the sharing is not matched at the level of
planning and implementation. The Premier’s Coordinating Council, where the Premier
of the Province meets with the mayors and municipal managers of all municipalities,
is making a very important start, by promoting a shared vision and commitment to
collaboration between Provincial and local structures and leadership. But beyond
this, the inter-governmental relations system is arguably not being implemented in a
practical integrative manner as is evidenced by the continuation of uncoordinated
planning and project formulation in a range of sectors including water and sanitation,
human settlements, local economic development, etc.
b) There are very serious capacity challenges at provincial and local government
spheres. There are many factors that feed into these capacity challenges, but the
impact of the challenges are undoubtedly being felt most severely at local municipal
level. The National and Provincial departments of Cooperative Governance has
detailed their assessments of these capacity problems and a number of initiatives are
being explored to address the problem. One that has clearly stood out is the difficulty
rural municipalities (especially the more remote municipalities) experience in
attracting professionals into their ranks. These and other factors need to be
integrated into the Local Government Turnaround Strategy and be monitored
through intergovernmental mechanisms. However the urgency of a very
comprehensive local government capacity building programme cannot be under-
estimated. A PGDS will ultimately only be as meaningful as the ability to implement it
at the local municipal level and thus this must take a place of priority in the PGDS.
c) There is a need to strengthen relations between local municipalities and traditional
councils in their respective areas. Given that such a large proportion of the land
under rural municipalities is under the custodianship of the Ingonyama Trust and
traditional leadership, it is imperative that more effective systems and processes for
integrating municipal planning and service delivery in Ingonyama areas be
developed. In turn there is a need for enhancement of the participation of members
of traditional councils in the processes of municipalities.
In summary, the very complex and multi-institutional nature of governance in the province,
and the enormity of the service delivery challenges that exist, mean that the PGDS must seek
to propose new pragmatic mechanisms to improve integration amongst the planning and
implementing institutions active at provincial and at local spheres. These mechanisms must
be formulated on the basis of the priority initiatives which the PGDS will identify so that the
methodologies for the integration of planning and for partnerships in implementation are
focused on a joint action agenda of all the existing institutions of governance in KwaZulu-
Natal.

Page 78 of 194
6 THE DEMOGRAPHIC LANDSCAPE
6.1 Introduction
The nine provinces of South Africa have widely differing physical, geographical and socio-
demographic features, which impact on the nature and extent of the developmental
challenge confronting government and society in the respective regions. The formulation of
provincial Growth and Development Strategies must therefore necessarily be predicated on
the socio-economic profile of the region in question and specifically, the developmental
challenges arising from this profile. In crafting a Growth and Development Strategy
appropriate to KwaZulu-Natal’s unique circumstances, therefore, it is important at the outset
to provide a snapshot of KwaZulu-Natal’s key distinguishing physical and socio-demographic
features. The following maps, graphs and tables summarise the key socio-economic and
demographic features of the province.
6.2 Population Growth and Distribution
The eThekwini Municipality hosts the largest share of the province’s 10.6 million people with
33.9%, far in excess of any of the other areas (see figure below). Zululand (which includes
Vryheid and Ulundi), Uthungulu (including Richards Bay, Eshowe and Empangeni) and
uMgundundlovu (Pietermaritzburg) each have in excess of 8% of the population of the
province. Sisonke is the smallest council in terms of population with just over 350 000
inhabitants as compared to eThekwini’s 3.4 million and Uthungulu’s 1 million. That said, the
majority of the provinces district municipalities are fairly evenly matched in terms of
population with between 5 and 10% of the provincial total each.
KZN Population per District
The map below reveals that the populations of all district municipalities have grown over the
period from 1996 to 2006, What is particularly noteworthy about the data is that the fastest
growth rate has not been recorded in eThekwini, which might have been forecast due to
predictions of migration to the city for economic benefits, but rather has been in the

Page 79 of 194
predominantly rural area of Sisonke (DC 43), which has experienced a growth rate far in
excess of the national average. Uthungulu (DC 28) which includes Richards Bay-Empangeni
and Uthukela (DC 23) which includes Ladysmith and Estcourt have also recorded growth
rates far in excess of Durban’s. Ilembe (DC 29) and Umgundunlovu (DC22) have the lowest
growth rates, at 2.57 and 3.15% over the five year period respectively.
Map 40 –Population 1996, 2001 and 2006
Map 41 –Population Density and Age Distribution 1996, 2001, 2006
Source: KZN COGTA 2006 13Spatial Representation of KwaZulu-Natal : Profile 2006
Department of Local Government and Traditional Affairs
Population Growth (1996, 2001 and 2006),
Population Density and Age Distribution (2006)

Page 80 of 194
6.3 Density
The population density distribution throughout the province is depicted in the map below:
Map 42 – Population Density
From the map above, it is evident that the highest concentrations of population densities are
found within the eThekwini and Pietermaritzburg complexes, followed by the Newcastle and
Richards Bay complexes. A third level of density concentrations are also evident in the areas
of Ladysmith, eMondlo, Port Shepstone and KwaDukuza and Mandeni. In general, the
highest population densities are recorded within the coastal regions.
The most densely populated areas described above, also represents the areas where the
highest number of social challenges including lack of access to services such as education,
markets, health care, and lack of services including water, sanitation, roads, transportation,
and communications occur. Evidently the concentration of people in these areas generates
additional pressures on all these services and requires adequate local and provincial
responses.

Page 81 of 194
6.4 Levels of Education
Education is one of the most important factors in the development of any economy, and this
is particularly true in South Africa where a lack of appropriate skills are seen as one of the
most important supply side constraints to growth.
Nationally 17.9% of the population (on average) had no schooling in 2001; the figure for
KwaZulu-Natal is 22%. This is a marked improvement from the very high figure of 33.6% in 1996,
but some areas still have very high numbers of people who haven’t gone to school. The worst
are Msinga (KZ244), Umhlabuyalingana (KZ271) and Jozini (KZ272) with rates of 68%, 54% and
51% respectively.
Adults with No Schooling
The map below reveals the proportion of adults in the province’s municipal areas with no
education at all. This figure only includes individuals over 20 who have not even completed
Grade 1 level education. It is immediately apparent that there are enormous disparities
when it comes to these figures, with areas such as eThekwini and Msunduzi having fewer
than 11% at this level, while most of the former KwaZulu homeland area has exceptionally
high percentages of people who have not had the opportunity to attend school.
Map 43 –Percentage Population of local municipalities over the age of 20 without schooling
2006

Page 82 of 194
Literacy
Adult literacy has improved in both percentage and absolute terms in KZN since 1990, with
almost 4 million more literate adults in 2006 then there were in 1991 and an increase of ten
percentage points in the proportion of the population that are literate. These figures reveal
the enormous strides made by the government when it comes to ABET. That said, there are
still pockets of the province where low literacy rates prevail. In Msinga the illiteracy rate is 33%
while in Nquthu and Umvoti the rates of illiteracy are 30 and 23% respectively.
6.5 Age Distribution
KZN hosts more than 21% of the country’s population. 54% of the province’s population is
rural. Adult life expectancy at birth in the province has dropped from 53 years in 1996, to 51.6
in 2000 was predicted to drop to 40 years by 2005 and 37 years by 2010 (Actuarial Society of
South Africa model; 2005)
The accompanying population pyramid for KwaZulu-Natal provides a breakdown of the age
and sex profiles of the province in 2007. Unlike in most developing countries, the bottom of
the pyramid curves inward, revealing that there are fewer 0-4 year olds and 5-9 year olds
then 10-14 year olds in the population. This is unusual in a developing country with basic
health care where there is usually a greater proportion of the population in the lower age
ranges. Secondly, there are more males between the ages of 0 and 19 than females, while
there are significantly fewer males then females over 40.
KZN Population by age and sex, 2007
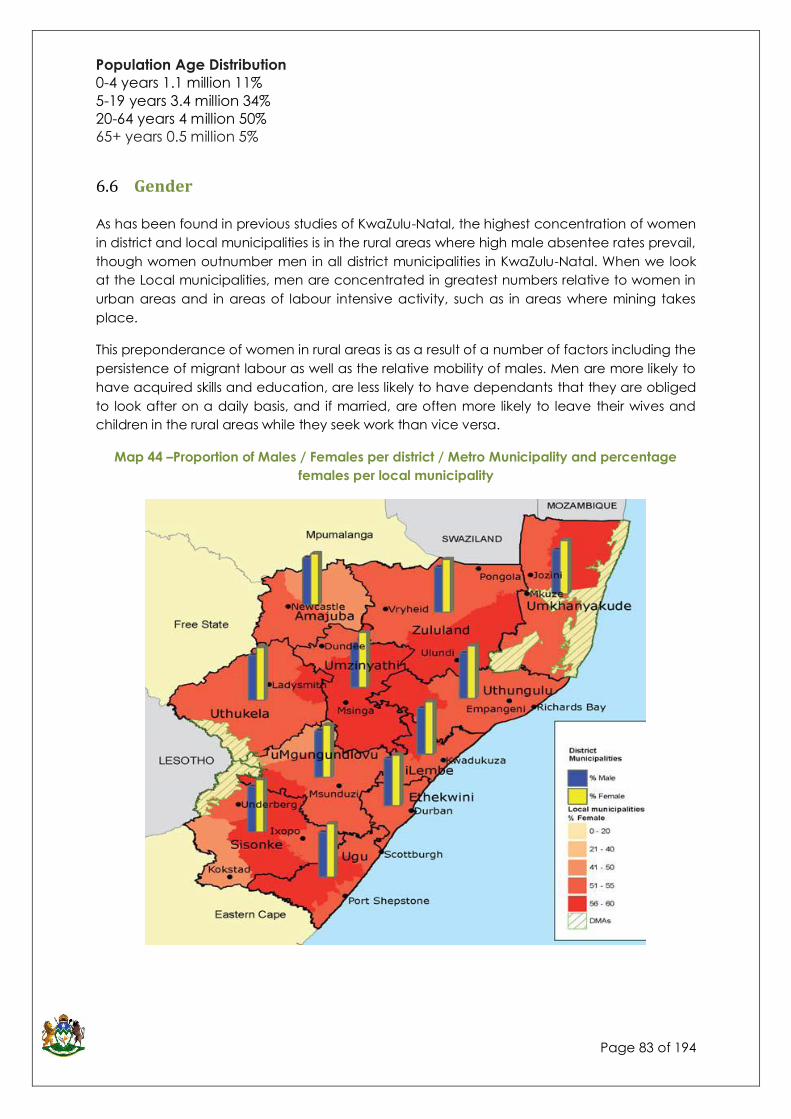
Page 83 of 194
Population Age Distribution
0-4 years 1.1 million 11%
5-19 years 3.4 million 34%
20-64 years 4 million 50%
65+ years 0.5 million 5%
6.6 Gender
As has been found in previous studies of KwaZulu-Natal, the highest concentration of women
in district and local municipalities is in the rural areas where high male absentee rates prevail,
though women outnumber men in all district municipalities in KwaZulu-Natal. When we look
at the Local municipalities, men are concentrated in greatest numbers relative to women in
urban areas and in areas of labour intensive activity, such as in areas where mining takes
place.
This preponderance of women in rural areas is as a result of a number of factors including the
persistence of migrant labour as well as the relative mobility of males. Men are more likely to
have acquired skills and education, are less likely to have dependants that they are obliged
to look after on a daily basis, and if married, are often more likely to leave their wives and
children in the rural areas while they seek work than vice versa.
Map 44 –Proportion of Males / Females per district / Metro Municipality and percentage
females per local municipality

Page 84 of 194
6.7 Migration
Assessing the extent of internal migration is crucial for assessing the needs and development
goals of communities and the province as a whole. While Posel (2003) argues that it is difficult
to differentiate between permanent and transitory migration, the data used in the
accompanying graphs attempts to control for the effects of migrant labour and temporary
absence.
As can be seen from the map below, the majority of migration into KwaZulu- Natal comes
from the neighbouring provinces of Gauteng and the Eastern Cape, with only small numbers
of migrants coming in from distant provinces such as the Northern Cape and North-West.
While data on why substantial internal migration occurs is somewhat lacking, there is
evidence to suggest that much of the migration that does occur is for economic reasons
and is often non-permanent, resulting in the sending of remittances to the area of origin
(Posel:2003). This can help to explain the high level of migration from relatively
underdeveloped provinces like the Eastern Cape, while much of the migration from
Gauteng may be due to returning migrants.
Inward migration to KwaZulu-Natal can be a source of vital skills and expertise, but can also
increase the demands on basic services which, if not catered for, can exacerbate current
service delivery problems. While Posel (2003) suggests that the very poor are unlikely to move
from rural areas as they are trapped by poverty, low skilled or untrained migrants also place
pressure on local populations already facing high unemployment and job scarcity.
Map 45 – In Migration to KZN
With regard to outward migration, residents of KwaZulu-Natal are most likely to move to
Gauteng, shown in the map below, most likely in search of employment, and continuing a
trend that has been in evidence for much of the last century. Other significant outflows are
toward the Western and Eastern Cape and Mpumalanga. Outward migration at these levels
can have serious detrimental effects, particularly on rural areas likely to suffer the detrimental
effects of the so called “brain drain” and resultant skills shortages. While difficult to curb,
necessary improvements in job provision and basic services need to be made to encourage
individuals with skills to remain part of the provincial economy. That said, migrants often

Page 85 of 194
retain close links with their families and dependants in the provinces, and continued flows of
remittances may help local communities.
Map 46 –Out Migration from KZN
The final migration map below shows the net migration figures for KwaZulu-Natal, the total
number of immigrants from other provinces minus the number of emigrants. From this we can
see that KwaZulu-Natal is a net exporter of people and skills to the rest of the country. Only
the Eastern Cape is a significant source of net migration into the province.
Map 47 – Nett Migration Patterns
Page 86 of 194
6.8 Synopsis: Strategic Demographic Issues
In summary the major demographic changes over the period 2008 and 2009 include the
following;
Population mid-estimate has increased from 10014500 to 10645400
From 2000 to 2009 KwaZulu-Natal’s share of the national population increased from 20.9
percent to 21.3 percent. However, population growth rate has decreased from 0.47
percent to 0.28 percent.
o Adult life expectancy at birth in the province has dropped from 53 years in 1996, to
51.6 in 2000 to 43 years in 2009.
o High adult mortality rate predominantly due to HIV infections.
o Lower fertility rates have led to a declining population growth rate: in KZN
population.
52% of the population live in the 7 municipalities making the largest contribution to KZN
economy.
48 % of population live in areas where economic development has not been performing;
Need to accommodate an additional 3.6 mil people in urban environment by 2030 of
which 85% will migrate to eThekwini if the current situation prevails.
Furthermore, the fact that Kwazulu-Natal’s population is predominantly rural with 54% of the
population living in rural areas makes it one of the most rural provinces in the country and this
puts considerable pressure on provision of social services and infrastructure on which
economic growth and development relies.
The most densely populated areas described above, also represent the areas with the
highest number of social challenges.
Adult life expectancy at birth in the province has dropped from 53 years in 1996, to 51.6 in
2000 to 43 years in 2009. (Actuarial Society of South Africa Model; 2005 and Institute of Race
Relations, South Africa report 2009).
Researchers attribute this high mortality rate predominantly to HIV infections. Further,
researchers say the spread of HIV/Aids as well as lower fertility rates has led to a declining
population growth rate: in KZN Population Growth rate is 0.28 % a 2010 estimate, showing a
decline from previous years.
Statistics SA report that KZN has 15.8% of the population infected with HIV/AIDS. This
increased from 15% in 2005 (Global Insight Poverty Indicators).
Being the leading province in both the prevalence and incidence of HIV and AIDS and
tuberculosis, any social sector development strategy for KwaZulu-Natal should take into
account and devise intervention mechanisms to halt these afflictions that both deplete and
incapacitate its stock of human capital.

Page 87 of 194
7 THE SOCIAL LANDSCAPE
7.1 Introduction
While KwaZulu-Natal is the most populous province in the country, for purposes of human
capital formation and development, and its’ contribution to the province’s economic
growth and development, it is less the number of people and more the quality of its’ stock of
human capital that is relevant. Being the leading province in the prevalence and incidence
of HIV and AIDS and Tuberculosis, any development strategy for KwaZulu-Natal should take
into account and devise intervention mechanisms to halt these afflictions that both deplete
and incapacitate its’ stock of human capital.
Growth
It is widely accepted within the PGDS framework that economic growth is the axis on which
all other dimensions of prosperity, including Social Sector development, will turn. This is also
the central and guiding principle of Accelerated and Shared Growth Initiative for South
Africa (ASGISA); that in order for social development, as measured in reduction of
unemployment, poverty, inequality and other cardinal development indicators, to take
place, there has to be growth in the first place, before its proceeds can be shared.
The role and objective of a sustainable development strategy should therefore be to
facilitate the development of the social sector in such a manner that those components that
are typically and currently excluded from participating in the generation of growth and
wealth, do come to share in the proceeds of growth.
Development
In the context of social sector development, the operative term development in the PGDS
framework relates to the following key aspects:
a) Human capital formation and development
The realisation of any economic growth pathway is predicated upon the availability of
requisite human capital skills in direct relation, proportion and assortment to the skills base
and repertoire dictated by the chosen economic growth pathway. The social sector
development strategy to support a revitalised KZN PGDS should therefore address issues of
human capital formation and development in the form of directly linking general education
and skills development to the requirements of industry and other customer institutions. At the
same time a social sector development strategy must be directed to the overall well-being
of the society, boosting the quality of life and human relations.
In the absence of such a tightly integrated and fine-tuned alignment of social sector
development strategy with growth and national development, the province will continue to
be afflicted by perennial challenges of structural unemployment, characterised by the
experience of concurrent rising unemployment and critical skills shortages.
b) Social capital formation and development
Social capital, the ‘stock of a community's goodwill and trust acquired by (a collective such
as a province) over the years, through its understanding and addressing of the concerns and
priorities of the citizens’, is a crucial aspect of any social sector strategy. it is the existence, or
lack of such a stock of social capital that determines, more than anything else, whether a

Page 88 of 194
collective such as a province can respond to and take advantage of developmental
opportunities as they arise. These are issues of social cohesion and they have a direct
bearing on the extent that the province has trust in the capabilities and intentions of its
political leadership and the exercise of goodwill towards developmental initiatives, for
example, as manifested in the quality and quantum of participation in social development
initiatives.
KZN is typically characterised by entrenched multiple and competitive political formations,
which, while intuitively good for democracy, tend to undermine and threaten any
sustainable and long term visioning and deployment of social sector development strategies.
The polarity of differences in the understanding and prioritisation of what constitutes social
and general developmental challenges facing the citizens of the province, as expressed
through multiple political formations, to the extent that it is most pronounced in KwaZulu-
Natal compared to the rest of the provinces, undermines social capital formation evidenced
by the lack of strong and collectively shared meaning in the province.
c) Household and community capacitation
Households and communities are the ultimate repositories of both human and social capital.
While human capital stock formation and development target individuals through education
and skills development interventions, households as well as communities as units of analysis
are the major targets for and indicators of the success or otherwise of social sector
development strategies.
It is evident from this review process that the social issues under evaluation are systematically
related. The provincial growth and development imperatives are emergent outcomes that
are driven by complex and systematically related elements; first, within the larger system of
the provincial economy, and secondly by the first-line determinants of provincial growth and
development, namely by the economy, our stock of natural resources, our infrastructural
base and our spatial framework.
While the province represents the larger and total system, which is in turn influenced by the
state of the national economy, which is itself a derivative of the regional and global
economies; the social sector itself, the unit of analysis for this submission, is unto itself an open
and dynamic system.
This level of understanding of the interrelatedness of social issues and challenges can further
be corroborated with the following construct adapted from Chambers (1983).
Figure 1: Poverty as an expression of exclusion and its relatedness to institutional spaces

Page 89 of 194
In the context of the PGDS review process, the following construct seeks to conceptualise the
provincial economy and locate social issues in relation to the larger system.
Figure 2: Mapping Social Sector Development Factors
Na
This construct demonstrates the dynamic complexity of the social sector as a social system
that is governed by the following principles:
+
+
+
+
+
+ +
+
+ +
+
The Global
Economy
The National Economy
KZN PROVINCIAL GROWTH AND DEVELOPMENT STRATEGY
Natural
Resources
Policy
Environment
Spatial
Development
The
Economy
Infrastructure The
Environment
THE SOCIAL SECTOR
Protection and
advancement
of women
Education
Youth
Developme
nt
Sustainable
Human
Settlements
Health
Arts, Sport
&
Recreation
Welfare Safety &
Security

Page 90 of 194
A large number of elements (stakeholders)
i) Dynamic interaction of the elements
ii) Rich interaction of the elements (no directly discernible outcomes), non-linearity
and the likelihood of outcomes disproportionate to triggers
iii) The existence of feedback loops among the dynamically interactive elements
which drive recurrency (amplification/stimulation or detracting/inhibitive)
iv) System history and the co-creation of outcomes between the past and the
present
v) The emergent properties of the system through interaction among the elements,
and the role of information in directing the system to its desired states
It is evident from this construct that the social sector is a complex, open and dynamic system,
and that it undergirds the rest of the dimensions of the PGDS framework and the review
process. The ultimate unit of analysis of the success of the PGDS is society. It is society that
must be the ultimate beneficiary of the growth and development of the provincial economy,
The Social Issues in KwaZulu-Natal
For the purposes of this Situational Overview ‘social’ is classified into three meanings, viz,
quality of livelihoods, human relationships, and essential human necessities. This assists in
classifying the social sectors and issues discussed here into some conceptual map. A social
issue relating to quality of livelihoods is poverty alleviation and eradication. Sectors and issues
relating to human relationships are Social Welfare, youth development, gender, generational
relationships, moral regeneration and institutional development. Sectors classified as essential
human necessities are sustainable human settlements, health, education, arts and culture,
and safety and security. In each sector or issue we seek to briefly:
paint the objective picture of challenges of each sector
pinpoint what its status/role is in the growth and development challenges of the
province.

Page 91 of 194
7.2 Quality of life
Poverty
The figure below summarises trends 2001 – 2007 in the composite deprivation index for KZN.
Source: Nerve Centre – KZN Office of The Premier
EThekwini Metro showed a significant decline in Deprivation Composite Analysis, an
estimated (19% decline) as compared to other municipalities, and Uthukela District
municipality shows an increase in Deprivation Composite Analysis by an estimated 9.6%. The
western parts of Umzinyathi declined whereas the Uthungulu generally worsened as well as
the central parts of Umkhanyakude.
General statistics on poverty:
5.3 million people were living in poverty and 1.2 million people were living on less
than US$1 a day (R6.50 a day or R200 a month),
the estimated poverty gap is Rbn18.3 (the amount required to raise the income of
the above-quoted 5.3 million people to the poverty line),
15 per cent of the population, 20 years or older had no schooling, 41 per cent
had no secondary schooling, and 73 per cent had not completed grade 12 (Stats
SA, Census 2001).

Page 92 of 194
Indicators of poverty over the years and in relation to different social groups is as follows:
Kw
aZu
lu-N
ata
l Period Black_HDI Indian_HDI White_HDI Coloured_HDI Total_HDI
1996 0.42 0.7 0.87 0.66 0.51
1997 0.37 0.68 0.86 0.63 0.48
1998 0.42 0.71 0.86 0.66 0.51
1999 0.44 0.72 0.86 0.68 0.53
2000 0.44 0.72 0.86 0.68 0.53
2001 0.47 0.73 0.86 0.69 0.55
2002 0.48 0.74 0.86 0.72 0.55
2003 0.49 0.74 0.87 0.71 0.56
2004 0.49 0.75 0.87 0.71 0.56
2005 0.50 0.75 0.88 0.72 0.57
2006 0.51 0.76 0.88 0.72 0.58
2007 0.53 0.77 0.88 0.74 0.59
2008 0.54 0.78 0.88 0.75 0.60
2009 0.55 0.78 0.88 0.76 0.61
2010 0.57 0.79 0.88 0.76 0.62
Whites’ HDI is as high as 0.62, although Whites form only 5% of the entire population of the
province. Blacks, being the majority in the province, have hardly exceeded the 0.50 mark in
terms of HDI (although this grew from 0.42 in 1996 to 0.50 in 2005). In formulating a growth
and development strategy, it is essential to give particular attention to this aspect as it plays
a pivotal role in the growth of the province.
In terms of a qualitative definition of poverty KwaZulu-Natal has a lot of people who are
experiencing varied levels of poverty. The General Households Survey (GHS) depicts KwaZulu-
Natal as having the highest recipients of social grants and social relief packages in the
country. 25% of the population that received such assistance in South Africa were in KwaZulu-
Natal alone, followed by 17% in the Eastern Cape1. Of the recipients of social relief packages
in KwaZulu-Natal 93% are Black and 53% are female. (GHS report 2009: 92).
In terms of economic activities of low skill resulting from the Extended Public Works
Programme, KwaZulu-Natal has had 30% of the country’s participants in these, followed by
Gauteng at 23%, with the Eastern Cape at 11%. KwaZulu-Natal is thus a province dealing with
huge economic challenges and using the largest proportion of the country’s methods of
poverty alleviation as opposed to economic opportunities produced by the mainstream
economy.
These figures have been converted to percentages for purposes of this report to avoid a long explanation on
sampling procedures (in the GHS).

Page 93 of 194
Besides non-participation in mainstream economy, KZN is also lagging behind in the
potential for decentralised economic sustainability. This is illustrated by clear trends of
population densities in urban centres with the eThekwini Metro leading the population figures
in 2010 at 3 610 844 and uMgungundlovu containing the next biggest figure at 1 028 563
people. There is a need to examine the patterns of circular migration and issues of inequality
within the urban space in order to declare suggestive statements about what this means for
these urban centres (see work generated by the Three Cities Project – Bouillon, Freund,
Hindson and Lootvet 2002). What is observable from previous research is that circular
migration allows for rural migrants to subsidise the urban spaces through labour whilst little
investment is ploughed back to rural areas by way of compensating attention.
Poverty is an area of intervention that requires sustainability of effort of government and non-
government agencies in empowering communities. It is also an area where the pressure to
review monitoring and evaluation paradigms is apparent – so that M&E informs justifiable
decisions about the intensity of support rendered to a community, the quality of support and
when to systematically pull away support and instil independent local economic and social
development of communities.
There are clear efforts of alignment of strategic outcomes between the province and
national government - as reflected for instance in the Strategic Framework of the KZN
Department of Social Development. There is a need for a further step in relating this to three
strategic impact initiatives:
- Mapping out the extent of poverty qualitatively in the particular areas of the province
– qualitative mapping refers to the integrated multitude of necessities that would
make it possible to achieve social mobility within any spatial location. This would
guide an affirmative deployment of resources.
- The KwaZulu-Natal government must be committed to investment in social
development in particularly under-resourced areas in order to bring the population
towards an upward development trend - the better to be able to contribute to
growth.
- Technical knowledge relating to stimulating economic growth within the particular
spatial framework must be deployed.
Social Welfare Services
The vision of the Department of Social Development in KwaZulu-Natal is to “Enhance the
quality of life through an integrated system of Social Development Services”. Their mission is a
commitment to “the promotion of developmental Social Welfare Services and Community
Development to the people of KwaZulu-Natal in partnership with stakeholders”. It is clear
from these statements that there is an acknowledgement of the complexity of the task as
both the quality of life issue and the need for an integrated approach are acknowledged in
the vision. In fact the Department of Social Development deals with many issues that are
dealt with by other stakeholders and agencies in government such as poverty, youth
development and HIV and AIDS besides their more focused areas such as dealing with
children and adults at risk, capacity building of non-profit organisations, etc. Of necessity, the
Department’s work overlaps with the work of other agencies / government departments. Its’
methodologies and strategies should be more sophisticated than they are currently –
ensuring more effective and sustainable operations; it cannot simply be a provider of welfare
packages.

Page 94 of 194
The Department of Social Development has a programme called Developmental Social
Welfare Services under which most of community oriented or social impact work is done. This
is work relating to children, special needs (including attention to older persons, people with
disabilities, the youth), restorative services (relating to dealing with drug abuse, social crime
prevention and victim empowerment), HIV and AIDS, and social relief of distress in relation to
war against poverty. In reviewing the annual reports of the department it is clear that there is
much activity in relation to all these aspects of the department’s work. However, this
reportage consists of the department’s current responsiveness: reaction to issues that come
to their attention. There is very little systematic research-based scoping of the social problems
in order to plan for deliberate and exhaustive attention to the roots and actual extent of the
problems.
Thus whilst there is ample statistical projection of what the current cases dealt with are and
what is targeted for years to come – it is not rooted in real projections of population, poverty
and need. For example, the number of social relief applications approved in 2008/9 financial
year was 143 553. This was what was budgeted for the following year 2009/10. The targeted
applications for 2010/11 and 2011/2012 respectively is 150 730 and 158 266. It is not clear
whether this target is established against the extent of the problem, against previous
reporting patterns, If there was information available on the extent of need on a spatial basis,
informed resource deployment would be the mode of operation.
A Department such as the Department of Social Development requires sophistication in its
oversight role as it deals issues that are observable in the province whose complexity requires
an integrated approach. These are such problems as:
- skip-generation households: which happen as a result of HIV and AIDS prevalence;
requiring resourcing of health facilities and availability of information; co-ordination of
community development efforts – live centres of support towards community projects
to match the level of (il)literacy affecting people’s capacity for institutional
negotiation especially in rural areas;
- asset-based community development – underuse of land from land reform projects;
capacitation of NPOs and Community Property Associations to become nodes of
support for community development );
- marginal urban existence: food security issues in the urban setting; circular migration
and lack of security of livelihoods – as security of tenure is not equal to security of
livelihoods.
These are simply illustrative examples of how the mandate of social development, dealing
with the welfare of people needs to be as dynamic as the complex manifestation of social
issues which include poverty, institutional capacity within communities, social trends that
worsen the quality of life of children, and so on.
7.3 Human relationships
Youth Development
KZN is understood to host as much as 22% of the country’s teenagers, followed by Eastern
Cape at 18%, the Northern Province at 15% and Gauteng at 13%. These findings are
consistent with the earlier citation of KZN as predominantly rural, and Gauteng being largely

Page 95 of 194
populated by a migratory, focussed and purposeful population for whom child-making does
not rank as a priority. The systemic relationship between male youthfulness and crime has
already been cited, and is extensively documented. Teenage pregnancy is one of the most
prevalent social challenges in both rural areas and in tertiary institutions in KZN, and the
implications of the phenomenon on the risk of HIV/AIDS are self-evident. Drop-out rates in
some of the province’s institutions have been cited elsewhere to be as high as 50%.
The fiscal pressures of teenage pregnancies in the form of social assistance grants can only
be more pronounced in KZN, the further implication of which is diversion of resources among
competing ends.
The above review of social welfare issues and the emphasis on a role of a champion (in the
form of the Department of Social Development) demonstrates also the integratedness of any
stage of human development in the human development cycle. The same issues that affect
all people in the community will affect the youth, albeit in different ways given the youth’s
stage of development and concomitant needs. However a desktop review of youth
organisations especially through their websites shows that although there is weak
conceptualisation of youth focus in South Africa, there is (an almost intuitive) societal worry
about the youth and a clearly expressed need to focus on them. Again this is where the
shortcomings of a positivist approach of “throwing-in-objective-necessities-and-stirring” shows
itself. Many organisations that deal with the youth rightly seeks to respond to youth
unemployment, to provide for youth fun, and to capacitate the youth with business skills.
They often fall short of sustainable socialisation methods for the youth, despite some of them
being rooted on religion.
There is a need to mainstream youth focus into community development initiatives rather
than only approaching the youth on the so-called “youth matters”. In the context of broken
homes and skip-generation households resulting from a recent high death rate of the middle
generation, there is a need for continuous exposure to motivational social life development
programmes that so not simply take the structured ‘Life Orientation’ approach provided at
school. Despite the political changes that have seen the youth of today theoretically living in
an equal opportunities environment, the socio-economic situation as well as the social
challenges (of HIV and AIDS) has seen the youth fending for itself whilst adult support is
focused on economic migrant activities to support households in terms of livelihoods. This is
more of the case in rural homes. Marginal socio-economic existence has also produced
youth that must quickly find its feet.
Technicalities of outlawing child labour are actually a luxury to deliberate upon in such
settings. It is in this context that social ills of substance abuse and street living also take place.
Thus there is a need to review whether the youth in various parts of the province need the
following type of attention:
- person directed development – personal development producing healthy motivated
individuals with good orientation to life
- social skills/competence – socially responsible, community oriented living
- material and technical development – directed at education and skilling for
materially well-endowed and technically competent youth
Many programmes that are channelled by national agencies and civil society organisations
do elements of these spheres of development in an ad hoc fashion based on some

Page 96 of 194
stereotype of the youth as focused on fun. A holistic approach to youth development needs
to be devised for the province and integrated within other projects in various communities.
Gender and the empowerment of women
In terms of the current population statistics there are 5 132 855 males and 5512654 females in
KwaZulu-Natal. Issues of gender pertain to relationships structured and influenced by culture
and general human tendencies. Gender as a social issue classified as human relationships
signifies the difficulties of reportage of social issues. All the stakeholders can work with is those
cases that reach the attention of institutions; even though qualitative research shows that a
lot of problematic gender issues go unreported (see issues raised the CGE’s work on the
Victim’s Charter, for instance). Generally even with the approach adopted by institutions, it is
clear that gender quotas are met in some areas of performance but gender difficulties,
especially for women, remain acute (see Hicks, CGE). Gender empowerment has been
theorised more than it has been implemented in South Africa as a whole and KwaZulu-Natal
is not exception to this. The agencies that deal with gender development such as the
Commission on Gender Equality are however aware of province specific challenges (such as
cultural dogmatism within which women are seen as minors, underdevelopment of women
and their association with the household, etc.).
Again it cannot be over-stressed that the main hindrance in gender change management2
is more the approach rather than laxity or lack of awareness on quotas for equality in
material gain and provision of policy environment enabling gender equality and
empowerment of women. A recent review of Millennium Development Goals indicated that
the goals are now too modest for the kinds of problems currently manifesting in KwaZulu-
Natal – simply seeking equal numbers of males and females in the classrooms, the workplace
and parliament.
Current challenges in relation to gender inequalities include:
- Making men to be carers (by dealing with patriarchy and elements of negative
cultural socialisation)
- Economic empowerment of women in order for them to be able to asset use the
rights embodied in legislation against their abuse. Civil society organisations have
established a link between difficulty to deal with continuous abuse of women and
domestic violence with their lack of economic independence
- A generic approach of statutory bodies that is not rooted in area-specific challenges
and monitoring and evaluation of gender change management in specific areas is
problematic. An agency-centred approach that takes its cue from the state of
gender consciousness of people within a given setting is recommended. This will
2 Gender change management is the term proposed by Sithole (2010) referring to the need for those in intervention
positions to analyse issues of gender within the setting of their operation and mutually plot change holistically with
those affected in order to change the whole environment to be conducive to lasting gender equity. Sithole suggests
that mainstreaming has self-defeating elements in that it does not change mindsets of all cultural agents involved in
keeping a double-day for women in tact despite chaperoning their inclusion in all sectors. The privatisation of
gender inequality happens because the household is not reached by formal agents to deal with gendered framing
of male and female responsibilities and regard of women as minors in the identity ladder.

Page 97 of 194
supplement, rather meaningfully the generic approaches of rights awareness and
complaints-driven mandates of these organisations
- Institutional transformation is oblivious to dealing with the holistic experience of
womanhood, thus creating pressure on women to be ‘miraculous’ performers when
the informal prejudice and the double-day issues are not the subject of discussion in
the workplace. Qualitative approaches need to be formulated for dealing with
institutional change management on gender issues. This will supplement the rights
driven approaches against sexual harassment, support for women in management
positions and quota-driven approach to institutional change.
Social Cohesion (Generational issues, disability, moral regeneration and institutional
empowerment)
There is a host of issues that are not part of the key mandate of any department or agency
but which some national driven policies try to enforce awareness thereof3. These are issues to
do with older persons, disability and moral and institutional empowerment. Within KwaZulu-
Natal these issues are dealt with in an ‘if-we-manage-to-devote-some-attention-fashion’, yet
there is serious recognition of the significance of these issues in social life of communities.
Disability suffers from an unfair ‘lack-of-majority’ syndrome because the marginal attention
and resourcing of attention to disability seems to be rooted in the fact that people with
disability are in the minority. Yet they are equally affected by all the other social problems
that affect other people whether it is poverty or HIV and AIDS (see Create, 2009 for the
articulation of how youth living with disability are affected by HIV and AIDS). Older persons
have been affected by HIV and AIDS in that they have become a generation taking up the
burden of orphans whilst they have their own needs that are not easy to fulfil especially
within developmentally-strained communities.
Morality is a subject of serious worry within communities over which there are visible and
conceptual challenges. There is a visible challenge of crime as has been articulated here in
relation to safety and security issues. There is also a serious problem of conceptual stuttering
related to the overwhelming emphasis on rights and less emphasis on responsibilities making
generational differences pronounced and frustrating particularly to the older generation. This
is made worse in the context where teenage pregnancies, crime, and social laxity about
development are generally associated with the youth on the one hand, and the need to
provide economically and being there for the youth is the strain of the older generation on
another hand.
In terms of approach this conflation of issues is generally associated with the concept of
social cohesion which has gained serious mileage in South Africa (see the KZN DSD Strategic
Framework). Within KwaZulu-Natal stakeholders are doing different initiatives with little
conceptual coherence. Not even the social welfare paradigm, with its emphasis on life-
stages seems to be approaching these issues in any conceptually coherent fashion. Social
cohesion itself as a concept is generally located within the arts (whose mission would be to
use it to for a social engineering fashion to foster love between people) or located within the
3 Some of the major initiatives that need scoping have been located within the Office of the Premier and delegated
to other stakeholders within government. These will be tracked carefully during stakeholder consultations.

Page 98 of 194
realm of political scientists who approach it as a tool to make previously segregated society
forge some ‘political love’ for each other.
In the context of all this disability often receives an advocacy-centred moral approach that
suggests a mainstreaming solution to disability. Whilst this is necessary, it is not sufficient
against the tide of unfair discrimination in terms of resourcing initiatives towards disabilities.
Most approaches end at the level of creating forums that simply advance the moral
standpoints. Sign language is not one of the subjects, not even in one designated school
grade within the province (perhaps replacing Life Orientation totally within that grade).
Many people who cannot speak are the problem of their families and cannot hope to
communicate effectively with the population of the province generally. In other words there
has not even been sufficient thought dedicated to use of current resources in relation to
mainstreaming disability in the province.
In addition to social morality issues there are problems of corruption and institutional morality
issues which stakeholders articulated during the research consultative phase. The issues
raised were both of about the difficulties of articulating these problems objectively since the
nature of the deeds is such that they are done so as to make it impossible to track them.
Corruption seems to be infesting all ranks of life in the bureaucracy and it was suggested that
it is both a result of a crisis of leadership together with lack of role modelling of honest
professional practice on the one hand, and on another hand, the lack of systematic and
integrated efforts at dealing with corruption – in punitive and proactive preventative ways.
Government stakeholder groups lamented the institutionalised nature of corruption, whilst
civil society lamented the incapacitating despondency of both the citizens and civil society
itself with respect to corruption. It was clear that whistle-blowing has been successfully
circumvented by the mainstreaming of corruption into practice, the normalising of corrupt
practices even in the ‘normal’ dealings with the private sector has created a facade out of
possible efficiency of whistle-blowing.
7.4 Education
Education Enrolment progression statistics in KZN - 2009
Level Numbers
Pre-Grade 9,492
Grade R 154,881
Primary (Gr 1-7) 1,627,717
Secondary (Gr 8-12) 1,030,755
SNE 4,274
Total 2,827,335
Total females in the system 1,401,827
Total Educators 89,377
Total female educators 62,661
Total of public schools 5,928
Total of independent Schools 163
Total schools 6,091
While KZN has more than 6 800 schools, Media24 estimates that as much as 75% of them lack
specialised facilities in the form of laboratories and libraries, and up to 25% of them are

Page 99 of 194
deemed “unsuitable for teaching”. Setting aside the controversy surrounding their integrity,
Matric results show a marginal improvement from 57.6% in 2008, to 61% in 2009 and 67% in
2010.
Provincial Overview: Education
Key Indicator 2008 2009
% of adults with no education 12 10
% population aged 15 literate 87 89
% adults with degree or higher education 3.3 2
Matric pass rate 57 61.2
University entrance pass rate 14 20
Of the 132 176 who sat the Matric examination in 2009, the number who qualified for
acceptance in universities was 26 287.
While any pattern that suggests improvement is encouraging, the fact remains that a 67%
pass rate by implication means that the 33% failure rate represents wasted resources and
time over a very long period. The quality of educators is indicted as the leading cause of this
failure, and KZN educators are reported to be absent from duty 1 out of 8 days on average,
or for 42 days in every year, although they are only entitled to 12 days leave in the same
period, excluding scheduled school holidays.
Another issue of grave concern in education is that for Mathematics and Science, the
subjects at which the majority of schools perform most dismally, 30% is considered a pass
mark. The implications of this inexplicable laxity on university performance, competence and
productivity in the work world and ultimately, on the country’s competitiveness are far-
reaching and staggering.
Many segments of the society are consumers when it comes to science and technology
products rather than seeing themselves as contributors in science. There is little evidence in
the province to suggest that institutions of Higher Learning, the National Research Foundation
or the department of Science and Education are concerned about the bifurcation of
indigenous knowledge and science in the minds of the population. Science and technology
is far from decentralised to communities. The youth is therefore not motivated to being
producers of scientific knowledge and links with gaps on the issue of youth development as
discussed in this submission.
StatsSA (2010) reports that attendance at Early Childhood Centres in KZN is 25%; higher only
than that of the Northern Province at 21.1%, against records as high as 39.4% in the Western
Cape and 42.6% in Gauteng. Furthermore, availability of Early Childhood facilities at Day
Care Centres in KZN was only 20.2%, again higher only than that of the Northern Cape at
19.7%, against 36.7% in Gauteng and 35.8% in the Western Cape.
Nationally, 72.8% of the population in the 7 – 24 age group attended some form of
educational institution, while the KZN average was 45.2%, higher only than that of the Eastern
Cape at 38.8%. The predominant reason given in KZN for non-attendance was lack of
money.

Page 100 of 194
The percentage of people aged 20 and above without any formal education in KZN was
8.5%, versus 2.1 in the Western Cape and 2.9 in Gauteng.
Close to 5% of the 13 – 19 age group in KZN were pregnant, and this has serious implications
on the prevalence of HIV/AIDS.
7.5 Health
Provincial Overview: Health
Key Indicator 2008 2009
Adult mortality rate 72% 71%
Under5 Mortality rate 90% 88%
Immunization coverage children U1 83% 83%
Proportion of HIV+ women attending antenatal clinics 39.1% 39.9%
Total HIV infections 1,560,573 1,572,457
AIDS related deaths 115,483 115,716
New Infections 2009/2010 131,858
TB cases reported 105,705 118,162
Public sector Doctors per 100,000 35
Public health professionals vacancy rate (2008) 33.3%
Ratio of population to beds in public hospitals (2005) 405
Ratio of population to beds in private hospitals (2008) 2 615
People without medical cover 9,084,000 (87.4%)
The KZN Social Sector Cluster Flagship Programmes initiative acknowledges that the province
has the highest burden of diseases associated with underdevelopment and poverty, among
them HIV&AIDS and Tuberculosis (TB), which have been identified as the top causes of
mortality in the province. It is estimated that 1 in every 3 females in the sexually active age
group in the province is HIV infected, and while the provincial HIV/AIDS prevalence is the
highest in the country, estimated at close to 16%, it is frequently more than double this
prevalence in densely populated and poor areas. The prevalence of TB is estimated at 1 054
cases per 100,000, making it more than five (5) times higher than the WHO accepted levels.
Life expectancy in the province has decreased from 53 years in 1996 to 47 in 2005, and
estimated to be much lower in 2010.
The Council for Medical Schemes data (2010) indicates that only about 7 million South
Africans are on private health care cover, and this figure has been largely stagnant in the
past 10 years, although significant reductions were noted as a result of retrenchments during
the global economic meltdown. At the same time, there are more than 7 million South
Africans who are employed in the low income bracket but have no medical cover. While the
national medical cover average is just below 18%, in KZN only about a quarter of households

Page 101 of 194
had at least one member covered on medical aid (StatsSA 2010), and this was in sharp
contrast to 24.4% in the Western Cape and 26.5% in Gauteng.
The predominantly rural character of KZN is reflected in the fact that the province has the
second highest Under 5 child mortality rate, better than only that of the Eastern Cape. More
than 70% of the Under 5 mortality rate occurs in rural areas, and 43% in urban areas.
Furthermore, there is a strong correlation between levels of education, conditions in the
household and child mortality; close to 84% of child mortality occurs in households with less
than Sub-Standard 3 levels of education.
7.6 Safety and Security
Provincial Overview: Safety and Security
Key Indicator 2008/2009 % Change (base 1994)
People per Police Official 478
Murder rate 47 (50.5)
Sexual Offenses rate 131 44.9
Aggravated robbery rate 255.9 18.9
Stock theft rate 74.6 (33.2)
Business burglary rate 110.6 (45.8)
Residential burglary rate 372.6 (20.9)
Motor vehicle theft rate 120.1 (47.8)
Drug related crime rate 235.7 123.2
KZN, accounting for 183 of the 1,100 police stations countrywide (second highest allocation
after the Eastern Cape with 194), is a safety and security hot-spot.
Featuring murder, attempted murder, rape, burglary, abductions and farm murders, KZN
records the second highest farm attacks after Gauteng (StatSA 2010). While the national
average of farm attacks involving murder is 10.5%, that of KZN is 14.4%, and 33.9% of such
attacks included serious injury.
The underlying significance of Safety and Security in the context of the Social Sector
Development strategy in the context of the PGDS is that crime, or the absence of safety and
security, undermines the province as an alternative and viable investment and dwelling
destination, drains the provincial treasury coffers through the costs of maintaining a large
criminal justice system, and depletes the province’s stock of potential human capital through
murders and incarceration.
There are quite recent accounts that still lament KZN to be host to the country’s ‘murder
capital’, KwaMashu, where employment is recorded as 28%, and more than half the
population is under 25 years of age (Centre for the Study of Violence and Reconcialiation,
2008). The relationship between young males and crimes is well documented Walklate, S.
2007). While these figures may look dramatic, they accurately mirror the state of safety and
security in KwaZulu-Natal’s poor communities and neighbourhoods. The Institute for Security

Page 102 of 194
Studies (2008), established a direct and positive relationship between poverty and incidence
of crime, “the wealthier you are, the less likely you are to be a victim of crime”, and
implicated public transport systems, run-down neighbourhoods, inability to install security
systems and poor policing services as some of the causes of high crime rates among the
poor.
On account of the leading role of the young male segment of the population in the
perpetration of crime, Youth Development through Education, Sport and Recreation, among
other interventions, become instructive as a component of the Social Sector Development
strategy initiative of the PGDS. In line with what has been argued above on the need for a
holistic development of the youth, there is need to ensure sustainable community
development projects that are not once off fun-oriented or correctional projects. Personal,
social and technical development of the youth must be tracked through the sum-total of
community development initiatives in the province.
7.7 Sustainable Human Settlements
The challenge of housing in KwaZulu-Natal has to be viewed against the statistics of what is
available and progress made in providing houses at any given point in time. According to
statistics by 2010 the province had 1 183 381 brick structures in the form of a house and
roughly the same amount in (solid) traditional housing and shared town type arrangements
such as flats. It is obvious that government initiatives in relation to human settlements are
taking place in the context of some challenges since for informal housing there seems to be
an increase rather than reduction when comparing 1995 an 2010.
Type of structure Number of units 1995 Number of units 2010
House or brick structure 624 437 1 183 381
Traditional dwelling 554 240 610 043
Informal dwelling in backyard 41 639 57 029
Informal dwelling NOT in backyard 147 182 167 671
There are two challenges here. The first is the population dynamics relating to migration,
growth and new independent households are emerging. However more qualitative data is
necessary to interpret these trends as there are indications also that the middle generation is
affected by a higher death rate and skip-generation households are resulting. The second
challenge is to reflect the social organisation patterns correctly such that it is clear what the
definition of a “household” is in urban and rural contexts. There are big households in rural
areas that are big merely on account of living together because of identity and coping
issues actually incorporating elementary households within the extended households.
Whether such households are counted as single households or not is not clear from the
current statistics and it requires a more nuanced qualitative data to discern.
Besides these challenges, government initiatives towards sustainable human settlements
have to contend with the conviction that rural homesteads are expensive to provide with

Page 103 of 194
service delivery and that more clustered settlements must be encouraged (Provincial
Planning and Development Commission, 2008). This is a problem since this is a statement of
competition between ‘what works’ for institutional ease of manipulation and ‘what matters’
for the receipts. Rural households are known to appreciate the possibilities of eking out a
livelihood at less cost in rural areas through the sum-total of possibilities in accordance with
available social capital (Sithole, 2006). Rural households balance the deployment of their
members in marginal urban spaces for meagre financial gains, limited livestock and seasonal
agricultural cultivation. This achieves some limited security of livelihood, albeit in difficult
situations in terms of accessing services. To ask them to trade these ways of economic
coping for ease of reach by government in provision of services is to suggest bureaucratic
egoism over people-centeredness.
The thinking on sustainable human settlements is also an area that demonstrates the need to
contend with the historical political challenges in that government (and especially local
government) has not devised an appropriate strategy to deal with the human rights issues
and access to service delivery of people who are farm dwellers. It is not clear whether the
provision of decent housing and the necessary services is part of any negotiation forum with
commercial farmers who have many Black people subjected to poverty in relationships of
patron-clientalism on farms. Whilst the sensitivities of this subject matter are appreciated
given a land reform programme in South Africa that shied away from opening historically
sensitive questions of land dispossession directly (rather opting for a willing seller-willing buyer
approach to land reform), it is important to regard people on farms as deserving of decent
settlements. They are also affected by the vicissitudes of poverty and other social challenges
(including HIV and AIDS) like other people within the country (see AFRA 2005).
7.8 Synopsis: Strategic Social Sector Issues
The Province of KwaZulu-Natal has obviously not been oblivious the fact that social problems
present themselves in complex ways which require integrated sector focus and nuanced
strategies. This is seen in the manner in which clusters have been formed and progress is
being monitored in relation to cluster plans. In February 2010 the KwaZulu-Natal Cabinet did
a review of its progress in relation to the key national outcomes that have been identified at
priority also for the province. Their reflection indicates how the various stakeholders locate
themselves not only within the clusters but also in relation to the Outcomes they are
responding to. Various clusters aligned themselves with the Outcomes in the following way:
However despite this significant sense of awareness on the crosscutting mandates and need
for integrated focus, sector initiatives are still undertaken in rigid silos and without a joint
identification of areas requiring simultaneous attention and ripple effects thereof. Many
departments are working on quantitative inputs in different areas – there is no clear
separation of inevitable mandated coverage of all citizens, on the one hand, from key
strategic projects done deliberately in partnerships so as to achieve systematic sustainable
growth and social development over time, on another hand. There are several issues that
require sharper attention in order to achieve sustainable development and in order to reach
the ideal of decentralised growth that was articulated earlier in this report. These are:
Qualitative monitoring and evaluation on specific areas – i.e. area-based approach
on cluster plans perhaps via district municipalities. District municipalities could
perhaps not simply compete for disaggregation on functions with local municipalities
but rather be the first level of serious kneading of oversight and discretion in relation

Page 104 of 194
to integrated approach and sustainability issues. Such will however require serious
institutional capacitation for these municipalities so that they do not understand their
role as merely “cracking the whip” on local municipalities. That kind of institutional
capacitation would have to be directed at both the bureaucratic and the political
arms of the municipalities. There will be a need to direct focus on: evaluation of
regional integrative capacity for growth and development, indigenous knowledge
issues for the district, and measures of sustainability
Planning for the rural-urban trends in the province linked to sustainability of livelihoods
(ways to decentralise the economy and persuading business to partner on
sustainable LED). This requires a consideration of several issues related to spatial
planning and land tenure issues. The first is recognition that security of tenure has not
really meant security of livelihoods within a certain range of socio-economic stratum.
Thus a healthy attitude needs to be developed towards land under iNgonyama Trust
which has in fact provided security of livelihoods for many. Secondly, there is a need
to forge practical and useful linkages on spatial planning and land use management
systems between traditional leaders and municipalities.
Each sector department needs to highlight provincial coverage based on their
centralised expertise but also monitoring of progress on integrated area-based plans
relating to cluster priorities. Lack of no accountability on integrated strategy projects
must be dealt with a provincial level and perhaps a lower level (via
Intergovernmental relations frameworks or a revised District mandate)
Inter-governmental relations designed from the point of view of recipients of service –
as individuals (efficient intergovernmental referrals), in terms of community
development (centering communities in designing access to services and socio-
economic development) and in terms of responding to key social issues (the
desirable outcomes of development be the centre of monitoring rather than the
sector plans for their own sake).
Summary of Key Strategic Issues
Field Issues to Consider Strategic Issues
Dealing with Poverty and
Inequality – the Quality of
Life issue
- Area-based social
mapping of KwaZulu-Natal
in terms of extent of
inequalities, social sector
necessities, as well as the
necessary key integrated
projects directed at
upward social mobility of
the population
- A specific department
(e.g. Social Development)
to be tasked with
accountability and
negotiating discretionary
prioritisation of specific key
identified joint projects.
- Treasury to support the
discretionary movement
of funds between the
stakeholders. Treasury to
explore new ways of
planning and budgeting
that allow the necessary
timeous investments on
projects whilst enforcing
accountability
- Engagement of business

Page 105 of 194
on decentralising
economic investment in
the province. Treasury
expenditure protocols to
allow a project centred
management of these
funds.
- Identification of policy
red-tape whilst allowing
strict accountability and
prioritisation of project
sustainability at the same
time.
Social Issues with respect to
human relationships
- Area social mapping of
KwaZulu-Natal in relation to
social issues – in terms of
human relationships
(gender, disability, youth
development)
- Identification of relevant
approach that covers the
whole province and
relevant approach for
specific local areas
affected by specific issues
– e.g. abduction of women
- Design of asset based
community development
(land at the core of this) –
this is an socio-economic
issue but it is first a human
relations issues since land
reform is a sensitive
historical/political matter
- National and Provincial
stakeholders to identify
key joint projects.
- Top political leadership in
the province to negotiate
key issues related to
access to services for
farm-dwellers.
- Top leadership to
negotiate with national
government and land
owners on speedy land
reform including invitation
to beneficiaries of colonial
plunder and apartheid to
donate portions of their
land (as a Social
responsibility programme),
as well as live support
centres for emerging
farmers
Designing Human
settlements with the people
- Servicing needs related to
access to housing and
services must be balanced
with servicing socio-
economic livelihoods
- Populations trends and the
rural urban circular
migration strain on people
- A provincial spatial plan
that sees the links between
social issues and economic
growth but also a
progressive move to
decentralise the economy
identifying potentially
thriving LED centres
- A holistic design of
settlements with early
consideration of services,
arts and culture, sports
and recreation, youth
development needs and
socio-economic survival –
an integrated approach is
necessary.
- It might be useful for the
Department of Human
Settlements to plan based
on municipal integrated
development plans rather
than adopting a top-
down planning approach
where the department has
independent planning as
a provincial department
making its own
identification.
- A need to ensure a
transport network that links

Page 106 of 194
people’s settlements with
markets and centres of
livelihoods
- Research on land
availability to
municipalities, iNgonyama
Trust and the political
sensitivities around long
leases done during the
Apartheid era and on the
eve of the democratic
dispensation
Improved Institutional
Capacity - Provincial
planning and development
strategies that seek to
include qualitative data
- Technical and quantitative
information is useful but
there are serious historical,
political and social issues
that are in nuanced social
relations not captured by
objective counting. This is
often where the potential
for strategy formulation is
hidden
- A need to convert rhetoric
into practical outcomes –
integration, sustainability
must be attached to
accountable hosts (even if
they are sector
departments)
- Engaging civil society
regularly on social issues
- Indigenous knowledge
must be sought –
especially on households,
belief systems (that impact
on gender and healing)
and on human relations
related to disability, stigma
of diseases and gender
orientation to caring
- All stakeholder must be
responsive to area-based
identification of social
problems but must also do
their own research in
relation to the relevant
local dynamics and
indigenous knowledge
- Inter-governmental
relations must not be
bureaucratic information
sharing vehicles but must
be designed with useful
referrals for the users of
government institutions
Quality of Service issues
- Finding ways for qualitative
assessments by the people
who are users.
- Urban-rural differentiation
in terms of quality of
services
- Sector departments to
explain and feature in their
performance reporting the
urban-rural quality of
service differentiation (e.g.
in terms of quality of
education, health services
and safety and security)

Page 107 of 194
8 THE ECONOMIC LANDSCAPE
Introduction
The economy of KwaZulu-Natal is the second largest within South Africa, contributing
approximately 16% to national Gross Value Added (GVA). The economic base within the
Province is diverse, with being driven largely by the manufacturing sector, and supported by
tertiary services such as tourism, finance and insurance, transport and storage, and other
business services. The province is however under-performing relative to population share,
and is faced with three structural constraints to growth, namely; increasing unemployment,
poverty and inequality. These constraints were further exacerbated by the recent recession,
which placed pressure on financial and economic systems, and caused substantial job
losses.
National Government has recently developed the New Growth Path (NGP), which has
placed emphasis on the need to create sustainable employment within the country in order
to achieve growth and development, and to assist in achieving the Millennium Development
Goals (MDG). Job creation is therefore a key concern for the PGDS, which will ensure that
the creation of employment is prioritised through the promotion of key sectors, and that no
further jobs are lost through the enhancement of business retention and expansion (BR&E)
initiatives.
A substantial decline in investment into the primary and secondary sectors (predominately
agriculture and manufacturing) over the past decade has reduced employment
(particularly within agriculture and textiles manufacturing), and has reduced the potential of
growth and development considerably. As a consequence, the province’s industrial base
has lost share of the national market, while the province has become a net-importer of
agricultural goods, which poses a threat to food security. The tertiary sector has however
performed well, with sectors such as ICT experiencing good growth off a low base. Priority
must therefore be given to strengthening the key sectors of manufacturing, agriculture,
tourism, and transport and logistics, as well as emerging key sectors such as ICT and green
energy production and processes.
The decline in key primary and secondary sectors is due to factors such pending land claims,
a lack of serviced and zoned industrial land, access to Ingonyama Trust Board land for
commercial and community agriculture, the rising cost of capital and other input costs (i.e:
machinery, electricity and labour), skills shortages, and the inflexibility of labour. These
challenges need to be addressed as a matter of urgency to ensure that the Province boasts
strong economic fundamentals, which will stimulate new investment and the expansion of
existing business.
Within the spatial context, the economic contribution to provincial GVA is largely driven by
eThekwini (53%), uMgungundlovu (12%) and uThungulu (8%). This indicates that economic
activity is dominated by the three cities of Durban, Pietermaritzburg and Richards Bay, with
the remainder of the smaller towns and rural areas contributing less than 30% to total GVA.
This is largely due to the infrastructure that exists within the city economies, and highlights the
need for investment into economic infrastructure within less dominant towns.
The Province current has a number of comparative advantages such as the Durban and
Richards Bay Ports, the Dube Trade Port, the Richards Bay IDZ, vast agricultural land, and a

Page 108 of 194
strong industrial base. However, these comparative advantages have not been translated
into competitive advantages and the Province has therefore not reached its full economic
potential. Constraints such as low productivity within the Durban Port, degrading road and
rail infrastructure, a slow take-off at the Richards Bay IDZ, and uncertainty about the future of
land for commercial farming have slowed the pace of potential growth within the Province.
Emphasis must be placed on the comparative advantages of the Province, to ensure that
these are strengthened and ultimately translated into competitive advantages, in order to
provide a conducive business environment that entices expansionary and new productive
investment.
Given the location of the Province, its economic assets, and a substantial labour force
(although largely un-skilled), there is a significant amount of potential to become an
economic gateway, not only within South Africa, but also within the rest of Africa. The
requirements to achieve such success are numerous, but generally include an educated
and skilled labour force, provision of reliable infrastructure and services, reduction of
bureaucracy and red-tape surrounding development, strong policy direction from the public
sector, and confidence from the private sector.
In terms of provincial planning, although the Province has been not been successful in
effectively and efficiently supporting SMME’s, expanding exports and attracting investment
in the past decade, a number of provincial strategies have recently been completed, or are
in the final draft phase, and will assist in guiding growth and development planning within the
provincial government. These strategies are aimed at creating a more conducive business
environment within the province, to encourage new investment, SMME development, and
expansion of export potential. These include the KZN Investment Strategy, KZN Export
Strategy, KZN Industrial Strategy, SMME Development Strategy, and the KZN Cooperatives
Strategy. The province must focus on implementing the strategic recommendations within
each of these strategies to ensure that the fundamentals are in place to support, promote
and enhance economic activities ranging from informal sector business to large multi-
nationals.
8.1 Overview of KZN Economy in National Context
A prerequisite to undertaking an assessment of the provincial economy is to provide an
overview of each province in the context of the national economy. This section provides a
brief assessment of the performance of each of the provincial economies in order to
contextualise the current position of KwaZulu-Natal.
The table below displays the total Gross Value-Add (GVA)4 for each of the provinces over a
period from 2000 – 2009:
4 GVA is a measure of the value of goods and services produced in an area, industry or
sector of an economy, and is useful when measuring the Gross Regional Domestic Product
for entities smaller than a whole economy.

Page 109 of 194
Graph 1: GVA per Province
Source: Quantec Database – Standardised Regional Dataset
KZN is the second largest provincial economy after Gauteng, contributing just over
16% to national GVA in 2009, equivalent to R260 billion in GVA.
This is an indication that the province is underperforming relatively, considering that
KZN comprises over 21% of the total national population.
The most comparable provincial economy to KwaZulu-Natal is the Western Cape
which contributes almost 15% to national GVA.
The graph below displays the provincial share of total national GVA from 1995 to 2009.
R 0
R 100 000
R 200 000
R 300 000
R 400 000
R 500 000
R 600 000
Ran
d (M
illio
ns)
in C
on
stan
t 200
5 P
rice
s
Western Cape
Eastern Cape
Northern Cape
Free State
Kwazulu-Natal
North West
Gauteng
Mpumalanga
Limpopo

Page 110 of 194
Figure 1: KZN Share of National GVA
Source: Quantec Database – Standardised Regional Dataset
The province has remained fairly stable in terms of national GVA contribution, ranging
between 16.0% and 16.4% of national GVA.
Decline in industries such as agriculture and manufacturing have therefore been
offset with growth in the tertiary sectors of the Province.
The table below displays the GVA Per Capita for each of the provinces in order of highest to
lowest.
Table 4: GVA Per Capita (2009)
Province GVA per Capita
Gauteng R 50 955.07
Western Cape R 46 434.07
North West R 30 589.83
Northern Cape R 30 117.50
Free State R 28 476.87
Mpumalanga R 27 874.44
Kwazulu-Natal R 24 653.72
Limpopo R 18 763.79
Eastern Cape R 18 668.74
Source: Quantec Database – Standardised Regional Dataset
Gauteng has a per capita GVA of almost R51,000, followed by the Western Cape
with just over R46,400.
The remainder of the provinces all fall under R31,000 per capita, with KZN at R24,650
per capita – the third lowest per capita income nationally.
15.85%
15.90%
15.95%
16.00%
16.05%
16.10%
16.15%
16.20%
16.25%
16.30%
16.35%
16.40%
1995 1996 1997 1998 1999 2000 2001 2002 2003 2004 2005 2006 2007 2008 2009
Pe
rce
nta
ge o
f to
tal N
atio
nal
GV
A
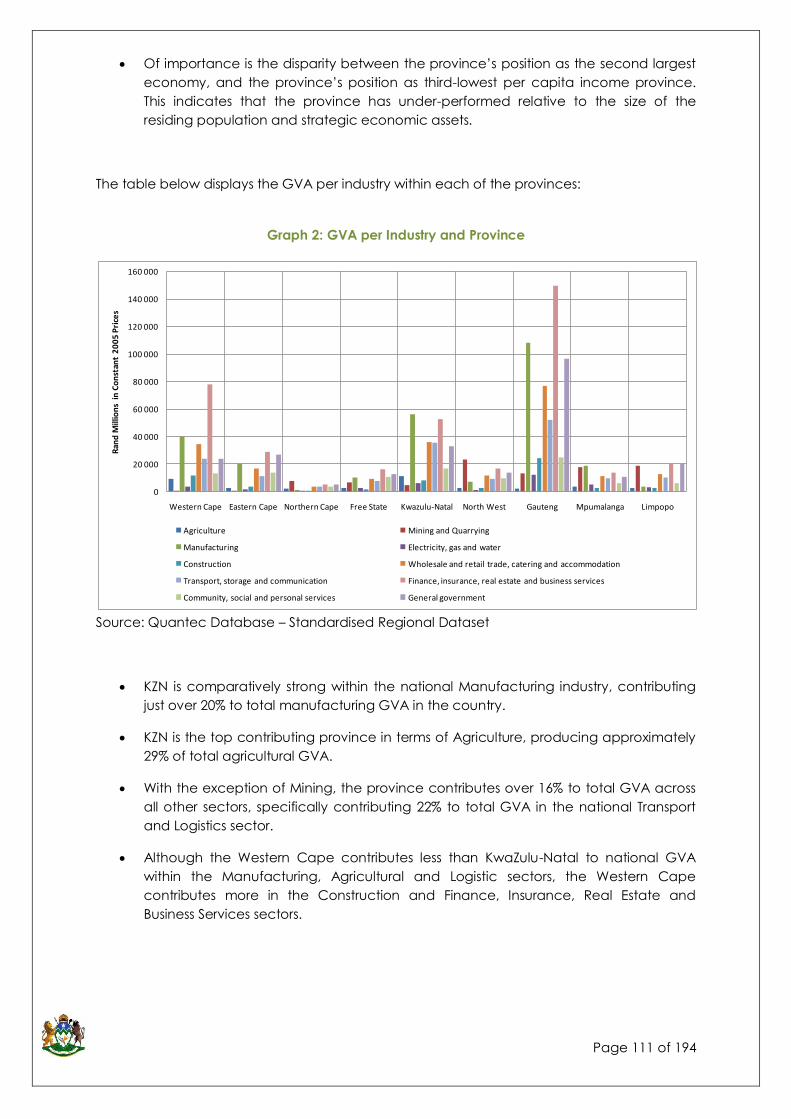
Page 111 of 194
Of importance is the disparity between the province’s position as the second largest
economy, and the province’s position as third-lowest per capita income province.
This indicates that the province has under-performed relative to the size of the
residing population and strategic economic assets.
The table below displays the GVA per industry within each of the provinces:
Graph 2: GVA per Industry and Province
Source: Quantec Database – Standardised Regional Dataset
KZN is comparatively strong within the national Manufacturing industry, contributing
just over 20% to total manufacturing GVA in the country.
KZN is the top contributing province in terms of Agriculture, producing approximately
29% of total agricultural GVA.
With the exception of Mining, the province contributes over 16% to total GVA across
all other sectors, specifically contributing 22% to total GVA in the national Transport
and Logistics sector.
Although the Western Cape contributes less than KwaZulu-Natal to national GVA
within the Manufacturing, Agricultural and Logistic sectors, the Western Cape
contributes more in the Construction and Finance, Insurance, Real Estate and
Business Services sectors.
0
20 000
40 000
60 000
80 000
100 000
120 000
140 000
160 000
Western Cape Eastern Cape Northern Cape Free State Kwazulu-Natal North West Gauteng Mpumalanga Limpopo
Ran
d M
illio
ns
in C
on
stan
t 2
00
5 P
rice
s
Agriculture Mining and Quarrying
Manufacturing Electricity, gas and water
Construction Wholesale and retail trade, catering and accommodation
Transport, storage and communication Finance, insurance, real estate and business services
Community, social and personal services General government
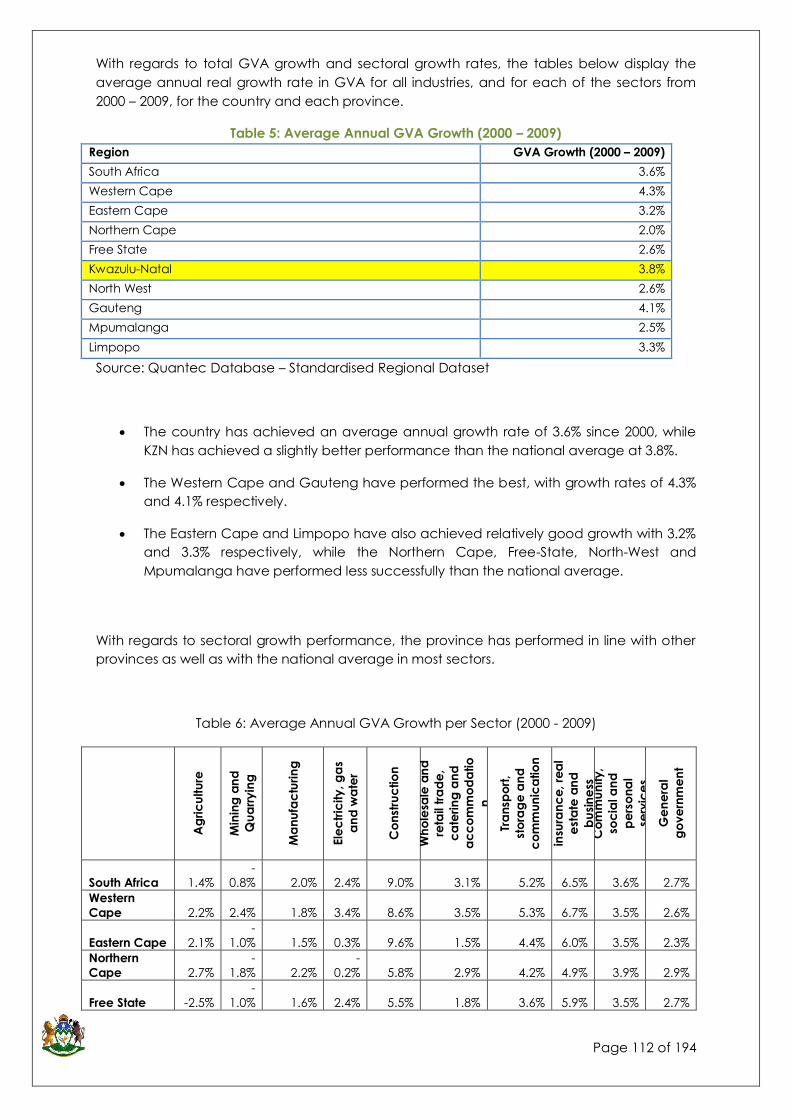
Page 112 of 194
With regards to total GVA growth and sectoral growth rates, the tables below display the
average annual real growth rate in GVA for all industries, and for each of the sectors from
2000 – 2009, for the country and each province.
Table 5: Average Annual GVA Growth (2000 – 2009)
Region GVA Growth (2000 – 2009)
South Africa 3.6%
Western Cape 4.3%
Eastern Cape 3.2%
Northern Cape 2.0%
Free State 2.6%
Kwazulu-Natal 3.8%
North West 2.6%
Gauteng 4.1%
Mpumalanga 2.5%
Limpopo 3.3%
Source: Quantec Database – Standardised Regional Dataset
The country has achieved an average annual growth rate of 3.6% since 2000, while
KZN has achieved a slightly better performance than the national average at 3.8%.
The Western Cape and Gauteng have performed the best, with growth rates of 4.3%
and 4.1% respectively.
The Eastern Cape and Limpopo have also achieved relatively good growth with 3.2%
and 3.3% respectively, while the Northern Cape, Free-State, North-West and
Mpumalanga have performed less successfully than the national average.
With regards to sectoral growth performance, the province has performed in line with other
provinces as well as with the national average in most sectors.
Table 6: Average Annual GVA Growth per Sector (2000 - 2009)
Ag
ric
ultu
re
Min
ing
an
d
Qu
arr
yin
g
Ma
nu
fac
turin
g
Ele
ctr
icity
, g
as
an
d w
ate
r
Co
nst
ruc
tio
n
Wh
ole
sale
an
d
reta
il tr
ad
e,
ca
terin
g a
nd
ac
co
mm
od
atio
n
Tra
nsp
ort
,
sto
rag
e a
nd
co
mm
un
ica
tio
n
Fin
an
ce
,
insu
ran
ce
, re
al
est
ate
an
d
bu
sin
ess
serv
ice
s C
om
mu
nity,
soc
ial a
nd
pe
rso
na
l
serv
ice
s
Ge
ne
ral
go
ve
rnm
en
t
South Africa 1.4%
-
0.8% 2.0% 2.4% 9.0% 3.1% 5.2% 6.5% 3.6% 2.7%
Western
Cape 2.2% 2.4% 1.8% 3.4% 8.6% 3.5% 5.3% 6.7% 3.5% 2.6%
Eastern Cape 2.1%
-
1.0% 1.5% 0.3% 9.6% 1.5% 4.4% 6.0% 3.5% 2.3%
Northern
Cape 2.7%
-
1.8% 2.2%
-
0.2% 5.8% 2.9% 4.2% 4.9% 3.9% 2.9%
Free State -2.5%
-
1.0% 1.6% 2.4% 5.5% 1.8% 3.6% 5.9% 3.5% 2.7%

Page 113 of 194
Ag
ric
ultu
re
Min
ing
an
d
Qu
arr
yin
g
Ma
nu
fac
turin
g
Ele
ctr
icity
, g
as
an
d w
ate
r
Co
nst
ruc
tio
n
Wh
ole
sale
an
d
reta
il tr
ad
e,
ca
terin
g a
nd
ac
co
mm
od
atio
n
Tra
nsp
ort
,
sto
rag
e a
nd
co
mm
un
ica
tio
n
Fin
an
ce
,
insu
ran
ce
, re
al
est
ate
an
d
bu
sin
ess
serv
ice
s C
om
mu
nity,
soc
ial a
nd
pe
rso
na
l
serv
ice
s
Ge
ne
ral
go
ve
rnm
en
t
Kwazulu-
Natal 1.8% 0.1% 1.9% 1.9% 7.6% 3.9% 5.3% 6.5% 3.6% 2.8%
North West 0.1%
-
0.6% 2.3% 3.6% 8.2% 2.1% 5.2% 6.8% 3.7% 2.5%
Gauteng 1.1%
-
1.3% 2.2% 2.6% 10.5% 3.5% 5.4% 6.6% 3.9% 2.8%
Mpumalanga -0.4%
-
1.0% 2.1% 2.1% 9.3% 2.7% 5.2% 6.1% 3.5% 2.9%
Limpopo 4.6%
-
0.1% 2.1% 4.0% 5.8% 3.1% 6.8% 6.1% 3.9% 2.6%
Source: Quantec Database – Standardised Regional Dataset
Within Agriculture, although KZN contributes almost 30% to total GVA, growth has
been less than Limpopo, and the Northern, Eastern and Western Cape, indicating
that more needs to be done within the province to stimulate growth within this sector.
The province contributes very little to the mining sector, and low growth in this sector
(0.1%) is indicative of this.
Within the manufacturing sector, the province has under-performed relative to some
other provinces, although not by a large degree.
KZN achieved a 1.9% GVA growth rate in Manufacturing from 2000 – 2009, just below
the 2% national average. This growth is the third slowest in the country, which is not
sufficient given the large contribution that this sector makes to provincial GVA. This
indicates that the Province needs to do more to achieve greater levels of growth
within the manufacturing sector in order to stimulate employment.
The Province has been successful in achieving the highest growth rate nationally
within the Wholesale, Retail, Catering and Accommodation Sector, with an average
annual GVA growth rate of 3.9%.
In terms of Transport, Storage and Communications, KZN has experienced a 5.3%
average annual growth rate, slightly higher than the national average, but well
below Limpopo who achieved 6.8% average annual GVA growth.
The graph below displays the contribution of each province to total domestic fixed
investment in 2009. This picture is similar to the GVA contributions of the national total.

Page 114 of 194
Graph 3: Provincial Contribution to Total Domestic Fixed Capital Investment (2009)
Source: Quantec Database – Standardised Regional Dataset
Gauteng has succeeded in capturing a third of total domestic fixed capital
investment, followed by KwaZulu-Natal with almost 17%, and Western Cape with just
over 13%.
The remainder of the provinces collectively contribute the remaining 36.8% of total
domestic fixed capital investment.
KwaZulu-Natal’s contribution is less than the relative population contribution of 21%,
indicating the need to enhance the province’s contribution of domestic fixed capital
investment.
This highlights to the importance of strengthening Business Retention and Expansion
(BR&E) programmes, as well as enhancing the effectiveness of investment promotion
and attraction activities.
The above assessment of each province has highlighted the significance of the KwaZulu-
Natal economy within the national context, contributing just over 16% to total GVA, as well as
over 20% of national GVA in Manufacturing and 29% of GVA in Agriculture. However, it was
also noted that KwaZulu-Natal is far behind most of the other provinces with regards to GVA
per Capita, which indicates that more needs to be done to transfer the economic benefits
of the province to the people.
7.6%8.9%
33.0%
6.3%
16.9%
4.8%
2.4%
6.8%
13.4%
0.0%
5.0%
10.0%
15.0%
20.0%
25.0%
30.0%
35.0%
Co
nri
bu
tio
n t
o N
atio
nal
To
tal
Limpopo
Mpumalanga
Gauteng
North West
Kwazulu-Natal
Free State
Northern Cape
Eastern Cape
Western Cape

Page 115 of 194
It is also important to understand the position of the labour market in the province in
comparison to the rest of the country.
Table 7: Employment and Unemployment per Province
Source: Quantec Database – Standardised Regional Dataset
Approximately 62% of the province’s population is within the working age bracket (15
– 65 years of age), in comparison to 63.7% in the country.
Of the working age population, 33.7% are employed either formally or informally,
compared to almost 39% within South Africa.
This is much lower than most of the other provinces, especially the Western Cape
(50.8%) and Gauteng (47.3%), which indicates that the province is lagging in terms of
employment creation relative to the main competing provincial ‘metro’ economies.
Although the province has the lowest number of unemployed individuals (10.2% of
the working age population), it has the second highest number of not-economically
active persons in the country.
Over half of the potential workforce is either not actively seeking work, or have been
discouraged from seeking employment, and points towards the importance of
implementing a comprehensive Human Resource Development (HRD) Strategy, as
well as enhanced demand-driven skills development and training, including
apprenticeships and internships, especially for the youth.
The graph below displays breakdown of employment into the formal and informal sectors.
Percentage Contribution
So
uth
Afr
ica
Weste
rn C
ap
e
Easte
rn C
ap
e
No
rth
ern
Cap
e
Fre
e S
tate
Kw
azu
lu-N
ata
l
No
rth
West
Gau
ten
g
Mp
um
ala
ng
a
Lim
po
po
Working Age
Population
(percentage of total
population)
63.7% 64.8% 60.4% 64.1% 65.5% 61.9% 62.7% 68.8% 62.8% 59.8%
Employed (Formal
and informal) 38.9% 50.8% 32.3% 38.6% 39.1% 33.7% 42.6% 47.3% 36.3% 25.5%
Unemployed 13.0% 14.1% 11.8% 14.7% 14.8% 10.2% 15.3% 15.3% 13.5% 10.7%
Non-participation 48.0% 35.2% 55.9% 46.7% 46.0% 56.1% 42.1% 37.4% 50.2% 63.8%

Page 116 of 194
Graph 4: Formal and Informal Employment by Province
Source: Quantec Database – Standardised Regional Dataset
Almost 80% of those employed are employed in the formal sector, with the remaining
21% employed in the informal sector.
This is very similar to the national trend but varies substantially from provinces such as
Western Cape, Northern Cape, North-West and Gauteng.
The Eastern Cape, Mpumalanga, and Limpopo have a larger percentage of the
population employed in the informal sector (25.3%, 23.6% and 28.9% respectively).
Of importance is the position of the province with regards to skills in the formal employment
sector.
Graph 5: Skills Profile of Formally employed per Province
Source: Quantec Database – Standardised Regional Dataset

Page 117 of 194
KwaZulu-Natal sits on the national average with regards to highly-skilled individuals,
with 12.5% of formally employed individuals, while Gauteng has the highest number
of highly-skilled workers (14.1%).
With regards to skilled individuals, again the province is similar to the national average
(42.7%), with 43% of those formally employed being classified as skilled.
Over 40% of those employed are semi or un-skilled, again indicating the need to
enhance the effectiveness of education and skills development, and the promotion
of demand-driven training.
8.2 Overview of KZN District Economies
KwaZulu-Natal’s Economic Profile identifies key sectors’ opportunities and constraints and
provides a synopsis of the levels of investment, growth and beneficiation processes, as well
as employment in key sectors within the provincial economy.
Graph 6: KZN Economy Overview
Source: Quantec Database – Standardised Regional Dataset
The four largest economic sectors in KwaZulu-Natal are Manufacturing (21.5%),
Finance, Real Estate and Business Services (20.2%), Wholesale and Retail Trade, Hotels
and Restaurants (13.9%), and Transport and Communications (13.6%).
The other important economic sectors in the province are: General Government
Services (12.7%), Community, Social and Other Personal Services (6.5%), Agriculture,
Forestry and Fishing (4.4%), Construction (3.1%), Electricity and Water (2.3%), and
Mining and Quarrying (1.7%).
Source: TIKZN: 2010

Page 118 of 194
Tourism, which is not classified under the category of economic sectors, is also a
major contributor to KwaZulu-Natal’s economy, contributing about 10% of the
provincial economy (TIKZN, 2010)5.
The provinces gross value added (GVA) is indicated below. The table is devised to show the
long-term growth trend (1995 -2009) and the short-term growth trend (2000 – 2009).
Table 8: Provincial GVA Growth Rates
Provincial GVA Growth 1995 - 2009 2000 - 2009
Agriculture, forestry and fishing 2.4% 1.8%
Mining and quarrying -0.1% 0.1%
Food, beverages and tobacco 2.4% 3.5%
Textiles, clothing and leather goods 0.0% 0.8%
Wood, paper, publishing and printing 0.9% 0.6%
Petroleum products, chemicals, rubber and plastic 3.6% 1.4%
Other non-metal mineral products 0.0% 2.0%
Metals, metal products, machinery and equipment 3.1% 2.5%
Electrical machinery and apparatus 3.7% 3.0%
Radio, TV, instruments, watches and clocks 1.7% 3.4%
Transport equipment 2.8% 2.8%
Furniture and other manufacturing 0.8% 0.1%
Electricity 0.8% 0.5%
Water 6.6% 6.0%
Construction 4.1% 7.6%
Wholesale and retail trade 4.0% 3.9%
Catering and accommodation services 2.3% 3.8%
Transport and storage 3.7% 4.0%
Communication 9.5% 8.3%
Finance and insurance 8.5% 10.1%
Business services 3.9% 4.2%
Community, social and personal services 3.5% 3.6%
General government 1.7% 2.8%
Source: Quantec Database – Standardised Regional Dataset
From the data presented the following trends are evident:
Agricultural growth rates declined considerably in the short-term;
Petroleum product growth slowed in the short-term;
Small electronic manufacturing increased in the short-term;
Similarly construction experienced an upswing from 2000 onwards, possibly due large
infrastructure projects in preparation for the 2010 World Cup as well as development
of Bridge City, the King Shaka Airport and Dube Tradeport;
5 KZN Investment Strategy, 2011
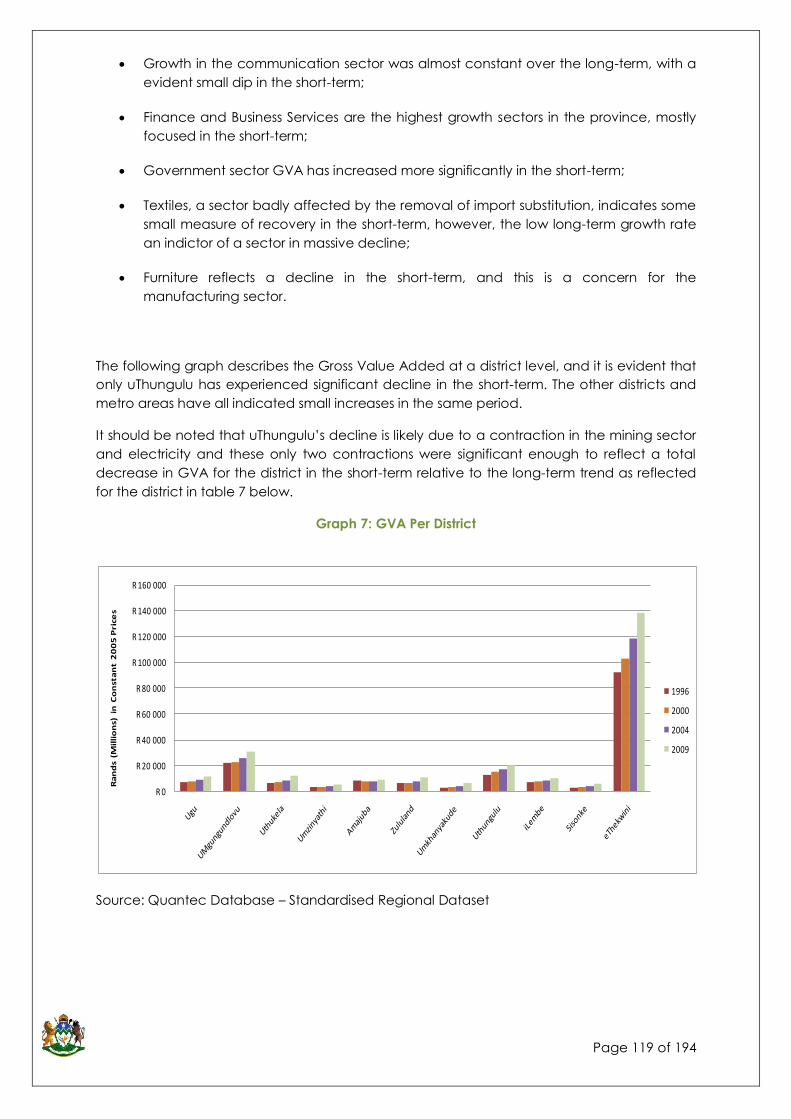
Page 119 of 194
Growth in the communication sector was almost constant over the long-term, with a
evident small dip in the short-term;
Finance and Business Services are the highest growth sectors in the province, mostly
focused in the short-term;
Government sector GVA has increased more significantly in the short-term;
Textiles, a sector badly affected by the removal of import substitution, indicates some
small measure of recovery in the short-term, however, the low long-term growth rate
an indictor of a sector in massive decline;
Furniture reflects a decline in the short-term, and this is a concern for the
manufacturing sector.
The following graph describes the Gross Value Added at a district level, and it is evident that
only uThungulu has experienced significant decline in the short-term. The other districts and
metro areas have all indicated small increases in the same period.
It should be noted that uThungulu’s decline is likely due to a contraction in the mining sector
and electricity and these only two contractions were significant enough to reflect a total
decrease in GVA for the district in the short-term relative to the long-term trend as reflected
for the district in table 7 below.
Graph 7: GVA Per District
Source: Quantec Database – Standardised Regional Dataset
R 0
R 20 000
R 40 000
R 60 000
R 80 000
R 100 000
R 120 000
R 140 000
R 160 000
Ra
nd
s (M
illi
on
s) i
n C
on
sta
nt
20
05
Pri
ces
1996
2000
2004
2009

Page 120 of 194
Table 9: GVA Growth (2000 – 2009) per District and Industry
Ugu uMgungundlovu uThukela uMzinyathi Amajuba Zululand Umkhanyakude uThungulu iLembe Sisonke eThekwini
Agriculture, forestry and fishing -0.2% -1.4% 8.9% 2.1% -5.7% 2.0% 7.1% 0.9% -1.1% 0.0% 8.9%
Mining and quarrying -8.1% 10.5% 1.4% 7.2% -7.9% 1.7% 1.9% -3.5% 4.0% -2.5% 4.1%
Food, beverages and tobacco 7.1% 4.1% 5.8% 10.6% 1.2% 11.0% 15.0% 4.3% 4.1% 14.5% 1.0%
Textiles, clothing and leather goods 5.2% 3.0% 0.6% 14.2% -2.1% 13.8% 17.0% 2.0% -0.5% 11.3% 0.5%
Wood, paper, publishing and printing 3.8% -0.2% 1.6% 6.3% -1.6% 5.8% 13.4% 2.4% -0.1% 8.1% -1.1%
Petroleum products, chemicals, rubber and plastic 5.8% 2.0% 4.0% 9.4% -0.6% 12.2% 18.1% 2.1% 0.7% 13.2% 0.6%
Other non-metal mineral products 5.9% 2.3% 5.0% 7.0% -1.7% 11.5% 12.9% 3.3% 0.0% 9.2% 0.0%
Metals, metal products, machinery and equipment 7.4% 2.8% 3.5% 13.2% 2.4% 16.1% 12.1% 1.9% 1.8% 13.8% 1.5%
Electrical machinery and apparatus 8.4% 4.1% 2.3% 9.6% 2.3% 14.3% 11.0% 6.0% 1.7% 13.9% 2.0%
Radio, TV, instruments, watches and clocks 7.9% 3.9% 3.0% 15.3% 0.5% 13.8% 16.3% 4.7% 2.8% 11.6% 2.1%
Transport equipment 7.1% 4.5% 6.6% 12.2% 1.1% 17.1% 17.5% 4.7% 3.0% 13.0% 2.0%
Furniture and other manufacturing 4.3% 0.7% 2.2% 10.3% -2.3% 11.0% 13.7% 0.7% -0.4% 15.3% -1.3%
Electricity -2.3% -2.2% -1.2% 10.4% -0.6% 1.1% -0.1% -0.5% -5.5% 4.4% 1.7%
Water 1.7% 2.8% 10.4% 10.2% 6.5% 6.5% 6.9% 4.7% 4.2% 15.3% 6.9%
Construction 7.2% 7.6% 11.8% 11.7% 4.5% 12.3% 11.7% 7.8% 6.5% 11.4% 6.9%
Wholesale and retail trade 3.5% 2.3% 7.5% 4.3% 2.9% 8.3% 12.4% 5.6% 5.6% 1.9% 3.1%
Catering and accommodation services 3.2% 2.3% 7.6% 4.1% 2.9% 8.4% 13.5% 5.2% 4.0% 2.0% 2.9%
Transport and storage 5.7% 5.9% 7.8% 7.5% 4.9% 4.8% 6.6% 5.1% 1.6% 10.3% 3.0%
Communication 10.6% 11.3% 11.5% 11.7% 9.2% 10.7% 13.3% 9.6% 4.8% 12.1% 7.4%
Finance and insurance 11.8% 8.4% 14.0% 10.4% 12.2% 9.7% 12.2% 12.2% 15.1% 15.3% 9.5%
Business services 4.9% 3.1% 9.3% 5.7% 6.9% 4.5% 6.4% 6.4% 5.0% 10.9% 3.6%
Community, social and personal services 3.2% 3.8% 5.3% 4.8% 3.0% 5.0% 4.6% 2.9% 4.0% 4.7% 3.3%
General government 2.5% 2.9% 4.2% 3.1% 2.3% 4.3% 4.2% 2.0% 3.1% 4.0% 2.4%
Source: Quantec Database – Standardised Regional Dataset

Page 121 of 194
8.2.1 Ugu Ugu experienced contractions in the following sectors: Agriculture (-0.2%); Mining (-8%) and
Electricity (-2.3%). However, the district’s economy showed greater diversification and
widening as key manufacturing sectors experienced extensive growth, notably in metal
products, transport equipment and electrical machinery. In addition, communication and
finance both grew considerably in the short-term, both experiencing growth rates in excess
of 10%.
8.2.2 uMgungundlovu Mining and Communications appear as the two lead sectors in uMgungundlovu, both
experiencing growth of over 10% in the period. Agriculture, wood and publishing, and
electricity are the three sectors that contracted in the period. Transport experienced
moderate growth; however, manufacturing appears to be in serious decline relative to long-
term performance in the other leading sectors.
8.2.3 uThukela uThukela has experienced good growth off a low base; notably Agriculture, Water,
Construction, and Finance and Insurance have performed well in the last decade. However,
much of the regional spend has been dominated by public sector, and this is evidenced in
the low levels of beneficiation and manufacturing locally.
8.2.4 uMzinyathi The Agricultural sector is fairly stagnant in uMzinyathi, with growth of only 2.1% shown for the
period. Service provision in Water and Electricity has significantly buoyed the local economy.
Local Mining and Quarrying has maintained its level of significance in the district.
8.2.5 Amajuba
Amajuba has experienced significant contraction in Agriculture and Mining, to historically
key sectors in the region. Their diversification to Manufacturing in the late 1990s and 2000s
has also gone through a decline, as is evidenced in the table above. However, the tertiary
sector, notably Financial Services and Communication have experienced good levels of
growth, showing a maturing of the region’s economy.
8.2.6 Zululand This area has experienced substantial local investment in the past decade and has
responded with high levels of GVA growth off a very low and previously undiversified base. In
particular, Food and Beverage services as well as Transport Equipment and Machinery
manufacture have grown.

Page 122 of 194
8.2.7 uMkhanyakude Interestingly, the district has experienced good growth in Manufacturing, virtually across all
production types. However, relatively lower growth in Transport, Business Services and
Community and Social Services indicate that there remains limited diversification.
8.2.8 uThungulu uThungulu’s decline is reflected by a contraction in the Mining sector and Electricity, and
continued steady growth in Manufacturing. Interestingly, the district has had good tertiary
sector growth in Financial Services, Communications and Retail.
8.2.9 iLembe iLembe has experienced declines in a range of sectors including Agriculture, Paper
Manufacturing, Textiles, Furniture and Electricity. However strong growth in Construction,
Communication, Business Services, and Finance and Insurance ensured that the district’s
total GVA grew in the period.
8.2.10 Sisonke Sisonke has experienced good growth off a very low base, with Food and Beverages,
Textiles, Metal products manufacturing, Furniture, and Finance and Insurance having
performed well in the last decade. In total, growth in GVA has been maintained at just below
6%, however off a very low base comparatively.
8.2.11 eThekwini
Interestingly, despite eThekwini’s highly urbanized setting, Agriculture GGP has grown just
below 9% in the last decade. There is evidence of stagnation in Manufacturing, and a clear
decline in Wood and Paper, as well as Furniture production. Construction rates remained
high for the period as did Communication and Financial Services.
8.3 Overview of KZN Economic Nodes6
Economic activity in KwaZulu-Natal is largely concentrated in three main centres, namely,
Durban, Pietermaritzburg and Richards Bay. Below is an overview of these three economic
centres.
6 Source: KZN Investment Strategy (2011)

Page 123 of 194
8.3.1 Durban Durban, which falls within the jurisdiction of the eThekwini Municipality, is South Africa’s third
largest city and the third largest city in South Africa after Gauteng and Cape Town
respectively. Durban is the biggest city on the east coast of the African continent, covering a
land area of 2,292 square kilometres. The city of Durban is connected to the other major
economic hubs of South Africa, namely, Pietermaritzburg and Richard’s Bay in KwaZulu-
Natal, and Johannesburg and Pretoria in Gauteng Province by road and rail. It is also
connected to the latter by road.
The other major economic features of Durban include:
The largest and busiest port in Africa: As a result, Durban is a major importer of both raw
materials and manufactured goods. Furthermore manganese, chrome ore, coal, sugar, and
grain are exported through the city;
A modern, world-class international airport, which started operating just before the start of
the 2010 FIFA World Cup hosted by South Africa;
A world-class convention centre, which has hosted many international events, such as
conferences. This centre has been voted the best in Africa at least the past six times. It is also
amongst the top 10 in the world;
A well-developed physical infrastructure; and
A variety of other attractions ranging from busy shopping malls, to sunny beaches and
gardens.
8.3.2 Pietermaritzburg
Pietermaritzburg in uMgungundlovu District Municipality is the capital city and
administrative/legislative centre of KwaZulu-Natal. Situated approximately 80 kilometres
north-west of Durban, Pietermaritzburg lies astride the N3 highway between Durban and
Johannesburg. The N3 is the busiest development corridor in South Africa. Pietermaritzburg is
the second largest city in KwaZulu-Natal. As a capital city, Pietermaritzburg has a strong
services sector and is the central location for different inland towns and settlements in
KwaZulu-Natal. The city is also host to many parastatals and government departments
(Pietermaritzburg-Msunduzi Government, 2010)7.
Pietermaritzburg is a regionally important industrial centre and offers a wide range of
products, including timber products, dairy products, footwear, and cloth. The city is also host
to about 15 motor-component producers. Various types of motor vehicles and a truck brand
are assembled in the city. Furthermore, Pietermaritzburg is also host to the main operations of
one of the largest producer of rolled; extruded and other semi-fabricated and finished
aluminium products in Africa.
7 Pietermaritzburg-Msunduzi Government. A Clever Strategy for Marketing Investment Opportunities (2010).

Page 124 of 194
8.3.3 Richards Bay Richard’s Bay is one of the fastest growing industrial areas in KwaZulu-Natal. It is the centre of
operations for South Africa's aluminium industry operations, producing over 4% of the world’s
aluminium exports. The Richards Bay Coal Terminal, which is located in this town, is the largest
coal export facility in the world. This terminal has been instrumental in securing South Africa's
position as the second-largest exporter of steam coal in the world. Furthermore, Richards Bay
Minerals is one of the largest sand-mining and mineral-processing operations in the world
(KZN Top Business, 2010).
Richards Bay is situated on a 30 square kilometre lagoon of the uMhlathuze River, which gives
it one of the country's largest harbours. The Port of Richard's Bay is South Africa's premier bulk
cargo handling port and is well situated to serve the KwaZulu-Natal and Mpumalanga coal
fields, and has expanded into other bulk and break bulk cargos including timber and granite
from as far away as the Eastern Cape and Northern Cape. The port handles in excess of 85
million tons of cargo per annum and is one of the few South African ports with the flexibility to
expand with demand to become one of the largest ports in the world. Exports remain the
main activity of this port.
The Richards Bay IDZ presents a number of opportunities for the expansion of industrial
development within uMhlathuze. However, a number of constraints such as the high initial
capital cost, environmentally sensitive areas, as well as high levels of existing pollution are
reducing the potential of the IDZ to make a dramatic impact. The attraction of investment to
the IDZ is of critical importance for growth and development of the region, not to mention
the province.
8.3.4 Summary of the City Economies
KZN’s current economic composition clearly indicates that economic activity is
largely concentrated in the three abovementioned urban centres, with these cities
dominating the share of provincial GVA.
This suggests that more needs to be done to establish or strengthen other smaller
urban-nodes to distribute economic activity more evenly within the province, and
create opportunities outside of these three leading cities – while at the same time,
ensuring that investment into these existing economic powerhouses continues to
support the growth and development of the province.
The sub-section to follow provides an assessment of the other significant nodes within the
province.

Page 125 of 194
8.3.5 Other Centres of Economic Activity in KwaZulu-Natal
The map below illustrates the locations of the major economic activities in the KwaZulu-Natal
Province, including those discussed above.
Figure 4: The District Municipalities and Main Towns/Cities within KZN
Source: TIKZN Annual Report (2008/09)
In addition to the three main economic centres, there are a number of smaller
economic centres that are generally supported by the surrounding rural and urban
settlements.
To the north-west of the province are Newcastle and Ladysmith, which both have
substantial manufacturing capacity.

Page 126 of 194
On the south coast, Port Shepstone is an economic node that has a strong light-
industrial sector as well as a significant trade and commerce sector.
To the north of Durban is the iLembe District which has, more recently, experienced a
substantial amount of investment in hotel properties and other high-end residential
estates, retail, and office and light-industrial capacity.
The Stanger town centre has a strong business sector as well as a fair amount of
industrial activity.
8.4 Detailed Economic Sector Review
8.4.1 Agriculture
KwaZulu-Natal’s agriculture, forestry and fishing sector is the smallest contributor to the
provincial economy, contributing about 4.4% to the province’s GDPR. However, it is the
leading contributor to the national output in this sector, with a contribution of about 29%
(TIKZN, 2010).
The province’s agricultural sector is focused mainly on the following (TIKZN, 2010):
Crops: Sugar and maize;
Horticulture: Sub-tropical fruits especially pineapples and bananas,
cashew nuts, potatoes, and Vegetables;
Animal Husbandry: Beef, sheep (mutton and wool), pigs, poultry; and
Forestry: South African pine, black wattle, eucalyptus, and poplar.
Forestry plays an important role in the economy and large plantations are found in
the northern part of the Province.
Timber production accounts for 6.5 percent of KwaZulu-Natal's agricultural output
and the forestry and paper industry had seen a huge inflow of foreign direct
investment into the province, amounting to R2.7-billion (Global Africa Network, 2007)
In terms of fishing, the marine life is diverse in KwaZulu-Natal, and it makes sea-fishing
a highly popular activity along the entire KwaZulu-Natal coastline.
Trout fishing is popular inland, while recreational fishing is popular with tourists and
locals (TIKZN, 2010).
The local fishing industry is regulated by Marine and Coastal Management. Three
TACs (Total Allowable Catch) are set every year.
The Government has also published a set of policy guidelines for the allocation of
commercial fishing rights (TIKZN, 2010).
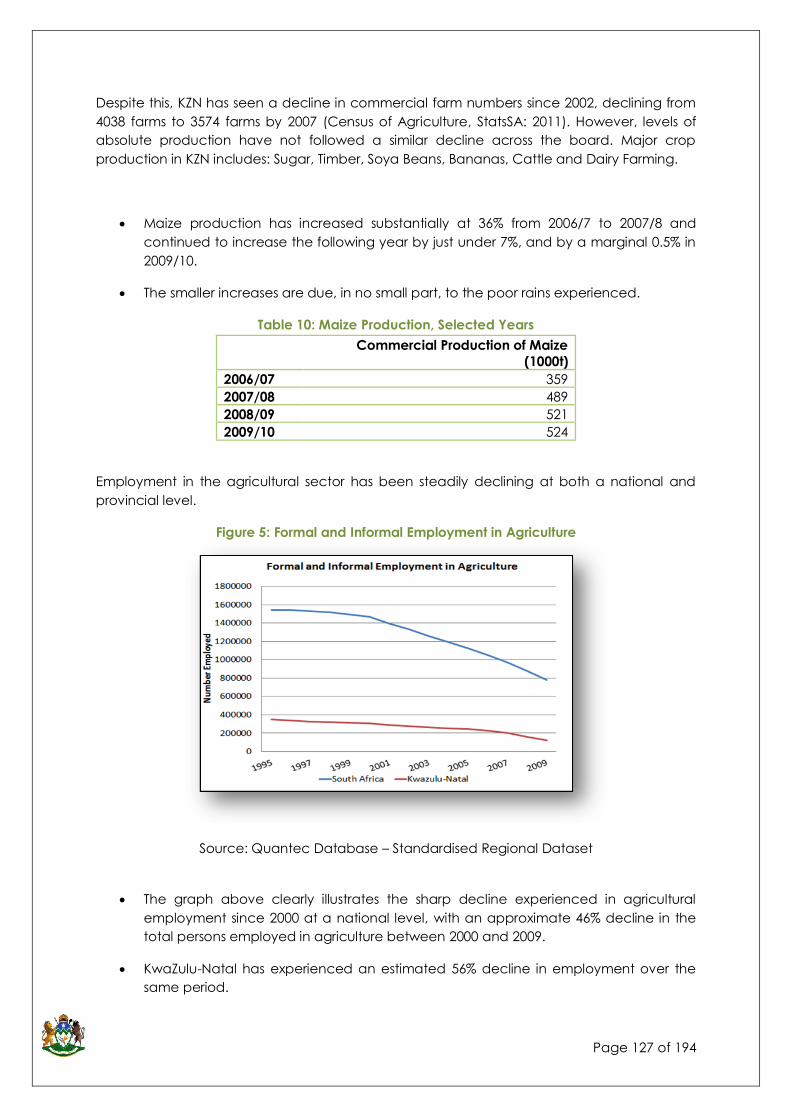
Page 127 of 194
Despite this, KZN has seen a decline in commercial farm numbers since 2002, declining from
4038 farms to 3574 farms by 2007 (Census of Agriculture, StatsSA: 2011). However, levels of
absolute production have not followed a similar decline across the board. Major crop
production in KZN includes: Sugar, Timber, Soya Beans, Bananas, Cattle and Dairy Farming.
Maize production has increased substantially at 36% from 2006/7 to 2007/8 and
continued to increase the following year by just under 7%, and by a marginal 0.5% in
2009/10.
The smaller increases are due, in no small part, to the poor rains experienced.
Table 10: Maize Production, Selected Years
Year Commercial Production of Maize
(1000t)
2006/07 359
2007/08 489
2008/09 521
2009/10 524
Employment in the agricultural sector has been steadily declining at both a national and
provincial level.
Figure 5: Formal and Informal Employment in Agriculture
Source: Quantec Database – Standardised Regional Dataset
The graph above clearly illustrates the sharp decline experienced in agricultural
employment since 2000 at a national level, with an approximate 46% decline in the
total persons employed in agriculture between 2000 and 2009.
KwaZulu-Natal has experienced an estimated 56% decline in employment over the
same period.
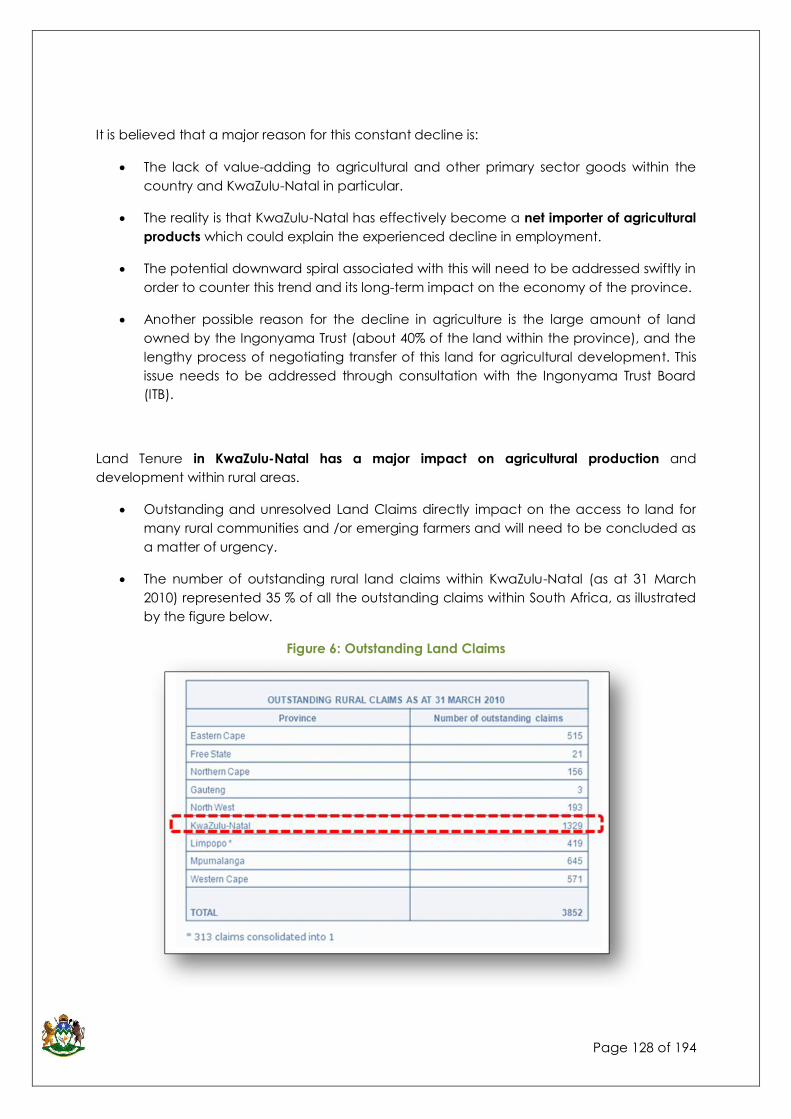
Page 128 of 194
It is believed that a major reason for this constant decline is:
The lack of value-adding to agricultural and other primary sector goods within the
country and KwaZulu-Natal in particular.
The reality is that KwaZulu-Natal has effectively become a net importer of agricultural
products which could explain the experienced decline in employment.
The potential downward spiral associated with this will need to be addressed swiftly in
order to counter this trend and its long-term impact on the economy of the province.
Another possible reason for the decline in agriculture is the large amount of land
owned by the Ingonyama Trust (about 40% of the land within the province), and the
lengthy process of negotiating transfer of this land for agricultural development. This
issue needs to be addressed through consultation with the Ingonyama Trust Board
(ITB).
Land Tenure in KwaZulu-Natal has a major impact on agricultural production and
development within rural areas.
Outstanding and unresolved Land Claims directly impact on the access to land for
many rural communities and /or emerging farmers and will need to be concluded as
a matter of urgency.
The number of outstanding rural land claims within KwaZulu-Natal (as at 31 March
2010) represented 35 % of all the outstanding claims within South Africa, as illustrated
by the figure below.
Figure 6: Outstanding Land Claims

Page 129 of 194
The Provincial Department of Agriculture and Environmental Affair’s Agrarian
Revolution programme and Land Reform’s New Strategic Framework, focusing on
integrated development models based on areas based plans, partnership, and
empowerment of beneficiaries at a local level, are both aimed at making a positive
impact on commercial agriculture.
With about 1 250 000 ha of the province’s white-owned agricultural land due to be
transferred to black owners by 2014, the Department of Land Affairs acknowledges
that an integrated approach is needed to scale up delivery and maximize positive
impact on poverty alleviation, job creation and economic growth.
An economic strategy that links land reform projects to key provincial agrarian
revolution programmes and projects will capitalise the transfer of the 30% of white-
owned agricultural land into an economic growth opportunity for the province.
Constraints to the Agricultural Sector
Re-tape surrounding Land Reform and Ingonyama Trust Board processes;
Limited value-adding occurring locally - extensive exports of raw materials through
our port system and to our hinterland provinces;
Increased international competition due to subsidisation of most international farmers;
Lack of small-scale agri-industries;
Migration by youth to urban settlements; and
Net-importer of agricultural goods due to highly specialised mono-cropping
practices.
Opportunities in Agriculture
Agro-industry development through beneficiation activities (notably dairy, bio-fuels,
timber and sugar);
Food security – “one household one garden”; community and agri-cooperative
towards commercial agriculture;
Agriculture exports – agri-hubs and processing hubs at key points like Dube Trade Port;
Alignment of Agricultural Planning Processes and the integration of Departmental
efforts;
Implementation of the ‘Framework of Rural Development Strategy’;
Supporting rural development and small-scale agricultural activities to retain and
grow the rural agricultural skill base and rural agricultural output;
Rapid conclusion of Land Restitution and Land Reform efforts;

Page 130 of 194
Creating access to local and international markets for all framing operations and co-
operatives;
Improving agricultural skills base;
Aqua-culture development;
Reducing input costs (i.e. fuel, fertilizers, electricity, etc.) and access to finance;
Continue the support to black commercial farmers and reform projects undertaken
by the Agribusiness Development Agency (ADA);
Initiate, facilitate and manage partnerships between farmers and markets;
Create linkages between new agricultural graduates and commercial farms.
8.4.2 Manufacturing
KwaZulu-Natal’s manufacturing sector (21% of national manufacturing GVA) is the second
largest in the country, after the Gauteng Province (41% of national manufacturing GVA). The
manufacturing sector is geared for export, with nearly a third of South Africa’s manufactured
exports being produced in KwaZulu-Natal. Its diversified nature is significant in the province’s
economic growth, and generates approximately 20 percent of provincial employment.
The manufacturing sector is the largest component of the broader industrial sector of
KwaZulu-Natal. As the largest economic sector in KwaZulu-Natal, the manufacturing
sector contributes a steady 21% to its GVA.
The potential for further development in the province’s industry and manufacturing
sector is anchored by the nodes of eThekwini and Umhlatuze. The corridors between
these two nodes and extending up to Howick form the primary zone of industrial
development in the province.
The cities of Newcastle, Ladysmith and Port Shepstone serve as important secondary
nodes of industrial development potential.
The graph below shows the levels of gross value add (GVA) in the province which indicates
the intrinsic levels of value-added to the provincial economy.

Page 131 of 194
Figure 7: Manufacturing GVA, KZN in Constant 2005 Prices
Source: Quantec Database – Standardised Regional Dataset
Petroleum products and chemicals account for 22% to total value added in the
manufacturing sector.
The next largest grouping of GVA is metals and machinery production at 20%, and
food, beverages and tobacco production at 18% of total value added.
Sub-sectors that contribute less to the province’s GVA include motor vehicles and
parts, printing and publishing, non-electrical machinery, and wood furniture.
The South African vehicle-manufacturing industry has created a considerable
multiplier effect in component and service providers. The automotive leather industry
has grown rapidly, with exports significantly increasing foreign exchange earnings.
The provinces’ automotive industries are located in Newcastle, Ladysmith, Dundee,
Richards Bay, Durban, Hammarsdale, Richmond, Pietermaritzburg, and Mandeni.8
KwaZulu-Natal has also recently undergone rapid industrialisation, due mainly to its
abundant water supply and labour resources.
Constraints in the Manufacturing Sector
The recent trend however within almost all to the abovementioned industrial centres has
confirmed a declining manufacturing base, mainly due to;
A shortage of zoned and serviced industrial land;
8 Global Africa Network. 2007.
Page 132 of 194
Lack of seamless logistical networks;
Inconsistency and cost of bulk services;
Restricted investment attraction;
Low levels of export from local industry;
High cost of capital and inflexibility of labour;
Out-migration of skilled persons to Johannesburg, Cape Town and overseas.
Opportunities in Manufacturing
The following potential opportunities towards promoting change in the manufacturing sector
can be identified:
Facilitate the provision of zoned and serviced industrial land;
Improved co-ordination towards seamless logistical networks;
Foreign and domestic investment promotion;
Demand-lead training programmes and apprenticeships;
Reducing capital inputs costs;
Promote knowledge and innovation sectors;
Development of harbour and coastal-based industries such as the Richards Bay IDZ;
Promote and support the Green Industries;
Implementation of the KwaZulu-Natal Industrial Development Strategy which suggest
sub-sector interventions relating to:
o Developing cluster or value chain networks;
o Supporting joint industrial and research;
o Developing cluster focused public procurement and local purchasing
agreements;
o Providing cluster or sector specific information;
o Developing joint marketing efforts;
o Developing demand led skills and education training programs;
o Developing shared logistical capabilities;
o Promoting trade and investment for these designated value chains.
Page 133 of 194
8.4.3 Tourism The Tourism industry is a key contributor to the KwaZulu-Natal economy. The province's
tourism attractions, perhaps less well known internationally, surpass the national norm in many
respects and are structured around five components. These are:
The coastal holiday areas;
Sunshine, boating, surfing and fishing;
The wildlife game parks, in the northern part of the province;
The historical battlefields;
Two World heritage sites have been declared recently, namely, the Greater Lucia
Wetlands, and Park, and uKhahlamba/Drakensberg Mountain Reserve.
In KwaZulu-Natal, tourism contribution to GDRP is standing around R30 billion - about 10% of
the provincial economy.
The Province currently attracts about 1.3 million foreign visitors and 13.9 million domestic
tourism trips on an annual basis.
Overseas arrivals to South Africa have been declining slightly but KwaZulu-Natal is visited by
approximately a third of all South Africa's international air arrival visitors.
Surveys indicate that foreign visitors spend on average 7.9 nights in South Africa, down from
11 three years ago. Most foreign tourists come from the United Kingdom, then Germany,
Africa, North America, Netherlands and France.
In terms of domestic tourism, recent surveys indicated that KwaZulu-Natal remains the most
popular destination of all provinces, capturing in excess of 35% of all domestic tourism trips in
the country.
The tourism products of provincial importance are:
Arts & crafts routes in Midlands Meander and Albert Falls Amble;
Durban, south coast and north coast beach tourism linked to cultural tourism in
the interior;
Drakensberg region;
iSimangaliso Park;
Game Parks of the North Coast;
Zulu Heritage & Cultural Trail;
Battlefields Route.

Page 134 of 194
Tourism is a growing economic sector internationally, nationally and provincially and this
sector is of importance because of its’ employment-creation potential, and its’ potential to
contribute to the region’s economic growth.
Figure 8: Destinations by Foreign Tourists, 2008
Source: SAT, 2009
Figure 9: KZN Destinations by Domestic Tourists, 2008
Source: SAT, 2009
According to SA Tourism (2009), KZN is the second major source of tourism and a
major destination market followed by the Eastern Cape.
KwaZulu-Natal continues to dominate the domestic tourism market, however the
Province’s share of the international market has declined slightly.
In KZN the average international tourist night stay is lower than the national average,
at 6.8 nights. As a result foreign tourists and tour operators are only including what are

Page 135 of 194
regarded as the core icons in a typical South African itinerary such as Cape Town,
the Garden Route and the Kruger National Park.
KZN is losing market share, however the development of the new King Shaka Airport
and the establishment of international flight routes directly to KZN will likely stem this
loss.
KZN is developing packages in partnership with leading outbound operators to
enable this area to be sold as a ‘stand alone foreign destination’ for periods of up to
seven nights, as Cape Town and the Garden Route have already successfully done.
Examining the TKZN statistics, it is evident that foreign tourists who used air travel preferred the
following activities:
Shopping (74%);
Nightlife (92%);
Visiting natural attractions (67%);
The beach (58%); and
Wildlife (51%).
An overwhelming number of domestic visitors preferred:
The beach (53%);
Live show/theatre/concert (12%);
Live sport events (14%);
Museums/galleries/historical buildings (16%);
Nature/wildlife/game reserve (18%).
This bodes well for coastal municipalities in KZN. Present indications are that the KwaZulu-
Natal coast will continue to draw tourists for the next 10 years due to its beaches, excellent
weather, golf courses and shopping facilities.
Constraints within the Tourism Sector
Although these key attractors represent a quality tourism base, it remains limited to
the beach attractions, natural environment and cultural tourism product and there is
a significant need to not only diversify offerings in this sector, but also better
integrated the various products with each other.
An increasingly antiquated tourism product and limited investment in expansion and
renewal in this sector means that the province may systematically be losing its current
competitive edge to competing attractions, not only within other parts of South
Africa, but the SADC region (i.e. Mozambique).
A fundamental concern however is the lack of the spread of tourism benefits
presented by this potential investment both to impoverished communities, as well as
the geographical spread of tourism activities from the current attractors to the lesser
known inland areas with significant potential in this regard.

Page 136 of 194
Opportunities in Tourism:
Resort development;
Struggle Heritage Tourism;
Adventure Tourism;
Capturing Local Emerging Markets;
Development of Health Tourism;
Promoting Better Universal Accessibility;
Renewal and Differentiation of Tourism Products (especially South Coast);
Rural Community Based Tourism development;
Enhance education and training in hospitality and other tourism-related industries;
Encourage KZN-loyal tour operators.
8.4.4 Finances and Services
The South African banking sector has long been rated among the top 10 globally. All the
major banking groups in the country, namely ABSA, First Rand Bank, Nedbank and Standard
Bank, operate in various parts of KwaZulu-Natal. All of these banking groups have
considerable assets, own retail distribution and electronic banking networks, which include
internet facilities. They offer a wide variety of banking and financial services. In recent years,
many foreign banks and investment institutions have set up operations in South Africa. A
significant number of them have branches in KwaZulu-Natal, especially in Durban.
Additional to the commercial banks, there are a number of development banks and
financial institutions that have been set up to provide funding and other financial assistance
to investors. These include the Development Bank of South Africa (DBSA), the Industrial
Development Corporation (IDC), The KZN Growth Fund, and iThala Development Finance
Corporation.
Business Support Programmes and Investment Incentives
There are a variety of business support programmes that are offered by the DTI that are
aimed to encouraging investment in South Africa and KwaZulu-Natal. In addition, the DTI
offers a wide range of fiscal and non-fiscal incentives to domestic and foreign companies
investing in strategically targeted sectors of the economy. Theses business support
programmes and incentives are:
Enterprise Investment Programme (EIP)
Black Business Supplier Development Programme (BBSDP)
The Critical Infrastructure Programme (CIP)
Business Process Outsourcing and Offshoring (BPO and O)

Page 137 of 194
The Sector Specific Assistance Scheme (SSAS)
The Co-Operative Incentive Scheme (CIS)
Film Production Incentives
Foreign Investment Grant
Skills Support Programme
SMME Development Programme
Export Marketing and Investment Assistance EMIA
In addition, SEDA has a number of programmes geared towards expanding SMME’s within
the country and province. Demand for SEDA services continued to grow in the 2009/2010
financial year, with 111% of the Enterprise Development Fund (EDF) being accessed. This is a
positive sign as it indicates that small business is being relieved from the pressures caused the
global financial crisis.
8.4.5 Wholesale and Retail Trade, Hotels and Restaurants (Trade and Commerce)
KwaZulu-Natal offers a range of shopping experiences from mega-malls, such as Gateway
Shopping Centre, to rural micro-markets. The ongoing construction of new shopping malls
and the expansion of existing ones across the Province give evidence to the fact that retail
trade is expanding. The malls are home to major shopping chains such as Woolworths and
Edgars. They also house shops selling a range of goods such as household necessities,
electronics, clothing, jewellery, and more specialised items.9
The increasing middle class is contributing to the surge in consumerism in KwaZulu-
Natal, even in many of the smaller towns of the province. They include taverns,
clothing stores, car-repair shops, cafes, stores selling household goods, and cell
phone kiosks for placing calls.
Brands are growing and access to new markets is occurring on an incremental basis.
Branded chains such as Engen, Standard Bank, Kentucky Fried Chicken are found on
the main roads, which form centres of business activity.
Small towns and communities benefit from projects which allow them to produce
and sell arts and crafts. This is of particular relevance to the upliftment of women who
often have few skills and little opportunity to find employment (TIKZN, 2010).
KwaZulu-Natal's hotels and restaurants are impressive. Scattered across the province
are a variety and range which suit all holiday styles and pockets, from cosy self
catering cottages to exclusive and luxurious private game resorts.
9 TIKZN ( 2010)

Page 138 of 194
Bed and Breakfast accommodation is a growing phenomenon, popular with both
tourists and business people.
The cross-cultural mix of people also ensures a wide choice of restaurants and
entertainment options. Township tourism and an overnight stay and meal in the local
community are growing in popularity, creating income opportunities (TIKZN, 2010).
8.4.6 Mining and Quarrying
There is some mining of coal and iron ore taking place in KwaZulu-Natal. However, the
contribution of this sector to the provincial economy is low. This increases an underlying
opportunity to expand the existing collieries in the province which have closed down, or to
explore unexplored mines. An agreement between Trade and Investment KwaZulu-Natal
(TIKZN) and Mintec would see the scanning of available mineral resources in the province to
realize investment opportunities in minerals (TIKZN, 2010).
Extensive sand mining and quarrying is evident throughout the province. In many instances
this is not a formally recorded activity, which has negative environmental consequences.
There is potential to formalise sand mining and quarrying in order to ensure supply to the
local construction industry.
Constraints in Mining and Quarrying:
Ecological and environmental degradation if not accurately managed;
Application for mineral rights licensing process is long and arduous and managed at
a national level, and is not transparent enough;
There is considerable risk of land tenure for local communities as well as the constraint
of unsettled land claims;
Mining vs Tourism potential along coastal areas.
Opportunities in Mining and Quarrying:
Highly labour intensive sector with good job growth potential;
Community mining and quarry is already extensive and can be formalized and
enhanced;
Small-scale coal mining;
Attraction of investment into new technologies for cleaner extraction and re-
processing;
Further expansion of building material mining;
Incentivise the beneficiation of minerals.
8.4.7 The Green Economy The green economy is a recent economic phenomenon, which according to the UNDP
refers to the development of an economy that is “low carbon, resource efficient and socially
inclusive”. In a green economy, growth in income and employment should be driven by
public and private investments that reduce carbon emissions and pollution, enhance energy
and resource efficiency, and prevent the loss of biodiversity and ecosystem services.” (UNDP:
2011).

Page 139 of 194
The Green Economy is developed around the notion that there does not need to be a trade-
off between environmental sustainability and economic development, but rather that the
two are mutually beneficial.
The KZN DEDT recently undertook to develop a report entitled “Unlocking the Green
Economy” with the intention that this would assist initiate the development of a Green
Economy Unit within the Department and assist direct future policy development. The report
identified the following priority areas:
Greening tourism;
Greening food production;
Greening energy production;
Greening water production;
Supporting the development of the Green Services Sector.
The report also went to some length to unpack the existing constraints as well as future
opportunities of the sector. These have been summarized below.
Constraints in Developing The Green Economy
Lack of regulations and standards;
Lack of incentives;
Lack of technology and/or research and development;
Lack of skills and capacity;
No access to capital;
Limited market demand;
Supply chain issues;
Lack of institutional support;
Lack of infrastructure;
Food insecurity promotes non-sustainable harvesting in protected areas;
Promotion of nodes of heavy and dirty industry affecting quality of life;
Service provision not also achieved in environmentally sustainable manner;
Insufficient policies developed to support green economy initiatives;
Difficulty in policing (emissions);
Will need to provide alternative to extraction activities that are contra-green
economic principles.
Opportunities for Developing The Green Economy
These include those identified in the KZN DEDT (Report D: Survey of KwaZulu-Natal Economy)
as: the existing opportunities for economic benefit from the management of natural
resources and their harvesting and transformation into goods and services (e.g. medicinal
tea, indigenous plants, subsistence fisheries and coastal recreation and leisure, rainwater
harvesting,).
Organic farming, especially for emerging farmers and in traditional authority areas,
food security initiatives linked to rural housing programmes, and reinvestment in our
prime agricultural assets;

Page 140 of 194
Areas of potential within the tourism sector include green tourism accreditation, the
clustering of tourism activities, niche tourism, and sourcing products from local
communities;
In energy: wind and biomass energy; the forestry reframing itself as an energy industry
relating to biofuels and carbon trading; a growing energy services sector;
neighbourhood mini-grids; and a carbon fund for the province;
There also exists the potential to completely transform the building and construction
supply chain through the development of green building materials, retrofitting existing
buildings, and creating decent jobs through the reintroduction of apprenticeships;
Likewise in the transport sector, there is scope for the development of alternative
road materials and fuels, to improve efficiencies in freight movement (particularly
from road to rail), the reform of public transport, and the greening of road
construction activities.
At the broader level of cities and towns, a continued effort to bring sustainability into
planning and development activities is required through training and capacity-
building;
Within the retail and manufacturing sectors, opportunities exist for foreign investment
in greening initiatives, especially niche markets, but also to provide support to
informal traders and co-operatives;
The waste management sector provides particular potential for socially orientated
programmes such as buy-back centres, ‘Waste for Food’, as well as reuse and
recycling (e.g. the recycling of building components);
The environmental consulting, policy and research sector is continuing to expand
with the growth of the green economy, and the demand for green professional
services and related innovative research is likely to continue;
Across sectors, green procurement and tendering processes provides a considerable
growth opportunity for the green economy as does the potential for corporates to
invest in green social responsibility projects10.
In addition:
Waste recycling – good initiatives in eThekwini and, eMnambithi already in operation;
Food packaging minimization – linkages to the paper industry already well
established in KZN;
Promotion of green technology development as a part of the provinces ICT focus;
Service delivery for electrification of households should focus on green solutions (solar
panels and turbines);
Water provision can also be focused on sustainable practices (run-off capture and
rain water solutions where possible);
Target public investment into green projects;
10 KZN DEDT: 2011, Unlocking the KwaZulu-Natal Green Economy

Page 141 of 194
Greening procurement processes;
Improving provincial and district environmental rule enforcement;
Promote sustainable and ecologically friendly agriculture, forestry, freshwater, and
fisheries methods to help conserve soil fertility and water resources in KZN with a
special focus on supporting subsistence farming.
8.4.8 Property Since bottoming out on 2009, South Africa’s house prices have steadily improved, partly as a
result of the stimulus of an accumulated 550 basis point interest rate reduction since
December 2008 and easier lending criteria. However the pace of acceleration in the
average price of domestic residential property started moderating from middle 2010,
indicating that house price inflation may be breaking.
This was confirmed by an increase in the length of time that properties have
remained on the market, initially about 12 weeks in the first quarter on 2010, and
extending to 17 weeks by the second quarter;
The property markets will continue to be affected by the affordability of houses which
remains under pressure along with high levels of house debt and high unemployment;
The year on year change in the average price of residential property in the middle
segment of the market as measured by Absa, improved marginally from a negative
3.8 percent in May 2009 to a positive 12.9 percent in April 2010, before slowing to 7.1
percent in August of last year;
FNB Property Index showed an annual improvement of 12.2 percent from 2009 April to
May 2010, and again, slowing in August to 7.2%;
The change in the Standard Bank median house price improved on a year-on-year
basis from a negative 5,2 percent in September 2009 to a positive 8,3 percent in
August 2010.11
Figure 10: Average Property Prices
Source: KZN Treasury
11 SA Reserve Bank (2010).
As is indicated in the graph
alongside: Industrial property (industrial and
warehousing) experienced
marked decline in total square
meters available, peaking in
2008.
Office and banking space follows
a similar trend, declining from
2009.
Shopping space has followed a
more moderate growth and is
continuing to increase at a
declining rate at present.

Page 142 of 194
8.4.9 Logistics and Communications Transport, logistics and communications accounts for 14% of the GVA of the province, and
equates to approximately R35,25 billion. There are numerous existing constraints facing the
sector, largely caused by the poorly integrated platform for intermodal freight movements
and the slow migration from road to rail of heavy freight. This has had a massive impact on
the road infrastructure in the province and has resulted in high cost (physical and
opportunity) of road maintenance. In addition, the global slow-down has resulted in a slower
than anticipated development of the Dube Trade Port area, as global markets have resulted
in a significant slow-down of freight related development.
As can be seen in the freight movements depicted in the graphic below, the container
traffic base through the port of Durban is substantially greater than the sum of the rest of the
remaining ports of South Africa.
Figure 11: Containerised Cargo in South African Port System
Constraints in Logistics and Communications
Lack of Integrated Networks of road, rail and harbours networks;
Slow progress Road to Rail –high cost of road maintenance;
Upgrading & Redesign of Transport Infrastructure;
Positioning of the KSIA & DTP;
Non-competitive ICT & Communication Sector.
Key Opportunities in Logistics and Communications
Optimisation of the KSIA, DTP, Richards Bay IDZ & port utilisation & efficiencies;
Further Port Development and Expansion (Durban Dig-Out Port);

Page 143 of 194
Seamless Logistical Infrastructure & Networks;
Durban-Richards Bay Corridor;
Broad Band and Optic Fibre application in the Province.
8.4.10 Informal Economy
The informal economy is a broad term used to describe a very large and growing sector of
the global economy where the world’s working poor earn a living. The term seeks to capture
the reality of the large share of the global workforce that remains outside the world of full-
time, secure, stable and protected jobs and in many cases with no form of social
protection. The importance of the informal sector within KZN is underpinned by the fact that
over 20% of those employed are within the informal sector.
Informal work traverses many occupations, including self-employed and own-
account workers, migrant, casual and temporary workers in an increasingly
globalising world economy;
The informal economy also comprises different sectors - apart from street vendors,
informal market vendors and hawkers, there are also waste collectors, home-based,
informal transport and agricultural workers;
Informal employment is a population-based definition. It includes informal wage
employment outside informal sector. To be precise, casual workers in formal sector,
employers in informal enterprises, own-account workers in informal enterprises, unpaid
family workers both in formal as well as informal enterprises.
Informal sector as production-based definition includes employment and production
that take place in small and unregistered enterprises;
In KZN, the informal economy’s employment level is indicated at 21% of the total
employed population, and equates to 462 855 persons12. This figure represents a
significant share of the employed; and has considerable implications for safe working
environments; tax revenue collection and the integration of this informal economy
into the first.
Constraints within the Informal Economy
Little control over informal working environments (health and safety; worker rights and
levels of exploitation);
Little control of the legality of economic activity undertaken;
Low levels of trust and cooperation.
12 Quantec 2011, Standardised Regional Dataset: Employment KZN

Page 144 of 194
Informal Economy Opportunities
Formalisation of informal sector workers will in the long-term assist in contribution to
the regional tax base;
Business support and training to provide informal businesses and entrepreneurs with
the skills to expand, and eventually move into the formal sector.
8.5 Investment In KZN
8.5.1 Domestic Fixed investment
This section briefly reviews the amount of fixed investment (i.e. plant, buildings, transport
equipment and transfer) that each key sector has experienced in the last decade in the
province.
Figure 12: KZN Gross Domestic Fixed Investment per Industry
Source: Quantec Database – Standardised Regional Dataset
The transport sector has experienced a massive and rapid level of investment. This is
in no small part related to the levels of freight transported via road haulage in KZN,
most notably from the Ports of Durban and Richards Bay;
Manufacturing has experienced a sharp decline since 2008, after growing at a
steady rate for the preceding 8 years;
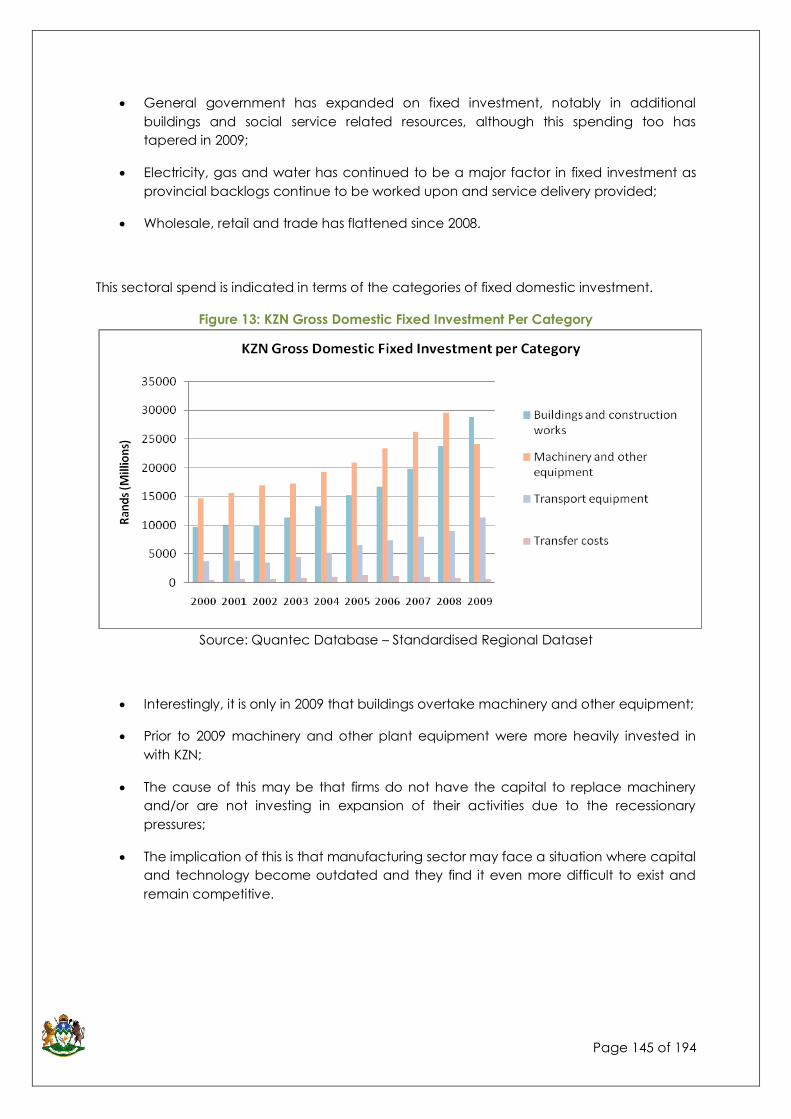
Page 145 of 194
General government has expanded on fixed investment, notably in additional
buildings and social service related resources, although this spending too has
tapered in 2009;
Electricity, gas and water has continued to be a major factor in fixed investment as
provincial backlogs continue to be worked upon and service delivery provided;
Wholesale, retail and trade has flattened since 2008.
This sectoral spend is indicated in terms of the categories of fixed domestic investment.
Figure 13: KZN Gross Domestic Fixed Investment Per Category
Source: Quantec Database – Standardised Regional Dataset
Interestingly, it is only in 2009 that buildings overtake machinery and other equipment;
Prior to 2009 machinery and other plant equipment were more heavily invested in
with KZN;
The cause of this may be that firms do not have the capital to replace machinery
and/or are not investing in expansion of their activities due to the recessionary
pressures;
The implication of this is that manufacturing sector may face a situation where capital
and technology become outdated and they find it even more difficult to exist and
remain competitive.

Page 146 of 194
8.5.2 Foreign Direct Investment
This section reviews the level and impact of foreign direct investment.
Table 11: Foreign Direct Investment into KwaZulu-Natal, 2003 – 2010 (Rand, millions)
Source: fDi Markets.com: Crossborder Investment Monitor (2010) FDI into KwaZulu-Natal – All
projects January 2003 – June 2010; Urban-Econ Calculations (2010)
* Investment to June 2010 has been accounted for the year 2010
As shown above, the levels of investment per annum for the period 2003 – 2010 (June)
indicate that:
Foreign direct investment was highest in 2008, at R 13 246 million;
The lowest foreign direct investment occurred in the 2009, at R 907 million. This low
level of foreign direct investment is most likely due to the global economic slowdown;
For 2010, R 316 million in foreign direct investment has taken place in the province
between January to June;
Total foreign direct investment for the period 2003 – 2010 is R 35 644 million.
8.6.2.1. Foreign Direct Investment per Municipality
Foreign direct investment projects have taken place in a range of areas within KwaZulu-
Natal with varying number of projects and investment value per municipality and city/town.
The graphs below provide the investor destination of foreign direct investment into KwaZulu-
Natal per municipality and city/town in terms of number of investment projects and value of
investment projects for the period 2003 – 2010.

Page 147 of 194
Figure 14: Investment Destination per KZN Municipality and city/town in terms of number of
projects, 2003 – 2010
Source: fDi Markets.com: Crossborder Investment Monitor (2010) FDI into KwaZulu-Natal – All projects January 2003 –
June 2010; Urban-Econ Calculations (2010)
As illustrated by the graphs above:
Most foreign direct investment projects have occurred in the eThekwini Metropolitan
Municipality. The municipality has attracted 59% of investment projects. This
investment has occurred in the following towns within the municipality: Durban which
has attracted the most investment (47% of investment projects), Umhlanga,
Umbogtwini, Pinetown and Umkomaas;
Umgungundlovu and Uthungulu District Municipalities have each attracted 8% of
investment projects. Within Umgungundlovu District Municipality investment occurred
within Pietermaritzburg which attracted 8% of investment projects in relation to other
towns. Within Uthungulu District Municipality investment occurred within Richards Bay
which attracted 4% of investment projects in relation to other towns;
iLembe District Municipality has attracted 6% of investment projects. Within the
municipality the towns of Zimbali has attracted 4% and Isithebe has attracted 2% of
investment projects in relation to other towns;
Uthukela District Municipality has attracted 4% of investment projects. Within the
municipality the town of Ladysmith has attracted 4% of investment projects in relation
to other towns;
Amajuba District Municipality has attracted 2% of investment projects. Within the
municipality the town of Newcastle has attracted 2% of investment projects in
relation to other towns.

Page 148 of 194
Table 12: Investment destination per KZN Municipality and city/town in terms of value of
investment, and investment per Municipality and city/town as a percentage of total
investment, 2003 – 2010
Investment
Destination per
Municipality
Investment
(Rand,
Million)
Percentag
e of Total
Investment
Investment
Destination
City/Town
within
Municipality
Investmen
t
(Rand,
million)
Percentag
e of total
investment
Uthungulu DM 13 687 38.4% Richards Bay 13 687 38.4%
eThekwini MM 9 614 27% Durban 6 882 19.3%
Umbogintwini 1 413 4%
Umhlanga 991 2.8%
Umkomaas 328 0.9%
Pinetown* 0 0%
iLembe DM 3 565 10% Zimbali 3 482 9.8%
Isithebe 83 0.2%
Umgungundlovu
DM
1 136 3.2% Pietermaritzbur
g
1 136 3.2%
Uthukela DM 335 0.9% Ladysmith 335 0.9%
Amajuba DM 285 0.8% Newcastle 285 0.8%
Not Specified 7 023 19.7% Not Specified 7 023 19.7%
TOTAL 35 644 100% 35 644 100%
Source: fDi Markets.com: Crossborder Investment Monitor (2010) FDI into KwaZulu-Natal – All
projects January 2003 – June 2010; Urban-Econ Calculations (2010)
As indicated by the table above:
The highest value of foreign direct investment occurred in Uthungulu District
Municipality, which attracted 38% of total foreign direct investment. Investment within
this municipality occurred within Richards Bay;
This was followed by eThekwini Metropolitan Municipality and iLembe District
Municipality which attracted 27% and 10% of investment, respectively. Within
eThekwini Metropolitan Municipality investment occurred in Durban, Umbogtwini,
Umhlanga, Umkomaas and Pinetown. Most investment in eThekwini Municipality
occurred in Durban which attracted 19.3% of investment. Within iLembe District
Municipality investment occurred in Zimbali and Isithebe. Most investment within the
District occurred in Zimbali with attracted 9.8% of investment;
Foreign direct investment in Umgungundlovu District Municipality was 3.2%. This
investment occurred in Pietermaritzburg;
Foreign direct investment in Uthukela District Municipality was 0.9%. This investment
occurred in Ladysmith; and,

Page 149 of 194
Foreign direct investment in Amajuba District Municipality was 0.8%. This investment
occurred in Newcastle.
Figure 15: Investment Destination per KZN Municipality and city/town in terms investment per
Municipality and city/town as a percentage of total investment, 2003 - 2010
Source: fDi Markets.com: Crossborder Investment Monitor (2010) FDI into KwaZulu-Natal – All projects January 2003 –
June 2010; Urban-Econ Calculations (2010)
This indicates that investment and economic activity is still highly concentrated in the
major ‘city’ economies of eThekwini, uThungulu and uMgungundlovu.
8.6.2.2. Foreign Direct Investment per Sector in KwaZulu-Natal
Foreign direct investment projects have occurred in a wide range of sectors within KwaZulu-
Natal. The table below provides of the number of projects per sector between 2003 and
2010. The table also provides the number of projects as a percentage of total projects.
Table 13 Number of new foreign direct investment projects per sector, 2003 – 2010
Sector Number of New Foreign
Direct Investment
Projects
Number of projects as
Percentage of Total Projects
Automotive Components 5 10%
Automotive OEM 4 8%
Building & Construction
Materials
1 2%
Chemicals 4 8%
Coal, Oil and Natural Gas 2 4%
Communications 1 2%
Consumer Products 3 6%
Financial Services 1 2%
Hotels & Tourism 4 8%
Industrial Machinery,
Equipment, Tools
2 4%
Metals 4 8%
Minerals 1 2%
Non-Automotive Transport OEM 1 2%
Paper, Printing & Packaging 2 4%

Page 150 of 194
Sector Number of New Foreign
Direct Investment
Projects
Number of projects as
Percentage of Total Projects
Real Estate 1 2%
Rubber 4 8%
Software & IT services 3 6%
Transportation 3 6%
Wood Products 3 6%
TOTAL 49 100%
Source: fDi Markets.com: Crossborder Investment Monitor (2010) FDI into KwaZulu-Natal – All
projects January 2003 – June 2010; Urban-Econ Calculations (2010)
As indicated by the table above:
The leading sector in terms of the number of projects was Automotive Components,
which had 5 projects or 10% of total foreign direct investment projects;
The following sectors had 4 projects or 8% of total foreign direct investment projects:
Automotive OEM; Chemicals; Hotels & Tourism; Metals; and Rubber;
The following sectors had 3 projects or 6% of total foreign direct investment projects:
Consumer Products; Software & IT services; Transportation; and Wood Products;
The following sectors had 2 projects or 4% of total foreign direct investment projects:
Coal, Oil and Natural Gas; Industrial Machinery, Equipment, Tools; Paper, Printing &
Packaging;
The following sectors had 1 project or 2% of total foreign direct investment projects:
Building & Construction Materials; Communications; Financial Services; Minerals; Non-
Automotive Transport OEM; and, Real Estate.
8.6 Synopsis: Strategic Economic Issues
The economy of KwaZulu-Natal is the second largest within South Africa, contributing
approximately 17% to national Gross Value Added (GVA).
The economic base within the Province is diverse, with the provincial economy being driven
largely by the manufacturing sector (22%), and supported by tertiary services such as tourism,
finance and insurance, transport and storage, and other business services.
The province is faced with three structural constraints to growth, namely; increasing
unemployment, poverty and inequality. These constraints have been further exacerbated by
the recent recession, which placed pressure on financial and economic systems and caused
substantial job losses. The province is under-performing relative to national population share
(21% of the national population), and currently has the third lowest per capita income
nationally (R24,650 compared to Gauteng with R50,955 ).
National Government has recently developed the New Growth Path (NGP), which has
placed emphasis on the need to create sustainable employment within the country in order

Page 151 of 194
to achieve growth and development, and to assist in achieving the Millennium Development
Goals (MDG). Job creation is therefore a key concern for the PGDS, which must ensure that
the creation of new employment is prioritised (by attracting new foreign and domestic
investment), and that no further jobs are lost, through the extension and support of business
retention and expansion programmes.
A substantial decline in investment into the primary and secondary sectors (predominantly
agriculture and manufacturing) over the past decade has reduced employment
(particularly within agriculture and textiles manufacturing), and reduced the growth
potential of the provincial economic substantially. As a consequence, the province’s
industrial base has experienced a declined national market share, and the province has
become a net-importer of agricultural goods, which illustrates the threat to food security and
the loss of export potential. The tertiary sector has however performed well, with sectors such
as ICT experiencing good growth albeit off a low base.
Tourism is a key sector within the KZN economy and holds much potential. KZN is a leading
domestic tourism destination, but lags as international destination. The Province’s Tourism
Strategy presents a thorough analysis and makes recommendations which address local and
international appeal such as marketing of SA’s urban centres more vigorously, diversifying the
appeal to be wider than nature-based tourism, as well as recommending development of
new products such as resorts.
Employment in the agriculture sector has declined by 64% since 2000, with employment in
manufacturing declining by 20% over the same period.
In spatial-economic terms, the economic contribution to provincial Gross Value Add (GVA) is
largely driven by eThekwini (53%), uMgungundlovu (12%) and uThungulu (8%). This indicates
that economic activity is dominated by the three cities of Ethekwini, Msunduzi and
Umhlatuze, with the remainder of the smaller towns and rural areas contributing less than 30%
to total GVA. This is largely due to the infrastructure that exists within the city economies, and
highlights the need for investment into economic infrastructure within less dominant towns to
create other significant contributing economic nodes.
Despite the Province enjoying a number of comparative advantages such as the Durban
and Richards Bay Ports, the Dube Tradeport, the Richards Bay industrial complex, vast tracts
of agricultural land, and a traditionally strong industrial base, these comparative advantages
have not been translated into competitive advantages. The Province has therefore not
reached its full economic potential.
Constraints such as low productivity within the Durban Port, degrading road and rail
infrastructure, a slow take-off at the Richards Bay IDZ, and uncertainty about the future of
land for commercial farming have slowed the pace of potential growth within the Province.
Emphasis must be placed on the comparative advantages of the Province, to ensure that
these are strengthened and ultimately translated into competitive advantages.
Given the location of the Province, its economic assets, and a substantial labour force
(although largely un-skilled), there is a significant amount of potential to become an
economic powerhouse, not only within South Africa, but also within the rest of Africa. The
requirements to achieve such success are numerous, but generally include an educated
and skilled labour force, provision of reliable infrastructure and services, reduction of
bureaucracy and red-tape surrounding development, strong policy direction from the public

Page 152 of 194
sector, and confidence from the private sector. In order to achieve these requirements, all
stakeholders need to work in a coordinated manner to ensure that development is correctly
planned and the public sector resources are channelled into the correct interventions in the
correct locations.
Priority must therefore be given to strengthening the key sectors of manufacturing,
agriculture, tourism, and transport and logistics, as well as emerging key sectors such as ICT
and green energy production and processes.
Key constraints facing the province and causing a decline in the key primary and secondary
sectors include:
A lack of serviced and zoned industrial land;
Lack of or delays in gaining access to Ingonyama Trust land for commercial
development and community agriculture;
Slow pace and failure of land reform programmes;
The rising cost of capital and other input costs (i.e: machinery, electricity and
labour);
Skills shortages; and
The inflexibility of labour.
These challenges need to be addressed as a matter of urgency to ensure that the Province
boasts strong economic fundamentals, which will stimulate new investment and the
expansion of existing business, and create a more conducive business environment.
In terms of provincial development planning, the Province has realised the importance of
such a platform to coordinate development. Policies and strategies in progress or recently
completed include the KZN Investment Strategy, KZN Export Strategy, KZN Industrial Strategy,
SMME Development Strategy, and the KZN Cooperatives Strategy. These strategies are
aimed at creating a more conducive business environment within the province in order to
encourage expansion of existing business, new domestic and foreign investment, SMME
growth and development, and the expansion of export potential.
The 2011 PGDS will need to provide an overarching framework through which the province
can coordinate the implementation of strategic recommendations within each of these
strategies to ensure that the fundamentals are in place to support, promote and enhance
economic activities ranging from informal sector business activities to the activities of large
multi-nationals.

9 THE INFRASTRUCTURE LANDSCAPE
9.1 Introduction
Although the term infrastructure refers to a wide range of hard (technical) and soft
(institutional) systems, the commentary presented in this section is limited to a selected range
of “hard” infrastructure which is supportive of both community and social well-being and that
which is necessary to enhance economic engagement.
Infrastructure has a direct impact on both basic services as well as the economy.
There exists a continuing problem of lack of integration with regard to service delivery
infrastructure as well as economic infrastructure developments resulting in glaring gaps
achieving infrastructural efficiencies. Coordinated advances in both areas area needs to be
prioritised. For example, improvements in service delivery infrastructure could lead to greater
economic activities in rural areas.
Important to community and social well-being are the “service delivery” components: water,
sanitation, electricity and human settlements.
As the world undergoes rapid urbanization and greater numbers of people in developing
countries move to the cities, the need to improve basic services and infrastructure such as
drinking water, waste disposal, transportation infrastructure and the ability to turn on a light
bulb has reached a critical point.
The currently exists a serious backlogs and shortages of water, sanitation and electricity. The
delivery in the area of human settlements is slow, random and uncoordinated. Out public
transportation system is predominately taxi dominated. Adding to this transportation issue,
the province has an overburdened road network and underutilized rail transportation system.
From the point of view of providing a world class platform for economic engagement, this
section raises issues around transportation of freight, ports and telecommunications. The Rural
Transport Strategy is raised as well as an area of need.
Transport, logistics and communication are important components of the services sector,
and the province already enjoys considerable comparative advantages in these sectors. A
major priority for the province therefore is to further build on this comparative advantage by
further investment in positioning KwaZulu-Natal as the trade entrance into the continent. This
requires further investments in building a modern infrastructure, particularly transportation
and logistics, that reduces business costs, enhances competitiveness and creates
employment for firms. The Dube Trade Port in particular is regarded as the key intervention by
the provincial government to cement its position as the premier transport, logistics and
communication hub on the continent. It is expected to act as catalyst for economic
development and labour-intensive growth throughout the province. However, at present the
Dube trade port as well as the King Shaka International Airport is underutilized.
Key among the province’s superior physical infrastructure facilities are the two strategically
situated ports of Durban and Richards Bay. Together, the two ports handle nearly 80% of

Page 154 of 194
South Africa’s cargo tonnage. Moreover, the province has an extensive rail and road
network connecting other parts of the country and linking the Province to Mozambique and
Swaziland. With the development KSIA and DTP, the province’s competitive edge in
transportation and freight logistics is likely to be further enhanced, in addition it provides an
effective platform for forging trade linkages between provinces within the country,
neighbouring states and the rest of the world (particularly the Asian and South American sub-
continents), offering the province considerable investment spin-offs and opportunities.
In summary, the province’s competitive and comparative advantages include:
The ports of Durban and Richards Bay, handling nearly 80 % of South Africa’s cargo
tonnage.
Richards Bay is the country’s centre of aluminium industry operations, producing over
4% of the world’s export of aluminium. It is also the seat of the world’s largest sand
mining and mineral-producing operations.
Leading producer of timber, processing over half of all timber used in the country,
and accounting for a significant percentage of the country’s wood exports.
The Province has the highest export propensity, as well as the highest level of
industrialization in the country.
The province is second only to Gauteng province in terms of its percentage
contribution to South Africa’s GDP.
Theoretically any improvements in a logistics system will result in widely felt benefits e.g.
Through a streamlined freight system, products can be exported to reach their global
markets faster, more cost efficiently and in better condition thereby netting higher
returns;
Through investment in infrastructure to address increases in projected demand,
growth can be facilitated and congestion lessened;
Through improved visibility of supply chains, bottlenecks are addressed resulting in
improved through-put for all role-players who are able to share in supply chain
improvements.
However, backlogs in infrastructure and investment and in some cases market structures that
do not encourage healthy competition, contribute to high costs of moving goods,
operational inefficiencies, and a poor logistics system.
9.2 Transport of Freight
9.2.1 Freight Logistics
The figure below depicts the relationship between freight transportation and the economy. It
is deduced that an improved transport system can lead to increased economic growth. This
is also applicable to freight transport. In order to achieve this, the following aspects must be
analysed:
The economic policy framework
The relationship between economic growth and freight volumes
To derive freight trends based on economic indications

Page 155 of 194
Figure 7.16: Transportation and the economy
The main functions for the public sector within the transport sector are identified by the
National Freight Logistics Strategy (NFLS) as follows:
To regulate the freight system to ensure economic efficiency
To own and provide financing for strategic or common user infrastructure
components in either the Infrastructure Utilities or State-Owned Enterprises (SOEs), and
to pave the way for increased private financing of facilities
To promote better physical and operational integration of seaports, airports and land
transport networks
Increased Competitiveness
Efficient Transportation Infrastructure Investment
Increased Transportation Capacity, Efficiency,
Reliability and Level of Service
Transportation Cost
savings
Transit Time Savings
(Reliability Improvement)
Business Expansion
(Relocation and Restructuring)
Increased Productivity
Increase Economic Growth

Page 156 of 194
To ensure appropriate safety conditions in transport activities and to exercise
effective supervision of environmental and security elements of the freight system
To contribute to the trade facilitation process at all borders and interfaces, and thus
to help ports and land transport entities (whether public or private) to act as creative
partners in international trade development
The following are functions identified for private sector in the transport sector:
To provide superstructure and / or operations investment
To provide operational management within appropriate regulatory environment,
free from unnecessary public sector activity crowd-out
To promote operational integration and efficiency, in order to foster economic
growth and development
To invest in infrastructure from both a debt and equity perspective
This strategy therefore seeks to address a number of issues that undermine the competitive
advantage that South Africa enjoys, thereby rendering the country less competitive and
relevant in world markets. In the context of the critical role that the freight system plays in
building and maintaining the South African economy, the problem statement that this
strategy responds to is:
“The freight system in South Africa is fraught with inefficiencies at system and firm levels. There
are infrastructure shortfalls and mismatches; the institutional structure of the freight sector is
inappropriate, and there is lack of integrated planning. Information gaps and asymmetries
abound; the skills base is deficient, and the regulatory frameworks are incapable of resolving
problems in the industry.”
The main challenge facing transport performance is the fact that funding and financing of
transport infrastructure, network development and maintenance is not constant and
responsive to transport demand and infrastructure utilisation over the long-term. The main
causes of inefficiency and poor service reliability are an aged asset base, low accountability
for operational efficiency and a poor service culture, which are strongly evident in ports and
rail.
The figure clearly shows that both ports and rail transport need generally need higher levels
of intervention as opposed to road freight transport.

Page 157 of 194
Figure 7.17:Efficiency and Service Reliability by Mode
Uncoordinated planning of freight transport infrastructure and facilities
The provision of freight transport infrastructure at the provincial and municipal level is
very limited. There is a need to define the roles and responsibilities of the province
and municipalities in providing freight transport infrastructure such as truck stops and
intermodal transfer facilities, in order to support the efficient and economic operation
of freight transport networks.
At the national level there is a working relationship between the DoT, the Department
of Trade and Industry, and the Department of Public Enterprises in respect of policy,
legislation, funding, management and operations. These departments are not directly
duplicated at the provincial level. The provincial DoT is the custodian of policy
formulation for freight. In KwaZulu-Natal, the national DTI is represented by the
Department of Economic Affairs and Finance. Its role is to ensure that provincial
freight policies will attract investments and facilitate economic development.
Furthermore, at the provincial level there is a particular need for setting up similar
interdepartmental co-ordinating structures that will ensure effective planning and
implementation of policy. A Freight Task Group – comprising representatives of
national and provincial departments as well as State Owned Enterprises (SOEs) – has
been operating since 1998. However, improvements and / or other initiatives are still
required. This forum should continue as an ongoing concern.
Low levels of investment in certain infrastructural and operational equipment.

Page 158 of 194
Ageing rail rolling stock and port-operating equipment that undermine efforts by
government and port authorities to turn these entities around in order to respond to
the demanding global growth of freight movements.
Rigid costing approaches that are not customised.
Costing methods used to develop and set tariffs are rigid and are not activity-based.
9.2.2 Harbours and Ports
KwaZulu-Natal ports are the main entry point for importing of goods to South Africa, as well
as exporting to the world. When assessing the information depicted in graph below, it clearly
depicts that the Durban Port, handles approximately 67.74% of all containers that is either
imported to South Africa, or exported. Although a decline is noted during the period 2008
and 2009 for Durban and Richards Bay, the overall import and export of goods through the
country has reduced in the number of container handling.
9.2.2.1. Port of Durban
The port of Durban is strategically placed on the world’s shipping routes, and it is South
Africa’s main general cargo and container port. It handles approximately 60% of all the
containers in the country, and about 32% of the ships calling at all the South African ports.
Cargo handled by the port during the 2006/07 fiscal year amounted to the following:
Cargo including oil and petroleum products – 41 483 950 tonnes

Page 159 of 194
Containers – 2.335 million TEUs (or ±32 million tonnes)
Port Limitations
• The port of Durban operates 24 hours a day 365 days a year. During daylight ships are
supposedly restricted to 243.8m length with a maximum width of 35m and a draught
of 11.9m, or 12.2m according to tide and harbour master's clearance. Larger vessels
are common, and ships up to 300m lengths and 37m beams are regular callers in
Durban. Night restrictions are for a ship length of 200m, a beam of 26m, and
maximum draught of 11.6m. The harbour master has to be consulted for permission if
larger vessels are to enter port.
• Pilotage is compulsory for all vessels from a point three miles northeast of the port
entrance, with a helicopter performing most pilot transfers, backed up by pilot boat
when the helicopter is unavailable. Navigation (including all shipping movements
inside port limits) is subject to VTS (vessels tracking service system) controlled from the
Millennium Tower on the Bluff. Tug assistance is required. Draught within the port varies
according to location.
• Through the Ports Master Plan (PMP), Transnet and the National Ports Authority (NPA)
has identified several new projects for the port of Durban. This includes the widening
and deepening of the Durban harbour mouth to enable safer access and access to
larger ships at a cost of R1.7 billion. The width of the channel will be increased to
220 m at its narrowest point, flaring into 300 m beyond the south breakwater. The
depth will vary from 19 m in the outer channel to 18 m in the inner channel, and 16 m
in the inner port channels and basins.
9.2.2.2. Port of Richards Bay
Richards Bay is South Africa’s premier bulk port and the most modern. Richards Bay handles
in excess of 80 million tons annually, representing 55% of South Africa’s seaborne cargo. This
makes it the country’s largest port in terms of volumes handled. Richards Bay serves the
coalfields of KwaZulu-Natal and Mpumalanga as well as timber and granite exporters from as
far away as the Eastern Cape and Northern Cape. The port is now handling an increasing
variety of bulk and neo-bulk cargo in addition to break-bulk. Much of the general cargo has
migrated away from Durban in recent years. Exports remain the main activity of the port.
9.2.2.3. The Dube Trade Port
The Dube Trade Port became active in 2010 there is direct and indirect benefits on a national
and provincial level expected in the following logistical areas:
Creation of logistical efficiencies
Support of high-value manufacturing, value-added logistics and perishables
Alternative use of the Southern Industrial Basin (port- or mixed manufacturing
perspective)
Increase in international trade

Page 160 of 194
The major issues that are not addressed by the Dube Trade Port is that there is
currently no rail connection planned that directly links the Trade Port with the national
rail network which means that cargo will have to be transported by road, which
places pressure on existing road infrastructure and is not the most efficient means of
transport.
Incentives for IDZ needs to be addressed
Currently, it thought that although IDZ incentives do exist, they are insufficient in
attracting increased volumes of economic activity.
9.2.3 Road Transport of Freight
The total length of roads in KwaZulu-Natal is 25,600 km. This includes 1,147 km of the road
network in the eThekwini Metro area and 1,138 km of national routes. 6,656 km are surfaced
and 18,943 km are gravel.
The main national routes are the N3 (Durban to Gauteng), N2 South (Durban to Kokstad) and
the N2 North (Durban to Pongola). The N3 to Gauteng is the busiest road freight corridor in
South Africa, carrying a volume of over 1.5 million vehicles per year on the Durban to
Pietermaritzburg section. The authorities charged with the maintenance of provincial roads
face the continual challenge of maintaining the condition of roads with limited funds, in spite
of increasing usage.
The N11 route between Ladysmith and Newcastle is recorded as the second busiest freight
route in the province.
Empangeni is a major freight transport hubfrom a vehicles and tonnage perspective, with N2
route to Matubatuba and Mtunzini carrying a large proportion of road freight within the
province. Not developed fully as a hub.
The combined effect of national policies of deregulation of road transport,
commercialisation of rail, increased legal axle-mass loads and gross combination mass of
heavy vehicles has resulted in a continual shift of cargo from rail to road transport. This results
in an increase in road damage, accidents, congestion and gas emissions.
The situation is aggravated by endemic overloading of heavy vehicles which, though better
controlled in KZN than the rest of the country, has negative consequences for the life of the
roads in the province.
The cumulative effects of increasing road usage and accumulated deficits in the funding of
road maintenance are felt by all road users in terms of increased vehicle operating costs. The
deteriorating condition of roads in KwaZulu-Natal is a cause for grave concern as it
contributes to rising costs, inflation and increasing accident rates. It is noteworthy that the
Department has in recent years, placed considerable emphasis on the development of
roads in remote rural areas and is in the process of upgrading several major provincial roads
such as the P700 route to Ulundi and the P496 John Ross Highway from Empangeni to
Richards Bay.

Page 161 of 194
It will in the near future be critically necessary to reassess the provision of road infrastructure
between the N3 corridor and the Port of Durban as increasing congestion and delays are
having a negative impact on the efficiency of the logistics system surrounding the port.
KZN has the busiest freight corridor in South Africa, linking Durban with Gauteng, and one of
the main logistical objectives for the province should be the efficient and effective
movement of goods by road and rail to and from the interior. Durban harbour is also the
busiest container terminal in South Africa and third in the country when it comes to bulk and
break-bulk cargo handled. Only Richards Bay harbour and Saldanha handle more bulk
cargo. These port nodes are very important when the efficiency of the logistics chain is
measured and any delay or problem here will have a direct influence on the efficiency of
the corridors that serve these ports.
Road Freight Volumes
The estimated road freight carried on the KwaZulu-Natal Road per annum was calculated
through a series of surveys on key provincial routes. The routes and the point of survey, is
depicted on the map below.
The estimated road freight carried on the KwaZulu-Natal Road per annum was calculated
through a series of surveys on key provincial routes.
Map 48 - Road Freight in KwaZulu-Natal

Page 162 of 194
Table 14- Total Vehicles and Tonnage on KwaZulu-Natal Road Freight Routes
Survey Points Total Vehicles Total Tons
(General Commodity)
Tons
(Dangerous Goods)
013-N3-Mariannhill-Pietermaritzburg 1 496 340 34 529 550 4 303 890
041-N3-Howick-Mooi-River 1 227 240 29 544 984 2 480 688
044-N2-Tongaat-Stanger 513 906 10 329 918 1 422 408
027-N2-Park Rynie-Port Shepstone 466 344 9 760 788 1 171 368
045-N2-Durban-Tongaat 457 200 9 321 900 1 364 100
014-M13-Durban-Shongweni 394 848 6 971 904 183 744
036-N2-Port-Shepstone-Harding 355 500 7 292 016 746 076
053-R33-Dundee-Greytown 336 000 468 300 2 400
026-N2-Mtunzini-Empangeni 329 160 6 951 048 1 013 376
032-N2-Empangeni-Mtubatuba 287 364 6 126 120 661 122
004-N11-Newcastle-Ladysmith 270 480 6 122 760 678 300
042-N2-Mountayliff-Kokstad 229 146 4 485 723 398 562
005-R103-Ladysmith-Durban 208 860 4 398 804 979 872
002-R23-Volksrust-Standerton 200 100 4 179 000 343 500
054-R69-Vryheid-Louwsburg 176 400 4 115 100 207 300
007-R103-Estcourt-Ladysmith 170 496 3 208 788 141 192
024-M53-Umkomaas-N2 157 500 2 285 100 109 500
028-R612-Umzinto-Ixopo 143 856 2 184 732 129 600
012-R74-N3-Colsenso 143 400 3 158 400 558 600
025-R102-Empangeni-Mtunzini 131 454 1 653 312 123 933
031-R61-Port Shepstone-Port Edward 118 950 1 879 410 205 875
040-R603-Winkelspruit-Camperdown 113 472 1 303 746 37 824
018-R33-Vryheid-Dundee 113 160 2 568 180 123 924
006-R103-Ladysmith-Harrismith 95 931 1 929 279 315 282
038-R617-Howick-Bulwer 85 200 3 136 400 81 000
039-R56-Ixopo-Richmond 83 400 1 437 600 81 600
051-R34-Melmoth-Vryheid 76 200 1 628 400 136 800

Page 163 of 194
009-R103-Mooiriver-Estcourt 69 600 1 284 300 22 200
023-R621-Dundee-Dannhauser 66 000 1 418 400 9 600
020-R34-Nkwalini-Empangeni 53 700 1 155 300 67 500
046-R33-New-Hanover-Seven-Oak 48 900 769 500 63 000
010-R602-N11-Dundee 48 300 924 000 158 100
011-R74-N3-Bergville 47 400 862 500 30 000
019-R66-Nkwalini-Gingindlovu 42 900 789 300 94 500
037-R612-Ixopo-Donnybrook 42 000 661 800 4 800
043-R614-Tongaat-Wartburg 41 700 393 000 9 600
008-R103-Howick-Notthingham Road 41 400 655 800 2 400
022-R34-Vryheid-Utrecht 38 100 674 700 86 700
003-R34-N11-Utrecht 32 100 703 800 33 600
052-R614-R33-Wartberg 30 600 443 400 19 800
015-N2-Golela 29 100 524 700 135 300
033-R56-Stafford-Post-Ixopo 27 600 487 200 8 400
049-R33-Vryheid-Paulpietersburg 23 700 458 400 24 300
034-R56-Kokstad-Matatiele 23 400 381 900 54 000
047-R74-Greytown-Weenen 23 400 311 700 0
029-R617-Underberg-Edendale 21 600 381 900 25 200
016-R618-Hlobane-Ngome 20 700 282 900 0
048-R74-Greytown-Kranskop 20 700 303 000 8 400
021-R33-Ulundi-Nongoma 16 800 255 300 8 400
055-N2-Piet-Retief-Pongola 15 000 273 600 7 200
035-R617-Kokstad-Underberg 14 700 279 000 13 200
050-R68-Melmoth-Nquthu 8 100 118 200 7 500
030-R612-Underberg-Ixopo 6 300 143 100 19 200
017-R66-Magudu-Pongola 4 800 61 800 19 200
TOTAL 9 240 507 185 969 762 18 933 936
From the table above can be derived that the largest number of vehicles is carried by the
route between Marian-Hill and Pietermaritzburg. This is where a number of the routes start to
split to other destinations.

Page 164 of 194
The upgrading and maintenance of the linkages from the harbours to the interior of South
Africa is very important in order to support economic growth and expansion of the province.
The transportation corridors will also support the newly King Shaka International Airport and
the associated Dube Trade Port.
The following key interventions need to be considered to ensure service delivery and to
improve and capacitate economic growth within the Province:
Coordinated and Integrated service delivery
Local construction capacity.
The intention of the Department (Transport) is to promote accessibility and the safe,
affordable movement of people, goods and services through the delivery and maintenance
of transport infrastructure that is sustainable, integrated and environmentally sensitive, and
which supports and facilitates social empowerment and economic growth. This includes
road, rail and air.
The main thrusts presently are:
To construct, re-construct, upgrade and rehabilitate road and transport
infrastructure
To effectively maintain road and transport infrastructure
Provide infrastructure planning for all modes of transport including the movement
of goods and passengers to integrate transport and spatial planning, integrated
modal transport facilities and systems including non motorised transport
To facilitate the provision of road safety audits on all transport modes of
movement
The provision of data collection services; research to provide management
information systems for the provincial road network. (e.g. road condition, traffic
counts and accident data)
To provide design of road and transport infrastructure including all necessary
support functions such as Environmental Impact Assessments, Traffic Impact
Assessments, survey, expropriation, material investigations and testing
Key Issues to be addressed:
Lack of integrated land use and transport planning
There is a lack of integration between land use and transport development due
to the fragmentation of responsibilities for administering, planning, and regulating
the various aspects of land use, infrastructure, operations and regulations. There is
a growing local interest in the co-ordination of transport and land use planning.
However, in most rural areas there is very little land use planning with which to
coordinate. While most local municipalities have comprehensive plans for urban
areas, rural areas and their transport problems are not addressed.

Page 165 of 194
Lack of consultation and communication
There is a need to strengthen the communication and consultation between the
KZN DoT and other provincial departments in the social cluster, as well as
between the KZN DoT and municipalities. While the roles of the KZN DoT and
municipalities are clearly described in the policy framework, there is a need to
improve the interaction between the department and municipalities on the
planning and implementation of transport projects
The impact of growth in private and freight transport on the provision of
infrastructure
Heavy vehicles also have a high impact on traffic congestion that needs to be
managed. Freight has moved away from rail due to underinvestment, poor
service levels, high rates, lack of rolling stock, security issues and the deregulation
of road freight in the 1980s. This has had a major impact on the maintenance of
provincial roads.
Higher levels of growth in the national and provincial economy have led to
increased car ownership, and the escalation in the quantity of goods conveyed
by road freight. However, the financial resources and space available to
accommodate the growth in infrastructure needs as well as the increase in traffic
volumes are limited.
Limited development opportunities in transport infrastructure and services
In KwaZulu-Natal, Broad-Based BEE and job creation in the delivery of transport
infrastructure and transport services is still limited. In addition, the implementation
of developmental opportunities to accompany activities such as roads
infrastructure delivery has not been maximised and all possible avenues to
promote this will need to be explored.
Uncoordinated functions between government spheres
Provinces and municipalities have concurrent road traffic enforcement and road
safety enhancement functions. This has resulted in the unclear delimitation of
responsibilities and the inadequate co-ordination of functions and systems, which
has impacted negatively on road safety situations and on the enforcement of
traffic laws and regulations. The problem has been exacerbated by a lack of
efficient liaison structures, integrated systems, and integrated emergency
response services.
Fragmented and inefficient management of public transport operations
The procurement of government-subsidised public transport operators and
management of the subsidy system has been devolved by the DoT to the KZN
DoT. However, various stumbling blocks at the national level prevented the

Page 166 of 194
effective implementation of the tendered contract system, and the KZN DoT is
merely performing administrative functions on behalf of the DoT.
Funding
There are major backlogs in the provision of new infrastructure and maintenance
of existing infrastructure. The shortage of funding for infrastructure development
and the provision of transport services is endemic, and is partly due to insufficient
use of alternative funding mechanisms for road infrastructure, public transport,
and rail transport.
Shortage of skills in the transport sector
The National Skills Development Strategy includes prioritising critical skills for
sustainable growth, development and equity; promoting and accelerating
quality training for all in the workplace; and promoting employability and
sustainable livelihoods through skills development. These have been carried
through into the Human Resource Development Strategy of the KZN DoT.
The roads of the province are deteriorating rapidly and the overall condition is
already poor and funding levels are low.
Unless this situation is adequately addressed, the efficiency and costs of road
transport will be adversely affected. A sustainable road maintenance programme
is essential to ensure the long term competitive advantage of KwaZulu-Natal.
Backlogs in road network maintenance and expansion /upgrade to ensure an
equitable and balanced network
There are about 11 000 kilometres of earth roads in the province that are vital to
the road network, but have not yet been upgraded to a maintainable condition.
The backlog in the provision and maintenance of roads impacts negatively on
the human and economic development of rural communities, as well as the
economic growth of the province.

Page 167 of 194
9.2.4 Rail Transport of Freight
Key focus remains on rail transportation in the province as a means to alleviate the pressures
on road transportation of delivering goods and passengers to destinations. This is a major
infrastructure improvement priority.
Map 49 - Road Freight in KwaZulu-Natal
KwaZulu-Natal has a total of 6 Main Freight Rails, with the main purpose of transporting
imported goods from the harbour and export goods to the harbour. The main lines are the
following:
Durban-Empangeni-Golela (and Swaziland) Secondary Main Line
Durban-Kelso-Port Shepstone-Simuma Secondary Main Line
Durban-Ladysmith-Volksrust (and beyond to Union in Gauteng)
Glencoe-Dundee-Vryheid Main Line

Page 168 of 194
Ladysmith-Van Reenen (and the Free State) Main Line
Richards Bay-Vryheid East-Piet Retief-Ermelo (the coal line)
From these main lines a number of secondary/branch lines feeds into the main lines. The
branch lines are the following:
Victoria
Kranskop
Mount Alida
Glendale
Bruyns hill
Masons Hill
Underberg
Matatiele
Richmond
Bergville
Nkwalini
Hlobane
The localities of the
main and branch lines are depicted on the adjacent map.
From the table below can be seen that a total of 104, 320, 651 million tons are transported
every year.
Table 7.15- Total Annual Tonnage Transported via KwaZulu-Natal Railways
Table Fwd Tons Received Tons Transit tons Total Tons
Durban-Empangeni-Golela
(and Swaziland) Secondary
Main Line
1 777 508 3 763 768 286 444 5 827 720
Durban-Ladysmith-Volksrust
(and beyond to Union in 6 125 970 10 924 499 768 764 17 839 233

Page 169 of 194
Recent developments include the development of the King Shaka International Airport
(KSIA), as well as the establishment of the Dube Trade Port (DTP) which positions KwaZulu-
Natal as a very strong export centre in South Africa. This will however put further pressure on
the current transportation system. The completion of the KSIA and the DTP puts KwaZulu-
Natal in a position to capitalise on the presence of these entities, and a need therefore arises
to develop an integrated transport system which can capitalise on the strengths of both rail,
air, sea and road transport.
Rail is a significant provider of transportation capacity; however, its market share of general
freight traffic has declined in recent years.
It is necessary for the province to monitor this situation. By virtue of the provincial requirement
in terms of the NLTTA to provide an integrated modal transport and freight transport plan, it
will be necessary for the province to monitor the market share of freight cargo carried by the
different modes of transport. Some three years ago, the national government at cabinet
level approved a general policy to encourage greater use of rail transport. This resulted in a
complete evaluation of the assets, liabilities and market status of the railway administration.
The recently announced R 80 billion recapitalisation programme by Transnet is the first major
state intervention to also address declining rail cargoes. For KZN to ensure maximum benefit
from this railway investment programme, joint planning will be necessary.
An increase in rail market share assumes that the substantial investment planned for rail
infrastructure, rolling stock and locomotives will facilitate a significant improvement in rail
service delivery. It must be appreciated that, as the railway investment programme has
barely commenced, there will be some delay before an overall improvement in service
delivery is evident. In this respect the administration is likely to follow a targeted marketing
Gauteng)
Durban-Kelso-Port
Shepstone-Simuma
Secondary Main Line
629 334 879 458 0.00 1 508 792
Glencoe-Dundee-Vryheid
Main Line 342 740 365 1 231 001 1 574 106
Ladysmith-Van Reenen
(and the Free State) Main
Line
54 004 1 805 398 1 859 402
Richards Bay-Vryheid East-
Piet Retief-Ermelo (the coal
line)
370 449 55 833 124 17 926 649 74 130 222
All Branch Lines 1 567 602 13 574 0.00 1 581 176
Total Tonnage 10 867 607 71 414 788 22 018 256 104 320 651

Page 170 of 194
approach, concentrating initially on specific commodities or areas. The province needs to
ensure that the targeted areas for improved performance are in line with its developmental
plans.
Unclear role of province in rail transport
National policy states that rail branch lines may be devolved to provinces, and the national
government is considering issuing concessions for the operation of rail freight services. The
future role of the province, and especially the KZN DoT, in respect of rail needs to be clearly
set out in policy.
The role of the province in planning, funding and operating rail infrastructure and rail freight
services has not been decided (at the time of publishing the Green Paper). In the meantime,
the rail network in the province is underutilised and lacks maintenance, especially the
branch lines. The rail network, including some narrow-gauge lines, does have potential to
play a role in freight transport. Revitalising the rail network in rural areas will probably only be
feasible when the provincial government becomes involved in planning, funding and/or
operating rail infrastructure and services. Transnet is developing a branch line strategy and is
waiting for a proposal from the DoT about a takeover of lines.
Rigid management practices formed by supply driven strategies
In the rail sector, for example, management should change its’ rigid approach to rail service,
which places customers at the end of the supply driven strategy and service-delivery ethos,
and thus undermines their responsiveness to their clients and results in lost business.
9.2.5 Air Transport
KZN Province airport infrastructure shows that there are currently 130 airstrips in the province.
These consist of numerous airports and airstrips from small dirt landing strips to regional
airports. The development of an airport strategy in the province is borne out of the thinking
that small airports can be integrated into the public transportation system in such a way that
these smaller airports support and complement each other, can operate as a co-ordinated
public transportation system while providing affordable service to the user. Additionally and
importantly, landing facilities are cited by the Department of health as being necessary to
the provision of health services and disaster management.
Until now, there has never been a co-ordinated or managed policy with regard to small
airport development and maintenance in the province. Small airports and airstrips have the
potential to contribute effectively towards sustainable and equitable development.
To this endeavour, an assessment of the actual state of the airports is necessary including
those that are proposed for future development in order that an overall provincial and
logistics plan could be developed within a holistic agenda.
It is a given that some municipal airports are busier that others and some contribute more to
economic growth than others.

Page 171 of 194
The municipal airport infrastructure in KZN includes the following municipal airports (with the
exception on King Shaka Airport which is operated by ACSA):
Pietermaritzburg
Virginia
Old Durban airport
Margate
Richards Bay
Ulundi
Ladysmith
Vryheid
Newcastle
Mkuze
Some of these airports are currently in use as scheduled airports, while others are used as
general aviation airports to charter flights for the public and also government officials. Some
of these airports are managed by municipalities themselves and others are managed by
private companies.
King Shaka International Airport
South Africa's new international airport became operational on 1 May 2010. The R7.9-billion
greenfield airport, South Africa's second-largest transport infrastructural project after the
Gautrain rapid rail link, is situated at La Mercy, 35 kilometres north of Durban.
Named after the great 19th century Zulu warrior-king, King Shaka International Airport
represents a major expansion over Durban International, with huge growth potential.
With 102 000m² of floor area in its passenger terminal building (compared to 30 000m² at the
old airport), King Shaka International has the capacity to handle 7.5-million passengers
annually (old airport: 4.4-million), with room for significant future expansion.
Its 3.7-kilometre runway (old airport: 2.4km) is capable of accommodating the world's largest
aircraft, including the double-decker Airbus A380, with provision for future construction of a
second runway.
It also boasts 34 aircraft parking bays (versus 23 at the old airport), 16 air bridges (versus 0), 72
check-in counters (versus 52), 18 self-service kiosks (versus 4), 52 retail outlets (versus 23), over
6 500m² of retail space (versus 2 900m²), and 6 500 vehicle parking bays (versus 2 500).
The passenger terminal building incorporates the latest design concepts to make passenger
movement from arrival to departure as smooth and pleasant as possible.
And for those passing through, King Shaka International offers the full range of banking, forex
and car rental services that one would expect of a world-class airport, along with a wide
choice of restaurants, bars and duty-free shops.

Page 172 of 194
Airlines operating at the airport as of 1 May 2010 are: Emirates Airlines and Air Mauritius (flying
international routes), along with South African Airways, SA Express, SA Airlink, Mango Airlines,
Interlink Airlines, Kulula Air, British Airways Comair and 1Time.
9.2.6 Pipelines The pipeline systems in South Africa have been created primarily to serve the petroleum
industries. The pipelines have established their place in the transportation system as the most
efficient and cost effective means of transporting large quantities of liquids and gases over
long distances safely and efficiently. The cost of transporting bulk liquids by pipeline is lower
than for other modes over extended periods but there is very high capital investment
required to establish the infrastructure. In South Africa the pipeline system has been
controlled and operated by the parastatal transport company Transnet and due to lack of
competition, the costs to users are not as low as could be anticipated, in relation to road
and rail transport. Durban is the main import point for crude oil and the main centre of
pipeline activity on the coast.
Transnet Pipeline Operations
The pipeline division of Transnet, provides transport services for gas, crude oil, aviation turbine
fuel, diesel, alcohol and various grades of petrol over varying distances, using over 3 000 km
of high pressure pipelines..
Sasol Gas Operations
As a large scale producer with near monopoly powers Sasol Gas has significant influence
over the pricing of all pipeline gas in South Africa. The cost of pipeline gas has historically
been linked to the Singapore spot price of bunker oil and the PPI; but the company on
occasions offered gas to certain large steam generating accounts at extremely attractive
rates in order to secure a portion of the market in the KwaZulu-Natal and Durban coastal
region.
Refineries
In South Africa, liquid fuels are produced at four crude oil based refineries and at the
synthetic fuels plants at Secunda and Mossel Bay. The refineries that produce liquid fuel
include Calref in Cape Town, Enref and Sapref in Durban, and Natref at Sasolburg. The Sasol
ll and Sasol lll plants at Secunda produce synthetic fuels (synfuels) using coal as feedstock.
The Mossgas plant at Mossel Bay, which is owned and operated by PetroSA, produces liquid
fuel from natural gas using a synfuel process similar to that of Sasol. Distribution of petroleum
products is done by inter-company coordination in an integrated fashion using road, rail, sea
tanker and pipeline transport to move product in the most efficient manner and ensure
uniformity of pricing and supply over the whole region.

Page 173 of 194
9.3 Public Transport
9.3.1 Road and Rail Public Transport
Existing public transport is not sustainable under present operational management practices.
A large percentage of households in KZN have limited access to public transport or cannot
afford it. Some 15 % have limited access both urban and rural. Some 43% of households using
public transport spend more than 10% of their household income on it.
There are also delays in road based public transport services caused by busses and mini-bus
taxis having to operate in congested traffic streams making public transport less attractive to
commuters. Added to this are the overcrowded minibus-taxis adding to the perceptions that
this mode of transport is unsafe.
With rising car ownership and use, pressure on the road network can be expected to mount
considerably in the coming decades. The poor quality of public transport services influences
this rise in car ownership. Rising car ownership and use in the metropolitan areas and large
urban centres, giving rise to serious congestion and unacceptable levels of air pollution and
wasteful use of valuable urban land taken up by roads and car parking.
Aged and, in some cases unsafe, rolling stock and public transport vehicles, are subject to
breakdowns and are considered uncomfortable and unattractive to passengers.
Serious user dissatisfaction with almost all attributes of train, bus and minibus taxi services
often lead to vandalisation of vehicles and an incipient tendency to burn vehicles as a form
of protest against non-delivery of adequate services.
Public operators are not incentivised to offer improved services or limit operating losses.
There is a vast difference between rail service and line capacity. Service capacity has
declined because of a failure to invest in new rolling stock. Failure to maintain and upgrade
line and signal systems will also result in a reduction of line capacity.
A very high percentage of scholars and workers walk to school (79%) or to their place of
employment (18%) and cognizance of this is required in the provision of transport
infrastructure.
There is also perception of a lack of safety from crime on the accesses to public transport
services, crime at stations and on trains.
Rail Operational Problems
There is only one inter-regional service in the province, while there is a potential
for more services, given more funding and higher quality of service.
Old rolling stock and signalling equipment becomes a safety problem.
Lack of suitable facilities and infrastructure impact on efficient transfers at stations
external to Durban.
Under-utilisation of rail transport.

Page 174 of 194
Low quality services for the lower income markets.
High and rising subsidies for rail
Long-distance rail suffers from very old rolling stock, low demand and hence low
profitability.
Security at stations and on trains is an ongoing concern, but are being addressed
by the new rail way police strategy
Bus Operational Problems
Traffic congestion during peak times makes it difficult for long-distance bus
services to access the Durban station, and other congested areas in the
metropolitan area.
Duplicating and competing taxi services on certain routes
There is potential for more services, given more funding and higher quality of
service, and effective regulation of taxis so that they do not compete on routes
best served by bus.
Dispersed and hilly settlements served by gravel roads are difficult and costly to
access. This becomes impossible during rainy periods
Fragmentation of governance and operational structures.
Lack of uniform standards in terms of safety or operational compliance.
Under-utilisation of bus / coach transport
Low quality bus services for the lower income markets.
High and rising subsidies for bus
Existing public transport is not sustainable under present operating and
management practices, targeting the lower income markets.
Low profitability for many private operators, resulting in a failure to adequately
maintain and recapitalise fleets.
Manpower capacity and ineffectual management are the main cause of low
productivity in the transport system, apart from the ageing fleets of vehicles and
rolling stock.
Minibus-Taxi Operational Problems
Access problems as with bus transport: Dispersed and hilly settlements served by
gravel roads are difficult and costly to access. This becomes impossible during
rainy periods

Page 175 of 194
Lack of suitable facilities and infrastructure impact on efficient transfers between
different modes of transport..
The large volumes of taxi-commuters during peak times.
Minibus-taxi mode is relatively inefficient and can be done more efficiently by
means of bus and train.
Fragmentation of governance and operational structures.
Lack of uniform standards in terms of safety or operational compliance, but is
being addressed by Minibus-taxi Recap program. However, the Recap program
experiences various problems and delays.
Existing public transport is not sustainable under present operating and
management practices, targeting the lower income markets.
Low profitability for many private operators, resulting in a failure to adequately
maintain and recapitalise fleets.
High prices charged by taxis for tourists
Traffic safety is a major problem. This is often the result of poor driving,
unroadworthy rolling stock, long driving hours, and lack of effective law
enforcement.
Manpower capacity and ineffectual management are the main cause of low
productivity in the transport system, apart from the ageing fleets of vehicles and
rolling stock.
Overall Analysis of Problems
The following problems are common to all modes of transport:
Fragmentation of governance and operational structures.
Lack of uniform standards in terms of safety or operational compliance.
For bus, taxi and rail: lack of suitable facilities and infrastructure impact on
efficient transfers; Long-distance stations and termini external to Durban are in
poor condition and generally not integrated with other supporting land-uses, such
as shopping and employment centres.
Lack of a common fare structure, transfer agreements and protocols between
the different modes and operators, and lack of an integrated ticketing system;
Lack of a common livery (signage) for public transport in the province to facilitate
efficient inter-modal changes.
Rising car ownership and use are not sustainable in terms of their energy,
environmental and road safety;
Lack of modal integration of long-distance public transport services.

Page 176 of 194
There is traffic congestion on inter-regional roads during weekends and peak
holiday times.
Inadequate policing and law enforcement, particularly relating to unsafe driving,
un-road-worthy vehicles and poor observance of traffic laws.
Operating License Boards lack capacity - resulting in delays with issuing of
operating licenses.
Uncertainty with regard to future demand patterns depending on future changes
in the economy, demographics and technology, such as information
communication technology.
9.3.2 Rural Transport Strategy
The plight of rural people has been highlighted by numerous policy studies and other
strategic interventions in rural areas. Whereas 50% of the population of South Africa is rural,
the rural areas contain 72% of those members of the total population who are poor.
Compared to their urban counterparts, rural people also have vastly inferior access to basic
social services and the economic mainstream. Given this context, the delivery of rural
transport infrastructure and services can be a significant catalyst for sustainable economic
development, improved access to social services and poverty alleviation in South Africa’s
rural areas
The Rural Transport Strategy is aimed at developing balanced and sustainable rural transport
systems by supporting local infrastructure and services. The emphasis is on improving access
roads, developing passable roads, and addressing neglected infrastructure and corridors,
which are linked to markets and other social services. The Rural Transport Strategy proposes
that the delivery of rural transport infrastructure and services be done in terms of the
following main categories:
Rural transport infrastructure – not only access roads, but also district roads, public
transport interchanges, tracks and other non-motorised transport infrastructure.
Village-level or intra-farm transportation, where communities – particularly women –
and farmers themselves provide transport services that involve head loading, as well
as the use of non-motorised and intermediate means of transport (such as tractor-
trailers), trucks and light delivery vehicles (LDVs).
Rural passenger and (small-volume) freight transport services to and from “deep”, rural
areas, where operators of LDVs (the so-called “bakkie sector”) and animal-drawn
carts are the main service providers
Bulk freight transportation to and from processing plants, distribution centres, markets
and suppliers– provided mainly by commercial producers and transport operators.

Page 177 of 194
9.4 Water and Sanitation
9.4.1 Backlogs in Water Provision
The current backlog of water provision in the province (July 2011) is estimated at 2 million
people residing in approximately 400,000 houses/households. In order to alleviate the
backlog and provide in this need, a total of R22,000 million is required to provide basic
minimum standards of services of which only R9,500 million is currently being allocated.
Furthermore, the available resources allocation does not compare favourable as currently
only R1, 000 million per annum is available through the Municipal Infrastructure Grant (MIG)
Programme.
The quality of water is also an area that demands attention both nationally as well as in the
province.
The fitness for use of water can range from being completely unfit for use to being 100 % or
ideally fit for a specific use. The narrative descriptions commonly used to express judgements
about the fitness of water for use are:
Ideal; 100 % fit for use; desirable water quality; target water quality range (TWQR)
Acceptable
Tolerable, usually for a limited time period only
Unacceptable for use
Completely unfit for use
Ugu 45,248
uMgungundlovu 20,236
Uthukela 45,587
Umzinyathi 43,640
Amajuba 10,533
Zululand 66,592
Uthungulu 35,277
Ilembe 35,538
Sisonke 52,943
Umkhanyakude 44,299
Ethekwini 10,089
Source :Dept Water Affairs : Backlogs:
Province (households)

Page 178 of 194
The quality of water for KwaZulu-Natal (rated 77.1%) compares very favourably with the
average of South Africa which is rated at 44%.
However, DWAF in the monthly sample of 700 glasses of water continue to find traces of
ecoli, total coliforms and chlorine residue, amongst others.
The cost of water is rapidly increasing in KZN. Nationally, KZN has the highest cost of water
per unit.
The rate of increased costs of water and sanitation among households in the province is also
rapidly increasing – almost doubling from 2006 to 2008.
Unit Cost of Water: Increasing unit costs per household (distribution)
Unit cost - water (R / hh) - medium sized scheme (5000 people)
0
1,000
2,000
3,000
4,000
5,000
6,000
7,000
8,000
EC FS KZN LP MP NC NW WC
Province
R / hh
0
2000
4000
6000
8000
10000
12000
14000
16000
2006 2007 2008
Year
R / hh
Water
Sanitation

Page 179 of 194
The current backlog of sanitation services in province is estimated at 2, 63 million people
residing in approximately 526 000 houses/households. A total of R4, 900 million is required to
provide in this need, of which only R1, 200 million is available. Of note, is that only R260 million
per annum is available through the Municipal Infrastructure Grant (MIG) Programme. It is
clear that current funding is inadequate to provide in the need.
Sanitation backlogs
Sanitation in some rural areas is being provided in the form of dry-pit VIP toilets and the
strategy is to implement these simultaneously with the roll-out of water services. This ensures a
more effective impact with health and hygiene awareness training.
Some urban areas have proper water borne sanitation systems, but rural areas rely on pit
latrines or no system at all. This places tremendous strain on the environment and poses a
health risk.
Refuse removal is limited mainly to the urban areas. Dumping of refuse has become a major
problem, particularly in denser rural settlements. This poses serious environmental problems
and risks. Efforts are needed to increase people’s awareness of the advantages of good
waste management practices.
Ethekwini 27,354
Ugu 13,697
uMgungundlovu 5,724
Uthukela 15,757
Umzinyathi 34,800
Amajuba 3,948
Zululand 39,475
Umkhanyuakude 35,452
Uthungulu 41,127
Ilembe Sisonke
15,137
Sisonke
15,137

9.5 Energy and Electricity The current infrastructure in South Africa is inadequate to provide for the increased electricity demand that is systematically increasing over
time. Providing affordable, adequate, and reliable modern energy supplies remains a major challenge, even though access to electricity has
increased from one-third to two-thirds of the population since 1994.
9.5.1 Backlogs in Electricity Provision
The current backlog (July 2011) is estimated at 600 000 houses/households with a total of R9, 000 million required to address such. R3, 300 million
is currently available.
Electricity provision backlogs by district
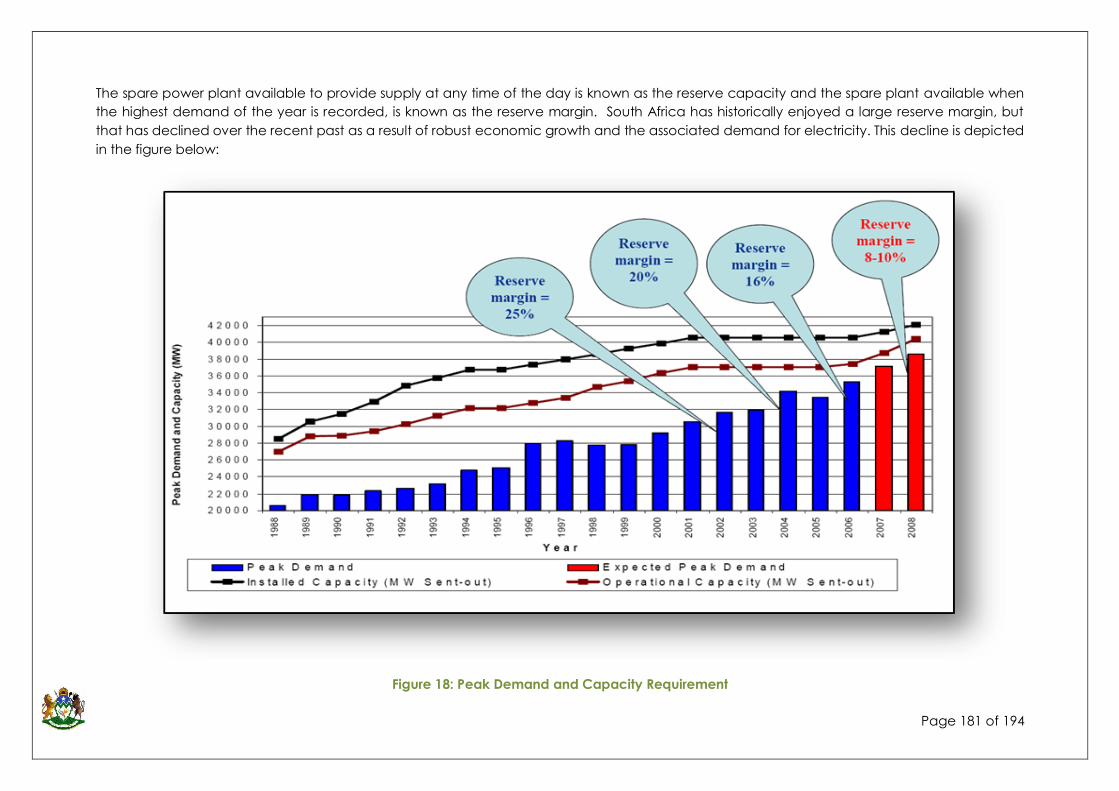
Page 181 of 194
The spare power plant available to provide supply at any time of the day is known as the reserve capacity and the spare plant available when
the highest demand of the year is recorded, is known as the reserve margin. South Africa has historically enjoyed a large reserve margin, but
that has declined over the recent past as a result of robust economic growth and the associated demand for electricity. This decline is depicted
in the figure below:
Figure 18: Peak Demand and Capacity Requirement

Page 182 of 194
Electricity supply demands will be met comprehensively with the completion of the two
power stations Khusile (in 2013) and Meduphi (in 2015). This will generate sufficient and
reliable energy for the short to medium term however it is predicted that the overall energy
demand in the country will still outstrip supply within a decade.
With the new capacity to generate electricity it is anticipated that sharp electricity price
increases will be necessary to finance the investment / debt of the new power stations so
Eskom will have to increase prices to cover maintenance and investment programmes.
Affordable special tariffs for low-income families will become important.
At municipal level there are issues around reliable grid networks to transport the electricity to
users. The challenges faced in the system of regional electricity distributors has to be
addressed in order to address maintenance and investment shortfalls.
At national level there are challenges around an institutional mechanism to decide who
should build required infrastructure for delivery of electricity. Resolution of issues around the
procurement of electricity from independent power producers will assist in regularising
access to electricity.
Eskom in KwaZulu-Natal has plans to build more sub-stations with special emphasis on rural
areas, and to integrate water and electricity provision: using electricity to provide water
through strategically-located pump stations and generating electricity in low demand times
through small scale hydro-stations. This will require close co-operation between Dept of
Water Affairs and municipal planning officials.
9.5.2 Diversified Energy Sources
Production of Renewable Energy
The two new coal-fired power stations will generate sufficient and reliable energy for the
short to medium term; however it is predicted that the overall energy demand in the country
will still outstrip supply within a decade.
To be able to meet the needs of residents and to market KwaZulu-Natal to international
Investors, a sustainable electricity provision is required.
A global phenomenon and challenge that South Africa is continually faced with is the issue
of cost effective and renewable energy. Energy is critical to virtually every aspect of the
economic and social development, contributing to about 15% to the country's gross
domestic product (GDP).
The Department of Minerals and Energy’s Energy Policy is based on the following key
objectives:
Attaining universal access to energy by 2012
Ensuring accessible, affordable and reliable energy, especially for the poor
Diversifying primary energy sources and reducing dependency on coal

Page 183 of 194
Practising good governance, which must also facilitate and encourage
private-sector investments in the energy sector
Providing environmentally responsible energy
Energy as source is largely generated through coal-fired power stations, whilst additional
electricity is generated through Nuclear Energy as well as Hydroelectric and pumped
storage schemes. The National Cabinet approved a Nuclear Energy Policy for South Africa in
June 2008, which aims to increase the role of nuclear energy as part of the process of
diversifying South Africa’s primary energy sources to ensure energy security.
Oil and gas
South Africa has very limited oil reserves and imports from the Middle East and Africa meets
about 95% of South Africa’s crude oil requirements. To produce further refined petroleum
products such as petrol, diesel, and paraffin and LPG gas for example, the following
processes are followed:
Refining crude oil (oil refineries)
Converting coal to liquid fuels and gas to liquid fuels (Sasol)
Turning natural gas into liquid gas (PetroSA)
Investment in renewable energy and energy efficiency is important to reduce the negative
economic, social and environmental impacts of energy production and consumption in
South Africa. The aim of renewable and sustainable energy refers therefore to the generate
electricity whilst the carbon footprint of the operation is reduces. Potential Sources of
renewal energy includes Wind, Bagasse, Wood, Hydro, Solar, Agricultural waste, Wood
waste, amongst some.
Apart from the availability of resources, it is also necessary to reduce the carbon footprint of
operations on the environment, whilst considering the following:
Researching sources and applicability of Renewable Energy
Waste Recovery and Recycling
Considering and implementing “Green Economy” principles
Food for waste
9.6 Information and Communication Technologies (ICT)
9.6.1 Overview
Key to positioning the province as South Africa’s opening to the world for export and import is
Information and Communications Technology (ICT).
Areas with poor ICT availability are likely to be considered less favourable for economic
investment, thereby limiting growth and development of enterprises, and limiting job creation
which is the main focus of economic development. It is therefore necessary to effectively
deploy ICT which may enable the province to accelerate the economic growth rate, on the

Page 184 of 194
basis of the potential of ICT to increase efficiency and productivity and to open up access to
new markets (HSRC, 2006).
9.6.2 Limited and expensive bandwidth
Bridging the digital divide remains a critical challenge for KZN. This situation has serious
implications especially in the rural areas as access to such infrastructure has significant
impact on the economic development. A significant retarding factor has been the high cost
of bandwidth in Africa. However, Government has committed to addressing this, and major
projects are under way to optimize the use of the South Africa – Far East undersea cable
which lands at Mtunzini – KZN west coast.
9.6.3 ICT education in the province is severely underdeveloped
Urgent attention is required with regard to greater educational initiatives with regard to the
youth being educated and proficient in the use of information technology tools. Efforts
should also be made in the areas of adult education where possible as well. There is an
insufficient focus on this area in the structure of our school curriculum.
Analysts believe that the ICT industry may have suffered extensively from 2009 onwards due
to a skills shortage predicted to have been as large as 25%. This is attributed in part to the
fact that domestic supply is far below demand. Depths of skills are even scarcer than entry
level skills.
9.7 Synopsis: Strategic Infrastructure Issues
• KZN has the two largest ports in Africa which serve as a gateway to South and
Southern Africa. Together, the two ports handle nearly 80% of South Africa’s cargo
tonnage. Serious backlogs and shortages of water, sanitation and electricity are also
prevalent.
• There exists a well developed but crumbling infrastructure. However, the need to
improve basic services and infrastructure such as drinking water, waste disposal,
transportation infrastructure and access to electricity has reached a critical point.
• Port inefficiencies exist and ports are reaching their capacity. One of the serious
constraints to development are the inefficiencies and congestion in the Durban Port
operations: back of port facilities for de-stuffing, transport out-of-port and processing
facilities for low-value goods are factors which are being addressed in the Transnet
2050 Plan.
• An over-burdened road network and under-utilised rail network are factors
contributing to infrastructural deficiencies in KZN.

Page 185 of 194
• The infrastructure stakeholders have recognised the need for multi-modal facilities
which cater for fast-moving consumer goods as well as bulk minerals and lighter
manufactured goods.
• Currently, the Dube Trade Port & KSIA; are severely underutilised. A major priority for
the province therefore is to further build on this comparative advantage by further
investment in positioning KwaZulu-Natal as the trade entrance into the continent.
• Taxi dominated public transport and lack of integrated public transport;
• Rising cost of electricity;
• Poor rural access roads and lack of secondary road network maintenance;
• Current water planning excludes agricultural demand and potential.
• Slow, random and unco-ordinated delivery of human settlements.
• In KwaZulu-Natal there exists a continuing problem of lack of integration with regard
to service delivery infrastructure as well as economic infrastructure developments
resulting in glaring gaps in achieving infrastructural efficiencies.

Page 186 of 194
10 INSTITUTIONAL AND POLICY LANDSCAPE
The National Planning Commission (NPC) has formulated an analysis of the governance
and institutional landscape of South Africa in its report “Institutions and Governance
Diagnostic” (2011), which is equally relevant to KwaZulu-Natal. In that report, the NPC
argues that there is a need to build a system and culture of governance which espouses
the principle of inclusion of people and communities in the planning and
implementation of the policies, strategies and regulations which relate to the
development of our society.
Given KwaZulu-Natal’s history of a very fragmented system of Government pre-1994,
and the governance divide that existed between large parts of the rural areas of the
Province versus many urban areas, there is a need to formulate changes to the
governance system which promotes unity amongst the wide range of communities in
KZN. The changing role of traditional leadership and maturing of the traditional
leadership institutional framework is an area that will require greater attention in the
development strategy of the Province.
The Situational Overview notes that KZN has successfully developed a stable
governance framework, with local municipalities increasingly coming to grips with the
fact that their integrated development plans (IDPs) need to speak to the needs and
aspirations of both urban and rural citizens and communities.
However it is fair to note that there is still no institutional framework for meaningful
engagement of all development partners. Whilst the regulated process for formulation of
municipal Integrated Development plans (IDP’s) requires consultation with
Government’s development partners – private sector and civil society – there is still a
great need to find institutional form for this partnership at local and provincial levels.
Provincial Government has taken the first steps towards addressing this in the
establishment of the KwaZulu-Natal Economic Council, which brings together the social
partners at provincial level to join forces around plans to grow the economy and
address economic inequalities. However at local levels there are but few, sporadic
instances of such institutional partnerships developing. A few district municipalities have
set up local development agencies which try to bring the private sector and civil society
into a structured partnership around a local development agenda, but these agencies
are often poorly resourced and rely on under-funded development programmes of
local municipalities.
As local government has become established as the centres of service delivery at a
local level, and because of a range of different factors, including reductions in donor
funding available, many organisations of civil society have been weakened or have
ceased to exist. In many instances this has made it more difficult for communities to
make local government accountable. It is widely known that the ward committee
system is not operating well in most parts of the Province.
The Province has a range of public entities which are meant to provide specialized
development support services across the Province. These include agencies focused on
economic development, for example: Ithala, Trade and Investment KZN, the KZN
Tourism Authority, the KZN Agricultural Development Agency, the KZN Growth Fund.

Page 187 of 194
Whilst these agencies have made an impact in their respective service areas, there is a
need to formulate mechanisms of collaboration with local and district municipalities that
facilitates better support for development at local levels.
The Situational Overview also focuses on the importance of the larger cities and towns of
the province in promoting better governance and accelerated growth and
development, as urbanization of the population increases. Presently there is a dilution of
input from eThekwini Metro and the larger cities and towns to Provincial decision-
making, compared to the population housed in those cities/towns and their contribution
to the economy.
In seeking to accelerate the pace of delivery of basic services and economic
development to all areas of the Province, the principle of densification of human
settlements and systematically linking nodal development to economic strategy must be
promoted. The PGDS will need to assess possibilities for strengthening collaborative
planning and policy implementation with these bigger urban centres in particular.
An important area of challenge and of opportunity which relates in particular to
governance and development of the more rural parts of the Province, is that of the
Ingonyama Trust, and land that is under the custodianship of the Trust. Whilst the Trust has
played and continues to play a very important role in overseeing the development of
land in KZN, there is a need to greatly improve the alignment in planning and in
development facilitation between the Trust, Provincial Government and local
municipalities.
The economic development strategy of this Province depends to quite a large extent on
better utilization of land as a resource to unlock value in the economy, but this will
require all stakeholders tackling the difficulties related to Ingonyama Trust land in an
honest and balanced manner. The on-going challenge around unresolved land claims
as well as the unsuccessful land reform programmes is also an area that the PGDS must
address, to ensure that land becomes a much stronger tool for empowerment of
communities and for equitable economic development.
A further issue regarding rural housing is the contradictory practices / policies in relation
to densification and the current provision of rural housing which follows existing scattered
rural patterns.
The range of challenges presented across sectors and across the different levels and
spheres of government point unequivocally to the need for clear spatial policies which
enable prioritized, co-ordinated and integrated development.

Page 188 of 194
11 FUNDING CHALLENGES
The Provincial Growth and Development Strategy is intended to be a guide for resource
allocation for all three spheres of Government as well as for the private sector and civil
society. It is however, clear that Government funding will play a lead role in driving
strategic investment into the strategies to unlock and accelerate development.
KwaZulu-Natal still receives the lion’s share of National Government funding in
comparison to the other provinces, in line with the proportion of the population resident
in KZN.
For the 2011/2012 financial year, the total Provincial Government budget amounts to
almost R75 billion. This is up from about R60 billion in the 2009/2010 financial year and is
expected to increase further to almost R80 billion in the coming financial year.
This reflects the significant growth in the amount of financial resources available to the
Province to address the backlogs in service delivery and to make advances in
development. Despite this growth in available funding, the Province still has major
backlogs in service delivery. This implies that the Province needs to continually assess
alternative mechanisms for addressing the “funding gap”. These mechanisms obviously
include further exploring of opportunities for generating own revenue. But more
importantly, Provincial Government needs to identify and create opportunities for
leveraging private sector investment into targeted service delivery areas.
Proportion of National Government Funding to Provinces

Page 189 of 194
Provincial Government Funding Allocations 2010/2011
In the 2010/2011 financial year, the allocations for the provincial government
departments were:
The above chart graphically illustrates how the bulk of the Provincial Government
budget (some 74%) is allocated to health and education. This is likely to remain the case
for the foreseeable future as health and education needs are expected to grow in the
years ahead. However, this leaves very limited financial resources available for
investment in more directly productive programmes of a PGDS. The financing strategy of
the PGDS will have to be focused on:
harnessing the existing resource base by integrating programme and budget
planning across those departments and Government agencies which contribute to
a specific development priority;
adopting innovative funding models and partnerships with private sector;
packaging of new programmes and initiatives which cannot be accommodated in
the present provincial budget framework and seeking special development funding
from National Government;
At local government level there are severe limitations to the financial contributions that
municipalities are able to make. A large proportion of the municipalities in KZN are
already hamstrung by their very poor rates base, and in many cases, a precarious
financial situation. However many municipalities are not making best use of the national
funds which are available for the promotion of growth and development in their areas.

Page 190 of 194
Figure 11.2 : Provincial Government Expenditure per District (2010/2011)
Source: KZN Provincial Treasury: KZN Payment Estimates per District
KZN Provincial Treasury has begun the process of analyzing these expenditure trends with the
aim of being able to better align demand and need with the spatial framework for
budgeting at Provincial and Departmental levels. However it is clear that Provincial
Government can play a strong facilitatory and support role in helping municipalities and
local development agencies to access funds such as the sector and project development
funds available from the “Neighbourhood Development Partnership Fund” operated by the
National Treasury. Similarly with the recent launch of the “Jobs Fund” being managed by the
Development Bank of Southern Africa, opportunities are opening up for innovative funding
partnerships around catalytic development projects at local level.
There is a need for Government to develop a focused financing strategy for key elements of
the PGDS, which will involve leveraging the spend of the private sector and the resource
investments that can be made by civil society as well.
KZN Provincial Treasury has undertaken an analysis of the expenditure of provincial
government departments and assessed this against the measured levels of poverty per
municipality. The table below reflects the degree of variation in terms of the financial
investment in services made through Provincial Government expenditure at local level.
28.2, 28%
6.1, 6%
22.3, 22%
5.0, 5%
4.1, 4%
3.7, 4%
7.4, 8%
5.8, 6%
8.4, 8%
4.7, 5% 4.2, 4%
Provincial Government Expenditure per District 2010/11
eThekwini
Ugu
uMgungundlovu
Uthukela
Umzinyathi
Amajuba
Zululand
Umkhanyakude
uThungulu
Ilembe
Sisonke
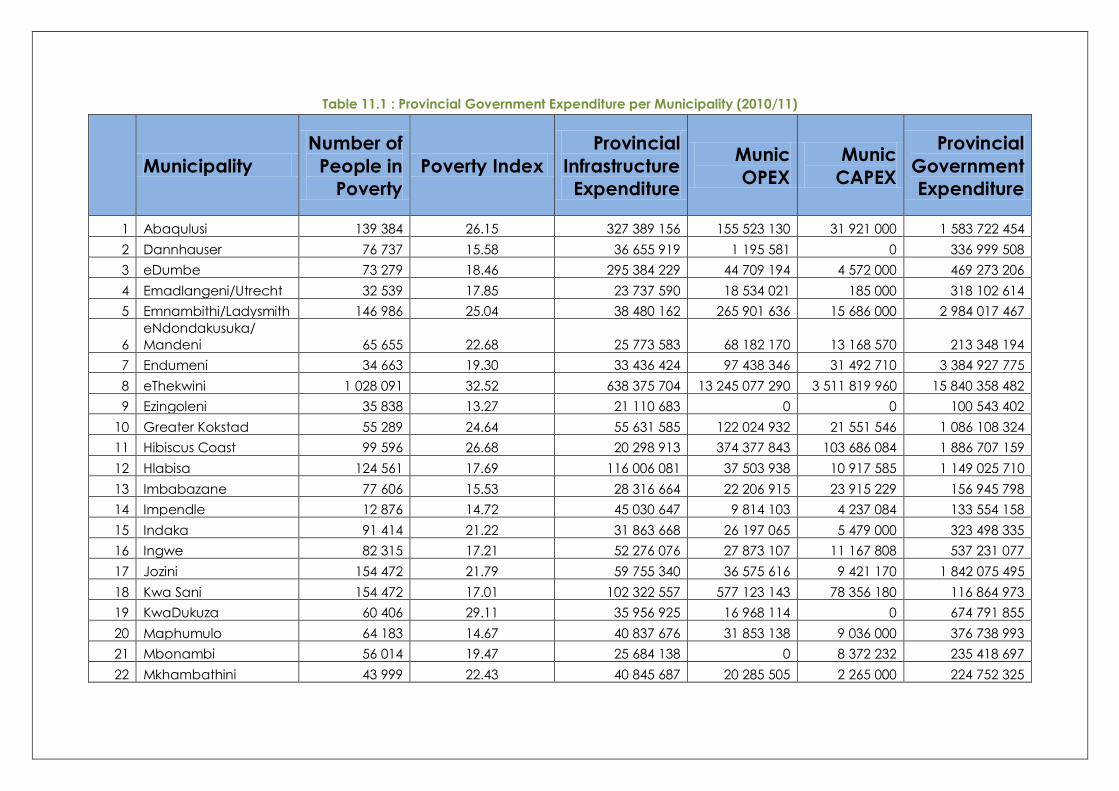
Table 11.1 : Provincial Government Expenditure per Municipality (2010/11)
Municipality
Number of
People in
Poverty
Poverty Index
Provincial
Infrastructure
Expenditure
Munic
OPEX
Munic
CAPEX
Provincial
Government
Expenditure
1 Abaqulusi 139 384 26.15 327 389 156 155 523 130 31 921 000 1 583 722 454
2 Dannhauser 76 737 15.58 36 655 919 1 195 581 0 336 999 508
3 eDumbe 73 279 18.46 295 384 229 44 709 194 4 572 000 469 273 206
4 Emadlangeni/Utrecht 32 539 17.85 23 737 590 18 534 021 185 000 318 102 614
5 Emnambithi/Ladysmith 146 986 25.04 38 480 162 265 901 636 15 686 000 2 984 017 467
6 eNdondakusuka/
Mandeni 65 655 22.68 25 773 583 68 182 170 13 168 570 213 348 194
7 Endumeni 34 663 19.30 33 436 424 97 438 346 31 492 710 3 384 927 775
8 eThekwini 1 028 091 32.52 638 375 704 13 245 077 290 3 511 819 960 15 840 358 482
9 Ezingoleni 35 838 13.27 21 110 683 0 0 100 543 402
10 Greater Kokstad 55 289 24.64 55 631 585 122 024 932 21 551 546 1 086 108 324
11 Hibiscus Coast 99 596 26.68 20 298 913 374 377 843 103 686 084 1 886 707 159
12 Hlabisa 124 561 17.69 116 006 081 37 503 938 10 917 585 1 149 025 710
13 Imbabazane 77 606 15.53 28 316 664 22 206 915 23 915 229 156 945 798
14 Impendle 12 876 14.72 45 030 647 9 814 103 4 237 084 133 554 158
15 Indaka 91 414 21.22 31 863 668 26 197 065 5 479 000 323 498 335
16 Ingwe 82 315 17.21 52 276 076 27 873 107 11 167 808 537 231 077
17 Jozini 154 472 21.79 59 755 340 36 575 616 9 421 170 1 842 075 495
18 Kwa Sani 154 472 17.01 102 322 557 577 123 143 78 356 180 116 864 973
19 KwaDukuza 60 406 29.11 35 956 925 16 968 114 0 674 791 855
20 Maphumulo 64 183 14.67 40 837 676 31 853 138 9 036 000 376 738 993
21 Mbonambi 56 014 19.47 25 684 138 0 8 372 232 235 418 697
22 Mkhambathini 43 999 22.43 40 845 687 20 285 505 2 265 000 224 752 325

Page 192 of 194
23 Mooi Mpofana 28 317 18.74 39 237 896 37 532 533 28 161 310 204 643 442
24 Msinga 112 439 13.45 69 565 287 0 0 1 009 407 555
25 Msunduzi 221 763 30.53 43 790 963 1 945 012 298 248 290 500 8 233 887 223
26 Mthonjaneni 53 499 21.31 29 891 023 33 183 400 4 541 000 686 093 647
27 Mtubatuba 25 143 16.01 37 630 095 28 755 603 2 072 000 196 182 247
28 Ndwedwe 62 934 13.24 49 951 861 31 242 000 10 866 000 829 789 930
29 Newcastle 173 494 29.04 56 210 845 0 0 2 005 397 317
30 Nkandla 82 603 15.64 77 112 946 28 042 000 0 922 268 050
31 Nongoma 132 046 24.38 376 497 076 40 293 877 0 1 498 817 944
32 Nqutu 124 001 16.46 37 026 065 43 860 316 6 797 947 951 507 417
33 Ntambanana 56 763 8.93 25 755 993 17 328 939 2 128 000 139 779 851
34 Okhahlamba 118 681 18.54 34 289 590 38 261 742 0 453 236 376
35 Richmond 32 045 15.92 47 434 747 36 472 393 3 813 000 276 304 739
36 St Lucia 2 981 6.77 23 497 462 0 0 0
37 The Big 5 False Bay 30 293 17.48 31 788 462 12 096 600 530 000 100 543 402
38 Ubuhlebezwe 89 432 21.43 66 850 081 26 843 210 64 876 000 865 173 129
39 Ulundi 124 422 24.48 300 294 582 86 248 244 15 867 000 2 584 404 499
40 Umdoni 34 024 26.11 27 624 199 73 222 539 45 550 000 407 543 560
41 Umhlabuyalingana 34 024 17.18 68 884 059 26 956 484 8 007 600 392 364 495
42 uMhlathuze 178 557 26.55 149 634 363 997 842 800 309 996 800 2 371 822 137
43 uMlalazi 113 167 22.52 149 634 363 116 154 505 22 162 404 1 749 223 685
44 uMngeni 26 101 28.40 40 193 296 191 691 239 38 282 000 461 275 383
45 uMshwathi 55 779 21.13 48 415 271 25 250 000 8 904 000 476 045 144
46 Umtshezi 43 912 19.99 43 674 391 110 153 883 28 690 000 1 323 589 967
47 UMuziwabantu 59 526 15.38 31 166 126 40 347 200 11 900 000 282 107 738
48 Umvoti 41 007 24.18 36 516 449 69 394 019 53 098 988 1 077 456 121
49 Umzimkhulu 87 876 21.29 99 167 956 64 692 881 17 151 000 614 931 109

Page 193 of 194
50 Umzumbe 140 766 23.12 92 330 683 25 849 253 40 662 354 458 549 223
51 UPhongolo 98 488 19.86 326 740 913 49 931 079 4 485 852 423 304 484
52 Vulamehlo 24 595 5.87 25 678 919 11 462 866 14 728 333 225 609 585
Total 5 119 055 1 037 4 581 655 370 19 407 486 690 4 888 812 246 65 196 265 399
Urban 1 701 501 117 908 311 16 562 310 231 4 173 793 344 30 338 172 318
Rural 3 417 554 920 3 673 345 2 845 176 459 715 018 902 34 858 093 082
*Source : KZN Provincial Treasury: KZN Public Demand vs Supply

12 CONCLUSION
The Situational Overview presents a brief picture of the various sectors of KwaZulu-Natal’s
social and economic life – the strengths and the constraints . The information is presented as
a base upon which to build responses to the challenges and opportunities in the Province
and will be updated as more information becomes available.