AMINU MOHAMMED - University of KwaZulu-Natal
341
ANTIOXIDATIVE AND ANTIDIABETIC EFFECTS OF SOME AFRICAN MEDICINAL PLANTS BY AMINU MOHAMMED Student number: 212562498 MARCH, 2016
-
Upload
khangminh22 -
Category
Documents
-
view
1 -
download
0
Transcript of AMINU MOHAMMED - University of KwaZulu-Natal

ANTIOXIDATIVE AND ANTIDIABETIC EFFECTS OF
SOME AFRICAN MEDICINAL PLANTS
BY
AMINU MOHAMMED
Student number: 212562498
MARCH, 2016
ii
ANTIOXIDATIVE AND ANTIDIABETIC EFFECTS OF
SOME AFRICAN MEDICINAL PLANTS
BY
AMINU MOHAMMED
Student number: 212562498
Submitted in fulfillment of the requirements for the award of Doctor of
Philosophy degree in Biochemistry
School of Life Sciences
College of Agriculture, Engineering and Science
As the candidate’s supervisor I have approved this thesis/dissertation for submission.
Signed: ……………………….. Name: Dr. M.S. Islam Date: …………………….
iii
COLLEGE OF AGRICLUTURE, ENGINEERING AND SCIENCE
DECLARATION I - PLAGIARISM
I, Aminu Mohammed…………………………….. declare that
1. The research reported in this thesis, except where otherwise indicated, is my original research.
2. This thesis has not been submitted for any degree or examination at any other university.
3. This thesis does not contain other persons’ data, pictures, graphs or other information, unless
specifically acknowledged as being sourced from other persons.
4. This thesis does not contain other persons' writing, unless specifically acknowledged as being
sourced from other researchers. Where other written sources have been quoted, then:
a. Their words have been re-written but the general information attributed to them has been
referenced
b. Where their exact words have been used, then their writing has been placed in italics and inside
quotation marks, and referenced
5. This thesis does not contain text, graphics or tables copied and pasted from the Internet, unless
specifically acknowledged, and the source being detailed in the thesis and in the references sections.
Signed: …………………………..
Declaration Plagiarism 22/05/08 FHDR Approved

iv
DECLARATION II
I, Aminu Mohammed hereby declare that the dissertation entitled “Antioxidative and antidiabetic effects
of some African medicinal plants” is the result of my own investigation and research and that it has not
been submitted in part or in full for any other degree or to any other university. Where use of the work of
others was made, it is duly acknowledged in the text.
Student: Mr. Aminu Mohammed Signature ……………………….
Supervisor: Dr. M.S. Islam Signature ……………………….

v
PUBLICATIONS AND PRESENTATIONS
DETAILS OF CONTRIBUTION TO PUBLICATIONS that form part of and/or include research presented
in this thesis (include publication in preparation, submitted, in press and published and give details of the
contributions of each author to the experimental work and writing of each publication).
In all the publications included in this thesis, I designed the work, performed all the experiments and wrote
all the publications. The co-authors contributed by conducting an editorial work, checking the scientific
content of the work and the correctness of my statistical analysis of data and interpretation of the findings.
Published and/or accepted papers
Publication 1
Mohammed, A., Koorbanally, N.A., Islam, M.S. (2015). Ethyl acetate fraction of Aframomum melegueta
fruit ameliorates pancreatic β-cell dysfunction and major diabetes-related parameters in a type 2 diabetes
model of rats. Journal of Ethnopharmacology 175: 518-527.
Publication 2
Mohammed, A., Koorbanally, N.A., Islam, M.S. (2015). Phytochemistry, anti-oxidative and anti-diabetic
effects of various parts of Eugenia caryophyllata Thunb. in vitro. Acta Poloniae Pharmaceutica-Drug
Research 72: 1201-1215.
Publication 3
Mohammed, A., Koorbanally, N.A., Islam, M.S. (2015). Anti-oxidative activity, phytochemistry, and
inhibition of key enzymes linked to type 2 diabetes by various parts of Aframomum melegueta in vitro.
Acta Poloniae Pharmaceutica-Drug Research In press (Accepted on 28 March, 2015).
Publication 4
Mohammed, A., Ibrahim, M.A., Islam, M.S. (2014). African medicinal plants with anti-diabetic potentials:
a review. Planta Medica 80: 354-377.

vi
Publication 5
Mohammed A., Koorbanally N.A., Islam M.S. Anti-diabetic effect of Xylopia aethiopica (Dunal) A. Rich.
(Annonaceae) fruit acetone fraction in a type 2 diabetes model of rats. Journal of Ethnopharmacology
180: 131-139.
Papers are intended to submit:
Publication 6
Mohammed, A., Islam, M.S. Anti-oxidant potential of Aframomum melegueta fruit ethyl acetate fraction in
a type 2 diabetes model of rats (in preparation).
Publication 7
Mohammed, A., Koorbanally, N.A., Islam, M.S. Anti-oxidative activity, phytochemistry, and inhibition of
key enzymes linked to type 2 diabetes by various parts of Xylopia aethiopica in vitro (in preparation).
Publication 8
Mohammed, A., Koorbanally, N.A., Islam, M.S. Anti-oxidative action and inhibition of key enzymes linked
to type 2 diabetes of various solvent fractions from fruit ethanolic extract of Xylopia aethiopica in vitro (in
preparation).
Publication 9
Mohammed, A., Koorbanally, N.A., Islam, M.S. In vivo anti-oxidant potential of Xylopia aethiopica fruit
acetone fraction in a type 2 diabetes model of rats (in preparation).
Publication 10
Mohammed, A., Koorbanally, N.A., Islam, M.S. Anti-oxidative and anti-diabetic effects of various parts of
Capsicum annuum L. (Solanaceae) in vitro (in preparation).
Publication 11
Mohammed, A., Koorbanally, N.A., Islam, M.S. Acetone fraction from Capsicum annuum fruit possesses
anti-oxidative effects and inhibits the activities of carbohydrate digesting enzymes in vitro (in preparation).

vii
Publication 12
Mohammed, A., Islam, M.S. Anti-diabetic effects of Capsicum annuum L. fruit acetone fraction in a type
2 diabetes model of rats (in preparation).
Publication 13
Mohammed, A., Islam, M.S. Anti-oxidant action of Capsicum annuum fruit acetone fraction in in a type 2
diabetes model of rats (in preparation).
Publication 14
Mohammed, A., Koorbanally, N.A., Islam, M.S. Anti-diabetic action of some African natural products
(Aframomum melegueta, Xylopia aethiopica and Capsicum annuum) in vitro and and isolation of bioactive
compounds (in preparation).
Presentions:
Presention 1
Mohammed, A., Islam, M.S. Anti-diabetic effect of acetone fraction from Xylopia aethiopica fruit in a type
2 diabetes model of rats. A poster presentation at the 23rd World Diabetes Congress 2015 (30th November,
2015 to 4th December, 2015) at Vancouver, Canada. I have been awarded one of the 100 prestigious
IDF Travel Grants to present the work at the conference.
Presention 2
Mohammed, A., Islam, M.S. Ethyl acetate fraction of Aframomum melegueta fruit ameliorates pancreatic
β-cell dysfunction and major diabetes-related parameters in a type 2 diabetes model of rats. A poster
presentation at the 15th Congress of International Society for Ethnopharmacology, (5-8 May, 2015) at
BeitZaman Hotel & Resort, Petra, Jordan.
Presention 3
Mohammed, A., Islam, M.S. Anti-diabetic effect of Xylopia aethiopica (Dunal) A. Rich. fruit acetone
fraction in a type 2 diabetes model of rats. An oral presentation at the College of Agriculture, Engineering
and Sciences Research Day (22nd September 2015) at C Block Lecture Theatre Complex, University of
KwaZulu-Natal, Pietermaritzburg Campus, Durban 4000, South Africa.

viii
Presention 4
Mohammed, A., Islam, M.S. Anti-diabetic effect of Aframomum melegueta ethyl acetate fraction from fruit
in type 2 diabetes model of rats. An oral presentation at the College of Agriculture, Engineering and
Sciences Research Day (27th October 2014) at T Block Lecture Theatre Complex, University of KwaZulu-
Natal, Westville Campus, Durban 4000, South Africa.
Presention 5
Mohammed, A., Islam, M.S. Anti-oxidative potential and inhibition of key enzymes linked to type-2
diabetes mellitus of various fractions from sweet pepper (Capsicum annuum L.) in vitro. A poster
presentation at the School of Life Sciences Research Day (26th May, 2014) at T Block Lecture Theatre
Complex, University of KwaZulu-Natal, Westville Campus, Durban 4000, South Africa.
Student: Mr. Aminu Mohammed Signature ……………………….
ix
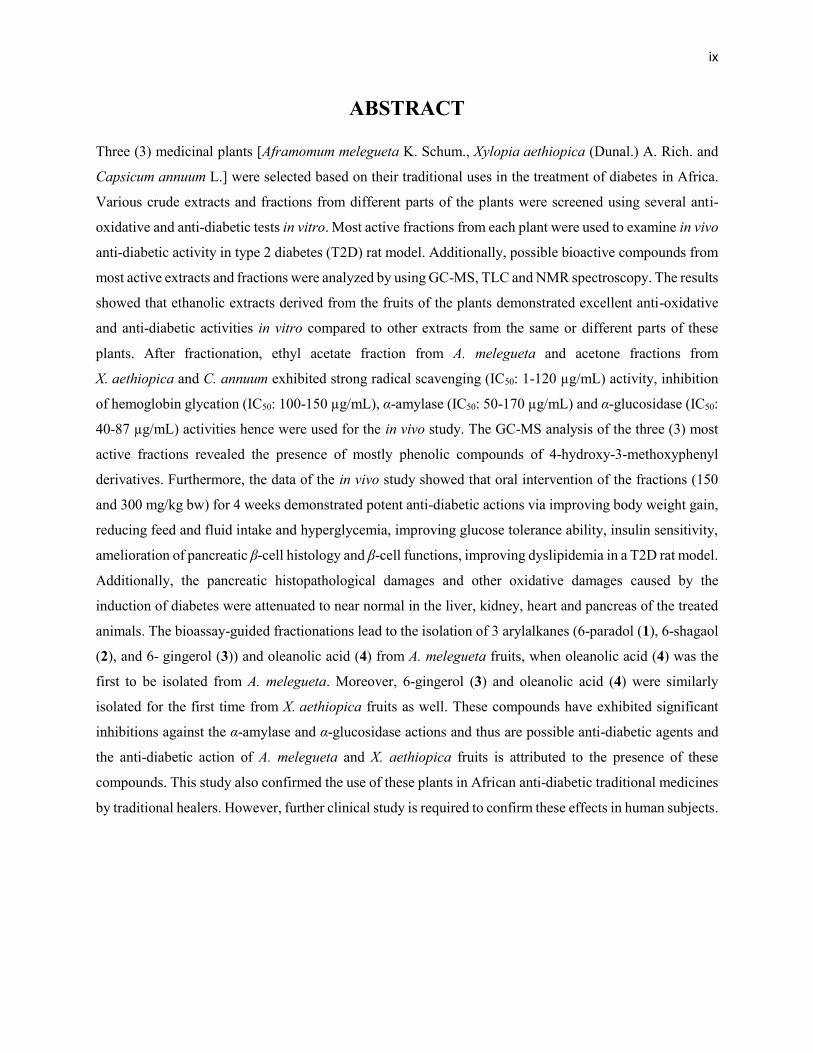
ABSTRACT
Three (3) medicinal plants [Aframomum melegueta K. Schum., Xylopia aethiopica (Dunal.) A. Rich. and
Capsicum annuum L.] were selected based on their traditional uses in the treatment of diabetes in Africa.
Various crude extracts and fractions from different parts of the plants were screened using several anti-
oxidative and anti-diabetic tests in vitro. Most active fractions from each plant were used to examine in vivo
anti-diabetic activity in type 2 diabetes (T2D) rat model. Additionally, possible bioactive compounds from
most active extracts and fractions were analyzed by using GC-MS, TLC and NMR spectroscopy. The results
showed that ethanolic extracts derived from the fruits of the plants demonstrated excellent anti-oxidative
and anti-diabetic activities in vitro compared to other extracts from the same or different parts of these
plants. After fractionation, ethyl acetate fraction from A. melegueta and acetone fractions from
X. aethiopica and C. annuum exhibited strong radical scavenging (IC50: 1-120 µg/mL) activity, inhibition
of hemoglobin glycation (IC50: 100-150 µg/mL), α-amylase (IC50: 50-170 µg/mL) and α-glucosidase (IC50:
40-87 µg/mL) activities hence were used for the in vivo study. The GC-MS analysis of the three (3) most
active fractions revealed the presence of mostly phenolic compounds of 4-hydroxy-3-methoxyphenyl
derivatives. Furthermore, the data of the in vivo study showed that oral intervention of the fractions (150
and 300 mg/kg bw) for 4 weeks demonstrated potent anti-diabetic actions via improving body weight gain,
reducing feed and fluid intake and hyperglycemia, improving glucose tolerance ability, insulin sensitivity,
amelioration of pancreatic β-cell histology and β-cell functions, improving dyslipidemia in a T2D rat model.
Additionally, the pancreatic histopathological damages and other oxidative damages caused by the
induction of diabetes were attenuated to near normal in the liver, kidney, heart and pancreas of the treated
animals. The bioassay-guided fractionations lead to the isolation of 3 arylalkanes (6-paradol (1), 6-shagaol
(2), and 6- gingerol (3)) and oleanolic acid (4) from A. melegueta fruits, when oleanolic acid (4) was the
first to be isolated from A. melegueta. Moreover, 6-gingerol (3) and oleanolic acid (4) were similarly
isolated for the first time from X. aethiopica fruits as well. These compounds have exhibited significant
inhibitions against the α-amylase and α-glucosidase actions and thus are possible anti-diabetic agents and
the anti-diabetic action of A. melegueta and X. aethiopica fruits is attributed to the presence of these
compounds. This study also confirmed the use of these plants in African anti-diabetic traditional medicines
by traditional healers. However, further clinical study is required to confirm these effects in human subjects.

x
DEDICATION
To my parent Alhaji Abubakar Mohammed and Hajiya Hauwa’u Aminu for their guidance, support and
wisdom.
xi
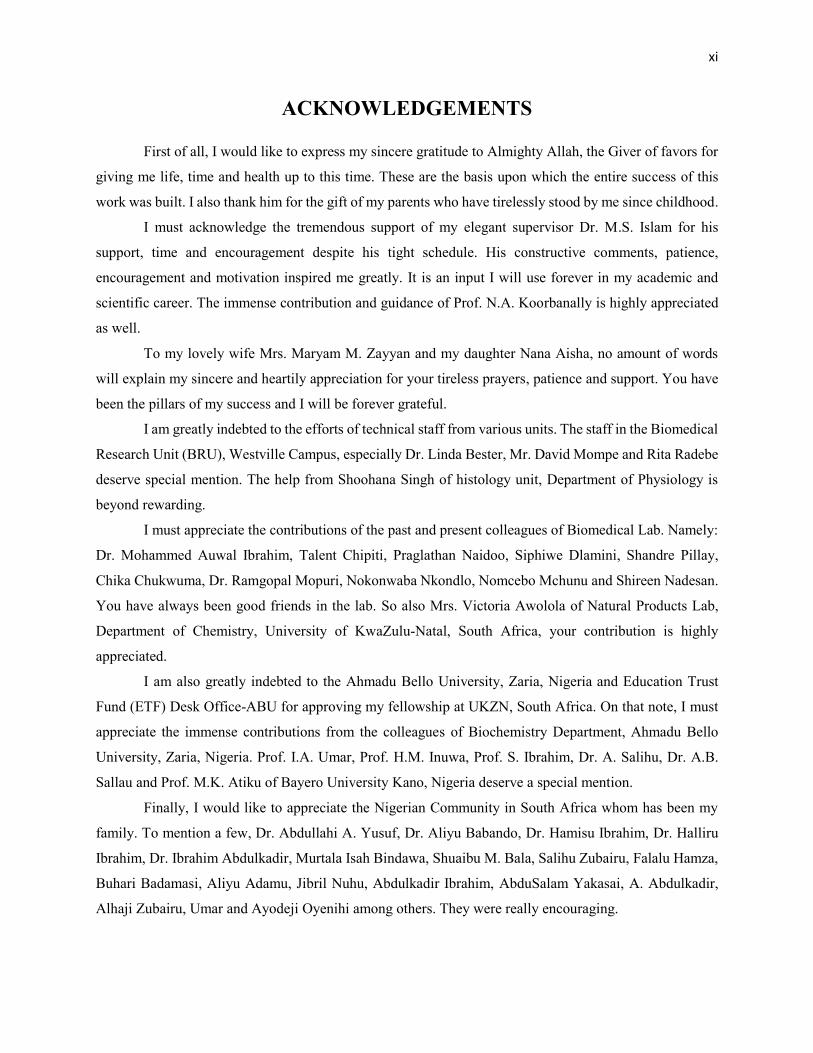
ACKNOWLEDGEMENTS
First of all, I would like to express my sincere gratitude to Almighty Allah, the Giver of favors for
giving me life, time and health up to this time. These are the basis upon which the entire success of this
work was built. I also thank him for the gift of my parents who have tirelessly stood by me since childhood.
I must acknowledge the tremendous support of my elegant supervisor Dr. M.S. Islam for his
support, time and encouragement despite his tight schedule. His constructive comments, patience,
encouragement and motivation inspired me greatly. It is an input I will use forever in my academic and
scientific career. The immense contribution and guidance of Prof. N.A. Koorbanally is highly appreciated
as well.
To my lovely wife Mrs. Maryam M. Zayyan and my daughter Nana Aisha, no amount of words
will explain my sincere and heartily appreciation for your tireless prayers, patience and support. You have
been the pillars of my success and I will be forever grateful.
I am greatly indebted to the efforts of technical staff from various units. The staff in the Biomedical
Research Unit (BRU), Westville Campus, especially Dr. Linda Bester, Mr. David Mompe and Rita Radebe
deserve special mention. The help from Shoohana Singh of histology unit, Department of Physiology is
beyond rewarding.
I must appreciate the contributions of the past and present colleagues of Biomedical Lab. Namely:
Dr. Mohammed Auwal Ibrahim, Talent Chipiti, Praglathan Naidoo, Siphiwe Dlamini, Shandre Pillay,
Chika Chukwuma, Dr. Ramgopal Mopuri, Nokonwaba Nkondlo, Nomcebo Mchunu and Shireen Nadesan.
You have always been good friends in the lab. So also Mrs. Victoria Awolola of Natural Products Lab,
Department of Chemistry, University of KwaZulu-Natal, South Africa, your contribution is highly
appreciated.
I am also greatly indebted to the Ahmadu Bello University, Zaria, Nigeria and Education Trust
Fund (ETF) Desk Office-ABU for approving my fellowship at UKZN, South Africa. On that note, I must
appreciate the immense contributions from the colleagues of Biochemistry Department, Ahmadu Bello
University, Zaria, Nigeria. Prof. I.A. Umar, Prof. H.M. Inuwa, Prof. S. Ibrahim, Dr. A. Salihu, Dr. A.B.
Sallau and Prof. M.K. Atiku of Bayero University Kano, Nigeria deserve a special mention.
Finally, I would like to appreciate the Nigerian Community in South Africa whom has been my
family. To mention a few, Dr. Abdullahi A. Yusuf, Dr. Aliyu Babando, Dr. Hamisu Ibrahim, Dr. Halliru
Ibrahim, Dr. Ibrahim Abdulkadir, Murtala Isah Bindawa, Shuaibu M. Bala, Salihu Zubairu, Falalu Hamza,
Buhari Badamasi, Aliyu Adamu, Jibril Nuhu, Abdulkadir Ibrahim, AbduSalam Yakasai, A. Abdulkadir,
Alhaji Zubairu, Umar and Ayodeji Oyenihi among others. They were really encouraging.

xii
TABLE OF CONTENTS
PAGE
DECLERATION I iii
DECLERATION II iv
PUBLICATIONS AND CONFERENCES v
ABSTRACT ix
DEDICATION x
ACKNOWLEDMENTS xi
TABLE OF CONTENTS xii
LIST OF TABLES xix
LIST OF FIGURES xxii
LIST OF ABBREVIATIONS xxviii
CHAPTER I 1
1.0 Introduction and background of the study 1
1.1 Literature review 2
1.2 Diabetes mellitus 2
1.2.1 Types of diabetes mellitus 2
1.2.2 Type 1 diabetes mellitus 2
1.2.3 Type 2 diabetes mellitus 3
1.2.4 Gestational diabetes mellitus 4
1.2.5 Specific types of diabetes due to other causes (secondary type) 5
1.2.6 Prevalence of diabetes mellitus 6
1.2.7 Diabetes associated complications 6
1.2.8 Treatment and management of diabetes mellitus 7
1.2.9 Non-pharmacological therapy 8
1.2.10 Pharmacological therapy 8
1.3
Medicinal plants 10
1.3.1 Medicinal plants in future drug discovery 10
1.3.2 Selection of medicinal plant for drug discovery 11
1.3.3 Collection, authentication and preparation of plant material 12
1.3.4 Preliminary in vitro studies 12
1.3.5 Bioassay-guided fractionation of the active principles 13

xiii
1.3.6 In vivo, clinical and toxicological studies 13
1.3.7 Medicinal plants for the treatment of diabetes 14
1.3.8 African medicinal plants with anti-diabetic potentials 14
1.3.9 Bioactive compounds from African medicinal plants with anti-diabetic
potentials
16
1.4 Aframomum melegueta K. Schum. 22
1.4.1 Description 22
1.4.2 Distribution 22
1.4.3 Phytochemistry 22
1.4.4 Ethnobotanical uses 23
1.4.5 Pharmacological importance 23
1.5 Xylopia aethiopica (Dunal) A. Rich 25
1.5.1 Description 25
1.5.2 Distribution 25
1.5.3 Phytochemistry 25
1.5.4 Ethnobotanical uses 25
1.5.5 Pharmacological importance 26
1.6 Capsicum annuum L. 27
1.6.1 Description 27
1.6.2 Distribution 27
1.6.3 Phytochemistry 27
1.6.4 Ethnobotanical uses 28
1.6.5 Pharmacological importance 28
1.7 Statement of the problem 29
1.8 Justification and significance of the research work 30
1.9 Objective of the study 30
1.9.1 General objective 30
1.9.2 Specific objectives 30
CHAPTER 2 32
2.0 Materials and methods 32
2.1 Chemicals and reagents 32
2.2 Equipment 32
2.3 Plant materials 32
2.3.1 Preparation of the plant extracts 33

xiv
2.3.2 Fractionation of the crude extracts 33
2.4 In vitro studies 33
2.4.1 Estimation of total polyphenol content 33
2.4.2 Determination of total flavonoid content 34
2.4.3 DPPH radical scavenging activity 34
2.4.4 Ferric (Fe3+) reducing anti-oxidant power assay 34
2.4.5 Inhibition of hemoglobin glycation 35
2.4.6 α-Amylase (E.C. 3.2.1.1) inhibitory effect 35
2.4.7 α-Glucosidase (E.C. 3.2.1.20) inhibitory effect 36
2.4.8 Calculation of IC50 values 36
2.4.9 Mechanism of α-glucosidase and α-amylase inhibitions 36
2.4.10 Gas Chromatography-Mass Spectroscopic (GC-MS) analysis 37
2.5 In vivo studies 37
2.5.1 Experimental animals 37
2.5.2 Animal grouping 37
2.5.3 Induction of Type 2 diabetes (T2D) 38
2.5.4 Intervention period 39
2.5.5 Oral glucose tolerance test (OGTT) 39
2.5.6 Collection and preparation of blood and organs 39
2.5.7 Analytical methods 40
2.5.8 Histopathological examination of pancreatic tissue 40
2.5.9 Determination of reduced glutathione (GSH) 41
2.5.10 Determination of thiobarbituric acid reactive substance (TBARS)
concentration as malondialdehyde (MDA) equivalent
41
2.5.11 Determination of catalase activity 41
2.5.12 Determination of superoxide dismutase (SOD) activity 41
2.5.13 Determination of glutathione peroxidase (GPx) activity 42
2.5.14 Determination of glutathione reductase (GR) 42
2.6
Isolation of the bioactive anti-diabetic compounds from the fractions 42
2.6.1 Isolation of the bioactive compounds from the ethyl acetate fraction of
ethanolic extract of Aframomum melegueta fruit
43
2.6.2 Isolation of the bioactive compound from the acetone fraction of ethanolic
extract of Xylopia aethiopica fruit
43
xv
2.6.3 Isolation of the bioactive compound from the acetone fraction of ethanolic
extract of Capsicum annuum fruit
43
2.7 Statistical analysis 44
CHAPTER 3 45
3.0 Anti-diabetic and anti-oxidative actions of various extracts and fractions from different
parts of Aframomum melegueta: an in vitro and in vivo approach
45
3.1 Anti-oxidative activity, phytochemistry, and inhibition of key enzymes linked to type 2
diabetes by various parts of Aframomum melegueta in vitro
45
3.1.1 Abstract 45
3.1.2 Introduction 46
3.1.3 Materials and methods 47
3.1.4 Results 47
3.1.5 Discussions 57
3.1.6 Conclusions 60
3.2 Phytochemistry, anti-oxidative and anti-diabetic effects of various solvent fractions
from fruit ethanolic extract of Aframomum melegueta in vitro
61
3.2.1 Abstract 61
3.2.2 Introduction 62
3.2.3 Materials and methods 63
3.2.4 Results 63
3.2.5 Discussions 71
3.2.6 Conclusions 73
3.3 Ethyl acetate fraction of Aframomum melegueta fruit ameliorates pancreatic β-cell
dysfunction and major diabetes-related parameters in a type 2 diabetes model of rats
74
3.3.1 Abstract 74
3.3.2 Introduction 75
3.3.3 Materials and methods 76
3.3.4 Results 76
3.3.5 Discussions 85
3.3.6 Conclusions 87
3.4 Anti-oxidant potential of Aframomum melegueta fruit ethyl acetate fraction in a type 2
diabetes model of rats
88
3.4.1 Abstract 88
3.4.2 Introduction 88
xvi
3.4.3 Materials and methods 90
3.4.4 Results 90
3.4.5 Discussions 95
3.4.6 Conclusions 96
CHAPTER 4 97
4.0 In vitro and in vivo anti-diabetic and anti-oxidative effects of various extracts and
fractions from different parts of Xylopia aethiopica
97
4.1 Phytochemistry, anti-oxidative and anti-diabetic effects of extracts from various parts
of Xylopia aethiopica in vitro
97
4.1.1 Abstract 97
4.1.2 Introduction 98
4.1.3 Materials and methods 99
4.1.4 Results 99
4.1.5 Discussions 108
4.1.6 Conclusions 110
4.2 Anti-oxidative effect and inhibition of key enzymes linked to type 2 diabetes of various
solvent fractions from fruit ethanolic extract of Xylopia aethiopica in vitro
111
4.2.1 Abstract 111
4.2.2 Introduction 112
4.2.3 Materials and methods 112
4.2.4 Results 112
4.2.5 Discussions 120
4.2.6 Conclusions 121
4.3 Anti-diabetic effect of Xylopia aethiopica (Dunal) A. Rich. fruit acetone fraction in a
type 2 diabetes model of rats
123
4.3.1 Abstract 123
4.3.2 Introduction 124
4.3.3 Materials and methods 125
4.3.4 Results 125
4.3.5 Discussions 135
4.3.6 Conclusions 137
4.4 In vivo anti-oxidant potential of Xylopia aethiopica fruit acetone fraction in a type 2
diabetes model of rats
138
xvii
4.4.1 Abstract 138
4.4.2 Introduction 138
4.4.3 Materials and methods 139
4.4.4 Results 139
4.4.5 Discussions 144
4.4.6 Conclusions 145
CHAPTER 5 146
5.0 In vitro and in vivo anti-diabetic and anti-oxidative effects of various extracts and
fractions from the different parts of Capsicum annuum
146
5.1 Anti-oxidative and anti-diabetic effects of various parts of Capsicum annuum L.
(Solanaceae) in vitro
146
5.1.1 Abstract 146
5.1.2 Introduction 147
5.1.3 Materials and methods 148
5.1.4 Results 148
5.1.5 Discussions 158
5.1.6 Conclusions 160
5.2 Acetone fraction from Capsicum annuum fruit possesses anti-oxidative effects and
inhibits the activities of carbohydrate digesting enzymes in vitro
161
5.2.1 Abstract 161
5.2.2 Introduction 162
5.2.3 Materials and methods 163
5.2.4 Results 163
5.2.5 Discussions 170
5.2.6 Conclusions 172
5.3 Anti-diabetic effects of Capsicum annuum L. fruit acetone fraction in a type 2 diabetes
model of rats
173
5.3.1 Abstract 173
5.3.2 Introduction 174
5.3.3 Materials and methods 175
5.3.4 Results 175
5.3.5 Discussions 184
5.3.6 Conclusions 187
xviii
5.4 Anti-oxidant action of Capsicum annuum fruit acetone fraction in in a type 2 diabetes
model of rats
188
5.4.1 Abstract 188
5.4.2 Introduction 188
5.4.3 Materials and methods 190
5.4.4 Results 190
5.4.5 Discussions 194
5.4.6 Conclusions 196
CHAPTER 6 197
6.1 Anti-diabetic action of some African natural products (Aframomum melegueta, Xylopia
aethiopica and Capsicum annuum) in vitro and and isolation of bioactive compounds
197
6.1.1 Abstract 197
6.1.2 Introduction 198
6.1.3 Materials and methods 200
6.1.4 Results 200
6.1.5 Discussions 204
6.1.6 Conclusions 205
CHAPTER 7 208
7.0 General discussion, conclusion and further research 208
7.1 General discussion 208
7.2 Overall conclusion 214
7.3 Further research 215
References 217
Appendices I (Publications) 251
Appendices II (NMR spectra) 310

xix
LIST OF TABLES
PAGE
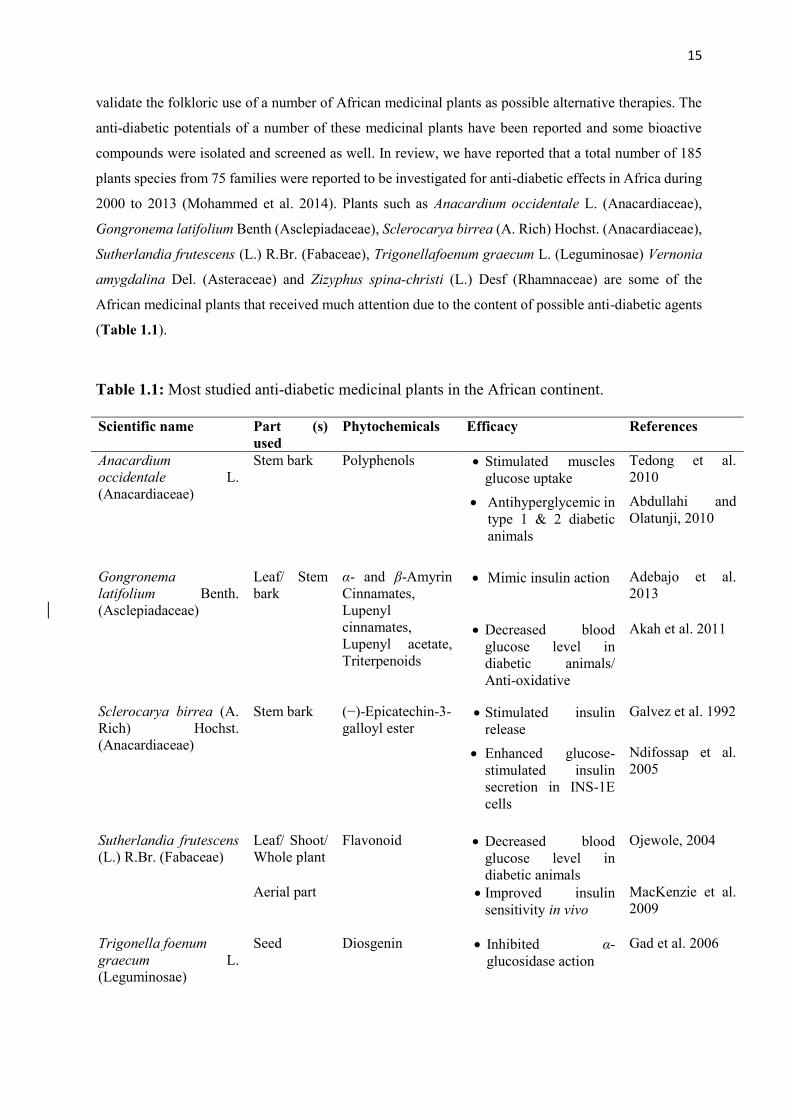
Table 1.1 Most studied anti-diabetic medicinal plants in the African continent 15
Table 1.2 Bioactive compounds from African medicinal plants with reported activities 17
Table 3.1 Percentage yield, total polyphenol and flavonoid contents of various solvent
extracts of A. melegueta parts
48
Table 3.2 IC50 values of various extracts of A. melegueta parts in different anti-oxidative
and anti-diabetic models
50
Table 3.3 Identified compounds from the EtOH fruit and leaf extracts of A. melegueta by
GC-MS
57
Table 3.4 Percentage yield, total polyphenol and flavonoid contents of various fractions
from ethanolic fruit extract of A. melegueta
65
Table 3.5 IC50 values of various solvent fractions from ethanolic fruit extract of A.
melegueta in different anti-oxidative and anti-diabetic models
65
Table 3.6 Identified compounds from the ethyl acetate fraction from fruit ethanolic
extract of A. melegueta by GC-MS
69
Table 3.7 Area under the curve (AUC) of different animal groups at the end of the
experimental period
79
Table 3.8 Serum insulin and fructosamine levels, HOMA-IR and HOMA-β scores of
different animal groups at the end of the experimental period
80
Table 3.9 Effect of AMEF on liver weights and liver glycogen concentrations in different
animal groups as the end of the experimental period
82
Table 3.10 Serum lipid profiles atherogenic and coronary risk indices of different animal
groups at the end of the experimental period
83
Table 3.11 Serum ALT, AST, ALP and other biochemical parameters different animal
groups at the end of the experimental period
84
Table 4.1 Percentage yield, total polyphenol and flavonoid contents of various solvent
extracts of X. aethiopica parts
99
Table 4.2 IC50 values of various solvent extracts of X. aethiopica parts in different anti-
oxidative and anti-diabetic models
102
Table 4.3 Identified compounds from the fruit, leaf and stem EtOH extracts of by GC-
MS
107
xx
Table 4.4 Percentage yield, total polyphenol and flavonoid contents of various fractions
from ethanolic fruit extract of X. aethiopica
113
Table 4.5 IC50 values of various solvent fractions from ethanolic fruit extract of X.
aethiopica in different anti-oxidative and anti-diabetic models
114
Table 4.6 Identified compounds from the acetone fraction from fruit ethanolic extract of
X. aethiopica by GC-MS
118
Table 4.7 Area under the curve (AUC) of different animal groups at the end of the
experimental period
128
Table 4.8 Effect of XAAF on serum insulin and fructosamine levels and calculated
HOMA-IR and HOMA-β scores in different animal groups at the end of the
intervention period
130
Table 4.9 Effect of XAAF on liver weights and liver glycogen concentrations in T2D rats 132
Table 4.10 Serum lipid profiles and other biochemical parameters in different animal
groups at the end of the intervention period
133
Table 4.11 Serum biochemical parameters in different animal groups at the end of the
intervention period
134
Table 5.1 Percentage yield, total polyphenol and flavonoid contents of various solvent
extracts of C. annuum parts
148
Table 5.2 IC50 values of various extracts of C. annuum parts in different anti-oxidative
and anti-diabetic models
150
Table 5.3 Identified compounds from the EtOH fruit, leaf and stem extracts of C. annuum
by GC-MS
156
Table 5.4 Percentage yield, total polyphenol and flavonoid contents of various fractions
from ethanolic fruit extract of C. annuum
163
Table 5.5 IC50 values of various solvent fractions from ethanolic fruit extract of C.
annuum in different anti-oxidative and anti-diabetic models
165
Table 5.6 Identified compounds from the acetone fraction from fruit ethanolic extract of
C. annuum by GC-MS
168
Table 5.7 Area under the curve (AUC) of different animal groups at the end of the
experimental period
178
Table 5.8 Effect of CAAF on serum insulin and fructosamine levels and calculated
HOMA-IR and HOMA-β scores in different animal groups at the end of the
intervention period
179
Table 5.9 Effect of CAAF on liver weights and liver glycogen concentrations in T2D rats 181

xxi
Table 5.10 Serum lipid profiles and other biochemical parameters in different animal
groups at the end of the intervention period
182
Table 5.11 Serum biochemical parameters in different animal groups at the end of the
intervention period
183
Table 6.1 IC50 values of bioactive compounds isolated from the ethyl acetate fraction of
A. melegueta and acetone fractions of C. annuum and X. aethiopica fruit in
anti-diabetic models
201
Table 6.2 Kinetic analysis of α-amylase and α-glucosidase inhibition by compounds
isolated from the ethyl acetate fraction of A. melegueta and acetone fractions
of C. annuum and X. aethiopica fruit in anti-diabetic models
203

xxii
LIST OF FIGURES
PAGE
Figure 1.1 Pathogenesis of type 1 diabetes 3
Figure 1.2 Pathogenesis of type 2 diabetes 4
Figure 1.3 Pathogenesis of gestational diabetes mellitus 5
Figure 1.4 Hyperglycemia-induced oxidative damages in diabetes mellitus 7
Figure 1.5 Target organs/tissues and mode of actions of orally anti-diabetic drugs 10
Figure 1.6 Flow chart for plant-derived drug discovery 11
Figure 1.7 Aframomum melegueta plant 22
Figure 1.8 Xylopia aethiopica plant 25
Figure 1.9 Capsicum annuum plant 27
Figure 2.1 Animal grouping in vivo study 38
Figure 3.1 Ferric reducing power (relative to gallic acid) of fruit and leaf extracts
of A. melegueta
49
Figure 3.2 DPPH Radical scavenging activity (%) of fruit, leaf and stem extracts
of A. melegueta
51
Figure 3.3 Inhibition of hemoglobin glycosylation (%) of fruit and leaf extracts
of A. melegueta
52
Figure 3.4 α-amylase inhibition (%) of fruit and leaf extracts of A. melegueta 53
Figure 3.5 α-glucosidase inhibition (%) of fruit leaf and stem extracts of A.
melegueta
54
Figure 3.6 GC-MS Chromatograms of ethanolic extracts of fruit and leaf of A.
melegueta
55
Figure 3.7 Structures of identified compounds from fruit and leaf of A. melegueta 56
Figure 3.8 Total reducing power (relative to gallic acid) of various fractions from
fruit ethanolic extract of A. melegueta
64
Figure 3.9 DPPH Radical scavenging activity (%) of various fractions from fruit
ethanolic extract of A. melegueta
65
Figure 3.10 Inhibition of hemoglobin glycation (%) of various fractions from fruit
ethanolic extract of A. melegueta
66
Figure 3.11 α-amylase inhibition (%) of various fractions from fruit ethanolic
extract of A. melegueta
66
xxiii
Figure 3.12 α-glucosidase inhibition (%) of various fractions from fruit ethanolic
extract of A. melegueta
67
Figure 3.13 Lineweaver-Burke’s plot of (A) α-glucosidase and (B) α-amylase
catalyzed reactions in the presence and in the absence of the ethyl
acetate (EtOAc) fraction derived from the A. melegueta fruit ethanolic
extract
68
Figure 3.14 GC-MS Chromatogram (A) and the structures of compounds (B)
identified from the ethyl acetate fraction from fruit ethanolic extract
of A. melegueta
70
Figure 3.15 Mean body weight change in all animal groups during the entire study
period
76
Figure 3.16 Mean food and fluid intake of different animal groups during 4-week
intervention period
77
Figure 3.17 Weekly NFBG of all animal groups during the entire experimental
period
78
Figure 3.18 Oral glucose tolerance test (OGTT) in all animal groups in the last
week of the 4-week experimental period
79
Figure 3.19 Histopathological examination of the pancreatic islets of different
animal groups at the end of the intervention period
80
Figure 3.20 Serum and organs glutathione contents of all animal groups during the
entire study period
90
Figure 3.21 Serum and organs glutathione contents of all animal groups during the
entire study period
91
Figure 3.22 Superoxide dismutase (SOD) activities of serum and organs of all
animal groups during the entire study period
92
Figure 3.23 Catalase activities of serum and organs of all animal groups during
the entire study period
93
Figure 3.24 Glutathione peroxidase activities of serum and organs of all animal
groups during the entire study period
94
Figure 3.25 Glutathione reductase activities of serum and organs of all animal
groups during the entire study period
94
Figure 4.1 Ferric reducing power (relative to gallic acid) of fruit, leaf and stem
extracts of X. aethiopica
100

xxiv
Figure 4.2 DPPH Radical scavenging activity (%) of fruit, leaf and stem extracts
of X. aethiopica
101
Figure 4.3 Inhibition of hemoglobin glycosylation (%) of fruit and leaf extracts
of X. aethiopica
103
Figure 4.4 α-Amylase inhibition (%) of fruit and leaf extracts of X. aethiopica 104
Figure 4.5 α-Glucosidase inhibition (%) of fruit and leaf extracts of X. aethiopica 105
Figure 4.6 GC-MS Chromatograms of ethanolic extracts of fruit and leaf extracts
of X. aethiopica
106
Figure 4.7 Total reducing power (relative to gallic acid) of various fractions from
fruit ethanolic extract of X. aethiopica
113
Figure 4.8 DPPH Radical scavenging activity (%) of various fractions from fruit
ethanolic extract of X. aethiopica
114
Figure 4.9 Inhibition of hemoglobin glycation (%) of various fractions from fruit
ethanolic extract of X. aethiopica
115
Figure 4.10 α-Amylase inhibition (%) of various fractions from fruit ethanolic
extract of X. aethiopica
115
Figure 4.11 α-Glucosidase inhibition (%) of various fractions from fruit ethanolic
extract of X. aethiopica
116
Figure 4.12 Lineweaver-Burke’s plot of α-amylase and α-glucosidase catalyzed
reactions in the presence and in the absence of the acetone fraction
derived from the X. aethiopica fruit ethanolic extract
117
Figure 4.13 GC-MS Chromatogram of the acetone fraction from fruit ethanolic
extract of X. aethiopica
118
Figure 4.14 The structures of compounds identified from the acetone fraction
from fruit ethanolic extract of X. aethiopica
119
Figure 4.15 Mean body weight change of all animal groups during the study
period
125
Figure 4.16 Food and fluid intake in different animal groups during the
experimental period
126
Figure 4.17 Weekly NFBG in all animal groups during the intervention period 127
Figure 4.18 Oral glucose tolerance test (OGTT) in all animal groups at the last
week of the 4-week intervention period
128
Figure 4.19 Histopathological examination of the pancreatic tissues of different
animal groups at the end of the intervention period
130
xxv
Figure 4.20 Serum and organs thiobarbituric acid reactive substances of all animal
groups during the entire study period
140
Figure 4.21 Serum and organs glutathione contents of all animal groups during the
entire study period
141
Figure 4.22 Superoxide dismutase (SOD) activities of serum and organs of all
animal groups during the entire study period
141
Figure 4.23 Catalase activities of serum and organs of all animal groups during
the entire study period
142
Figure 4.24 Glutathione peroxidase activities of serum and organs of all animal
groups during the entire study period
143
Figure 4.25 Glutathione reductase activities of serum and organs of all animal
groups during the entire study period
143
Figure 5.1 Ferric reducing power (relative to gallic acid) of fruit, leaf and stem
extracts of C. annuum
149
Figure 5.2 DPPH Radical scavenging activity (%) of fruit and leaf extracts of C.
annuum
151
Figure 5.3 Inhibition of hemoglobin glycosylation (%) of fruit and leaf extracts
of C. annuum
152
Figure 5.4 α-Amylase inhibition (%) of fruit and leaf extracts of C. annuum 153
Figure 5.5 α-Glucosidase inhibition (%) of fruit, leaf and stem (C) extracts of C.
annuum
154
Figure 5.6 GC-MS Chromatograms of ethanolic extracts of fruit and leaf of C.
annuum
155
Figure 5.7 Structures of identified compounds from ethanolic extracts of fruit
and leaf of C. annuum
157
Figure 5.8 Total reducing power (relative to gallic acid) of various fractions from
fruit ethanolic extract of C. annuum
164
Figure 5.9 DPPH Radical scavenging activity (%) of various fractions from fruit
ethanolic extract of C. annuum
164
Figure 5.10 Inhibition of hemoglobin glycation (%) of various fractions from fruit
ethanolic extract of C. annuum
165
Figure 5.11 α-Amylase inhibition (%) of various fractions from fruit ethanolic
extract of C. annuum
166
xxvi
Figure 5.12 α-Glucosidase inhibition (%) of various fractions from fruit ethanolic
extract of C. annuum
166
Figure 5.13 Lineweaver-Burke’s plot of (A) α-amylase and (B) α-glucosidase
catalyzed reactions in the presence and in the absence of the acetone
fraction derived from the C. annuum fruit ethanolic extract
167
Figure 5.14 GC-MS chromatogram and structures of identified compounds from
acetone fraction from fruit of C. annuum
169
Figure 5.15 Mean body weight change of all animal groups during the study
period
176
Figure 5.16 Food and fluid intake in different animal groups during the
experimental period
176
Figure 5.17 Weekly NFBG in all animal groups during the intervention period 177
Figure 5.18 OGTT of all animal groups in the last week of the 4-week intervention
period
178
Figure 5.19 Histopathological examination of the pancreatic islets of different
animal groups at the end of the intervention period
179
Figure 5.20 Serum and organs thiobarbituric acid reactive substances of all animal
groups during the entire study period
190
Figure 5.21 Serum and organs glutathione contents of all animal groups during the
entire study period
191
Figure 5.22 Superoxide dismutase (SOD) activities of serum and organs of all
animal groups during the entire study period
192
Figure 5.23 Catalase activities of serum and organs of all animal groups during
the entire study period
192
Figure 5.24 Glutathione peroxidase activities of serum and organs of all animal
groups during the entire study period
193
Figure 5.25 Glutathione reductase activities of serum and organs of all animal
groups during the entire study period
194
Figure 6.1 Structures of compounds 1-4 isolated from A. melegueta and X.
aethiopica
200
Figure 6.2 α-Amylase Inhibition (%) of compounds isolated from A. melegueta,
X. aethiopica and C. annuum fruits
201
Figure 6.3 α-Glucosidase Inhibition (%) of compounds isolated from A.
melegueta, X. aethiopica and C. annuum fruits
202
xxvii
Figure 6.4 Lineweaver-Burke plot for α-amylase in the absence and presence of
the inhibitors (bioactive compounds)
204
Figure 6.5 Lineweaver-Burke plot for α-glucosidase in the absence and presence
of the inhibitors (bioactive compounds)
205

xxviii
LIST OF ABBREVIATIONS
ADA American diabetes association
AI Atherogenic index
ALP Alkaline phosphatase
ALT Alanine transaminase
AMEF Aframomum melegueta ethyl acetate fraction
AST Aspartate transaminase
AUC Area under the curve
BRU Biomedical Resource Unit
CAAF Capsicum annuum acetone fraction
CK-MB Creatine kinase
CRI Coronary artery risk index
DAMH Diabetic Aframomum melegueta high dose
DAML Diabetic Aframomum melegueta low dose
DBC Diabetic control
DCAH Diabetic Capsicum annuum high dose
DCAL Diabetic Capsicum annuum low dose
DETAPAC Diethylenetriaminepentaacetic acid
DM Diabetes mellitus
DMF Diabetic metformin
DMSO Dimethyl sulfoxide
DNS Dinitrosalicylic acid
DPP-4 Dipeptidyl peptidase-4
DPPH 1, 1-Diphenyl-2-picrylhydrazyl radical
DXAH Diabetic Xylopia aethiopica high dose
DXAL Diabetic Xylopia aethiopica low dose
EMA European medicines agency
ELISA Enzyme-linked immunosorbent assay
EtOAc Ethyl acetate
EtOH Ethanolic
FBG Fasting blood glucose
FDA Food and drug administration
FRAP Ferric reducing anti-oxidant power
xxix
GADA Glutamic acid decarboxylase antibodies
GAE Gallic acid equivalent
GC-MS Gas chromatography-mass spectroscopic
GDM Gestational diabetes mellitus
GLUT 2 Glucose transporter type 2
GLUT 4 Glucose transporter type 4
GLP Glucagon-like peptide
GPx Glutathione peroxidase
GR Glutathione reductase
HOMA-β Homeostatic model assessment-β cell function
HOMA-IR Homeostatic model assessment-insulin resistance
IDDM Insulin dependent diabetes mellitus
IDF International Diabetes Federation
IFG Impaired fasting glucose
IGT Impaired glucose tolerance
LDH Lactate dehydrogenase
MDA Malondialdehyde
MODY Maturity-onset diabetes of the young
NAMH Normal Aframomum melegueta high dose
NC Normal control
NCAH Normal Capsicum annuum high dose
NFBG Non-fasting blood glucose
NIDDM Non-insulin dependent diabetes mellitus
NMR Nuclear magnetic resonance spectroscopy
pNPG p-Nitropheynyl glucopyranoside
NXAH Normal Xylopia aethiopica high dose
OGTT Oral glucose tolerance test
PPAR Peroxisome proliferator activated receptor
QE Quercetin equivalent
ROS Reactive oxygen species
SOD Superoxide dismutase
STZ Streptozotocin
TBARS Thiobarbituric acid reactive substance
T1D Type 1 diabetes

xxx
T2D Type 2 diabetes
TLC Thin layer chromatography
WHO World health organization
XAAF Xylopia aethiopica acetone fraction

1
CHAPTER 1 Introduction and Literature Review
1.0 Introduction and background of the study Diabetes mellitus (DM) is a group of complex and chronic metabolic disorders with diverse
multiple etiologies. It is characterized by high blood glucose (hyperglycemia) resulting from
malfunction in insulin secretion and/or insulin action, both leading to impair metabolism of
carbohydrates, lipids and proteins (ADA, 2015). The alterations in the utilization of complex
biomolecules by the most affected tissues (liver, muscle and adipose tissue) due to hyperglycemia
initiate a sequence of oxidative processes that cause dysfunction and failure of other organs in the body.
Long-term complications may affect the organs such as kidneys, eyes, nerves, heart and blood vessels,
and in absence of effective treatment result into death (ADA, 2015; Surampud et al. 2009; Maritim et
al. 2003).
At present, different approaches are used to control diabetes using modern synthetic anti-diabetic
drugs, insulin injection and life style modification. The synthetic anti-diabetic drugs include
sulphonylureas, glucosidase inhibitors, dipeptidyl peptidase-4 (DPP-4) inhibitors and biguanide.
However, these synthetic drugs have characteristic profiles of serious side effects, which include
hypoglycemia, weight gain, gastrointestinal discomfort and nausea, liver and heart failure, and diarrhea
(Hung et al. 2012; Michael et al. 2005). This is in addition to being rather costly and not affordable by
the majority of people in developing countries especially for African populations. These limitations
coupled with an exponential increase in the prevalence of diabetes motivate researchers to scientifically
validate the folkloric use of a number of medicinal plants and/or their isolated bioactive compounds as
possible alternative therapies for diabetes. The prime target for such research is to pave the way for the
development of newer plant-derived anti-diabetic compounds that could be used to ameliorate the
diabetes associated complications. This can subsequently be standardized and be used as drug for the
treatment of the DM.
Furthermore, in many continents such as Africa, herbs and natural products form an integral
component of the health care delivery system (Cragg and Newman, 2013). This has been further
supported by the World Health Organization (WHO) report that 80% of the population in Africa
depends almost entirely on traditional medicines, herbal medicines in particular, for their primary health
care needs (WHO, 2001). This is attributed to the proven effectiveness of the plant-based therapies as
well as the availability of these medicinal plants. Because, the African continent accounts for about
25% of the total number of higher plants in the world where more than 5400 medicinal plants were
reported to have over 16300 medicinal uses (van Wyk et al. 2008). Fortunately, some plant products
either in the form of crude extracts, fractions or isolated compounds have been screened or investigated
for possible anti-diabetic remedy in Africa (Mohammed et al. 2014). However, the number of plants

2
and/or isolated bioactive compounds with potential anti-diabetic actions is very limited and many of
their anti-diabetic effects have not yet been scientifically validated.
1.1 Literature Review 1.2 Diabetes Mellitus
Diabetes mellitus (DM) is a disorder that causes elevation of blood glucose, otherwise known as
hyperglycemia (fasting blood glucose level: ≥126 mg/dL or 7.0 mmol/L; or postprandial hyperglycemia:
≥200 mg/dL or 11.1 mmol/L) due to either decrease in insulin secretion and/or insulin sensitivity of
target tissues (Panini, 2013; ADA, 2015).
1.2.1 Types of diabetes mellitus
Originally, diabetes has been classified into two major classes: (1) type 1 or insulin dependent
diabetes mellitus (IDDM) and (2) type 2 or non-insulin dependent diabetes mellitus (NIDDM) (WHO,
1980). However, rapidly changing pathogenesis of diabetes has been taken into account for the new
classification of DM. The recent classification by the American Diabetes Association (ADA), diabetes
is categorized into four types: type 1 diabetes, type 2 diabetes, gestational diabetes and the secondary
form of diabetes which encompasses all types of diabetes due to other causes, for instance, monogenic
diabetes syndromes, diseases of the exocrine pancreas and drug- or chemical-associated diabetes (ADA,
2015).
1.2.2 Type 1 diabetes mellitus
This form of diabetes is due to autoimmune-mediated destruction of the pancreatic β-cells as a
result of production of humoral auto antibodies (ADA, 2015; Canivell and Gomis, 2014). Although the
cause of type 1 diabetes (T1D) remains elusive, it is strongly linked to interplay between genetic
predisposition and environmental factors that possibly triggers an autoimmune destruction of the
pancreatic β-cells leading to absolute insulin deficiency (Patterson et al. 2014). The environmental
factors include infectious agents such as viruses (coxsackie B virus, rubella virus) and food toxins. The
destruction of pancreatic β-cells is gradual and variable, being rapid in infants and children and slower
in adults (Joslin and Kahn, 2005). The mechanism involves on selective destruction of pancreatic β-cells
in T1D is poorly understood due to the dissimilarities of pancreatic lesions (Ozougwu et al. 2013). The
proposed mechanism involves the infiltration of lymphocytes (innate immune cells) or insulitis due to
co-interaction of genetic and environmental factors. The infiltration of innate immune cells produces
cytokines such as glutamic acid decarboxylase antibodies (GAD-65), islet cell antibodies
(ICA512A/ICA) and insulin antibodies (IAA), which promote pancreatic β-cell apoptosis and increase
3
infiltration of islet reactive T cells that ultimately attack and destroys pancreatic β-cells (Szablewski,
2014).
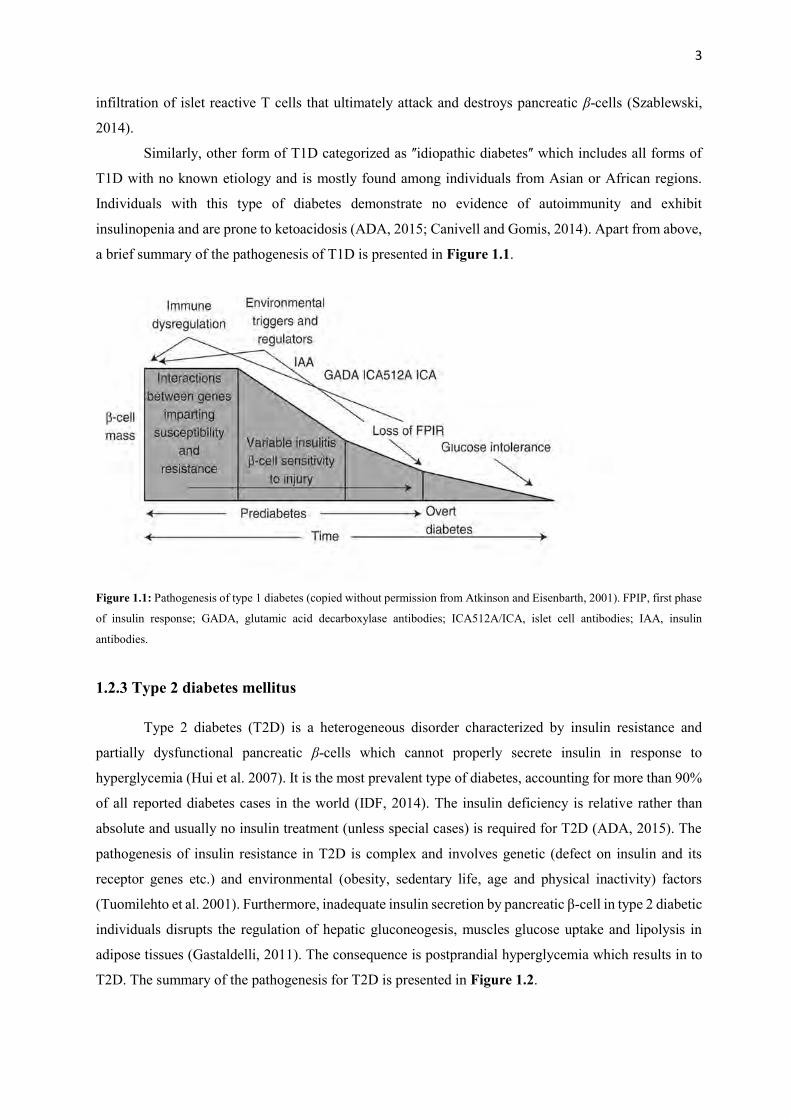
Similarly, other form of T1D categorized as ʺidiopathic diabetesʺ which includes all forms of
T1D with no known etiology and is mostly found among individuals from Asian or African regions.
Individuals with this type of diabetes demonstrate no evidence of autoimmunity and exhibit
insulinopenia and are prone to ketoacidosis (ADA, 2015; Canivell and Gomis, 2014). Apart from above,
a brief summary of the pathogenesis of T1D is presented in Figure 1.1.
Figure 1.1: Pathogenesis of type 1 diabetes (copied without permission from Atkinson and Eisenbarth, 2001). FPIP, first phase
of insulin response; GADA, glutamic acid decarboxylase antibodies; ICA512A/ICA, islet cell antibodies; IAA, insulin
antibodies.
1.2.3 Type 2 diabetes mellitus
Type 2 diabetes (T2D) is a heterogeneous disorder characterized by insulin resistance and
partially dysfunctional pancreatic β-cells which cannot properly secrete insulin in response to
hyperglycemia (Hui et al. 2007). It is the most prevalent type of diabetes, accounting for more than 90%
of all reported diabetes cases in the world (IDF, 2014). The insulin deficiency is relative rather than
absolute and usually no insulin treatment (unless special cases) is required for T2D (ADA, 2015). The
pathogenesis of insulin resistance in T2D is complex and involves genetic (defect on insulin and its
receptor genes etc.) and environmental (obesity, sedentary life, age and physical inactivity) factors
(Tuomilehto et al. 2001). Furthermore, inadequate insulin secretion by pancreatic β-cell in type 2 diabetic
individuals disrupts the regulation of hepatic gluconeogesis, muscles glucose uptake and lipolysis in
adipose tissues (Gastaldelli, 2011). The consequence is postprandial hyperglycemia which results in to
T2D. The summary of the pathogenesis for T2D is presented in Figure 1.2.
4
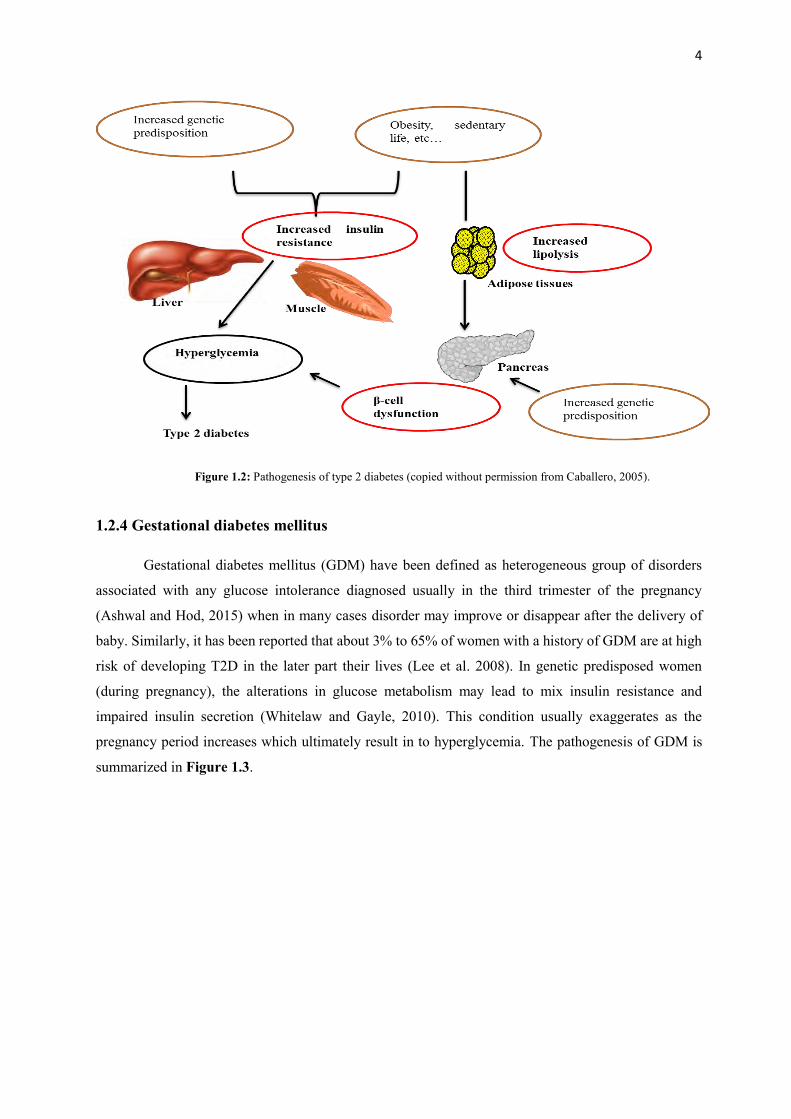
Figure 1.2: Pathogenesis of type 2 diabetes (copied without permission from Caballero, 2005).
1.2.4 Gestational diabetes mellitus
Gestational diabetes mellitus (GDM) have been defined as heterogeneous group of disorders
associated with any glucose intolerance diagnosed usually in the third trimester of the pregnancy
(Ashwal and Hod, 2015) when in many cases disorder may improve or disappear after the delivery of
baby. Similarly, it has been reported that about 3% to 65% of women with a history of GDM are at high
risk of developing T2D in the later part their lives (Lee et al. 2008). In genetic predisposed women
(during pregnancy), the alterations in glucose metabolism may lead to mix insulin resistance and
impaired insulin secretion (Whitelaw and Gayle, 2010). This condition usually exaggerates as the
pregnancy period increases which ultimately result in to hyperglycemia. The pathogenesis of GDM is
summarized in Figure 1.3.

5
Figure 1.3: Pathogenesis of gestational diabetes mellitus (GDM) (prepaid based on Whitelaw and Gayle (2010) report).
1.2.5 Specific types of diabetes due to other causes (secondary type)
This is further sub-divided in to the following;
a) Maturity-onset diabetes of the young (MODY) This form of diabetes is due to the defect on DNA methylation of genes for pancreatic β-cell
development (Thomas and Philipson, 2015). It is mainly categorized into neonatal diabetes and maturity-
onset diabetes of the young (MODY). The onset of elevated blood glucose as a result of pancreatic β-
cell failure usually occurs at an early stage of life (within the first 6 months). Furthermore, in MODY,
there is a defect in insulin secretion with less or no reported alterations in insulin function (ADA, 2015;
Thomas and Philipson, 2015).
b) Cystic fibrosis related diabetes The cystic fibrosis–related diabetes is frequently occurs in individuals with cystic fibrosis. The
disorder is due to impair insulin secretion as a result of partial fibrotic reduction of the pancreatic β-cell
mass (ADA, 2015). Insulin sensitivity is usually normal or may be partially impaired in this kind of
diabetes (Ode and Moran, 2013). Other disorders associated with pancreas include chronic pancreatitis,
hereditary hemochromatosis and pancreatic neoplasia.

6
c) Drug associated diabetes The medications of some diseases were reported to interfere with complex metabolic processes,
thereby alters the secretion and/or function of insulin in physiological system (Thomas and Philipson,
2015). This may likely triggers diabetes or insulin resistance in susceptible individuals. For instance,
glucocorticoids were reported to cause insulin resistance, hyperglycemia, and do interfere with some
stages in the insulin-signaling pathways via multiple mechanisms (Ferris and Kahn, 2012). Antiretroviral
drugs (HIV protease inhibitors) were also reported to induce insulin resistance and impaired glucose
tolerance by inhibiting glucose disposal via GLUT4 in cellular system (Koster et al. 2003). Hence, it is
clear that the pathogenesis of diabetes changing rapidly to create newer type of diabetes which directly
affecting the total prevalence of diabetes mellitus.
1.2.6 Prevalence of diabetes mellitus
The global prevalence of DM is increasing exponentially. Recent data from the International
Diabetes Federation (IDF) indicates that DM affects over 387 million people globally and this figure is
likely to rise to 592 million by 2035 (IDF, 2014; Guariguata et al. 2014). The disease affects nearly 8.3%
of adult (20-79 years) which are mostly live in the low- and middle-income countries. In Africa, more
than 22 million people have diabetes, accounting for about 5.1% of adults (mostly < 60 years) in the
region (Peer et al. 2014; IDF, 2014). In addition, multiple factors contribute to this rising prevalence of
diabetes including population growth, urbanization, dietary change, nutritional transition, physical
inactivity and so on (Guariguata et al. 2014; Hirst et al. 2013).
1.2.7 Diabetes associated complications Although the pathogenesis of T1D and T2D are different, the consequences of their resulting
complications are almost similar (van Dijk and Berl, 2004). These complications are categorized as either
acute or chronic, which partly or solely depend on the uncontrolled hyperglycemia (Monnier et al. 2006).
Acute complications include ketoacidosis, hyperosmolar non-ketotic coma and hypoglycemia (Fishbein
and Palumbo, 1995). The chronic crises comprise of microvascular (retinopathy, neuropathy and
nephropathy) and macro vascular (myocardial infarction, atherosclerosis and peripheral vascular
diseases) complications (Heydari et al. 2010; Rahman et al. 2007). The over production of reactive
oxygen species (ROS) via metabolic processes and due to hyperglycemia have been considered as the
major hallmarks of diabetes-associated complications (Pazdro and Burgess, 2010). In chronic
uncontrolled hyperglycemia, there is an increased production of ROS and a declined of in vivo anti-
oxidant defense system, a term referred as oxidative stress. The ROS are derived from the normal
physiological processes and become highly deleterious if the levels increases and not arrested by
complex anti-oxidant systems in the body (Chang and Chuang, 2010). Furthermore, major contributors
of hyperglycemia-induced oxidative stress include glucose toxicity, protein glycosylation, increased
7
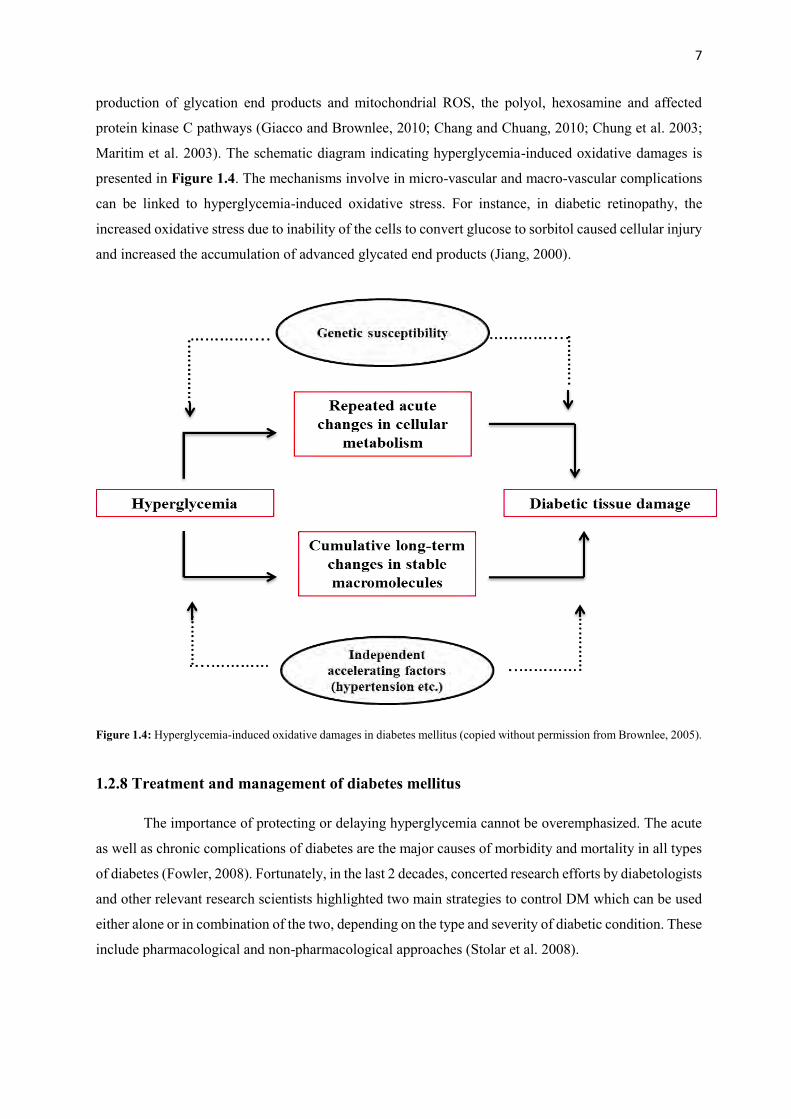
production of glycation end products and mitochondrial ROS, the polyol, hexosamine and affected
protein kinase C pathways (Giacco and Brownlee, 2010; Chang and Chuang, 2010; Chung et al. 2003;
Maritim et al. 2003). The schematic diagram indicating hyperglycemia-induced oxidative damages is
presented in Figure 1.4. The mechanisms involve in micro-vascular and macro-vascular complications
can be linked to hyperglycemia-induced oxidative stress. For instance, in diabetic retinopathy, the
increased oxidative stress due to inability of the cells to convert glucose to sorbitol caused cellular injury
and increased the accumulation of advanced glycated end products (Jiang, 2000).
Figure 1.4: Hyperglycemia-induced oxidative damages in diabetes mellitus (copied without permission from Brownlee, 2005).
1.2.8 Treatment and management of diabetes mellitus
The importance of protecting or delaying hyperglycemia cannot be overemphasized. The acute
as well as chronic complications of diabetes are the major causes of morbidity and mortality in all types
of diabetes (Fowler, 2008). Fortunately, in the last 2 decades, concerted research efforts by diabetologists
and other relevant research scientists highlighted two main strategies to control DM which can be used
either alone or in combination of the two, depending on the type and severity of diabetic condition. These
include pharmacological and non-pharmacological approaches (Stolar et al. 2008).
8
1.2.9 Non-pharmacological therapy
The non-pharmacological option refers to the use of lifestyle intervention strategies in patients
with established risk factors for T2D in order to delay the progression and development of DM. Lifestyle
changes such as weight loss, increased physical exercise and some dietary manipulations are effective in
preventing and controlling diabetes (Tuomilehto, 2009) and this was demonstrated in a number of
randomized controlled clinical trials such as Swedish Malmo feasibility study (Eriksson and Lindgarde,
1991), Chinese Da Qing study (Pan et al. 1997), Finnish diabetes prevention study (Tuomilehto et al.
2001), U.S diabetes prevention program (DPP, 2002), Japanese lifestyle intervention study (Kosaka et
al. 2005) and the Indian diabetes prevention program (Ramachandran et al. 2006). It has been reported
that lifestyle modification by diabetic patients significantly improved hepatic and muscle insulin
sensitivity, muscle glucose uptake and utilization, and the overall glycemic control in addition to
decrease lipids and blood pressure levels (Hayes, 2008).
1.2.10 Pharmacological therapy
Pharmacological intervention to prevent diabetes involves the use of drugs or any agents to treat
patients with established risk factors. The basic risk factors are impaired glucose tolerance (IGT) or
impaired fasting blood glucose (IFG) because approximately 50% of IGT and IFG individuals progress
to diabetes (T2D) over their lifetime (De Fronzo and Abdul-Ghani, 2011).
Insulin It has been well established that insulin therapy reduce hyperglycemia and micro- and macro-
vascular complications associated with diabetes in several randomized clinical trials (Holman et al.
2008; UKPDS, 1998; Ohkubo et al. 1995). However, insulin therapy is associated with two major
limitations; hypoglycemia and weight gain, arose due to intensive insulin treatment (Swinnen et al.
2009).
Mode of insulin action Insulin is a polypeptide hormone produced by the pancreatic β-cells of the islets of Langerhans
in response to hyperglycemia (Harvey and Ferrier, 2011).The β-cells are freely permeable to glucose via
type 2 glucose transporter (GLUT 2) which are immediately phosphorylated to glucose 6-phosphate by
glucokinase enzyme. This stimulates the rise in metabolic flux through glycolysis, the citric acid cycle,
and the generation of ATP (Murray et al. 2003). Elevation of ATP concentration down regulates the
ATP-sensitive K+ channel, leading to depolarization of the pancreatic β-cell membrane. This may
eventually increases Ca2+ influx via voltage-sensitive Ca2+ channels and stimulates the exocytosis of
insulin (Kieffer et al. 1997). Hence, the level of insulin in the blood is proportionate to that of the blood
glucose. Therefore, insulin stimulates glucose transport into adipose tissue and skeletal muscles via type
9
4 glucose transporter (GLUT 4) which are utilized as metabolic fuel and stored as well (Kieffer et al.
1997).
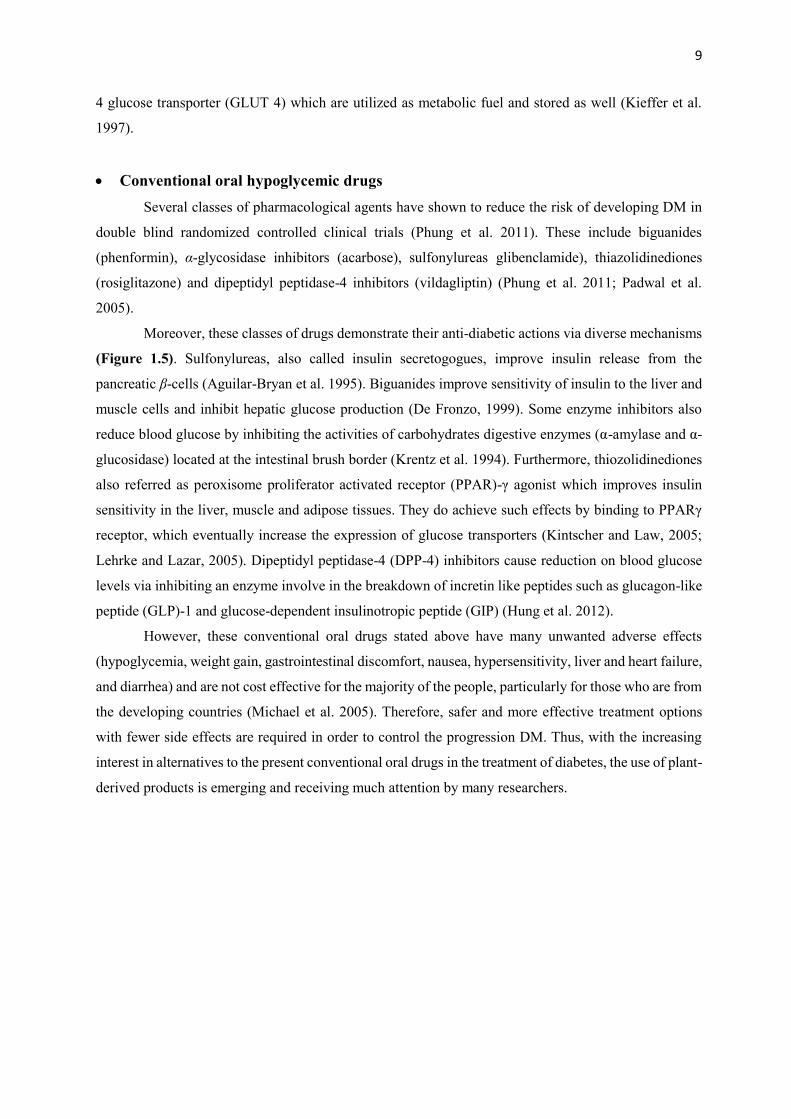
Conventional oral hypoglycemic drugs Several classes of pharmacological agents have shown to reduce the risk of developing DM in
double blind randomized controlled clinical trials (Phung et al. 2011). These include biguanides
(phenformin), α-glycosidase inhibitors (acarbose), sulfonylureas glibenclamide), thiazolidinediones
(rosiglitazone) and dipeptidyl peptidase-4 inhibitors (vildagliptin) (Phung et al. 2011; Padwal et al.
2005).
Moreover, these classes of drugs demonstrate their anti-diabetic actions via diverse mechanisms
(Figure 1.5). Sulfonylureas, also called insulin secretogogues, improve insulin release from the
pancreatic β-cells (Aguilar-Bryan et al. 1995). Biguanides improve sensitivity of insulin to the liver and
muscle cells and inhibit hepatic glucose production (De Fronzo, 1999). Some enzyme inhibitors also
reduce blood glucose by inhibiting the activities of carbohydrates digestive enzymes (α-amylase and α-
glucosidase) located at the intestinal brush border (Krentz et al. 1994). Furthermore, thiozolidinediones
also referred as peroxisome proliferator activated receptor (PPAR)-γ agonist which improves insulin
sensitivity in the liver, muscle and adipose tissues. They do achieve such effects by binding to PPARγ
receptor, which eventually increase the expression of glucose transporters (Kintscher and Law, 2005;
Lehrke and Lazar, 2005). Dipeptidyl peptidase-4 (DPP-4) inhibitors cause reduction on blood glucose
levels via inhibiting an enzyme involve in the breakdown of incretin like peptides such as glucagon-like
peptide (GLP)-1 and glucose-dependent insulinotropic peptide (GIP) (Hung et al. 2012).
However, these conventional oral drugs stated above have many unwanted adverse effects
(hypoglycemia, weight gain, gastrointestinal discomfort, nausea, hypersensitivity, liver and heart failure,
and diarrhea) and are not cost effective for the majority of the people, particularly for those who are from
the developing countries (Michael et al. 2005). Therefore, safer and more effective treatment options
with fewer side effects are required in order to control the progression DM. Thus, with the increasing
interest in alternatives to the present conventional oral drugs in the treatment of diabetes, the use of plant-
derived products is emerging and receiving much attention by many researchers.

10
Figure 1.5: Target organs/tissues and mode of actions of orally anti-diabetic drugs (copied without permission from Koutnik,
2013). (DPP4: Dipeptidyl peptidase-4; GLP-1: Glucagon-like peptide).
1.3 Medicinal plants Medicinal plants are a plants of which one or more parts contain substances that can be used for
therapeutic purposes or which are precursors of the useful drugs (Ebadi, 2006; Lewis, 1981). Medicinal
plants have formed the basis of health care system worldwide for several years and are still widely used
as good sources for the present modern drugs. Recognition of their therapeutic and economic value is
emerging and receiving much attention. Plants are important for pharmacological research and drug
discovery, not only when bioactive compounds are used directly for treatment of ailments, but also as
template for the synthesis of modern conventional drugs (Mendonça-Filho, 2006; Geldenhuys and
Mitchell, 2006).
1.3.1 Medicinal plants in future drug discovery
Medicinal plants are natural products endowed with tremendous capacities to treat wide arrays of
diseases. The use of plant-based formulation to treat diseases also known as herbal medicine is the oldest
form of medicine since around 2600 BCE (Cragg and Newman, 2013; Soladoye et al. 2012). Fortunately,
this area has documented the traditional uses of more than 1000 plant-derived formulations which are
still being used to treat both communicable and non-communicable diseases. Studies conducted
previously have demonstrated that about 80% of isolated compounds, which are used in the modern
medicines, are derived from medicinal plants and traditionally these medicinal plants were used for the
same or similar purposes (Cragg and Newman, 2013; Farnsworth et al. 1985). For instance, the anti-
diabetic agent galegine (a template for synthesis of metformin) was isolated from Galega officinalis L.,
which plant was used to treat diabetes traditionally (Heinrich, 2010). Similarly, the anti-malarial drug,
artemisinin and anti-HIV drug, calanolide A were derived from the plant Artemisia annua L. and
Calophyllum lanigerum var. austrocoriaceum (Whitmore) P.F. Stevens, respectively. These plants have
11
also been widely used in the traditional medicines for the treatment of fevers and some microbial
infections (Gurib-Fakim, 2006).
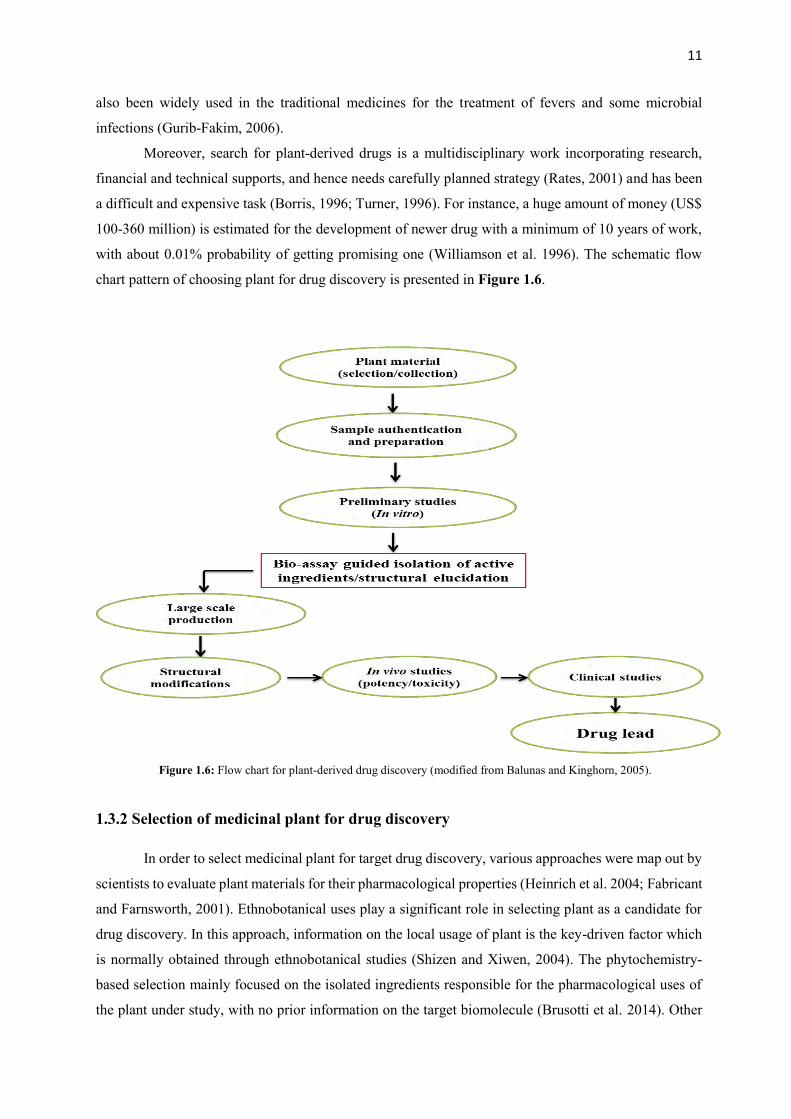
Moreover, search for plant-derived drugs is a multidisciplinary work incorporating research,
financial and technical supports, and hence needs carefully planned strategy (Rates, 2001) and has been
a difficult and expensive task (Borris, 1996; Turner, 1996). For instance, a huge amount of money (US$
100-360 million) is estimated for the development of newer drug with a minimum of 10 years of work,
with about 0.01% probability of getting promising one (Williamson et al. 1996). The schematic flow
chart pattern of choosing plant for drug discovery is presented in Figure 1.6.
Figure 1.6: Flow chart for plant-derived drug discovery (modified from Balunas and Kinghorn, 2005).
1.3.2 Selection of medicinal plant for drug discovery
In order to select medicinal plant for target drug discovery, various approaches were map out by
scientists to evaluate plant materials for their pharmacological properties (Heinrich et al. 2004; Fabricant
and Farnsworth, 2001). Ethnobotanical uses play a significant role in selecting plant as a candidate for
drug discovery. In this approach, information on the local usage of plant is the key-driven factor which
is normally obtained through ethnobotanical studies (Shizen and Xiwen, 2004). The phytochemistry-
based selection mainly focused on the isolated ingredients responsible for the pharmacological uses of
the plant under study, with no prior information on the target biomolecule (Brusotti et al. 2014). Other
12
approaches include random and/or target selection of plants followed by some biological studies and
follow-up bioactivity reports (Heinrich et al. 2004; Harborne, 1998).
1.3.3 Collection, authentication and preparation of plant material
Collection of individual plant materials and/or whole plant samples depends on the parts with
rich bioactive constituents and is greatly affected by some environmental factors such as nature of the
soil, rainfall, weather and temperature (Harborne, 1998). The collected plant parts need to be
scientifically and correctly authenticated by either taxonomist or a botanist (Satyajit et al. 2006). The
voucher specimen number is usually deposited in the herbarium for subsequent reference purposes for
an unlimited period of time (Harborne, 1998).
Furthermore, extraction of the plant samples is an integral part on the way of plant-derived drug
discovery (Brusotti et al. 2014). Several methods are employed to achieve successful extraction of the
bioactive compounds from the plant materials. The conventional solid-liquid solvent extraction
procedure depends mainly on the polarity and solubility of the target bioactive compounds in the
extracting solvent (Hostettmann et al. 1991). Such conventional methods include but not limited to
maceration, infusion, decoction, percolation, steam distillation, sequential solvent extraction and soxhlet
extraction (Harborne, 1998). This is in addition to some modern techniques currently employed for
sample extraction which include the microwave-assisted extraction, ultrasound assisted extraction,
supercritical fluid extraction and pressurized liquid extraction (Brusotti et al. 2014). Before subjecting
the sample to extraction procedure, the plant materials must be dried, usually under shade in a well
ventilated space to avoid microbial contamination and loss of target compounds. After drying, the
samples are grounded into a fine powder for proper extraction of the bioactive metabolites. Then the
extracts can be used either for in vitro, ex-vivo or in vivo study.
1.3.4 Preliminary in vitro studies
Once the extracts are obtained, the next step is to subject the extracts to some in vitro bioassay
protocols in order to examine whether the extracts are active or not. In vitro assays are usually faster,
specific and not much amount of the extracts are used (mostly in micro or milligram amount) (Cos et al.
2006). Furthermore, some of the in vitro methods employed include chemical and enzymatic procedures,
which depend on spectrophotometric analysis (Beretta and Facino, 2010). For instance in evaluating
plants as possible anti-diabetic drugs, several in vitro models are used to assess the anti-diabetic effects
and mode of actions as well. These models include enzyme inhibition-based assays (e.g. α-amylase, α-
glucosidase and glucose 6-phosphatase inhibitions), glucose uptake bioassays (using cell lines such as
C2C12 myocytes, 3T3-L1 pre-adipocytes and human Chang liver cells) and stimulation of insulin release

13
which is usually conducted in perfused pancreas, isolated pancreatic islets cells or clonal pancreatic β-
cell-lines (van de Venter et al. 2008; Bhandari et al. 2008; Hannan et al. 2007).
1.3.5 Bioassay-guided fractionation of the active principles
Bioassay-guided fractionation is an important method employed to identify the plant derived
bioactive compounds. It involves repetitive fractionation (column chromatography and thin layer
chromatography) and evaluation of bioactivity of the fractions up to the isolation of pure target principles
with the selected biological activity (Gurib-Fakim, 2006). As soon as the isolation of a pure compound
is achieved, the next step is the structural elucidation of the compound isolated which requires the use
of Nuclear Magnetic Resonance Spectroscopy (NMR) and Mass Spectroscopy (MS) (Verpoorte, 1989).
1.3.6 In vivo, clinical and toxicological studies
In in vivo approach, animals are used to investigate the efficacy, mode of action and side effects
of the plant extracts, fractions and their active principles (Eddouks et al. 2012). In vivo screening is
usually conducted based on the results of the in vitro study and its require a large scale production and/or
extraction of the target compound from the extract. In some cases structural modification is employed to
ascertain or improve the bioactivity of the target substance (Rates, 2001). This approach otherwise called
pre-clinical investigation can take longer time and demand a lot of resources.
Furthermore, in some diseases such as DM, several models are employed in order to establish
the potency of the target compounds, due to the complex heterogeneity of human body system in disease
conditions. These include chemically induced animal models such as alloxan and streptozotocin-induced
diabetic animals that are mostly used for the induction of T1D (Wang et al. 2009). The animal models
of T2D include genetically induced or spontaneous (e.g. Zucker diabetic fatty model) and experimentally
induced or nonspontaneous (e.g. high-fats diet-fed and fructose-fed/streptozotocin) models (Eddouks et
al. 2012; Islam and Loots, 2009). Due to the easy induction of diabetes, lower maintenance cost and
wider availability the experimentally induced model has been recommended as a better option over
genetically induced spontaneous model, particularly for the researchers and scientists from the
developing countries (Eddouks et al. 2012; Islam and Loots, 2009). Additionally, if the target drug
candidate was observed to cause some adverse effects in the animal model, structural modification of
the compound is carried out to reduce the severity of the consequences (Lin and Lu, 1997). Preliminary
toxicological effects of the plant derived compounds are conducted both in vitro (cell line) and at in vivo
level to ascertain their safety for clinical use.
Clinical trials are usually carried out to confirm the safety of potential bioactive compounds in
human subjects. Before the commencement of such investigation, a careful protocol has to be prepared
due to a strict ethical procedures involved in using humans as subjects in various studies. For instance,

14
in USA or Europe, an investigational new drug application is usually applied to the relevant authorities
such as Food and Drug Administration (FDA) or European Medicines Agency (EMA) (Mishra and
Tiwari, 2011). Once the investigation is successful, the candidate drug is now ready for marketing and
will subsequently be available to the general people.
1.3.7 Medicinal plants for the treatment of diabetes
The practice of using plants to treat DM by humans has been employed by different cultural
settings worldwide since immemorial time (Gurib-Fakim, 2006; Bnouham et al. 2006; Samuelsson,
2004). With the recent escalation of the prevalence of DM, high cost and inaccessibility to modern drugs,
the popularity of using medicinal plants derived medicines to treat DM has been increased especially in
the developing countries (Rachid et al. 2012). On the other side, reports available have also showed a
dramatic increase on the use of plant-derived formulations to manage DM in developed countries
(Achaya and Shrivastava, 2008; Gilani, 2005; Cordell and Colvard, 2005). This increase has been
attributed due to the undesirable adverse effects of synthetic anti-diabetic drugs (Shu, 1998).
Recently, Hung et al. (2012) highlighted that during 2005 to 2010; about 100 plant-derived
preparations have been investigated for possible anti-diabetic actions. Interestingly, some of these
preparations are now formulated and available in the market as anti-diabetic remedy. Additionally, 85
bioactive compounds have demonstrated anti-diabetic potentials within the same periods of time. In a
similar study reported earlier, about 106 plant-derived compounds were reported to show possible anti-
diabetic effects in various studies published within the period of 2000-2005 (Jung et al. 2006). However,
the exert mode of actions of plant-derived formulations and/or compounds used in diabetes treatment is
still remain elusive and speculative. Some of the mechanisms proposed include insulin-like action
(Broadhurst et al. 2000), inhibition of carbohydrate digestive enzymes (Bhandari et al. 2008), decreasing
the absorption of glucose at the gut (Gallagher et al. 2003), stimulation of hepatic and muscle glucose
uptake (Eid et al. 2010), anti-oxidative effects in preventing β-cell damage (Sef et al. 2011), complement
the action of insulin (Donga et al. 2011).
1.3.8 African medicinal plants with anti-diabetic potentials
African region is among the regions endowed with the richest biodiversity in the world, with an
abundance of plants used for therapeutic purposes. According to the World Health Organization (WHO)
report, more than 80% of the population in Africa depends almost entirely on plant-derived preparations
to treat various types of diseases (Zhang, 2001). However, many of these plants still await proper
scientific investigation.
Similarly, the undesirable adverse effects and high cost of conventional oral synthetic drugs
coupled with an exponential increase in the prevalence of DM motivate researchers to scientifically
15
validate the folkloric use of a number of African medicinal plants as possible alternative therapies. The
anti-diabetic potentials of a number of these medicinal plants have been reported and some bioactive
compounds were isolated and screened as well. In review, we have reported that a total number of 185
plants species from 75 families were reported to be investigated for anti-diabetic effects in Africa during
2000 to 2013 (Mohammed et al. 2014). Plants such as Anacardium occidentale L. (Anacardiaceae),
Gongronema latifolium Benth (Asclepiadaceae), Sclerocarya birrea (A. Rich) Hochst. (Anacardiaceae),
Sutherlandia frutescens (L.) R.Br. (Fabaceae), Trigonellafoenum graecum L. (Leguminosae) Vernonia
amygdalina Del. (Asteraceae) and Zizyphus spina-christi (L.) Desf (Rhamnaceae) are some of the
African medicinal plants that received much attention due to the content of possible anti-diabetic agents
(Table 1.1).
Table 1.1: Most studied anti-diabetic medicinal plants in the African continent.
Scientific name Part (s) used
Phytochemicals Efficacy References
Anacardium occidentale L. (Anacardiaceae)
Stem bark Polyphenols Stimulated muscles glucose uptake
Tedong et al. 2010
Antihyperglycemic in type 1 & 2 diabetic animals
Abdullahi and Olatunji, 2010
Gongronema latifolium Benth. (Asclepiadaceae)
Leaf/ Stem bark
α- and β-Amyrin Cinnamates, Lupenyl cinnamates, Lupenyl acetate, Triterpenoids
Mimic insulin action Adebajo et al. 2013
Decreased blood glucose level in diabetic animals/ Anti-oxidative
Akah et al. 2011
Sclerocarya birrea (A. Rich) Hochst. (Anacardiaceae)
Stem bark (−)-Epicatechin-3-galloyl ester
Stimulated insulin release
Galvez et al. 1992
Enhanced glucose-stimulated insulin secretion in INS-1E cells
Ndifossap et al. 2005
Sutherlandia frutescens (L.) R.Br. (Fabaceae)
Leaf/ Shoot/ Whole plant
Flavonoid Decreased blood glucose level in diabetic animals
Ojewole, 2004
Aerial part Improved insulin sensitivity in vivo
MacKenzie et al. 2009
Trigonella foenum graecum L. (Leguminosae)
Seed Diosgenin Inhibited α-glucosidase action
Gad et al. 2006

16
Vernonia amygdalina Del. (Asteraceae)
Leaf Sesquiterpene lactones
Improved postprandial glucose utilization in human subjects
Okolie et al. 2008
Decreased blood glucose level in diabetic animals
Atangwo et al. 2007
Ziziphus spina-christi (L.) Desf (Rhamnaceae)
Leaf Chritinin-A Stimulated insulin release
Abdel-Zahera et al. 2005
1.3.9 Bioactive compounds from African medicinal plants with anti-diabetic potentials
The major target of screening medicinal plants as anti-diabetic agent is to isolate pure bioactive
compounds that could be responsible for the observed activities of the plant under study. Such
compounds can be further standardized and used as alternative anti-diabetic drugs. In Africa, just like
other continents, some bioactive compounds were isolated and screened as possible anti-diabetic agents.
In our current search, a total of 53 compounds isolated from African medicinal plants which were
reported to be investigated as possible anti-diabetic agents include 3 phenolic compounds from marine
algae Ecklonia maxima (Osbeck) Papenfuss. Interestingly, 45 compounds were found to be active in the
models used in the reported studies (Table 1.2). However, numerous other plants and plant-based natural
products from the African continent are still need to be evaluated scientifically to identify better
alternative of existing anti-diabetic medicines or natural products. Some of these plants are included in
this study which is described below.
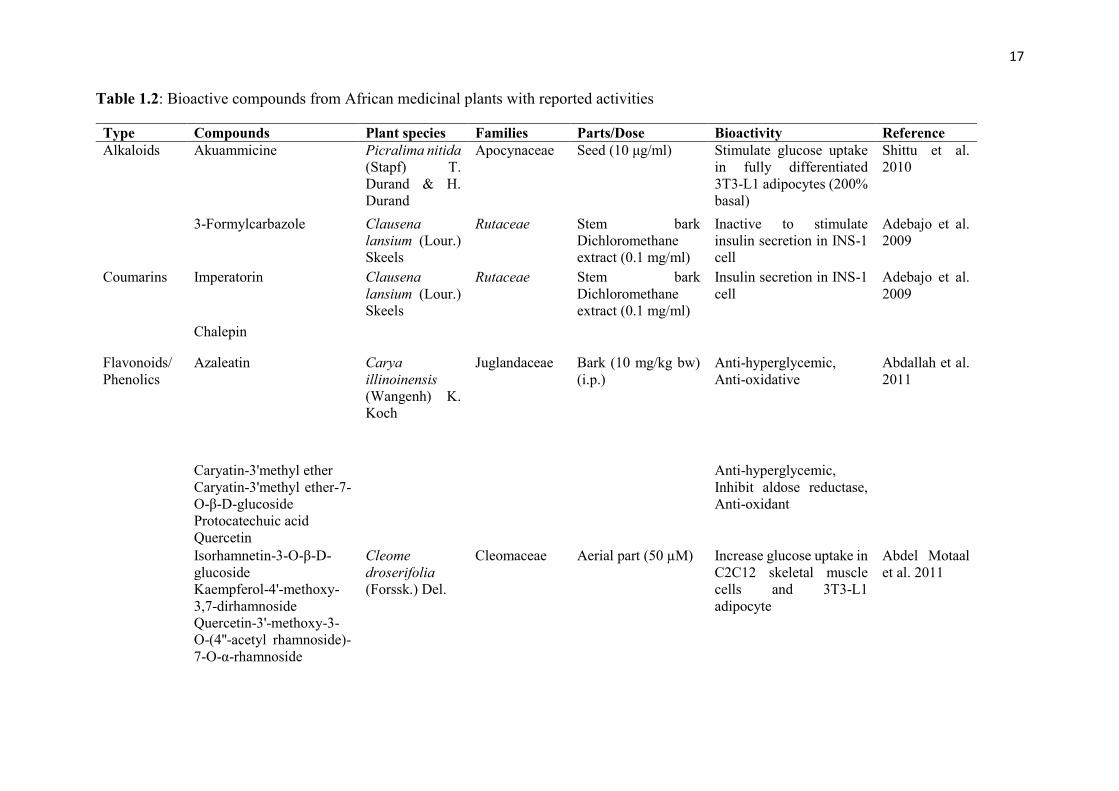
17
Table 1.2: Bioactive compounds from African medicinal plants with reported activities
Type Compounds Plant species Families Parts/Dose Bioactivity Reference Alkaloids
Akuammicine Picralima nitida (Stapf) T. Durand & H. Durand
Apocynaceae Seed (10 μg/ml) Stimulate glucose uptake in fully differentiated 3T3-L1 adipocytes (200% basal)
Shittu et al. 2010
3-Formylcarbazole Clausena lansium (Lour.) Skeels
Rutaceae Stem bark Dichloromethane extract (0.1 mg/ml)
Inactive to stimulate insulin secretion in INS-1 cell
Adebajo et al. 2009
Coumarins
Imperatorin Clausena lansium (Lour.) Skeels
Rutaceae
Stem bark Dichloromethane extract (0.1 mg/ml)
Insulin secretion in INS-1 cell
Adebajo et al. 2009
Chalepin
Flavonoids/Phenolics
Azaleatin Carya illinoinensis (Wangenh) K. Koch
Juglandaceae
Bark (10 mg/kg bw) (i.p.)
Anti-hyperglycemic, Anti-oxidative
Abdallah et al. 2011
Caryatin-3'methyl ether Anti-hyperglycemic, Inhibit aldose reductase, Anti-oxidant
Caryatin-3'methyl ether-7-O-β-D-glucoside Protocatechuic acid Quercetin Isorhamnetin-3-O-β-D-glucoside
Cleome droserifolia (Forssk.) Del.
Cleomaceae
Aerial part (50 µM)
Increase glucose uptake in C2C12 skeletal muscle cells and 3T3-L1 adipocyte
Abdel Motaal et al. 2011
Kaempferol-4'-methoxy-3,7-dirhamnoside Quercetin-3'-methoxy-3-O-(4''-acetyl rhamnoside)-7-O-α-rhamnoside
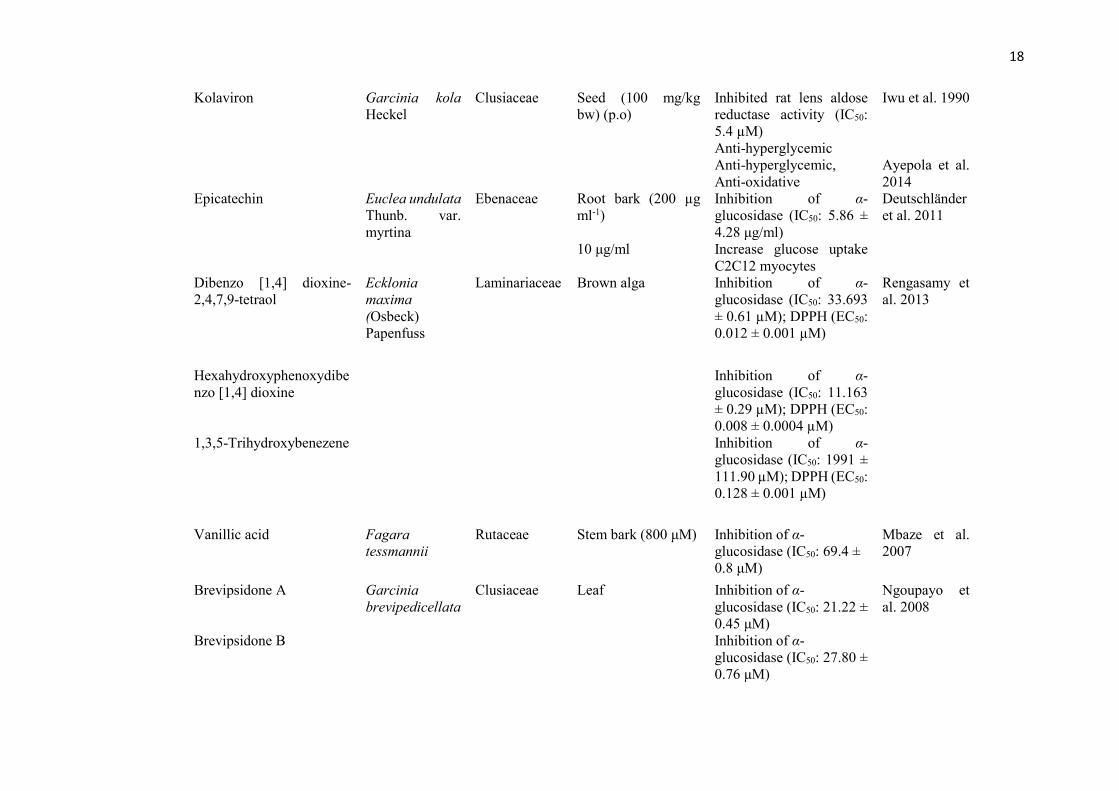
18
Kolaviron
Garcinia kola Heckel
Clusiaceae
Seed (100 mg/kg bw) (p.o)
Inhibited rat lens aldose reductase activity (IC50: 5.4 µM)
Iwu et al. 1990
Anti-hyperglycemic Anti-hyperglycemic, Anti-oxidative
Ayepola et al. 2014
Epicatechin Euclea undulata Thunb. var. myrtina
Ebenaceae Root bark (200 µg ml-1)
Inhibition of α-glucosidase (IC50: 5.86 ± 4.28 μg/ml)
Deutschländer et al. 2011
10 μg/ml Increase glucose uptake C2C12 myocytes
Dibenzo [1,4] dioxine-2,4,7,9-tetraol
Ecklonia maxima (Osbeck) Papenfuss
Laminariaceae
Brown alga
Inhibition of α-glucosidase (IC50: 33.693 ± 0.61 µM); DPPH (EC50: 0.012 ± 0.001 µM)
Rengasamy et al. 2013
Hexahydroxyphenoxydibenzo [1,4] dioxine
Inhibition of α-glucosidase (IC50: 11.163 ± 0.29 µM); DPPH (EC50: 0.008 ± 0.0004 µM)
1,3,5-Trihydroxybenezene
Inhibition of α-glucosidase (IC50: 1991 ± 111.90 µM); DPPH (EC50: 0.128 ± 0.001 µM)
Vanillic acid Fagara tessmannii
Rutaceae Stem bark (800 μM) Inhibition of α-glucosidase (IC50: 69.4 ± 0.8 μM)
Mbaze et al. 2007
Brevipsidone A Garcinia brevipedicellata
Clusiaceae
Leaf
Inhibition of α-glucosidase (IC50: 21.22 ± 0.45 μM)
Ngoupayo et al. 2008
Brevipsidone B Inhibition of α-glucosidase (IC50: 27.80 ± 0.76 μM)

19
Brevipsidone C
Inhibition of α-glucosidase (IC50: 59.67 ± 0.41 μM)
Brevipsidone D Inhibition of α-glucosidase (IC50: 7.04 ± 0.26 μM)
Gallic acid Terminalia superba
Combretaceae
Stem bark (800 μM) Inhibition of α-glucosidase (IC50: 5.2 ± 0.2 μM)
Wansi et al. 2007
Methyl gallate Inhibition of α-glucosidase (IC50: 11.5 ± 0.1 μM)
Tannins
Ellagic acid Terminalia superba
Combretaceae
Stem bark (800 μM)
Inhibition of α-glucosidase (IC50: 194.1 ± 0.2 μM)
Wansi et al. 2007
Ellagic acid 3,3'-dimethyl ether
Inhibition of α-glucosidase (IC50: 184.6 ± 0.9 μM)
Ellagic acid-4-O-β-D-xylopyranoside-3,3'-dimethyl ether
Inhibition of α-glucosidase (IC50: 118.7 ± 0.1 μM)
3,4'-Di-O-methylellagic acid 3'-O-β-D-xylopyranoside
Inhibition of α-glucosidase (IC50: 7.95 ± 0.33 μM)
Tabopda et al. 2008
4'-Galloy-3,3'-di-O-methylellagic acid 4-O-β-D-xylopyranoside
Inhibition of α-glucosidase (IC50: 21.21 ± 0.69 μM)
Terpenoids
Oleanolic acid
Olea europaea subsp. africana (Mill.) P.S.Green
Oleaceae Leaf (60 mg/kg bw) (i.p.)
Hypoglycemic, Anti-hyperlipidemic, Anti-hypertensive, Anti-oxidant
Somova et al. 2003a
Syzygium aromaticum
Myrtaceae
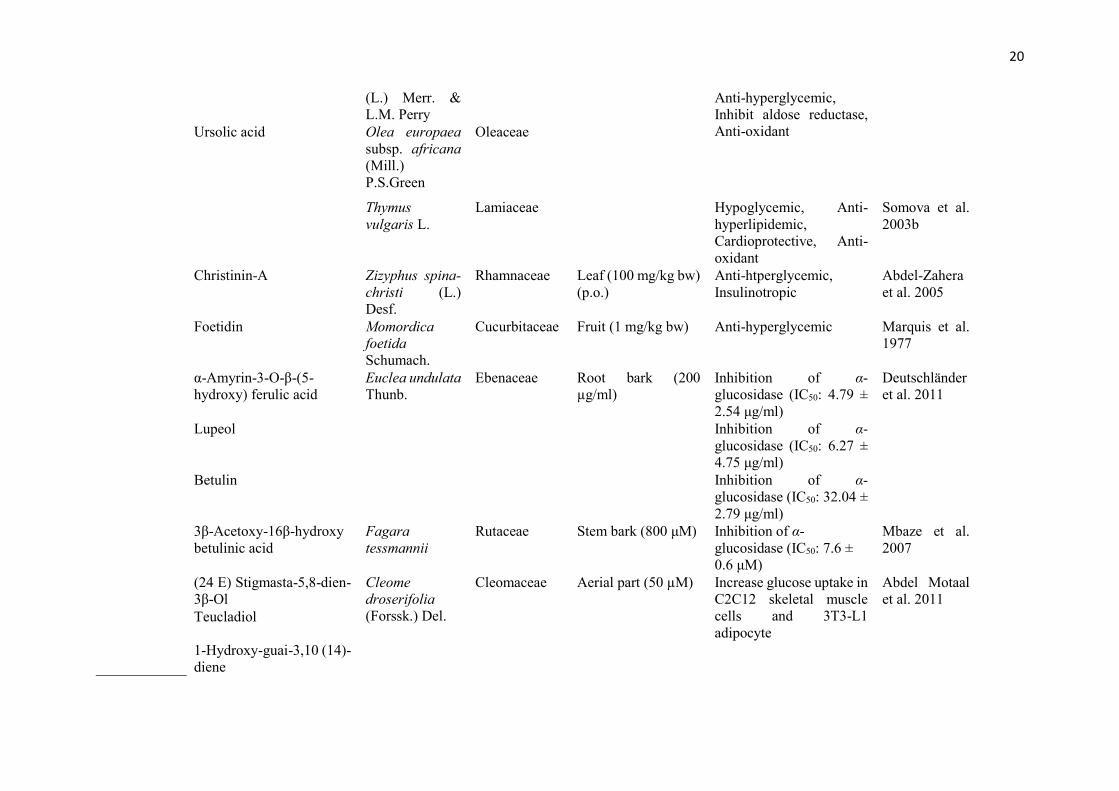
20
(L.) Merr. & L.M. Perry
Anti-hyperglycemic, Inhibit aldose reductase, Anti-oxidant
Ursolic acid
Olea europaea subsp. africana (Mill.) P.S.Green
Oleaceae
Thymus vulgaris L.
Lamiaceae Hypoglycemic, Anti-hyperlipidemic, Cardioprotective, Anti-oxidant
Somova et al. 2003b
Christinin-A Zizyphus spina-christi (L.) Desf.
Rhamnaceae Leaf (100 mg/kg bw) (p.o.)
Anti-htperglycemic, Insulinotropic
Abdel-Zahera et al. 2005
Foetidin Momordica foetida Schumach.
Cucurbitaceae Fruit (1 mg/kg bw) Anti-hyperglycemic Marquis et al. 1977
α-Amyrin-3-O-β-(5-hydroxy) ferulic acid
Euclea undulata Thunb.
Ebenaceae
Root bark (200 µg/ml)
Inhibition of α-glucosidase (IC50: 4.79 ± 2.54 μg/ml)
Deutschländer et al. 2011
Lupeol Inhibition of α-glucosidase (IC50: 6.27 ± 4.75 μg/ml)
Betulin Inhibition of α-glucosidase (IC50: 32.04 ± 2.79 μg/ml)
3β-Acetoxy-16β-hydroxy betulinic acid
Fagara tessmannii
Rutaceae Stem bark (800 μM) Inhibition of α-glucosidase (IC50: 7.6 ± 0.6 μM)
Mbaze et al. 2007
(24 E) Stigmasta-5,8-dien-3β-Ol
Cleome droserifolia (Forssk.) Del.
Cleomaceae
Aerial part (50 µM)
Increase glucose uptake in C2C12 skeletal muscle cells and 3T3-L1 adipocyte
Abdel Motaal et al. 2011
Teucladiol
1-Hydroxy-guai-3,10 (14)-diene

21
18-Hydroxy-dollabela-8 (17)-ene
Guai-7(11), 8-diene Buchariol
2,6-Dimethoxy-1,4-benzoquinone
Fagara tessmannii
Rutaceae Stem bark (800 μM) Inhibition of α-glucosidase (IC50: 900.0 ± 3.5 μM)
Mbaze et al. 2007
D-3-O-Methylchiroinositol
Piliostigma thonningii (Schum.) Milne-Redh.
Fabaceae Stem bark (2-8 mg/kg bw) (p.o.)
Anti-hyperglycemic, Anti-hyperlipidemic,
Asuzu and Nwaehujor, 2013

22
1.4 Aframomum melegueta K. Schum.
Figure 1.7: Aframomum melegueta plant, whole plant (A), fruits (B).
1.4.1 Description
Aframomum melegueta K. Schum. commonly known as alligator pepper, grains of paradise or
guinea pepper belongs to Zingiberaceae family (Iwu, 2014). It is a perennial herbaceous plant with
aromatic spicy fruits and grows up to 4 m height. The fruits are indehiscent with many tiny seeds
integrated in tasting axils. The seeds are strongly aromatic and pungent, usually golden or red-brown in
color when fresh but darken on drying. The flowers are pinkish-orange and develop separately from the
leafy stem. The leaves are large, parallel pinnate nerves and appear with open or closed sheath. It has
short, branched and leafy stem with adventitious root located at the lower end. It also possessed tuberous
rhizome with scaly leaves and occasional buds in axils (Figure 1.7) (Iwu, 2014; Irvine, 1961).
1.4.2 Distribution
A. melegueta is an indigenous spice widely available throughout the tropical Africa, but mostly
cultivated in West and Central African regions (Iwu, 2014).
1.4.3 Phytochemistry
Many of the phytochemical investigations reported on A. melegueta were carried out on the
seed part, with very scanty or no information on the other parts (fruit, leaf and stem) of this plant.
Available studies indicated that, A. melegueta seed aqueous extract is rich in phenolic compounds and
minerals (Adefegha and Oboh, 2012a; Gbadamosi et al. 2011; Okwu, 2005). It was also reported that
gingerols, shogaols and paradols as are the active constituents of A. melegueta seed (Tackie et al. 1975;
Connelland McLachlan, 1972; Connell, 1970). Other compounds isolated from this plant include
gingerdione, 5-oxo-l-(4-hydroxy-3-methoxyphenyl) decan-3-one, [6]-paradol, 1-(4-hydroxy-3-
methoxyphenyl) decan-3-one, [6]-gingerol, 5-hydroxy-l-(4-hydroxy-3-methoxyphenyl) decan-3-one
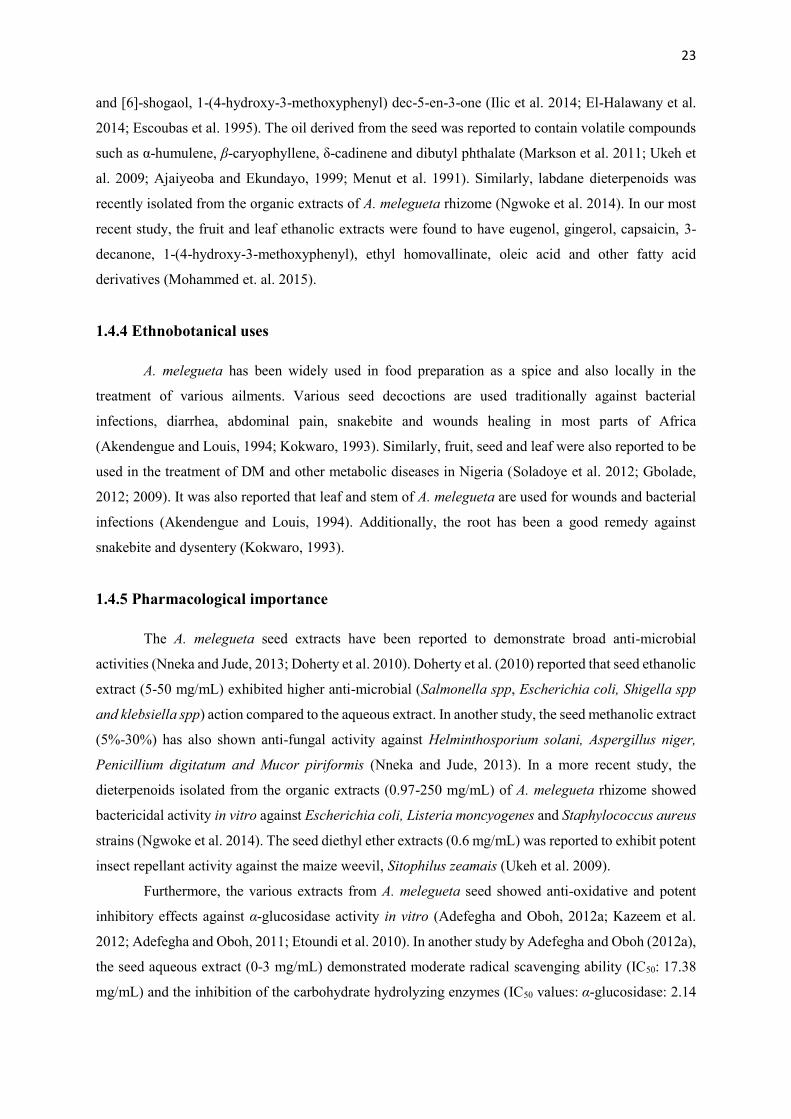
23
and [6]-shogaol, 1-(4-hydroxy-3-methoxyphenyl) dec-5-en-3-one (Ilic et al. 2014; El-Halawany et al.
2014; Escoubas et al. 1995). The oil derived from the seed was reported to contain volatile compounds
such as α-humulene, β-caryophyllene, δ-cadinene and dibutyl phthalate (Markson et al. 2011; Ukeh et
al. 2009; Ajaiyeoba and Ekundayo, 1999; Menut et al. 1991). Similarly, labdane dieterpenoids was
recently isolated from the organic extracts of A. melegueta rhizome (Ngwoke et al. 2014). In our most
recent study, the fruit and leaf ethanolic extracts were found to have eugenol, gingerol, capsaicin, 3-
decanone, 1-(4-hydroxy-3-methoxyphenyl), ethyl homovallinate, oleic acid and other fatty acid
derivatives (Mohammed et. al. 2015).
1.4.4 Ethnobotanical uses
A. melegueta has been widely used in food preparation as a spice and also locally in the
treatment of various ailments. Various seed decoctions are used traditionally against bacterial
infections, diarrhea, abdominal pain, snakebite and wounds healing in most parts of Africa
(Akendengue and Louis, 1994; Kokwaro, 1993). Similarly, fruit, seed and leaf were also reported to be
used in the treatment of DM and other metabolic diseases in Nigeria (Soladoye et al. 2012; Gbolade,
2012; 2009). It was also reported that leaf and stem of A. melegueta are used for wounds and bacterial
infections (Akendengue and Louis, 1994). Additionally, the root has been a good remedy against
snakebite and dysentery (Kokwaro, 1993).
1.4.5 Pharmacological importance
The A. melegueta seed extracts have been reported to demonstrate broad anti-microbial
activities (Nneka and Jude, 2013; Doherty et al. 2010). Doherty et al. (2010) reported that seed ethanolic
extract (5-50 mg/mL) exhibited higher anti-microbial (Salmonella spp, Escherichia coli, Shigella spp
and klebsiella spp) action compared to the aqueous extract. In another study, the seed methanolic extract
(5%-30%) has also shown anti-fungal activity against Helminthosporium solani, Aspergillus niger,
Penicillium digitatum and Mucor piriformis (Nneka and Jude, 2013). In a more recent study, the
dieterpenoids isolated from the organic extracts (0.97-250 mg/mL) of A. melegueta rhizome showed
bactericidal activity in vitro against Escherichia coli, Listeria moncyogenes and Staphylococcus aureus
strains (Ngwoke et al. 2014). The seed diethyl ether extracts (0.6 mg/mL) was reported to exhibit potent
insect repellant activity against the maize weevil, Sitophilus zeamais (Ukeh et al. 2009).
Furthermore, the various extracts from A. melegueta seed showed anti-oxidative and potent
inhibitory effects against α-glucosidase activity in vitro (Adefegha and Oboh, 2012a; Kazeem et al.
2012; Adefegha and Oboh, 2011; Etoundi et al. 2010). In another study by Adefegha and Oboh (2012a),
the seed aqueous extract (0-3 mg/mL) demonstrated moderate radical scavenging ability (IC50: 17.38
mg/mL) and the inhibition of the carbohydrate hydrolyzing enzymes (IC50 values: α-glucosidase: 2.14

24
mg/mL; α-amylase: 4.83 mg/mL). The same extract at the concentration of 0.2 g/mL was also reported
to inhibit the α-amylase (30.61%) and lipase (8.91%) activities in vitro (Etoundi et al. 2010). It was also
reported previously that the seed aqueous extract (0-3 mg/mL) attenuated the Fe2+-induced lipid
peroxidation in normal rat’s brain (Adefegha and Oboh, 2011). Kazeem et al. (2012) have reported that
seed polyphenolic-rich extract (0.1-1 mg/ml) exhibited good anti-oxidant action (IC50 values: DPPH:
0.11 mg/mL; anti-glycation: 0.125 mg/mL; Superoxide anion: 0.105 mg/mL). In a more recent study,
treatment of seed ethanolic extract (100-400 mg/kg bw) daily for 4 weeks was reported to improve in
vivo anti-oxidative status in normal rats (Onoja et al. 2014).
Similarly, the seed aqueous extract (4.8 g/kg bw/day) demonstrated hepato-protective effect in
ethanol-induced toxic animals after 16 days oral intervention (Nwozo and Oyinloye, 2011). The seed
ethanolic extract (0.5-1 g/kg bw) including paradol, gingerol, and shogaol isolated from the seed (0.15
g/kg bw) have showed anti-inflammatory activities in a rats paw edema model after 3 hour post-
administration period (Ilic et al. 2014). Umukoro and Ashorobi (2008) had earlier reported that
treatment of aqueous extract (50-200 mg/kg bw) daily for 4 days exhibited anti-inflammatory action in
rats. Some previous findings have showed the potential of the seed extracts in ameliorating problems
associated with reproductive function. Kamtchouing et al. (2002) have shown that treatment of aqueous
extract (115 mg/kg bw/day) improved penile erection in rats. Subsequently, after 55 days treatment, the
extract at the same dose increased the secretions of epididymis and seminal vesicle in animals (Mbongue
et al. 2012). In another study, seed aqueous extract (25-200 mg/kg bw) showed anti-stress as well as
anti-nociceptive potentials in mice after 30 minutes post-treatment period (Umukoro and Ashorobi,
2007; 2005).
Sugita et al. (2013) have recently reported that daily administration of A. melegueta capsule (10
mg) for 4 weeks activates brown adipose tissue and increases whole-body energy expenditure in healthy
human subjects. In a preliminary study, Adesokan et al. (2010) reported that daily treatment of A.
melegueta seed aqueous extract (200, 400 mg/kg bw) demonstrated blood glucose lowering ability in
alloxan-induced diabetic rats. Similarly, the leaf extract (50-200 mg/kg bw) was also reported to cause
reduction of blood glucose level in alloxanized animals after 5 day post-treatment period (Mojekwu et
al. 2011). Additionally, the seed ethanolic extract was reported safe up to a dose of 300 mg/kg bw
(Akpanabiatu et al. 2013; Ilic et al. 2010). In another study, paradol, gingerol, and shogaol isolated from
the seed have showed anti-inflammatory activity in a rats paw edema model (Ilic et al. 2014). El-
Halawany et al. (2014) have also reported that diarylheptanoid, 8-dehydrogingerdione, 6-
dehydroparadol, dihydrogingerenone, 6-gingerol, dihydroparadol, paradol and 6-shogaol demonstrated
hepato-protective and anti-oxidative actions in CCl4 induced acute liver injury in rats.
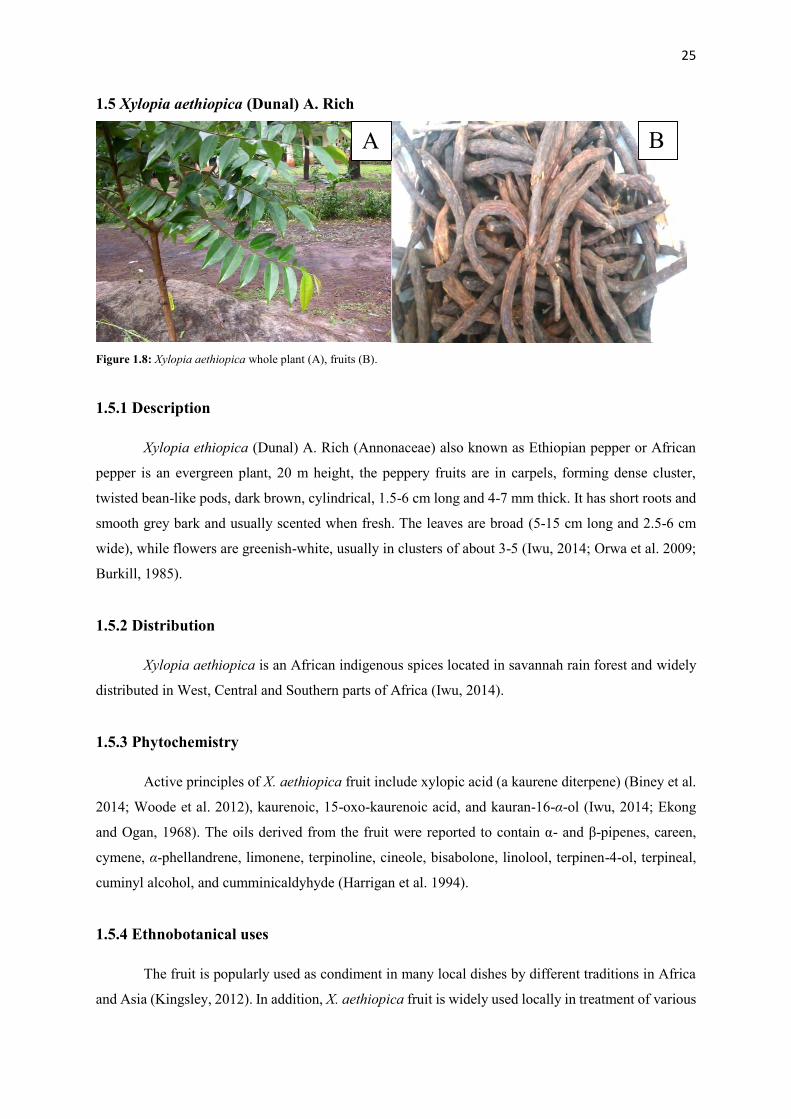
25
1.5 Xylopia aethiopica (Dunal) A. Rich
Figure 1.8: Xylopia aethiopica whole plant (A), fruits (B).
1.5.1 Description
Xylopia ethiopica (Dunal) A. Rich (Annonaceae) also known as Ethiopian pepper or African
pepper is an evergreen plant, 20 m height, the peppery fruits are in carpels, forming dense cluster,
twisted bean-like pods, dark brown, cylindrical, 1.5-6 cm long and 4-7 mm thick. It has short roots and
smooth grey bark and usually scented when fresh. The leaves are broad (5-15 cm long and 2.5-6 cm
wide), while flowers are greenish-white, usually in clusters of about 3-5 (Iwu, 2014; Orwa et al. 2009;
Burkill, 1985).
1.5.2 Distribution
Xylopia aethiopica is an African indigenous spices located in savannah rain forest and widely
distributed in West, Central and Southern parts of Africa (Iwu, 2014).
1.5.3 Phytochemistry
Active principles of X. aethiopica fruit include xylopic acid (a kaurene diterpene) (Biney et al.
2014; Woode et al. 2012), kaurenoic, 15-oxo-kaurenoic acid, and kauran-16-α-ol (Iwu, 2014; Ekong
and Ogan, 1968). The oils derived from the fruit were reported to contain α- and β-pipenes, careen,
cymene, α-phellandrene, limonene, terpinoline, cineole, bisabolone, linolool, terpinen-4-ol, terpineal,
cuminyl alcohol, and cumminicaldyhyde (Harrigan et al. 1994).
1.5.4 Ethnobotanical uses
The fruit is popularly used as condiment in many local dishes by different traditions in Africa
and Asia (Kingsley, 2012). In addition, X. aethiopica fruit is widely used locally in treatment of various
B A

26
ailments and also as an excipient to many other medicines as well (Freiesleben et al. 2015; Fall et al.
2003). In Nigerian, Guinean, Togolese and Senegalese traditional medicines, the fruit decoction is
widely used in the treatment of diabetes (Soladoye et al. 2012; Diallo et al. 2012; Karou et al. 2011;
Diéye et al. 2008). The fruit and/or stembark are also used as pain reliever and in the treatment of
stomach aches, dysentery, ulceration, skin infections and coughs (Ezeikwesili et al. 2010). The seed is
employed by women after childbirth to promote healing, lactation and/or promote fertility (Iwu, 2014).
The leaf or root decoction is used as tonic and in the treatment of constipation (Ndukwu and Ben-
Nwadibia, 2005).
1.5.5 Pharmacological importance
The X. aethiopica fruit methanolic extract (20 µg/mL) was reported to inhibit more than 50%
of the proliferation of the tested cancer cells; human pancreatic cancer cell line MiaPaCa-2, leukemia
CCRF-CEM cells and their multidrug resistant (MDR) subline CEM/ADR5000, and the normal human
umbilical vein endothelial cells (HUVECs) (Kuete et al. 2013; 2011). Additionally, Choumessi et al.
(2012) have reported that the fruit ethanolic extract (100 mg/mL) demonstrated anti-proliferative
activity against HCT116 colon cancer cells, U937 and KG1a leukemia cells.
In another study, fruit aqueous extract (100 mg/mL) exhibited moderate anti-microbial activity
against Escherichia coli and Staphylococcus aureus (Esekhiagbe et al. 2009). Tekwu et al. (2012) have
reported that the fruit methanolic extract (0.002-2 mg/mL) showed anti-mycobacterial activity against
Mycobacterium tuberculosis strains (H37Rv (ATCC27294) and H37Ra (ATCC25177)).
Furthermore, various extracts from X. aethiopica fruit have shown good anti-oxidative action
in vitro in a number of previously reported studies. The fruit aqueous and methanolic extracts (0-3
mg/mL) have demonstrated excellent radical scavenging ability (Adefegha and Oboh, 2012a,b; 2011;
George and Osiama, 2011; Etoundi et al. 2010; Odukoya et al. 2005). In addition, dietary inclusion of
X. aethiopica fruit (2% and 4%) for 2 weeks improved the in vivo anti-oxidant status of normal rats
(Adefegha and Oboh, 2012b). Moreover, fruit aqueous extract (0-3 mg/mL) demonstrated moderate
inhibition of the carbohydrate hydrolyzing enzymes (IC50 values: α-glucosidase: 2.57 mg/mL; α-
amylase: 2.81 mg/mL) (Adefegha and Oboh, 2012a; Etoundi et al. 2010). In another study, fruit
ethanolic extract (30-300 mg/kg bw/day) showed anti-anaphylactic and anti-inflammatory actions in
mice after 7 days treatment period (Obiri and Osafo, 2013). Furthermore, oral treatment of fruit
ethanolic extract (100-400 mg/kg bw) for 2 weeks did not cause any toxicological effect in the treated
animals (Johnkennedy et al. 2011; Taiwo et al. 2009).
More recently, Etoundi et al. (2013) have reported that the blood glucose tolerance ability after
2 hour post-administration period was improved in high-sucrose fed rats treated with 400 mg/kg bw of
fruit ethanolic extract. Additionally, no significant anti-hyperlipidemic action was observed after 2-day
post-treatment period of the extract in hyperlipidemic rats (Etoundi et al. 2013). Conversely, in another
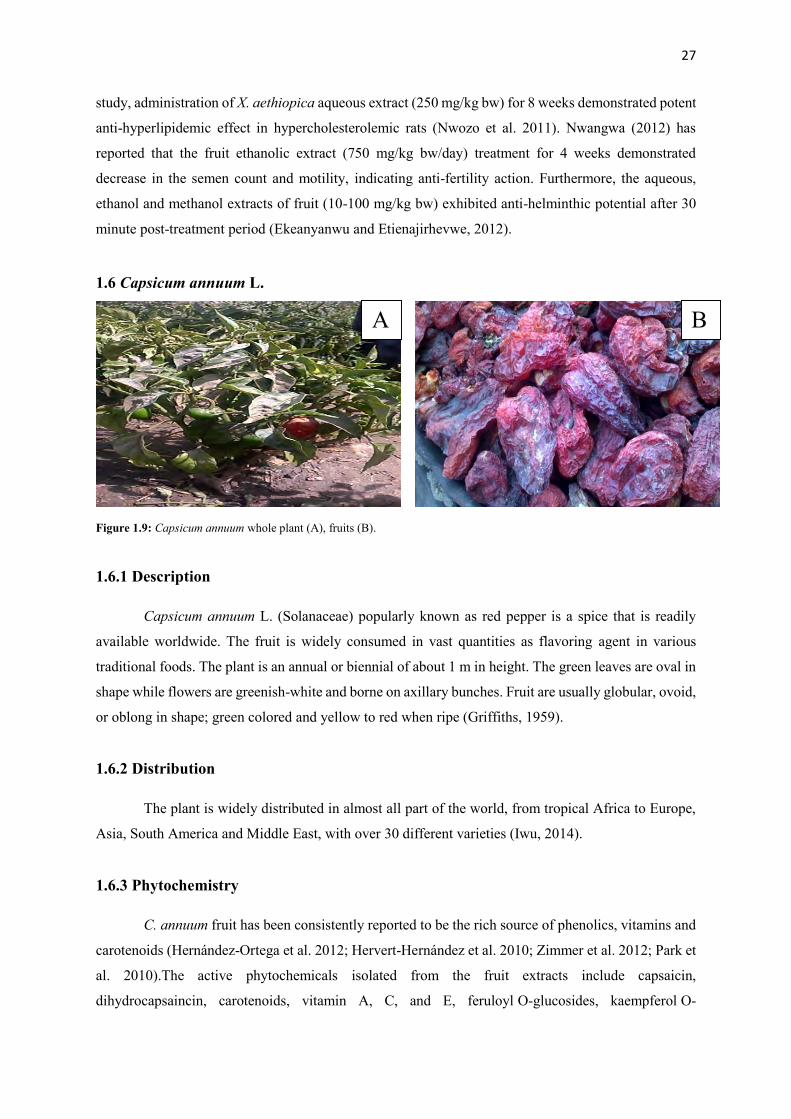
27
study, administration of X. aethiopica aqueous extract (250 mg/kg bw) for 8 weeks demonstrated potent
anti-hyperlipidemic effect in hypercholesterolemic rats (Nwozo et al. 2011). Nwangwa (2012) has
reported that the fruit ethanolic extract (750 mg/kg bw/day) treatment for 4 weeks demonstrated
decrease in the semen count and motility, indicating anti-fertility action. Furthermore, the aqueous,
ethanol and methanol extracts of fruit (10-100 mg/kg bw) exhibited anti-helminthic potential after 30
minute post-treatment period (Ekeanyanwu and Etienajirhevwe, 2012).
1.6 Capsicum annuum L.
Figure 1.9: Capsicum annuum whole plant (A), fruits (B).
1.6.1 Description
Capsicum annuum L. (Solanaceae) popularly known as red pepper is a spice that is readily
available worldwide. The fruit is widely consumed in vast quantities as flavoring agent in various
traditional foods. The plant is an annual or biennial of about 1 m in height. The green leaves are oval in
shape while flowers are greenish-white and borne on axillary bunches. Fruit are usually globular, ovoid,
or oblong in shape; green colored and yellow to red when ripe (Griffiths, 1959).
1.6.2 Distribution
The plant is widely distributed in almost all part of the world, from tropical Africa to Europe,
Asia, South America and Middle East, with over 30 different varieties (Iwu, 2014).
1.6.3 Phytochemistry
C. annuum fruit has been consistently reported to be the rich source of phenolics, vitamins and
carotenoids (Hernández-Ortega et al. 2012; Hervert-Hernández et al. 2010; Zimmer et al. 2012; Park et
al. 2010).The active phytochemicals isolated from the fruit extracts include capsaicin,
dihydrocapsaincin, carotenoids, vitamin A, C, and E, feruloyl O-glucosides, kaempferol O-
A B
28
pentosyldihexosides, dihydroxyflavone O-hexoses and quercetin-3-O-L-rhamnoside (Santos et al.
2012; Hervert-Hernández et al. 2010; Materska and Perucka, 2005). In another study, capsiate,
dihydrocapsiate and vanillyl alcohol were also isolated from C. annuum fruit (Kobata et al. 1998).
Furthermore, some amide derivative compounds were also isolated from the stem of C. annuum (Chen
et al. 2011). These compounds include N-p-trans-coumaroyl-tyramine, N-trans-caffeoyltyramine, β-
sitostenone, ferulic acid, hydroferulic acid, 5-hydroxy-3,4-dimethoxycinnamic acid, vatic acid, vanillic
acid, isovanillic acid, syringic acid, (+)-syringaresinol, pheophorbide, 7'-(4'-hydroxyphenyl)-N-[(4-
methoxyphenyl) ethyl] propenamide, 7'-(3',4'-dihydroxyphenyl)-N-[(4-methoxyphenyl) ethyl]
propenamide (Chen et al. 2011).
1.6.4 Ethnobotanical uses
The fruit is locally used as a blood tonic, stimulant and in the treatment of nerve weakness due
to diabetes in Africa and Asia (Iwu, 2014; Jayakumar et al. 2010). In most part of Africa, the fruit is
used in the treatment of skin infections and other bacterial infections (Iwu, 2014). Additionally, the fruit
and seed are also used in the remedy of cold, fever, dysentery, malaria and gonorrhea (Ndukwu and
Ben-Nwadibia, 2005).
1.6.5 Pharmacological importance
The radical scavenging ability of C. annuum fruit has been well documented (Tundis et al.
2013; Tundis et al. 2012; Chen et al. 2012; Ghasemnezhad et al. 2011; Kim et al. 2011; Kumar et al.
2010; Deepa et al. 2007; Kwon et al. 2007; Perucka and Materska, 2001). In these studies, the aqueous
and ethanolic extracts (0.01-1 mg/mL) have demonstrated excellent electron quenching ability (IC50:
0.1-0.5 mg/mL). Kim et al. (2011) have also reported the potent anti-oxidative actions (DPPH: IC50:
0.2-3 mg/mL; ABTS: 0.05-0.3 mg/mL) of C. annuum fruit and leaf ethanolic extracts (0.01 mg/mL) in
vitro. Additionally, the fruit aqueous extract (3.3-16.7 mg/mL) was reported to prevent Fe2+-induced
lipid peroxidation in rat’s brain homogenate in vitro (Oboh et al. 2007).
In some other studies, C. annuum fruit ethanolic extract (0.005-1 mg/mL) was reported to
inhibit the activities of α-amylase (IC50: 0.05-0.5 mg/mL) and α-glucosidase (IC50: 0.1-1 mg/mL) in
vitro in addition to its anti-oxidative actions (Tundis et al. 2013; Kwon et al. 2007). Capsaicin and
dihydrocapsaicin (0.005-1 mg/mL) have also demonstrated α-amylase (IC50: capsaicin: 0.083 mg/mL;
dihydrocapsaicin: 0.092 mg/mL) and α-glucosidase (IC50: capsaicin > 0.5 mg/mL; dihydrocapsaicin >
0.5 mg/mL) inhibitory action (Tundis et al. 2013). Moreover, the volatile oil (0.3-7.8%) derived from
C. annuum fruit has shown anti-parasitic effect against Anopheles gambiae. (Dadji et al. 2011). In
another study, fruit ethanolic extract (0.004-0.3%) was also exhibited potent larvicidal efficacy against
Anopheles stephensi and Culex quinquefasciatus (Madhumathy et al. 2007).

29
Furthermore, fruit ethanolic extract (0.1 mg/mL) showed anti-nociceptive and anti-
inflammatory actions in mice (Hernández-Ortega et al. 2012). Cichewicz and Thorpe (1996) have
earlier reported that the fruit juice extract (100 µL) showed anti-microbial action against Bacillus spp.,
Clostridium spp., Enterobacter aerogenes, Salmonella typhimurium and Staphylococcus aureus. In
another study, the fruit ethyl acetate extracts (5-40 mg/mL) and the capsaicinoids (2.5-10 µg/mL)
demonstrated excellent anti-microbial activity against Streptococcus mutans (Santos et al. 2012).
Careaga et al. (2003) have also reported that the fruit juice (0.02-5 mL/100g) showed anti-bacterial
activity against Salmonella typhimurium and Pseudomonas aeruginosa inoculated in raw beef meat. In
a preliminary study, Monsereenusorn (1980) has reported that the intraperitoneal injection of fruit
extract (500-700 mg/kg bw) showed a significant hypoglycemic action after 30 minutes post-treatment
period in normal rats.
Conversely, Babu and Srinivasan (1997) have reported that diabetic animals maintained on
capsaicin (0.015%) in diet, for 8 weeks have shown no any significant reduction on blood glucose levels.
In another study, consumption dietary C. annuum (0.9 g/day) for 2 days increases energy expenditure,
decreases appetite and food intake in human subjects (Westerterp-Plantenga et al. 2004). Similarly, C.
annuum and its pungent principle capsaicin has been reported to play a beneficial role on lipid
metabolism in a number of studies reported previously. Capsaicin (0.015%) included in diet for 8 weeks
was reported to ameliorate dyslipidemia in diabetic and high-fat diet-fed animals (Kempaiah and
Srinivasan, 2006; Babu and Srinivasan, 1997). Additionally, oral treatment of capsaicin (50 mg/kg bw)
or whole fruit extract (500 mg/kg bw) for 2 months demonstrated hypolipidemic actions in normal rats
(Monsereenusorn, 1983).
1.7 Statement of the problem The epidemic of DM is among the major cause of morbidity and mortality worldwide and has
been on the rise particularly in developing countries such as Africa. It has been estimated that about
80% of diabetic patients live in low- and middle- income countries (ADA, 2015). In Africa, more than
22 million people have diabetes, accounting for about 5.1% of adults and it is responsible for about
8.6% deaths in the region (IDF, 2014). Furthermore, the high cost and unwanted adverse effect of most
of the modern synthetic drugs for the treatment of DM is also an issue of concern. Similarly, treatment
and control of DM is still a major challenge to medical community and requires safer and cheaper
alternative to effectively curb the problem of this disease. However, the use of natural products for the
treatment of DM is getting more popular due to the lower side effects, availability and cost effectiveness
compared to conventional synthetic drugs. However, the number of plants with potential anti-diabetic
actions is very limited and many of their anti-diabetic effects have not yet been scientifically validated.
Additionally, mechanisms of actions as well as active principles from these natural products are still
unknown.
30
1.8 Justification and significance of the research work With rapid advancement in medicine, novel treatment options with fewer side effects have
become feasible for the long-term control of diabetic complications. Recent scientific investigations
have confirmed the efficacy of many plant-derived formulations (extracts and fractions) and their
isolated bioactive compounds in the treatment and control of diabetes (Hung et al. 2012; Ponnusamy et
al. 2010). The recommendation of the WHO committee on DM encouraged research on hypoglycemic
agents from natural products such as plant (WHO, 1980). Therefore, there is a need to investigate and
establish the anti-diabetic effects of natural products. This will prove and display their anti-diabetic
potentials for the treatment of DM. Subsequently, a chemical lead for the development of newer classes
of drugs that can be used in the treatment of DM could be derived from this research work as well.
Moreover, previous ethnobotanical studies have shown that the fruits and leaves from the selected plants
(Aframomum melegueta, Xylopia aethiopica, and Capsicum annuum) are used locally in the treatment
of diabetes. This is in addition to some preliminary studies that demonstrated the blood glcose lowering
potentials of A. melegueta (Adesokan et al., 2010), X. aethiopica (Adefegha and Oboh, 2012a,b;
Etoundi et al. (2013) and C. annuum (Monsereenusorn, 1980). Thus, this study will prove and establish
the detail scientific evidences to support the anti-diabetic potentials of these plants.
1.9 Objective of the study
1.9.1 General Objective This research work is aimed at screening and isolation of some potent anti-diabetic compounds
from some African medicinal plants [Aframomum melegueta K. Schum., Xylopia aethiopica (Dunal.)
A. Rich. and Capsicum annuum L.] by using several in vitro and in vivo models.
1.9.2 Specific Objectives The research work specifically focused on:
(i) Screening the various solvent extracts from different parts of the selected medicinal plants
for in vitro anti-oxidative and anti-diabetic activities using several in vitro models.
(ii) Screening the in vitro anti-oxidant and anti-diabetic activities of various solvent fractions
from the most active extracts from the selected parts of the medicinal plants.
(iii) Preliminary phytochemical studies of the most active extracts and fractions from the
selected natural products using Gas Chromatography-Mass Spectrophotometry (GC-MS)
technique.

31
(iv) Investigating the in vivo anti-diabetic and anti-oxidative effects of the most active fractions
(from the in vitro studies in (ii) above) from the selected natural in an experimentally-
induced type 2 diabetes model of rats.
(v) Based on the results of above in vitro and in vivo studies, isolation and structural elucidation
of possible bioactive components from the most active fractions of the selected medicinal
plant parts by thin layer chromatography (TLC), column chromatography and Nuclear
Magnetic Resonance (NMR) spectroscopy.
(vi) Investigating the α-glucosidase and α-amylase inhibitory effects of the isolated compounds
in vitro.

32
CHAPTER 2
Materials and methods
2.1 Chemicals and reagents
Ascorbic acid, quercetin, hemoglobin (human lyophilized powder), gallic acid, aluminium
chloride, citric acid, sodium citrate, sodium phosphate dibasic (Na2HPO4), sodium phosphate
monobasic (NaH2PO4), dimethyl sulfoxide (DMSO), potassium hydroxide, Streptozotocin (STZ),
metformin, formalin, α-amylase from porcine pancreas, α-glucosidase from Saccharomyces cerevisiae
and 1,1-diphenyl-2-picrylhydrazyl radical (DPPH), xylene, hematoxylin dye, absolute ethanol, hexane,
ethyl acetate, dichloromethane and methanol were purchased from Sigma-Aldrich through Capital Lab
Supplies, New Germany, South Africa. Folin Ciocalteau reagent was purchased from Merck Chemical
Company, South Africa. Gentamycin was purchased from EMD Chemicals, San Diego, CA, USA.
Ultrasensitive rat insulin ELISA kit was purchased from Mercodia, Uppsala, Sweden.
2.2 Equipment
Glucometer (Glucoplus Inc., Saint-Laurent, Quebec, Canada), rotary evaporator (Buchi
Rotavapor II, Buchi, Germany), Whatmann filter paper (No. 1), multiplate reader (MR-96A, Vacutec
Pvt. Ltd., Durban, South Africa), Automated Chemistry Analyzer (Labmax Plenno, Labtest Co. Ltd.,
Lagoa Santa, Brazil), Leica slide scanner (SCN 4000, Leica Biosystems, Wetzlar, Germany), Nuclear
Magnetic Resonance (NMR) spectroscopy (Bruker BioSpin, Rheinstetten, Germany),
spectrophotometer (Shimadzu Corporation, Kyoto, Japan).
2.3 Plant materials
The various parts of Aframomum melegueta (Rosc.) K. Schum. and Xylopia aethiopica (Dunal)
A. Rich. were freshly collected in December, 2012 from Ibadan, Oyo State, Nigeria. Capsicum annuum
L. parts were collected in December, 2012 from Zaria, Kaduna State, Nigeria. They were identified and
authenticated at the herbarium unit of the Biological Science Department, Ahmadu Bello University,
Zaria, Nigeria by Mr. Umar Gallah and a voucher specimen number for each plant was deposited
accordingly [A. melegueta (1511), X. aethiopica (1025) and C. annuum (1755)]. The various plants
samples (fruits, leaves, stems and roots) were immediately washed and shade-dried for two weeks to
constant weights. The dried samples were ground to a fine powder, and then stored individually in
airtight containers for transport to the University of KwaZulu-Natal, Westville campus, Durban, South
Africa for further investigations.

33
2.3.1 Preparation of the plant extracts
Three (3) kilograms of each of the finely powdered plant parts were separately defatted with 10
L of hexane. The defatted material was sequentially extracted with ethyl acetate, ethanol and water by
soaking for 48 hour in 200 mL of the relevant solvent followed by a 2 hour orbital shaking at 200 rpm.
After filtration through Whatmann filter paper (No. 1), respective solvents were evaporated under
vacuum, using a rotary evaporator (Buchi Rotavapor II, Buchi, Germany) at 40°C under reduced
pressure to obtain the different solvent extracts with the exception of the aqueous extracts which were
dried on a water bath at 45°C. The extracts in each case were weighed, transferred to 50 mL falcon
tubes and stored in a refrigerator at 4-8°C until further analysis.
2.3.2 Fractionation of the crude extracts
Forty (40) grams of the crude extracts of the selected plant parts were dissolved in 500 mL of
distilled water: methanol (9:1) and successively partitioned with hexane (2 x 500 mL), dichloromethane
(2 x 500 mL), ethyl acetate (2 x 500 mL) and acetone (2 x 500 mL). The fractions were evaporated to
dryness in vacuum at 40°C under reduced pressure by using afore-mentioned rotary evaporator. The
dried fractions were transferred to tubes and stored at 4°C until further analysis.
2.4 In vitro studies
2.4.1 Estimation of total polyphenol content
The total polyphenol content of each extracts and/or fraction was determined (as gallic acid
equivalent) according to the method described by McDonald et al. (2001) with slight modifications.
Briefly, a 200 µL of the extract (240 µg/mL) was incubated with 1 mL of 10 times diluted Folin
Ciocalteau reagent and 800 µL of 0.7 M Na2CO3 for 30 minutes at room temperature. The absorbance
values were then determined at 765 nm in a Shimadzu UV mini 1240 spectrophotometer (Shimadzu
Corporation, Kyoto, Japan). All measurements were done in triplicate.
Quantification was done on the basis of a standard curve of gallic acid. Results were expressed
mg/g (GAE) and calculated using following formula,
Total polyphenol content (mg/g GAE) = [GAE (mg/mL) × V (mL)]/W (g)
Where GAE (mg/mL) = (y-c)/m
GAE: Gallic acid equivalent (mg/mL), V: Total volume of sample (mL), W: Sample weight
(g), y: absorbance of the sample, c: intercept at the y-axis, m: slope of the standard curve

34
2.4.2 Determination of total flavonoid content
The total flavonoid content of the plant extracts and/or fractions was determined using a method
reported by Chang et al. (2002) with slight modification. Briefly, a 500 µL (240 µg/mL) of each sample
was mixed with 500 µL methanol, 50 µL of 10% AlCl3, 50 µL of 1 mol/L potassium acetate and 1.4
mL water, and allowed to incubate at room temperature for 30 minutes. The absorbance of the reaction
mixture was subsequently measured at 415 nm using the spectrophotometer mentioned above. The total
flavonoid content was calculated as quercetin equivalent (QE) in mg per g of dry extract.
Quantification was done on the basis of a standard curve of quercetin. Results were expressed
mg/g (QE) and calculated using following formula,
Total polyphenol content (mg/g QE) = [QE (mg/mL) × V (mL)]/W (g)
Where QE (mg/mL) = (y-c)/m
QE: quercetin equivalent (mg/mL), V: Total volume of sample (mL), W: Sample weight (g), y:
absorbance of the sample, c: intercept at the y-axis, m: slope of the standard curve.
2.4.3 DPPH radical scavenging activity
The total free radical scavenging activity of the extracts and/or fractions was determined and
compared to that of ascorbic and gallic acids by using a slightly modified method described by Tuba
and Gulcin (2008). An aliquot of 500 µL of a 0.3 mM solution of 1,1-diphenyl-2-picryl-hydrazyl
(DPPH) in methanol was added to 1 mL of the extracts and/or fractions at different concentrations (30,
60, 120 and 240 µg/mL). These solutions were mixed and incubated in the dark for 30 minutes at room
temperature. The absorbance was measured at 517 nm against blank samples lacking the free radical
scavengers.
The results of the DPPH were expressed as a percentage of the control (blank) according to the
following formula:
% Inhibition = [(Abs of control-Abs of sample)/Abs of control] x 100
2.4.4 Ferric (Fe3+) reducing anti-oxidant power assay
The ferric reducing anti-oxidant power method of Oyaizu (1986) was used with slight
modifications to measure the reducing capacity of the samples. To perform this assay, 1 mL of each
extract and/or fractions (30, 60, 120 and 240 µg/mL) were incubated with 1 mL of 0.2 M sodium
phosphate buffer (pH 6.6) and 1% potassium ferricyanide at 50°C for 30 minutes. After 30 minutes
incubation, the reaction mixtures were acidified with 1 mL of 10% trichloroacetic acid. Thereafter, 1
mL of the acidified sample of this solution was mixed with 1 mL of distilled water and 200 μL of FeCl3
(0.1%). The absorbance of the resulting solution was measured at 700 nm in a spectrophotometer.

35
Increased absorbance of the reaction mixture indicated the greater reductive capability of the extracts
(Gulcin et al. 2004).
The results of the ferric reducing anti-oxidant power assay was expressed as a gallic acid
equivalent according to the following formula:
% Inhibition = (Abs of sample/Abs of Gallic acid) x 100
2.4.5 Inhibition of hemoglobin glycation
Inhibition of non-enzymatic glycosylation of hemoglobin by various extracts and/or fractions
was measured by the modified method of Pal and Dutta (2006). Glucose (2%), hemoglobin (0.06%)
and gentamycin (0.02%) solutions were prepared in phosphate buffer 0.01 M, pH 7.4. An aliquot of 1
mL of each of the solution above was mixed with 1 mL of extracts with different concentrations (30,
60, 120 and 240 µg/mL) in dimethyl sulfoxide (DMSO). These mixtures were incubated in the dark at
room temperature for 72 hour. The percentage inhibition of glycosylation of hemoglobin was calculated
from the absorbance measured at 520 nm. Gallic acid was used as a standard.
The results of the inhibition of hemoglobin glycation were expressed as a percentage of the
control (blank) according to the following formula:
% Inhibition = [(Abs of control-Abs of sample)/Abs of control] x 100
2.4.6 α-Amylase (E.C. 3.2.1.1) inhibitory effect
The α-amylase inhibitory effect of the extracts and/or fractions was carried out using a modified
method of McCue and Shetty (2004). Briefly, a 250 µL aliquot of extracts, fractions and/or compounds
at different concentrations (30, 60, 120 and 240 µg/mL) was placed in a tube and 250 µL of 0.02 M
sodium phosphate buffer (pH 6.9) containing α-amylase (2.0 U/mL) solution was added. This solution
was pre-incubated at 25°C for 10 minutes, after which 250 µL of 1% starch solution in 0.02 M sodium
phosphate buffer (pH 6.9) was added at a time interval of 10 seconds and then further incubated at 25°C
for 10 minutes. The reaction was terminated after incubation by adding 1 mL of dinitrosalicylic acid
(DNS) reagent. The tube was then boiled for 10 minutes and cooled to room temperature. The reaction
mixture was diluted with 5 mL distilled water and the absorbance was measured at 540 nm using a
Shimadzu UV mini 1240 spectrophotometer. A control was prepared using the same procedure,
replacing the extract with distilled water.
The results of the α-amylase assay were expressed as a percentage of the control (blank)
according to the following formula:
% Inhibition = [(Abs of control-Abs of sample)/Abs of control] x 100
36
2.4.7 α-Glucosidase (E.C. 3.2.1.20) inhibitory effect
The inhibitory effect of the plant extracts and/or fractions on α-glucosidase activity was
determined according to the method described by Kim et al. (2005) using α-glucosidase from
Saccharomyces cerevisiae. The substrate solution 5.0 mM p-nitrophenylglucopyranoside (pNPG) was
prepared in 20 mM phosphate buffer, pH 6.9. An aliquot of 500 µL of α-glucosidase (1.0 U/mL) was
then pre-incubated with 250 µL of the different concentrations of the extracts, fractions and/or
compounds (30, 60, 120 and 240 µg/mL) for 10 minutes. Thereafter, a 250 µL of 5.0 mM pNPG was
dissolved in 20 mM phosphate buffer (pH 6.9) as a substrate to start the reaction. The reaction mixture
was incubated at 37°C for 30 minutes. The α-glucosidase activity was determined by measuring the
yellow coloured p-nitrophenol released from pNPG at 405 nm.
The results of the α-glucosidase assay were expressed as a percentage of the control (blank)
according to the following formula:
% Inhibition = [(Abs of control-Abs of sample)/Abs of control] x 100
2.4.8 Calculation of IC50 values
Concentrations of extracts, fractions or compounds resulting in 50% inhibition of radical or
enzyme activities (IC50) were calculated from the plot of percentage inhibition against log(concentration
of the samples).
IC50= 10x
Where x (mg/mL) = (y-c)/m
y: 50%, c: intercept at the y-axis, m: slope of the graph of log(concentration of sample used)
against the percentage inhibitions.
2.4.9 Mechanism of α-glucosidase and α-amylase inhibitions
The most active fractions or compounds were subjected to kinetic experiments to determine the
type of inhibition exerted on α-glucosidase and α-amylase. The experiment was conducted according
to the protocols as described above at a constant concentration of the fractions or compounds (30
µg/mL) with a variable concentration of substrate. For the α-glucosidase inhibition assay, 0.313-5.0
mmol/L of pNPG was used and 0.063-1.0% of starch was used for the α-amylase inhibition assay. The
initial rates of reactions were determined from calibration curves constructed using varying
concentrations of p-nitrophenol (0.313-5.0 mmol/L) and maltose (0.063-1.0%) for the α-glucosidase
and α-amylase inhibition assays, respectively. The initial velocity data obtained were used to construct
Lineweaver-Burke’s plot to determine the KM (Michaelis constant) and vmax (maximum velocity) of the
enzyme as well as the Ki (inhibition binding constant as a measure of affinity of the inhibitor to the
enzyme) and the type of inhibition for both enzymes.

37
2.4.10 Gas Chromatography-Mass Spectroscopic (GC-MS) analysis
Based on the results of in vitro anti-oxidative and anti-diabetic studies, the most active extracts
and/or fractions were subjected to GC-MS analysis. The GC-MS analysis was conducted with an
Agilent technology 6890 GC coupled with an Agilent 5973 Mass Selective Detector and driven by
Agilent Chemstation software. Compounds were identified by direct comparison of the retention times
and mass spectral data with those in the National Institute of Standards and Technology (NIST) library.
2.5 In vivo studies
2.5.1 Experimental animals
Six-week-old male Sprague-Dawley (SD) rats were obtained from the Biomedical Resource
Unit (BRU) located at the University of KwaZulu-Natal (Westville Campus), South Africa with initial
mean body weight (bw) 163.25 ± 13.67 g. Animals were housed as two in one medium size poly-
carbonated cage in a temperature and humidity controlled room with a 12 hour light-dark cycle. A
standard rat pellet diet was supplied ad libitum to all animals during the entire experimental period.
Animals were maintained according to the rules and regulations of the Experimental Animal Research
Ethics Committee of the University of KwaZulu-Natal, South Africa (Ethical approval number:
018/14/Animal).
2.5.2 Animal grouping
Animals were randomly divided into twelve groups of 5 (non-diabetic groups) or 8 (diabetic
groups) animals namely; NC: Normal Control, DBC: Diabetic Control, DAML: Diabetic + low dose
(150 mg/kg bw) of AMEF, DAMH: Diabetic + high dose (300 mg/kg bw) of AMEF, DCAL: Diabetic
+ low dose (150 mg/kg bw) of CAAF, DCAH: Diabetic + high dose (300 mg/kg bw) of CAAF, DXAL:
Diabetic + low dose (150 mg/kg bw) of XAAF, DXAH: Diabetic + high dose (300 mg/kg bw) of XAAF,
DMF: Diabetic + metformin (300 mg/kg bw), NAMH: Non-diabetic + high dose (300 mg/kg bw) of
AMEF. NCAH: Non-diabetic + high dose (300 mg/kg bw) of CAAF, NXAH: Non-diabetic + high dose
(300 mg/kg bw) of XAAF. The animals were allowed to acclimatize for two weeks before starting the
experiment. The animal grouping was summarized in Figure 2.1 as well.

38
Figure 2.1: Animal grouping in vivo study.
Key: NC: Normal control; DBC: Diabetic control; DMF: Diabetic treated with metformin AMEF: A. melegueta ethyl acetate
fraction; DAML & DAMH: Diabetic treated with lower & higher dose of AMEF; NAMH: Normal treated with higher dose of
AMEF; CAAF: C. annuum acetone fraction; DCAL & DCAH: Diabetic treated with lower & higher dose of CAAF; NCAH:
Normal treated with higher dose of CAAF; XAAF: X. aethiopica acetone fraction; DXAL & DXAH: Diabetic treated with
lower & higher dose of XAAF; NXAH: Normal treated with higher dose of XAAF; SD: Sprague-Dawley.
2.5.3 Induction of Type 2 diabetes (T2D)
In order to induce the two major pathogeneses of T2D, insulin resistance and partial pancreatic
β-cell dysfunction, during the first two weeks of the experiment, the animals in the DBC, DAML,
DAMH, DCAL, DCAH, DXAL, DXAH and DMF groups were supplied with a 10% fructose solution
ad libitum for the induction of insulin resistance when the animals in the NC, NAMH, NCAH and
NXAH groups were supplied with normal drinking water. After this period, a low dose of STZ (40
mg/kg bw) dissolved in citrate buffer (pH 4.5) were intraperitoneally injected to the animals in the DBC,
DAML, DAMH, DCAL, DCAH, DXAL, DXAH and DMF groups to induce partial pancreatic β-cell
dysfunction, whereas the animals in the NC and NAMH, NCAH and NXAH groups were injected with
a similar volume of vehicle buffer only (Wilson and Islam, 2012). One week after the STZ injection,
the non-fasting blood glucose (NFBG) of all animals were measured in the blood collected from the tail
vein by using a portable glucometer (Glucoplus Inc., Saint-Laurent, Quebec, Canada). Animals with a
NFBG level ≥ 200 mg/dL were considered as diabetic (Davidson et al. 2011) while animals with a
NFBG level < 200 mg/dL were excluded from the study.

39
2.5.4 Intervention period
After the confirmation of diabetes, a respective dose of the various fractions were orally
administered once daily for four weeks using a gastric gavage needle to the animals in DAML, DAMH,
DCAL, DCAH, DXAL, DXAH, NAMH, NCAH and NXAH groups while the animals in controls (NC
and DBC) and DMF groups were treated with similar volume of the vehicle and metformin,
respectively. Throughout the experimental period, feed and fluid intake were measured every morning
by subtracting the remaining amount of feed and fluid respectively from the amount given on the
previous morning. Moreover, the weekly bw and NFBG levels were measured in all animal groups
during the entire intervention period.
2.5.5 Oral glucose tolerance test (OGTT)
To determine the glucose tolerance ability of each animal, the OGTT was performed in the last
week of the four-week intervention period. To perform this test, a single dose of glucose solution (2
g/kg bw) was orally administered to each animal and the subsequent levels of blood glucose were
measured at 0 (just before glucose ingestion), 30, 60, 90 and 120 minutes after the ingestion of glucose.
2.5.6 Collection and preparation of blood and organs
At the end of the experimental period, animals were euthanized with halothane anesthesia and
blood and organ samples were collected. The whole blood of each animal was collected via cardiac
puncture and immediately preserved in a refrigerator until further processing. The blood samples were
centrifuged at 3000 rpm for 15 minutes and serum from each blood sample was separated and preserved
at -30°C for further analysis. The liver, kidney, heart and pancreas were collected from each animal,
washed with normal saline, wiped with filter paper, weighed and preserved at -30°C until subsequent
analysis. A small piece of pancreatic tissue from each animal was cut and placed in a 10% neutral
buffered formalin solution and preserved at room temperature for histopathological study. The neutral
buffered formalin of each pancreatic tissue sample was replaced weekly during the entire preservation
period.
For the organs, about 0.5 g each organ (liver, pancreas, heart and kidney) was homogenized in
4 mL of homogenization buffer (50 mM sodium phosphate buffer with triton X-100, pH 7.5) using a
portable tissue homogenizer. Thereafter, the mixtures were transferred to micro tubes and spinned for
15 minutes at 15000 rpm in a microcentrifuge at 4°C. The supernatants were then collected in other
micro tubes and stored at -20ºC for the analysis of in vivo anti-oxidative parameters.
40
2.5.7 Analytical methods
The serum insulin concentrations were measured by an enzyme-linked immunosorbent assay
(ELISA) method using an ultrasensitive rat insulin ELISA kit (Mercodia, Uppsala, Sweden) in a
multiplate reader (MR-96A, Vacutec Pvt. Ltd., Durban, South Africa). The serum lipid profile,
fructosamine, urea, uric acid, total protein, lactate dehydrogenase (LDH), creatine kinase (CK-MB) and
creatinine concentrations as well as liver function enzymes; aspartate and alanine aminotransferases
(AST and ALT) and alkaline phosphatase (ALP) were measured using an Automated Chemistry
Analyzer (Labmax Plenno, Labtest Co. Ltd., Lagoa Santa, Brazil) with commercial assay kits from the
same company. Homeostatic model assessment (HOMA-IR and HOMA-β) scores were calculated at
the end of the intervention according to the following formula:
HOMA-IR = [(Fasting serum insulin in U/l x Fasting blood glucose in mmol/L) / 22.5]
HOMA-β = (Fasting serum insulin in U/l x 20 / Fasting blood glucose in mmol/L -3.5)
Conversion factor: insulin (1 U/l = 7.174 pmol/L).
LDL-cholesterol was calculated according to Friedewald et al. (1972) equation as shown below:
LDL-Cholesterol (mg/dL) = TC- (HDL+ (TG/5)
Where, TG/5 is equivalent to the concentration of VLDL-cholesterol.
Atherogenic index (AI) was calculated according to the method described by Liu et al. (1999) and
expressed as:
AI = (TC - HDL-cholesterol)/HDL-cholesterol.
Coronary artery risk index (CRI) was also calculated using the following formula (Boers et al., 2003).
Coronary artery risk index (CRI): TC / HDL-cholesterol
Liver glycogen concentrations were measured by phenol-sulfuric acid method as described by Lo et al.
(1970).
2.5.8 Histopathological examination of pancreatic tissue
A standard laboratory protocol for paraffin embedding was used to treat the formalin preserved
pancreatic tissues. Tissue sections were cut into a size of 4 mm before fixing on the slides. Then, the
slides were deparaffinized in p-xylene and rehydrated in ethanol gradient (100, 80, 70 and 50%) and
rinsed with water. Slides were stained in hematoxylin for 5 minutes and rinsed with water, and were
41
counter stained in eosin, mounted in DPX, cover-slipped and viewed with Leica slide scanner (SCN
4000, Leica Biosystems, Wetzlar, Germany).
2.5.9 Determination of reduced glutathione (GSH)
The reduced glutathione levels were determined using the procedure described by Ellman
(1959) with slight modifications. A 0.5 mL of the serum or tissue homogenate was added to 0.5 ml of
10% TCA and centrifuged at 5000 rpm for 10 minutes. Thereafter, 0.5 mL of the supernatant was mixed
with 0.5 mL of Ellman’s reagent (19.80 mg of DTNB dissolved in 100 mL of 0.1% NaNO3) and 3 mL
of phosphate buffer (200 mM, pH 8.0). The mixture was incubated for 30 minutes at room temperature
and the absorbance was measured at 412 nm. The concentration of the reduced glutathione in the
samples was calculated from a standard glutathione curve.
2.5.10 Determination of thiobarbituric acid reactive substance (TBARS) concentration as
malondialdehyde (MDA) equivalent
Thiobarbituric acid reactive substances, expressed as MDA equivalent, were measured to
determine the extent of lipid peroxidation using the protocol described by Fraga et al. (1988). A 200 μL
of the sample or MDA standards were thoroughly mixed with 200 μL of 8.1% sodium dodesylsulphate
(SDS) solution, 750 μL of 20% acetic acid, 2 mL of 0.25% TBA and 850 μL of distilled water.
Subsequently, the resulting mixture was heated in a water bath at 95°C for 1 hour and allowed to cool
to room temperature. The absorbance of the resulting solution was then read at 532 nm and the
concentration of TBARS in the samples was calculated from the MDA standard curve.
2.5.11 Determination of catalase activity
This assay was carried out as described by Aebi (1984). A 340 μL of 50 mM sodium phosphate
buffer (pH 7.0) was mixed with 150 μL of 2 M H2O2. Thereafter, a 10 μL of the sample was added and
the decrease in absorbance at 240 nm was monitored for 3 min at 1 minute interval.
Activity (µmol/min/µg protein)= [(Abs1-Abs2)/ε] x 0.5/µmol/min/µg protein. Where ε=
0.00394 mM-1cm-1; Abs1= Initial absorbance; Abs2= Final absorbance
2.5.12 Determination of superoxide dismutase (SOD) activity
This assay was carried out by transferring 1 ml of 0.1 mM diethylenetriaminepentaacetic acid
(DETAPAC) and 90 μl of the sample into a quartz cuvette. Then a 90 μl of 1.6 mM 6-hydroxydopamine
(6-HD) was added and the mixture was quickly mixed. Absorbance of the resulting mixture was
recorded at 492 nm for 3 minutes at 1 minute interval (Kakkar et al. 1984).

42
Activity (µmol/min/µg protein)= [(Abs1-Abs2)/ε] x 0.5/µg protein. Where ε= 1.742 mM-1cm-1;
Abs1= Initial absorbance; Abs2= Final absorbance
2.5.13 Determination of glutathione peroxidase (GPx) activity
GPx was assayed by the method of Paglia and Valentine (1967). The reaction mixture contained
0.1 M phosphate buffer (pH 7.0), 1 mM EDTA, 10 mM glutathione, 1 mM NaN3, 1 unit of glutathione
reductase, 1.5 mM NADPH and 0.1 ml of sample. After incubating for 10 minutes at 37ºC, H2O2 was
added to each sample to a final concentration of 1 mM. GPx activity was measured as the rate of
NADPH oxidation at 340 nm in a spectrophotometer for 3 minutes at 1 minute intervals.
Activity (µmol/min/µg protein)= [(Abs1-Abs2)/ε] x 0.5/µg protein. Where ε= 6.22 mM-1cm-1;
Abs1= Initial absorbance; Abs2= Final absorbance
2.5.14 Determination of glutathione reductase (GR)
Glutathione reductase (GR) activity was determined according to the method described by
Foyer and Halliwell (1976). About 800 μL of 25 mM sodium phosphate buffer (pH 7.8) was added to
the sample and blank tubes respectively. This was followed by the addition of 100 μL of each oxidized
glutathione (GSSG) and NADPH in both blank and the sample tubes. A 100 μL of the sample is finally
added into the sample tube. The oxidation of NADPH was recorded by reading the absorbance at 340
nm continuously for 180 seconds.
Activity (µmol/min/µg protein)= [(Abs1-Abs2)/ε] x 0.5/µg protein. Where ε= 6.22 mM-1cm-1;
Abs1= Initial absorbance; Abs2= Final absorbance
2.6 Isolation of the bioactive anti-diabetic compounds from the fractions
All NMR data, 1H, 13C and 2D experiments were recorded on a Bruker Avance III 400 MHz
spectrometer. Samples were acquired with deuterated chloroform (CDCl3). The spectra were referenced
according to the deuteriochloroform signal at δH 7.24 (for 1H NMR spectra) and δC 77.0 (for 13C NMR
spectra) for CDCl3. The HRESIMS spectra were obtained from a Bruker Micro TOF-QII instrument.
A bioassay guided isolation protocol was used to isolate the pure bioactive anti-diabetic
agent(s) from each of the most active fraction (from in vitro studies described in sub chapter 2.4) but
the approach slightly differs from one fraction to another.
43
2.6.1 Isolation of the bioactive compounds from the ethyl acetate fraction of ethanolic
extract of Aframomum melegueta fruit
15.5 g of the ethyl acetate (EtOAc) crude extract of A. melegueta was subjected to column
chromatography on a silica gel column using gradient solvent systems of hex: EtOAc and EtOAc:
MeOH with increments of 10% in each step to afford 84 fractions. After monitoring with TLC, similar
fractions were pooled together to afford seven major fractions (A: 11-13; B: 14-17; C: 20-25; D: 26-32;
E: 33-34; F: 35-47 and G: 48-55). Compound 1 (210.0 mg), was obtained as an oil from fraction C (2.51
g) after further purification on a 2.0 cm diameter column using hex: EtOAc (17:3) as eluent. Fraction
D (990. 3 mg) was further purified on a column (1.5 cm in diameter) by elution with hex: EtOAc (8:2)
to obtain compound 2 (490.0 mg) as an oil. Compound 3 (990.9 mg) was obtained as an oil by
purification of fraction F (4.13 g) on a silica column and eluted with hex: EtOAc (3:2). Fraction E
(100.9 mg) was further purified with a hex: EtOAc (7:3) solvent system, which yielded compound 4
(60.0 mg). All the isolated bioactive compounds demonstrated considerable α-amylase and α-
glucosidase inhibitory actions.
2.6.2 Isolation of the bioactive compound from the acetone fraction of ethanolic extract
of Xylopia aethiopica fruit
A part of the acetone crude extract of X. aethiopica (16 g) was fractionated on a 3.5 cm diameter
column over silica gel (0.040-0.063 mm) using a gradient elution of n-hexane:EtOAc (with 10%
increments of EtOAc) and then MeOH (100%) resulting in 64 fractions. The fractions were pooled
together on the basis of TLC to afford six main fractions (A: 6-8; B: 9-13; C: 14-16; D: 18-22; E: 27-
32 and F: 33-54). Compound 4 (440.7 mg) was purified with hex: EtOAc (7:3) from fraction C (1.55
g) by CC (2 cm column) where 4 eluted again in fractions 16-43. Fraction E (1.92 g) was separated by
CC on a 2.0 cm column using Hex: EtOAc (1:1) which yielded 3 (350.6 mg) again as a brownish oil in
fractions 16-44. Additionally, these compounds showed considerable α-amylase and α-glucosidase
inhibitory actions.
2.6.3 Isolation of the bioactive compound from the acetone fraction of ethanolic extract
of Capsicum annuum fruit
A 15.13 g sample of the acetone crude extract of C. annuum was fractionated by column
chromatography using Hex: EtOAc and then EtOAc: MeOH in a stepwise gradient elution by 10%
increments using a 3.5 cm diameter column. After TLC, the 4 main fractions were combined as follows:
A: 12-18; B: 19-23; C: 24-45 and D: 46-49. Repeated purifications by column chromatography of
44
fraction C (3.03g) yielded a mixture of compounds 5, which could not be separated despite several
attempts and exhibited considerable α-amylase and α-glucosidase inhibitory actions.
2.7 Statistical analysis For all the in vitro studies, data were presented as the mean ± SD of triplicates determination
while in the in vivo studies, the data were presented as the mean ± SD of 5 to 7 animals. Data were
analyzed by using a statistical software package (SPSS for Windows, version 23, IBM Corporation,
NY, USA) using Tukey's-HSD multiple range post-hoc test. Values were considered significantly
different at p < 0.05.
45
CHAPTER 3
3.0 Anti-diabetic and anti-oxidative actions of various extracts and
fractions from different parts of Aframomum melegueta: an in vitro
and in vivo approach
3.1 Anti-oxidative activity, phytochemistry, and inhibition of key
enzymes linked to type 2 diabetes by various parts of Aframomum
melegueta in vitro
Aminu Mohammed,1,3 Neil Anthony Koorbanally2 and Md. Shahidul Islam1*
1Department of Biochemistry, School of Life Sciences and 2Department of Chemistry, School of
Chemistry and Physics, University of KwaZulu-Natal, (Westville Campus), Durban, 4000, South Africa 3Department of Biochemistry, Faculty of Science, Ahmadu Bello University, Zaria-Nigeria
Accepted by the Acta Poloniae Pharmaceutica Drug Research
3.1.1 Abstract Objective: Aframomum melegueta K. Schum. (Zingiberaceae) fruits, leaf or seeds are used for
treatment of different diseases such as diabetes, microbial infections, stomach ache, snakebite and
diarrhea in Africa. This study investigated and compared the anti-oxidative, anti-diabetic effects and
possible compounds present in various solvent extracts of fruit, leaf and stem of A. melegueta.
Methods: Samples were sequentially extracted using solvents of increasing polarity. They were
subjected and investigated for 1,1-diphenyl-2-picryl-hydrazyl (DPPH) radical scavenging activity,
ferric reducing power, inhibition of hemoglobin glycosylation, α-amylase and α-glucosidase activities
as markers of in vitro anti-diabetic effects at various doses (30-240 µg/mL). Possible compounds were
analyzed using Gas Chromatography-Mass Spectrometry (GC-MS) analysis.
Results: Fruit ethanolic (EtOH) extract showed higher total polyphenol (12.52 ± 0.13 mg/gGAE) and
flavonoid (4.92 ± 0.12 mg/gQE) contents compared to other extracts. Similarly for all the in vitro
models used in this study, fruit EtOH extract exhibited lower IC50 values compared to other extracts and
comparable to standards used accordingly (DPPH 0.04 ± 0.01 mg/mL; Ascorbic acid: 0.03 ± 0.02
mg/mL; Gallic acid: 0.05 ± 0.01 mg/mL; Hemoglobin glycosylation: 0.72 ± 0.03 mg/mL; Gallic acid:
0.20 ± 0.01 mg/mL; α-amylase: 0.13 ± 0.01 mg/mL; Acarbose: 0.37 ± 0.03 mg/mL; α-glucosidase: 0.06
46
± 0.01 mg/mL; Acarbose: 0.21 ± 0.01 mg/mL). The GC-MS analysis of the most active extracts (EtOH
fruit and leaf) revealed the presence of some phenolics and other fatty acids derivatives as possible
compounds present.
Conclusion: Fruit EtOH extract exhibited higher anti-oxidative and anti-diabetic effects compared to
other solvent extracts in vitro and thus require further work to fully validate these effects in vivo.
Keywords: Aframomum melegueta, Anti-oxidative, α-amylase, α-glucosidase, Type 2 diabetes
3.1.2 Introduction
Globally, the prevalence of diabetes mellitus (DM) is increasing exponentially. Presently, over
387 million people are diabetic and this figure is likely to rise to 592 million by 2035 (IDF, 2014).
Among the major types of diabetes (type 1 and type 2), type 2 is the most prevalent one and about 90-
95% of diabetics suffer from type 2 diabetes (T2D) (van-Dam et al. 2002). T2D is a heterogeneous
disorder characterized by insulin resistance and partially dysfunctional pancreatic β-cell to properly
secrete insulin in response to hyperglycemia (Hui et al. 2007). The hyperglycemia increases the
generation of reactive oxygen species (ROS) that bind to carbohydrates, proteins, lipids or DNA,
thereby cause cellular and tissue damages, leading to oxidative stress in T2D (Devasagayam et al. 2007;
Rosen et al. 2001). Hence, oxidative stress is considered as the major causal factor of T2D associated
complications. Moreover, anti-oxidants are molecules that can inhibit or terminate the initiation or
propagation of oxidative chain reactions, and can therefore prevent or repair the damage caused by ROS
(Halliwell et al. 1995). However, the increasing risk associated with the use of existing synthetic anti-
oxidants has been an issue of concern. Therefore, focus has been shifted to the use of natural anti-
oxidants in preventing oxidative damage either in disease condition or food preservation.
Furthermore, the major treatment options for T2D include the use oral hypoglycemic drugs in
addition to lifestyle modification. However due to the number of short- and long-term side effects
associated with the use of the synthetic drugs, their popularity are decreasing gradually (Stephen, 2006;
Suba et al. 2004). This has paves way for a search of newer alternative agents such as plant-derived
products to control T2D that are known to pose fewer side effects. Furthermore, the inhibition of
carbohydrate digesting enzymes such as α-glucosidase is now regarded as another alternative approach
to control T2D. This caused a reduction of postprandial hyperglycemia via decrease in the intestinal
glucose absorption (Imam, 2015). Additionally, in a number of recently published data, plant-derived
extracts or fractions have shown potent anti-oxidant and demonstrated abilities to inhibit α-glucosidase
activities (Ibrahim et al. 2014; Kong et al. 2014; Gulati et al. 2012; Adefegha and Oboh, 2012a).
Aframomum melegueta K. Schum. (Zingiberaceae) commonly known as guinea or alligator
pepper is abundantly found in central and western part of Africa (Iwu, 2014). The seeds, leaf or fruit
are consumed as flavoring agent in various traditional foods and are used locally to treat diseases such

47
as diabetes, microbial infections, diarrhea, abdominal pain, snakebite and wounds healing in Nigeria,
Cameroon, Kenya and Gabon (Iwu, 2014; Soladoye et al. 2012; Gbolade, 2009; Akendengue and Louis,
1994; Kokwaro, 1993). Recently, the dieterpenoids isolated from the organic seed extract of A.
melegueta has showed bactericidal activity in vitro against Escherichia coli, Listeria moncyogenes and
Staphylococcus aureus strains (Ngwoke et al. 2014). In another study, Sugita et al. (2013) have reported
that A. melegueta alcohol extract activates brown adipose tissue and increases whole-body energy
expenditure in human subjects which is directly linked to the pathogenesis of T2D. Moreover, in a
number of studies reported earlier, various extracts from A. melegueta seed possessed anti-oxidative as
well as anti-diabetic effects in vitro (Kazeem et al. 2012; Adefegha and Oboh, 2012a; Adefegha and
Oboh, 2011; Etoundi et al. 2010) and in vivo (Onoja et al. 2014; Adesokan et al. 2010) when the anti-
oxidative or anti-diabetic effects of fruit, leaf and stem are still unknown. Additionally, to our
knowledge, no study is available that investigated and compared anti-oxidative and anti-diabetic effects
of A. melegueta fruit, leaf and stem in a single study either in vitro or in vivo.
Therefore, this study was designed to investigate and compare the anti-oxidative and inhibition
of key enzymes linked to T2D by various extracts from fruit, leaf and stem of A. melegueta using several
in vitro models. Additionally, possible bioactive compounds on most active extracts were analyzed
using GC-MS.
3.1.3 Materials and methods
For sample collection, identification and preparation of the extracts, including the detail
experimental protocols, please refer to chapter 2, sub-sections 2.3 and 2.4.
3.1.4 Results
The yields recovered, total polyphenols and flavonoids contents from different solvent extracts
of various parts are presented in Table 3.1. The aqueous leaf extract showed higher yield compared to
other solvent extracts, while stem ethyl acetate (EtOAc) extract was the least recovered. Moreover,
significantly (p < 0.05) higher total polyphenols and flavonoids contents were observed in the fruit
ethanolic (EtOH) extract compared to other solvent extracts of the same or different parts of A.
melegueta (Table 3.1). Interestingly, the contents of leaf EtOH extract were also higher compared to
the EtOAc and aqueous extracts of this part. However, in the stem part, the EtOAc extract showed
significantly (p < 0.05) higher polyphenols with no detectable flavonoid content (Table 3.1).
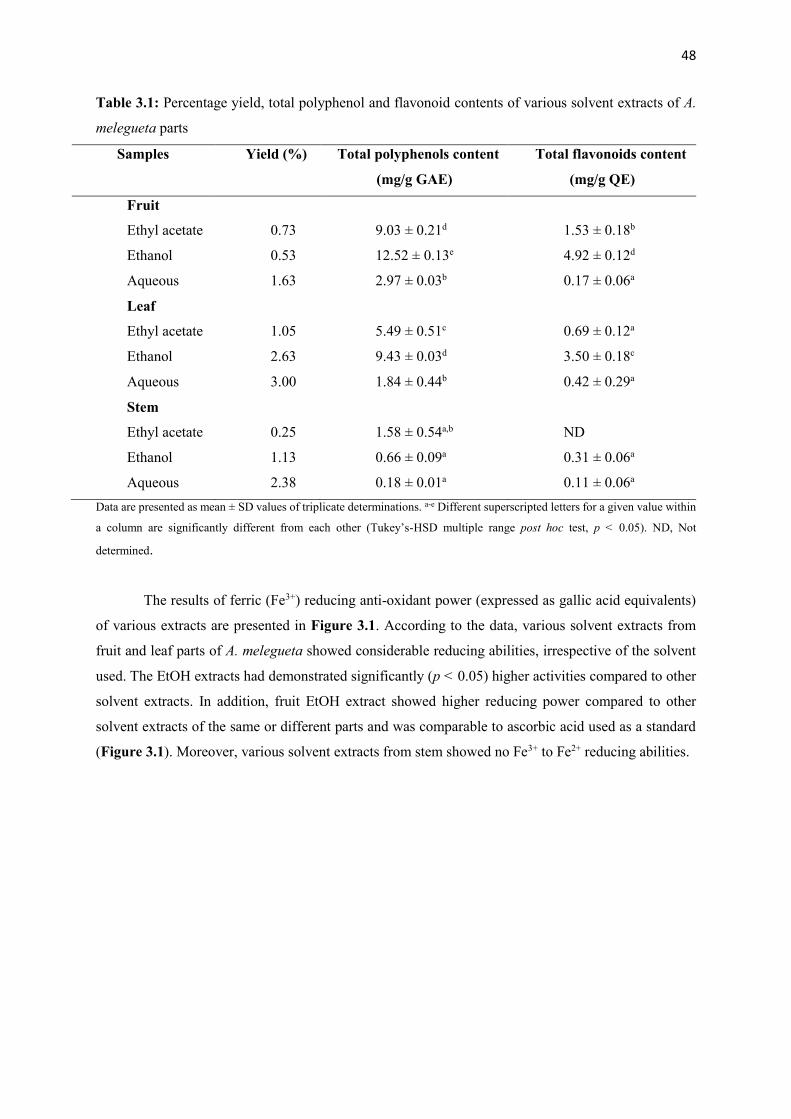
48
Table 3.1: Percentage yield, total polyphenol and flavonoid contents of various solvent extracts of A.
melegueta parts
Samples Yield (%) Total polyphenols content
(mg/g GAE)
Total flavonoids content
(mg/g QE)
Fruit
Ethyl acetate 0.73 9.03 ± 0.21d 1.53 ± 0.18b
Ethanol 0.53 12.52 ± 0.13e 4.92 ± 0.12d
Aqueous 1.63 2.97 ± 0.03b 0.17 ± 0.06a
Leaf
Ethyl acetate 1.05 5.49 ± 0.51c 0.69 ± 0.12a
Ethanol 2.63 9.43 ± 0.03d 3.50 ± 0.18c
Aqueous 3.00 1.84 ± 0.44b 0.42 ± 0.29a
Stem
Ethyl acetate 0.25 1.58 ± 0.54a,b ND
Ethanol 1.13 0.66 ± 0.09a 0.31 ± 0.06a
Aqueous 2.38 0.18 ± 0.01a 0.11 ± 0.06a Data are presented as mean ± SD values of triplicate determinations. a-e Different superscripted letters for a given value within
a column are significantly different from each other (Tukey’s-HSD multiple range post hoc test, p < 0.05). ND, Not
determined.
The results of ferric (Fe3+) reducing anti-oxidant power (expressed as gallic acid equivalents)
of various extracts are presented in Figure 3.1. According to the data, various solvent extracts from
fruit and leaf parts of A. melegueta showed considerable reducing abilities, irrespective of the solvent
used. The EtOH extracts had demonstrated significantly (p < 0.05) higher activities compared to other
solvent extracts. In addition, fruit EtOH extract showed higher reducing power compared to other
solvent extracts of the same or different parts and was comparable to ascorbic acid used as a standard
(Figure 3.1). Moreover, various solvent extracts from stem showed no Fe3+ to Fe2+ reducing abilities.
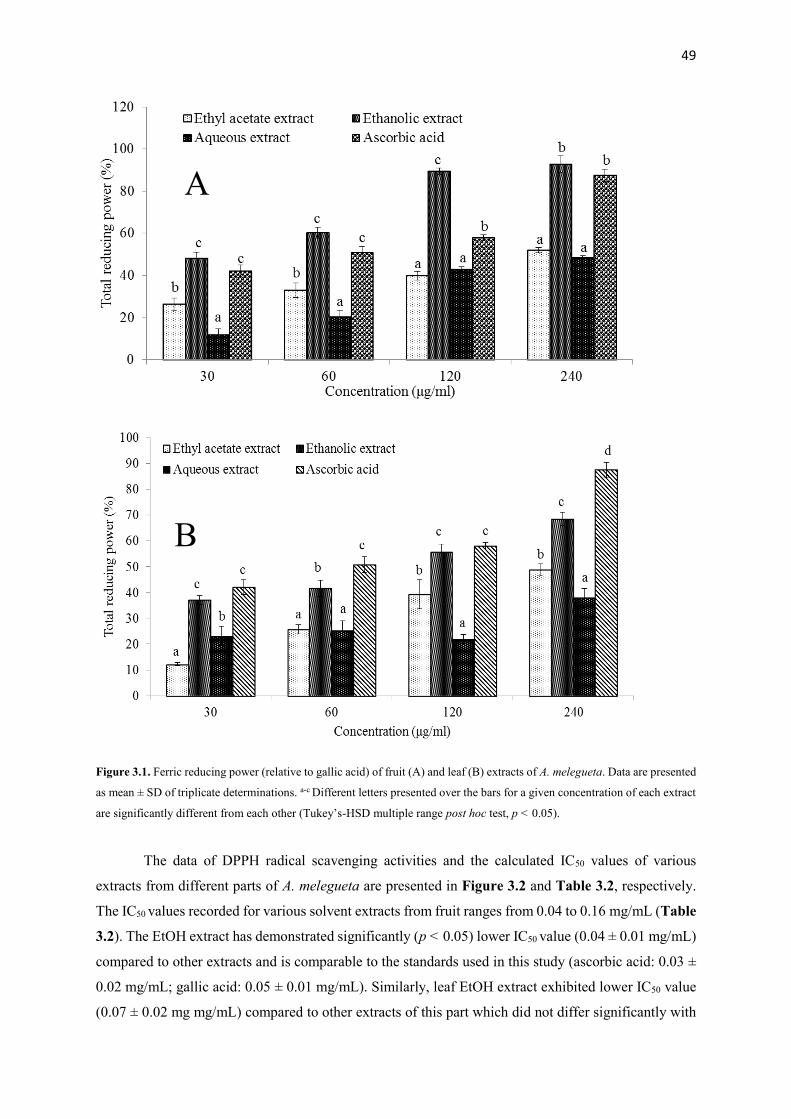
49
Figure 3.1. Ferric reducing power (relative to gallic acid) of fruit (A) and leaf (B) extracts of A. melegueta. Data are presented
as mean ± SD of triplicate determinations. a-c Different letters presented over the bars for a given concentration of each extract
are significantly different from each other (Tukey’s-HSD multiple range post hoc test, p < 0.05).
The data of DPPH radical scavenging activities and the calculated IC50 values of various
extracts from different parts of A. melegueta are presented in Figure 3.2 and Table 3.2, respectively.
The IC50 values recorded for various solvent extracts from fruit ranges from 0.04 to 0.16 mg/mL (Table
3.2). The EtOH extract has demonstrated significantly (p < 0.05) lower IC50 value (0.04 ± 0.01 mg/mL)
compared to other extracts and is comparable to the standards used in this study (ascorbic acid: 0.03 ±
0.02 mg/mL; gallic acid: 0.05 ± 0.01 mg/mL). Similarly, leaf EtOH extract exhibited lower IC50 value
(0.07 ± 0.02 mg mg/mL) compared to other extracts of this part which did not differ significantly with
A
B
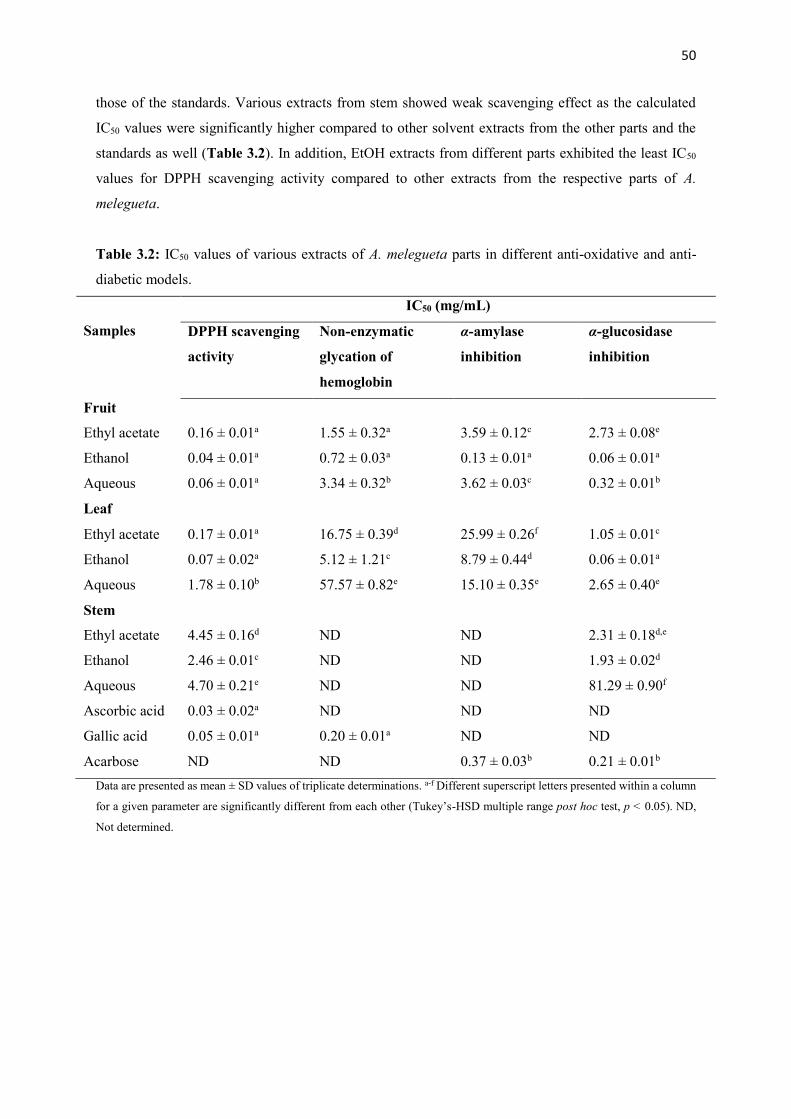
50
those of the standards. Various extracts from stem showed weak scavenging effect as the calculated
IC50 values were significantly higher compared to other solvent extracts from the other parts and the
standards as well (Table 3.2). In addition, EtOH extracts from different parts exhibited the least IC50
values for DPPH scavenging activity compared to other extracts from the respective parts of A.
melegueta.
Table 3.2: IC50 values of various extracts of A. melegueta parts in different anti-oxidative and anti-
diabetic models.
Samples
IC50 (mg/mL)
DPPH scavenging
activity
Non-enzymatic
glycation of
hemoglobin
α-amylase
inhibition
α-glucosidase
inhibition
Fruit
Ethyl acetate 0.16 ± 0.01a 1.55 ± 0.32a 3.59 ± 0.12c 2.73 ± 0.08e
Ethanol 0.04 ± 0.01a 0.72 ± 0.03a 0.13 ± 0.01a 0.06 ± 0.01a
Aqueous 0.06 ± 0.01a 3.34 ± 0.32b 3.62 ± 0.03c 0.32 ± 0.01b
Leaf
Ethyl acetate 0.17 ± 0.01a 16.75 ± 0.39d 25.99 ± 0.26f 1.05 ± 0.01c
Ethanol 0.07 ± 0.02a 5.12 ± 1.21c 8.79 ± 0.44d 0.06 ± 0.01a
Aqueous 1.78 ± 0.10b 57.57 ± 0.82e 15.10 ± 0.35e 2.65 ± 0.40e
Stem
Ethyl acetate 4.45 ± 0.16d ND ND 2.31 ± 0.18d,e
Ethanol 2.46 ± 0.01c ND ND 1.93 ± 0.02d
Aqueous 4.70 ± 0.21e ND ND 81.29 ± 0.90f
Ascorbic acid 0.03 ± 0.02a ND ND ND
Gallic acid 0.05 ± 0.01a 0.20 ± 0.01a ND ND
Acarbose ND ND 0.37 ± 0.03b 0.21 ± 0.01b Data are presented as mean ± SD values of triplicate determinations. a-f Different superscript letters presented within a column
for a given parameter are significantly different from each other (Tukey’s-HSD multiple range post hoc test, p < 0.05). ND,
Not determined.
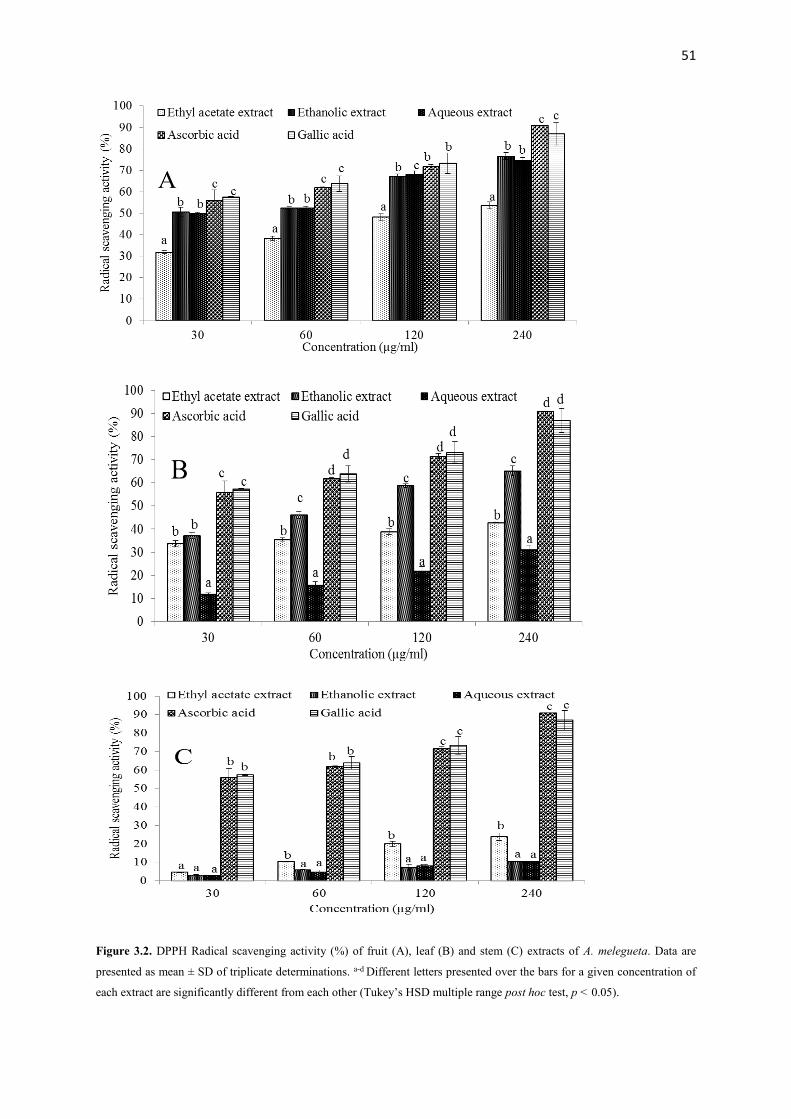
51
Figure 3.2. DPPH Radical scavenging activity (%) of fruit (A), leaf (B) and stem (C) extracts of A. melegueta. Data are
presented as mean ± SD of triplicate determinations. a-d Different letters presented over the bars for a given concentration of
each extract are significantly different from each other (Tukey’s HSD multiple range post hoc test, p < 0.05).
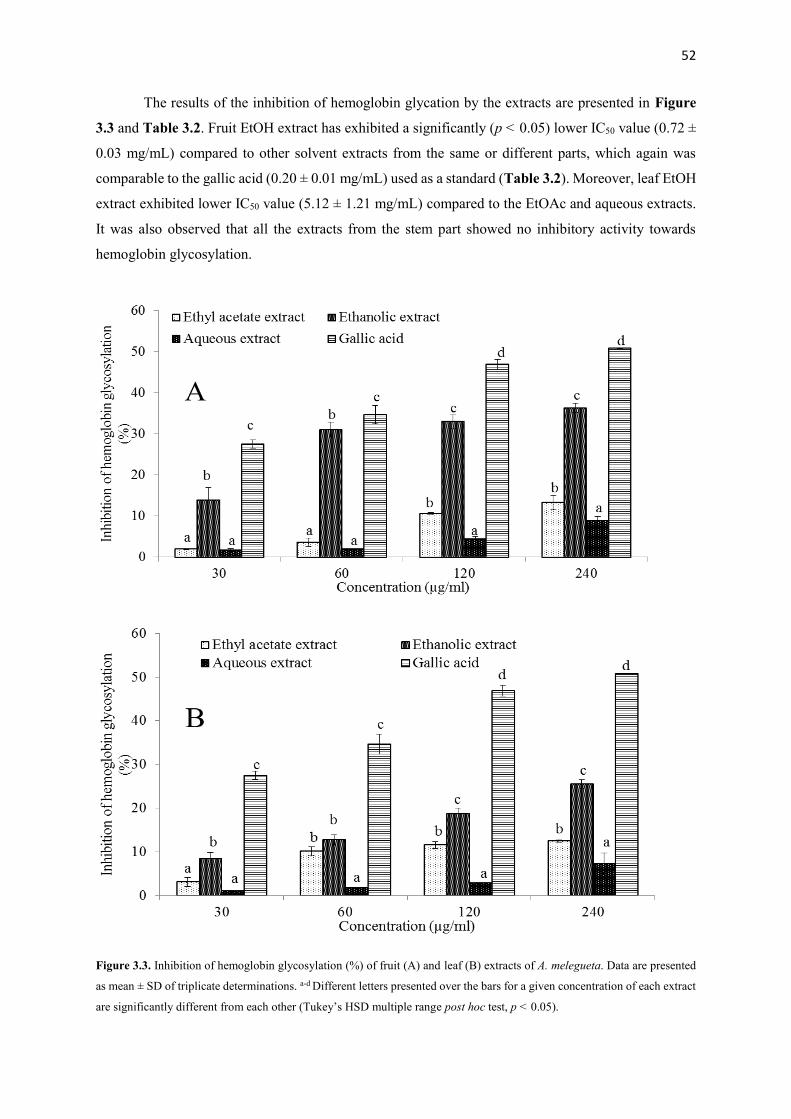
52
The results of the inhibition of hemoglobin glycation by the extracts are presented in Figure
3.3 and Table 3.2. Fruit EtOH extract has exhibited a significantly (p < 0.05) lower IC50 value (0.72 ±
0.03 mg/mL) compared to other solvent extracts from the same or different parts, which again was
comparable to the gallic acid (0.20 ± 0.01 mg/mL) used as a standard (Table 3.2). Moreover, leaf EtOH
extract exhibited lower IC50 value (5.12 ± 1.21 mg/mL) compared to the EtOAc and aqueous extracts.
It was also observed that all the extracts from the stem part showed no inhibitory activity towards
hemoglobin glycosylation.
Figure 3.3. Inhibition of hemoglobin glycosylation (%) of fruit (A) and leaf (B) extracts of A. melegueta. Data are presented
as mean ± SD of triplicate determinations. a-d Different letters presented over the bars for a given concentration of each extract
are significantly different from each other (Tukey’s HSD multiple range post hoc test, p < 0.05).

53
The results of inhibition of α-amylase action by various extracts from A. melegueta are
presented in Figure 3.4 and Table 3.2. It was observed from the data that, fruit EtOH extract exhibited
significantly (p < 0.05) lower IC50 value (0.13 ± 0.01 mg/mL) compared to other solvent extracts of
this part (EtOAc: 3.59 ± 0.12 mg/mL; aqueous: 3.62 ± 0.03 mg/mL) and comparable to acarbose (0.37
± 0.03 mg/mL). The degree of inhibitions was in the increasing order: aqueous < EtOAc< EtOH (Table
3.2). On the other hand, the calculated IC50 value of leaf EtOH extract (8.79 ± 0.44 mg/mL) was
significantly (p < 0.05) higher compared to acarbose (0.37 ± 0.03 mg/mL). Furthermore, none of the
extracts from the stem part the showed α-amylase inhibitory actions.
Figure 3.4. α-Amylase inhibition (%) of fruit (A) and leaf (B) extracts of A. melegueta. Data are presented as mean ± SD of
triplicate determinations. a-d Different letters presented over the bars for a given concentration of each extract are significantly
different from each other (Tukey’s HSD multiple range post hoc test, p < 0.05).

54
The data of the α-glucosidase inhibitory action by various solvent extracts from A. melegueta
are presented in Figure 3.5 and Table 3.2. According to the data, fruit and leaf EtOH extracts have
demonstrated potent α-glucosidase inhibitory effects with the same IC50 value (0.06 ± 0.01 mg/mL)
which is significantly lower compared to that of acarbose (0.21 ± 0.01 mg/mL). Stem EtOH extract
which shows no α-amylase inhibitory effect exhibited moderate α-glucosidase (IC50= 1.93 ± 0.02
mg/mL) inhibition (Table 3.2).
Figure 3.5. α-Glucosidase inhibition (%) of fruit (A), leaf (B) and stem (C) extracts of A. melegueta. Data are presented as
mean ± SD of triplicate determinations. a-d Different letters presented over the bars for a given concentration of each extract
are significantly different from each other (Tukey’s HSD multiple range post hoc test, p < 0.05).
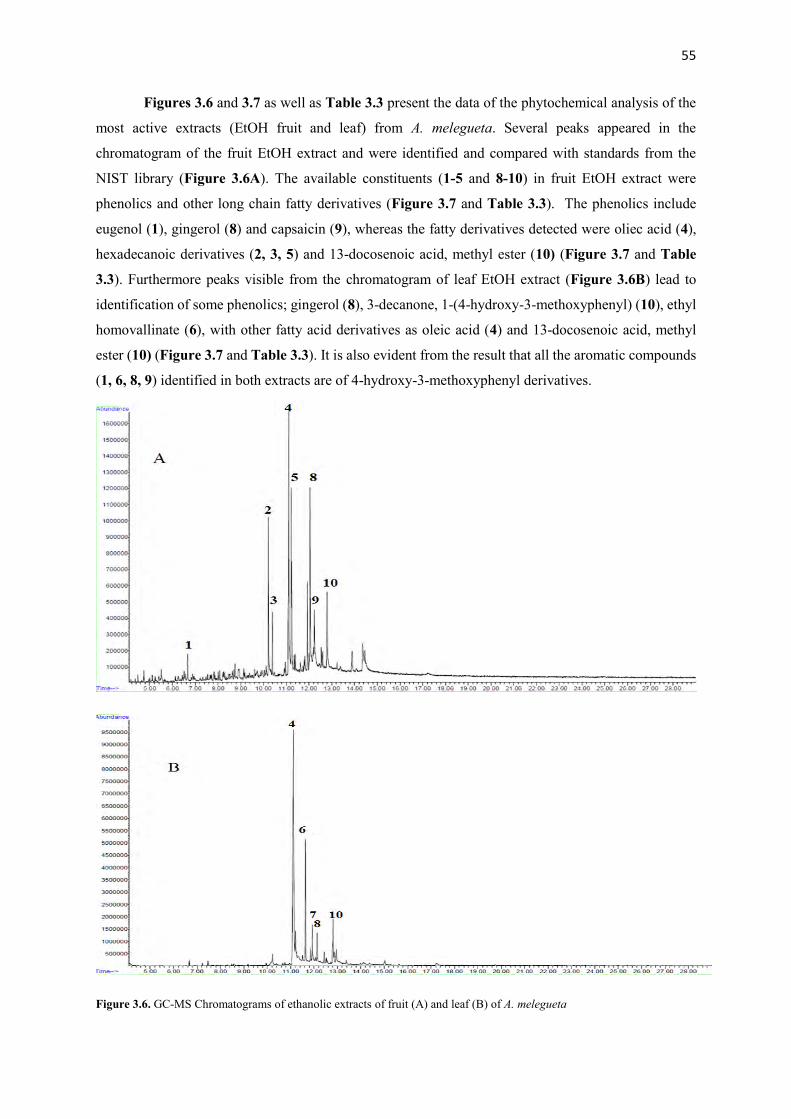
55
Figures 3.6 and 3.7 as well as Table 3.3 present the data of the phytochemical analysis of the
most active extracts (EtOH fruit and leaf) from A. melegueta. Several peaks appeared in the
chromatogram of the fruit EtOH extract and were identified and compared with standards from the
NIST library (Figure 3.6A). The available constituents (1-5 and 8-10) in fruit EtOH extract were
phenolics and other long chain fatty derivatives (Figure 3.7 and Table 3.3). The phenolics include
eugenol (1), gingerol (8) and capsaicin (9), whereas the fatty derivatives detected were oliec acid (4),
hexadecanoic derivatives (2, 3, 5) and 13-docosenoic acid, methyl ester (10) (Figure 3.7 and Table
3.3). Furthermore peaks visible from the chromatogram of leaf EtOH extract (Figure 3.6B) lead to
identification of some phenolics; gingerol (8), 3-decanone, 1-(4-hydroxy-3-methoxyphenyl) (10), ethyl
homovallinate (6), with other fatty acid derivatives as oleic acid (4) and 13-docosenoic acid, methyl
ester (10) (Figure 3.7 and Table 3.3). It is also evident from the result that all the aromatic compounds
(1, 6, 8, 9) identified in both extracts are of 4-hydroxy-3-methoxyphenyl derivatives.
Figure 3.6. GC-MS Chromatograms of ethanolic extracts of fruit (A) and leaf (B) of A. melegueta
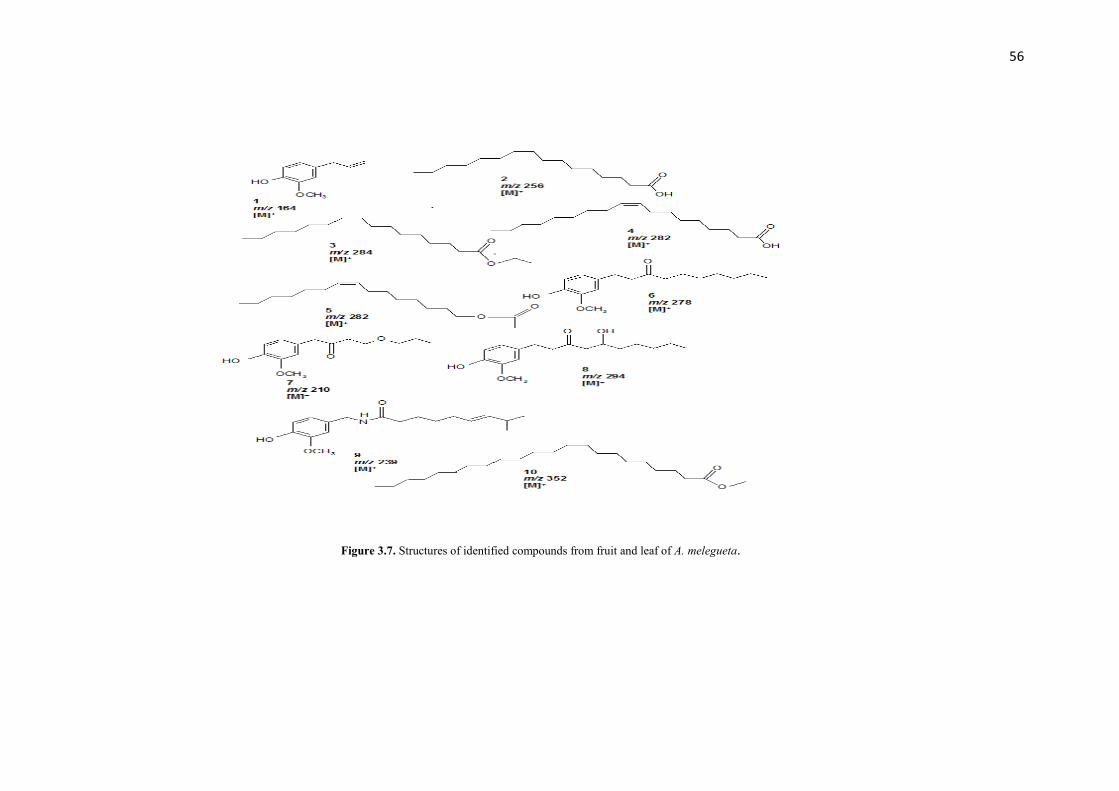
56
Figure 3.7. Structures of identified compounds from fruit and leaf of A. melegueta.
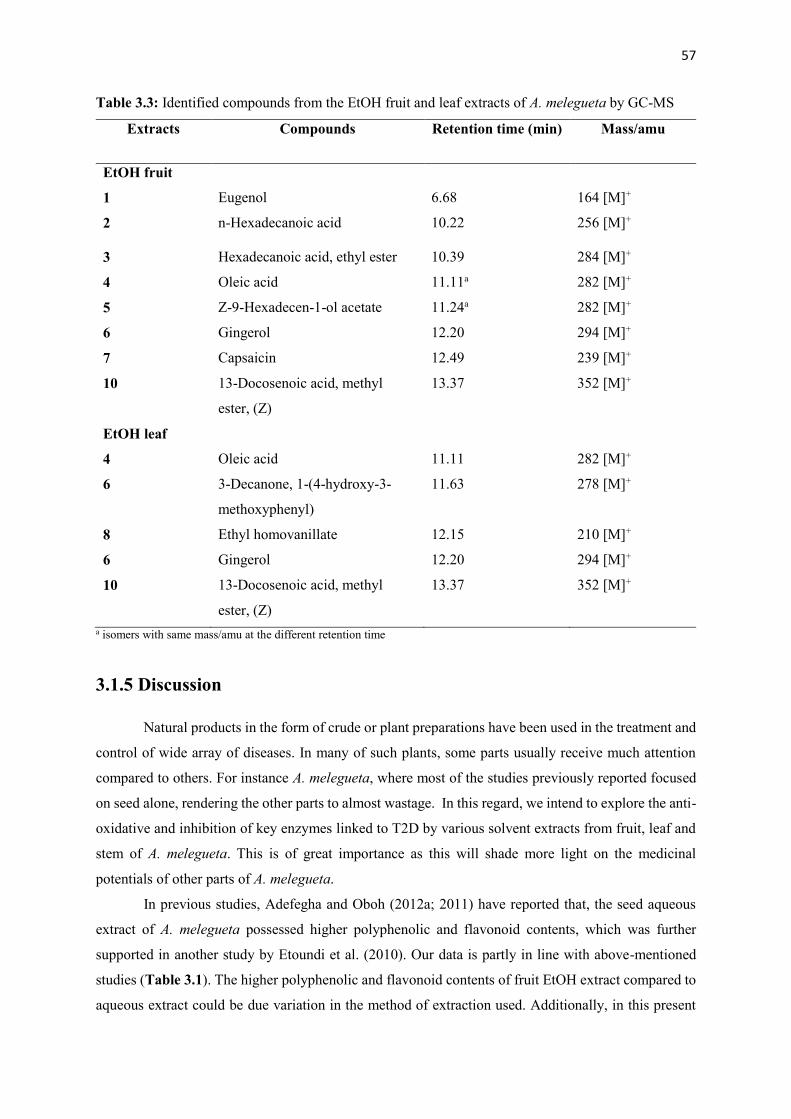
57
Table 3.3: Identified compounds from the EtOH fruit and leaf extracts of A. melegueta by GC-MS
Extracts Compounds Retention time (min) Mass/amu
EtOH fruit
1 Eugenol 6.68 164 [M]+
2 n-Hexadecanoic acid 10.22 256 [M]+
3 Hexadecanoic acid, ethyl ester 10.39 284 [M]+
4 Oleic acid 11.11a 282 [M]+
5 Z-9-Hexadecen-1-ol acetate 11.24a 282 [M]+
6 Gingerol 12.20 294 [M]+
7 Capsaicin 12.49 239 [M]+
10 13-Docosenoic acid, methyl
ester, (Z)
13.37 352 [M]+
EtOH leaf
4 Oleic acid 11.11 282 [M]+
6 3-Decanone, 1-(4-hydroxy-3-
methoxyphenyl)
11.63 278 [M]+
8 Ethyl homovanillate 12.15 210 [M]+
6 Gingerol 12.20 294 [M]+
10 13-Docosenoic acid, methyl
ester, (Z)
13.37 352 [M]+
a isomers with same mass/amu at the different retention time
3.1.5 Discussion
Natural products in the form of crude or plant preparations have been used in the treatment and
control of wide array of diseases. In many of such plants, some parts usually receive much attention
compared to others. For instance A. melegueta, where most of the studies previously reported focused
on seed alone, rendering the other parts to almost wastage. In this regard, we intend to explore the anti-
oxidative and inhibition of key enzymes linked to T2D by various solvent extracts from fruit, leaf and
stem of A. melegueta. This is of great importance as this will shade more light on the medicinal
potentials of other parts of A. melegueta.
In previous studies, Adefegha and Oboh (2012a; 2011) have reported that, the seed aqueous
extract of A. melegueta possessed higher polyphenolic and flavonoid contents, which was further
supported in another study by Etoundi et al. (2010). Our data is partly in line with above-mentioned
studies (Table 3.1). The higher polyphenolic and flavonoid contents of fruit EtOH extract compared to
aqueous extract could be due variation in the method of extraction used. Additionally, in this present
58
study the polyphenolic and flavonoid contents of the aqueous extract were relatively similar with that
of the seed aqueous extract reported earlier (Adefegha and Oboh, 2012a; 2011). Interestingly, leaf EtOH
extract was also found to be rich in polyphenols and flavonoids contents. This is the first study that
highlighted the contents of these phytochemicals from either the leaf or the stem parts. Furthermore, it
is important to notice that, the amount and distribution of plants products such as polyphenols varies
greatly from one species of plants to another or among the parts of the same plants. The production and
accumulation of polyphenols are influenced by many factors, such as genetic and environmental factors
(nature of the soil, high temperature and rain fall) in addition to growth or maturation stages for most
of the parts of the plants (Mamphiswana et al. 2010; Pandey and Rizvi, 2009). Hence, the higher
polyphenols and flavonoids contents of fruits compared to other parts could be attributed to one or
combination of the above-mentioned factors, which were linked to most of the anti-oxidant ability of
various plant-derived extracts.
In this study, a number of in vitro models were used to investigate the anti-oxidative potentials
of various solvent extracts from different parts of A. melegueta. Among such model is the reduction of
Fe3+ to Fe2+ by plant extracts or compounds is another reliable index and a good indicator of their
electron-quenching abilities (Chung et al. 2002). This reaction is monitored by the formation of Perl’s
Prussian blue color at 700 nm. In an attempt to further support the anti-oxidative nature of A. melegueta,
Adefegha and Oboh, (2012b) have earlier reported higher reducing potential of A. melegueta aqueous
seed extract, which correlate well with the results of our present study (Figure 3.1). Moreover, although
no previous study is available on the A. melegueta leaf, our data have shown that leaf could be a good
source of anti-oxidant in addition to seed and fruit that are popularly utilized. The higher ferric iron
(Fe3+) reducing anti-oxidant power of various extracts from A. melegueta scavenging activity of EtOH
extracts than other extracts from different parts of A. melegueta could be attributed to their rich
polyphenols and flavonoids contents of these extracts, which has been further supported by the DPPH
radical scavenging activity (Table 3.2).
The DPPH radical scavenging activity is a quick and reliable method for determining the anti-
oxidative nature of plant-derived products. DPPH is a stable radical that usually delocalized by
accepting electrons from the referenced anti-oxidant, thereby becoming a stable molecule (Lobo et al.
2010). The anti-oxidative effectiveness of various solvent extracts was assessed base on the calculated
IC50 values. The lower the IC50 value, the higher the anti-oxidative potential of the extract. In some
previous studies various extracts from the A. melegueta seed have shown good radical scavenging
capacities. Kazeem et al. (2012) have reported an IC50 value of 0.110 ± 0.010 mg/mL for seed acetone
extract, whereas 17.38 ± 2.00 mg/mL was earlier reported for seed aqueous extract (Adefegha and
Oboh, 2012a). However, these are by far higher compared to that of fruit EtOH and aqueous extracts
(EtOH: 0.04 ± 0.01mg/mL; aqueous: 0.04 ± 0.01 mg/mL) as well observed in our present study (Table
3.2). This has indicated higher electron scavenging ability of fruit than the seed part (Table 3.2).
59
Additionally, this is the lowest IC50 value reported for DPPH scavenging of any extracts derived from
A. melegueta.
Hemoglobin glycation is a non-enzymatic reaction occurs when proteins are exposed to excess
reducing sugars and contributes immensely to the formation of advanced glycation end products that
lead to oxidative stress (Yamagishi et al. 2008; Rahbar and Figarola, 2003; Brownlee et al. 1984).
Kazeem et al. (2012) have earlier reported an IC50 value of 0.125 ± 0.02 mg/mL for acetone extract
(0.25-1 mg/mL), which is obviously lower compared to that of fruit EtOH extract and other solvent
extracts (Table 3.2). This could be due to the lower concentrations (30-240 µg/mL) used in our present
study. The results were further supported by the α-amylase and α-glucosidase inhibitory actions of
various extracts from A. melegueta (Table 3.2).
On the other hand, the control of postprandial hyperglycemia is crucial for the management of
DM and prevention of its complications at early stage (Ali et al. 2006). This is achieved by delaying
the absorption of glucose from the small intestine through the inhibition of carbohydrates metabolizing
enzymes such as α-amylase and α-glucosidase, located at the intestinal tract. The α-amylase catalyzes
the endo-hydrolysis of α-1, 4-glucosidic linkage releasing disaccharides and oligosaccharides which are
further hydrolyzed at the small intestinal brush border by α-glucosidases to release glucose (Hua-Quang
et al. 2012; Hanhineva et al. 2010). In a previous study, Adefegha and Oboh (2012a) have reported an
IC50 value of 4.83 ± 0.56 mg/mL for α-amylase inhibition by seed aqueous extract. However, according
to our results all the extracts derived from fruit part have demonstrated lower IC50 values compared to
that of seed aqueous extract reported earlier, indicating better activity of the fruit than the seed part
(Table 3.2). Similarly, the calculated IC50 value of the seed aqueous extract (2.14 ± 1.08 mg/mL) for
α-glucosidase inhibition reported earlier was again far higher compared to that of fruit EtOH extract
(0.06 ± 0.01 mg/mL) observed in our present study (Adefegha and Oboh, 2012a). Also observed in our
data is that the IC50 value of the fruit aqueous extract was about 6-fold lower compared to that reported
by Adefegha and Oboh (2012a) for seed aqueous extract. Furthermore, the relatively similar α-
glucosidase inhibitory action of the leaf and fruit EtOH extracts has shown that leaf could be another
potential source for α-glucosidase inhibitors (Table 3.2).
Based on the results of this study, fruit and leaf EtOH extracts that exhibited higher activities
were subjected to GC-MS analysis to find the possible bioactive compounds that could be responsible
for their activities. The study reported by Ilic et al. (2010) has indicated that, seed EtOH extract contains
mainly the phenolic compounds such as gingerol, shogaol and paradol, which supports our present
finding. It is also evident that eugenol (1), gingerol (6), capsaicin (7) 3-decanone, 1-(4-hydroxy-3-
methoxyphenyl) (10) and ethyl homovallinate (11), detected in fruit and leaf EtOH extracts were of 4-
hydroxy-3-methoxyphenyl derivatives. Therefore, it is propose that the presence of phenolics is
regarded as the key feature that could be responsible for the higher anti-oxidative and anti-diabetic
effects of the fruit and leaf EtOH extracts observed in this study in addition to the contribution of other
compounds (Figure 3.7). Phenolics and other related compounds have the ability to act as anti-oxidants

60
due to their low reduction potential compared to highly reactive species such as hydroxyl (•OH),
superoxide (O2•-), nitric oxide (NO•) radicals. Their ability to donate electron or proton from hydroxyl
moieties result in stabilizing lipid peroxidation, neutralizing ROS and ultimately inhibit the initiation
and propagation of chain reaction associated with oxidative damage (Brewer, 2011). Likewise, it has
been proposed that phenolics interact with one or multiple sites of the α-glucosidase or α-amylase
surface proteins and thus form a hydrophobic layer. This leads to aggregation and precipitation which
changes the conformation of the enzyme structure and hence decrease in activity (Toda et al. 2001;
Spencer et al. 1988).
3.1.6 Conclusions
In conclusion, various solvent extracts from fruit and leaf of A. melegueta have demonstrated
anti-oxidative as well as anti-diabetic effects in vitro when stem extracts showed very low or no
significant activities in these regards. The fruit EtOH extract exhibited higher actions compared to other
extracts of the same or different parts. Thus, it is recommended for further bioassay-guided fractionation
in order to fully investigate the in vivo anti-diabetic and anti-oxidative effects of this extract.
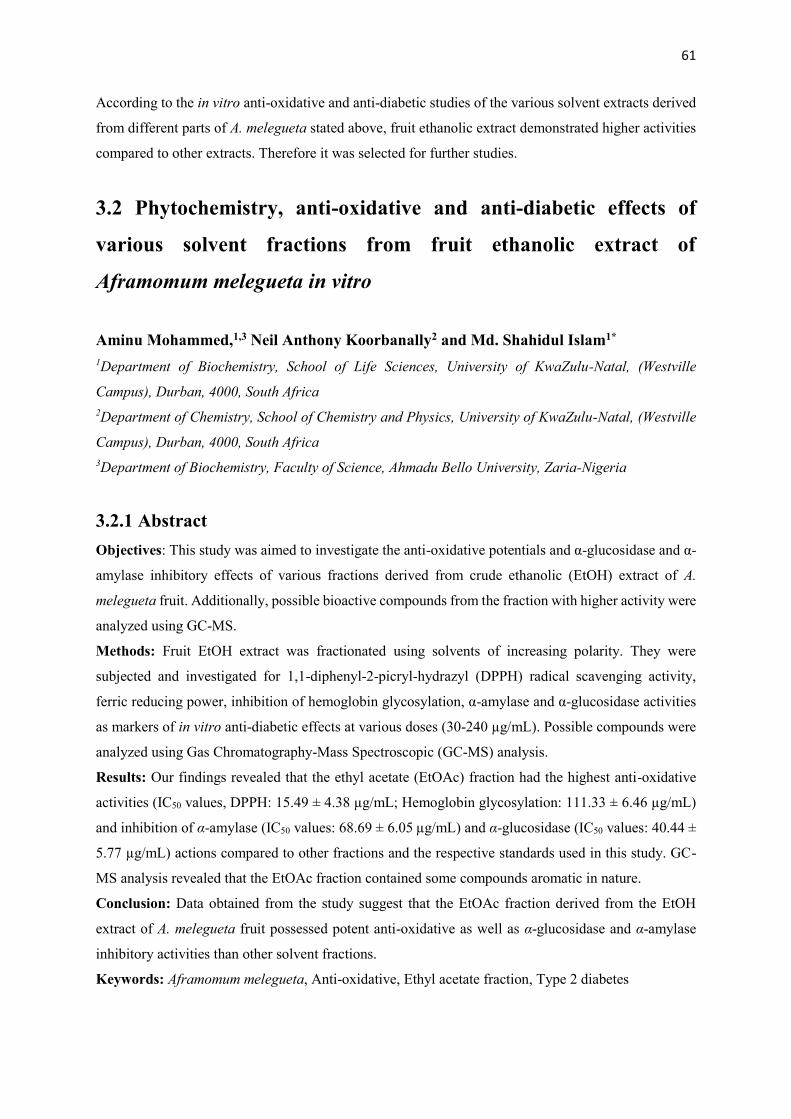
61
According to the in vitro anti-oxidative and anti-diabetic studies of the various solvent extracts derived
from different parts of A. melegueta stated above, fruit ethanolic extract demonstrated higher activities
compared to other extracts. Therefore it was selected for further studies.
3.2 Phytochemistry, anti-oxidative and anti-diabetic effects of
various solvent fractions from fruit ethanolic extract of
Aframomum melegueta in vitro
Aminu Mohammed,1,3 Neil Anthony Koorbanally2 and Md. Shahidul Islam1*
1Department of Biochemistry, School of Life Sciences, University of KwaZulu-Natal, (Westville
Campus), Durban, 4000, South Africa 2Department of Chemistry, School of Chemistry and Physics, University of KwaZulu-Natal, (Westville
Campus), Durban, 4000, South Africa 3Department of Biochemistry, Faculty of Science, Ahmadu Bello University, Zaria-Nigeria
3.2.1 Abstract Objectives: This study was aimed to investigate the anti-oxidative potentials and α-glucosidase and α-
amylase inhibitory effects of various fractions derived from crude ethanolic (EtOH) extract of A.
melegueta fruit. Additionally, possible bioactive compounds from the fraction with higher activity were
analyzed using GC-MS.
Methods: Fruit EtOH extract was fractionated using solvents of increasing polarity. They were
subjected and investigated for 1,1-diphenyl-2-picryl-hydrazyl (DPPH) radical scavenging activity,
ferric reducing power, inhibition of hemoglobin glycosylation, α-amylase and α-glucosidase activities
as markers of in vitro anti-diabetic effects at various doses (30-240 µg/mL). Possible compounds were
analyzed using Gas Chromatography-Mass Spectroscopic (GC-MS) analysis.
Results: Our findings revealed that the ethyl acetate (EtOAc) fraction had the highest anti-oxidative
activities (IC50 values, DPPH: 15.49 ± 4.38 µg/mL; Hemoglobin glycosylation: 111.33 ± 6.46 µg/mL)
and inhibition of α-amylase (IC50 values: 68.69 ± 6.05 µg/mL) and α-glucosidase (IC50 values: 40.44 ±
5.77 µg/mL) actions compared to other fractions and the respective standards used in this study. GC-
MS analysis revealed that the EtOAc fraction contained some compounds aromatic in nature.
Conclusion: Data obtained from the study suggest that the EtOAc fraction derived from the EtOH
extract of A. melegueta fruit possessed potent anti-oxidative as well as α-glucosidase and α-amylase
inhibitory activities than other solvent fractions.
Keywords: Aframomum melegueta, Anti-oxidative, Ethyl acetate fraction, Type 2 diabetes
62
3.2.2 Introduction
Type 2 diabetes (T2D) is a heterogeneous disorder characterized by insulin resistance and
partially dysfunctional pancreatic β-cell to properly secrete insulin in response to elevation of blood
glucose levels (Hui et al. 2007). The inability of pancreatic β-cell to secret insulin disrupts the regulation
of hepatic gluconeogesis, muscles glucose uptake and lipolysis in adipose tissues. The consequence is
postprandial hyperglycemia which results into T2D (Gastaldelli, 2011). Moreover, in chronic
uncontrolled hyperglycemia, there is an increased production of reactive oxygen species (ROS) and a
declined of in vivo anti-oxidant defense system, a term referred as oxidative stress (Maritim et al. 2003).
The ROS are derived from the normal physiological processes and become highly deleterious if the
levels increases and not arrested by complex anti-oxidant systems in the body (Chang and Chuang,
2010). The most common ROS include superoxide (O2·-), hydrogen peroxide (H2O2), peroxyl (ROO·)
and reactive hydroxyl (OH·) radicals (Niki, 2010). Furthermore, increase intake of anti-oxidants has
good correlation in amelioration of complication caused by ROS. However, people are now aware of
the high risk caused by the synthetic anti-oxidants due to their chemical instability and hence depend
on plant-derived anti-oxidants for food preservations and disease controls such as T2D.
On the other hand, inhibition of the activities of carbohydrate hydrolysing enzymes such as α-
glucosidase has been used as one of the recent alternatives for the treatment and control of T2D
(Adefegha and Oboh, 2012). This reduces the rate of intestinal glucose absorption which apparently
decreases the postprandial hyperglycemia (Bhadari et al. 2008). Currently, some synthetic α-
glucosidase inhibitors such as acarbose and miglitol are available for the control of T2D. But the
undesirable adverse effects with the use of these drugs cause a shift to look for options from natural
sources such as plants that are to cause fewer or no adverse side effects.
Interestingly, in most of the recent studies, plant-derived extracts and/or fractions have shown
potent anti-oxidant as well as inhibition of α-glucosidase activities and therefore could possibly be a
potential candidates for the treatment and control of T2D (Ibrahim et al. 2014; Kong et al. 2014;
Adamson and Oboh, 2012; Adefegha and Oboh, 2012a).
Aframomum melegueta K. Schum. (Zingiberaceae) commonly known as guinea or alligator
pepper is a native to west and central parts of Africa (Iwu, 2014). The seeds, leaf or fruit are consumed
as flavoring agent in various traditional foods and are used locally to treat diseases such as diabetes,
microbial infections, diarrhea, abdominal pain, snakebite and wounds healing in Nigeria, Kenya and
Gabon (Iwu, 2014; Soladoye et al. 2012; Gbolade, 2009; Akendengue and Louis, 1994; Kokwaro,
1993). Previously, Sugita et al. (2013) have reported that A. melegueta seed alcoholic extract stimulates
brown adipose tissue and increases whole-body energy expenditure in human subjects which is directly
linked with the pathogenesis of T2D. Additionally, in a number of recent studies reported that various
solvent extracts from A. melegueta seed have demonstrated potent anti-oxidant as well as anti-diabetic
actions in vitro (Adefegha and Oboh 2012; Kazeem et al. 2012; Adefegha and Oboh 2011; Etoundi et

63
al. 2010) and in vivo (Onoja et al. 2014). Furthermore, in our recent study, we have reported that fruit
ethanolic (EtOH) extract demonstrated higher anti-oxidant and anti-diabetic actions in vitro compared
to other solvent extracts from the various parts of A. melegueta (Mohammed et al. 2015a). Therefore,
in our effort to find potent anti-diabetic plant-derived formulations, we further partitioned and
fractionated the crude EtOH extract from A. melegueta fruit with the hope to obtain the best fraction
with highest anti-diabetic activities.
Therefore, our present study was aimed to investigate the anti-oxidative potentials and
inhibitory effects of various fractions derived from crude EtOH extract of A. melegueta fruit on the
activities of α-glucosidase and α-amylase enzymes. Additionally, possible bioactive compounds from
the fraction with highest activities was also analysed using GC-MS.
3.2.3 Materials and methods
For sample collection, identification and preparation of the fractions, including the detail
experimental protocols, please refer to chapter 2, sub-sections 2.3 and 2.4.
3.2.4 Results
The results of the percentage yield recovered, total polyphenols and flavonoids contents of
various fractions from the fruit EtOH extract are presented in Table 3.4. It was observed from the data
that the least polar solvent (hexane) recovered higher yield whereas the acetone, which is the most polar
recovered the least amount. Similarly, the most polar fractions (ethyl acetate (EtOAc) and acetone) have
demonstrated higher polyphenols and flavonoids contents compared to the less polar solvent fractions
(hexane and dichloromethane). Furthermore, within the most polar, the polyphenols and flavonoids
contents of the EtOAc fraction were relatively higher compared to that of acetone fraction (Table 3.4).
The total polyphenols content was in the order; EtOAc > acetone > dichloromethane > hexane.
Table 3.4. Percentage yield, total polyphenol and flavonoid contents of various fractions from ethanolic
fruit extract of A. melegueta
Solvent Yield (%) Total polyphenols
content (mg/gGAE)
Total flavonoids
content (mg/gQE)
Hexane 17.80 1.46 ± 0.16a 0.53 ± 0.41a
Dichloromethane 10.54 3.64 ± 0.41b 0.52 ± 0.14a
Ethyl acetate 5.60 18.98 ± 0.06c 6.06 ± 0.06b
Acetone 1.70 16.21 ± 0.70c 5.02 ± 0.34b Data are presented as mean±SD values of triplicate determinations. a-cDifferent superscripted letters for a given value within
a column are significantly different from each other (Tukey’s-HSD multiple range post hoc test, p < 0.05).

64
The results of ferric (Fe3+) reducing total anti-oxidant power (expressed as gallic acid
equivalents) of the various fractions are presented in Figure 3.8. It was observed that EtOAc fraction
showed a significantly (p < 0.05) higher and concentration dependent reducing power compared to other
solvent fractions as well as the standard ascorbic acid (Figure 3.8). Hexane and acetone fractions
demonstrated similar Fe3+ to Fe2+ reducing abilities while dichloromethane fraction was the least active
among the fractions tested (Figure 3.8).
Figure 3.8. Total reducing power (relative to gallic acid) of various fractions from fruit ethanolic extract of A. melegueta. Data
are presented as mean±SD of triplicate determinations. a-d Different letters presented over the bars for a given concentration of
each extract are significantly different from each other (Tukey’s-HSD multiple range post hoc test, p < 0.05).
The data of DPPH radical scavenging activities and the calculated IC50 values of various
fractions from the fruit EtOH extract are presented in Figure 3.9 and Table 3.5, respectively. All the
solvent fractions have shown variable scavenging abilities. The EtOAc fraction exhibited significantly
(p < 0.05) lower IC50 value (15.49 ± 4.38 µg/mL) for DPPH scavenging activities compared to other
solvent fractions and comparable to standards used in this study (Ascorbic acid: 25.34 ± 6.19 µg/mL;
Gallic acid: 20.01 ± 4.42 µg/mL) (Table 3.5).
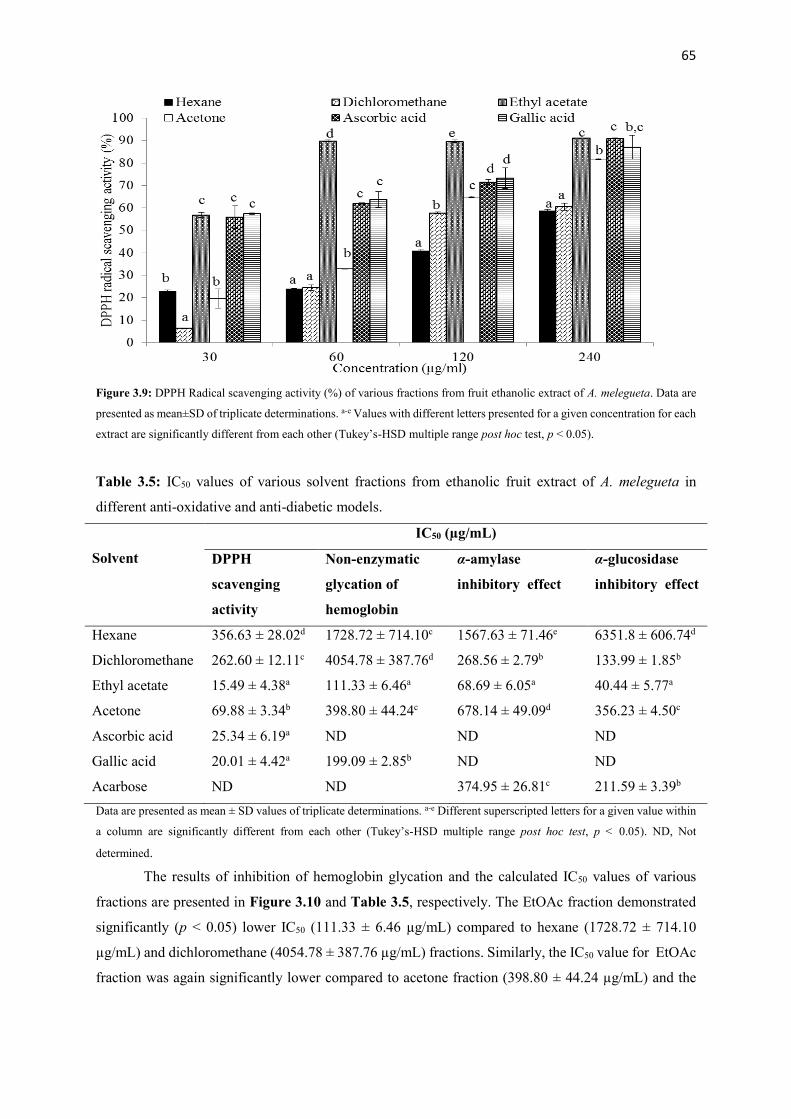
65
Figure 3.9: DPPH Radical scavenging activity (%) of various fractions from fruit ethanolic extract of A. melegueta. Data are
presented as mean±SD of triplicate determinations. a-e Values with different letters presented for a given concentration for each
extract are significantly different from each other (Tukey’s-HSD multiple range post hoc test, p < 0.05).
Table 3.5: IC50 values of various solvent fractions from ethanolic fruit extract of A. melegueta in
different anti-oxidative and anti-diabetic models.
Solvent
IC50 (µg/mL)
DPPH
scavenging
activity
Non-enzymatic
glycation of
hemoglobin
α-amylase
inhibitory effect
α-glucosidase
inhibitory effect
Hexane 356.63 ± 28.02d 1728.72 ± 714.10c 1567.63 ± 71.46e 6351.8 ± 606.74d
Dichloromethane 262.60 ± 12.11c 4054.78 ± 387.76d 268.56 ± 2.79b 133.99 ± 1.85b
Ethyl acetate 15.49 ± 4.38a 111.33 ± 6.46a 68.69 ± 6.05a 40.44 ± 5.77a
Acetone 69.88 ± 3.34b 398.80 ± 44.24c 678.14 ± 49.09d 356.23 ± 4.50c
Ascorbic acid 25.34 ± 6.19a ND ND ND
Gallic acid 20.01 ± 4.42a 199.09 ± 2.85b ND ND
Acarbose ND ND 374.95 ± 26.81c 211.59 ± 3.39b Data are presented as mean ± SD values of triplicate determinations. a-e Different superscripted letters for a given value within
a column are significantly different from each other (Tukey’s-HSD multiple range post hoc test, p < 0.05). ND, Not
determined. The results of inhibition of hemoglobin glycation and the calculated IC50 values of various
fractions are presented in Figure 3.10 and Table 3.5, respectively. The EtOAc fraction demonstrated
significantly (p < 0.05) lower IC50 (111.33 ± 6.46 µg/mL) compared to hexane (1728.72 ± 714.10
µg/mL) and dichloromethane (4054.78 ± 387.76 µg/mL) fractions. Similarly, the IC50 value for EtOAc
fraction was again significantly lower compared to acetone fraction (398.80 ± 44.24 µg/mL) and the

66
standard gallic acid (199.09 ± 2.85 µg/mL), although did not differ significantly among the fractions
(Table 3.5).
Figure 3.10: Inhibition of hemoglobin glycation (%) of various fractions from fruit ethanolic extract of A. melegueta. Data
are presented as mean±SD of triplicate determinations. a-d Values with different letters presented for a given concentration for
each extract are significantly different from each other (Tukey’s-HSD multiple range post hoc test, p < 0.05).
The data of α-amylase inhibition by the various fractions and the calculated IC50 values are
presented in Figure 3.11 and Table 3.5, respectively. EtOAc fraction had exhibited a significantly (p <
0.05) lower calculated IC50 value (68.69 ± 6.05 µg/mL) towards α-amylase inhibition compared to other
solvent fractions and acarbose as well (Table 3.5). The activity of the acetone fraction did not differ
significantly (p < 0.05) compared to the standard acarbose.
Figure 3.11: α-Amylase inhibition (%) of various fractions from fruit ethanolic extract of A. melegueta. Data are presented as
mean±SD of triplicate determinations. a-e Values with different letters presented for a given concentration for each extract are
significantly different from each other(Tukey’s-HSD multiple range post hoc test, p < 0.05).
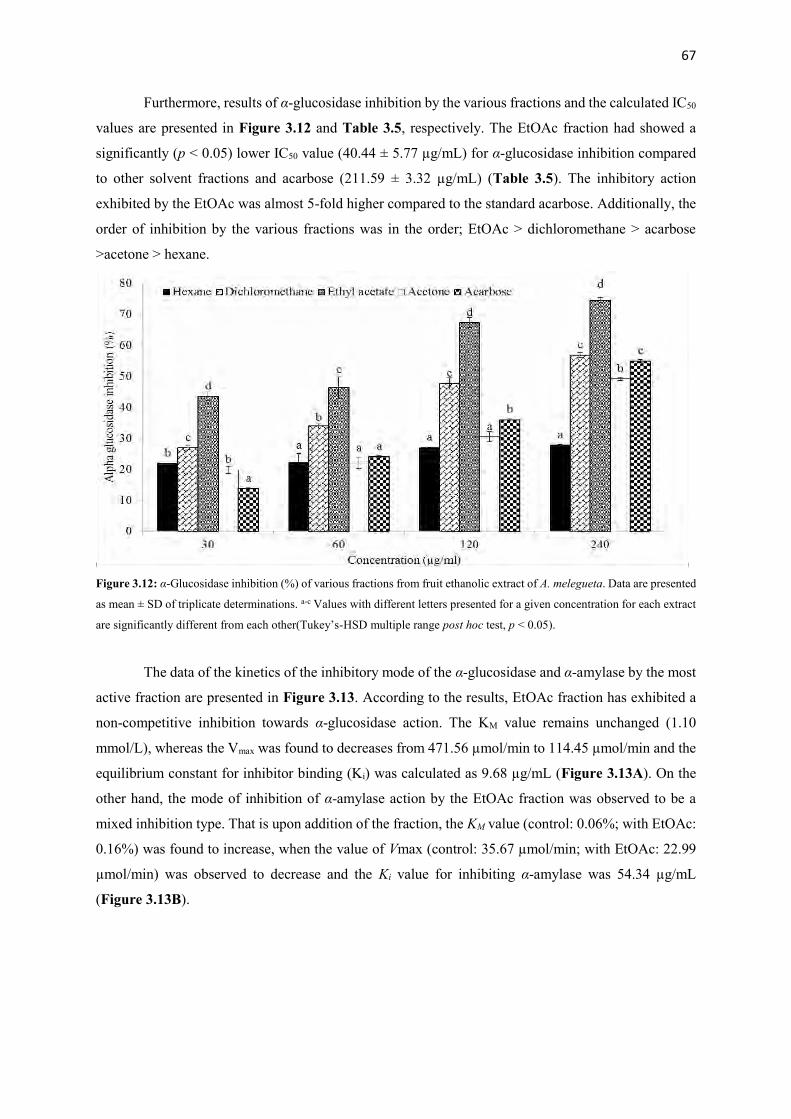
67
Furthermore, results of α-glucosidase inhibition by the various fractions and the calculated IC50
values are presented in Figure 3.12 and Table 3.5, respectively. The EtOAc fraction had showed a
significantly (p < 0.05) lower IC50 value (40.44 ± 5.77 µg/mL) for α-glucosidase inhibition compared
to other solvent fractions and acarbose (211.59 ± 3.32 µg/mL) (Table 3.5). The inhibitory action
exhibited by the EtOAc was almost 5-fold higher compared to the standard acarbose. Additionally, the
order of inhibition by the various fractions was in the order; EtOAc > dichloromethane > acarbose
>acetone > hexane.
Figure 3.12: α-Glucosidase inhibition (%) of various fractions from fruit ethanolic extract of A. melegueta. Data are presented
as mean ± SD of triplicate determinations. a-c Values with different letters presented for a given concentration for each extract
are significantly different from each other(Tukey’s-HSD multiple range post hoc test, p < 0.05).
The data of the kinetics of the inhibitory mode of the α-glucosidase and α-amylase by the most
active fraction are presented in Figure 3.13. According to the results, EtOAc fraction has exhibited a
non-competitive inhibition towards α-glucosidase action. The KM value remains unchanged (1.10
mmol/L), whereas the Vmax was found to decreases from 471.56 µmol/min to 114.45 µmol/min and the
equilibrium constant for inhibitor binding (Ki) was calculated as 9.68 µg/mL (Figure 3.13A). On the
other hand, the mode of inhibition of α-amylase action by the EtOAc fraction was observed to be a
mixed inhibition type. That is upon addition of the fraction, the KM value (control: 0.06%; with EtOAc:
0.16%) was found to increase, when the value of Vmax (control: 35.67 µmol/min; with EtOAc: 22.99
µmol/min) was observed to decrease and the Ki value for inhibiting α-amylase was 54.34 µg/mL
(Figure 3.13B).
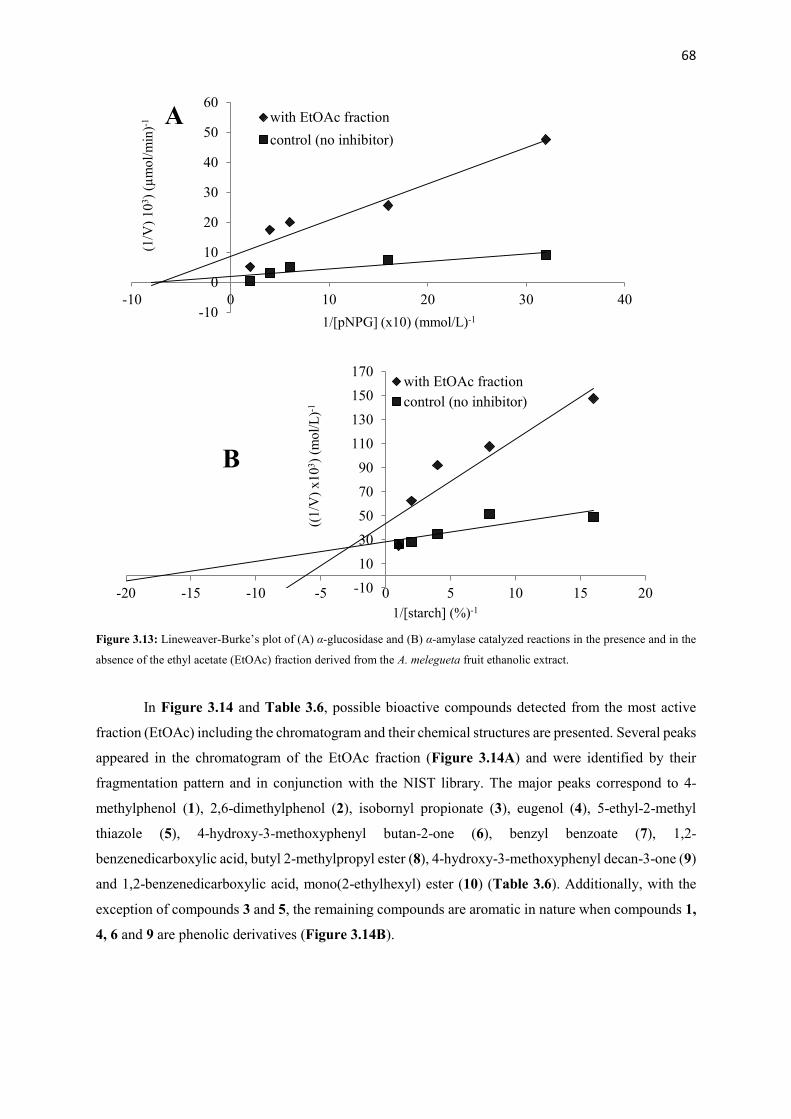
68
Figure 3.13: Lineweaver-Burke’s plot of (A) α-glucosidase and (B) α-amylase catalyzed reactions in the presence and in the
absence of the ethyl acetate (EtOAc) fraction derived from the A. melegueta fruit ethanolic extract.
In Figure 3.14 and Table 3.6, possible bioactive compounds detected from the most active
fraction (EtOAc) including the chromatogram and their chemical structures are presented. Several peaks
appeared in the chromatogram of the EtOAc fraction (Figure 3.14A) and were identified by their
fragmentation pattern and in conjunction with the NIST library. The major peaks correspond to 4-
methylphenol (1), 2,6-dimethylphenol (2), isobornyl propionate (3), eugenol (4), 5-ethyl-2-methyl
thiazole (5), 4-hydroxy-3-methoxyphenyl butan-2-one (6), benzyl benzoate (7), 1,2-
benzenedicarboxylic acid, butyl 2-methylpropyl ester (8), 4-hydroxy-3-methoxyphenyl decan-3-one (9)
and 1,2-benzenedicarboxylic acid, mono(2-ethylhexyl) ester (10) (Table 3.6). Additionally, with the
exception of compounds 3 and 5, the remaining compounds are aromatic in nature when compounds 1,
4, 6 and 9 are phenolic derivatives (Figure 3.14B).
-10
0
10
20
30
40
50
60
-10 0 10 20 30 40
(1/V
) 103 )
(µm
ol/m
in)-1
1/[pNPG] (x10) (mmol/L)-1
with EtOAc fractioncontrol (no inhibitor)
-101030507090
110130150170
-20 -15 -10 -5 0 5 10 15 20
((1/
V) x
103 )
(mol
/L)-1
1/[starch] (%)-1
with EtOAc fractioncontrol (no inhibitor)
A
B

69
Table 3.6: Identified compounds from the ethyl acetate fraction from fruit ethanolic extract of A.
melegueta by GC-MS
Solvent Compounds Retention time (min) Mass/amu
Ethyl acetate
1 4-Methylphenol 4.44 107 [M]+
2 2,6-Dimethylphenol 5.07 122 [M]+
3 Isobornyl propionate 6.22 210 [M]+
4 Eugenol 6.67 164 [M]+
5 5-Ethyl-2-methyl thiazole 7.65 127 [M]+
6 4-Hydroxy-3-methoxyphenyl butan-
2-one
8.58, 12.43 194 [M]+
7 Benzyl benzoate 9.36 212 [M]+
8 1,2-Benzenedicarboxylic acid, butyl
2-methylpropyl ester
10.26 278 [M]+
9 4-Hydroxy-3-methoxyphenyl decan-
3-one
11.63 278 [M]+
10 1,2-Benzenedicarboxylic acid,
mono(2-ethylhexyl) ester
13.17 279 [M]+

70
Figure 3.14. GC-MS Chromatogram (A) and the structures of compounds (B) identified from the ethyl acetate fraction from fruit ethanolic extract of A. melegueta
A
B
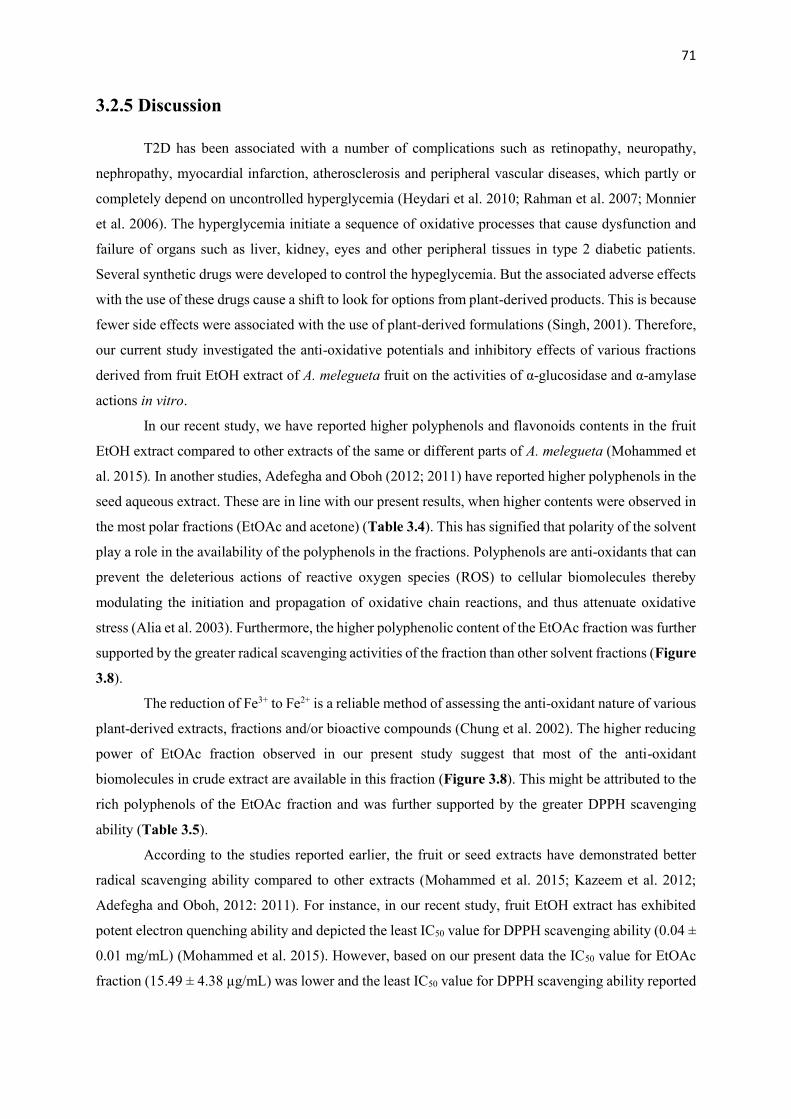
71
3.2.5 Discussion
T2D has been associated with a number of complications such as retinopathy, neuropathy,
nephropathy, myocardial infarction, atherosclerosis and peripheral vascular diseases, which partly or
completely depend on uncontrolled hyperglycemia (Heydari et al. 2010; Rahman et al. 2007; Monnier
et al. 2006). The hyperglycemia initiate a sequence of oxidative processes that cause dysfunction and
failure of organs such as liver, kidney, eyes and other peripheral tissues in type 2 diabetic patients.
Several synthetic drugs were developed to control the hypeglycemia. But the associated adverse effects
with the use of these drugs cause a shift to look for options from plant-derived products. This is because
fewer side effects were associated with the use of plant-derived formulations (Singh, 2001). Therefore,
our current study investigated the anti-oxidative potentials and inhibitory effects of various fractions
derived from fruit EtOH extract of A. melegueta fruit on the activities of α-glucosidase and α-amylase
actions in vitro.
In our recent study, we have reported higher polyphenols and flavonoids contents in the fruit
EtOH extract compared to other extracts of the same or different parts of A. melegueta (Mohammed et
al. 2015). In another studies, Adefegha and Oboh (2012; 2011) have reported higher polyphenols in the
seed aqueous extract. These are in line with our present results, when higher contents were observed in
the most polar fractions (EtOAc and acetone) (Table 3.4). This has signified that polarity of the solvent
play a role in the availability of the polyphenols in the fractions. Polyphenols are anti-oxidants that can
prevent the deleterious actions of reactive oxygen species (ROS) to cellular biomolecules thereby
modulating the initiation and propagation of oxidative chain reactions, and thus attenuate oxidative
stress (Alia et al. 2003). Furthermore, the higher polyphenolic content of the EtOAc fraction was further
supported by the greater radical scavenging activities of the fraction than other solvent fractions (Figure
3.8).
The reduction of Fe3+ to Fe2+ is a reliable method of assessing the anti-oxidant nature of various
plant-derived extracts, fractions and/or bioactive compounds (Chung et al. 2002). The higher reducing
power of EtOAc fraction observed in our present study suggest that most of the anti-oxidant
biomolecules in crude extract are available in this fraction (Figure 3.8). This might be attributed to the
rich polyphenols of the EtOAc fraction and was further supported by the greater DPPH scavenging
ability (Table 3.5).
According to the studies reported earlier, the fruit or seed extracts have demonstrated better
radical scavenging ability compared to other extracts (Mohammed et al. 2015; Kazeem et al. 2012;
Adefegha and Oboh, 2012: 2011). For instance, in our recent study, fruit EtOH extract has exhibited
potent electron quenching ability and depicted the least IC50 value for DPPH scavenging ability (0.04 ±
0.01 mg/mL) (Mohammed et al. 2015). However, based on our present data the IC50 value for EtOAc
fraction (15.49 ± 4.38 µg/mL) was lower and the least IC50 value for DPPH scavenging ability reported
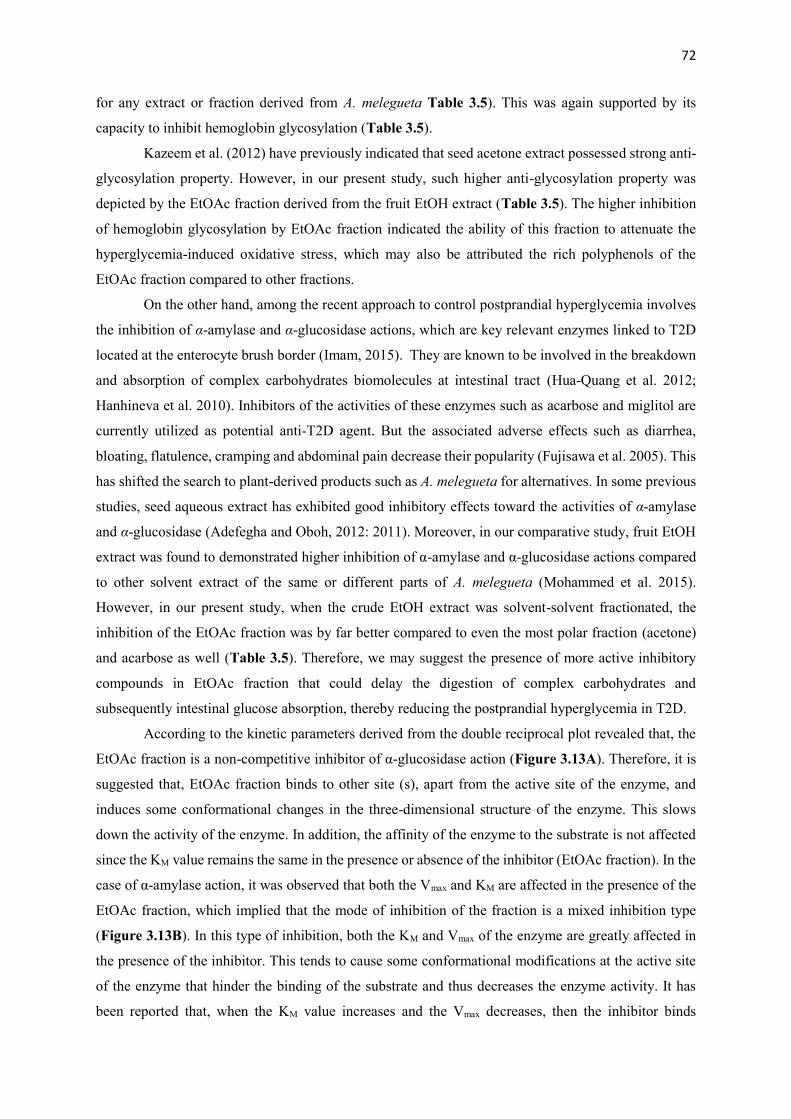
72
for any extract or fraction derived from A. melegueta Table 3.5). This was again supported by its
capacity to inhibit hemoglobin glycosylation (Table 3.5).
Kazeem et al. (2012) have previously indicated that seed acetone extract possessed strong anti-
glycosylation property. However, in our present study, such higher anti-glycosylation property was
depicted by the EtOAc fraction derived from the fruit EtOH extract (Table 3.5). The higher inhibition
of hemoglobin glycosylation by EtOAc fraction indicated the ability of this fraction to attenuate the
hyperglycemia-induced oxidative stress, which may also be attributed the rich polyphenols of the
EtOAc fraction compared to other fractions.
On the other hand, among the recent approach to control postprandial hyperglycemia involves
the inhibition of α-amylase and α-glucosidase actions, which are key relevant enzymes linked to T2D
located at the enterocyte brush border (Imam, 2015). They are known to be involved in the breakdown
and absorption of complex carbohydrates biomolecules at intestinal tract (Hua-Quang et al. 2012;
Hanhineva et al. 2010). Inhibitors of the activities of these enzymes such as acarbose and miglitol are
currently utilized as potential anti-T2D agent. But the associated adverse effects such as diarrhea,
bloating, flatulence, cramping and abdominal pain decrease their popularity (Fujisawa et al. 2005). This
has shifted the search to plant-derived products such as A. melegueta for alternatives. In some previous
studies, seed aqueous extract has exhibited good inhibitory effects toward the activities of α-amylase
and α-glucosidase (Adefegha and Oboh, 2012: 2011). Moreover, in our comparative study, fruit EtOH
extract was found to demonstrated higher inhibition of α-amylase and α-glucosidase actions compared
to other solvent extract of the same or different parts of A. melegueta (Mohammed et al. 2015).
However, in our present study, when the crude EtOH extract was solvent-solvent fractionated, the
inhibition of the EtOAc fraction was by far better compared to even the most polar fraction (acetone)
and acarbose as well (Table 3.5). Therefore, we may suggest the presence of more active inhibitory
compounds in EtOAc fraction that could delay the digestion of complex carbohydrates and
subsequently intestinal glucose absorption, thereby reducing the postprandial hyperglycemia in T2D.
According to the kinetic parameters derived from the double reciprocal plot revealed that, the
EtOAc fraction is a non-competitive inhibitor of α-glucosidase action (Figure 3.13A). Therefore, it is
suggested that, EtOAc fraction binds to other site (s), apart from the active site of the enzyme, and
induces some conformational changes in the three-dimensional structure of the enzyme. This slows
down the activity of the enzyme. In addition, the affinity of the enzyme to the substrate is not affected
since the KM value remains the same in the presence or absence of the inhibitor (EtOAc fraction). In the
case of α-amylase action, it was observed that both the Vmax and KM are affected in the presence of the
EtOAc fraction, which implied that the mode of inhibition of the fraction is a mixed inhibition type
(Figure 3.13B). In this type of inhibition, both the KM and Vmax of the enzyme are greatly affected in
the presence of the inhibitor. This tends to cause some conformational modifications at the active site
of the enzyme that hinder the binding of the substrate and thus decreases the enzyme activity. It has
been reported that, when the KM value increases and the Vmax decreases, then the inhibitor binds

73
favorably to the enzyme in free-form and thereby decrease the affinity of the enzyme for the substrate
(Storey, 2004). Therefore, based on our present data, it seems that the EtOAc fraction binds to the α-
amylase in a free state before binding to its substrate (starch) and results in decrease activity.
Based on the higher anti-oxidative and anti-diabetic actions exhibited by the EtOAc fraction, it
was subjected to GC-MS analysis to detect possible bioactive compounds present in this fraction. It has
been highlighted previously that A. melegueta fruit or seed extracts are rich in phenolic compounds
such as gingerol, paradol, shagaol and eugenol (Mohammed et al. 2015; Ilic et al. 2010). This is in line
with our present data and could possibly be attributed to the observed higher actions of EtOAc fraction
than other solvent fractions. It is also possible from our results that, other compounds detected from the
EtOAc fraction might further contribute significantly to the higher anti-oxidative and enzyme inhibitory
actions of the EtOAc fraction (Table 3.6 and Figure 3.14B). In a nutshell, these compounds may act
individually or in synergy to achieve the strong activities by the EtOAc fraction reported in our present
study.
3.2.6 Conclusions In conclusion, various solvent fractions derived from the fruit ethanolic extract of A. melegueta
possessed anti-oxidative as well as α-amylase and α-glucosidase inhibitory actions in vitro. The EtOAc
fraction has exhibited higher activities compared to other fractions. Thus, it is recommended for further
in vivo anti-diabetic and anti-oxidative actions to fully validate the efficacy of this fraction.

74
According to the anti-oxidative and anti-diabetic study of the various solvent fractions derived from
ethanolic extract of A. melegueta fruit stated above, ethyl acetate fraction exhibited higher activities
compared to other solvent fractions. Therefore it was selected for the in vivo studies.
3.3 Ethyl acetate fraction of Aframomum melegueta fruit
ameliorates pancreatic β-cell dysfunction and major diabetes-
related parameters in a type 2 diabetes model of rats
Aminu Mohammed a,b and Md. Shahidul Islam a*
a Department of Biochemistry, School of Life Sciences, University of KwaZulu-Natal, (Westville
Campus), Durban, 4000, South Africa b Department of Biochemistry, Faculty of Science, Ahmadu Bello University, Zaria-Nigeria
Published in the Journal of Ethnopharmacology 175: 518-527.
3.3.1 Abstract Objectives: In West Africa, various preparations of the fruit, seed and leaf of Aframomum melegueta
K. Schum. are reputably used for the management of diabetes mellitus (DM) and other metabolic
disorders. The present study evaluated the anti-diabetic effects of A. melegueta ethyl acetate fraction
(AMEF) from fruit ethanolic extract in a type 2 diabetes (T2D) model of rats.
Methods: T2D was induced in rats by feeding a 10% fructose solution ad libitum for two weeks
followed by a single intraperitoneal injection of streptozotocin (40 mg/kg body weight) and the animals
were orally treated with 150 or 300 mg/kg body weight (bw) of the AMEF once daily for four weeks.
Results: At the end of the intervention, diabetic untreated animals showed significantly higher serum
glucose, serum fructosamine, LDH, CK-MB, serum lipids, liver glycogen, insulin resistance (HOMA-
IR), AI, CRI and lower serum insulin, β-cell function (HOMA- β) and glucose tolerance ability
compared to the normal animals. Histopathological examination of their pancreas revealed
corresponding pathological changes in the islets and β-cells. These alterations were reverted to near-
normal after the treatment of AMEF at 150 and 300 mg/kg bw when, the effects were more pronounced
at 300 mg/kg bw compared to the 150 mg/kg bw.
Conclusion: The results of our study suggest that AMEF treatment at 300 mg/kg bw showed potent
anti-diabetic effect in a T2D model of rats.
Keywords: Aframomum melegueta, Ethyl acetate fraction, Fruit ethanolic extract, Type 2 diabetes,
Rats.
75
3.3.2 Introduction
Diabetes mellitus (DM) is a condition that causes hyperglycemia due to either decreased insulin
secretion or insulin sensitivity of target tissues (Panni, 2013). Recent data indicate that more than 387
million people have DM and this figure is likely to be doubled by 2035 (IDF, 2014). Among the major
types of diabetes (type 1 and type 2), type 2 is the most prevalent one, accounting for more than 90%
of all diabetic cases. Type 2 diabetes (T2D) is a heterogeneous disorder characterized by insulin
resistance and partially dysfunctional pancreatic β-cells which cannot properly secrete insulin in
response to hyperglycemia (Hui et al. 2007). Insulin resistance usually occurs in the early stage of T2D
after which a further decline of β-cells is induced, resulting in hyperglycemia and hyperlipidemia
(Robertson et al. 2004).
The current treatment option for T2D include mainly oral anti-diabetic drugs, such as-
sulfonylureas, biguanides, α-glucosidase inhibitors, thiazolidinediones and dipeptidyl peptidase-4
(DPP-4) inhibitors among others. But these drugs do not adequately improve the consequences of T2D
and have caused characteristic profiles of serious side effects, which include hypoglycemia, weight
gain, hypersensitivity, gastrointestinal discomfort, nausea, liver and heart failure, and diarrhoea (Hung
et al. 2012). Therefore, search for novel molecules has been extended to natural plant-based remedies,
as they are considered more effective, safe, natural and cause less adverse effects compared to modern
synthetic drugs.
Aframomum melegueta K. Schum. (Zingiberaceae) commonly known as guinea pepper is a
herbaceous plant that grows up to 1500 cm height, with purple flowers that develop into 5-7 cm long
pods containing small, reddish-brown aromatic and pungent seeds. The fruits are ovoid with reddish
color and numerous small brownish angular seeds with a cardamorn flavor (Iwu, 2014). Fruit, seed
and leaf of A. melegueta are commonly used as spices in various food preparations and have been locally
used in the treatment of DM and other metabolic disorders in Nigeria (Gbolade, 2009). In a recent study,
Sugita et al. (2013) reported that A. melegueta seed alcoholic extract stimulates brown adipose tissue
and increases whole-body energy expenditure in human subjects which is directly linked with the
pathogenesis of T2D. In a very recent study, we showed that different solvent extracts from the various
parts (fruit, leaf and stem) of A. melegueta demonstrated anti-oxidative and anti-diabetic potentials in
vitro (Mohammed et al. 2015a). Similarly, in vitro anti-diabetic as well as anti-oxidative potentials of
the aqueous seed extracts of A. melegueta have been reported in many recent studies (Adefegha and
Oboh 2012; Kazeem et al., 2012; Adefegha and Oboh 2011; Etoundi et al., 2010). In another study,
Onoja et al. (2014) have reported the anti-oxidative potentials of seed methanolic extracts of A.
melegueta both in vitro and in vivo. Additionally, phenolics such as gingerols, shogaols, paradols are
compounds reported to be rich in the crude ethanolic extract of the seed which showed minimum
toxicity after a four week oral treatment in rats (Ilic et al., 2010). In preliminary studies, seed (Adesokan
et al., 2010) and leaf (Mojekwu et al., 2011) aqueous extracts of A. melegueta have demonstrated blood
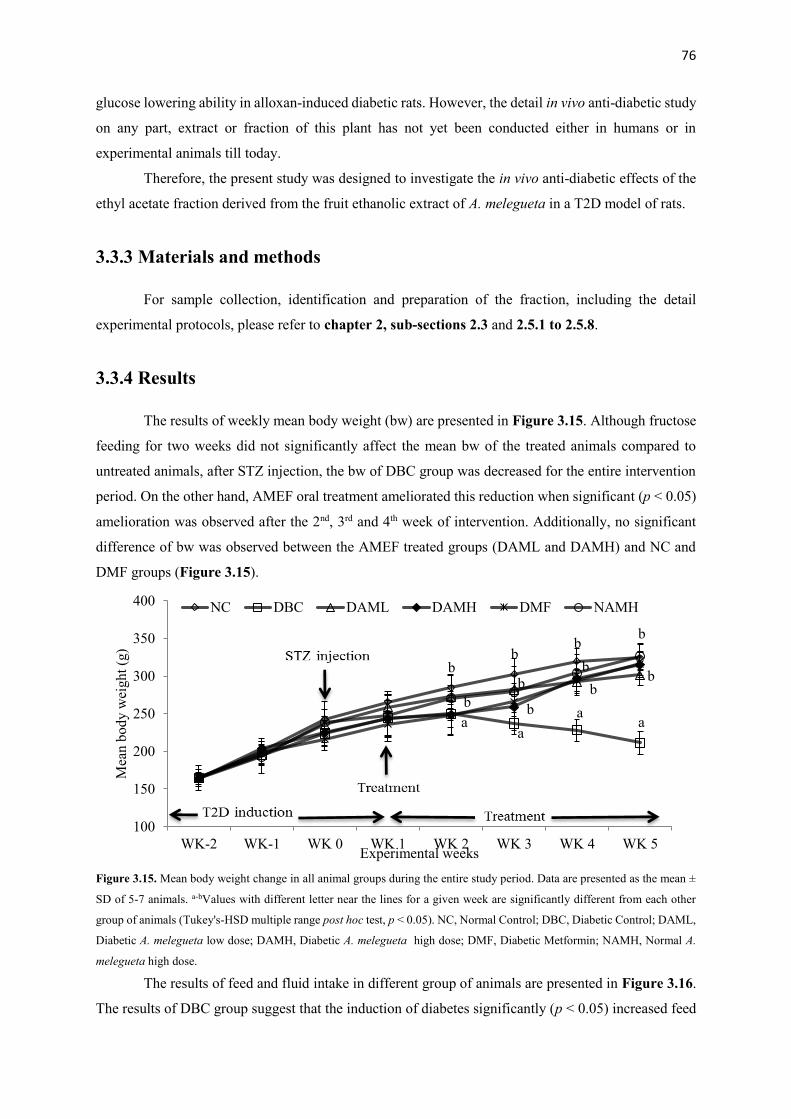
76
glucose lowering ability in alloxan-induced diabetic rats. However, the detail in vivo anti-diabetic study
on any part, extract or fraction of this plant has not yet been conducted either in humans or in
experimental animals till today.
Therefore, the present study was designed to investigate the in vivo anti-diabetic effects of the
ethyl acetate fraction derived from the fruit ethanolic extract of A. melegueta in a T2D model of rats.
3.3.3 Materials and methods
For sample collection, identification and preparation of the fraction, including the detail
experimental protocols, please refer to chapter 2, sub-sections 2.3 and 2.5.1 to 2.5.8.
3.3.4 Results
The results of weekly mean body weight (bw) are presented in Figure 3.15. Although fructose
feeding for two weeks did not significantly affect the mean bw of the treated animals compared to
untreated animals, after STZ injection, the bw of DBC group was decreased for the entire intervention
period. On the other hand, AMEF oral treatment ameliorated this reduction when significant (p < 0.05)
amelioration was observed after the 2nd, 3rd and 4th week of intervention. Additionally, no significant
difference of bw was observed between the AMEF treated groups (DAML and DAMH) and NC and
DMF groups (Figure 3.15).
Figure 3.15. Mean body weight change in all animal groups during the entire study period. Data are presented as the mean ±
SD of 5-7 animals. a-bValues with different letter near the lines for a given week are significantly different from each other
group of animals (Tukey's-HSD multiple range post hoc test, p < 0.05). NC, Normal Control; DBC, Diabetic Control; DAML,
Diabetic A. melegueta low dose; DAMH, Diabetic A. melegueta high dose; DMF, Diabetic Metformin; NAMH, Normal A.
melegueta high dose.
The results of feed and fluid intake in different group of animals are presented in Figure 3.16.
The results of DBC group suggest that the induction of diabetes significantly (p < 0.05) increased feed
bb
b
aa
a a
bb
b
b bb
b
100
150
200
250
300
350
400
WK-2 WK-1 WK 0 WK 1 WK 2 WK 3 WK 4 WK 5
Mea
n bo
dy w
eigh
t (g)
Experimental weeks
NC DBC DAML DAMH DMF NAMH
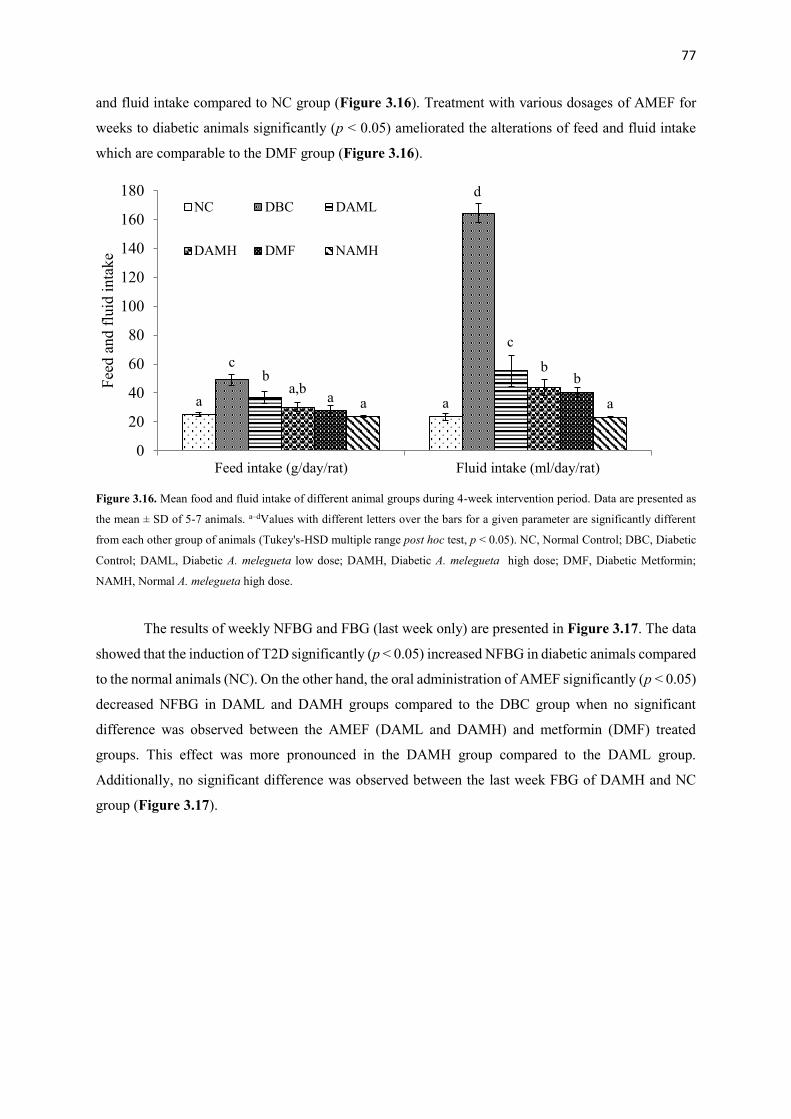
77
and fluid intake compared to NC group (Figure 3.16). Treatment with various dosages of AMEF for
weeks to diabetic animals significantly (p < 0.05) ameliorated the alterations of feed and fluid intake
which are comparable to the DMF group (Figure 3.16).
Figure 3.16. Mean food and fluid intake of different animal groups during 4-week intervention period. Data are presented as
the mean ± SD of 5-7 animals. a–dValues with different letters over the bars for a given parameter are significantly different
from each other group of animals (Tukey's-HSD multiple range post hoc test, p < 0.05). NC, Normal Control; DBC, Diabetic
Control; DAML, Diabetic A. melegueta low dose; DAMH, Diabetic A. melegueta high dose; DMF, Diabetic Metformin;
NAMH, Normal A. melegueta high dose.
The results of weekly NFBG and FBG (last week only) are presented in Figure 3.17. The data
showed that the induction of T2D significantly (p < 0.05) increased NFBG in diabetic animals compared
to the normal animals (NC). On the other hand, the oral administration of AMEF significantly (p < 0.05)
decreased NFBG in DAML and DAMH groups compared to the DBC group when no significant
difference was observed between the AMEF (DAML and DAMH) and metformin (DMF) treated
groups. This effect was more pronounced in the DAMH group compared to the DAML group.
Additionally, no significant difference was observed between the last week FBG of DAMH and NC
group (Figure 3.17).
a a
c
d
b
c
a,bb
ab
a a
0
20
40
60
80
100
120
140
160
180
Feed intake (g/day/rat) Fluid intake (ml/day/rat)
Feed
and
flui
d in
take
NC DBC DAML
DAMH DMF NAMH

78
Figure 3.17. Weekly NFBG of all animal groups during the entire experimental period. Data are presented as the mean ± SD
of 5-7 animals. a–cValues with different letters near the lines for a given week are significantly different from each other group
of animals (Tukey's-HSD multiple range post hoc test, p<0.05). NC, Normal Control; DBC, Diabetic Control; DAML, Diabetic
A. melegueta low dose; DAMH, Diabetic A. melegueta high dose; DMF, Diabetic Metformin; NAMH, Normal A. melegueta
high dose; NFBG, Non-fasting blood glucose; FBG, Fasting blood glucose.
The data of oral glucose tolerance test (OGTT) are presented in Figure 3.18. According to the
results, the glucose tolerance ability of the animals in AMEF treated groups was significantly better
than the DBC group for the entire period of the test when the results were significantly better in the
AMEF treated groups compared to the DMF group from 60-120 min of the test period. No significant
difference was observed between the glucose tolerance ability of AMEF treated groups and NC group
during this period as well (Figure 3.18). Furthermore, the calculated area under curve (AUC) for DBC
group was significantly (p < 0.05) higher compared to NC group when that of DAML and DAMH
groups were significantly (p < 0.05) lower compared to DBC groups and were comparable to the DMF
group (Table 3.7).
b
c c c c
bb
bb
a,b
b
b
b b
a a a aa
0
50
100
150
200
250
300
350
400
450
500
WK 0 WK 1 WK 2 WK 3 WK 4
Blo
od g
luco
se le
vels
(mg/
dL)
Week after intervention
NC DBC DAML DAMH DMF NAMH
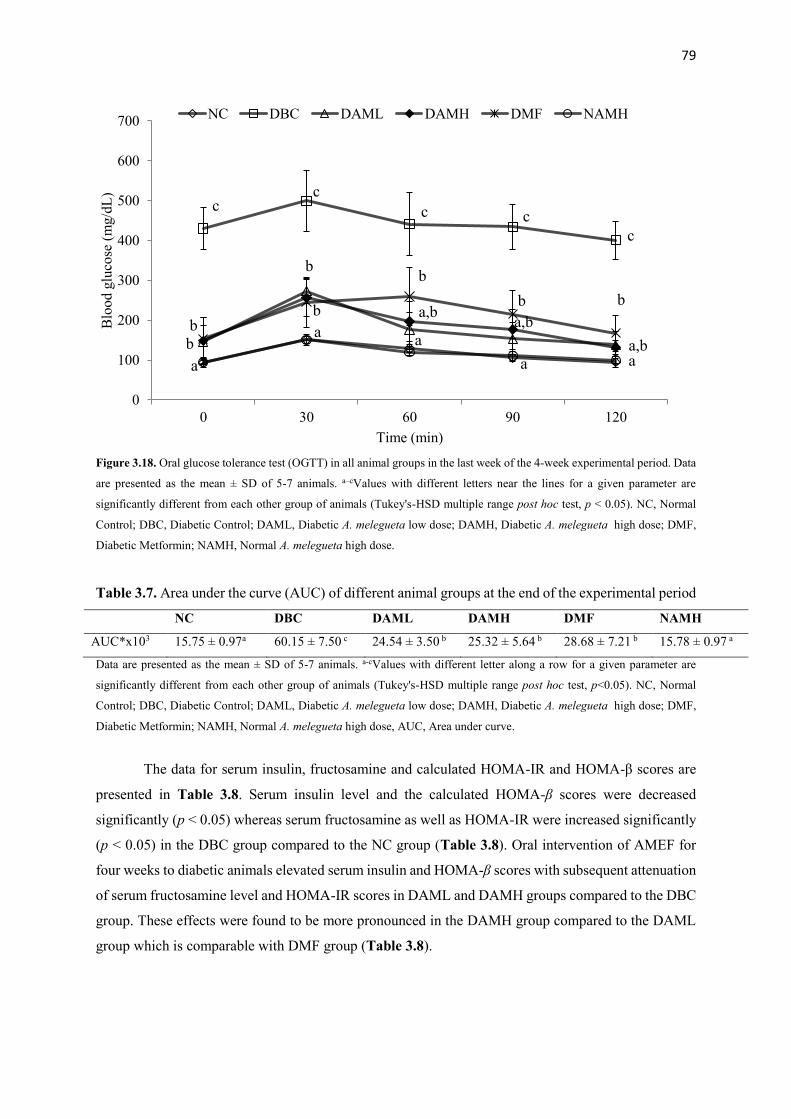
79
Figure 3.18. Oral glucose tolerance test (OGTT) in all animal groups in the last week of the 4-week experimental period. Data
are presented as the mean ± SD of 5-7 animals. a–cValues with different letters near the lines for a given parameter are
significantly different from each other group of animals (Tukey's-HSD multiple range post hoc test, p < 0.05). NC, Normal
Control; DBC, Diabetic Control; DAML, Diabetic A. melegueta low dose; DAMH, Diabetic A. melegueta high dose; DMF,
Diabetic Metformin; NAMH, Normal A. melegueta high dose.
Table 3.7. Area under the curve (AUC) of different animal groups at the end of the experimental period
NC DBC DAML DAMH DMF NAMH
AUC*x103 15.75 ± 0.97a 60.15 ± 7.50 c 24.54 ± 3.50 b 25.32 ± 5.64 b 28.68 ± 7.21 b 15.78 ± 0.97 a
Data are presented as the mean ± SD of 5-7 animals. a-cValues with different letter along a row for a given parameter are
significantly different from each other group of animals (Tukey's-HSD multiple range post hoc test, p<0.05). NC, Normal
Control; DBC, Diabetic Control; DAML, Diabetic A. melegueta low dose; DAMH, Diabetic A. melegueta high dose; DMF,
Diabetic Metformin; NAMH, Normal A. melegueta high dose, AUC, Area under curve.
The data for serum insulin, fructosamine and calculated HOMA-IR and HOMA-β scores are
presented in Table 3.8. Serum insulin level and the calculated HOMA-β scores were decreased
significantly (p < 0.05) whereas serum fructosamine as well as HOMA-IR were increased significantly
(p < 0.05) in the DBC group compared to the NC group (Table 3.8). Oral intervention of AMEF for
four weeks to diabetic animals elevated serum insulin and HOMA-β scores with subsequent attenuation
of serum fructosamine level and HOMA-IR scores in DAML and DAMH groups compared to the DBC
group. These effects were found to be more pronounced in the DAMH group compared to the DAML
group which is comparable with DMF group (Table 3.8).
cc
c cc
b
b a,b a,ba,b
b
b bb b
a
a aa a
0
100
200
300
400
500
600
700
0 30 60 90 120
Blo
od g
luco
se (m
g/dL
)
Time (min)
NC DBC DAML DAMH DMF NAMH

80
Table 3.8. Serum insulin and fructosamine levels, HOMA-IR and HOMA-β scores of different animal groups at the end of the experimental period NC DBC DAML DAMH DMF NAMH
Insulin (pmol/L) 76.50 ± 6.26b 47.05 ± 9.02a 59.86 ± 11.45b 64.81 ± 8.77b 75.88 ± 14.23b 65.49 ± 11.87b
Fructosamine (μmol/L)
239.20 ± 47.49a 365.43 ± 44.94b 298.00 ± 23.39a 247.86 ± 28.96a 283.14 ± 32.46a 274.00 ± 19.95a
HOMA-IR0.27 ± 2.50 ٭a 6.30 ± 1.64c 3.75 ± 0.53b 3.11 ± 0.61b 3.82 ± 0.90b 2.11 ± 0.44a
HOMA-β43.71 ± 127.66 ٭٭d 7.33 ± 1.26a 26.17 ± 10.18b 44.32 ± 9.86b,c 52.57 ± 25.76c 108.60 ± 19.24d
Data are presented as the mean ± SD of 5-7 animals. a–dValues with different letters along the rows for a given parameter are significantly different from each other group of animals (Tukey's-HSD multiple range post hoc test, p<0.05). NC, Normal Control; DBC, Diabetic Control; DAML, Diabetic A. melegueta low dose; DAMH, Diabetic A. melegueta high dose; DMF, Diabetic Metformin; NAMH, Normal A. melegueta high dose; HOMA-IR, Homeostasis model assessment-insulin resistance; HOMA-β, Homeostasis model assessment-β .HOMA-β = (Fasting serum insulin in U/l x 20/Fasting blood glucose in mmol/L-3.5)٭٭.HOMA-IR = [(Fasting serum insulin in U/l x Fasting blood glucose in mmol/L)/22.5]٭
Figure 3.19. Histopathological examination of the pancreatic islets of different animal groups at the end of the intervention period. The NC had a larger islet with high number of β-cells while the DBC had a smaller islet and morphologically deformed β-cells. The DAML, DAMH and DMF groups had relatively larger islets with higher number of β-cells compared to the DBC group. NC, Normal Control; DBC, Diabetic Control; DAML, Diabetic A. melegueta low dose; DAMH, Diabetic A. melegueta high dose; DMF, Diabetic Metformin; NAMH, Normal A. melegueta high dose.
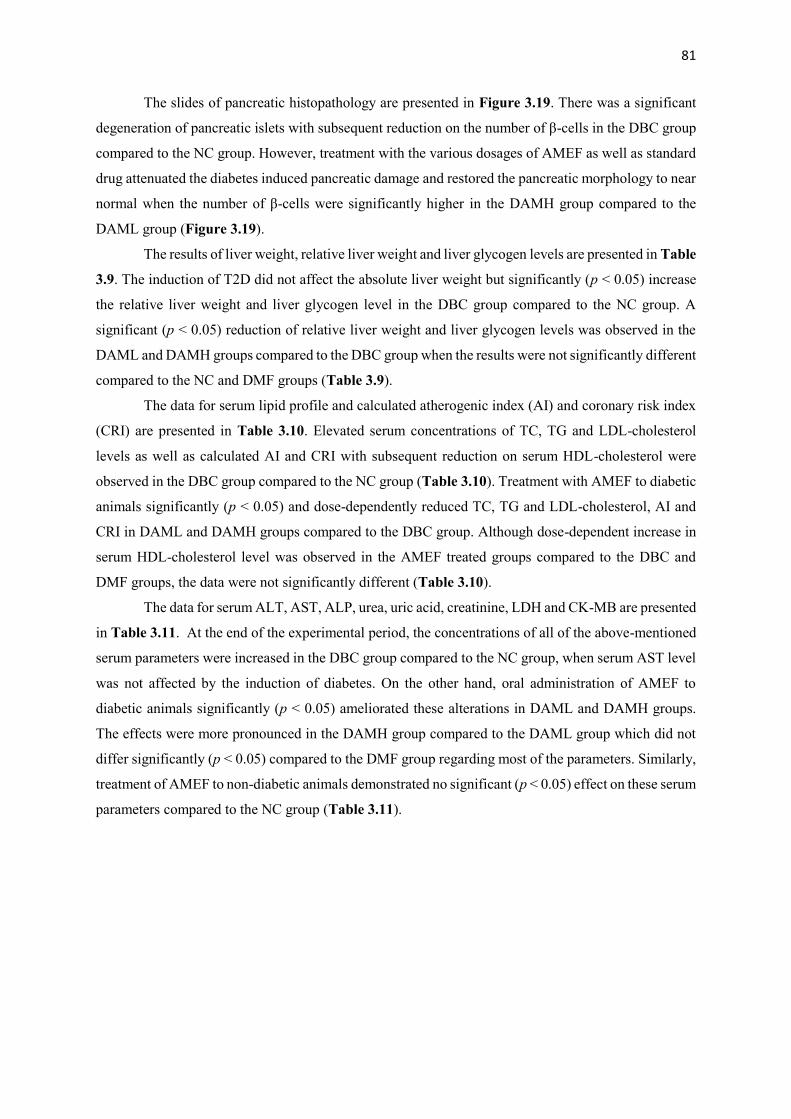
81
The slides of pancreatic histopathology are presented in Figure 3.19. There was a significant
degeneration of pancreatic islets with subsequent reduction on the number of β-cells in the DBC group
compared to the NC group. However, treatment with the various dosages of AMEF as well as standard
drug attenuated the diabetes induced pancreatic damage and restored the pancreatic morphology to near
normal when the number of β-cells were significantly higher in the DAMH group compared to the
DAML group (Figure 3.19).
The results of liver weight, relative liver weight and liver glycogen levels are presented in Table
3.9. The induction of T2D did not affect the absolute liver weight but significantly (p < 0.05) increase
the relative liver weight and liver glycogen level in the DBC group compared to the NC group. A
significant (p < 0.05) reduction of relative liver weight and liver glycogen levels was observed in the
DAML and DAMH groups compared to the DBC group when the results were not significantly different
compared to the NC and DMF groups (Table 3.9).
The data for serum lipid profile and calculated atherogenic index (AI) and coronary risk index
(CRI) are presented in Table 3.10. Elevated serum concentrations of TC, TG and LDL-cholesterol
levels as well as calculated AI and CRI with subsequent reduction on serum HDL-cholesterol were
observed in the DBC group compared to the NC group (Table 3.10). Treatment with AMEF to diabetic
animals significantly (p < 0.05) and dose-dependently reduced TC, TG and LDL-cholesterol, AI and
CRI in DAML and DAMH groups compared to the DBC group. Although dose-dependent increase in
serum HDL-cholesterol level was observed in the AMEF treated groups compared to the DBC and
DMF groups, the data were not significantly different (Table 3.10).
The data for serum ALT, AST, ALP, urea, uric acid, creatinine, LDH and CK-MB are presented
in Table 3.11. At the end of the experimental period, the concentrations of all of the above-mentioned
serum parameters were increased in the DBC group compared to the NC group, when serum AST level
was not affected by the induction of diabetes. On the other hand, oral administration of AMEF to
diabetic animals significantly (p < 0.05) ameliorated these alterations in DAML and DAMH groups.
The effects were more pronounced in the DAMH group compared to the DAML group which did not
differ significantly (p < 0.05) compared to the DMF group regarding most of the parameters. Similarly,
treatment of AMEF to non-diabetic animals demonstrated no significant (p < 0.05) effect on these serum
parameters compared to the NC group (Table 3.11).

82
Table 3.9. Effect of AMEF on liver weights and liver glycogen concentrations in different animal groups as the end of the experimental period.
NC DBC DAML DAMH DMF NAMH
Liver weight(g) 9.25 ± 1.04 10.34 ± 0.31 9.79 ± 0.30 9.75 ± 0.40 9.10 ± 1.33 9.02 ± 0.70
Relative liver weight (%)0.29 ± 2.89 ٭a 4.55 ± 0.34b 3.36 ± 0.04a 3.31 ± 0.40a 3.10 ± 0.45a 2.90 ± 0.25a
Liver glycogen (mg/g
tissue)
6.76 ± 0.81a 8.25 ± 0.83b 7.03 ± 0.53a 6.98 ± 0.63a 6.92 ± 0.56a 6.80 ± 0.57a
Data are presented as the mean ± SD of 5-7 animals. a-bValues with different letter along a row for a given parameter are significantly different from each other group of animals (Tukey's-HSD
multiple range post hoc test, p<0.05). NC, Normal Control; DBC, Diabetic Control; DAML, Diabetic A. melegueta low dose; DAMH, Diabetic A. melegueta high dose; DMF, Diabetic Metformin;
NAMH, Normal A. melegueta high dose.
Relative liver weight (%) = [weight of the liver (g)/body weight (g)] x 100%٭

83
Table 3.10. Serum lipid profiles atherogenic and coronary risk indices of different animal groups at the end of the experimental period
NC DBC DAML DAMH DMF NAMH
TC (mg/dL) 76.20 ± 7.40a 116.00 ± 12.92c 94.86 ± 10.17b 83.29 ± 8.40a,b 95.71 ± 7.74b 78.00 ± 7.91a
TG (mg/dL) 70.20 ± 18.10a 150.86 ± 24.57b 107.71 ± 38.13a 81.14 ± 23.78a 100.71 ± 32.47a 68.80 ± 5.50a
LDL-Cholesterol
(mg/dL)*
12.96 ± 4.16a 57.54 ± 14.45c 40.03 ± 11.21b 30.34 ± 7.28a,b 42.86 ± 8.93b,c 22.84 ± 10.72a
HDL-Cholesterol
(mg/dL)
49.20 ± 8.35b 28.29 ± 6.25a 33.29 ± 6.99a 36.71 ± 8.52a,b 32.71 ± 7.43a 41.40 ± 6.62a,b
AI 0.57 ± 0.13a 3.30 ± 1.08c 2.00 ± 0.91b 1.36 ± 0.54a,b 2.06 ± 0.69b 0.93 ± 0.38a,b
CRI 1.57 ± 0.13a 4.30 ± 1.08c 3.00 ± 0.91b 2.36 ± 0.54a,b 3.06 ± 0.69b 1.93 ± 0.38a,b
Data are presented as mean ± SD of 5-7 animals. a–cValues with different superscript letters along a row for a given parameter are significantly different from each other group of animals (Tukey's-
HSD multiple range post hoc test, p<0.05). NC, Normal Control; DBC, Diabetic Control; DAML, Diabetic A. melegueta low dose; DAMH, Diabetic A. melegueta high dose; DMF, Diabetic
Metformin; NAMH, Normal A. melegueta high dose; TC, Total cholesterol; TG, Triglyceride; LDL-cholesterol, Low density lipoprotein-cholesterol; HDL-cholesterol; High density lipoprotein-
cholesterol; AI, Atherogenic index; CRI, Coronary risk index.
*LDL-Cholesterol (mg/dL)= [TC- HDL- (TG/5)]

84
Table 3.11. Serum ALT, AST, ALP and other biochemical parameters different animal groups at the end of the experimental period
NC DBC DAML DAMH DMF NAMH
ALT (U/L) 77.40 ± 20.38a,b 116.14 ± 37.37c 70.14 ± 10.07a,b 74.14 ± 8.86a,b 93.57 ± 6.86b 58.80 ± 21.67a
AST (U/L) 88.40 ± 11.41 83.29 ± 15.57 80.29 ± 4.19 85.57 ± 10.97 94.71 ± 9.39 82.20 ± 7.46
ALP (U/L) 149.40 ± 11.33a 451.14 ± 35.10c 230.14 ± 31.76b 200.86 ± 26.82a,b 208.86 ± 27.58b 158.60 ± 22.55a
Creatinine (mg/dL) 2.52 ± 0.78b 3.12 ± 0.45b 1.73 ± 0.52a 1.53 ± 0.42a 1.68 ± 0.27a 2.42 ± 0.77a,b
Urea (mg/dL) 22.00 ± 4.69a 60.71 ± 15.71b 21.29 ± 7.80a 29.29 ± 7.11a 26.00 ± 5.00a 27.80 ± 3.90a
Uric acid (mg/dL) 2.06 ± 0.67 2.85 ± 1.18 2.28 ± 0.84 2.77 ± 0.84 2.56 ± 1.36 1.69 ± 1.05
LDH (U/L) 284.00 ± 62.56a 458.86 ± 68.05b 419.14 ± 95.60b 395.14 ± 57.94a,b 361.57 ± 80.66a,b 321.20 ± 78.44a
CK-MB (U/L) 374.54 ± 82.56a 1064.36 ± 537.18b 692.53 ± 128.69a,b 368.16 ± 83.06a 743.97 ± 75.29a,b 508.68 ± 127.34a
Data are presented as mean ± SD of 5-7 animals. a–cValues with different superscript letters along a row for a given parameter are significantly different from each other group of animals (Tukey's-
HSD multiple range post hoc test, p < 0.05). NC, Normal Control; DBC, Diabetic Control; DAML, Diabetic A. melegueta low dose; DAMH, Diabetic A. melegueta high dose; DMF, Diabetic
Metformin; NAMH, Normal A. melegueta high dose; ALT, Alanine transaminase; AST, Alanine transaminase; ALP, Alkaline phosphate; LDH, Lactate dehydrogenase; CK-MB, Creatine kinase.

85
3.3.5 Discussion
In the present study, we have investigated the effect of oral administration of a low and a high
dose of A. melegueta ethyl acetate fraction (AMEF) of fruit ethanolic extract in a T2D model of rats
through four weeks post-treatment period. This is obviously the first study that comprehensively
reported the anti-diabetic effect of A. melegueta despite the reported ethnobotanical potentials of A.
melegueta in the management of diabetes.
It is evident from the results of this study that induction of T2D decreased bw and caused
polyphagia and polydipsia, the classical symptoms of DM (Figures 3.15 and 3.16). The observed
polydipsia could possibly be linked to polyuria due to the excessive fluid retention in uncontrolled
diabetic condition (Kitabchi et al. 2009). Interestingly, post-treatment of AMEF for four weeks
ameliorated these alterations even at a lower dose administered (150 mg/kg bw), indicating possible
recovery from the diabetic state (Figures 3.15 and 3.16). The data were further supported by the
significant reduction in hyperglycemia in AMEF treated groups (Figure 3.17).
It is well known that the successful treatment of T2D requires an effective control of
hyperglycemia and hence search for active anti-hyperglycemic agents cannot be underscored (Bavarva
and Narasimhacharya, 2008). In our study, the marked appearance of hyperglycemia in DBC group
throughout the study period is an indication of successful induction of diabetes. On the other hand, the
AMEF treated diabetic animals responded positively to the treatment and significantly reduced
diabetes-induced hyperglycemia to near normal just after a four-week post-administration period
(Figure 3.17). Similar reduction on blood glucose level was also reported previously when alloxan-
induced diabetic rats were treated with seed aqueous extract (Adesokan et al. 2010). Moreover, in our
present study, the more pronounced anti-hyperglycemic effect in the DAMH group compared to the
DAML group suggests the dose-dependent effects AMEF, which has been further supported by the
significantly better glucose tolerance ability of the animals in treated groups compared to the DBC
group (Table 3.7). Additionally, the AMEF treatment at higher dose (300 mg/kg bw) to normal animals
did not affect the blood glucose levels and therefore confirmed the anti-hyperglycemic ability of AMEF
but not hypoglycemic effect (Figure 3.17), which has been again supported by the pancreatic β-cell
ameliorating as well as insulin secreting effects of AMEF in this study (Figure 3.19 and Table 3.7).
T2D is a heterogeneous disorder characterized by insulin resistance and pancreatic β-cell
dysfunction that cannot properly secrete insulin in response to hyperglycemia (Hui et al. 2007). In this
study, decreased insulin levels and loss of β-cell integrity were observed in the DBC group compared
to the NC group (Table 3.8). In the diabetic AMEF treated as well as DMF groups, these effects were
significantly ameliorated and the morphology of pancreas was restored near to normal. The improved
serum insulin levels in the AMEF treated diabetic animals (DAML and DAMH) (Table 3.8) could be
due to the regeneration of pancreatic islets observed in the pancreatic histology (Figure 3.19), which
has been additionally supported by the significantly higher HOMA-β index (β-cell function) in the
86
treated groups compared to the DBC group (Table 3.8). The significantly lower HOMA-IR index in
the DAML and DAMH groups compared to the DBC group also confirmed the improvement of insulin
sensitivity as well as the stimulation of peripheral glucose absorption in these groups (Table 3.8).
Therefore, the anti-hyperglycemic effect of AMEF could partly be mediated via decreasing insulin
resistance and not only by hyperinsulinomic mechanism. The anti-hyperglycemic effect of AMEF is
further supported by the significantly lower serum fructosamine levels in the DAML and DAMH groups
compared to the DBC group which did not differ significantly with the NC and DMF groups (Table
3.8). This could be attributed to some of the phenolic compounds such as gingerols, shogaols and
paradols that were reported to possessed anti-oxidative potentials (Ilic et al. 2014; 2010).
On the other hand, increase liver weight as well as accumulations of liver glycogen are some
common pathological features of metabolic disorders including T2D which apparently lead to
hepatomegaly (Paschos and Paletas, 2009). In our study, the relative liver weight was found to decrease
in AMEF treated diabetic rats whereas no significant effect was observed in the normal treated animals
(Table 3.9), which is contradictory with an earlier report (Ilic et al. 2010). Ilic et al. (2010) highlighted
an increase on the absolute and relative liver weight in normal animals after the supplementation of
seed ethanolic extract, which could be attributed to the higher dosages (450 and 1500 mg/kg bw) used
in the reported study when the lower dose (120 mg/kg bw) did not cause any significant increase on
absolute and relative liver weight of normal treated animals (Ilic et al. 2010). Similarly, it was also
observed a reduction on glycogen content in the liver of treated diabetic animals, which apparently
indicates the modulation of hepatic glycogenesis. This could possibly be another anti-hyperglycemic
mechanism exhibited by AMEF and has been a possible mode of action by several anti-diabetic plant-
derived formulations and compounds (Bnouham et al. 2006; Grover et al. 2002) which was further
supported by the anti-hyperlipidemic effect of AMEF (Table 3.10).
There has been a significant elevation on serum lipid profiles and calculated AI and CRI indices
with a reduction on serum HDL-cholesterol in DBC group compared to the NC group (Table 3.10).
This might be due to the effect of fructose feeding on DBC group. Fructose metabolism has been shown
to be independent of insulin action, which is an important factor for the regulation of fats production as
well as energy utilization by the cells (Basciano et al. 2005). In addition, fructose induced more
hyperlipidemic condition by increasing the levels of LDL, VLDL and total cholesterol in experimental
animals compared to other carbohydrates molecules (Benado et al. 2004). Oral intervention of AMEF
at lower and higher dosages as well as the standard drug prevents diabetes-induced dyslipidemia,
reduced the risk of atherogenesis and coronary artery disease and augmented serum HDL-cholesterol
level (Table 3.10).
In addition to decreased dyslipidemia as well as the risk of atherogenesis and coronary artery
diseases, diabetic AMEF treated animals demonstrated a lower serum LDH and CK-MB levels,
suggesting the cardio-protective effects of AMEF (Table 3.11). The CK-MB occurs to a much greater
extent in cardiac muscle than skeletal muscle and is thus a useful diagnostic marker in myocardial
87
infarction (Baird et al. 2012). Furthermore, the serum levels of ALT, ALP and urea were significantly
elevated in DBC group compared to NC group (Table 3.11). In many disease conditions such as DM,
hepatocellular damage increases the release of serum ALT, ALP and urea into circulation which is an
indication of hepatic injuries, infarction and functional disturbance of hepatic cells (Abolfathi et al.
2012). It was observed from the result that serum AST level was not affected by the diabetes (Table
3.11). In comparison with ALT, AST is less specific for the detection of hepatic injury (Center, 2007).
This is partly due to the fact that, the half-life of ALT is much longer compared to AST in experimental
animals (Ramaiah, 2007; Meyer and Harvey, 2004). Therefore, in a condition of acute liver injury, there
will be an increase in both serum ALT and AST levels. However, the serum AST level may likely return
to normal more rapidly compared to the level of serum ALT, which make ALT more sensitive in
assessing hepatic damage in disease conditions (Ramaiah, 2007; Meyer and Harvey, 2004). Therefore,
the unaffected serum AST level in our present result could be link to above-stated factor. Hence, the
hepato-protective ability of AMEF is supported by the reduced serum ALT, ALP and urea levels in the
DAML and DAMH groups compared to the DBC group (Table 3.11). Furthermore, the moderate
reduction on serum creatinine, urea and uric acid demonstrate the ability of AMEF to attenuate diabetic
nephropathy (Fogo and Kon, 2001). The significantly lower serum creatinine, urea and uric acid in the
AMEF treated groups compared to the DBC group suggest its possible effects on the amelioration of
diabetic nephropathy (Table 3.11).
3.3.6 Conclusion
In conclusion, various doses of A. melengueta ethyl acetate fraction from fruit possess strong
anti-T2D activity via improving bw gain, reducing food and fluid intake and hyperglycemia, improving
glucose tolerance ability, insulin sensitivity, amelioration of pancreatic β-cell and β-cell functions,
improving dyslipidemia and number of organ specific diabetic-complications related parameters.
Hence, ethyl acetate fraction of A. melengueta fruit from crude ethanolic extract may be an excellent
anti-diabetic natural product with no considerable side effects. Further clinical study is required to
confirm its effects in human subjects. The isolation and partial characterization of the active principle
from AMEF is currently underway to find the compounds responsible for this activity in addition to its
molecular mechanisms behind the anti-diabetic activity.

88
3.4 Anti-oxidant potential of Aframomum melegueta fruit ethyl
acetate fraction in a type 2 diabetes model of rats
Aminu Mohammed a,b and Md. Shahidul Islam a*
aDepartment of Biochemistry, School of Life Sciences, University of KwaZulu-Natal, (Westville
Campus), Durban, 4000, South Africa bDepartment of Biochemistry, Faculty of Science, Ahmadu Bello University, Zaria-Nigeria
3.4.1 Abstract Objectives: The present study evaluated the in vivo anti-oxidative actions of Aframomum melegueta
ethyl acetate fraction (AMEF) from fruit ethanolic extract in a type 2 diabetes (T2D) model of rats.
Methods: T2D was induced in rats by feeding a 10% fructose solution ad libitum for two weeks
followed by a single intraperitoneal injection of streptozotocin (40 mg/kg body weight (bw)) and the
animals were orally treated with 150 or 300 mg/kg bw of the AMEF once daily for four weeks.
Results: After four weeks of intervention, diabetic untreated animals showed significantly higher levels
of thiobarbituric acid reactive substances (TBARS) and lower levels of reduced glutathione (GSH) in
the serum and organs (liver, kidney, heart and pancreas) compared to the normal animals. The activities
of endogenous anti-oxidant enzymes (superoxide dismutase, catalase, glutathione peroxidase and
reductase) were greatly altered in the serum and organs of diabetic untreated animals compared to the
normal animals. These alterations were reverted to near-normal after the treatment of AMEF, especially
at the dose of 300 mg/kg bw.
Conclusion: The results of our study suggest that AMEF treatment at 300 mg/kg bw showed potent
anti-oxidative action in a T2D model of rats.
Keywords: Aframomum melegueta, Anti-oxidant, Ethyl acetate fraction, Fruit ethanolic extract, Type
2 diabetes, Rats.
3.4.2 Introduction
The progressive increase of DM is quite alarming and the disease affects people mostly living
in the low- and middle-income countries. Recent data from the International Diabetes Federation (IDF)
indicates that DM affects over 387 million people and this figure is likely to be increased to 592 million
by 2035 (IDF, 2014; Guariguata et al. 2014). Between the two major types of diabetes, type 2 diabetes
(T2D) is the most prevalent one and about 90-95% of diabetic patients suffer from T2D (van-Dam et
al. 2002). T2D is a heterogeneous disorder characterized by insulin resistance and partial pancreatic β-
89
cell dysfunction, leading to hyperglycemia (Hui et al. 2007). As a result of the hyperglycemia in T2D,
various macro- and micro-vascular complications develop which have been attributed to oxidative
stress, a major contributor to pancreatic β-cell damage (Quilliot et al. 2005).
Oxidative stress is a condition due to an imbalance between the generations of reactive oxygen
species (ROS) and the quenching of those free radicals by in vivo anti-oxidant system (AS), thereby
shifting the ROS/AS balance in favor of stress (Rahimi et al. 2005). The ROS are derived from the
normal physiological processes but become harmful when they are not quenched by the cascade of anti-
oxidant defense systems. It has been highlighted that, the major contributors of hyperglycemia-induced
oxidative stress include glucose toxicity, protein glycosylation, increased production of glycation end
products and mitochondrial ROS, the polyol, hexosamine and protein kinase C pathways (Giacco and
Brownlee, 2010; Chang and Chuang, 2010; Chung et al. 2003; Maritim et al. 2003). Therefore, the
increased intake of anti-oxidants is necessary to prevent the oxidative damages due to oxidative stress.
However, the use of synthetic anti-oxidants such as butylated hydroxy anisole (BHA), butylated
hydroxy toluene (BHT), tertiary butylated hydroquinon and gallic acid esters in food protection and
disease control have been associated with unwanted consequences. This has motivated researchers to
look for options from plant-derived anti-oxidants that may offer better protection with lesser side effects
(Michael et al. 2005).
Aframomum melegueta K. Schum. (Zingiberaceae) is a plant which fruits, seeds and leaves are
commonly used as spices in various food preparations and have been locally used in the treatment of
DM and other metabolic disorders in Nigeria (Gbolade, 2009). In our previous study, fruit EtOH extract
of A. melegueta has demonstrated potent anti-oxidant action and anti-diabetic actions in vitro
(unpublished data). Additionally several studies reported previously, various seed extracts of A.
melegueta have shown interesting anti-oxidative as well as anti-oxidative actions in vitro (Adefegha
and Oboh 2012; Kazeem et al. 2012; Adefegha and Oboh 2011; Etoundi et al. 2010). Our recent findings
have shown that, A. melegueta ethyl acetate fraction (AMEF) fruit EtOH extract exhibited anti-
hyperglycemic action, ameliorated pancreatic β-cell dysfunction and other major diabetes-related
parameters in a T2D model of rats (Mohammed et al. 2015b). In a recent preliminary study, Onoja et
al. (2014) reported that the seed EtOH extract of A. melegueta improved the serum anti-oxidant
parameters in normal rats, when the detail in vivo anti-oxidant action of any part of the A. melegueta
has not yet been conducted.
Therefore, in the present study we intend to comprehensively study the in vivo anti-oxidant
potentials of the ethyl acetate fraction derived from the fruit ethanolic extract of A. melegueta in a T2D
model of rats.
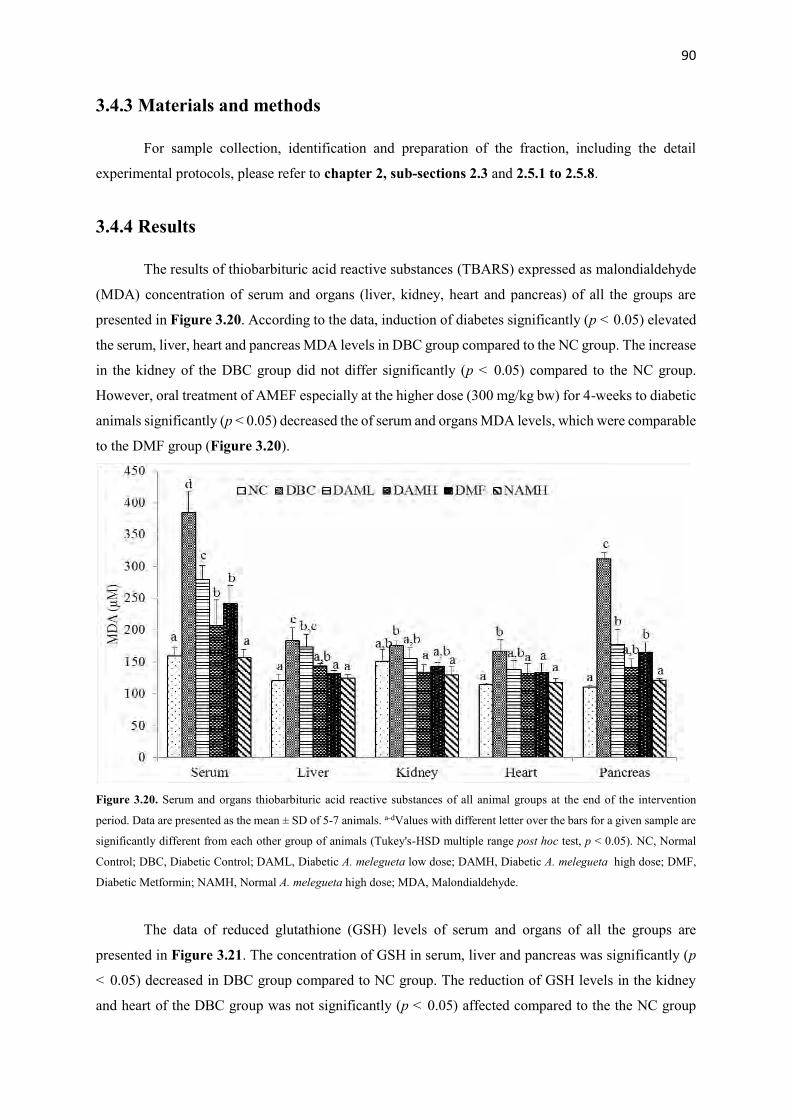
90
3.4.3 Materials and methods
For sample collection, identification and preparation of the fraction, including the detail
experimental protocols, please refer to chapter 2, sub-sections 2.3 and 2.5.1 to 2.5.8.
3.4.4 Results
The results of thiobarbituric acid reactive substances (TBARS) expressed as malondialdehyde
(MDA) concentration of serum and organs (liver, kidney, heart and pancreas) of all the groups are
presented in Figure 3.20. According to the data, induction of diabetes significantly (p < 0.05) elevated
the serum, liver, heart and pancreas MDA levels in DBC group compared to the NC group. The increase
in the kidney of the DBC group did not differ significantly (p < 0.05) compared to the NC group.
However, oral treatment of AMEF especially at the higher dose (300 mg/kg bw) for 4-weeks to diabetic
animals significantly (p < 0.05) decreased the of serum and organs MDA levels, which were comparable
to the DMF group (Figure 3.20).
Figure 3.20. Serum and organs thiobarbituric acid reactive substances of all animal groups at the end of the intervention
period. Data are presented as the mean ± SD of 5-7 animals. a-dValues with different letter over the bars for a given sample are
significantly different from each other group of animals (Tukey's-HSD multiple range post hoc test, p < 0.05). NC, Normal
Control; DBC, Diabetic Control; DAML, Diabetic A. melegueta low dose; DAMH, Diabetic A. melegueta high dose; DMF,
Diabetic Metformin; NAMH, Normal A. melegueta high dose; MDA, Malondialdehyde.
The data of reduced glutathione (GSH) levels of serum and organs of all the groups are
presented in Figure 3.21. The concentration of GSH in serum, liver and pancreas was significantly (p
< 0.05) decreased in DBC group compared to NC group. The reduction of GSH levels in the kidney
and heart of the DBC group was not significantly (p < 0.05) affected compared to the the NC group
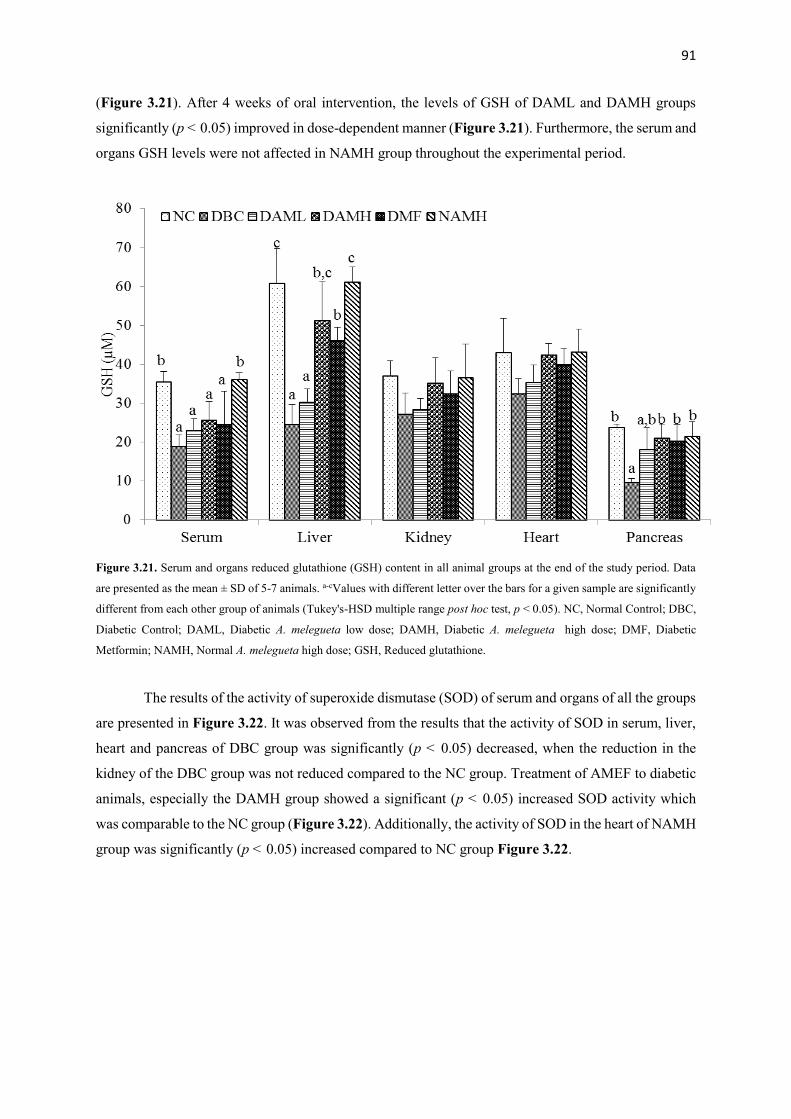
91
(Figure 3.21). After 4 weeks of oral intervention, the levels of GSH of DAML and DAMH groups
significantly (p < 0.05) improved in dose-dependent manner (Figure 3.21). Furthermore, the serum and
organs GSH levels were not affected in NAMH group throughout the experimental period.
Figure 3.21. Serum and organs reduced glutathione (GSH) content in all animal groups at the end of the study period. Data
are presented as the mean ± SD of 5-7 animals. a-cValues with different letter over the bars for a given sample are significantly
different from each other group of animals (Tukey's-HSD multiple range post hoc test, p < 0.05). NC, Normal Control; DBC,
Diabetic Control; DAML, Diabetic A. melegueta low dose; DAMH, Diabetic A. melegueta high dose; DMF, Diabetic
Metformin; NAMH, Normal A. melegueta high dose; GSH, Reduced glutathione.
The results of the activity of superoxide dismutase (SOD) of serum and organs of all the groups
are presented in Figure 3.22. It was observed from the results that the activity of SOD in serum, liver,
heart and pancreas of DBC group was significantly (p < 0.05) decreased, when the reduction in the
kidney of the DBC group was not reduced compared to the NC group. Treatment of AMEF to diabetic
animals, especially the DAMH group showed a significant (p < 0.05) increased SOD activity which
was comparable to the NC group (Figure 3.22). Additionally, the activity of SOD in the heart of NAMH
group was significantly (p < 0.05) increased compared to NC group Figure 3.22.
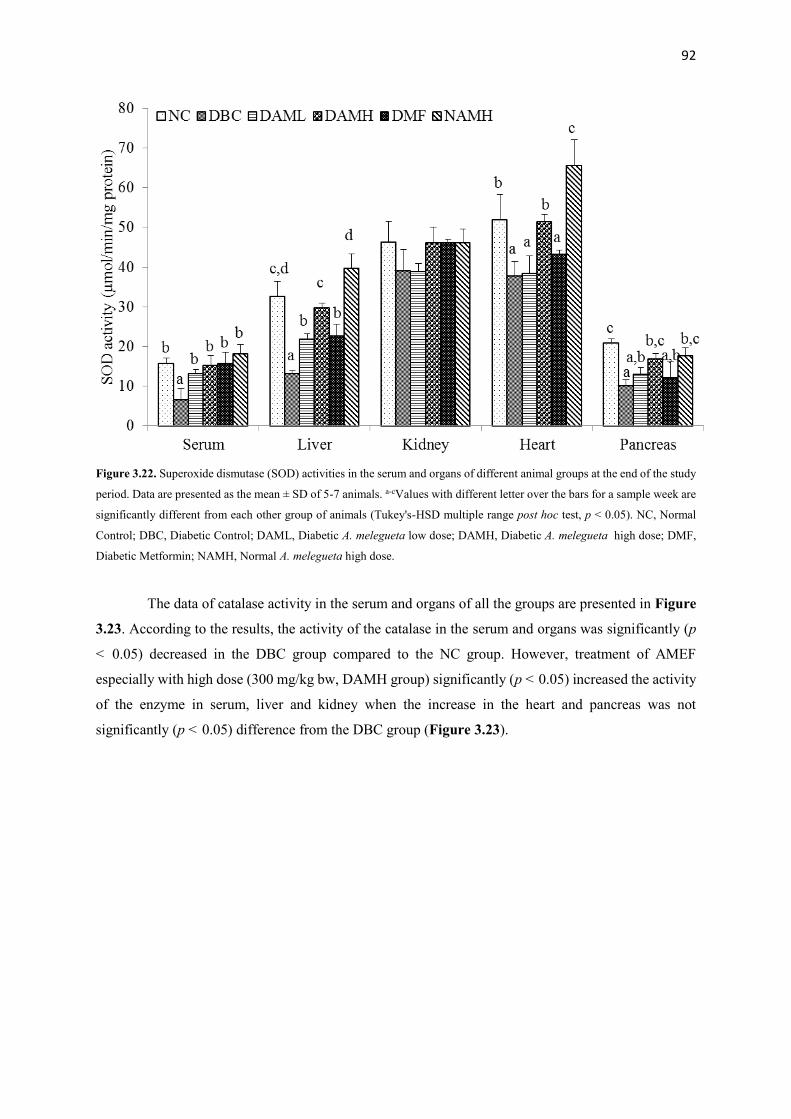
92
Figure 3.22. Superoxide dismutase (SOD) activities in the serum and organs of different animal groups at the end of the study
period. Data are presented as the mean ± SD of 5-7 animals. a-cValues with different letter over the bars for a sample week are
significantly different from each other group of animals (Tukey's-HSD multiple range post hoc test, p < 0.05). NC, Normal
Control; DBC, Diabetic Control; DAML, Diabetic A. melegueta low dose; DAMH, Diabetic A. melegueta high dose; DMF,
Diabetic Metformin; NAMH, Normal A. melegueta high dose.
The data of catalase activity in the serum and organs of all the groups are presented in Figure
3.23. According to the results, the activity of the catalase in the serum and organs was significantly (p
< 0.05) decreased in the DBC group compared to the NC group. However, treatment of AMEF
especially with high dose (300 mg/kg bw, DAMH group) significantly (p < 0.05) increased the activity
of the enzyme in serum, liver and kidney when the increase in the heart and pancreas was not
significantly (p < 0.05) difference from the DBC group (Figure 3.23).

93
Figure 3.23. Catalase activities in the serum and different organs of different animal groups at the end of the study period.
Data are presented as the mean ± SD of 5-7 animals. a-dValues with different letter over the bars for a given sample are
significantly different from each other group of animals (Tukey's-HSD multiple range post hoc test, p < 0.05). NC, Normal
Control; DBC, Diabetic Control; DAML, Diabetic A. melegueta low dose; DAMH, Diabetic A. melegueta high dose; DMF,
Diabetic Metformin; NAMH, Normal A. melegueta high dose.
The results of the activity of glutathione peroxidase (GPx) in serum and organs of all the groups
are presented in Figure 3.24. The activity of the GPx in the serum and organs was significantly (p <
0.05) decreased in the DBC group compared to the NC group. Oral treatment with the fraction,
significantly (p < 0.05) increased the GPx activity in the DAMH group which is comparable to the
DMF group (Figure 3.24). It was also observed that the GPx activity in the serum and organs of NAMH
group was increased although not statistically different from the NC group (Figure 3.24).
The data of glutathione reductase (GR) activity in the serum and organs of all the groups are
presented in Figure 3.25. The activity of this enzyme was not affected by the induction of diabetes in
the kidney and heart, whereas significantly (p < 0.05) decreased in the serum, liver and pancreas of the
DBC group compared to the NC group (Figure 3.25). After treatment with AMEF for 4-weeks, the GR
activity was significantly (p < 0.05) increased in the serum, liver and pancreas of the DAMH group,
when the effect was not statistically different in the kidney and heart compared to the DBC group
(Figure 3.25). In addition, the activity of GR in heart of NAMH group was significantly (p < 0.05)
increased compared to the NC group (Figure 3.25).
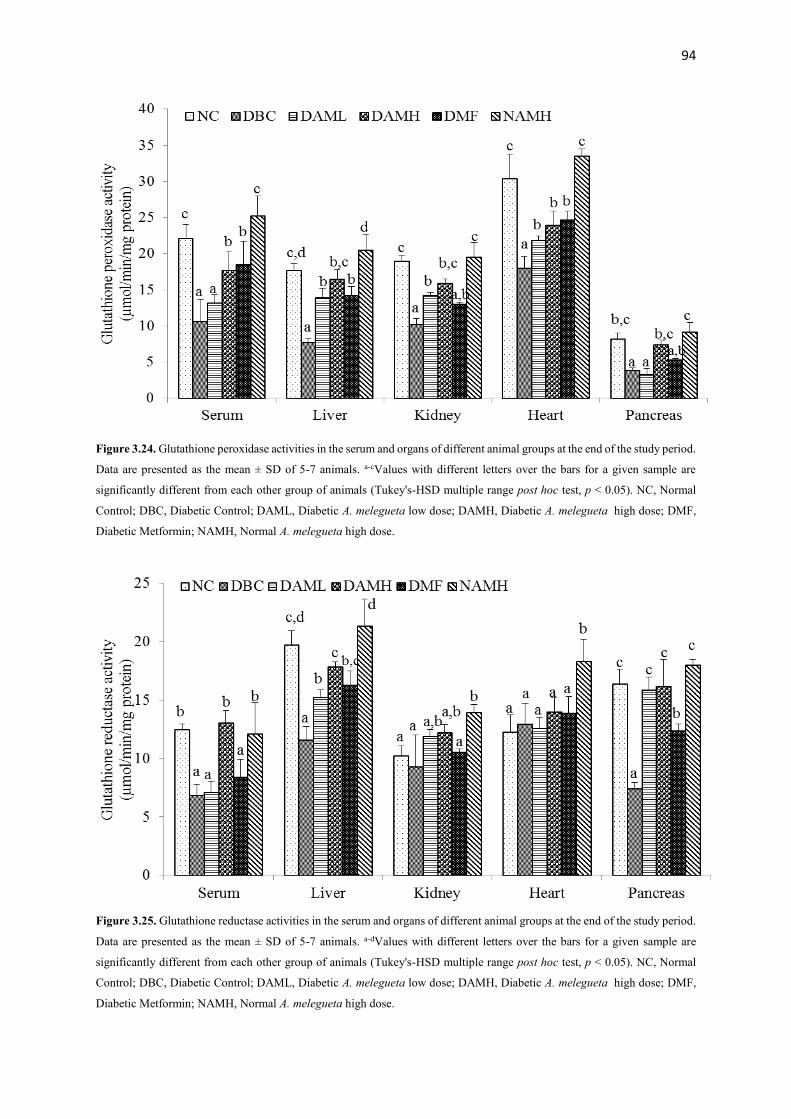
94
Figure 3.24. Glutathione peroxidase activities in the serum and organs of different animal groups at the end of the study period.
Data are presented as the mean ± SD of 5-7 animals. a-cValues with different letters over the bars for a given sample are
significantly different from each other group of animals (Tukey's-HSD multiple range post hoc test, p < 0.05). NC, Normal
Control; DBC, Diabetic Control; DAML, Diabetic A. melegueta low dose; DAMH, Diabetic A. melegueta high dose; DMF,
Diabetic Metformin; NAMH, Normal A. melegueta high dose.
Figure 3.25. Glutathione reductase activities in the serum and organs of different animal groups at the end of the study period.
Data are presented as the mean ± SD of 5-7 animals. a-dValues with different letters over the bars for a given sample are
significantly different from each other group of animals (Tukey's-HSD multiple range post hoc test, p < 0.05). NC, Normal
Control; DBC, Diabetic Control; DAML, Diabetic A. melegueta low dose; DAMH, Diabetic A. melegueta high dose; DMF,
Diabetic Metformin; NAMH, Normal A. melegueta high dose.

95
3.4.5 Discussion
In our recent findings, EtOAc fraction derived from fruit EtOH extract of A. melegueta
exhibited anti-hyperglycemic action, ameliorated pancreatic β-cell dysfunction and other major
diabetes-related parameters in a T2D model of rats (unpublish data). Therefore we hypothesized that
AMEF may attenuate serum and organs oxidative-stress induced by hyperglycemia in type 2 diabetic
rats. The results of our present study are quite promising as oral treatment of the AMEF ameliorated
most of the alterations caused by the induction of diabetes in the serum and various organs.
In a recent study, Onoja et al. (2014) reported that the treatment of A. melegueta seed extract
(400 mg/kg bw) to normal rats decreased the serum MDA levels which is in line with our present study.
According to the data of our present study, the treatment of AMEF even at a lower dose (300 mg/kg
bw) has showed potent anti-oxidative action (Figure 3.20). It has been postulated that increase ROS
production in T2D initiates peroxidation of lipids and stimulates hemoglobin and other protein glycation
which in turn causes cellular and tissue damages (Sabu and Kuttan, 2002; Boynes, 1991). Therefore the
reductions of MDA levels in the serum and organs by AMEF treatment supports the results of ours and
many previous studies that showed the strong ability of extracts or fractions from A. melegueta in
scavenging the deleterious effects of ROS in vitro (Mohammed et al. 2015; Adefegha and Oboh 2012;
Kazeem et al. 2012; Adefegha and Oboh 2011; Etoundi et al. 2010). The reduction of MDA levels was
further supported by the increase of reduced glutathione levels in the serum and organs as well (Figure
3.21).
Glutathione is a tripeptide that contributes immensely to the reduction of the deleterious cellular
damages induced by lipid peroxidation (Lu, 1999). In our present study, the reduction of reduced
glutathione (GSH) in the DBC group signifies the higher utilization of GSH due to diabetes-induced
oxidative stress (Figure 3.21). Treatment of AMEF augmented the serum and organs GSH levels in
dose-dependent manner (Figure 3.21). Therefore we suggest that AMEF may likely to improve the
biosynthesis of GSH or attenuated the oxidative processes leading to GSH reduction, or exhibited both
effects. Our results were further supported by the ability of the AMEF to increase the activity of
superoxide dismutase (Figure 3.22).
There is a close relationship between hyperglycemia in T2D and the elevation of cellular
superoxide radical production (Rahimi et al. 2005). An enzyme superoxide dismutase (SOD) scavenges
the superoxide radical by converting the radical to hydrogen peroxide (H2O2) and molecular oxygen
(Sati et al. 2010). In a recent study, Onoja et al. (2014) indicated that, a significant increase of serum
SOD levels was observed in normal rats after 4-weeks treatment period of seed methanolic extract (400
mg/kg bw). This was similarly observed in our present data (Figure 3.22). Therefore, the anti-oxidative
actions of A. melegueta may partly be mediated via an increase in the activities of SOD, which again
was further supported by the increasing activities of catalase in the serum and other related organs
(Figure 3.23).
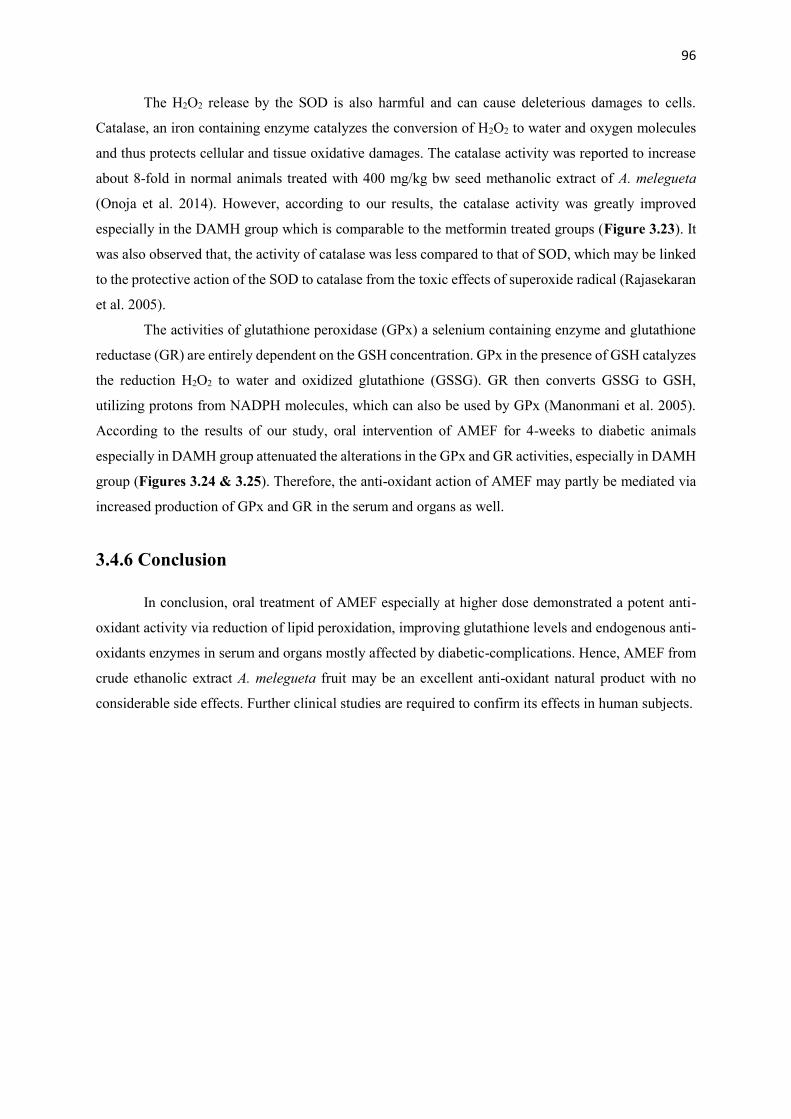
96
The H2O2 release by the SOD is also harmful and can cause deleterious damages to cells.
Catalase, an iron containing enzyme catalyzes the conversion of H2O2 to water and oxygen molecules
and thus protects cellular and tissue oxidative damages. The catalase activity was reported to increase
about 8-fold in normal animals treated with 400 mg/kg bw seed methanolic extract of A. melegueta
(Onoja et al. 2014). However, according to our results, the catalase activity was greatly improved
especially in the DAMH group which is comparable to the metformin treated groups (Figure 3.23). It
was also observed that, the activity of catalase was less compared to that of SOD, which may be linked
to the protective action of the SOD to catalase from the toxic effects of superoxide radical (Rajasekaran
et al. 2005).
The activities of glutathione peroxidase (GPx) a selenium containing enzyme and glutathione
reductase (GR) are entirely dependent on the GSH concentration. GPx in the presence of GSH catalyzes
the reduction H2O2 to water and oxidized glutathione (GSSG). GR then converts GSSG to GSH,
utilizing protons from NADPH molecules, which can also be used by GPx (Manonmani et al. 2005).
According to the results of our study, oral intervention of AMEF for 4-weeks to diabetic animals
especially in DAMH group attenuated the alterations in the GPx and GR activities, especially in DAMH
group (Figures 3.24 & 3.25). Therefore, the anti-oxidant action of AMEF may partly be mediated via
increased production of GPx and GR in the serum and organs as well.
3.4.6 Conclusion
In conclusion, oral treatment of AMEF especially at higher dose demonstrated a potent anti-
oxidant activity via reduction of lipid peroxidation, improving glutathione levels and endogenous anti-
oxidants enzymes in serum and organs mostly affected by diabetic-complications. Hence, AMEF from
crude ethanolic extract A. melegueta fruit may be an excellent anti-oxidant natural product with no
considerable side effects. Further clinical studies are required to confirm its effects in human subjects.
97
CHAPTER 4
4.0 In vitro and in vivo anti-diabetic and anti-oxidative effects of
various extracts and fractions from different parts of Xylopia
aethiopica
4.1 Phytochemistry, anti-oxidative and anti-diabetic effects of
extracts from various parts of Xylopia aethiopica in vitro
Aminu Mohammed,1,3 Neil Anthony Koorbanally2 and Md. Shahidul Islam1*
1Department of Biochemistry, School of Life Sciences and 2Department of Chemistry, School of Chemistry and Physics, University of KwaZulu-Natal, (Westville Campus), Durban, 4000, South Africa 3Department of Biochemistry, Faculty of Science, Ahmadu Bello University, Zaria-Nigeria
4.1.1 Abstract Objective: Various parts of Xylopia aethiopica (Dunal) A. Rich. are used for traditional treatment of
different diseases such as diabetes, microbial infections and diarrhea in Africa. This study investigated
and compared the in vitro anti-oxidative, anti-diabetic effects and possible compounds present in
various solvent extracts of fruit, leaf, stem and root of X. aethiopica.
Methods: Samples were sequentially extracted using solvents of increasing polarity. They were
subjected and investigated for 1,1-diphenyl-2-picryl-hydrazyl (DPPH) radical scavenging activity,
ferric reducing power, inhibition of hemoglobin glycation, α-amylase and α-glucosidase activities as
markers of in vitro anti-diabetic effects at various doses (30-240 µg/mL). Possible compounds were
analyzed using Gas Chromatography-Mass Spectroscopic (GC-MS) analysis.
Results: The ethanolic (EtOH) extracts from the fruit and leaf have exhibited higher total polyphenol
and flavonoid contents compared to other extracts. Furthermore, for all the in vitro models used in this
study, EtOH extracts from the fruit and leaf demonstrated significantly lower IC50 values compared to
other extracts, when fruit EtOH extract showed the lowest IC50 value (DPPH: 0.04 ± 0.01 mg/mL;
inhibition of hemoglobin glycation: 0.16 ± 0.01 mg/mL; -amylase: 0.21 ± 0.01 mg/mL; -glucosidase:
0.08 ± 0.01 mg/mL). The GC-MS analysis of the most active extracts (EtOH fruit and leaf) revealed the
presence of majorly terpenes and aromatic compounds and other fatty acids derivatives as possible
compounds.
Conclusion: Fruit EtOH extract exhibited higher anti-oxidative and anti-diabetic effects compared to
other solvent extracts in vitro and thus require further work to fully validate these effects in vivo.
Keywords: Anti-oxidative, α-amylase, α-glucosidase, Type 2 diabetes, Xylopia aethiopica
98
4.1.2 Introduction
Diabetes mellitus (DM) is the fast growing metabolic disorder and a leading cause of morbidity
in developing countries. It is a heterogeneous group of metabolic disorders characterized by persistent
hyperglycemia (Neelesh et al. 2010) and alteration in the metabolism of major cellular biomolecules as
a result of defects in insulin secretion and/or insulin action (Maritim et al. 2003). Type 2 diabetes (T2D)
is most prevalent among the major forms of DM. T2D is a heterogeneous disorder characterized by
insulin resistance and pancreatic β-cell dysfunction leading to hyperglycemia (Hui et al. 2007). In
chronic uncontrolled hyperglycemia, there is an increased production of reactive oxygen species (ROS)
and reduced anti-oxidant defense system, which is referred as oxidative stress. This leads to initiation
of the major processes that underlay the various diabetic associated complications, and in the absence
of effective treatment result to death (ADA, 2015; Surampud et al. 2009; Maritim et al. 2003).
The current treatment option for T2D that is widely receiving much interest include the control
of postprandial hyperglycemia by the use of inhibitors of carbohydrate digesting enzymes (Ademiluyi
and Oboh, 2013).The inhibitors of carbohydrate digesting enzymes such as α-glucosidase and α-
amylase can significantly delay the intestinal absorption of dietary glucose and therefore help in
lowering postprandial hyperglycemia (Imam, 2015). However, the major available glucosidase
inhibitors such as acarbose and miglitol, were reported to cause diarrhea and other gastrointestinal
disturbances (Fujisawa et al. 2005). Therefore with increasing interest in alternatives for the control of
T2D, search for anti-diabetic agent has been extended to plant-based remedies as less adverse effects
are associated with plant-based therapy (Singh, 2001; Calixto, 2000).
Xylopia aethiopica (Dunal) A. Rich. (Annonaceae) commonly known as Ethiopian pepper is a
spice widely used as flavoring and coloring agents. In addition, X. aethiopica is utilized in folk
medicines for the treatment of diabetes in Africa (Soladoye et al. 2012; Diallo et al. 2012; Karou et al.
2011; Diéye et al. 2008). Recent studies have shown that the extracts from X. aethiopica fruit possesses
anti-oxidative (Adefegha and Oboh, 2012a,c; 2011; Etoundi et al. 2010; Odukoya et al. 2005; George
and Osiama, 2011), anti-microbial (Esekhiagbe et al. 2009), anti-cancer (Kuete et al. 2013; 2011;
Choumessi et al. 2012) and anti-diabetic (Adefegha and Oboh, 2012a,c; 2011; Etoundi et al. 2010)
activities in vitro. However, the majority of scientific investigations had only focused on the fruit only.
No data is available on the validity or potential of extracts of the other parts of the plant. Therefore the
present study was aimed to investigate and compare the anti-oxidative and anti-diabetic effects of
various extracts from different parts (including fruit) of X. aethiopica using several in vitro models.
Additionally, phytochemical analysis of the possible bioactive compounds present in most active
extracts was also carried out using GC-MS analysis.
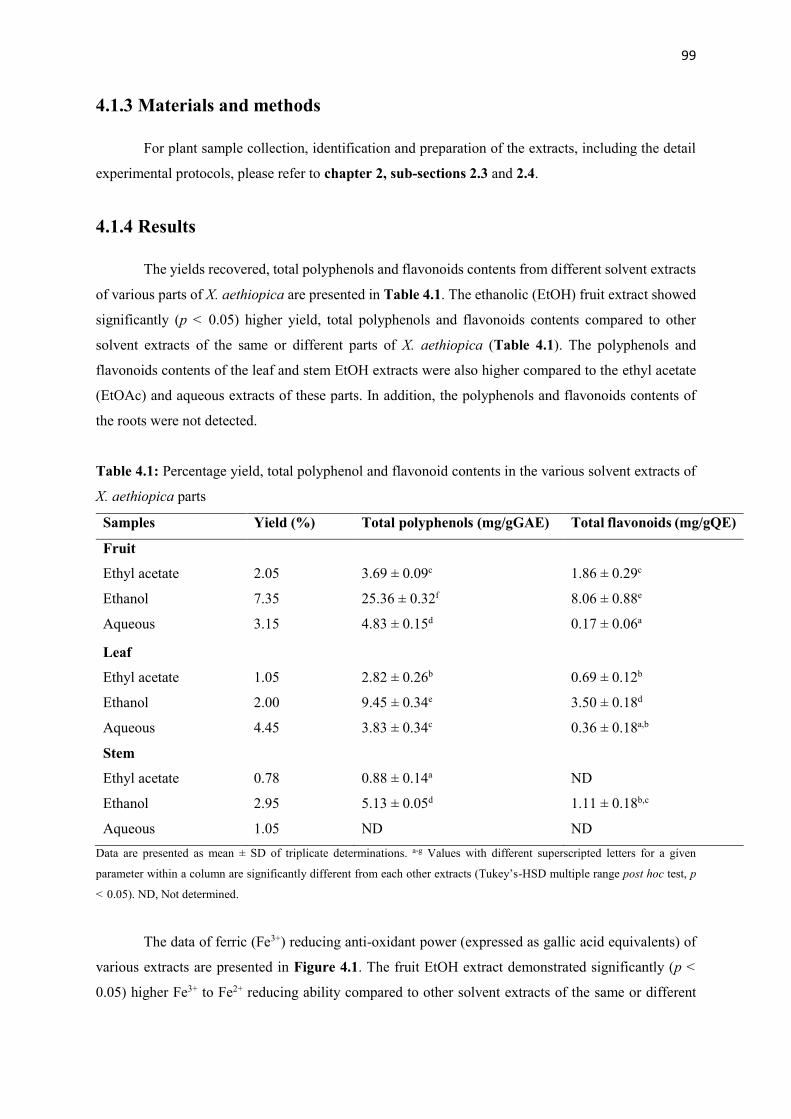
99
4.1.3 Materials and methods
For plant sample collection, identification and preparation of the extracts, including the detail
experimental protocols, please refer to chapter 2, sub-sections 2.3 and 2.4.
4.1.4 Results
The yields recovered, total polyphenols and flavonoids contents from different solvent extracts
of various parts of X. aethiopica are presented in Table 4.1. The ethanolic (EtOH) fruit extract showed
significantly (p < 0.05) higher yield, total polyphenols and flavonoids contents compared to other
solvent extracts of the same or different parts of X. aethiopica (Table 4.1). The polyphenols and
flavonoids contents of the leaf and stem EtOH extracts were also higher compared to the ethyl acetate
(EtOAc) and aqueous extracts of these parts. In addition, the polyphenols and flavonoids contents of
the roots were not detected.
Table 4.1: Percentage yield, total polyphenol and flavonoid contents in the various solvent extracts of
X. aethiopica parts
Samples Yield (%) Total polyphenols (mg/gGAE) Total flavonoids (mg/gQE)
Fruit
Ethyl acetate 2.05 3.69 ± 0.09c 1.86 ± 0.29c
Ethanol 7.35 25.36 ± 0.32f 8.06 ± 0.88e
Aqueous 3.15 4.83 ± 0.15d 0.17 ± 0.06a
Leaf
Ethyl acetate 1.05 2.82 ± 0.26b 0.69 ± 0.12b
Ethanol 2.00 9.45 ± 0.34e 3.50 ± 0.18d
Aqueous 4.45 3.83 ± 0.34c 0.36 ± 0.18a,b
Stem
Ethyl acetate 0.78 0.88 ± 0.14a ND
Ethanol 2.95 5.13 ± 0.05d 1.11 ± 0.18b,c
Aqueous 1.05 ND ND Data are presented as mean ± SD of triplicate determinations. a-g Values with different superscripted letters for a given
parameter within a column are significantly different from each other extracts (Tukey’s-HSD multiple range post hoc test, p
< 0.05). ND, Not determined.
The data of ferric (Fe3+) reducing anti-oxidant power (expressed as gallic acid equivalents) of
various extracts are presented in Figure 4.1. The fruit EtOH extract demonstrated significantly (p <
0.05) higher Fe3+ to Fe2+ reducing ability compared to other solvent extracts of the same or different

100
part (Figure 4.1). The activity of leaf EtOH extract was also significantly (p < 0.05) higher than the
other extracts from this part, when the action of stem EtOH extract was not significantly (p < 0.05)
difference compared to the EtOAc extract (Figure 4.2).
Figure 4.1. Ferric reducing power (relative to gallic acid) of fruit (A), leaf (B) and stem (C) extracts of X. aethiopica. Data are presented as mean ± SD of triplicate determinations. a-d Different letters presented over the bars for a given concentration of each extract are significantly different from each other (Tukey’s-HSD multiple range post hoc test, p < 0.05).

101
The results of DPPH radical scavenging activities and the calculated IC50 values of various
extracts from different parts of X. aethiopica are presented in Figure 4.2 and Table 4.2, respectively.
According to the data, the fruit and leaf EtOH extracts had exhibited significantly (p < 0.05) lower IC50
values (fruit: 0.04 ± 0.01 mg/mL; leaf: 0.08 ± 0.01 mg/mL) compared to other extracts that are
comparable to the standards used in this study (ascorbic acid: 0.03±0.02 mg/mL; gallic acid: 0.05 ±
0.01 mg/mL). In all the parts investigated, EtOH extracts were the most active followed by EtOAc
extracts while aqueous extracts were the least active (Table 4.2). Various extracts derived from the root
part were inactive to scavenge the DPPH radical.
Figure 4.2. DPPH Radical scavenging activity (%) of fruit (A), leaf (B) and stem (C) extracts of X. aethiopica. Data are presented as mean ± SD of triplicate determinations. a-d Different letters presented over the bars for a given concentration of each extract are significantly different from each other (Tukey’s HSD multiple range post hoc test, p < 0.05).
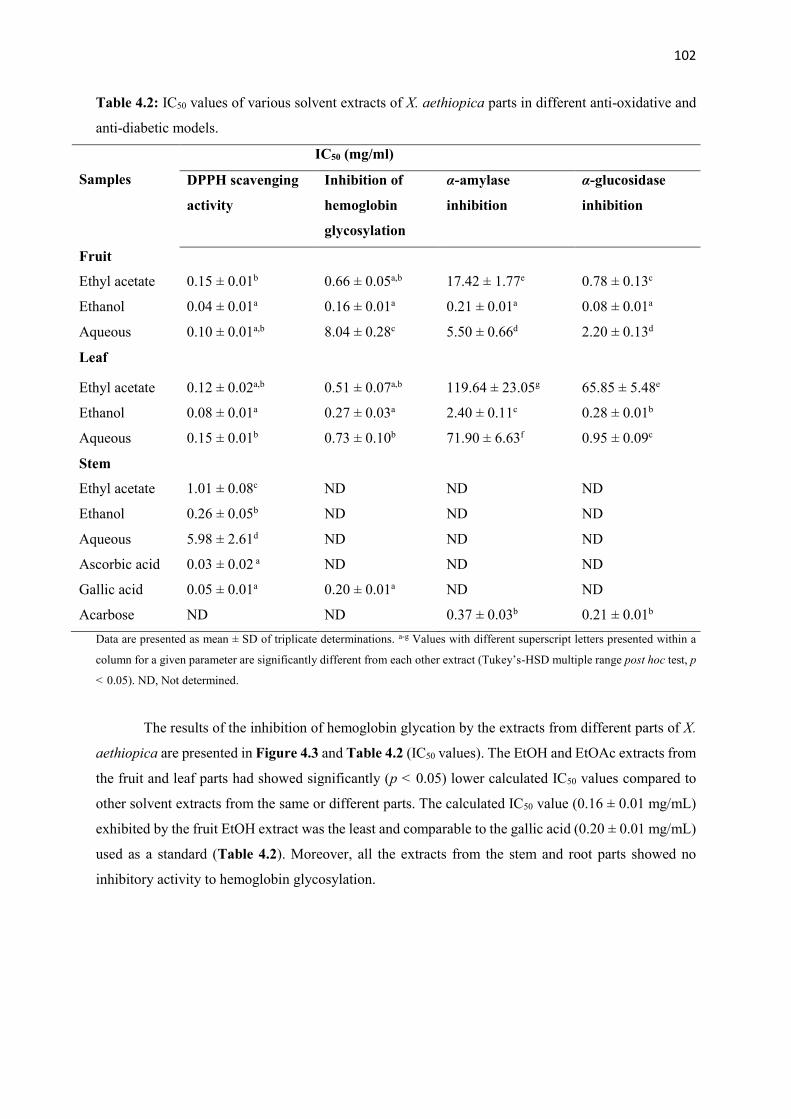
102
Table 4.2: IC50 values of various solvent extracts of X. aethiopica parts in different anti-oxidative and
anti-diabetic models.
Samples
IC50 (mg/ml)
DPPH scavenging
activity
Inhibition of
hemoglobin
glycosylation
α-amylase
inhibition
α-glucosidase
inhibition
Fruit
Ethyl acetate 0.15 ± 0.01b 0.66 ± 0.05a,b 17.42 ± 1.77e 0.78 ± 0.13c
Ethanol 0.04 ± 0.01a 0.16 ± 0.01a 0.21 ± 0.01a 0.08 ± 0.01a
Aqueous 0.10 ± 0.01a,b 8.04 ± 0.28c 5.50 ± 0.66d 2.20 ± 0.13d
Leaf
Ethyl acetate 0.12 ± 0.02a,b 0.51 ± 0.07a,b 119.64 ± 23.05g 65.85 ± 5.48e
Ethanol 0.08 ± 0.01a 0.27 ± 0.03a 2.40 ± 0.11c 0.28 ± 0.01b
Aqueous 0.15 ± 0.01b 0.73 ± 0.10b 71.90 ± 6.63f 0.95 ± 0.09c
Stem
Ethyl acetate 1.01 ± 0.08c ND ND ND
Ethanol 0.26 ± 0.05b ND ND ND
Aqueous 5.98 ± 2.61d ND ND ND
Ascorbic acid 0.03 ± 0.02 a ND ND ND
Gallic acid 0.05 ± 0.01a 0.20 ± 0.01a ND ND
Acarbose ND ND 0.37 ± 0.03b 0.21 ± 0.01b Data are presented as mean ± SD of triplicate determinations. a-g Values with different superscript letters presented within a
column for a given parameter are significantly different from each other extract (Tukey’s-HSD multiple range post hoc test, p
< 0.05). ND, Not determined.
The results of the inhibition of hemoglobin glycation by the extracts from different parts of X.
aethiopica are presented in Figure 4.3 and Table 4.2 (IC50 values). The EtOH and EtOAc extracts from
the fruit and leaf parts had showed significantly (p < 0.05) lower calculated IC50 values compared to
other solvent extracts from the same or different parts. The calculated IC50 value (0.16 ± 0.01 mg/mL)
exhibited by the fruit EtOH extract was the least and comparable to the gallic acid (0.20 ± 0.01 mg/mL)
used as a standard (Table 4.2). Moreover, all the extracts from the stem and root parts showed no
inhibitory activity to hemoglobin glycosylation.

103
Figure 4.3. Inhibition of hemoglobin glycosylation (%) of fruit (A) and leaf (B) extracts of X. aethiopica. Data are presented
as mean ± SD of triplicate determinations. a-d Different letters presented over the bars for a given concentration of each extract
are significantly different from each other (Tukey’s-HSD multiple range post hoc test, p < 0.05).
The data of inhibition of α-amylase action by various extracts from X. aethiopica are presented
in Figure 4.4 and Table 4.2 (IC50 values). It was observed from the results that, the calculated IC50
value (0.21 ± 0.01 mg/mL) exhibited by the fruit EtOH extract was significantly (p < 0.05) lower
compared to other solvent extracts of the same or different parts and the acarbose as well (Table 4.2).
The leaf EtOH extract was also observed to show an IC50 value (2.40 ± 0.11 mg/mL) that was
significantly (p < 0.05) lower than the standard acarbose (0.37 ± 0.03 mg/mL).
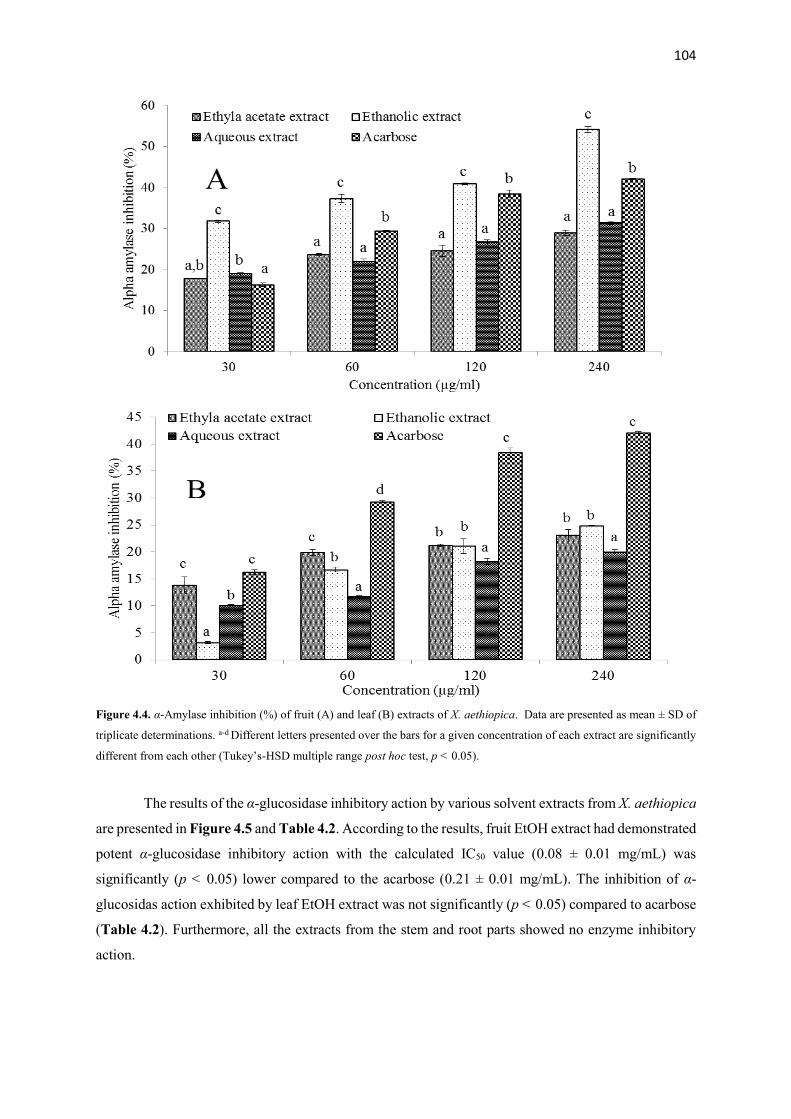
104
Figure 4.4. α-Amylase inhibition (%) of fruit (A) and leaf (B) extracts of X. aethiopica. Data are presented as mean ± SD of
triplicate determinations. a-d Different letters presented over the bars for a given concentration of each extract are significantly
different from each other (Tukey’s-HSD multiple range post hoc test, p < 0.05).
The results of the α-glucosidase inhibitory action by various solvent extracts from X. aethiopica
are presented in Figure 4.5 and Table 4.2. According to the results, fruit EtOH extract had demonstrated
potent α-glucosidase inhibitory action with the calculated IC50 value (0.08 ± 0.01 mg/mL) was
significantly (p < 0.05) lower compared to the acarbose (0.21 ± 0.01 mg/mL). The inhibition of α-
glucosidas action exhibited by leaf EtOH extract was not significantly (p < 0.05) compared to acarbose
(Table 4.2). Furthermore, all the extracts from the stem and root parts showed no enzyme inhibitory
action.
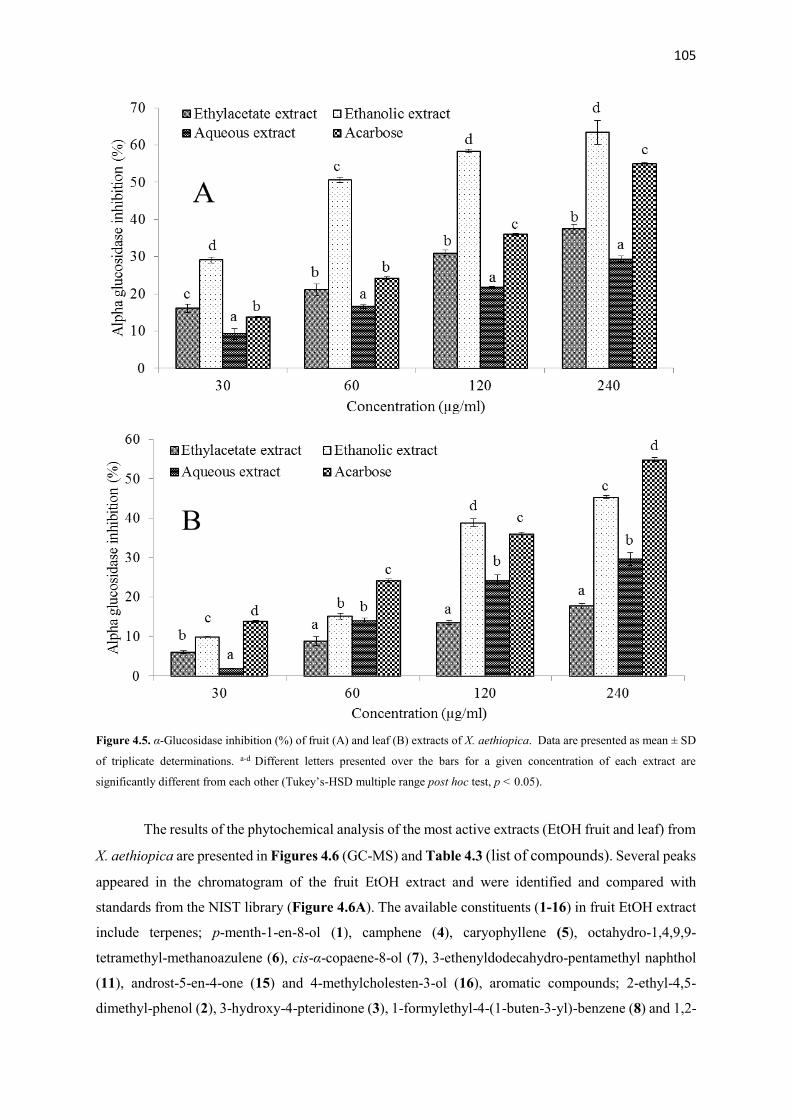
105
Figure 4.5. α-Glucosidase inhibition (%) of fruit (A) and leaf (B) extracts of X. aethiopica. Data are presented as mean ± SD
of triplicate determinations. a-d Different letters presented over the bars for a given concentration of each extract are
significantly different from each other (Tukey’s-HSD multiple range post hoc test, p < 0.05).
The results of the phytochemical analysis of the most active extracts (EtOH fruit and leaf) from
X. aethiopica are presented in Figures 4.6 (GC-MS) and Table 4.3 (list of compounds). Several peaks
appeared in the chromatogram of the fruit EtOH extract and were identified and compared with
standards from the NIST library (Figure 4.6A). The available constituents (1-16) in fruit EtOH extract
include terpenes; p-menth-1-en-8-ol (1), camphene (4), caryophyllene (5), octahydro-1,4,9,9-
tetramethyl-methanoazulene (6), cis-α-copaene-8-ol (7), 3-ethenyldodecahydro-pentamethyl naphthol
(11), androst-5-en-4-one (15) and 4-methylcholesten-3-ol (16), aromatic compounds; 2-ethyl-4,5-
dimethyl-phenol (2), 3-hydroxy-4-pteridinone (3), 1-formylethyl-4-(1-buten-3-yl)-benzene (8) and 1,2-
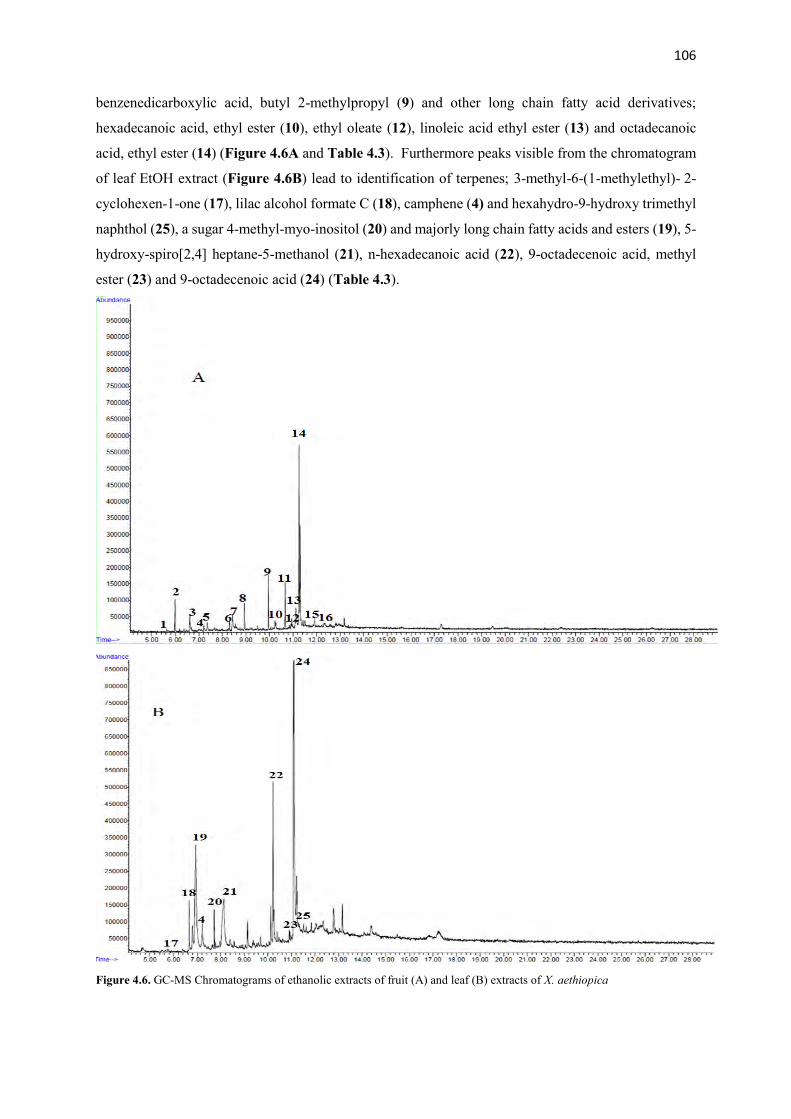
106
benzenedicarboxylic acid, butyl 2-methylpropyl (9) and other long chain fatty acid derivatives;
hexadecanoic acid, ethyl ester (10), ethyl oleate (12), linoleic acid ethyl ester (13) and octadecanoic
acid, ethyl ester (14) (Figure 4.6A and Table 4.3). Furthermore peaks visible from the chromatogram
of leaf EtOH extract (Figure 4.6B) lead to identification of terpenes; 3-methyl-6-(1-methylethyl)- 2-
cyclohexen-1-one (17), lilac alcohol formate C (18), camphene (4) and hexahydro-9-hydroxy trimethyl
naphthol (25), a sugar 4-methyl-myo-inositol (20) and majorly long chain fatty acids and esters (19), 5-
hydroxy-spiro[2,4] heptane-5-methanol (21), n-hexadecanoic acid (22), 9-octadecenoic acid, methyl
ester (23) and 9-octadecenoic acid (24) (Table 4.3).
Figure 4.6. GC-MS Chromatograms of ethanolic extracts of fruit (A) and leaf (B) extracts of X. aethiopica
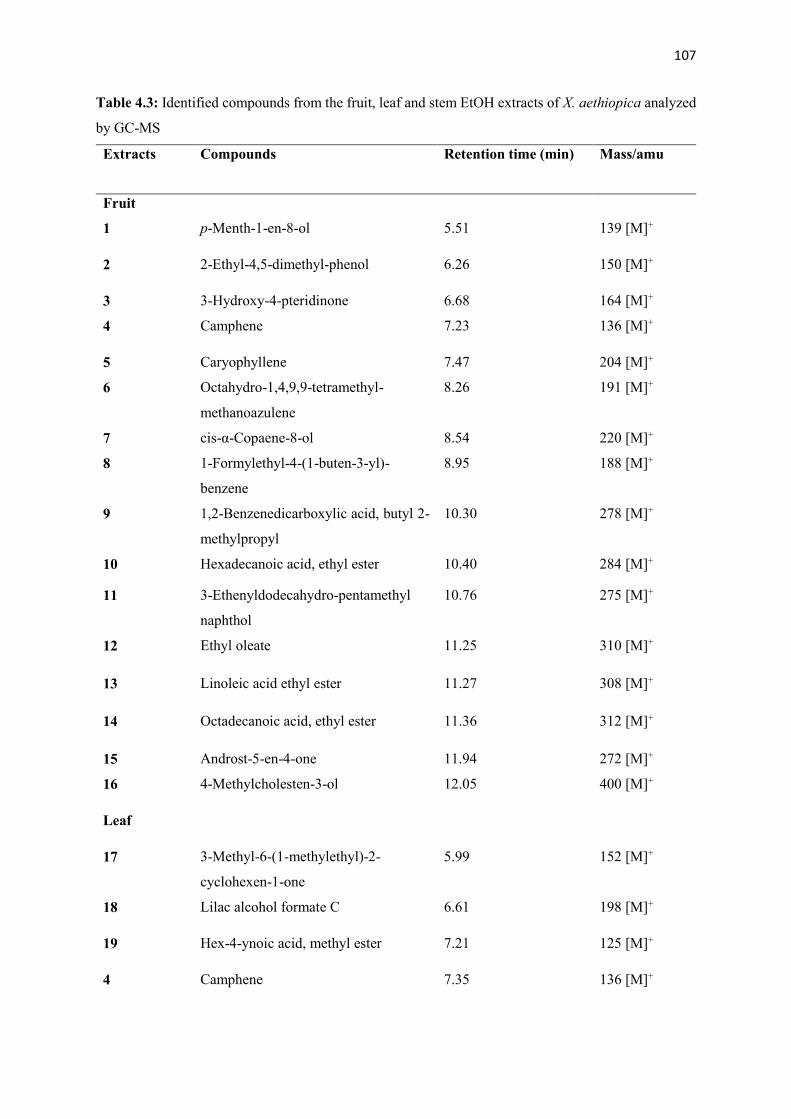
107
Table 4.3: Identified compounds from the fruit, leaf and stem EtOH extracts of X. aethiopica analyzed
by GC-MS
Extracts Compounds Retention time (min) Mass/amu
Fruit
1 p-Menth-1-en-8-ol 5.51 139 [M]+
2 2-Ethyl-4,5-dimethyl-phenol 6.26 150 [M]+
3 3-Hydroxy-4-pteridinone 6.68 164 [M]+
4 Camphene 7.23 136 [M]+
5 Caryophyllene 7.47 204 [M]+
6 Octahydro-1,4,9,9-tetramethyl-
methanoazulene
8.26 191 [M]+
7 cis-α-Copaene-8-ol 8.54 220 [M]+
8 1-Formylethyl-4-(1-buten-3-yl)-
benzene
8.95 188 [M]+
9 1,2-Benzenedicarboxylic acid, butyl 2-
methylpropyl
10.30 278 [M]+
10 Hexadecanoic acid, ethyl ester 10.40 284 [M]+
11 3-Ethenyldodecahydro-pentamethyl
naphthol
10.76 275 [M]+
12 Ethyl oleate 11.25 310 [M]+
13 Linoleic acid ethyl ester 11.27 308 [M]+
14 Octadecanoic acid, ethyl ester 11.36 312 [M]+
15 Androst-5-en-4-one 11.94 272 [M]+
16 4-Methylcholesten-3-ol 12.05 400 [M]+
Leaf
17 3-Methyl-6-(1-methylethyl)-2-
cyclohexen-1-one
5.99 152 [M]+
18 Lilac alcohol formate C 6.61 198 [M]+
19 Hex-4-ynoic acid, methyl ester 7.21 125 [M]+
4 Camphene 7.35 136 [M]+

108
20 4-Methyl-myo-inositol 7.61 179 [M]+
21 5-Hydroxy-spiro[2,4] heptane-5-
methanol
8.23 124 [M]+
22 n-Hexadecanoic acid 10.23 256 [M]+
23 9-Octadecenoic acid, methyl ester 10.94 296 [M]+
24 9-Octadecenoic acid 11.11 282 [M]+
25 Hexahydro-9-hydroxy trimethyl
naphthol
11.25 264 [M]+
4.1.5 Discussion
In most of the previous studies, various extracts from X. aethiopica fruit were reported to be
rich in polyphenols and flavonoids as well (Adefegha and Oboh, 2012a,c; 2011; George and Osioma,
2011; Etoundi et al. 2010; Esekhiagbe et al. 2009; Odukoya et al. 2005). The highest amounts of
polyphenols (4.2 ± 0.0 mg/g) and flavonoids (3.5 ± 0.6 mg/g) were that reported in X. aethiopica fruit
aqueous extract (Adefegha and Oboh, 2012c). This is far lower compared to that of fruit EtOH extract
(polyphenols: 25.36 ± 0.32 mg/g; flavonoids: 8.06 ± 0.88 mg/g) obtained in our present study (Table
4.1). Additionally, even the polyphenolic content of the fruit aqueous extract (4.83 ± 0.15 mg/g)
obtained in our present study was higher than that reported earlier (Adefegha and Oboh, 2012c). These
variations could be due to many factors, but not limited to the method and the solvent used for the
extraction. It was also evident from our present results that polyphenolic and flavonoid contents vary
from one part to another (Table 4.1). This again might be attributed to genetic and environmental factors
(nature of the soil, high temperature and rain fall) in addition to growth or maturation stages for most
of the parts of the plants (Mamphiswana et al. 2010; Pandey and Rizvi, 2009).
In a previous study, Odukoya et al. (2005) have reported that the X. aethiopica fruit aqueous
extract showed excellent ferric (Fe3+) reducing anti-oxidant ability. This is in line with the results of our
present study, when the fruit EtOH extract was the most potent than other extracts (Figure 4.1). In
addition although no correlation analysis was conducted in our present study, the reducing anti-oxidant
ability of the various extracts correlates well with the polyphenolic and flavonoid contents (Table 4.1).
It was also observed that extracts derived from the leaf part are good source for anti-oxidant molecules
as they exhibited good anti-oxidant activity. The reducing anti-oxidant ability of various X. aethiopica
extracts was further supported by the potent potent DPPH radical scavenging actions (Table 4.2).
The anti-radical potentials of X. aethiopica fruit aqueous extract (IC50: 0.3 mg/mL) has been
reported recently (Adefegha and Oboh, 2012a, c; 2011). However, according to our results, the
calculated IC50 value for the fruit aqueous extract (0.10 ± 0.01 mg/mL) was lower compared to that

109
reported by Adefegha and Oboh (2012c), when that of EtOH extract (0.04 ± 0.01 mg/mL) was by far
lower compared to the aqueous extract (Table 4.2). This could be the least IC50 value for DPPH
scavenging of any extract from X. aethiopica so far reported. The higher activity of the fruit EtOH
extract might be attributed to the higher polyphenol and flavonoid content mentioned above. This again
could be the reason behind the higher anti-radical ability of the EtOH extracts from other parts of X.
aethiopica than other solvent extracts (Table 4.2).
In order to further evaluate the anti-oxidant capacity of various extracts from different parts of
X. aethiopica, the inhibitory effect of hemoglobin glycation by these extracts was investigated.
Glycation is a non-enzymatic reaction that occurs when proteins such as hemoglobin and albumin are
exposed to excess reducing sugars and contributes greatly to formation of advanced glycation end
products that lead to oxidative stress (Yamagishi et al. 2008; Rahbar and Figarola, 2003; Brownlee et
al. 1984). According to the results of previous studies, there is a positive correlation between
polyphenolic contents and anti-glycation ability of several plant-derived extracts (Ramkissoon et al.
2013; Povichit et al. 2010; Rahbar and Figarola, 2003). Therefore, the higher anti-glycation of the EtOH
extracts from fruit and leaf of X. aethiopica observed in our present study might be due to the greater
amount of polyphenols in these parts (Table 4.1 and 4.2). The result was further supported by the
inhibition of the activities of α-amylase and α-glucosidase by various extracts from X. aethiopica (Table
4.2).
It has been reported that X. aethiopica fruit aqueous extract exhibited moderate inhibition of α-
amylase as well as α-glucosidase actions (Adefegha and Oboh, 2012a; Etoundi et al. 2010). The
calculated IC50 values were 2.81 ± 0.79 mg/mL and 2.57 ± 1.15 mg/mL for α-amylase and α-glucosidase
actions, respectively (Adefegha and Oboh, 2012a). However, according to our present results, the IC50
values (α-amylase: 0.21 ± 0.01 mg/mL α-glucosidase: 0.08 ± 0.01 mg/mL) demonstrated by the most
potent extract (fruit EtOH) was lower than other extracts, indicating higher inhibitory actions than the
aqueous extract reported previously (Adefegha and Oboh, 2012a; Etoundi et al. 2010). Therefore, it is
suggested that the availability of bioactive inhibitors from X. aethiopica are higher in the fruit EtOH
extract compared to other extracts of the same or different parts (Table 4.2). The inhibitors of α-amylase
and α-glucosidase actions can significantly control the postprandial hyperglycemia by delaying the
process of carbohydrate hydrolysis and absorption as well (Imam, 2015; Kwon et al. 2006).
Furthermore, the higher α-amylase and α-glucosidase actions as well as the anti-oxidant
activities of fruit and leaf EtOH extracts indicated the presence of promising compounds and were
therefore subjected to GC-MS analysis. Karioti et al. (2004) have reported that monoterpene
hydrocarbons are the major compounds detected in the essential oils derived from the fruit, leaf stem
and root barks. This is in line with our present data (Figure 4.6 and Table 4.3). Moreover, compounds
such as p-menth-1-en-8-ol (1), camphene (4) and caryophyllene (5) detected in fruit EtOH extract were
also reported previously (Karioti et al. 2004). Additionally, Karioti et al. (2004) have also attributed the
anti-radical potentials of the essential oils derived from X. aethiopica to the presence of these
110
compounds. Therefore, the higher anti-oxidative and anti-diabetic actions of the fruit and leaf EtOH
extracts might be due the presence of these compounds and constituents detected from the extracts.
4.1.6 Conclusions
In conclusion, various solvent extracts from fruit and leaf of X. aethiopica have demonstrated
anti-oxidative as well as anti-diabetic effects in vitro when stem and root extracts showed very low or
no significant activities in these regards. The fruit EtOH extract exhibited higher actions compared to
other extracts of the same or different parts. Thus, it is selected for further study in order to fully
investigate the in vivo anti-diabetic and anti-oxidative effects of this plant.

111
According to the in vitro anti-oxidative and anti-diabetic studies of the various solvent extracts derived
from different parts of X. aethiopica stated above, fruit ethanolic extract demonstrated higher activities
compared to other extracts. Therefore it was selected for further studies.
4.2 Anti-oxidative effect and inhibition of key enzymes linked to
type 2 diabetes of various solvent fractions from fruit ethanolic
extract of Xylopia aethiopica in vitro
Aminu Mohammed,1,3 Neil Anthony Koorbanally2 and Md. Shahidul Islam1*
1Department of Biochemistry, School of Life Sciences, University of KwaZulu-Natal, (Westville
Campus), Durban, 4000, South Africa 2Department of Chemistry, School of Chemistry and Physics, University of KwaZulu-Natal, (Westville
Campus), Durban, 4000, South Africa 3Department of Biochemistry, Faculty of Science, Ahmadu Bello University, Zaria-Nigeria
4.2.1 Abstract Objectives: Xylopia aethiopica (Dun.) A. Rich (Annonaceae) has been widely used in food
preparations and is locally used in treatment of various diseases. The present study was carried out to
assess the anti-oxidative and anti-diabetic potentials of solvent-solvent fractions from crude ethanolic
extract of X. aethiopica fruit using various in vitro models.
Methods: Crude ethanolic extract was fractionated using hexane, dichloromethane, ethyl acetate and
acetone. They were subjected and investigated for 1,1-diphenyl-2-picryl-hydrazyl (DPPH) radical
scavenging activity, ferric reducing anti-oxidant power (FRAP), inhibition of hemoglobin
glycosylation, α-amylase and α-glucosidase activities as markers of in vitro anti-diabetic effects at
various doses (30-240 µg/mL). Possible bioactive compounds were analyzed using Gas
Chromatography-Mass Spectrometry (GC-MS) analysis.
Results: The results indicated that acetone fraction exhibited significantly (p < 0.05) higher total
polyphenols and flavonoids contents and recorded lower IC50 values in all the models used (DPPH:
84.47 ± 0.71 µg/mL; inhibition of hemoglobin glycosylation: 148.15 ± 3.57 µg/mL; -amylase: 155.41
± 1.83 µg/mL; -glucosidase: 86.23 ± 0.30 µg/mL) compared to other solvent fractions. Possible
phytochemical present in acetone fraction were mostly phenolics and fatty acid derivatives. This finding
clearly demonstrates that acetone fraction possesses anti-oxidative and anti-diabetic effects.
Keywords: Acetone fraction, Anti-oxidative, Ethanolic extract, Type 2 diabetes, Xylopia aethiopica,
112
4.2.2 Introduction
Xylopia aethiopica (Dun.) A. Rich (Annonaceae) also known as Ethiopian pepper is a plant, 20
m in height with short roots and smooth grey bark and usually scented when fresh (Iwu, 2014). Its
popularity as a spice in many local dishes employed by various traditions in Africa (Kingsley, 2012).
In addition, different parts of X. aethiopica are used locally either alone or in combination with other
plant in the treatment of different disease conditions (Fall et al. 2003). In Nigeria, either X. aethiopica
fruit decoction alone or in equal proportion with Alstonia congensis bark were reported to be used in
the treatment of diabetes (Soladoye et al. 2012; Ogbonnia et al. 2008). The fruit is also used as pain
reliever and in the treatment of stomach aches, dysentery, ulceration, skin infections and coughs
(Ezeikwesili et al. 2010). Previous studies have reported that X. aethiopica fruit extracts and/or its
essential oils possess anti-cancer (Kuete et al. 2013; Choumessi et al. 2012), anti-anaphylactic and anti-
inflammatory (Obiri and Osafo, 2013), hypolidemic (Etoundi et al. 2013) and anti-microbial
(Esekhiagbe et al. 2009) effects. Furthermore, fruit aqueous extract from X. aethiopica was reported to
exhibit anti-oxidative and carbohydrate digesting enzymes inhibitory effects in vitro (Adefegha and
Oboh, 2012a; Etoundi et al. 2010; Odukoya et al. 2005; George and Osiama, 2011). In addition, our
recently concluded study had showed that fruit ethanolic (EtOH) extract from X. aethiopica fruit
demonstrated potent anti-oxidative and anti-diabetic actions in vitro (unpublished data). Therefore in
our search for the plant-derived products with potent anti-oxidative and anti-diabetic effects, the fruit
EtOH extract was further partitioned and fractionated using solvents of increasing polarity. The
fractions obtained were subjected to anti-oxidative and anti-diabetic effects using various in vitro
models. Phytochemical analysis of the fraction with higher activity was assessed using GC-MS analysis.
4.2.3 Materials and methods
For sample collection, identification and preparation of the fractions, including the detail
experimental protocols, please refer to chapter 2, sub-sections 2.3 and 2.4.
4.2.4 Results
The results of percentage yield recovered, total polyphenols and flavonoids contents of all the
fractions derived from X. aethiopica fruit are presented in Table 4.4. According to the data hexane
fraction was observed to recover the highest yield while acetone fraction recovered the least amount. It
was also observed that acetone fraction exhibited significantly (p < 0.05) higher total polyphenols and
flavonoids contents compared to other solvent fractions (Table 4.4). In addition the flavonoids content
of the hexane fraction was not detected.

113
Table 4.4: Percentage yield, total polyphenol and flavonoid contents of various fractions from ethanolic
fruit extract of X. aethiopica
Solvent Yield (%) Total polyphenols (mg/gGAE) Total flavonoids (mg/gQE)
Hexane 17.80 0.63 ± 0.16a ND
Dichloromethane 10.54 1.14 ± 0.34a 0.07 ± 0.02a
Ethyl acetate 9.60 2.31 ± 0.05b 0.23 ± 0.04b
Acetone 8.70 13.46 ± 0.05c 5.13 ± 0.05c Data are presented as mean ± SD values of triplicate determinations. a-c Different superscripted letters for a given value within
a column are significantly different from each other fractions or standards (Tukey’s-HSD multiple range post hoc test, p <
0.05), ND, Not determined.
The results of ferric (Fe3+) reducing anti-oxidant power (FRAP) of the various fractions are
presented in Figure 4.7. It was observed that acetone fraction showed a significantly (p < 0.05) higher
and concentration dependent Fe3+ to Fe2+ reducing power compared to other solvent fractions, although
the results were significantly (p < 0.05) lower than the ascorbic acid (Figure 4.7). The ethyl acetate
(EtOAc) fraction exhibited moderate activity, whereas the hexane fraction was the least active.
Figure 4.7. Total reducing power (relative to gallic acid) of fruit (A) and leaf (B) extracts of X. aethiopica. Data are presented
as mean ± SD of triplicate determinations. a-e Different letters presented over the bars for a given concentration of each extract
are significantly different from each other fractions or standards (Tukey’s-HSD multiple range post hoc test, p < 0.05).
The data of the DPPH radical scavenging ability of various fractions are presented in Table 4.5
and Figure 4.8. From the results, acetone fraction demonstrated significantly (p < 0.05) lower IC50
value (84.47 ± 0.71 µg/mL) for the DPPH radical scavenging activity compared to other fractions and
this was also comparable to the standards used (Ascorbate: 25.34 ± 6.19 µg/mL; Gallic acid: 20.01 ±
4.42 µg/mL). The IC50 value depicted by the EtOAc fraction was significantly (p < 0.05) lower
compared to that of the hexane and dichloromethane fractions as well (Table 4.5).

114
Figure 4.8. DPPH Radical scavenging activity (%) of various fractions from fruit ethanolic extract of X. aethiopica. Data are
presented as mean ± SD of triplicate determinations. a-d Values with different letters presented for a given concentration for
each extract are significantly different from each other fractions or standards (Tukey’s-HSD multiple range post hoc test, p
< 0.05). The data of inhibition of hemoglobin glycation and the calculated IC50 values of various
fractions are presented in Figure 4.9 and Table 4.5 (IC50 values). According to the results the acetone
fraction demonstrated significantly (p < 0.05) lower IC50 value (148.15 ± 3.57 µg/mL) compared to
other solvent fractions and comparable to the gallic acid (199.09 ± 2.85 µg/mL). The IC50 values
exhibited by the dichloromethane and EtOAc fractions were not significantly (p < 0.05) different from
each other (Table 4.5).
Table 4.5: IC50 values of various solvent fractions from ethanolic fruit extract of X. aethiopica in
different anti-oxidative and anti-diabetic models.
Solvent
IC50 (µg/ml)
DPPH scavenging
activity
Anti-glycation of
hemoglobin
α-amylase
inhibition
α-glucosidase
inhibition
Hexane 3190.52 ± 147.53e 5373.39 ± 90.74d 2517.02 ± 194.33c 4155.78 ± 188.35e
Dichloromethane 1172.05 ± 5.81d 4892.59 ± 53.78c 6818.32 ± 804.96e 1315.41 ± 122.27d
Ethyl acetate 317.74 ± 6.29c 4912.24 ± 541.03c 4086.76 ± 153.59d 652.60 ± 58.47c
Acetone 84.47 ± 0.71b 148.15 ± 3.57a 155.41 ± 1.83a 86.23 ± 0.30a
Ascorbic acid 25.34 ± 6.19a ND ND ND
Gallic acid 20.01 ± 4.42a 199.09 ± 2.85b ND ND
Acarbose ND ND 374.95 ± 26.81b 211.59 ± 3.32b Data are presented as mean ± SD values of triplicate determinations. a-e Different superscripted letters for a given value within
a column are significantly different from each other fractions or standards (Tukey’s-HSD multiple range post hoc test, p <
0.05). ND, Not determined.

115
Figure 4.9: Inhibition of hemoglobin glycation (%) of various fractions from fruit ethanolic extract of X. aethiopica. Data are
presented as mean ± SD of triplicate determinations. a-e Values with different letters presented for a given concentration for
each extract are significantly different from each other fractions or standards (Tukey’s-HSD multiple range post hoc test, p
< 0.05).
The results of α-amylase inhibition by the various fractions and the calculated IC50 values are
presented in Figure 4.10 and Table 4.5 (IC50 values). According to the data, acetone fraction showed
a significantly (p < 0.05) lower calculated IC50 value (155.41 ± 1.83 µg/mL) for α-amylase inhibition
compared to other solvent fractions and acarbose as well (Table 4.5). The IC50 values exhibited by the
EtOAc and hexane fractions were not significantly (p < 0.05) difference compared to the standard
acarbose, when that of dichloromethane fraction was the highest (Table 4.5).
Figure 4.10: α-Amylase inhibition (%) of various fractions from fruit ethanolic extract of X. aethiopica. Data are presented as
mean±SD of triplicate determinations. a-e Values with different letters presented for a given concentration for each extract are
significantly different from each other fractions or standards (Tukey’s-HSD multiple range post hoc test, p < 0.05).
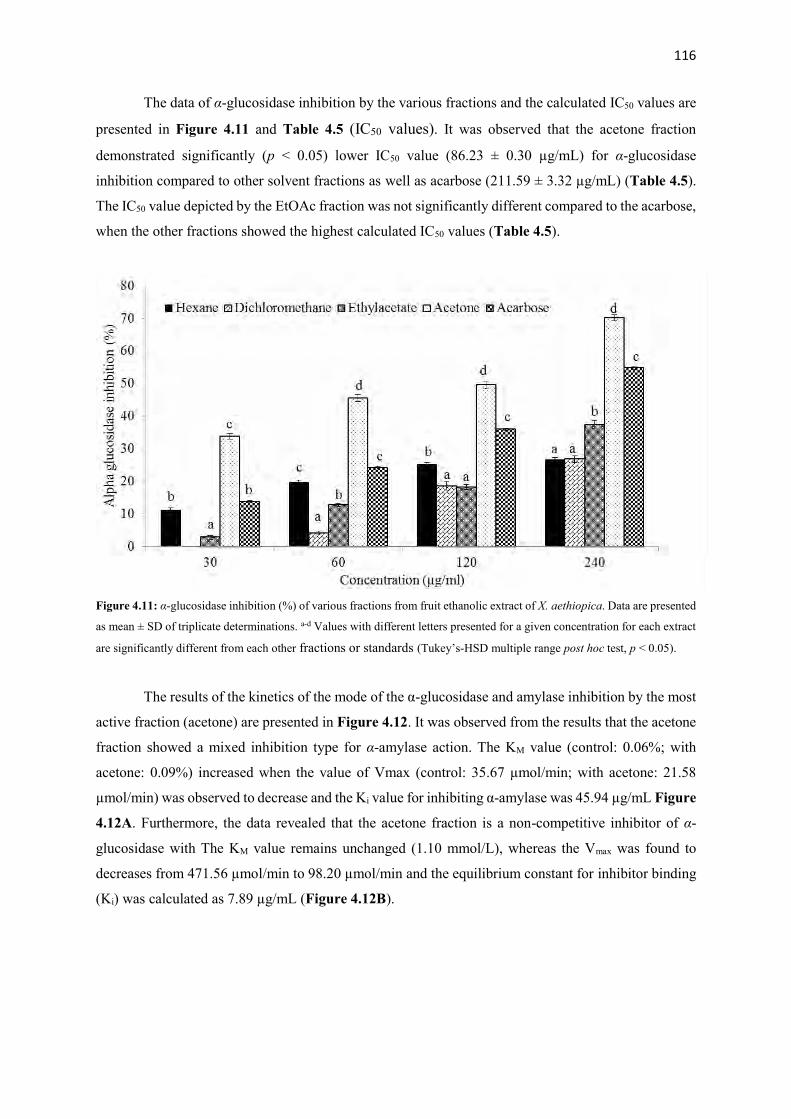
116
The data of α-glucosidase inhibition by the various fractions and the calculated IC50 values are
presented in Figure 4.11 and Table 4.5 (IC50 values). It was observed that the acetone fraction
demonstrated significantly (p < 0.05) lower IC50 value (86.23 ± 0.30 µg/mL) for α-glucosidase
inhibition compared to other solvent fractions as well as acarbose (211.59 ± 3.32 µg/mL) (Table 4.5).
The IC50 value depicted by the EtOAc fraction was not significantly different compared to the acarbose,
when the other fractions showed the highest calculated IC50 values (Table 4.5).
Figure 4.11: α-glucosidase inhibition (%) of various fractions from fruit ethanolic extract of X. aethiopica. Data are presented
as mean ± SD of triplicate determinations. a-d Values with different letters presented for a given concentration for each extract
are significantly different from each other fractions or standards (Tukey’s-HSD multiple range post hoc test, p < 0.05).
The results of the kinetics of the mode of the α-glucosidase and amylase inhibition by the most
active fraction (acetone) are presented in Figure 4.12. It was observed from the results that the acetone
fraction showed a mixed inhibition type for α-amylase action. The KM value (control: 0.06%; with
acetone: 0.09%) increased when the value of Vmax (control: 35.67 µmol/min; with acetone: 21.58
µmol/min) was observed to decrease and the Ki value for inhibiting α-amylase was 45.94 µg/mL Figure
4.12A. Furthermore, the data revealed that the acetone fraction is a non-competitive inhibitor of α-
glucosidase with The KM value remains unchanged (1.10 mmol/L), whereas the Vmax was found to
decreases from 471.56 µmol/min to 98.20 µmol/min and the equilibrium constant for inhibitor binding
(Ki) was calculated as 7.89 µg/mL (Figure 4.12B).
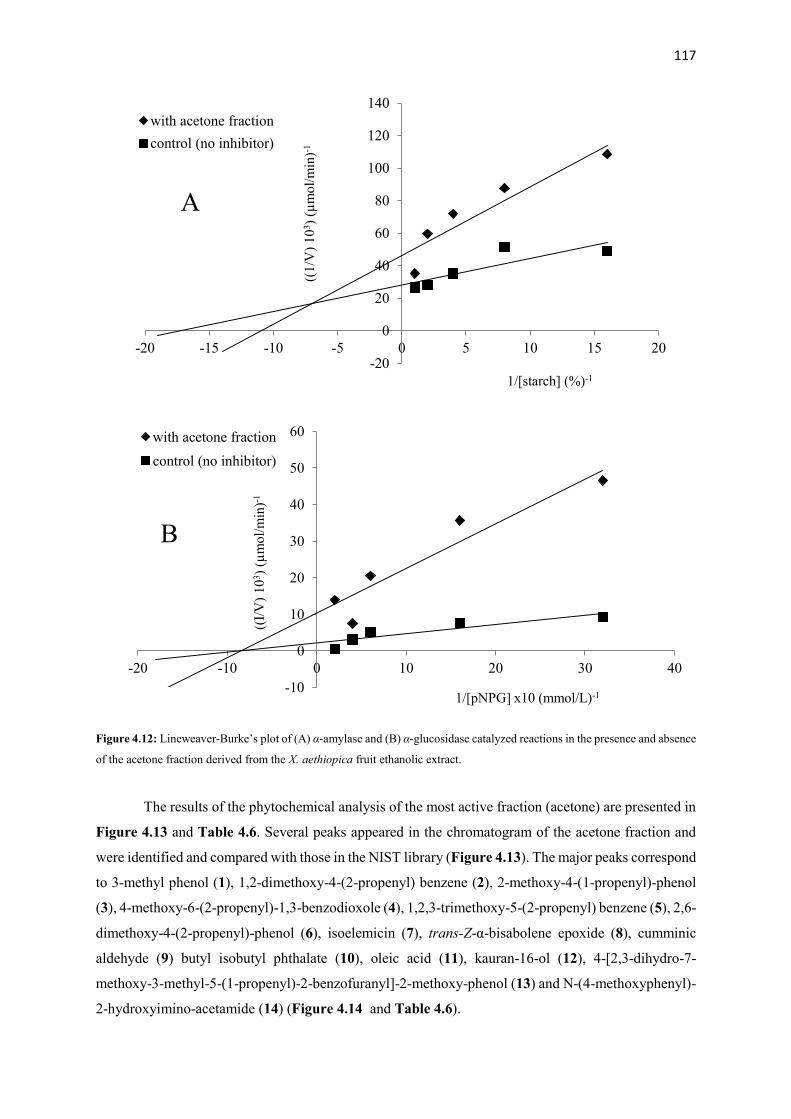
117
Figure 4.12: Lineweaver-Burke’s plot of (A) α-amylase and (B) α-glucosidase catalyzed reactions in the presence and absence
of the acetone fraction derived from the X. aethiopica fruit ethanolic extract.
The results of the phytochemical analysis of the most active fraction (acetone) are presented in
Figure 4.13 and Table 4.6. Several peaks appeared in the chromatogram of the acetone fraction and
were identified and compared with those in the NIST library (Figure 4.13). The major peaks correspond
to 3-methyl phenol (1), 1,2-dimethoxy-4-(2-propenyl) benzene (2), 2-methoxy-4-(1-propenyl)-phenol
(3), 4-methoxy-6-(2-propenyl)-1,3-benzodioxole (4), 1,2,3-trimethoxy-5-(2-propenyl) benzene (5), 2,6-
dimethoxy-4-(2-propenyl)-phenol (6), isoelemicin (7), trans-Z-α-bisabolene epoxide (8), cumminic
aldehyde (9) butyl isobutyl phthalate (10), oleic acid (11), kauran-16-ol (12), 4-[2,3-dihydro-7-
methoxy-3-methyl-5-(1-propenyl)-2-benzofuranyl]-2-methoxy-phenol (13) and N-(4-methoxyphenyl)-
2-hydroxyimino-acetamide (14) (Figure 4.14 and Table 4.6).
-20
0
20
40
60
80
100
120
140
-20 -15 -10 -5 0 5 10 15 20
((1/
V) 1
03 ) (µ
mol
/min
)-1
1/[starch] (%)-1
with acetone fractioncontrol (no inhibitor)
-10
0
10
20
30
40
50
60
-20 -10 0 10 20 30 40
((I/V
) 103 )
(µm
ol/m
in)-1
1/[pNPG] x10 (mmol/L)-1
with acetone fractioncontrol (no inhibitor)
A
B
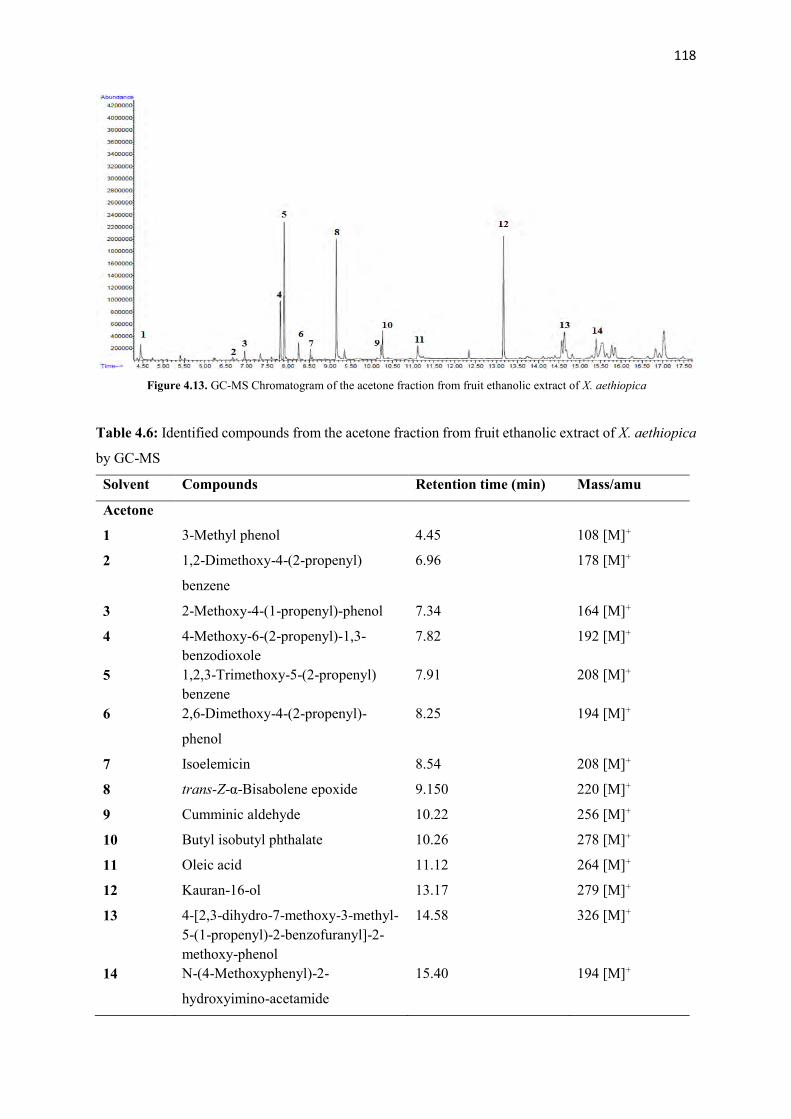
118
Figure 4.13. GC-MS Chromatogram of the acetone fraction from fruit ethanolic extract of X. aethiopica
Table 4.6: Identified compounds from the acetone fraction from fruit ethanolic extract of X. aethiopica
by GC-MS
Solvent Compounds Retention time (min) Mass/amu
Acetone
1 3-Methyl phenol 4.45 108 [M]+
2 1,2-Dimethoxy-4-(2-propenyl)
benzene
6.96 178 [M]+
3 2-Methoxy-4-(1-propenyl)-phenol 7.34 164 [M]+
4 4-Methoxy-6-(2-propenyl)-1,3-benzodioxole
7.82 192 [M]+
5 1,2,3-Trimethoxy-5-(2-propenyl) benzene
7.91 208 [M]+
6 2,6-Dimethoxy-4-(2-propenyl)-
phenol
8.25 194 [M]+
7 Isoelemicin 8.54 208 [M]+
8 trans-Z-α-Bisabolene epoxide 9.150 220 [M]+
9 Cumminic aldehyde 10.22 256 [M]+
10 Butyl isobutyl phthalate 10.26 278 [M]+
11 Oleic acid 11.12 264 [M]+
12 Kauran-16-ol 13.17 279 [M]+
13 4-[2,3-dihydro-7-methoxy-3-methyl-5-(1-propenyl)-2-benzofuranyl]-2-methoxy-phenol
14.58 326 [M]+
14 N-(4-Methoxyphenyl)-2-
hydroxyimino-acetamide
15.40 194 [M]+
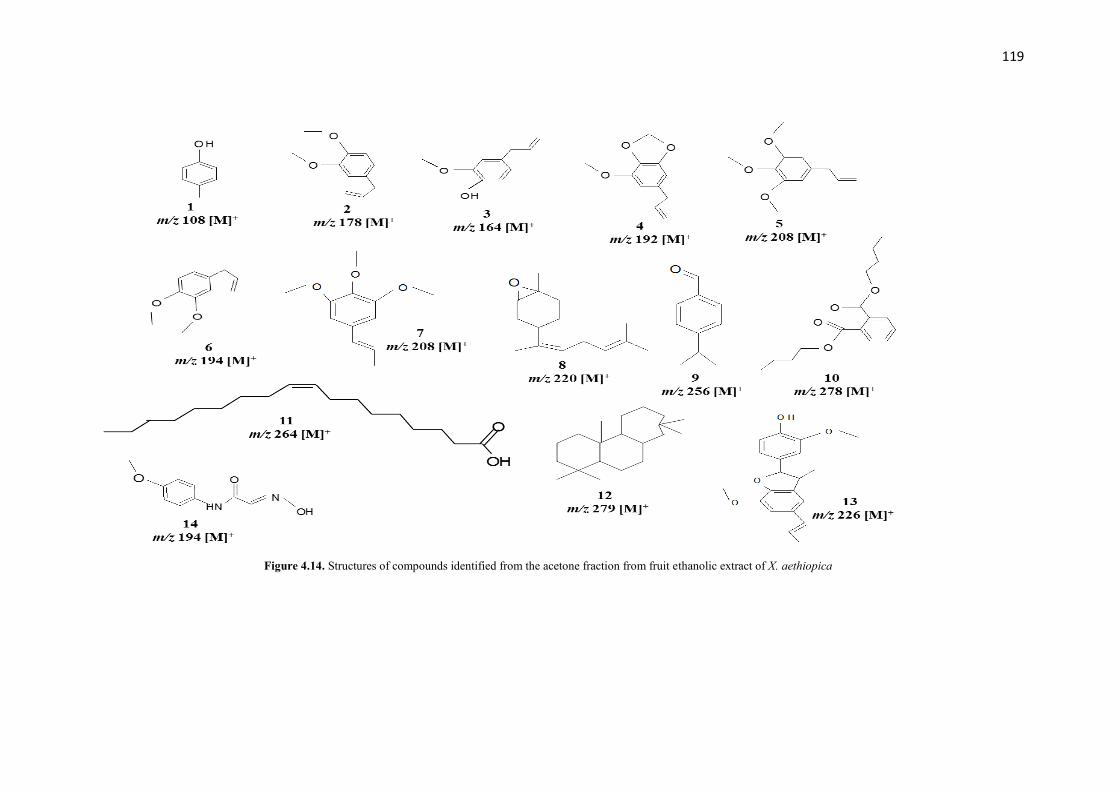
119
Figure 4.14. Structures of compounds identified from the acetone fraction from fruit ethanolic extract of X. aethiopica

120
4.2.5 Discussion
It has been reported that aqueous and methanolic extracts from X. aethiopica fruit contained
high amount of polyphenols and flavonoids (Adefegha and Oboh, 2012a,c; 2011; George and Osioma,
2011; Etoundi et al. 2010; Esekhiagbe et al. 2009; Odukoya et al. 2005). Likewise in our recent study,
the fruit EtOH extract was observed to contain higher polyphenols and flavonoids compared to other
extracts from the different parts of X. aethiopica (unpublished data). However, according to our present
results the most polar solvent fraction (acetone) contained the highest amounts, indicating the role of
polarity in the extraction of the polyphenols and flavonoids (Table 4.4). That is a positive correlation
exists between the polyphenolic contents and polarity of the solvents. The polyphenols are the most
available and diverse constituents in plant-derived extracts and impact crucial role in the prevention of
the deleterious action of free radicals (Brewer, 2011; Cohen and Kennedy, 2010). The data were further
supported by the higher anti-radical actions of the acetone fraction (Table 4.5).
The anti-radical scavenging abilities of the fruit aqueous extract have been reported in some
recent studies (Adefegha and Oboh, 2012a,c). In addition, our recent data showed that the fruit EtOH
extract exhibited the most active Fe3+ to Fe2+ and DPPH (IC50: of 0.04 ± 0.01 mg/mL) reducing potentials
(unpublished data). Moreover, based on our present results, fractionation of the crude EtOH extract
yielded another potent anti-radical scavenger (acetone fraction), which was further supported by the
higher Fe3+ to Fe2+ reducing potentials of this fraction (Figure 4.7 and Table 4.5). Therefore the higher
electron quenching ability of the acetone fraction might be associated to the higher polyphenolic
content, as previous studies have shown strong correlation between the polyphenolic content and the
anti-oxidant activity of plant-derived products (Miladi and Demak, 2008; Pulido et al. 2000).
Additionally, radical scavenging is among the underlying mechanisms by which plant-derived products
prevent the delitarious oxidative damages in diabetes and aging-related complications (Perron and
Brumaghim, 2009).
In some diseases such as diabetes, elevation of blood glucose levels and the increasing
production of free radicals lead to glycation of the proteins such a as albumin and hemoglobin. This
process contributes significantly to tissue and cellular damage in diabetics increase the production of
advanced glycation endproducts (AGEs) as well (Lobo et al. 2010). However in a number of studies
reported earlier, plant-derived extracts and/or fractions have showed potent anti-glycation that was
attributed to their phenolic contents (Mudgal et al. 2010; Pandey and Rizvi, 2009; Rice-Evans et al.
1996). Therefore, the potent anti-glycation exhibited by the acetone fraction might be attributed to the
higher phenolic contents of this fraction as well (Table 4.5). This result is partly supported by the higher
inhibition of α-amylase and α-glucosidase actions by the acetone fraction (Table 4.5).
Inhibition of the activities of α-amylase and α-glucosidase is an important strategy for delaying
carbohydrate digestion and subsequent intestinal absorption of the monosaccharides, and is thus crucial
in reduction of postprandial hyperglycemia (Kawamura-Konishi et al. 2012). It has been reported that
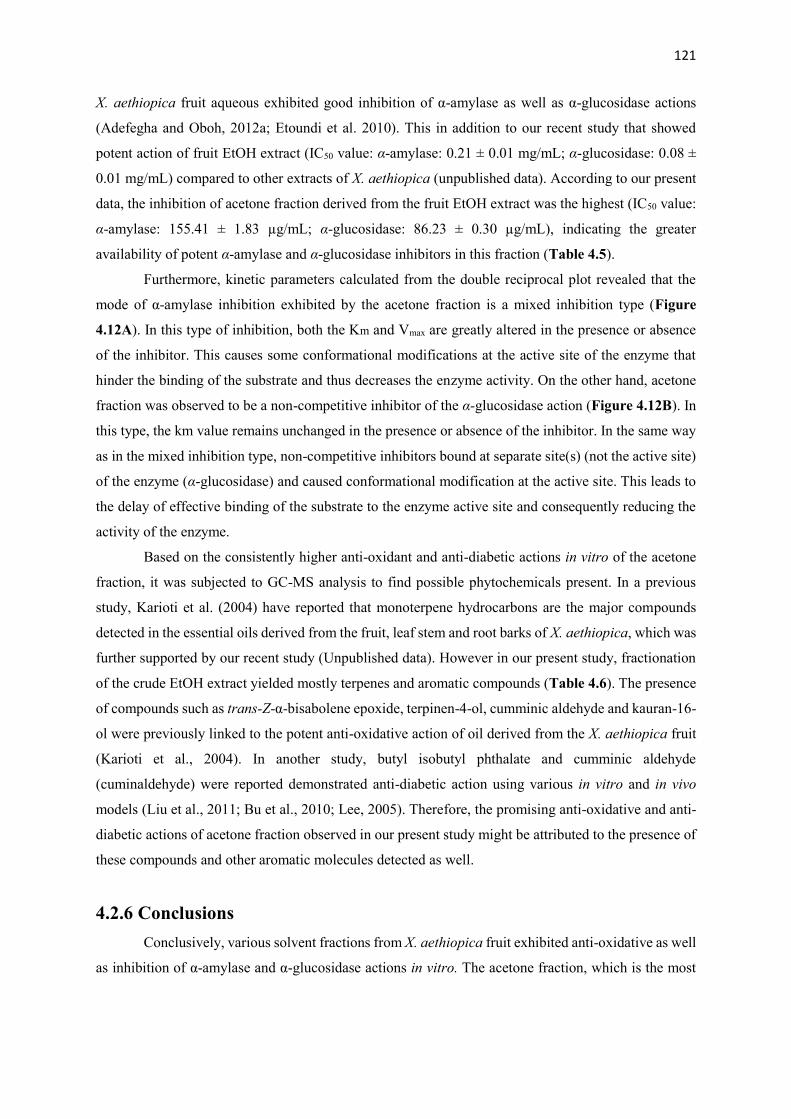
121
X. aethiopica fruit aqueous exhibited good inhibition of α-amylase as well as α-glucosidase actions
(Adefegha and Oboh, 2012a; Etoundi et al. 2010). This in addition to our recent study that showed
potent action of fruit EtOH extract (IC50 value: α-amylase: 0.21 ± 0.01 mg/mL; α-glucosidase: 0.08 ±
0.01 mg/mL) compared to other extracts of X. aethiopica (unpublished data). According to our present
data, the inhibition of acetone fraction derived from the fruit EtOH extract was the highest (IC50 value:
α-amylase: 155.41 ± 1.83 µg/mL; α-glucosidase: 86.23 ± 0.30 µg/mL), indicating the greater
availability of potent α-amylase and α-glucosidase inhibitors in this fraction (Table 4.5).
Furthermore, kinetic parameters calculated from the double reciprocal plot revealed that the
mode of α-amylase inhibition exhibited by the acetone fraction is a mixed inhibition type (Figure
4.12A). In this type of inhibition, both the Km and Vmax are greatly altered in the presence or absence
of the inhibitor. This causes some conformational modifications at the active site of the enzyme that
hinder the binding of the substrate and thus decreases the enzyme activity. On the other hand, acetone
fraction was observed to be a non-competitive inhibitor of the α-glucosidase action (Figure 4.12B). In
this type, the km value remains unchanged in the presence or absence of the inhibitor. In the same way
as in the mixed inhibition type, non-competitive inhibitors bound at separate site(s) (not the active site)
of the enzyme (α-glucosidase) and caused conformational modification at the active site. This leads to
the delay of effective binding of the substrate to the enzyme active site and consequently reducing the
activity of the enzyme.
Based on the consistently higher anti-oxidant and anti-diabetic actions in vitro of the acetone
fraction, it was subjected to GC-MS analysis to find possible phytochemicals present. In a previous
study, Karioti et al. (2004) have reported that monoterpene hydrocarbons are the major compounds
detected in the essential oils derived from the fruit, leaf stem and root barks of X. aethiopica, which was
further supported by our recent study (Unpublished data). However in our present study, fractionation
of the crude EtOH extract yielded mostly terpenes and aromatic compounds (Table 4.6). The presence
of compounds such as trans-Z-α-bisabolene epoxide, terpinen-4-ol, cumminic aldehyde and kauran-16-
ol were previously linked to the potent anti-oxidative action of oil derived from the X. aethiopica fruit
(Karioti et al., 2004). In another study, butyl isobutyl phthalate and cumminic aldehyde
(cuminaldehyde) were reported demonstrated anti-diabetic action using various in vitro and in vivo
models (Liu et al., 2011; Bu et al., 2010; Lee, 2005). Therefore, the promising anti-oxidative and anti-
diabetic actions of acetone fraction observed in our present study might be attributed to the presence of
these compounds and other aromatic molecules detected as well.
4.2.6 Conclusions Conclusively, various solvent fractions from X. aethiopica fruit exhibited anti-oxidative as well
as inhibition of α-amylase and α-glucosidase actions in vitro. The acetone fraction, which is the most

122
polar, has exhibited higher activities compared to other fractions. Therefore, it is recommended for in
vivo anti-diabetic and anti-oxidative effects to fully establish the efficacy of this fraction.
123
According to the anti-oxidative and anti-diabetic study of the various solvent fractions derived from
ethanolic extract of X. aethiopica fruit stated above, acetone fraction exhibited higher activities
compared to other solvent fractions. Therefore it was selected for the in vivo studies.
4.3 Anti-diabetic effect of Xylopia aethiopica (Dunal) A. Rich. fruit
acetone fraction in a type 2 diabetes model of rats
Aminu Mohammed1,2 and Md. Shahidul Islam1*
1Department of Biochemistry, School of Life Sciences, University of KwaZulu-Natal, (Westville
Campus), Durban, 4000, South Africa 2Department of Biochemistry, Faculty of Science, Ahmadu Bello University, Zaria-Nigeria
Published in the Journal of Ethnopharmacology 180: 131-139.
4.3.1 Abstract Objective: In the traditional medicine from West Africa, fruit decoction of Xylopia aethiopica (Dunal)
A. Rich. is widely used for the treatment of diabetes mellitus (DM) either alone or in combination with
other plants. The present study is designed to investigate the anti-diabetic effects of X. aethiopica
acetone fraction (XAAF) from fruit ethanolic extract in a type 2 diabetes (T2D) model of rats.
Methods: T2D was induced in rats by feeding a 10% fructose solution ad libitum for 2 weeks followed
by a single intraperitoneal injection of streptozotocin (40 mg/kg body weight) and the animals were
orally treated with 150 or 300 mg/kg body weight (bw) of the XAAF once daily for four weeks.
Results: After 4 weeks study period, diabetic untreated animals exhibited significantly higher serum
glucose, serum fructosamine, LDH, CK-MB, serum lipids, liver glycogen, insulin resistance (HOMA-
IR), AI, CRI and lower serum insulin, β-cell function (HOMA-β) and glucose tolerance ability
compared to the normal animals. Histopathological examination of their pancreas revealed
corresponding pathological changes in the islets and β-cells. These alterations were reverted to near-
normal after the treatment of XAAF at 150 and 300 mg/kg bw when, the effects were more pronounced
at 300 mg/kg bw compared to the 150 mg/kg bw.
Conclusion: The results of our study suggest that XAAF treatment showed excellent anti-diabetic
effect in a T2D model of rats.
Keywords: Acetone fraction, Fruit ethanolic extract, Type 2 diabetes, Rats, Xylopia aethiopica.
124
4.3.2 Introduction The progressive increase of diabetes mellitus (DM) constitutes a global public health problem.
The recent report by the International Diabetes Federation (IDF) estimate that DM affects more than
378 million people and this figure is likely to double by 2035, and type 2 diabetes (T2D) is the most
prevalent one (IDF, 2014). T2D is a heterogeneous disorder characterized by insulin resistance and
partially dysfunctional pancreatic β-cell to properly secrete insulin in response to hyperglycemia (Hui
et al. 2007). Despite the currently available conventional drugs (sulfonylureas, biguanides, α-
glucosidase inhibitors, thiazolidinediones and dipeptidyl peptidase-4 (DPP-4) inhibitors), the treatment
of T2D has been a difficult task. This is due to the unwanted side effects associated with the use of the
conventional drugs, which include hypoglycemia, weight gain, hypersensitivity, gastrointestinal
discomfort, nausea, liver and heart failure, and diarrhoea (Hung et al. 2012). Therefore, in order to curve
these problems, search for anti-diabetic agents has been extended to plant-derived products, since fewer
side effects have been reported with the use of plants in the treatment of several diseases (Singh, 2001;
Calixto, 2000).
Xylopia aethiopica (Dunal) A. Rich. (Annonaceae) also known as Ethiopian pepper is an
indigenous spice widely distributed in almost all parts of Africa. It is an aromatic, evergreen plant, 20
m height, fruits in carpels, forming dense cluster, twisted bean-like pods, dark brown, cylindrical, 1.5-
6 cm long and 4-7 mm thick (Iwu, 2014; Orwa et al. 2009). The fruit is popularly used as condiment in
many local dishes by different traditions in Africa and Asia (Kingsley, 2012). In addition, X. aethiopica
fruit is widely used locally in the treatment of various ailments and also as an excipient to many other
medicines (Freiesleben et al. 2015). In Nigerian, Guinean, Togolese and Senegalese traditional
medicines, the fruit decoction is widely used in the treatment of diabetes (Soladoye et al. 2012; Diallo
et al. 2012; Karou et al. 2011; Diéye et al. 2008). Additionally, there are some anti-diabetic recipes such
as Okudiabet, in Nigeria and Togo that are used for the treatment of diabetes containing X. aethiopica
fruit as one of the ingredients of the poly-herbal drug (Soladoye et al. 2012; Karou et al. 2011; Ogbonnia
et al. 2010; 2008). Moreover, previous studies have shown that various extracts from X. aethiopica
fruit possessed anti-cancer (Kuete et al. 2013; 2011; Choumessi et al. 2012), anti-fertility (Nwangwa,
2012), anti-sickling (Uwakwe and Nwaoguikpe, 2008), anti-microbial (Esekhiagbe et al. 2009), anti-
oxidative actions and inhibits the activities of carbohydrate hydrolyzing enzymes in vitro as well
(Adefegha and Oboh, 2012a,c; 2011; Etoundi et al. 2010; Odukoya et al. 2005; George and Osiama,
2011).
Furthermore, the toxicological studies so far conducted have indicated that oral administration
of X. aethiopica fruit aqueous extract for 2 weeks was found to cause less side effects in rats
(Johnkennedy et al. 2011; Taiwo et al. 2009). Xylopic acid (15β-acetoxy-(-)-kaur-16-en-19-oic acid),
kaurenoic, 15-oxo-kaurenoic acid, and kauran-16-α-ol are some of the compounds isolated from X.
aethiopica fruit (Iwu, 2014; Ekong and Ogan, 1968). Moreover, X. aethiopica seed extract was reported

125
to exhibit hypolidemic and anti-oxidant actions in hypercholesterolemic rats (Nwozo et al. 2011). In a
more recent study, Etoundi et al. (2013) have indicated that X. aethiopica fruit ethanolic extract
improved glucose tolerance ability in high-sucrose containing diet-fed animals, when the detail anti-
diabetic action of either extract or fraction from X. aethiopica fruit has not yet been conducted either in
humans or in experimental animals.
Therefore, the present study was designed to investigate the in vivo anti-diabetic effects of the
acetone fraction derived from the fruit ethanolic extract of X. aethiopica in a T2D model of rats.
4.3.3 Materials and methods For sample collection, identification and preparation of the fraction, including the detail
experimental protocols, please refer to chapter 2, sub-sections 2.3 and 2.5.1 to 2.5.8.
4.3.4 Results The data of weekly body weight (bw) change of all the animals are presented in Figure 4.15.
It was observed from the result that before the STZ injection, fructose feeding did not affect the bw of
the animals. However, after one week of STZ injection, the bw of the diabetic animals were significantly
(p < 0.05) decreased compared to non-diabetic animals. Treatment of X. aethiopica acetone fraction
(XAAF) to diabetic animals for 4-weeks significantly (p < 0.05) increased the bw to near normal and
comparable to metformin treated animals (Figure 4.15). The effect was more pronounced in DXAH
group compared to DXAL group, when the increased in bw of NXAH group was observed not differ
significantly (p < 0.05) compared to NC group (Figure 4.15).
Figure 4.15. Mean body weight change of all animal groups during the study period. Data are presented as the mean ± SD of 5-7 animals. a-c Values with different letter near the lines for a given week are significantly different from each other group of animals (Tukey's-HSD multiple range post hoc test, p< 0.05). NC, Normal Control; DBC, Diabetic Control; DXAL, Diabetic X. aethiopica low dose; DXAH, Diabetic X. aethiopica high dose; DMF, Diabetic Metformin; NXAH, Normal X. aethiopica high dose.
b
c c
aa
a
aa
bbb,c
b,cb b
bb
cc c
c
100
150
200
250
300
350
400
WK-3 WK-2 WK 1 WK 0 WK 1 WK 2 WK 3 WK 4
Mea
n bo
dy w
eigh
t (g)
Experimental weeks
NC DBC DXAL DXAH DMF NXAH
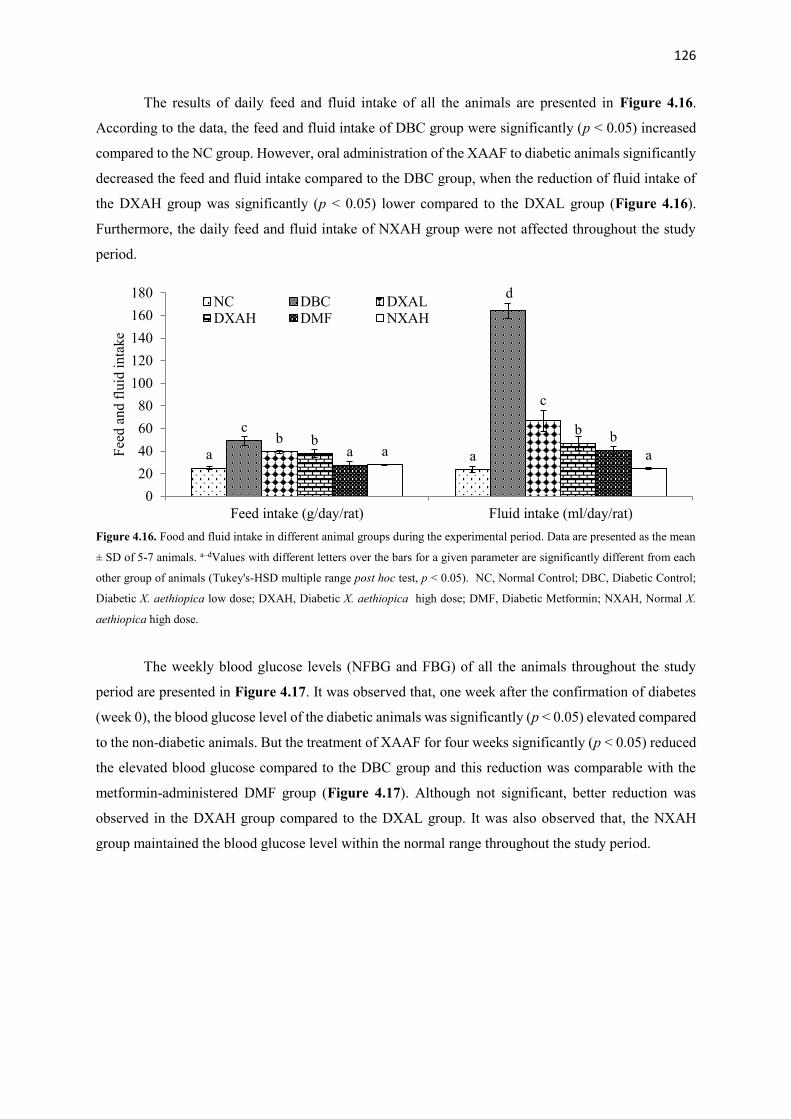
126
The results of daily feed and fluid intake of all the animals are presented in Figure 4.16.
According to the data, the feed and fluid intake of DBC group were significantly (p < 0.05) increased
compared to the NC group. However, oral administration of the XAAF to diabetic animals significantly
decreased the feed and fluid intake compared to the DBC group, when the reduction of fluid intake of
the DXAH group was significantly (p < 0.05) lower compared to the DXAL group (Figure 4.16).
Furthermore, the daily feed and fluid intake of NXAH group were not affected throughout the study
period.
Figure 4.16. Food and fluid intake in different animal groups during the experimental period. Data are presented as the mean
± SD of 5-7 animals. a–dValues with different letters over the bars for a given parameter are significantly different from each
other group of animals (Tukey's-HSD multiple range post hoc test, p < 0.05). NC, Normal Control; DBC, Diabetic Control;
Diabetic X. aethiopica low dose; DXAH, Diabetic X. aethiopica high dose; DMF, Diabetic Metformin; NXAH, Normal X.
aethiopica high dose.
The weekly blood glucose levels (NFBG and FBG) of all the animals throughout the study
period are presented in Figure 4.17. It was observed that, one week after the confirmation of diabetes
(week 0), the blood glucose level of the diabetic animals was significantly (p < 0.05) elevated compared
to the non-diabetic animals. But the treatment of XAAF for four weeks significantly (p < 0.05) reduced
the elevated blood glucose compared to the DBC group and this reduction was comparable with the
metformin-administered DMF group (Figure 4.17). Although not significant, better reduction was
observed in the DXAH group compared to the DXAL group. It was also observed that, the NXAH
group maintained the blood glucose level within the normal range throughout the study period.
a a
c
d
b
c
bb
ab
a a
020406080
100120140160180
Feed intake (g/day/rat) Fluid intake (ml/day/rat)
Feed
and
flui
d in
take
NC DBC DXALDXAH DMF NXAH
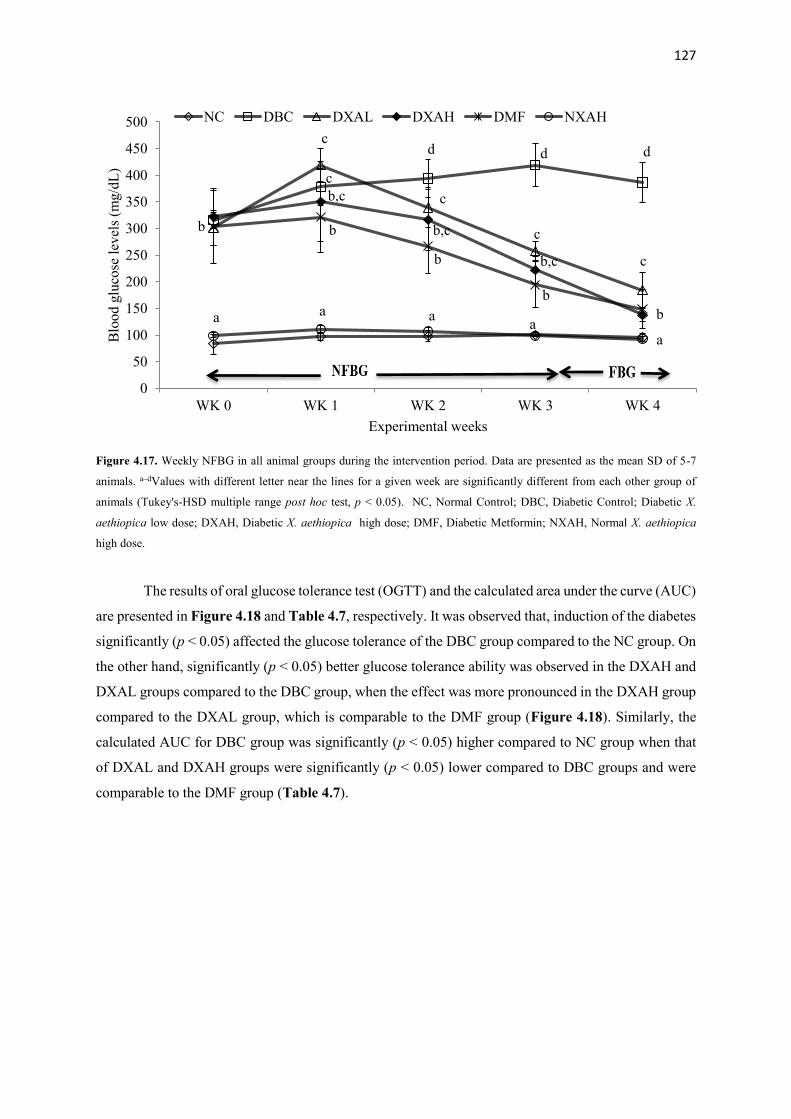
127
Figure 4.17. Weekly NFBG in all animal groups during the intervention period. Data are presented as the mean SD of 5-7
animals. a–dValues with different letter near the lines for a given week are significantly different from each other group of
animals (Tukey's-HSD multiple range post hoc test, p < 0.05). NC, Normal Control; DBC, Diabetic Control; Diabetic X.
aethiopica low dose; DXAH, Diabetic X. aethiopica high dose; DMF, Diabetic Metformin; NXAH, Normal X. aethiopica
high dose.
The results of oral glucose tolerance test (OGTT) and the calculated area under the curve (AUC)
are presented in Figure 4.18 and Table 4.7, respectively. It was observed that, induction of the diabetes
significantly (p < 0.05) affected the glucose tolerance of the DBC group compared to the NC group. On
the other hand, significantly (p < 0.05) better glucose tolerance ability was observed in the DXAH and
DXAL groups compared to the DBC group, when the effect was more pronounced in the DXAH group
compared to the DXAL group, which is comparable to the DMF group (Figure 4.18). Similarly, the
calculated AUC for DBC group was significantly (p < 0.05) higher compared to NC group when that
of DXAL and DXAH groups were significantly (p < 0.05) lower compared to DBC groups and were
comparable to the DMF group (Table 4.7).
c
d d dc
c
c
c
b,c
b,c
b,c
b b
b
bba a a aa
0
50
100
150
200
250
300
350
400
450
500
WK 0 WK 1 WK 2 WK 3 WK 4
Blo
od g
luco
se le
vels
(mg/
dL)
Experimental weeks
NC DBC DXAL DXAH DMF NXAH
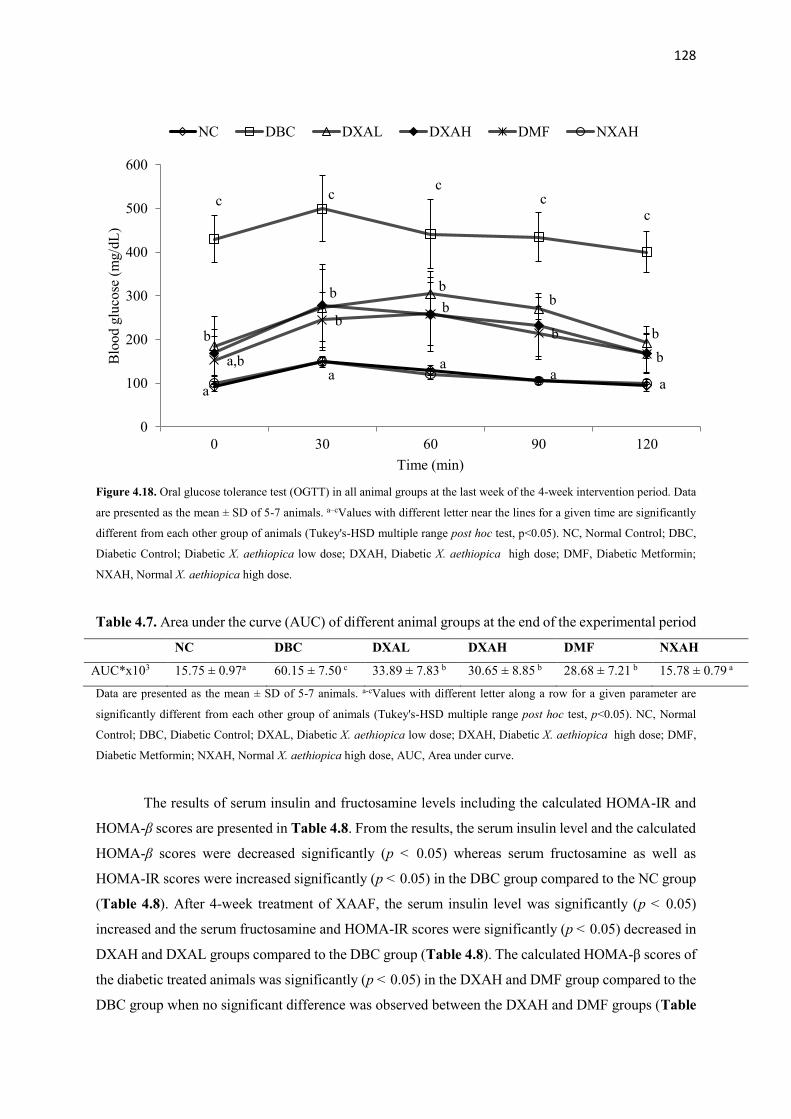
128
Figure 4.18. Oral glucose tolerance test (OGTT) in all animal groups at the last week of the 4-week intervention period. Data
are presented as the mean ± SD of 5-7 animals. a–cValues with different letter near the lines for a given time are significantly
different from each other group of animals (Tukey's-HSD multiple range post hoc test, p<0.05). NC, Normal Control; DBC,
Diabetic Control; Diabetic X. aethiopica low dose; DXAH, Diabetic X. aethiopica high dose; DMF, Diabetic Metformin;
NXAH, Normal X. aethiopica high dose.
Table 4.7. Area under the curve (AUC) of different animal groups at the end of the experimental period
NC DBC DXAL DXAH DMF NXAH
AUC*x103 15.75 ± 0.97a 60.15 ± 7.50 c 33.89 ± 7.83 b 30.65 ± 8.85 b 28.68 ± 7.21 b 15.78 ± 0.79 a
Data are presented as the mean ± SD of 5-7 animals. a-cValues with different letter along a row for a given parameter are
significantly different from each other group of animals (Tukey's-HSD multiple range post hoc test, p<0.05). NC, Normal
Control; DBC, Diabetic Control; DXAL, Diabetic X. aethiopica low dose; DXAH, Diabetic X. aethiopica high dose; DMF,
Diabetic Metformin; NXAH, Normal X. aethiopica high dose, AUC, Area under curve.
The results of serum insulin and fructosamine levels including the calculated HOMA-IR and
HOMA-β scores are presented in Table 4.8. From the results, the serum insulin level and the calculated
HOMA-β scores were decreased significantly (p < 0.05) whereas serum fructosamine as well as
HOMA-IR scores were increased significantly (p < 0.05) in the DBC group compared to the NC group
(Table 4.8). After 4-week treatment of XAAF, the serum insulin level was significantly (p < 0.05)
increased and the serum fructosamine and HOMA-IR scores were significantly (p < 0.05) decreased in
DXAH and DXAL groups compared to the DBC group (Table 4.8). The calculated HOMA-β scores of
the diabetic treated animals was significantly (p < 0.05) in the DXAH and DMF group compared to the
DBC group when no significant difference was observed between the DXAH and DMF groups (Table
c c cc
c
b
b bb
b
a,b
bb
bb
aa
aa a
0
100
200
300
400
500
600
0 30 60 90 120
Blo
od g
luco
se (m
g/dL
)
Time (min)
NC DBC DXAL DXAH DMF NXAH
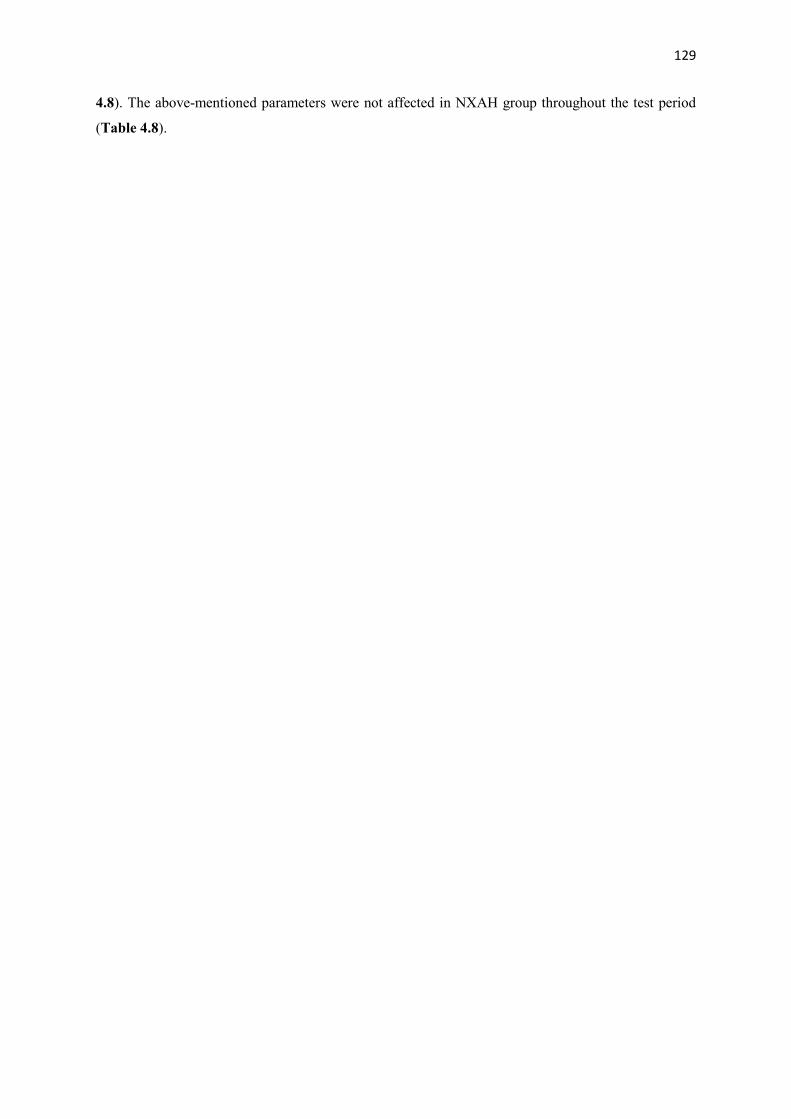
129
4.8). The above-mentioned parameters were not affected in NXAH group throughout the test period
(Table 4.8).
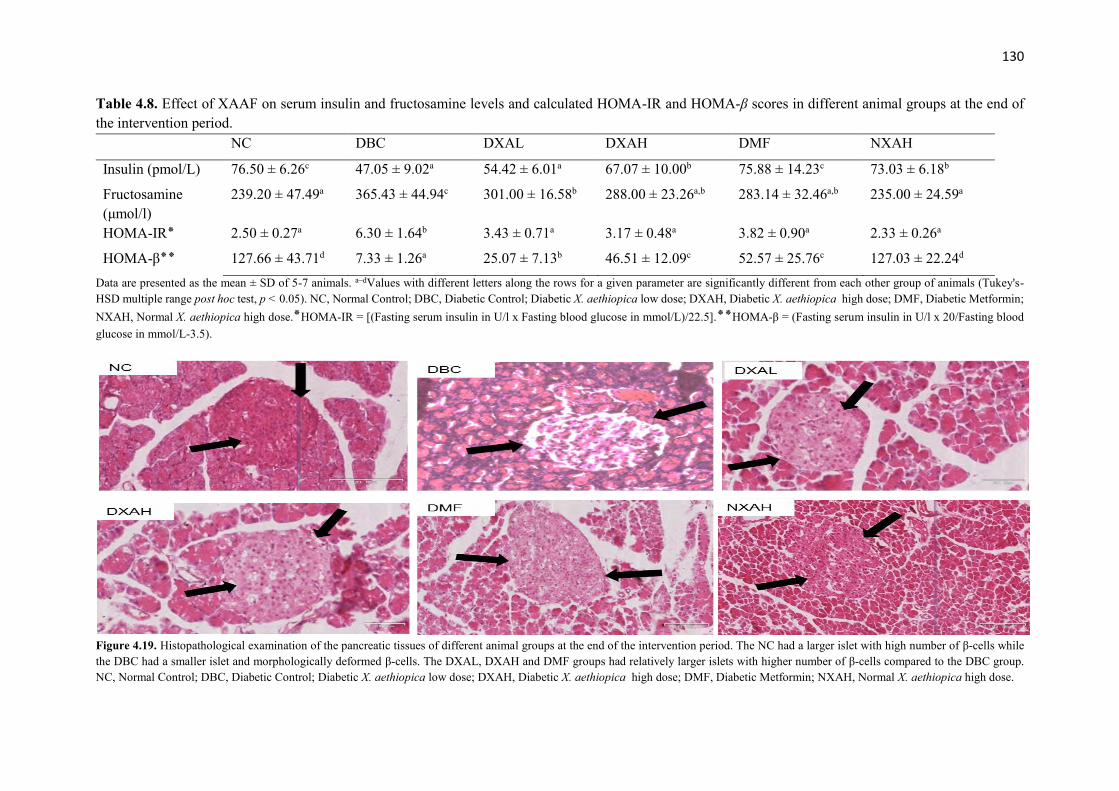
130
Table 4.8. Effect of XAAF on serum insulin and fructosamine levels and calculated HOMA-IR and HOMA-β scores in different animal groups at the end of the intervention period. NC DBC DXAL DXAH DMF NXAH
Insulin (pmol/L) 76.50 ± 6.26c 47.05 ± 9.02a 54.42 ± 6.01a 67.07 ± 10.00b 75.88 ± 14.23c 73.03 ± 6.18b
Fructosamine (μmol/l)
239.20 ± 47.49a 365.43 ± 44.94c 301.00 ± 16.58b 288.00 ± 23.26a,b 283.14 ± 32.46a,b 235.00 ± 24.59a
HOMA-IR0.27 ± 2.50 ٭a 6.30 ± 1.64b 3.43 ± 0.71a 3.17 ± 0.48a 3.82 ± 0.90a 2.33 ± 0.26a
HOMA-β43.71 ± 127.66 ٭٭d 7.33 ± 1.26a 25.07 ± 7.13b 46.51 ± 12.09c 52.57 ± 25.76c 127.03 ± 22.24d Data are presented as the mean ± SD of 5-7 animals. a–dValues with different letters along the rows for a given parameter are significantly different from each other group of animals (Tukey's-HSD multiple range post hoc test, p < 0.05). NC, Normal Control; DBC, Diabetic Control; Diabetic X. aethiopica low dose; DXAH, Diabetic X. aethiopica high dose; DMF, Diabetic Metformin; NXAH, Normal X. aethiopica high dose.٭HOMA-IR = [(Fasting serum insulin in U/l x Fasting blood glucose in mmol/L)/22.5].٭٭HOMA-β = (Fasting serum insulin in U/l x 20/Fasting blood glucose in mmol/L-3.5).
Figure 4.19. Histopathological examination of the pancreatic tissues of different animal groups at the end of the intervention period. The NC had a larger islet with high number of β-cells while the DBC had a smaller islet and morphologically deformed β-cells. The DXAL, DXAH and DMF groups had relatively larger islets with higher number of β-cells compared to the DBC group. NC, Normal Control; DBC, Diabetic Control; Diabetic X. aethiopica low dose; DXAH, Diabetic X. aethiopica high dose; DMF, Diabetic Metformin; NXAH, Normal X. aethiopica high dose.
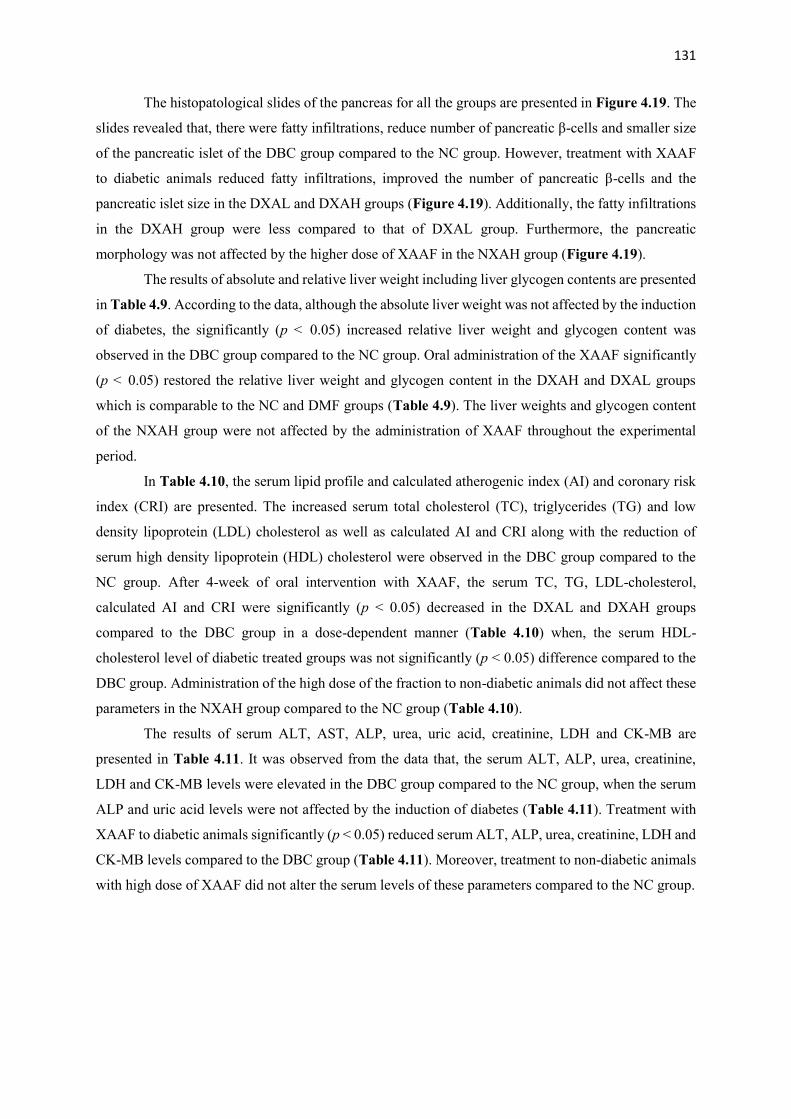
131
The histopatological slides of the pancreas for all the groups are presented in Figure 4.19. The
slides revealed that, there were fatty infiltrations, reduce number of pancreatic β-cells and smaller size
of the pancreatic islet of the DBC group compared to the NC group. However, treatment with XAAF
to diabetic animals reduced fatty infiltrations, improved the number of pancreatic β-cells and the
pancreatic islet size in the DXAL and DXAH groups (Figure 4.19). Additionally, the fatty infiltrations
in the DXAH group were less compared to that of DXAL group. Furthermore, the pancreatic
morphology was not affected by the higher dose of XAAF in the NXAH group (Figure 4.19).
The results of absolute and relative liver weight including liver glycogen contents are presented
in Table 4.9. According to the data, although the absolute liver weight was not affected by the induction
of diabetes, the significantly (p < 0.05) increased relative liver weight and glycogen content was
observed in the DBC group compared to the NC group. Oral administration of the XAAF significantly
(p < 0.05) restored the relative liver weight and glycogen content in the DXAH and DXAL groups
which is comparable to the NC and DMF groups (Table 4.9). The liver weights and glycogen content
of the NXAH group were not affected by the administration of XAAF throughout the experimental
period.
In Table 4.10, the serum lipid profile and calculated atherogenic index (AI) and coronary risk
index (CRI) are presented. The increased serum total cholesterol (TC), triglycerides (TG) and low
density lipoprotein (LDL) cholesterol as well as calculated AI and CRI along with the reduction of
serum high density lipoprotein (HDL) cholesterol were observed in the DBC group compared to the
NC group. After 4-week of oral intervention with XAAF, the serum TC, TG, LDL-cholesterol,
calculated AI and CRI were significantly (p < 0.05) decreased in the DXAL and DXAH groups
compared to the DBC group in a dose-dependent manner (Table 4.10) when, the serum HDL-
cholesterol level of diabetic treated groups was not significantly (p < 0.05) difference compared to the
DBC group. Administration of the high dose of the fraction to non-diabetic animals did not affect these
parameters in the NXAH group compared to the NC group (Table 4.10).
The results of serum ALT, AST, ALP, urea, uric acid, creatinine, LDH and CK-MB are
presented in Table 4.11. It was observed from the data that, the serum ALT, ALP, urea, creatinine,
LDH and CK-MB levels were elevated in the DBC group compared to the NC group, when the serum
ALP and uric acid levels were not affected by the induction of diabetes (Table 4.11). Treatment with
XAAF to diabetic animals significantly (p < 0.05) reduced serum ALT, ALP, urea, creatinine, LDH and
CK-MB levels compared to the DBC group (Table 4.11). Moreover, treatment to non-diabetic animals
with high dose of XAAF did not alter the serum levels of these parameters compared to the NC group.
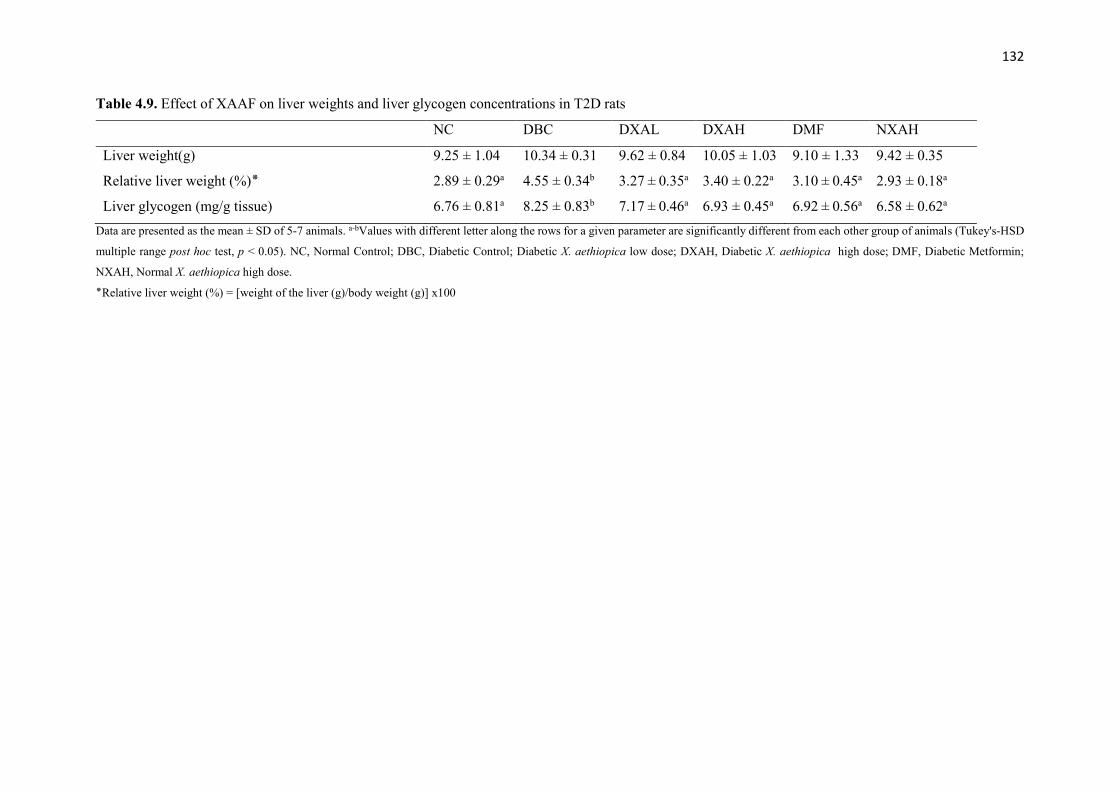
132
Table 4.9. Effect of XAAF on liver weights and liver glycogen concentrations in T2D rats
NC DBC DXAL DXAH DMF NXAH
Liver weight(g) 9.25 ± 1.04 10.34 ± 0.31 9.62 ± 0.84 10.05 ± 1.03 9.10 ± 1.33 9.42 ± 0.35
Relative liver weight (%)0.29 ± 2.89 ٭a 4.55 ± 0.34b 3.27 ± 0.35a 3.40 ± 0.22a 3.10 ± 0.45a 2.93 ± 0.18a
Liver glycogen (mg/g tissue) 6.76 ± 0.81a 8.25 ± 0.83b 7.17 ± 0.46a 6.93 ± 0.45a 6.92 ± 0.56a 6.58 ± 0.62a Data are presented as the mean ± SD of 5-7 animals. a-bValues with different letter along the rows for a given parameter are significantly different from each other group of animals (Tukey's-HSD
multiple range post hoc test, p < 0.05). NC, Normal Control; DBC, Diabetic Control; Diabetic X. aethiopica low dose; DXAH, Diabetic X. aethiopica high dose; DMF, Diabetic Metformin;
NXAH, Normal X. aethiopica high dose.
Relative liver weight (%) = [weight of the liver (g)/body weight (g)] x100٭
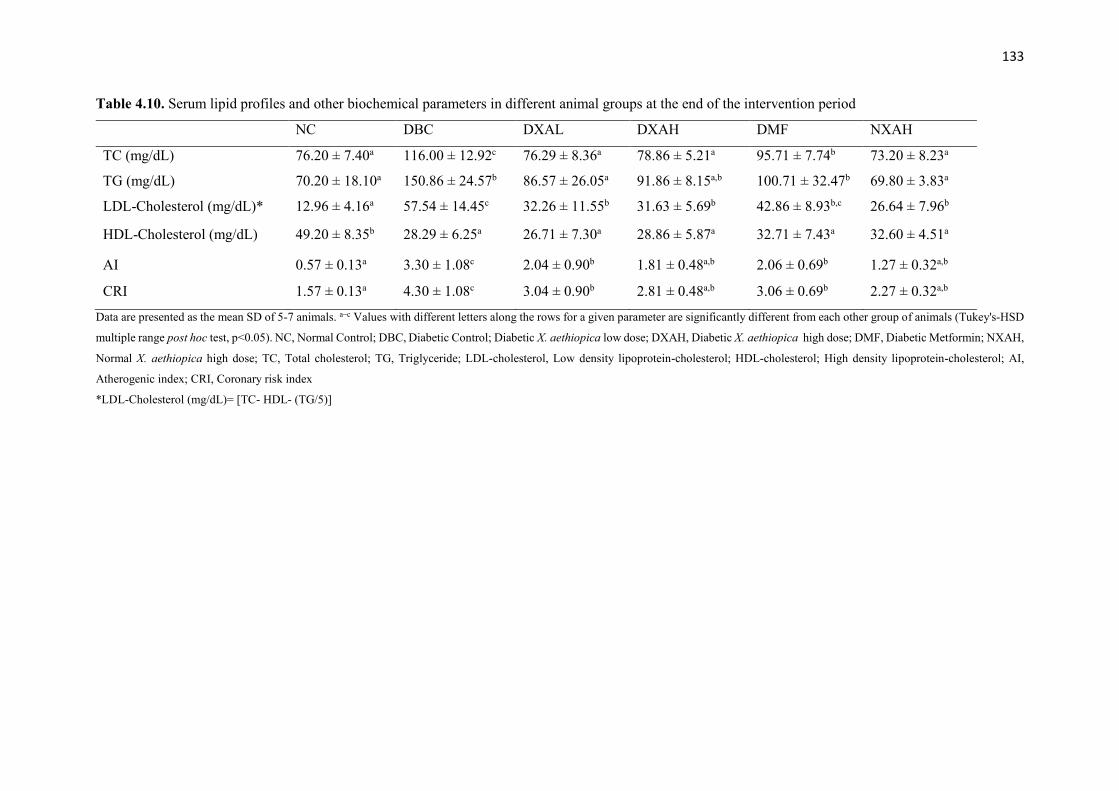
133
Table 4.10. Serum lipid profiles and other biochemical parameters in different animal groups at the end of the intervention period
NC DBC DXAL DXAH DMF NXAH
TC (mg/dL) 76.20 ± 7.40a 116.00 ± 12.92c 76.29 ± 8.36a 78.86 ± 5.21a 95.71 ± 7.74b 73.20 ± 8.23a
TG (mg/dL) 70.20 ± 18.10a 150.86 ± 24.57b 86.57 ± 26.05a 91.86 ± 8.15a,b 100.71 ± 32.47b 69.80 ± 3.83a
LDL-Cholesterol (mg/dL)* 12.96 ± 4.16a 57.54 ± 14.45c 32.26 ± 11.55b 31.63 ± 5.69b 42.86 ± 8.93b,c 26.64 ± 7.96b
HDL-Cholesterol (mg/dL) 49.20 ± 8.35b 28.29 ± 6.25a 26.71 ± 7.30a 28.86 ± 5.87a 32.71 ± 7.43a 32.60 ± 4.51a
AI 0.57 ± 0.13a 3.30 ± 1.08c 2.04 ± 0.90b 1.81 ± 0.48a,b 2.06 ± 0.69b 1.27 ± 0.32a,b
CRI 1.57 ± 0.13a 4.30 ± 1.08c 3.04 ± 0.90b 2.81 ± 0.48a,b 3.06 ± 0.69b 2.27 ± 0.32a,b
Data are presented as the mean SD of 5-7 animals. a–c Values with different letters along the rows for a given parameter are significantly different from each other group of animals (Tukey's-HSD
multiple range post hoc test, p<0.05). NC, Normal Control; DBC, Diabetic Control; Diabetic X. aethiopica low dose; DXAH, Diabetic X. aethiopica high dose; DMF, Diabetic Metformin; NXAH,
Normal X. aethiopica high dose; TC, Total cholesterol; TG, Triglyceride; LDL-cholesterol, Low density lipoprotein-cholesterol; HDL-cholesterol; High density lipoprotein-cholesterol; AI,
Atherogenic index; CRI, Coronary risk index
*LDL-Cholesterol (mg/dL)= [TC- HDL- (TG/5)]

134
Table 4.11. Serum biochemical parameters in different animal groups at the end of the intervention period
NC DBC DXAL DXAH DMF NXAH
ALT (U/L) 77.40 ± 20.38a 116.14 ± 37.37c 81.29 ± 8.46a 87.57 ± 9.86a,b 93.57 ± 6.86b 73.80 ± 14.1a
AST (U/L) 88.40 ± 11.41 83.29 ± 15.57 80.29 ± 13.09 83.43 ± 9.45 94.71 ± 9.39 82.60 ± 16.33
ALP (U/l) 149.40 ± 11.33a 451.14 ± 35.10d 317.71 ± 33.60c 234.86 ± 25.79b 208.86 ± 27.58b 146.40 ± 19.32a
Creatinine (mg/dL) 2.52 ± 0.78b 3.12 ± 0.45b 2.27 ± 0.34b 2.13 ± 0.40b 1.68 ± 0.27a 1.35 ± 0.34a
Urea (mg/dL) 22.00 ± 4.69a 60.71 ± 15.71c 29.43 ± 6.43b 30.00 ± 8.91b 26.00 ± 5.00b 17.80 ± 4.66a
Uric acid (mg/dL) 2.06 ± 0.67 2.85 ± 1.18 2.05 ± 1.07 2.40 ± 1.20 2.56 ± 1.36 1.48 ± 0.40
LDH (U/L) 284.00 ± 62.56a 458.86 ± 68.05c 339.86 ± 64.41b 301.71 ± 36.94b 361.57 ± 80.66a,b 295.60 ± 37.96a
CK-MB (U/L) 374.54 ± 82.56a 1064.36 ± 537.18b 582.53 ± 86.00a 492.01 ± 51.28a 743.97 ± 75.29a,b 371.52 ± 9.06a
Data are presented as mean ± SD of 5-7 animals. a–dValues with different superscript letters along a row for a given parameter are significantly different from each other group of animals (Tukey's-
HSD multiple range post hoc test, p < 0.05). ALT, Alanine transaminase; AST, Alanine transaminase; ALP, Alkaline phosphate; LDH, Lactate dehydrogenase; CK-MB, Creatine kinase.

135
4.3.5 Discussion
In the traditional medicine from West Africa, X. aethiopica fruit is used locally for anti-diabetic
remedy and other related metabolic disorders (Soladoye et al. 2012; Diallo et al. 2012; Karou et al.
2011; Diéye et al. 2008). In addition, the acetone fraction derived from the fruit ethanolic extract has
demonstrated higher inhibitory effect of α-glucosidae and α-amylase actions in vitro (unpublished data)
compared to other fractions and therefore was selected for the present study. This is the first
comprehensive study that reports the anti-diabetic potential of X. aethiopica fruit, despite the popularity
of the plant in the treatment of diabetes in West Africa. The result of our present study is quite promising
as the both dosages of the fraction (150 and 300 mg/kg bw) used have demonstrated strong anti-diabetic
activity in the diabetic animals.
Etoundi et al. (2013) have reported that the daily administration of X. aethiopica fruit ethanolic
extract (400 mg/kg bw) for 30 days reverted the gained body weight in high-sucrose fed rats. In another
study, non-diabetic animals maintained in diets with 2% and 4% of X. aethiopica fruit for 2 weeks
showed no effect on the bw of the treated animals (Adefegha and Oboh, 2012a). However, the effect X.
aethiopica fruit ethanolic extracts or fruit itself may be different from the X. aethiopica acetone fraction
of fruit ethanolic extract. Additionally, the effects of X. aethiopica fruit extracts or fraction may not be
similar in non-diabetic and diabetic animals. Hence, the effects XAAF in our study are not exactly
consistent with the above-mentioned studies. However, despite of lower feed and fluid intake (Figure
4.16) the significantly improved body weight in the XAAF administered groups (DXAL and DXAH)
compared to the DBC group (Figure 4.15) revealed its potent anti-diabetic effects, when no significant
alteration was observed in the NXAH group (Figure 4.15 and 4.16). The result was further supported
by the significantly reduced blood glucose level in the DXAL and DXAH groups compared to the DBC
group (Figure 4.17).
In our present study, the persistent hyperglycemia was observed in the DBC group throughout
the experimental period (Figure 4.17), which is an indication of successful induction of diabetes. At
the same time, significantly higher HOMA-IR scores and significantly lower HOMA-β scores in the
DBC group compared to the NC group (Table 4.7) confirmed the induction of insulin resistance and
partial pancreatic beta-cell dysfunction. However, a dose-dependent reduction of blood glucose level
was observed in the diabetic treated animals (Figure 4.17), which was further supported by the OGTT
data (Figure 4.18). In a previous study, Etoundi et al. (2013) have reported that, high-sucrose fed rats
treated with 400 mg/kg bw of fruit ethanolic extract improved the blood glucose tolerance ability, which
is in line with our present data. This could be due to the potent inhibitory effects of X. aethiopica fruit
on the activities of carbohydrate hydrolyzing enzymes as reported previously (Adefegha and Oboh,
2012a; Etoundi et al. 2010). The inhibitors of these enzymes cause a decrease in the digestion of
carbohydrates and intestinal absorption of glucose and therefore reduced the hyperglycemia in T2D
(Ademiluyi and Oboh, 2013). In addition, even though, the dosages used in our present study are lower

136
compared to the earlier study (Etoundi et al. 2013), the significantly lower blood glucose levels and
better glucose tolerance ability of the DXAL and DXAH groups compared to DBC the group (Figures
4.17 and 4.18) revealed the potential anti-diabetic effects XAAF, at least in the case of type 2 diabetes.
It has been reported that chronic uncontrolled hyperglycemia in T2D causes an impairment or
decline in insulin secretion (Nattrass and Bailey, 1999), with subsequent distortion of pancreatic
architecture, β-cell integrity and function as well (Bonner-Weir and O'Brien, 2008). These effects were
fully manifested in the DBC group in our present study (Table 4.8 and Figure 4.19). On the other hand,
the oral treatment of XAAF dose dependently improved serum insulin levels, decreased insulin
resistance and restored the pancreatic morphology to near normal in diabetic animals. In one of our
previous studies, the XAAF was also found to possess high in vitro anti-oxidative activity (data not
shown) in addition to other studies conducted on the crude extracts of X. aethiopica fruit (Adefegha and
Oboh, 2012a; 2011; Etoundi et al. 2010; Odukoya et al. 2005; George and Osiama, 2011). Therefore,
we may propose that the protection of the pancreatic islets morphology could be mediated through the
anti-oxidant potentials because oxidative stress is the major causal factor for the pancreatic β-cell
damage inT2D (Huang et al. 2011). Interestingly, the above hypothesis was further supported by the
significant attenuation of the serum fructosamine level in diabetic treated animals (Table 4.8). The
reduction of serum fructosamine level by XAAF is an indication of decrease in protein glycosylation, a
major contributor to the production of advanced glycation ends products in diabetic condition.
In consistent with the earlier reports, the absolute liver weight was not affected but the relative
liver weight and liver glycogen content were significantly increased by the induction of diabetes (Clore
et al. 1992; Oliveira et al. 2008). The elevation of hepatic glycogen content could possibly be linked to
the fructose feeding that triggers hepatic glycogenesis via stimulation of glucose-6-phosphatase activity
and cause higher accumulation of glycogen in the liver despite low circulating insulin (Ciudad et al.
1988). However, these effects were completely attenuated to near normal in DXAH and DXAL groups
and were comparable to DMF group (Table 4.9). This suggests that, XAAF may modulate glycogen
biosynthesis by suppressing the activity of glucose-6-phosphatase through a reduction in glucose-6-
phosphate/ATP ratio and therefore, decreases the hepatic glycogen synthesis and storage as well.
Though the diabetic treated animals have shown insulinotropic ability, which invariably mobilize
hepatic glucose input for glycogenesis, the hepatic glycogen level was maintained within the normal
range. This has demonstrated that treatment of XAAF to diabetic animals restored the normal metabolic
processes altered by the induction of diabetes, which was further supported by the anti-hyperlipidemic
effect of XAAF (Table 4.10).
Considerable evidence has been accumulated to correlate insulin resistance in the etiology of
dyslipidemia in T2D. It has been postulated that the insulin resistance stimulate lipolysis from the fats
depots, which promote the activity of HMG-CoA reductase and decrease lipoprotein lipase, which lead
to the elevation of TG and TC levels (De Silva and Frayling, 2010; Hotamisligil, 2000). In a previous
study, the oral treatment of X. aethiopica fruit aqueous extract (200 mg/kg bw) to non-diabetic animals

137
for 2 weeks exhibited hypolipidemic action (Johnkennedy et al. 2011). Moreover, Adefegha and Oboh
(2012a) also reported similar findings when X. aethiopica fruit (2% and 4%) was included in the diet
of the same animal model and for the same period of time. In another study, administration of X.
aethiopica aqueous extract (250 mg/kg bw) for 8 weeks demonstrated potent anti-hyperlipidemic effect
in hypercholesterolemic rats (Nwozo et al. 2011). Conversely, in a more recent study, Etoundi et al.
(2013) have shown that ethanolic extract (400 mg/kg bw) did not show any significant anti-
hyperlipidemic action after 2-day post-treatment period in hyperlipidemic rats. However, in our study,
the X. aethiopica fruit acetone fraction showed potent anti-hyperlipidemic ability with no alterations in
serum lipid profile of NXAH group (Table 4.10). Therefore, the lipid-lowering effect of X. aethiopica
fruit can only be achieved after prolong treatment (sub-chronic or chronic) against the acute treatment
as recently reported by Etoundi et al. (2013). In addition, the anti-hyperlipidemic action of XAAF
observed in our present study could be attributed to the reduction of insulin resistance in the diabetic
treated animals.
On the other hand, Etoundi et al. (2013) have also reported the hepato-protective ability of X.
aethiopica fruit (400 mg/kg bw) in hyperlipidemic rats via reduction of serum ALT and AST levels in
the treated animals. Additionally, no significant alterations of serum ALT, AST and ALP were observed
in non-diabetic animals treated with X. aethiopica fruit (3% and 4%) in diet for 2 weeks (Adefegha and
Oboh, 2012a). This was apparently in line with our present data (Table 4.11). Treatment of the fraction
protects the integrity of the liver as well as heart via reductions of serum ALT, ALP, urea, creatinine,
LDH and CK-MB in the treated diabetic animals. The serum AST was found not to be affected by the
diabetes throughout the study period. In comparison with ALT, AST is less specific for the detection of
hepatic injury due to its shorter half-life compared to ALT, particularly in experimental animals (Center,
2007).
4.3.6 Conclusion
In conclusion, oral intervention of X. aethiopica fruit acetone fraction (150 and 300 mg/kg bw)
have demonstrated anti-diabetic actions via improving bw gain, reducing food and fluid intake and
hyperglycemia, improving glucose tolerance ability, insulin sensitivity, amelioration of pancreatic β-
cell histology and β-cell functions and improving dyslipidemia in T2D model of rats. Hence, our
findings suggest that acetone fraction derived from X. aethiopica fruit may provide an excellent anti-
diabetic remedy with no considerable side effects. Further clinical study is required to confirm the
effects in human subjects. The isolation and partial characterization of the active principle from XAAF
is currently underway to find the compound(s) responsible for this activity
138
4.4 In vivo anti-oxidant potential of Xylopia aethiopica fruit acetone
fraction in a type 2 diabetes model of rats
Aminu Mohammed a,b and Md. Shahidul Islam a*
aDepartment of Biochemistry, School of Life Sciences, University of KwaZulu-Natal, (Westville
Campus), Durban, 4000, South Africa bDepartment of Biochemistry, Faculty of Science, Ahmadu Bello University, Zaria-Nigeria
4.4.1 Abstract Objectives: The present study investigated the in vivo anti-oxidative actions of Xylopia aethiopica
acetone fraction (XAAF) from fruit ethanolic extract in a type 2 diabetes (T2D) model of rats.
Methods: T2D was induced in rats by feeding a 10% fructose solution ad libitum for two weeks
followed by a single intraperitoneal injection of streptozotocin (40 mg/kg body weight(bw)) and the
animals were orally treated with 150 or 300 mg/kg bw of the XAAF once daily for four weeks.
Results: After four weeks of intervention, diabetic untreated animals showed significantly higher levels
of thiobarbituric acid reactive substances (TBARS) and reductions of reduced glutathione (GSH) in the
serum and organs (liver, kidney, heart and pancreas) compared to the normal animals. The activities of
endogenous anti-oxidant enzymes (superoxide dismutase, catalase, glutathione peroxidase and
reductase) were greatly impaired in in the serum and organs of diabetic untreated animals compared to
the normal animals. These alterations were reverted to near-normal after the treatment of XAAF,
especially at the dose of 300 mg/kg bw.
Conclusion: The results of our study suggest that XAAF treatment at 300 mg/kg bw showed potent
anti-oxidative action in a T2D model of rats.
Keywords: Xylopia aethiopica, Anti-oxidant, acetone fraction, Fruit ethanolic extract, Type 2 diabetes,
Rats.
4.4.2 Introduction
Recently, tremendous evidences are available, correlating the cellular injury arising from ROS
in the etiology of some diseases such as Alzheimer disease, inflammation, viral infections and T2D
(Kroner, 2009; Atawodi, 2005; Rahimi et al. 2005). In T2D, the mechanisms involve in hyperglycemia-
induced cellular and tissue damages have been previously described (Sabu and Kuttan, 2002; Boynes,
1991; Collier et al. 1990). This condition causes a depletion of in vivo anti-oxidant defense system and
increase the ROS production, a term referred as oxidative stress. Therefore, due to decrease in the

139
overall in vivo defense system, the increased intake of anti-oxidants cannot be underestimated.
Interestingly, within the last two decades, there has been an upsurge of interest in the utilization of
natural anti-oxidants present in plants such as Xylopia aethiopica (Dunal) A. Rich. (Annonaceae) in
attenuating the deleterious ROS-induced tissue damage (Sangeetha et al. 2011).
X. aethiopica also known as Ethiopian pepper is an indigenous spice widely distributed in
almost all parts of Africa (Iwu, 2014). In some previous studies, extracts derived from the X. aethiopica
fruit have showed potent anti-oxidative activity using various in vitro models (Adefegha and Oboh,
2012a,c; 2011; Etoundi et al. 2010; Odukoya et al. 2005; George and Osiama, 2011). In another study,
the seed aqueous extract was reported to exhibit hypolidemic and anti-oxidant actions in
hypercholesterolemic rats (Nwozo et al. 2011). In addition, our recent investigation have shown that X.
aethiopica acetone fraction (XAAF) from fruit EtOH extract demonstrated anti-oxidative potential in
vitro, ameliorated β-cell dysfunction and decreased blood glucose levels in a T2D model of rats
(Mohammed and Islam, 2015; Unpublished work). Therefore in order to fully validate the anti-diabetic
action of XAAF, our present study investigate the effect of XAAF in attenuating hyperglycemia-
induced alterations on the in vivo anti-oxidant defense system in type 2 diabetic animals.
4.4.3 Materials and methods
For sample collection, identification and preparation of the fraction, including the detail
experimental protocols, please refer to chapter 2, sub-sections 2.3 and 2.5.1 to 2.5.8.
4.4.4 Results
The data of the lipid peroxidation, expressed as malondialdehyde (MDA) concentration of the
serum and organs (liver, kidney, heart and pancreas) of all the groups are presented in Figure 4.20.
According to the results, the MDA concentration of diabetic control (DBC) group has significantly (p
< 0.05) increased in the serum, liver, heart and pancreas compared to the NC group. Additionally, the
elevation of MDA level in the kidney of the the DBC group was not significantly (p < 0.05) affected
by the diabetes (Figure 4.20). However, oral administration of XAAF has significantly (p < 0.05)
reduced the MDA levels in the serum, liver and pancreas of the DXAL and DXAH groups, comparable
to the DMF group. The reduction of MDA in the kidney and heart of the diabetic treated groups was
observed not to differ significantly (p < 0.05) compared to DBC group (Figure 4.20).
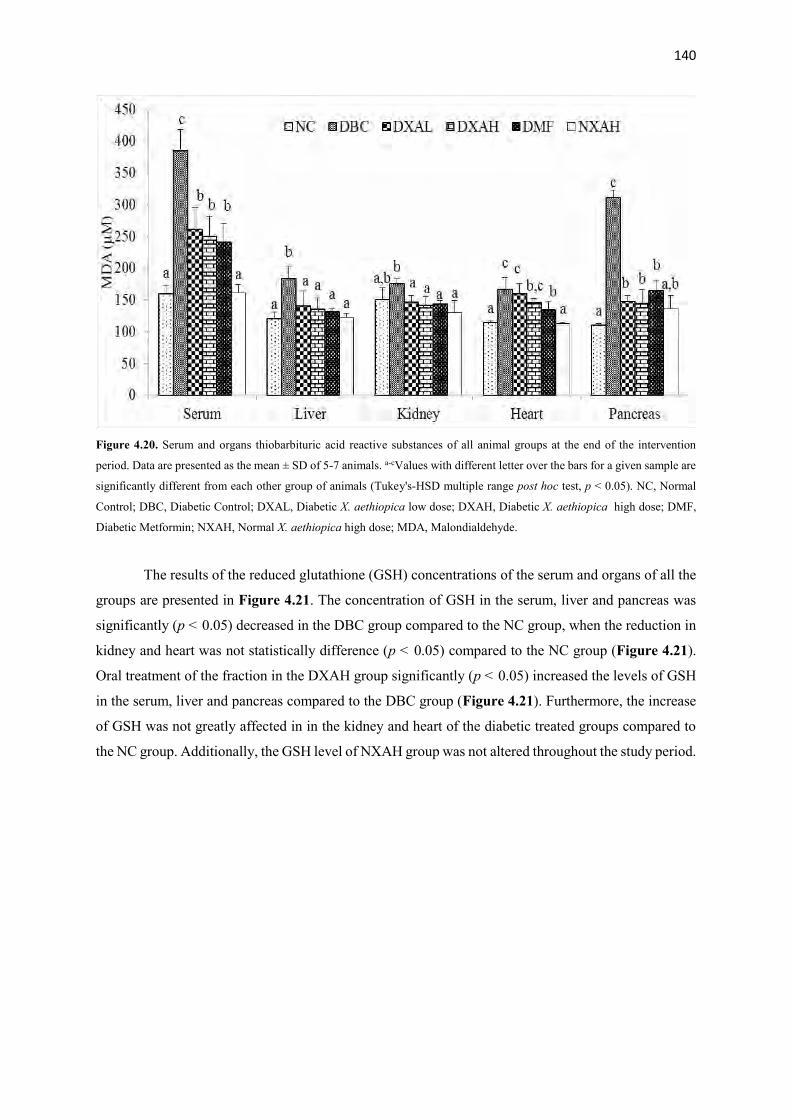
140
Figure 4.20. Serum and organs thiobarbituric acid reactive substances of all animal groups at the end of the intervention
period. Data are presented as the mean ± SD of 5-7 animals. a-cValues with different letter over the bars for a given sample are
significantly different from each other group of animals (Tukey's-HSD multiple range post hoc test, p < 0.05). NC, Normal
Control; DBC, Diabetic Control; DXAL, Diabetic X. aethiopica low dose; DXAH, Diabetic X. aethiopica high dose; DMF,
Diabetic Metformin; NXAH, Normal X. aethiopica high dose; MDA, Malondialdehyde.
The results of the reduced glutathione (GSH) concentrations of the serum and organs of all the
groups are presented in Figure 4.21. The concentration of GSH in the serum, liver and pancreas was
significantly (p < 0.05) decreased in the DBC group compared to the NC group, when the reduction in
kidney and heart was not statistically difference (p < 0.05) compared to the NC group (Figure 4.21).
Oral treatment of the fraction in the DXAH group significantly (p < 0.05) increased the levels of GSH
in the serum, liver and pancreas compared to the DBC group (Figure 4.21). Furthermore, the increase
of GSH was not greatly affected in in the kidney and heart of the diabetic treated groups compared to
the NC group. Additionally, the GSH level of NXAH group was not altered throughout the study period.
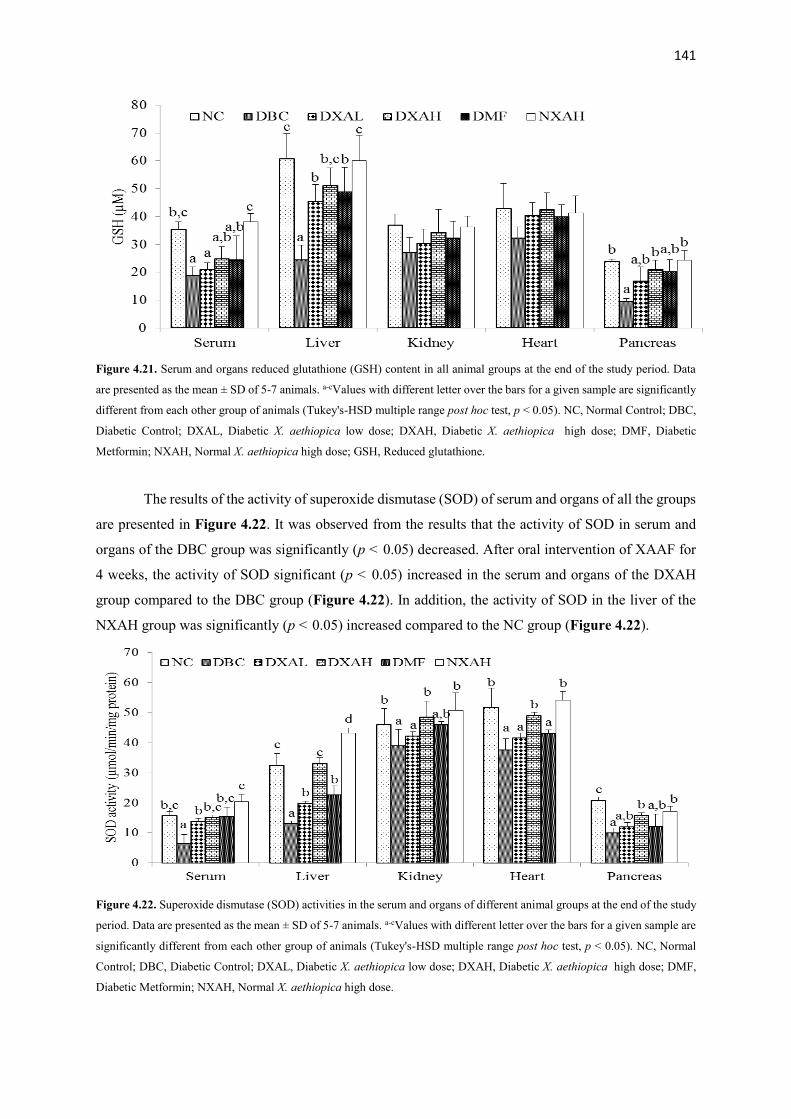
141
Figure 4.21. Serum and organs reduced glutathione (GSH) content in all animal groups at the end of the study period. Data
are presented as the mean ± SD of 5-7 animals. a-cValues with different letter over the bars for a given sample are significantly
different from each other group of animals (Tukey's-HSD multiple range post hoc test, p < 0.05). NC, Normal Control; DBC,
Diabetic Control; DXAL, Diabetic X. aethiopica low dose; DXAH, Diabetic X. aethiopica high dose; DMF, Diabetic
Metformin; NXAH, Normal X. aethiopica high dose; GSH, Reduced glutathione.
The results of the activity of superoxide dismutase (SOD) of serum and organs of all the groups
are presented in Figure 4.22. It was observed from the results that the activity of SOD in serum and
organs of the DBC group was significantly (p < 0.05) decreased. After oral intervention of XAAF for
4 weeks, the activity of SOD significant (p < 0.05) increased in the serum and organs of the DXAH
group compared to the DBC group (Figure 4.22). In addition, the activity of SOD in the liver of the
NXAH group was significantly (p < 0.05) increased compared to the NC group (Figure 4.22).
Figure 4.22. Superoxide dismutase (SOD) activities in the serum and organs of different animal groups at the end of the study
period. Data are presented as the mean ± SD of 5-7 animals. a-cValues with different letter over the bars for a given sample are
significantly different from each other group of animals (Tukey's-HSD multiple range post hoc test, p < 0.05). NC, Normal
Control; DBC, Diabetic Control; DXAL, Diabetic X. aethiopica low dose; DXAH, Diabetic X. aethiopica high dose; DMF,
Diabetic Metformin; NXAH, Normal X. aethiopica high dose.
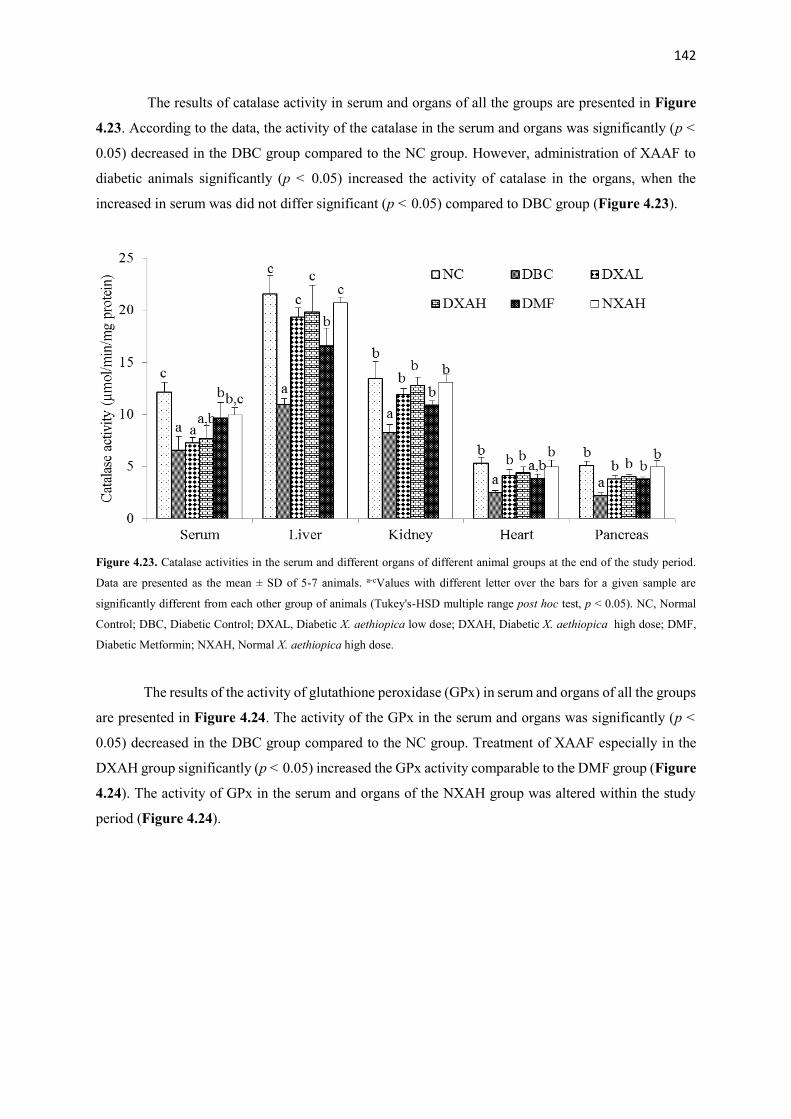
142
The results of catalase activity in serum and organs of all the groups are presented in Figure
4.23. According to the data, the activity of the catalase in the serum and organs was significantly (p <
0.05) decreased in the DBC group compared to the NC group. However, administration of XAAF to
diabetic animals significantly (p < 0.05) increased the activity of catalase in the organs, when the
increased in serum was did not differ significant (p < 0.05) compared to DBC group (Figure 4.23).
Figure 4.23. Catalase activities in the serum and different organs of different animal groups at the end of the study period.
Data are presented as the mean ± SD of 5-7 animals. a-cValues with different letter over the bars for a given sample are
significantly different from each other group of animals (Tukey's-HSD multiple range post hoc test, p < 0.05). NC, Normal
Control; DBC, Diabetic Control; DXAL, Diabetic X. aethiopica low dose; DXAH, Diabetic X. aethiopica high dose; DMF,
Diabetic Metformin; NXAH, Normal X. aethiopica high dose.
The results of the activity of glutathione peroxidase (GPx) in serum and organs of all the groups
are presented in Figure 4.24. The activity of the GPx in the serum and organs was significantly (p <
0.05) decreased in the DBC group compared to the NC group. Treatment of XAAF especially in the
DXAH group significantly (p < 0.05) increased the GPx activity comparable to the DMF group (Figure
4.24). The activity of GPx in the serum and organs of the NXAH group was altered within the study
period (Figure 4.24).

143
Figure 4.25. Glutathione peroxidase activities in the serum and organs of different animal groups at the end of the study period.
Data are presented as the mean ± SD of 5-7 animals. a-cValues with different letters over the bars for a given sample are
significantly different from each other group of animals (Tukey's-HSD multiple range post hoc test, p < 0.05). NC, Normal
Control; DBC, Diabetic Control; DXAL, Diabetic X. aethiopica low dose; DXAH, Diabetic X. aethiopica high dose; DMF,
Diabetic Metformin; NXAH, Normal X. aethiopica high dose.
The data of glutathione reductase (GR) activity in the serum and organs of all the groups are
presented in Figure 4.25. The activity of this enzyme was not affected by the diabetes in the kidney and
heart, whereas significantly (p < 0.05) decreased in the serum, liver and pancreas of the DBC group
compared to NC group (Figure 4.25). However, oral administration of the XAAF especially in the
DXAH significantly (p < 0.05) and dose-dependently increased in activity of GR in serum, liver,
kidney and pancreas, when in the eart the effect was not statistically different from the DBC group
(Figure 4.25). In addition, treatment of XAAF had significantly (p < 0.05) increased the activity of GR
in the liver, kidney and heart of NAMH compared to the NC group (Figure 4.25).
Figure 4.25. Glutathione reductase activities in the serum and organs of different animal groups at the end of the study period.
Data are presented as the mean ± SD of 5-7 animals. a-dValues with different letter over the bars for a given sample are
significantly different from each other group of animals (Tukey's-HSD multiple range post hoc test, p < 0.05). NC, Normal
Control; DBC, Diabetic Control; DXAL, Diabetic X. aethiopica low dose; DXAH, Diabetic X. aethiopica high dose; DMF,
Diabetic Metformin; NXAH, Normal X. aethiopica high dose.

144
4.4.5 Discussion
In a previous study, Nwozo et al. (2011) have reported that administration of X. aethiopica
aqueous extract (250 mg/kg bw) for 8 weeks decrease MDA level in the serum, liver and kidney of
hypercholesterolemic rats. This is in line with the result of our present study and was similarly observed
in the heart and pancreas of the diabetic treated animals (Figure 4.20). Additionally, the result is
promising even at the lower dose (150 mg/kg bw) of XAAF used in our present study. Lipid
peroxidation manifested due to impair lipid metabolism plays a crucial role in the pathogenesis of
cellular damage in T2D (Fenercioglu et al. 2010; Memısogullari et al. 2003). Therefore, the potent
reduction of MDA levels after treatment of XAAF indicated the ability of the XAAF in modulating
diabetes-induced cellular injury and oxidative stress as well. The data was further supported by the
increase in reduced glutathione (GSH) levels of the diabetic treated animals (Figure 4.21).
GSH is an important cellular anti-oxidant biomolecule that prevents the oxidative damage by
alleviating the ROS mediated lipid peroxidation (Rahimi et al. 2005). Previously, treatment of X.
aethiopica fruit aqueous extract at 250 mg/kg bw for 8 weeks to hypercholesterolemic rats was reported
to elevate serum GSH level to near normal (Nwozo et al. 2011). This again accord with the result of our
present study, when the effect was more pronounced in the DXAH group than DXAL group (Figure
4.21). The increase of GSH concentrations in the serum and organs of diabetic treated animals might
be due to the reduction of lipid peroxidation highlighted above. This also shows that the ratio of
GSH/GSSG greatly improved in diabetic treated groups than in the DBC group, which was further
supported by improved activity of superoxide dismutase (Figure 4.22).
The termination of the deleterious effect of superoxide radical is achieved in a reaction
catalyzed by superoxide dismutase (SOD) to less harmful hydrogen peroxide (Sati et al. 2010).
Moreover in a study by Nwozo et al. (2011), the SOD activity was observed to greatly improve after 8
weeks treatment of X. aethiopica fruit aqueous extract (250 mg/kg bw) in hypercholesterolemic rats.
However in our present study, when the dose was increased to 300 mg/kg bw and treated for 4 weeks,
the activity of SOD in the DXAH group was even comparable to the NC group (Figure 4.22). This
indicates that the higher dose of XAAF can shown better activity in a shorter period of time, when no
alteration in the SOD activity was observed in the NXAH group.
Furthermore, in the same study by Nwozo et al. (2011), daily treatment of X. aethiopica fruit
aqueous extract (250 mg/kg bw) to hypercholesterolemic rats increased the catalase activity in the
serum, liver and kidney. This is also in line with our present data, when the catalase activity in the
organs of the DXAL group was even comparable to the NC group. Interestingly, the catalase activity in
the serum and organs correlate well with the activity of SOD, as these enzymes mostly work closely to
attenuate the oxidative damage mediated by lipid peroxidation (Figure 4.23).
On the other hand, the decrease in the activities of glutathione dependent enzymes; GPx and
GR in the serum and organs in the DBC group could be attributed to the reduction of intracellular GSH

145
concentration (Memısogullari et al. 2003). Treatment of XAAF revealed positive response and
attenuated the reduction of GPx and GR activities of the diabetic treated groups to near normal (Figure
4.24 and Figure 4.25).This reflects the potency of the XAAF in ameliorating oxidative stress associated
with T2D.
4.4.6 Conclusion
Oral administration of XAAF especially at higher dose showed excellent anti-oxidant activity
via reduction of lipid peroxidation, increasing glutathione levels and endogenous anti-oxidants enzymes
in serum and organs mostly affected by diabetic-complications. Therefore, XAAF is a good anti-oxidant
agent with no considerable side effects. Further clinical study is required to confirm its efficacy in
human subjects.

146
CHAPTER 5
5.0 In vitro and in vivo anti-diabetic and anti-oxidative effects of
various extracts and fractions from the different parts of Capsicum
annuum
5.1 Anti-oxidative and anti-diabetic effects of various parts of
Capsicum annuum L. (Solanaceae) in vitro
Aminu Mohammed,1,3 Neil Anthony Koorbanally2 and Md. Shahidul Islam1*
1Department of Biochemistry, School of Life Sciences and 2Department of Chemistry, School of
Chemistry and Physics, University of KwaZulu-Natal, (Westville Campus), Durban, 4000, South
Africa 3Department of Biochemistry, Faculty of Science, Ahmadu Bello University, Zaria-Nigeria
5.1.1 Abstract Objective: Capsicum annuum L. is widely consumed as spice worldwide and is endowed with abundant
medicinal properties. The present study examined the anti-oxidative as well as anti-diabetic effects of
various solvent extracts from fruit, leaf and stem of Capsicum annuum L. using various in vitro models.
Methods: The plant samples were sequentially extracted using solvents of increasing polarity and
investigated for 1,1-diphenyl-2-picryl-hydrazyl (DPPH) radical scavenging activities, total reducing
power, inhibition of hemoglobin glycosylation, α-amylase and α-glucosidase activities as markers of in
vitro anti-diabetic effects.
Results: Our results showed that fruit and leaf ethanolic (EtOH) extracts exhibited significantly (p <
0.05) higher total polyphenols and flavonoids contents with greater anti-oxidative and anti-diabetic
actions, when that of fruit EtOH extract showed higher activity compared to the leaf EtOH extract.
Furthermore, various solvent extracts from the stem part showed no ant-diabetic effect. The GC-MS
analysis of the most active extracts (fruit and leaf EtOH) revealed the presence of phenolic compounds
such as phenol-4-methyl, gingerol, Phenol, 2-methoxy-4-(2-propenyl)-, and eugenol acetate.
Conclusion: The EtOH fruit extract exhibited strong anti-oxidative and anti-diabetic effects compared
to other solvent extracts and thus recommended for further studies to confirm these effects in-vivo
Key words: Capsicum annuum, Anti-oxidative, Anti-diabetic, In vitro
147
5.1.2 Introduction
Oxidative modifications are crucial for the survival of cells. A side effect of this process is the
increased reactive oxygen species (ROS) production (Winrow et al. 1993). ROS are normal products of
biochemical reactions, capable of oxidizing cellular and tissue molecules (Cui et al. 2004). Increase
production of ROS and depletion of endogenous defense system lead to oxidative stress, and this has
been observed in several metabolic disorders, such as obesity, atherosclerosis and type 2 diabetes (T2D)
(Atawodi, 2005). In T2D, oxidative stress is a major contributor to the pancreatic β-cell failure and the
overproduction of ROS usually occurs via but not limited to; protein kinase C dependent activation of
NADH/NADPH oxidase (Inoguchi et al. 2003), increased flux of glucose through the polyol pathway
(Brownlee, 2001), increased formation of advanced glycation end products (AGEs) and their receptors
(Giocco and Brownlee, 2010) and over activity of the hexosamine pathways (Ceriello and Testa, 2009).
Therefore, in the context of T2D, oxidative stress can also be regarded as a trigger of postprandial
hyperglycemia which is a prime target for the control of T2D (Ademiluyi and Oboh, 2013; Brownlee,
2005).
There are several approaches employed to control the postprandial hyperglycemia in T2D,
among such strategy is by delaying the activities of α-amylase and α-glucosidase, which are key
enzymes involved in the digestion of carbohydrates and absorption of glucose in the small intestinal
tract (Tucci et al. 2010; Ortiz-Andrade et al. 2007). Therefore, inhibition of these enzymes will limit
the absorption of glucose to bloodstream and hence, achieved in reduction of hyperglycemia in T2D.
However, the major drawback to this is the unwanted side effects associated with the use of the
conventional α-glucosidase inhibitors, such as acarbose and miglitol (Fujisawa et al. 2005). This cause
a shift to look for option from natural products that pose limited adverse consequences. Furthermore,
convincing evidences are now available that strongly correlate inhibitory effects of α-amylase and α-
glucosidase by the plant-derived products (Xiao et al. 2013a,b; Rastija et al. 2012; Hsieh et al. 2010;
Hanhineva et al. 2010), which again have reported to possess high anti-oxidant actions as well (Sati et
al. 2010; Rahimi et al. 2005; Chanwitheesuk et al. 2005).
In view of this, there is a growing interest in T2D therapy and control by natural anti-oxidants
from plants source capable of decreasing the production of ROS as well as delaying glucose absorption
at intestinal tract. Among such species endowed with tremendous potentials is Capsicum annuum L. It
belongs to Solanaceae family and is readily available in almost all parts of the world. The fruit is widely
consumed in vast quantities as flavoring agent in various traditional foods (Khan et al. 2014), and also
used as a blood tonic, stimulant and in the treatment of nerve weakness due to diabetes in some parts of
Africa and Asia (Iwu, 2014; Jayakumar et al., 2010).
Previous studies have demonstrated that C. annuum fruit possessed high polyphenolic contents
and strong anti-oxidative activities (Deepa et al. 2007; Ghasemnezhad et al. 2011; Chen et al. 2012;
Silva et al. 2013). Some other studies reported the α-amylase and α-glucosidase inhibitory and anti-
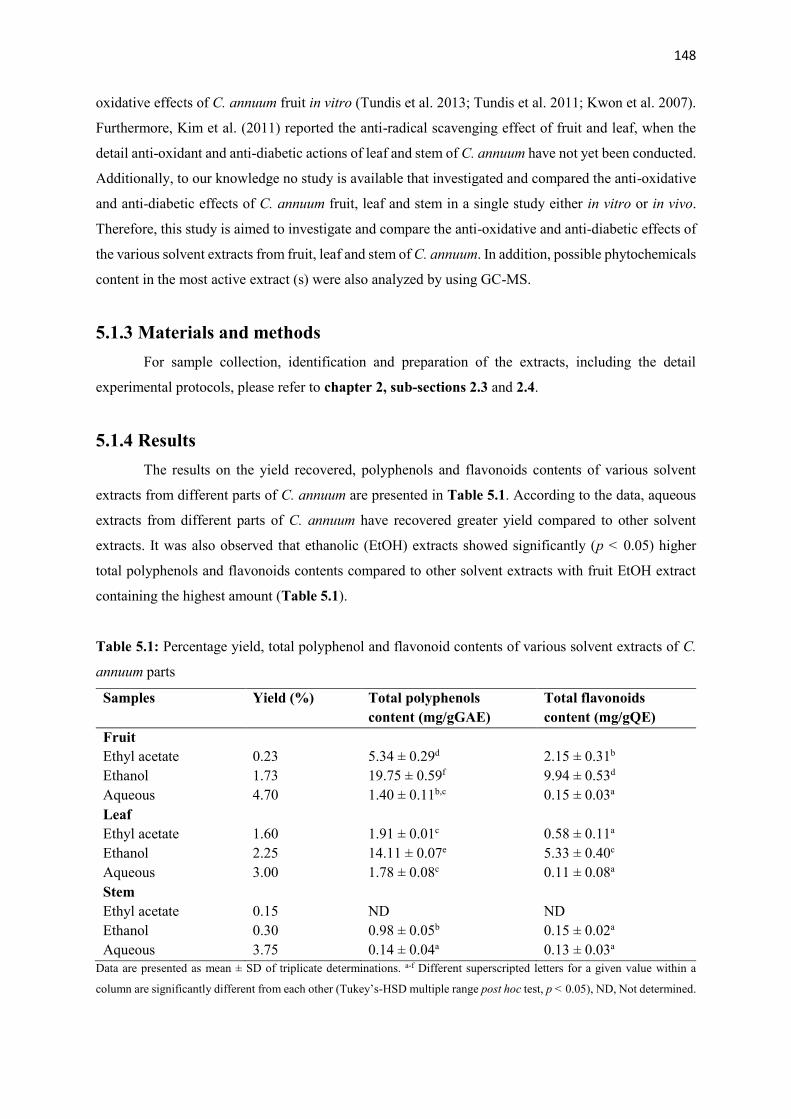
148
oxidative effects of C. annuum fruit in vitro (Tundis et al. 2013; Tundis et al. 2011; Kwon et al. 2007).
Furthermore, Kim et al. (2011) reported the anti-radical scavenging effect of fruit and leaf, when the
detail anti-oxidant and anti-diabetic actions of leaf and stem of C. annuum have not yet been conducted.
Additionally, to our knowledge no study is available that investigated and compared the anti-oxidative
and anti-diabetic effects of C. annuum fruit, leaf and stem in a single study either in vitro or in vivo.
Therefore, this study is aimed to investigate and compare the anti-oxidative and anti-diabetic effects of
the various solvent extracts from fruit, leaf and stem of C. annuum. In addition, possible phytochemicals
content in the most active extract (s) were also analyzed by using GC-MS.
5.1.3 Materials and methods
For sample collection, identification and preparation of the extracts, including the detail
experimental protocols, please refer to chapter 2, sub-sections 2.3 and 2.4.
5.1.4 Results
The results on the yield recovered, polyphenols and flavonoids contents of various solvent
extracts from different parts of C. annuum are presented in Table 5.1. According to the data, aqueous
extracts from different parts of C. annuum have recovered greater yield compared to other solvent
extracts. It was also observed that ethanolic (EtOH) extracts showed significantly (p < 0.05) higher
total polyphenols and flavonoids contents compared to other solvent extracts with fruit EtOH extract
containing the highest amount (Table 5.1).
Table 5.1: Percentage yield, total polyphenol and flavonoid contents of various solvent extracts of C.
annuum parts
Samples Yield (%) Total polyphenols content (mg/gGAE)
Total flavonoids content (mg/gQE)
Fruit Ethyl acetate 0.23 5.34 ± 0.29d 2.15 ± 0.31b Ethanol 1.73 19.75 ± 0.59f 9.94 ± 0.53d Aqueous 4.70 1.40 ± 0.11b,c 0.15 ± 0.03a Leaf Ethyl acetate 1.60 1.91 ± 0.01c 0.58 ± 0.11a Ethanol 2.25 14.11 ± 0.07e 5.33 ± 0.40c Aqueous 3.00 1.78 ± 0.08c 0.11 ± 0.08a Stem Ethyl acetate 0.15 ND ND
Ethanol 0.30 0.98 ± 0.05b 0.15 ± 0.02a Aqueous 3.75 0.14 ± 0.04a 0.13 ± 0.03a
Data are presented as mean ± SD of triplicate determinations. a-f Different superscripted letters for a given value within a
column are significantly different from each other (Tukey’s-HSD multiple range post hoc test, p < 0.05), ND, Not determined.

149
The data of the ferric (Fe3+) ion reducing anti-oxidant potential of various extracts from C.
annuum are presented in Figure 5.1. It was observed from the results that fruit and leaf EtOH extracts
have demonstrated significantly (p < 0.05) higher reducing potentials compared to other solvent extracts
from the same or different parts of C. annuum. Again the reducing ability of the fruit EtOH extract was
higher compared to the leaf EtOH extract, when the EtOAc extracts from the fruits and leaf showed
reducing ability which was significantly (p < 0.05) higher compared to the aqueous extracts (Figure
5.1). Additionally, various solvent extracts from stem part exhibited no reducing potential at different
concentrations used in this study (Figure 5.1).
Figure 5.1. Ferric reducing power (relative to gallic acid) of fruit (A) and leaf (B) extracts of C. annuum. Data are presented
as mean ± SD of triplicate determinations. a-d Different letters presented over the bars for a given concentration of each extract
are significantly different from each other (Tukey’s-HSD multiple range post hoc test, p < 0.05).
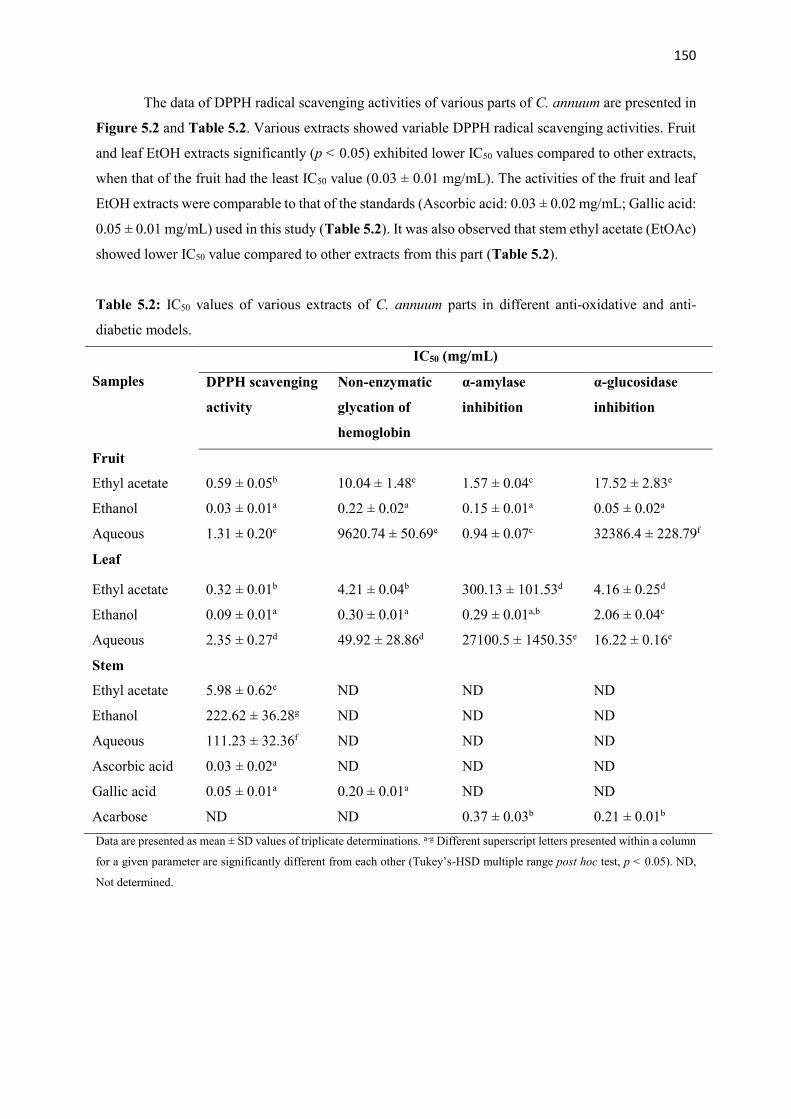
150
The data of DPPH radical scavenging activities of various parts of C. annuum are presented in
Figure 5.2 and Table 5.2. Various extracts showed variable DPPH radical scavenging activities. Fruit
and leaf EtOH extracts significantly (p < 0.05) exhibited lower IC50 values compared to other extracts,
when that of the fruit had the least IC50 value (0.03 ± 0.01 mg/mL). The activities of the fruit and leaf
EtOH extracts were comparable to that of the standards (Ascorbic acid: 0.03 ± 0.02 mg/mL; Gallic acid:
0.05 ± 0.01 mg/mL) used in this study (Table 5.2). It was also observed that stem ethyl acetate (EtOAc)
showed lower IC50 value compared to other extracts from this part (Table 5.2).
Table 5.2: IC50 values of various extracts of C. annuum parts in different anti-oxidative and anti-
diabetic models.
Samples
IC50 (mg/mL)
DPPH scavenging
activity
Non-enzymatic
glycation of
hemoglobin
α-amylase
inhibition
α-glucosidase
inhibition
Fruit
Ethyl acetate 0.59 ± 0.05b 10.04 ± 1.48c 1.57 ± 0.04c 17.52 ± 2.83e
Ethanol 0.03 ± 0.01a 0.22 ± 0.02a 0.15 ± 0.01a 0.05 ± 0.02a
Aqueous 1.31 ± 0.20c 9620.74 ± 50.69e 0.94 ± 0.07c 32386.4 ± 228.79f
Leaf
Ethyl acetate 0.32 ± 0.01b 4.21 ± 0.04b 300.13 ± 101.53d 4.16 ± 0.25d
Ethanol 0.09 ± 0.01a 0.30 ± 0.01a 0.29 ± 0.01a,b 2.06 ± 0.04c
Aqueous 2.35 ± 0.27d 49.92 ± 28.86d 27100.5 ± 1450.35e 16.22 ± 0.16e
Stem
Ethyl acetate 5.98 ± 0.62e ND ND ND
Ethanol 222.62 ± 36.28g ND ND ND
Aqueous 111.23 ± 32.36f ND ND ND
Ascorbic acid 0.03 ± 0.02a ND ND ND
Gallic acid 0.05 ± 0.01a 0.20 ± 0.01a ND ND
Acarbose ND ND 0.37 ± 0.03b 0.21 ± 0.01b Data are presented as mean ± SD values of triplicate determinations. a-g Different superscript letters presented within a column
for a given parameter are significantly different from each other (Tukey’s-HSD multiple range post hoc test, p < 0.05). ND,
Not determined.
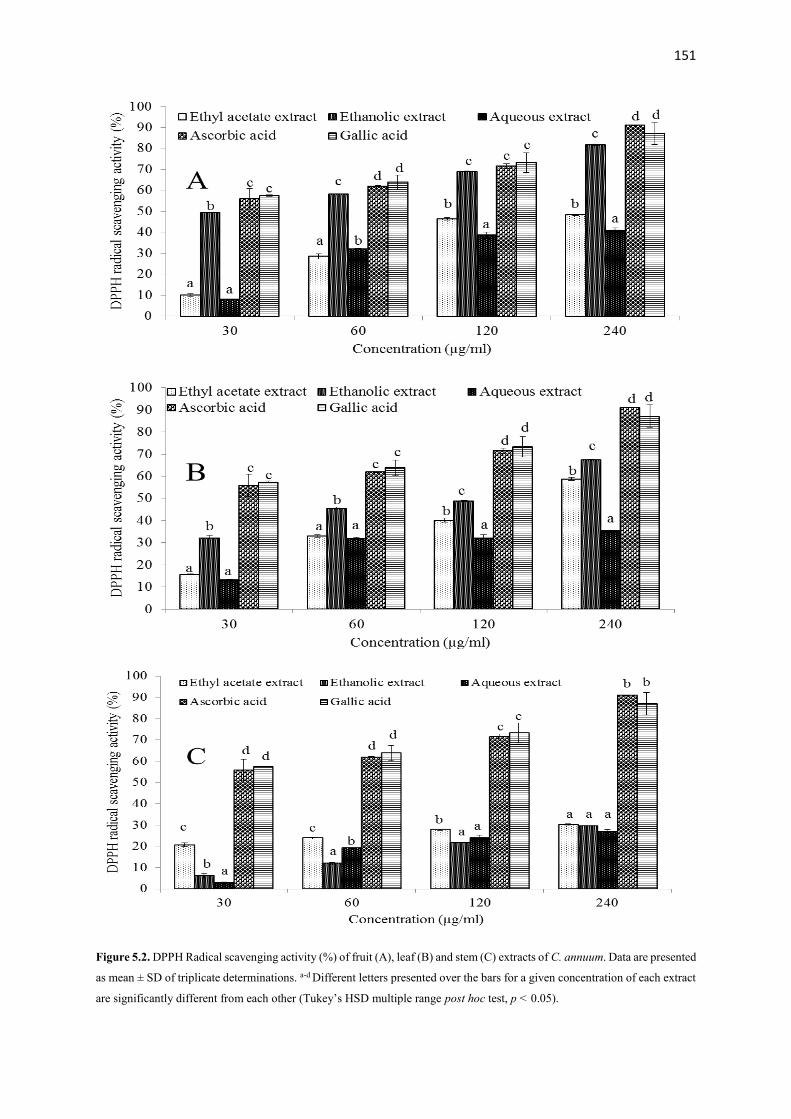
151
Figure 5.2. DPPH Radical scavenging activity (%) of fruit (A), leaf (B) and stem (C) extracts of C. annuum. Data are presented
as mean ± SD of triplicate determinations. a-d Different letters presented over the bars for a given concentration of each extract
are significantly different from each other (Tukey’s HSD multiple range post hoc test, p < 0.05).
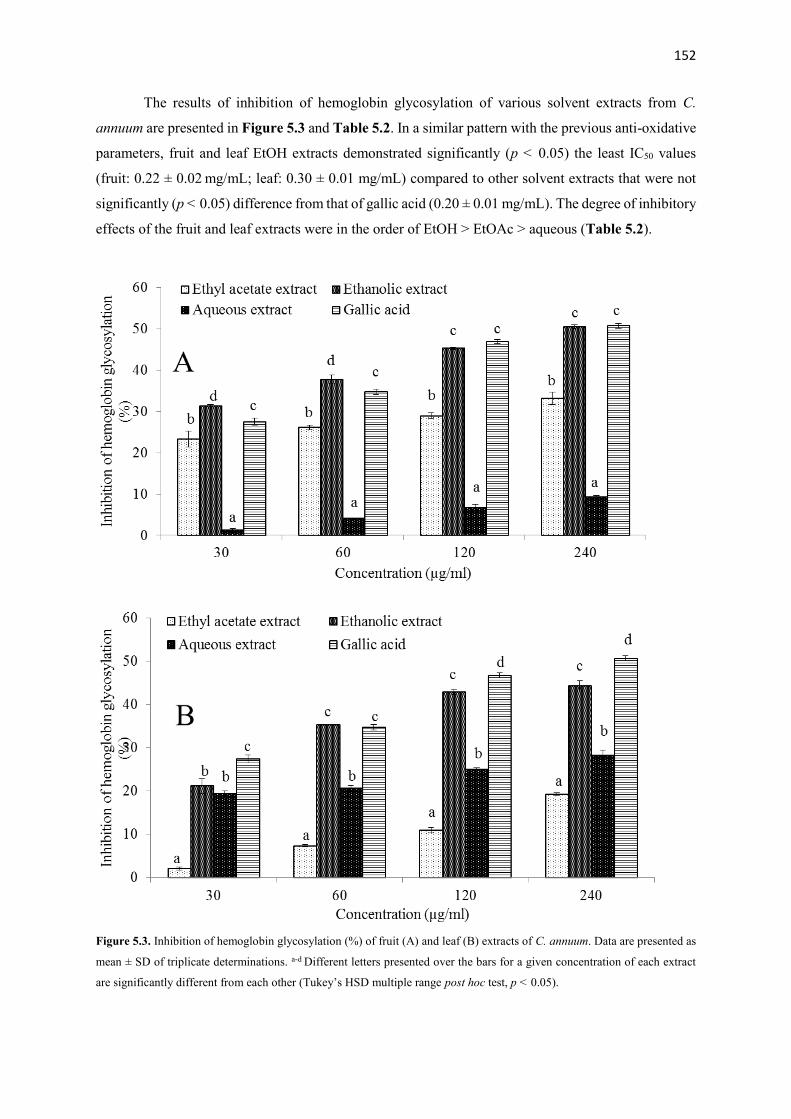
152
The results of inhibition of hemoglobin glycosylation of various solvent extracts from C.
annuum are presented in Figure 5.3 and Table 5.2. In a similar pattern with the previous anti-oxidative
parameters, fruit and leaf EtOH extracts demonstrated significantly (p < 0.05) the least IC50 values
(fruit: 0.22 ± 0.02 mg/mL; leaf: 0.30 ± 0.01 mg/mL) compared to other solvent extracts that were not
significantly (p < 0.05) difference from that of gallic acid (0.20 ± 0.01 mg/mL). The degree of inhibitory
effects of the fruit and leaf extracts were in the order of EtOH > EtOAc > aqueous (Table 5.2).
Figure 5.3. Inhibition of hemoglobin glycosylation (%) of fruit (A) and leaf (B) extracts of C. annuum. Data are presented as
mean ± SD of triplicate determinations. a-d Different letters presented over the bars for a given concentration of each extract
are significantly different from each other (Tukey’s HSD multiple range post hoc test, p < 0.05).

153
The results of the inhibitory effect of α-amylase action of various solvent extracts from C.
annuum are presented in Figure 5.4 and Table 5.2. According to the data, EtOH extract derived from
the fruit have exhibited lower IC50 value (0.15 ± 0.01 mg/mL) compared to other extracts of the same
or different parts as well as acarbose. Various extracts from the stem part have shown no inhibitory
action towards α-amylase action (Table 5.2).
Figure 5.4. The α-amylase inhibition (%) of fruit (A) and leaf (B) extracts of C. annuum. Data are presented as mean ± SD of
triplicate determinations. a-d Different letters presented over the bars for a given concentration of each extract are significantly
different from each other (Tukey’s HSD multiple range post hoc test, p < 0.05).
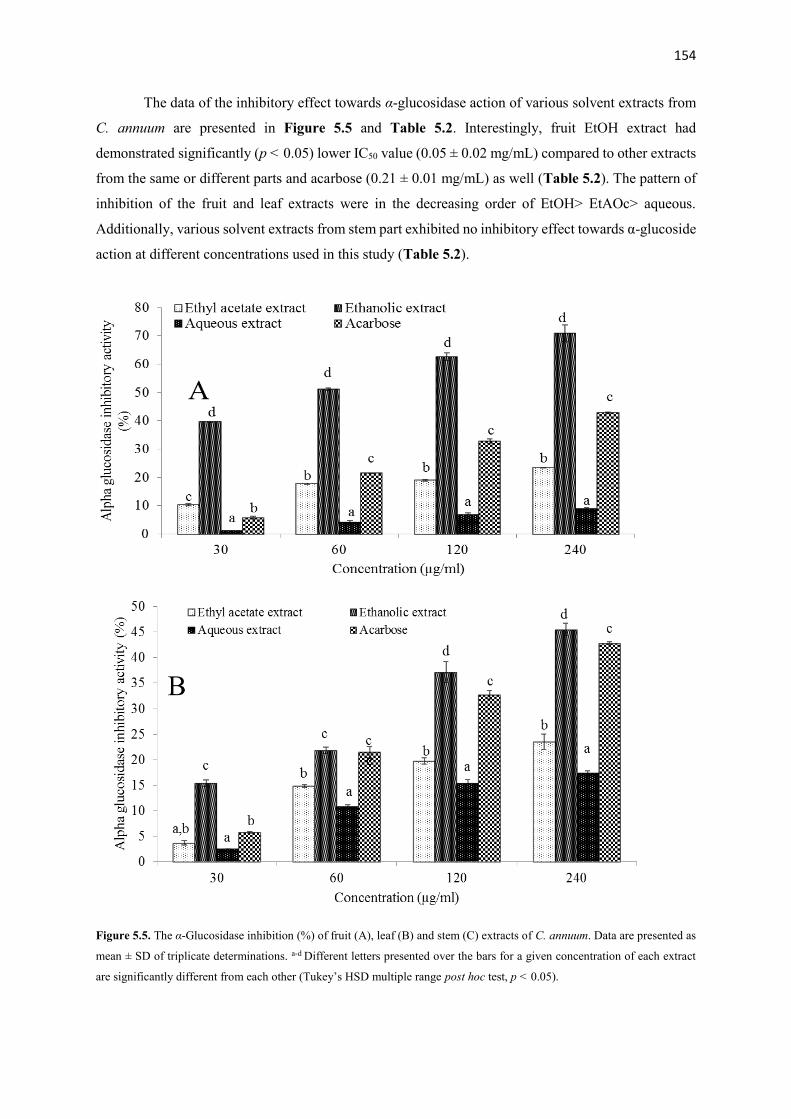
154
The data of the inhibitory effect towards α-glucosidase action of various solvent extracts from
C. annuum are presented in Figure 5.5 and Table 5.2. Interestingly, fruit EtOH extract had
demonstrated significantly (p < 0.05) lower IC50 value (0.05 ± 0.02 mg/mL) compared to other extracts
from the same or different parts and acarbose (0.21 ± 0.01 mg/mL) as well (Table 5.2). The pattern of
inhibition of the fruit and leaf extracts were in the decreasing order of EtOH> EtAOc> aqueous.
Additionally, various solvent extracts from stem part exhibited no inhibitory effect towards α-glucoside
action at different concentrations used in this study (Table 5.2).
Figure 5.5. The α-Glucosidase inhibition (%) of fruit (A), leaf (B) and stem (C) extracts of C. annuum. Data are presented as
mean ± SD of triplicate determinations. a-d Different letters presented over the bars for a given concentration of each extract
are significantly different from each other (Tukey’s HSD multiple range post hoc test, p < 0.05).

155
The results of the GC-MS analyses of the most active extracts (fruit and leaf EtOH extracts) are
presented in Table 5.3, Figures 5.6 and 5.7. The major peaks detected from the chromatogram of the
fruit EtOH extract correspond to phenol 4-methyl (1), eugenol (2), caryophyllene (3), eugenol acetate
(4), 4-(4-hydroxy-3-methoxyphenyl)-butanone (5), 1, 2-benzenedicarboxylic acid, butyl 2-
methylpropyl ester (6), 9-octadecenoic acid (7), 1-(4-hydroxy-3-methoxyphenyl)- 3-decanone (8),
gingerol (9) and capsaicin (10) (Table 5.3, Figures 5.6A and 5.7). On the other hand, the based on the
chromatogram of leaf EtOH extract, the major peaks tha correspond to the NIST library include;
eugenol (2), tetradecanoic acid (11), dibutyl phthalate (12) and 1,2-benzene dicarboxylic acid, mono(2-
ethylhexyl) ester (13) (Table 5.3, Figures 5.6B and 5.7).
Figure 5.6. GC-MS Chromatograms of ethanolic extracts of fruit (A) and leaf (B) of C. annuum
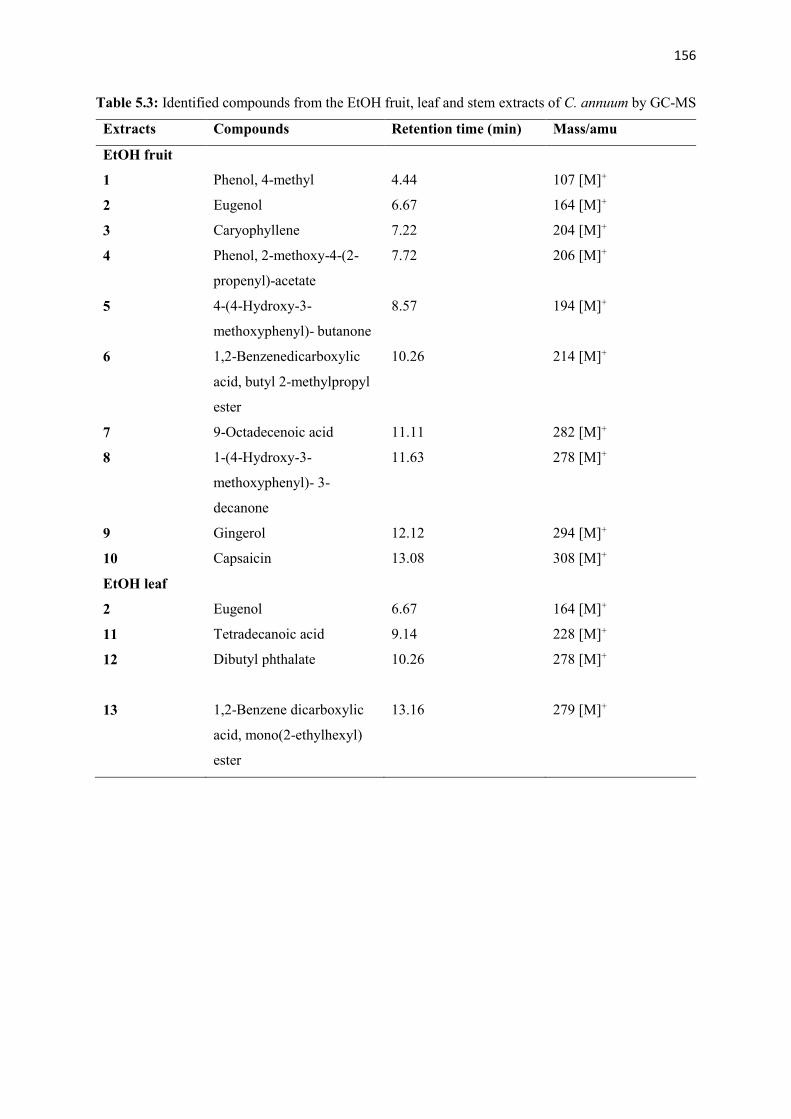
156
Table 5.3: Identified compounds from the EtOH fruit, leaf and stem extracts of C. annuum by GC-MS
Extracts Compounds Retention time (min) Mass/amu
EtOH fruit
1 Phenol, 4-methyl 4.44 107 [M]+
2 Eugenol 6.67 164 [M]+
3 Caryophyllene 7.22 204 [M]+
4 Phenol, 2-methoxy-4-(2-
propenyl)-acetate
7.72 206 [M]+
5 4-(4-Hydroxy-3-
methoxyphenyl)- butanone
8.57 194 [M]+
6 1,2-Benzenedicarboxylic
acid, butyl 2-methylpropyl
ester
10.26 214 [M]+
7 9-Octadecenoic acid 11.11 282 [M]+
8 1-(4-Hydroxy-3-
methoxyphenyl)- 3-
decanone
11.63 278 [M]+
9 Gingerol 12.12 294 [M]+
10 Capsaicin 13.08 308 [M]+
EtOH leaf
2 Eugenol 6.67 164 [M]+
11 Tetradecanoic acid 9.14 228 [M]+
12 Dibutyl phthalate 10.26 278 [M]+
13 1,2-Benzene dicarboxylic
acid, mono(2-ethylhexyl)
ester
13.16 279 [M]+
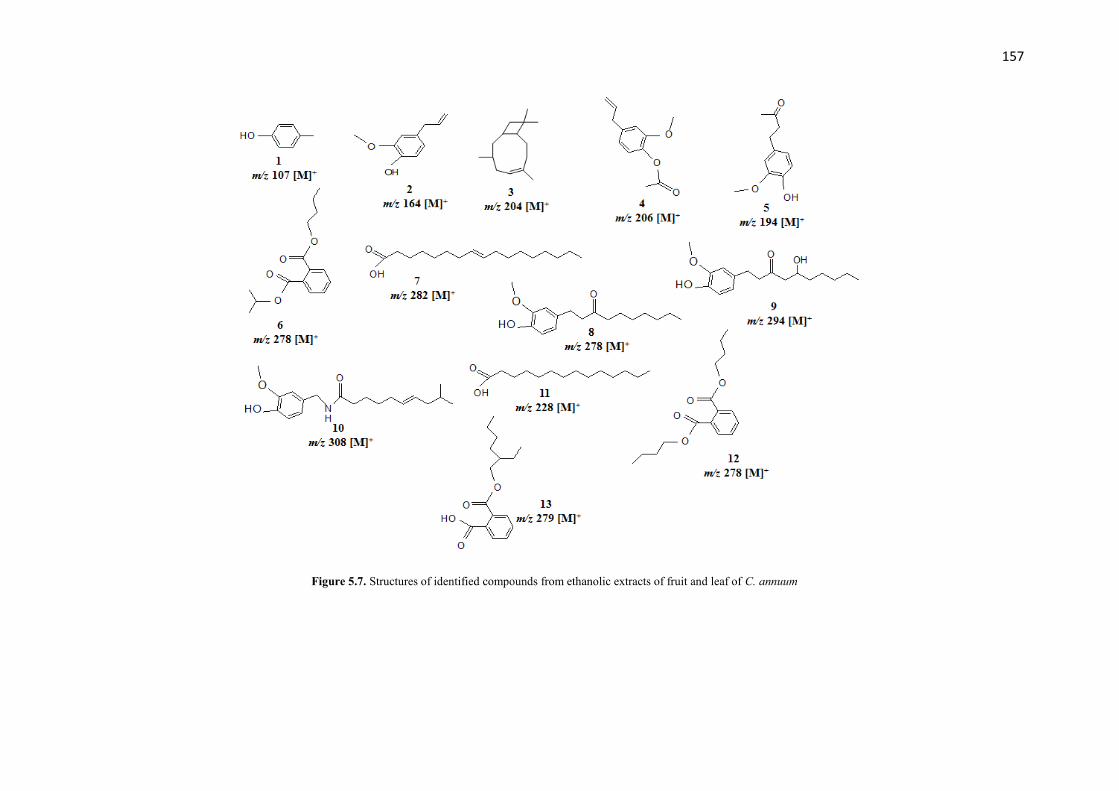
157
Figure 5.7. Structures of identified compounds from ethanolic extracts of fruit and leaf of C. annuum
158
5.1.5 Discussion
In our present study, we have investigated and compared the anti-oxidative and anti-diabetic
effects of various solvent extracts derived from different parts of C. annuum. This is the first study that
systematically compared the activities of different parts (fruit, leaf and stem) of C. annuum in a single
study, despite several studies that reported the anti-oxidative and anti-diabetic effects of C. annuum in
vitro.
The polyphenols and flavonoids contents of C. annuum fruit and leaf parts have been previously
studies in a number of studies. Kim et al. (2011) highlighted that the polyphenolic and flavonoid
contents of the EtOH extracts from the leaf were higher than the fruit part of C. annuum cultivated in
Korea, which contradict our present data. This could partly be due to some genetic and environmental
(nature of the soil, high temperature and rain fall) factors in addition to growth and maturation stages
of the C. annuum parts (Mamphiswana et al. 2010; Pandey and Rizvi, 2009). To support our present
data, several studies have reported the fruit EtOH extract to contain greater amount of polyphenols and
flavonoids (Tundis et al. 2013; Deepa et al. 2007; Perucka and Materska, 2007; Materska and Perucka,
2005). Furthermore, our present results have further support the fact that EtOH is basically the best
solvent for proper extraction of polyphenols and other related compounds, which has been observed
across all the parts (fruit, leaf and stem) used in our current study (Table 5.1). It was also observed that
C. annuum leaf could be a potential source of polyphenols and flavonoids, which in most of the time is
considered as wasted vegetable.
In assessing the anti-oxidant status of plants species, several in vitro models were developed.
In our present study, the in vitro methods used include the ferric (Fe3+) reducing power, DPPH radical
scavenging ability as well as the inhibition of hemoglobin glycosylation. Deepa et al. (2007) have
reported that fruit EtOH extracts of C. annuum obtained at different stages of maturation, have
demonstrated variable Fe3+ to Fe2+ reducing potentials. This was similarly observed in our present data
(Figure 5.2). Therefore, although no correlation analysis was carried out in our present study, it might
be suggested that the Fe3+ to Fe2+ reducing potential is correlated to the polyphenols and flavonoids
contents, which is in line with a previous published data (Pulido et al. 2000). The result was further
supported by the DPPH radical scavenging activity by the various extracts from C. annuum (Table 5.2).
The DPPH radical scavenging activity of various solvent extracts from the fruit of C. annuum
has been extensively reported (Azeez et al. 2012; Chen et al. 2012; Tundis et al. 2011; Perucka and
Materska, 2007; Conforti et al. 2007; Kwon et. 2007). In some of these studies, fruit methanolic extract
had exhibited IC50 values of 1.15 mg/mL and 0.13 mg/mL for DPPH scavenging activity (Azeez et al.
2012; Conforti et al. 2007). Similarly, Tundis et al. (2011) and Kim et al. (2011) have also reported an
IC50 value of 0.15 mg/mL for fruit EtOH extract, when that of leaf EtOH extract was 0.46 mg/mL.
However, in our present results, the IC50 values recorded for the DPPH scavenging was lower for the
fruit (IC50: 0.03 ± 0.01 mg/mL) and leaf (IC50: 0.09 ± 0.01 mg/mL) extracts compared to previously
159
reported data (Table 5.2). The higher activity of fruit over the leaf and stem parts observed in our
present study indicated the greater amounts of active ingredients that could scavenge and terminate the
oxidative damages of ROS (Miladi and Demak, 2008; Manach et al. 2004).
Furthermore, increased protein glycation contributes significantly to the progression and
manifestation of diabetic complications (Calisti and Tognetti, 2005). The glycation process involves a
cascade of reactions and rearrangements between reducing sugars and proteins which ultimately forms
AGEs (Rahbar and Figarola, 2002). Hence, inhibitors of this process could play a crucial role in the
prevention of T2D associated complications. In our present study, fruit EtOH extract maintained higher
anti-oxidative nature by exhibiting the lower IC50 value (0.22 ± 0.02 mg/mL) toward hemoglobin
glycation, indicating higher activity compared to other solvent extracts. Interestingly, leaf EtOH extract
also showed similar inhibition of glycosylation with fruit EtOH extract (Table 5.2). This could possibly
be utilized and will reduce the over usage of fruit for nutritional and medicinal purposes.
On the other side, inhibitors of carbohydrate hydrolyzing enzymes are recently being utilized
as therapeutic targets in prevention and control of T2D and its associated complications (Tucci et al.
2010; Ortiz-Andrade et al., 2007). However, the major glucosidase inhibitors, acarbose and miglitol,
were reported to cause abdominal distension, flatulence, bowel necrosis and diarrhea (Fujisawa et al.
2005). This paves way for search of inhibitors from plants origin. Furthermore, the α-amylase and α-
glucosidase inhibitory effects of various extracts from the fruit of C. annuum have been reported
(Tundis et al. 2013; 2012; Kwon et al. 2007). Tundis et al. (2012) have reported that fruit EtOH extract
is a potential inhibitor of α-amylase (IC50: 0.26 mg/mL) and α-glucosidase (IC50: 0.36 mg/mL) actions.
However, when compared to our data, the calculated IC50 values for α-amylase and α-glucosidase
inhibitory effects are lower, which could be the least reported for fruit of C. annuum (Table 5.2).
Additionally, the observed higher α-glucosidase inhibitory action of the fruit EtOH extact over α-
amylase action is of enormous importance. This is because some of the unwanted effects attributed with
the currently utilized drugs are linked to strong inhibition of α-amylase effect (Ademiluyi and Oboh,
2013). Moreover, the better inhibitory effect of the fruit extracts than leaf extracts is an indication of
the greater availability of the inhibitors in fruit compared to leaf part.
Based on the higher anti-oxidative and anti-diabetic effects of fruit and leaf EtOH extracts, the
GC-MS analysis was carried out to identify major possible phytochemicals present. It was observed
that most of the compounds detected were phenolics in nature with some long chain fatty derivatives.
Phenolics and other related compounds are known to directly or indirectly contribute to the anti-
oxidative and enzyme inhibitory actions of various plant-derived products (Mai et al. 2007). Therefore,
without the exclusion of the possible contribution of other compounds present in the two extracts, the
consistently higher anti-oxidative and anti-diabetic effects could be associated to the presence of these
phenolics compounds.
160
5.1.6 Conclusions
In conclusion, various solvent extracts from fruit and leaf possessed potent anti-oxidative and
anti-diabetic effects in vitro, when the fruit EtOH extracts exhibited the highest. Therefore, bioassay
guided fractionation and investigation of anti-oxidative and anti-diabetic effects in vivo of most active
extract has been conducted and presented in the following part of this chapter.

161
According to the in vitro anti-oxidative and anti-diabetic studies of the various solvent extracts derived
from different parts of C. annuum stated above, fruit ethanolic extract demonstrated higher activities
compared to other extracts. Therefore it was selected for further studies.
5.2 Acetone fraction from Capsicum annuum fruit possesses anti-
oxidative effects and inhibits the activities of carbohydrate
digesting enzymes in vitro
Aminu Mohammed,1,3 Neil Anthony Koorbanally2 and Md. Shahidul Islam1*
1Department of Biochemistry, School of Life Sciences, University of KwaZulu-Natal, (Westville
Campus), Durban, 4000, South Africa 2Department of Chemistry, School of Chemistry and Physics, University of KwaZulu-Natal, (Westville
Campus), Durban, 4000, South Africa 3Department of Biochemistry, Faculty of Science, Ahmadu Bello University, Zaria-Nigeria
5.2.1 Abstract Objectives: The present study was carried out to investigate the anti-oxidative and inhibition of the
activities of carbohydrate digesting enzymes by various solvent fractions from crude ethanolic extract
of C. annuum using various in vitro models.
Methods: Crude ethanolic extract of fruit was fractionated using hexane, dichloromethane, ethyl acetate
and acetone. They were subjected and investigated for 1,1-diphenyl-2-picryl-hydrazyl (DPPH) radical
scavenging activity, ferric reducing anti-oxidant power (FRAP), inhibition of hemoglobin
glycosylation, α-amylase and α-glucosidase activities as markers of in vitro anti-diabetic effects at
various doses (30-240 µg/ml). Possible bioactive compounds were analyzed using Gas
Chromatography-Mass Spectrometry (GC-MS) analysis.
Results: The results indicated that acetone fraction showed significantly (p < 0.05) higher total
polyphenols and flavonoids contents and recorded lower IC50 values in all the models used (DPPH:
111.97 ± 2.06 µg/mL; inhibition of hemoglobin glycosylation: 150.64 ± 6.10 µg/ml; -amylase: 803.34
± 22.18 µg/mL; -glucosidase: 65.11 ± 6.78 µg/mL) compared to other solvent fractions, and also
demonstrated excellent reducing Fe3+ to Fe2+ power. The phytochemical studies identified six possible
compounds (tridecanoic acid, 9, 12-octadecadienoic acid, oleic acid, kauran-16-ol, capsaicin and 1, 2-
benzenedicarboxylic acid, mono (2-ethylhexyl) ester) from the acetone fraction. This results clearly
demonstrates that acetone fraction from C. annuum possesses potent anti-oxidative and inhibition of the
activities of carbohydrate digesting enzymes, with potential bioactive compounds.

162
Keywords: Anti-oxidative, Capsicum annuum, Inhibitory effect, Type 2 diabetes mellitus
5.2.2 Introduction
In recent time, natural products such as plants are regarded as good source of potential
therapeutic agents. This is in addition to the fact that a number of widely used modern drugs were
initially derived from plant source. For instance, the discoveries of metformin (anti-diabetic drug) and
artemisinin (anti-malarial drug) from Galega officinalis L. and Artemisia annua L., respectively just to
mention few (Gurib-Fakim, 2006). Similarly, plant-derived formulations or compounds were reported
to cause limited or no adverse side effects compared to the conventional synthetic drugs (Harvey, 2014).
In view of this, there is a widespread search for newer chemical lead from plants to treat various diseases
which may offer better protection with lesser side effects.
On the other hand, the prevalence of diseases such as type 2 diabetes (T2D) is quite alarming
globally; reaching epidemic proportion. T2D is characterized by chronic insulin resistance and loss of
pancreatic β-cell function (Hui et al. 2007). This leads to hyperglycemia, which has been associated
with increase formation of reactive oxygen species (ROS), and eventually causes oxidative stress
(Devasagayam et al. 2007). Oxidative stress is a condition of imbalance that exists between pro-oxidants
and in-vivo anti-oxidant levels in such a way that pro-oxidant production overwhelms anti-oxidant
defenses (Powers and Jackson, 2008). Moreover, oxidative stress plays a crucial role in the pathogenesis
of diabetes associated complications such as neuropathy, nephropathy and retinopathy (Azenabor et al.
2011). Therefore, control of oxidative stress could be a potential strategy to control T2D in addition to
the inhibition of the activities of carbohydrate digesting enzymes, such as α-glucosidase and α-amylase
that are currently employed to treat T2D. This process involves retarding the digestion of carbohydrates
via inhibition of key enzymes; α-glucosidase and α-amylase, which may limit the hydrolysis and
absorption of glucose in the into the bloodstream (Kawamura-Konishi et al. 2012). Hence, the search
for natural inhibitors of α-glucosidase and α-amylase activities and ROS scavengers have gradually
increased to achieve in the proper control of T2D.
The fruit from Capsicum annuum L. has been a major component of various food preparations
worldwide. In addition to this, C. annuum fruit has been reported to be an excellent source of vitamins,
phenolics and other potentially active phytochemicals which are anti-oxidants that may prevent the risk
of T2D. More importantly, there is sufficient available data that support the anti-oxidative as well as
anti-diabetic effects of crude extracts of C. annuum in vitro (Tundis et al. 2013; Tundis et al. 2011;
Kwon et al. 2007). Although not much comparative studies have been conducted using various solvent
extracts, in most of the reported studies (including ours), fruit ethanolic extract showed promising and
better activity compared to other solvent extracts (Tundis et al. 2013; 2011; Kim et al. 2011; Deepa et
al. 2007). In view of this and our continued efforts to explore potential leads with anti-oxidative and
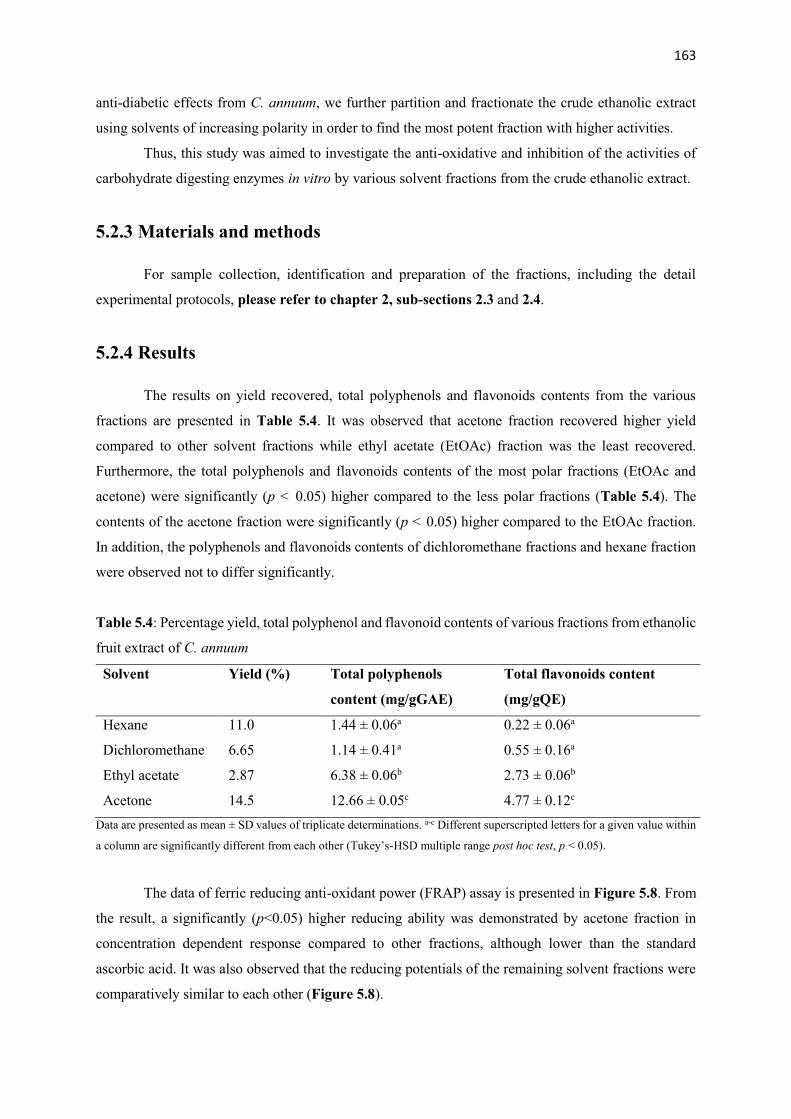
163
anti-diabetic effects from C. annuum, we further partition and fractionate the crude ethanolic extract
using solvents of increasing polarity in order to find the most potent fraction with higher activities.
Thus, this study was aimed to investigate the anti-oxidative and inhibition of the activities of
carbohydrate digesting enzymes in vitro by various solvent fractions from the crude ethanolic extract.
5.2.3 Materials and methods
For sample collection, identification and preparation of the fractions, including the detail
experimental protocols, please refer to chapter 2, sub-sections 2.3 and 2.4.
5.2.4 Results
The results on yield recovered, total polyphenols and flavonoids contents from the various
fractions are presented in Table 5.4. It was observed that acetone fraction recovered higher yield
compared to other solvent fractions while ethyl acetate (EtOAc) fraction was the least recovered.
Furthermore, the total polyphenols and flavonoids contents of the most polar fractions (EtOAc and
acetone) were significantly (p < 0.05) higher compared to the less polar fractions (Table 5.4). The
contents of the acetone fraction were significantly (p < 0.05) higher compared to the EtOAc fraction.
In addition, the polyphenols and flavonoids contents of dichloromethane fractions and hexane fraction
were observed not to differ significantly.
Table 5.4: Percentage yield, total polyphenol and flavonoid contents of various fractions from ethanolic
fruit extract of C. annuum
Solvent Yield (%) Total polyphenols
content (mg/gGAE)
Total flavonoids content
(mg/gQE)
Hexane 11.0 1.44 ± 0.06a 0.22 ± 0.06a
Dichloromethane 6.65 1.14 ± 0.41a 0.55 ± 0.16a
Ethyl acetate 2.87 6.38 ± 0.06b 2.73 ± 0.06b
Acetone 14.5 12.66 ± 0.05c 4.77 ± 0.12c Data are presented as mean ± SD values of triplicate determinations. a-c Different superscripted letters for a given value within
a column are significantly different from each other (Tukey’s-HSD multiple range post hoc test, p < 0.05).
The data of ferric reducing anti-oxidant power (FRAP) assay is presented in Figure 5.8. From
the result, a significantly (p<0.05) higher reducing ability was demonstrated by acetone fraction in
concentration dependent response compared to other fractions, although lower than the standard
ascorbic acid. It was also observed that the reducing potentials of the remaining solvent fractions were
comparatively similar to each other (Figure 5.8).
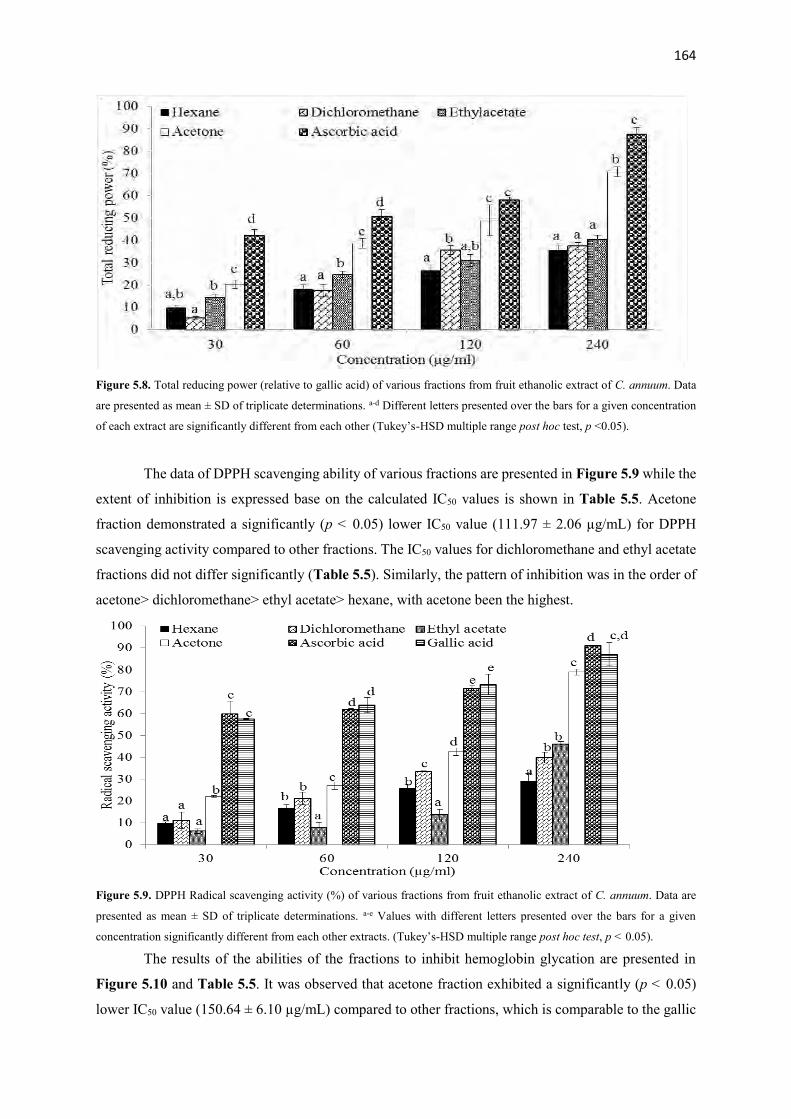
164
Figure 5.8. Total reducing power (relative to gallic acid) of various fractions from fruit ethanolic extract of C. annuum. Data
are presented as mean ± SD of triplicate determinations. a-d Different letters presented over the bars for a given concentration
of each extract are significantly different from each other (Tukey’s-HSD multiple range post hoc test, p <0.05).
The data of DPPH scavenging ability of various fractions are presented in Figure 5.9 while the
extent of inhibition is expressed base on the calculated IC50 values is shown in Table 5.5. Acetone
fraction demonstrated a significantly (p < 0.05) lower IC50 value (111.97 ± 2.06 µg/mL) for DPPH
scavenging activity compared to other fractions. The IC50 values for dichloromethane and ethyl acetate
fractions did not differ significantly (Table 5.5). Similarly, the pattern of inhibition was in the order of
acetone> dichloromethane> ethyl acetate> hexane, with acetone been the highest.
Figure 5.9. DPPH Radical scavenging activity (%) of various fractions from fruit ethanolic extract of C. annuum. Data are
presented as mean ± SD of triplicate determinations. a-e Values with different letters presented over the bars for a given
concentration significantly different from each other extracts. (Tukey’s-HSD multiple range post hoc test, p < 0.05). The results of the abilities of the fractions to inhibit hemoglobin glycation are presented in
Figure 5.10 and Table 5.5. It was observed that acetone fraction exhibited a significantly (p < 0.05)
lower IC50 value (150.64 ± 6.10 µg/mL) compared to other fractions, which is comparable to the gallic

165
acid (199.09 ± 2.85 µg/mL). The extent of inhibitory effects of hexane and EtOAc fractions were found
not to differ significantly, when dichloromethane fraction was observed to exhibit the highest IC50 value
(Table 5.5).
Figure 5.10: Inhibition of hemoglobin glycation (%) of various fractions from fruit ethanolic extract of C. annuum. Data are
presented as mean ± SD of triplicate determinations. a-d Values with different letters presented for a given concentration for
each extract are significantly different from each other. (Tukey’s-HSD multiple range post hoc test, p < 0.05).
Table 5.5: IC50 values of various solvent fractions from ethanolic fruit extract of C. annuum in different
anti-oxidative and anti-diabetic models.
Solvent
IC50 (µg/ml)
DPPH
scavenging
activity
Non-enzymatic
glycation of
hemoglobin
α-amylase
inhibition
α-glucosidase
inhibition
Hexane 1862.88 ± 720.3d 844.84 ± 32.85c 8403.23 ± 806.97e 724.89 ± 95.61d
Dichloromethane 462.30 ± 14.32c 2127.97 ± 987.21d 2798.53 ± 143.65d 454.01 ± 63.34c
Ethyl acetate 503.73 ± 7.74c 503.73 ± 7.70b 2143.46 ± 213.67c 380.31 ± 20.35b,c
Acetone 111.97 ± 2.06b 150.64 ± 6.10a 164.11 ± 5.28a 65.11 ± 6.78a
Ascorbic acid 25.34 ± 6.19a ND ND ND
Gallic acid 20.01 ± 4.42a 199.09 ± 2.85a ND ND
Acarbose ND ND 374.95 ± 26.81b 211.59 ± 3.39b Data are presented as mean ± SD values of triplicate determinations. a-e Different superscripted letters for a given value within
a column are significantly different from each other (Tukey’s-HSD multiple range post hoc test, p < 0.05). ND, Not determined The results of α-amylase inhibition of various solvent fractions from the fruit EtOH extract are
presented in Figure 5.11 and Table 5.5. Based on the data, the IC50 value demonstrated by the acetone
fraction (164.11 ± 5.28 µg/mL) for α-amylase inhibition was significantly (p<0.05) lower compared to
other fractions and the acarbose as well. The IC50 value of EtOAc fraction was significantly (p < 0.05)
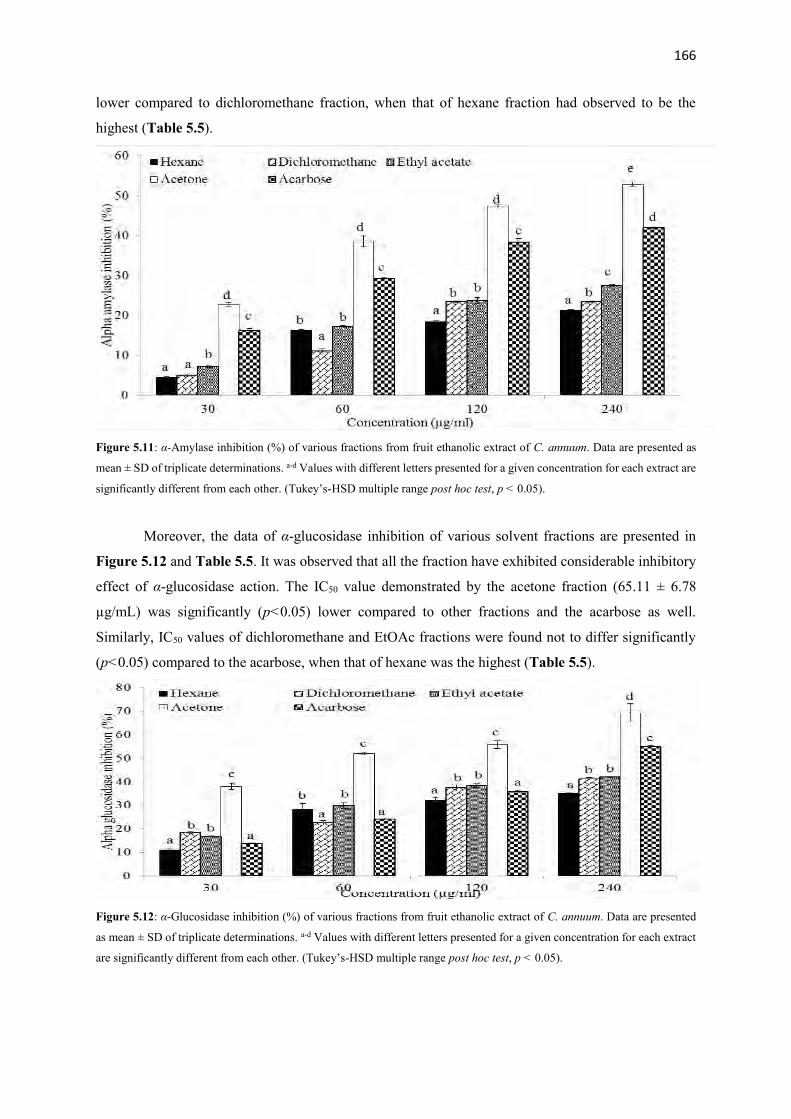
166
lower compared to dichloromethane fraction, when that of hexane fraction had observed to be the
highest (Table 5.5).
Figure 5.11: α-Amylase inhibition (%) of various fractions from fruit ethanolic extract of C. annuum. Data are presented as
mean ± SD of triplicate determinations. a-d Values with different letters presented for a given concentration for each extract are
significantly different from each other. (Tukey’s-HSD multiple range post hoc test, p < 0.05).
Moreover, the data of α-glucosidase inhibition of various solvent fractions are presented in
Figure 5.12 and Table 5.5. It was observed that all the fraction have exhibited considerable inhibitory
effect of α-glucosidase action. The IC50 value demonstrated by the acetone fraction (65.11 ± 6.78
µg/mL) was significantly (p<0.05) lower compared to other fractions and the acarbose as well.
Similarly, IC50 values of dichloromethane and EtOAc fractions were found not to differ significantly
(p<0.05) compared to the acarbose, when that of hexane was the highest (Table 5.5).
Figure 5.12: α-Glucosidase inhibition (%) of various fractions from fruit ethanolic extract of C. annuum. Data are presented
as mean ± SD of triplicate determinations. a-d Values with different letters presented for a given concentration for each extract
are significantly different from each other. (Tukey’s-HSD multiple range post hoc test, p < 0.05).
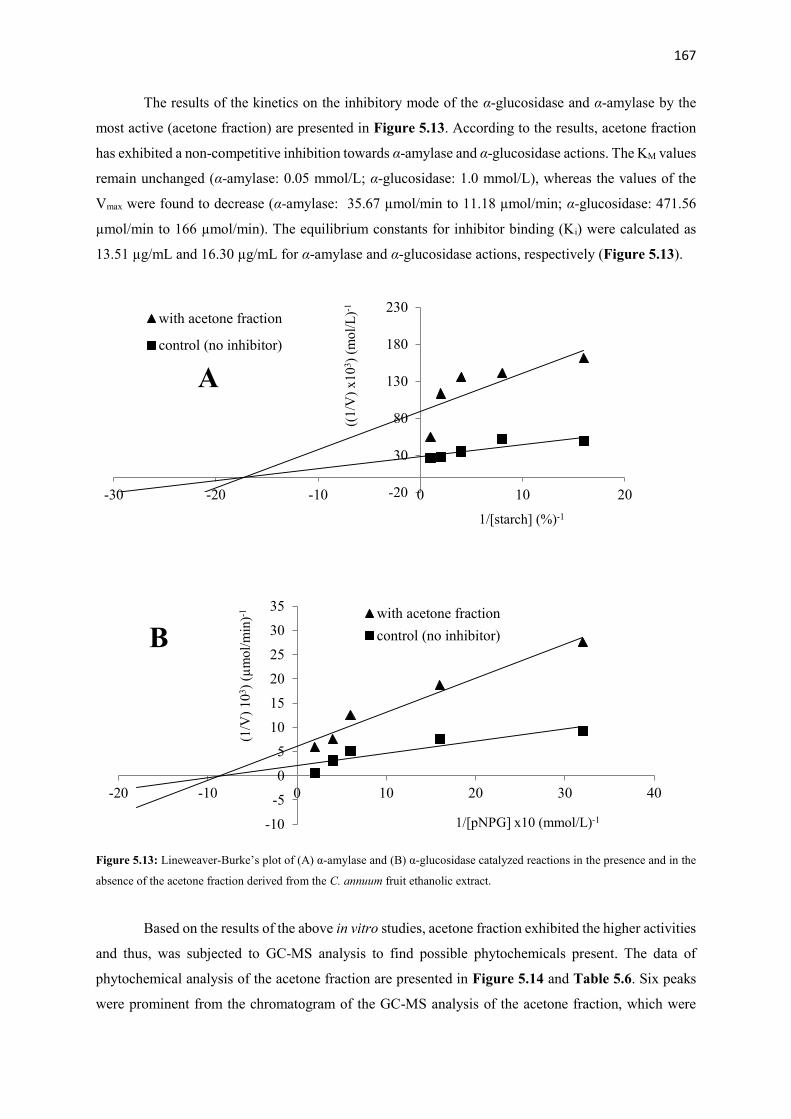
167
The results of the kinetics on the inhibitory mode of the α-glucosidase and α-amylase by the
most active (acetone fraction) are presented in Figure 5.13. According to the results, acetone fraction
has exhibited a non-competitive inhibition towards α-amylase and α-glucosidase actions. The KM values
remain unchanged (α-amylase: 0.05 mmol/L; α-glucosidase: 1.0 mmol/L), whereas the values of the
Vmax were found to decrease (α-amylase: 35.67 µmol/min to 11.18 µmol/min; α-glucosidase: 471.56
µmol/min to 166 µmol/min). The equilibrium constants for inhibitor binding (Ki) were calculated as
13.51 µg/mL and 16.30 µg/mL for α-amylase and α-glucosidase actions, respectively (Figure 5.13).
Figure 5.13: Lineweaver-Burke’s plot of (A) α-amylase and (B) α-glucosidase catalyzed reactions in the presence and in the
absence of the acetone fraction derived from the C. annuum fruit ethanolic extract.
Based on the results of the above in vitro studies, acetone fraction exhibited the higher activities
and thus, was subjected to GC-MS analysis to find possible phytochemicals present. The data of
phytochemical analysis of the acetone fraction are presented in Figure 5.14 and Table 5.6. Six peaks
were prominent from the chromatogram of the GC-MS analysis of the acetone fraction, which were
-20
30
80
130
180
230
-30 -20 -10 0 10 20
((1/
V) x
103 )
(mol
/L)-1
1/[starch] (%)-1
with acetone fraction
control (no inhibitor)
-10
-5
0
5
10
15
20
25
30
35
-20 -10 0 10 20 30 40
(1/V
) 103 )
(µm
ol/m
in)-1
1/[pNPG] x10 (mmol/L)-1
with acetone fractioncontrol (no inhibitor)
A
B

168
compared with those present in the NIST library (Figure 5.14A). The compounds were identified as
tridecanoic acid (1), 9, 12-octadecadienoic acid (2), oleic acid (3), kauran-16-ol (4) and two phenolics
identified as capsaicin (5) and 1, 2-benzenedicarboxylic acid, mono (2-ethylhexyl) ester (6) (Figure
5.14B and Table 5.6).
Table 5.6: Identified compounds from the acetone fraction from fruit ethanolic extract of C. annuum
by GC-MS
Solvent Compounds Retention time (min) Mass/amu
Acetone
1 Tridecanoic acid 10.24 214 [M]+
2 9,12-Octadecadienoic acid 10.26 280 [M]+
3 Oleic acid 11.11 282 [M]+
4 Kauran-16-ol 11.39 290 [M]+
5 Capsaicin 12.49 239 [M]+
6 1,2-Benzenedicarboxylic
acid, mono(2-ethylhexyl)
ester
13.15 279 [M]+

169
Figure 5.14. GC-MS chromatogram (A) and structures of identified compounds (B) from acetone fraction from fruit of C. annuum
A
B

170
5.2.5 Discussion
Natural products such as plants are now considered as an integral component of health care
system, particularly in developing countries where most people have limited resources and access to
modern treatments. In addition, the unwanted adverse effect of most of the modern synthetic drugs for
treatment of diseases such as T2D is also an issue of concern (Marles and Farnsworth, 1994). However,
the number of plants with potential anti-diabetic actions is very limited and many of their anti-diabetic
effects have not yet been scientifically validated. Therefore, our present study is designed to investigate
the anti-oxidative potentials and inhibition of the activities of α-glucosidase and α-amylase actions by
various fractions derived from crude EtOH extract of C. annuum fruit in vitro.
Plant-derived bioactive compounds such as polyphenols and flavonoids are reported to
scavenge reactive oxygen species (ROS) and also modulate the activities of α-amylase and α-
glucosidase that are crucial in treatment of T2D (Ani and Akhilender, 2008; Pulok et al. 2006; Atawodi,
2005). The polyphenols and flavonoids contents of different extracts of C. annuum were extensively
documented (Tundis et al. 2013; Kim et al. 2011; Deepa et al. 2007; Perucka and Materska, 2007;
Materska and Perucka, 2005). In most of the earlier studies, crude ethanolic extract was reported to
contain high amount of polyphenols and flavonoids. However, according to our present data, most of
these compounds were observed to be available in the acetone fraction, which is the most polar fraction
(Table 5.4). This is due to the greater polarity of acetone compared to other solvents and therefore
retains most of the polyphenols from the crude extract.
In complex systems such as living organisms, oxidative stress may arise from different ways to
cause deleterious effects, which contribute to high levels of ROS (Hinneburg et al. 2006). The ferric
reducing anti-oxidant power (FRAP) is a method used to assess the anti-oxidant potentials of the plant
extracts, fractions and/or compounds. The assay depends on the reduction of the Fe3+ to Fe2+ monitored
by via the formation of Perl’s Prussian blue at 700 nm (Chung et al. 2002). According to our present
results, acetone fraction showed higher anti-oxidant potential by demonstrating excellent reducing
power in concentration dependent manner partly correlated to the rich-phenolic its contents (Figure
5.8).
The DPPH radical scavenging activity was used to further support the anti-radical action of the
fractions. It has been highlighted previously that extracts derived from C. annuum fruit have
demonstrated potent DPPH radical scavenging ability (Azeez et al. 2012; Chen et al. 2012; Tundis et
al. 2011; Perucka and Materska, 2007; Conforti et al. 2007; Kwon et. 2007). This is in line with the
results of our present study (Table 5.5). The lower IC50 value for DPPH scavenging ability exhibited
by the acetone fraction might be attributed to the higher polyphenols and flavonoids contents which are
known to exert anti-oxidative effects (Sen et al. 2010; Atawodi, 2005).
Hemoglobin glycation induced by hyperglycemia, is a non-enzymatic reaction that contributes
to increase in the formation of advanced glycated end products (AGEs), which lead to most of the
171
complications associated with diabetes (Calisti and Tognetti, 2005). Therefore, inhibitors of AGEs
formation may prevent and attenuate the progression and development of complications due to
hyperglycemia. It is evident from our present data that acetone fraction is a potential inhibitor of
hyperglycemia-induced glycation (Table 5.5). The results accord with the DPPH and FRAP assays as
described above, which correlate well with the total polyphenols and flavonoids contents of acetone
fraction that again supported by the α-glucosidase and α-amylase inhibitory actions (Table 5.5).
The two important carbohydrate-digesting enzymes, α-glucosidase and α-amylase are the key
enzymes involved in the in the breakdown of dietary carbohydrates. The α-amylase converts starch into
disaccharides and oligosaccharides, after which α-glucosidase catalyzes the breakdown of disaccharides
to monosaccharide (glucose) which is subsequently absorbed into bloodstream via small intestinal
mucos (Tucci et al. 2010; Ortiz-Andrade et al. 2007). Therefore, inhibitors of these enzymes can
slowdown carbohydrate digestion and increase the overall transit time. This will reduce the rate of
glucose absorption, which may apparently abrupt the postprandial elevation of blood glucose levels,
and therefore provide effective approaches in controlling T2D. Interestingly, the α-amylase and α-
glucosidase inhibitory effects of aqueous and ethanolic extracts from the fruit of C. annuum have been
reported (Tundis et al. 2013; 2012; Kwon et al. 2007). However, when the crude ethanolic extract was
fractionated, acetone fraction has exerted the highest inhibitions (least IC50 values), which may be due
to the rich-polyphenolic content of the fraction (Table 5.5).
The kinetic results have demonstrated that the nature of α-glucosidase and α-amylase
inhibitions were of non-competitive type (Figure 5.13). This is the first study that report on the mode
of inhibition of these enzymes by any extracts, fractions or compounds derived from C. annuum.
Therefore acetone fraction exerts the inhibitory effect toward α-glucosidase and α-amylase actions by
binding to the enzymes at regions other than active sites and may not be affected by higher amount of
substrate. This induces some conformational changes in the three-dimensional structure of the enzymes
that slowdown the activity of the enzymes.
Based on the higher anti-oxidative and anti-diabetic actions exhibited by the acetone fraction,
it was subjected to GC-MS analysis to detect possible bioactive compounds present in this fraction. The
six bioactive compounds detected in the acetone fraction were previously reported to be present in the
C. annuum fruit (Tundis et al. 2013; Conforti et al. 2007). These compounds may act individually or in
synergy to confer the strong activities demonstrated by the acetone fraction observed in our present
study.
5.2.6 Conclusion
Conclusively, various solvent fractions from C. annuum fruit exhibited anti-oxidative as well
as inhibitory effect towards carbohydrates digesting enzymes activities in vitro. The acetone fraction,
which is the most polar, has exhibited higher activities compared to other fractions. Therefore, it is

172
recommended for in vivo anti-diabetic and anti-oxidative effects and to isolate the active principle from
this fraction which is responsible for these actions.
173
Based on the results of the study above, acetone fraction demonstrated higher anti-oxidative action and
inhibits the activities of carbohydrate digesting enzymes in vitro compared to other solvent fractions. It
was therefore selected for the in vivo studies.
5.3 Anti-diabetic effects of Capsicum annuum L. fruit acetone
fraction in a type 2 diabetes model of rats
Aminu Mohammed1,2 and Md. Shahidul Islam1*
1Department of Biochemistry, School of Life Sciences, University of KwaZulu-Natal, (Westville
Campus), Durban, 4000, South Africa 2Department of Biochemistry, Faculty of Science, Ahmadu Bello University, Zaria-Nigeria
5.3.1 Abstract
Objective: Capsicum annuum L. (Solanaceae) is a spice that is readily available in different parts of
the world. The fruit is locally used as a blood tonic, stimulant and in the treatment of nerve weakness
due to diabetes in some parts of Africa and Asia. The present study investigated the anti-diabetic effect
of C. annuum acetone fraction (CAAF) derived from fruit ethanolic extract in type 2 diabetes (T2D)
model of rats.
Methods: T2D was induced in rats by feeding a 10% fructose solution ad libitum for two weeks
followed by a single intraperitoneal injection of streptozotocin (40 mg/kg body weight (bw)). The
animals were orally treated with 150 or 300 mg/kg bw of the CAAF once daily for 4 weeks.
Results: Oral treatment of CAAF for 4 weeks especially at 300 mg/kg bw to diabetic animals
demonstrated anti-hyperglycemic and anti-hyperlipidemic effects, improved glucose intolerance and
insulin resistance and restored pancreatic morphology to near normal. Additionally, the alterations of
other organ related serum markers were ameliorated in the treated diabetic animals compared to diabetic
control group.
Conclusion: The results of our study suggest that CAAF possessed potent anti-diabetic effect in a T2D
model of rats when no toxicological effects were observed for the above-mentioned parameters. Hence,
CAAF can not only be used as a potential anti-diabetic natural medicine but also can be used to find
novel compounds to develop anti-diabetic medicine.
Keywords: Capsicum annuum, Fruit ethanolic extract, Acetone fraction, Type 2 diabetes, Rats.
174
5.3.2 Introduction Type 2 diabetes (T2D) is a metabolic disorder characterized by chronic insulin resistance and
loss of functional β-cells due to relative (rather than absolute) deficiency of insulin (ADA, 2015).
Inadequate secretion of insulin by pancreatic β-cell in type 2 diabetic individuals disrupts the regulation
of hepatic gluconeogesis, muscles glucose uptake and lipolysis in adipose tissue. The consequence is
postprandial hyperglycemia which subsequently causes T2D (Gastaldelli, 2011). Furthermore, the
control of postprandial hyperglycemia is crucial for the prevention of the progression of diabetic
complications (Rahati et al. 2014). One therapeutic strategy to reduce postprandial hyperglycemia in
T2D is to retard absorption of glucose via inhibition of carbohydrate-digesting enzymes, such as α-
glucosidase and α-amylase located at the intestinal brush boarder (Holman et al. 1999). Acarbose and
miglitol are the major available glucosidase inhibitors currently used in treatment of T2D. However,
lack of effective treatment and the resulting adverse effects with the existing drugs motivated further
search for better anti-diabetic agents with fewer side effects as well (Hung et al. 2012). Therefore, with
the increasing interest in alternatives the use of food based approaches is emerging and receiving much
attention. This is in addition to the fact that consumers prefer natural functional ingredients than the
synthetic chemicals (Taveira et al. 2010). Vegetables such as spices are important food adjuncts that
have been used as flavoring or coloring agents in various food preparations. Additionally, considerable
evidence have shown that spices can enhance the overall health status of diabetic patients by blood
glucose lowering ability, amelioration of dyslipidemia, improving β-cell function, body weight and
preventing cellular oxidative damage (Asif, 2011; Srinivasan, 2005a, b; Khan and Safdar, 2003;
Broadhurst et al. 2000).
Capsicum annuum L. (Solanaceae) also known as red pepper is a spice that is readily available
in almost all parts of the world. The fruit is widely consumed in vast quantities as flavoring agent in
various traditional foods (Khan et al. 2014). The fruit is locally used as a blood tonic, stimulant and in
the treatment of nerve weakness or pain due to diabetes in some parts of Africa and Asia (Iwu 2014;
Jayakumar et al. 2010). In addition, C. annuum is endowed with variety of medicinal values and a good
source of important phytochemicals such as dihydrocapsaincin, carotenoids, vitamin C, feruloyl O-
glucosides, kaempferol O-pentosyldihexosides, dihydroxyflavone O-hexoses,quercetin-3-O-L-
rhamnoside and capsaicin (Hernández-Ortega et al. 2012; Park et al. 2012; Luthria and Mukhopadhyay
2006; Materska and Perucka, 2005). These ingredients have beneficial effects on human health and
could play a role in the prevention of disease such as diabetes, cardiovascular and other age-related
disorders (Materska and Perucka, 2005; Sun et al. 2007).The beneficial influence of C. annuum fruit
and its pungent principle capsaicin as anti-oxidative agents have been well documented (Tundis et al.
2011; 2013; Kwon et al. 2007; Materska and Perucka, 2005; Prasad et al. 2004; Kogure et al. 2002;
Reddy and Lokesh, 1992). In addition, consumption of the whole fruit extract or capsaicin was reported

175
to attenuate dyslipidemia, improve satiety and impact thermogenic effect in hyperlipidemic animals
(Kempaiah and Srinivasan 2006; Kawada et al. 1986; Sambaiah et al. 1978).
On the other hand, the anti-diabetic action of C. annuum is still poorly understood due to
inconsistency of the anti-diabetic action of the pure capsaicin, one of the active ingredients of C.
annuum fruit. It has been highlighted that various extracts from the whole fruit and pure capsaicin were
reported to inhibit the activities of α-glucosidase and α-amylase in vitro, which are potential target for
the treatment of T2D (Tundis et al. 2011, 2013; Kwon et al. 2007). Tsui et al. (2007) have reported that
‘substance P’ a neuropeptide released by capsaicin, was able to reduce insulin resistance and
hyperglycemia in diabetic mice. Conversely, dietary inclusion of pure capsaicin to diabetic animals did
not show any beneficial anti-hyperglycemic and hypolipidemic effects in diabetic animals (Babu and
Srinivasan, 1997), when consumption of the aqueous extract of the whole fruit improved glycemic
control in non-diabetic animals after 1 h post-treatment period (Monsereenusorn, 1980). Therefore,
based on the above-mentioned studies and diverse array of compounds present in plant-based food, we
may hypothesize that consumption of either extract or fraction from the whole fruit of C. annuum may
have anti-diabetic action. Additionally, to the best of our knowledge no study is available that
comprehensively reported the anti-diabetic effect of the extract or fraction from C. annuum whole fruit
either in humans or in experimental animals.
Therefore, the present study was design to investigate the in vivo anti-diabetic effects of the C. annuum
acetone fraction (CAAF) derived from the fruit ethanolic extract in a T2D model of rats.
5.3.3 Materials and methods
For sample collection, identification and preparation of the fraction, including the detail
experimental protocols, please refer to chapter 2, sub-sections 2.3 and 2.5.1 to 2.5.8.
5.3.4 Results
The results of body weight (bw) change of all animals are presented in Figure 5.15. According
to the data, before the STZ-injection, fructose feeding did not affect the mean bw of the treated animals
compared to the untreated animals. But one week after the STZ-injection, the mean bw of the diabetic
animals significantly decreases compared to non-diabetic groups. However, at 2nd, 3rd and 4th week of
CAAF treatment the mean bw of diabetic treated groups were significantly (p < 0.05) increased
compared to the DBC group (Figure 5.15) which is comparable to the DMF group. Furthermore,
administration of the fraction to non-diabetic animals did not affect the mean bw change of the treated
animals (Figure 5.15).

176
Figure 5.15. Mean body weight change of all animal groups during the study period. Data are presented as the mean ± SD of
5-7 animals. a-c Values with different letter near the lines for a given week are significantly different from each other group of
animals (Tukey's-HSD multiple range post hoc test, p< 0.05). NC, Normal Control; DBC, Diabetic Control; DCAL, Diabetic
C. annuum low dose; DCAH, Diabetic C. annuum high dose; DMF, Diabetic Metformin; NCAH, Normal C. annuum high
dose.
The data of feed and fluid intake are presented in Figure 5.16. It was observed that feed and
fluid intake of the DBC group significantly (p < 0.05) increased compared to the NC group. Oral
intervention of CAAF and metformin for 4 weeks to diabetic animals reduced feed and fluid intake,
when the effect is more pronounced in the DCAH group compared to the DCAL group (Figure 5.16).
However, treatment of CAAF at high dose did not affect the eating behavior of the non-diabetic treated
animals.
Figure 5.16. Food and fluid intake in different animal groups during the experimental period. Data are presented as the mean
± SD of 5-7 animals. a–eValues with different letters over the bars for a given parameter are significantly different from each
other group of animals (Tukey's-HSD multiple range post hoc test, p < 0.05). NC, Normal Control; DBC, Diabetic Control;
DCAL, Diabetic C. annuum low dose; DCAH, Diabetic C. annuum high dose; DMF, Diabetic Metformin; NCAH, Normal
C. annuum high dose.
c c c
a a a a aa
a b bb
bb b,c b,c
100
150
200
250
300
350
WK-3 WK-2 WK -1 WK 0 WK 1 WK 2 WK 3 WK 4
Mea
n bo
dy w
eigh
t (g)
Experimental weeks
NC DBC DCAL DCAH DMF NCAH
a a
c
e
b
d
a,b
c
ab
aa
020406080
100120140160180
Feed intake (g/day/rat) Fluid intake (ml/day/rat)
Feed
and
flui
d in
take
NC DBC DCALDCAH DMF NCAH

177
The results of weekly NFBG and FBG (last week only) of all the animal groups are presented
in Figure 5.17. Induction of T2D significantly (p < 0.05) elevated the blood glucose levels of DBC
group compared to the NC group. However, oral treatment of CAAF for 4 weeks significantly (p <
0.05) decreased the blood glucose levels in the DCAL and DCAH groups, when the effect was more
prominent in DCAH group which is comparable to DMF group. Additionally, treatment of CAAF to
NCAH group did not affect NFBG and FBG throughout the study period (Figure 5.17).
Figure 5.17. Weekly NFBG in all animal groups during the intervention period. Data are presented as the mean SD of 5-7
animals. a–dValues with different letter near the lines for a given week are significantly different from each other group of
animals (Tukey's-HSD multiple range post hoc test, p < 0.05). NC, Normal Control; DBC, Diabetic Control; DCAL, Diabetic
C. annuum low dose; DCAH, Diabetic C. annuum high dose; DMF, Diabetic Metformin; NCAH, Normal C. annuum high
dose; NFBG, Non-fasting blood glucose; FBG, Fasting blood glucose.
The data of oral glucose tolerance test (OGTT) and the calculated area under the curve (AUC)
are presented in Figure 5.18 and Table 5.7, respectively. The oral glucose tolerance ability of DBC
group was significantly impaired compared to the NC group. However, significantly (p < 0.05) better
glucose tolerance ability was observed in the DCAL and DCAH groups compared to the DBC group
throughout the test period. Moreover, better glucose tolerance ability was observed in the DCAH group
compared to the DCAL group when at 60 min the blood glucose of DCAH was significantly (p < 0.05)
better compared to the DMF group. The glucose tolerance ability of NCAH group is not affected during
the entire period of the test (Figure 5.18). The calculated AUC for DBC group was observed to be
significantly (p < 0.05) higher compared to NC group when that of DCAL and DCAH groups were
significantly (p < 0.05) lower compared to DBC groups and were comparable to the DMF group (Table
5.7).
b
b c c d
b
bb
cb
b
a,bb
a a a aa
0
50
100
150
200
250
300
350
400
450
500
WK 0 WK 1 WK 2 WK 3 WK 4
Blo
od g
luco
se le
vels
(mg/
dL)
Week after intervention
NC DBC DCAL DCAH DMF NCAH

178
Figure 5.18. OGTT of all animal groups in the last week of the 4-week intervention period. Data are presented as the mean ±
SD of 5-7 animals. a–dValues with different letter near the lines for a given time are significantly different from each other
group of animals (Tukey's-HSD multiple range post hoc test, p <0.05). NC, Normal Control; DBC, Diabetic Control; DCAL,
Diabetic C. annuum low dose; DCAH, Diabetic C. annuum high dose; DMF, Diabetic Metformin; NCAH, Normal C. annuum
high dose.
Table 5.7. Area under the curve (AUC) of different animal groups at the end of the experimental period
NC DBC DCAL DCAH DMF NCAH
AUC*x103 15.75 ± 0.97a 60.15 ± 7.50 c 35.97 ± 9.01 b 23.36 ± 2.97 b 28.68 ± 7.21 b 15.47 ± 0.47 a
Data are presented as the mean ± SD of 5-7 animals. a-cValues with different letter along a row for a given parameter are
significantly different from each other group of animals (Tukey's-HSD multiple range post hoc test, p<0.05). NC, Normal
Control; DBC, Diabetic Control; DCAL, Diabetic C. annuum low dose; DCAH, Diabetic C. annuum high dose; DMF, Diabetic
Metformin; NCAH, Normal C. annuum high dose, AUC, Area under curve.
The results of serum insulin and fructosamine levels including the calculated HOMA-IR and
HOMA-β scores are presented in Table 5.8. According to the data, the serum insulin level and the
calculated HOMA-β scores were decreased significantly (p < 0.05) whereas serum fructosamine as well
as HOMA-IR were increased significantly (p < 0.05) in the DBC group compared to the NC group
(Table 5.8). Treatment of the fraction to diabetic animals caused a significant (p < 0.05) and dose-
dependent increase of serum insulin levels and the calculated HOMA-β scores with a concomitant
reduction of serum fructosamine levels and HOMA-IR scores. Similarly, the reduction of serum
fructosamine levels and HOMA-IR scores did not differ significantly (p < 0.05) within the diabetic
treated groups (DCAL and DCAH) although more pronounced results were observed in the DCAH
group which is also comparable to the DMF group. These parameters were not altered in the non-
diabetic treated group (Table 5.8).
c cc d
c
b
b bc
b
a
aa,b
aa,b
b bb
a,b
a
a a aa
0
100
200
300
400
500
600
700
0 30 60 90 120
Blo
od g
luco
se (m
g/dL
)
Time (min)
NC DBC DCAL DCAH DMF NCAH
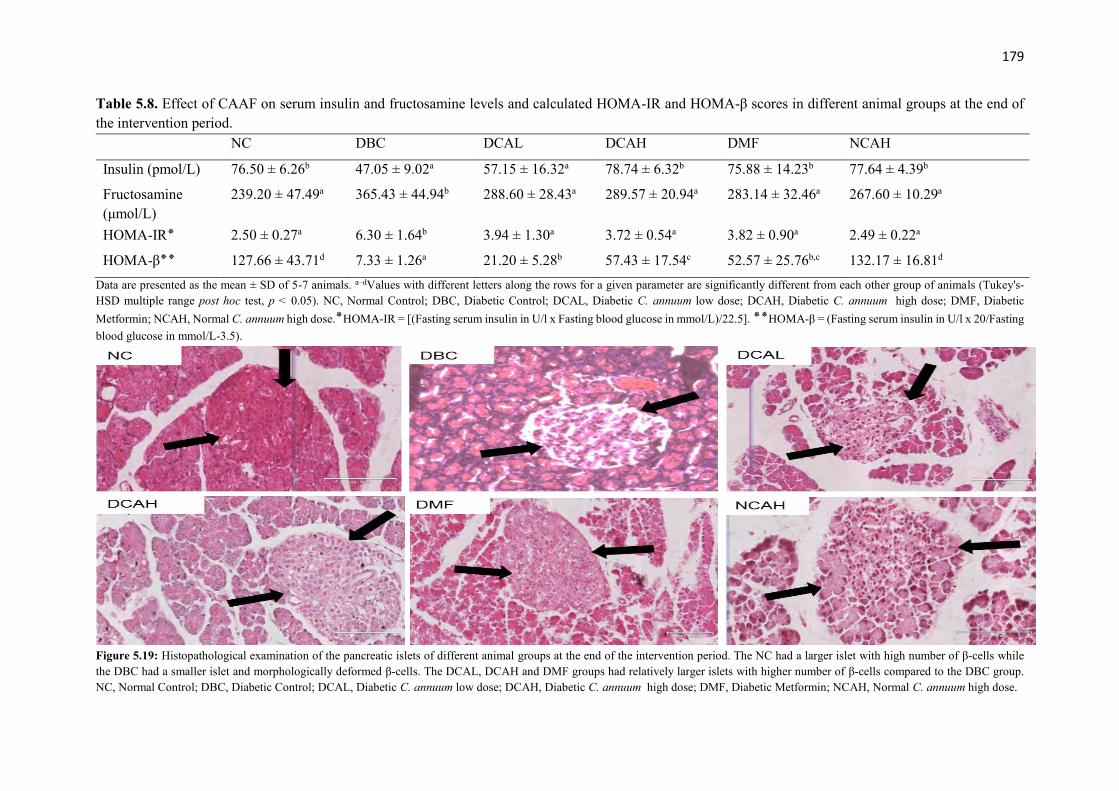
179
Table 5.8. Effect of CAAF on serum insulin and fructosamine levels and calculated HOMA-IR and HOMA-β scores in different animal groups at the end of the intervention period. NC DBC DCAL DCAH DMF NCAH
Insulin (pmol/L) 76.50 ± 6.26b 47.05 ± 9.02a 57.15 ± 16.32a 78.74 ± 6.32b 75.88 ± 14.23b 77.64 ± 4.39b
Fructosamine (μmol/L)
239.20 ± 47.49a 365.43 ± 44.94b 288.60 ± 28.43a 289.57 ± 20.94a 283.14 ± 32.46a 267.60 ± 10.29a
HOMA-IR0.27 ± 2.50 ٭a 6.30 ± 1.64b 3.94 ± 1.30a 3.72 ± 0.54a 3.82 ± 0.90a 2.49 ± 0.22a
HOMA-β43.71 ± 127.66 ٭٭d 7.33 ± 1.26a 21.20 ± 5.28b 57.43 ± 17.54c 52.57 ± 25.76b,c 132.17 ± 16.81d Data are presented as the mean ± SD of 5-7 animals. a–dValues with different letters along the rows for a given parameter are significantly different from each other group of animals (Tukey's-HSD multiple range post hoc test, p < 0.05). NC, Normal Control; DBC, Diabetic Control; DCAL, Diabetic C. annuum low dose; DCAH, Diabetic C. annuum high dose; DMF, Diabetic Metformin; NCAH, Normal C. annuum high dose.٭HOMA-IR = [(Fasting serum insulin in U/l x Fasting blood glucose in mmol/L)/22.5]. ٭٭HOMA-β = (Fasting serum insulin in U/l x 20/Fasting blood glucose in mmol/L-3.5).
Figure 5.19: Histopathological examination of the pancreatic islets of different animal groups at the end of the intervention period. The NC had a larger islet with high number of β-cells while the DBC had a smaller islet and morphologically deformed β-cells. The DCAL, DCAH and DMF groups had relatively larger islets with higher number of β-cells compared to the DBC group. NC, Normal Control; DBC, Diabetic Control; DCAL, Diabetic C. annuum low dose; DCAH, Diabetic C. annuum high dose; DMF, Diabetic Metformin; NCAH, Normal C. annuum high dose.

180
The histopatological slides of the pancreas for all the groups are presented in Figure 5.19. It
was observed from the slides that the pancreas of the DBC group shows increased fatty infiltrations of
the islets and reduced number of β-cells compared to the NC group (Figure 5.19). On the other hand,
the pancreatic morphology of DCAL, DCAH and DMF groups were significantly improved with larger
islets and higher number of β-cells compared to the DBC group. No significant difference was observed
between the pancreatic islets integrity of NCAH and NC group.
The data of absolute and relative liver weight including liver glycogen contents are presented
in Table 5.9. Although absolute liver weight was not affected by the induction of diabetes, the relative
liver weight and hepatic glycogen content of DBC group were significantly (p < 0.05) increased
compared to the NC group (Table 5.9). Oral intervention of CAAF to diabetic animals did not
significantly (p < 0.05) affect the relative liver weight and hepatic glycogen content compared to the
DBC group (Table 5.9). Similarly, the glycogen content of NCAH group was not altered at the end of
the intervention period.
The data for serum lipid profile and calculated atherogenic index (AI) and coronary risk index
(CRI) are presented in Table 5.10. The serum total cholesterol (TC), triglycerides (TG) and low density
lipoprotein (LDL) cholesterol as well as calculated AI and CRI with subsequent reduction on serum
high density lipoprotein (HDL) cholesterol were observed in the DBC group compared to the NC group
(Table 5.10). Treatment of CAAF to the diabetic animals significantly (p < 0.05) decreased serum TC,
TG and LDL-cholesterol levels, calculated AI and CRI indices compared to the DBC group. Moreover,
the increased on serum HDL-cholesterol level in CAAF diabetic treated groups did not differ
significantly (p < 0.05) compared to the DBC group. Additionally, the levels of the above-mention
parameters were not affected in NCAH group at the end of the intervention period (Table 5.10).
The results of serum ALT, AST, ALP, urea, uric acid, creatinine, LDH and CK-MB are
presented in Table 5.11. According to the data, the serum ALT, ALP, urea, creatinine, LDH and CK-
MB levels were elevated in DBC group compared to the NC group, when the serum creatinine, ALP
and uric acid levels were not affected by the induction of diabetes (Table 5.11). However, oral
intervention of CAAF for 4 weeks to diabetic animals significantly reduced serum ALT, ALP, urea,
creatinine, LDH and CK-MB levels compared to the DBC group. Although these reductions were not
significantly (p < 0.05) different between DCAL and DCAH groups, they were comparable with the
DMF group. Furthermore, treatment of CAAF did not cause any alterations in the serum levels of the
above-stated parameters in NCAH group (Table 5.11).

181
Table 5.9. Effect of CAAF on liver weights and liver glycogen concentrations in T2D rats
NC DBC DCAL DCAH DMF NCAH
Liver weight(g) 9.25 ± 1.04 10.34 ± 0.31 9.52 ± 0.35 9.62 ± 0.85 9.10 ± 1.33 9.65 ± 0.41
Relative liver weight (%)0.29 ± 2.89 ٭a 4.55 ± 0.34b 4.31 ± 0.10b 4.27 ± 0.20b 3.10 ± 0.45a,b 2.85 ± 0.13a
Liver glycogen (mg/g tissue) 6.76 ± 0.81a 8.25 ± 0.83b 8.12 ± 0.32b 8.08 ± 0.49b 6.92 ± 0.56a 6.72 ± 0.27a Data are presented as the mean ± SD of 5-7 animals. a-cValues with different letter along the rows for a given parameter are significantly different from each other group of animals (Tukey's-HSD
multiple range post hoc test, p < 0.05). NC, Normal Control; DBC, Diabetic Control; DCAL, Diabetic C. annuum low dose; DCAH, Diabetic C. annuum high dose; DMF, Diabetic Metformin;
NCAH, Normal C. annuum high dose.
Relative liver weight (%) = [weight of the liver (g)/body weight (g)] x100٭

182
Table 5.10. Serum lipid profiles and other biochemical parameters in different animal groups at the end of the intervention period
NC DBC DCAL DCAH DMF NCAH
TC (mg/dl) 76.20 ± 7.40a 116.00 ± 12.92c 83.14 ± 13.69a,b 79.43 ± 7.91a,b 95.71 ± 7.74b 75.80 ± 9.39a
HDL-Cholesterol (mg/dl) 49.20 ± 8.35b 28.29 ± 6.25a 32.57 ± 7.30a 30.57 ± 4.47a 32.71 ± 7.43a 30.40 ± 3.21a
LDL-Cholesterol (mg/dl)* 12.96 ± 4.16a 57.54 ± 14.45c 33.26 ± 9.10b 34.31 ± 9.97b 42.86 ± 8.93b,c 32.84 ± 12.74a,b
TG (mg/dl) 70.20 ± 18.10a 150.86 ± 24.57b 86.57 ± 29.40a 72.71 ± 20.89a 100.71 ± 32.47a 62.80 ± 6.06a
AI 0.57 ± 0.13a 3.30 ± 1.08c 1.60 ± 0.37a,b 1.63 ± 0.38a,b 2.06 ± 0.69b 1.53 ± 0.38a,b
CRI 1.57 ± 0.13a 4.30 ± 1.08c 2.60 ± 0.37a,b 2.63 ± 0.38a,b 3.06 ± 0.69b 2.93 ± 0.38a,b Data are presented as the mean ± SD of 5-7 animals. a–cValues with different letters along the rows for a given parameter are significantly different from each other group of animals (Tukey's-
HSD multiple range post hoc test, p < 0.05). NC, Normal Control; DBC, Diabetic Control; DCAL, Diabetic C. annuum low dose; DCAH, Diabetic C. annuum high dose; DMF, Diabetic
Metformin; NCAH, Normal C. annuum high dose; TC, Total cholesterol; TG, Triglyceride; LDL-cholesterol, Low density lipoprotein-cholesterol; HDL-cholesterol; High density lipoprotein-
cholesterol; AI, Atherogenic index; CRI, Coronary risk index.
*LDL-Cholesterol (mg/dl)= [TC- HDL- (TG/5)]
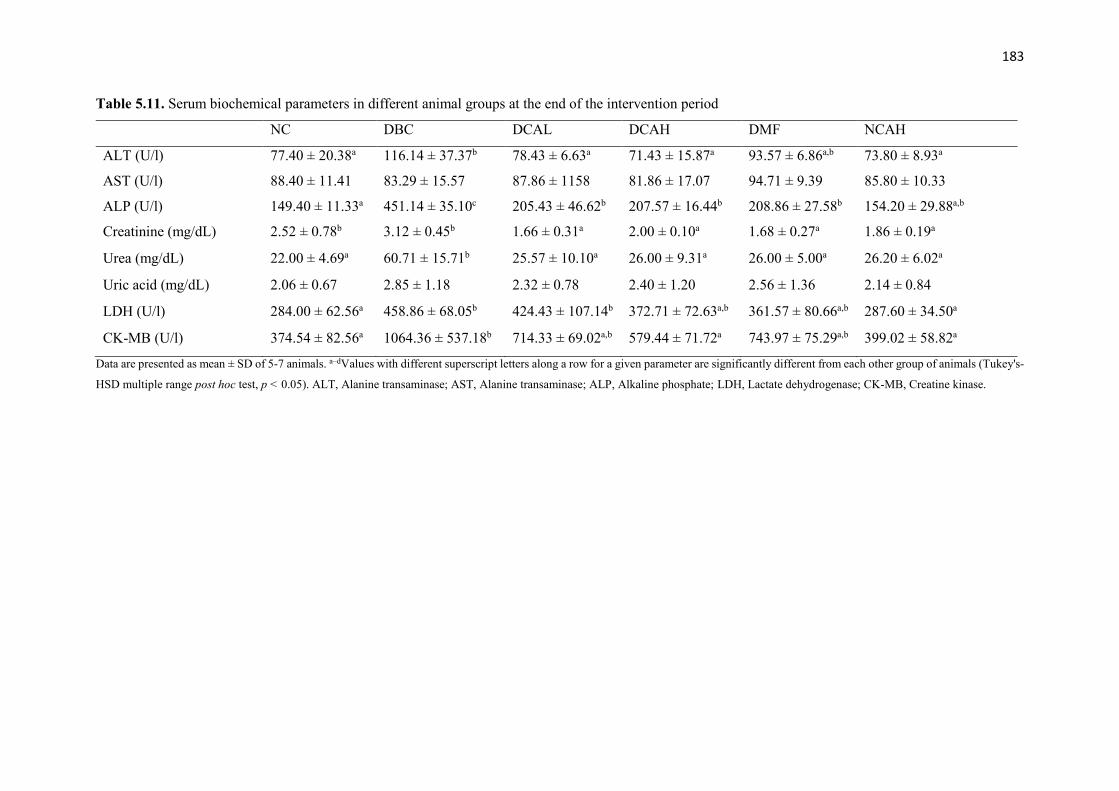
183
Table 5.11. Serum biochemical parameters in different animal groups at the end of the intervention period
NC DBC DCAL DCAH DMF NCAH
ALT (U/l) 77.40 ± 20.38a 116.14 ± 37.37b 78.43 ± 6.63a 71.43 ± 15.87a 93.57 ± 6.86a,b 73.80 ± 8.93a
AST (U/l) 88.40 ± 11.41 83.29 ± 15.57 87.86 ± 1158 81.86 ± 17.07 94.71 ± 9.39 85.80 ± 10.33
ALP (U/l) 149.40 ± 11.33a 451.14 ± 35.10c 205.43 ± 46.62b 207.57 ± 16.44b 208.86 ± 27.58b 154.20 ± 29.88a,b
Creatinine (mg/dL) 2.52 ± 0.78b 3.12 ± 0.45b 1.66 ± 0.31a 2.00 ± 0.10a 1.68 ± 0.27a 1.86 ± 0.19a
Urea (mg/dL) 22.00 ± 4.69a 60.71 ± 15.71b 25.57 ± 10.10a 26.00 ± 9.31a 26.00 ± 5.00a 26.20 ± 6.02a
Uric acid (mg/dL) 2.06 ± 0.67 2.85 ± 1.18 2.32 ± 0.78 2.40 ± 1.20 2.56 ± 1.36 2.14 ± 0.84
LDH (U/l) 284.00 ± 62.56a 458.86 ± 68.05b 424.43 ± 107.14b 372.71 ± 72.63a,b 361.57 ± 80.66a,b 287.60 ± 34.50a
CK-MB (U/l) 374.54 ± 82.56a 1064.36 ± 537.18b 714.33 ± 69.02a,b 579.44 ± 71.72a 743.97 ± 75.29a,b 399.02 ± 58.82a
Data are presented as mean ± SD of 5-7 animals. a–dValues with different superscript letters along a row for a given parameter are significantly different from each other group of animals (Tukey's-
HSD multiple range post hoc test, p < 0.05). ALT, Alanine transaminase; AST, Alanine transaminase; ALP, Alkaline phosphate; LDH, Lactate dehydrogenase; CK-MB, Creatine kinase.
184
5.3.5 Discussion
Apart from dietary and life style modifications, the current treatment options of T2D involve in the
use of conventional oral hypoglycemic drugs. However, the use of oral hypoglycemic drugs was associated
with a number of short- and long-time consequences. For instance α-glucosidase inhibitors are reported to
cause diarrhea, bloating, flatulence, cramping and abdominal pain (Fujisawa et al. 2005). Therefore, this
has triggered researchers to scientifically investigate the anti-diabetic actions of a number of plants
including plant-based spices as possible alternative therapies for diabetes. This is partly because plant-
derived preparations are important component of health care delivery system, particularly in developing
countries and were reported to cause minimum side effects (Cragg and Newman, 2013; Balunas and
Kinghorn, 2005). Spices are important food supplements which have been used as flavoring agents and
their ethnobotanical usage in the treatment of diabetes has been documented for a long time (Srinivasan,
2005). In the present study, we have evaluated the effect of the 4-week oral administration of a low (150
mg/kg bw) and a high (300 mg/kg bw) dose of C. annuum acetone fraction (CAAF) of fruit ethanolic extract
in a T2D model of rats. Although a number of recent and previous studies reported the anti-diabetic effects
of C. annum fruit extract in vitro (Tundis et al. 2013; Tundis et al. 2011; Kwon et al. 2007), as per our
knowledge, this is the first in vivo study that comprehensively conducted the anti-diabetic effect of C.
annuum fruit.
According to the American Diabetes Association (ADA), diabetes causes polyuria, increase
catabolic processes and weight loss, in addition to increase of feed and fluid intake (ADA, 2015). On the
other hand, capsaicin is the major bioactive compound of C. annum and it has been reported that dietary
inclusion of capsaicin (0.015%) for 8 weeks to diabetic animals did not show any effect on the bw change
(Babu and Srinivasan, 1997). In another study, consumption dietary C. annuum (0.9 g four times daily)
increased energy expenditure, decreased appetite and food intake in human subjects within 2 days of study
period (Westerterp-Plantenga et al. 2005). However, in our study, oral treatment of CAAF to diabetic
animals for 4 weeks caused a significant increase in bw despite of lower feed and fluid intake compared to
DBC group (Figure 5.15 and 5.16). In the above-mentioned studies, either pure capsaicin or whole dietary
C. annum was used when acetone fraction of the fruit ethanolic extract was used in our study which
chemical compositions might be different from the above. Hence, the other compounds from the C. annuum
might be contributed to this activities compared to the major active principle, capsaicin, or whole C. annum.
Furthermore, the effects were more pronounced in DCAH group compared to the DCAL and were
comparable to the DMF group. This indicates possible recovery from the diabetes-induced alterations in
eating behavior of the treated animals, which was further supported by the significant decrease in blood
glucose levels in CAAF treated groups (Figure 5.17).

185
Successful control of either fasting or postprandial blood glucose levels remains a prime target in
preventing and attenuating diabetes and its associated complications (Bavarva and Narasimhacharya,
2008). Babu and Srinivasan (1997) have reported that diabetic animals maintained on capsaicin (0.015%)
containing diet, for 8 weeks have shown no significant reduction on blood glucose levels. Likewise, in
another study, ʺsubstance Pʺ (a neuropeptide released by capsaicin) was reported to cause fluctuations in
blood sugar levels in human subjects (Brown and Vale, 2011). Conversely, Monsereenusorn, (1980) has
reported that intraperitoneal injection of fruit extract (500-700 mg/kg bw) showed a significant
hypoglycemic action after 30 minutes post-treatment period. In our study, oral intervention of the CAAF
to diabetic animals for 4 weeks significantly lowered blood glucose levels, when it was more pronounced
in DCAH group compared to DCAL group (Figure 5.17). This has shown a dose-dependent anti-
hyperglycemic response in the diabetic treated groups, which was further supported by the OGTT data
(Figure 5.18). In the OGTT result, better glucose utilizing capacities was observed in CAAF diabetic
treated animals compared to DBC group, when it was more prominent in the DCAH group compared to the
DCAL group and was comparable to DMF group. This again supports the possible contribution of other
compounds in CAAF apart from the major capsaicin in the observed anti-hyperglycemic action of CAAF.
On the other hand, the CAAF did not show any effect on the blood glucose level of NCAH group throughout
the study period, when in another study higher dosages (500-700 mg/kg bw) of the extract have shown
hypoglycemic effects in non-diabetic animals (Monsereenusorn, 1980). This could be due to the lower
dosages (300 mg/kg bw) of the fraction used in our study. The anti-hyperglycemic action of CAAF could
be attributed to the higher α-glucosidase and α-amylase inhibitory actions which apparently could delay the
intestinal absorption of glucose (Imam, 2015) in addition to the pancreatic β-cell ameliorating as well as
insulin secreting effects of CAAF in our study (Figure 5.19 and Table 5.8).
It has been reported that chronic hyperglycemia in T2D causes an impairment or decline in insulin
secretion (Nattrass and Bailey, 1999), with subsequent distortion of pancreatic architecture (Bonner-Weir
and O'Brien, 2008). Based on the current available data, this is the first study that investigates the effect of
CAAF of fruit on serum insulin levels and pancreatic β-cell integrity in diabetic state. According to our
results, treatment of CAAF to diabetic animals especially at the higher dose (300 mg/kg bw) have shown a
significant insulinotropic effect, lowered peripheral insulin resistance, stimulated pancreatic β-cell function
and restored the pancreatic morphology to near normal compared to the DBC group (Figure 5.19 and Table
5.8). Therefore, the anti-hyperglycemic effect of CAAF could partly be mediated via insulinotropic actions
and decreasing insulin resistance. This was further supported by the significantly lower serum fructosamine
levels in the DCAL and DCAH groups compared to the DBC group which did not differ significantly with
the NC and DMF groups (Table 5.8). This could be due to the strong anti-oxidative nature of C. annuum
186
fruit (extracts or fractions) reported in previous studies (Tundis et al. 2013; Tundis et al. 2011; Kwon et al.
2007; Oboh et al. 2007).
On the other side, previous studies have shown that supplementation of 0.015% capsaicin
containing diet to high-fat diet-fed diabetic animals for 8 weeks have shown no significant effect on the
relative liver weight (Kempaiah and Srinivasan, 2006; Babu and Srinivasan, 1997), which was similarly
observed in our present data (Table 5.9). Additionally, oral treatment of CAAF did not show any
significantly effect on the hepatic glycogen content of the treated diabetic animals (Table 5.9). Hence, our
data are in line with the previous capsaicin-based studies.
On the other side, C. annuum and its pungent principle capsaicin have been reported to play
beneficial role on lipid metabolism in a number of previous studies. Capsaicin (0.015%) included in diet
for 8 weeks was reported to decrease serum TC, TG and LDL-cholesterol levels in diabetic and high-fat
diet animals (Kempaiah and Srinivasan, 2006; Babu and Srinivasan, 1997 and). Similarly, in a chronic
study, oral treatment of capsaicin (50 mg/kg bw) or whole fruit extract (500 mg/kg bw) for 2 months
demonstrated hypolidemic actions (Monsereenusorn, 1983). Our results are also in line with the above-
mentioned studies. Additionally, a moderate increase of serum HDL-cholesterol levels was also observed
in DCAL and DCAH groups which did not differ significantly from DBC groups (Table 5.10). These
indicate the anti-hyperlipidemic effect of CAAF in diabetic animals. Moreover significantly lower
calculated AI and CRI indices in DCAL and DCAH groups compared to the DBC in our study again support
the anti-hyperlipidemic effect of CAAF in diabetic condition (Table 5.10).
In some disease conditions such as T2D, an increase of serum ALT, ALP, creatinine, urea, LDH
and CK-MB into blood circulation induces hepatic injuries, myocardial infarction and functional
disturbance of hepatic and renal tissues (Abolfathi et al. 2012; Jaramillo-Juarez et al. 2008). Therefore,
based on the results of the above-mentioned parameters, treatment of CAAF has demonstrated hepato-
protective, cardio-protective as well as reno-protective effects in diabetic condition, when serum AST level
was not affected anyway (Table 5.11). In comparison with ALT, AST is less specific for the detection of
hepatic injury due to its shorter half-life compared to ALT, particularly in experimental animal (Center,
2007). Therefore, in a condition of acute or sub-chronic liver injury, there will be an elevation in both serum
ALT and AST levels. However, the serum AST level may likely return to normal more rapidly compared
to the level of serum ALT, which make ALT more sensitive in assessing hepatic damage in disease
conditions (Ramaiah, 2007; Meyer and Harvey, 2004). Therefore, the unaffected serum AST level in our
present result could be link to the above-mentioned factor.
187
5.3.6 Conclusion
Oral intervention of CAAF from whole fruit especially at the higher dose (300 mg/kg bw) have
demonstrated anti-diabetic actions via improving bw gain, reducing food and fluid intake and
hyperglycemia, improving glucose tolerance ability, insulin sensitivity, amelioration of pancreatic β-cell
histology and β-cell functions and improving dyslipidemia in T2D. Hence, our findings suggest that acetone
fraction of the whole C. annuum fruit ethanolic extract may provide an excellent anti-diabetic remedy with
no considerable side effects. Further clinical study is required to confirm the effects in human subjects. The
isolation and partial characterization of the active principle from CAAF is currently underway to find the
compound (s) responsible for this activity.
188
5.4 Anti-oxidant action of Capsicum annuum fruit acetone fraction in
in a type 2 diabetes model of rats
Aminu Mohammed a,b and Md. Shahidul Islam a*
aDepartment of Biochemistry, School of Life Sciences, University of KwaZulu-Natal, (Westville Campus),
Durban, 4000, South Africa bDepartment of Biochemistry, Faculty of Science, Ahmadu Bello University, Zaria-Nigeria
5.4.1 Abstract
Objectives: The present study evaluated the in vivo anti-oxidative actions of Capsicum annuum acetone
fraction (CAAF) from fruit ethanolic extract in a type 2 diabetes (T2D) model of rats.
Methods: T2D was induced in rats by feeding a 10% fructose solution ad libitum for two weeks followed
by a single intraperitoneal injection of streptozotocin (40 mg/kg body weight (bw)) and the animals were
orally treated with 150 or 300 mg/kg bw of the CAAF once daily for 4 weeks.
Results: After four weeks of intervention, diabetic untreated animals showed significantly higher levels of
thiobarbituric acid reactive substances (TBARS) and reductions of reduced glutathione (GSH) in the serum
and organs (liver, kidney, heart and pancreas) compared to the normal animals. The activities of endogenous
anti-oxidant enzymes (superoxide dismutase, catalase, glutathione peroxidase and reductase) were greatly
impaired in in the serum and organs of diabetic untreated animals compared to the normal animals. These
alterations were attenuated after the treatment of CAAF, especially at the dose of 300 mg/kg bw.
Conclusion: The results of our study suggest that CAAF treatment at 300 mg/kg bw showed potent anti-
oxidative potential in a T2D model of rats.
Keywords: Acetone, Anti-oxidant, Capsicum annuum, Fruit ethanolic extract, Type 2 diabetes, Rats.
5.4.2 Introduction
Diabetes mellitus (DM) is a major threat to global public health that is rapidly escalating, and the
highest impact on adults in most of the developing countries. The recent data indicate that more than 387
million people have DM and this figure is likely to be doubled by 2035, with type 2 diabetes (T2D) been
the most prevalent one, accounting for more than 90% of all diabetic cases (IDF, 2014; Guariguata et al.
189
2014). T2D is a heterogeneous disorder characterized by insulin resistance and partially dysfunctional
pancreatic β-cells which cannot properly secrete insulin in response to hyperglycemia (Hui et al. 2007).
T2D is associated with severe chronic complications that are partly or solely depend on
uncontrolled hyperglycemia (Monnier et al. 2006). The hyperglycemia in T2D induces generation of
reactive oxygen species (ROS), which are responsible for oxidative stress induced pancreatic β-cell
destruction (Ceriello and Testa, 2009). Oxidative stress is a condition due to the presence of ROS that
usually arise either from an excess production of ROS or from the inactivation of the in vivo anti-oxidants
defense system, thus shifting the ROS/anti-oxidant equilibrium towards stress (Ibrahim et al. 2012).
In aerobic system, oxygen is required for energy production (in the form of ATP) via the
metabolism of biomolecules such as fatty acids, glucose, lactate, ketones, and amino acids. During this
complex process, an unstable ROS, superoxide anion radical is produced, which is regarded as primary
ROS and later generate the secondary ROS either directly or indirectly by a variety of enzyme or metal
catalyzed processes (Sati et al. 2010). An enzyme, superoxide dismutase (SOD) catalyzes the conversion
of superoxide to hydrogen peroxide, which subsequently cross the membranes and causes enzyme
inactivation through oxidations of their thiol groups (Rajasekaran et al. 2005). The hydrogen peroxide is
later converted to hydroxyl radicals in the presence of transition metals. This initiates a sequence for the
generation of other ROS such as singlet oxygen and peroxyl (ROO•) radicals.
Therefore, due to the shift in the ROS/anti-oxidant equilibrium balance in living organisms, the
increased intake of anti-oxidants is necessary to prevent the oxidative damages due to oxidative stress.
However, the use of synthetic anti-oxidants such as butylated hydroxy anisole (BHA), butylated hydroxy
toluene (BHT), tertiary butylated hydroquinon and gallic acid esters in food protection and disease control
have been associated with unwanted consequences. This has motivated researchers to look for options from
plant-derived anti-oxidants.
The fruit from Capsicum annuum L. has been a major component of various food preparations
worldwide. In addition to this, C. annuum fruit has been reported to be an excellent source of important
anti-oxidant biomolecules such as vitamins, polyphenols and other potentially active phytochemicals that
may prevent the risk of T2D (Rahimi et al. 2005). More importantly, there is sufficient available data that
support the anti-oxidative crude extracts of C. annuum in vitro (Azeez et al. 2012; Chen et al. 2012; Tundis
et al. 2011; Perucka and Materska, 2007; Conforti et al. 2007; Kwon et. 2007), when no available study on
the in vivo anti-oxidant action of any extracts, fractions or isolated compounds from C. annuum either in
normal or diseased conditions.
Therefore, the present study was designed to comprehensively investigate the in vivo anti-oxidant
effects of the acetone fraction derived from the fruit ethanolic extract of C. annuum in a T2D model of rats.
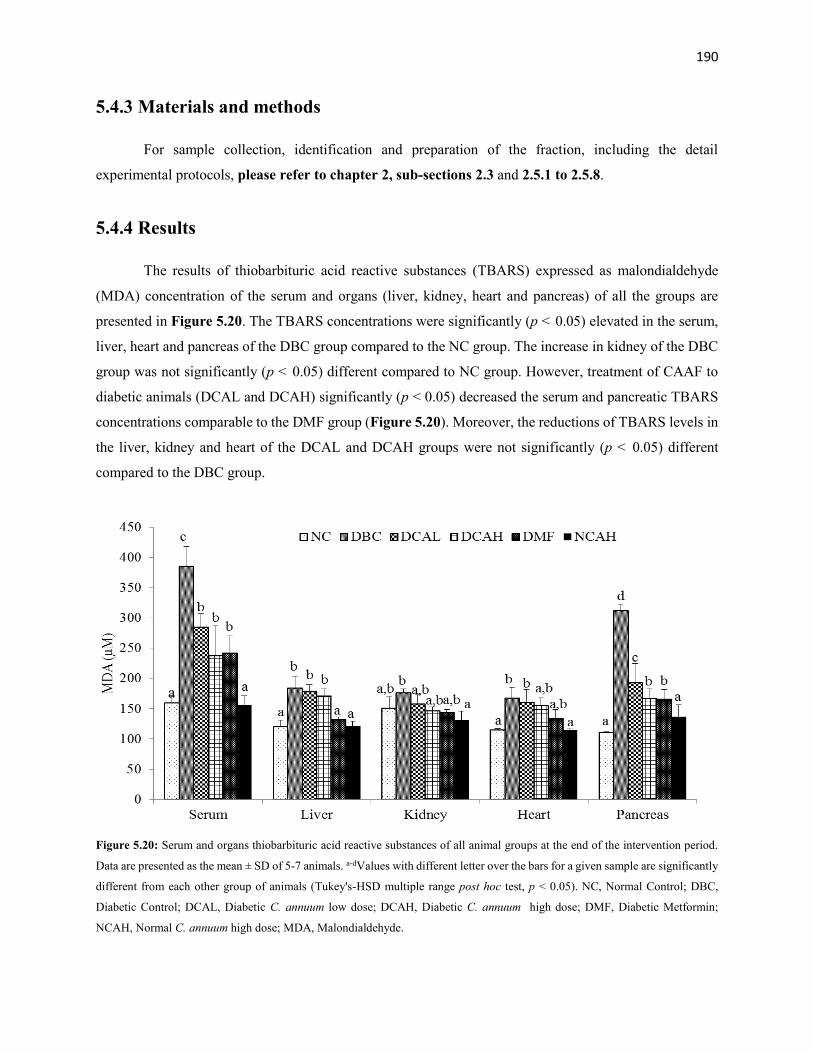
190
5.4.3 Materials and methods
For sample collection, identification and preparation of the fraction, including the detail
experimental protocols, please refer to chapter 2, sub-sections 2.3 and 2.5.1 to 2.5.8.
5.4.4 Results
The results of thiobarbituric acid reactive substances (TBARS) expressed as malondialdehyde
(MDA) concentration of the serum and organs (liver, kidney, heart and pancreas) of all the groups are
presented in Figure 5.20. The TBARS concentrations were significantly (p < 0.05) elevated in the serum,
liver, heart and pancreas of the DBC group compared to the NC group. The increase in kidney of the DBC
group was not significantly (p < 0.05) different compared to NC group. However, treatment of CAAF to
diabetic animals (DCAL and DCAH) significantly (p < 0.05) decreased the serum and pancreatic TBARS
concentrations comparable to the DMF group (Figure 5.20). Moreover, the reductions of TBARS levels in
the liver, kidney and heart of the DCAL and DCAH groups were not significantly (p < 0.05) different
compared to the DBC group.
Figure 5.20: Serum and organs thiobarbituric acid reactive substances of all animal groups at the end of the intervention period.
Data are presented as the mean ± SD of 5-7 animals. a-dValues with different letter over the bars for a given sample are significantly
different from each other group of animals (Tukey's-HSD multiple range post hoc test, p < 0.05). NC, Normal Control; DBC,
Diabetic Control; DCAL, Diabetic C. annuum low dose; DCAH, Diabetic C. annuum high dose; DMF, Diabetic Metformin;
NCAH, Normal C. annuum high dose; MDA, Malondialdehyde.
a

191
The data of reduced glutathione (GSH) levels of serum and organs of all the groups are presented
in Figure 5.21. According to the results, the concentration of GSH in the serum, liver and pancreas were
significantly (p < 0.05) decreased in the DBC group compared to the NC group. Similarly, the decrease of
GSH levels in the kidney and heart of the DBC group were not significantly (p < 0.05) different compared
to the NC group. Oral administration of CAAF to diabetic animals significantly (p < 0.05) increased the
levels of GSH in the liver, when that of the serum, kidney, heart and pancreas was not significantly (p <
0.05) different compared to the DBC group (Figure 5.21). In addition, the effect was more pronounced in
the DCAH compared to DCAL group. Furthermore, the GSH level in the NCAH was comparatively within
normal range throughout the study period (Figure 5.21).
Figure 5.21: Serum and organs reduced glutathione (GSH) content in all animal groups at the end of the study period. Data are
presented as the mean ± SD of 5-7 animals. a-cValues with different letter over the bars for a given sample are significantly different
from each other group of animals (Tukey's-HSD multiple range post hoc test, p < 0.05). NC, Normal Control; DBC, Diabetic
Control; DCAL, Diabetic C. annuum low dose; DCAH, Diabetic C. annuum high dose; DMF, Diabetic Metformin; NCAH, Normal
C. annuum high dose; GSH, Reduced glutathione.
The results of the activity of superoxide dismutase (SOD) of serum and organs of all the groups are
presented in Figure 5.22. It was observed from the data that induction of diabetes significantly (p < 0.05)
decrease the activity of SOD in serum, liver, heart and pancreas of DBC group, whereas the reduction in
kidney did not differ significantly (p < 0.05) compared to NC group. However, treatment of the fraction to
diabetic animals, especially the DCAH group showed a significant (p < 0.05) increased in the SOD activity
of the serum and organs, comparable to DMF group (Figure 5.22). Additionally, the SOD activity in the
serum and organs of NCAH group was not affected throughout the study period.

192
Figure 5.22: Superoxide dismutase (SOD) activities in the serum and organs of different animal groups at the end of the study period. Data are presented as the mean ± SD of 5-7 animals. a-cValues with different letter over the bars for a given sample are significantly different from each other group of animals (Tukey's-HSD multiple range post hoc test, p < 0.05). NC, Normal Control; DBC, Diabetic Control; DCAL, Diabetic C. annuum low dose; DCAH, Diabetic C. annuum high dose; DMF, Diabetic Metformin; NCAH, Normal C. annuum high dose.
The data of catalase activities in serum and organs of all the groups are presented in Figure 5.23.
According the results, the activity of the catalase in the serum and organs was significantly (p < 0.05)
decreased in the DBC group compared to the NC group. Treatment of CAAF to the diabetic animals
increases the catalase activity, when the effect was more pronounced in the DCAH group than the DCAL
group (Figure 5.23). Additionally, treatment of the fraction to the non-diabetic animals did not affect the
serum or organ catalase activity throughout the study period (Figure 5.23).
Figure 5.23: Catalase activities in the serum and different organs of different animal groups at the end of the study period. Data are presented as the mean ± SD of 5-7 animals. a-cValues with different letter over the bars for a given sample are significantly different from each other group of animals (Tukey's-HSD multiple range post hoc test, p < 0.05). NC, Normal Control; DBC, Diabetic Control; DCAL, Diabetic C. annuum low dose; DCAH, Diabetic C. annuum high dose; DMF, Diabetic Metformin; NCAH, Normal C. annuum high dose.
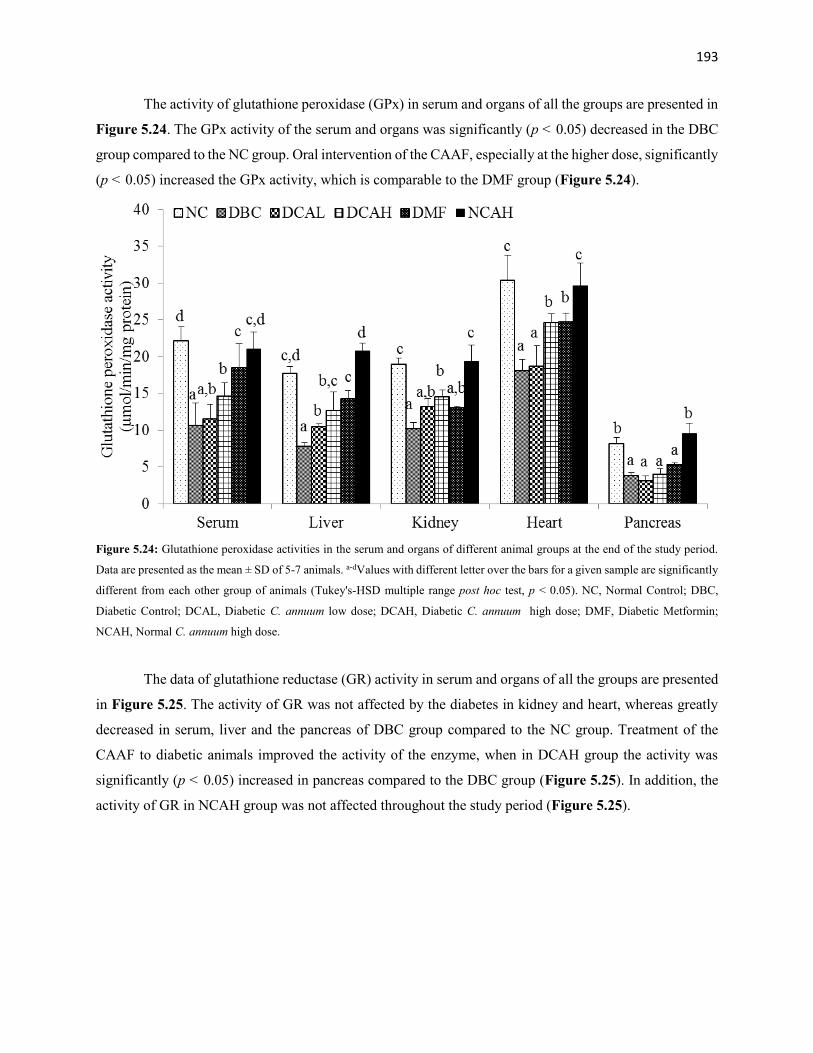
193
The activity of glutathione peroxidase (GPx) in serum and organs of all the groups are presented in
Figure 5.24. The GPx activity of the serum and organs was significantly (p < 0.05) decreased in the DBC
group compared to the NC group. Oral intervention of the CAAF, especially at the higher dose, significantly
(p < 0.05) increased the GPx activity, which is comparable to the DMF group (Figure 5.24).
Figure 5.24: Glutathione peroxidase activities in the serum and organs of different animal groups at the end of the study period.
Data are presented as the mean ± SD of 5-7 animals. a-dValues with different letter over the bars for a given sample are significantly
different from each other group of animals (Tukey's-HSD multiple range post hoc test, p < 0.05). NC, Normal Control; DBC,
Diabetic Control; DCAL, Diabetic C. annuum low dose; DCAH, Diabetic C. annuum high dose; DMF, Diabetic Metformin;
NCAH, Normal C. annuum high dose.
The data of glutathione reductase (GR) activity in serum and organs of all the groups are presented
in Figure 5.25. The activity of GR was not affected by the diabetes in kidney and heart, whereas greatly
decreased in serum, liver and the pancreas of DBC group compared to the NC group. Treatment of the
CAAF to diabetic animals improved the activity of the enzyme, when in DCAH group the activity was
significantly (p < 0.05) increased in pancreas compared to the DBC group (Figure 5.25). In addition, the
activity of GR in NCAH group was not affected throughout the study period (Figure 5.25).
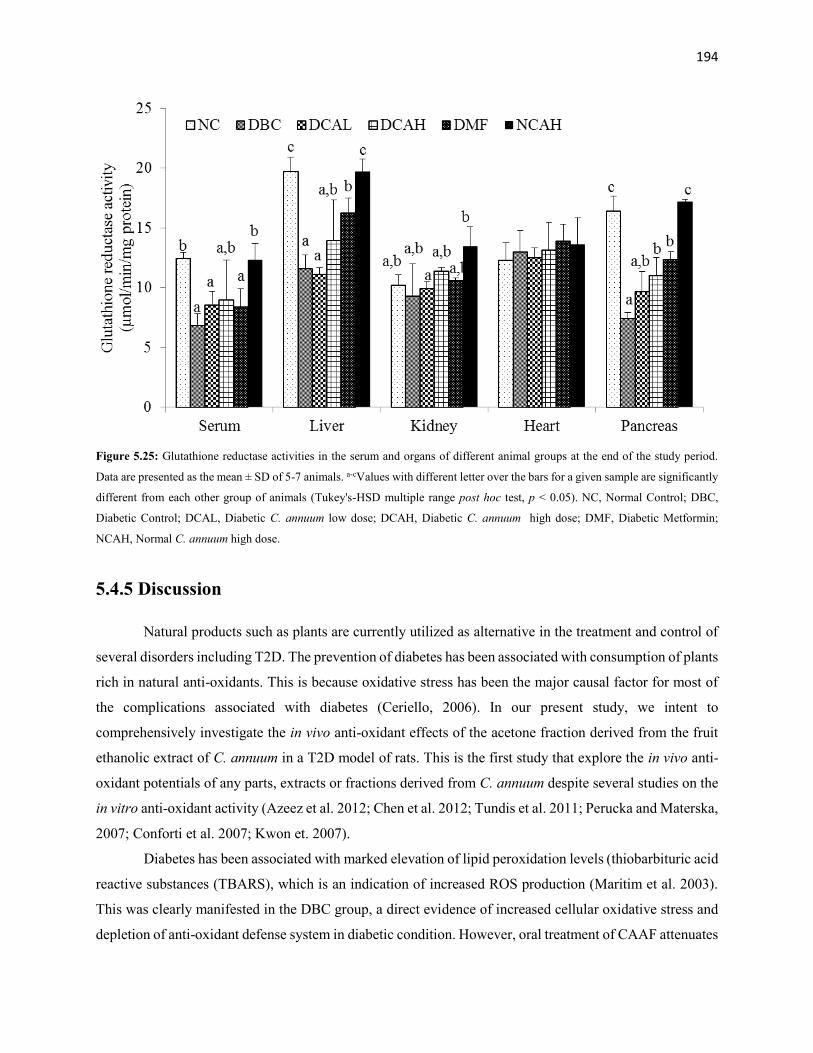
194
Figure 5.25: Glutathione reductase activities in the serum and organs of different animal groups at the end of the study period.
Data are presented as the mean ± SD of 5-7 animals. a-cValues with different letter over the bars for a given sample are significantly
different from each other group of animals (Tukey's-HSD multiple range post hoc test, p < 0.05). NC, Normal Control; DBC,
Diabetic Control; DCAL, Diabetic C. annuum low dose; DCAH, Diabetic C. annuum high dose; DMF, Diabetic Metformin;
NCAH, Normal C. annuum high dose.
5.4.5 Discussion
Natural products such as plants are currently utilized as alternative in the treatment and control of
several disorders including T2D. The prevention of diabetes has been associated with consumption of plants
rich in natural anti-oxidants. This is because oxidative stress has been the major causal factor for most of
the complications associated with diabetes (Ceriello, 2006). In our present study, we intent to
comprehensively investigate the in vivo anti-oxidant effects of the acetone fraction derived from the fruit
ethanolic extract of C. annuum in a T2D model of rats. This is the first study that explore the in vivo anti-
oxidant potentials of any parts, extracts or fractions derived from C. annuum despite several studies on the
in vitro anti-oxidant activity (Azeez et al. 2012; Chen et al. 2012; Tundis et al. 2011; Perucka and Materska,
2007; Conforti et al. 2007; Kwon et. 2007).
Diabetes has been associated with marked elevation of lipid peroxidation levels (thiobarbituric acid
reactive substances (TBARS), which is an indication of increased ROS production (Maritim et al. 2003).
This was clearly manifested in the DBC group, a direct evidence of increased cellular oxidative stress and
depletion of anti-oxidant defense system in diabetic condition. However, oral treatment of CAAF attenuates
195
this alteration, suggesting the protective role of CAAF in terminating the deleterious effect of ROS and
oxidative stress as well (Figure 5.20).
In living system, there are some low molecular weight non-enzymatic molecules such as α-
tocopherol, ascorbic acid, bilirubin and glutathione (GSH) that support the anti-oxidant defense system and
counteract the effects of oxidative stress (Rahimi et al. 2005). Moreover, diabetes has been associated with
reduction of GSH levels, due to the depletion of in vivo anti-oxidant system in diabetic condition, which
was observed in the DBC group in our present data (Figure 5.21). Treatment of the fraction to diabetic
animals was found to increase the serum and organ GSH levels, which may be liked to either increased
GSH biosynthesis or attenuated the oxidative processes leading to GSH reduction.
Superoxide anion radical has been considered as a primary ROS formed when molecular oxygen
accept electron in the metabolism of complex macromolecules (Sati et al. 2010). The deleterious effect of
this radical is prevented by an enzyme superoxide dismutase (SOD), which converts the superoxide radical
to less toxic hydrogen peroxide. The activity of this enzyme was reported to be impaired in diabetic
condition, due to increased ROS production that cannot be quenched by the enzyme action (Niki, 2010;
Valko et al. 2007). In our present study, this was clearly observed in the DBC group compared to the NC
group (Figure 5.22). However, the increased SOD activity observed in diabetic treated animals suggests
that the fraction contributes to in vivo anti-oxidant system via increasing the SOD activity, which was
further supported by the increased catalase activity (Figure 5.23).
Furthermore, the hydrogen peroxide released by the SOD is immediately converted to non-toxic
molecules, water and oxygen by catalase (McCrod et al. 1976). In most of degenerative disorders, the
activity of catalase is greatly altered; leading to increase in the conversion of hydrogen peroxide to hydroxyl
radicals, which invariably increased the oxidative stress. Therefore, the decreased catalase activity in the
DBC group observed in our present study may be attributed to increase conversion of hydrogen peroxide
to hydroxyl radicals that overpowered and reduced the catalase activity. Interestingly, treatment of CAAF
was found to improve the activity of catalase in the serum and organs, when is more pronounced in the
DCAH than DCAL (Figure 5.23). This was again supported by the increased activities of glutathione
peroxidase (GPx) and glutathione reductase (GR) (Figure 5.24 and 5.24).
According to our present data, the reduction of the activities of two glutathione dependent enzymes;
GPx and GR in the serum and organs of the DBC group could be due to the oxidative damage initiated by
increased ROS production. The moderate recovery of GPx and GR activities in the serum and organs of the
DCAH group indicates the protective effect of CAAF on the in vivo anti-oxidants (Figure 5.24 and 5.24).
196
5.4.6 Conclusion
In conclusion, oral administration of the fraction especially at higher dose demonstrates strong anti-
oxidant activities via reduction of lipid peroxidation, improving glutathione levels and endogenous anti-
oxidants enzymes in serum and organs mostly affected by diabetic-complications. Therefore, CAAF is
considered as excellent anti-oxidant agent with no considerable side effects. Further clinical study is
required to confirm its effects in human subjects. The isolation and partial characterization of the active
principle from CAAF has been conducted to find the compounds responsible for this activity.
197
CHAPTER 6
6.1 Anti-diabetic action of some African medicinal plants
(Aframomum melegueta, Xylopia aethiopica and Capsicum annuum)
in vitro and isolation of bioactive compounds
Aminu Mohammed1,3, Gbonjubola Victoria Awolola2, Neil Anthony Koorbanally2 and Md.
Shahidul Islam1*
1Department of Biochemistry, School of Life Sciences and 2Department of Chemistry, School of Chemistry
and Physics, University of KwaZulu-Natal, (Westville Campus), Durban, 4000, South Africa 3Department of Biochemistry, Faculty of Science, Ahmadu Bello University, Zaria-Nigeria
6.1.1 Abstract
Objective: The use of Aframomum melegueta K. Schum. (Zingiberaceae), Xylopia aethiopica (Dunal) A.
Rich. (Annonaceae) and Capsicum annuum L. (Solanaceae) fruits for treatment of diabetes and related
metabolic disorders have been reported. This has recently been established in vivo. However, compounds
responsible for the anti-diabetic action have not been identified. The present study is aimed at carrying out
the bioassay-guided isolation of possible compounds responsible for the anti-diabetic action of the selected
plants.
Methods: Plant parts were extracted in organic solvents and the secondary metabolites, isolated and
purified before being identified by spectroscopic analysis. Their α-glycosidase and α-amylase inhibitory
activities were investigated.
Results: Three arylalkanes, 6-paradol (1), 6-shagaol (2) and 6-gingerol (3) and a pentacyclic triterpene,
oleanolic acid (4) were isolated from A. melegueta fruit. Compounds (3) and (4) were also isolated from
the fruit of X. aethiopica. A mixture of aromatic compounds and a fatty acid (unable to be identified) was
also isolated from the active subfraction of C. annuum and labeled as (5). All the compounds exhibited
considerable inhibitory activity against α-amylase and α-glucosidase. Compounds (3) and (4) showed the
best activity against α-amylase (IC50: (3): 156.96 ± 12.23 µM; (4): 91.72 ± 1.63 µM) and α-glucosidase
(IC50: (3): 104.34 ± 3.99 µM; (4): 47.10 ± 0.42 µM) compared to the standard acarbose and the other isolated
compounds. The kinetics of the enzyme action shown by the compounds showed a non-competitive mode
of inhibition.

198
Conclusion: 6-Gingerol (3) oleanolic acid (4) present in the fruit of both A. melegueta and X. aethiopica
are possibly responsible for the anti-diabetic action attributed to these plants. Both 3 and 4 could be potential
anti-diabetic plants.
Keywords: Aframomum melegueta, Capsicum annuum, Xylopia aethiopica Anti-diabetic, α-amylase, α-
glucosidase
6.1.2 Introduction
Type 2 diabetes (T2D) is a metabolic disorder characterized by chronic insulin resistance and loss
of functional pancreatic β-cells due to relative (rather than absolute) deficiency of insulin (ADA, 2015).
The inability of the pancreatic β-cell to secrete enough insulin disrupts the regulation of hepatic glucose
synthesis, muscles glucose uptake and lipolysis in adipose tissue. The consequence is postprandial
hyperglycemia which subsequently causes T2D (Gastaldelli, 2011). This postprandial hyperglycemia must
be controlled in order to prevent diabetic complications (Rahati et al. 2014). One therapeutic approach to
reducing postprandial hyperglycemia in T2D is delaying glucose absorption via inhibition of carbohydrate-
digesting enzymes, such as α-glucosidase and α-amylase located at the intestinal brush boarder (Holman et
al. 1999). Acarbose and miglitol are the major available glucosidase inhibitors currently used in treatment
of T2D. However these drugs have side-effects major drawback with the use of the existing drugs has been
the adverse consequences such as diarrhea, bloating, flatulence, cramping and abdominal pain (Fujisawa et
al. 2005). Thus anti-diabetic leads with similar or better activity are sought after with fewer side effects
(Hung et al. 2012). The use of plant based approaches is emerging as alternatives to these nasty drugs and
is currently receiving much attention. Plant-derived natural products are becoming popular as alternatives
to synthetic drugs as they are considered to be safer with fewer side-effects (Taveira et al. 2010).
Aframomum melegueta K. Schum. (Zingiberaceae) commonly known as guinea or alligator pepper
is abundantly found in the central and western part of Africa (Iwu, 2014). The fruit, leaf or seeds are
consumed as flavoring agents in various traditional foods and are used locally to treat diseases including
diabetes, microbial infections, diarrhea, abdominal pain, snakebite and wound healing in many parts of
Africa (Iwu, 2014; Soladoye et al. 2012; Gbolade, 2009; Akendengue and Louis, 1994; Kokwaro, 1993).
Previous studies have shown that A. melegueta possessed anti-microbial (Nneka and Jude, 2013; Doherty
et al. 2010), hepato-protective (Nwozo and Oyinloye, 2011), anti-inflammatory (Ilic et al. 2014; Umukoro
and Ashorobi, 2008), anti-oxidative and potent inhibitory effects against α-glucosidase activities
(Mohammed et al. 2015; Onoja et al. 2014; Adefegha and Oboh, 2012a; Kazeem et al. 2012; Adefegha and
Oboh, 2011; Etoundi et al. 2010). In a recent study, the diterpenoids isolated from the organic seed extract
of A. melegueta showed bactericidal activity in vitro against Escherichia coli, Listeria moncyogenes and

199
Staphylococcus aureus strains (Ngwoke et al. 2014). In another study, paradol (1), shogaol (2) and gingerol
(3) isolated from the seed have showed anti-inflammatory activity in a rat paw edema model (Ilic et al.
2014). El-Halawany et al. (2014) have also reported that diarylheptanoid, 8-dehydrogingerdione, 6-
dehydroparadol, dihydrogingerenone, 6-gingerol, dihydroparadol, paradol and 6-shogaol demonstrated
hepato-protective and anti-oxidative actions in CCl4 induced acute liver injury in rats.
Xylopia aethiopica (Dunal) A. Rich. (Annonaceae) also known as Ethiopian pepper is an
indigenous spice widely distributed in almost all parts of Africa. The fruit is popularly used as a condiment
in many local dishes by different traditions in Africa and Asia (Kingsley, 2012). In addition, X. aethiopica
fruit is widely used locally in the treatment of various ailments and as an excipient to many other medicines
(Freiesleben et al. 2015). In Nigerian, Guinean, Togolese and Senegalese traditional medicines, the fruit
decoction is widely used in the treatment of diabetes (Soladoye et al. 2012; Diallo et al. 2012; Karou et al.
2011; Diéye et al. 2008). Moreover, previous studies have shown that various extracts from X. aethiopica
fruit possessed anti-cancer (Kuete et al. 2013; 2011; Choumessi et al. 2012), anti-fertility (Nwangwa, 2012),
anti-sickling (Uwakwe and Nwaoguikpe, 2008), anti-microbial (Esekhiagbe et al. 2009), anti-oxidative
actions and inhibits the activities of carbohydrate hydrolyzing enzymes in vitro (Adefegha and Oboh,
2012a,c; 2011; Etoundi et al. 2010; Odukoya et al. 2005; George and Osiama, 2011). Previously, diterpene
kaurenoids isolated from X. aethiopica fruit exhibited hypotensive and diuretic effects in rats (Somova et
al. 2001).
Capsicum annuum L. (Solanaceae) also known as red pepper is a spice that is readily available in
almost all parts of the world. The fruit is widely consumed in vast quantities as a flavoring agent in various
traditional foods (Khan et al. 2014). The fruit is locally used as a blood tonic, stimulant and in the treatment
of nerve weakness or pain due to diabetes in some parts of Africa and Asia (Iwu 2014; Jayakumar et al.
2010). Studies reported earlier indicated that C. annuum fruit extracts exhibited potent anti-microbial
(Santos et al. 2012; Careaga et al. 2003), anti-diabetic (Monsereenusorn, 1980), anti-nociceptive and anti-
inflammatory (Hernández-Ortega et al. 2012), anti-oxidative and inhibitory effects against α-glucosidase
activities (Tundis et al. 2011; 2013; Kwon et al. 2007; Materska and Perucka, 2005; Reddy and Lokesh,
1992). In addition, consumption of the whole fruit extract or capsaicin was reported to attenuate
dyslipidemia, improve satiety and have an impact on the thermogenic effect in hyperlipidemic animals
(Kempaiah and Srinivasan 2006; Kawada et al. 1986; Sambaiah et al. 1978). Capsaicin and
dihydrocapsaicin isolated from C. annuum fruit have demonstrated α-amylase and α-glucosidase inhibitory
actions (Tundis et al. 2013). Moreover, the volatile oil derived from C. annuum fruit also exhibited excellent
anti-parasitic effects against Anopheles gambiae (Dadji et al. 2011).
Our recent findings have shown that, A. melegueta ethyl acetate, X. aethiopica acetone and C.
annuum acetone fractions from the fruit exhibited anti-hyperglycemic and anti-hyperlipidemic actions,
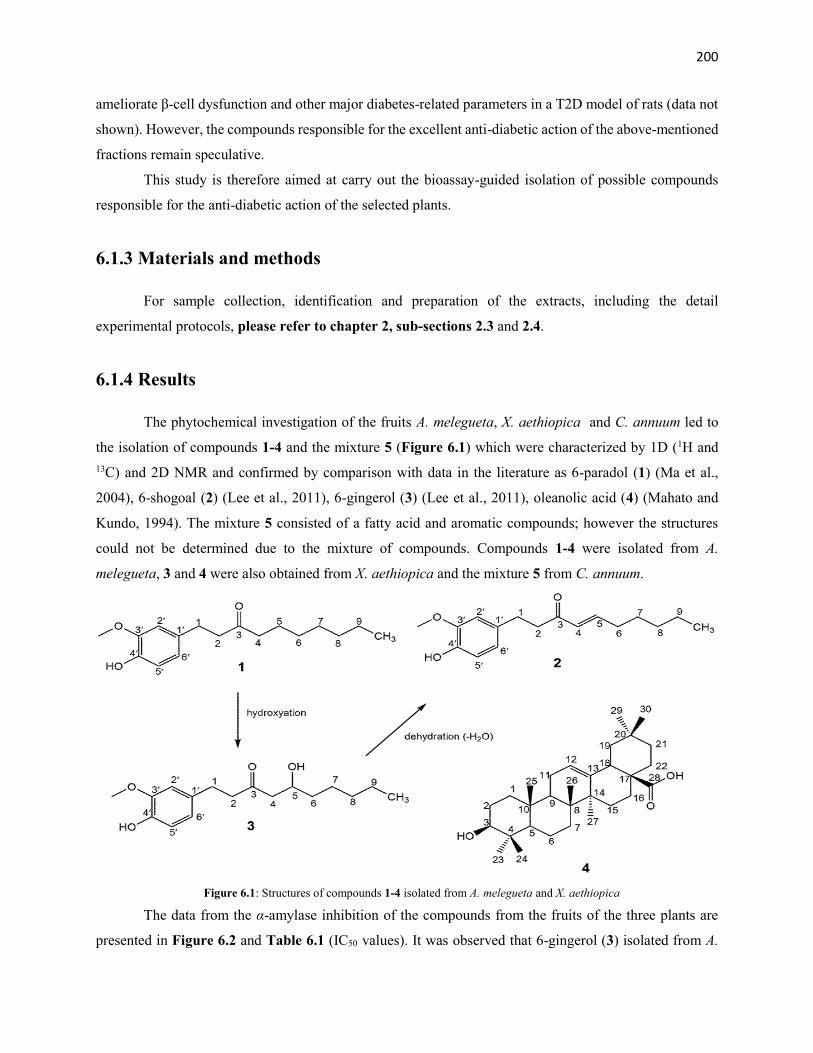
200
ameliorate β-cell dysfunction and other major diabetes-related parameters in a T2D model of rats (data not
shown). However, the compounds responsible for the excellent anti-diabetic action of the above-mentioned
fractions remain speculative.
This study is therefore aimed at carry out the bioassay-guided isolation of possible compounds
responsible for the anti-diabetic action of the selected plants.
6.1.3 Materials and methods
For sample collection, identification and preparation of the extracts, including the detail
experimental protocols, please refer to chapter 2, sub-sections 2.3 and 2.4.
6.1.4 Results
The phytochemical investigation of the fruits A. melegueta, X. aethiopica and C. annuum led to
the isolation of compounds 1-4 and the mixture 5 (Figure 6.1) which were characterized by 1D (1H and 13C) and 2D NMR and confirmed by comparison with data in the literature as 6-paradol (1) (Ma et al.,
2004), 6-shogoal (2) (Lee et al., 2011), 6-gingerol (3) (Lee et al., 2011), oleanolic acid (4) (Mahato and
Kundo, 1994). The mixture 5 consisted of a fatty acid and aromatic compounds; however the structures
could not be determined due to the mixture of compounds. Compounds 1-4 were isolated from A.
melegueta, 3 and 4 were also obtained from X. aethiopica and the mixture 5 from C. annuum.
Figure 6.1: Structures of compounds 1-4 isolated from A. melegueta and X. aethiopica
The data from the α-amylase inhibition of the compounds from the fruits of the three plants are
presented in Figure 6.2 and Table 6.1 (IC50 values). It was observed that 6-gingerol (3) isolated from A.

201
melegueta and X. aethiopica exhibited the lowest IC50 value (156.96±12.23 µM), significantly lower
(p<0.05) compared to 1, 2 and the mixture 5 from C. annuum (Table 6.1). However, the IC50 of oleanolic
acid (4) (91.72 ± 1.63 µM) was significantly lower (p<0.05) than the 6-gingerol (3). The IC50 values of
compounds 2-4 were significantly lower (p<0.05) than the standard acarbose (580.77 ± 20.71 µM), when
the IC50 value (664.56 ± 11.58 µM) of 6-paradol (1) was higher compared to the acarbose (Table 6.1). In
addition, the IC50 value depicted by the mixture (5) was found to be 124.95±6.38 µg/ml.
Figure 6.2: α-amylase Inhibition (%) of compounds isolated from A. melegueta, X. aethiopica and C. annuum fruits. Data are
presented as mean ± SD of triplicate determinations. a-e Values with different letters presented for a given concentration for each
extract are significantly different from each other.
Table 6.1: IC50 values of bioactive compounds isolated from the A. melegueta and X. aethiopica fruit in
anti-diabetic models.
Compounds
IC50 (µM)
α-amylase inhibition α-glucosidase inhibition
A. melegueta/X. aethiopica
6-Paradol (1) 664.56 ± 11.58e 243.32 ± 6.65c
6-Shagaol (2) 443.17 ± 1.38c 326.11 ± 5.60d
6-Gingerol (3) 156.96 ± 12.23b 104.34 ± 3.99b
Oleanolic acid (4) 91.72 ± 1.63a 47.10 ± 0.42a
Acarbose 580.77 ± 20.71d 327.74 ± 9.88d Data are presented as mean ± SD values of triplicate determinations. a-d Different superscript letters presented within a column for
a given parameter are significantly different from each other (Tukey’s-HSD multiple range post hoc test, p < 0.05).
a
aa
b
a
a
c
c
d
c
ed
c
cd
d
b
bb
c
a
aa a
0102030405060708090
30 60 120 240
Alp
ha a
myl
ase
inhi
bitio
n (%
)
Concentration (µg/ml)
6-Paradol 6-Shagaol 6-GingerolOleanolic acid Compound 5 Acarbose
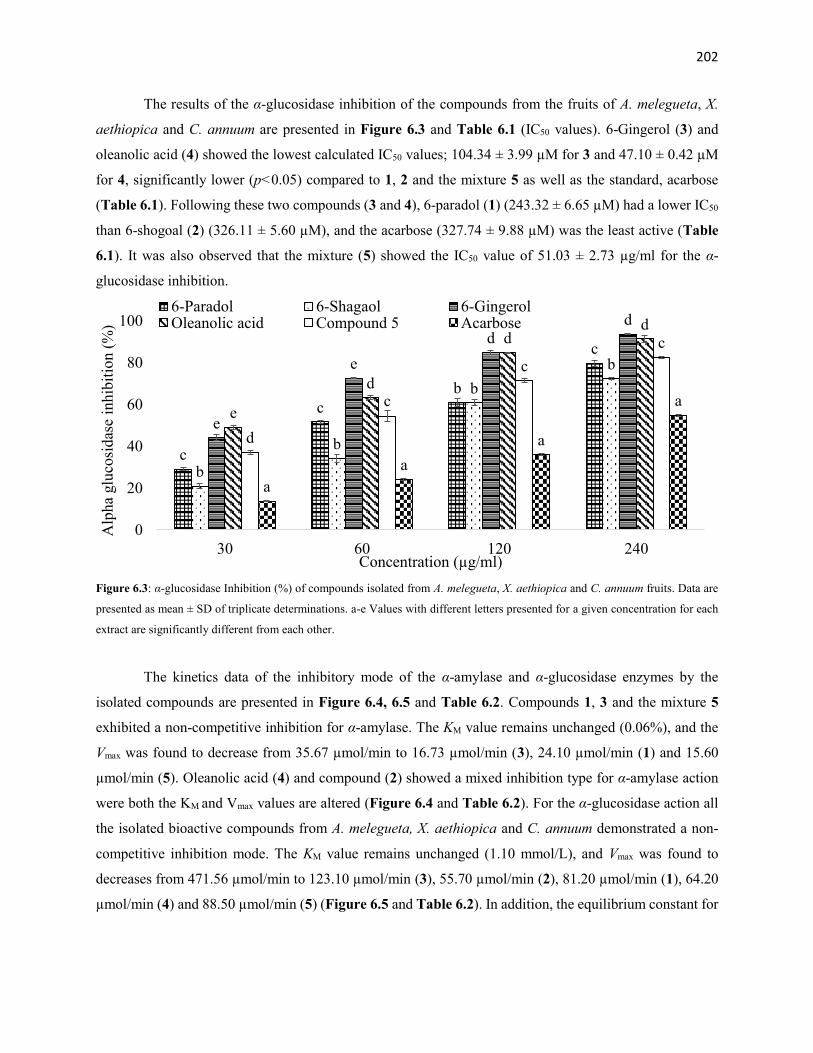
202
The results of the α-glucosidase inhibition of the compounds from the fruits of A. melegueta, X.
aethiopica and C. annuum are presented in Figure 6.3 and Table 6.1 (IC50 values). 6-Gingerol (3) and
oleanolic acid (4) showed the lowest calculated IC50 values; 104.34 ± 3.99 µM for 3 and 47.10 ± 0.42 µM
for 4, significantly lower (p<0.05) compared to 1, 2 and the mixture 5 as well as the standard, acarbose
(Table 6.1). Following these two compounds (3 and 4), 6-paradol (1) (243.32 ± 6.65 µM) had a lower IC50
than 6-shogoal (2) (326.11 ± 5.60 µM), and the acarbose (327.74 ± 9.88 µM) was the least active (Table
6.1). It was also observed that the mixture (5) showed the IC50 value of 51.03 ± 2.73 µg/ml for the α-
glucosidase inhibition.
Figure 6.3: α-glucosidase Inhibition (%) of compounds isolated from A. melegueta, X. aethiopica and C. annuum fruits. Data are
presented as mean ± SD of triplicate determinations. a-e Values with different letters presented for a given concentration for each
extract are significantly different from each other.
The kinetics data of the inhibitory mode of the α-amylase and α-glucosidase enzymes by the
isolated compounds are presented in Figure 6.4, 6.5 and Table 6.2. Compounds 1, 3 and the mixture 5
exhibited a non-competitive inhibition for α-amylase. The KM value remains unchanged (0.06%), and the
Vmax was found to decrease from 35.67 µmol/min to 16.73 µmol/min (3), 24.10 µmol/min (1) and 15.60
µmol/min (5). Oleanolic acid (4) and compound (2) showed a mixed inhibition type for α-amylase action
were both the KM and Vmax values are altered (Figure 6.4 and Table 6.2). For the α-glucosidase action all
the isolated bioactive compounds from A. melegueta, X. aethiopica and C. annuum demonstrated a non-
competitive inhibition mode. The KM value remains unchanged (1.10 mmol/L), and Vmax was found to
decreases from 471.56 µmol/min to 123.10 µmol/min (3), 55.70 µmol/min (2), 81.20 µmol/min (1), 64.20
µmol/min (4) and 88.50 µmol/min (5) (Figure 6.5 and Table 6.2). In addition, the equilibrium constant for
c
cb
c
b
b
bb
e
ed
d
e
d
dd
d
c
cc
aa
a
a
0
20
40
60
80
100
30 60 120 240
Alp
ha g
luco
sida
se in
hibi
tion
(%)
Concentration (µg/ml)
6-Paradol 6-Shagaol 6-GingerolOleanolic acid Compound 5 Acarbose

203
inhibitor binding (Ki) of the compounds for α-glucosidase were lower compared to that of α-amylase (Table
6.2).
Table 6.2: Kinetic analysis of α-amylase and α-glucosidase inhibition by compounds isolated from the fruit
of A. melegueta, C. annuum and X. aethiopica in anti-diabetic models.
Compounds α-Amylase inhibition α-Glucosidase inhibition
KM (%) Vmax (µmol/min) Ki (µg/mL) KM (mM) Vmax (µmol/min) Ki (µg/mL)
Control 0.06 35.65 1.10 471.56
A. melegueta/
X. aethiopica
6-Paradol (1) 0.06 15.60 23.29 1.10 81.20 6.24
6-Shagaol (2) 0.09 24.10 62.33 1.10 55.70 4.02
6-Gingerol (3) 0.06 16.73 26.46 1.10 123.10 7.83
Oleanolic acid (4) 0.13 273.00 59.25 1.10 64.20 4.73
C. annuum
Compound (5) 0.06 20.40 40.00 1.10 88.50 6.93

204
Figure 6.4. Lineweaver-Burke plot for α-amylase in the absence and presence of the inhibitors (bioactive compounds).
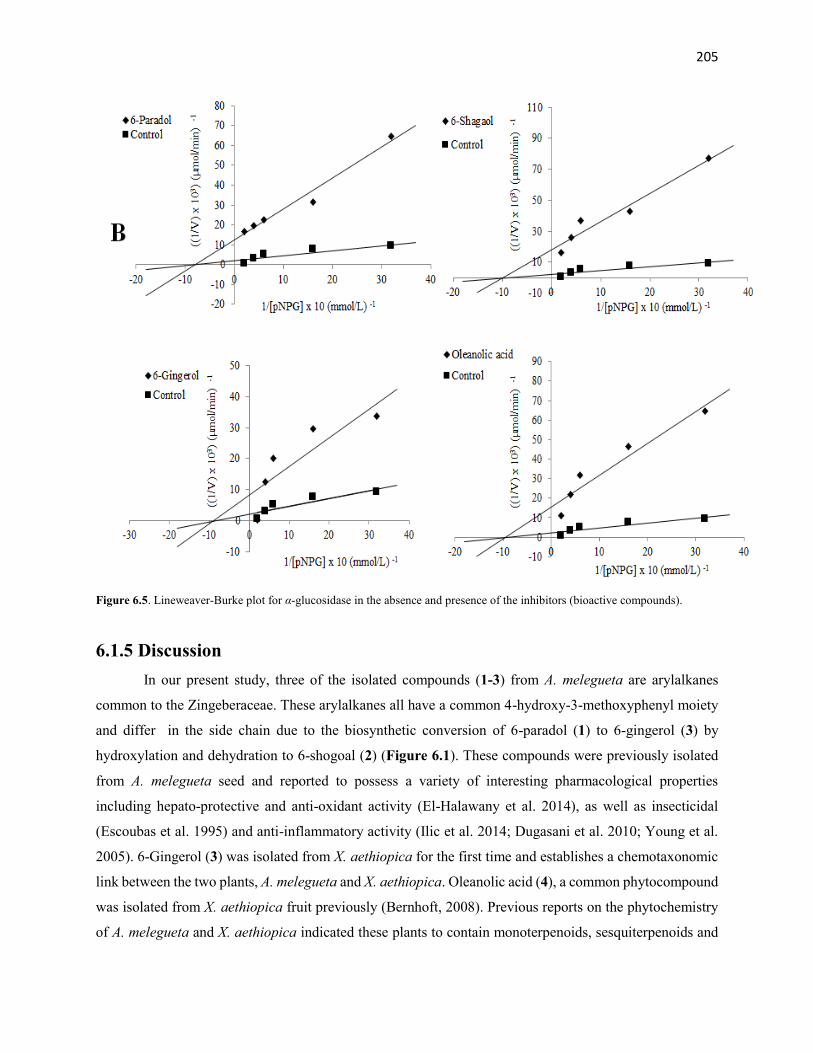
205
Figure 6.5. Lineweaver-Burke plot for α-glucosidase in the absence and presence of the inhibitors (bioactive compounds).
6.1.5 Discussion
In our present study, three of the isolated compounds (1-3) from A. melegueta are arylalkanes
common to the Zingeberaceae. These arylalkanes all have a common 4-hydroxy-3-methoxyphenyl moiety
and differ in the side chain due to the biosynthetic conversion of 6-paradol (1) to 6-gingerol (3) by
hydroxylation and dehydration to 6-shogoal (2) (Figure 6.1). These compounds were previously isolated
from A. melegueta seed and reported to possess a variety of interesting pharmacological properties
including hepato-protective and anti-oxidant activity (El-Halawany et al. 2014), as well as insecticidal
(Escoubas et al. 1995) and anti-inflammatory activity (Ilic et al. 2014; Dugasani et al. 2010; Young et al.
2005). 6-Gingerol (3) was isolated from X. aethiopica for the first time and establishes a chemotaxonomic
link between the two plants, A. melegueta and X. aethiopica. Oleanolic acid (4), a common phytocompound
was isolated from X. aethiopica fruit previously (Bernhoft, 2008). Previous reports on the phytochemistry
of A. melegueta and X. aethiopica indicated these plants to contain monoterpenoids, sesquiterpenoids and
206
diterpenoids (Moreira et al. 2013; Tane et al. 2005). The isolation of oleanolic acid (4) a pentacyclic
triterpene from A. melegueta fruit is not surprising since it is found quite commonly in the plant kingdom.
Oleanolic acid is quite active pharmacologically, having anti-oxidant, anti-inflammatory and anti-diabetic
activity (Pollier and Goossens, 2012).
The preferred method for screening anti-diabetic agents used recently involves the inhibition of
carbohydrate hydrolyzing enzymes such as α-amylase and α-glucosidase with the aim of controlling
postprandial hyperglycemia. Inhibitors of these enzymes decrease the breakdown of complex carbohydrates
to absorbable monosaccharides such as glucose (Imam, 2015). The isolated arylalkanes have not been tested
previously on α-amylase and α-glucosidase, however previous reports have shown that compound 6-
shogoal (2) and 6-gingerol (3) might play a crucial role in the treatment and control of T2D. Singh et al.
(2009) reported that treatment of 6-gingerol (3) (100 mg/kg bw) to db/db mice for 12 days resulted in anti-
hyperglycemic, anti-hyperlipidemic and anti-oxidant action. In another study, 6-gingerol (3) (10 µM) was
shown to attenuate β-amyloid-induced oxidative cell death in SH-SY5Y cell lines (Lee et al. 2011).
Chakraborty et al. (2012) have shown that, 6-gingerol (3) (50 and 75 mg/kg bw) down-regulate the over-
expression of TNF-α and IL6 in sodium arsenate intoxicated mice via up-regulation of GLUT4, IRS-1, IRS-
2, PI3K, AKT, PPARα signaling molecules. 6-Shogoal (2) and 6-gingerol (3) (10 µM) were reported to
inhibit the TNF-α mediated downregulation of adiponectin expression in 3T3-L1 adipocytes (Isa et al.
2008). Interestingly, our present data support the studies mentioned above and further show the contribution
of 1-3 to T2D treatment as they exhibited considerable inhibitory action on α-amylase and α-glucosidase
(Table 6.1). The lowest calculated IC50 values of (3) (α-amylase: 156.96 ± 12.23 µM; α-glucosidase: 104.34
± 3.99 µM) indicates that this is the most suitable candidate for an anti-diabetic drug compared to the other
isolated compounds.
Oleanolic acid (4) was shown to have an inhibitory effect on α-amylase and α-glucosidase. Ali et
al. (2002) reported an IC50 value of 11.16 ± 0.49 µM for 4 on α-glucosidase. Most recently, an IC50 value
of 3.8 ± 0.2 µM on α-glucosidase was repoted by Guo et al. (2013). Komak et al. (2003) reported inhibitory
activity of 4 against α-amylase with an IC50 of 154.89 µM. The IC50 values of oleanolic acid obtained in
this study was 59.22 ± 1.05 µg/mL for α-amylase and 91.72 ± 1.63 µM for α-glucosidase. These values
were lower than the standard acarbose (α-amylase: 580.77 ± 20.71 µM; α-glucosidase: 327.74 ± 9.88 µM)
and that reported by Komak et al. (2003) for α-amylase action (154.89 µM). These results support previous
findings, which have shown the ability of oleanolic acid (4) to improve blood glucose tolerance in mice fed
a high-fat diet as well as enhance insulin secretion in pancreatic β-cells (Castellano et al. 2013; de Melo et
al. 2010; Teodoro et al. 2008).
The kinetic parameters derived from the double reciprocal plot revealed that the mode of α-amylase
and α-glucosidase inhibitory activity exhibited by 1-5 is either non-competitive or of the mixed inhibition

207
type (Figure 6.4, 6.5 and Table 6.2). It is therefore suggested that these compounds bind to other site(s),
apart from the active site of the enzyme, which induces a conformational change in the three-dimensional
structure of the enzymes and ultimately slows down its activity (Mahomoodally and Muthoora, 2014). The
equilibrium constant for inhibitor binding (Ki) of the compounds were lower for α-glucosidase than α-
amylase, indicating greater stability of the enzyme-substrate complex for α-glucosidase compared to α-
amylase (Table 6.2).
Structure-activity relationship reported in the literature for the arylalkanes state that the 4-hydroxy-
3-methoxyphenyl moiety and C-3 carbonyl group of the aliphatic side chain are crucial for the activity of
these compounds (El-Halawany et al. 2014). It is also suggested that the presence of the β-OH at C-5 in 6-
gingerol (3) or α,β-unsaturated double bond in 6-shogoal (2) of the aliphatic side chain significantly
increases the α-amylase and α-glucosidase inhibitory activity. In oleanolic acid (4), the hydroxyl at C-3 and
the carboxyl group (C-28) are essential for its activity (Matsuda et al. 1998).
6.1.6 Conclusion
In conclusion, the results of the present study indicate that 6-gingerol (3) and oleanolic acid (4)
isolated from the fruit of A. melegueta and X. aethiopica demonstrate better α-amylase and α-glucosidase
inhibitory activity compared to the other isolated compounds and could be a good lead for an anti-diabetic
drug. The anti-diabetic activity of the fruit of A. melegueta and X. aethiopica is attributed to these active
ingredients. Further clinical and detailed toxicological studies are required to fully establish the potency of
the isolated bioactive compounds.
208
CHAPTER 7
7.0 General discussion, conclusion and recommendations
7.1 General discussion
Africa is among the regions endowed with the richest biodiversity in the world, with an abundance
of many plants that could provide a new lead for treatment of several diseases including diabetes mellitus
(DM). In our present study, three (3) African medicinal plants [Aframomum melegueta K. Schum.,
Xylopia aethiopica (Dunal.) A. Rich. and Capsicum annuum L.] were selected based on their traditional
uses in the treatment of DM.
According to the literatures, several extraction methods of plant-derived products are available that
include hot percolation, supercritical fluid extraction, soxhlet extraction and cold extraction among others
(Brusotti et al. 2014; Harborne, 1998; Hostettmann et al. 1991). In our present study, the cold extraction
technique was employed due to easeful extraction method and no heating is required. This allows most
ingredients present in the plant samples to be extracted with low possibility of degradation (Heinrich et al.
2012). This is of enormous interest as the bioactivity of plant-derived extracts depends entirely on the
presence of compounds such terpenoids, alkaloids and polyphenols to mention a few. Additionally, the
amount of the bioactive compounds depends on the polarity of the extracting solvents as well.
In a number of previous studies, the most polar solvent extracts such as ethanolic (EtOH) and
aqueous from the fruit of A. melegueta, X. aethiopica and C. annuum were reported to be rich in phenolic
contents (Tundis et al. 2013; Adefegha and Oboh, 2012a, c; 2011; Etoundi et al. 2010; Deepa et al. 2007).
This is in line with our present data (Tables 3.1, 4.1 and 5.1). In addition, the higher phenolic contents of
the fruits than other parts (leaves, stems and roots) could be influenced by several factors including genetic
and environmental factors (nature of the soil, high temperature and rain fall) (Mamphiswana et al. 2010;
Pandey and Rizvi, 2009). Furthermore, it was observed from the results that higher phenolic content were
available in the most polar solvent fractions (acetone and ethyl acetate (EtAOc)) after partitioning of the
crude EtOH extracts (Tables 3.4, 4.4 and 5.4). This could be due to the greater polarity of these solvents
than other less polar solvents (hexane and dichloromethane). While not discounting the contributions of
other compounds, our interest in determining the phenolic contents was due to the fact that several
therapeutic potentials of plant-derived products such as anti-oxidative action are attributed to their rich-
phenolic contents (Gülçin, 2012; Ferrazzano et al. 2011). Therefore, phenolics may play a significant role
in the amelioration of oxidative damages associated with many disease conditions such as T2D.
209
In the pathogenesis of T2D, increased generation of reactive oxygen species (ROS) due to
hyperglycemia is considered as a major contributor for oxidative as well as associated complications
(Pazdro and Burgess, 2010). A number of previous studies supported the contribution of anti-oxidants in
attenuating the complications associated with diabetes (McCune and Johns, 2007; Rahimi et al. 2005;
McCune and Johns, 2002). However, the increasing risk associated with the use of existing synthetic anti-
oxidants has been an issue of concern. This cause a shift to the use of plant-derived anti-oxidants in
preventing oxidative damage either in disease condition or food preservation. Moreover, several methods
are used to assess the anti-oxidative potential of plant-derived products due to the diverse nature of the
ROS. In our present study, DPPH radical scavenging activity, ferric (Fe3+) reducing anti-oxidant power and
inhibition of hemoglobin glycation were used to evaluate the anti-oxidative action of the extracts and/or
fractions derived from the plants under this study. The anti-oxidative effectiveness of various solvent
extracts was assessed base on the calculated IC50 values.
In some previous studies, various extracts from these plants demonstrated anti-oxidative activity.
The A. melegueta seed acetone and aqueous extracts (Adefegha and Oboh, 2012a, b; Kazeem et al. 2012),
X. aethiopica fruit aqueous extract (Adefegha and Oboh, 2012a, c; 2011; Odukoya et al. 2005) and C.
annuum fruit aqueous, methanolic and EtOH extracts (Azeez et al. 2012; Chen et al. 2012; Tundis et al.
2012; Perucka and Materska, 2007; Conforti et al. 2007; Kwon et. 2007) were reported to demonstrate
excellent anti-radical (IC50: 100-400 µg/mL) as well as anti-glycation (IC50 >100 µg/mL) activities in vitro.
However, most of the above-mentioned studies did not evaluate the anti-oxidative activities of the extracts
and fractions from the different parts of the plants which have been done in our study. The results of above-
mentioned studies are also in line with the results of our present data (Tables 3.5, 4.5, and 5.5). Therefore,
the data of our study suggest that most active extracts or fractions contained active ingredients with high
redox potentials that could reasonably quench the activities of ROS and other radicals released due to the
disease condition.
On the other hand, plant-derived products have been reported to demonstrate inhibitory effect
against α-glucosidase and α-amylase activities (Xiao et al. 2013a,b; Elya et al. 2012; Rastija et al. 2012;
Sudha et al. 2011). These are key enzymes involved in the metabolism of complex carbohydrates to
absorbable monosaccharides. Inhibition of the activities of these enzymes limit the release of dietary
monosaccharide (glucose) and subsequent absorption via the intestinal brush border, thereby controlling
postprandial hyperglycemia in T2D. Hence, this strategy is recently employed as a treatment option of T2D.
According to the previous data, A. melegueta seed aqueous extract (Adefegha and Oboh, 2012a, b), X.
aethiopica fruit aqueous extract (Adefegha and Oboh, 2012a; Etoundi et al. 2010) and C. annuum fruit
EtOH extract (Tundis et al. 2013; 2012; Kwon et. 2007) exhibited inhibitory effect against α-glucosidase
(IC50: 0.005-5 mg/mL) and α-amylase (IC50: 0.05-3 mg/mL) actions, which agree with the data of our

210
present study (Tables 3.2, 4.2, and 5.2). Interestingly, the inhibitory action against α-glucosidase (IC50: 40-
90 µg/mL) and α-amylase (IC50: 60-170 µg/mL) actions exhibited by the fractions in our present study were
the least (Tables 3.5, 4.5, and 5.5) compared to the previously published studies (Tundis et al. 2013; 2012;
Adefegha and Oboh, 2012a, b; Etoundi et al. 2010; Kwon et. 2007). This shows that fractionation of the
crude extracts further increases the activities of the extracts.
Moreover, analysis of the mode of inhibition exhibited by the most active fractions revealed that
EtAOc fraction from A. melegueta and acetone fractions from X. aethiopica and C. annuum fruits
demonstrated non-competitive or mixed inhibitions towards α-glucosidase and α-amylase actions (Figures
3.13, 4.12, 5.14). This again is in accordance with the mode of inhibition exhibited by several phenolic
compounds reported previously (Rastija et al. 2012). In these types of inhibition the inhibitor binds to other
site (s), apart from the active site of the enzyme, and causes some conformational changes in the three-
dimensional structure of the enzyme that slows down the activity of the enzyme (Mahomoodally and
Muthoora, 2014).
Based on the higher anti-oxidative and anti-diabetic effects of the most active extracts and fractions,
they were subjected to GC-MS analysis. The objective of conducting GC-MS analysis was to identify the
small organic secondary metabolites and possibly to find a link between these organic molecules and the in
vitro anti-diabetic and anti-oxidative actions of the extracts and fractions. In addition, the data revealed the
type of compounds present in the fractions under this study. Most small molecular weight compounds
detected were volatile and identified by their fragmentation pattern based on the data from the NIST library
(Tables 3.2, 3.5, 4.2, 4.5, 5.2, and 5.5). Interestingly, 4-hydroxy-3-methoxyphenyl derivatives including
some terpenoids were observed to be available from the GC-MS analysis of the most active fractions, which
confirmed the type of bioactive compounds present in these fractions. Finally, the fractions with higher in
vitro anti-diabetic and anti-oxidative actions (A. melegueta EtAOc fraction (AMEF) and X. aethiopica
acetone fractions (XAAF) and C. annuum acetone fractions (CAAF) from fruits) were selected for the in
vivo studies to further confirm their potentials.
The in vivo anti-diabetic and anti-oxidative actions were investigated in a fructose-fed
streptozotocin (STZ)-induced T2D model of rats through 4 weeks oral intervention period. The high
fructose feeding followed by low-dose STZ (40 mg/kg bw) injection was reported to induce the 2 major
pathological features of T2D, insulin resistance and β-cell failure (Wilson and Islam, 2012). It is postulated
that the fructose feeding stimulate lipolysis from the adipocytes, which promote the activity of HMG-CoA
reductase and decrease lipoprotein lipase action (De Silva and Frayling, 2010; Hotamisligil, 2000). This
leads to the elevation of TG and TC levels that induce insulin resistance. Furthermore, the selective affinity
of STZ to the pancreatic β-cells leads to DNA alkylation that induces free radical formation, which target
211
the DNA sugar residue and result in DNA strand breakage (KunduSen et al. 2011). This leads to pancreatic
β-cell damage as well as hyperglycemia in T2D.
It has been reported that polyphagia, polydipsia and weight loss are classical symptoms of T2D,
possibly attributed to the increased energy expenditure, urinary excretion and catabolic processes in diabetic
condition (ADA, 2015; Kamalakkannan and Prince, 2006). These effects were evidently observed in the
diabetic group (DBC) compared to the normal control (NC) group. However, oral treatment of fractions at
both dosages (150 and 300 mg/kg bw) significantly decreased these alterations which was comparable to
diabetic metformin (DMF) treated group (Figures 3.15, 3.16, 4.14, 4.15, 5.16 and 5.17). This indicates a
recovery from the diabetes-induced alterations in the feeding habit of the diabetic-treated animals, which
was further supported by the significant decrease in hyperglycemia in diabetic treated groups.
Persistent hyperglycemia and lack of glucose tolerance ability are the major contributors of most
of the complications associated with T2D (Monnier et al. 2006). In some preliminary studies, it has been
reported that the treatment of aqueous extracts from A. melegueta seed (200-400 mg/kg bw/2 weeks), X.
aethiopica fruit (400 mg/kg bw/2 hours) and C. annuum fruit (500-700 mg/kg bw/2 hours) demonstrated
blood glucose lowering effects in alloxan-induced diabetic, high sucrose-fed and normal rats, respectively
(Etoundi et al. 2013; Adesokan et al. 2010; Monsereenusorn, 1980). However, the major limitations with
above-mentioned previous studies include short treatment periods, lack of proper control groups and the
type of animal models used, which have been considered in our present study. Our data showed better anti-
hyperglycemic action (Figures 3.17, 3.18 and 4.16) and glucose tolerance ability (Figures 5.18 and 5.19)
in the diabetic treated groups compared to the previously reported studies (Etoundi et al. 2013; Adesokan
et al. 2010; Monsereenusorn, 1980). Additionally, the better anti-hyperglycemic action of the fractions
might be correlated to potent α-glucosidase and α-amylase inhibitory effects exhibited by these fractions
that limit the absorption of dietary glucose in to the blood stream and thus, reduced hyperglycemia. Another
assumption is that the active ingredients from the fractions might stimulate the regeneration of pancreatic
β-cells in the diabetic animals due to their strong anti-oxidative nature. This speculation was supported by
the increased serum insulin levels and improved pancreatic morphology and β-cell function in the diabetic
treated animals.
In prolong uncontrolled T2D, loss of pancreatic β-cell function and the insulin resistance lead to
decrease in serum insulin level as well as damage to the pancreatic architecture (Bonner-Weir and O'Brien,
2008; Nattrass and Bailey, 1999). These effects were prominent in the DBC group than the NC group
(Figures 3.19 4.18 and 5.20; Tables 3.7, 4.7 and 5.7). The DBC group had a smaller islet and
morphologically deformed β-cells with higher fatty infiltrations (Figures 3.19 4.18 and 5.20). However,
oral administration of the fractions especially at the higher dose (300 mg/kg bw/day) significantly decreased
insulin resistance, improved β-cell function and serum insulin level to near normal and were comparable to

212
the DMF group. This further display the anti-diabetic action of the plants used in our present study that was
not yet previously reported. Therefore, the ability of AMEF, XAAF and CAAF to increase serum insulin
levels might facilitate the passage of glucose across the membrane into the target cells and thereby attenuate
hyperglycemia in diabetic treated animals. Furthermore, these effects might also be linked to the excellent
in vitro anti-oxidative actions of the fractions, which is again supported by the potent reduced serum
fructosamine levels in the diabetic treated groups (Tables 3.7, 4.7 and 5.7).
On the other hand, long term pathological features of T2D may include elevation of hepatic
glycogen content and increased liver weight (Paschos and Paletas, 2009). In our present study, these kind
of alterations observed in the DBC group might be attributed to fructose feeding that triggers hepatic
glycogenesis via stimulation of glucose-6-phosphatase activity and cause higher accumulation of glycogen
in the liver despite low circulating serum insulin (Ciudad et al. 1988). However, AMEF and XAAF
treatment to diabetic animals reverted these effects near to normal, when no significant alterations were
observed in the treated non-diabetic animals (Tables 3.8, 4.8 and 5.8). The results were further supported
by the excellent attenuation of dyslipidemia in the diabetic treated animals (Tables 3.9, 4.9 and 5.9).
Previous data have strongly correlated insulin resistance in the etiology of dyslipidemia in T2D.
Decrease in circulating serum insulin lead to lipoprotein lipase inactivation thereby causing lipid
abnormalities (Verma et al. 2013). The most frequently observed diabetes-induced lipid alterations include
elevation of serum TG and TC levels with concomitant reduction of HDL-cholesterol level. Furthermore,
according to some previous studies, aqueous extracts from A. melegueta seed, X. aethiopica and C. annuum
fruits showed lipid lowering potentials ethanol-induced hepatotoxic, hypercholesterolemic and normal rats,
respectively (Nwozo and Oyinloye, 2011; Nwozo et al. 2011; Monsereenusorn, 1983), with no data on any
diabetic-induced animal models. However according to our present data, the potent anti-hyperlipidemic
effect in the diabetic treated groups further contribute to the anti-diabetic action of AMEF, XAAF and
CAAF in diabetic-induced animal model. In addition, the reduction was more pronounced in groups treated
with the higher dose of the fractions and comparable to the DMF group (Tables 3.9, 4.9 and 5.9). Moreover,
the excellent decrease of the coronary risk index (CRI) and atherogenic index (AI) further support the
effects of the fractions in ameliorating dyslipidemia in type 2 diabetic animals (Tables 3.9, 4.9 and 5.9).
Therefore, it is suggested that the elevation of serum insulin level observed in the diabetic treated groups
might be directly activated lipoprotein lipase activity, which promoted lipolysis and thus attenuated
dyslipidemia. Our data are again supported by the reduction of serum indices of liver, heart and kidney in
the diabetic treated groups compared to the DBC group (Tables 3.10, 4.10 and 5.10).
It has been highlighted that in some disease conditions such as T2D, elevation of serum ALT, AST,
ALP, creatinine, urea, LDH and CK-MB into blood circulation induces hepatic injuries, myocardial
infarction and functional disturbance of hepatic and renal tissues (Abolfathi et al. 2012; Jaramillo-Juarez et

213
al. 2008). These effects were evidently observed in the DBC group of our study (Tables 3.10, 4.10 and
5.10). However, oral administration of the AMEF, XAAF and CAAF (300 mg/kg bw) significantly
ameliorated the serum elevations of ALT, ALP, creatinine, urea, LDH and CK-MB indicating their possible
hepato-protective, cardio-protective and reno-protective effects (Tables 3.10, 4.10 and 5.10). It was
observed from our data that serum AST level was not affected by the diabetes. In comparison with ALT,
AST is less specific for the detection of hepatic injury (Center, 2007). This is partly due to the fact that the
half-life of ALT is much longer compared to AST in experimental animals (Ramaiah, 2007; Meyer and
Harvey, 2004). Therefore, in a condition of acute liver injury, there will be an increase in both serum ALT
and AST levels. However, the serum AST level may likely return to normal more rapidly compared to the
level of serum ALT, which makes ALT more sensitive in assessing hepatic damage in disease conditions
(Ramaiah, 2007; Meyer and Harvey, 2004). The excellent hepato-protective, cardio-protective and reno-
protective effects observed might be also attributed to the potent anti-oxidative action in vitro as exhibited
by the fractions.
Moreover, in vivo anti-oxidative action of the various fractions was extended to further support the
in vitro anti-oxidative effects. Our present data are the first to comprehensively reveal the anti-oxidative
action of the extracts or fractions from A. melegueta seed, X. aethiopica and C. annuum in vivo. It has been
highlighted that chronic uncontrolled hyperglycemia leads to increased production of ROS as well as
declined of in vivo anti-oxidant defense system referred as oxidative stress. This results to increase lipid
peroxidation that impaired cellular function by inducing osmotic stress and thereby alters the activity of
membrane-bound enzymes and receptors (Verma et al. 2013). The observed elevation of lipid peroxidation
(expressed as MDA equivalent) in DBC group were attenuated in the diabetic treated groups in the serum
and organs (liver, kidney, heart and pancreas) in dose-depended manner (Figure 3.20, 4.19 and 5.21),
attributed to the potent anti-oxidative action of the fractions in vitro. The data support the improved
pancreatic β-cell morphology in the diabetic treated animals (Figures 3.19 4.18 and 5.20) that again
correlated to the increase in both enzymatic and non-enzymatic in vivo anti-oxidants defense system in the
diabetic treated groups.
The α-tocopherol, ascorbic acid, bilirubin and reduced glutathione (GSH) are considered as non-
enzymatic in vivo anti-oxidant molecules. The GSH plays a crucial role in modulating the oxidative
damages induced due to increased lipid peroxidation (Rahimi et al. 2005). According to our present data,
the marked reduction of GSH levels in serum and organs of the DBC group were augmented in the diabetic
treated groups (Figure 3.21, 4.20 and 5.22). Therefore, it is suggested that AMEF, XAAF and CAAF
improve the anti-oxidant activity by stimulating the biosynthesis of GSH that prevented and terminated the
lipid peroxidation in the treated diabetic animals.

214
The levels of the enzymatic anti-oxidants, superoxide dismutase (SOD), catalase (CAT),
glutathione peroxidase (GPx) and glutathione reductase (GR) of the DBC group were observed to decrease
in the serum and the organs as well. This might be due to the hyperglycemia-induced oxidative stress in the
diabetic condition as reported earlier (Verma et al. 2013; Sreelatha and Inbavalli, 2012; Gokce and
Haznedaroglu, 2008). However, the increased activities of these enzymes in the diabetic treated groups
indicated the possible contribution of the constituents of the fractions in attenuating the deleterious action
of the lipid peroxidation and consequently reduced the MDA levels (Figure 3.22-3.25, 4.21-4.24 and 5.23-
5.26). Therefore, as suggested earlier, the potent anti-diabetic and anti-oxidative activities observed in both
in vitro and in vivo conditions in our present study are attributed to the bioactive compounds present in the
AMEF, XAAF and CAAF.
In our present study, three of the isolated compounds (1-3) from A. melegueta are arylalkanes
common to the Zingeberaceae. These arylalkanes all have a common 4-hydroxy-3-methoxyphenyl moiety
and differ in the side chain due to the biosynthetic conversion of 6-paradol (1) to 6-gingerol (3) by
hydroxylation and dehydration to 6-shogoal (2) (Figure 6.1). These compounds were previously isolated
from A. melegueta seed and reported to possess a variety of interesting pharmacological properties
including hepato-protective and anti-oxidant activity (El-Halawany et al. 2014), as well as insecticidal
(Escoubas et al. 1995) and anti-inflammatory activity (Ilic et al. 2014; Dugasani et al. 2010; Young et al.
2005). 6-Gingerol (3) and oleanolic acid (4) were isolated from X. aethiopica for the first time and
establishes a chemotaxonomic link between the two plants, A. melegueta and X. aethiopica (Bernhoft,
2008). Previous reports on the phytochemistry of A. melegueta and X. aethiopica indicated these plants to
contain monoterpenoids, sesquiterpenoids and diterpenoids (Moreira et al. 2013; Tane et al. 2005). The
isolation of oleanolic acid (4) a pentacyclic triterpene from A. melegueta fruit is not surprising since it is
found quite commonly in the plant kingdom. Oleanolic acid is quite active pharmacologically, having anti-
oxidant, anti-inflammatory and anti-diabetic activity (Pollier and Goossens, 2012).
The isolated arylalkanes have not been tested previously on α-amylase and α-glucosidase, which
have been done in our present study. However previous reports have shown that compound 6-shogoal (2)
and 6-gingerol (3) might play a crucial role in the treatment and control of T2D (Chakraborty et al. 2012;
Lee et al. 2011; Singh et al. 2009; Isa et al. 2008). Interestingly, our present data support the studies
mentioned above and further show the contribution of 1-3 to T2D treatment as they exhibited considerable
inhibitory action on α-amylase and α-glucosidase (Table 6.1). The lowest calculated IC50 values of (3) (α-
amylase: 156.96 ± 12.23 µM; α-glucosidase: 104.34 ± 3.99 µM) indicates that this is the most suitable
candidate for an anti-diabetic drug compared to the other isolated compounds.
According to some previous studies, oleanolic acid (4) was shown to have an inhibitory effect on
α-amylase and α-glucosidase (Guo et al. 2013; Komak et al. 2003; Ali et al. 2002). The IC50 values of

215
oleanolic acid obtained in our present study for α-amylase (91.72 ± 1.63 µM) and α-glucosidase (47.10 ±
0.42 µM) were significantly lower compared to the standard acarbose (α-amylase: 580.77 ± 20.71 µM; α-
glucosidase: 327.74 ± 9.88 µM). The results support previous findings, which have shown the ability of
oleanolic acid (4) to improve blood glucose tolerance in mice fed a high-fat diet as well as enhance insulin
secretion in pancreatic β-cells (Castellano et al. 2013; de Melo et al. 2010; Teodoro et al. 2008).
The kinetic parameters derived from the double reciprocal plot revealed that the mode of α-amylase
and α-glucosidase inhibitory activity exhibited by 1-5 is either non-competitive or of the mixed inhibition
type (Figure 6.4, 6.5 and Table 6.2). It is therefore suggested that these compounds bind to other site(s),
apart from the active site of the enzyme, which induces a conformational change in the three-dimensional
structure of the enzymes and ultimately slows down its activity (Mahomoodally and Muthoora, 2014). The
equilibrium constant for inhibitor binding (Ki) of the compounds were lower for α-glucosidase than α-
amylase, indicating greater stability of the enzyme-substrate complex for α-glucosidase compared to α-
amylase (Table 6.2).
Structure-activity relationship reported in the literature for the arylalkanes state that the 4-hydroxy-
3-methoxyphenyl moiety and C-3 carbonyl group of the aliphatic side chain are crucial for the activity of
these compounds (El-Halawany et al. 2014). It is also suggested that the presence of the β-OH at C-5 in 6-
gingerol (3) or α, β-unsaturated double bond in 6-shogoal (2) of the aliphatic side chain significantly
increases the α-amylase and α-glucosidase inhibitory activity. In oleanolic acid (4), the hydroxyl at C-3 and
the carboxyl group (C-28) are essential for its activity (Matsuda et al. 1998).
7.2 Overall conclusion
In conclusion, the results of our present study have shown that A. melegueta ethyl acetate fraction
(AMEF), X. aethiopica acetone fraction (XAAF) and C. annuum acetone fraction (CAAF) from fruits
demonstrated potent anti-diabetic and anti-oxidative actions in vitro and in vivo. The improved glucose
tolerance ability, insulin sensitivity and in vivo anti-oxidants status as well as amelioration of pancreatic β-
cell histology and β-cell functions are mechanisms via which AMEF, XAAF and CAAF exhibited anti-
diabetic action that were not previously reported. Hence, our findings suggest that AMEF, XAAF and
CAAF may provide an excellent anti-diabetic remedy with no considerable side effects. Moreover, our
present study establish that 6-paradol (1), 6-shagaol (2), 6-gingerol (3) and oleanolic acid (4) isolated and
purified from AMEF and XAAF are potential anti-diabetic drugs and the anti-diabetic action of A.
melegueta and X. aethiopica fruits is attributed to the presence of these compounds. This study also
confirmed the use of these plants as natural anti-diabetic medicine by African traditional healers.
216
7.3 Further research
On the basis of the findings of this study, it is recommended that:
i. Detail toxicological studies of the most active fractions (AMEF, XAAF and CAAF) and
the isolated bioactive compounds (6-gingerol, 6-shagaol, 6-paradol and oleanolic acid) are
required to further validate their safety
ii. Mechanistic-based in vitro studies are required to evaluate the mode of action of the active
fractions and the isolated compounds as well.
iii. Clinical studies are necessary to further confirm the effects in human subjects.

217
References
Abdallah, H.M., Salama, M.M., Abd-elrahman, E.H. and El-Maraghy, S.A. (2011). Antidiabetic activity of
phenolic compounds from Pecan bark in streptozotocin induced diabetic rats. Phytochemistry
Letters. 4: 337-341.
Abdel Motaal, A., Ezzat, S.M. and Haddad, P.S. (2011). Determination of bioactive markers in Cleome
droserifolia using cell-based bioassays for antidiabetic activity and isolation of two novel active
compounds. Phytomedicine. 19: 38-41.
Abdel-Zahera, A.O, Salima, S.Y., Assaf, M.H. and Abdel-Hady, R.H. (2005). Antidiabetic activity and
toxicity of Zizyphus spina-christi leaves. Journal of Ethnopharmacology. 101: 129-138.
Abdullahi, S. and Olatunji, G.A. (2010). Antidiabetic activity of Anacardium occidentale in alloxan-
diabetic rats. Journal of Science and Technology. 30: 35-41.
Abolfathi, A.A., Mohajeri, D., Rezaie, A. and Nazeri, M. (2012). Protective effects of green tea extract
against hepatic tissue injury in streptozotocin-induced diabetic rats. Evidence-Based
Complementary and Alternative Medicine. 2012: doi:10.1155/2012/740671.
Acharya, D. and Shrivastava, K. (2008). Indigenous herbal medicines: tribal formulations and traditional
herbal practices, Aavishkar Publishers Distributor, Jaipur-India. ISBN 9788179102527. pp 440.
Adamson, S.S. and Oboh, G. (2012). Aqueous extracts from unripe plantain (Musa paradisiaca) products
inhibit key enzymes linked with type 2 diabetes and hypertension in vitro. Jordan Journal of
Biological Sciences. 5: 239-246.
Adebajo, A.C., Ayoola, M.D., Odediran, S.A., Aladesanmi, A.J., Schmidt, T.J. and Verspohl, E.J. (2013).
Evaluation of ethnomedical claim III: anti-hyperglycaemic activities of Gongronema latifolium
root and stem. Journal of Diabetes. 5: 336-343.
Adebajo, A.C., Iwalewa, E.O., Obuotor, E.M., Ibikunle, G.F., Omisore, N.O., Adewunmi, C.O., Obaparusi,
O.O., Klaes, M., Adetogun, G.E., Schmidt, T.J. and Verspoh, E.J. (2009). Pharmacological
properties of the extract and some isolated compounds of Clausena lansium stem bark: Anti-
trichomonal, antidiabetic, anti-inflammatory, hepatoprotective and antioxidant effects. Journal of
Ethnopharmacology. 122: 10-19.
Adefegha, S.A. and Oboh, G. (2011).Water extractable phytochemicals from some Nigerian spices inhibit
Fe2+-induced lipid peroxidation in rat’s brain-in vitro. Journal of Food Processing and Technology.
2: http://dx.doi.org/10.4172/2157-7110.1000104.
Adefegha, S.A. and Oboh, G. (2012a). Inhibition of key enzymes linked to type-2 diabetes and sodium
nitroprusside-induced lipid peroxidation in rat pancreas by water extractable phytochemicals from
some tropical spices. Pharmaceutical Biology. 50: 857-865.

218
Adefegha, S.A. and Oboh, G. (2012b). Acetylcholinesterase (AChE) inhibitory activity, antioxidant
properties and phenolic composition of two Aframomum species. Journal of Basic Clinical
Physiology and Pharmacology. 23: 153-161.
Adefegha, S.A. and Oboh, G. (2012c). Effect of diets supplemented with Ethiopian pepper [Xylopia
aethiopica (Dun.) A. Rich (Annonaceae)] and Ashanti pepper [Piper guineense Schumach. et
Thonn (Piperaceae)] on some biochemical parameters in normal rats. Asian Pacific Journal of
Tropical Biomedicine. 2: S558-S566.
Barros, F., Dykes, L., Awika, J.M. and Rooney, L.W. (2013). Accelerated solvent extraction of phenolic
compounds from sorghum brans. Journal of Cereal Science. 58: 305-312.
Ademiluyi, A.O. and Oboh, G. (2013). Soybean phenolic-rich extracts inhibit key-enzymes linked to type
2 diabetes (α-amylase and α-glucosidase) and hypertension (angiotensin I converting enzyme) in
vitro. Experimental Toxicology and Pathology. 65: 305-309.
Adesogan, E.K. and Okunade, A.L. (1979). A new flavonefrom Ageratum conyzoides. Phytochemistry. 18:
1863.
Adesokan, A.A., Akanji, M.A. and Adewara, G.S., (2010). Evaluation of hypoglycaemic efficacy of
aqueous seed extract of Aframomum melegueta in alloxan-induced diabetic rats. Sierra Leone
Journal of Biomedical Research. 2: 91-94.
Aebi, H. (1984). Catalase in vitro. Methods in Enzymology. 105: 121-126.
Aguilar-Bryan, L., Nichols, C.G., Wechsler, S.W., Clement, J.P., Boyd, A.E., González, G., Herrera-Sosa,
H., Nguy, K., Bryan, J. and Nelson, D.A. (1995). Cloning the β cell high-affinity sulfonylurea
receptor: A regulator of insulin secretion. Science. 268: 423-426.
Aiyeloja, A.A. and Bello, O.A. (2006). Ethnobotanical potentials of common herbs in Nigeria: A case study
of Enugu state. Educational Research and Review. 1: 16-22.
Ajaiyeoba, E.O. and Ekundayo, O. (1999). Essential oil constituents of Aframomum melegueta (Roscoe)
K. Schum. seeds (alligator pepper) from Nigeria. Flavour and Fragrance Journal. 14: 109-111.
Akah, P.A., Uzodinma, S.U. and Okolo, C.E. (2011). Antidiabetic activity of aqueous and methanol extract
and fractions of Gongronema latifolium (Asclepidaceae) leaves in alloxan diabetic rats. Journal of
Applied Pharmaceutical Sciences. 1: 99-102.
Akendengue, B. and Louis, A. (1994). Medicinal plants used by the Masango people in Gabon. Journal of
Ethnopharmacology. 4: 193-200.
Akpanabiatu, M.I., Ekpo, N.D., Ufot, U.F., Udoh, N.M., Akpan, E.J. and Etuk, E.U. (2013). Acute toxicity,
biochemical and haematological study of Aframomum melegueta seed oil in male Wistar albino
rats. Journal of Ethnopharmacology.150: 590-594.

219
Ali, H., Houghton, P.J. and Soumyanath, A. (2006). Alpha amylase inhibitory activity of some Malaysian
plants used to treat diabetes; with particular reference to Phyllanthus amarus. Journal of
Ethnopharmacology. 107: 449-455.
Ali, M.S., Jahangir, M., Hussan, S.S. and Choudhary, M.I. (2002). Inhibition of alpha-glucosidase by
oleanolic acid and its synthetic derivatives. Phytochemistry. 60: 295-299.
American Diabetes Association (ADA). (2015). Report of the expert committee on the diagnosis and
classification of diabetes mellitus. Diabetes Care. 38: S8-S16.
Ani V, Akhilender NK (2008) Antihyperglycemic activity of polyphenolic components of black/bitter
cumin Centratherum anthelminticum (L.) Kuntze seeds. European Food Research and Technology.
226: 897-903.
Ashwal, E. and Hod, E. (2015). Gestational diabetes mellitus: Where are we now? Clinica Chimica Acta.
http://dx.doi.org/10.1016/j.cca.2015.01.021.
Asif, M. (2011). The role of fruits, vegetables, and spices in diabetes. International Journal of Nutrition,
Pharmacology and Neurological Diseases. 1: 27-35.
Asuzu, I.U. and Nwaehujor, C.O. (2013). The anti-diabetic, hypolipidemic and anti-oxidant activities of D-
3-O-methylchiroinositol in alloxan-induced diabetic rats. Hygeia: Journal for Drugs and
Medicines. 5: 27-33.
Atangwho, I.J., Ebong, P.E., Eteng, M.U., Eyong, E.U. and Obi, A.U. (2007). Effect of Vernonia
amygdalina Del leaf on kidney function of diabetic rats. International Journal of Pharmacology.
3: 143-148.
Atawodi, S.E. (2005). Antioxidant potential of African medicinal plants. African Journal of Biotechnology.
4: 128-133.
Atkinson, M.A. and Eisenbarth, G.S. (2001). Type 1 diabetes: new perspectives on disease pathogenesis
and treatment. The Lancet. 358: 221-229.
Ayepola, O.R., Cerf, M.E., Brooks, N.L. and Oguntibeju, O.O. (2014). Kolaviron, a biflavonoid complex
of Garcinia kola seeds modulates apoptosis by suppressing oxidative stress and inflammation in
diabetes-induced nephrotoxic rats. Phytomedicine. 21: 1785-1793.
Azeez, L., Adeoye, M.D., Majolagbe, T.A., Lawal, A.T. and Badiru, R. (2012). Antioxidant activity and
phytochemical contents of some selected Nigerian fruits and vegetables. American Journal of
Chemistry. 2: 209-213.
Azenabor, A., Ogbera, A.O., Ogunyemi, E.O. and Okafor, C.J. (2011). Oxidative stress and glycaemic
control determinants in Type 2 DM. Pakistan Journal of Medical Sciences. 27: 739-743.
220
Babu, P.S. and Srinivasan, K. (1997). Influence of dietary capsaicin and onion on the metabolic
abnormalities associated with streptozotocin induced diabetes mellitus. Molecular and Cellular
Biochemistry. 175: 49-57.
Baird, M.F., Graham, S.M., Baker, J.S. and Bickerstaff, G.F. (2012). Creatine-kinase- and exercise-related
muscle damage implications for muscle performance and recovery. Journal of Nutrition and
Metabolism. 2012: http://dx.doi.org/10.1155/2012/960363.
Balunas, M.J. and Kinghorn, A.D. (2005). Drug discovery from medicinal plants. Life Sciences. 78: 431-
441.
Barceloux, D.J. (2008). Medical toxicology of natural substances: foods, fungi, medicinal herbs, toxic
plants, and venomous animals. Hoboken, NJ: John Wiley & Sons. pp. 67-70.
Basciano, H., Frederico, L. and Adeli, K. (2005). Review: Fructose, insulin resistance, and metabolic
dyslipidemia. Nutrition and Metabolism. 2: 5.
Bavarva, J.H. and Narasimhacharya, A.V.R.L. (2008). Antihyperglycemic and hypolipidemic effects of
Costus speciosus in alloxan-induced diabetic rats. Phytotherapy Research. 22: 620-626.
Benado, M., Alcantara, C., de La Rosa, R., Ambrose, M., Mosier, K. and Kern, M. (2004). Effects of various
levels of dietary fructose on blood lipids in rats. Nutrition Research. 24: 565-571.
Beretta, G. and Facino, R.M. (2010). Recent advances in the assessment of the antioxidant capacity of
pharmaceutical drugs: from in vitro to in vivo evidence, Annals of Bioanalytical Chemistry. 398:
67-75.
Bernhoft, A. (2008). Bioactive compounds in plants-benefits and risks for man and animals. Proceedings
from a symposium held at The Norwegian Academy of Science and Letters, Oslo, 13-14 November
2008.
Bhadari, M.R., Jong-Anarakkan, N., Hong, G. and Kawabata, J. (2008). α-Glucosidase and α-amylase
inhibitory activities of Nepalese medicinal herb Pakhanbhed (Bergenia ciliata, Haw). Food
Chemistry. 106: 247-252.
Bin, S., Yizhong, Z.C., Mei, S. and Harold, C. (2005). Antioxidant capacity of 26 spices extracts and
characterization of their phenolic constituents. Journal of Agricultural and Food Chemistry. 53:
7749-7759.
Biney, R.P., Mante, P.K., Boakye-Gyasi, E., Kukuia, K.E. and Woode, E. (2014). Neuropharmacological
effects of an ethanolic fruit extract of Xylopia aethiopica and xylopic acid, a kaurene diterpene
isolate, in mice. West African Journal of Pharmacy. 25: 106-117.
Bnouham, M., Ziyyat, A., Mekhfi, H., Tahri, A. and Legssyer, A. (2006). Medicinal plants with potential
anti-diabetic activity-A review of ten years of herbal medicine research (1990-2000), International
Journal of Diabetes and Metabolism. 14: 1-25.

221
Boers, M., Nurmohamed, M.T., Doelman, C.J., Lard, L.R., Verhoeven, A.C., Voskuyl, A.E., Huizinga,
T.W., van de Stadt, R.J., Dijkmans, B.A. and van der Linden, S. (2003). Influence of
glucocorticoids and disease activity on total and high density lipoprotein cholesterol in patients
with rheumatoid arthritis. Annals of Rheumatic Diseases. 62: 842-845.
Bonner-Weir, S. and O'Brien, T.D. (2008). Islets in type 2 diabetes: in honor of Dr. Robert C.
Turner. Diabetes. 57: 2899-2904.
Borris, R.P. (1996). Natural products research: perspectives from a major pharmaceutical company. Journal
of Ethnopharmacology. 51: 29-38.
Boynes, J.W. (1991). Role of oxidative stress in the development of complication in diabetes. Diabetes. 40:
405-411.
Brewer, M.S. (2011). Natural antioxidants: sources, compounds, mechanisms of action, and potential
applications. Comprehensive Reviews in Food Science and Food Safety. 10: 221-247.
Broadhurst, C.L., Polansky, M.M. and Anderson, R.A. (2000). Insulin-like biological activity of culinary
and medicinal plant aqueous extracts in vitro. Journal of Agricultural and Food Chemistry. 48:
849-852.
Brown, M. and Vale, W. (2011). Effects of neurotensin and substance P on plasma insulin, glucagon and
glucose levels. Endocrinology. 98: 819-822.
Brownlee, M. (2001). Biochemistry and molecular cell biology of diabetic complications. Nature. 414: 813-
820.
Brownlee, M. (2005). The pathobiology of diabetic complications: a unifying mechanism. Diabetes. 54:
1615-1625.
Brownlee, M., Vlassara, H. and Cerami, A. (1984). Non-enzymatic glycosylation and the pathogenesis of
diabetic complications. Annals of Internal Medicine. 101: 527-537.
Brusotti, G., Cesari, I., Dentamaro, A., Caccialanza, G. and Massolini, G. (2014). Isolation and
characterization of bioactive compounds from plant resources: The role of analysis in the
ethnopharmacological approach. Journal of Pharmaceutical and Biomedical Analysis. 87: 218-
228.
Burkhills, H.M. (1985). Useful plants of West Tropical Africa. 2nd ed. Royal botanical garden. 1 pp. 130-
132.
Buss, A.D. and Waigh, R.D. (1995). Natural products as leads for new pharmaceuticals, in: M.E. Wolff
(Ed.), Burger's medicinal chemistry and drug discovery. Principles and practice, vol. 1, John Wiley
& Sons, Inc., New York, NY. pp. 983-1033.
Caballero, A.E. (2005). Diabetes in the Hispanic or Latino population: genes, environment, culture, and
more. Current Diabetes Reports. 5: 217-225.
222
Calisti, L. and Tognetti, S. (2005). Measurement of glycosylated hemoglobin. Acta Biomedica. 76: 59-62.
Calixto, B.J. (2000). Efficacy, safety, quality control, marketing and regulatory guidelines for herbal
medicines (phytotherapeutic agents). Brazilian Journal of Medical and Biological Research. 33:
179-189.
Canivell, S. and Gomis, R. (2014). Diagnosis and classification of autoimmune diabetes mellitus.
Autoimmunity Reviews. 13: 403-407.
Careaga, M., Fernández, E., Dorantes, L., Mota, L., Jaramillo, M.E. and Hernandez-Sanchez, H. (2003).
Antibacterial activity of Capsicum extract against Salmonella typhimurium and Pseudomonas
aeruginosa inoculated in raw beef meat. International Journal of Food Microbiology. 83: 331-335.
Castellano, J.M., Guinda, A., Delgado, T., Rada, M. and Cayuela, J.A. (2013). Biochemical basis of the
antidiabetic activity of oleanolic acid and related pentacyclic triterpenes. Diabetes. 62: 1791- 1799.
Center, S.A. (2007). Interpretation of liver enzymes. Veterinary Clinics of North America: Small Animal
Practice. 37: 297-333.
Ceriello, A. (2006). Oxidative stress and diabetes-associated complications. Endocrinological Practice. 1:
60-62.
Ceriello, A. and Testa, R. (2009). Antioxidant anti-Inflammatory treatment in type 2 diabetes. Diabetes
Care. 32: 232-235.
Chakraborty, D., Mukherjee, A., Sikdar, S., Paul, A., Ghosh, S. and Khuda-Bukhsh, A.R. (2012). [6]-
Gingerol isolated from ginger attenuates sodium arsenite induced oxidative stress and plays a
corrective role in improving insulin signaling in mice. Toxicology Letters. 210: 34-43.
Chance, B., Greenstein, D.S. and Roughton, R.J.W. (1952). The mechanism of catalase action 1-steady
state analysis. Archives of Biochemistry and Biophysics. 37: 301-339.
Chang, C.C., Yang, M.H., Wen, H.M. and Chern, J.C. (2002). Estimation of total flavonoid content in
propolis by two complementary colorimetric methods. Journal of Food Drug Analysis. 10: 178-
182.
Chang, Y.C. and Chuang, L.M. (2010). The role of oxidative stress in the pathogenesis of type 2 diabetes:
from molecular mechanism to clinical implication. American Journal of Translational Research.
2: 316-331.
Chanwitheesuk, A., Teerawutgulrag, A. and Rakariyatham, N. (2005). Screening of antioxidant activity
and antioxidant compounds of some edible plants of Thailand. Food Chemistry. 92:491-497.
Charles, D.J. (2013). Antioxidant properties of spices, herbs and other sources. Springer New York
Heidelberg Dordrecht London. pp. 245.
Chen, C.Y., Yeh, Y.T. and Yang, W.L. (2011). Amides from the stem of Capsicum annuum. Natural
Production Communication. 6: 227-229.

223
Chen, L., Hwang, J., Gu, K.M., Kim, J., Choi, B., Song, K., Park, Y. and Kang, Y. (2012). Comparative
study of antioxidant effects of five Korean varieties red pepper (Capsicum annuum L.) extracts
from various parts including placenta, stalk, and pericarp. Food Science and Biotechnology. 21:
715-721.
Choumessi, A.T., Danel, M., Chassaing, S., Truchet, I., Penlap, V.B., Pieme, A.C., Asonganyi, T.,
Ducommun, B. and Valette, A. (2012). Characterization of the antiproliferative activity of Xylopia
aethiopica. Cell Division. 7, http://www.celldiv.com/content/7/1/8.
Chung, S.S.M., Ho, E.C.M., Lam, K.S.L. and Chung, S.K. (2003). Contribution of polyol pathway to
diabetes-induced oxidative stress. Journal of American Society Nephrology. 14: S233-S236.
Chung, Y.C., Chang, C.T., Chao, W.W., Lin, C.F. and Chou, S.T. (2002). Antioxidative activity and safety
of the 50% ethanolic extract from red bean fermented by Bacillus subtilis IMR-NK1. Journal of
Agricultural Food and Chemistry. 50: 2454-2458.
Cichewicz, R.H. and Thorpe, P.A. (1996). The antimicrobial properties of chile peppers (Capsicum species)
and their uses in Mayan medicine. Journal of Ethnopharmacology. 52: 61-70.
Ciudad, C.J., Carabaza, A. and Guinovart, J.J. (1988). Glycogen synthesis from glucose and fructose in
hepatocytes from diabetic rats. Archives of Biochemistry and Biophysics. 267: 437-447.
Clore, J.N., Post, E.P., Bailey, D.J., Nestler, J.E. and Blackard, W.G. (1992). Evidence for increased liver
glycogen in patients with noninsulin-dependent diabetes mellitus after a 3-day fast. The Journal of
Clinical Endocrinology & Metabolism. 74: 660-666.
Cohen, S.D. and Kennedy, J.A. (2010). Plant metabolism and the environment: Implications for managing
phenolics. Critical Reviews in Food Science and Nutrition. 50: 620-543.
Collier, A., Wilson, R., Bradley, H., Thomson, J.A. and Small, M. (1990). Free radical activity in type 2
diabetes. Diabetes. 7: 27-30.
Conforti, F., Statti, G.A. and Menichini, F. (2007). Chemical and biological variability of hot pepper fruits
(Capsicum annuum var. acuminatum L.) in relation to maturity stage. Food Chemistry. 102: 1096-
1104.
Connell, D.W. (1970). Natural pungent compounds. III. Paradols and associated compounds. Australian
Journal of Chemistry. 23: 369-376.
Connell, D.W. and McLachlan, R. (1972). Natural pungent compounds. IV. Examination of the gingerols
shogaols, paradols, and related compounds by thin-layer and gas chromatography. Journal of
Chromatography A. 61: 29-35.
Cordell, G.A. and Colvard, M.D. (2005). Some thoughts on the future of ethnopharmacology. Journal of
Ethnopharmacology. 100: 5-14.

224
Cos, P., Vlietinck, A.J., Vanden Berghe, D. and Maes, L. (2006). Anti-infective potential of natural
products: how to develop a stronger in vitro ‘proof-of-concept’, Journal of Ethnopharmacology.
106: 290-302.
Cragg, G.M. and Newman, D.J. (2013). Natural products: A continuing source of novel drug leads.
Biochimica et Biophysica Acta (BBA)-General Subjects. 1830: 3670-3695.
Cui, K., Luo, X., Xu, K. and Ven-Murthy, M.R. (2004). Role of oxidative stress in neurodegeneration:
recent developments in assay methods for oxidative stress and nutraceutical antioxidants. Progress
in Neuro-Psychopharmacology & Biological Psychiatry. 28: 771-799.
Dadji, G.A.F., Tamesse, J.L. and Boyom, F.F. (2011). Adulticidal effects of essential oils extracts from
Capsicum annuum (Solanaceae) Piper nigrum (Piperaceae) and Zingiber officinale (Zingiberaceae)
on Anopheles gambiae (Diptera-Culicidea), vector of malaria. Journal of Entomology. 8: 152-163.
Davidson, E.P., Coppey, L.J., Holmes, A., Dake, B. and Yorek, M.A. (2011). Effect of treatment of high
fat fed/low dose streptozotocin-diabetic rats with Ilepatril on vascular and neural complications.
European Journal of Pharmacology. 668: 497-506.
De Fronzo, R.A. (1999). Pharmacologic therapy for type 2 diabetes mellitus. Annals of Internal Medicine.
131: 281-303.
De Fronzo, R.A. and Abdul-Ghani, M.A. (2011). Type 2 diabetes can be prevented with early
pharmacological intervention. Diabetes Care. 34: S202-S209.
de Melo, C.L., Queiroz, M.G.R. and Fonseca, S.G.C. (2010). Oleanolic acid, a natural triterpenoid improves
blood glucose tolerance in normal mice and ameliorates visceral obesity in mice fed a high-fat diet.
Chemico-Biological Interactions. 185: 59-65.
De Silva, N.M. and Frayling, T.M. (2010). Novel biological insights emerging from genetic studies of type
2 diabetes and related metabolic traits. Current Opinion in Lipidology. 21: 44-50.
Deepa, N., Kaur, C., George, B., Singh, B and Kapoor, H.C (2007). Antioxidant constituents in some sweet
pepper (Capsicum annuum L.) genotypes during maturity. LWT- Food Science and Technology.
40: 121-129.
Deutschländera, M.S., Lall N., Van de Venter, M. and Husseina, A.A. (2011). Hypoglycemic evaluation of
a new triterpene and other compounds isolated from Euclea undulata Thunb. var. myrtina
(Ebenaceae) root bark. Journal of Ethnopharmacology. 133: 1091-1095.
Devasagayam, A., Manisha, M., Priyanjali, D., Jayant, L., Saroj, G., and Thomas, P. (2007). Indian herbs
and herbal drugs used for the treatment of diabetes. Journal of Clinical Biochemistry and Nutrition.
40: 163-173.
Diabetes Prevention Program Research Group (2002). Reduction in the incidence of type 2 diabetes with
lifestyle intervention or metformin. The New England Journal of Medicine. 346:393-403.

225
Diallo, A., Traore, M.S., Keita, S.M., Balde, M.A., Keita, A., Camara, M., Miert, S.V., Pieters, L. and
Balde, A.M. (2012). Management of diabetes in Guinean traditional medicine: An ethnobotanical
investigation in the coastal low lands. Journal of Ethnopharmacology. 144: 353-361.
Diéye, M.A., Sarr, A., Diop, S.N., Ndiaye, M., Sy, G.Y., Diarra, M., Gaffary, I.R., Sy, A.N. and Faye, B.
(2008). Medicinal plants and the treatment of diabetes in Senegal: survey with patients.
Fundamental & Clinical Pharmacology. 22: 211-216.
Doherty, V.F., Olaniran, O.O. and Kanife U.C. (2010). Antimicrobial activities of Aframomum melegueta
(Alligator pepper). International Journal of Biology. 2: 126-131.
Donga, J.J., Surani, V.S., Sailor, G.U., Chauhan, S.P. and Seth, A.K. (2011). A systematic review on natural
medicine used for therapy of diabetes mellitus of some Indian medicinal plants. Pharma Science
Monitor. 2: 36-72.
Dorman, H.J.D., Suraj, D. and Dean, S.G. (2000). In vitro antioxidant activity of a number of plant essential
oils and phytoconstituents. Journal of Essential Oil Research. 12: 241-248.
Dugasani, S., Pichika, M.R., Nadarajah, V.D., Balijepalli, M.K., Tandra, S. and Korlakunta, J.N. (2010).
Comparative antioxidant and anti-inflammatory effects of [6]-gingerol, [8]-gingerol, [10]-gingerol
and [6]-shogaol. Journal of Ethnopharmacology. 127: 515-520.
Ebadi, M. (2006). Pharmacodynamic basis of herbal medicine. CRC press.
Eddouks, M., Chattopadhyay, D. and Zeggwagh, N.A. (2012). Animal models as tools to investigate
antidiabetic and antiinflammatory plants. Evidence-Based Complementary and Alternative
Medicine. 2012: doi:10.1155/2012/142087.
Eid, H.M., Martineau, L.C., Saleem, A., Muhammad, A., Vallerand, D., Benhaddou‐Andaloussi, A., Nistor,
L., Afshar, A., Arnason, J.T. and Haddad, P.S. (2010). Stimulation of AMP‐activated protein kinase
and enhancement of basal glucose uptake in muscle cells by quercetin and quercetin glycosides,
active principles of the antidiabetic medicinal plant Vaccinium vitisidaea. Molecular Nutrition and
Food Research. 54: 991-1003.
Ekeanyanwu, R.C. and Etienajirhevwe, O.F. (2012). In vitro anthelmintic potentials of Xylopia aethiopica
and Monodora myristica from Nigeria. African Journal of Biochemistry Research. 6: 115-120.
Ekong, D.E.U. and Ogan, A.U. (1968). Chemistry of the constituents of Xylopia aethiopica. The structure
of xylopic acid, a new diterpene acid. Journal of Chemical Society. 311-312. doi:
10.1039/J39680000311.
El-Halawany, A.M., El Dine, R.S., El Sayed, N.S. and Hattori, M. (2014). Protective effect of Aframomum
melegueta phenolics against CCl4-induced rat hepatocytes damage; role of apoptosis and pro-
inflammatory cytokines inhibition. Scientific Reports. 4: DOI: 10.1038/srep05880.
Ellman, G.L. (1959). Tissue sulfhydryl groups. Archives of Biochemistry and Biophysics. 82: 70-77.
226
Elya, B., Basah, K., Mun’im, A., Yuliastuti, W., Bangun, A. and Septiana E.K. (2012). Screening of α-
Glucosidase inhibitory activity from some plants of Apocynaceae, Clusiaceae, Euphorbiaceae, and
Rubiaceae. Journal of Biomedicine and Biotechnology. 2012: doi:10.1155/2012/281078.
Eriksson, K.F. and Lindgarde, F. (1991). Prevention of type 2 (non-insulin-dependent) diabetes mellitus by
diet and physical exercise: the 6-year Malmo feasibility study. Diabetologia. 34: 891-898.
Escoubas, P., Lajide, L. and Mizutani, J. (1995). Termite antifeedant activity in Aframomum melegueta.
Phytochemistry. 40: 1097-1099.
Esekhiagbe, M., Uzuazokaro, M.A. and Agatemor, C. (2009). Phenolic content and antimicrobial potentials
of Xylopia aethiopica and Myristica argentea. Macedonian Journal of Chemistry and Chemical
Engineering. 28: 159-162.
Etoundi, C.B., Kuaté, D., Ngondi, J.L. and Oben, J. (2010). Anti-amylase, anti-lipase and antioxidant
effects of aqueous extracts of some Cameroonian spices. Journal of Natural Product. 3: 165-171.
Etoundi, C.B.O., Kuaté, D., Ngondi, J.L. and Oben, J.E. (2013). Effects of extracts of Hypodaphnis zenkeri
and Xylopia aethiopica on blood lipids, glycemia and body weight of Triton WR-1339 and insulin
resistant rats. International Journal of Research in Ayurveda Pharmacology. 4: 736-741.
Export-Forum.com. http://www.export-forum.com/africa/plants/photos.htm. Retrieved 3rd April, 2015.
Ezekwesili, C.N., Nwodo, O.F.C., Eneh, F.U. and Ogbunugafor, H.A. (2010). Investigation of the chemical
composition and biological activity of Xylopia aethiopica Dunal (Annonacaea). African Journal of
Biotechnology. 9: 7352-7356.
Fabricant, D.S. and Farnsworth, N.R. (2001). The value of plants used in traditional medicine for drug
discovery. Environmental Health Perspectives. 109: 69-75.
Fall, D., Badiane, M., Ba, D., Loiseau, P., Bories, C., Gleye, C., Laurens, A. and Hocquemiller, R. (2003).
Antiparasitic activities of Senegalese Annonacae used in traditional medicine. Dakar Medicine. 48:
112-116.
Farnsworth, N.R., Akerele, R.O., Bingel, A.S., Soejarto, D.D. and Guo, Z. (1985). Medicinal plants in
therapy. Bulletin of World Health Organization. 63: 965-981.
Fenercioglu, A.K., Saler, T., Genc, E., Sabuncu, H. and Altuntas, Y. (2010). The effects of polyphenol-
containing antioxidants on oxidative stress and lipid peroxidation in Type 2 diabetes mellitus
without complications. Journal of Endocrinological Investigation. 33: 118-124.
Ferrazzano, G.F., Amato, I., Ingenito, A., Zarrelli, A., Pinto, G. and Pollio, A. (2011). Plant polyphenols
and their anti-cariogenic properties: a review. Molecules. 16: 1486-1507.
Ferris, H.A. and Kahn, C.R. (2012). New mechanisms of glucocorticoid-induced insulin resistance: make
no bones about it. Journal of Clinical Investigation. 122: 3854-3857.

227
Fishbein, H. and Palumbo, P.J. (1995). Acute metabolic complications in diabetes. Diabetes in America. 2:
283-292.
Fogo, A.B. and Kon, V. (2001). Pathophysiology of progressive renal diseases. an overview. In: Neilson,
E.G., Couser, W.G., editors. Immunologic Renal Diseases. 2nd ed. Philadelphia: Lippincott
Williams and Wilkins. p. 55-72.
Fowler, M.J. (2008). Microvascular and macrovascular complications of diabetes. Clinical Diabetes. 26:
77-82.
Foyer, C.H. and Halliwell, B. (1976). The presence of glutathione and glutathione reductase in chloroplasts:
a proposed role in ascorbic acid metabolism. Planta. 133: 21-25.
Fraga, C.G., Leibovitz, B.E. and Tappel, A.L. (1988). Lipid peroxidation measured as thiobarbituric acid
reactive substances in tissue slices: characterization and comparison with homogenate and
microsomes. Free Radical Biology & Medicine. 4: 155-161.
Freiesleben, S.H., Soelberg, J. and Jäger, A.K. (2015). Medicinal plants used as excipients in the history in
Ghanaian herbal medicine. Journal of Ethnopharmacology.
http://dx.doi.org/10.1016/j.jep.2015.03.005.
Friedewald, W.T., Levy, R.I. and Fredrickson, D.S. (1972). Estimation of the concentration of low density
lipoprotein in plasma, without use of the preventive ultracentrifuge. Clinical Chemistry. 18: 499-
502.
Friedman, M., Henika, P.R. and Mandrell, R.E. (2002). Bactericidal activities of plant essential oils and
some of their isolated constituents against Campylobacter jejuni, Escherichia coli, Listeria
monocytogenes, and Salmonella enterica. Journal of Food Protection. 65: 1545-1560.
Fujisawa, T., Ikegami, H., Inoue, K., Kawabata, Y. and Ogihara, T. (2005). Effect of two α- glucosidase
inhibitors, voglibose and acarbose, on postprandial hyperglycemia correlates with subjective
abdominal symptoms. Metabolism. 54: 387-390.
Gad, M.Z., El-Sawalhi, M.M., Ismail, M.F. and El-Tanbouly, N.D. (2006). Biochemical study of the anti-
diabetic action of the Egyptian plants fenugreek and balanites. Molecular and Cellular
Biochemistry. 281: 173-183.
Gallagher, A.M., Flatt, P.R., Duffy, G. and Abdel-Wahab, Y.H.A. (2003). The effects of traditional
antidiabetic plants on in vitro glucose diffusion. Nutrition Research. 23: 413-424.
Galvez, P.J., Zarzuelo, A., Busson, R., Cobbaert, C. and de Witte, P. (1992). (−)-Epicatechingalloyl ester:
a secretagogue compound from bark of Sclerocarya birrea. Planta Medica. 58: 174-175.
Gastaldelli, A. (2011). Role of beta-cell dysfunction, ectopic fat accumulation and insulin resistance in the
pathogenesis of type 2 diabetes mellitus. Diabetes Research and Clinical Practice. 93: S63-S66.
228
Gbadamosi, I.T., Moody, J.O. and Lawal, A.M. (2011). Phytochemical screening and proximate analysis
of eight ethnobotanicals used as antimalaria remedies in Ibadan, Nigeria. Journal of Applied
Biosciences. 44: 2967-2971.
Gbolade, A. (2009). Inventory of antidiabetic plants in selected districts of Lagos State, Nigeria. Journal of
Ethnopharmacology. 121: 135-139.
Gbolade, A. (2012). Ethnobotanical study of plants used in treating hypertension in Edo State of Nigeria.
Journal of Ethnopharmacology. 144: 1-10.
Geldenhuys, C. and Mitchell, D. (2006). Sustainable harvesting technologies, in commercializing medicinal
plants-a southern African guide, N. Diederichs, Ed., Sun Press, Stellenbosch, South Africa. pp. 21-
40.
George, B.O. and Osioma, E. (2011). Phenolic content and total antioxidant capacity of local spices in
Nigeria. African Journal of Food Sciences. 5: 741-746.
Ghasemnezhad, M., Sherafati, M. and Payvast, G.A. (2011). Variation in phenolic compounds, ascorbic
acid and antioxidant activity of five colored bell pepper (Capsicum annum) fruits at two different
harvest times. Journal of Functional Foods. 3: 44-49.
Giacco, F. and Brownlee, M. (2010). Oxidative stress and diabetic complications. Circulation Research.
107: 1058-1070.
Gilani, A.H. (2005). Trends in ethnopharmacology. Journal of Ethnopharmacology. 100: 43-49.
Gokce, G., Haznedaroglu, M.Z., 2008. Evaluation of antidiabetic, antioxidant and vasoprotective effects of
Posidonia oceanica extract. Journal of Ethnopharmacology. 115: 122-130.
Griffiths, L.A. (1959). On the distribution of gentisic acid in green plant. Journal of Experimental Botony.
10: 437-442.
Grover, J.K., Vats, V. and Yadav, S. (2002). Effect of feeding aqueous extract of Pterocarpus marsupium
on glycogen content of tissues and the key enzymes of carbohydrate metabolism. Molecular and
Cellular Biochemistry. 241: 53-59.
Guariguata, L., Whiting, D.R., Hambleton, I., Beagley, J., Linnenkamp, U. and Shaw, J.E. (2014). Global
estimates of diabetes prevalence for 2013 and projections for 2035. Diabetes Research and Clinical
Practice. 103: 137-149.
Gulati, V., Harding, I.H and Palombo, E.A. (2012). Enzyme inhibitory and antioxidant activities of
traditional medicinal plants: Potential application in the management of hyperglycemia. BMC
Complementary and Alternative Medicine. 12: http://www.biomedcentral.com/1472-6882/12/77.
Gülçin, İ. (2012). Antioxidant activity of food constituents: an overview. Archives of Toxicology. 86: 345-
391.

229
Gurib-Fakim, A. (2006). Medicinal plants: Traditions of yesterday and drugs of tomorrow. Molecular
Aspects of Medicine. 27: 1-93.
Halliwell, B., Murcia, M.A., Chirico, S. and Aruoma, O.I. (1995). Free radicals and antioxidants in food
and in vivo: what they do and how they work. Critical Review in Food Science and Nutrition. 35:
7-20.
Hanhineva, K., Törrönen, R., Bondia-Pons, I., Pekkinen, J., Kolehmainen, M., Mykkänen, H. and Poutanen,
H. (2010). Impact of dietary polyphenols on carbohydrate metabolism. International Journal of
Molecular Sciences. 11: 1365-1402.
Hannan, J.M.A., Ali, L., Rokeya, B., Khaleque, J., Akhter, M., Flatt, P.R. and Addel-Wahab, Y.H.A.
(2007). Soluble dietary fibre fraction of Trigonella foenum-gracecum (fenugreek) seed improves
glucose homeostasis in animal models of type 1 and type 2 diabetes by delaying carbohydrate
digestion and absorption and enhancing insulin action. British Journal of Nutrition. 97: 514-521.
Harbone, J. (1998). Phytochemical methods: a guide to modern techniques of plant analysis. pp. 54-84.
Harborne J.B. and Baxter H. (1993). Phytochemical Dictionary. Taylor and Francis: Washington DC.
Harrigan, G.G., da Bolzani, V.S., Gunatilaka, A.A.L. and Kingston, D.G.I. (1994). Kaurane and
trachylobane diterpenes from Xylopia aethiopica. Phytochemistry. 36: 109-113.
Harvey, A.L. (2008). Natural products in drug discovery. Drug Discovery Today. 13: 894-901.
Harvey, R.A. and Ferrier, D.R. (2011). Lippincott’s Illustrated Reviews: Biochemistry. 5th ed. Lippincott
Williams & Wilkins. pp. 307.
Hayes, C. (2008). Role of physical activity in diabetes management and prevention. Journal of the
American Dietetic Association. 108: S19-S23.
Heinrich, M. (2010). Ethnopharmacology and drug discovery. Comprehensive Natural Products Chemistry.
3: 351-381.
Heinrich, M., Barnes, J., Gibbons, S. and Williamson, E.M. (2004). Fundamentals of Pharmacognosy and
Phytotherapy. Churchill Livingstone, Elsevier Science Ltd., UK.
Heinrich, M., Barnes, J., Gibbons, S. and Williamson, E.M. (2012). Fundamentals of Pharmacognosy and
Phytotherapy. 2nd Ed Elsevier Ltd. pp. 107.
Hernández-Ortega, M., Ortiz-Moreno, A., Hern´andez-Navarro, M.D., Chamorro-Cevallos, G., Dorantes-
Alvarez, L. and Necoechea-Mondragon, H. (2012). Antioxidant, antinociceptive and anti-
inflammatory effects of carotenoids extracted from dried Pepper (Capsicum annuum L.). Journal
of Biomedicine and Biotechnology. 2012: doi:10.1155/2012/524019.
Hervert-Hernández, D., Sayágo-Ayerdi, S.G. and Gońi, I. (2010). Bioactive compounds of four hot pepper
varieties (Capsicum annuum L.), antioxidant capacity, and intestinal bioaccessibility. Journal of
Agricultural and Food Chemistry. 58: 3399-3406.

230
Heydari, I., Radi, V., Razmjou, S. and Amiri, A. (2010). Chronic complications of diabetes mellitus in
newly diagnosed patients. International Journal of Diabetes Mellitus. 2: 61-63.
Hinneburg, I., Dorman, H.J.D. and Hiltunen, R. (2006). Antioxidant activities of extracts from selected
culinary herbs and spices. Food Chemistry. 97: 122-129.
Hirst, M. (2013). Diabetes in 2013. The new figures. Diabetes Research and Clinical Practice. 102: 265.
Holman RR, Paul SK, Bethel MA, Matthews DR, Neil HA. (2008). 10-year follow-up of intensive glucose
control in type 2 diabetes. The New England Journal of Medicine. 359: 1577-1589.
Holman, R.R., Cull, C.A. and Turner, R.C. (1999). A randomized double-blind trial of acarbose in type 2
diabetes shows improved glycemic control over 3 years. Diabetes Care. 22: 960-964.
Hostettmann, K., Hostettmann, M. and Marston, A. (1991). Saponins, in: B.V., Charlwood, D.V. Banthorpe
(Eds.), Methods in Plant Biochemistry, Terpenoids, vol. 7, Academic Press, San Diego, CA. 435-
471.
Hotamisligil, G.S. (2000). Molecular mechanisms of insulin resistance and the role of the adipocyte.
International Journal of Obesity and Related Metabolic Disorders. 24: S23-S27.
Hsieh, P.C., Huang, G.J., Ho, Y.L., Lin, Y.H., Huang, S.S., Chiang, Y.C., Tseng, M.C. and Chang, Y.S.
(2010). Activities of antioxidants, α-glucosidase inhibitors and aldose reductase inhibitors of the
aqueous extracts of four Flemingia species in Taiwan. Botanical Studies. 51: 293-302.
Huang, C., Yin, M. and Chiu, L. (2011). Antihyperglycemic and antioxidative potential of Psidium guajava
fruit in streptozotocin-induced diabetic rats. Food and Chemical Toxicology. 49: 2189-2195.
Hua-Qiang, D., Mei, L., Feng, Z., Fu-Lai, L. and Jian-Bo, H. (2012). Inhibitory potential of trilobatin from
Lithocarpus polystachyus Rehd against α -glucosidase and α -amylase linked to type 2 diabetes.
Food Chemistry. 130: 261-266.
Hui, J.W., Yuan, X.Y., Wan-Shen, J.N., Tao-Wu, J.N. and Zheng, W.F. (2007). Low dose streptozotocin
(STZ) combined with high energy intake can effectively induce type 2 diabetes through altering
the related gene expression. Asia Pacific Journal of Clinical Nutrition. 16: 412-417.
Hung, H.Y., Qian, K., Morris-Natschke, S.L., Hsu, C.S. and Lee, K.S. (2012). Recent discovery of plant-
derived anti-diabetic natural products. Natural Product Reports. 29: 580-606.
Ibrahim, M.A., Koorbanally, N.E. and Islam, M.S. (2014). Antioxidative activity and inhibition of key
enzymes linked to type-2 diabetes (α-glucosidase and α-amylase) by Khaya senegalensis. Acta
Pharmaceutica. 64: 311-324.
Ilic, N., Schmidt, B.M., Poulev, A. and Raskin, I. (2010). Toxicological evaluation of Grains of Paradise
(Aframomum melegueta) [Roscoe] K. Schum. Journal of Ethnopharmacology. 127: 352-356.

231
Ilic, N.M., Dey, M., Poulev, A.A., Logendra, S., Kuhn, P.E. and Raskin, I. (2014). Anti-inflammatory
activity of grains of paradise (Aframomum melegueta Schum) extract. Journal of Agricultural and
Food Chemistry. 62: 10452-10457.
Imam, S.K. (2015). Diabetes: a new horizon and approach to management. In: Glucose intake and
utilization in pre-diabetes and diabetes implications for cardiovascular disease. Ed. Watson, R.R.,
Dokken, B.B. Elsevier Academic Press, UK. pp 35.
Inoguchi, T., Sonta, T., Tsubouchi, H., Etoh, T., Kakimoto, M., Sonoda, N., Sato, N., Sekiguchi, N.,
Kobayashi, K., Sumimoto, H., Utsumi, H. and Nawata, H. (2003). Protein kinase C-dependent
increase in reactive oxygen species (ROS) production in vascular tissues of diabetes: role of
vascular NAD(P)H oxidase. Journal of the American Society of Nephrology. 14: S227-S232.
International Diabetes Federation (IDF). (2014). Diabetes Atlas. 6th ed. Available at
http://www.idf.org/diabetesatlas/update-2014, Accessed on 13th March, 2015.
Irvine, F.R. (1961). Woody Plants of Ghana. Oxford University Press, London, pp. 878.
Isa, Y., Miyakawa, Y., Yanagisawa, M., Goto, T., Kang, M.S., Kawada, T., Morimitsu, Y., Kubota, K. and
Tsuda, T. (2008). 6-Shogaol and 6-gingerol, the pungent of ginger, inhibit TNF-α mediated
downregulation of adiponectin expression via different mechanisms in 3T3-L1 adipocytes.
Biochemical and Biophysical Research Communications. 373: 429-434.
Islam, M.S. and Loots, D.T. (2009). Experimental rodent models of type 2 diabetes: a review. Methods and
Findings in Experimental and Clinical Pharmacology. 31: 249-261.
Iwu, M.M. (2014). Handbook of African Medicinal Plants. 2nd -CRC Press.
Iwu, M.M., Igboko, O.A., Okunji, C.O. and Tempesta, M.S. (1990). Antidiabetic and aldose reductase
activities of biflavanones of Garcinia kola. Journal of Pharmacy and Pharmacology. 42: 290-292.
Jaramillo-Juarez, F., Rodriquez-Vazquez, M.L., Rincon-Sanchez, A.R., Consolación-Martínez, M., Ortiz,
G.G. and Llamas, J. (2008). Acute renal failure induced by carbon tetrachloride in rats with hepatic
cirrhosis. Annals of Hepatology. 7: 331-338.
Jayakumar, G., Ajithabai, M. D., Sreedevi, S., Viswanathan, P. K. and Remeshkumar, B. (2010).
Ethnobotanical survey of the plants used in the treatment of diabetes. Indian Journal of Traditional
Knowledge. 9: 100-104.
Jiang, Z. (2000). Cataract induced by osmotic stress. American Journal of Physiology. 254: C788-
C7921988.
Johnkennedy, N., Adamma E., Austin, A. and Njoku, N.E.C. (2011). Influence of Xylopia aethiopica fruits
on some hematological and biochemical profile. Al Ameen Journal of Medical Sciences. 4: 191-
196.

232
Joslin, E.P. and Kahn, C.R. (Eds.). (2005). Joslin's Diabetes Mellitus: Edited by C. Ronald Kahn. Lippincott
Williams & Wilkins. p. 333.
Jung, M., Park, M., Lee, H.C., Kang, Y.H., Kang, E.S. and Kim, S.K. (2006). Antidiabetic agents from
medicinal plants. Current Medicinal Chemistry. 13: 1203-1218.
Kakkar, P., Dos, B. and Viswanathan, P.N. (1984). A modified spectrophotometric assay of superoxide
dismutase. Indian Journal of Biochemistry & Biophysics. 21: 130-132.
Kamalakkannan, N. and Prince, P.S. (2006). Antihyperglycaemic and antioxidant effect of rutin, a
polyphenolic flavonoid, in streptozotocin-induced diabetic Wistar rats. Basic Clinical and
Pharmacology and Toxicology. 98: 97-103.
Kamatou, G.P., Vermaak, I. and Viljoen, A.M. (2012). Eugenol-from the remote Maluku Islands to the
international market place: a review of a remarkable and versatile molecule. Molecules. 17: 6953-
6981.
Kamtchouing, P., Mbonge, G.Y.F., Dimo, T., Watcho, P., Jatsa, H.B. and Sokeng, S.D. (2002). Effects of
Aframomum melegueta and Piper guineense on sexual behaviour of male rats. Behaviuorial
Pharmacology. 13: 243-247.
Karou, S.D., Tchacondo, D., Tchibozo, M.A.D., Abdoul-Rahaman, S., Anani, K., Koudouvo, K., Batawila,
K., Agbonon, A., Simpore, J. and de Souza, C. (2011). Ethnobotanical study of medicinal plants
used in the management of diabetes mellitus and hypertension in the Central Region of Togo.
Pharmaceutical Biology. 49: 1286-1297.
Kaushik, G., Satya, S., Khandelwal, R.K. and Naik, S.N. (2010). Commonly consumed Indian plant food
materials in the management of diabetes mellitus. Diabetes, Metabolic Syndrome and Clinical
Research Reviews. 4: 21-40.
Kawamura-Konishi, Y., Watanabe, N., Saito, M., Nakajima, N., Sakaki, T., Katayama, T. and Enomoto, T.
(2012). Isolation of a new phlorotannin, a potent inhibitor of carbohydrate-hydrolyzing enzymes,
from the brown algae Sargassum patens, Journal of Agricultural and Food Chemistry. 60: 5565-
5570.
Kazeem, M.I., Akanji, M.A., Hafizur Rahman, M. and Choudhary, M.I. (2012). Antiglycation, antioxidant
and toxicological potential of polyphenol extracts of alligator pepper, ginger and nutmeg from
Nigeria. Asian Pacific Journal of Tropical Biomedicine. 2: 727-732.
Kempaiah, R.K. and Srinivasan, K. (2006). Beneficial influence of dietary curcumin, capsaicin and garlic
on erythrocyte integrity in high-fat fed rats. Journal of Nutritional Biochemistry. 17: 471-478.
Khan, A. and Safdar, M. (2003). Role of diet, nutrients, spices and natural products in diabetes mellitus.
Pakistan Journal of Nutrition. 2: 1-12.

233
Khan, F.A., Mahmood, T., Ali, M., Saeed, A. and Maalik, A. (2014). Pharmacological importance of an
ethnobotanical plant: Capsicum annuum L. Natural Product Research. 28: 1267-1274.
Kieffer, T.J., Heller, R.S., Leech, C.A., Holz, G.G. and Habener, J.F. (1997). Leptin suppression of insulin
secretion by the activation of ATP-sensitive K+ channels in pancreatic β-cells. Diabetes. 46: 1087-
1093.
Kim, J.S., Ahn, J., Lee, S.J., Moon, B., Ha, T.Y. And Kim, S. (2011). Phytochemicals and antioxidant
activity of fruits and leaves of paprika (Capsicum annuum L., var. special) cultivated in Korea.
Journal of Food Science. 76: 193-198.
Kim, Y.M., Jeong, Y.K., Wang, M.H., Lee, W.Y. and Rhee, H.I. (2005). Inhibitory effects of pine bark
extract on alpha-glucosidase activity and postprandial hyperglycemia. Nutrition. 21: 756-761.
Kingsley, E.N. (2012). Antifertility effects of ethanolic extract of Xylopia aethiopica on male reproductive
organ of Wister rats. American Journal of Medicine and Medical Science. 2: 12-15.
Kintscher, U. and Law, R.E. (2005). PPARgamma-mediated insulin sensitization: the importance of fat
versus muscle. American Journal of Physiology, Endocrinology and Metabolism. 288: E287-E291.
Kitabchi, E.A., Miles, J.M., Umpierrrez, G.E. and Fisher, J.N. (2009). Hyperglycemic crises in adult
patients with diabetes. Diabetes Care. 32: 1335-1343.
Kobata, K., Todo, T., Yazawa, S., Iwai, K. and Watanabe, T. (1998). Novel Capsaicinoid-like substances,
capsiate and dihydrocapsiate, from the fruits of a nonpungent cultivar, CH-19 sweet, of pepper
(Capsicum annuum L.). Journal of Agricultural and Food Chemistry. 46: 1695-1697.
Kokwaro, J.O. (1993). Medicinal Plants of East Africa. East Africa Literature Bureau, Nairobi: Kenya
Literature Bureau 401p. 190.
Kong, D., Wu, J., Sun, S., Wang, Y. and Xu, P. (2014). A comparative study on antioxidant activity and
inhibitory potential against key enzymes related to type 2 diabetes of four typical teas. Journal of
Food and Nutrition Research. 2: 652-658.
Kosaka, K., Noda, M. and Kuzuya, T. (2005). Prevention of type 2 diabetes by lifestyle intervention: a
Japanese trial in IGT males. Diabetes Research and Clinical Practice. 67:152-162.
Koster, J.C., Remedi, M.S., Qiu, H., Nichols, C.G. and Hruz, P.W. (2003). HIV protease inhibitors acutely
impair glucose-stimulated insulin release. Diabetes. 52: 1695-1700.
Koutnik, E. (2013). Drug therapies for improving type 2 diabetes outcomes. Consultant 360. 53:
http://www.consultant360.com/articles/drug-therapies-improving-type-2-diabetes-outcomes.
Krentz, A.J., Ferner, R.E. and Bailey, C.J. (1994). Comparative tolerability profiles of oral antidiabetic
agents. Drug Safety. 11: 223-241.
Kroner, Z. (2009). The relationship between Alzheimer's disease and diabetes: type 3 diabetes?. Alternative
Medicine Review. 14: 373.
234
Kuete, V., Krusche, B., Youns, M., Voukeng, I., Fankam, A.G., Tankeo, S., Lacmata, S. and Efferth, T.
(2011). Cytotoxicity of some Cameroonian spices and selected medicinal plant extracts. Journal of
Ethnopharmacology. 134: 803-812.
Kuete, V., Sandjo, L.P., Wiench, B. and Efferth, T. (2013). Cytotoxicity and modes of action of four
Cameroonian dietary spices ethno-medically used to treat Cancers: Echinops giganteus, Xylopia
aethiopica, Imperata cylindrica and Piper capense. Journal of Ethnopharmacology. 149: 243-253.
Kumar, O.A., Rao, S.A. and Tata, S.S. (2010). Phenolics quantification in some genotypes of Capsicum
annuum L. Journal of Phytology. 2: 87-90.
Kumar, R., Patel, D.K., Prasad, S.K., Laloo, D., Krishnamurthy, S. and Hemalatha, S. (2012). Type 2
antidiabetic activity of bergenin from the roots of Caesalpinia digyna Rottler. Fitoterapia. 83: 395-
401.
KunduSen, S.K., Haldar, P.K., Gupta, M., Mazumder, U.K., Saha, P., Bala, A., Bhattacharya, S. and Kar,
B. (2011). Evaluation of antihyperglycemic activity of Citrus limetta fruit peel in streptozotocin-
induced diabetic rats. ISRN Endocrinology. 2011: doi:10.5402/2011/869273.
Kwon, Y.I., Apostolidis, E. and Shetty, K. (2007). Evaluation of pepper (Capsicum annuum) for
management of diabetes and hypertension. Journal of Food Biochemistry. 31: 370-385.
Lee, C., Park, G.H., Kim, C.Y. and Jang, J.H. (2011). [6]-Gingerol attenuates b-amyloid-induced oxidative
cell death via fortifying cellular antioxidant defense system. Food and Chemical Toxicology. 49:
1261-1269.
Lee, H., Jang, H.C., Park, H.K., Metzger, B.E. and Cho, N.H. (2008). Prevalence of type 2 diabetes among
women with a previous history of gestational diabetes mellitus. Diabetes Research and Clinical
Practice. 81: 124-129.
Lehrke, M. and Lazar, M.A. (2005). The many faces of PPARgamma. Cell. 123: 993-999.
Lewis, R.A. (1981). Scientific terminology in Ethnopharmacology. Journal of Ethnopharmacology. 4: 121.
Li, Y., Xu, C., Zhang, Q., Liu, J.Y. and Tan, R.X. (2005). In vitro anti-Helicobacter pylori action of 30
Chinese herbal medicines used to treat ulcer diseases. Journal of Ethnopharmacology. 98: 329-333.
Lin, J.H. and Lu, A.Y. (1997). Role of pharmacokinetics and metabolism in drug discovery and
development. Pharmacological Reviews. 49: 403-449.
Liu, C.S., Lin, C.C. and Li, T.C. (1999). The relation of white blood cell count and atherogenic index ratio
of LDL-cholesterol to HDL-cholesterol in Taiwan school children. Acta Paediatrica Taiwanica.
40: 319-324.
Lo, S., Russel, J.C. and Taylor, A.W. (1970). Determination of glycogen in small tissue samples. Journal
of Applied Physiology. 28: 234-236.
235
Lobo, V.C., Phatak, A. and Chandra, N. (2010). Antioxidant and free radical scavenging activity of
Hygrophila schulli (Buch.-Ham.) Almeida and Almeida seeds. Advances in Bioresources. 1: 72-78.
Long-Solís, J. (1986). Capsicum y cultura : la historia del chilli. Fondo de Cultura Económica, México.
Lu, S.C. (1999). Regulation of hepatic glutathione synthesis: current concepts and controversies. FASEB
Journal. 13: 1169-1183.
Luthria, D.L. and Mukhopadhyay, S. (2006). Influence of sample preparation on assay of phenolic acids
from eggplant. Journal of Agriculture and Food Chemistry. 54: 41-47.
Ma, J., Jin, X., Yang, L. and Liu, Z-L. (2004). Diarylheptanoids from the rhizomes of Zingiber officinale.
Phytochemistry. 65: 1137-1143.
MacKenzie, J., Koekemoer, T., van de Venter, M., Dealtry, G. and Roux, S. (2009). Sutherlandia frutescens
limits the development of insulin resistance by decreasing plasma free fatty acid levels.
Phytotherapy Research. 23: 1609-1614.
Madhumathy, A.P., Aivazi, A.A. and Vijayan, V.A. (2007). Larvicidal efficacy of Capsicum annum against
Anopheles stephensi and Culex quinquefasciatus. Journal of Vector Borne Diseases. 44: 223-226.
Mahato, S.B and Kundu, A.P. (1994). 13C NMR Spectra of pentacyclic triterpenoids-A compilation and
some salient features. Phytochemistry. 37: 1517-1575.
Mahomoodally, M.F. and Muthoora, D.D. (2014). Kinetic of inhibition of carbohydrate-hydrolysing
enzymes, antioxidant activity and polyphenolic content of Phyllanthus amarus Schum. & Thonn.
(Phyllanthaceae). Journal of Herbal Medicine. 4: 208-223.
Mai, T.T., Thu, N.N., Tien, P.G. and Chuyen, N.V. (2007). Alpha-glucosidase and antioxidant activities of
Vietnamese edible plants and their relationships with polyphenol contents, Journal of Nutritional
Science and Vitaminology. 53: 267-276.
Mamphiswana, N.D., Mashela, P.W. and Mdee, L.K. (2010). Distribution of total phenolics and antioxidant
activity in fruit, leaf, stem and root of Monsonia burkeana. African Journal of Agricultural
Research. 5: 2570-2575.
Manach, C., Scalbert, A., Morand, C., Rémésy, C. and Jimenez, L. (2004). Polyphenols: food sources and
bioavailability. The American Journal of Clinical Nutrition. 79: 727-747.
Mannervik, B. (1985). Glutathione peroxidase. In: Meister A, editor. Methods in Enzymology. 113. Florida:
Academic Press. p 490-495.
Manonmani, G., Bhavapriya, V., Kalpana, S., Govindasamy, S. and Apparanantham, T. (2005). Antioxidant
activity of Cassia fistula (Linn.) flowers in alloxan induced diabetic rats. Journal of
Ethnopharmacology. 97: 39-42.
Maritim, A.C., Sander, R.A. and Watkins, J.B. (2003). Diabetes, oxidative stress, and antioxidants: a
review. Journal of Biochemical and Molecular Toxicology. 17: 24-38.

236
Markson, A.A., Amadioha, A.C., Omosun, G., Ukeh, D., Udo, S.E., Umana, E.J. and Madunagu, B.E.
(2011). Control efficiency of Botryodiplodia theobromae (Pat.) By essential oil of Aframomum
melegueta (K. Schum) seed from south-south, Nigeria. International Science Research Journal. 3:
88-92.
Marles, R.J. and Farnsworth, N. (1994). Antidiabetic plants and their active constituents. Phytomedicine.
2: 137-189.
Marquis, V.O., Adanlawo, T.A. and Olaniyi, A.A. (1977). The effect of foetidin from Momordica foetida
on blood glucose level of albino rats. Planta Medica. 31: 367-374.
Materska, M and Perucka, I (2005). Antioxidant activity of the main phenolic compounds isolated from hot
pepper fruit (Capsicum annuum L.). Journal of Agriculture and Food Chemistry. 53: 1750-1756.
Matsuda, H., Li, Y., Murakami, T., Matsumura, N., Yamahara, J. and Yoshikawa, M. (1998). Antidiabetic
principles of natural medicines. III. Structure-related inhibitory activity and action mode of
oleanolic acid glycosides on hypoglycemic activity. Chemical and Pharmaceutical Bulletin. 46:
1399-1403.
Mbaze, L.M., Poumale, H.M., Wansi, J.D., Lado, J.A., Khan, S.N., Iqbal, M.C., Ngadjui, B.T. and Laatsch,
H. (2007). α-glucosidase inhibitory pentacyclic triterpenes from the stem bark of Fagara
tessmannii (Rutaceae). Phytochemistry. 68: 591-595.
Mbongue, G.Y.F., Kamtchouing, P. and Dimo, T. (2012). Effects of the aqueous extract of dry seeds of
Aframomum melegueta on some parameters of the reproductive function of mature male rats.
Andrologia. 44: 53-58.
McCrod, J.M. Keele, B.B. Fridovich, I. (1976). An enzyme based theory of obligate anaerobiosis; the
physiological functions of superoxide dismutase. Proceedings of the National Academy of
Sciences, USA. 68: 1024-1027.
McCue, P. and Shetty, K. (2004). Inhibitory effects of rosmarinic acid extracts on porcine pancreatic
amylase in vitro. Asian Pacific Journal of Clinical Nutrition. 13: 101-106.
McCune, L.M. and Johns, T. (2002). Antioxidant activity in medicinal plants associated with the symptoms
of diabetes mellitus used by the Indigenous Peoples of the North American boreal forest. Journal
of Ethnopharmacology. 82: 197-202.
McCune, L.M. and Johns, T. (2007). Antioxidant activity relates to plant part, life form and growing
condition in some diabetes remedies. Journal of Ethnopharmacology. 112: 461-469.
McDonald, S., Prenzier, P.D., Autokiwich, M. and Robards, K. (2001). Phenolic content and antioxidant
activity of olive oil extracts. Food Chemistry. 73: 73-84.
Memısogullari, R., Taysi, S., Bakan, E. and Capoglu, I. (2003). Antioxidant status and lipid peroxidation
in type II diabetes mellitus. Cell Biochemistry and Function. 2: 291-296.

237
Mendonça-Filho, R.R. (2006). ed. Ahamad, AI., Aqil, S. and Owais, M. Modern Phytomedicine: Turning
Medicinal Plants into Drugs. Wiley-VCH Verlag GmbH & Co. KGaA, Weinheim. pp 3-4.
Menut, C., Lamaty, G., Zollo, P.H.A., Atogho, B.M., Abondo, R. and Bessiere, J.M. (1991). Aromatic
Plants of Tropical Central Africa. V. Volatile components of three Zingiberaceae from Cameroon:
Aframomum melegueta (Roscoe) K. Schum., A. daniellii (Hook. f.) K. Schum. and A. sulcatum
(Oh. and Hanb.) K. Schum. Flavour and Fragrance Journal. 6: 183-186.
Meyer, D. and Harvey, J.W. (2004). Hepatobiliary and skeletal muscle enzymes and liver function tests. In:
Meyer, D., Harvey, J.W. (Eds.), Veterinary Laboratory Medicine: Interpretation and Diagnosis.
WB. Saunders Co, St. Louis, MO, p. 169-192.
Michael, P.K., Asim, A.B. and Robert, S.B. (2005). The utility of oral diabetes medications in type 2
diabetes of the young. Current Diabetes Reviews. l, 83-92.
Miladi, S. and Demak, M. (2008). In-vitro antioxidant activities of Aloe vera leaf skin extract. Journal de
la Société Chimique de Tunisie. 10: 101-109.
Mishra, B.B and Tiwari, V.K. (2011). Natural products: An evolving role in future drug discovery.
European Journal of Medicinal Chemistry. 46: 4769-4807.
Mohammed, A., Ibrahim, M.A. and Islam, M.S. (2014). African medicinal plants with antidiabetic
potentials: a review. Planta Medica. 80: 354-377.
Mohammed, A., Koorbanally, N.A. and Islam, M.S. (2015a). Antioxidative activity, phytochemistry, and
inhibition of key enzymes linked to type 2 diabetes by various parts of Aframomum melegueta in
vitro. Acta Poloniae Pharmaceutica-Drug Research. In press.
Mohammed, A., Koorbanally, N.A. and Islam, M.S. (2015b). Ethyl acetate fraction of Aframomum
melegueta fruit ameliorates pancreatic β-cell dysfunction and major diabetes-related parameters in
a type 2 diabetes model of rats. Journal of Ethnopharmacology. 175: 518-527.
Mojekwu, T.O., Yama, O.E., Ojokuku, S.A. and Oyebadejo, S.A. (2011). Hypoglyceamic effects of
aqueous extract of Aframomum melegueta leaf on alloxan-induced diabetic male albino rats. Pacific
Journal of Medical Sciences. 8: 28-36.
Monnier, L., Mas, E., Ginet, C., Michel, F., Villon, L., Cristol, J.P. and Colette, C. (2006). Activation of
oxidative stress by acute glucose fluctuations compared with sustained chronic hyperglycemia in
patients with type 2 diabetes. The Journal of the American Medical Association. 295: 1681-1687.
Monsereenusorn, S. (1983). Sub chronic toxicity studies of capsaicin and capsicum in rats. Research
Communications in Chemical Pathology and Pharmacology. 41: 95-100.
Monsereenusorn, Y. (1980). Effect of Capsicum annum on blood glucose levels. Pharmaceutical Biology.
18: 1-7.
238
Moreira, I.C., Roque, N.F., Vilegas, W.F., Zalewski, C.A., Lago, J.H.G. and Funasaki, M. (2013). Genus
Xylopia (Annonaceae): chemical and biological aspects. Chemistry & Biodiversity. 10: 1921-1943.
Mudgal, V., Madaan, N., Mudgal, A. and Mishra, S. (2010). Dietary polyphenols and human health. Asian
Journal of Biochemistry. 5: 154-162.
Murcia, M.A., Egea, I., Romojaro, F., Parras, P., Jimenez, A.M. and Martinez-Tome, M. (2004).
Antioxidant evaluation in dessert spices compared with common food additives. Influence of
irradiation procedure. Journal of Agricultural and Food Chemistry. 52: 1872-1881.
Murray, R.K., Granner, D.K., Mayes, P.A. and Rodwell, V.W. (2003). Harper’s Illustrated Biochemistry.
26th ed. Lange Medical Books/McGraw-Hill. pp. 171.
Musabayane, C.T., Tufts, M.A. and Mapanga, R.F. (2010). Synergistic antihyperglycemic effects between
plant-derived oleanolic acid and insulin in streptozotocin-induced diabetic rats. Renal failure. 32:
832-839.
Nattrass, M. and Bailey, C.J. (1999). New agents for type 2 diabetes. Best Practice and Research in Clinical
Endocrinology and Metabolism. 13: 309-329.
Ndifossap, I.G.M., Frigerio, F., Casimir, M., Tsofack, F. N., Dongo, E., Kamtchouing, P., Dimo, T. and
Maechler, P. (2010). Sclerocarya birrea (Anacardiaceae) stem-bark extract corrects glycaemia in
diabetic rats and acts on β-cells by enhancing glucose-stimulated insulin secretion. Journal of
Endocrinology. 205: 79-86.
Ndukwu, B.C. and Ben-Nwadibia, N.B. (2005). Ethnomedicinal aspects of plants used as spices and
condiments in the Niger Delta area of Nigeria. Ethnobotanical Leaflets. 1: 10.
Neelesh, M., Sanjay, J. and Sapna, M. (2010). Antidiabetic potential of medicinal plants. Acta Acta
Poloniae Pharmaceutica-Drug Research. 67: 113-118.
Ngoupayo, J., Tabopda, T.K., Ali, M.S. and Tsamo, E. (2008). Alpha-glucosidase inhibitors from Garcinia
brevipedicellata (Clusiaceae). Chemical and Pharmaceutical Bulletin (Tokyo). 56: 1466-1469.
Ngwoke, K.G., Chevallier, O., Wirkom, V.K., Stevenson, P., Elliott, C.T. and Situ, C. (2014). In vitro
bactericidal activity of diterpenoids isolated from Aframomum melegueta K. Schum agains strains
of Esceherichia coli, Listeria monocytogenes and Staphylococcus aureus. Journal of
Ethnopharmacology. 153: 1147-1154.
Niki, E. (2010). Assessment of antioxidant capacity in vitro and in vivo. Free Radical Biology & Medicine.
49: 503-515.
Nneka, C.V. and Jude, U.A. (2013). Efficacy of Aframomum melegueta and Zingiber officinale extracts on
fungal pathogens of tomato fruit. IOSR Journal of Pharmacy and Biological Sciences. 4: 13-16.
Nwangwa, E.K. (2012). Antifertility effects of ethanolic extract of Xylopia aethiopica on male reproductive
organ of Wister rats. American Journal of Medicine and Medical Sciences. 2: 12-15.

239
Nwozo, S.O. and Oyinloye, B.E. (2011). Hepatoprotective effect of aqueous extract of Aframomum
melegueta on ethanol-induced toxicity in rats. Acta Biochimica Polonica. 58: 355-358.
Nwozo, S.O., Orojobi, B.F. and Adaramoye, O.A. (2011). Hypolipidemic and antioxidant potentials of
Xylopia aethiopica seed extract in hypercholesterolemic rats. Journal of Medicinal Food. 14: 114-
119.
Obiri, D.D. and Osafo, N. (2013). Aqueous ethanol extract of the fruit of Xylopia aethiopica (Annonaceae)
exhibits anti-anaphylactic and anti-inflammatory actions in mice. Journal of Ethnopharmacology.
148: 940-945.
Oboh, G., Puntel, R.L. and Rocha, J.B.T. (2007). Hot pepper (Capsicum annuum, Tepin and Capsicum
chinese, Habanero) prevents Fe2+-induced lipid peroxidation in brain-in vitro. Food Chemistry.
102: 178-185.
Ode, K.L. and Moran, A. (2013). New insights into cystic fibrosis-related diabetes in children. Lancet
Diabetes Endocrinology. 1: 52-58.
Odukoya, A.O., Ilori, O.O., Sofidiya, M.O., Aniunoh, O.A., Lawal, B.M. and Tade, I.O. (2005).
Antioxidant activity of Nigerian dietary spices. Electronic Journal of Environment, Agriculture
and Food Chemistry. 4: 1086-1093.
Ogbonnia, S., Adekunle, A.A., Bosa, M.K. and Enwuru, V.N. (2008). Evaluation of acute and subacute
toxicity of Alstonia congensis Engler (Apocynaceae) bark and Xylopia aethiopica (Dunal) A. Rich
(Annonaceae) fruits mixtures used in the treatment of diabetes. African Journal of Biotechnology.
7: 701-705.
Ogbonnia, S.O., Mbaka, G.O., Adekunle, A., Anyika, E.N., Gbolade, O.E. and Nwakakwa, N. (2010).
Effect of a poly-herbal formulation, Okudiabet, on alloxan- induced diabetic rats. Agriculture and
Biology Journal of North America. 1: 139-145.
Ohkubo, Y., Kishikawa, H., Araki, E., Miyata, T., Isami, S., Motoyoshi, S., Kojima, Y., Furuyoshi, N. and
Shichiri, M. (1995). Intensive insulin therapy prevents the progression of diabetic microvascular
complications in Japanese patients with non-insulin-dependent diabetes mellitus: a randomized
prospective 6-year study. Diabetes Research and Clinical Practice. 28: 103-117.
Ojewole, J.A.O. (2004). Analgesic, anti-inflammatory and hypoglycemic effects of Sutherlandia frutescens
R.BR. (variety incana E. MEY.) [Fabaceae] shoot aqueous extract. Methods and Findings in
Experimental and Clinical Pharmacology. 26: 409-416.
Okolie, U.V., Okeke, C.E., Oli, J.M. and Ehiemere, I.J. (2008). Hypoglycemic indices of Vernonia
amygdalina on postprandial blood glucose concentration of healthy humans. African Journal of
Biotechnology. 7: 4581-4585.

240
Okwu, D.E. (2005). Phytochemicals, vitamins and mineral contents of two Nigerian medicinal plants.
International Journal of Molecular Medicine and Advance Sciences. 1: 375-381.
Oliveira, H.C., dos Santos, M.P., Grigulo, R., Lima, L.L., Martins, D.T.O., Lima, J.C.S., Stoppiglia, L.F.,
Lopes, C.F. and Kawashita, N.H. (2008). Antidiabetic activity of Vatairea macrocarpa extract in
rats. Journal of Ethnopharmacology. 115: 515-519.
Onoja, S.O., Omeh, Y.N., Ezeja, M.I. and Chukwu, M.N. (2014). Evaluation of the in vitro and in vivo
antioxidant potentials of Aframomum melegueta methanolic seed extract. Journal of Tropical
Medicine. 2014: http://dx.doi.org/10.1155/2014/159343.
Ortiz-Andrade, R.R., Garcia-Jimenez, S., Castillo-Espana, P., Rameriz-Vila, G., Villalobos-Molina, R. and
Estrada-Soto, S. (2007). α-Glucosidase inhibitory activity of the methanolic extract from
Tourneforia hartwegiana: an anti-hyperglycemic agent. Journal of Ethnopharmacology. 109: 48-
53.
Orwa, C., Mutua, A., Kindt, R., Jamnadass, R. and Simons, A. (2009). Agroforestree Database: a tree
reference and selection guide version 4.0 (http:/ww.orldagrofrestry.org/af/treedb/).
Oyaizu, M. (1986). Studies on products of browning reactions: Antioxidative activities of products of
browning reaction prepared from glucosamine. Japan Journal of Nutrition. 103: 413-9.
Ozougwu, J.C., Obimba, K.C., Belonwu, C.D. and Unakalamba, C.B. (2013). The pathogenesis and
pathophysiology of type 1 and type 2 diabetes mellitus. Journal of Physiology and
Pathophysiology. 4: 46-57.
Padwal, R., Majumdar, S.R., Johnson, J.A., Varney, J. and MacAlister F.A. (2005). A systematic review
of drug therapy to delay or prevent type 2 diabetes. Diabetes Care. 28: 736-744.
Paglia, D.E. and Valentine, W.N. (1967). Studies on the quantitative and qualitative characterization of
erythrocyte glutathione peroxidase. The Journal of Laboratory and Clinical Medicine. 70: 158-
164.
Pal, D.K. and Dutta, S. (2006). Evaluation of antioxidant activity of the roots of Cyperus rotundus L. Indian
Journal of Pharmacy Sciences. 68: 256-258.
Palmer, S.A., Stewart, J. and Fyfe, L. (2002). Inhibition of listeriolysin-O and phosphatidyl choline-specific
production in Listeria monocytogenes by subinhibitory concentrations of plant essential oils.
Journal of Medical Microbiology. 51: 567-574.
Pan, X.R., Li, G.W., Hu, Y.H., Wang, J.X., Yang, W.Y., An, Z.X., Hu, Z.X., Lin, J., Xiao, J.Z., Cao, H.B.,
Liu, P.A., Jiang, X.G., Jiang, Y.Y., Wang, J.P., Zheng, H., Zhang, H., Bennett, P.H. and Howard,
B.V. (1997). Effects of diet and exercise in preventing NIDDM in people with impaired glucose
tolerance: the Da Qing IGT and diabetes study. Diabetes Care. 20:537-544.

241
Pandey, K.B. and Rizvi, S.I. (2009). Plant polyphenols as dietary antioxidants in human health and disease.
Oxidative Medicine and Cell Longevity. 2: 270-278.
Panini, S.R. (2013). Medical Biochemistry: An Illustrated Review. Thieme, New York, USA., ISBN-13:
978-1604063165, p. 169.
Park, J.S., Chyun, J.H., Kim, Y.K., Line, L.L. and Chew, B.P. (2010). Astaxanthin decreased oxidative
stress and inflammation and enhanced immune response in humans. Nutrition and Metabolism. 7:
http://www.nutritionandmetabolism.com/content/7/1/18.
Park, S., Jeong, W.Y., Lee, J.H., Kim, Y.H., Jeong, S.W., Kim, G.S., Bae, D.W., Lim, C.S., Jin, J.S., Lee,
S.J. and Shin, S.C. (2012). Determination of polyphenol levels variation in Capsicum annuum L.
cv. chelsea (yellow bell pepper) infected by anthracnose (Colletotrichum gloeosporioides) using
liquid chromatography-tandem mass spectrometry. Food Chemistry. 130: 981-985.
Paschos, P. and Paletas, K. (2009). Non-alcoholic fatty liver disease and metabolic syndrome. Hippokratia.
13: 9-19.
Patil, S.B., Ghadyale, V.A., Taklikar, S.S., Kulkarni, C.R. and Arvindekar, A.U. (2011). Insulin
secretagogue, alpha-glucosidase and antioxidant activity of some selected spices in streptozotocin-
induced diabetic rats. Plant Foods and Human Nutrition. 66: 85-90.
Patterson, C., Guariguata, L., Dahlquist, G., Soltész, G., Ogle, G. and Silink, M. (2014). Diabetes in the
young–a global view and worldwide estimates of numbers of children with type 1
diabetes. Diabetes Research and Clinical Practice. 103: 161-175.
Pawar, V.C. and Thaker, V.S. (2006). In vitro efficacy of 75 essential oils against Aspergillus niger.
Mycoses. 49: 316-323.
Pazdro, R. and Burgess, J.R. (2010). The role of vitamin E and oxidative stress in diabetes complications.
Mechanisms of Ageing and Development. 131: 276-286.
Peer, N., Kengne, A.P., Motala, A.A. and Mbanya, J.C. (2014). Diabetes in the Africa region: An update.
Diabetes Research and Clinical Practice. 103: 197-205.
Perron, N.R. and Brumaghim, J.L. (2009). A review of the antioxidant mechanisms of polyphenol
compounds related to iron binding. Cell Biochemistry and Biophysics. 53: 75-100.
Perucka, I. and Materska, M. (2001). Phenylalanine ammonia-lyase and antioxidant activities of lipophilic
fraction of fresh pepper fruits Capsicum annum L. Innovative Food Science & Emerging
Technologies. 2: 189-192.
Perucka, I. and Materska, M. (2007). Antioxidant vitamin contents of Capsicum annuum fruit extracts as
affected by processing and varietal factors. Acta Scientiarum Polonorum Technologia Alimentaria.
6: 67-74.
242
Phung, O.J., Sood, N.A., Sill, B.E. and Coleman, C.I. (2011). Oral anti-diabetic drugs for the prevention of
Type 2 diabetes. Diabetic Medicine. DOI: 10.1111/j.1464-5491.2011.03303.x.
Pollier, J. and Goossens, A. (2012). Oleanolic acid. Phytochemistry. 77: 10-15.
Ponnusamy, S., Ravindran, R., Zinjarde, S., Bhargava, S. and Ravi, K.A. (2010). Evaluation of traditional
Indian antidiabetic medicinal plants for human pancreatic amylase inhibitory effect in vitro.
Evidence-Based Complementary and Alternative Medicine, 2011:
http://dx.doi.org/10.1155/2011/515647.
Povichit, N., Phrutivorapongkul, A., Suttajit, M., Chaiyasut, C. and Leelapornpisid, P. (2010). Phenolic
content and in vitro inhibitory effects on oxidation and protein glycation of some Thai medicinal
plants. Pakistan Journal of Pharmaceutical Sciences. 23: 403-408.
Powers, S.K. and Jackson, M.J. (2008). Exercise-induced oxidative stress: cellular mechanisms and impact
on muscle force production. Physiology Reviews. 88: 1243-1276.
Pulido, R., Bravo, L. and Saura-Calixto, F. (2000). Antioxidant activity of dietary polyphenols as
determined by a modified ferric reducing antioxidant power assay. Journal of Agricultural and Food
Chemistry, 40, 3396-3402.
Pulok, K.M., Kuntal, M., Kakali, M. and Peter, J.H. (2006). Leads from Indian medicinal plants with
hypoglycemic potentials. Journal of Ethnopharmacology. 106: 1-28
Quilliot, D., Walter, E., Bonte, J.P., Fruchart, J.C., Duriez, P. and Ziegler, O. (2005). Diabetes mellitus
worsens antioxidant status in patients with chronic pancreatitis. American Journal of Clinical
Nutrition. 81: 1111-1117.
Rachid, A., Rabah, D., Farid, L., Zohra, S.F., Houcine, B. and Nacéra, B. (2012). Ethnopharmacological
survey of medicinal plants used in the traditional treatment of diabetes mellitus in the North
Western and South Western Algeria. Journal of Medicinal Plants Research. 6: 2041-2050.
Rahati, S., Shahraki, M., Arjomand, G. and Shahraki, T. (2014). Food pattern, lifestyle and diabetes
mellitus. International Journal of High Risk and Behavioral Addiction. 3: e8725.
Rahbar, S. and Figarola, J.L. (2003). Novel inhibitors of advanced glycation end products. Archives of
Biochemistry and Biophysics. 419: 63-79.
Rahimi, R., Nikfar, S., Larijani, B. and Abdollahi, M. (2005). A review on the role of antioxidants in the
management of diabetes and its complications. Biomedicine and Pharmacotherapy. 59: 365-373.
Rahman, S., Rahman, T., Ismail, A.A. and Rashid, A.R. (2007). Diabetes-associated macrovasculopathy:
pathophysiology and pathogenesis. Diabetes, Obesity and Metabolism. 9: 767-780.
Rajasekaran, S., Sivagnanam, K. and Subramanian, S. (2005). Antioxidant effect of Aloe vera gel extract
in streptozotocin-induced diabetes in rats. Pharmacological Reports. 57: 90-96.
243
Ramachandran, A., Snehalatha, C., Mary, S., Mukesh, B., Bhaskar, A.D. and Vijay V. (2006). The Indian
Diabetes Prevention Programme (IDPP): The Indian Diabetes Prevention Programme shows that
lifestyle modification and metformin prevent type 2 diabetes in Asian Indian subjects with impaired
glucose tolerance (IDPP-1). Diabetologia. 49: 289-297.
Ramaiah, S.K. (2007). A toxicologist guide to the diagnostic interpretation of hepatic biochemical
parameters. Food and Chemical Toxicology. 45: 1551-1557.
Ramawat, K.G., Dass, S. and Mathur, M. (2009). Herbal Drugs: Ethnomedicine to Modern Medicine.
Springer-Verlag Berlin Heidelberg. p. 7.
Ramkissoon, J.S., Mahomoodally, M.F., Ahmed, N. and Subratty, A.H. (2013). Antioxidant and anti-
glycation activities correlates with phenolic composition of tropical medicinal herbs. Asian Pacific
Journal of Tropical Medicine. 6: 561-569.
Rastija, V., Beślo, D. and Nikolić, S. (2012). Two-dimensional quantitative structure–activity relationship
study on polyphenols as inhibitors of a-glucosidase. Medicinal Chemistry in Research. 21: 3984-
3993.
Rates, S.M.K. (2001). Plants as source of drugs. Toxicon. 39: 603-613.
Rengasamy, K.R.R., Aderogba, M.A., Amoo, S.O., Stirk, W.A. and van Staden, J. (2013). Potential
antiradical and alpha-glucosidase inhibitors from Ecklonia maxima (Osbeck) Papenfuss. Food
Chemistry. 141: 1412-1415.
Rice-Evans, C.A., Miller, N.J. and Paganga, G. (1996). Structure-antioxidant activity relationships of
flavonoids and phenolic acids. Free Radicals in Biology and Medicine. 20: 933-956.
Robertson, R.P., Harmon, J., Tran, P.O.T. and Poitout, V. (2004). β-cell glucose toxicity, lipotoxicity, and
chronic oxidative stress in type 2 diabetes. Diabetes. 53: S119-S124.
Rosen, P., Nawroth, P.P. and King, G. (2001). The role of oxidative stress in the onset and progression of
diabetes and its complications: A summary of a congress series sponsored by UNESCO-MCBN,
the American diabetes association and the German diabetes society. Diabetes/Metabolism
Research and Reviews. 17: 189-212.
Sabu, M.C. and Kuttan, R. (2002). Antidiabetic activity of medicinal plants and its relationship with their
antioxidant property. Journal of Ethnopharmacology. 81:155-160.
Sallau, A.B., Njoku, G.C., Olabisi, A.R., Wurochekke, A.U., Abdulkadir, A.A., Isah, S., Abubakar, M.S.
and Ibrahim, S. (2005). Effect of Guiera senegalensis leaf extract on some Echis carinatum venom
enzymes. Journal of Medical Sciences. 5: 280-283.
Samuelsson, G. (2004). Drugs of natural origin: a textbook of pharmacognosy. 5th Swedish Pharmaceutical
Press, Stockholm.
244
Sangeetha, M.K., Raghavendran, H.R.B., Gayathri, V. and Vasanthi, H.R. (2011). Tinospora cordifolia
attenuates oxidative stress and distorted carbohydrate metabolism in experimentally induced type
2 diabetes in rats. Journal of Natural Medicines. 65: 544-550.
Santos, M.M.P., Vieira-da-Motta, O., Vieira, I.J.C., Braz-Filho, R., Gonçalves, P.S., Maria, E.J., Terra,
W.S., Rodrigues, R. and Souza, C.L.M. (2012). Antibacterial activity of Capsicum annuum extract
and synthetic capsaicinoid derivatives against Streptococcus mutans. Journal of Natural Medicines.
66: 354-356.
Sati, S.C., Sati, N., Ruwat, U. and Sati, O.P. (2010). Medicinal plants as a source of antioxidants. Research
Journal of Phytochemistry. 4: 213-224.
Satyajit, D., Sarker, Z., Latif, A. and Gray, I. (2006). Natural product isolation. 2nd, Humana Press Inc
ISBN 1-59259-955-9.
Sefi, M., Fetoui, H., Lachkar, N., Tahraoui, A., Lyoussi, B., Boudawara, T. and Zeghal, N. (2011).
Centaurium erythrea (Gentianaceae) leaf extract alleviates streptozotocin-induced oxidative stress
and β-cell damage in rat pancreas. Journal of Ethnopharmacology. 135: 243-250.
Sen, S., Chakraborty, R., Sridhar, C., Reddy, Y.S.R. and De, B. (2010). Free radicals, antioxidants, diseases
and phytomedicines: current status and future prospect. International Journal of Pharmaceutical
Sciences Review and Research. 3: 91-100.
Shittu, H., Gray, A., Furman, B. and Young, L. (2010). Glucose uptake stimulatory effect of akuammicine
from Picralima nitida (Apocynaceae). Phytochemistry Letters. 3: 53-55.
Shivanna, N., Naika, M., Khanum, F. and Kaul, V.K. (2013). Antioxidant, anti-diabetic and renal protective
properties of Stevia rebaudiana. Journal of Diabetes and Its Complications. 27: 103-113.
Shizen, L. and Xiwen, L. (2004). Compendium of materia medica (Bencao Gangmu), Foreign Languages
Press.
Shu, Y.Z. (1998). Recent natural products based drug development: a pharmaceutical industry perspective.
Journal of Natural Product. 61: 1053-1071.
Silva, L.R., Azevedo, J., Pereira, M.J., Valentão, P. and Andrade, A. (2013). Chemical assessment and
antioxidant capacity of pepper (Capsicum annuum L.) seeds. Food and Chemical Toxicology. 53:
240-248.
Singh, A.B., Singh, N., Maurya, R. and Srivastava, A.K. (2009). Anti-hyperglycaemic, lipid lowering and
anti-oxidant properties of [6]-gingerol in db/db mice. International Journal of Medicine and
Medical Sciences. 1: 536-544.
Singh, R.S. (2001). Plant disease management. Science Publishers, Inc.

245
Soladoye, M.O., Chukwuma, E.C. and Owa, F.P. (2012). An ‘avalanche’ of plant species for the traditional
cure of diabetes mellitus in south-western Nigeria. Journal of Natural Product and Plant
Resources. 2: 60-72.
Somova, L.I., Nadar, A., Ramnanan P. and Shode, F.O. (2003a). Cardiovascular, antihyperlipidemic and
antioxidant effects of oleanolic and ursolic acids in experimental hypertension. Phytomedicine. 10:
115-121.
Somova, L.I., Shode, F.O., Ramnanan P. and Nadar, A. (2003b). Antihypertensive, antiatherosclerotic and
antioxidant activity of triterpenoids isolated from Olea europaea, subspecies africana leaves.
Journal of Ethnopharmacology. 84: 299-305.
Spencer, C.M., Cai, Y., Martin, R., Gaffeney, S.H., Goulding, P.N., Mangnolato, D., Lilley, Y. and Haslam,
E. (1988). Polyphenol complexation-some thoughts and observations. Phytochemistry. 27: 2397-
2409.
Sreelatha, S. and Inbavalli, R. 2012. Antioxidant, antihyperglycemic, and antihyperlipidemic effects of
Coriandrum sativum leaf and stem in alloxan-Induced diabetic rats. Journal of Food Science. 77:
119-123.
Srinivasan, K. (2005a). Plant foods in the management of diabetes mellitus: Spices as beneficial antidiabetic
food adjuncts. International Journal of Food Science and Nutrition. 56: 399-414.
Srinivasan, K. (2005b). Role of spices beyond food flavoring: nutraceuticals with multiple health effects.
Food Reviews International. 21: 167-188.
Stephen, N.D. (2006). Insulin, oral hypoglycemic agent and the pharmacology of endocrine pancreas, in:
L.L. Burnton, J.S. Lazo and K.L. Parker, ed., Goodman & Gillman’s The Phamacological Basis of
Therapeutic. New York: McGraw-Hill Medical Publishing Division, 1613-641.
Stolar, M.W., Hoogwerf, B., Boyle, P., Gorshow, S.M. and Wales, D.O. (2008). Managing type 2 diabetes:
Going beyond glycemic control. Journal of Managed Care Pharmacy. 14: S1-S19.
Storey, K.B. (2004). Functional metabolism: regulation and adaptation. New Jersey: Wiley & Sons Inc. p.
47.
Suba, V., Murugesan, T., Arunachalam, G., Mandal, S.C. and Sahu, B.P. (2004). Anti-diabetic potential of
Barleria lupilina extract in rats. Phytomedicine. 11: 202-205.
Sudha, P., Smita, S.Z., Shobha, Y.B. and Ameeta, R.K. (2011). Potent α-amylase inhibitory activity of
Indian Ayurvedic medicinal plants. BMC Complementary and Alternative Medicine. 2011:
http://www.biomedcentral.com/1472-6882/11/5.

246
Sugita, J., Yoneshiro, T., Hatano, T., Aita, S., Ikemoto, T., Uchiwa, H., Iwanaga, T., Kameya, T., Kawai
Y. and Saito, M. (2013). Grains of paradise (Aframomum melegueta) extract activates brown
adipose tissue and increases whole-body energy expenditure in men. British Journal of Nutrition.
110: 733-738.
Surampudi, P.N., John‐Kalarickal, J. and Fonseca, V.A. (2009). Emerging concepts in the pathophysiology
of type 2 diabetes mellitus. Mount Sinai Journal of Medicine: A Journal of Translational and
Personalized Medicine. 76: 216-226.
Swinnen, S.G., Hoekstra, J.B. and deVries, J.H. (2009). Insulin therapy for type 2 diabetes. Diabetes Care.
32: S253- S259.
Szablewski, L. (2014). Role of immune system in type 1 diabetes mellitus pathogenesis. International
Immunopharmacology. 22: 182-191.
Tabopda, T.K., Ngoupayo, J., Liu, J., Ali, M.S., Khan, S.N., Ngadjui, B.T. and Luu, B. (2008). α-
glucosidase inhibitors ellagic acid derivatives with immunoinhibitory properties from Terminalia
superba. Chemical and Pharmaceutical Bulletin (Tokyo). 56: 847-850.
Tackie, A.N., Dwuma-Badu, D., Ayim, J.S.K., Dabra, T.T., Knapp, J.E., Slatkin, D.J. and Schiff Jr., P.L.
(1975). Constituents of West African medicinal plants. VIII. Hydroxyphenylalkanones from
Aframomum melegueta. Phytochemistry. 14: 853-854.
Taiwo, I.A., Oboh, B.O. and Francis-Garuba, P.N. (2009). Haematological properties of aqueous extracts
of Phyllantus amarus (Schum and Thonn.) and Xylopia aethiopica (Dunal) A. Rich in albino rats.
Ethnomedicine. 3: 99-103.
Tane, P., Tatsimo, S.D., Ayimele, G.A. and Connolly, J.D. (2005). Bioactive metabolites from Aframomum
species. 11th NAPRECA Symposium Book of Proceedings, Antananarivo, Madagascar, 2005. 214-
223.
Taveira, M., Silva, L.R., Vale-Silva, L.A., Pinto, E., Valentão, P., Ferreres, F., Guedes, P. and Andrade,
P.B. (2010). Lycopersicon esculentum seeds: an industrial byproduct as an antimicrobial agent.
Journal of Agricultural Food and Chemistry. 58: 9529-9536.
Tedong, L., Madiraju, P., Martineau, L.C., Vallerand, D., Arnason, J.T., Desire, D.D., Lavoie, L.,
Kamtchouing P. and Haddad, P.S. (2010). Hydro‐ethanolic extract of cashew tree (Anacardium
occidentale) nut and its principal compound, anacardic acid, stimulate glucose uptake in C2C12
muscle cells. Molecular Nutrition and Food Research. 54: 1753-1762.
Tekwu, E.M., Askun, T., Kuete, V., Nkengfack, A.E., Nyasse, B., Etoa, F.X. and Beng, V.P. (2012).
Antibacterial activity of selected Cameroonian dietary spices ethno-medically used against strains
of Mycobacterium tuberculosis. Journal of Ethnopharmacology. 142: 374-382.
247
Teodoro T, Zhang L, Alexander T, Yue J, Vranic M, Volchuk A. Oleanolic acid enhances insulin secretion
in pancreatic β-cells. FEBS Letters. 582: 1375-1380.
The West African plant photo guide. http://www.westafricanplants.senckenberg.de/root/index.php.
Retrieved on 3rd April, 2015.
Thomas, C.C. and Philipson, L.H. (2015). Update on diabetes classification. Medical Clinics of North
America. 99: 1-16.
Toda, M., Kawabata, J. and Kasai, T. (2001). Inhibitory effects of ellagi-and gallotannins on rat intestinal
α-glucosidase complexes. Bioscience, Biotechnology and Biochemistry. 65: 542-547.
Tuba, A.K. and Gulcin, I. (2008). Antioxidant and radical scavenging properties of curcumin. Chemical
and Biological Interactions. 174: 27-37.
Tucci, S.A, Boyland, E.J. and Halford, J.C.G. (2010). The role of lipid and carbohydrate digestive enzyme
inhibitors in the management of obesity: a review of current and emerging therapeutic agents.
Diabetes, Metabolic Syndrome and Obesity: Targets and Therapy. 3: 125-143.
Tundis, R., Loizzo, M.R., Menichini, F., Bonesi, M., Conforti, F., Statti, G., Luca, D.D., Cindio, B. and
Menichini, F. (2012). Comparative study on the chemical composition, antioxidant properties and
hypoglycemic activities of two Capsicum annuum L. cultivars (Acuminatum small and
Cerasiferum). Plant Foods and Human Nutrition. 66: 261-269.
Tundis, R., Menichini, F., Bonesi, M., Conforti, F., Statti, G., Menichini, F. and Loizzo, M.R. (2013).
Antioxidant and hypoglycaemic activities and their relationship to phytochemicals in Capsicum
annuum cultivars during fruit development. LWT Food Science and Technology. 53: 370-377.
Tuomilehto, J. (2009). Nonpharmacologic therapy and exercise in the prevention of type 2 diabetes.
Diabetes Care. 32: S189-S193.
Tuomilehto, J., Hämäläinen, H., Laakso, M. and Uusitupa, M. (2001). Prevention of type 2 diabetes mellitus
by changes in lifestyle among subjects with impaired glucose tolerance. The New England Journal
of Medicine. 344: 1343-1350.
Turkmen, N., Sari, F. and Velioglu, Y.S. (2006). Effects of extraction solvents on concentration and
antioxidant activity of black and black mate tea polyphenols determined by ferrous tartrate and
Folin-Ciocalteu methods. Food Chemistry. 99: 835-841.
Turner, D.M. (1996). Natural product source material use in the pharmaceutical industry: the Glaxo
experience. Journal of Ethnopharmacology. 51: 39-44.
U.K. Prospective Diabetes Study (UKPDS) Group. (1998). Intensive blood-glucose control with
sulphonylureas or insulin compared with conventional treatment and risk of complications in
patients with type 2 diabetes (UKPDS 33). Lancet. 352: 837-853.
248
Ukeh, D.A., Birkett, M.A., Pickett, J.A., Bowman, A.S. and Luntz, A.J.M. (2009). Repellent activity of
alligator pepper, Aframomum melegueta, and ginger, Zingiber officinale, against the maize weevil,
Sitophilus zeamais. Phytochemistry. 70: 751-758.
Umukoro, S. and Ashorobi, R.B. (2005). Anti-Stress Potential of aqueous seed extract of Aframomum
melegueta. African Journal of Biomedical Research. 8: 119-121.
Umukoro, S. and Ashorobi, R.B. (2007). Further studies on the antinociceptive action of aqueous seed
extract of Aframomum melegueta. Journal of Ethnopharmacology. 109: 501-504.
Umukoro, S. and Ashorobi, R.B. (2008). Further pharmacological studies on aqueous seed extract of
Aframomum melegueta in rats. Journal of Ethnopharmacology. 115: 489-493.
van de Venter, M., Roux, S., Bungu, L.C., Louw, C.N. R., Olwen, M.G., Maharaj, V., Pillay, P., Sewnarian,
P., Bhagwandin, N. and Folb, P. (2008). Antidiabetic screening and scoring of 11 plants
traditionally used in South Africa. Journal of Ethnopharmacology. 119: 81-86.
van Dijk, C., and Berl, T. (2004). Pathogenesis of diabetic nephropathy. Reviews in Endocrine and
Metabolic Disorders. 5, 237-248.
van Wyk, B.E., de Wetb H. and van Heerden, F.R. (2008). An ethnobotanical survey of medicinal plants in
the south-eastern Karoo, South Africa. South African Journal of Botany. 74: 696-704.
van-Dam, R.M., Willett, W.C., Rimm, E.B., Stampfer, M.J. and Hu, F.B. (2002). Dietary fat and meat
intake in relation to risk of type 2 diabetes in men. Diabetes Care. 25: 417-24.
Verma, P.R., Itankar, P.R. and Arora, S.K. (2013). Evaluation of antidiabetic antihyperlipidemic and
pancreatic regeneration, potential of aerial parts of Clitoria ternatea. Brazilian Journal of
Pharmacognosy. 23: 819-829.
Verpoorte, R. (1989). Some phytochemical aspects of medicinal plant research. Journal of
Ethnopharmacology. 25: 43-59.
Wang, Y. J., Fu, G.S., Chen, F.M. and Wang, H. (2009). The effect of valsartan and fluvastatin on the
connective tissue growth factor expression in experimental diabetic cardiomyopathy. Zhonghua
Nei Ke Za Zhi. 48: 660-665.
Wansi, J.D., Lallemand, M.C., Chiozem, D.D., Toze, F.A., Mbaze, L.M., Naharkhan, S., Iqbal, M.C.,
Tillequin, F., Wandji, J. and Fomum, Z.T. (2007). α-Glucosidase inhibitory constituents from stem
bark of Terminalia superba (Combretaceae). Phytochemistry. 68: 2096-2100.
Westerterp-Plantenga, M.S., Smeets, A. and Lejeune, M.P.G. (2005). Sensory and gastro intestinal satiety
effects of capsaicin on food intake. International Journal of Obesity. 29: 682-688.
Whitelaw, B., Gayle, C., 2010. Gestational diabetes. Obstetrics, Gynaecology and Reproductive Medicine.
21:41-46.

249
Williamson, E., Okpako, D.T. and Evans, F.J. (1996). Selection, preparation and pharmacological
evaluation of plant material, Wiley, Chichester.
Wilson, R. and Islam, M.S. (2012). Fructose-fed streptozotocin-injected rat: an alternative model for type
2 diabetes. Pharmacological Reports. 64: 129-139.
Wilson, R. and Islam, M.S. (2012). Fructose-fed streptozotocin-injected rat: an alternative model for type
2 diabetes. Pharmacological Reports. 64: 129-139.
Winrow, V.R., Winyard, P.G., Morris, C.J. and Blake, D.R. (1993). Free radicals in inflammation: second
messengers and mediators of tissue destruction. British Medical Bulletin. 49: 506-522.
Woode, E., Ameyaw, E.O., Boakye-Gyasi, E. and Abotsi, W.K.M. (2012). Analgesic effects of an ethanol
extract of the fruits of Xylopia aethiopica (Dunal) A. Rich (Annonaceae) and the major constituent,
xylopic acid in murine models. Journal of Pharmacy and Bioallied Sciences. 4: 291-301.
World Health Organization (WHO). (1980). The WHO expert committee on diabetes mellitus, Technical
Report Series, WHO, Geneva.
World Health Organization (WHO). (2001). Legal status of traditional medicines and
complementary/alternative medicine: a worldwide review. World Health Organization Technical
Report Series Geneva.
Xiao, J., Ni, X., Kai, G. and Chen, X. (2013a). A review on structure-activity relationship of dietary
polyphenols inhibiting α-amylase. Critical Reviews in Food Science and Nutrition. 53: 497-506.
Xiao, J., Ni, X., Kai, G. and Chen, X. (2013b). Advance in dietary polyphenols as α-glucosidases inhibitors:
a review on structure-activity relationship aspect. Critical Reviews in Food Science and Nutrition.
53: 818-836.
Xu, B.J. and Chang, S.K.C. (2007). A comparative study on phenolic profiles and antioxidant activities of
legumes as affected by extraction solvents. Journal of food science. 72: S159-S166.
Yamagishi, S., Ueda, S., Matsui, T., Nakamura, K. and Okuda, S. (2008). Role of advanced glycation
(AGEs) and oxidative stress in diabetic retinopathy. Current Pharmaceutical Design. 14: 962-968.
Yang, S.S., Cragg, G.M., Newman, D.J. and Bader, J.P. (2001). Natural product-based anti-HIV drug
discovery and development facilitated by the NCI developmental therapeutics program. Journal of
Natural Products. 64: 265-277.
Young, H.Y., Luo, Y.L., Cheng, H.Y., Hsieh, W.C., Liao, J.C. and Peng, W.H. (2005). Analgesic and anti-
inflammatory activities of [6]-gingerol. Journal of Ethnopharmacology. 96: 207-210.
Zhang, X. (2001). Legal status of traditional medicines and complementary/alternative medicine. A
worldwide review. World Health Organization Technical Report Series. 2: 5-41.
250
Zimmer, A.R., Leonardi, B., Miron, D., Schapoval, E., Oliveira, J.R. and Gosmann, G. (2012). Antioxidant
and anti-inflammatory properties of Capsicum baccatum: from traditional use to scientific
approach. Journal of Ethnopharmacology. 139: 228-233.

251
Appendix I
PUBLICATIONS

252

253

254
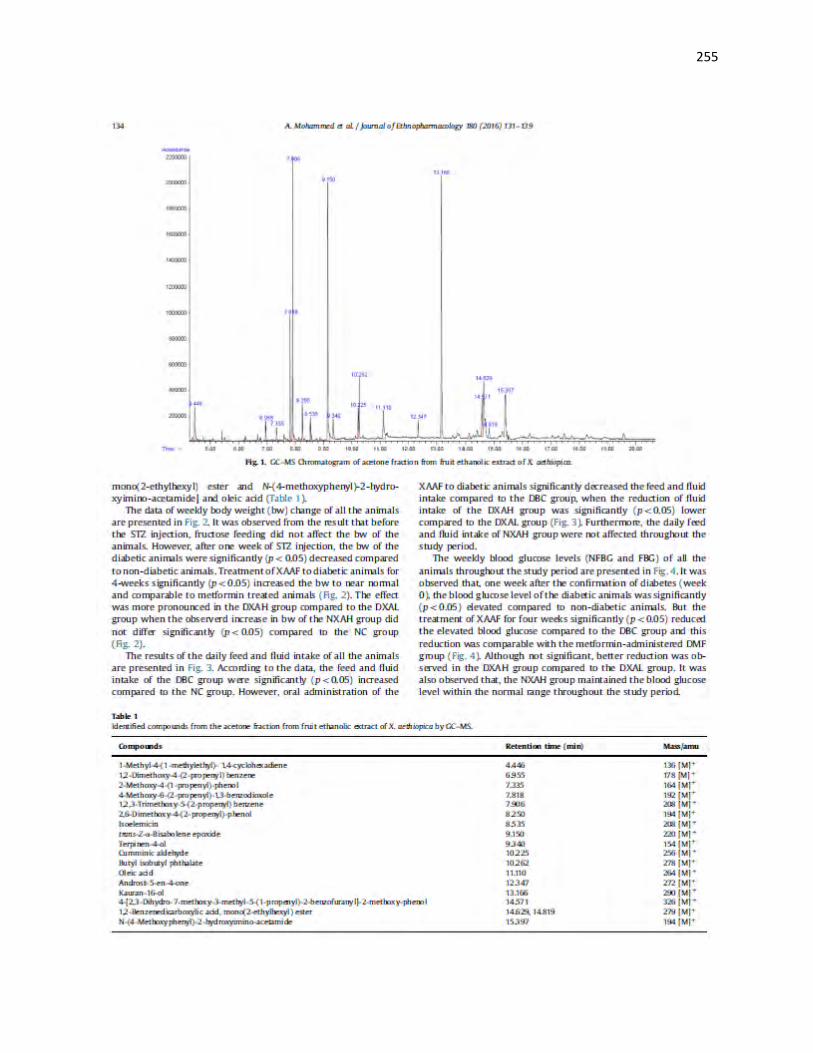
255

256
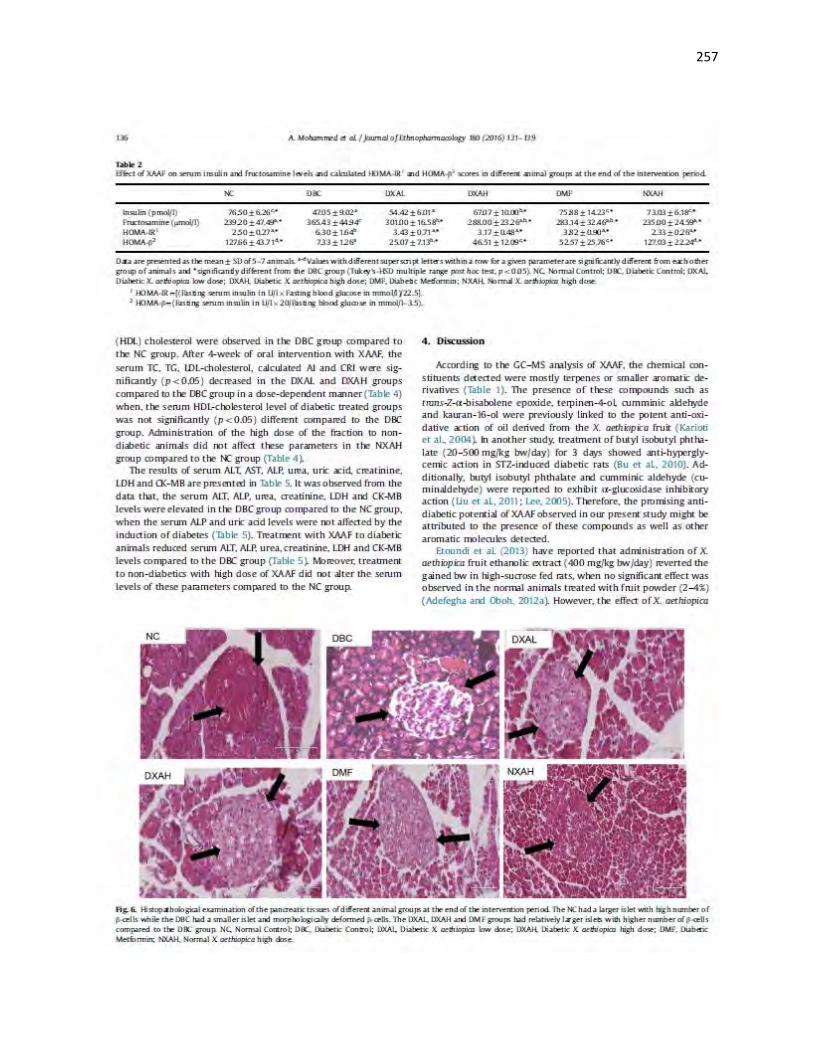
257
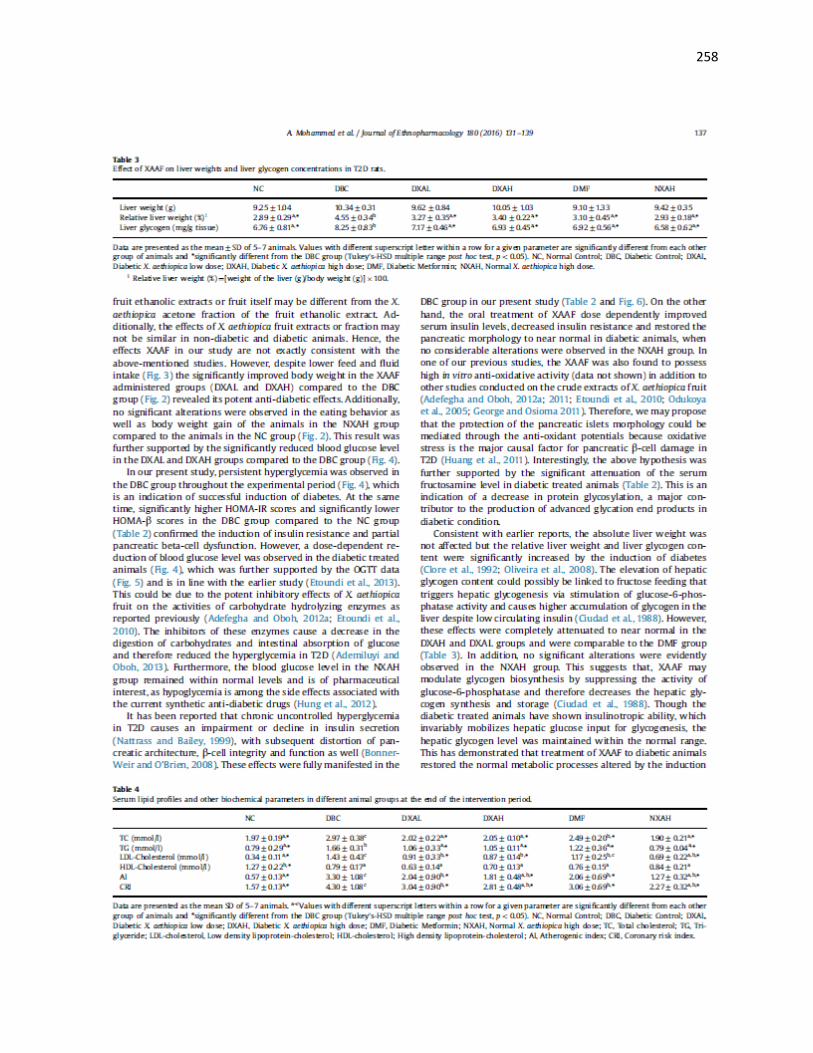
258
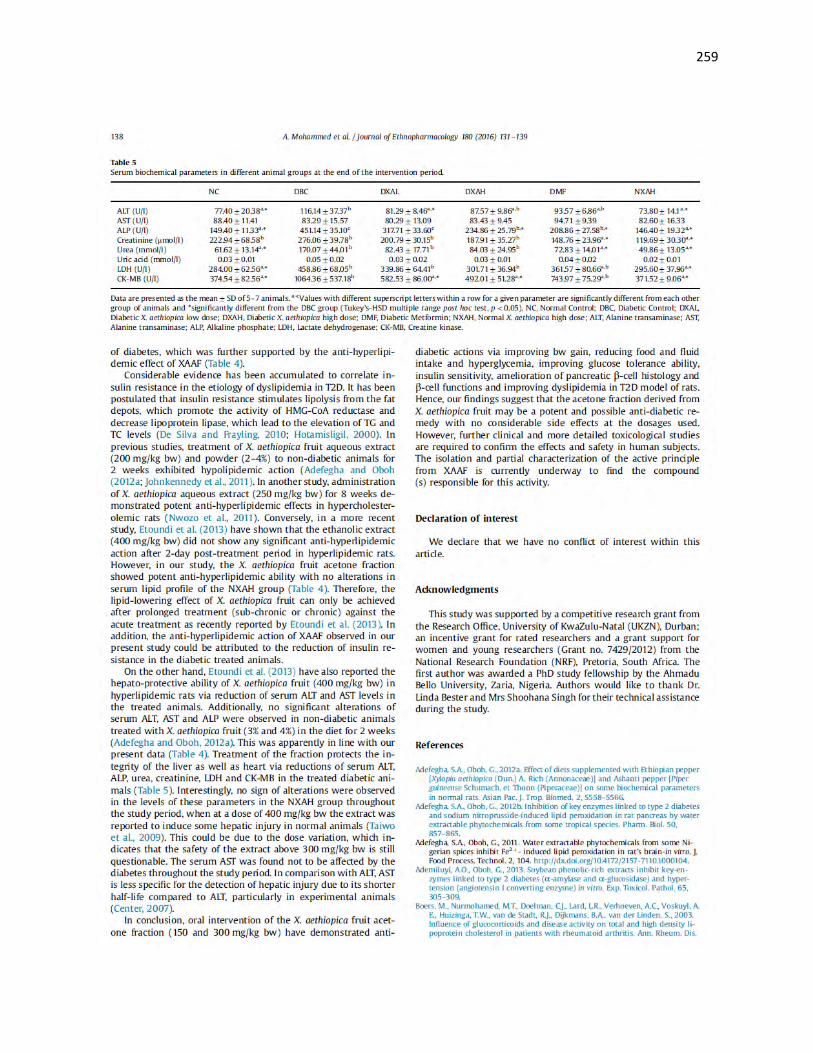
259
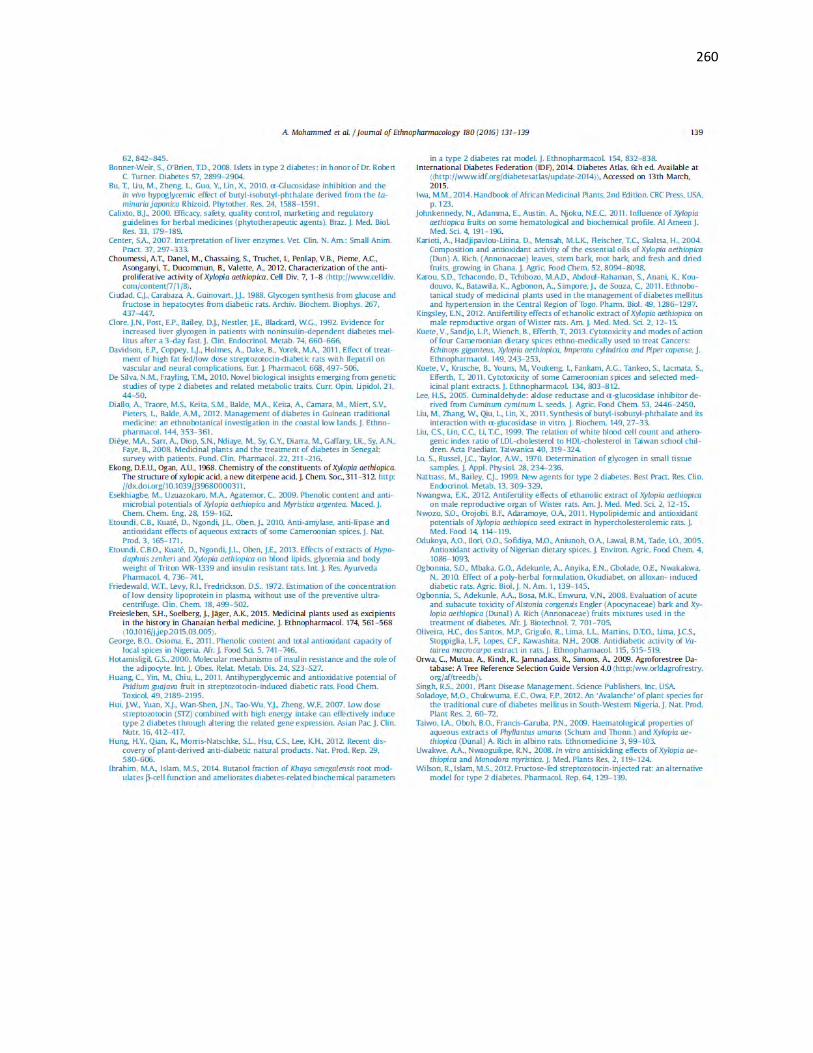
260

310
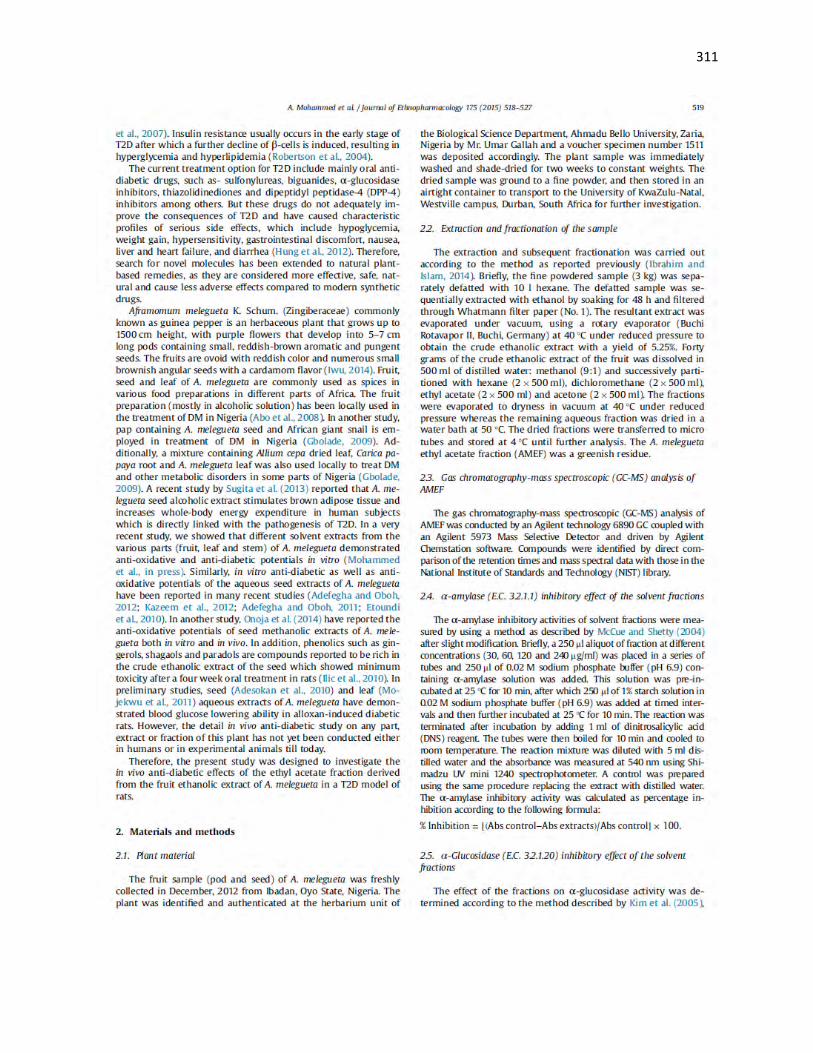
311
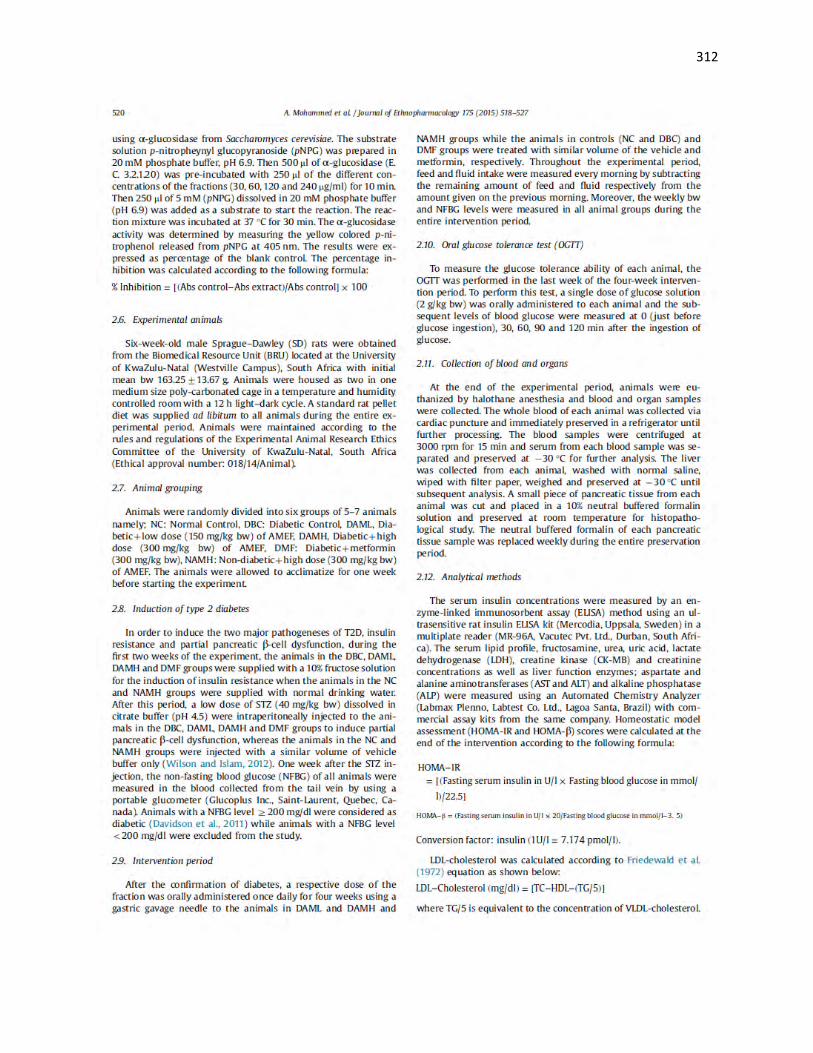
312
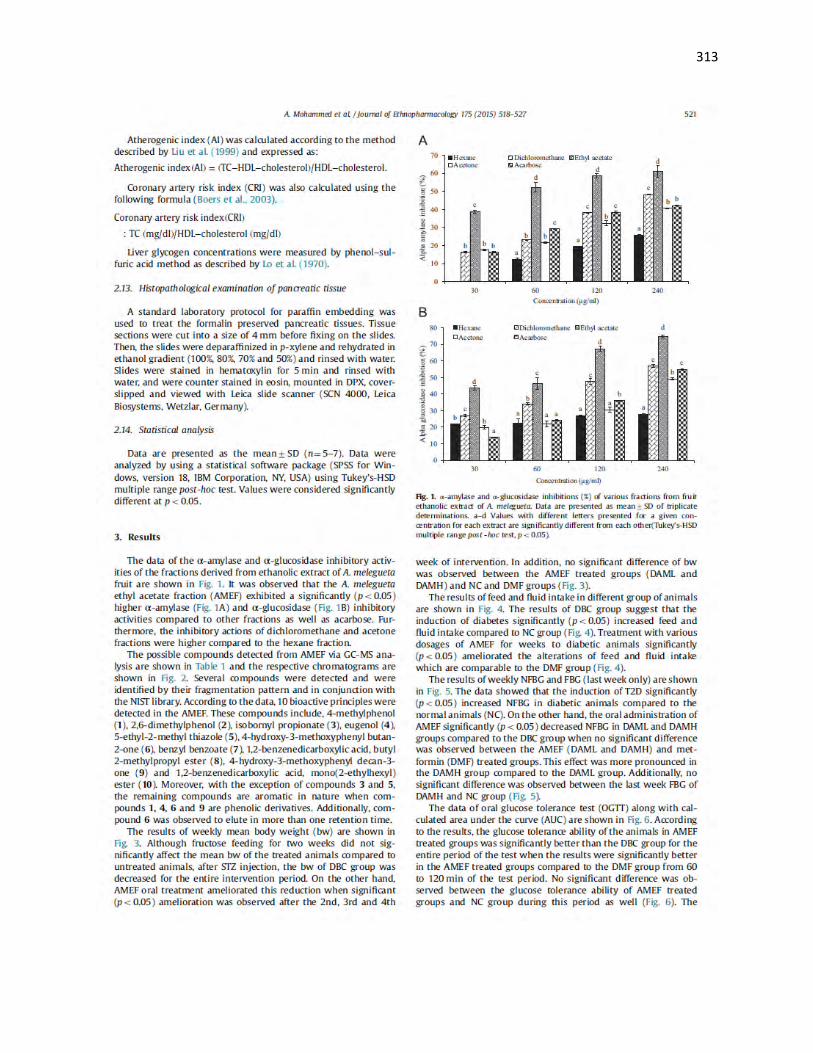
313
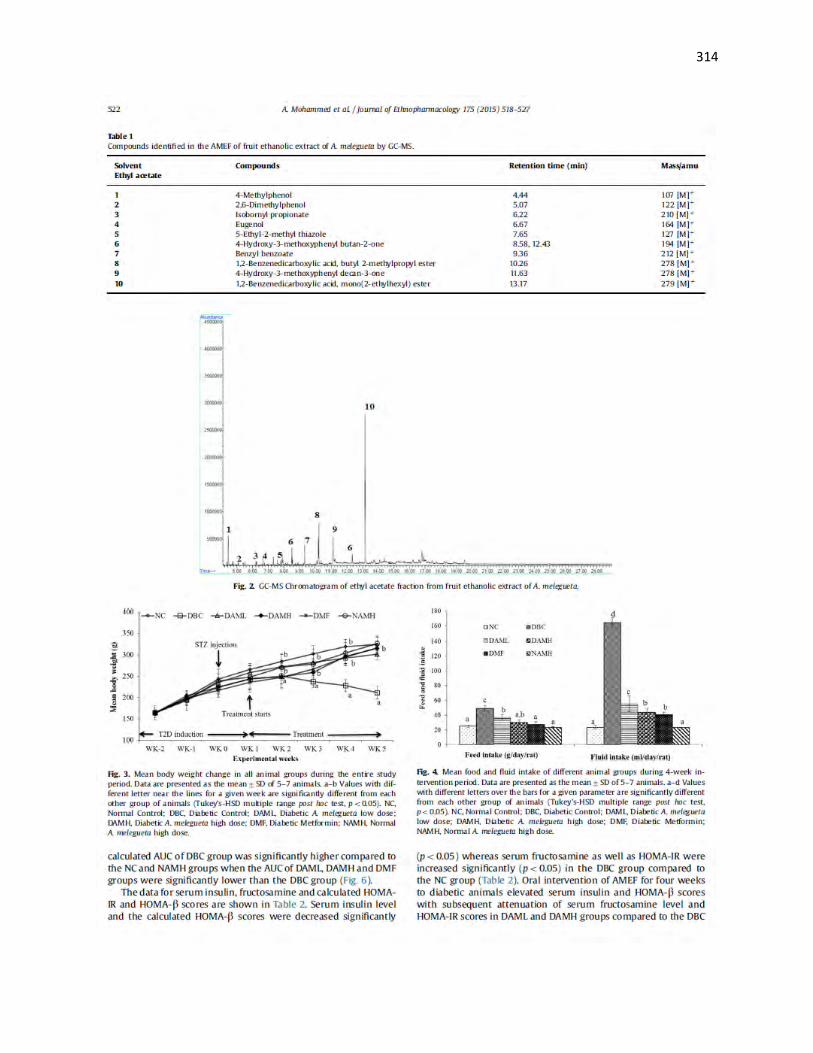
314

315

316

317
318
319
320

321

322

323
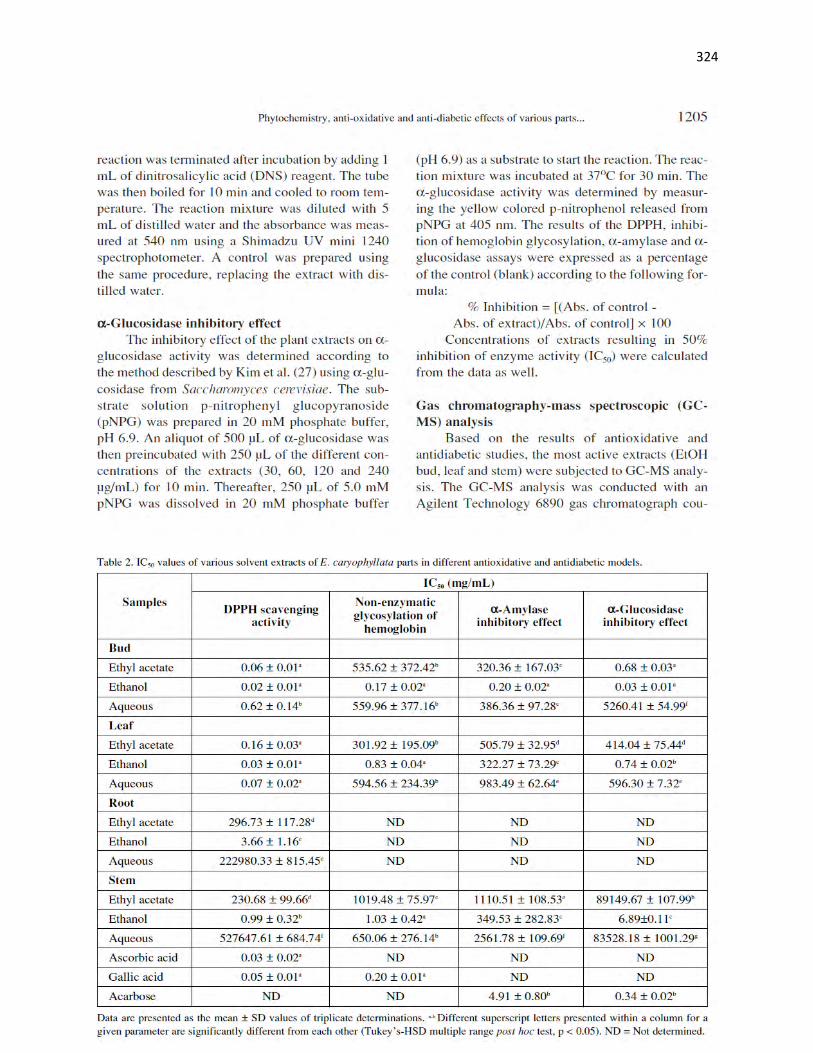
324
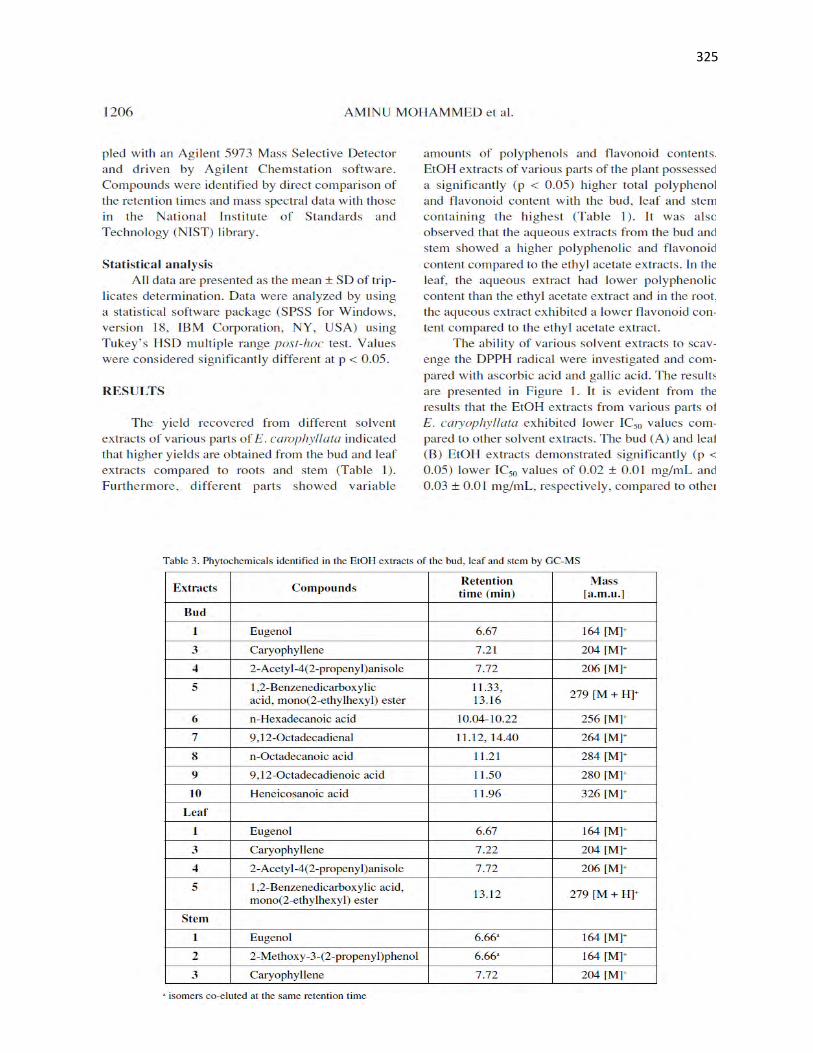
325

326
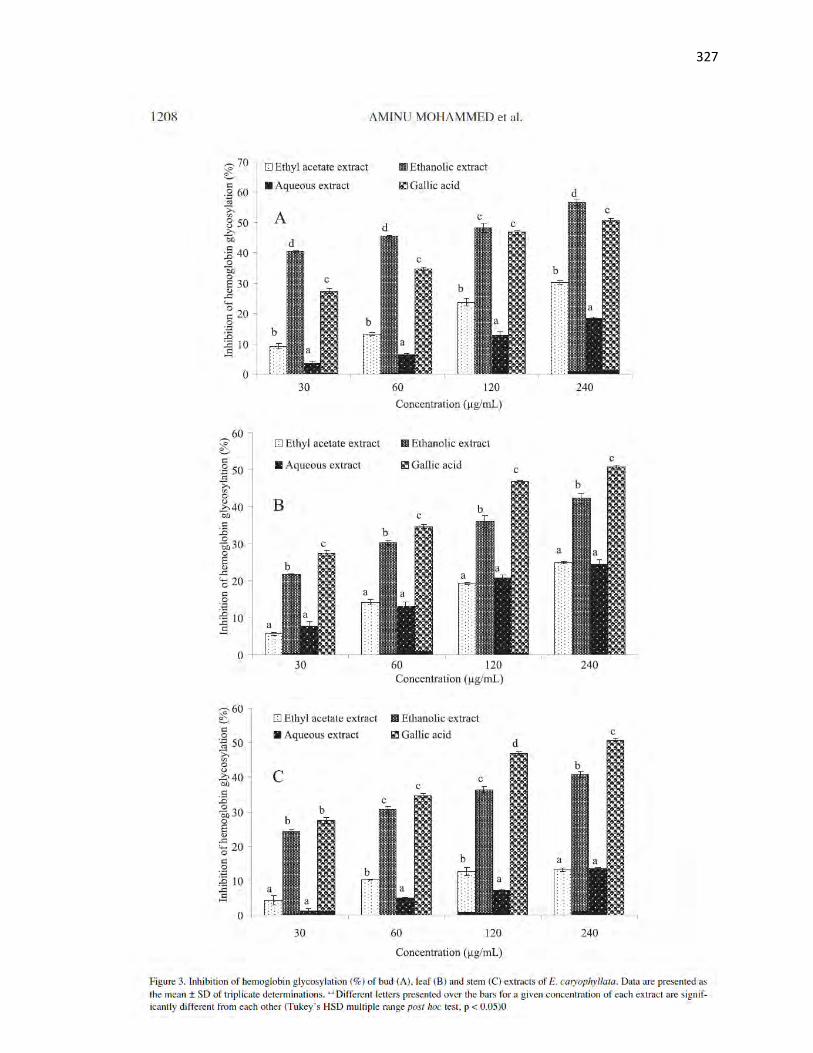
327
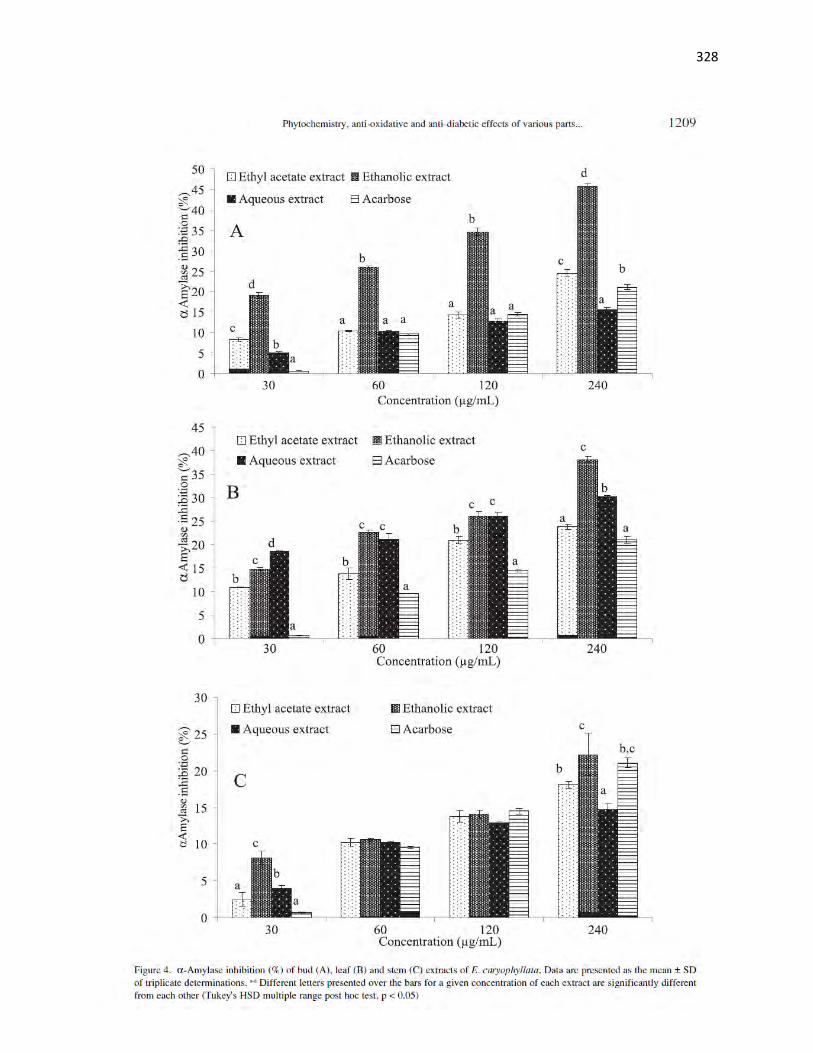
328
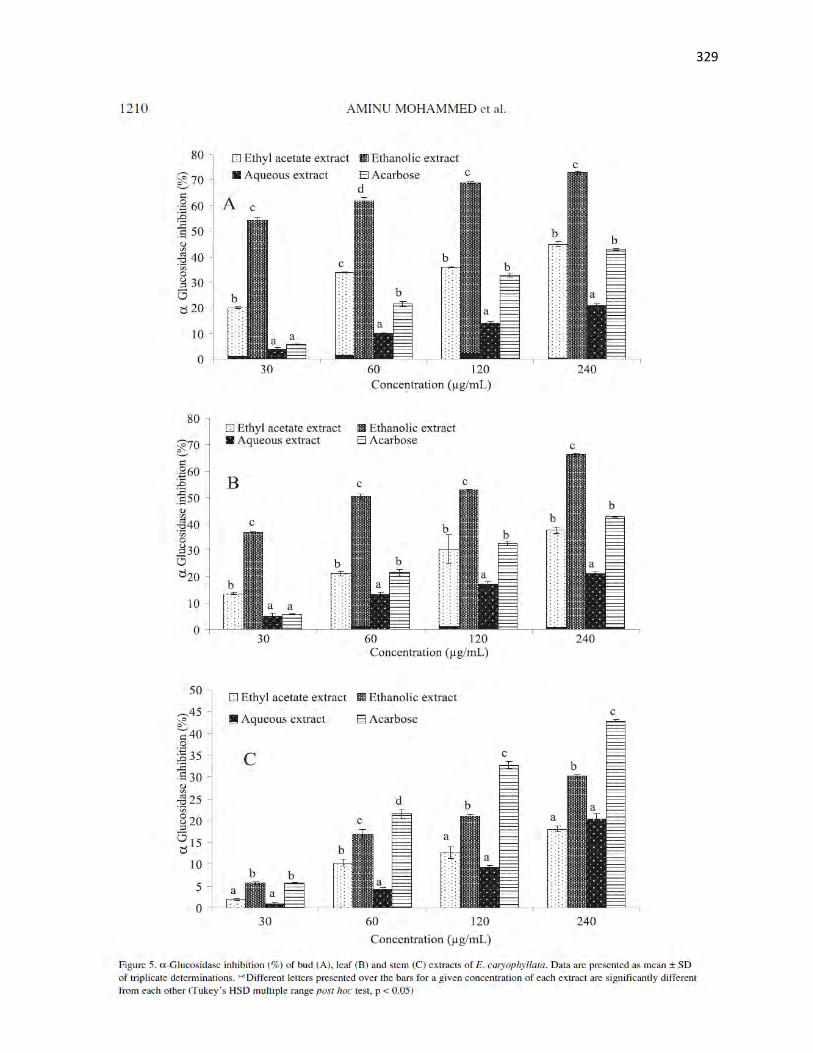
329
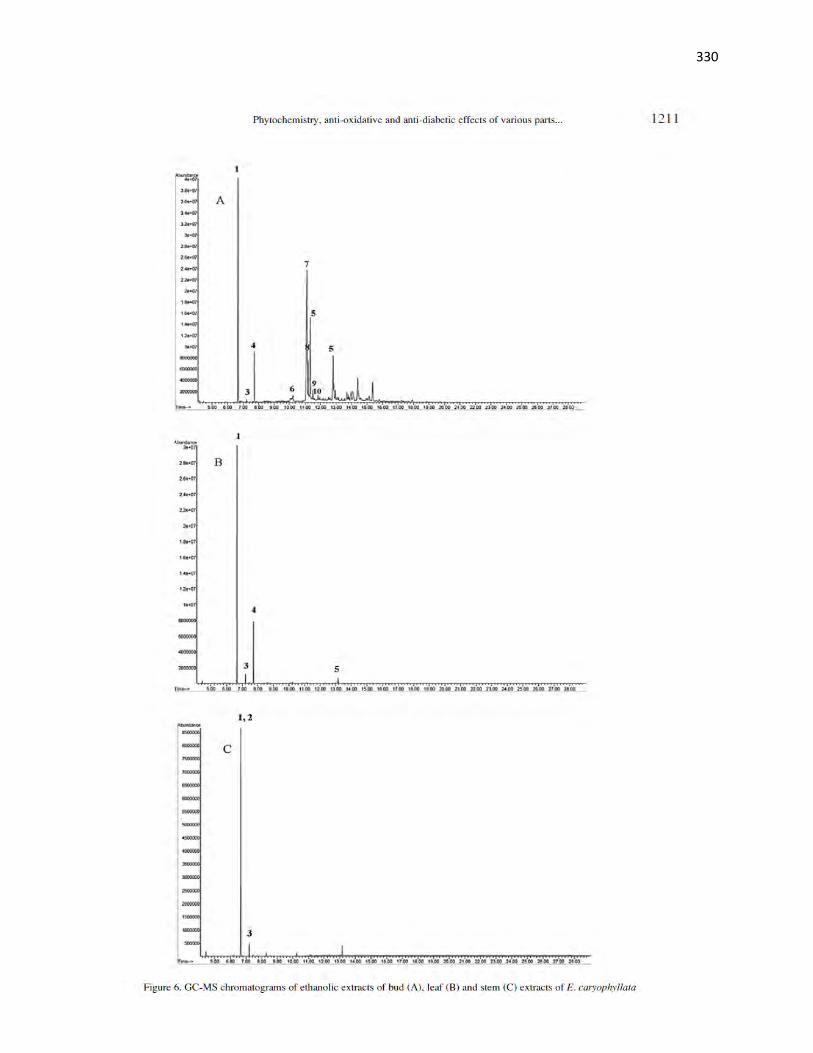
330

331

332
333

334
335
Appendix II
NMR SPECTRA
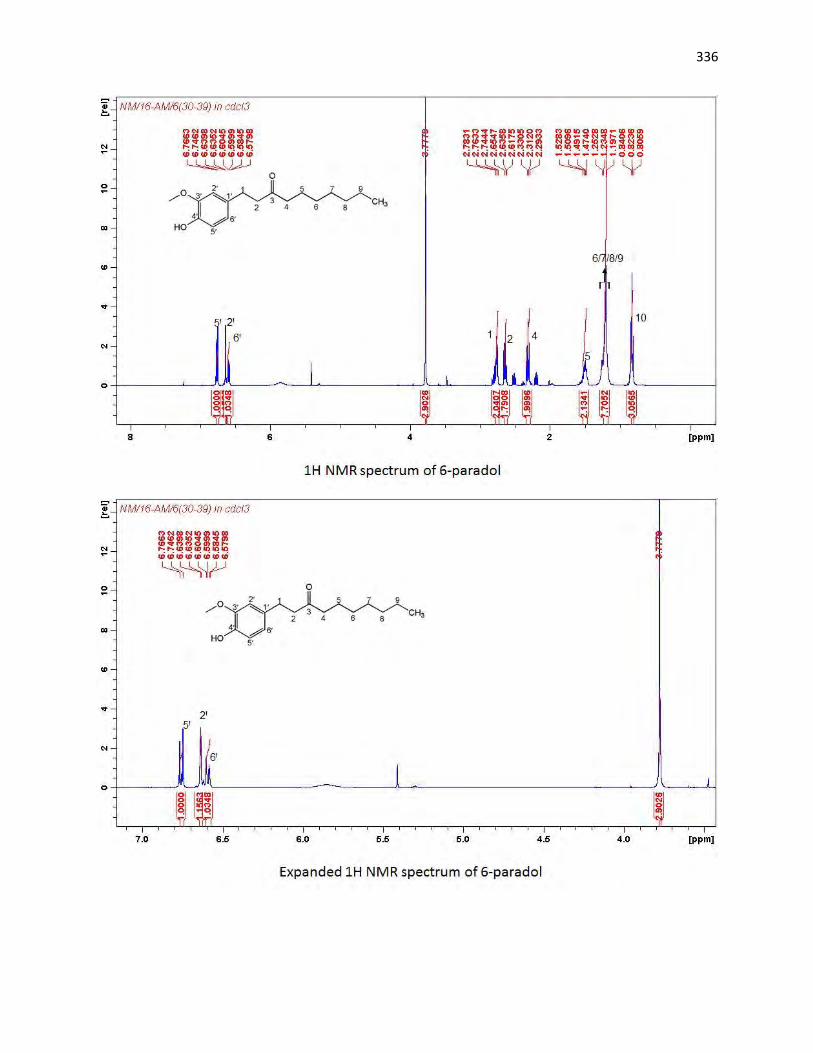
336
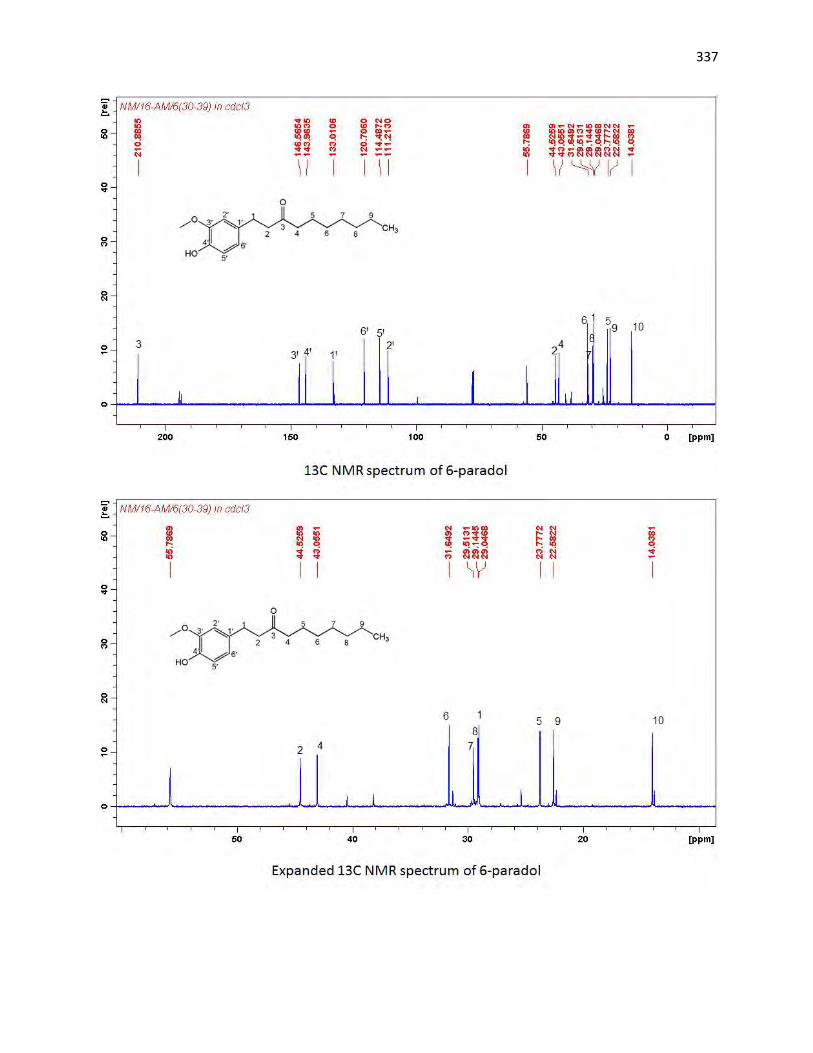
337

338

339
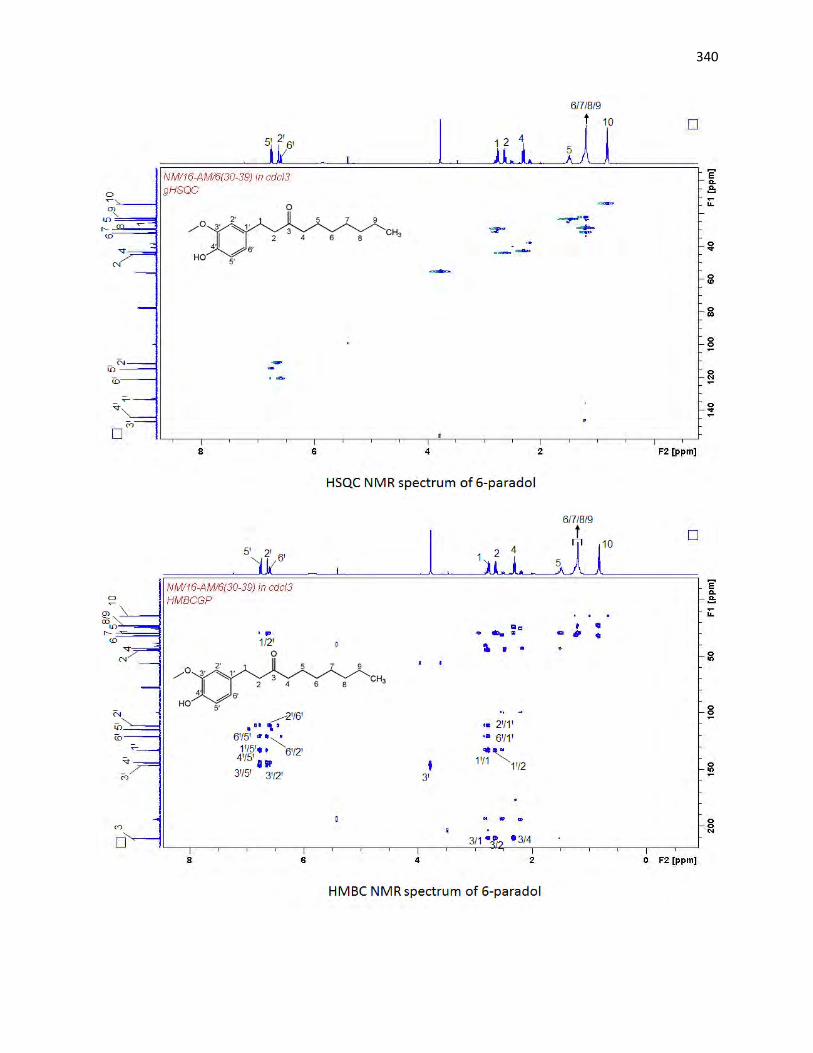
340

341
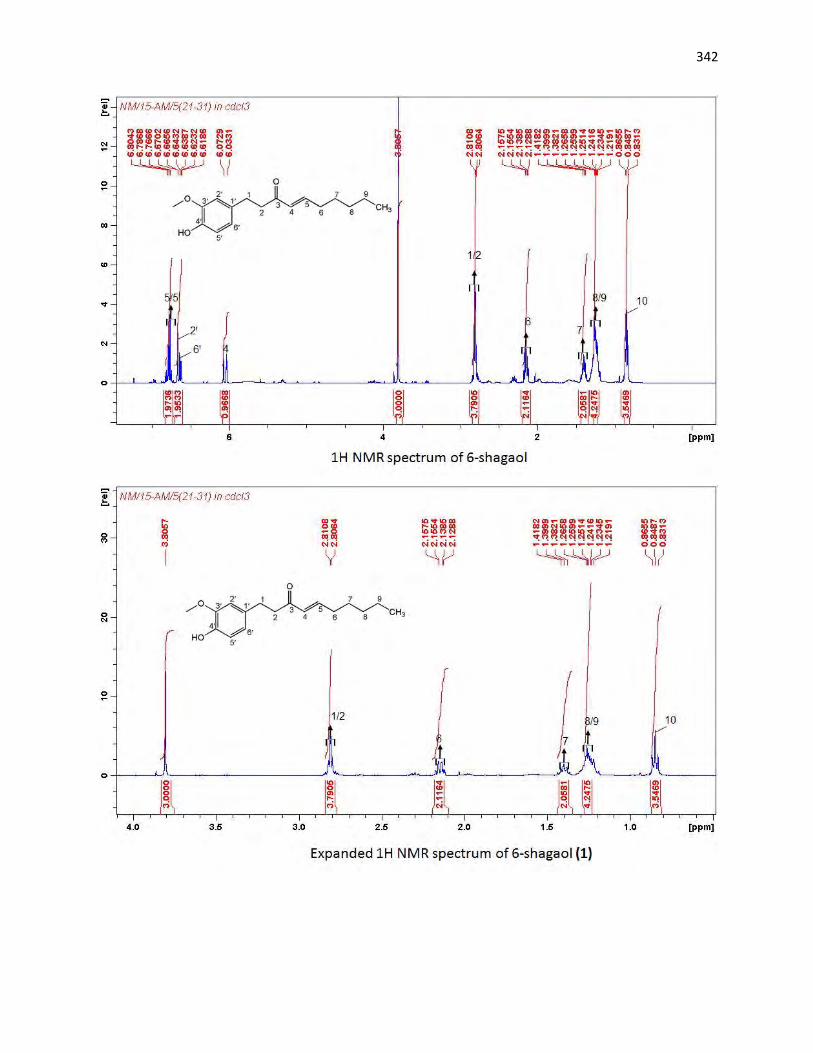
342

343

344

345
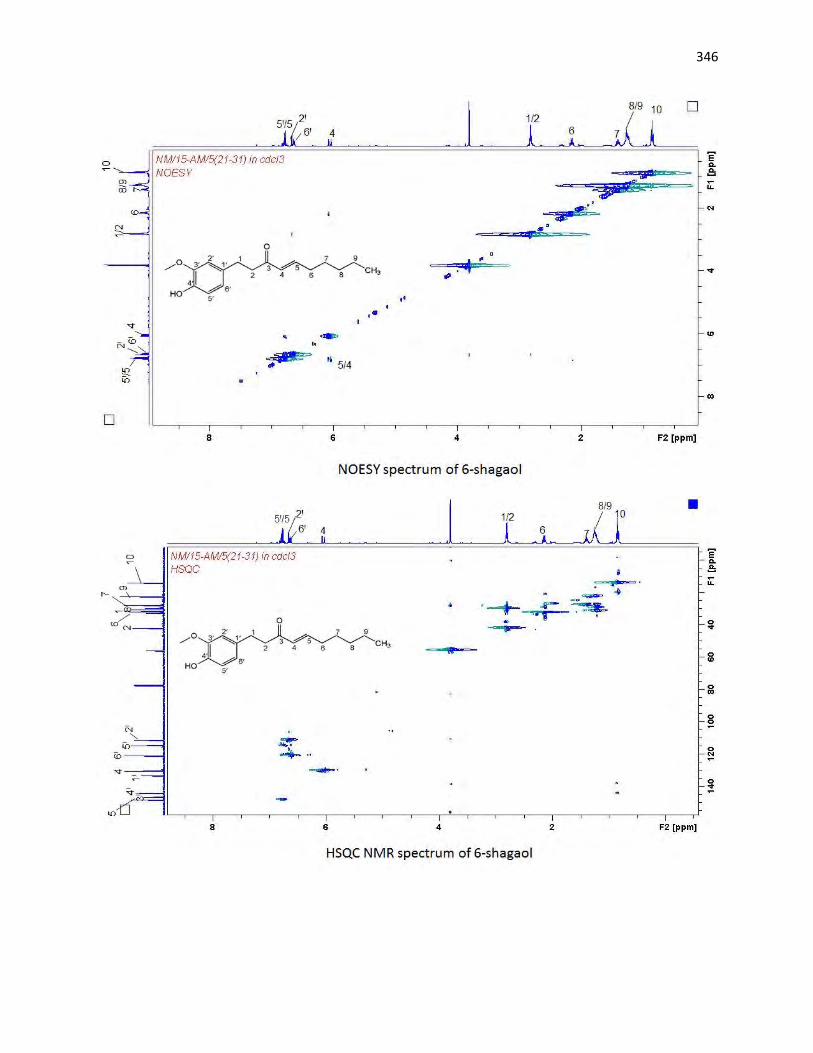
346
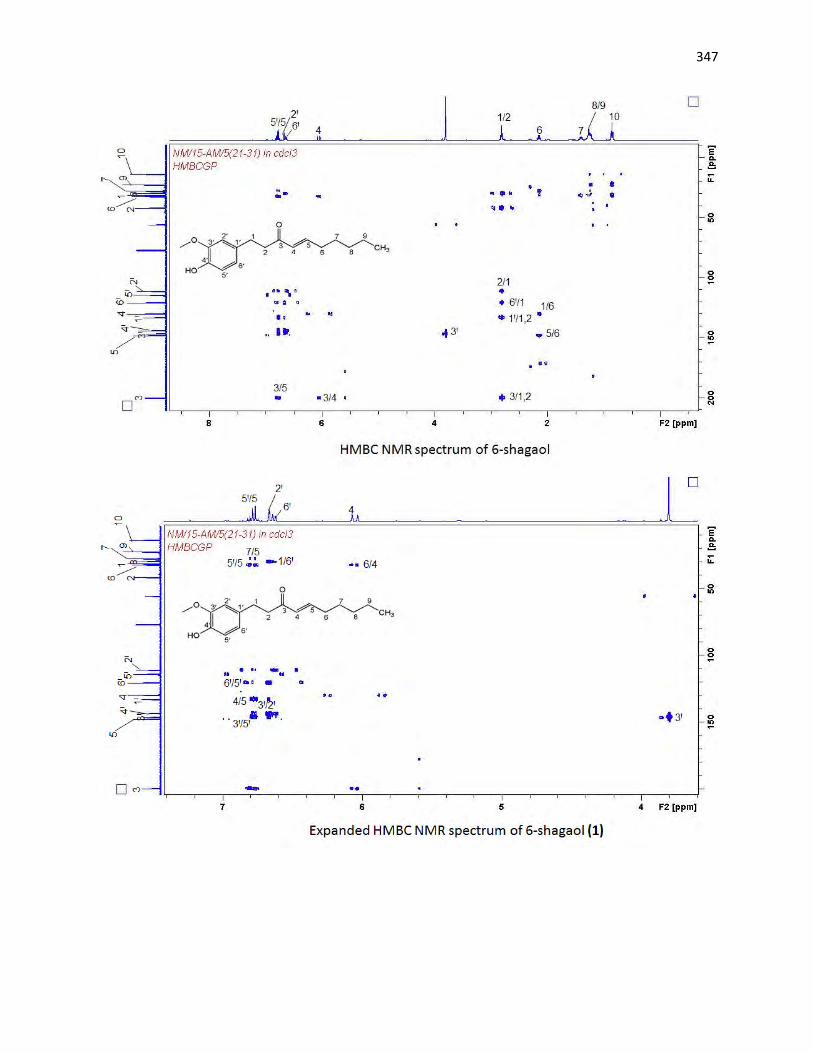
347

348

349

350
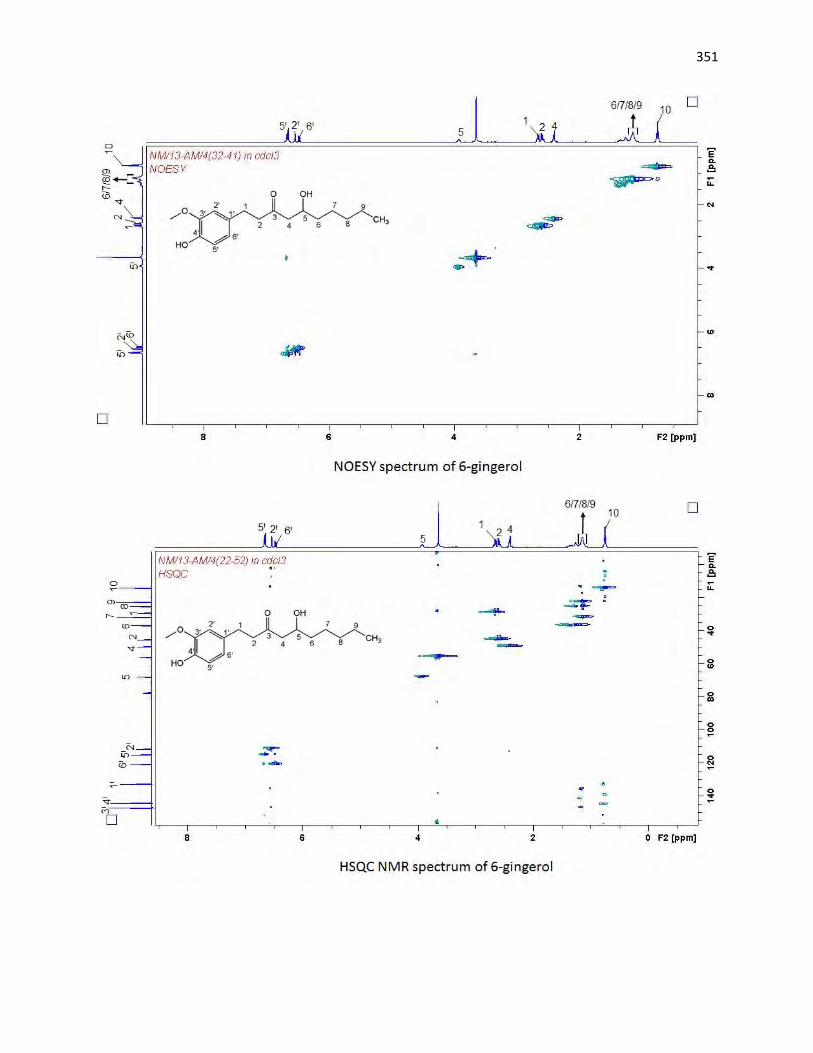
351
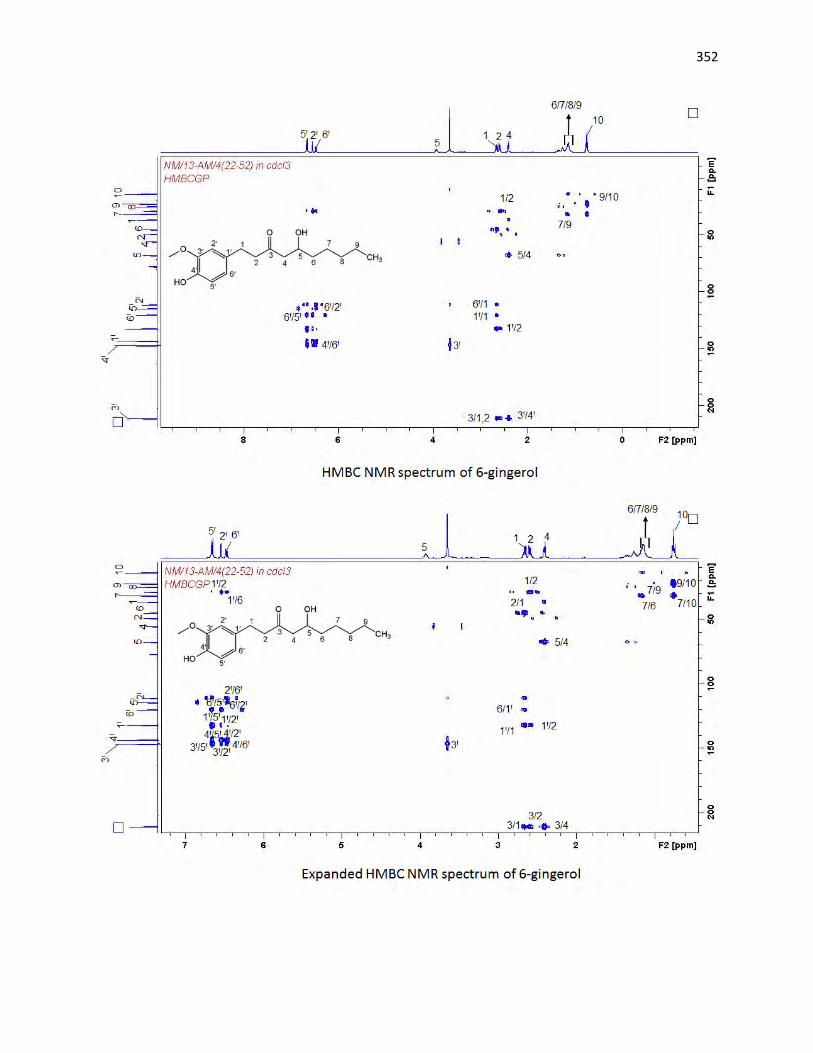
352
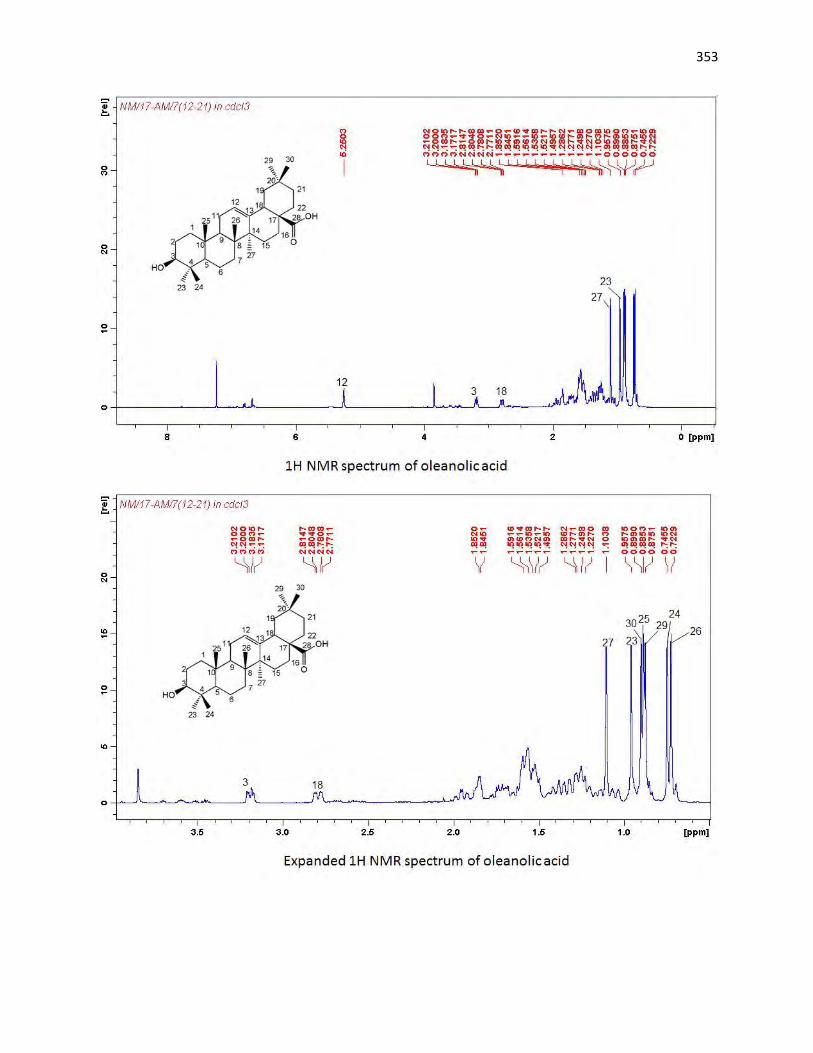
353

354
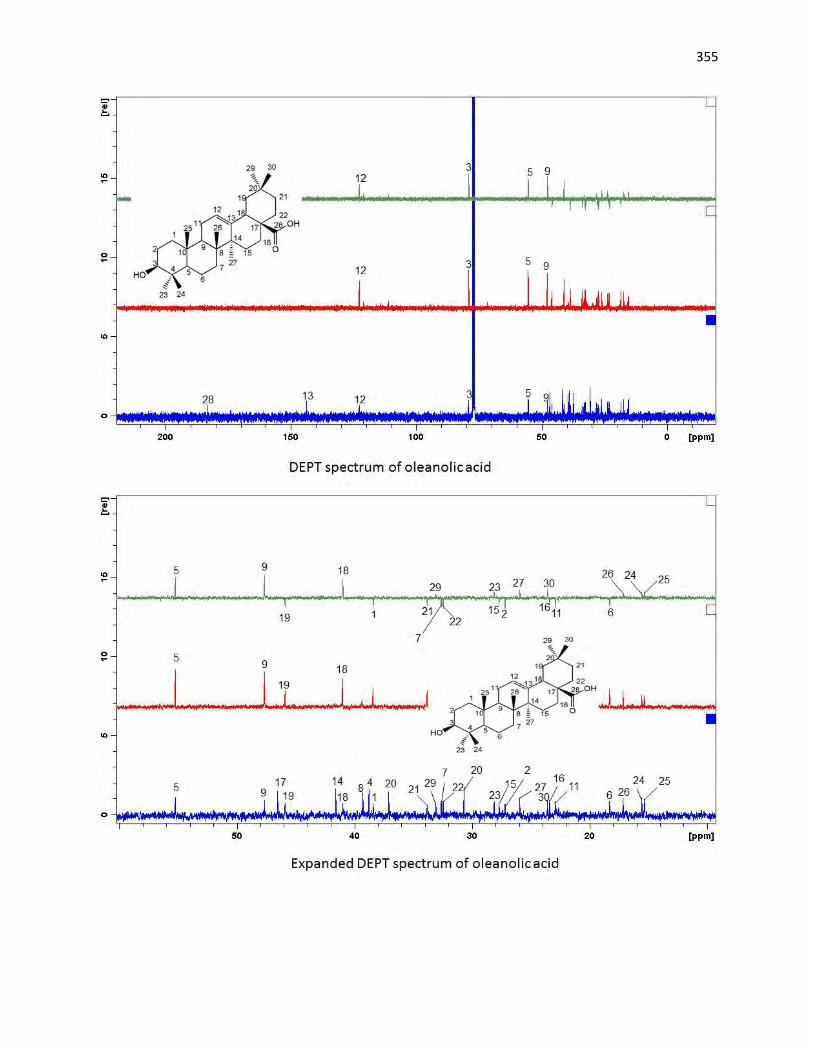
355
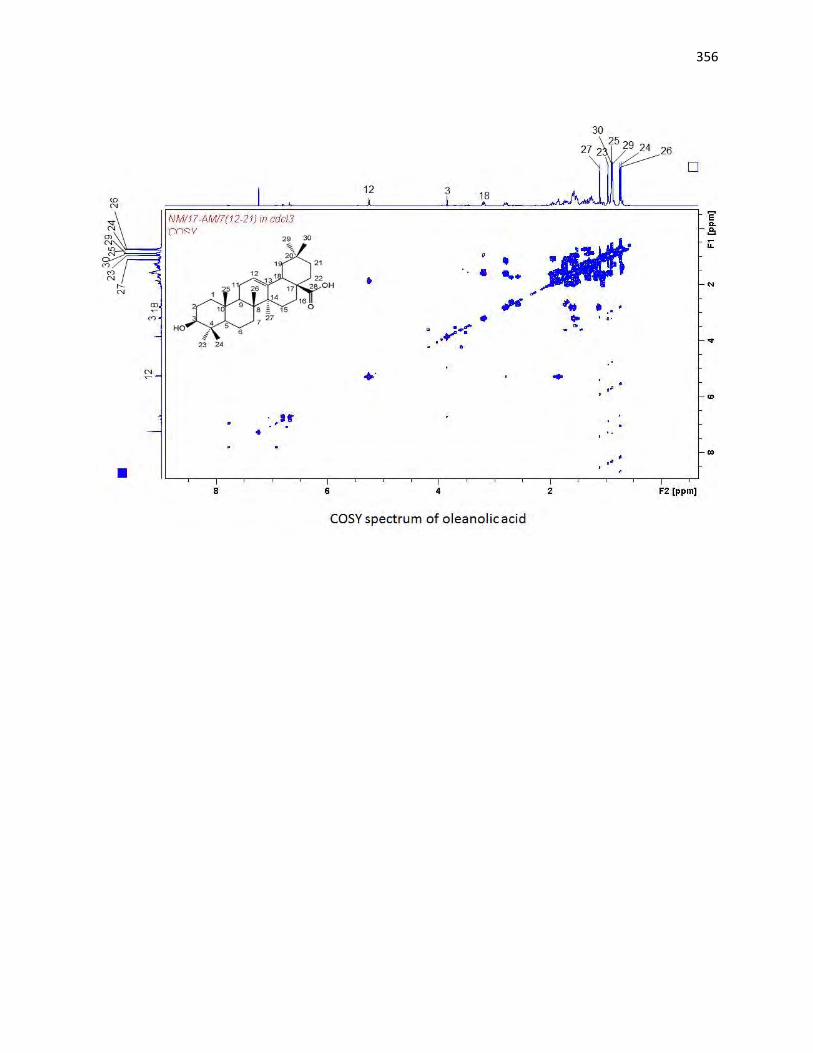
356
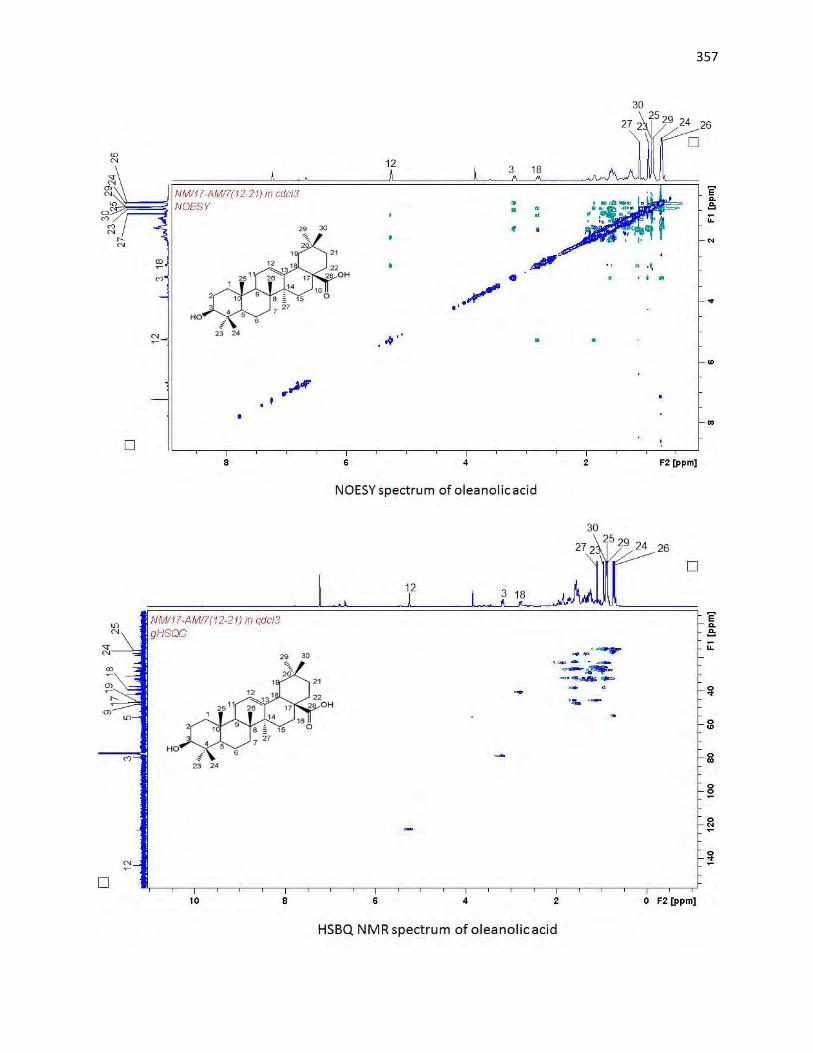
357
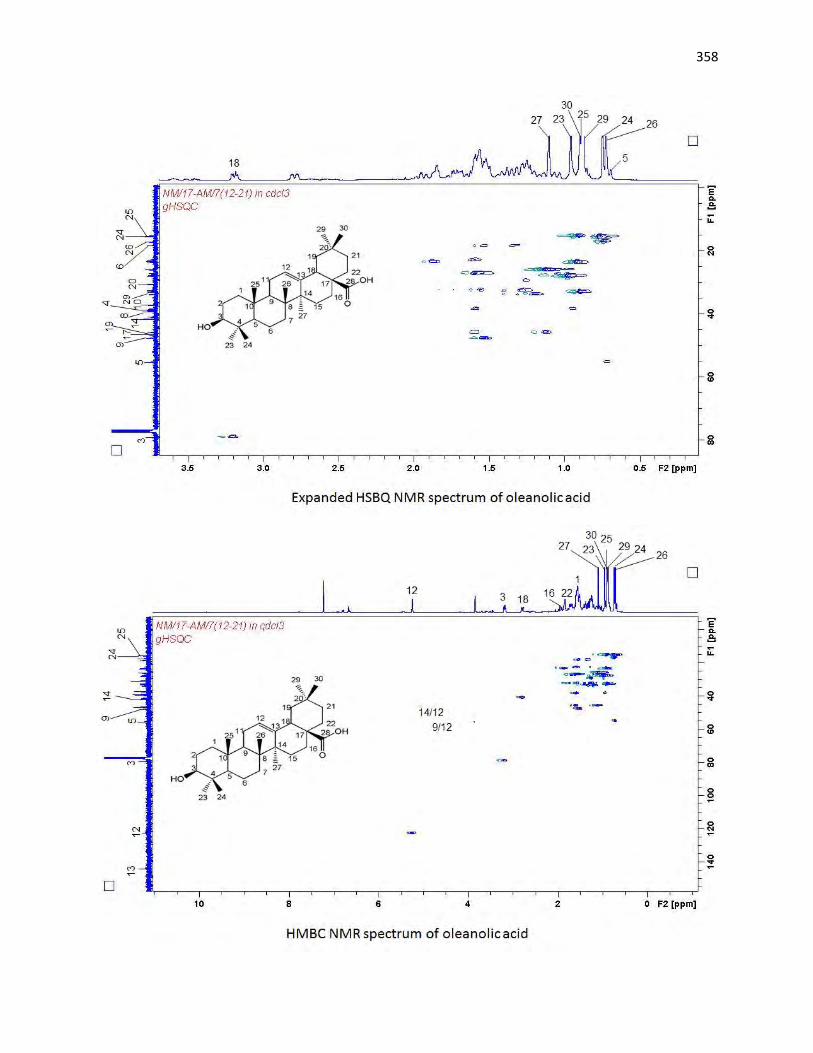
358
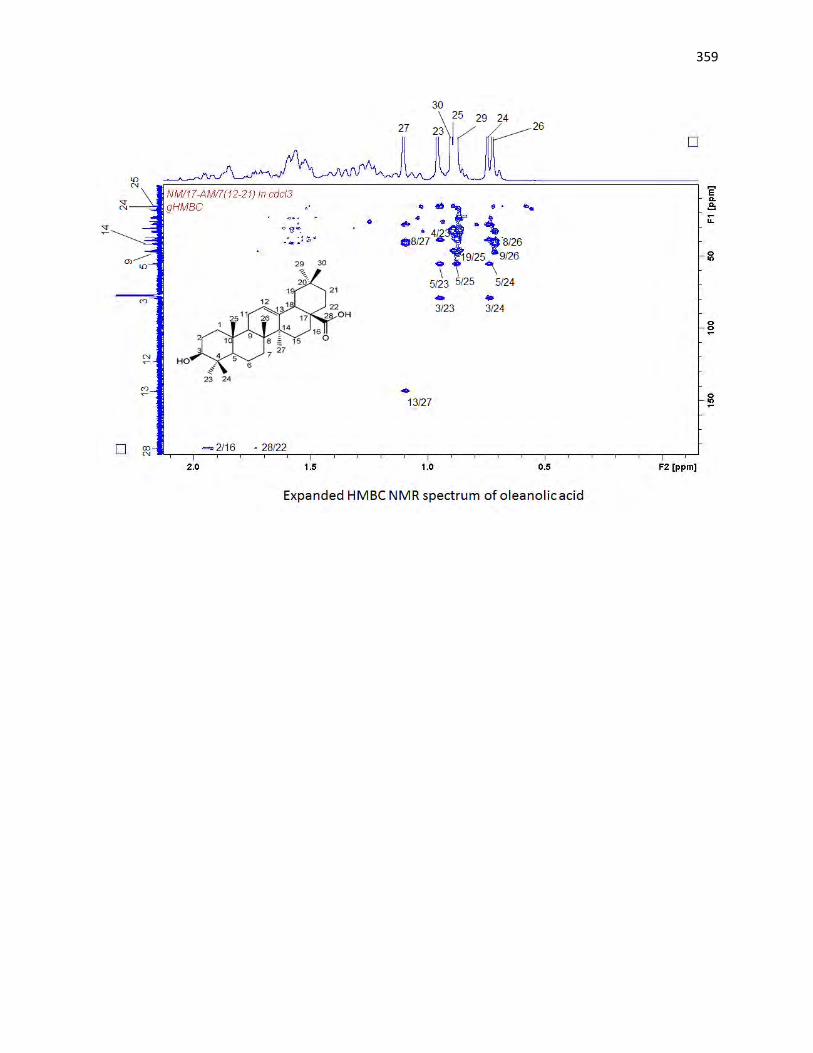
359