UNIVERSITY OF KWAZULU-NATAL CUSTOMER SATISFACTION ...
119
UNIVERSITY OF KWAZULU-NATAL CUSTOMER SATISFACTION OF CALL CENTRE SERVICE DELIVERY iN SOUTH AFRiCA by SONIL BOOR! MASTER OF BUSINESS ADMINISTRATION 2009
-
Upload
khangminh22 -
Category
Documents
-
view
2 -
download
0
Transcript of UNIVERSITY OF KWAZULU-NATAL CUSTOMER SATISFACTION ...

UNIVERSITY OF KWAZULU-NATAL
CUSTOMER SATISFACTION OF CALL CENTRE SERVICE DELIVERY iN SOUTH AFRiCA
by
SONIL BOOR!
MASTER OF BUSINESS ADMINISTRATION
2009

i
DECLARATION
I, Sonil Ramchander Bodri declare that
(i) The research reported in this dissertation, except where otherwise
indicated, is my original work.
(ii) This dissertation has not been submitted for any degree or examination at
any other university.
(iii) This dissertation does not contain other persons’ data, pictures, graphs or
other information, unless specifically acknowledged as being sourced
from other persons.
(iv) This dissertation does not contain other persons’ writing, unless
specifically acknowledged as being sourced from other researchers.
Where other written sources have been quoted, then:
a) their words have been re-written but the general information attributed
to them has been referenced;
b) where their exact words have been used, their writing has been placed
inside quotation marks, and referenced.
(v) Where I have reproduced a publication of which I am an author, co-author
or editor, I have indicated in detail which part of the publication was
actually written by myself alone and have fully referenced such
publications.
(vi) This dissertation does not contain text, graphics or tables copied and
pasted from the Internet, unless specifically acknowledged, and the
source being detailed in the dissertation and in the References sections.
Signed:

ii
Acknowledgements
I wish to express my sincere appreciation and gratitude to the following individuals,
without whose assistance, this study would not have been possible:
• My Guru, without whom this dissertation would not be possible. This study
was written by faith and would have not come to a completion without His
divine grace.
• My supervisor, Professor Anesh Maniraj Singh, for affording me the
opportunity to be supervised by himself. Your mentorship, guidance and
support has enabled me to see the completion of this dissertation.
• My respondents, who have given this dissertation validity and meaning.
• The Graduate School of Business staff, Mrs. Kiru Naidoo, Mrs Wendy Clarke
and Mrs Ntutu Sogoni for willingly assisting with communication between my
supervisor and myself.
• My MBA colleagues who have supported and encouraged me throughout this
semester.
• My Wife, who has been an instrumental figure in supporting me through words
of confidence, encouragement and assisting with communicating with the
University throughout my years at Business School. Thank you for the
patience and sacrifice given to this episode of my life.
• My Daughter who has been the most patient, understanding and sweet little
baby one could ever have whilst embarking on a journey such as this.

iii
Abstract
The call centre is often the first human interaction a customer has with a company
and many customers form their perception of a company based on their experience
with that call centre. The call centre industry is growing rapidly and South Africa is
fast becoming a desired destination for outsourced call centres. The main aim of this
study was to determine the level to which people are satisfied with call centre service
delivery in South Africa and the reasons causing customer dissatisfaction.
A non probability sample of 106 consumers was drawn from the city of Durban with
respondents being over the age of 21 years. The sample was composed of 61%
females and 39% males. Of the sample, 55% were between the age group of 21-30
years, 25% were between the age group of 31-40 years, 12% between the age
group of 41-50 years and 8% between the age group of 41-50 years. Data was
collected using a self administered questionnaire as this proved to be most effective
for this study. Respondents from all companies and parts of Durban were recruited
as participant for the study. The SPSS software package was used to capture and
analyse the data. Frequency bar graphs and cross tabulation frequency results were
used to present the data.
Statistical results showed that there was a positive association between service
quality and customer satisfaction. Descriptive frequency analysis highlighted issues
that are causing most dissatisfaction to people using the call centre. Results
indicated that users of the call centres found customer service levels to be
acceptable which was in contrast to international findings where results indicated
that consumers were less than 30% happy with call centre service delivery.
Results showed that consumers increasingly wish to communicate with companies
using newer technologies, and value having access to multiple channels. It was
found that web chat followed by SMS and email was a preferred medium of
communicating with the call centre. The findings of the study indicated that long
waiting times on the phone, calls being dropped, lack of accountability, irrelevant
voice menus and repetition were the main reasons for their causes of customer
dissatisfaction.

iv
Table of Contents
Description Page
Declaration i
Acknowledgements ii
Abstract iii
Table of Contents iv
List of Figures x
List of Tables xi
CHAPTER ONE
Introduction 1
1.1 Introduction 1
1.2 Motivation for the Study 1
1.3 Focus of the Study 3
1.4 Problem Statement of the Study 3
1.5 Research Questions 4
1.6 Objectives 5
1.7 Limitations of the Study 6
1.8 Chapter Summary 8
CHAPTER TWO
Literature Review 9
2.1 Introduction 9
2.2 Call Centres 9

v
2.2.1 History of Call Centres 10
2.2.2 Different Types of Call Centres 12
2.2.2.1 In House Vs Outsourced Call Centres 12
2.2.2.2 Business Process Outsourcing (BPO) 12
2.2.3 Call Centres in South Africa 13
2.2.3.1 Geographic Split Between Call Centres in South Africa 13
2.2.4 South African Call Centres Vs International Call Centres 14
2.2.5 The Global View 15
2.2.6 Convergent National Trends 16
2.2.7 Call Centre Investment 18
2.3 Call Centre Service Quality 20
2.3.1 Measuring Service Quality 21
2.3.2 Service Quality in the UK 22
2.3.3 Factors Impacting on Call Centre Service Quality 23
2.3.3.1 Call Centre Agents 24
2.3.3.2 Work Performance 24
2.3.3.3 Service Delivery Innovation 25
2.4 Customer Satisfaction 26
2.4.1 Link Between Service Quality and Customer Satisfaction 28
2.4.1.1 Customer Retention 28
2.4.1.2 Earning Customer Loyalty 29
2.4.2 Customer Service and Expectations 30
2.4.3 The Causes of Customer Frustration 30
2.4.4 Customer Satisfaction in the US 31

vi
2.4.5 Customer Satisfaction in the UK 32
2.4.5.1 Impact of Negative Customer Experiences 32
2.4.5.2 Benefits of Positive Customer Experiences 33
2.4.6 Improving Customer Satisfaction 33
2.5 Regional Trends 34
2.5.1 Impact of Skills Shortage on Service Delivery in South Africa 35
2.6 Summary 36
CHAPTER THREE
Research Methodology
3.1 Introduction 37
3.2 Aim of the Study 37
3.2.1 Objectives 37
3.3 Data Collection Strategies 38
3.3.1 Advantages of the Self Administered Questionnaire 39
3.3.2 Definition of Sampling 40
3.3.3 Sampling Approach and Technique 40
3.4 Research Design and Methods 40
3.4.1 Quantitative Research 40
3.4.1.1 Construction of the Instrument 41
3.4.1.2 Recruitment of the Study Participants 41
3.4.2 Pretesting and Validation 42
3.4.3 Administration of the Questionnaire 42
3.5 Analysis of the Data 42
3.5.1 Descriptive Statistics 43
3.5.2 Frequency Distribution 44

vii
3.5.3 Visual Representation of the Data 44
3.6 Summary 44
CHAPTER FOUR
Presentation of Results 45
4.1 Introduction 45
4.2 Frequency Analysis 45
4.3 Results for Objectives 63
4.3.1 Objective One 63
4.4.2 Objective Two 64
4.4.3 Objective Three 65
4.4.4 Objective Four 67
4.4.5 Objective Five 68
4.4.6 Objective Six 70
4.4.7 Objective Seven 72
4.5 Summary 72
CHAPTER FIVE
Discussion of Findings 74
5.1 Introduction 74
5.2 Objective One 74
5.3 Objective Two 75
5.3.1 Rude Agents 75
5.3.2 Empathetic Agents 75
5.3.3 Customer Loyalty 76
5.3.4 Courtesy Call 77
5.4 Objective Three 77

viii
5.4.1 Lack of Personal Service 77
5.4.2 Long Waiting Times 78
5.4.3 Dropped Calls 78
5.4.4 Lack of Accountability 79
5.4.5 Bouncing Calls 80
5.4.6 Repetition 80
5.4.7 Irrelevant Voice Menus 81
5.4.8 Access to Supervisor 81
5.5 Objective Four 82
5.6 Objective Five 82
5.7 Objective Six 83
5.8 Objective Seven 84
5.9 Objective Eight 84
5.10 Customer Reactions to Poor Customer Service 84
5.11 Preffered Means of Communication 85
5.12 Summary 86
CHAPTER SIX
Conclusions and Recommendations 88
6.1 Introduction 88
6.2 Outcome of this Study 88
6.3 Recommendations and Implications 89
6.3.1 Recommendations from this Study 89
6.3.2 Implications of this Study 91
6.4 Recommendations for Future Studies 93
6.5 Summary 94
ix
BIBLIOGRAPHY xii
Appendix 1 Introductory Letter xvi
Appendix 2 Consent Letter xvii
Appendix 3 Questionnaire xviii
Appendix 4 Ethical Clearance xxiv

x
List of Figures
No. Description Page
2.1 The Generic Value Chain 11
2.2 Primary Market Served by Call Centre 14
2.3 Total Cost of Ownership 19
2.4 Management Philosophy 27
4.1 Genders of Respondents 45
4.2 Respondents Age 46
4.3 Respondents Race Group 47
4.4 Frequency of Using a Call Centre 48
4.5 Lack of Personalised Service 49
4.6 Long Waiting Times 50
4.7 Dropped Calls 51
4.8 Lack of Accountability 52
4.9 Rude Agents 53
4.10 Agent Empathy 54
4.11 Transfer of Calls 55
4.12 Repeating Information 56
4.13 Irrelevant Voice Menus 57
4.14 Access to Supervisor 58
4.15 Customer Loyalty 59
4.16 Courtesy Calls 60
4.17 Customer Reactions to Poor Customer Service 61
4.18 Preferred Medium of Communication 62

xi
List of Tables
No. Description Page
2.1 Call Centres and Employment 17
2.2 Operating Expenses 20
4.1 Frequency Results for Objective One 63 4.2 Frequency Results for Objective Two 64
4.3 Frequency Results for Objective Three 65
4.4 Additional Frequency Results for Objective Three 66 4.5 Cross Tabulation Between Sector and Service Satisfaction 67 4.6 Cross Tabulation Between Race and Service Satisfaction 68 4.7 Cross Tabulation Between Race and Service Satisfaction 69 4.8 Cross Tabulation Between Age and Service Satisfaction 70 4.9 Cross Tabulation Between Age and Irrelevant Voice Menu’s 71 4.10 Cross Tabulation Between Gender and Service Delivery 72

xii
Bibliography
Benefits of superior customer service. 2007. [ONLINE]. Available WWW:
www.mcg.com (Accessed 11 May 2009).
Benner, C., Lewis, C. & Omar, R. 2007, The South African Call Centre Industry: A Study of Strategy, Human Resource Practices and Performance, Kogan Page Ltd., United Kingdom
Bryman, A. & Bell, A. 2007. Business Research Methods. 2nd ed. Oxford University
Press Inc., New York.
Buisness process outsourcing. 2009. [ONLINE]. Available WWW:
www.wikipedia.org/wiki/Business_process_outsourcing (Accessed 3 March 2009)
Call centre. 2009. [ONLINE]. Available WWW: www.datamonitor.com (Accessed 3
March 2009).
Call Centre Africa. 2005. [ONLINE]. Available WWW: www.customersatisfactionincall centres/literature/didata survey.mht (Accessed 5 May 2009).
Call Centres – Cause for Concern. 2000. [ONLINE]. Available WWW: www.mintel.co.uk (Accessed 5 May 2009).
Call Centres. 2008. [ONLINE]. Available WWW: www.wkipedia/callcentres/org
(Accessed 7 April 2009).

xiii
Campbell, J.S. 2007, Customer Satisfaction with Call Center Largely Relies on First
Call Resolution and Offshoring, [Online]. Available WWW:
www.tmcnet.com/news/2007/06/12/2706248.htm (Accessed 6 June 2009).
Consumers twice as vocal about bad customer experiences. 2008. [ONLINE]. Available WWW: www.customer satisfaction in callcentres/literature/consumers twice as vocal about bad customer experiences.mht (Accessed 5 May 2009).
Cook, S. 2002. Customer Care Excellence – How to Create an Effective Customer
Focus. Kogan Page Limited, United Kingdom.
Cronin, J.J. and Taylor, S.A. 1992. Measure Service Quality. Journal of Marketing,
Vol. 56, No. 2, pp 55 – 68.
Customer Self-Service Preferences Report. 2008. [ONLINE]. Available WWW: http://www.nuance.com/ (Accessed 4 April 2009)
Customer satisfaction falls despite call center efforts. 2008. [ONLINE]. Available
WWW: www.searchcrm.com (Accessed 7 May 2009).
Denison, D.R., Haaland, S. & Goelzer, P. 2004. Corporate Culture & Organisational
Effectiveness. Organisational Dynamics, Vol. 33, No. 1. [Online]. Available WWW:
www.sciencedirect.com (Accessed 5 May 2009)
DTI 2007, BPO Government Assistance & Support Programme, [Online]. Available WWW: www.bpo2sa.org.za (Accessed 8 June 2009).
Genesys Global Consumer Survey. 2007. [ONLINE]. Available WWW:
www.mintel.co.uk (Accessed 3 June 2009).
Ghauri, P. & Gronhaug, K. 2002. Research Methods in Business Studies- A Practical
Guide, Pearson Education, United Kingdom.

xiv
Gillian, A. 2000. The Impact of customer care representatives on consumer
perceptions of value. International Journal of Service Industry Management, Vol. 9,
No.2, MIS Quartely, New Jersey.
Holman, D., BaBatt, R. & Holtgrewe, U. 2007, The Global Call Centre Report – International Perspectives on Management & Employment, [Online]. Available WWW: www.ilr.cornell.edu/globalcallcenter/upload/GCC-Intl-Rept-UK-Version.pdf (Accessed 10 June 2009). NEDLAC 200, Information & Communication Technologies Sector Summit, [Online]. Available WWW: www.nedlac.org.za/docs/agreements/ict.htm (Accessed 15 June 2009)
Odgers, P.G. 2008. The World of Customer Service. 2nd ed. Thomson South
Western, United States of America.
Outsourcing to South Africa. 2008. [ONLINE]. Available WWW: www.customer
satisfactionincallcentres/outsourcingtosouthafrica- SouthAfrica_info.mht (Accessed 3
June 2009).
Parasuraman, A., Zeithaml, V. A., & Berry, L. L. 1998. SERVQUAL: A Multiple-Item Scale for measuring consumer perceptions of service quality. Journal of Retailing, Vol. 64, No. 1, pp 12-40. Parasuraman et al. 2005. E-S-Qual: A multiple-item scale for assessing electronic service quality, Journal of Service Research, Vol. 7, No. 3.
Schneider, B. & White, S.S. 2004. Service Quality – Research Perspectives. Sage
Publications Ltd., California.
Szwarc, P. 2005. Researching Customer Satisfaction & Loyalty. Kogan Page Ltd., United Kingdom

xv
Smith, I. 2001. Meeting Customer Needs. Reed Educational and Professional
Publishing Ltd, London.
Willingham, R. 2005. Integrity Service. Simon & Schuster Inc., New York.

xvi
APPENDIX 1
Graduate School of Business
Dear Respondent,
MBA Research Project Researcher: Sonil Bodri (083 7788008)
Supervisor: Professor Anesh Singh (031 260 7564) Research Office: Ms P Ximba 031-2603587
I, Sonil Bodri am an MBA student at the Graduate School of Business, of the University of Kwazulu Natal. You are invited to participate in a research project entitled Customer Satisfaction of Call Centre Service Delivery in South Africa. The aim of this study is to investigate whether users from the city of Durban are satisfied with the level of service they are receiving from call centres. Through your participation I hope to understand your experience when calling a Call Centre. The results of the survey are intended to contribute to improving service levels of South African Call Centres. Your participation in this project is voluntary. You may refuse to participate or withdraw from the project at any time with no negative consequence. There will be no monetary gain from participating in this survey. Confidentiality and anonymity of records identifying you as a participant will be maintained by the Graduate School of Business, UKZN. If you have any questions or concerns about completing the questionnaire or about participating in this study, you may contact me or my supervisor at the numbers listed above. The survey should take you about 10 minutes to complete. I hope you will take the time to complete this survey. Sincerely Investigator’s signature____________________________________
Date_________________

xvii
APPENDIX 2
CONSENT FORM
Graduate School of Business
MBA Research Project Researcher: Sonil Bodri (083 7788008) Supervisor: Anesh Singh (031 260 7564) Research Office: Ms P Ximba 031-2603587
CONSENT
I, ____________________ hereby confirm that I understand the contents of this
document and the nature of the research project, and I consent to participating in the
research project.
I understand that I am at liberty to withdraw from the project at any time, should I so
desire.
SIGNATURE OF PARTICIPANT DATE
…………………………………………… ……………………

xviii
APPENDIX 3
Questionnaire: Customer Satisfaction of Call Centre Service Delivery in
South Africa - May 2009
MBA STUDENT-DISSERTATION RESEARCH STUDY
INSTRUCTIONS TO PARTICIPANTS
Please tick the relevant blocks for each of the questions/statements
1. Gender:
Male __ Female __
2. Age Group:
21-30 ___
31-40 ___
41-50 ___
51-60 ___
61 > ___
3. Race Group:
Black __
Coloured __
Indian __
White __

xix
4. Do you ever call a call centre?
1 2 3 4 5
Very Often Usually Seldom Rarely Never
5. How would your rate your experience?
1 2 3 4 5
Excellent Good Acceptable Poor Weak
6. What type of call centre do you call most often:
Banking ___
Telecom / Cellular ___
Retail ___
Insurance ___
Airlines ___
Entertainment ___
Travel ___
Other ___
7. I believe that call centres lack personal service.
1 2 3 4
Strongly Agree Agree Disagree Strongly Disagree
8. I often have to wait a long time when calling a call centre.
1 2 3 4 5
Very Often Usually Seldom Rarely Never

xx
9. My calls are often dropped when placed on hold during a query.
1 2 3 4 5
Very Often Usually Seldom Rarely Never
10. Call centre agents are not competent. They lack knowledge on their
products, systems and procedures.
1 2 3 4 5
Very Often Usually Seldom Rarely Never
11. Call centre agents lack accountability. They fail to live up to their promises
of calling back.
1 2 3 4 5
Very Often Usually Seldom Rarely Never
12. Call centre agents are rude and arrogant.
1 2 3 4 5
Very Often Usually Seldom Rarely Never
13. I feel that call centre agents need to be more patient and empathetic
during a query or complaint.
1 2 3 4
Strongly Agree Agree Disagree Strongly Disagree
14. I often get transferred from one department to the next when calling a call
centre.
1 2 3 4
Strongly Agree Agree Disagree Strongly Disagree

xxi
15. My complaints are seldom resolved.
1 2 3 4 5
Very Often Usually Seldom Rarely Never
16. I am often placed on hold by call centre agents due to their systems being
slow.
1 2 3 4
Strongly Agree Agree Disagree Strongly Disagree
17. I often have difficulty in understanding or communicating with call centre
agents.
1 2 3 4 5
Very Often Usually Seldom Rarely Never
18. I often have to repeat myself with a call centre agent.
1 2 3 4 5
Very Often Usually Seldom Rarely Never
19. I am often placed on hold by call centre agents whilst they are wrapping
up a previous call.
1 2 3 4 5
Very Often Usually Seldom Rarely Never
20. I believe that there are too many irrelevant voice prompts before leading
me to the one I require.
1 2 3 4
Strongly Agree Agree Disagree Strongly Disagree

xxii
21. I seldom get to speak to a supervisor or manager when faced with a query
that can not get resolved by a call centre agent.
1 2 3 4
Strongly Agree Agree Disagree Strongly Disagree
22. I would be willing to spend more with a company that improves its overall
customer experience.
1 2 3 4
Strongly Agree Agree Disagree Strongly Disagree
23. As a result of poor customer service with call centres, I have:
a) Shouted at the agent __
b) Hung up on the call __
c) Developed a headache or felt sick __
d) Have felt my chest tighten __
e) Other __
24. I will recommend a company to my friends and family if it provides
outstanding customer service.
1 2 3 4
Strongly Agree Agree Disagree Strongly Disagree
25. I would be more positive about call centres if I received a courtesy call just
for thanking me for my business received.
1 2 3 4
Strongly Agree Agree Disagree Strongly Disagree
26. I would rather communicate with a call centre by:
a) Email __
b) Web Chat __
c) SMS __
d) Phone __

xxiii
27. In general, how would you rate call centre service delivery in South Africa?
1 2 3 4 5
Excellent Good Acceptable Poor Weak
Thank you for your time.

xxiv
APPENDIX 4
RESEARCH OFFICE (GOVAN MBEKI CENTRE) WESTVILLE CAMPUS TELEPHONE NO.: 031 - 2603587 EMAIL: [email protected]
22 JUNE 2009
MR. SR BODRI (207510570) GRADUATE SCHOOL OF BUSINESS
Dear Mr. Sodri
ETHICAL CLEARANCE APPROVAL NUMBER: HSS/0276/09M
UNIVERSITY OF KWAZ ULU - NATAL
I wish to confirm that ethical clearance has been granted for the following project:
"Customer satisfaction of Call Centre Service Delivery in South Africa"
PLEASE NOTE: Research data should be securely stored in the school/department for a period of 5 years
Yours faithfully
~ . • I~ ~ ... ... . ........ ~~ ....... .............. ..... .. .. .... ... ...... ....... .. . MS. PHUMELELE XIMBA ADMINISTRATOR HUMANITIES & SOCIAL SCIENCES ETHICS COMMITTEE
cc. Supervisor (Prof. AM Singh) cc. Mrs. C Haddon
Founding Campuses: _ Edgewood Howard College Medical Sc hool _ Pietermaritzburg _ Westville

1
CHAPTER ONE
Introduction
1.1 Introduction
Call centres have inherently become the customer’s first point of contact before or
after a transaction and therefore responsible for creating and constructing either
negative or positive perceptions towards the quality of service offered by the
organisation as a whole. Customer expectations are increasingly growing and call
centres need to satisfy these expectations in order to ensure a thriving industry.
Delighting customers will become an increasingly difficult task in the predicted future
for all industry sectors. Petousis (2007) stated “Changing technology and generation
factors imply changes in customer expectations”.
Companies need to take action to address their customer service concerns, and can
include improving processes, improving staff loyalty and training, and improved
monitoring and control. This study investigated the root causes of customer
satisfaction and dissatisfaction of call centres in South Africa.
The sample was drawn from the city of Durban and results have provided
recommendations for call centres to improve its customer service channels. Included
in this research are comparisons of results to international benchmarks ensuring
reliability of information. This chapter will further explain the intentions behind this
research, the description of the objectives that was researched and the limitations of
the study.
1.2 Motivation for the Study
According to the survey carried out by ASK Afrika (2007), it was revealed that call
centres failed to personalise their service resulting in the customers having to go
back to the store where the transaction took place.

2
Businesses are now outsourcing their customer service function and rely on call
centres to sustain their brand value. This indicates that businesses place their faith
in these call centres to uplift their services and enhance their brands. The question
circulating around these issues relates to whether call centre service delivery
enhances or deteriorates a company’s image. The Genesys Global Survey (2007)
conducted in four parts of the world (US, Europe, Asia Pacific, Japan) revealed that
less than sixty percent of customers were happy with the service they receive from
call centres.
According to Odgers (2008), the very nature of customer service has changed
dramatically over the last decade. Today’s customers expect more than traditional
customer service. They want a company and its employees to exceed their
expectations which mean that they require exceptional customer service. Therefore
in order to provide exceptional service, call centres need to firstly understand the
perceptions of users call centre experience and secondly, the issues that are
causing them most dissatisfaction.
By researching this area of customer satisfaction, call centres will directly benefit as
they will have up front information relating to issues of weakness in their business
and will thus be in a position to rectify and improve operational procedures. This will
add credibility to their business and strengthen their position in respect of securing
new business contracts and increasing their profits.
The employees of the call centres will benefit as a result of call centres reassessing
their worth and empowering them to carry out their duties more efficiently. The users
of call centres will benefit from having improved systems saving them time, money
and frustration. Lastly the company that outsources its service to call centres will
benefit in many ways. Firstly its brand will be strengthened, more happy customers
will result in repeat business and increased market share and more market share will
lead to increased profits.

3
1.3 Focus of the Study
The essence of this study lies with the concepts of service quality, customer
satisfaction and call centres. Each of these concepts is interlinked and has an add
on effect to the next.
1.3.1 Service Quality
Service quality is one of the key drivers in business sustainability. The objective is to
move towards customer satisfaction which leads to customer loyalty and retention.
The main focus in the service quality dimension is to determine the exact
requirements of the customer (Willingham: 2005). Customer profiling is thus
necessary when assessing customer needs. Biographical data affects purchasing
decisions and perceptions about service quality. Willingham (2005) stated, ‘’To avoid
cultural collisions with customers, a customer service representative needs to be
aware of how culture plays a role in the service encounter”.
Therefore the questionnaire designed for this survey takes into account these
prerequisites and was designed to obtain data necessary to make logical
conclusions about service quality from the consumer’s perspective.
1.3.2 Customer Satisfaction
Organisations are increasingly interested in retaining existing customers while
targeting non-customers. Measuring customer satisfaction provides an indication of
how successful the organisation is at providing products and services to the market
place in improving their service levels and uplifting the South African standard of
customer service.
1.4 Problem Statement
A large scale survey was conducted on the call centre industry by the Universities of
Witwatersrand, Western Cape and the University of California in June 2007. The
report covered the aspects of management strategies and employment practices in

4
the global call centre industry, covering almost 2 500 call centre sites in 17 countries.
The South African Call Centre industry was amongst the 17 countries surveyed.
One of the aspects researched in the study was the type of customer interaction with
the call centre that made up the largest volume of call centre business. The results
indicated that predominantly customer service type of business queries made up for
majority of the interaction between the customer and the call centre. However the
content of these customer service queries were unknown i.e. to what extent
customers were happy or unhappy with their interaction with the call centres and
whether their queries were being resolved or not. Therefore this research has
investigated the extent to which customers are satisfied or not as well as determining
the main reasons for unhappy users of call centres amongst people living in the city
of Durban, Kwa-Zulu Natal
1.5 Research Questions
The research aims to determine the following:
1.5.1 Perceptions of Service Quality from a Sample of Users from Durban
In order to improve customer satisfaction of call centres, it would be imperative to
understand customer’s perceptions of the quality of service they received.
1.5.2 To Determine What are the Root Causes of Customer Satisfaction and
Dissatisfaction of Call Centre Service Quality in South Africa
In order for service levels to improve, call centres would need to know what the main
causes of customer dissatisfaction are. Results from here will have a direct impact
on call centre operational changes. At the same time factors causing satisfaction will
also be examined to improve even further.

5
1.5.3 To Compare Demographics to Determine Whether Gender, Age and
Race Groups Has Any Influence on Call Centre Service Delivery.
Tests will be carried to determine whether demographics do indeed have any impact
in the way in which service is delivered. All three cases will be correlated to check for
similarities and differences.
1.5.4 To Determine Which Call Centre Sector Caused the Most Dissatisfaction
Call centres are broad and diverse and operate in almost all industries. An
evaluation of the call centre sector that is most disliked needs to be conducted.
Results will ensure recommendations are made to the correct sector.
1.5.5 To Make Recommendations to Call Centres
The information gathered from this survey has meaningful and practical information.
Recommendations will therefore be given to call centres from this survey so that
service levels are improved.
1.6 Objectives
The Objectives of this Study are to:
a) Determine customer’s level of satisfaction with call centre service delivery.
b) Determine what factors provide consumers with satisfaction.
c) Determine what factors cause consumers dissatisfaction.
d) Identify which call centre sectors, customers are most dissatisfied with.
e) Compare demographics to determine whether there are similarities and
differences among race groups, age groups and gender with regards to
satisfaction with call centre service delivery.
f) Provide recommendations to call centres to improve service levels.

6
The research questions were answered by administering a purpose constructed
research questionnaire. The research questionnaire was self administered and made
up of twenty seven questions. Closed ended questions were used to gather data
from the sample. The sample was drawn from the Durban population and was
emailed and hand delivered to the respondents.
The data obtained from the questionnaire was analysed using various statistical
approaches. Information in the form of graphs, numbers and statements was used to
make logical conclusions
1.7 Limitations of the Study
The limitation of this study will be discussed with regard to the following:
1.7.1 Population and Sample
Cooper and Schindler (2001) stated, ‘’ By selecting some of the elements in a
population, we may draw conclusions about the entire population’’. The population of
a study consists of the total collection of elements about which the researcher makes
some inferences. In this study, the population was the city of Durban. Call centres
are operated nationally in South Africa and therefore in order to get an unbiased
response, this study will have to be replicated and conducted in other provinces of
the country.
In terms of the sample, this study was restricted to people who makes use of call
centres. The survey was therefore not open to all consumers resulting in time delays.
Generally it was found that female respondents were more willing to participate than
male. This then resulted in majority of the respondents being female which doesn’t
balance the gender response.
1.7.2 Identifying and Targeting Respondents
Research designs can be classified by the approach used to gather primary data.
There are two approaches to do this namely the observation and communication
approach (Cooper and Schindler, 2001). This study made use of the communication

7
approach as it would yield a large amount of data that cannot be collected through
observation.
The targeting was based on randomly selecting people which was at shopping malls
and work offices.
There was difficulty in communicating with certain respondents as many did not
know what a call centre was until explained. The questionnaire had to be explained
in simpler language. This therefore caused doubt in the mind of the respondents
resulting in delays in returning the questionnaire.
1.7.3 The Size and Scope of the Topic
Call centres can be categorised in three categories such as in-house call centres,
outsourced call centres and business process outsourcing (Gans: 2003). Each of
these types of call centres are found across all industry sectors. This study was
based on call centres in general and not to a specific type. Therefore results
obtained from respondents represent a broad view of all call centres thus limiting the
information credibility.
1.7.4 Accuracy of Results
Call centres is a new concept for many people, therefore a few questions remained
unanswered by certain respondents. This also suggests that these respondents
weren’t sure what call centres were about and the possibility of them answering the
remainder questions incorrectly does exist. This limits the validity and reliability of
results.
1.7.5 Access to Academic Literature
Various websites and electronic libraries were consulted in an effort to gain a review
of published literature in the areas of call centres, customer satisfaction and service
quality. Most of the literature contained in the customer satisfaction and service
quality articles were not pertinent to call centres. Academic literature on the various
types of call centres was not available thereby resulting in use of other material.

8
1.8 Summary
The call centre industry is becoming more and more competitive and as a result
customer’s expectations are increasing and this means businesses need to shape
their infrastructure and operational procedures in order to meet these needs. In order
for service quality to improve, call centres need to know what issues are causing
distress to the customer. This chapter therefore provided an overview of the
reasoning behind this study. It explained the motivation and focus areas of the study.
The research objectives are listed to better explain the direction of this study. An
understanding of the limiting factors that caused barriers to the study was then
looked at.
The literature review that follows provides definitions of the concepts of the study,
the theory behind these concepts and general understanding of the essence of this
call centres, service quality, and customer satisfaction.
9
CHAPTER TWO
Literature Review
2.1 Introduction
The call centre is often the first (and sometimes the only) human interaction a
customer has with a company, and therefore it is at this stage that the brand of a
company is positioned in the mind of the customer. While most call centres have
typically been managed as a resource that responds to customers requests for
service, a significant opportunity exists for contact centres to be more pro-active in
building engaging relationships with their customers (Genesys Global Survey 2007)
Service quality is a key business driver in ensuring customer satisfaction. When
firms build a reputation for providing quality service and make this a key priority, they
encourage not only short term increases in net operating income and revenue
growth but future returns as well. Providing quality service is a business mindset and
conditioning all areas of the business and its staff is an ongoing project, which is
integral to the successful existence of the business (Rapert & Wren: 1998).
This chapter attempts to investigate the customer service process in terms of
satisfaction, service quality and value. This chapter also analyses call centres and
closely looks at statistics of call centres locally and abroad and the evolution of the
call centre industry.
2.2 Call Centres
A call centre is a centralised office used for the purpose of receiving and
transmitting a large volume of requests by telephone. A call centre is operated by a
company to administer incoming product support or information inquiries from
consumers. Outgoing calls for telemarketing, clientele, product services, and debt
collection are also made. In addition to a call centre, collective handling of letters,

10
faxes, live chat, and e-mails at one location is known as a contact centre. Most major
businesses use call centres to interact with their customers (Call Centres…2009).
A more recent trend has been the emergence of contact centres, which in addition to
telephone contact, allow for email, fax etc. Call centres may be designed for inbound
and/ or outbound calls. Inbound call centres are those call centres that receive calls
from outside callers that call the centre to seek certain assistance. Outbound call
centres contact people who are already customers or are potential customers to
market or sell a product or service. Over 80% of the call centres, by some estimates
are inbound call centres (Gans: 2003).
2.2.1 History of Call Centres
The first call centres in South Africa began to appear in the 1970s, though it was only
in the late 1990s that the combination of improved computer technology and reduced
telecommunications costs contributed to a rapid growth in call centres. More
recently, call centres have been widely punted by an informal coalition of
stakeholders with overlapping interests, ranging from trade unions, through
provincial development agencies, to national government (Benner, Lewis & Omar
2007). The oldest call centre was established in 1976, but there was a burst in call
centre creation in the early 1990s, and another major growth right around 1999. The
average age of call centres is just under 9 years (Benner, Lewis & Omar: 2007).
For instance the 2002 ICT sector summit produced an endorsement by business,
labour and government of call centres as an investment focus for “labour absorbing
activities” (Nedlac 2002). According to Nedlac (2002), provincial bodies have been
established to promote the establishment of call centres, often specifically targeting
international outsourcing activities. These include Calling the Cape, Contact in
Gauteng and KZNonSource, amongst others, now under the national umbrella of
Business Process enabling South Africa. In 2002, government launched a multi-
million rand business process outsourcing support programme.

11
Firm Infrastructure
People Management
Technology Development Procurement Inbound Operations Outbound Marketing Service Logistics Logistics & Sales
Primary Activities Figure. 2.1 The Generic Value Chain
Adapted from Searle, A. 2007. South African Contact Centre Benchmarking Report.
Dimension Data Insight 2007, South Africa.
According to Searle (2002), an organisation with a cost leadership strategy is most
likely to utilise the direct call centre channel as a means to reduce its marketing and
sales costs as evidenced in figure 2.1. An organisation with a differentiated strategy
might choose to utilise its direct call centre channel as a means to provide it’s
customers with a superior service to it’s competitors by offering them a greater
choice of channel, 24hours a day, 7days a week, 365 days a year access and a
consistent and excellent experience.
Today’s (2009) reality is that few call centres have the luxury of such a simplistic and
easily defined role in the value chain. Many of today’s call centres operate
marketing, sales and service desks that perform many and varied activities for
internal business units who serve different customer segments with different value
propositions.
Suport
Activitie
The Multi
Channel, multi
Function,
integrated call

12
2.2.2 Different Types of Call Centres
Call centres can be divided into three categories. Companies must therefore decide
which option would be best suited for their operations. Call centres are divided into
an in house call centre, an outsourced call centre and an internationally based call
centre called Business Process Outsourcing.
2.2.2.1 In House vs. Outsourced Call Centres
One of the most important distinctions in types of call centres is between those that
are run ‘in-house’ versus those that are run as ‘out-sourced’ call centres.
In-house call centre is a call centre developed by the company itself. This operation
is managed internally together with the other business functional units. It makes use
of its own infrastructure and own personnel.
Out-sourced call centres are run by firms that specialise in providing these customer
relationship and interface services for other external clients. This call centre would
be responsible for providing the infrastructure and personnel to its client. A legal
contract would be developed between the two and the outsourced call centre would
take over that function of its client’s. A total of 19% of call centres in South Africa are
outsourced compared with 17% in the United States, but is below the global average
of 33% and well below the 80% of outsourced call centres reported in India (Holman,
Batt & Holtgrewe: 2007).
2.2.2.2 Business Process Outsourcing (BPO)
Business process outsourcing (BPO) is a form of outsourcing that involves the
contracting of the operations and responsibilities of a specific business function (or
processes) to a third-party service provider (Business process outsourcing … 2009).
BPO involves agents in one country that typically have lower labour costs, serving
customers in the U.S. or Europe. Thus, international observers often see India as the
prototypical country for call centre industries in the developing world. The South
African call centre industry, by contrast to this stereotype, developed more similarly
13
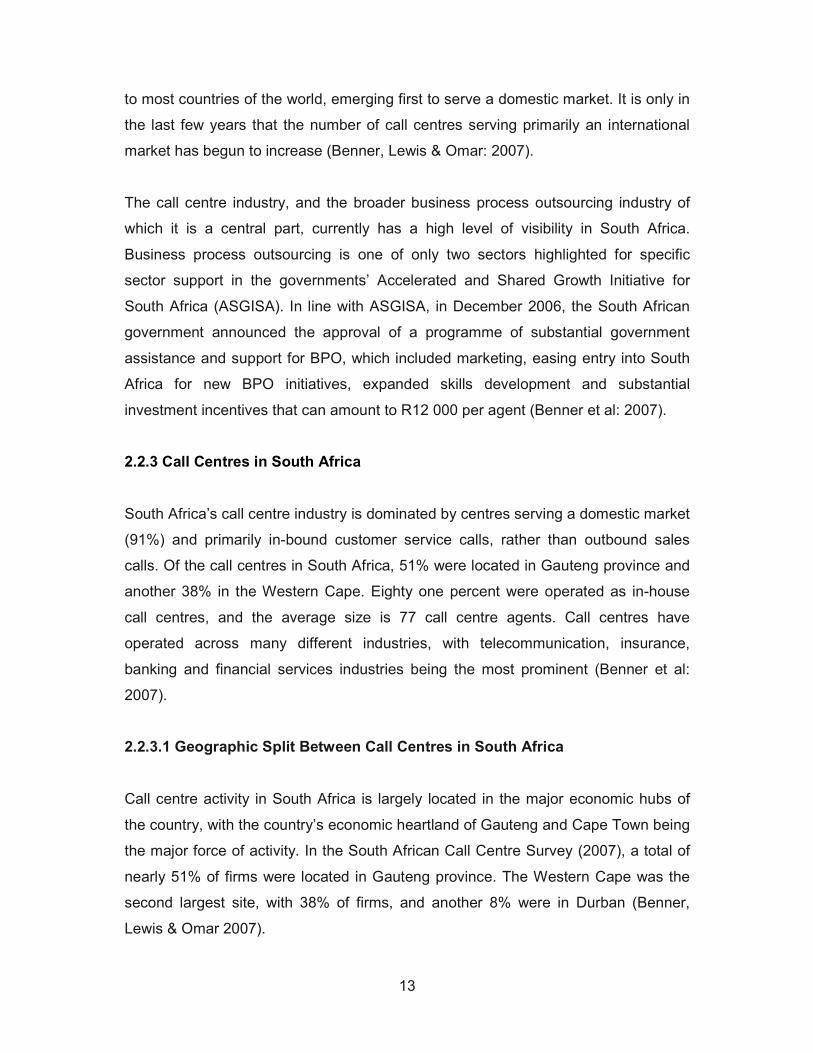
to most countries of the world, emerging first to serve a domestic market. It is only in
the last few years that the number of call centres serving primarily an international
market has begun to increase (Benner, Lewis & Omar: 2007).
The call centre industry, and the broader business process outsourcing industry of
which it is a central part, currently has a high level of visibility in South Africa.
Business process outsourcing is one of only two sectors highlighted for specific
sector support in the governments’ Accelerated and Shared Growth Initiative for
South Africa (ASGISA). In line with ASGISA, in December 2006, the South African
government announced the approval of a programme of substantial government
assistance and support for BPO, which included marketing, easing entry into South
Africa for new BPO initiatives, expanded skills development and substantial
investment incentives that can amount to R12 000 per agent (Benner et al: 2007).
2.2.3 Call Centres in South Africa
South Africa’s call centre industry is dominated by centres serving a domestic market
(91%) and primarily in-bound customer service calls, rather than outbound sales
calls. Of the call centres in South Africa, 51% were located in Gauteng province and
another 38% in the Western Cape. Eighty one percent were operated as in-house
call centres, and the average size is 77 call centre agents. Call centres have
operated across many different industries, with telecommunication, insurance,
banking and financial services industries being the most prominent (Benner et al:
2007).
2.2.3.1 Geographic Split Between Call Centres in South Africa
Call centre activity in South Africa is largely located in the major economic hubs of
the country, with the country’s economic heartland of Gauteng and Cape Town being
the major force of activity. In the South African Call Centre Survey (2007), a total of
nearly 51% of firms were located in Gauteng province. The Western Cape was the
second largest site, with 38% of firms, and another 8% were in Durban (Benner,
Lewis & Omar 2007).

14
Frequency of Call Centre Use
51
38
7
22
0
10
20
30
40
50
60
Gauteng Western Cape Durban Eastern Cape Other
P
E
R
C
E
N
T
Figure. 2.2 Primary Market Served by South African Call Centres
Adapted from Benner, C., Lewis, C. & Omar, R. 2007. Call Centre Practices and
Performance. University of California Davis, Witwatersrand & Pretoria.
According to Benner, Lewis & Omar (2007), most call centres in South Africa are
based in Gauteng and Western Cape as evidenced in figure 2.2. A small percentage
is based in Durban and Eastern Cape. The smaller call centres tend to be smaller
firms with in-house call centres, serving clients in their immediate area.
2.2.4 South African Call Centres vs. International Call Centres
In many ways the South African call centre industry is broadly inline with patterns
across most of the rest of the world. These patterns are in terms of size, the mix of
in-house and outsourced firms, ratio of inbound/outbound calls, and broadly similar
patterns of work organisation and job design (Benner, Lewis & Omar: 2007). Within
these broad similarities between South Africa and the rest of the globe, it is important
to highlight two factors that are important. First is that the vast majority of call centres
in South Africa serve a domestic, not an international market (Benner et al 2007).
Secondly, most call centres employ only a few dozen workers, with a median
international size of 49 employees and a median size in South Africa of only 24.

15
These characteristics are important because much of the South African government
policy towards promoting the call centre industry is based, either implicitly or
explicitly, on trying to replicate India’s success in attracting large, internationally
oriented call centres (Benner et al: 2007).
According to Benner et al (2007), there are a number of important differences in
South Africa’s call centre industry as well viz:
• Education Levels: In South Africa, the typical call centre agent has only a
matriculation certificate and only 2% typically hire agents with a University
degree. Only Brazil has a lower percentage of firms typically hiring agents
with a University degree. Across the world,on average, 22% of call centres
rely primarily on a university-educated workforce, and in India, over 70% of
centres reported that they primarily rely on college graduates.
• Sub-Contractors compared to In-House: In nearly all other countries of the
world, subcontractors use more temporary employees, provide less training,
take a shorter time for new hires to become fully competent, are more likely to
offer jobs with lower discretion, have higher turnover rates and pay
substantially less.
In South Africa, sub-contractors employ fewer temporary employees who have lower
attrition and turnover rates, are generally no more likely to provide jobs with little
discretion pay only marginally less and provide only somewhat less training.
However in most countries, sub-contracting firms are substantially larger on average
than in-house firms and in most countries two to three times the average size. In
South Africa, sub-contractors average only 40 employees, while in-house firms
average 99 employees.
2.2.5 The Global View
Call centres have developed broadly around the world. An important feature of call
centers is the relative ease with which work flows can be routed to different

16
geographic locations, organizations, or employees within the same organization.
This has allowed companies to shift service delivery from local interactions to more
remote ones (Holman et al: 2007).
Promise and controversy: The growth of call centres has been controversial. On
the one hand, consumers may gain from new or lower cost services, while
governments in advanced and industrializing countries view call centers as a source
of jobs and economic development. On the other hand, consumers often object to
poor service quality, and managers complain of the difficulties and dilemmas of
providing high quality service at low cost, while dealing with excessive turnover.
Critics, including trade unions, also have complained that call centers are large
service factories that only provide poor quality jobs with high levels of routine and
low wages and job security. Thus, many different constituencies share an interest in
the development of call centers and how they can be managed successfully in the
global economy (Holman et al: 2007).
Convergence and similarity: Common to all call centres is the use of advanced
information technologies to handle customer enquiries remotely in operations that
encompass high levels of engineering efficiency. There is also a perception that call
centers operate in a uniform way across countries as a call centre in the UK looks
like one in South Africa, the Netherlands, or Brazil – which suggests that call centers
in different countries are converging on a standard set of management and
employment practices (Holman et al: 2007).

17
Over the past decade, call centres have expanded phenomenally in virtually every
country around the world as evidenced in table 2.1
Number of Call Total Employment
Centres
Coordinated Economies
Austria 96 8049
Denmark 118 7162
France 210 15440
Germany 153 21600
Israel 80 3792
Netherlands 118 8437
Spain 68 13712
Sweden 139 7060
Subtotal 982 85251
Liberal Market Economies
Canada 387 71041
Ireland 43 3453
UK 167 26187
US 464 94938
Subtotal 1061 195619
Recently Industrialized Economies
Brazil 114 122,590
India 60 34146
Poland 75 9375
S. Africa 64 5599
S. Korea 121 22361
Subtotal 434 194,071
Total 2477 474,942
Table 2.1 Call Centres and Employment
Adapted From Social Research Council. 2007. The Global Call Centre Report.
International Research Foundation, United Kingdom.

18
According to Holman et al (2007), call centre’s have experienced phenomenal
growth in virtually every country around the world. Due to advancement in
technology, businesses have found that using a call centre was more cost effective
to carry out its functions and thus call centre growth has expanded in countries world
wide which has effectively increased employment in that country as evidenced in
table 2.1 above.
2.2.6 Convergent National Trends
The global call centre study shows that there are many similarities across countries,
suggesting that the call centre sector has developed in broadly similar ways across
advanced and recently industrialized countries with regard to markets, services, and
some organizational characteristics. One indicator of the similarities in countries
around the world is the typical age of call centres. A call center in this study is
typically 8 years old (in 2007), ranging from a high of 14 years in the US to a low of 6
years in India and 7 years in Poland and South Korea (Holman et al: 2007).
Another common feature of call centers across countries is that the market leaders in
each case have been the telecommunications and financial services industries.
Telecommunications firms were early adopters of call centers for long distance
operators and telephone directory assistance (Holman et al: 2007).
2.2.7 Call Centre Investment
Call centres are complex configurations of people, business processes and IT and
Telephony systems that can be operated from one or many physical locations and
can consist of owned, shared or outsourced infrastructures.
According to Searle et al (2003), call centres requires a large investment therefore
the journey from cost to profit is an expensive one as evidenced in figure 2.3,
however potentially very rewarding, as the call centre is a complex environment
which if not properly structured, configured and fully integrated into the main stream
of the business will fail to bear the expected fruits. Making such a journey requires
effort, time, money and commitment.

19
100 seats @Total cost of
Figure.2.3 Total cost of ownership decomposed to functional / desk level
Adapted from Searle, A., Van, S. & Routen. R. 2003. Call Centres: Addressing
Changing Needs. South Africa: Paladin Consulting. p9.
Figure 2.3 illustrates the point that the total cost of ownership can be decomposed
to the level of the different call centre desk groupings e.g. marketing, sales, service
and administration. In this scenario, the total investment needed for this call centre
amounts to approximately R1, 660 million.
Each call centre needs to be assessed on the basis of the internal and external
environment in which the particular call centre operates. Pricing models and prices
are determined on the basis of the strategic role of that call centre. The investment in
a call centre will decide its operational and strategic capability which ultimately
impacts on the service it is able to deliver.
The physical infrastructure configurations that are available today enable a call
centre to own and host it’s own IT and Telephony platforms and systems or to elect
to outsource this ownership and hosting service to internal business units within the
organisation or to external service providers (Searle, Van & Routen: 2003).
CALL
CENTRE
DIRECT
MARKETING
INBOUND SALES OUTBOUND
SALES
ADMINISTRATION
20 SEATS
@ R240 000
40 SEATS
@ R1 MILLION
20 SEATS
@ R240 000
20 SEATS
@ R180 OOO
R12000 PER
SEAT
R25000 PER
SEAT
R12000 PER
SEAT
R9000 PER
SEAT
Total Cost of
Operation R1, 660m

20
Examples of typical call centre operating expenses are indicated in table 2.1.
Facilities charges rental, insurance, light, electricity
IT and Telephony charges purchases, repairs, consumables,
depreciation
Call charges telephone calls, emails, sms
People charges recruitment, salaries, fringe benefits,
overtime, maternity leave, training
Overhead charges finance and admin
Other communication, travel and entertainment,
marketing and advertising
Table 2.2 Operational Expenses
Adapted from Searle, A., Van, S. & Routen. R. 2003. Call Centres: Addressing
Changing Needs. South Africa: Paladin Consulting. p9.
According to Searle 2003, the infrastructure required to operate a call centre gives
rise to a large operational expenditure. The expenses vary from fixed costs to
variable costs of which IT and telephony costs are the most concern for call centre
owners. Thus it is imperative for businesses to assess the feasibility of either
developing an in house call centre or outsourcing its functional units.
2.3 Call Centre Service Quality
Parasuraman, Zeithaml and Berry (2006), define service quality as “the degree and
direction of discrepancy between customers’ service perceptions and expectations”.
Thus if the perception is higher than expectation, then the service is said to be of
high quality. Likewise, when expectation is higher than perception, the service is said
to be of low quality.
Thus the components of service quality defined by Parasuraman et al (2006) are as
follows:

21
• Assurance - Knowledge and courtesy of employees and their ability to inspire
trust and confidence.
• Empathy - Caring, individualized attention the firm provides its customers.
• Reliability - Ability to perform the promised service dependably and
accurately.
• Response - Willingness to help customers and provide prompt service.
• Tangibles - Appearance of physical facilities, equipment, personnel, and
communication materials.
Service quality is "the consumer's overall impression of the relative
inferiority/superiority of the organisation and its services" (Bitner & Hubbert 1994, p.
77). The basis of service quality theory lies in the product quality and customer
satisfaction literature. The role of quality is complex and not only does quality affect
perceptions of value and satisfaction; it also influences behavioural intentions
directly.
Service quality is a user’s judgement about the service itself. The quality of a service
is high when the customer says it is and this is not always when the service
conforms to technical criteria. Call centres often experience large fluctuations in
demand over relatively short periods of time. This also places great emphasis upon
capacity management practices within call centre operations. A theme which is clear
in the definitions of service quality is thus expectations in determining judgements
about quality (White: 2004).
2.3.1 Measuring Service Quality
There are two perspectives of quality measurement: internal and external. According
to internal perspectives, it is defined as zero defects; doing it right the first, time or
conformance to requirements.

22
The external perspective understands this aspect in terms of customer perception,
customer expectation, customer satisfaction, customer attitude and customer delight.
External perspective is becoming important in the light of increasing consumer
awareness, changing consumer tastes and growing consumer expectations
(Services Research: 2004).
Measuring service quality can help companies increase service quality, innovation
and most important, customer retention. By implementing measurement standards,
call centre agents pay more attention to performance standards that are measured
because they then know what to expect. Customer foucused measurements are
needed because they explain reasons for lost sales, retention problems, time
consuming and costly complaints and cost redundancies (Odgers: 2008).
2.3.2 Service Quality in the United Kingdom
Outstanding service remains the top reason consumers will recommend a company
but consumers are even more likely to tell others about poor treatment following a
negative customer experience.
As the credit crunch deepens, the third annual Customer Experience Impact Report
(2008) found that consumers are becoming increasingly intolerant of poor customer
service. For the third year in a row, there is a growing trend for consumers to stop
doing business with a company following a negative customer experience. This year,
81% of consumers will remove their business following a poor experience versus
76% in 2007 and 65% in 2006. However, despite a challenging UK economy, the
survey also found one in two consumers (50%) are willing to always or often pay
more for a better customer experience.
According to Nuance Communications (2008), its research in London revealed that
60% of respondents were less than ‘satisfied’ with their interactions with customer
service departments. The top two complaints were that agents were difficult to
understand due to language barriers (28%) and that it took too long to speak to a live

23
agent (25%). Almost half of respondents would prefer using a speech automated
system to struggling with an agent they couldn’t understand (46%).
The research further revealed that consumers prefered speech recognition to
touchtone systems with 45% of consumers less than satisfied with touchtone
systems. Despite the perceived dislike of speech recognition applications, 84% of
respondents were willing to try a new speech automated system provided they were
notified in advance of its availability.
According to Harris Interactive (2008), data was gathered data from more than 200
UK consumers over 18 years of age who had contacted customer service by phone
for 12 months. The study explored consumer attitudes towards customer service to
determine what customer interaction channels and what type of phone automation
consumers preferred. Customer service quality had a major impact on brand
perception. The majority (82%) believed that quality of customer service was
influential, very influential or extremely influential on their perception of a company.
Nearly two thirds (62%) of consumers who had bad call centre experiences stopped
doing business with the organisation, 69% had shared their experience with friends
and family, and 56% would be likely to switch to another company following a bad
experience.
This research clearly demonstrates the frustration UK consumers have with call
centre service.
2.3.3 Factors Impacting on Call Centre Service Quality
According to Odgers (2008), service is a critical business function. It is driven
primarily by the mindset, perspective and abilities of the people who perform the
activities. Odgers (2008) further elaborates that call centres can provide people with
better tools, improved systems, enhanced delivery methods but good people get
good results, better people get better results and superior people get superior
results. In the final analysis these are the things that determine long term business
success or failure.

24
2.3.3.1 Call Centre Agents
The intrinsic motivation of an employee depends on the nature of the work, the fit
between an employee’s view of interesting and challenging work and what is
provided and also on how relationships with other workers are structured to make
their work easier to accomplish (Frenkel: 2003). Although the call centre job involves
a lot of routine work there is also work that can be intrinsically satisfying with
opportunities to pursue challenges and express creativity (Bain & Taylor 2000).
A call centre agent is likely to be motivated by the level of compensation and the
nature of benefits and external rewards based on performance. Moreover it is not the
magnitude of the compensation/reward that matters, but by the belief that the
rewards are good (Ojha & Pandey: 2005).
Patience, tolerance, the ability to listen and the ability to be flexible are all desirable
qualities in a call centre agent, particularly as s/he has to be able to extract all the
necessary information for action, while carrying on a courteous conversation
(Callaghan & Thompson: 2002).
During service transactions, employees are expected to display emotions that
comply with certain norms or standards of the organisation designed to create a
desired state of mind in the customer (Ojha et al: 2005). An employee is expected to
appear happy and glad to serve the customer, an aspect that most service providers
including call centre agents find very stressful among other emotionally demanding
and stressful aspects of their work (Deery, Iverson & Walsh: 2002).
2.3.3.2 Work Performance
People have always been important to the success of any industry, but they are even
more critical in the service sector (Thomson 2001). This is particularly true in the call
centre industry as call centre agents (CCA) are front line employees in direct contact
with the customer.

25
The salary and compensation related costs of the CSA contributes to about 70% of
the cost of running a call centre (Friedman: 2000). Therefore call centre performance
is critical for the company to maintain customer satisfaction and high operational
efficiency.
Employees in a call centre are connected to information technology that
automatically allocates work, facilitates its completion and monitors employee
performance. Work is conducted in relative isolation from colleagues but under
constant gaze of management who are responsible for structuring and interpreting
the electronic information.
According to Frenkel (2003), work in the call centre can be defined as being
deskilled and monotonous, relieved only by the increasing employment of part time
workers or it can be viewed as a job that is rich in interactions and communications
for people who would otherwise be less gainfully employed (Ojha et al: 2005). These
two differing points of view are due to different persons reacting to seemingly similar
work environments.
2.3.3.3 Service Delivery Innovation
Companies need to find new ways to deliver their services, which must surpass
client expectations. Through successful innovation a firm can protect its largest
revenue generators, making possible its investment in the “next big thing” in terms of
high-margin service offerings (Schneider & White 2004). In doing so, a firm must
address the converging challenges of client sophistication, globalization, competition,
technology innovation, and modularization – while still taking advantage of the
market opportunities as they arise. To succeed at this balancing act, professional
services firms must bring together resources in new ways, creatively package high-
value products and services, and co create solutions with their clientsAccording to du
Toit 2009, one of the areas which he believed needs attention, is the payment of
entry level employees. He believes that South Africa would improve the quality of
delivery and reduce attrition rates if there was more innovative thinking on rewarding
people in line with similar jobs in other fields.

26
Another important area of development in South African contact centres and BPO
that is probably lagging behind many experienced BPO centres, is flexible staffing.
Staffing companies including CallForce Direct look at ways in which one can offer
solutions which enhance efficiency whilst lowering staffing costs. This means
working with clients who resource their contact centres or back offices efficiently for
peak periods when volumes require additional resources without increasing
permanent staff numbers (du Toit: 2009).
2.4 Customer Satisfaction
According to Athanassopoulos (2000), customer satisfaction is regarded as "being
highly associated with value and is based, conceptually, on the amalgamation of
service quality attributes with such attributes as price”.
Satisfaction is generally agreed to be a post purchase and post use evaluation (Hunt
1977). Hunt (1977) describes satisfaction as "an evaluation of an emotion". Kotler
(2000) describes satisfaction as "a person's feelings of pleasure or disappointment
resulting from comparing a product's perceived performance (or outcome) in relation
to his or her expectation". The above suggests that satisfaction reflects the degree to
which a customer believes that the possession and / or use of a service evokes
positive feelings (Rust & Oliver 1994).
According to Odgers (2008), the only way to survive in the marketplace is by building
a wide base of loyal customers and this is a chain reaction which begins from
investing in employees and delivering superior service as evidenced in figure 2.4.

27
Start
Figure 2.4 Management Philosophy
Benefits of superior customer service. 2007. [ONLINE]. Available WWW:
www.mcg.com (Accessed 11 May 2009).
According to Acqua Consulting (2007), management philosophy has shown an
increasing realisation of the importance of customer focus, customer satisfaction and
loyalty in any business. Management philosophy thus begins with employees
investing in their staff by empowering them to deliver superior service. Superior
service has a follow on effect on customer satisfaction.
Customers tend to stay with organizations that enable them to experience positive,
meaningful and personally important feelings. The customer becomes ‘king’ and
loyalty is earned. Loyal customers lead to repeat business and repeat business
leads to increased sales and profits (Odgers: 2008).
High Sales
and profit
margins
Training and
empowerment
of employees
Employee
satisfaction &
competence
Customer
Loyalty
Customer
satisfaction
Superior
service
delivery

28
2.4.1 Link Between Service Quality and Customer Satisfaction
What happens on the inside of an organization has been shown to relate to the
quality of service, customers report receiving. Delivering quality service has a direct
impact on customer satisfaction and loyalty which ultimately determines profit levels.
In other words when customers receive quality service they will be satisfied with the
organization providing the service. Their satisfaction with the organisation will in turn
lead them to be loyal customers to the organisation, repeatedly purchasing the
service. Repeat business of loyal customers translates into higher profits (Schneider
& White: 2004).
From an empirical viewpoint, several studies provide support for the link between
service quality and behaviours that are indicative of customer satisfaction and
loyalty. For example Boulding, Kalra, Staelin and Zeithaml (1993) found a positive
relationship between customers’ perceptions of overall service quality and their
intentions to exhibit loyalty and making recommendations to others (Schneider &
White: 2004).
Hence poor Service quality that is delivered by call centres in South Africa and the
UK as mentioned above will have a direct impact on customer satisfaction and
loyalty.
2.4.1.1 Customer Retention
As customers begin to experience a better service their expectations rise.
Furthermore the service experienced is transferable in the mind of the customer. The
customer makes conscious and unconscious comparisons between different service
experiences, irrespective of industry sectors. A company’s ability to attract and retain
new customers therefore is a function not only of its product or product offering but
also the way it services its existing customers and the reputation it creates within and
across marketplaces (Cook: 2005).

29
The following statistics highlighted by Ogilvy & Mather (2002) indicate just how
crucial retaining customers can be:
• Reducing customer defections can boost profits by 25-28 per cent
• The price of acquiring new customers can be five times greater than the cost
of keeping current ones
• Can be up to seven times more than to prospective customers
Most organisations lose significantly more than 30 per cent of their customers
before, or at the time of a repurchase decision, mainly through poor service. Thus, if
a company can develop repeat and multiple business relationships with existing
customers, it is more able to maximise both its sales overheads and resources
(Cook: 2005).
2.4.1.2 Earning Customer Loyalty
Customer centricity has become the new, challenging, competitive battlefield. The
only way to survive in the marketplace is by building a wide base of loyal customers
and the only way to do that is by tailoring the customers experience to their wants
and needs as much as possible (Cook: 2005). According to Odgers (2007),
customers tend to stay with organisations that enable them to experience positive,
meaningful and personally important feelings even if an organisation cannot always
provide everything customers want or cannot solve all their problems.
Most people shift from one supplier to another because of dissatisfaction with
service, not price or product offerings. The service provider’s responsibility is to
manage the emotions in customer service exchanges. Sixty eight percent of
customers who go elsewhere do so because of a perception of indifference.
Indifference means that customers believe that their loyalty is wasted on a company
that doesn’t care whether they remain customers. Earning customer loyalty is critical
because today’s economy has increased capacity to produce products and

30
information therefore an excess in the marketplace is inherent as more and more
companies compete for the same customers (Odgers: 2008).
2.4.2 Customer Service and Expectations
According to Shroer (2003), the right of customers to expect some level of service
based on an express or implied promise is quite different from wishful thinking.
Customer expectations are beliefs about service deliveries that are used as
standards against which performance is judged (Zeithaml & Bitner 2000). According
to Zeithaml & Bitner (2000), customers hold several different types of expectations
about service.
There is a level of service that a customer hopes to receive i.e. that level which a
customer believes a service ‘can’ and ‘should’ be at and this is referred to as desired
service. Service expectations are formed by uncontrollable factors, from a
customer’s experience with other companies and their advertising to a customer’s
psychological state at the time of service delivery.
2.4.3 The Causes of Customer Frustration with Call Centres
According to Genesys Global Call Centre Report (2007) the major sources of
customer frustration include:
• Long hold times - 67 percent of consumers were frustrated by long hold times
and 88 percent preferred to receive a call-back in 10 minutes than to be on
hold for that long.
• Poor automation - 57 percent of consumers were frustrated by interactive
voice responses with too many or incorrect options and 76 percent of
consumers feel that companies are pushing them to use self-service systems
instead of talking to live people.
• Customer Repetition - 52 percent of consumers were frustrated by having to
repeat information they had already provided.

31
In competitive business environments, successful companies will be those that
address the main sources of consumer frustration with call centres, use new
channels wisely to enhance customer service while minimising operational costs,
and seize every opportunity to engage customers by making their call centre
experience a powerful one (Genesys Global Call Centre Report: 2007).
2.4.4 Customer Satisfaction in the United States
According to CFI Group (2007), customer satisfaction was the direct result of the
performance of the contact centre. The inaugural Call Center Satisfaction Index
(2006) revealed that the two issues with the most impact on customer satisfaction
with the call centres are first call resolution and off shoring. The key element that is
driving customer satisfaction and therefore customer loyalty and the likelihood to
recommend is issue resolution. The study found that across all industries that were
measured, nearly one fifth of all callers hung up with their issue unresolved. Of those
customers who did have their issue unresolved, 68 percent were at risk of defection
(Campbell: 2007).
The study also indicated that customers who believe the contact centre is located
outside the US rate their satisfaction with the call centre experience 26 points lower
on the index’s 100-point scale and are almost twice as likely to defect compared to
those who assume the call centre is in the United Sates. Teodoru (2007) stated
“Offshoring has a negative impact on satisfaction because offshore customer service
reps are less adept at solving customer problems. Customer service reps located
outside of the United States were rated lower on communication skills. When
communication skills are poor, customers’ issues remain unsolved in the majority of
cases”.
Customer issues see resolution only 45 percent of the time when handled by reps
with poor communication skills. In the instance where a rep can speak clearly, 88
percent of issues were resolved. According to Teodoru (2007), many companies
treat call centres as cost centres rather than seeing them as an opportunity to solidify
the customer relationship, resulting in increased loyalty and retention.

32
2.4.5 Customer Satisfaction in the United Kingdom
For the third consecutive year in 2003, consumers voted ‘waiting on hold’ as the
most frustrating aspect when contacting a company for assistance. When engaging
with a company, British consumers also want quick access to a live agent. More
than half (53%) found ‘automated menus that don’t provide an option to speak to a
live agent’, and ‘being unable to reach a human being’ (49%) frustrating. When
interacting with a company online 36% of consumers want the option of a live web
chat with an agent (Genesys: 2003).
Brown (2008) stated “Against the current economic backdrop, more than ever before
businesses need to understand the significance of delivering good customer
experiences. Emphasis has to be placed on retaining existing customers by fostering
loyalty through satisfying interactions. The risk of not doing so exposes businesses
to heightened customer attrition and will make it tougher to acquire new customers.”
2.4.5.1 Impact of Negative Customer Experiences
According to the Genesys Global Call Centre Report (2007), consumers were
fighting back against poor treatment in a number of ways, many of which could
directly influence a company’s bottom line. These include:
• Lost business: 81% will stop doing business with a company because of a
negative customer experience, 69% decide NEVER to use that company
again Viral detractors: 74% of consumers tell others about their poor
treatment, 20% have posted negative feedback online or to a blog.
• Operational burden: 61% have complained to the company at fault while 37%
return products.
Poor customer experiences can also bring forth the following emotional outbursts
from consumers (Genesys Global Call Centre Report: 2007).
• 32% of consumers have sworn
• 25% have shouted

33
• 9% have developed a headache or felt sick
• 8% have cried
• 6% have felt their chest tighten
Unhappy customers are not good for any company. It takes only one unsatisfied
person to shatter a perfectly good day at work for everyone and steer many more
prospective customers away from you. Therefore understanding and recognizing
customer emotions as well as handling their complaints fairly can help bring the
conflict to a satisfactory resolution for both sides (Odgers: 2008).
2.4.5.2 Benefits of positive customer experiences
The survey also found that consumers are willing to reward companies for the
provision of good customer experiences (Genesys Global Call Centre Report: 2007).
• Customer acquisition: 53% of consumers will recommend a company to
someone else because it provides outstanding service
• Repeat business: 52% of consumers would feel encouraged to spend more
with a company if it were to improve its overall customer experience
• Sustained business: even in an economic downturn, 50% of consumers will
always/often pay more for a better customer experience
2.4.6 Improving Customer Satisfaction
In order to provide excellent customer care, an organisation needs to exceed
customer expectations. An important factor in providing a good service is therefore to
always keep to promises and not to guarantee things which cannot be delivered. To
provide excellent service, an organisation needs to under promise and over deliver
(Cook: 2005).
The number one element of “great” customer service is the speed and accuracy of
the response, with 37% wanting a fast service, followed by 30% wanting
knowledgeable staff. Consumers were less concerned about speaking to a human

34
being, with only 6% citing the ability to speak to a live agent as an element of great
service (Call Centres Research…2009). Forty six percent of respondents would
prefer using an automated system to struggling with an agent they can’t understand.
Eighty percent would be at least somewhat willing to try a new automated system if
they were notified in advance of its availability (Call Centres Research…2009).
Despite the widespread use of call centres, 49% of respondents or around 23.6
million adults agree they miss the individual service that going to a branch or office
offers. The majority of consumers - almost 70%, do not appreciate incoming sales
calls. Fifteen percent of adults were actually willing to listen to incoming calls offering
services on behalf of various institutions (Call Centres Research…2009).
As per the literature contained in paragraph 2.2.3, South Africa’s call centre industry
is dominated by centres serving a domestic market (91%) and primarily in-bound
customer service calls, rather than outbound sales calls. This therefore implies that
South Africa needs to focus on ways to improve its customer satisfaction so as to
remain competitive in the call centre industry.
2.5 Regional Trends
According to du Toit (2009), South Africa’s business process outsourcing and off
shoring (BPO&O) sector has achieved quality standards including consistent service
delivery excellence particularly in view of South Africa’s international marketing
efforts. Du Toit (2009) stated “While we have excellent contact centres in many
regions, not all achieve the required quality standards which are currently being
developed through work with the South African Bureau Standards”.
Reflecting on some key components of service delivery in the South African BPO&O
industry, Du Toit (2009) felt that there was a growing need for more mature,
competent and skilled team leaders and operations managers. Identifying, recruiting
and selecting those people who will drive superb delivery was one of the focus areas
for companies such as CallForce Direct. However, he explained that there was a
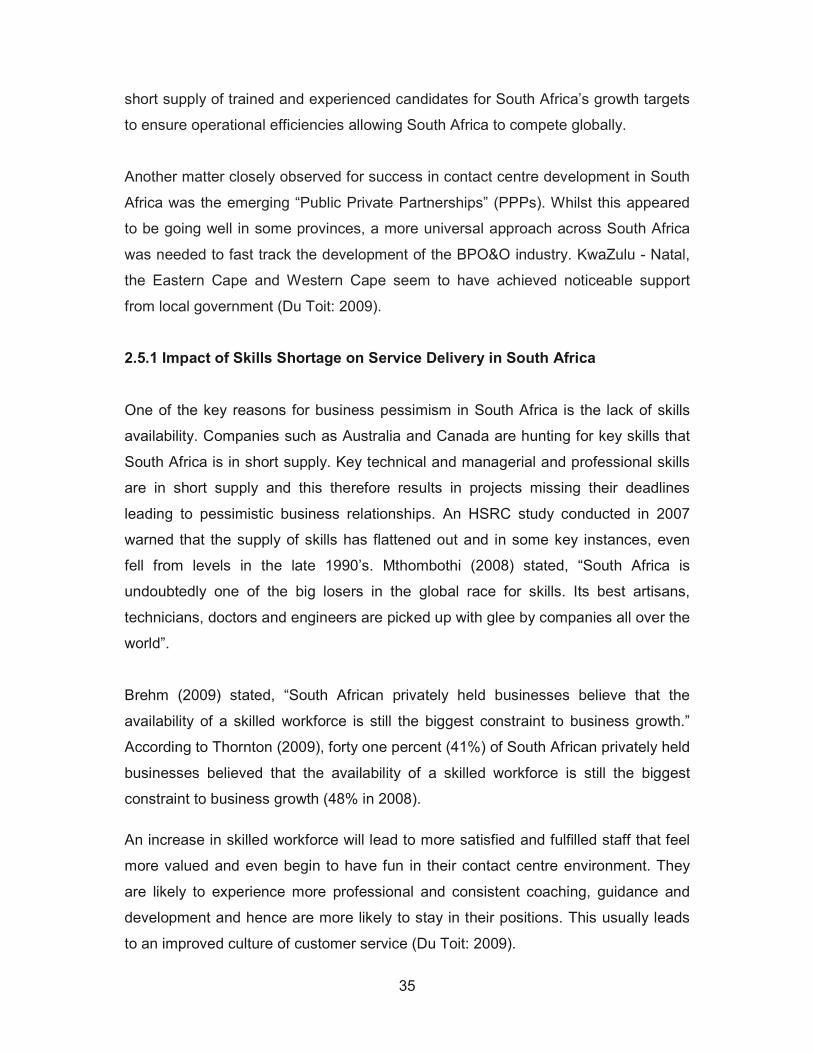
35
short supply of trained and experienced candidates for South Africa’s growth targets
to ensure operational efficiencies allowing South Africa to compete globally.
Another matter closely observed for success in contact centre development in South
Africa was the emerging “Public Private Partnerships” (PPPs). Whilst this appeared
to be going well in some provinces, a more universal approach across South Africa
was needed to fast track the development of the BPO&O industry. KwaZulu - Natal,
the Eastern Cape and Western Cape seem to have achieved noticeable support
from local government (Du Toit: 2009).
2.5.1 Impact of Skills Shortage on Service Delivery in South Africa
One of the key reasons for business pessimism in South Africa is the lack of skills
availability. Companies such as Australia and Canada are hunting for key skills that
South Africa is in short supply. Key technical and managerial and professional skills
are in short supply and this therefore results in projects missing their deadlines
leading to pessimistic business relationships. An HSRC study conducted in 2007
warned that the supply of skills has flattened out and in some key instances, even
fell from levels in the late 1990’s. Mthombothi (2008) stated, “South Africa is
undoubtedly one of the big losers in the global race for skills. Its best artisans,
technicians, doctors and engineers are picked up with glee by companies all over the
world”.
Brehm (2009) stated, “South African privately held businesses believe that the
availability of a skilled workforce is still the biggest constraint to business growth.”
According to Thornton (2009), forty one percent (41%) of South African privately held
businesses believed that the availability of a skilled workforce is still the biggest
constraint to business growth (48% in 2008).
An increase in skilled workforce will lead to more satisfied and fulfilled staff that feel
more valued and even begin to have fun in their contact centre environment. They
are likely to experience more professional and consistent coaching, guidance and
development and hence are more likely to stay in their positions. This usually leads
to an improved culture of customer service (Du Toit: 2009).

36
2.6 Summary
This chapter focused on four specific areas viz: Call Centres, Service Delivery,
Customer Satisfaction and Regional Trends. The different types of call centres was
first looked at, and focus was placed on how the call centre industry was expanding
worldwide. Next, the similarities and differences between call centres in South Africa
and internationally was analysed to understand where South African call centres
were positioned with the rest of the world. Convergent trends between call centres
locally and abroad was then analysed. Lastly the components associated with call
centre investment were examined. The dimensions of service quality was then
examined. Service quality standards in the United Kingdom were then explained and
various factors affecting service quality viz. call centre agents, work performance and
service delivery innovation was looked at.
The theory behind customer satisfaction was then explained. The link between
service quality and customer satisfaction was then examined which showed how
customer retention, customer loyalty customer expectations and customer
frustrations were all interlinked. An understanding of customer satisfaction in the
United States and the United Kingdom was then focused on. The impact of negative
and positive customer experiences was then looked at.
In the last dimension of this chapter, a look at regional trends in South Africa led the
chapter to focus on the impact that skills shortage was having on service quality. The
next chapter discusses Research Methodology and Data Collection Strategies.

37
CHAPTER THREE
Research Methodology
3.1 Introduction
Business research relates to aspects of the field that have a social science
orientation. The methods of management and business research are closely tied.
Methods are linked to the ways in which social scientists envision the connection
between different viewpoints about the nature of social reality and how it should be
examined (Bryman & Bell: 2007).
This chapter addresses the objectives of the study, research design i.e. type of
study, data collection methods, instrument design, respondent selection and data
analysis i.e. how the data was processed.
3.2 Aim of the Study
The call centre industry is becoming more and more competitive as companies are
increasingly outsourcing their services to call centres which have a pre built
infrastructure to accommodate their needs. Studies in the UK have shown that the
customer experience with call centres has a big impact on customer loyalty. They
have also indicated that the majority of customers are experiencing frustrations when
using call centres.
The aim of this study is to investigate and understand the perceptions of users of call
centres from Durban, Kwa-Zulu Natal.
3.2.1 Objectives
The objectives of this study are to:

38
1. Determine customer’s level of satisfaction with call centre service delivery.
2. Determine what factors provide customers with satisfaction.
3. Determine what factors cause customers dissatisfaction.
4. Identify which call centre sectors, customers are most dissatisfied with.
5. Compare demographics to determine whether there are similarities and
differences among race groups, age groups and gender with regards to
satisfaction with call centre service delivery.
6. Provide recommendations to call centres to improve service levels.
3.3. Data Collection Strategies
Data Collection is an important aspect of any type of research study. Inaccurate data
collection can impact the results of a study and ultimately lead to invalid results.
Typical quantitative data gathering strategies include:
• questionnaires
• interviews
• focus group interviews
• observation
• case-studies
• diaries
• critical incidents
Quantitative data collection methods rely on random sampling and structured data
collection instruments. They produce results that are easy to summarise and
compare (Data Collection Methods…2007).
For this study, the self administered questionnaire was used to collect data.
Questionnaires have advantages over other types of surveys in that they are cheap,

39
do not require as much effort from the questioner as verbal or telephone surveys,
and have standardised answers that make it simple to compile data.
3.3.1 Advantages of the Self Administered Questionnaire
The following is a list of advantages that warrant the use of the self administered
questionnaire.
a) Cheaper to administer
Interviewing can be expensive. It will be cheaper for this research survey to
be emailed and hand delivered than conducting telephone interviews (Leedy
& Ormrod: 2001)
b) Quicker to administer
Self – completion questionnaires can be sent out by post, email, fax or hand
deliveries. A thousand questionnaires can be sent out by post in one batch
but with a team of interviewers it would take a long time to conduct personal
interviews with a sample of this size (Bryman & Bell: 2007).
c) No interviewer variability
Self completion questionnaires do not suffer from the problem of interviewers
asking questions in a different order or in different ways (Brent: 2003)
d) Convenience for respondents
Self completion questionnaires are more convenient for respondents because
they can complete a questionnaire when they want and at the speed they
want to go (Bryman & Bell: 2007).
e) Accuracy of Responses
People are more truthful while responding to the questionnaires regarding
controversial issues in particular due to the fact that their responses are
anonymous (Leedy et al: 2001).
40
3.3.2 Definition of Sampling
According to Cooper and Schindler (2001), a sample is a part of the target
population carefully selected to represent that population. The basic idea of sampling
is that by selecting some of the elements in a population, conclusions may be drawn
about the entire population.
3.3.3 Sampling Approach and Technique
There are two types of sampling techniques that can be used, namely probability and
non probability sampling. For the purpose of this study a non probability judgmental
sample was drawn. The study was entirely dependant on consumers voluntarily
agreeing to fill in the questionnaire and the response rate would have been difficult to
obtain with probability sampling.
According to Cooper and Schindler (2001), judgmental sampling occurs when ‘a
researcher selects sample members who conform to some criterion’. Respondents
for this sample were selected after they confirmed they were older than 21 years of
age and that they previously called into a call centre.
3.4 Research Design and Methods
Research design provides a framework for the collection and analysis of data. A
choice of research design reflects decisions about the priority being given to a range
of dimensions of the research process (Bryman & Bell: 2007).
3.4.1 Quantitative Research
Quantitative research emphasises the measurement and analysis of common
relationships between variables (Denzin & Lincoln: 1998). Quantitative research
attempts precise measurement of something. Quantitative methodologies usually
measure consumer behaviour, knowledge, opinions or attitudes (Cooper &
Schindler, 2006). Quantitative research deals with numbers using statistical models
to explain the data (Bauer & Gaskell: 2000).

41
A quantitative research method was used because it provides a more statistical and
graphical understanding of the data collected therefore better explaining Customer
Satisfaction of Call Centre Service Delivery in Durban. Secondly quantitative
research enables easier analysis of the data collected from the questionnaire as
opposed to qualitative research. A quantitative study was therefore selected as the
appropriate research method for this study.
3.4.1.1 Construction of the Instrument
The questionnaire contained two parts:
• Part 1: Contained general demographic particulars of the respondents such
as age, gender and ethnic identity.
• Part 2: focused on the major aspects of the respondents experience with a
call centre.
The questionnaire was designed to be specific and capture information that was
relevant to the objectives of the study. A total of 27 questions were carefully
constructed. Closed ended questions were used. This is best suited to a study that
attempts to gather data based on respondents perceptions. A four and five point
Likert scale was used to rate questions. A four point scale was used in order to
obtain a defined answer from the respondents and to understand the respondents
exact feelings without allowing any neutral ground. On the contrary, a five point scale
was used when a question was open ended and didn’t necessarily apply to every
user of a call centre. A five point scale gives the respondents neutral ground to
answer neither positive nor negative therefore adding a balance to the answers.
Respondents were requested to rate their level of agreement / disagreement with
each statement on a scale ranging from strongly disagree (1) to strongly agree (4).
3.4.1.2 Recruitment of Study Participants
The population of a study consists of the total collection of elements about which the
researcher makes some inferences. The target population for this study were users
of call centres in Durban, KwaZulu - Natal who were over the age of 21 years. The
sample consisted of consumers from all demographics. It also included skilled and

42
semi skilled people, professionals and unemployed individuals. Thus the sample is
representative of people from different backgrounds which gave a neutral view on
the status of call centre service delivery in South Africa.
3.4.2 Pretesting and Validation
The final step toward improving survey results is pretesting the assessment of
questions and instruments before the start of a study. The reason for pretesting is to:
a) Discover ways to increase participant interest
b) Increasing the likelihood that participants will remain engaged to the completion of
the survey
c) Discovering question content, wording and sequencing problems
d) Exploring ways to improve the overall quality of survey data
(Cooper and Schindler: 2006).
The questionnaire was administered to colleagues to review and check for
vocabulary, confusion and ambiguity so that the research instrument could be
refined to be understood.
3.4.3 Administration of the Questionnaire
Data was collected by means of a self-administered questionnaire. With this
approach, the researcher sent out the questionnaires by hand delivery, email and
fax. Two hundred questionnaires were administered but 106 questionnaires were
returned and processed. Responses were then mailed back and the balance were
hand collected by the researcher. Some of the reasons for the non responses were
due to respondents either having time limitations or regarded the questionnaire as
‘junk mail’.
3.5 Analysis of the Data
Analysis of data involves reducing accumulated data to a manageable size,
developing summaries, looking for patterns and applying statistical techniques
(Cooper and Schindler: 2006).

43
A summary of descriptive and inferential statistics and exploratory data analysis was
used to analyse the data. The computer programme Statistical Package for the
Social Sciences (SPSS) is among the most widely used programs for statistical
analysis in social science. It is used by market researchers, health researchers,
survey companies, government, education researchers and others (SPSS…2009).
SPPS software was therefore selected as the statistics tool to analyse the data for
this study. Various statistical methods were used.
Descriptive frequency statistics was drawn and used to analyse the data. Bar graphs
containing frequency percentages from highest to lowest values were formulated.
Standard deviation, mean scores, minimum and maximum percentages were
calculated and used for the analysis of data.
Cross tabulated frequencies were used to make conclusions about two interrelated
questions. This technique was used to measure the strength of the relationship
between the biographical variables and customer satisfaction.
From the above data, clear conclusions can be drawn for customer satisfaction of
call centre service delivery in South Africa and recommendations to improve service
levels.
3.5.1 Descriptive Statistics
The objective of descriptive statistics analysis is to develop sufficient knowledge to
describe a body of data. This is accomplished by understanding the data levels for
the measurements which were chosen, their distributions, and characteristics of
location, spread, and shape. The discovery of miscoded values, missing data, and
other problems in the dataset is enhanced with descriptive statistics (Cooper, &
Schindler, 2001). In the case of descriptive statistics, the frequencies will be
calculated to ascertain the extent of customer satisfaction with call centre service
delivery.
3.5.2 Frequency Distribution
A frequency distribution is a table, which summarises ratio-scaled data into intervals
(classes) each with corresponding frequencies. The class frequencies reflect the

44
number of occurrences of data values that fall within the class limits (Cooper &
Schindler: 2001).
3.5.3 Visual Representation of the Data
Bar graphs and statistical tables were used to visually describe results of this survey.
Visualising the results places thoughts into perspective thus allowing conclusions to
be made.
3.6 Summary
Chapter three discussed the research methodology and design that was used as a
framework for this research.
Firstly the data collection strategy was analysed and selected. The choices selected
here was vitally important as the results were based on this premise. In addition to
selecting the data collection strategy, a look at the advantages of using a self
administered questionnaire confirmed the selected data collection strategy.
Research design and methods was then analysed. The choice for the selected
research method was explained and an analysis of the construction of the instrument
was then conducted.
Recruitment of the participants and methods of administering the questionnaire then
followed. Finally the data analysis was examined and various techniques that were
selected for this study was discussed.
The presentation of the results will follow in the next chapter.

45
CHAPTER FOUR
Presentation of Results
4.1 Introduction
This chapter provides a presentation of the data. The analysis provides a breakdown
of the demographics of the respondents including aspects such as age, gender, race
etc. in order to describe the sample data.
4.2 Frequency Analysis
The following frequency results yielded information regarding the composition of the
sample and some of the demographics of the respondents.
4.2.1 Gender
N = 106
61
39
0
10
20
30
40
50
60
70
Female Male
P
E
R
C
E
N
T
Figure 4.1 Genders of Respondents
Sixty one percent of the respondents were female and thirty nine percent were male.

46
4.2.2 Age
N = 106
55
25
128
00
10
20
30
40
50
60
21-30 31-40 41-50 51-60 61>
P
E
R
C
E
N
T
Figure 4.2 Respondent’s Age
Figure 4.2 indicates that fifty five percent of the respondents were aged between 21-
30 years. Twenty five percent fell in the 31-40 years age group, twelve percent were
in the 41-50 years age group, eight percent in the 51-60 years age group and none
were greater than 60 years of age.

47
4.2.3 Race
N = 10676
15
5 4
0
10
20
30
40
50
60
70
80
Indian Black White Coloured
P
E
R
C
E
N
T
Figure 4.3 Respondent’s Race Group
It was found that in the race category, majority of the respondents i.e. seventy six
percent were of Indian descent. The rest of the sample was made up of fifteen
percent Black, five percent White and four percent were Coloured.

48
4.2.4 Call Centre Usage
N = 105
24
31
27
16
2
0
5
10
15
20
25
30
35
Very Often Usually Seldom Rarely Never
P
E
R
C
E
N
T
Figure 4.4 Frequency of Use of a Call Centre
Figure 4.4 indicates the frequency to which South Africans make use of a call centre.
Thirty one percent usually called into a call centre, twenty seven percent seldom
called in while twenty four percent often called in, sixteen percent rarely called in and
two percent never called into a call centre.

49
4.2.5 Lack of Personalised Service
N = 106
1
33
51
15
0
10
20
30
40
50
60
Strongly Agree Agree Disagree Strongly Disagree
P
E
R
C
E
N
T
Figure 4.5 Lack of Personalised Service
Figure 4.5 indicates the extent to which respondents felt that call centres lacked the
personal service. Sixty six percent of the respondents were in agreement with the
lack of personal service call centres offer whilst thirty four percent disagreed.

50
4.2.6 Call Waiting Times
N = 105
26
42
23
5 4
0
5
10
15
20
25
30
35
40
45
Very Often Usually Seldom Rarely Never
P
E
R
C
E
N
T
Figure 4.6 Long Waiting Times
Figure 4.6 indicates the extent to which respondents have to wait when calling a call
centre. Forty two percent of respondents usually experience long waiting times whilst
twenty six percent very often experience long waiting times. Four percent never
experience long waiting times.

51
4.2.7 Dropped Calls Whilst on Hold
N = 105
14
23
39
14
10
0
5
10
15
20
25
30
35
40
45
Very Often Usually Seldom Rarely Never
P
E
R
C
E
N
T
Figure 4.7 Dropped Calls
Thirty seven percent of respondents experienced problems of dropped calls whilst
they were on hold. Fifty three percent of respondents don’t realy have a problem with
dropped calls whilst ten percent never experience this problem.

52
4.2.8 Employee Accountability
N = 105
26
33
20
12
9
0
5
10
15
20
25
30
35
Very Often Usually Seldom Rarely Never
P
E
R
C
E
N
T
Figure 4.8 Lack of Accountability
Fifty nine percent of respondents felt that call centre agents were not accountable for
their actions in their jobs whilst thirty three percent didn’t really think that was the
case.

53
4.2.9 Employee Personality
N = 106
8
17
28
34
13
0
5
10
15
20
25
30
35
40
Very Often Usually Seldom Rarely Never
P
E
R
C
E
N
T
Figure 4.9 Rude Agents
Fifty three percent of respondents had experiences with rude call centre agents
whilst forty seven percent didn’t really go through this experience.

54
4.2.10 Employee Attitude Towards Customers
N = 105
25
46
25
4
0
5
10
15
20
25
30
35
40
45
50
Strongly Agree Agree Disagree Strongly
Disagree
P
E
R
C
E
N
T
Figure 4.10 Agent Empathy
Forty six percent of repsondents felt that call centre agents needed to be more
patient and empathetic during a query or complaint whilst twenty five percent
strongly agreed with this. Twenty five percent disagreed with this and a minor four
percent strongly disagreed.

55
4.2.11 Call Bouncing
N = 105
26
43
27
3
0
5
10
15
20
25
30
35
40
45
50
Strongly Agree Agree Disagree Strongly
Disagree
P
E
R
C
E
N
T
Figure 4.11 Transfer of Calls
Two thirds of the respondents experienced problems of being transferred from one
department to the next when calling a call centre. Twenty seven percent of
respondents disagreed whilst a minor three percent strongly disagreed.

56
4.2.12 Repetition of Information
N = 105
32
21
26
15
6
0
5
10
15
20
25
30
35
Very Often Usually Seldom Rarely Never
P
E
R
C
E
N
T
Figure 4.12 Repeating Information
Fifty three percent of respondents experienced problems of having to repeat
themselves with a call centre agent whilst six percent never experienced such
problems.

57
4.2.13 Poor Use of Technology
N = 106
43 41
14
2
0
5
10
15
20
25
30
35
40
45
50
Strongly Agree Agree Disagree Strongly Disagree
P
E
R
C
E
N
T
Figure 4.13 Irrelevant Voice Menus
A majority eighty four percent of respondents felt that there were too many irrelevant
voice prompts when calling a call centre whilst fourteen percent disagreed with this
and a minor two percent strongly disagreeing.

58
4.2.14 Communication with Higher Management
N = 106
8
19
40
33
0
5
10
15
20
25
30
35
40
45
Strongly Agree Agree Disagree Strongly Disagree
P
E
R
C
E
N
T
Figure 4.14 Access to Supervisor / Higher Management
Almost three quarters of respondents were unable to speak with a supervisor or
higher manager when faced with a query that could not have been resolved by an
agent. Twenty seven percent of respondents felt otherwise.

59
4.2.15 Impact of Improved Customer Service
N = 106
36
43
48
0
10
20
30
40
50
60
Strongly Agree Agree Disagree Strongly Disagree
P
E
R
C
E
N
T
Figure 4.15 Customer Loyalty
A majority of ninety one percent of respondents indicated that good customer service
had the biggest impact on their loyalty whilst six percent were in disagreement and
three percent in strong disagreement

60
4.2.16 Pro Active Outbound Communication
N = 104
0
4947
4
0
10
20
30
40
50
60
Strongly Agree Agree Disagree Strongly Disagree
P
E
R
C
E
N
T
Figure 4.16 Courtesy Calls
A majority of ninety six respondents would have a more positive opinion about call
centres if they received a courtesy call thanking them for their business.
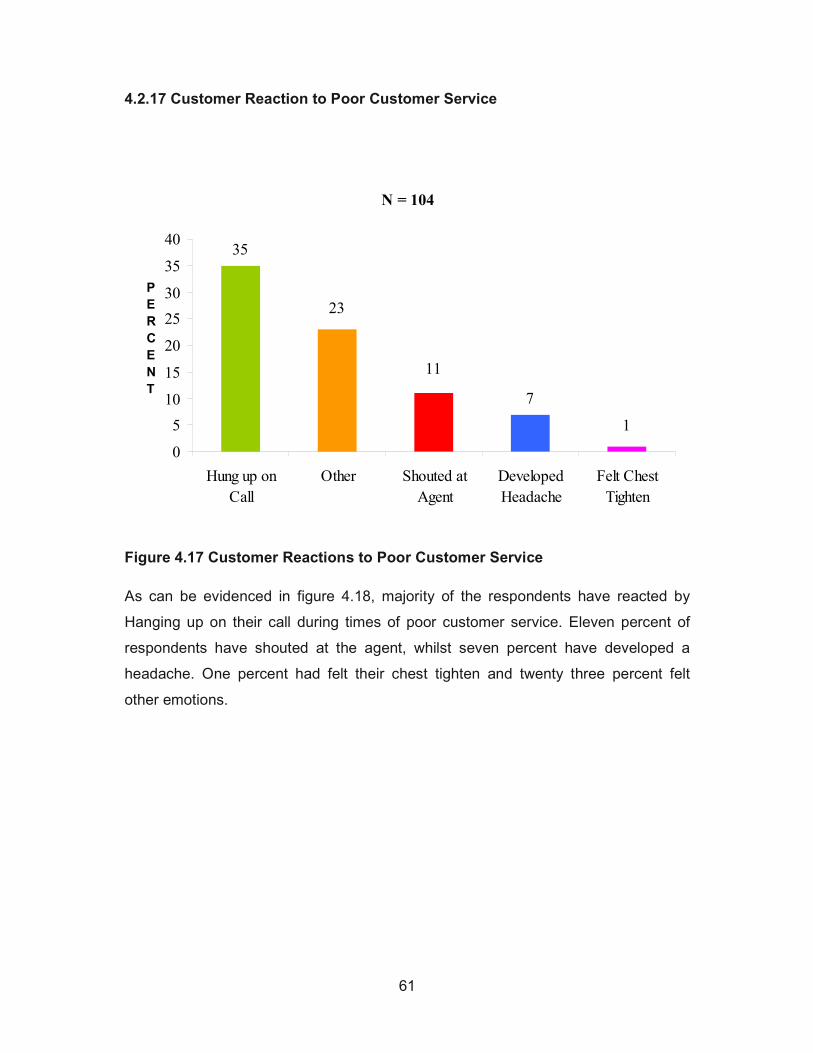
61
4.2.17 Customer Reaction to Poor Customer Service
CustomerN = 104 Reaction
7
1
11
23
35
0
5
10
15
20
25
30
35
40
Hung up on
Call
Other Shouted at
Agent
Developed
Headache
Felt Chest
Tighten
P
E
R
C
E
N
T
Figure 4.17 Customer Reactions to Poor Customer Service
As can be evidenced in figure 4.18, majority of the respondents have reacted by
Hanging up on their call during times of poor customer service. Eleven percent of
respondents have shouted at the agent, whilst seven percent have developed a
headache. One percent had felt their chest tighten and twenty three percent felt
other emotions.

62
4.2.18 Preferred Means of Communication
N = 106
38
26
20
15
0
5
10
15
20
25
30
35
40
Phone Web Chat Email SMS
P
E
R
C
E
N
T
Figure 4.18 Preferred Medium of Communication
As can be evidenced in figure 4.19 above, twenty six percent of respondents would
rather be communicating with a call centre through web chat.
Twenty percent of respondents would rather commuicate through email and fifteen
percent chose SMS communication as a prefered means of communicating with call
centres. Thirty eight percent of respondents have still chosen telephone as their
preferred mode of communication.
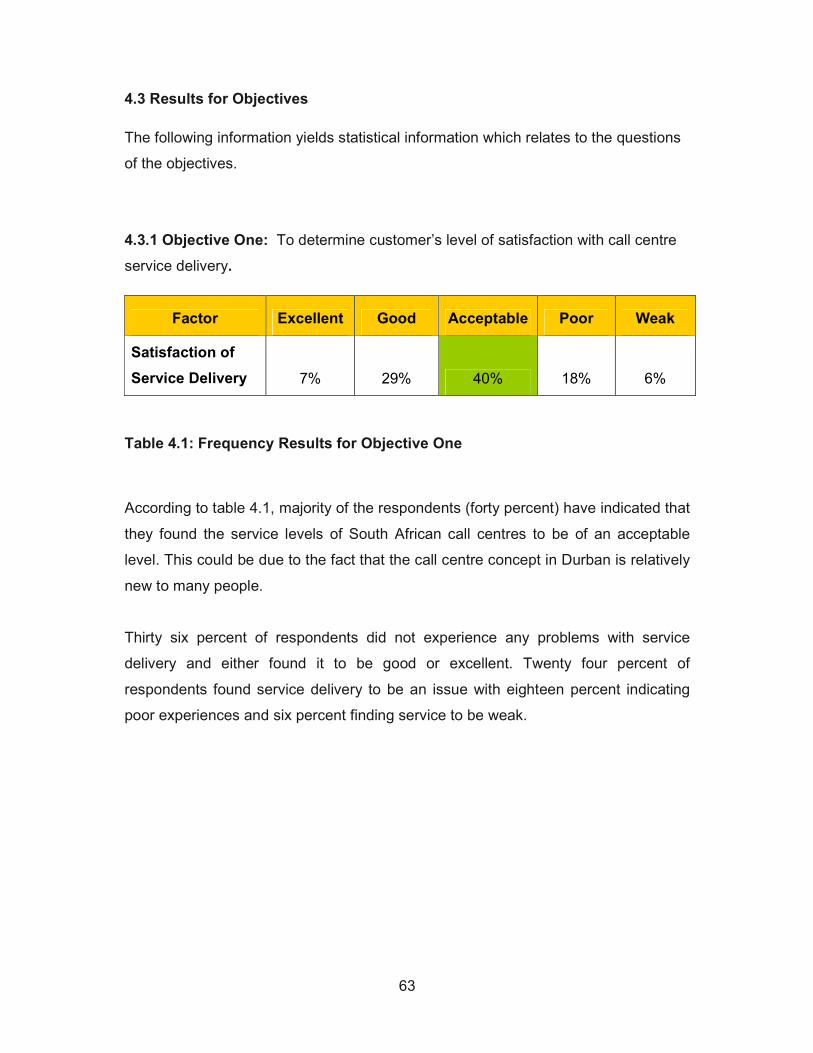
63
4.3 Results for Objectives
The following information yields statistical information which relates to the questions
of the objectives.
4.3.1 Objective One: To determine customer’s level of satisfaction with call centre
service delivery.
Factor Excellent Good Acceptable Poor Weak
Satisfaction of
Service Delivery 7% 29% 40% 18% 6%
Table 4.1: Frequency Results for Objective One
According to table 4.1, majority of the respondents (forty percent) have indicated that
they found the service levels of South African call centres to be of an acceptable
level. This could be due to the fact that the call centre concept in Durban is relatively
new to many people.
Thirty six percent of respondents did not experience any problems with service
delivery and either found it to be good or excellent. Twenty four percent of
respondents found service delivery to be an issue with eighteen percent indicating
poor experiences and six percent finding service to be weak.

64
4.3.2 Objective Two: To determine what factors of service provide customers with
satisfaction.
Factor
Strongly
Agree Agree Disagree
Strongly
Disagree
Improved customer
service 48% 43% 6% 3%
Empathetic Agents 25% 46% 25% 4%
Courtesy Call 49% 47% 4% 0%
Table 4.2 Frequency Results for Objective Two
According to table 4.2, ninety one percent of respondents agreed that improved
customer service would lead to them being more satisfied with call centres. Nine
percent of the respondents disagreed to improved customer service having an
impact on their perception of call centres.
Seventy one percent of the respondents indicated that their requirement to be
satisfied with call centre service delivery was for call centre agents to be more
empathetic and patient during a conversation. Twenty nine percent of the
respondents were in disagreement about empathetic agents being a requirement for
their satisfaction.
Ninety six percent of the respondents indicated that they are more likely to be
positive about call centres in South Africa, if they merely received a courtesy call,
thanking them for their business received. Four percent of the respondents
disagreed with courtesy calls having an impact on their satisfaction with call centres.

65
4.3.3 Objective Three: To determine what factors cause customer dissatisfaction.
Factor
Strongly
Agree Agree Disagree
Strongly
Disagree
Lack of Personal Service 15% 50% 33% 2%
Bouncing Calls 26% 43% 27% 3%
Irrelevant Voice Menu’s 43% 41% 14% 2%
Access to Supervisor 33% 40% 19% 8%
Table 4.3: Frequency Results for Objective Three
According to table 4.3, sixty five percent of respondents were in agreement with call
centres lacking a personalised service. The remaining thirty five percent felt
otherwise about call centres lacking a personalized service.
Sixty nine percent of respondents were in agreement that their calls were often
transferred from one department to the next which highlighted their dissatisfaction.
The remaining thirty percent of respondents were not affected by call transfers within
a call centre.
Eighty four percent of respondents were in agreement of call centres having too
many incorrect voice options on their automated answering machines. This clearly
indicates that this is an undesired feature and call centres would need to revise their
voice answering systems. A minimal sixteen percent of respondents did not find the
automated answering machines to be an issue that affected their use when calling a
call centre.
Seventy seven percent of respondents were in agreement that they were unable to
speak to a supervisor to resolve queries when call centre agents were unable to.
Twenty seven percent of respondents were not affected by this issue.

66
The following table lists additional factors which caused customer dissatisfaction and
is relative to objective three.
Factor
Very
Often Usually Seldom Rarely Never
Long Waiting Times 26% 42% 23% 5% 4%
Dropped Calls 14% 23% 39% 14% 10%
Lack of Accountability 26% 33% 20% 12% 9%
Repetition 32% 21% 26% 15% 6%
Table 4.4: Additional Frequency Results for Objective Three
Sixty eight percent of respondents were affected by having to wait long times before
their call was taken by a call centre agent. Twenty eight percent of respondents were
partially affected by long call waiting times whilst four percent were never affected.
Thirty seven percent of respondents were affected by their calls being dropped whilst
holding on for a call centre agent. Fifty three percent of respondents were partially
affected by dropped calls whilst ten percent were never affected.
Fifty nine percent of respondents felt that call centre agents lacked accountability for
their actions. Thirty two percent of respondents were partially affetd by
unenthusiastic agents whilst nine percent were never affected.
Fifty three percent of respondents were affected by having to repeat themselves with
a call centre agent causing much frustration. Forty one percent were partially
affected with this communication barrier whilst six percent were never affected.

67
4.3.4 Objective Four: To identify which call centre sectors, customers were most
dissatisfied with.
SERVICE SATISFACTION
Excellent Good Acceptable Poor Weak Total
Airlines 0% 20% 30% 40% 10% 100%
Insurance 6% 18% 28% 24% 24% 100%
Travel 0% 27% 27% 36% 10% 100%
Retail 0% 40% 20% 27% 13% 100%
Entertainment 13% 0% 50% 37% 0% 100%
Banking 5% 18% 50% 25% 2% 100%
Other 8% 15% 62% 15% 0% 100%
SECTOR
Telecom 7% 36% 32% 21% 4% 100%
Table 4.5 Cross Tabulation Between Sector and Service Satisfaction
Table 4.5 reflects the cross tabulation between call centre sectors and the
respondents rating of call centre service delivery in South Africa.
According to table 4.4, it can be seen that the sector which respondents are most
dissatisfied with, is the Airlines sector. Fifty percent of the respondents rated this as
the poorest and weakest sector. Thirty percent of respondents found this sector to be
acceptable whilst twenty percent were happy with this sector.
Forty eight percent of respondents rated the insurance sector as the second least
satisfying sector with twenty nine percent finding it acceptable and twenty five
percent having no problem with this sector.
The third most disliked sector was that of the travel industry with forty six percent
rating it poor and weak, twenty seven percent finding it acceptable and twenty seven
percent being content with it.
The retail sector shows that an equal amount of respondents liked and disliked this
sector i.e. forty percent rated it poor and weak whilst forty percent rated it good.

68
The entertainment and banking sector were the only two sectors whereby majority of
the respondents found it to be of an acceptable level.
The telecommunications sector was most liked by the respondents with forty three
percent of people having positive experiences and twenty five percent having poor
experiences.
4.3.5 Objective Five: To compare demographics to determine whether there are
similarities and differences amongst race groups with regards to satisfaction with call
centre service delivery.
Service Delivery in South Africa
Excellent Good Acceptable Poor Weak Total
African 7% 27% 46% 7% 13% 100%
Colored 50% 0% 25% 25% 0% 100%
Indian 4% 33% 40% 19% 4% 100%
RACE
White 20% 0% 20% 40% 20% 100%
Table 4.6 Cross Tabulation Between Race and Service Satisfaction
According to Table 4.6, eighty percent of the African respondents were happy and
satisfied with call centre service delivery. Twenty percent of the African race group
were unhappy and dissatisfied with the service delivery levels from call centres.
Seventy five percent of the Colored respondents were happy and satisfied with call
centre service delivery whilst twenty five percent were unhappy and dissatisfied with
the service delivery levels from call centres.
Seventy seven percent of the Indian respondents were happy and satisfied with call
centre service delivery whilst twenty three percent were unhappy and dissatisfied
with the service delivery levels from call centres.

69
Only forty percent of the White respondents were happy and satisfied with call centre
service delivery whilst twenty three percent were unhappy and dissatisfied with the
service delivery levels from call centres.
Based on this difference of perceptions of service delivery amongst the White race
group, a further test was done to identify whether language barriers had any effect
on this difference. Table 4.7 presents the results for a cross tabulation between race
group and repetition of information.
Repetition of Information
Very Often Usually Seldom Rarely Never Total
African 37% 6% 19% 19% 19% 100%
Colored 25% 25% 0% 50% 0% 100%
Indian 30% 24% 28% 14% 4% 100%
RACE
White 32% 21% 26% 15% 6% 100%
Table 4.7 Cross Tabulation Between Race and Service Satisfaction
According to Table 4.7, forty three percent of African respondents had to repeat
information when speaking to a call centre agent. Thirty eight percent of respondents
weren’t really affected by this problem whilst nineteen percent were never affected.
Amongst the Colored respondents, fifty percent of respondents had to repeat
information when speaking to a call centre agent and fifty percent rarely experienced
this problem.
Fifty four percent of Indian respondents had to repeat information when speaking to
a call centre agent whilst forty two percent of respondents were partially affected by
this problem and four percent were never affected.
Amongst the White respondents fifty three percent had to repeat information when
speaking to a call centre agent. Forty one percent weren’t really affected by this
problem whilst six percent were never affected.
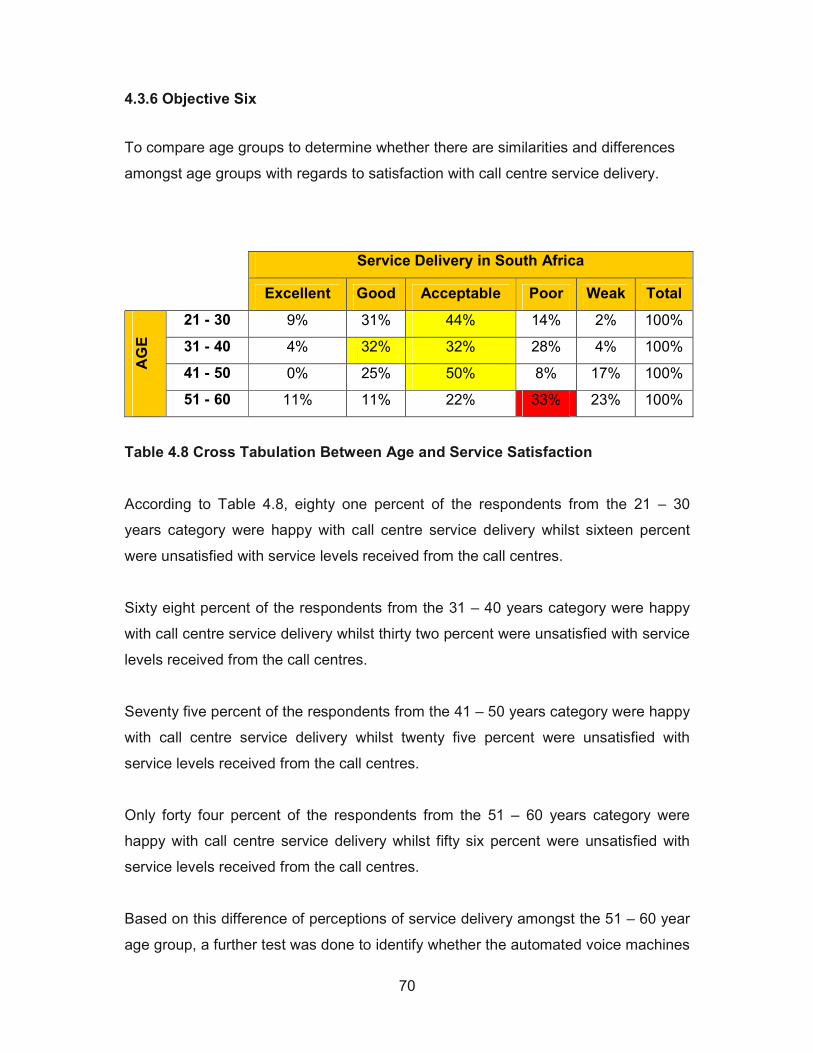
70
4.3.6 Objective Six
To compare age groups to determine whether there are similarities and differences
amongst age groups with regards to satisfaction with call centre service delivery.
Service Delivery in South Africa
Excellent Good Acceptable Poor Weak Total
21 - 30 9% 31% 44% 14% 2% 100%
31 - 40 4% 32% 32% 28% 4% 100%
41 - 50 0% 25% 50% 8% 17% 100%
AGE
51 - 60 11% 11% 22% 33% 23% 100%
Table 4.8 Cross Tabulation Between Age and Service Satisfaction
According to Table 4.8, eighty one percent of the respondents from the 21 – 30
years category were happy with call centre service delivery whilst sixteen percent
were unsatisfied with service levels received from the call centres.
Sixty eight percent of the respondents from the 31 – 40 years category were happy
with call centre service delivery whilst thirty two percent were unsatisfied with service
levels received from the call centres.
Seventy five percent of the respondents from the 41 – 50 years category were happy
with call centre service delivery whilst twenty five percent were unsatisfied with
service levels received from the call centres.
Only forty four percent of the respondents from the 51 – 60 years category were
happy with call centre service delivery whilst fifty six percent were unsatisfied with
service levels received from the call centres.
Based on this difference of perceptions of service delivery amongst the 51 – 60 year
age group, a further test was done to identify whether the automated voice machines

71
used in call centres had any effect on this difference. Table 4.9 presents the results
for a cross tabulation between age group and irrelevant voice menu’s.
Irrelevant Voice Prompts
Strongly
Agree Agree Disagree
Strongly
Disagree Total
21 – 30 44% 40% 16% 0% 100%
31 – 40 27% 50% 19% 4% 100%
41 – 50 53% 39% 0% 8% 100%
AGE
51 – 60 43% 41% 14% 2% 100%
Table 4.9 Cross Tabulation Between Age and Irrelevant Voice Menu’s
According to Table 4.9, eighty four percent of respondents in the 21 -30 year age
category agreed that there were too many irrelevant voice options on the automated
voice machines whilst sixteen percent disagreed.
Seventy seven percent of the respondents in the 31 – 40 year age category agreed
that there were too many irrelevant voice options on the automated voice machines.
whilst twenty three percent disagreed.
Ninety two percent of the respondents in the 41 – 50 year age category agreed that
there were too many irrelevant voice options on the automated voice machines
whilst eight percent disagreed.
Eighty four percent of the respondents in the 51 – 60 year age category agreed that
there were too many irrelevant voice options on the automated voice machines,
whilst sixteen percent disagreed.

72
4.3.7 Objective Seven
To compare gender groups to determine whether there are similarities and
differences amongst gender groups with regards to satisfaction with call centre
service delivery.
Service Delivery in South Africa
Excellent Good Acceptable Poor Weak Total
Male 12% 20% 43% 20% 5% 100%
GENDER
Female 3% 35% 38% 18% 6% 100%
Table 4.10 Cross Tabulation Between Gender and Service Delivery
According to Table 4.10, seventy five percent of the male respondents were overall
happy with call centre service delivery whilst twenty five percent were dissatisfied
with service levels of call centres.
Seventy six percent of the female respondents were overall happy with call centre
service delivery whilst twenty four percent were dissatisfied with service levels of call
centres.
4.5 Summary
This chapter presented the data that was obtained from the results. The results were
presented in two different formats i.e. through graphical representation and tables.
Each question was presented showing the percentages which were obtained from
analysing the responses. The graphs made it visually possible to understand the
responses and trends.
The responses from the questionnaire were coded in Microsoft excel format and
applied to the SPSS application. Objectives one, two and three were analysed using
the frequency descriptive analysis and objectives four to seven was analysed using

73
the cross tabulation frequency analysis. Cells were highlighted showing the direction
of the most favourable response. All results were presented using percentage
values.
Some of the salient findings were that customers on an overall basis were generally
satisfied with the service delivery received from call centres. The airline sector
proved to be the most dissatisfying sector for respondents and the
telecommunication sector was the most satisfying sector. Respondents preferred to
communicate with call centres through other means than the telephone such as
email, web chat and SMS.
The next chapter will discuss the findings that were presented in this chapter with an
intention of answering the research questions set out at the beginning of this
research.
74
CHAPTER FIVE
Discussion of Findings
5.1 Introduction
This chapter focuses on the findings of the data that was presented in the previous
chapter. It draws similarities and states differences in the findings of this study in
comparison to previous studies conducted by various researchers and scholars. This
chapter has been structured to answer each objective.
5.2 Objective 1: To Determine Customer’s Level of Satisfaction with Call
Centre Service Delivery.
According to Table 4.1, seventy six percent of the respondents were happy with the
service they received from call centres. However forty percent of this percentage
found service to be acceptable indicating that they were satisfied but there was still
place for improvements. A possible reason for an average rating is the fact that the
call centre industry in South Africa is still a relatively new concept and respondents
are not sure of the standards received in comparison to international standards.
According to Benner, Lewis & Omar (2007), it was only in the late 1990’s that call
centres in South Africa became popular as a cost saving mechanism for many
businesses, expanding in the outsourced market.
The results from this research differ from that conducted in London by Nuance
Communications (2008). The research in London revealed that 60% of respondents
were less than satisfied with their interactions with customer service departments
whilst the results from the sample in this research reflected approximately 30% of
respondents were less than satisfied with customer service delivery. This could be
due to the fact that the Call Centre industry in London has been in existence for a
much longer period than in South Africa.
According to the Customer Experience Impact Report (2008) conducted in the
United Kingdom, consumers are becoming increasingly intolerant of poor customer
care.

75
For the third year in a row in the United Kingdom, there was a growing trend for
consumers to stop doing business with a company following a negative customer
experience. The survey also found one in two consumers (50%) are willing to often
pay more for a better customer experience.
5.3 Objective 2: To Determine What Factors Provide Customers With
Satisfaction
The Customer Experience Impact Report (2008) has shown that consumer’s who are
satisfied, maintain their loyalty and aid a company’s growth through word of mouth
advertising.
5.3.1 Rude Agents
According to figure 4.9, results revealed that fifty five percent of respondents had
spoken to an agent that was rude over the phone. Results from the Global Genesys
survey (2007), revealed that fifty five percent of respondents also experienced this
problem. These results indicate that the global average is approximately the same as
that in South Africa, indicating that this is a global problem with call centres which
needs to be improved.
Service quality and customer satisfaction within an organization is a combination of
all the elements within the organisation that provide superior quality to its customers.
Call centre managers therefore need to review quality and control measures either
through technology or performance measurement and ensure that the right staff is in
the right job delivering quality service.
5.3.2 Empathetic Agents
According to Table 4.2, majority (seventy one percent) of the respondents require
agents to be patient and understanding when dealing with them over the telephone.
This implies that customers feel intimidated by agents. This could be due to
numerous reasons such as agents having time limits on a call or having targets to

76
achieve thus trying to complete a call quicker than it should. This suggests that
customers want a sense of courtesy from agents and also would like to receive a
personalised service, the same as which they would receive if they were to go
personally to a store or company.
Call centre’s therefore need to review targets set for agents and ensure that queries
are dealt with effectively. South Africa’s Business Process Outsourcing industry is
fast growing and one of the key features of marketing the country’s ability to compete
on an International level is to ensure that agents are skilled with telephone
mannerism.
This is backed up by Odgers (2006) who said, ‘Customer service representatives
who are skilled listeners communicate more effectively and make better decisions.
Customer focused listening is based on looking for the underlying feelings in each
message. Empathy is seeking to understand the other person’s position without
getting emotionally involved yourself.’
5.3.3 Customer Loyalty
According to Table 4.2, results revealed that ninety one percent of agreed that
customer service had the biggest impact on their loyalty. This high percentage
therefore suggests that South African users of call centres value customer service as
a key component to their purchasing decisions and that price is not the only factor
when making the decision to buy.
This is in contrast to previous research carried out in Asia, Europe and the United
States (Global Genesys Survey 2007), whereby thirty eight percent of respondents
indicated that customer service had the biggest impact on their loyalty to a company.
The difference here suggests that South African users of Call Centres place more
emphasis on the sole aspect of customer service whilst respondents from the global
survey are more concerned about their overall call centre experience such as
technology, people and internal processes.

77
5.3.4 Courtesy Call
The findings presented in Table 4.2 revealed that ninety four percent of the
respondents would have been more positive about Call Centre’s, had they received
a courtesy call, thanking them for their business. These results were backed up by
results from the Global Genesys Survey (2007) which revealed that eighty seven
percent of consumers would have a positive opinion after receiving a call just to
thank them for their business or asking them how satisfied they were.
The similarities here suggests that consumers in general look forward to feeling
valued as a customer and appreciate calls from a call centre rather than having to
make calls to a call centre. Thus it can be proven that improved service delivery will
lead to improved customer satisfaction and stronger customer relationships.
This once again stems from exceptional customer service. The happier a customer
remains, the more loyal he remains. According to Odgers (2007), ‘If a customer gets
more than they expected, the end result is exceptional customer service. Customers
tend to stay with organizations that enable them to experience positive, meaningful
and personally important feelings’.
5.4 Objective 3: To Determine What Factors Cause Consumers Dissatisfaction
‘Attracting replacement customers is an expensive process, because research
indicates that it costs five times as much to generate a new customer as it does to
keep an existing one’, (Cook 2005).Thus it is imperative for Call Centres to ensure
that everything is being done to enable a satisfying experience.
5.4.1 Lack of Personal Service
According to Table 4.3, sixty five percent of respondents agreed that call centres
didn’t offer a personal service. This is mainly directed at call centres which have
automated voice machines, assisting customers with queries. The reasons for this
could be vast such as voice options incorrectly programmed or customers unable to
get what they required from the computer programmed system. This suggests that

78
call centres need to revise their technology which is used to interface between
customers.
One of the functions of a call centre, is to provide a more convenient service to the
customer. In order to ensure this, call centres need to provide the customer with a
process that is easy and efficient. Reviewing their technology, internal operations
and personnel communicating with the customer is crucial.
These results are backed up by Mintel Research (2000) where half of adults missed
the personal touch. Forty nine percent of respondents from the Mintel survey agreed
that they missed the individual service that going to a branch or office offers.
5.4.2 Long Waiting Times
The test results for long waiting times revealed that customers were unhappy about
the amount of time they had to spend waiting before their calls were answered.
According to Table 4.4, sixty eight percent of respondents were frustrated with long
waiting times. A Call centre provides service to a broad range of customers including
businesses. Long waiting times for businesses impacted on their productivity and
therefore could not allow for this problem. Call centres need to segment the market
into various categories and through the use of technology, strategically prioritise
customers.
These results are backed up by results from the Global Genesys Survey (2007),
which revealed that the same number of respondents (sixty seven percent) was also
frustrated with long waiting times. The exact similarity in findings indicates that this is
a common problem with call centre’s globally and thus call centres should focus on
continuous improvements.
5.4.3 Dropped Calls
According to Table 4.4, the results for the number of calls that were being dropped
during or whilst holding on for an agent is approximately thirty seven percent. Whilst
this figure may not seem very high, a problem does exist. Dropped calls are costly,

79
time consuming and frustrating to the customer. However a large fifty three percent
of respondents were not severely affected by this problem implying that the problem
is not as bad as it could be.
In a time where business competition is strong, customers now have the option of
demanding what they require and as a result dissatisfaction, will lead to customer
loss. According to Odgers (2006), ‘Customer perceptions are created during and
after a transaction. It is based on how actual service measures up to his or her
expectations. If the customer gets anything less than they expected, they perceive a
performance gap and in that gap lies disappointment’.
5.4.4 Lack of Accountability
The results from Table 4.4, revealed that more than fifty percent of respondents
agreed that call centre agents lacked accountability and failed to live up to their
promises of returning their call. Lack of accountability could be as a result of various
factors such as lack of training, under staffed call centres, poor systems, unrealistic
targets or unenthusiastic employees.
Agents that lack training are not confident enough to call back their customers or
take ownership. Understaffed call centres, often leads to over committed agents who
are then unable to resolve a query from beginning to end. Poor systems, wouldn’t
allow multiple agents to work on a particular customers query, resulting in a
customer having to repeat information which ultimately leads to dissatisfaction.
Briggs (2005) said, ‘As the scope of contact centres grows, the complexity of
interactions that agents handle increases, which means they need more training’.
Call centre agents are faced with strict targets in terms of answering and making a
set number of calls in a day and as a result of not being able to multitask, queries are
left unresolved. Therefore team leaders and managers should ensure that there is a
balance between call centre agents achieving their target and proving quality
service. Lastly, there is always the possibility of employees who lose their
enthusiasm and should be performance managed to ensure maximum productivity.
Call centres would therefore need to investigate these options in order to make
improvements.

80
5.4.5 Bouncing Calls
Results from Table 4.3 indicated that more than sixty percent of respondent’s calls
got transferred from one department to the next when calling into a call centre. The
reason for this occurrence could be twofold. It could be that call centre’s
telecommunication and IT systems needs to be upgraded to higher standards or it
could be that call centre agents need to be updated on how to make efficient use of
internal operations.
Once again this is a frustration for the customer leading to dissatisfaction and
eventually loss of business for the company concerned. According to Odgers (2006),
first impressions are critical and a customer often rates the quality of the service at
this stage. Hence it is crucial for call centre’s to create a positive first impression
ensuring sustainable development. ‘When calls must be transferred, it must be kept
simple, positive and transferred with care’ (Odgers 2006).
5.4.6 Repetition
The results in Table 4.4 for repetition revealed that just over fifty percent of the
respondents had to repeat themselves when speaking to a call centre agent. The
problem here could be either a technological disadvantage, in which case system
upgrades may be needed or language barriers could be a cause for concern. In the
latter case, call centre managers would need to asses the problem on its entirety and
recruit staff in a manner which will get the right person for the right job. According to
the Genesys Global Study (2007), 52% of the respondents were frustrated having to
repeat themselves. Once again the Geneysy Global Survey supports findings from
this research. This therefore suggests that this issue does not solely relate to
communication barriers however other factors such as systems and use of
technology need to be improved. These results, once again indicates that certain
issues of customer dissatisfaction is a global issue and hence South Africa is not far
behind from the leading Call Centre hubs around the world.

81
5.4.7 Irrelevant Voice Menus
According to Table 4.3, results for irrelevant voice menus revealed that more than
eighty percent of respondents felt that they believed that there were too many
irrelevant voice prompts before leading them to the correct option. This is a
considerably high percentage and should be a serious cause for concern for many
call centres. This suggests that South African call centre’s need to research their
customer’s needs correctly and effectively programme voice menus for customer
user friendliness.
According to the Genesys Global Survey (2007), fifty seven percent of respondents
felt that there were too many irrelevant voice prompts before getting the correct
option. This figure is considerably smaller than that observed from South African
respondents.
Odgers (2007) stated, ‘Customers want to feel that their telephone calls are
important to a company. What drives customers to frustration about some phone
systems is not the fact that they are automated, but that they think no one is paying
attention to their needs’.
5.4.8 Access to Supervisor
The results from Table 4.3 for access to a supervisor revealed that seventy four
percent of respondents were unable to get assistance from a supervisor when this
was required. This suggests that a large number of respondents required the
assistance of someone from a higher position. This implies that call centre agents
need to be trained on products and services regularly and appraisals should be in
place to eliminate poor productivity. On the other hand, call centre’s need to
empower team leaders to be able to handle calls from customers with certain queries
that need extra assistance.
Customers who are unable to get reassurance from supervisors and managers will
ultimately feel not valued and this often results in unhappy customers leading to
business loss.

82
5.5 Objective 4: To Identify Which Call Centre Sectors, Customers Are Most
Dissatisfied With.
According to the results from Table 4.5, the descriptive frequencies indicated that the
Airline industry was the sector that customers were most dissatisfied with, followed
by insurance, travel and retail. Respondents had found entertainment, banking and
telecom to be of an acceptable level placing these sectors higher up on the list. The
sector that was most liked was that of Telecommunication indicating that companies
such as MTN, Vodacom, Cell C and Telkom had provided service that was
customers were satisfied with. The sector that received the best rating was the
entertainment sector.
The results for the airline sector came as a surprise as more and more customers
are now booking online thus relieving the pressure on call centres. Furthermore,
airline call centres have been long in operation and should ideally be equipped to
offer exceptional service. The rating for the insurance sector came as no surprise as
this is a relatively new concept for insurance companies who makes use of in–house
and outsourced call centres to market their services This objective was designed to
understand exactly which sector needed most attention so that problems causing
dissatisfaction can be appropriately addressed.
5.6 Objective 5: To Compare Demographics to Determine Whether there are
Similarities and Differences Among Race Groups with Regards to Satisfaction
with Call Centre Service Delivery.
Figure 4.3 revealed that almost three quarters (seventy six percent) of the sample
represented the Indian race group, followed by the black race (fifteen percent) whilst
the Coloured (four percent) and White race (five percent) groups were the least in
the sample.
According to Table 4.6, the majority of the Black South Africans and Indian
respondents had found call centre service delivery to be acceptable whilst the
Coloured respondents felt it was excellent. However the majority of the White
respondents felt service delivery was poor. The common trend here is that the Black

83
South Africans, Coloured and Indian respondents were content with the level of
service received from call centres whilst the White respondents were not satisfied.
A further test was carried out to assess whether language barrier had been a result
of the difference in perception from the White respondents. According to Table 4.7,
fifty three percent of the White respondents had a problem communicating with call
centre agents. The fact that only fifty percent of the respondents experienced this
problem implied that language barrier could be part of the reason for the difference in
perceptions of call centre service delivery however there could be various other
contributing factors.
5.7 Objective 6: To Compare Age Groups to Determine Whether there are
Similarities and Differences Amongst Age Groups with regards to Satisfaction
with Call Centre Service Delivery.
Figure 4.2 revealed that just over fifty percent of respondent in the sample were
aged between 21-30 years and quarter of the sample were aged between 31-40
years with a mere eight percent representing the 51-60 years age group.
According to Table 4.8, it can be seen that majority of the respondents from the 21-
50 age group category were satisfied with service delivery received. This can be due
to the fact that these respondents are more familiar with the new cal centre
technology and are able to identify with the changes in service provision.
However it was found that the 51-60 year age group were most dissatisfied with the
service received from call centres. This could be indicative of the fact that call
centres are a relatively new concept. Customers from the older age category were
probably more familiar with traditional methods such as interacting directly with the
company rather than making use of automated voice machines. To confirm this, a
further cross tabulation test was carried out between age groups and irrelevant voice
options on automated voice machines.
According to Table 4.9, eighty four percent of the respondents from the 51 – 60 year
age group agreed to experiencing problems with the options on the automated voice
machines. This therefore suggests that respondents who belonged to the 51 – 60

84
age group, are in actual fact uncomfortable with the automated voice services
offered by call centres thereby causing dissatisfaction with call centre service
delivery.
5.8 Objective 7: To Compare Gender Groups to Determine Whether there are
Similarities and Differences Amongst Gender Groups with regards to
Satisfaction with Call Centre Service Delivery.
Figure 4.1 revealed that majority (sixty one percent) of the respondents in the
sample were female. According to Table 4.10, it can be seen that females were
marginally happier than the male respondents. However in totality, there weren’t any
distinct differences in the comparison between gender and service quality. This
implies that call centres were not bias in the way in which they have approached the
male and female respondents. This is positive for call centres in South Africa
ensuring that call centres remain free from bias of any kind.
5.9 Objective 8: To Provide Recommendations to Call Centres to Improve
Service Levels.
The information gathered from the findings presented in Chapter four as well as the
discussion in this Chapter, lends itself towards making valuable recommendations to
call centres to improve and enhance the way in which they deliver service to their
customers. These recommendations are discussed in chapter six.
5.10 Customer Reactions to Poor Customer Service
Figure 4.17 revealed that customers have reacted in various ways to display their
anger and frustration at poor customer service. Results indicate that thirty five
percent of the respondents have resorted to hanging up on their call as a result of
not being able to get what they required. Eleven percent of respondents have
resorted to shouting at the agent, whilst seven percent developed a headache.

85
One percent of respondents felt their chest tighten and twenty three percent have
experienced other symptoms of frustration. All of these reactions are a
representation of poor customer service which could relate to a personnel problem or
operations problem.
According to the Global Genesys Survey (2007), twenty five percent of respondents
have shouted, nine percent have developed a headache or felt sick, six percent have
felt their chest tighten and two percent have cried.
In both these findings, ‘shouting at the agent’ was an emotion expressed by majority
of the respondents. This suggests that customers get highly irate over the phone
thus venting their anger at the agent. The cause of this anger could have been one
of many or even a combination such as those factors.
Call centres need to further investigate this area of frustration by listening in on
previous and current calls and improve on issues that can be dealt with, be it at
employee level or operational. The implication here is that poor service from call
centres leads to customer frustration which eventually leads to loss of business thus
tarnishing the image of the company.
5.11 Preferred Means of Communication
As a result of poor service and the frustration of long waiting times, consumers
increasingly want to communicate with companies using newer technologies, and
having access to multiple channels. According to Figure 4.2.18, majority of the
respondents (sixty one percent) preferred not to communicate via the telephone.
Twenty four percent wanted to communicate through email instead of talking over
the phone, twenty one percent would like the option of using web chat to
communicate with call centres, fifteen percent through SMS and one percent through
other means.
According to the Genesys Global Survey (2007), a large percentage of global call
centre users still prefer using the telephone as a means of communication as
86
opposed to thirty eight of those in South Africa. This therefore implies that customers
globally are not as frustrated with call centre agents as users in South Africa.
Eighty six percent of global call centre users prefer using email to communicate with
call centres as opposed to twenty percent of users in South Africa. This indicates
that South Africans are slowly integrating other communication channels to interact
with call centres. This could also suggest that fewer people in South Africa have
internet access with an email account. Finally this could also be due to the fact that
Call centre communication is relatively new with South Africans and over time, this
will change.
5.12 Summary
Overall, it was found that respondents have found customer satisfaction of call
centre service delivery in South Africa to be of an acceptable level however call
centres need to still carefully examine factors causing dissatisfaction.
The findings revealed that improved service delivery led to customer loyalty which
ultimately leads to better business profits. The main focus of this study was to test
customer satisfaction of call centre service delivery in South Africa.
The chapter examined factors that caused customer satisfaction and dissatisfaction
and were compared against the Global Genesys Report. Facts from the Customer
Experience Impact report was also analysed to look for similarities and differences.
Findings showed that there were more factors that caused dissatisfaction than that
which caused satisfaction. Generally it was found that South African call centre
issues that were faced by customers were also faced by users from abroad.
Thus it was noted that South Africa was not behind international standards however
has much to do in order to improve service levels which have appeared to be mainly
operational issues rather than people issues.
Results for the call centre sector that caused most dissatisfaction were examined
and a summary comparing analyzing potential reasons was formulated. Tests were

87
carried out and results were analysed to examine whether age, gender or race had
any correlation with call centre service delivery.
The next chapter discusses the implications of these findings and recommendations
that will impact on the relevant stakeholders.

88
CHAPTER SIX
Recommendations and Conclusions
6.1 Introduction
Service quality had been identified as a critical issue for ensuring customer
satisfaction when using call centres. The literature contained in this study highlighted
issues of service quality in call centres in the United Kingdom and around the world.
It showed that customer satisfaction is dependent upon service quality.
Business Process Outsourcing (BPO) is a growing industry in South Africa and in
order for South Africa to attract international attention, service quality has to be in
line with international standards.
Understanding South Africa’s level of quality and customer satisfaction is vital
information for most call centres. Satisfied customers often lead to loyal clients thus
ensuring sustainable profits.
The findings from this study will provide new and existing call centres with services
that can be improved on, so as to uplift service delivery and customer satisfaction.
6.2 Outcome of this Study
The objectives set out in this research were aimed at understanding customer
perceptions. Service quality will always be an area of focus which will need
improvement due to growing demands and expectations from the customer however
findings from this study will help call centres understand the reasons why customers
think they way they do i.e. analysing factors causing happiness and stress will allow
for better decision making. Having accessibility to this information will cut costs
ensuring that time and money are utilized in areas of most need. Thus the findings
from this research have been converted into valuable information which will assist
call centres in improving their service levels.

89
6.3 Recommendations and Implications
Recommendations and implications are listed below to explain what needs to be
done to improve overall customer satisfaction and who will stand to benefit from this
study.
6.3.1 Recommendations from this Study
The following call centre concerns caused the greatest amount of dissatisfaction for
the respondents and therefore improving the following will enhance service levels in
South African Call Centres.
a) Long Call Waiting Times
Call centres need to enhance technology and other operations facilities which
impact on call waiting times.
b) Dropped Calls
Call centres need to train staff and improve call handling facilities to reduce
the amount of calls that are dropped when a user calls into a call centre.
c) Lack of Accountability
Call centre agents need to be trained and measured against query resolution
and customer satisfaction. Improved internal information technology systems
will ensure customer’s problems are resolved efficiently.
d) Bouncing Calls
Call centres need to ensure agents are fully trained on telephone systems and
internal processes are learnt to avoid the issue of calls being transferred from
one department to the next endlessly.

90
e) Irrelevant Voice Prompts
Call centre telecommunication systems need to be revised to ensure that the
correct voice prompts are at the forefront of their business. This will reduce
customer frustration and improve loyalty.
f) Supervisor Resolution
Proper escalation paths need to be implemented so that customers are able
to speak to supervisors or team leaders when issues of major concern arise
amongst customers. Implementation of these practices and policies would
improve supervisory support, increase job competencies, increase job
opportunities and improve career satisfaction, which would in turn improve
customer service orientation among employees.
g) Call Centre Sector
Call centres who serve as service providers for the airline industry need to
improve on all the concerns from points a) – f) listed above, as it was found
that respondents were most dissatisfied with the airline sector.
h) Understanding Customer Emotions
Figure 4.18 clearly indicates that customers have expressed various emotions
at call centre agents during times of poor service delivery. Call centres need
to view these emotions so that they can avoid such customer frustrations.
i) Preferred Means of Communication
Figure 4.19 indicates that customers prefer communicating with call centres
through other means than the telephone. Cal centres therefore need to view
these preferences and develop a communication system that suits all
stakeholders.

91
6.3.2 Implications of this Study
The following is a list of benefits that can be obtained from the research questions of
this study for the stakeholders concerned.
a) Perceptions of Service Quality
Findings here will provide call centres with first hand information about the
perceptions of users of call centres from the city of Durban. This will give call centres
a sense of reassurance in terms of customer feedback. On the other hand users will
benefit from knowing that their views have been taken into account for
improvements.
b) Main Factors Related to Customer Satisfaction
Findings here are vitally important to call centres for decision making purposes in call
centres. Call centres will need to take note of these findings and decide which
concerns applies to their business so that sustainable systems can be implemented.
This will prevent call centres from exhausting time and funds in areas that don’t need
attention. Majority of the findings are in line with international concerns which will
reassure South African call centres of their standards of quality in this growing
sector.
c) Factors Related to Customer Dissatisfaction
Findings here will allow call centres to review these causes of dissatisfaction and
determine which issues directly apply to their business. The consumer stands to
benefit by addressing these concerns and thus ensuring call centres aim for a more
rigid and full proof system.
92
d) Most Disliked Call Centre Sector
Findings here will allow call centres to understand where they are positioned in the
mind of the customer in comparison to other call centre sectors. This rating will act
as a goal for call centres to improve their position to becoming the call centre sector
with the least unhappy customers.
e) Similarities and/or Differences Amongst Demographics
Demographic data is important for decision makers in the sales and marketing
division. Call centres will benefit from this information by allowing it to strategically
plan for the needs of its customers by taking into consideration demographic
information. Sales agents will also be empowered with information which will allow
them to profile customers before approaching the consumer market.
f) Providing Recommendations
One of the key objectives of this research was to feedback as well as provides
recommendations to call centres. The recommendations are practical and apply
directly to all call centres. It is made up of operational, personnel and technological
recommendations and will definitely assist call centres in reviewing their business
strategy and policy and procedures.
These recommendations are meant to benefit three key stakeholders which are call
centres itself, employees of call centres and the customer. This will assist call
centres by ensuring it implements sustainable systems which will improve service
quality; hence this will lead to returning customers leading to increased profits.
Employees will benefit from call centres now being able to empower them in the area
which training is most needed. Finally the customer benefits from the
recommendations made, leading to improved service levels user friendly systems.

93
6.4 Recommendations for Future Studies
Future studies should take into account the following:
• Call centres operate nationally. The current study looked at a sample from the
city of Durban. A broader and larger sample must be drawn so that the
sample is representative of the entire country. Therefore this study needs to
be conducted in other provinces to get an unbiased opinion of call centres in
South Africa.
• The majority of the sample was made up of female respondents. Research is
needed with a more balanced gender sample so that associations between
the two can be more distinct.
• A sample of a more balanced mix of race groups would highlight different
purchasing patterns.
• This study did not identify whether the respondents were employed or not as
well as the industry in which they were employed. An understanding of this
will enable call centres to highlight perceptions of people from differing
industry’s and can examine thinking patterns between the employed and
unemployed.
• A large number of respondents from the sample had indicated the ‘Other’
option as their choice for call centre sector which they used. This needs to be
explored further hence future studies need to list the various other sectors of
the call centre industry in the questionnaire.
• This study focused on service quality of call centres in general. It did not
research the exact type of call centre i.e. in-house, outsourced or business
process outsourcing. An understanding of the exact type of call centre with
which problems are encountered is important so that dissatisfaction is not
generalised across all call centres. This will then ensure that
recommendations are specific and are made to the relevant call centres.
• This study did not examine correlations between age and returning customer,
gender and returning customer and race and returning customer. Future
94
studies need to explore this area of importance which will indicate
associations between these two variable and will thus assist in modifying
systems.
• Call centres exist globally. This survey used two other surveys as a
benchmark for comparison. Future studies need to compare results to other
surveys carried out globally so that it can have a true measure of its standard
of quality.
6.5 Summary
The aim of this research was to understand to what extent people from Durban are
satisfied with call centre service delivery. The sub objective was to identify and
explore reasons for customer dissatisfaction with call centres. The results from this
survey are an indication of the respondent’s feelings and can now be used as a
means of understanding their frustration.
The results obtained were compared to previous international research studies which
showed similar comparisons to most results thus reaffirming that issues of
dissatisfaction is a world wide phenomenon. The study of customer satisfaction for
call centre service delivery is therefore vital for technological and operational
advances in this fast growing sector. The data collected directly answered the
questions for the objectives and therefore call centres will be able to take practical
guidance from the findings in order to build sustainable systems.