
Connectivity influences on nutrient and sediment migration in the Wartburg catchment, KwaZulu-Natal...
12
This article appeared in a journal published by Elsevier. The attached copy is furnished to the author for internal non-commercial research and education use, including for instruction at the authors institution and sharing with colleagues. Other uses, including reproduction and distribution, or selling or licensing copies, or posting to personal, institutional or third party websites are prohibited. In most cases authors are permitted to post their version of the article (e.g. in Word or Tex form) to their personal website or institutional repository. Authors requiring further information regarding Elsevier’s archiving and manuscript policies are encouraged to visit: http://www.elsevier.com/authorsrights
Transcript of Connectivity influences on nutrient and sediment migration in the Wartburg catchment, KwaZulu-Natal...
This article appeared in a journal published by Elsevier. The attachedcopy is furnished to the author for internal non-commercial researchand education use, including for instruction at the authors institution
and sharing with colleagues.
Other uses, including reproduction and distribution, or selling orlicensing copies, or posting to personal, institutional or third party
websites are prohibited.
In most cases authors are permitted to post their version of thearticle (e.g. in Word or Tex form) to their personal website orinstitutional repository. Authors requiring further information
regarding Elsevier’s archiving and manuscript policies areencouraged to visit:
http://www.elsevier.com/authorsrights

Author's personal copy
Connectivity influences on nutrient and sediment migrationin the Wartburg catchment, KwaZulu-Natal Province, South Africa
Kipkemboi J. Kollongei a,⇑, Simon A. Lorentz b
a School of Engineering, University of KwaZulu-Natal, Durban 4041, South Africab Centre for Water Resources Research, University of KwaZulu-Natal, Pietermaritzburg, South Africa
a r t i c l e i n f o
Article history:Available online 17 February 2014
Keywords:ConnectivityNon-point-source pollutantsIsotopesWartburg catchmentWetlands
a b s t r a c t
Non-point-source (NPS) pollution of surface and groundwater by sediment and nutrient loads emanatingfrom agricultural catchments is a prominent environmental issue, with major consequences on watersupply and aquatic ecosystem quality. The concept of connectivity has proved invaluable in understand-ing migration of NPS pollutants in catchments. Observations of sediments or suspended solids (SS),nitrate (NO3) and phosphorous (P) fluxes alongside stable water isotope sampling were made on a nestedbasis at field and catchment (41 km2) scales for a series of events in the Wartburg catchment, SouthAfrica. The nested catchment scale sampling was focused on control features in the stream network,including road crossings, farm dams and wetland zones. The analyzed stable water (d18O and d2H) iso-topes results were used to interpret the connectivity of the contributing land forms and the stream net-work. The results reveal the dominant influences of farm dams and wetlands in limiting the downstreammigration of sediment and nutrients for all but the most intense events. Certain events resulted in mixingin the dams and larger resultant outflow than inflow loads. These occurrences appear to be as a result ofcombinations of reservoir status, catchment antecedent conditions and rainfall depth and intensity. Thenutrients loads between Bridge 1 and Bridge 2 stations reflect the bedrock control, where contributionsfrom sugar cane hillslopes between these stations are not retained, even in the short wetland upstream ofBridge 2. Isotope analyses reveal that the headwaters, comprising 70% of the catchment area, contributeas little as 29% of the total catchment discharge, due to impoundments in this area. However, this con-tribution varies significantly for different events, reaching a maximum of 78% of the catchment discharge.It can therefore be concluded that nutrients and sediment migration in the Wartburg catchment is greatlyinfluenced by connectivity. The d18O and d2H water isotopes can be used to assess the contributions ofdifferent sources of water which impact the transport of nutrients and sediments in catchments.
� 2014 Elsevier Ltd. All rights reserved.
1. Introduction
The concept of connectivity in NPS processes is of increasinginterest to a range of disciplines such as landscape ecology (Turneret al., 1993), hydrology (Western et al., 2001; Bracken and Croke,2007) and geomorphology (Brierley et al., 2006; Müller et al.,2007). This is mainly because the transient connection of hillslopesto channel networks is at the centre of important issues such asflood and sediment yield generation, diffuse pollutant fluxes andthe trigger of many important ecological events. In order to under-stand catchment sciences much of the research work has to focuson the role of connectivity in explaining catchment hydrological
responses and pollutant fluxes. The three most important formsof connectivity that are discernible in the Wartburg catchmentare landscape, hydrological and sedimentological connectivity.Landscape connectivity defines the physical coupling of landforms(e.g. hillslope to channel) within a catchment whereas hydrologicalconnectivity refers to the passage of water from one part of thelandscape to another and is expected to generate a catchment run-off response. Sedimentological connectivity relates to the physicaltransfer of sediments and attached pollutants throughout thedrainage area and may depend on among other factors, the particlesize. Recent findings in Water Research Commission (WRC) pro-jects on NPS Pollution in the Wartburg catchment have demon-strated that sediment and nutrient delivery at the catchmentscale defy the classic source-area concept, but are dictated by land-scape and stream connectivity and controls (Lorentz et al., 2011,2012).
http://dx.doi.org/10.1016/j.pce.2014.01.0021474-7065/� 2014 Elsevier Ltd. All rights reserved.
⇑ Corresponding author. Tel.: +254 722235223 (Kenya).E-mail addresses: [email protected], [email protected]
(K.J. Kollongei).
Physics and Chemistry of the Earth 67–69 (2014) 12–22
Contents lists available at ScienceDirect
Physics and Chemistry of the Earth
journal homepage: www.elsevier .com/locate /pce
Author's personal copy
Miller et al. (2013) combined provenance studies with datafrom the geomorphic investigations which showed that the Wart-burg catchment could be subdivided into three geomorphological-ly distinct subcatchments. These subcatchments vary in relief, thenature of their drainage network (or process zones) and their abil-ity to store and transport sediment plus other adsorbed pollutants.Consequently, sediment transport and storage are characterized byspatially abrupt changes in their nature and magnitudes, but donot systematically vary along the axial drainage system (Milleret al., 2013). The capability of the process zones to transfer sedi-ment and adsorbed nutrients and their spatial distribution at thecatchment scale indicated that the movement of material throughthe Wartburg catchment was limited and discontinuous except,perhaps, during high magnitude runoff events (Lorentz et al.,2011; Miller et al., 2013). Sediment which is delivered to andtransferred through waterways and upland channels on hillslopeswill primarily be deposited downstream within wetlands anddams (reservoirs) during low- to moderate-floods. Thus, the uppercatchment areas were characterized by a highly disconnected sed-iment transport system.
At the agricultural catchment scale, sediment and nutrient lossmitigation strategies must assess the hydrological connectivitybetween contributing landforms and the stream network. McGlynnet al. (2004) linked hillslope runoff contributions, total runoff andriparian water table dynamics in five nested catchments to land-scape topography and the organization of hillslope and riparianlandscape elements. Increasing synchronicity of runoff and soluteresponse across scales was attributed to increasing antecedentwetness, event size, and the resulting increased riparian–hillslope–landscape hydrologic connectivity. The approach has highlightedthe importance of hillslope–riparian–stream connectivity forthe explanation and prediction of hydrologic response and thein-stream water quality degradation in the Wartburg catchment.
According to Heathwaite et al. (2005) the main challenge inidentifying water bodies at risk from diffuse pollution is to deter-mine how nutrients are retained within complex landscapes andreleased to adjacent streams via surface and subsurface flow paths.In order to overcome this challenge it is necessary to identify thekey landscape and land management controls driving nutrientmobilization e.g. road crossings, connected slopes, bedrock control,farm dams and wetland zones in tandem with catchment anteced-ent moisture conditions, rainfall depth and rainfall intensity.Integrating these controls with a methodology for field character-ization allows the primary flow path of nutrient and particle move-ment to be identified. In the Wartburg catchment the application oftracer-based techniques relying primarily on naturally occurringenvironmental isotopes were used to study nutrient losses andconnectivity. It consisted of identifying the connectivity of thepathways of pollutant migration and surface water–groundwaterhydraulic interactions.
Stable isotopes of water (d18O and d2H) used in the Wartburgcatchment were as a result of isotope fractionations that producesa natural labeling effect within the global water cycle and has beenapplied successfully to study a wide range of hydrological and cli-matic processes at the local, regional and global scales (Gibsonet al., 2005). Like in Baskaran et al. (2009), the stable isotopes usedin Wartburg catchment defined hydrological processes connectiv-ity between surface water features mainly streams, wetlands andthe underlying groundwater systems. In the Wartburg scenario,stream discharge and consequent NPS pollution from the two im-pounded tributaries was limited by the storage afforded in theseimpoundments. The dominant contribution mechanism for nutri-ents in the landscape appeared to be in the subsurface, in lateraldischarge in the intermediate layer between the sandy soil andbedrock. Event water, carrying high nutrient loads, dominatedthe responses at the field scale, while low flows reflect the ground-
water concentrations of NO3 and P. This information helps in betterunderstanding the nature and extent of connectivity in the processzones of contributing landforms and influence of farm dams, wet-lands and bedrock controls on the migration of nutrient and sedi-ments in the catchment which can be ultimately used for effectiveNPS pollution mitigation measures.
The objectives of the study were;
� To define the dynamics and connectivity in the process zones ofcontributing landforms by observing water, sediment and nutri-ent fluxes using hydrometric and stable isotope responses.� To define and quantify hydrological and dissolved nutrient
sources and transport mechanisms within the process zones.� To define and quantify the effect of NPS pollution controls such
as riparian buffer zones, wetlands and reservoirs on the migra-tion of sediments and solutes through the catchment.
2. Materials and methods
2.1. Study area
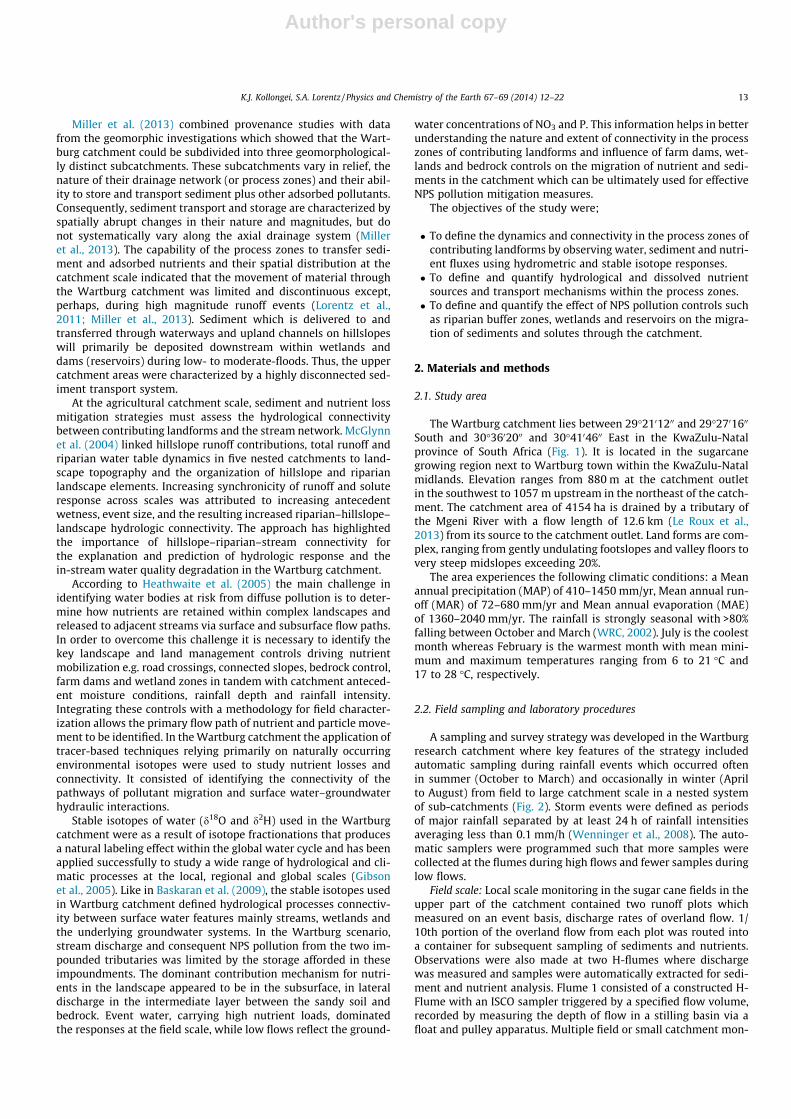
The Wartburg catchment lies between 29�2101200 and 29�2701600
South and 30�3602000 and 30�4104600 East in the KwaZulu-Natalprovince of South Africa (Fig. 1). It is located in the sugarcanegrowing region next to Wartburg town within the KwaZulu-Natalmidlands. Elevation ranges from 880 m at the catchment outletin the southwest to 1057 m upstream in the northeast of the catch-ment. The catchment area of 4154 ha is drained by a tributary ofthe Mgeni River with a flow length of 12.6 km (Le Roux et al.,2013) from its source to the catchment outlet. Land forms are com-plex, ranging from gently undulating footslopes and valley floors tovery steep midslopes exceeding 20%.
The area experiences the following climatic conditions: a Meanannual precipitation (MAP) of 410–1450 mm/yr, Mean annual run-off (MAR) of 72–680 mm/yr and Mean annual evaporation (MAE)of 1360–2040 mm/yr. The rainfall is strongly seasonal with >80%falling between October and March (WRC, 2002). July is the coolestmonth whereas February is the warmest month with mean mini-mum and maximum temperatures ranging from 6 to 21 �C and17 to 28 �C, respectively.
2.2. Field sampling and laboratory procedures
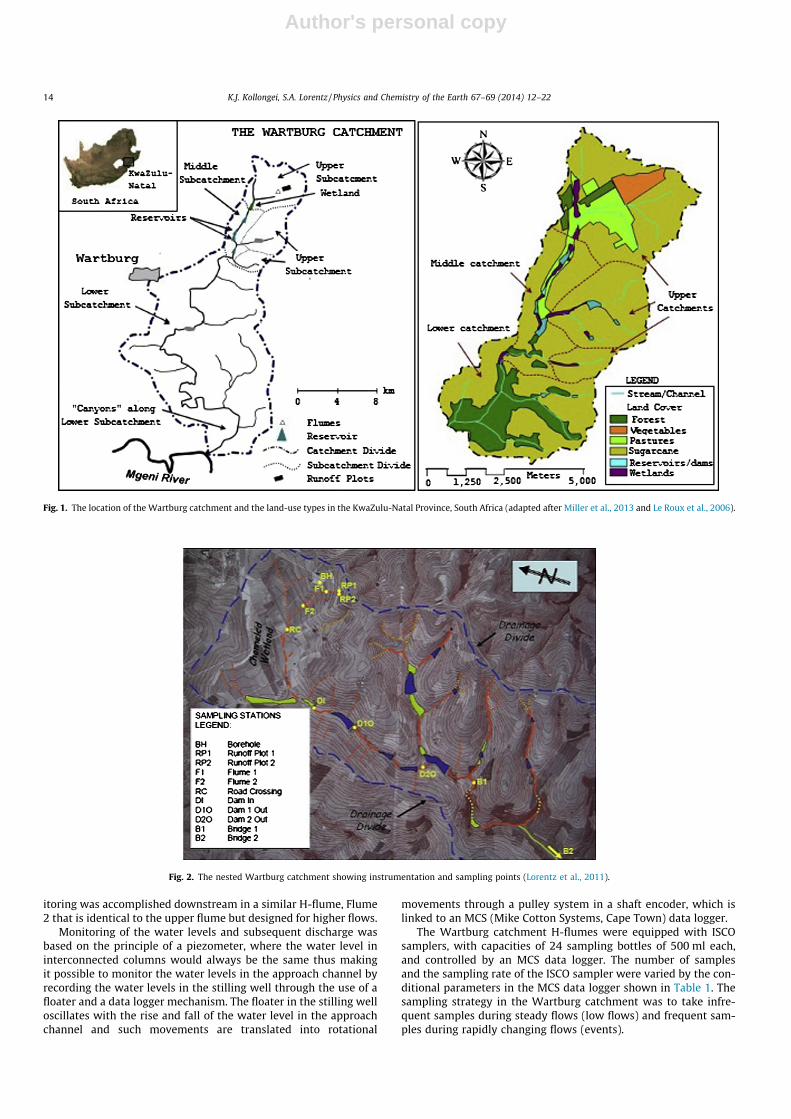
A sampling and survey strategy was developed in the Wartburgresearch catchment where key features of the strategy includedautomatic sampling during rainfall events which occurred oftenin summer (October to March) and occasionally in winter (Aprilto August) from field to large catchment scale in a nested systemof sub-catchments (Fig. 2). Storm events were defined as periodsof major rainfall separated by at least 24 h of rainfall intensitiesaveraging less than 0.1 mm/h (Wenninger et al., 2008). The auto-matic samplers were programmed such that more samples werecollected at the flumes during high flows and fewer samples duringlow flows.
Field scale: Local scale monitoring in the sugar cane fields in theupper part of the catchment contained two runoff plots whichmeasured on an event basis, discharge rates of overland flow. 1/10th portion of the overland flow from each plot was routed intoa container for subsequent sampling of sediments and nutrients.Observations were also made at two H-flumes where dischargewas measured and samples were automatically extracted for sedi-ment and nutrient analysis. Flume 1 consisted of a constructed H-Flume with an ISCO sampler triggered by a specified flow volume,recorded by measuring the depth of flow in a stilling basin via afloat and pulley apparatus. Multiple field or small catchment mon-
K.J. Kollongei, S.A. Lorentz / Physics and Chemistry of the Earth 67–69 (2014) 12–22 13
Author's personal copy
itoring was accomplished downstream in a similar H-flume, Flume2 that is identical to the upper flume but designed for higher flows.
Monitoring of the water levels and subsequent discharge wasbased on the principle of a piezometer, where the water level ininterconnected columns would always be the same thus makingit possible to monitor the water levels in the approach channel byrecording the water levels in the stilling well through the use of afloater and a data logger mechanism. The floater in the stilling welloscillates with the rise and fall of the water level in the approachchannel and such movements are translated into rotational
movements through a pulley system in a shaft encoder, which islinked to an MCS (Mike Cotton Systems, Cape Town) data logger.
The Wartburg catchment H-flumes were equipped with ISCOsamplers, with capacities of 24 sampling bottles of 500 ml each,and controlled by an MCS data logger. The number of samplesand the sampling rate of the ISCO sampler were varied by the con-ditional parameters in the MCS data logger shown in Table 1. Thesampling strategy in the Wartburg catchment was to take infre-quent samples during steady flows (low flows) and frequent sam-ples during rapidly changing flows (events).
Fig. 1. The location of the Wartburg catchment and the land-use types in the KwaZulu-Natal Province, South Africa (adapted after Miller et al., 2013 and Le Roux et al., 2006).
Fig. 2. The nested Wartburg catchment showing instrumentation and sampling points (Lorentz et al., 2011).
14 K.J. Kollongei, S.A. Lorentz / Physics and Chemistry of the Earth 67–69 (2014) 12–22
Author's personal copy
With reference to Table 1, Delta G is used to establish if the flowis constant or changing. If the change in flow rate is less than DeltaG, then a sample will be taken after Delta q m3 of flow has passedthe H-flume. Alternatively, if the change in flow is greater than Del-ta G, as in runoff events, then the samples will be taken after DeltaQ m3 of flow. The parameters Delta Q, Delta q and Delta G were de-rived through a calibration process, by simulating observed flowdata while checking the sampling scheme of the data logger beforeadjusting the appropriate variables (Delta G, Delta Q and Delta q).
Catchment scale: Manual sampling and flow depth observationswere periodically made at selected flow controls such as roadcrossings, wetlands, reservoirs and bridges. These grab samplingstations were located at different positions in the catchment. Thiswas done after every week during summer events (frequently) andless frequently after every fortnight during winter. In order to getan indication of the sources of water, sediments and nutrients fromthe headwaters to the catchment outlet, sampling events wereconducted in which the complete stream network was sampledwithin a 2 h period. This sampling campaign comprised compre-hensive sampling throughout the catchment with negligible pre-cipitation in the preceding 4 days.
Physico-chemical and water isotopes analyses: all the collectedwater samples were analyzed within 1 day of collection from thefield in the laboratory for NO3, soluble-P, suspended solids and iso-topic composition of Oxygen-18 (d18O) and Deuterium-2 (d2H).Analyses of NO3 and soluble-P were conducted with a HACH DR/2000 Direct Reading Spectrophotometer (Lorentz et al., 2012).The Spectrophotometer was calibrated against known solutionsof KHPO4 and KNO3 and values for field concentrations of solu-ble-P and NO3 read directly. In the laboratory, 200 ml or 100 mlof samples were shaken thoroughly and 5 ml of Hydrochloric acidadded to promote the flocculation of the suspended solids. To al-low complete settlement of suspended solids, the mixtures wereleft overnight. After the sediments settled, the supernatant waterwas discarded carefully. The remaining wet sediments were ovendried overnight at 105 �C. The sediment concentration was thendetermined as the dry mass of sediments divided by the volumeof sample (Lorentz et al., 2012). Isotope data were post-processedusing LGR LWIA Post Analysis Software (LGR, 2007), and were re-ported as per mil (‰) d18O/d16O relative to Vienna Standard MeanOcean Water (VSMOW). Isotope values were compared acrosssites, water storage impoundments and with the Global MeteoricWater Line (GMWL). The co-variance between d18O and d16O givenas GMWL was defined as by Craig (1961).
2.3. Mass balance mixing model
Harris et al. (1995) showed that streamflow contributions fromoverland flow could be described by a simple analytic function ofantecedent conditions and catchment processes. This approach isof interest as many studies highlight the importance of the riparian
zone in imparting the chemical signal of streamwater (Hooperet al., 1998). A simple mass balance mixing model was developedusing the d18O values with the end members as the combined dis-charge from the impounded tributaries (QDO); the contribution tostream flow of the land unit between the impoundments and theBridge stations (QLUi) and the Bridge station discharge (QB1 andQB2). For the discharge at the first bridge station, this takes theform of:
QB1 � dB1 ¼ QDO � dDO þ Q LU1 � dLU1 ð1Þ
Where:dB1 = d18O value at the Bridge 1 station,dDO = d18O value for discharge from both impounded tributaries
anddLU1 = d18O value for discharge from the sub-catchment
(3.6 km2) between the most downstream reservoir and the Bridge1 station.
Recognizing that, QB1 = QDO + QLU1, the ratio of discharge fromthe contributing sub-catchment to the total discharge at the Bridgestation, can be expressed as a function of the isotope ratios as in:
QLU1
Q B1¼ dB1 � dDO
dLU1 � dDOð2Þ
It was assumed that the eastern, impounded tributary, up-stream of Bridge 1, yielded a similar evaporated isotope signal asthat in the discharge from the Dam Out stations. The isotope valuesof the contributing land units between the reservoir outlets andthe Bridge stations were also assumed to be similar to the Flume2 values.
3. Results and discussions
3.1. Field nutrient and isotope events results
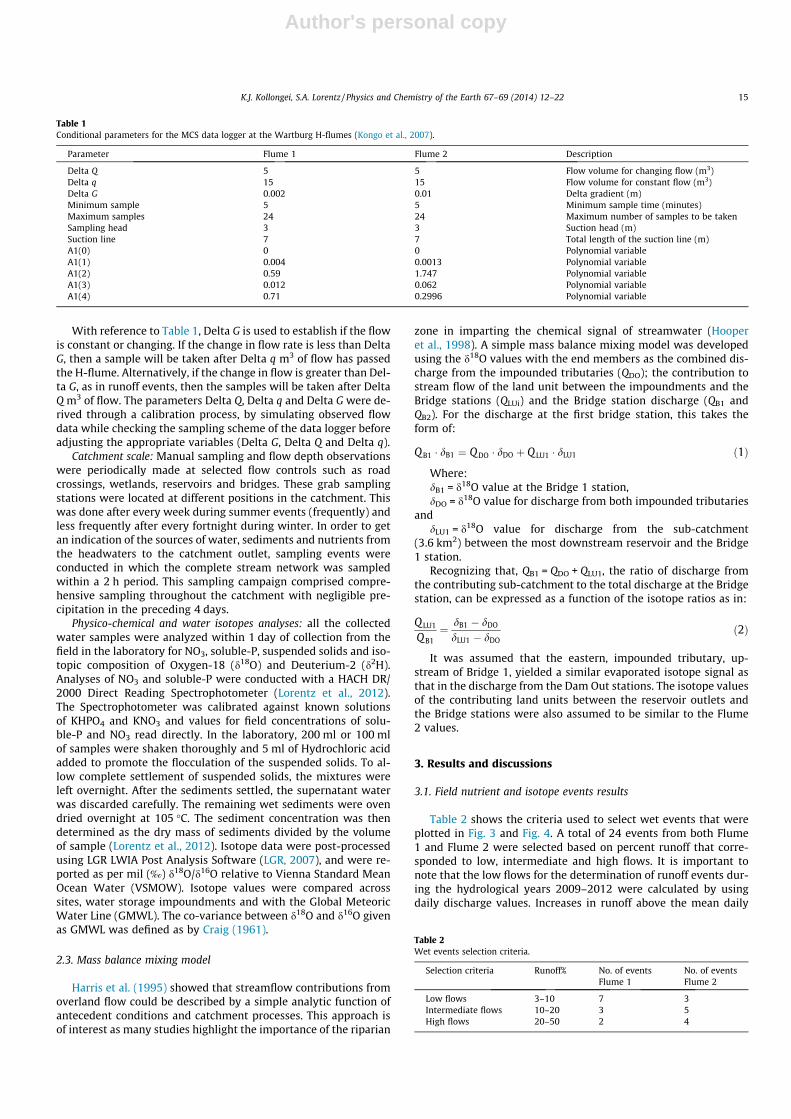
Table 2 shows the criteria used to select wet events that wereplotted in Fig. 3 and Fig. 4. A total of 24 events from both Flume1 and Flume 2 were selected based on percent runoff that corre-sponded to low, intermediate and high flows. It is important tonote that the low flows for the determination of runoff events dur-ing the hydrological years 2009–2012 were calculated by usingdaily discharge values. Increases in runoff above the mean daily
Table 1Conditional parameters for the MCS data logger at the Wartburg H-flumes (Kongo et al., 2007).
Parameter Flume 1 Flume 2 Description
Delta Q 5 5 Flow volume for changing flow (m3)Delta q 15 15 Flow volume for constant flow (m3)Delta G 0.002 0.01 Delta gradient (m)Minimum sample 5 5 Minimum sample time (minutes)Maximum samples 24 24 Maximum number of samples to be takenSampling head 3 3 Suction head (m)Suction line 7 7 Total length of the suction line (m)A1(0) 0 0 Polynomial variableA1(1) 0.004 0.0013 Polynomial variableA1(2) 0.59 1.747 Polynomial variableA1(3) 0.012 0.062 Polynomial variableA1(4) 0.71 0.2996 Polynomial variable
Table 2Wet events selection criteria.
Selection criteria Runoff% No. of eventsFlume 1
No. of eventsFlume 2
Low flows 3–10 7 3Intermediate flows 10–20 3 5High flows 20–50 2 4
K.J. Kollongei, S.A. Lorentz / Physics and Chemistry of the Earth 67–69 (2014) 12–22 15
Author's personal copy
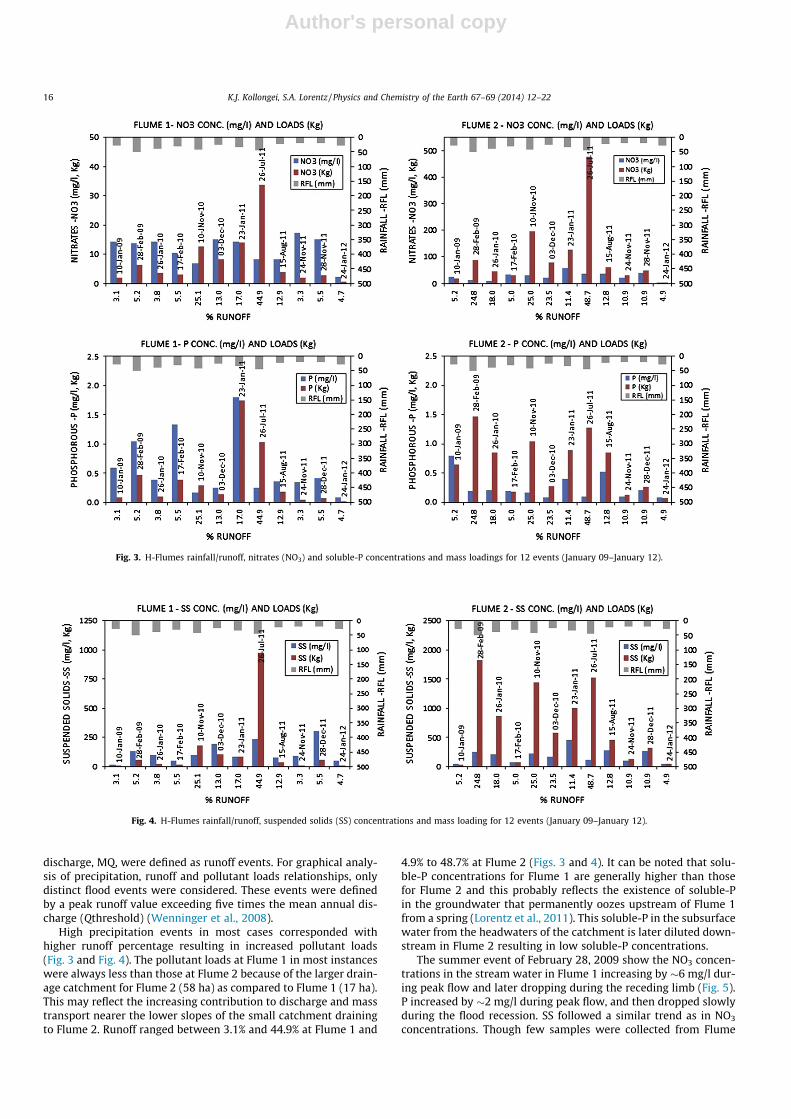
discharge, MQ, were defined as runoff events. For graphical analy-sis of precipitation, runoff and pollutant loads relationships, onlydistinct flood events were considered. These events were definedby a peak runoff value exceeding five times the mean annual dis-charge (Qthreshold) (Wenninger et al., 2008).
High precipitation events in most cases corresponded withhigher runoff percentage resulting in increased pollutant loads(Fig. 3 and Fig. 4). The pollutant loads at Flume 1 in most instanceswere always less than those at Flume 2 because of the larger drain-age catchment for Flume 2 (58 ha) as compared to Flume 1 (17 ha).This may reflect the increasing contribution to discharge and masstransport nearer the lower slopes of the small catchment drainingto Flume 2. Runoff ranged between 3.1% and 44.9% at Flume 1 and
4.9% to 48.7% at Flume 2 (Figs. 3 and 4). It can be noted that solu-ble-P concentrations for Flume 1 are generally higher than thosefor Flume 2 and this probably reflects the existence of soluble-Pin the groundwater that permanently oozes upstream of Flume 1from a spring (Lorentz et al., 2011). This soluble-P in the subsurfacewater from the headwaters of the catchment is later diluted down-stream in Flume 2 resulting in low soluble-P concentrations.
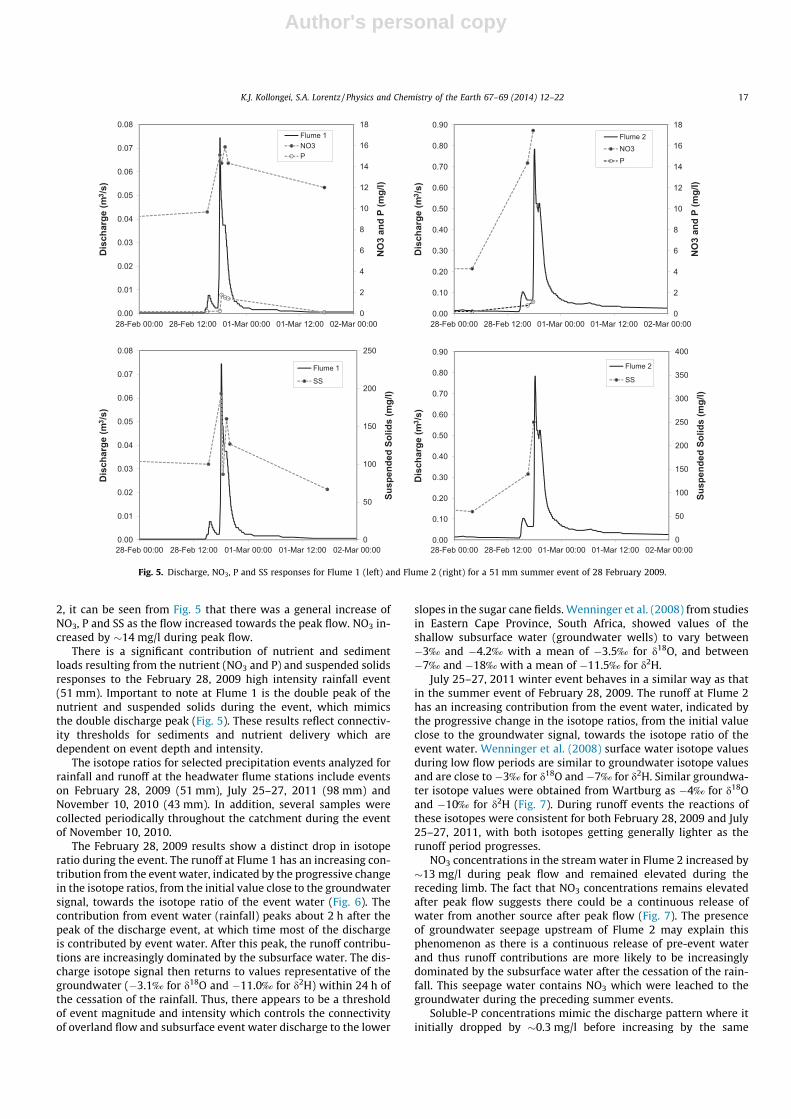
The summer event of February 28, 2009 show the NO3 concen-trations in the stream water in Flume 1 increasing by �6 mg/l dur-ing peak flow and later dropping during the receding limb (Fig. 5).P increased by �2 mg/l during peak flow, and then dropped slowlyduring the flood recession. SS followed a similar trend as in NO3
concentrations. Though few samples were collected from Flume
Fig. 3. H-Flumes rainfall/runoff, nitrates (NO3) and soluble-P concentrations and mass loadings for 12 events (January 09–January 12).
Fig. 4. H-Flumes rainfall/runoff, suspended solids (SS) concentrations and mass loading for 12 events (January 09–January 12).
16 K.J. Kollongei, S.A. Lorentz / Physics and Chemistry of the Earth 67–69 (2014) 12–22
Author's personal copy
2, it can be seen from Fig. 5 that there was a general increase ofNO3, P and SS as the flow increased towards the peak flow. NO3 in-creased by �14 mg/l during peak flow.
There is a significant contribution of nutrient and sedimentloads resulting from the nutrient (NO3 and P) and suspended solidsresponses to the February 28, 2009 high intensity rainfall event(51 mm). Important to note at Flume 1 is the double peak of thenutrient and suspended solids during the event, which mimicsthe double discharge peak (Fig. 5). These results reflect connectiv-ity thresholds for sediments and nutrient delivery which aredependent on event depth and intensity.
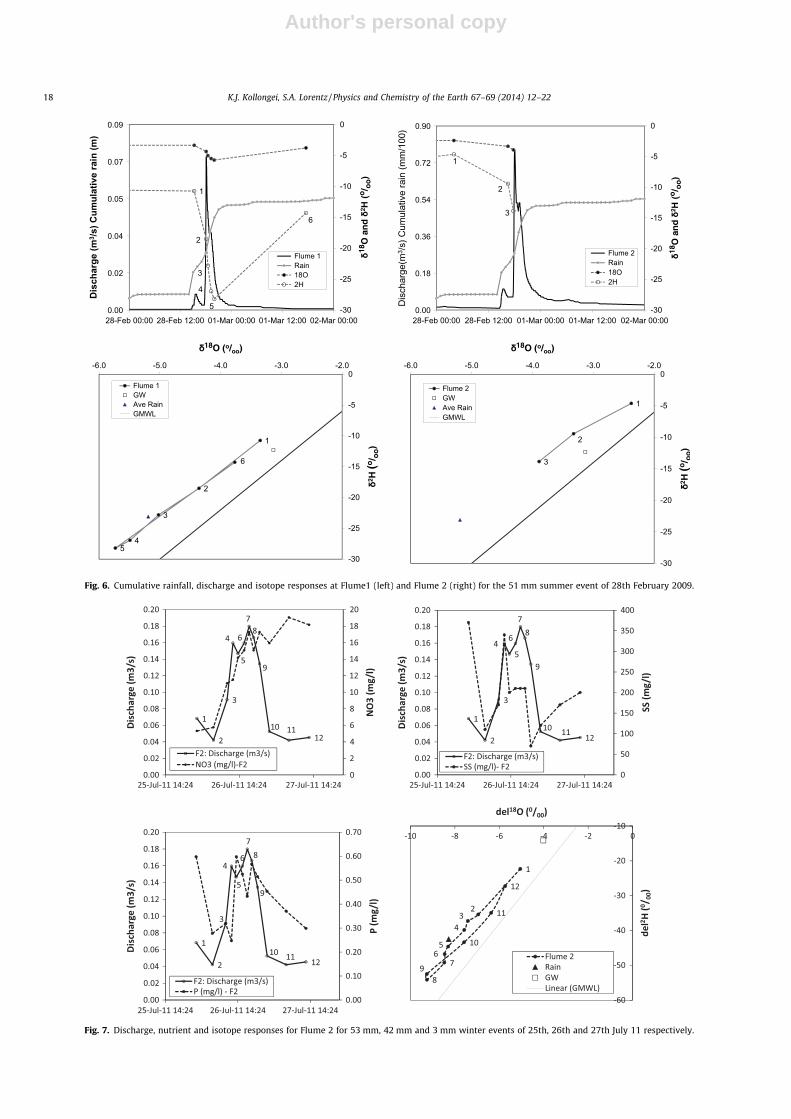
The isotope ratios for selected precipitation events analyzed forrainfall and runoff at the headwater flume stations include eventson February 28, 2009 (51 mm), July 25–27, 2011 (98 mm) andNovember 10, 2010 (43 mm). In addition, several samples werecollected periodically throughout the catchment during the eventof November 10, 2010.
The February 28, 2009 results show a distinct drop in isotoperatio during the event. The runoff at Flume 1 has an increasing con-tribution from the event water, indicated by the progressive changein the isotope ratios, from the initial value close to the groundwatersignal, towards the isotope ratio of the event water (Fig. 6). Thecontribution from event water (rainfall) peaks about 2 h after thepeak of the discharge event, at which time most of the dischargeis contributed by event water. After this peak, the runoff contribu-tions are increasingly dominated by the subsurface water. The dis-charge isotope signal then returns to values representative of thegroundwater (�3.1‰ for d18O and �11.0‰ for d2H) within 24 h ofthe cessation of the rainfall. Thus, there appears to be a thresholdof event magnitude and intensity which controls the connectivityof overland flow and subsurface event water discharge to the lower
slopes in the sugar cane fields. Wenninger et al. (2008) from studiesin Eastern Cape Province, South Africa, showed values of theshallow subsurface water (groundwater wells) to vary between�3‰ and �4.2‰ with a mean of �3.5‰ for d18O, and between�7‰ and �18‰ with a mean of �11.5‰ for d2H.
July 25–27, 2011 winter event behaves in a similar way as thatin the summer event of February 28, 2009. The runoff at Flume 2has an increasing contribution from the event water, indicated bythe progressive change in the isotope ratios, from the initial valueclose to the groundwater signal, towards the isotope ratio of theevent water. Wenninger et al. (2008) surface water isotope valuesduring low flow periods are similar to groundwater isotope valuesand are close to �3‰ for d18O and �7‰ for d2H. Similar groundwa-ter isotope values were obtained from Wartburg as �4‰ for d18Oand �10‰ for d2H (Fig. 7). During runoff events the reactions ofthese isotopes were consistent for both February 28, 2009 and July25–27, 2011, with both isotopes getting generally lighter as therunoff period progresses.
NO3 concentrations in the stream water in Flume 2 increased by�13 mg/l during peak flow and remained elevated during thereceding limb. The fact that NO3 concentrations remains elevatedafter peak flow suggests there could be a continuous release ofwater from another source after peak flow (Fig. 7). The presenceof groundwater seepage upstream of Flume 2 may explain thisphenomenon as there is a continuous release of pre-event waterand thus runoff contributions are more likely to be increasinglydominated by the subsurface water after the cessation of the rain-fall. This seepage water contains NO3 which were leached to thegroundwater during the preceding summer events.
Soluble-P concentrations mimic the discharge pattern where itinitially dropped by �0.3 mg/l before increasing by the same
0
2
4
6
8
10
12
14
16
18
0.00
0.01
0.02
0.03
0.04
0.05
0.06
0.07
0.08
NO
3 an
d P
(mg/
l)
Dis
char
ge (m
3 /s)
Dis
char
ge (m
3 /s)
Dis
char
ge (m
3 /s)
Dis
char
ge (m
3 /s)
Flume 1NO3P
0
50
100
150
200
250
0.00
0.01
0.02
0.03
0.04
0.05
0.06
0.07
0.08
Susp
ende
d So
lids
(mg/
l)
Flume 1
SS
0
50
100
150
200
250
300
350
400
0.00
0.10
0.20
0.30
0.40
0.50
0.60
0.70
0.80
0.90
Susp
ende
d So
lids
(mg/
l)
Flume 2
SS
0
2
4
6
8
10
12
14
16
18
0.00
0.10
0.20
0.30
0.40
0.50
0.60
0.70
0.80
0.90
28-Feb 00:00 28-Feb 12:00 01-Mar 00:00 01-Mar 12:00 02-Mar 00:00
28-Feb 00:00 28-Feb 12:00 01-Mar 00:00 01-Mar 12:00 02-Mar 00:00 28-Feb 00:00 28-Feb 12:00 01-Mar 00:00 01-Mar 12:00 02-Mar 00:00
28-Feb 00:00 28-Feb 12:00 01-Mar 00:00 01-Mar 12:00 02-Mar 00:00
NO
3 an
d P
(mg/
l)
Flume 2NO3P
Fig. 5. Discharge, NO3, P and SS responses for Flume 1 (left) and Flume 2 (right) for a 51 mm summer event of 28 February 2009.
K.J. Kollongei, S.A. Lorentz / Physics and Chemistry of the Earth 67–69 (2014) 12–22 17
Author's personal copy
1
2
3
-30
-25
-20
-15
-10
-5
0
0.00
0.18
0.36
0.54
0.72
0.90
28-Feb 00:00 28-Feb 12:00 01-Mar 00:00 01-Mar 12:00 02-Mar 00:00
Dis
char
ge(m
3 /s) C
umul
ativ
e ra
in (m
m/1
00)
Flume 2Rain18O2H
1
2
3
4
5
6
-30
-25
-20
-15
-10
-5
0
0.00
0.02
0.04
0.05
0.07
0.09
28-Feb 00:00 28-Feb 12:00 01-Mar 00:00 01-Mar 12:00 02-Mar 00:00
Dis
char
ge (m
3 /s) C
umul
ativ
e ra
in (m
)
Flume 1Rain18O2H
1
2
3
45
6
-30
-25
-20
-15
-10
-5
0-6.0 -5.0 -4.0 -3.0 -2.0
Flume 1GWAve RainGMWL
1
2
3
-30
-25
-20
-15
-10
-5
0-6.0 -5.0 -4.0 -3.0 -2.0
Flume 2GWAve RainGMWL
Fig. 6. Cumulative rainfall, discharge and isotope responses at Flume1 (left) and Flume 2 (right) for the 51 mm summer event of 28th February 2009.
Fig. 7. Discharge, nutrient and isotope responses for Flume 2 for 53 mm, 42 mm and 3 mm winter events of 25th, 26th and 27th July 11 respectively.
18 K.J. Kollongei, S.A. Lorentz / Physics and Chemistry of the Earth 67–69 (2014) 12–22
Author's personal copy
margin during peak flow and finally dropping slowly as withdischarge during the flood recession (Fig. 7). SS concentrations fol-lowed a similar trend as with soluble-P concentrations initially buttheir pattern differed at the later stages. Initially SS concentrationsdropped by 275 mg/l and increased with the same margin duringthe peak flow. However after recession limb, SS concentrationsstarted to increase again. The increase in SS concentrations maybe due to the presence of fine particle colloids that may havepassed through fissures in the ground and now being emittedout together with groundwater as preferential flow. These finecolloids mimic discharge patterns just as P ions that are adsorbedto the colloids mimic discharge as well.
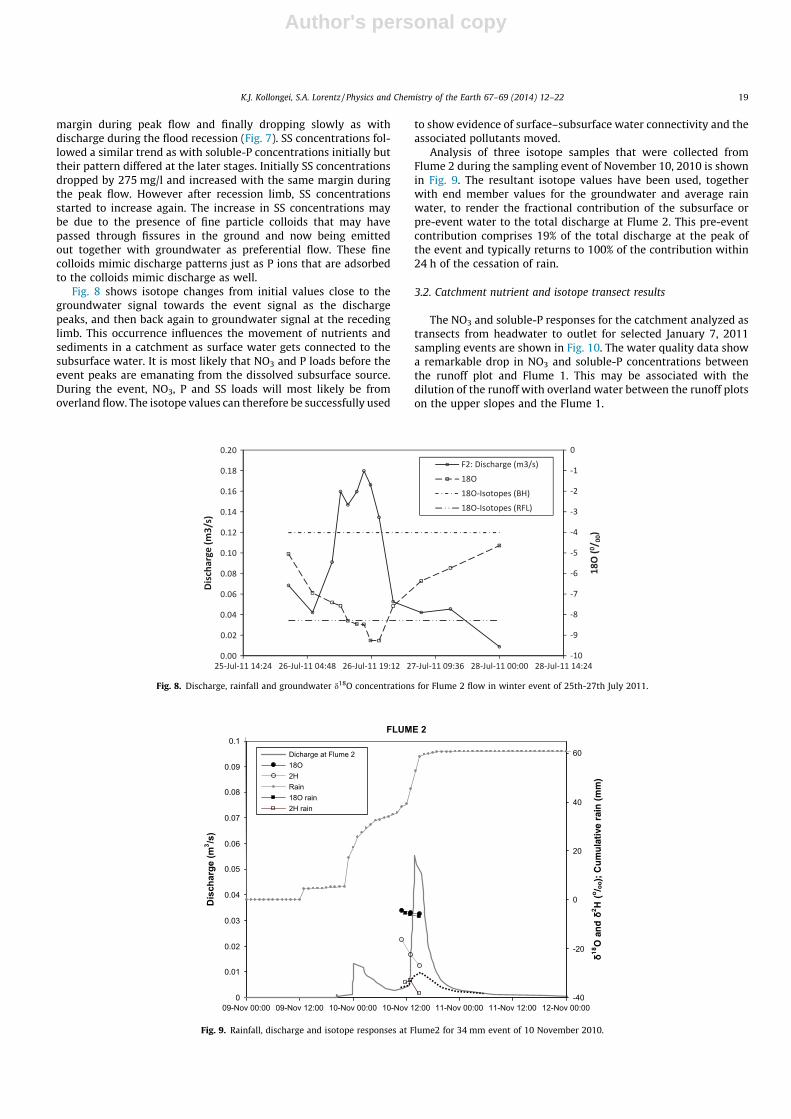
Fig. 8 shows isotope changes from initial values close to thegroundwater signal towards the event signal as the dischargepeaks, and then back again to groundwater signal at the recedinglimb. This occurrence influences the movement of nutrients andsediments in a catchment as surface water gets connected to thesubsurface water. It is most likely that NO3 and P loads before theevent peaks are emanating from the dissolved subsurface source.During the event, NO3, P and SS loads will most likely be fromoverland flow. The isotope values can therefore be successfully used
to show evidence of surface–subsurface water connectivity and theassociated pollutants moved.
Analysis of three isotope samples that were collected fromFlume 2 during the sampling event of November 10, 2010 is shownin Fig. 9. The resultant isotope values have been used, togetherwith end member values for the groundwater and average rainwater, to render the fractional contribution of the subsurface orpre-event water to the total discharge at Flume 2. This pre-eventcontribution comprises 19% of the total discharge at the peak ofthe event and typically returns to 100% of the contribution within24 h of the cessation of rain.
3.2. Catchment nutrient and isotope transect results
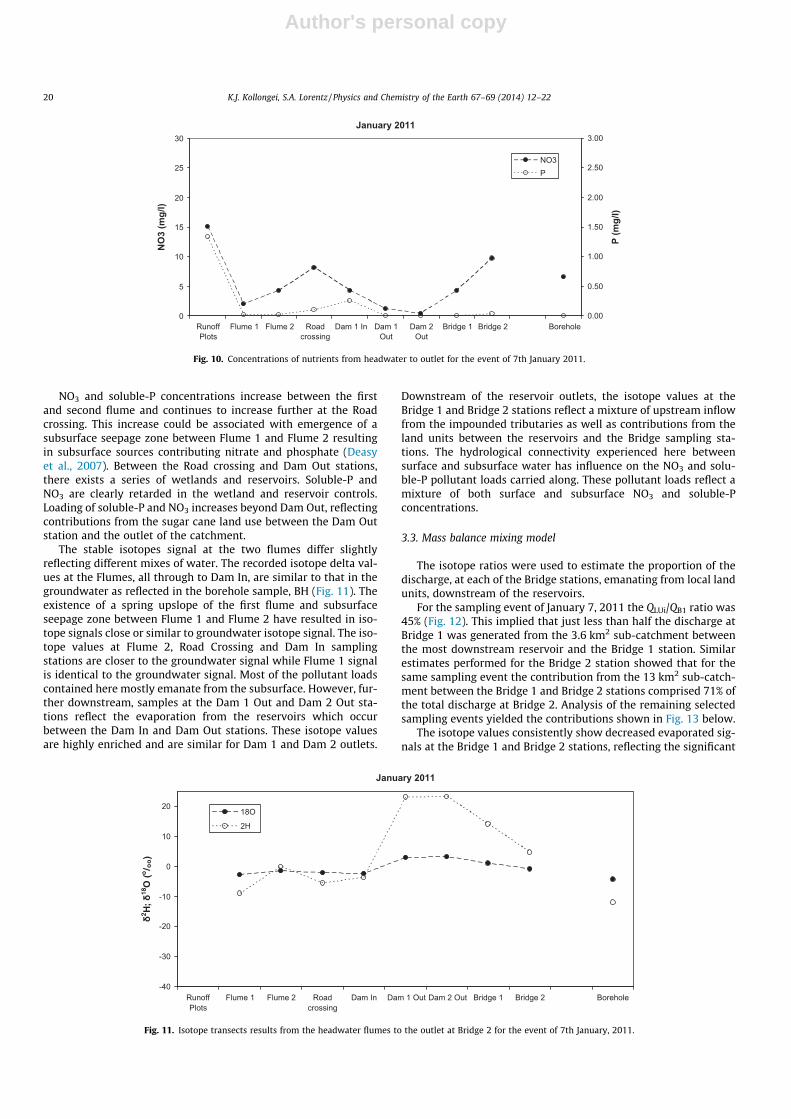
The NO3 and soluble-P responses for the catchment analyzed astransects from headwater to outlet for selected January 7, 2011sampling events are shown in Fig. 10. The water quality data showa remarkable drop in NO3 and soluble-P concentrations betweenthe runoff plot and Flume 1. This may be associated with thedilution of the runoff with overland water between the runoff plotson the upper slopes and the Flume 1.
FLUME 2
0
0.01
0.02
0.03
0.04
0.05
0.06
0.07
0.08
0.09
0.1
09-Nov 00:00 09-Nov 12:00 10-Nov 00:00 10-Nov 12:00 11-Nov 00:00 11-Nov 12:00 12-Nov 00:00
Dis
char
ge (m
3 /s)
-40
-20
0
20
40
60Dicharge at Flume 218O2HRain18O rain2H rain
Fig. 9. Rainfall, discharge and isotope responses at Flume2 for 34 mm event of 10 November 2010.
Fig. 8. Discharge, rainfall and groundwater d18O concentrations for Flume 2 flow in winter event of 25th-27th July 2011.
K.J. Kollongei, S.A. Lorentz / Physics and Chemistry of the Earth 67–69 (2014) 12–22 19
Author's personal copy
NO3 and soluble-P concentrations increase between the firstand second flume and continues to increase further at the Roadcrossing. This increase could be associated with emergence of asubsurface seepage zone between Flume 1 and Flume 2 resultingin subsurface sources contributing nitrate and phosphate (Deasyet al., 2007). Between the Road crossing and Dam Out stations,there exists a series of wetlands and reservoirs. Soluble-P andNO3 are clearly retarded in the wetland and reservoir controls.Loading of soluble-P and NO3 increases beyond Dam Out, reflectingcontributions from the sugar cane land use between the Dam Outstation and the outlet of the catchment.
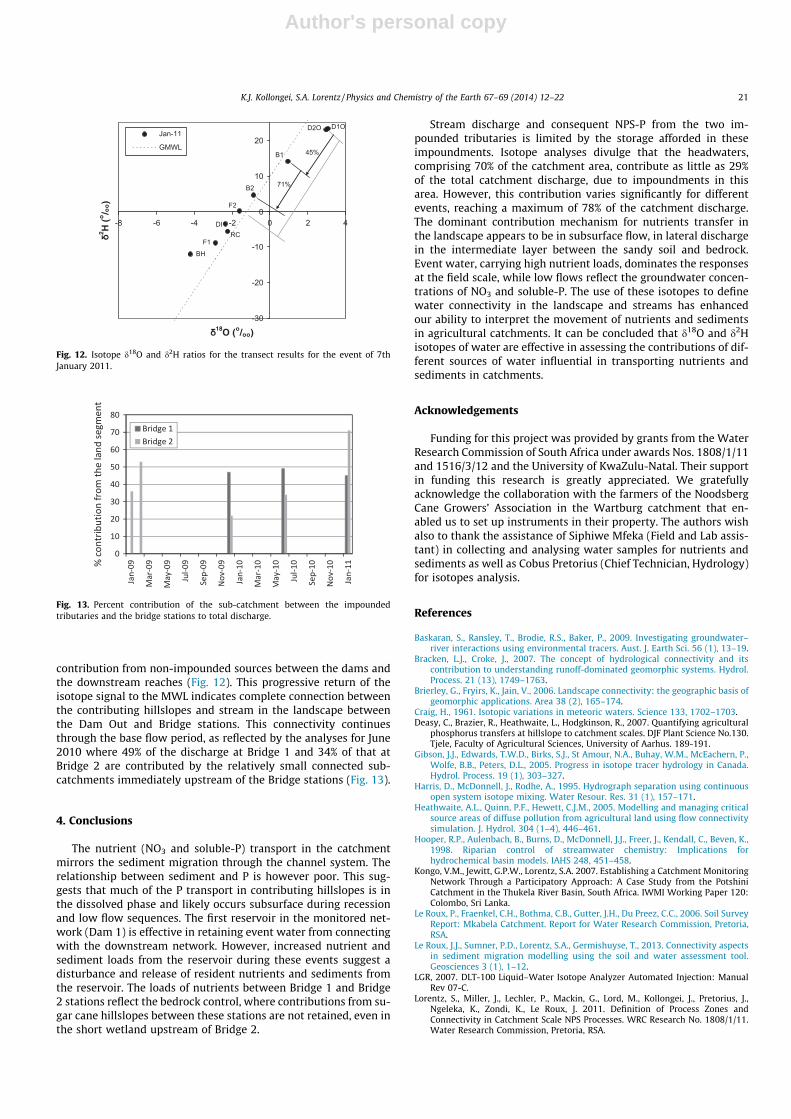
The stable isotopes signal at the two flumes differ slightlyreflecting different mixes of water. The recorded isotope delta val-ues at the Flumes, all through to Dam In, are similar to that in thegroundwater as reflected in the borehole sample, BH (Fig. 11). Theexistence of a spring upslope of the first flume and subsurfaceseepage zone between Flume 1 and Flume 2 have resulted in iso-tope signals close or similar to groundwater isotope signal. The iso-tope values at Flume 2, Road Crossing and Dam In samplingstations are closer to the groundwater signal while Flume 1 signalis identical to the groundwater signal. Most of the pollutant loadscontained here mostly emanate from the subsurface. However, fur-ther downstream, samples at the Dam 1 Out and Dam 2 Out sta-tions reflect the evaporation from the reservoirs which occurbetween the Dam In and Dam Out stations. These isotope valuesare highly enriched and are similar for Dam 1 and Dam 2 outlets.
Downstream of the reservoir outlets, the isotope values at theBridge 1 and Bridge 2 stations reflect a mixture of upstream inflowfrom the impounded tributaries as well as contributions from theland units between the reservoirs and the Bridge sampling sta-tions. The hydrological connectivity experienced here betweensurface and subsurface water has influence on the NO3 and solu-ble-P pollutant loads carried along. These pollutant loads reflect amixture of both surface and subsurface NO3 and soluble-Pconcentrations.
3.3. Mass balance mixing model
The isotope ratios were used to estimate the proportion of thedischarge, at each of the Bridge stations, emanating from local landunits, downstream of the reservoirs.
For the sampling event of January 7, 2011 the QLUi/QB1 ratio was45% (Fig. 12). This implied that just less than half the discharge atBridge 1 was generated from the 3.6 km2 sub-catchment betweenthe most downstream reservoir and the Bridge 1 station. Similarestimates performed for the Bridge 2 station showed that for thesame sampling event the contribution from the 13 km2 sub-catch-ment between the Bridge 1 and Bridge 2 stations comprised 71% ofthe total discharge at Bridge 2. Analysis of the remaining selectedsampling events yielded the contributions shown in Fig. 13 below.
The isotope values consistently show decreased evaporated sig-nals at the Bridge 1 and Bridge 2 stations, reflecting the significant
January 2011
0
5
10
15
20
25
30
RunoffPlots crossing
Flume 1 Flume 2 Road Dam 1 In Dam 1Out
Dam 2Out
Bridge 1 Bridge 2 Borehole
NO
3 (m
g/l)
0.00
0.50
1.00
1.50
2.00
2.50
3.00
P (m
g/l)
NO3P
Fig. 10. Concentrations of nutrients from headwater to outlet for the event of 7th January 2011.
January 2011
-40
-30
-20
-10
0
10
20
RunoffPlots crossing
Flume 1 Flume 2 Road Dam In Dam 1 Out Dam 2 Out Bridge 1 Bridge 2 Borehole
18O
2H
Fig. 11. Isotope transects results from the headwater flumes to the outlet at Bridge 2 for the event of 7th January, 2011.
20 K.J. Kollongei, S.A. Lorentz / Physics and Chemistry of the Earth 67–69 (2014) 12–22
Author's personal copy
contribution from non-impounded sources between the dams andthe downstream reaches (Fig. 12). This progressive return of theisotope signal to the MWL indicates complete connection betweenthe contributing hillslopes and stream in the landscape betweenthe Dam Out and Bridge stations. This connectivity continuesthrough the base flow period, as reflected by the analyses for June2010 where 49% of the discharge at Bridge 1 and 34% of that atBridge 2 are contributed by the relatively small connected sub-catchments immediately upstream of the Bridge stations (Fig. 13).
4. Conclusions
The nutrient (NO3 and soluble-P) transport in the catchmentmirrors the sediment migration through the channel system. Therelationship between sediment and P is however poor. This sug-gests that much of the P transport in contributing hillslopes is inthe dissolved phase and likely occurs subsurface during recessionand low flow sequences. The first reservoir in the monitored net-work (Dam 1) is effective in retaining event water from connectingwith the downstream network. However, increased nutrient andsediment loads from the reservoir during these events suggest adisturbance and release of resident nutrients and sediments fromthe reservoir. The loads of nutrients between Bridge 1 and Bridge2 stations reflect the bedrock control, where contributions from su-gar cane hillslopes between these stations are not retained, even inthe short wetland upstream of Bridge 2.
Stream discharge and consequent NPS-P from the two im-pounded tributaries is limited by the storage afforded in theseimpoundments. Isotope analyses divulge that the headwaters,comprising 70% of the catchment area, contribute as little as 29%of the total catchment discharge, due to impoundments in thisarea. However, this contribution varies significantly for differentevents, reaching a maximum of 78% of the catchment discharge.The dominant contribution mechanism for nutrients transfer inthe landscape appears to be in subsurface flow, in lateral dischargein the intermediate layer between the sandy soil and bedrock.Event water, carrying high nutrient loads, dominates the responsesat the field scale, while low flows reflect the groundwater concen-trations of NO3 and soluble-P. The use of these isotopes to definewater connectivity in the landscape and streams has enhancedour ability to interpret the movement of nutrients and sedimentsin agricultural catchments. It can be concluded that d18O and d2Hisotopes of water are effective in assessing the contributions of dif-ferent sources of water influential in transporting nutrients andsediments in catchments.
Acknowledgements
Funding for this project was provided by grants from the WaterResearch Commission of South Africa under awards Nos. 1808/1/11and 1516/3/12 and the University of KwaZulu-Natal. Their supportin funding this research is greatly appreciated. We gratefullyacknowledge the collaboration with the farmers of the NoodsbergCane Growers’ Association in the Wartburg catchment that en-abled us to set up instruments in their property. The authors wishalso to thank the assistance of Siphiwe Mfeka (Field and Lab assis-tant) in collecting and analysing water samples for nutrients andsediments as well as Cobus Pretorius (Chief Technician, Hydrology)for isotopes analysis.
References
Baskaran, S., Ransley, T., Brodie, R.S., Baker, P., 2009. Investigating groundwater–river interactions using environmental tracers. Aust. J. Earth Sci. 56 (1), 13–19.
Bracken, L.J., Croke, J., 2007. The concept of hydrological connectivity and itscontribution to understanding runoff-dominated geomorphic systems. Hydrol.Process. 21 (13), 1749–1763.
Brierley, G., Fryirs, K., Jain, V., 2006. Landscape connectivity: the geographic basis ofgeomorphic applications. Area 38 (2), 165–174.
Craig, H., 1961. Isotopic variations in meteoric waters. Science 133, 1702–1703.Deasy, C., Brazier, R., Heathwaite, L., Hodgkinson, R., 2007. Quantifying agricultural
phosphorus transfers at hillslope to catchment scales. DJF Plant Science No.130.Tjele, Faculty of Agricultural Sciences, University of Aarhus. 189-191.
Gibson, J.J., Edwards, T.W.D., Birks, S.J., St Amour, N.A., Buhay, W.M., McEachern, P.,Wolfe, B.B., Peters, D.L., 2005. Progress in isotope tracer hydrology in Canada.Hydrol. Process. 19 (1), 303–327.
Harris, D., McDonnell, J., Rodhe, A., 1995. Hydrograph separation using continuousopen system isotope mixing. Water Resour. Res. 31 (1), 157–171.
Heathwaite, A.L., Quinn, P.F., Hewett, C.J.M., 2005. Modelling and managing criticalsource areas of diffuse pollution from agricultural land using flow connectivitysimulation. J. Hydrol. 304 (1–4), 446–461.
Hooper, R.P., Aulenbach, B., Burns, D., McDonnell, J.J., Freer, J., Kendall, C., Beven, K.,1998. Riparian control of streamwater chemistry: Implications forhydrochemical basin models. IAHS 248, 451–458.
Kongo, V.M., Jewitt, G.P.W., Lorentz, S.A. 2007. Establishing a Catchment MonitoringNetwork Through a Participatory Approach: A Case Study from the PotshiniCatchment in the Thukela River Basin, South Africa. IWMI Working Paper 120:Colombo, Sri Lanka.
Le Roux, P., Fraenkel, C.H., Bothma, C.B., Gutter, J.H., Du Preez, C.C., 2006. Soil SurveyReport: Mkabela Catchment. Report for Water Research Commission, Pretoria,RSA.
Le Roux, J.J., Sumner, P.D., Lorentz, S.A., Germishuyse, T., 2013. Connectivity aspectsin sediment migration modelling using the soil and water assessment tool.Geosciences 3 (1), 1–12.
LGR, 2007. DLT-100 Liquid–Water Isotope Analyzer Automated Injection: ManualRev 07-C.
Lorentz, S., Miller, J., Lechler, P., Mackin, G., Lord, M., Kollongei, J., Pretorius, J.,Ngeleka, K., Zondi, K., Le Roux, J. 2011. Definition of Process Zones andConnectivity in Catchment Scale NPS Processes. WRC Research No. 1808/1/11.Water Research Commission, Pretoria, RSA.
BH
DIRC
D1O
B1
D2O
B2
F1
F2
-30
-20
-10
0
10
20
-8 -6 -4 -2 0 2 4
Jan-11
GMWL45%
71%
Fig. 12. Isotope d18O and d2H ratios for the transect results for the event of 7thJanuary 2011.
Fig. 13. Percent contribution of the sub-catchment between the impoundedtributaries and the bridge stations to total discharge.
K.J. Kollongei, S.A. Lorentz / Physics and Chemistry of the Earth 67–69 (2014) 12–22 21

Author's personal copy
Lorentz, S.A., Kollongei, J., Snyman, N., Berry, S.R., Jackson, W., Ngaleka, K., Pretorius,J.J., Clark, D., Thornton-Dibb, S., Le Roux, J.J., Germishuyse, T., Gorgens, A.H.M.2012. Modelling Nutrient and Sediment Dynamics at the Catchment Scale. WRCResearch No. 1516/3/12. Water Research Commission, Pretoria, RSA.
McGlynn, B.L., McDonnell, J.J., Seibert, J., Kendall, C., 2004. Scale effects onheadwater catchment runoff timing, flow sources, and groundwater–streamflow relations. Water Resour. Res. 40, 1–14.
Miller, J.R., Mackin, G., Lechler, P., Lord, M., Lorentz, S., 2013. Influence of basinconnectivity on sediment source, transport, and storage within the MkabelaBasin, South Africa. Hydrol. Earth Syst. Sci. 17 (2), 761–781.
Müller, E.N., Wainwright, J., Parsons, A.J., 2007. Impact of connectivity on themodeling of overland flow within semiarid shrubland environments. WaterResour. Res. 43 (9), W09412.
Turner, M.G., Romme, W.H., Gardner, R.H., O’Neill, R.V., Kratz, T.K., 1993. A revisedconcept of landscape equilibrium: disturbance and stability on scaledlandscapes. Landscape Ecol. 8 (3), 213–227.
Wenninger, J., Uhlenbrook, S., Lorentz, S., Leibundgut, C., 2008. Identification ofrunoff generation processes using combined hydrometric, tracer andgeophysical methods in a headwater catchment in South Africa. Hydrol. Sci.53 (1), 65–80.
Western, A.W., Blöschl, G., Grayson, R.B., 2001. Toward capturing hydrologicallysignificant connectivity in spatial patterns. Water Resour. Res. 37 (1), 83–97.
WRC, 2002. State of Rivers Report: The uMngeni River and Neighbouring Riversand Streams. WRC Report No. TT 200/02. Water Research Commission, Pretoria,RSA.
22 K.J. Kollongei, S.A. Lorentz / Physics and Chemistry of the Earth 67–69 (2014) 12–22