
Power Line Telecommunications Option in Rural KwaZulu-Natal
151
DISSERTATION TITLE Power Line Telecommunications Option in Rural KwaZulu-Natal SUSMITTED By Thembinkosi E. Mhlongo IN PARTIAL FULFILMENT OF THE DEGREE Master of Science in Engineering with specialisation in the field of Telecommunications and Infonnation Technology from the University of KwaZulu-Natal (Westville Campus) DATE OF SUBMISSION Apri12005 SUPERVISED By Prof. T.J.O. Afullo Centre of Excellence in Radio Access and Rural Teclmologies 18 Private Bag X54001, 4000, RSA (l) / (031) 260-7008 '1J [email protected] http://coe.ukzn.ac.za
-
Upload
khangminh22 -
Category
Documents
-
view
1 -
download
0
Transcript of Power Line Telecommunications Option in Rural KwaZulu-Natal
DISSERTATION TITLE
Power Line Telecommunications Option in Rural
KwaZulu-Natal
SUSMITTED By
Thembinkosi E. Mhlongo
IN PARTIAL FULFILMENT OF THE DEGREE
Master of Science in Engineering with specialisation
in the field of Telecommunications and Infonnation Technology
from the University of KwaZulu-Natal (Westville Campus)
DATE OF SUBMISSION
Apri12005
SUPERVISED By
Prof. T.J.O. Afullo
Centre of Excellence in Radio Access and Rural Teclmologies 18 Private Bag X54001, 4000, RSA (l) / ~ (031) 260-7008 '1J [email protected] ~ http://coe.ukzn.ac.za

DECLARATION
I, Thembinkosi Emmanuel Mhlongo, Student Number 9801328, hereby declare that the
dissertation entitled Power Line Telecommunications Option in Rural KwaZulu
Natal is a result of my own investigation and research, and presents my own work
unless specifically referenced in the text. This work has not been submitted in part or in
full for any other degree or to any other University.

ACKNOWLEDGEMENT
First and foremost, I would like to thank GOD for being with me to this very moment. Also, I am
conveying my deepest appreciation to Prof. TJ. Afullo from the School of Electrical and
Computer Engineering at the University of KwaZulu Natal (Westville campus), for his constant
encouragement, faith, guidance and support in the course of this research project. I want to
express my gratitude to Dr. PJ Chitamu from the School of Electrical and Information
Engineering at the University of Witwatersland (Johannesburg) and Prof S.H. Mneney of the
School of Electrical and Electronic Engineering at the University of KwaZulu Natal (Durban
campus), for their continuous support and invaluable insight during the period of my research.
Thanks to the secretary of the Center of Excellence in Rural Telecommunication (CoE) at the
University of KwaZulu Natal (Westville campus), Ms Rene Truter, for her continuous help all
the time. Special thanks to Eskom TSI, particularly to Mr. Fernanda Nogueira (based in
Pretoria), Rodney Westwood (based in New Germany-KZN), Maarten van HeIden, (City of
Tshwane Metropolitan Municipality) and Mr. Mchunu of Telkom SA (Ladysmith) for their
interest, vision and expertise in my research project. My sincere and grateful thanks goes to the
Head of the CoE, Prof Muyingi, at the University of Fort Hare for giving me a chance to
participate and observe some experiments on Ascom PLT equipment. To his students, Mr. S.
Ntuli and Mr. M Mamdioma, many thanks for the exposure they gave me to the above
mentioned equipment. Thanks to Mr. Mbebe for his inspiration and support, to my fellow
students for their ideas, which contributed a lot towards the completion of this research project.
Last but not least, I want to express my heartfelt thanks to my family, friends, and Buhle
Ngobese for their unconditional love and moral support throughout the period of this research
project. To my brother, Thokozani Edward Mhlongo, this one is for you.
Finally, I would like to thank Telkom SA for financial support for the whole period of my
postgraduate studies.

Abstract
Power Line Communications (PLC) is a recent and rapidly evolving technology, aiming
at the utilization of the electricity power lines for the transmission of data. PLC
technology opens up new opportunities for the mass provision of local, last-mile access at
a reasonable cost. PLC can furthermore provide a multitude of new Information Society
services - both in the energy and telecom domains - to residential and commercial users
that are difficult or costly to implement through other technologies.
PLC technology has a number of important strengths: it offers a permanent on-line
connection as well as symmetric, two-way communication; it has good performance, very
good geographical coverage, and is relatively cheap because most of the infrastructure is
already in place. Currently, the main weaknesses of PLC technology are that it is still in
the developmental stage.
It is likely not to be the only one: rather, it will be part of a range of complementary
technologies, because each technology yields a different compromise between
bandwidth, reach, noise immunity, and cost. This report starts by looking at access
technologies and describing the power line as a communication medium and then
frequency response and noise characteristics. A transmission technique (OFDM) that
avoids power line noise and uses the common modulation formats is also explained.
The results of this work shows that the power line technology can be used as a
communication channel for urban areas and fast developing rural areas. This is because
of the bandwidth is uses. A proposed future research for slow developing rural areas is
found in the conclusion.
11

TABLE OF CONTENT
List of Abbreviations ......................................................................................................... vii
List of Figures and Tables ................................................................................................... x
CHAPTER l:INTRODUCTION ................................................................. 1
1.1 Rural Telecommunication .................................................................. l
1.2 The Power Line Network ................................................................... 4
1.3 Why Power Lines for Communication ................................................... 5
1.4 The Power Line Carriers Systems as used by Energy Industries ....................... 7
1.4.1 What is a Power Line Carrier? .................................................................... 8
1.4.2 Description of a PLCS ............................................................. 9
1.4.3 The Power Line Carrier Unit ..................................................... .1 0
1.5 Potential'and Directions for New Applications and Services ........................ 15
1.6 ProjectObjective ........................................................................... 19
1.7 Dissertation Structure ...................................................................... .19
CHAPTER 2: COMPARISON OF WIRELINE TECHNIQUES .•.•.•...••.•.•.•.•.•... 21
2.1 Wire Line Communication ................................................................ 21
2.2 Integrated Services Digital Network - ISDN ........................................... 21
2.3 Digital Subscriber Line - DSL. ............................................................ 23
2.3.1 Asymmetrical DSL .................................................................................... 23
2.3.2 Symmetrical DSL ...................................................................................... 25
2.3.3 Very High Bit Rate DSL ............................................................................ 25
2.4 Cable TV Data ....................................................................................................... 26
2.5 Power Line Communication .................................................................................. 27
2.6 Comparison Between Various Technologies ........................................................ .30
iii
CHAPTER 3: GLOBAL DEVELOPMENT AND PROBLEMS
ENCOUNTERED .................................................................................... 35
3.1 Low-Voltage and Medium-Voltage Architectures ............................................... .35
3.2 International Trials ................................................................................................. 36
3.3 Domestic Trials ...................................................................................................... 39
3.3.1 ASCOM Power Line Communication ...................................................... .40
3.3.2 Main.Net. ......................... .................. ............ ................. ........................... 40
3.3.3 Inovatech .......................... ..................................... .......... .............. ............. 41
3.3.4 Other Trials ............................................. ................................................... 41
3.4 Market Differences By Region ............................................................................. .41
3.4.1 Europe ................... .............................................................................. ...... . 41
3.4.2 North America ........................................................................................... 43
3.4.3 AsialPacific and Japan ............................................................................... 44
3.4.4 Latin America ............................................................................................ 45
3.5 Regulations and Applications ................................................................................ 45
3.5.1 Power Line As an Antenna ........................................................................ 47
3.5.2 Why was HF used in BPL .......................................................................... 48
3.5.3 Radio Communication Issues ................................................................... .48
3.5.4 Federal Communications Commission ..................................................... .49
3.5.5 Europe ......................... ..................... " ........................................................ 50
3.5.5.1 Europe Conference of Postal and Telecommunication
Administrations (CEPT) ................................................................ 51
3.5.5.2 European Telecommunication Standards Institute (ETSI) ............ 51
3.5.6 International E1ectrotechnical Commission (IEC) ..................................... 53
3.5.7 International Special Committee on Radio Interference (CISPR) ............ .53
CHAPTER 4: CHARACTERISTICS OF THE POWER LINE
CHANNEL ............................................................................................... 54
4.1 Overview of the Power Line ChanneL ................................................................. 54
4.2 Channel Characteristics .......................... .................................................... ........... 57
IV

4.2.1 Channel Impedance ............ ..................... ......... .......... ....................... ........ 58
4.3 Channel Transfer Function ....... ............................................. ............ .. .......... ........ 61
4.4 Channel Noise .................... .............. ................... .............. ..................................... 64
4.4.1 Impulse noise .................. ....................... .. ............. .......... ... ... ..................... 66
4.4.2 Tonal Noise ..... ................ .. ......... ................................................................ 66
4.4.3 High Frequency Impulse Noise .................. ................ ............................... 67
CHAPTER 5:0FDM AS A MODULATION SCHEME FOR POWER LINE
COMMUNICATION ............................................................................... 71
5.1 Communication Technologies ............................................................................... 71
5.2 Multicarrier Modulation ......................................................................................... 73
5.2.1 Theory of Operation ................................................................................... 74
5.2.2 Transmitter ...... · ........................................................................................... 76
5.2.3 Receiver ..................................................................................................... 76
5.2.4 Multipath ....................................................................................... ............. 77
5.3 Application ofOFDM to Power Lines ......................................................... : ......... 78
5.3.1 Fading Channel Model. .............................................................................. 79
5.4 Channel Capacity ................................................................................................... 82
5.4.1 Coherent Transmission .... .......................................................................... 82
5.4.2 Non-coherent Transmission ....................................................................... 84
CHAPTER 6:PERFORMANCE EVALUATION OF POWER LINE
COMMUNICATION SYSTEM USING COHERENT AND
CONVENTIONAL DIFFERENTIAL
RECEPTI 0 NS ••••••••••••••••••••.•. ~ •••••••••..••••••.••••.•••••....•..•••••.•..••••••••••••••••••••• 88
6.1 Numerical Results .................................... .............................................................. 88
6.1.1 Coherent Transmission .............................................................................. 89
6.1.2 Non-coherent Transmission ....................................................................... 92
6.2 Simulation Results ................................... ..... ......................................................... 94
v
6.3 Power Line Technology Practical Equipment ................... ................................. 101
6.3.1 Introduction ................................................................ . ....... 101
6.3.2 Basic Coupling Methods and Components .................................. .102
6.3.3 Conductive Coupling and Components ................................................... 102
6.3.4 Inductive Coupling Method ..................................................................... 104
6.4 Proposed Solution for Rural Telecommunication ............................................... 117
6.4.1 General. ........................................................................... 108
6.4.2 Traffic Consideration ............................................................ 110
6.4.3 Distance Between Repeaters ................................................... 111
6.4.4 Final Solution ..................................................................... 115
CHAPTER 7:CONCLUSION AND RECOMMENDATION ................................... 118
7.1 Conclusion and Recommendation ....................................................................... 118
7.2 Future Work ......................................................................................................... 121
REFEREN CES .............................................................................................................. 123
APENDICES .................................................................................................................. 131
VI

AC
ACF
ADSL
APSK
ASK
ATM
AWGN
bd
BER
BICM
BPL
BPSK
BRI
CENELEC
CSED
CSI
DAPSK
dB
DECT
DFT
List of Abbreviations
Alternating Current
Autocorrelation Function
Asynchronous Digital Subscriber Line
Amplitude and Phase Shift Keying
Amplitude Shift Keying
Asynchronous Transfer Mode
Additive White Gaussian Noise
baud
Bit Error Rate
Bit Interleaved Coded Modulation
Broadband Power Line
Binary Phase Shift Keying
Basic Rate Interface
European Committee for Electrotechnical
Standardisation
Channel Symbol Expansion Diversity
Channel State Information
Differential Amplitude and Phase Shift Keying
Decibel
Digital European Cordless Telephone
Discreet Fourier Transform
DOCSIS / EuroDOCSIS / DVB Euro-modem European Cable Certificates
DQPSK Differential Quadrature Phase Shift Keying
DSL
DSLAM
DVB
EnBW
Digital Subscriber Line
Digital Subscriber Line Access Multiplexer
Digital Video Broadcasting
Energie Baden-Wurttemberg
Vll

ESCOM
FCC
FFT GMSK
GSM
HDSL
HF
HV
ICI
ICT
IF
IP
ISDN
lSI
kbps
kHz
LAN
LVEDN
MAN
MB
Mbps
MHz
MLC
MSD
OFDM
PLC
PLCS
PLL
PLT
PSK
Electricity Supply Commission
Federal Communication Commission
Fast Fourier Transform
Gaussian Minimum Shift Keying
Global System for Mobile Communication
High Bit Rate Digital Subscriber Line
High Frequency
High Voltage
Interchannel Interference
Information Communication Technology
Intermediate Frequency
Internet Protocol
Integrated Services Digital Network
Intersymbol Interference
kilobits per second
kilo-Hertz
Local Area Network
Low Voltage Electricity Distribution Network
Medium Area Network
Megabytes
Mega bit per second
Mega-Hertz
Multilevel Coding
Multistage Decoding
Orthogonal Frequency Division MUltiplexing
Probability Density Function
Power Line Communication
Power Line Carrier System
Phase Locked Loop
Power l,-ine Technology
Phase Shift: Keying
viii
PSTN
QAM
QPSK
RADSL
RF
SCADA
SDSL
SNR
TETRA
VDSL
VSAT/Satellite
WAN
WCDMA
WLL
Public Switched Telephone Network
Quadrature Amplitude Modulation
Quadrature Phase Shift Keying
Rate Adaptive Digital Subscriber Line
Radio Frequency
Supervisory Control and Data Acquisition
Symmetrical Digital Subscriber Line
Signal-to-Noise-Ratio
Terrestrial Trunked Radio
Very High Bit Rate Digital Subscriber Line
Very Small Aperture Terminal/Satellite
Wide Area Network
Wideband Code Division Multiple Access
Wireless Line
IX

List of Figures and Tables
Figure 1.1 Penetrations of Power Line and Telephone in South African
Households .. ....... ............... ........ ... ............................ ............................... .. 3
Figure 1.2 PLC Access Network ........... ... .......... .. ...... ...................... ................ ............. 4
Figure 1.3 Block Diagram of Power Line carrier system coupled to ground on a
single 3 phase line ....... ......... .... .................................................................. 10
Figure 1.4 Subdivision of the 4 kHz channeL ................... .............. .................... ...... .11
Figure 1.5 Interconnection of the transmitter to the receiver units ... .......................... 12
Figure 1.6 A detailed interconnection of the transmitter to the receiver units ............ 13
Figure 1.7 Sending a trip signal. .................................................................................. 14
Figure 1.8 Receiving a trip signal. ....... ....................................................................... 14
Figure 2.1 Loaded Loop Frequency Response ....................................... ~ ................... 24
Figure 2.2 Noise PSD in good and foul weather ........................................................ .29
Figure 4.1 Maximum noise level. ................................................................................ 55
Figure 4.2 Outlet-to-outlet attenuation level. .............................................................. 56
Figure 4.3 Sample functions of a non-stationary random process .............................. 62
x
Figure 4.4 Example of the autocorrelation function ............................................. ...... 64
Figure 4.5 Lamp dimmer impulse noise ..................................................................... 66
Figure 4.6 Noise from an electronic toothbrush charging stand ....... ..... ....... ... .. .... ..... 67
Figure 4.7 Vacuum cleaner nOIse and amplitude distribution for common
impairments ......... ..... ......... ............... ... .. ....................... ......... .......... ........ ... 68
Figure 4.8 Vacuum cleaner noise spectrum ................... .... .. .... ............ ... .... ..... ........... 69
Figure 4.9 Example of a power line frequency distortion ........................................... 70
Figure 5.1 Methods of narrow band modulation ......................................................... 71
Figure 5.2 Phase locked loop (PLL) receiver .............................................................. 72
Figure 5.3 Error in PLL recovered signal due to impulse noise .................................. 72
Figure 5.4 Differential phase encoding across symbols .... .. ........................................ 75
Figure 5.5 OFDM using coherent modulation on subcarriers ....... .............................. 75
Figure 5.6 Transform from the frequency domain to the time domain and adding the
cyclic prefix ............................................................................................... 76
Figure 5.7 Histogram of the normalised channel transfers function ........................... 81
Figure 5.8 System model for coherent transmission .... · .................. ............................. 83
Figure 5.9 System model for non-coherent transmission ............................................ 84
Xl

Figure 5.10 Grouping of the received sequence into overlapping vectors of length N=3
and deinterleaving ...................................................................................... 85
Figure 6.1 Capacities CCSI for coherent reception for a = 10-7 and BT= 3MHz ......... 89
Figure 6.2 Capacities CCSI for coherent reception for a = 10-6 and a = 10-7,
BT = 3MlIz ................................................................................................. 90
Figure 6.3 Capacities CCSI for coherent reception for a = 10-6, BT= 2MHz and
BT= 3MlIz .............. ............................................................ ....................... 91
Figure 6.4 Capacities CCS1 for conventional differential reception for a = 10-6 and
a = 10-7, BT= 3MHz ................................................................................... 93
Figure 6.5 Capacities CCS1 and C(N) for 16QAM and D2APSK, a = 10-7,
BT= 2MlIz ............................................................................................... 94
Figure 6.6 BER as a function of Eb/ No ,rate = 2 bits/symbol, a = 10-7 and
BT=2MHz ................................................................................................. 97
Figure 6.7 BER as a function of Eb/ No , rate = 2 bits/symbol, a = 10-7 and a = 10-6
BT=2MHz ................................................................................................. 98
Figure 6.8 BER as a function of EJ No , rate = 2 bits/symbol, a = 10-7 and
BT = 2MHz Be = 0 Hz, Be = 5 ·Il! , Be = 11·1l! . BICM over one OFDM-
symbol. ....................................................................................................... 99
Figure 6.9 BER as a function of Eb / No for 8PSK and D8PSK with N = 2,
xu

rate = 1.5 bits/symbol, a = 10-7 and BT= 3Hz ............................... .......... 100
Figure 6.10 Typical Signal-to-Noise ratio ........................ ........ ...... ...... ...... .1 02
Figure 6.11 Conductive Coupling of Power Line Signal to Mains ....................... 103
Figure 6.12 Inductive Coupling of Power Line Signal to Mains .......................... 105
Figure 6.13 Conductive Coupling and Inductive Coupling with RF Short Circuit.. ... 1 06
Figure 6.14 Push-Pull Signal Injection ....................................................... 107
Figure 6.15 Daily Traffic Variations in a Typical Rural Area ........................... 110
Figure 6.16 Signal Attenuation as a Function of Distance ........ ...... .................. 112
Figure 6.17 Rural Area Near Ladysmith (Roosbom} ...................................... 114
Figure 6.18 Rural Layout for Roosbom .................................................... .114
Figure 6.19 Proposed Network Connectivity for Rural Area ............................ 115
Table 2.1 Network comparison at a glance .............................................................. .30
Table 2.2 State-of-the-art comparison between PL T and other relevant
Technologies ............................................................................................. 32
Table 2.3 Comparison of access technology upgrade paths ..................................... .33
Table 4.1 Transmission Line ModeL. ........................................................................ 57
xiii

Table 4.2 Power wire characteristics ......................................................................... 60
Table 4.3 Low impedance power line loads ............. ............... ...... .. .. .... ... .. ............... 60
Table 6.1 Rural households with telephone facilities ...................... ... ........ . 108
XIV

CHAPTER ONE
INTRODUCTION
1.1 RURAL TELECOMMUNICATION
"Economic development in Africa will depend heavily on the development of the
infonnation sector. Countries will need the ability to communicate efficiently with local
and overseas markets. Many of the development problems facing African countries have
scientific and technological components that will require solutions to be developed in
Africa by African scientist, however lack of infonnation is still a critical constraint" [2].
In rural areas, the sparse and scattered population pattern typically translates into high
costs to the carriers providing local and long distances services. Both state regulatory
commissions and the Federal Communications Commission have always said that
affordable telephone services must be available throughout each state - in the rural as
well as urban areas. But in the midst of the regulatory change, how can we be sure that
rural subscribers will actually receive affordable phone services? [66]
The rural sectors of the Third World and, to a certain extent, newly industrialized
countries, are often subsistence economies whose primary function is to provide labour to
a more advanced and usually urbanised sector. These rural sectors are usually
characterised by · the basic lack of clean and adequate supplies of water, food, fuel,
shelter, roads and power. It is difficult therefore to even attempt to prioritize
telecommunication development in rural areas until these basic need have been satisfied.
Rural telecommunication is an issue of concern because statistics shows that, most of the
populations in developing countries live in the rural and often isolated areas; therefore the
majority of the popUlation in these countries do not have a ready access to a
telecommunication infrastructure. The facts show that, 12 % of the world's population
resides in Africa with a tele-density ratio of 1.74 %. There are more phone lines in New
York or Tokyo than there are in the whole of Africa [2].
I

The provision of the various services in an urban area is usually not a very big problem
since a number of options are available ranging from wireless technology,
LAN/MAN/WAN, wireline networks, optical fibre cabling and VSAT. Recently many
authors have studied the technology viable for communication in non-urban areas and
low density in different environment especially in developing countries, by reflecting the
already available wireless technology adopted in some of urban areas of developing
countries. These wireless technologies are Cellular networks (GSM and WCDMA),
VSAT, Microwave based wireless access, TETRA (Terrestrial Trunked Radio), Cordless
(CT2, PHS, Digital European Cordless Telephone (DECT), Integrated/Combined
VSATIWLL, Integrated! Combined MicrowavelWLL and proprietary Solution (e.g.
DaRT). All these technology differ in their basic capacity and coverage design. Some of
the technologies, which have realized to be the candidates for communications in such
areas, are VSAT ISatellite systems. But according to the indications in various developing
countries the project implemented using such communication media have either failed to
be implemented or those which have been implemented failed to satisfy the requirement
of communication in such areas [1]. The reasons behind this include the cost of
infrastructure of the proposed technology due to the few potential end users, hence
causing the failure of communication in non-urban and low-density areas in developing
countries.
The role of telecommunications in transmitting information can be particularly significant
in rural areas where alternative means of obtaining and conveying information such as
personal contact, transport, medical care and postal services , are likely to be less
accessible. Thus, it is a fact that in Africa where population and economic activities
remains largely rural-based, sharing information is vital if Africans are to contribute to
finding the solutions to their own development problems.
Power line network is of basic consideration because the potential telecommunication
end users first consider having electricity in their household and business areas or tend to
implement the network from electrical power grid or private operators network. It has
2

been observed that in South Africa about 35.6 % of residences in rural areas and 67 % in
urban areas have managed to have electricity, while the average telephone tele-density
stands at 10,05 per hundred inhabitants. It has also been observed that the percentage of
the households with telephone in rural areas is 4.7 % as compared to 45.7 % in urban
areas [5] (see Figure 1.1).
Figure 1.1: Penetration of power lines and telephones in South African households
This is largely due to the distance between neighbours in rural areas and also the cost of
new infrastructure. If these figures are compared to that of the households with
electricity, it can be seen that if power lines are used as a communication channel, means
of communications will be at most people's disposaL
Researchers have already investigated the applicability of Power Line Network for
communication in developed countries and already the possibilities of communication in
such medium have been realized. The power line networks have proved to have enough
bandwidth for communication at any data rate [1,8 -10].
The limitation which is still hindering communications through this medium is the
regulations by communication authorities in various countries; for example in Europe,
CENELEC (European Committee for Electrotechnical Standardisation) standard have
regulated the operation frequencies and maximum power to be transmitted in PLC
environment [1]. The same applies to USA and Japan but differently from Europe, the
3

Japan and USA PLC both frequencies and power operations are differently and also only
frequencies have been regulated basing on radio operations frequencies. These have
caused researchers to review the operations in PLC. The frequency band and maximum
power to be operated is still under research in various countries, because PLC radiates
like antenna and can cause interference to other communication medium if it operates
under same frequency with for example wireless, normal broadcast radio and so on.
1.2 THE POWER LINE NETWORK
T elecommunica1ion network ,/' ...... -... ----_. -- \ --_ ... -"'.
I I , , ,
.'
, -,
: .. ': • .;, ...... .J,
I - .. ..
\---!d--;::; .' Fiber-optic nel\YO~/
" --.... -.. -Highlmedium-voltage power supply network
PLC access
Low-voltage power supply network
Figure 1.2: PLC access network (Source: Intellon Corp [17))
The power line networks implemented in different countries have shown to have
similarities. A typical PLC access network is shown in Figure 1.2. In Europe for example
from households to distribution transformers the maximum distance is 500 meters and in .
Africa it extends up to 1.2 km to distribution transformer and up to 5.2 km to primary
substation [4]. This, in PLC environment, is the called last mile. PLC in principle is
4

affected by noise, but this has shown to be similar with other communication channels
like cellular and radio, this limits the performance to be achieved. In developing countries
the telecommunication regulators have not yet considered PLC as a transmission medium
and nothing has been done to regulate it for communications. But still various companies
are operating locally. For example in Tanzania, Tanzania Electrical Supply Company
(TANESCO) is communicating in power line network high-tension grid basing on
CENELEC standard due to manufacturer of the equipment. Many researchers have
already pointed out that IP based network is the cost effective solution for
communicating towards non -urban and low density areas and technologies in
consideration include satellite [1]. The reasons behind this are that data networking
equipment is easily available at competitive prices, all links integrates data and voice
packets on per link basis, enabling higher channel utilizations and packets are acceptable
even when network is busy [1], [4]. In addition, in developing countries the power line
network is well established arid where the network is not available can be implemented
because the electricity has been shown to be the basic requirement for development. In
KwaZulu - Natal, this can connect up to 175 house holds in non-urban areas per mini
sub-transformer. In addition, this type of technology will make more customers to opt for
communication because the network will be at their disposal. Hence having many
customers and cost effective technology of IP, and also the power line network which has
not only been implemented purposely for communication but for providing electricity
will enhance the operators to invest and also to make profits.
1.3 WHY POWER LINES FOR COMMUNICATION
The companies that provide Internet services have not been carrying on as usual. They
realize that users of the Internet are hungry for faster service than phone lines and 56k
modems currently provide. Additionally, many Internet service companies seek to
increase their profitability by offering Internet access, local phone calls, cable TV, and
perhaps long distance phone services to their customers in one relatively inexpensive
package. The solution is a high bandwidth network with links to each customer's location.
5
Implementing this type of network has not proven to be easy and not accessible and
affordable to rural population.
Telephone companies have offered high bandwidth lines for many years. For the most
part, the cost of these lines and the equipment needed to access them has limited their
usefulness to large businesses and remote areas. The lone exception has been Integrated
Services Digital Network (ISDN) that has won over some residential customers. ISDN
offers fast Internet access (128k) at a relatively low cost. Telephone companies have
begun to replace the phone lines that connect residences and business to the standard
telephone network with higher bandwidth lines. However, this process is costly and time
consummg. Such higher bandwidth networks will not be operational for several years to
come.
Cable television companies have also jumped into the Internet access market. The lines
that carry cable television are much faster than standard phone lines or even ISDN. The
major problem with cable TV's attempts at providing Internet access has been the
unidirectional character of cable TV lines. Cable TV lines are only designed to bring
information to the customer, not to get input from the customer. This fundamental flaw in
cable TV lines has increased the costs of developing Internet access services based on
them. Thus, most cable TV Internet access systems will not be ready for several years in
many countries.
Wireless solutions have also been proposed, but have run into problems. First, the
performance and reliability of wireless solutions has not been up to the level of any of the
wire line solutions described so far. Second, the ability to send data from a customer to
the Internet requires much more equipment than simply receiving data. This additional
equipment makes wireless Internet access much more expensive than cable TV [6].
None of the available Internet access services offer the right balance of cost,
convenience, and speed. Power line communication technology, also mown as PLC,
6

could change all that. It promises customers high speed Internet access through electrical
networks. Lower costs are achieved because the service is implemented on standard
electrical lines. The service is also convenient because it is already in many homes in
urban as well as rural areas. Internet access through power line would be at several Mbps,
which may be 20 to 50 times faster than a standard phone/modem connection. Most high
bandwidth Internet access schemes fail at the point of connection to residences and
businesses. The cost of connecting many individual points usually overwhelms the
project. Power line services are already connected to almost all residences and
businesses through electrical lines, thus making the service more economical for both
providers of the service and customers of the service.
Using electrical lines makes the service very convenient. There is no need for the bulky
apparatus associated with wireless access. The service does not tie up phone lines like
standard phone/modem connections, current implementations of Cable TV services, or
other phone line based services. Additionally, the system features constant access to the
Internet and much of the apparatus is already in your home. Power line offers very high
speed Internet access. Its performance far outclasses phone/modem connections and even
ISDN. At IMbps, customers of power line services could explore the Web, talk on the
phone, and watch a video-on-demand movie at the same time. All of these services are
available through the innocuous looking electrical lines currently in your home. Evidently
electrical lines were manufactured with more forethought than phone lines.
1.4 THE POWER LINE CARRIER SYSTEM AS USED BY ENERGY
INDUSTRIES
Power line carrier links form the information transmission backbone of many electrical
energy supply authorities throughout the world. The system, abbreviated to PLCS, has
been of great value in power system network control over the years, principally because it
offers a relatively economical solution to many information transmission problems.
Among the signals which can be transmitted securely and reliably by means of PLCS are
7
speech, teleprinting, telemetry (data), remote control (telecontrol), regulation, meter
reading and most important, line protection signals [7].
To understand more fully the description of a PLCS and its associated components, it
may be pertinent to describe briefly the power distribution system of the Electricity
Supply Commission (Escom) in the republic of South Africa.
Escom is subdivided into a number of licensed areas of supply called Regions. Each of
these regions has its own organization for construction projects and maintenance work
and Control Centre, which is responsible for switching operations on the power network
within that particular region. Each Regional Control Centre is tied to a National Control
Centre at Simmerpan near Johannesburg. Also within each region are a number of
substations and, in some cases, power stations.
These Power or Generating stations mostly situated in the Republic, supply electrical
energy to the interconnected grid and this power is then distributed to the consumers
within each Region.
Without going into detail it should be evident to the reader that the complex system of
power distribution outlined above could not be satisfactorily monitored, controlled and
protected without an efficient information transmission system. Such a system is required
between stations, between control centres and stations and of course between National
Control stations and Regional Control Centres. In most of these cases, power lines exist
between such as stations, which in physical form consist of one or two three phase lines
suspended by means of insulators from steel towers. Because these "hard wire" links are
already in use for the distribution of power, such a system lends itself, with some
necessary adaptation and interfacing, as a communications link. Hence the evolution of
the Power Line Carrier System (PLCS) [6, 7].
1.4.1 What Is A Power Line Carrier?
8

Just as in a radio system a low frequency (audio) signal is modulated and then propagated
as high frequency signal through free space by means of an antenna to some distant
receiving antenna, so is a power line carrier signal (audio frequency) modulated and
propagated as a high frequency signal along a power line. The text that follows describes
in simple terms the basic operation of such a system and some of the techniques and
problems associated with coupling the high frequency, low power carrier signal to a high
voltage 50 Hz power line. While it is not the intention of the author to dwell on
quantitative values, it may be of interest to point out, for comparison purposes, typical
magnitudes of power and voltage associated with a typical power line and a typical power
line carrier unit.
Typical Power Line
Phase to phase voltage
Phase current
Power (neglecting phase angle)
Frequency
Typical Power Line Carrier
Output voltage
Output power
Frequency
400kV
2000 Amps
800kW
89dBm
50Hz
40V
40W
46dBm
200kHz
1.4.2 Description Of A Power Line Carrier System
The block diagram in Figure 1.3 shows the simplest form of PLC transmission system in
which the carrier equipment is coupled to a single phase of one power line. This is known
as phase to ground coupling. Other forms of coupling, which will not be described in
9

details at this point, include phase to phase coupling between two phases on the same
line, and coupling between phases on two different lines, known as intercircuit coupling.
r - - - - - STATION A- - - - - - , r - - - - - -STATION B- - - - - --, I I I I
~--------r' -3 PHASE POWERLINE...;:--------....,: , ' I !
~L--~I----~--------~-,I-----~
1-------,
, SPEECH ' - ______ 1
1- - - - - - - - - - - ~
, DATA {TELEMETRY, , , TELECONTROL) , ~ - - - - - - - - - __ I
:- spEiCi~ - ______ 1
1- - - - - - - - - - ~
, DATA {TELEMETRY, I
I TELECONTROL) I ~----- __ __ __ I
Figure 1.3: Block Diagram of Power Line Carrier System Coupled phase to ground
on a Single 3 Phase Line (Eskom Transmission [7])
Key: LT
CC
:LineTrap
:Coupling Capacitor
PROT :Line Protection Equipment
1.4.3 The Power Line Carrier Unit
IfF
LMU
PLC
: Interface Equipment
:Line Matching Unit
: Power Line Carrier
Fundamentally, the power line carrier unit consists of a transmitter and a receiver, usually
housed in a common cabinet, together with the necessary circuitry required for
interfacing the protection equipment and other inputs to the carriers. Also include in such
a cabinet is the protection signalling unit should carried protection be a requirement for a
particular line, which is usually the case for lines of 132-kV and above. It should be noted
that in some cases power line carriers are used purely for speech and data transmission
and as such are not equipped with protection signalling equipment.
10

The frequency bandwidth of a power line carriers is 8 kHz, a separate 4 kHz range being
used for transmitting and receiving, these two ranges are however usually adjacent to one
another. This 4 kHz bandwidth is subdivided into two frequency ranges, separated by
means of sharp out-off filters, for speech and super audio or data information as shown in
Figure 1.4. Depending upon the type of carrier equipment, other particular frequencies
also occupy this bandwidth. For the purpose of explanation, certain aspect of the siemens
ESB 400 PLC will be described. This system is, in the true sense of the word, a single
sideband (SSB) system as the HF carrier is completely suppressed in the transmitter.
o
Protection (TRIP)
Pilot (Guard)
300Hz 2.4k1fz 2.7k1fz 3.7k1fz 4kHz
, ..... ' <~_Telephony_---.:;> .. ,
(Speech)
, , ~Telegraphy~
(Data)
Figure 1.4: Subdivision of the 4 kHz channel (Eskom Transmission [7])
The subdivision of the 4 kHz channel shown in Figure 1.4 is as follows: -
1. A speech channel with a bandwidth of 2.1 kHz from 300 Hz to 2.4 kHz.
11. A combined pilot and signalling frequency (which can be shifted - frequency
shift keying - FSK) 2580 Hz.
lll. A super audio channel with a theoretical bandwidth of approximately 1 kHz.
IV. A protection channel capable of transmitting one or more independent intertrip
signals.
11

The telegraphy channel is capable of accommodating a number of data channels for
example 5x50 bd, 2xlOO bd or lx200 bd, where bd stands for band and means bit/second.
The simple block diagram in Figure 1.5 illustrates the interconnection of the transmitter
(Tx) and receiver (Rx) units.
Input
Tx
t high hf] cc>-ax to 1M un!
cam-r hf2
Output t Rx
Figure 1.5: Interconnection of the transmitter to receiver units (Eskom
Transmission [7])
A hybrid, connected to the output of the transmitter and to the input of the receiver, acts
as a 2 to 4 wire· converter since the coaxial cable from the power line carrier equipment is
the path for both the transmitted and the received signal, e.g. input and output. This
hybrid also provides a low loss path in the directions transmitter to line and line to
receiver but blocks the transmitted signal from entering its own receiver.
Two stages of modulation are usually employed, the low frequency signal, 0 - 4 kHz is
modulated in an intermediated frequency (IF) stage to around 20 kHz. (The TX and RX
in the Siemens equipment share a common IF oscillator).
This signal is then modulated in the final stage of the transmitter to the desired HF
frequency, typically between 50 kHz, from where it is fed via filters and a hybrid, co
axial cable, and the line matching equipment to the H. V. line. The converse takes place
12
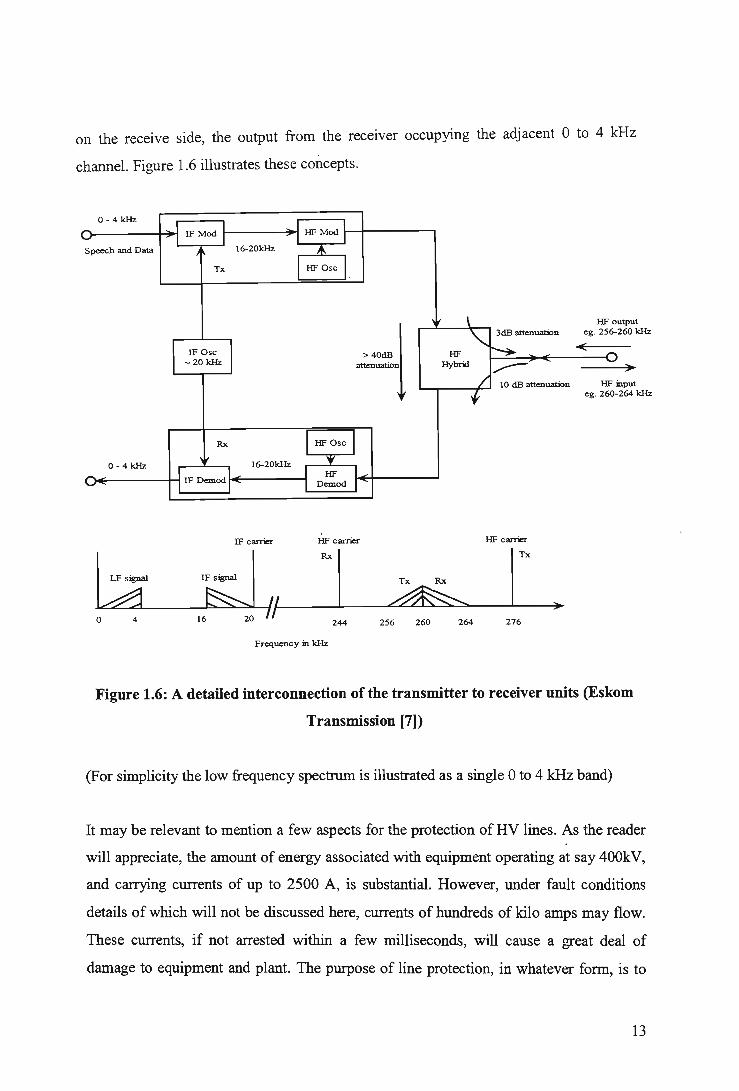
on the receive side, the output from the receiver occupying the adjacent 0 to 4 kHz
channel. Figure 1.6 illustrates these concepts.
0-4kHz J HFMod I I IF Mod I
I I I I Speech and Data ) 16-20kHz .t.
Tx 1 HFOsc I.
, \
"- 3dB attenuation
~-I IFOsc J '-\ HF -20kHz attenuation Hybrid ~
/ 10 dB attenuation
f
Rx 1 HF Osc 1 if 16-20kHz ....
0-4kHz I I
0 I IF Demod I HF
II I Demod 1-
IF carrier HF carrier HF carrier
IA 'd hi Tx Rx I T.
n ~ ., 0 4 16 20 /I
276 244 256 260 264
Frequency in kHz
HFo utput 260 kHz eg.256-
oE 0 .,
HF . mput 264kHz eg.26O-
Figure 1.6: A detailed interconnection of the transmitter to receiver units (Eskom
Transmission [7])
(For simplicity the low frequency spectrum is illustrated as a single 0 to 4 kHz band)
It may be relevant to mention a few aspects for the protection of HV lines. As the reader
will appreciate, the amount of energy associated with equipment operating at say 400kV,
and carrying currents of up to 2500 A, is substantial. However, under fault conditions
details of which will not be discussed here, currents of hundreds of kilo amps may flow.
These currents, if not arrested within a few milliseconds, will cause a great deal of
damage to equipment and plant. The purpose of line protection, in whatever form, is to
13

open the correct circuit breakers, and isolate faults as soon as possible after onset of the
fault condition. Nonnal distance relays will clear a fault in a time of, for example, 100 to
300 ms, which is often not fast enough so a power line carrier system is used which
facilitates the clearing of a fault in say 30 ms. Manufacturers are striving to reduce these
times still further. The main consideration when designing a protection scheme is a high
degree of reliability and security.
If the power line carrier is to be used for the protection of a high voltage line it is
equipped with a protection-signalling unit. This consist of a transmitter which transmits a
protection signal, usually a particular frequency within the 4 kHz channel, through the
power line carrier unit, and a receiver which processes the received breaker trip signal
and via some interfacing circuitry, uses it to operate a relay which in turns applies a
voltage and opens a circuit breaker in the HV yard. The transmitter receives the
command to transmit the breaker trip signal to the remote as follows (see Figure 1.7): -
HVYard Fauh .... Protection _ ...... sensing device ,
Relay .,- Interface Protection Equipment signal unit
PLC Transmitter
.... , Trans mit Trip
SIgl1al
Figure 1.7: Sending of a trip signal (Eskom Transmission [7])
Whereupon the distant receiver processes the received trip signal which opens the
required breaker (see Figure 1.8).
HVBreaker """'- Protection ...L Interface ...... Relay "' Equipment
Protection PLC signal unit Receiver
.., "'
Receiv edTrip SIgl1al
Figure 1.8: Receiving of a trip signal (Eskom Transmission [7])
The function of the interface equipment between the protection relays and the power line
carrier equipment is to isolate the relatively high voltage signal (110 or 220 V de)
14

produced by the relays from the delicate electronics inputs circuitry of the power line
carner.
Most power line carrier transmitters cut the speech and data signals and boost the level of
the transmitted trip signal by 6 to 10 dB, during the transmission of the trip (protection)
signal, the duration of which is up to a few tens of milliseconds. The reason for this is
that during certain fault conditions on the line, the noise level increases dramatically, so
to maintain a reasonable signal to noise ratio, which will ensure correct receiver
operation, all available power is channelled onto the line in the form of the trip signal.
This signal is propagated over the power line to the remote end, where, via the
appropriate equipment, the breaker is opened.
1.5 POTENTIAL AND DIRECTIONS FOR NEW APPLICATIONS
AND SERVICES
This new tecbnological and commercial environment will create vast new opportuniti~ 1 for everybody and especially for the power utilities. A new type of 'telecommunications
plus energy operator' is emerging which will grow out of a mixture of the old type '
monolithic telecommunications operators and old type power utility companies. This new
type of operator is expected to gradually replace the existing ones, eventually taking the
shape of a customer' Services Operator' .
This business development implies that the integration of ICT in energy systems is a
strategic technological area. Here, Power Line Telecommunications will have a dominant
role. Communication in general will enable the utilities to refocus their strategic intent,
change their organization and improve their customer orientation and marketing. Current
utility objectives are:
Cost reduction: - improve operations efficiency
- increase productivity \ - improve asset utilization
15

- outsource non-core functions
Customer retention: - improve customer services
- retain revenue and load
- maintain competitive position
- gain new customers
New revenues: - develop new service offerings to both new and existing customers
- enhance services through communications functionality
Many of these are using PLT -enabled applications and services to help achieve their
business objectives. Below we list a range of such PLT-enabled services that are
currently being investigated and tested in Europe and elsewhere [69, 70].
Examples of operations-focused services
~ automated meter reading enables the utility to remotely obtain meter readings,
load and consumption data, and detect tampering and! or energy theft
~ remote connect/disconnect for example, create a final read bill while the
customer is waiting
~ multi-utility services provide service bundles for other utilities
~ network control operating efficiencies are targeted through automation of the
distribution network, allowing dispatchers or computer-based algorithms to
operate field devices to optimize the network (substation automation, dynamic
loading and VoltIV ar control)
~ outage handling detect outages automatically and proactively notify customers
in addition to service restoration
~ power quality monitoring such as line conditioning to ensure that the service
is delivered according to set performance standards
~ predictive maintenance based on condition rather than on and field force
automation time
16
1
I
I I I I
\

Examples of customer-focused services
~ aggregated, tailored billing for a number of customer premises
~ appliance management individual appliances can be monitored and managed.
Customer can be informed if appliance has abnormal usage or appears
inefficient compared to modem alternatives
~ customer load management electricity consumption based on time of use
and/or real-time pricing in response to economic signals that provide
incentives for more efficient use of energy; direct load control may be
included as an option
~ energy usage management the customer information interface is used to
provide energy usage information and advice, as well as communications
regarding billing and new services offerings
~ interactive services customer interface for enabling servIce delivery,
scheduling services appointments and selecting service options
~ market pricing/availability market information regarding available options
provided by the utility and/or other providers
~ comfort and savings intelligent home devices and network agents providing
home comfort and energy/cost savings functions
~ Telecom intensive applications Fast Internet access (>2Mbps), electronic
commerce, IP telephony, Web TV, electronic content services in education
and entertainment, etc.
(i:day, the utilities are all working to prepare for the upcoming deregulation and to
prepare for the open domestic market. Especially in the domestic market, information
systems will be needed to handle the massive change into new flexible billing systems
and systems that provide enhanced customer service. These systems must not only
provide services towards the customers. The need is also to develop and focus on the
17

utilities' own internal efficiency. A number of ways are considered to cut management
and operational costs and to shorten repair times. Over the years 1980 - 1990, many
utilities reduced personnel and have today reached the level at which only limited
changes in this respect would be possible. The next step therefore is to incorporate more
efficient methods through better information management and through up-grading old
ICT systems [69, 70].
There is a trend to focus on increased efficiency, both when it comes to handling the I customer services and to run the installations in an optimized way. Management based on \
condition rather than on time is one fast expanding area. Asset management is seen as \
the area in which it is possible to provide the greatest potential for reduced costs and I increased efficiency in management and maintenance. Up till now, the SCADA systems
Supervisory Control and Data Acquisition - have been installed on higher system levels
i.e. from production down to 50 kV. With the new communication and computer
possibilities, the observation and control platform has been expanded to include the
whole electric system, incorporating also some parts of customer systems/units. The
power grid for data communication is essential for this approach.
As an example, analysis of British utilities show a total predicted investment of close to 2 I
billions ECU in ICT systems over the next few years, of which half will be related to
customer and market systems. Those investments have been estimated to be allocated to
the main sectors as follows [69, 70].
Call centres: 30%
Customer databases: 30%
Billing and transactions: 25%
Smart cards: 5%
Remote metering: 5%
Maintenance: 5%
18

Of the total lCT investment, the build-up of new telecommunications infrastructures is an
essential part whereby the power lines will yield advantages provided that the data
transfer is secure and efficient. All in all, from the viewpoints of both increased
operational efficiency and enhanced customer service, it is evident that lCT is a strong
competitive factor for tomorrow's energy and electricity industry, as it is for today's
telecom industry [70].
1.6 PROJECT OBJECTIVE
The primary objective of this project is to evaluate the performance of the power lines (in
terms of speed, access and bandwidth) and its applications, if used as a high speed large
scale data transmitter and information carrier in its own right as compared to most
commonly used wire lines such as the xDSL and Cable TV. The secondary objective is
to check its viability in rural telecommunication.
1.7 DISSERTATION STRUCTURE
Chapter 2: The focus of this chapter is on the comparison of the types of access
technologies available or proposed for rural telecommunication. Their merits and
demerits are weighed up leading to the proposing of a power line communication system
as an alternative network for communication in rural areas.
Chapter 3: Global deployment of the power line technology and problems encountered
are discussed in this chapter. Regulations and applications proposed by
telecommunications authorities are also looked at.
Chapter 4: Chapter 4 looks at the power line as a communication medium in its own
right. The focus is more on the transfer function of the channel, frequency characteristic,
limitations in terms of frequency spectrum, bandwidth and attenuation, how channel
19

generates harmonics, influence of loading and services of PLC are discussed in this
chapter.
Chapter 5: A typical power line design for communication purposes is done and
explained in this chapter. The channel is characterised by a channel transfer function
H(f) and a subsequent additive noise term. based on the OFDM transmission technique.
Chapter 6: Numerical and simulations results and also the discussion of these results is
done in this chapter. Attenuation factor a= 10.7 and a= 10-6, bandwidth of 2 MHz and 3
MHz are used to evaluate channel capacities, BER and SNR. Practical set up is also
discussed but using GMSK as a modulation scheme. Finally a solution to rural
telecommunication is proposed.
Chapter 7: Conclusion, recommendation and future research are done here.
20
CHAPTER TWO
COMPARISON OF WIRELINE TECHNIQUES
2.1 WIRE LINE COMMUNICATION
6 e last mile, first mile, local loop, access network: Whatever you Choose. to call it, the
meaning's the same, that part of the telecom network that hnks users wIth broadband
servIces. ere are many techniques to do that and this chapter tries to cover some of
them.
Traditionally basic users have used a modem connected to PSTN to access the Internet.
There are many emerging solutions to the faster last mile access: ISDN, ADSL, Cable
modems, hybrid fibre coax, fibre-optics, etc. Broadband was the mantra of the dot-com
and telecom booms, and is being offered as a magic elixir for curing the woes of the high
tech sector. There are interesting dynamics to the financial and technological scenes that
suggest broadband access may arrive very soon to very many people. Fibre-to-the-home,
widely regarded as the Holy Grail of residential broadband, might never become
widespread, because of other competing technologies that make the use of existing
infrastructure [8].
2.2 ISDN (INTEGRATED SERVICES DIGITAL NETWORK)
ISDN (Integrated Services Digital Network) is a digital telephone line which allows
normal telephone operation and data communications at speeds of 64 kbitls and 128
kbitls using normal home telephone wire. Using the same copper phone line that modems
use, ISDN delivers a considerable speed improvement up to 128 kbps and provides
essentially perfect transmission reliability. And ISDN can mesh into other digital
technologies, such as Frame Relay and ATM, making possible future speeds several
times higher even than 128 kbps.
21

The "Integrated" part of ISDN's name refers to the combining of voice and data services
over the same wires, so computers can connect directly to the telephone network without
first converting their signals to an analogue audio signal, as modems do. This integration
brings with it a host of new capabilities combining voice, data, fax, and sophisticated
switching. And because ISDN uses the existing local telephone wiring, it's equally
available to home and business customers. Most important for Internet users, however, is
that ISDN provides a huge improvement in access speed at only a fractional increase in
cost.
ISDN service is available today in most major metropolitan areas and almost throughout
the country in USA, Canada, Far East and in most European countries. They are also
widely available in urban areas of South America, Middle East, Northern and Southern
Africa Many Internet Service Providers (ISPs) sell ISDN access. The ISDN connection
price depends on your local telephone company, equipment budget, and ISP. An Internet
ISDN connection consists of three components: the ISDN line itself, the equipment and
the ISP's fees.
GDN provides a raw data rate of 144 kbps on a single telephone company (called Telco
in the business) twisted pair. To better suit voice applications, this 144 kbps channel is
partitioned into sub channels: two 64 kbps B (for bearer) channels and one 16 kbps D (for
data) channeL Each B channel can carry a separate telephone call and usually has its own
telephone number, called a Directory Number (DN). You can combine the two B
channels together to form a single 128 kbps data channel through a process called
bOndin~e B channels carry customer voice or data signals. The D channel · carries
signals between the ISDN equipment and the phone company's central office. The two
bearer plus one data channel is called the Basic Rate Interface (BRI) or sometimes just
2B+D. )
~cause ISDN is purely digital, the telecommunication companies can more easily
deliver data intact from end to end, largely eliminating the effects of noise. And because
the 64 kbps channel is essentially a pure "bit pipe," with no rate negotiation or
22
handshaking involved, there are no modem speed or protocol differences to cause
conflicts. In fact, because the negotiation phase with ISDN is so simple, ISDN takes only
a second or two to dial and establish a connection (modems may take as long as a minute
to accomplish the same thing):.]
2.3 DSL (DIGITAL SUBSCRIBER LOOP)
DSL (Digital Subscriber Line) is a new, digital data-connection method that allows high
speed Internet connections over standard telephone lines. A standard telephone
infrastructure around the world consists of a pair of copper wires that the phone company
installs in your home. A pair of copper wires has plenty of bandwidth for carrying data in
addition to voice conversations. Voice signals use only a fraction of the available
capacity on the wires. DSL exploits this remaining capacity to carry information on the
wire without disturbing the line's ability to carry conversations.
To use DSL, a DSL modem or DSL router is required. They work with the same single
copper-wire pair that telephone services use, but they contain sophisticated digital signal
processors that take advantage of a much greater range in the frequency spectrum. The
result is much higher bandwidth capability than standard telephone service and modem
combinations. There are many related technologies like HDSL, HDSL2, ADSL, SDSL,
RADSL, VDSL and many other which are commonly referred to as DSL or xDSL
technologies [6].
2.3.1 ADSL (Asymmetrical DSL)
ADSL (asymmetrical DSL) is a DSP-based communications technology that can
dramatically increase the speeds of data communications over the typical copper wiring
that connects most homes and businesses to the public telephone network. ADSL can
transfer data up to megabits per seconds speed and is particularly well suited to Internet
related communications. DSL normally only works within a certain distance (typically
5500 metres) of the telephone company central office and is therefore unusable for many
23
rural and semi rural customers. The performance (data rate and error rate) of DSL depend
on used wiring conditions (line length, line noise, etc.) and the used DSL technology.
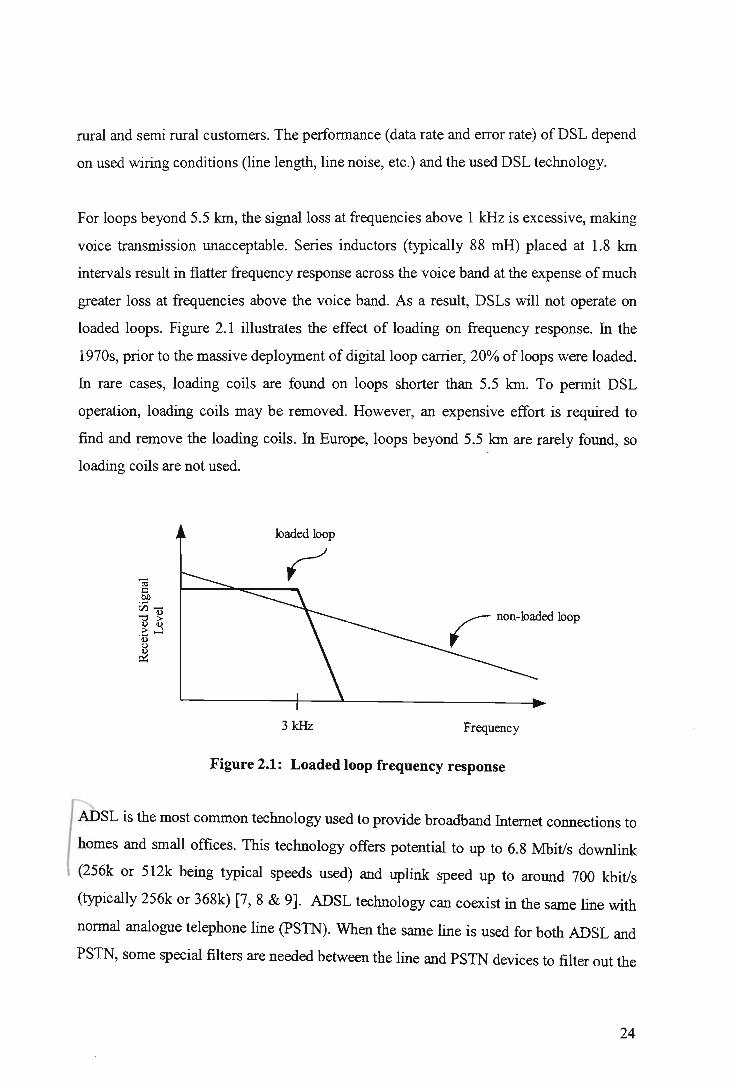
For loops beyond 5.5 km, the signal loss at frequencies above 1 kHz is excessive, making
voice transmission unacceptable. Series inductors (typically 88 mH) placed at 1.8 km
intervals result in flatter frequency response across the voice band at the expense of much
greater loss at frequencies above the voice band. As a result, DSLs will not operate on
loaded loops. Figure 2.1 illustrates the effect of loading on frequency response. In the
1970s, prior to the massive deployment of digital loop carrier, 20% of loops were loaded.
In rare cases, loading coils are found on loops shorter than 5.5 km. To permit DSL
operation, loading coils may be removed. However, an expensive effort is required to
find and remove the loading coils. In Europe, loops beyond 5.5 km are rarely found, so
loading coils are not used.
loaded loop
r non-loaded loop
3 kHz Frequency
Figure 2.1: Loaded loop frequency response
~SL is the most common technology used to provide broadband Internet connections to
homes and small offices. This technology offers potential to up to 6.8 Mbitls downlink
(256k or 512k being typical speeds used) and uplink speed up to around 700 kbitls
(typically 256k or 368k) [7, 8 & 9]. ADSL technology can coexist in the same line with
normal analogue telephone line (PS1N). When the same line is used for both ADSL and
PS1N, some special filters are needed between the line and PS1N devices to filter out the
24

ADSL high frequency signals from entering those devices. ADSL can not coexist on the
same line with ISDN system because they operate at same frequency range. ADSL
connections are always built between the terminal device on the user premises (ADSL
modem) and the central office device (ADSL DSLAM).
2.3.2 SDSL (Symmetrical DSL)
Symmetrical DSL (SDSL) is a technique which transports fast digital signals through
telephone line wiring. SDLS system transfers the data at the same speed to both
directions (typically from 256 kbps to few megabits per second) through telephone line
wiring. Two suitable SDLS modems can be connected to each other through some
kilometres (typically below 5-10 km) oftelephone line (leased line).
2.3.3. VDSL (Very Higb Bit Rate DSL)
The newest competitor in the field is VDSL. VDSL stands for very high bit-rate DSL. It
is seen by many as the next step in providing a complete borne-communications or
entertainment package. VDSL provides an incredible amount of bandwidth, with speeds
up to about 52 megabits per second (Mbps). VDSL's amazing performance comes at a
price: It can only operate over the copper line for a short distance, about 1200 metres. As
from the year 2002, products seemed to be still limited to around 15 Mbitls speeds.
DSL is a distance-sensitive technology, as the connection's length increases, the signal
quality and connection speed decrease. ADSL service has a maximum distance of 5460
metres between the DSL modem and the DSLAM, though for speed and quality of
service reasons, many ADSL providers place an even lower limit on the distance. At the
upper extreme of the distance limit, ADSL customers may experience speeds far below
the promised maximums, whereas customers close to the central office or DSL
termination point may experience speeds approaching the maximum, and even beyond
the current limit in the future.
25
I
2.4 CABLE TV DATA
Many traditionally one-way cable TV networks have nowadays converted to two-way
data highways by adding two way operation to the cable TV network amplifiers and
connecting cable modems to the cable TV network. Cable modems are devices that allow
high-speed access to the Internet via a cable television network. While similar in some
respects to a traditional analogue modem, a cable modem is significantly faster.
There are different cable modem systems in use. Some cable companies have "one-way"
cable modem service. In this system, communications in the down direction is by cable
but the return path is by conventional telephone line and telephone modem (33 kbps).
Two way cable systems transmit data in both directions via cable and therefore do not
need a telephone line. Uplink speeds are typically higher than 56K modem but not as
high as downlink speeds. Downlink speeds are typically at least several hundred kilobits
per second.
Cable modem service is typically provided as always-on service. A "Cable Modem" is a
device that allows high-speed data access (such as to the Internet) via a cable TV
network. A cable modem will typically have two connections, one to the cable wall outlet
and the other to a computer (PC). Most cable modems are external devices that connect to
the PC through a standard 1 OBase-T Ethernet card and twisted-pair wiring. Cable modem
speeds vary, depending on the cable modem system, cable network architecture, and
traffic load. An asymmetric cable modem scheme is most common and is specified in the .
DOCSIS, EuroDOCSIS and DVB Euro Modem standards. The downstream channel has
a much higher bandwidth allocation (faster data rate) than the upstream.
The dominant service offered by cable modem is high-speed Internet access. Many cable
TV operators are packaging high-speed data services much like they do basic cable
television service.
26

Cable modem systems are generally implemented as a very asymmetrical system. There
is fast download and slower upload. All the network traffic is controlled by the operator
system, it gives different modems rights to transmit and control what they receive. The
cable modem systems are generally built so that the user cable modem can only
communicate with the access router in the operator premises. This device then forwards
the traffic to where-ever the user wants to communicate and the operator policy allows.
2.5 POWER LINE COMMUNICATIONS
G wer line Carrier is a communication technique that uses the existing power wiring (120
Volts, 240, etc) to carry information. It is a kind of "wireless" means of communication,
because PLC technology can supersede the installation of dedicated wiring in some
applications. Various applications use PLC technology from power company equipment
controlling to computer networkin~ The two main reasons why there will be
communications problems with PLC transmissions are low signal level and noise or
interference.
0 YPiCal frequency ranges used in power line communication is from 30 kHz to 150 kHz. '-.../
In Europe mains power line communication is standardized at 1991 in EN 50065-1
standard. EN 50065-1 is defined to standardize signalling on low-voltage electrical
installations in the frequency range 3 kHz to 148.5 kHz. It gives general requirements,
frequency bands and electromagnetic disturbances. The frequency range of EN 50065-1
is split to four different frequency bands. In the A-band, the carrier signal can be from 9
kHz to 95 kHz where electricity suppliers and their licensees are permitted to
communicate. Power lines can also be used for other applications; the C-band is for
consumer use with an access protocol. This band goes from 125 kHz to 140 kHz.
Between the A-band and C-band is the B-band, used for consumer without an access
protocol so this band has some freedom of communication. Devices can interfere with
one another and baby alarms use this band.)
27

Above 150 kHz, communication is prohibited in Europe. But in USA those higher
frequencies are usable. Popular "wireless" intercom systems for example operate at
around 150 kHz to 500 kHz frequency range.
The power line environment is a hard environment for any communication. For example
vacuum cleaners, hand-held drilling machines, etcetera which use universal series wound
motors generate a lot of impulse noise to power line. TV -sets are a very common source
of distortion. Light dimmers are also a source of mains noise. Switch mode power
supplies use high frequency components, and usually a lot of tonal noise is generated.
Everything can change over the frequency range, both the attenuation, phase response
and noise level. The channel response (amplitude and phase) between any two nodes on
the power line varies greatly with frequency; at some frequencies the signal is attenuated
such that it is lost below the ambient noise floor. Figure 2.2 shows a noise power
spectrum density in good and foul weather respectively (foul weather in this case is
referring to lightning and thunder storm). As a further complication, the noise and
channel response of a power line network vary over time. Generally, the channel's
characteristics are stable over the time required to send numerous packets [16]. If a
packet is lost due to changes that occur during transmission, the packet is re-transmitted.
To compensate for these effects, this work explores signals using a frequency band from
2 to 20 MHz as proposed in the Part 15 of the FCC rules. Spreading the signal out over a
wide band increases the probability that a portion of the signal can be received
28

~-30 --E OJ ~40 >. .-
. iii
c:-50 Q) "0
E ~-60 L.-o Q)
~70 LQ)
~-80 a..
•••••• • •• :. • •• • ••••• : ••• • ••••• • •• • •• •• ••• 0
· . .. . ............. . ... ........ ..... .... ..... .. . · . · .
. . .. ... .. ... . . ... . ..... ...... .. .. .......
... ~ ..... ..... :' ... ..... ':' ... .... . ~ ....... .. : .. . . . . .
-90: . . . . 100 200 300 400 500
Frequency [kHz]
--~-30 --E OJ ~40 >. --·00 c:-50 v "0
E :J-60 L---o v ~-70 Lv
~-80 a.
. . ....... ... ... : .... .. .. . : ...... . . : . .. ... .. . : .. . · . · . · . · . · . · . · .
... :' .. ... ... ~ ...... ... ~ ... ...... ~ ......... ~ .. . '. . '. . : : : :: :
···;···· ·····!· .. ··· .. ·l· ····· .. ·:·········l'·· :: :
100 200 300 400 500 Frequency [kHz]
Figure 2.2: Noise Power Spectrum Density in good weather (left) and foul weather
(right) (Eskom Transmission [7])
Broadband over Power Line (BPL) is a form of power line carrier technology that uses
existing low and medium-voltage power lines to deliver broadband services to homes and
businesses. BPL proponents, primarily electric power utilities, are testing BPL systems in
several markets. BPL uses frequencies between 2 MHz and 80 MHz. Radio amateurs fear
that BPL could affect HF and low-VHF amateur allocations wherever it's deployed. The
problem in using the open wire medium voltage lines is potential radio signals radiation
out of the wires. Electrical transmission lines were designed to conduct 50- or 60-Hz
power from point to point. At those frequencies, power lines are excellent transmission
lines and little of that 50- or 60-Hz power is radiated. The electric-utility industry also
uses those lines at frequencies below 490 kHz to transmit Power Line Carrier signals to
control utility equipment. Those lines, however, were not designed to carry
radiofrequency energy. As the frequency of carrier-current signals conducted on pow~
29

-J lines is raised, the amount of signal radiated from the line increases rapidly. The gain of
the power-line as a radiator increases rapidly with frequency. A radiating conductor wi~
relatively low emissions at 0.1 MHz can have emissions tens of dB higher at HF.
2.6 COMPARISON BETWEEN VARIOUS ACCESS
TECHNOLOGIES
In order for one to understand the merits and demerits of access technologies, we look at
home networks as an example. Once the decision to add a home network has been made,
consumers will expect it to be easy to install, reasonably priced, and require low
maintenance. There are currently three broad categories of home networking
technologies: special network wiring such as CATS, co-axial cable, or telephone lines,
wireless networks, or power line networks. Refer to Table 2.1 for a review of these three
alternatives. While each of the alternatives has its appeal, most homeowners will want a
solution that is easy to install and easy to use. They do not want high maintenance. They
do not want to disrupt their homes to put the network in place, pulling cable through the
walls or punching holes for jacks. They do not want to have to open their PC or other
device and screw in cards. Most car owners do not do their own maintenance but they do
like to drive. Plug and play is the preferred mode of use.
Special wires
Pros - Dedicated connection
Cons - needs new wires - difficult to add nodes - expensive to retrofit
Network comparison at a glance
Wireless
- Nodes available almost everywhere
- added cost to devices - older hardware needs adapter - no single standard - possible security issues
Power line
- 'inexpensive - built-in encryption for security - many nodes available - Single standard
- not ideal for handheld devices
Table 2.1: Netwo~k comparison at a glance (Source: Spectrum [3,72))
30
There must be adequate connection points available. The number and location of special
wiring nodes must be specified at the time of construction and it is not easy to foresee all
the applications the network will have to support in future. Finally, the cost must be
reasonable. Adapting older devices and adding new network nodes add to the expense of
installing a home network.
Power line networks provide the consumer with a low cost, convenient option. As with
phone line networks (and other networks using special wires), no antennae or RF
conversion hardware is required, making power line inherently lower in cost than a
wireless solution. Using power lines for a home network provides many connection
points for network devices.
As most devices will require a power source, the outlet is a convenient connection point.
ower line networks use a single industry standard to ensure that all power line network
devices will be interoperab~ere are several alternative technologies, besides PLC, for
the provision of the Information Society local access infrastructure and services. Each
technology has its own strengths and weaknesses. A state-of-the-art comparison between
PLC and some other relevant technologies is presented in Table 2.2.
31

Copper I PSTN
+ tv1ature and robust + Good installed base
ISDN
+ tv1ature and robust + Wdelyavailable
Cable Modems
+ Excellent performance + Permanently on line
+ Wde choice of product + Easy to install / use + Relatively cost effective
- Expensive for consumer market
- United geographical coverage - OJrrently only available in Iirrited trials
- 01 demand only - Relatively slow - 01 demand only
~r/~L-Ute
+ Good Performance + OJrrently at the trial stage + Permanently on line
- Irnnature - Length of local loop affects performance
- Contention based
+ Good Performance + Perrranently on line
PLT
+ Good geographical coverage
- Still at the developmental stage - No installed base - Dista1ce lirrited - Possible problems in meshed pcmer netv.a1<s
Table 2.2: State-of-the-art comparison between PLC and other relevant technologies
(Source: Mason Communications Ltd [10])
A technology comparison must not only take into account the state of the art today, but
should also look at the ease of development and improvement in the near future. This is
done in Table 2.3, which compares the upgrade paths for various technologies.
32
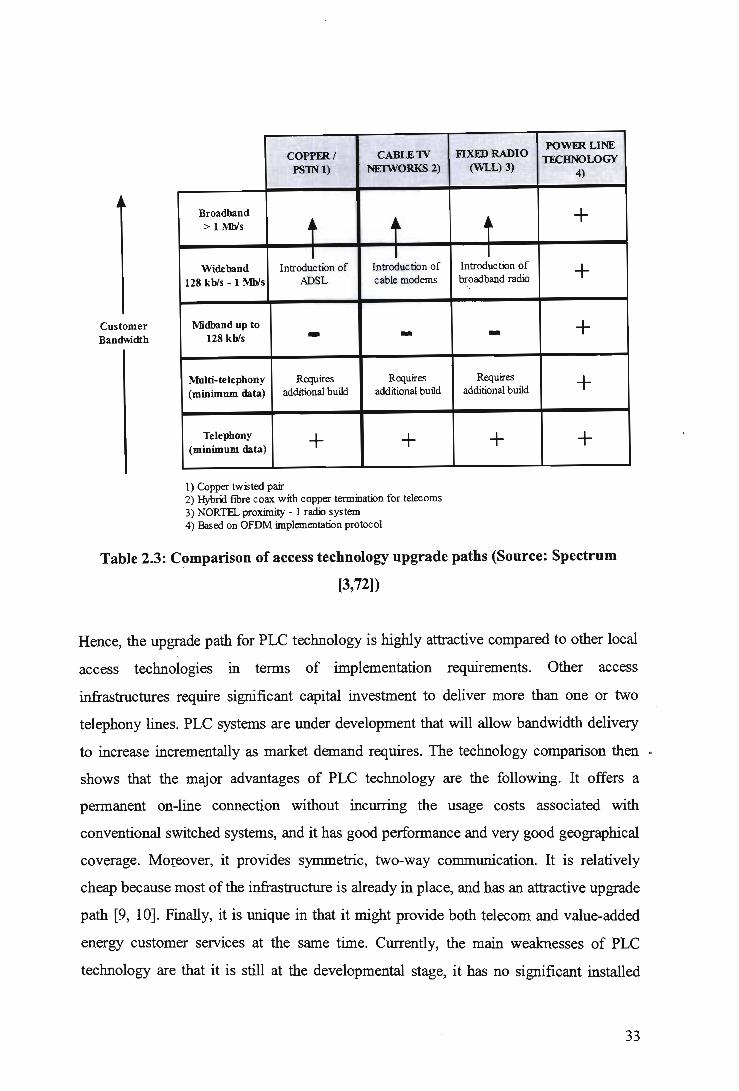
rowmLINE FIXED RADIO COPPER! CABLElV
lECHNOLOGY PS1Nl) NEIWORK(2) (WLL) 3)
Customer Bandwidth
..•
Broadband > 1 Mbls j~ ~
Wide band Introduction of Introduction of 128 kbls - 1 Mbls ADSL cable modems
Midband up to 128 kbls - -
Multi-telephony Requires Requires (minimum data) additional build additional build
Telephony + + (minimum data)
1) Copper twi<> ted 'pair 2) Hybrii fibre coax with copper termination for telecoms 3) NORTEL proximity - 1 radio system 4) Based on OFDM implementation protocol
4)
+
Introduction of + broadband radio
- +
Requires + additional build
+ +
Table 2.3: Comparison of access technology upgrade paths (Source: Spectrum
[3,72])
Hence, the upgrade path for PLC technology is highly attractive compared to other local
access technologies in terms of implementation requirements. Other access
infrastructures require significant capital investment to deliver more than one or two
telephony lines. PLC systems are under development that will allow bandwidth delivery
to increase incrementally as market demand requires. The technology comparison then .
shows that the major advantages of PLC technology are the following. It offers a
permanent on-line connection without incurring the usage costs associated with
conventional switched systems, and it has good performance and very good geographical
coverage. Mo(eover, it provides symmetric, two-way communication. It is relatively
cheap because most of the infrastructure is already in place, and has an attractive upgrade
path [9, 10]. Finally, it is unique in that it might provide both telecom and value-added
energy customer services at the same time. Currently, the main weaknesses of PLC
technology are that it is still at the developmental stage, it has no significant installed
33

customer base yet, the distances it can cover are limited, and possible problems may arise
when very heavy power functions are simultaneously involved. It offers medium band
width, but not the extremely high bandwidths as some other technologies do, the latter
however With higher costs and less coverage. In sum, PLC is a definite and significant
last-mile local access technology, but it will not be the only one. The use of different
complementary technologies is seen as more likely, since each technology offers a
different compromise between bandwidth, reach, noise immunity, and cost. PLC has a
number of unique advantages, but it must be positioned within a well defined local access
strategy, especially targeting geographic concentrations of users requiring common
services [11].
34
CHAPTER THREE
GLOBAL DEPLOYMENT AND PROBLEMS
ENCOUNTERED
3.1 LOW-VOLTAGE AND MEDIUM-VOLTAGE
ARCHITECTURES
Most early deployments ofPLC access technology have placed the head end gateway at
the low-voltage transfonner site. This location provides stability and short distances
within which to operate. The chipsets available so far have provided limited bandwidth
and are unsuitable for sharing by large numbers of subscribers.
As PLC technology matures, the limitations of the low-voltage architectures become
more noticeable. Back-haul costs and limited subscriber capacity become more
significant issues the closer utilities move to commercial services. Furthennore, North
America's electricity grid is characterised by small transfonners serving small numbers of
customers; this does not lend itself well to PLC deployment. Despite this and North
America's greater penetration of broadband technologies such as cable and DSL, the
region's high revenue potential makes it a key market in which to generate capital
investment for the development ofPLC [58, 63].
The alternative to low-voltage architectures is to move the headend gateways to a
location at the substation on the medium-voltage lines. However, this approach faces
significant challenges: it requires some fonn of bypass of the transfonner units; it also
needs high-bandwidth chipsets for service provisioning to larger groups of customers on
the same gateway. The challenge of bypassing is usually tackled by using a coupling
device; the need for bandwidth will be met by evolution of chipsets and prototypes.
35

At present, DS2 in Spain makes the highest-capacity chipset - bandwidth capacity of 45
Mbps with throughput of up to 13 Mbps. Ambient, the most prominent PLC system
vendor in North America uses DS2's chipset. Most other vendors are reportedly working
to expand the bandwidth capacity of their chip sets to between 10 Mbps and 20 Mbps [58,
63].
It is logical for PLC to evolve toward medium-voltage architectures over the next few
years. The cost of providing back haul for headends is unlikely to fall significantly during
this time and will continue to loom large as a deterrent to large-scale deployments ofPLC
where the utility does not own a back-haul network based on other technologies.
Although low-voltage architecture provided a safe environment for PLC's early
development, Gartner Dataquest doubts whether it can support PLC's evolution to large
scale business models worldwide [64].
3.2 INTERNATIONAL TRIALS
In North America, a transformer serves from 5 to 10 households while in Europe and
India a transformer serves 150 households. Power line signals cannot pass through a
transformer. Therefore, all electrical substation equipment needed for power line has to
be located after the transformer. If there are fewer households per transformer predicted
equipment costs would be prohibitive. However, this conclusion has been debated.
Analysts suggest that 100% subscription rates are possible in US, and that at such rates
power line is profitable [56].
Soon after the first trials of power line in the UK, some unanticipated problems arose.
Certain radio frequencies were suddenly deluged with traffic, making it impossible to
transmit on those frequencies. BBC, amateur radio, and the UK's emergency broadcasting
service were affected. The apparent culprits were standard light poles. Then it became
clear that by pure chance British light poles were the perfect size and shape to broadcast
Power line signals. This situation posed problems not just because of the frequencies
involved but also because anyone could listen in on the traffic. Companies are addressing
36
the problem by proposing to lease the frequencies involved from their owners and
offering amateur radio operators a new frequency. Negotiations on this topic are currently
taking place in London [56].
I "Power line technology was fIrst tested in a public setting at the Seymour Park Primary
School in Manchester, UK. Twelve PCs were connected to a single Power line outlet.
Dedicated high-speed access to the Internet turned out to be a great success in the eyes of
students and teachers)
(Norters power line web site quotes Seymour Head teacher, Jenny Dunn; "The high speed
connection really lets us take advantage of the educational potential of the Internet. With
a normal connection the children could lose interest waiting for pages to download. The
new system means information arrives virtually instantaneously, thereby maximizing
teaching time and keeping children on task. This set is amazingly flexible in educational
terms, and not only gives us the addi.tional medium with which to improve standards, but
prepares us for the National Grid for Learning" [57].~
(Following the success at Seymour Park, a more comprehensive trial was initiated at the
Stanley Road electricity substation, also located in Manchester. The crux of this trial was
to test the limits of power line technology and make sure that it could meet industry
standards even in worst case scenarios. The Stanley Road substation was set up to use
two distributors to serve two distinct neighbourhoods. Northumberland Close is located
350 meters from the substation and Seymour Close is located 600 meters from the
substation. Fifteen users were chosen between the two neighbo~hoods to participate in
the pilot program. They received various data and telephone services as well as remote
metering/information Services)
( UnfortunatelY, the results of the trial are unobtainable. Nortel and Nor.Web claim that the
results of this trial and similar trials in the United States are being protected for
competitive reasons. The only indication of the trial's success is a subjective quote from
Nor. Web. The quote states that "results produced over this period have now proved
37
conclusively that Nor.Web's technology provides a commercially viable alternative to
established means of telecommunications delivery to customer premises" [66].
German utility Energie Baden-Wurttemberg (EnBW) has launched a trial for Internet
access over electrical power lines. The trial puts EnBW in the forefront of utilities
looking to exploit the opportunity of Internet access over power lines. If utilities can iron
out problems such as a transmission standards as well as disturbances during
transmission, the technology holds out the promise of providing cheaper and faster
Internet access than telephone wires. Power lines connect customers at 1 Mbps,
prompting the utility behind the project, Energie Baden-Wurttemberg (EnBW), to
promise no dial-ups, no hefty phone bills and no World Wide Wait.
EnBW is one of a consortium of power companies committed to using power line
technology, which allows voice and data to be sent in both directions over electrical
power lines at speeds of up to 1M bit per second. EnBW is working on the trial project
with its telecommunications subsidiary, Tesion Communikationsnetze Sudwest, a joint
venture with carrier Swisscom, Nortel Dasa, a joint venture between Canada's Northern
Telecom and Daimler-Benz Aerospace of Germany, and Nor.web.
To link up to the Internet, customers use an Ethernet network card, which connects to a
coaxial cable outfitted with a special modem. From there, data is sent on to a nearby
electricity meter. Besides making possible Internet applications that require high
bandwidths such as sending large data files with graphics and video, the technology may
also be developed to automatically read users' electricity meters.
Using technology developed by United Utilities in 1995, Energie transmits digital data to
and from a cable-modern-type device connected to a consumer's PC. The device is
connected to a box attached to a home's electric meter that converts the signals and sends
them over a power line. When the signals reach a power transformer, they're peeled off,
transferred to a fibre-optic network and uploaded to the Net [65].
38
3.3 DOMESTIC TRIALS
The last mile in telecommunication is the term used for the link between a
telecommunication service provider like Telkom or the Second Network Operator (SNO)
and the end user. Currently these services or the last mile are being provided by Telkom
by means of, mostly, telephone lines. With the SNO coming into play, Telkom will no
longer have sole mandate over the provision of last mile services. However in the case of
the SNO, the problem of bridging the last mile arises. It is just not viable for the SNO to
roll out copper lines to each and every end user or subscriber in the same way that
Telkom invested in their infrastructure over the last 70 years. It is for this reason that
SNO at the City of Tshwane have been investigating several last mile access alternatives.
One of the alternatives is power line communication (PLC). Power line communication -
PLC Power line communication is not a new concept. It has been used by Eskom for
telemetry purposes for a number of years already, at very low bandwidths/data rates. It is
only recently that development in the field reached a level where broadband services such
as telephony, high speed Internet access, video streaming, etc. can be supplied using the
electricity network [67].
Power line communication works on the simple principle of providing voice and data
services over the existing electricity infrastructure. Data and voice signals are injected
into the network at a central point on the electricity network by means of some kind of
PLC coupling device and the end user can retrieve these data or voice signals by means
of a PLC modem. Two divisions of PLC exist currently: medium voltage (MV -PLC) and
low voltage (LV-PLC). With MV-PLC the 11 kV electricity network is used for primary
data distribution, whereas with LV-PLC the 380 V consumer distribution network is
used. LV PLC is currently installed or being rolled out at various sites in Europe where
electricity utility companies provide telecommunications services to their customers over
the power lines using some or other kind ofPLC technology [67,68].
At Tshwane, Corporate Communications Department researchers currently have four
installations where the possibilities of providing telecommunication services under
39
license of the SNO are currently being investigated. MV PLC is still in the early stages of
development and not much success has been reached in this field. The main reasons
being that the general length of 11 kV cables is too great for the distance the injected
signal can travel and some safety issues exists where the PLC equipment needs to be
coupled onto 11 kV cables, switchgear or busbars. At Tshwane four pilot projects
regarding PLC have already been rolled out. These include an office building, PLC in a
laboratory, and two residential areas. In all four cases it was be shown that it is possible
to provide last mile access via power lines [67].
A few PLC pilots have been rolled out in the last two years in South Africa by Tshwane
and Eskom. The technologies tested up to date are ASCOM (Tshwane), Inovatech
(Tshwane) and Main.Net (Eskom). All three pilot systems have been rolled out
successfully and future pilots with Sumitomo, Ambient and others will also be
investigated. A short summary of these pilot systems are listed below [67, 68].
3.3.1 Ascom Power Line Communication
The ASCOM PLC system has been successfully rolled out and tested by Tshwane during
the course of 2002/2003 at various sites. The first pilot was at the Electronic Services
offices in Tshwane. The Tshwane pilot was from a substation about 400 m away on
overhead lines to the office building. The second pilot is in a laboratory environment at
the University of Pretoria (UP), where ten computers are connected via the electricity
infrastructure and PLC system. Data rates of up to 4,2 Mbps were measured in both the .
Tshwane and UP pilots. Thirdly the ASCOM PLC system is being used for the roll out
of PLC in a residential area With this pilot, broadband services are provided to a few
residential homes.
3.3.2 Main.Net
The Main.Net PLC pilot was rolled out by Eskom TSI, their research division. The pilot
successfully supplied Internet access via power lines to five residential users.
40
The minisub where the signal was injected was about 450 m from the furthest point in the
PLC network. A constant data rate of '2 Mbps was shared amongst the five users.
3.3.3 Inovatech
The Inovatech pilot was rolled by Tshwane Municipality and is currently still running. It
is rolled in the same way as described for the ASCOM Tshwane pilot above. Data rates
of up to 18 Mbps (11 Mbps downlink and 7 Mbps uplink) were measured. This system
also includes automatic meter reading whereby the meter data are also transferred via the
power lines.
3.3.4 Other Trials
Other domestic trials are research trials done by universities (to name a few, University
of KwaZulu Natal, University of Rhodes, University of Fort Hare and University of
Pretoria). Observed measurements done by the CoE of the University of Fort Hare came
to data rate of 3.67 Mb/s on the downlink and 4.72 Mb/s on the uplink using 3 streams.
The equipment that was used was a 4.5 Mb/s ASCOM adapter. The distance between
the measuring points was about 70 metres.
3.4 MARKET DIFFERENCES BY REGIONS
3.4.1 Europe
Europe is the leading market for PLC deployments and technical expertise. Europe's
electrical grid consists largely of cells in which a single transformer supplies about 200
houses. This is a far better topology for PLC than that found in, for example, the United
States, where a typical cell is only 20 houses. In practice this means that, in the United
States, a utility company would have to deploy 10 times as many transformer head ends
to "pass" the same number of houses. Also, Europe's electricity wires are, in general,
better-shielded; this helps tackle radiation and noise problems. Broadband availability _
41
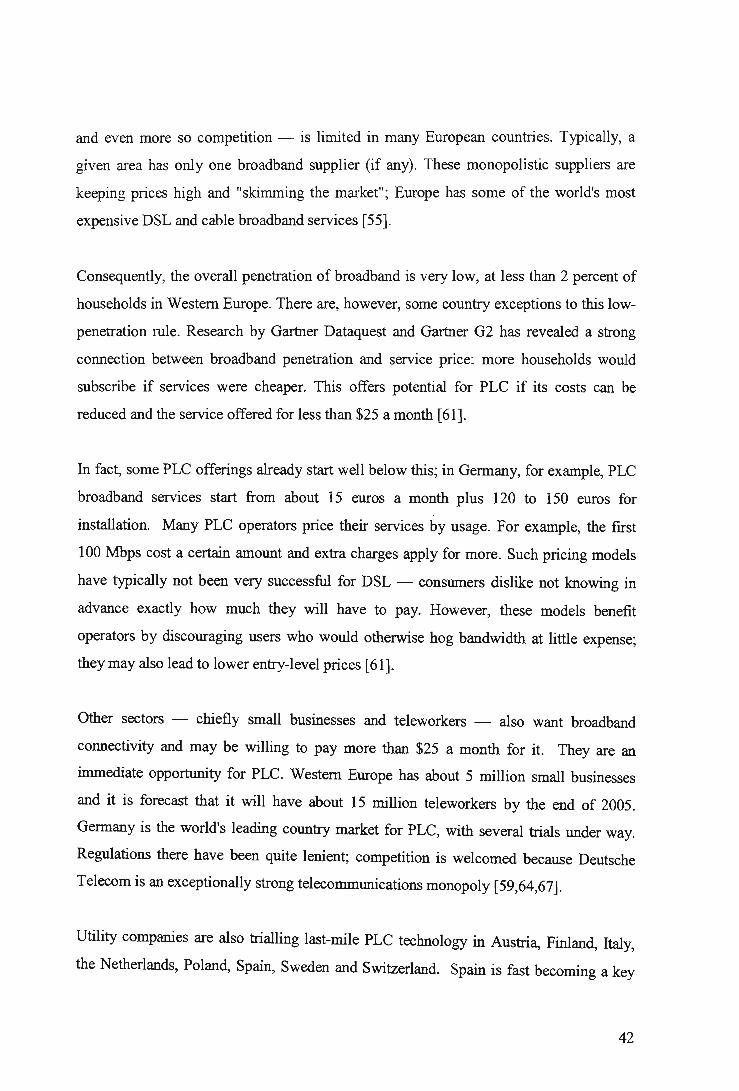
and even more so competition - is limited in many European countries. Typically, a
given area has only one broadband supplier (if any) . These monopolistic suppliers are
keeping prices high and "skimming the market"; Europe has some of the world's most
expensive DSL and cable broadband services [55].
Consequently, the overall penetration of broadband is very low, at less than 2 percent of
households in Western Europe. There are, however, some country exceptions to this low
penetration rule. Research by Gartner Dataquest and Gartner G2 has revealed a strong
connection between broadband penetration and service price: more households would
subscribe if services were cheaper. This offers potential for PLC if its costs can be
reduced and the service offered forless than $25 a month [61].
In fact, some PLC offerings already start well below this; in Germany, for example, PLC
broadband services start from about 15 euros a month plus 120 to 150 euros for
installation. Many PLC operators price their services by usage. For example, the first
100 Mbps cost a certain amount and extra charges apply for more. Such pricing models
have typically not been very successful for DSL - consumers dislike not mowing in
advance exactly how much they will have to pay. However, these models benefit
operators by discouraging users who would otherwise hog bandwidth at little expense;
they may also lead to lower entry-level prices [61].
Other sectors - chiefly small businesses and teleworkers - also want broadband
connectivity and may be willing to pay more than $25 a month for it. They are an
immediate opportunity for PLC. Western Europe has about 5 million small businesses
and it is forecast that it will have about 15 million teleworkers by the end of 2005.
Germany is the world's leading country market for PLC, with several trials under way.
Regulations there have been quite lenient; competition is welcomed because Deutsche
Telecom is an exceptionally strong telecommunications monopoly [59,64,67].
Utility companies are also trialling last-mile PLC technology in Austria, Finland, Italy,
the Netherlands, Poland, Spain, Sweden and Switzerland. Spain is fast becoming a key
42

market for PLC; the country's main utility companies, Endesa and Iberdrola, have been
very active in developing the technology. Endesa has also begun a 2,500-user medium
voltage trial in the city of Zaragoza; this foreshadows the technology's evolution path
[62].
3.4.2 North America
Difficulties abound for PLC in North America:
~ Broadband is much more available than in Europe and household penetration
is higher, at about 15 percent. Moreover, in areas where broadband is
available there are usually several suppliers to choose from.
~ Average end-user prices for broadband are lower than in Europe, and much
less than the price of current PLC offerings. The business case for PLC for
data-only use - the use that accounts for most of the mass market for
broadband - is harder to make than in Europe.
~ The topology of the power grid is more challenging for PLC in North America
than in Europe. Each transformer serves so few end users that higher
penetration is needed for a good return on investment.
North America would especially benefit from viable medium-voltage PLC solutions,
whereby the number of subscribers served can be extended beyond those connected to
single transformers. Many industry participants believe that such solutions are needed
before the U.S. PLC market can develop. Judging by the very small number of advance
trials in the United States, this is probably true. The region's poorer cable insulation
makes RF interference a · greater problem than in Europe. Because many PLC
deployments will require medium voltage solutions, worker safety is likely to be more of
an issue than in low-voltage markets [66].
However, North America also presents incentives to deploy PLC [60,61 , 64]:
43

~ Further DSL and cable deployment faces an uphill struggle. Cable and DSL
operators are limiting their new capital expenditure because of the difficult
economic conditions.
~ The political importance of raising broadband penetration is arguably higher
than ever. The FCC has said that one of its highest priorities is to get the
country broadband-enabled.
~ Many places lack broadband coverage, particularly smaller communities and
rural areas.
~ Following the deregulation of the electricity markets in many states,
electricity distributors face significant challenges in managing the demand for
electricity. They are finding that, when demand exceeds expectation, the cost
of buying electricity on the spot markets can be very high. PLC offers them
the possibility of monitoring demand much more closely, and so may be a
useful tool to increase the efficiency of electricity provisioning.
In short, offering PLC might improve the efficiency of their core business. Most PLC
equipment suppliers are investigating the North American market. They plan to be there
if and when the market takes off. Gartner Dataquest thinks it likely that this will not be
for at least another two years. In the long term, however, North America could account
for a significant part of the global PLC market.
3.4.3 AsiaiPacific And Japan
PLC penetration in AsialPacific and Japan is very low. Howev~, it has great potential
because major areas are not passed by copper lines. Japan only recently allowed data
communications over the power grid, but already there is interest in PLC. Indeed, some
of the chip vendors Gartner Dataquest interviewed said that Japan was showing the most
interest [64].
44
3.4.4 Latin America
Low penetration of telecommunications and generally favourable distribution
architectures for electricity make Latin America a market of significant promise for PLC.
Moreover, although cable, wireless local loop and DSL are being deployed in key
markets, the slowness of deployment and a lack of available lines have limited
consumers' choice of broadband access. This potentially "opens the door" for PLC.
Electricity utilities in Latin America have pursued opportunities in telecommunications,
but focused on selling capacity wholesale rather than on last-mile options. With PLC,
they may expand their activities to include access too.
Their established channels to the consumer may make them players to watch, both as
suppliers of access infrastructure to telecommunications companies and as
telecommunications competitors in their own right.
PLC trials have been under way since 2001 in Argentina, Brazil and Chile. Further trials
are likely in the following years as the availability of PLC equipment grows. However,
connectivity for head ends is very expensive and limited in most Latin American
countries. The areas where connectivity is most plentiful are those that have deployed
broadband alternatives such as DSL and cable. Despite its potential as a market for PLC,
conditions in Latin America for significant short-term PLC deployment are mixed at
present. Many countries- including Argentina, Colombia and Venezuela - are in
economic difficulty. Others may join them. In Brazil, however, utilities have been active
in the telecommunications space for years and may see opportunities to expand their role
in a market that is subject to deregulation [60, 61].
3.5 REGULATIONS AND APPLICATIONS
lPower line carrier communications hardware must operate within guidelines established
) by various statutory world standards bodies. A number of such regulatory authorities
45

exist. In essence, the common points between the different standards covering PLC
communications are [59]:
~ ...... Private-user communications must occur in the bandwidth 95-150 kHz.
~ Within this bandwidth, the section from 125-140 kHz is reserved for devices
that use unique addressing schemes. Such schemes avoid p~ssible interference
from neighbouring PLC devices. Outside of the "addressing band" devices are
not required to use addressing schemes and interference is possible.
~ PLC devices should operate at a maximum transmitted power of 500m W. This
limitation is for many reasons, some chiefly being so as to avoid possible
radio-frequency interference problems, and neighbouring device interference.
r The standards also specify such things as network protocols, equipment impedance and
methods for testing PLC devices for adherence to the regulations. Main applications of
power line communication (PLC) products include: Internet access, telephony and AMR
(automated meter readings). Further applications, such as home automation, home
security and video conferencing may also be implemented over the same infrastructure.
In the past, solutions like this for a homeowner or small business would have required
several skilled technicians to install. By utilizing the electrical wiring already available,
communication products allow for handling large amounts of data transmission at high
speeds with no disruption to the homeowner or small business [62]~ :J
~ inve_en! in power line technology will propel the power utility companies into the
broadband carrier market right next to AT&T, providing data, voice, and video
transmission. The electrical utility companies will be able to provide a direct route for
high-speed broadband communications directly to the home or office of their customers.
Their lines are already entering every house and office building. These same companies
have plenty of expertise in running and maintaining distribution cables and systems. The
architecture of an electrical power distribution system is ideal for data transmission in
that power is routed to the end users in a tree and branch type Syst~
46

Ir:ng distance sen<ice can be provided over the existing power transmission lines: by
\ ::egrating satellIte and the eXlstmg optical fibre cables that many commumcatlOns
companies already have in place, with the power grid. It is sure that by integration of
Power line, satellite and existing fibre optic line technologies the electrical companies
could challenge the local telephone companies in a few years and win. Telephone
technology is not efficient or fast. It is built around large expensive central switches.
Communication signals travel faster routed, than switched. Each piece of information
contains its own destination or address and is routed to its fmal destination. The
intelligence is in the data not in the system. The equipment to provide this intelligence is
distributed throughout the network rather than centralized [65].
Dedicated, multipurpose communication lines make the Power line model an attractive
option for the information age. Wide bandwidth and frequency division multiplexing
allow for multiple lines to a single household. Ideally, an entire family could utilize their
own communication devices simultaneously, whether telephone or PC, without
interrupting one another.
3.5.1 Power Line As An Antenna
The electrical power distribution network IS unlike other guided public
telecommunications networks. The communications characteristics of the network are
less controlled with large numbers of non-telecommunications devices being constantly
added and removed from the network. As this wiring is not shielded, radio frequency .
signals passing along it are in part, and unavoidably, radiated from it. One issue then is
whether these radiated signals might interfere with radio communications. The frequent
uncontrolled connection of appliances and other loads to this network means that, unlike
other wire based telecommunications networks; the electrical supply network does not
have well defined physical or electrical characteristics relevant to the data rates used [66].
The lack of isolation between private networks and public networks raises such questions
as interference to public networks, compatibility of systems and carrier licensing
47
requirements. The full extent of public telecommunications issues arising from
widespread use of broadband power line communications systems will need further
investigation.
3.5.2 Wby Was HF Used In PIc?
Broadband power line communications systems typically use a number of carrier
frequencies in parallel in order to spread the data over a wider range of frequencies. This
allows individual carriers to be turned on or off with less impact on the overall data rate
of the system. This makes the communications less vulnerable to nulls, or interference
form noise or other devices connected to the network [55].
Low data rate PLC systems utilised frequencies in the range 9 kHz and 525 kHz. In this
frequency range the risk of emissions is low as the attenuation of the cable is low and the
wavelengths used in the signalling are long with respect to the typical cable lengths in the
system. Broadband PLC systems use much higher data rates; these cannot be
accommodated in the bandwidth available below 525 kHz. Instead, these systems
typically use carrier frequencies in the range 2 - 30 MHz. The use of higher frequencies
leads to greater attenuation of the signals along the cable. The shorter wavelengths
associated with these frequencies are now more typical of cable lengths found in the
network and this increases the likelihood of nulls from open circuits occurring. These
effects rapidly increase with frequency, effectively limiting the use of frequencies higher
than the typical values indicated above. As well, the cables are becoming more effective
radiators of electromagnetic waves [55].
3.5.3 Radio Communications Issues
The main radio communications issue raised by the widespread use of broadband power
line communications systems is the risk of interference to radio communications services
caused by their generation of electromagnetic emissions from the power lines over which
they operate. Open wire aerial power lines in particular freely radiate high frequency
48

signals being passed along their length. There are many case histories within the records
of the Australian Communications Authority (ACA) and its predecessors of signals
radiated from power lines causing interference to radio communications services. The
high frequency signals in these case histories have been typically generated by faults in
the wired network such as arcing switch gear, coronal discharge and discharges across
dirty insulators [62].
Similar experiences across the world experience have led many to believe that the
deliberate placement of high frequency signals on power lines by broadband power line
communications systems will lead to large scale interference problems for radio
communications services particularly in the high frequency (HF) spectrum (3 to 30
MHz). Current radio communications make use of this spectrum include amateur radio,
aeronautical and maritime communications and navigation services, broadcasting, fixed
and land mobile operations [62].
3.5.4 Federal Communications Commission (FCC)
Power line communications systems have developed in the USA under Part 15 of the
FCC Rules and Regulations, which is equivalent to Australia's class licensing regime.
This part of the FCC Rules and Regulations relates to requirements for unlicensed low
power radio communications devices and emissions from non-radio communications
digital equipment that might otherwise cause electromagnetic interference (EMI) to radio
communications services
Power line communications systems are treated in Part 15 as non-radio communications
digital equipment. They are referred to in this Part as current carrier systems and specific
arrangements are in place for systems operating on frequencies in the band 9 kHz to 30
MHz. The FCC Rules and Regulations specify limits for both conducted and radiated
emissions for current carrier systems. Section 15.107 sets out the conducted emission
limits for all Part 15 devices connected to the AC power supply, including devices used
in current carrier systems. It appears that these requirements apply to the terminal devices
49

only.
The radiated emission limits for current carrier systems [15.107(c)(3)] [15.l09(e)] are the
general radiated emission limits for non-specified devices that radiate either intentionally
or unintentionally. The limits for conducted emissions set out in FCC Rules and
Regulations section 15.107 and the limits for radiated emissions set out in section 15.109
are reproduced in Appendix A. These limits are significantly higher (> 100 times) than
limits found in the regulation of other countries for these devices at HF frequencies.
The FCC in April 2003 [ET docket No.03-104] initiated an enquiry into current carrier
systems, including broadband-over-power line systems, to obtain information on a variety
of issues relating to these systems. The enquiry sought technical information and data to
allow an evaluation of the current state of the technology and to determine whether
changes to Part 15 are necessary to facilitate the deployment of this technology.
The closing date for comment was initially set as 7 July 2003 but was later extended to
20 August 2003 due to the large number of comments (filings) made. The period in
which responses to the filings can be made is expected to close in late September 2003.
The FCC initiated this enquiry as part of its statutory mandate to encourage new
technologies [66].
3.5.5 Europe
The use of broadband power line communications systems in Europe is in some ways ore
developed than in the USA. Last-mile systems are in use and growing in a number of
European countries including Finland, Iceland, and Russia. The basic legal framework
under which harmonised regulatory arrangements for these systems are being developed
is that established to meet the requirements of European Economic Community EMC
Directive 89/336/EEC.
50

3.5.5.1 European Conference Of Postal And Telecommunications Administrations
(CEPT)
The European Communications Committee (ECC) of CEPT has considered in ECC
Report 24 (May 2003) the compatibility between cable communications systems,
including power line communications systems, and radio services. This report includes
measurement results from PLT field trials held in Norway, Germany and Finland. The
report also considers the compatibility of three other high data rate cable communications
technologies including Digital Subscriber Line (DSL), cable TV and Local Area Network
systems.
The report finds in its general conclusions that the electromagnetic spectrum below 30
MHz needs special protection and that "the risk of interference to radio services depends
not only on compliance with a radiation limit but also on the different network structures
and technologies as well as the frequencies used. For example, owing to the type and
properties of cables installed, the structure of the network, the risk of interference caused
by high frequency power line systems is much higher than with DSL or cable TV
systems."
The report states that the European Commission has entrusted (Mandate 313) the
European Committee for Electrotechnical Standardisation (CENELEC) and European
Telecommunications Standards Institute (ETSI) with the task of developing a set of
harmonised standards covering the electromagnetic compatibility (EMC) requirements
for telecommunications networks using those using power lines, coaxial cables or
telephone wires [61].
3.5.5.2 European Telecommunications Standards Institute (ETSI)
The ETSI Technical Committee has already produced standards for reference network
architecture (TS 1010896) and coexistence (sharing) arrangements between in-house and
last-mile systems (TS 101867). Other standards in development cover detailed in-house
51

architecture and protocols. It should be noted that all of these standards are dealing with
telecommunications aspects and that none directly address potential interference issues
for radio communications systems.
The Technical Committee is working through CENELEC with the International
Electrotechnical Committee specialist body CISPR (the International Special Committee
on Radio Interference), on EMC issues related to power line systems. The CISPR
standard for information technology equipment conducted limits at mains terminals and
telecommunications ports (CISPR 22), together with its European counteIpart EN 55022,
are in the process of being updated to include changes clarifying their application to
power line systems [57].
Currently, several European countries have adopted their own requirements for power
line communications systems. These include: Germany, where limits for emissions from
all cable systems are set out in NB308; and the United Kingdom - covered by MPT 1570,
which has been recently updated. There is also a limit proposed by Norway. See
Appendix C for a comparison of these limits, as taken from ECC Report 24.
In summary, the European Communications Committee has identified a significant risk
of interference to HF radio communications services (BCC Report 24). Based on these
findings, Europe is currently developing a range of telecommunications and other
harmonised standards specifically covering broadband power line communications
systems. There is, however, a growing number of systems already being deployed in
Europe and surrounding countries to provide last-mile broadband services using devices
compliant with EN 55022.
3.5.6 International Electrotechnical Commission (lEC)
The IEC is the leading global organisation that prepares and publishes international
standards for all electrical, electronic and related technologies. Work related to
broadband power line communications systems is currently being undertaken by the IEC
52
International Special Committee on Radio Interference (CISPR).
3.5.7 International Special Committee On Radio Interference (CISPR)
CISPR has developed a range of EMC standards for electronic equipment that have been
widely adopted by regulatory authorities around the world, including Australia. CISPR
Standard 22 on the limits and measurements of emissions from information technology
equipment is currently in the process of being updated. The CISPR 22 work program
includes a project to provide clarification of the application of CISPR 22 to PLC
equipment (project number: CISPR 22 Amd.2 f9 Ed.3). This work was scheduled for
completion in August 2003; however, due to the level of debate regarding the impact on
radio communications services from power line systems the work is still incomplete [59,
62].
The debate is centred on the appropriateness of the conducted signal measurement
methods and limits in CISPR 22 which are intended to limit the amount of
radiofrequency energy finding its way from information technology equipment onto
mains power networks. The radiated signal limits and measurements methods would only
be applicable to the cases of power line communications terminal devices and radiation
from the case of these terminal devices does not present a significant interference risk
[62].
53

CHAPTER FOUR
CHARACTERISTICS AND IMPAIRMENTS OF POWER
LINE CHANNEL
4.1 OVERVIEW OF THE POWER LINE CHANNEL
Evaluation of any communication technology is only relevant in the context of the
operating environment. This seemingly obvious point, frequently bypassed in textbook
analysis, can not be overlooked in the field of power line communication. We begin by
examining the three common assumptions which must be modified in order to be
applicable to power line analysis. The majority of engineering texts rely heavily on the
principle of superposition. Umortunately, the conditions required for superposition to be
applicable (i.e. linearity and time invariance) are not met for the majority of power line
networks. One cause of non-linearity is when apacket's signal voltage adds to the AC
line voltage and causes power supply diodes to turn on and off at the packet carrier
frequency. A common example of time variance is when the impedance at a point of a
power line network varies with time as appliances on the network are alternately drawing
and then not drawing power from the network at twice the AC line frequency.
ost in the industry agree that useful data rates for consumer home networking start
around 1 M bits/second. At that data rate, the power line provides an inhospitable . ,
communications channel. With multiple outlets in every room though, the payback in
consumer convenience is obvious. The power line as a communications channel has
specific characteristics that must be considered. These include the dominant and widely
varying noise sources, impedance changes, and multipath effects [3]. Noise sources are
I
electronic, electro-mechanical, and even induced by the power lines themselves. Some i noise is harmonically related to the 50 or 60 Hz power. Light dimmers and related I products that use triacs create impulse noise on every cycle or half cycle of power. Some
power supplies, especially poorly designed switching supplies, conduct quite a bit of I
54

noise onto the power line. This noise may have high harmonic content related to the
switching frequency of the supply. One of the worst offenders is the brush motor with its
rotating spark-gap generators that create broadband noise. Intellon (a broadband
telecommunication company) has even noted cases where corroded junctions in the
building wiring have a semiconductor effect whose nonlinearity induces noise on every
power half cycle [23]. Even if every device were unplugged, there would still be noise
present, coupled onto the power line from outside RF sources.
These noise sources have both time domain and frequency domain characteristics. The
easiest way to get a flrst order understanding of Signal to Noise Ratio (SNR) on the
power line is to look at noise amplitude as a function of frequency, as shown in Figure
4.1. This plot shows the maximum noise level recorded for a particular test site as a
function of frequency. The maximum noise level is indicative of the amount of noise
energy the communications signal will be competing against at particular instances in
time, but not on a continuous basis. ~e average noise level is 20 to 30 dB less than this
maximum recorded value, which is more indicative of the potential for communicating
over this channel [23].
0.00
-10.00
:;--2'100 ~ 'B -3).00 - .\ I
1 -40.00 \. L.u. GI -6100 -l
GI 1'~ • l. J J It) .al00 15 .lIJl W.l It
. """ III I J Z -70.00 T .,.., lILA
. ~-~ "'" 11J1 ........ • • .11.. .moo .moo
0 .., 10 .., .... v CD co (\j 10 ,... 0 t") CD ~ .... ~ ,... CI (\j III CD 0 .... N co) -.i cD ,..; cD ai ,...: c-.. co) &ri t,D ,..; cO cj ..... N ..; &ri ui ,..; oj .... .... ............ ........ (\j (\j (\j (\j (\j (\j (\j (\j
Frequency (r.tiz)
Figure 4.1: Maximum Noise Level (Source: Intellon Corp [17])
55
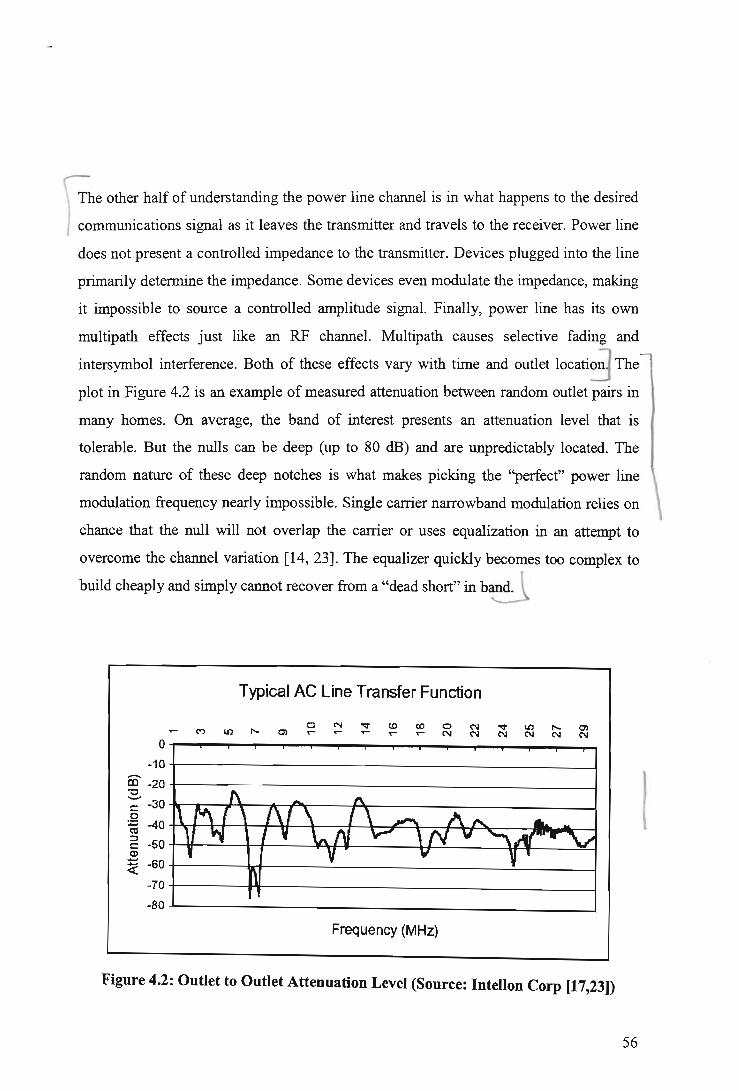
r;he other half of understanding the power line channel is in what happens to the desired
I communications signal as it leaves the transmitter and travels to the receiver. Power line
does not present a controlled impedance to the transmitter. Devices plugged into the line
primarily determine the impedance. Some devices even modulate the impedance, making
it impossible to source a controlled amplitude signal. Finally, power line has its own
multipath effects just like an RF channel. Multipath causes selective fading and
intersymbol interference. Both of these effects vary with time and outlet locati~ The
plot in Figure 4.2 is an example of measured attenuation between random outlet pairs in
many homes. On average, the band of interest presents an attenuation level that is
tolerable. But the nulls can be deep (up to 80 dB) and are unpredictably located. The
random nature of these deep notches is what makes picking the "perfect" power line
modulation frequency nearly impossible. Single carrier narrowband modulation relies on
chance that the null will not overlap the carrier or uses equalization in an attempt to
overcome the channel variation [14, 23]. The equalizer quickly becomes too complex to
build cheaply and simply cannot recover from a "dead short" in b~
Typical AC Line Transfer Function
o N .... ('oj ('oj
o.-~~--~~~--~~~--~~~--~~~--~
-10t-------------------------------------------~ co -20t-----~------------------------------------~ ~ c -301rir.~~r_~~~----~r_----------------------~ o ~ 40f\t-tt-1-i~~t_~~\,~~~~~~~~~~~ ~ .. 50 t-V----.:!:....-+t-~--lPt:HI--------...:~~-------J~I-------..!!£J 2 ~ -60t-------~~------~------------------~------~ -70t-----~~------------------------------~ -80~--------------------------------------~
Frequency (MHz)
Figure 4.2: Outlet to Outlet Attenuation Level (Source: Intellon Corp [17,23])
56
I

4.2 CHANNEL CHARACTERISTICS
Power lines constitute a rather hostile medium for data transmission. Varying impedance,
considerable noise, and high attenuation are the main issues. The channel mixes the nasty
behaviour of a power line with that of a communication channel. The transmission
environment for PLC seems much worse than that for mobile communications, so we
need to not only utilize existing advanced technologies, but also create novel ones.
Channel characteristics can be both time- and frequency-dependent, and also dependent
on the location of transmitter and receiver in the specific power line infrastructure.
Hence, the channel can in general be described as random time varying with a frequency
dependent signal-to-noise ratio (SNR) over the communication bandwidth. Generally, a
measured in-house (10 m) transfer function shows some deep narrowband notches spread
over the whole frequency range.
To understand the channel response and the impedance behaviour, Electronics
Workbench (EWB) and Matlab 6.1 programme were used to simulate the transmission
line. EWB includes a T-line model in which you set various per-unit-Iength parameters of
the line. The transmission line module included in Matlab 6.1 and Electronics Workbench
was set to have the parameters of common 12-gauge copper wiring, which were
calculated as in Table 4.1 :
Parameter Formula Variables Variable Value Parameter Value Inductance L - 41txlO 7ln(D1 r') D - distance between wires D=0.635 cm L=2.60 ¢lIm
r' = 0.7788 x radius of r' = 0.08 cm conductor
Capacitance C = 1tS I In(D/r) D - distance between wires D-0.635 cm C = 45.8 pF 1m r = radius of conductor r= 0.103 cm
Resistance R-p p - Resistance per unit p=5.21 mOl R=5.21 mQ/m length m
Table 4.1: Transmission line model (Source: Telkom SA)
57
The per-unit conductance of the line' s insulation was in the rnicrosiemen-per-meter range
and was therefore ignored.
4.2.1 Channel Impedance
Quite a few measurements in the frequency and time domains for high-bit-rate
transmission have been reported, converging essentially to some general conclusions.
Impedance is highly varying with frequency and ranges between a few ohms and a few
kilo-ohms with peaks at some frequencies where the network behaves like a parallel
resonant circuit. In most frequency ranges the impedance shows inductive or capacitive
behaviour around 90 n to 100 n. The net impedance is strongly influenced by the
network topology and connected loads, so we can say that the low voltage mains do not
have essentially characteristic impedance since loads being switched on and off randomly
introduce a change in impedance [3] .
Measurements in houses for frequencies of 5-30 MHz resulted in some general and
common conclusions for the absolute value IZI of the impedance:
~ The magnitude IZI increases with frequency in the range of 5-20 MHz.
~ It shows strong fluctuation between a maximum and a minimum value.
~ Its mean value increases from about 5 n at 20 kHz to about 120 n at 30 MHz
~ There are no big differences between the mean values of impedance presented
throughout the 30 kHz to 1 MHz spectrum range, whereas throughout 1-30 MHz
they are almost uniform
~ Mostly impedance values do not vary significantly from country to country.
~ Resonances can occur in residential networks, usually above 40 kHz. They make
the impedance at higher frequencies more unpredictable than that at the frequency
range of 5-20 kHz.
Of various loads, resistive heating loads cause the greatest residential impedance
changes for lower frequencies .
58

Carrying out impedance measurements outside buildings from 9 to 95 kHz, we find that
the residential power circuit has extremely low impedance in most cases. The impedance
varies with time and location. A maximum value that was measured was 4 n at 9 kHz at
the rural location, and a minimum value was 0.4 n at 40 kHz at the suburban location.
These low values are attributed to ''the large capacitor that is used for power factor
correction at 50 Hz that represents a short circuit in 9 to 95 kHz range reducing even
lower overall impedance values"
Characteristic indoor and outdoor records of attenuation have been reported in many
literatures. Measurements have been made at a voltage of 0.35 V rms on in-house lines,
resulting in about 15 dB attenuation, and on a 1 kIn cable feeding a cluster of houses,
resulting in 50 dB attenuation. In the range of frequency of 9-95 kHz the line losses
ranged between 40-100 dBlkm depending on the location where the attenuation was
measured. So far research has focused on LVEDNs (Low Voltage Electricity
Distribution Network), but some studies on medium voltage cables (1l-32kV) are still
being investigated. A large variety of cables exist differing in general structure, number
of cores, conductor material, and insulation used.
Another area of confusion anses from the common VIew that wmng capacitance
dominates signal propagation effects. This simplified view is rooted in assumptions
which do not accurately reflect power wiring environments. While it is true that wire
capacitance is dominant for cases where the termination or load impedance is much
greater than the characteristic impedance of the wire, power lines are frequently loaded
with impedances significantly below the characteristic impedance of the wire [53].
Common examples of loads which present a low network impedance at communication
frequencies include capacitors used within computers and television sets to meet
electromagnetic emission regulations and resistive heating elements found in cooking
ovens, space heaters and the like. The impedance of these devices is typically an order of
magnitude, or more, below the characteristic impedance of power wiring. This can be
seen quantitatively by comparing the entries in Table 4.2 and Table 4.3.
59

Wire Type lZo ohms Clm (PF) !LIm (uH)
!RIm (ohm)
@130kHz
IV (mlns)
12-2 BX metal clad 74.2 74.48 0.427 0.0433 0.181
12-2G Romex NM-B 143 34.12 0.702 p.0446 0.204
18-2 Lamp cord 124 ~3.31 0.666 p.0771 ~U86
18-3 IEC power cord 179.6 101.05 0.640 /0.1033 ~.124
Table 4.2: Power line wire characteristics (Echelon Corp [53])
Low impedance Load Impedance at 100 kHz
0.1 uF EMC capacitor 16 ohms
2 kW 240V AC Space Heater 30 ohms I Table 4.3: Low impedance power line loads (Echelon Corp [53])
While a full transmission line model, complete with high frequency models of each load,
is required to fully characterize power line attenuation, there is one simplification which
can be used as a first order approximation. For cases where wire runs are less than 118 of
a wavelength (approximately 250 meters at 100 kHz) and communication is confined to a
single power phase, the presence of low impedance loads causes wire inductance to
dominate [53]. In many instances a lumped model which includes only wire inductance
and low impedance loads closely approximates actual signal attenuation. Frequently the
only other effect which must be considered in order to match measured values is the loss
encountered when the communication signal must cross power phases. This loss,
typically in the range of 5 to 25dB, is influenced by a number of variables including
distribution transformer coupling, distribution wire cross-coupling, multi-phase load .
impedance and circuits which are explicitly installed to reduce this loss. Combining the
above effects we find that 96% of the time the attenuation within a single residence falls
60

in the range of 54dB near 100 kHz.
4.3 CHANNEL TRANSFER FUNCTION
Using the power distribution grid for communication purposes the transmission line is
appropriately described by a linear, dispersive, time-invariant system, at least for time
intervals which are very long compared to the duration of one Orthogonal Frequency
Division Multiplexing symbol (OFDM-symbol). Thus, the channel is characterized by a
channel transfer function H(f) and a subsequent additive noise term. Throughout this
chapter, H(f) constitutes the transfer function in the equivalent low-pass domain.
Due to the structure of typical power line networks with a lot of impedance
discontinuities a transmitted signal will be received as a number of distinctively delayed
and attenuated signals at the receiver side corresponding to reflections from those
discontinuities. Hence, a multi-path signal propagation model seems to be suitable to
describe the channel transfer characteristics. Neglecting the (slow) time-variance of the
channel, this was used for presenting a deterministic expression of H (f) depending on
some parameters [26, 27].
But in many situations, a stochastic model regarding the transfer function as a random
process H (ll, f), where II denotes the atomic event of the random experiment, is
desirable instead of one determined transfer function. Clearly, as the signal attenuation
and phase on the long term increase with the frequency f , H(ll,f) is a non-stationary
random process along the frequency axis. Sample functions of this process are illustrated
in Figure 4.3.
61

t I .----.. ~
I
'-" -;;=;: ....... .E; ::t: -Co
tiD 0
I
a IN
1----
Figure 4.3: Sample functions of the non-stationary random process H(T],/)
For a certain frequency I the random variable H(T],/) results from the supeIposition of
numerous independent random variables which represent the effects of mismatched lines
in power line networks. Therefore, the application of the central limit theorem is
motivated, which yields H(T], I) to be a complex non-stationary Gaussian process with
autocorrelation function (* denotes complex conjugate and G denotes expectation) [29].
(1)
and mean value
m(/) == £{H(T],/)} (2)
The second moment of the non-stationary process, i.e., the average power of the transfer
function, will be denote by
P(/) == ¢HH (1,/) = £{IH(T],lt} (3)
62
Generally, the average gain ~ P(f) and the frequency dependent average phase term
CPo (f) of the set of transfer functions can be assumed to be characteristic for different
types of power line networks and communication links over these networks. The average
power transfer function may be approximated by
P(f) oc Exp (-a· f) (4)
In many situations, where the attenuation parameter a corresponds to different network
types, the average phase term can be expressed by
(5)
where ci are normalization constants, and, for example, terms for hi =0 correspond to the
phase term due to the transformation into the low pass domain, terms for hi =0.5 describe
the skin-effect, and terms for hi = 1 give the phase term representing the average signal
delay. Hence, it is convenient to eliminate these average values and to define a
normalized random process
(6)
For simplicity, let the mean value of H(7],f)be constant overf. If additionally the
autocorrelation function (act) tP jjjj (f +!::.f, f) of this normalized process only depends
on the frequency difference4{, i.e·,tPjjjj(f +/If,f) == tPjjjj(4{), Vf E ~. H(T/,f) is well
modelled by a stationary Gaussian process.
63

t 1-- - ----
1 1
1 I I 1
1
1 I I I
- - - - -- - 1
o
I I I I 1
1
1
1 I I I
b.f • Figure 4.4: Example of the autocorrelation function
An exemplary acf t/>jjjj (11/) for this normalized stationary process is depicted in Figure
4.4. Within the coherence bandwidth Be which is defined by
(7)
the transfer function does not change significantly.
4.4 CHANNEL NOISE
Communication signals at low frequency are propagated along the low voltage power line
through conducted emission with very little energy radiated from the line causing
interference to other communication services. Different noise sources, motors, radio
signals, and power supplies result in a noise curve very much dependent on location and
64

time. Generally, charmel noise varies strongly with frequency, load, time of day, and
geographical location.
The noise spectrum in the frequency range up to 145 kHz consists of four types of noise:
~ Coloured background noise, which is the summation of low power sources like
universal motors. Its power spectral density is frequency-dependent and decreases
for increasing frequencies.
~ Periodic impulse noise (synchronous and asynchronous to the power frequency)
stemming from appliances that produce harmonies of 50 or 100 Hz.
~ Narrowband noise consisting of sinusoidal signals with modulated amplitudes
(radio stations, the horizontal retrace frequency for television, etc.).
~ Asynchronous impulsive noise (noise bursts of switching operations).
The noise power level ranges according to the distance between the noise source and
receiver, and in most cases was found to be below -40 dB (W/kHz). Significant noise
sources are universal motors to frequencies up to 50 kHz. It is worth mentioning that,
since noises as well as wanted signals are subject to attenuation, noise sources close to
the receiver will have the greatest effect on the received noise structure, particularly when
the network attenuation is large [53].
If attenuation were the only impairment, then receiver gain could simply compensate for
this signal loss. Both the noise and distortion characteristics of the power line must also
be considered before we have a picture of the operating enviro~ent which is adequate
for use in technology comparison.
Many electrical devices which are connected to the power mains inject significant noise
back onto network. The characteristic of the noise from these devices varies widely_
Examination of the noise from a wide range of devices leads to the observation that the
noise can also be classified the following categories:
65
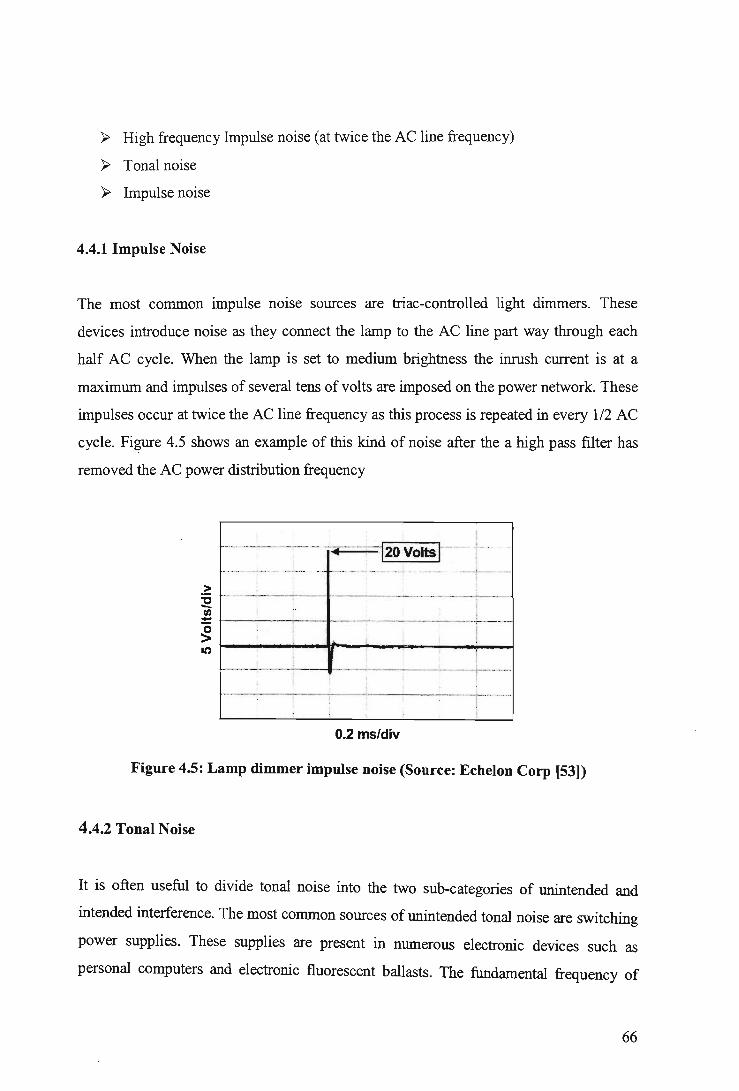
~ High frequency Impulse noise (at twice the AC line frequency)
~ Tonal noise
~ Impulse noise
4.4.1 Impulse Noise
The most common impulse noise sources are triac-controlled light dimmers. These
devices introduce noise as they connect the lamp to the AC line part way through each
half AC cycle. When the lamp is set to medium brightness the inrush current is at a
maximum and impulses of several tens of volts are imposed on the power network. These
impulses occur at twice the AC line frequency as this process is repeated in every 112 AC
cycle. Figure 4.5 shows an example of this kind of noise after the a high pass filter has
removed the AC power distribution frequency
..........
> ~ - ••••••• _ _ • _ _ ... __ ¥~ •• ¥ ••••••• _._ •• _ -·_· ____ "" · ___ • ___ • _ ______ •• __ •••• _ •. _, •• _w. ___ .....-_.
!i f------i--- __ ... __ ._ .... __ .. _. ___ . ______ ~ ___ _
>0 i ~
~~------~r--~~~--~l ~ .-.-.- ---'--- 1---... -.-...... ----.--.... --..... --... -.-.-..... -.-... -.. ... -....... -+----.--.. /
... --'- -'""7'----.---, .. -.. -.-........ .-1------ ---.---.. - ... -... -.-.-_
0.2 ms/div
Figure 4.5: Lamp dimmer impulse noise (Source: Echelon Corp [53))
4.4.2 Tonal Noise
It is often useful to divide tonal noise into the two sub-categories of unintended and
intended interference. The most common sources of unintended tonal noise are switching
power supplies. These supplies are present in numerous electronic devices such as
personal computers and electronic fluorescent ballasts. The fundamental frequency of
66

these supplies may be anywhere in the range from 20 kHz to > 1 MHz. The noise that
these devices inject back onto the power mains is typically rich in harmonics of the
switching frequency [53]. Noise from the charging stand of an electronic toothbrush is
shown in the plot of Figure 4.6. Note the similarity between the switching supply noise
and an ideal sawtooth waveform.
>
~ ('oj
ci
l&Mtching pawersupplywavebm
Time (8 usldiv)
·10
..21)
.3)
. ~~ 'tl
-60-G>
. . -8) ~
·10
.8)
~----~--------------~.8) o ~ U U ~ ~ ~ ~ ~ ~ 1
Frequenc.y (MHz)
Figure 4.6: Noise from an electronic toothbrush charging stand (Source: Echelon
Corp [53])
Intentional tonal noise can result from devices such as power line intercoms and baby
monitors. In the United States and Japan these devices generally operate at frequencies
between 150 kHz to 400 kHz; injecting signals of several volts peak to peak onto the
power line. A second source of intentional tonal noise results from pickup of commercial
radio broadcasts. Power wiring acts an antenna to pick up signals from these multi
thousand watt transmitters. Interference on the order of a volt peak-to-peak at frequencies
just above the communication band is not uncommon. Note that this interference has very
specific implications for the filtering requirements of any power line transceiver
3.4.3 High Frequency Impulse Noise
High frequency impulse noise finds its source in a variety of series-wound AC motors.
This type of motor is found in devices such as vacuum cleaners, electric shavers and
67

many common kitchen appliances. Commutator arcmg from these motors produces
impulses at repetition rates in the several kilohertz range.
I ;. 0.8
0.7
> 0.6 ~
0.5 > E Power line 0 0.4 I/)
1 ms/div o
Figure 4.7: Vacuum cleaner noise and amplitude distribution for common
impairments (Source: Echelon Corp [53])
Figure 4.7 is an oscilloscope plot of noise from a household vacuum cleaner on the left
and on the right amplitude distribution plots of three common types of impainnents. An
ideal Gaussian distribution fitted to the vacuum distribution is also shown.
68

0
-10
-20
~ -30
-40 "'0 -Gi ·50 > at
..J -60
-70
-80
-90
i
+--'-. - , t----: ---:----~-----; '" i ! ! i
0
!' t' - ! . -;-----t----- -+----. -;....--: ; 1- i II I-Bandwidth = 10 kHz k--
~btlo+:--+--+! --r-H--t:= , I
0.1 0.2 0.3 0.4 0.5 0.6 0.7 0.8 0.9 1 Frequency (MHz)
Figure 4.8: Vacuum cleaner noise spectrum (Source: Intellon Corp [17,23])
Figure 4.8 is a frequency domain view of the noise from the same vacuum cleaner
showing the wide band spectrum on the left and a close up of the part of the spectrum
typically used for power line communications on the right. Note that, of the various
categories of power line noise, this motor noise is the only type which bears even a
remote resemblance to white Gaussian noise commonly used to analyze many
communication systems.
As mentioned earlier a complete analysis of power line characteristics must include an
analysis of the distortion characteristics of the channel. Various reactive loads and wire
characteristics combine to create a channel with highly distorted (and time varying)
frequency response. Figure 4.9 illustrates this point showing the magnitude and phase
characteristics between two points of a sample power line network.
69

0 90
·10 45
·20 0
·30 -45 .. iD • ~ -40 ·90 ! ~
!II
·50 ' I • ::I , : - ·135 ~ ~
ii. -60 • E ·180 :
oC .c ·70 ·225 G-
·80 ·270
·90 ·315
·100 ·360 10 100 1000
Frequency (kHz)
Figure 4.9: Example of power line frequency distortion (Source: Cogency [9,22])
Having reviewed the characteristics of the power line, we are now in the position to
compare various communication technologies within the context of their true operating
environment. This will be covered in the next chapter.
70

CHAPTER FIVE
OFDM AS A MODULATION SCHEME FOR POWER LINE
COMMUNICATION
5.1 COMMUNICATION TECHNOLOGIES
We will begin by examining the three technologies in the order of historical significance.
Many early power line communication devices used narrow band transmission combined
with a phase-locked-loop type receiver. Three variations of narrow band transmission are I
illustrated in Figure 5.1. For clarity these figures do not include wave shaping which is
typically applied to remove abrupt transitions.
sine 'Wave
sine wave
Frequency Modulator
Phase Modulator
Amplitude Modulator
Frequency Shift Keying (FSK)
Phase Shift Keying (PSK)
Amplitude Shift Keying (ASK)
~VVVV~\r '··· .. ~.... I
Figure 5.1: Methods of narrow band modulation
71
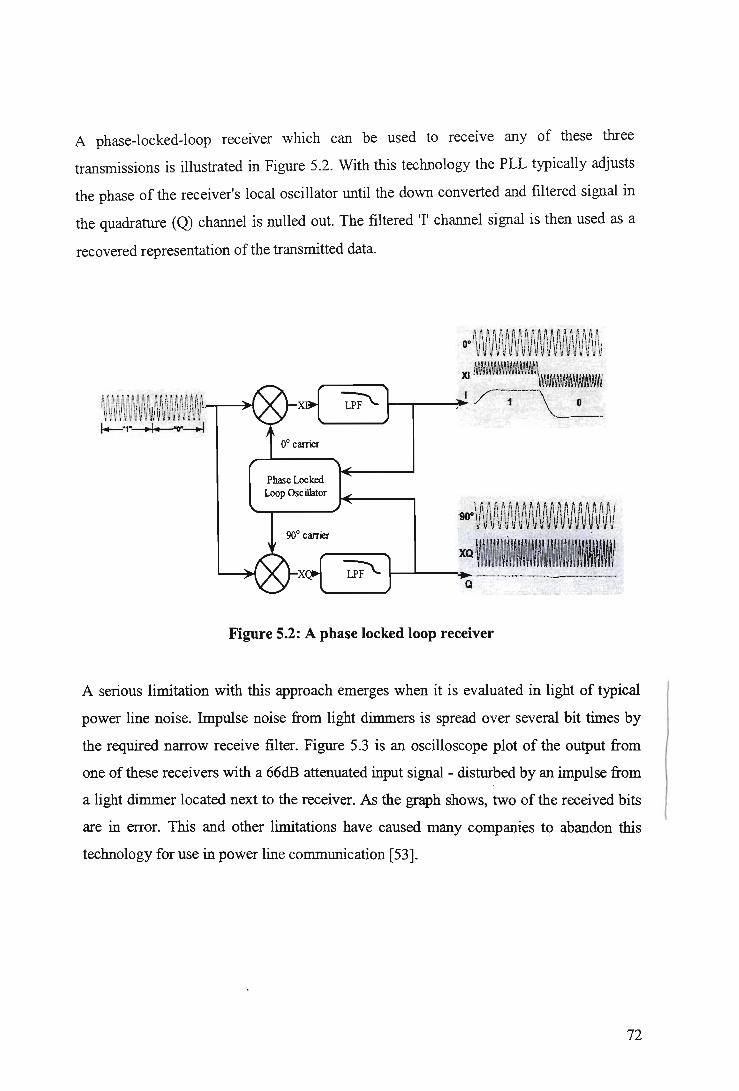
A phase-locked-loop receIver which can be used to receIve any of these three
transmissions is illustrated in Figure 5.2. With this technology the PLL typically adjusts
the phase of the receiver's local oscillator until the down converted and filtered signal in
the quadrature (Q) channel is nulled out. The filtered 'I' channel signal is then used as a
recovered representation of the transmitted data.
Phase Locked Loop Oscillator
90° carrier
Figure 5.2: A phase locked loop receiver
A serious limitation with this approach emerges when it is evaluated in light of typical
power line noise. Impulse noise from light dimmers is spread over several bit times by
the required narrow receive filter. Figure 5.3 is an oscilloscope plot of the output from
one of these receivers with a 66dB attenuated input signal - disturbed by an impulse from
a light dimmer located next to the receiver. As the graph shows, two of the received bits
are in error. This and other limitations have caused many companies to abandon this
technology for use in power line communication [53].
72

• .• 011 OOnOO00f)()1 .. ~ .
. . . 500lJSIdiv
Figure 5.3: Error in PLL recovered signal due to impulse noise (Source: Spectrum [3,72))
5.2 MULTICARRIER MODULATION
Orthogonal Frequency Division Multiplexing is a spectrum efficient modulation
technique that enables wireless transmission at very high data rates. Data rates in excess
of 100 Million bits per second (Mbps) are possible. Enhanced OFDM is a multiple carrier
system with characteristics that make it adaptable to environments with harsh multi-path
reflections, large narrowband interference, and impulse noise without equalization.
Equalization becomes very complex and expensive, if not impossible, for data rates
above 10 Mbps with single carrier modulation. The problems caused by multi-path
reflections increase with distance and data rate. The decision to select OFDM was
largely due to OFDM's ability to mitigate multi-path reflections while making efficient
use of the available spectrum.
OFDM modulation is essentially the simultaneous transmission of a large number of
narrow band carriers, sometimes called sub carriers, each modulated with a low data rate,
but the sum total yielding a very high data rate. The history of OFDM dates back to 1966,
when R. W. Chang published his paper on the synthesis of band-limited orthogonal
signals for multichannel transmission (Bell System Technical Journal). A major
contribution to OFDM was later presented in 1971 by S. B. Weinstein and P. M. Ebert,
who used the discrete Fourier transform (DFT) to perform baseband modulation and
73

demodulation. They also added a guard space between OFDM symbols to combat
intersymbol interference (lSI) caused by multi-path reflections. In 1980, A. Peled and A.
Ruiz introduced the cyclic prefix in the guard space to solve a final problem with
maintaining orthogonality, a lack of which causes interchannel interference (lCI). With
today's technology, the DFT processor and other circuitry required to implement OFDM,
can be built in a very low cost CMOS IC. Very high-speed, low cost consumer
transceivers can now be a reality [17].
5.2.1 Theory Of Operation
The basic idea of OFDM is to divide the available spectrum into many narrowband, low
data rate carriers (or sub carriers). To obtain high spectral efficiency the frequency
response of the sub carriers are overlapping and orthogonal, hence the name OFDM.
Each narrowband sub carrier can be modulated using various modulation formats where
BPSK, QPSK and QAM (or the differential equivalents) are commonly used.
Since the modulation rate on each sub carrier is very low, each sub carrier experiences
flat fading in a multi-path environment and is easy to equalize. The need for equalization
can be eliminated by using differential QPSK (DQPSK) modulation where the data is
encoded as the difference in phase between the present and previous symbol in time on
the same sub carrier (see Figure 5.4). Differential modulation improves performance in
environments where rapid changes in phase are possible.
74

dP,
Time )
Figure 5.4: Differential phase encoding across symbols (Source: Intellon Corp
[17,23]).
Enhanced OFDM can be implemented equally well, with coherent (non-differential)
modulation and demodulation to maximize the signal to noise ratio of the system, while
achieving the greatest possible range [14, 17,23]. Such a system is illustrated in Figure
5.5. This approach is preferred for performance oriented systems, like point to multi
point licensed radios, where the highest bit rate per Hertz is most important.
D Subcarriers
1 2 3 4 5
Frequency Domain B bits per subcarrier per symbol
QPSK, B= 2 bits 16-QAM, B= 4 bits 64-QAM, B= 6 bits
D
Figure 5.5: OFDM using coherent modulation on sub carriers (Source: Intellon
Corp [17,23]).
75
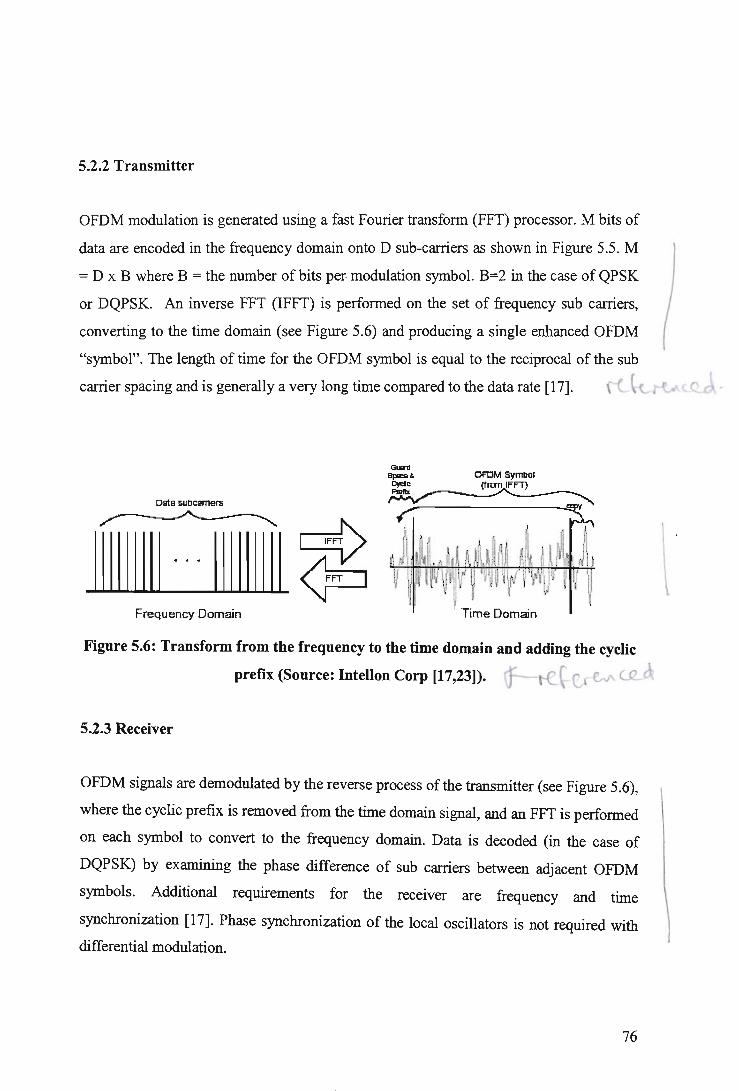
5.2.2 Transmitter
OFDM modulation is generated using a fast Fourier transform (FFT) processor. M bits of
data are encoded in the frequency domain onto D sub-carriers as shown in Figure 5.5. M
= D x B where B = the number of bits per. modulation symbol. B=2 in the case of QPSK
or DQPSK. An inverse FFT (IFFT) is performed on the set of frequency sub carriers,
converting to the time domain (see Figure 5.6) and producing a single enhanced OFDM
"symbol". The length oftime for the OFDM symbol is equal to the reciprocal of the sub
carrier spacing and is generally a very long time compared to the data rate [17]. ,l ~ tv..<.~·
Data 5ullcarT1ers
111111111 111111111 ~ Frequency Domain
OFDMsymbol (frcm IFFT)
"'-----"" '----
Figure 5.6: Transform from the frequency to the time domain and adding the cyclic
prefIX (Source: Intellon Corp [17,23]). If--~~e~ CQ...a
5.2.3 Receiver
OFDM signals are demodulated by the reverse process of the transmitter (see Figure 5.6),
where the cyclic prefix is removed from the time domain signal, and an FFT is performed
on each symbol to convert to the frequency domain. Data is decoded (in the case of
DQPSK) by examining the phase difference of sub carriers between adjacent OFDM
symbols. Additional requirements for the receiver are frequency and time
synchronization [17]. Phase synchronization of the local oscillators is not required with
differential modulation.
76
\ .
t
5.2.4 Multi-Path
A cyclic prefix is added to the enhanced OFDM symbol to maintain complete
orthogonality in a time-dispersive channel (caused by multi-path reflections). This prefix
copies the last part of the symbol and adds the copy to the beginning of the symbol (see
Figure 5.6). The long enhanced OFDM symbol time, generally many microseconds,
combined with the cyclic prefix, which is usually a small percentage of the enhanced
OFDM symbol time, are key factors that enable performance in a time-dispersive
channel.
Conventional modulation suffers from interference caused by time-delayed reflections of
the original signal overlapping successive symbols, or lSI. Consider the transmission of
conventional QPSK symbols at a rate of 1 MHz (yielding 2 Mbps) in a time-dispersive
channel with reflections delayed as much as 1 microsecond [23]. These reflections of 1
microsecond occur in indoor environments with several hundred feet of range. In this
example, the symbol time is 1/(1 MHz) = 1 microsecond. When multiple copies of the
original signal are delayed up to 1 microsecond in arriving at the receiver, the symbol
being decoded (likely to be the signal from the most direct path) is interfered with, and
corrupted by, the delayed signals.
These delayed signals contain the previous symbol transmitted 1 us earlier. This
distortion can be corrected with equalization, but becomes much more difficult when the
symbol rate is increased to 10 MHz. For example; potentially all 10 preceding symbols
interfere with the symbol currently being decoded. With OFDM, many hundreds of bits
(see above: D x B) are transmitted for each symbol making the duration of the symbol
many microseconds long [14,17].
Selecting a cyclic prefix of 1 microsecond for the example above, all received copies of
the original signal would contain the same enhanced OFDM symbol (except shifted in
time) and there would be no lSI. For long distance transmissions, such as the DVB
77
standard where the distance may be 50 miles or more, the time-dispersion is many
microseconds longer. In this case, the enhanced OFDM symbol time is specified to be
hundreds of microseconds and the cyclic prefix many microseconds, in order to combat
interference from reflections. Due to the properties of OFDM, the stochastic process
along the frequency axis is transformed into an equivalent discrete-time process, which
models a fading channel.
5.3 APPLICATION OF OFDM TO POWER LINES
Core of the OFDM-system is the conversion of the convolution of the transmit signal an-;l
the channel impulse response into a component-wise multiplication of samples of th~~ l Fourier transforms. For transformation of linear convolution into cyclic convolution, each
block of D channel symbols is preceded by the Do last symbols of the same block at the
transmitter and at the receiver only D symbols out of D + Do received symbols is taken.
Do is commonly referred to as guard interval [18, 25]. If the guard interval is at least as
long as the (discrete-time) channel impulse response, OFDM partitions the dispersive
channel into D independent AWGN-sub channels (sub carriers). The sub channel
transfer factors Av are samples of the channel transfer function H (/) :
Av = H(fl./· v), v = O,I, .... ,D-1. (8)
where !if denotes the OFDM-sub carrier spacing. Generally, the signal-to-noise ratios
in these sub channels differ significantly. Clearly, if the sub channel SNR is known at the
transmitter side the transmit power and information rate can be appropriately assigned
(loaded) to each sub channel. In power line communication schemes channel state
information usually is not available at the transmitter, especially for the point-to
multipoint transmission situations. Thus, loading is not further considered [30, 31].
Without loading, equal power and equal information rate have to be assigned to the
OFDM-sub carriers. If the signal processing is performed independently in each sub
78

channel, only a subset of sub carners would allow reliable communication. An
advantageous alternative is to employ channel coding across the sub carriers [32]. In this
case, in the decoding the reliably received symbols from a sub channel with relatively
high SNR are used to restore the unreliable symbols from a sub channel with relatively
low SNR.
5.3.1 Fading Channel Model
First, we regard the transmission of only one OFDM- symbol. The signalling along the
discrete frequency axis in OFDM is equivalent to transmission over a frequency non
selective (flat) discrete-''time'' fading channel. Describing this fading channel in the
equivalent low-pass domain, the complex valued channel state is related to the sub
carrier transfer factors and the channel transfer function, respectively, by ( k e Z :
discrete-''time'' index)
s[ k ] = Ak = H (t! . k) , k = O,1, ... ,D-1 (9)
Let x[ k] and y[ k] denote the fading channel input and output signal, respectively, the
input-output-relation reads
y[ k] = s[ k] . ej9'c • x[ k] + n[ k] (10)
where rp c is the carrier phase offset between transmitter and receiver, which can be
assumed to be constant over at least one OFDM-symbol, and n[k] represents the AWGN
with variance (J"~ = No . D· 4f where No is a one sided noise power spectral density.
Applying the stochastic power line channel model discussed in the previous chapter, the
fading gain g[ k ] == Is[ k]1 has for a fixed ''time'' k , or equivalently for a fixed sub carrier
number v, a Ricean distribution with the probability density function (pdf) (Io (-) is the
modified Bessel function of order zero)
79
where
and
2 P(l1f ·v) (Y =
v K +1 v
K = __ m_2~(I1.::...if--:-· v~) __ v P(l1f ·v)-m2 (l1f .v)
(11)
(12)
(13)
are the usual parameters of a Ricean pdf. It is also interesting to consider the normalized
channel state
(14)
which corresponds to samples of the normalized transfer function from Equation (6). The
normalized fading gain g[k] == 1S'[kj is Ricean distributed with parameters (j2 and K
independent of the sub carrier number v thus, the power line fading channel model for
OFDM transmission is here constructed by using the well-known Ricean flat fading
channel model and multiplying each channel gain g[ k] with the corresponding amplitude
term ~P(l1f ·k) . Usually, adjacent OFDM-sub carriers are located within the coherence
bandwidth Be. Hence, the fading channel is slowly time-varying and the channel state
can be expected to be constant over at least two consecutive symbols. For transmission
over a series of OFDM-symbols, we defme the discrete-"time" stochastic process
80

s[ (, k], k E Z, as stochastic model for the fading channel, where ( denotes the atomic
event of the corresponding random experiment. Each sample function s[ (, k] corresponds
to one exemplary power line channel. Now, the long term time variance of the power
line channel has to be taken into consideration, too. As a proven model to describe this
time variance has not been established yet, one reasonable choice is that one realization
of s[(,k]contains random variables of one sample function H(T/,f) for fixed frequency
values f = I),.f . v, v = 0,1,2, ... , D -1 . However, since we are interested in results which
are valid for an average of power line transmission scenarios, it is more convenient to
identify a sample function of s[(,k] with a concatenation of many realizations of the
discrete-frequency stochastic process H(T/, I),.f . v), v = k mod D. In this case, one fading
channel realization represents an ensemble average over power line channel realizations.
0.9 • • I • • • •
0..&
t 0.7
........ {_ .. \1... ... -.. ~ ....... .).-... -.j.-....... l .. -... ) ......... L ..... . (! ~ R~ylei~ pdf ~ ~ ~ i .. _.. r--"-; '; ··-T···_··T-··-·r·····T·_··-[·_·····-r······
p.. o.B Cl
l 0..5
: : : : : : : : ... - .... ~.-...... -": ..... - .. ~ .. ........... -:-.-.-.. -~ .. --..... -... ~ .. --.-~.-.. .. .. -.":-- .. -... . ~ : ! ~ ~! !
... - ..... ~.---.. -~ ... --. - .. ~- .. ....... - . -~.----.- .. ~ .. -... -... -~- .. --.-}.-- .. -... ~ .. -- ....... . 11 l:: ., D.4
fi CI OoJ
"G ...
~ ; 1 ; ; ~ . . .. -..... ~.--.. -~. --- .. · ~ .. ··--.. ·--r·--·--~---· ...... · .. r···--·-~ ··-·· .... · ~---· ·--· ·
; !!;! ... .. .. ·-t ·_-_··_{·_··_·· ... ----.-~.---.--{ ... -.---.-~ .. --.-~.-.. --.{-... . -- ..
~ i i ! ~ . i . 0.2 : : : : : . : .
--'-;'--"-r-"-";-" ""---r--"··_";-"--·--·-r'·-"·-f'-··"-'1-··-·· 0.1
00
: ! : : : ! ! ·· __ ·-t·--··-i·_···_··t····_· .i·-· · -·i·-······~ ··-·-t·-··- ·j-· · ··· · ·
: :: :!:: 0.5 1..5 35 4 4.5
Figure 5.7: Histogram of the normalized channel transfer function I H (I),.f . v) I for
1 < (I),.f· v)/ MHz < 4 (solid line) and Rayleigh pdf (dashed line)
Figure 5.7 shows the histogram of I H(l),.f ·v) I for 1 < (I),.f ·v)/ MHz < 4 (solid line)"
assuming that the average power transfer function P(f) is well approximated by equation
81

(4), where the attenuation parameter a is fitted to the sample transfer functions. The sub
carrier spacing !J..f is chosen appropriately small so that a sufficient number of samples
of H(f) occur in the histogram. Clearly, the fluctuations of the curve are due to the
relatively small available data base. For a comparison the Rayleigh pdf, which is the
special case of the Ricean pdf with Ricean parameter K equal to zero, is plotted in Figure
5.7 (dashed line). As it can be seen, the pdf given by the stochastic model satisfactorily
matches the histogram based on measurements.
5.4 CHANNEL CAPACITY
Having established a fading channel model for power line communications using OFDM,
we are now in the position to calculate channel capacities as figure of merit to compare
different transmission schemes. It should be noted that the capacities are expressed as
ensemble averages. Thus, the capacities represent averages of achievable rates over an
ensemble of power line channel realizations and they are not the achievable rates for all
special channel realizations. Subsequently, we will distinguish the cases where
information on the channel state and the carrier phase are and are not available at the
receIver.
5.4.1 Coherent Transmission
The fading channel model introduced earlier in this chapter is applied and channel state
information (CSI) is supposed to be available at the receiver side, i.e., the channel gain
and phase are known. In this case, at least from the information theoretical point of view,
the dependency between consecutive channel states, i.e., the channel memory is of no
importance. But usually, in order to make standard coding techniques applicable,
interleaving at the transmitter and deinterleaving at the receiver are performed leading to
virtually memoryless channel between x and y. As full CSI is also passed through the
deinterleaver, capacity is not affected by such an interleaving technique, of course. The
corresponding system model for coherent transmission is sketched in Figure 5.8.
82

y x ..... ~ , ,
...... Interleaver ..... Channel Deinterleaver , , ...... .""" , ,
s,rPc
Figure 5.8: System model for coherent transmission (Source: Cogency [9,22])
The channel is described by the conditioned pdf py (Ylx, s, tp J. Since coherent reception
is asswned and since the noise is rotationally invariant, the phase of s[ k ] . ej'Pc is
irrelevant and it is sufficient to consider p y (ylx, g). Clearly, py (ylx, g) is the well
known two-dimensional Gaussian pdf with mean g[ k ] . x[ k] [18]. The calculation of the
channel capacity requires the optimization of all free parameters. As we are interested in
the limits for given PSK and QAM signal constellations with uniformly, independently,
and identically distributed signal points, i.e., constellation and a-priori probabilities are
regarded as part of the channel, no optimization on these parameters has to be performed.
For coherent reception and perfect channel state information, the capacityCcsI' measured
in bit per symbol, equals the average mutual information [35].
C _ & {Py(Y1X,g)} CSI - y,X,G py(Ylg) (15)
where py (Ylg) is the average pdf of the channel output given the channel state. For
averaging over the channel state the pdf
(16)
83

with P G (glv) from (11) is used.
5.4.2 Noncoherent Transmission
In many communications scenarios reliable estimation of the channel state and carrier
phase is not practicable. For such applications the use of differential encoding at the
transmitter and noncoherent reception at the receiver are convenient. Figure 5.9 shows
the system model for noncoherent transmission. By differential encoding the information
is conveyed in the transitions of the channel input symbols x. The current transmitted
symbol x[k] is determined by an interleaved version of the data carrying (differential)
symbol a[k] and the previous transmitted symbol x [k-l].
Bin. Ch. Encoder fI .. Differential x ... I - Mapper - - encoder Data
Channel
Bin. _11 [-1 y - Decoder - Grouping -Data
Figure 5.9: System model for noncoherent transmission (Source: Cogency [9,22])
84

I I I I I I I I I y[k] r I • • • • • • • • • •
) 1. r I • I • I 2. r • I • I 3. r • I
r: reference symbol of the • I vector symbol representing
N - 1 differential symbols 4. r • I • I
Figure 5.10: Grouping ofthe received sequence y[k] into overlapping vectors y of
length N = 3 and deinterleaving (Source: Cogency [9,22])
For high bandwidth efficiency this differential encoding is perfonned in both phase and
amplitude, which is known as differential amplitude and phase shift keying (DAPSK).
Suitable signal constellations are a A P PSK for the symbols x, which consist of
M = a . P points arranged in a distinct concentric rings with different radii Pi ,
i = 0,1,2, ... , a -1, and p uniformly spaced phases <Pm' m = 0,1,2, ... , P -1, so-called
"star- constellations" [37]. As usual, the differential symbols a are taken from the same
signal set as the transmitted signal. Let irk] and m[k], k eZ, denote the sequences of
radius and phase indices of the corresponding sequence x[k] of channel symbols, i.e.,
x[ k] = pi[k]ej(l1"[k]. Additionally, the radius and phase indices of the differential symbols
ark] are written by j[k] and n[k], i.e., ark] = Pj[k]ej'Pn[k). Then, differential encoding is
perfonned by
x[k] = P ej(l1(m[k-IJ+n[k Dmod.6
(i[k-l]+ j[k]) mod a (17)
85

In conventional differential detection the discrete channel output sequence y[ k] is
partitioned into overlapping vectors y of two consecutive symbols at the receiver. If the
coherence bandwidth of the channel is at least N>2 symbols the receiver favourably
operates on blocks y of N>2 consecutive symbols, overlapping each other by one symbol,
see Figure 5.10 (where N=3) . This multiple symbol differential detection provides
further gains [38, 39]. From the observation of one received vector y, decision variables
on the differential vector a of N-l data symbols a are obtained. Thereby, y corresponds to
the vector x containing N transmitted symbols x, where the first entry acts as reference
symbol r of the differential encoder. In order to apply standard coding techniques for
memoryless channels, it is convenient to ignore the statistical dependencies between the
blocks y. This is generated by applying (asymptotically ideal) interleaving based on
. vector symbols a and y, respectively, which generates a virtually memoryless channel
between a and y . Figure 5.10 illustrates overlapping, grouping, and deinterleaving for
N=3.
Although the current channel gains g[k] are assumed to be unknown to the receiver, it is
reasonable to exploit the well-known average channel parameters cr; and Kv introduced
in (12) and (13), respectively, for each OFDM-sub carrierv = 0,1,2, ... ,D -1. Here, each
vector symbol a and y, respectively, corresponds to N sub carriers. Since a verified model
of the acf of the channel gain has not been found yet, we employ the usual assumption
that the channel gain is almost constant over at least N sub carriers. Thus, the memoryless
channel is represented by the pdf py(yja, v) , where the dependency on cr; and Kv is
expressed by conditioning on one sub carrier number v of the N consecutive sub carriers.
In order to determine py (yla, v) the fading channel input-output-relation (10) is extended
to vector symbols
y[l] = s[l]· ej'Pc • x[l] + n[l] (18)
86

where s[l] is nearly equal for all components of x[l] , n[l] denotes independent AWGN
with variance (T~ = Nofj.jD per complex component, and 1=[k(N-1)] E Z denotes the
discrete-"time" index corresponding to vector symbols. Replacing a by x and one
reference symbol r according to (17), py (ylx, v) can be expressed by py (yla, r, v). This
pdf includes inversion of the differential encoding. Averaging this pdf over all possible
reference symbols r [mally yields the desired pdf py (yla, v). Now, the capacity of the
memoryless vector channel, normalized to bit per scalar symbol, is calculated by
C(N) =_1_.~ ~&Y'A{IOg2 Py(Y1a,v)} N-l Dv=o py(Ylv)
(19)
It should be noted that no optimization of the distribution of a can be performed.
Regardless the distribution of a the differentially encoded symbols x will be uniformly
distributed. Therefore, we had already restricted the differential symbols a to be uniform,
independently, and identically distributed, which maximizes the throughput of the
channel.
87

CHAPTER SIX
PERFORMANCE EVALUATION OF POWER LINE
COMMUNICATION SYSTEM
6.1 NUMERICAL RESULTS
In this chapter, capacities over the average signal-tcr-noise ratio E) No (Es: average
receive energy per symbol) are evaluated by numerical integration. The results are
independent of the number D of OFDM-sub carriers and the sub carrier spacing !:::..f as
long as N·!:::..f« Be holds. For the following numerical results we suppose the channel
gains g[k] corresponding to sub carriers v=k mod D to be Rayleigh distributed, which is
the most important special case of the Ricean fading model. The average power transfer
function P(f) with exponential decay in f , i.e.,
CT; = P(!:::..f ·v) oc exp(-a·!:::..f ·v) (20)
The attenuation parameter a is set to 10.7 11Hz and 10-6 11Hz, respectively, typical for
some classes of power line channels. Furthermore, the transmission bandwidth BT
assumed to be limited to 2 MHz and 3 MHz, respectively, which are reasonable values
regarding restrictions imposed on power line communications by regulator authorities
[40]. It should be noted that the capacity in bit per channel versus Es/No depends on the
transmission bandwidth because, via the average power transfer function P( f), the
channel fading properties depend on BT• Although the channel parameters are only
exemplary chosen, the subsequently drawn consequences apply in general.
88

6.1.1 Coherent Transmission
Coherent transmission with perfect channel state information and usual 4PSK, 8PSK,
16QAM, 32QAM, and 64QAM providing spectral efficiencies up to 6 bit/slHz is
considered.
6~---------.-----r----'-----.-----~~-'----~
--- AWGN - fading i 5 f----,----t-
4
l$QAM
3 --8PSK
4PSK -fIl t.,)
U
-------- . - ~ --. ---. -. . - . - - - . - - ~ - - - - - - ..•• - f - - - . - •. - •. - f - - - • - •. - • - - f - - - • - .• - - - - f - - - - - - - - - -. . · . . . . · . . . . I , • I • · . . . . , . , . . I • I , •
f • , , • · . . . . · . . . . · . . . . OL-----~----~----~----~------~----~----~----~ -10 -5 0 5 10 15 20 25 30
10Iog1O(Es/No) [dB] -+
Figure 6.1: Capacities CCSI (coherent reception) for 4PSK, 8PSK, 16QAM, 32QAM,
64QAM. Solid lines: Fading channel of OFDM over power lines with parameters a = 10-7
11Hz and BT = 3 MHz. Dashed lines: A WGN channel.
Figure 6.1 presents the capacity curves for 10-7 11Hz and BT =3 MHz. As reference, the
respective capacities of the A WGN channel are shown. As expected, for a fixed
information rate, the fading channel of OFDM transmission over power lines requires a
considerably higher SNR than the A WGN channel. Furthermore, it is interesting to
89
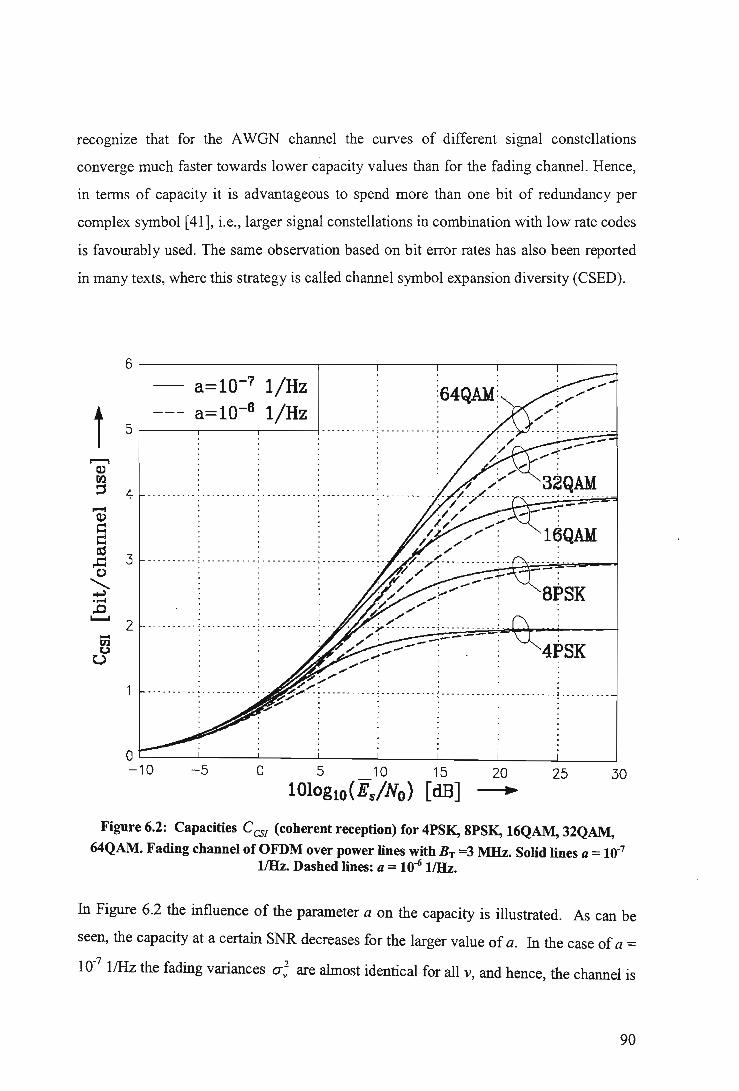
recogrnze that for the A WON channel the curves of different signal constellations
converge much faster towards lower capacity values than for the fading channel. Hence,
in terms of capacity it is advantageous to spend more than one bit of redundancy per
complex symbol [41], i.e., larger signal constellations in combination with low rate codes
is favourably used. The same observation based on bit error rates has also been reported
in many texts, where this strategy is called channel symbol expansion diversity (CSED).
6r-------------------.-----.------.------.-----,,----~
a=10-7 11Hz
1 a=10-6 11Hz 5 f------r----..----i
16QAM
4PSK
O~--~----~----~-----L ____ _L ____ _L ____ -L ____ ~
-10 -5 0 5 10 15 20 25 30 10Iog10(Es/No) [dB] ----.
Figure 6.2: Capacities CCSJ (coherent reception) for 4PSK, 8PSK, 16QAM, 32QAM,
64QAM. Fading channel of OFDM over power lines with BT =3 MHz. Solid lines a = 10.7
11Hz. Dashed lines: a = 10.6 11Hz.
In Figure 6.2 the influence of the parameter a on the capacity is illustrated. As can be
seen, the capacity at a certain SNR decreases for the larger value of a. In the case of a =
10.7
11Hz the fading variances a; are almost identical for all v, and hence, the channel is
90

essentially Rayleigh fading ( P G (g) in (17) is the Rayleigh pdf), whereas for a = 10-6 11Hz
the variances vary strongly over the sub channel number, and thus, the channel gain
fluctuates more heavily. Regarding the capacity curves of different constellations the
concept of CSED is expected to provide higher gains for increasing a. Concerning the
capacity over the average SNR, using a larger transmission bandwidth is equivalent to
increasing the value of a. Figure 6.3 shows the capacity curves for BT = 2 MHz and BT =
3 MHz.
6r-----------------.-.-----~----_,------~----~----~
Br=3MHz
t Sr=2MHz 5 I-------r-----.----'
4PSK
. . --: .. ........ . .... . : ................... ~ ... .. ..... .. - .... . : . ... .. .... .. . .... .. : ... -----.... -· . . . . · , . . . · , . . . • , I • •
• , I • , · . . . . · . . . . · . . . . · . . . . ~1~O~--~5~--~----~----~----~----L---~L---~
- 0 5 10 15 20 25 30 101o~ho(Es/No) [dB] ..
Figure 6.3: Capacities CCS1 (coherent reception) for 4PSK, 8PSK, 16QAM, 32QAM,
64QAM. Fading channel of OFDM over power lines with a = lO-61/Hz. Solid lines: BT = 3 MHz. Dashed lines: BT = 2 MHz.
91

For a bandwidth of 3 MHz the channel gain experiences a stronger fading which leads to
a performance loss compared to the case of BT = 2 MHz. Therefore, as long as
exp(-a . f) does not deviate negligibly from one, relatively large signal constellations
should be applied for power line transmission over a wide spectral range. Although the
capacity in bit per channel decreases for increasing transmission bandwidth BT due to
more severe fading, transmission capacity measured in bit per second increases with
increasing BT because of a higher possible number of channel uses per second.
6.1.2 N oncoherent Transmission
Differentially encoded transmission and differential detection is regarded without channel
state information. The rings of the D a A f3 PSK constellations are geometrically spaced
with the ratios PI/PO = 2 for a = 2 and Pi+l/ Pi = 1.4 for i = 0,1,2 for a = 4, which
were found to be advantageous for fading channels [42, 43]. Note, optimally the ring
ratios have to be optimized for each SNR.
92

t
..-t\2 II
Z -t)
6~---------------,-----,----'-----'-----'---~
a=10-7 11Hz a=10-6 11Hz
5 1------,-----,---1 ......... . .. . ......... ; ........... ; .... .. .. · ·;·7 ······ ·
D2A16PSK I'~
4
, , , 2 ------- --- !_.-- --_ ... -!---- -- _._._! --- --.... _. -
, , , , , , · . , · , . , , . · . . , . , , . . · . . · . . · . . -... --~ _ .. . ----.. --: --- . - --_. ---: ---. -. . -----: . ---_ . . ---· . . . · . . . · . , , · . . .
, • , I · . . . · . , , · . . . I • • • · . . .
O~~~~ __ J_ ____ ~---L----~--~~--~~~ -10 -5 0 5 10 15 20 25 30
101og10(Es/No) [dB] ..
Figure 6.4: Capacities CCSI (conventional differential reception) for D4PSK, D8PSK,
D2A8PSK, D2A16PSK, D4A16PSK. Solid lines: Fading channel of OFDM over power lines with parameters a = 10-7 11Hz and BT = 3 MHz. Dashed lines: a = 10-6 11Hz
Figure 6.4 comprises the capacity curves of various D a A P PSK constellations, which
offer spectral efficiencies up to 6 bit/slHz, and noncoherent detection with N = 2. The
parameters of the power line channel are a = 10-7 11Hz and a = 10-6 11Hz, respectively,
and BT = 3 MHz. Since the ring ratios are fixed, the capacity curves for DAPSK and
DPSK intersect. Consequently, CSED is not expected to provide gains for relatively low
target rates, e.g., 2 bit/channel use for a = 10-7 11Hz. However, if high spectral
efficiencies are desired, gains can be achieved by spending more than one bit of
redundancy per symbol. Moreover, for increasing a the positive effect of CSED
intensifies. Similar to the case of coherent transmission, the capacity loss due to fading
strongly depends on the parameter a (For clarity, the respective capacity curves of the
A WGN channel are omitted in Figure 6.4.).
93
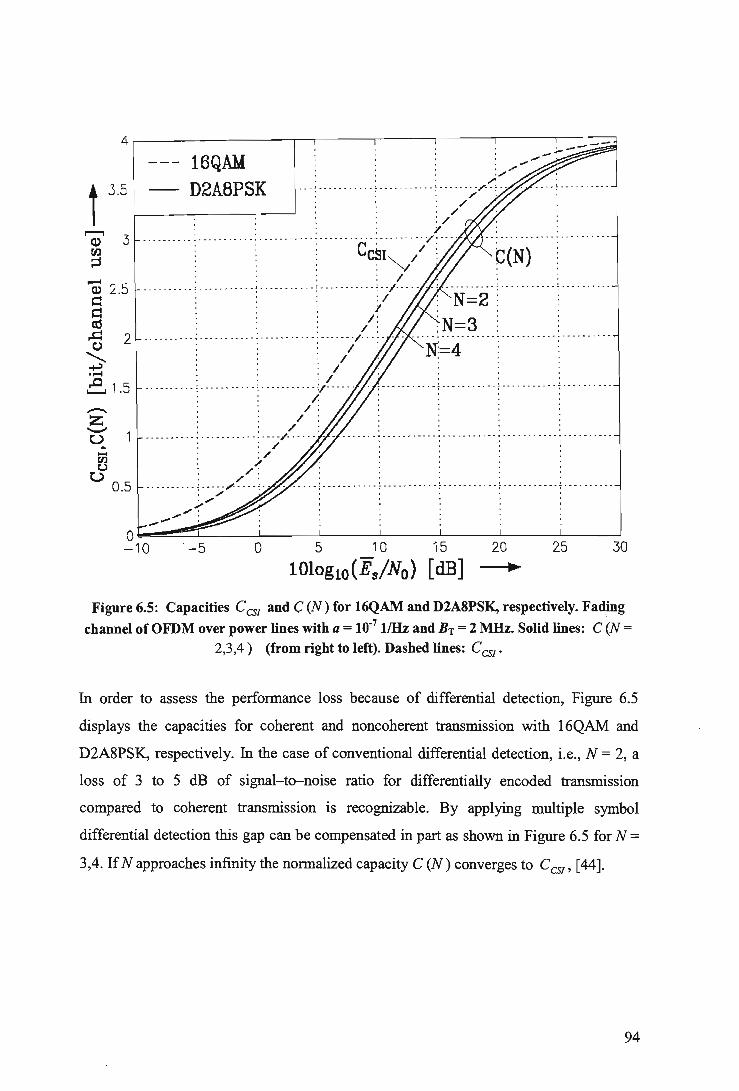
4~-------------,-r-----r----'-----~----'-~_~-~ , --..-16QAM : /"'''''' .
' / . . . ".
t 3.5 f-__ D_2A_B_P_S-:--K---, "':" .... ..... : ...... .... . : ... . ;/' .. : .. : : : /
· ,.' / : :: .t
3 ..... .... . : .. ...... .. . : ........... : ...... .... . : .. . ..... . / .... .
~ ~ : CcilI'y/ :
Q) 2.5
= I=l ct5
,.t:I 2 o ~ ..... e1.5 -
· . . , • • I I
P(N) . . . ..... .. : ...... .. ... : . .. ........ ; ...... . . . . . \ .. /(. ... .. ! . . ... .... . ; .. . ....... . ; .... .. . .. .
~ ~ . / : N=2 : : : : . / : 'N-3 : · . : I : : - : : . . . . . . . . . . : ... .. .. .... : . .. ......... . . . .... / ..... .. ....... . ... . . ... . . .... . . . .. . . .. . .... . .. . : : : I : ~-4 ' , : : : / :-: : : I . : : : / : ·· .. .... ·· ,·· ··· · .. ···,· .... ······v· .... · . : ... ... .. ... ; ...... ..... ; ....... .... ; ......... .
I . . . . / : : : : :
/ : : : : : / . , • • I
1 .. .... .. .. ~ .. ...... ... ~ . . ;/ ..... . .. ........ ~ .. .. ....... ~ .. ....... .. ~ .. ...... . .. ~ ... .. . ... . Z -... t) - : ,-~/ . : : ~ :
, ,- , . . . . .... ... ... , . . . .. / . . .. ,. . ... .. , ......... . . ; .. .... . .. .. ; .. . ..... . .. ; ... ... . .. .. ; ......... . . ;' ., . . .
~ t) 0.5
;.." : ::: : / . .....
~.,..., : :: : :: O~~~~ __ J-__ ~L-__ -L ____ ~ __ ~ ____ ~ __ ~
-10 . -5 0 5 10 15 20 25 30
101og10(Es/No) [dB] --+-
Figure 6.5: Capacities CCSI and C (N) for 16QAM and D2A8PSK, respectively. Fa~ng
channel of OFDM over power lines with a = 10.7 11Hz and BT = 2 MHz. Solid lines: C (N = 2,3,4) (from right to left). Dashed lines: CCSI'
In order to assess the performance loss because of differential detection, Figure 6.5
displays the capacities for coherent and noncoherent transmission with 16QAM and
D2A8PSK, respectively. In the case of conventional differential detection, i.e., N = 2, a
loss of 3 to 5 dB of signal-to-noise ratio for differentially encoded transmission
compared to coherent transmission is recognizable. By applying multiple symbol
differential detection this gap can be compensated in part as shown in Figure 6.5 for N =
3,4. If N approaches infinity the normalized capacity C (N) converges to CCSI> [44].
94

6.2. SIMULATION RESULTS
In order to further assess the capabilities of power line communications, different
transmission scenarios have been simulated. In particular, 8PSK and 16QAM
transmission with coherent reception and perfect channel state information at the receiver
and 8PSK differentially encoded transmission (D8PSK) with (conventional) differential
detection for N = 2 over the power line fading channel are considered. Again, the
Rayleigh fading model for the sub channel transfer factors with variances according to
equation (20) is used. The attenuation parameters are chosen a = 10-6 11Hz and a = 10-7
11Hz, respectively, and transmission bandwidth is BT = 3 MHz.
As this is a coded modulation scheme we apply bit-interleaved coded modulation
(BIeM) [45, 46] in combination with Gray labelling of the signal points. BICM is a
suboptimum but simple scheme applying only one binary code. For several applications it
has been shown [46] that based on Gray labelling BICM suffers only a marginal capacity
loss compared to optimum coded modulation via multilevel coding (MLC) with
multistage decoding (MSD) [48]. Parallel concatenated convolutional codes (Turbo
codes) [52] perform close to the capacity limit and are thus used as codes. We employ
Turbo codes with 16 state constituent codes and random interleavers. Rate is adjusted by
symmetric puncturing of parity symbols [49]. In the decoding 6 iterations are executed.
The code lengths are chosen in that way that the code symbols of one code word are
mapped to 1000 channel symbols. As the use of D ~ 1000 sub carriers is practical
regarding the bandwidth of 3 MHz, coding can be done separately for each OFDM
symbol. If bit-interleaving is also restricted to one OFDM-symbol, the transmission
delay is limited to 1000 channel symbols. However, in order to obtain results that are not
affected by the special choice of the autocorrelation function ¢jjff (/) for which a proved
model does not exist, ideal symbol interleaving is simulated by generating the sub
channel transfer factors Av, v = 0,1,2, ... ,D-I, independently of each other. If the ·
coherence bandwidth of the power line channel is negligible compared to the interleaving
95
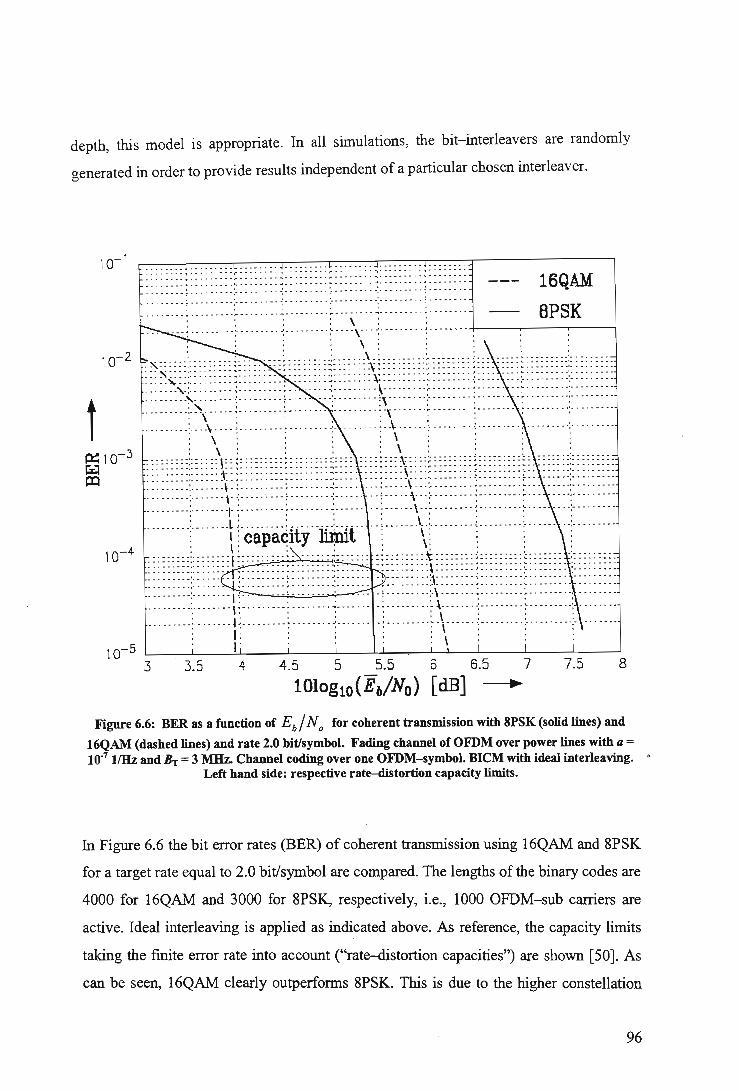
depth, this model is appropriate. In all simulations, the bit-interleavers are randomly
generated in order to provide results independent of a particular chosen interleaver.
16QAM . ... -. --~ . - . . -. -.. :--- . - .. - . -: -- . --. -.. :. ---- . - . --:. ------.. ~ . ----- . -
BPSK
t
Figure 6.6: BER as a function of Eb/ No for coherent transmission with 8PSK(solid lines) and
16QAM (dashed lines) and rate 2.0 bit/symbol. Fading channel of OFDM over power lines with a = 10-7 11Hz and BT = 3 MHz. Channel coding over one OFDM-symbol. BICM with ideal interleaving. •
Left hand side: respective rate--distortion capacity limits.
In Figure 6.6 the bit error rates (BER) of coherent transmission using 16QAM and 8PSK
for a target rate equal to 2.0 bit/symbol are compared. The lengths of the binary codes are
4000 for 16QAM and 3000 for 8PSK, respectively, i.e., 1000 OFDM-sub carriers are
active. Ideal interleaving is applied as indicated above. As reference, the capacity limits
taking the finite error rate into account ("rate-distortion capacities") are shown [50]. As
can be seen, 16QAM clearly outperforms 8PSK. This is due to the higher constellation
96

expansion diversity when 16QAM with code rate 112 is applied to achieve the desired
target rate of 2.0 bit/symbol. The gap of about 1.5 dB between the curves simulated for
8PSK and 16QAM matches the result predicted by the capacity analysis, which is
illustrated by the rate-distortion capacities. For BER's around 10-4 the gap between the
required signal-to-noise ratios and the capacity limits is about 2 dB.
a=10-7 11Hz : ::::: : : ~ ~ : : : :: : : =:: : :: : :: :: ; : : . : : : : : :~:: : : : : :: ~:: : : : : :: a=10-6 11Hz ........ ~ ......... : ... .. .... ~ ....... -: ......... ~ ....... .
~OC::::::---'--'::""'-~-----!T--~ """""""'" ...........•........ ~ ........ ~ ....... .
t
: : : : : : : : ::: : : : : : : I 1: : : : : : : : : [ : : : : : : : : J: : : : :: ::: : : : : : \: : ~ : : : : : : : : ) : : : : : : : : : ~ : : : : : : : : :~: : : : : : : : : : I: capaCity limits : \\: : : : . \. , . , . . . .
: ~ ~ ~ ~ ~ ~ j ~ ~ ~ ~ ~ ~ : I ! ~ ~ ~ ~ ~ ~ ~ ~ ~ ~ ~ ; : ; ; ~ ; ~ ~ ~ ~ ~ ~ ~ ~ ~ : : ~ ~ ~ ~ ~ ~ ~ ~ ~ 1 ~ ~ ~ ~ ~ ~ ~ ~ j ~ ~ ~ ~ ~ ~ ~ ~ t ~ ~ ~ ~ ~ ~ ~ ~:~ ~ ~ ~ ~ ~ ~ : .~. ~ ~.[. ~ •• ~ J j ~ ••••••• :.~ •• ~.: r::· •• : : ••••••• ~ •• ~ ••. r ••••••• ~ ••• ~ ~ •• ·.i· •.. ~ •••
: I : : : : : \ . : : ; 10-5~---L' --~I~' ____ ~. ____ ~. __ ~~. ____ ~.~ __ ~. ____ ~. ____ ~. __ ~
3 3.5 4 4.5 5 5.5 6 6.5 7 7.5 8
10Iog10{E"INo) [dB] -...
Figure 6.7: BER as a function of Eb/ No for coherent transmission with 16QAM and rate 2.0
bit/symbol. Fading channel of OFDM over power lines with BT = 3 MHz and a = 10-6 11Hz (solid lines) and a = 10·7 11Hz (dashed lines), respectively. Channel coding over one OFDM-symbol. BICM
with ideal interleaving. Left hand side: respective rate-distortion capacity limits.
Coherent transmission with 16QAM over power line channels with different attenuation
parameters a is regarded in Figure 6.7. Clearly, the stronger fading due to a larger value
of a leads to a performance loss. In particular, the power efficiency decreases by about
97

1.7 dB when a increases from 10-7 11Hz to 10-6 11Hz. Again, the simulation results are in
great accordance with the rate-distortion capacities. As mentioned in Chapter 5, the
channel memory does not play any role for the capacity of the coherent transmission
scheme. But if the channel coherence bandwidth is relatively large and interleaving is
done within one OFDM-symbol, a decoding error is caused with high probability when
deep fades occur, which leads to an increased average error rate. In order to study these
effects in more detail, we use a simple model for the normalized stationary Gaussian
process fi(T/, f), i.e., a Gaussian acf
tPijjj (f) = exp( -;ref / B c)2) (21)
The simulation results for different values of the coherence bandwidth Be are depicted in
Figure 6.8 (a = 10-7 11Hz, BT = 3 MHz). Again, randomly generated bit-interleavers are
applied. The curves show that the channel memory cannot completely be eliminated by
the bit-interleaving within one OFDM-symbol, i.e., for a larger Be the bit error rate
deteriorates. For the coherence bandwidths comprising 5 and 11 OFDM-sub channels,
respectively, the losses in power efficiency are about 0.2 dB and 0.6 dB, respectively, for
BER~ 104. Although the interleaving depth of 1000 channel symbols is still relatively
large when compared to the coherence bandwidth of e.g. 11 channel symbols, this effect
occurs because of the high sensitivity of the Turbo code to statistical dependencies within
the received symbol sequence.
98

t
- - ----- -,- . - - ------: ------ --- ~ ----- - - - -: ---- .. - - - ~ . ----- . --.. -----~ . ----. ---: -- - . -. --- ~ ----. -.. -:. -. -.. -. - ~ ---. --..
, : : : : --- -----:- . - ------: -- - - - . --. ~ ---- - ... -:- --- . -- . - ~ - -----. -. , . . . • , • , I
, , . , ,
Bc=o·/:::.f Bc=5'~f Bc=11·/lf
: ~ ~ ~ ~ ~ ~ ~ ~:~ ~ ~ ~ ~ ~ ~ ~ ~ : ~ ~ : ~ ~ ~ ~ ~ ~ ~?<~.~ ~ ~ ~ ~ ~ ~ ~ ~ ~ ~ ~ ~ ~ ~ ~ ~ ~ ~ ~ ~ g ~ ~ ~ ~ ~ ~ : ~ 1 ~ ~ ~ ~ ~ ~ ~ ~ g ~ ~ ~ : ~ : ~ ~ H ~ ~ ~ ~ ~ ~ ~ :
::'+:::f~<J::~<,,~T:I:T:::
•• 1' •••• '[" •••• ·:;. ::':1 .,1,'. ".'. 8~'m, •• :. "m'~·~ml •••• •• , I:.' •• :1" 1,. ·.1 • . ... . . .. . : .. .. ..... : ......... : ... .. ... : ........ :~ .... ... ; . .. ..... ~; ...... · ·c··· .. · · .. ; ...... . . . · . . . . \. . . , . , ......... : ......... j' ........ i··' ...... :. . . . . .. : ... \~ .. ~ ....... ·1·· :., .< < .... .. .. : ...... .. .
1 f ll·l nl i·: :::::':::l i[:!·: l\~\\\ ::: ill: :m\~.\:::: ------.. -:- ---.. ---~ ------ - --~ -------- .:. ------_. : ----- -. -:- . --\ -_. -; ----. -. --:- -- . .. .. --:- ---- .. - . · , . . . , , , , · . . , , . . , ,
10-5 L-__ ~'~~~'~~~'~~~'~ __ ~' __ ~~'~~~'~~~' ~~~' ~~ 5 5.2 5.4 5.6 5.8 6 6.2 6.4 6.6 6.8 7
10Iog10 (Eb/No) [dB] •
Figure 6.8: BER as a function of Eb/ No for coherent transmission with 16QAM and rate 2.0
bit/symbol. Fading channel of OFDM over power lines with a = 10.7 11Hz and BT = 3 MHz.
Autocorrelation function ¢ fiii (f) according to (21). Coherence bandwidth: Be = 0 Hz (solid line), Be
= 5· tJ.j (dashed line), Be = 11· tJ.f (dash-dotted line). BICM (channel coding and random
interleaving) over one OFDM- symbol.
Finally, coherent transmission with channel state infonnation and differentially encoded
transmission without channel state infonnation using the 8PSK signal constellation are
compared. Here, ideal interleaving is simulated, and for D8PSK the channel is assumed
to be constant over two consecutive symbols. The target rate of 1.5 bit/symbol is chosen.
In Figure 6.9 the simulation results are plotted.
99

:~~i-~J-~t~~ ~~U-~~J~:/ }:2H ::::'\ ! // . : : : ', : : \ :
t : ::1::? :1::?:}::::::::: r :T!::' :::H I Y:
. . BPSK ' . l ' . \
: : : : : : : : : : : ~ : : : : : : : : : : : ~ : . : : : : : : : : : ~ : : : : : : : : : : : ; : :: ::::: :: ;::::: ~ : : : : : ; : : : : : : : : : : : ; : : : : : ~: : : : :
~ : ::~:: : :: : :::::: :: :: : :I ~ : : ::~::~:~l: ::: :::::::i:::~:::::::i::::: I ::::~'::: : :~:::::'::::::\ :: : : : : : : : I : : . . . , . , . 10-5 L-____ ~ ____ ~L-__ ~ ____ ~ __ ~~ __ ~~~ ____ ~ __ ~
1 2 345 6 7 8 9 10Iog10 (E f/No) [dB]
Figure 6.9: BER as a function of Eb/ No for 8PSK (solid lines) and D8PSK transmission
and differential detection with N = 2 (dashed lines) and rate 1.5 bit/symbol. Fading channel of OFDM over power lines with a = 10.7 11Hz and BT = 3 MHz. Channel coding over one OFDM- symbol. Ideal interleaving. Left hand side: respective rate-distortion capacity
limits.
As predicted by the theoretical considerations, a difference in the power efficiencies of
about 3 to 3.5 dB between coherent and noncoherent transmission can be observed. An
increase of the observation interval with N > 2 is expected to reduce the gap. But it
should be noted that for N > 2, BICM is not the appropriate scheme [51]. High
performance PLC can now be considered a mature technology, based on the well-known
improved OFDM engines.
100
6.3 POWER LINE TECHNOLOGY PRACTICAL EQUIPMENTS
6.3.1 Introduction
Since PL T has not been extensively deployed in South Africa, and owing to the fact that
there are in place few experimental site for PLT, we had to settle for the use of the
equipment at the University of Fort Hare Centre of Excellence (CoE) provided by
Ascom. Ascom is an international provider of services for telecommunication systems,
integrated voice and data communications, wireless and corded security solutions and
networked revenue collection systems. As a strong supporter and pioneer of PL T, Ascom
has continuously and systematically developed this technology for the broadband access
as well as for the in-house distribution of data.
The University of Fort Hare is located about 120 km from Port Elizabeth in a place which
is a bit more of a village than urban poor. There are no busy main roads and there are
overhead high tension lines running near by the university. The observed experiments
were carried out in the Department of Computer Science, which houses the CoE. The
software provided enabled the user to determine or measure the throughput variation
using different adapters provided by Ascom (i.e. the 1.5 Mbps and the 4.5 Mbps Ascom
adapters). The A typical SNR measured by Ascom using their adapters is shown in
Figure 6.10.
In the experimental set up, it is possible to measure the throughputs between clients and
also between client and server. The file size transferred in intervals of 500 milliseconds
for 50 seconds and the file transfer rate are then measured. The ASCOM adapters used
carriers of 19.8,22.8 and 25.2 MHz with data rates of up to 4.5 Mbps. A bandwidth of2
MHz/carrier using GMSK (Gaussian Minimum Shift Keying) modulation with a delay of
less than 25 milliseconds and a total power consumption of less than 10 W were the
specifications for the adapters used.
101
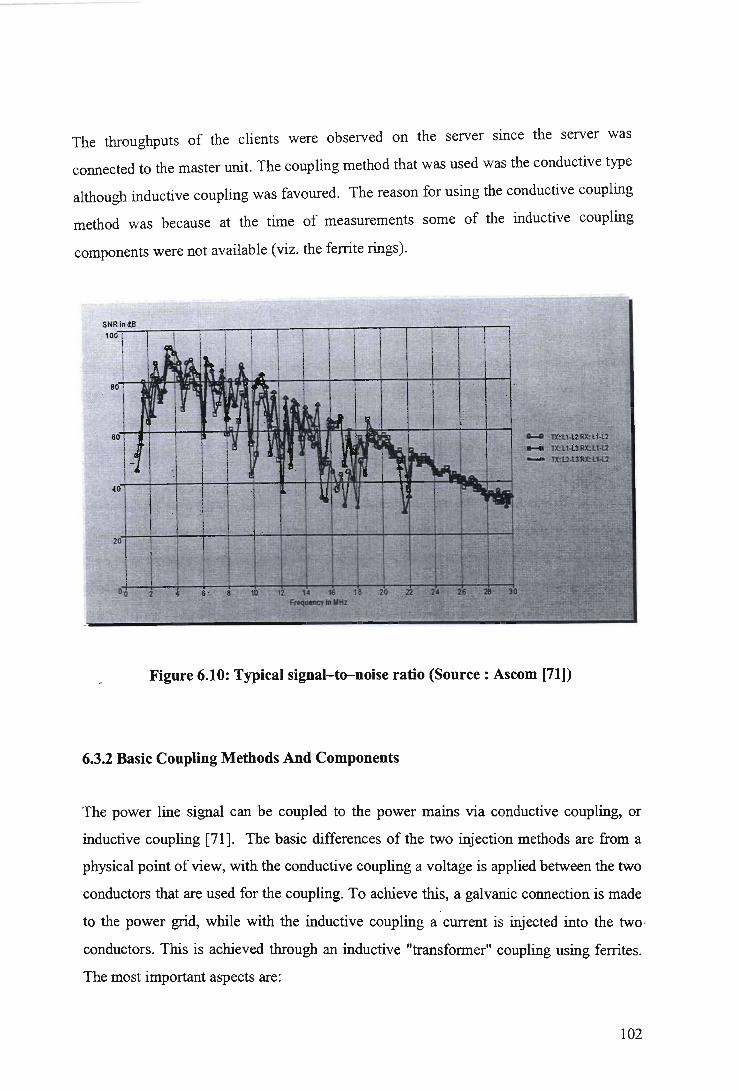
The throughputs of the clients were observed on the server since the server was
connected to the master unit. The coupling method that was used was the conductive type
although inductive coupling was favoured. The reason for using the conductive coupling
method was because at the time of measurements some of the inductive coupling
components were not available (viz. the ferrite rings).
Figure 6.10: Typical signal-to-noise ratio (Source: Ascom [71])
6.3.2 Basic Coupling Methods And Components
The power line signal can be coupled to the power mains via conductive coupling, or
inductive coupling [71]. The basic differences of the two injection methods are from a
physical point of view, with the conductive coupling a voltage is applied between the two
conductors that are used for the coupling. To achieve this, a galvanic connection is made
to the power grid, while with the inductive coupling a current is injected into the two
conductors. This is achieved through an inductive "transformer" coupling using ferrites.
The most important aspects are:
102

Conductive injection: The conductive injection method is most effective when the
mains impedance is high at the signal injection point. This is typically the case at simple
house access points where a single power cable is entering and another single cable is
leaving the connection point.
Inductive injection: The inductive injection method is most effective when the mains
impedance is low at the signal injection point. This is typically the case when injecting
into a bus system where several power cables are connected together. Connecting several
power cables to a single point or bus effectively results in a parallel connection of the
individual cable impedances. This results in a low impedance.
6.3.3 Conductive Coupling And Components
With the conductive coupling method (see Figure 6.11), the power line signal is injected
into the power grid via the power cable of the unit or via signal coupling units [71].
Power line unit
Signal Coupler Devices
Power line
Figure 6.11: Conductive coupling of power line signal to power mains (Source:
Ascom [71])
The conductive signal coupling is used:
~ When the mains impedance is high (> 20 Ohms),
103
~ when there is no need for the more efficient inductive coupling due to high signal
levels,
~ when there is no space for the inductive coupling elements.
The drawbacks of the conductive signal coupling are:
~ High coupling loss at coupling points with low impedance « 20 Ohm),
~ normally the electricity must be switched off for the installation of the power line
units.
The conductive signal coupling is the inherent method. Whenever a power line unit is
connected to the power mains via the provided cable, the unit is coupled conductively.
Bridging large distribution panels (with large signal losses) with conductive coupling is
achieved with Signal Coupler Devices (SCD), and Signal Distribution Box (SDB).
The signal coupler device (or signal coupler for short) is used to make the galvanic
connection to the power mains and to .decouple the signal port from the dangerous mains
voltage. It also includes the required over voltage protection elements. The signal coupler
can be used to build a phase/phase or a phase/neutral injection. For each galvanic
coupling point one signal coupler must be installed. The signal distribution box is a
passive signal splitter. It has one input port and 6 or 11 output ports, depending on the
model. The input port is connected to the power line unit. Using an Ethernet patch cable
an output port is connected to a signal coupling unit. The 6- port signal distribution box
results in a loss (as seen by a single injection point) of about 10 dB, the II-port version of
about 14 dB.
6.3.4 Inductive Coupling Method
The inductive coupling method is the preferred method for the power line infrastructure
units [71].
104

Power line unit
Ferrite rings
Power line
Figure 6.12: Inductive coupling of power line signal to power mains (Source: Ascom
[71])
Its advantages are:
~ Very good method for coupling points with low impedance,
~ Best performance in low impedance situations,
~ Results in many cases in lower radiation from power mains than conductive
coupling,
~ Very simple implementation of multiple coupling points,
~ Allows directional coupling to avoid the use of "foreman" installations,
~ There is normally no need to switch off electrical power for the installation,
~ Easy to install in meter room
With the inductive coupling method the power line signal is injected into the power
mains with the aid of Ferrite rings (acting as transformers) and a special signal cable
(refer to Figure 6.12). In this case there is no galvanic connection between the power grid
and the power line unit. The elements for inductive coupling are:
~ Ferrite sets,
~ Double insulated twisted pair signal cable,
~ Coupling capacitors.
Various ferrite sets are available. The proper choice satisfies the following conditions:
~ It is the set with the smallest inner diameter, and
105

~ the maximum current in the mains conductor is smaller or equal to the maximum
current specification of the ferrite set.
The coupling capacitors are used to:
~ Lower the impedance at the coupling point, resulting in increased coupling
efficiency for the inductive coupling method,
~ Limit the propagation direction of the inductively coupled power line signal, see
Figure 6.13.
Coupling capaCitor
Figure 6.13: Conductive coupling and Inductive coupling with RF short circuit
(Source: Ascom [71))
The coupling capacitor forces the inductively coupled signal to propagate in only one
direction. Signal propagation direction is shown with green arrows. The coupling
capacitor acts like a signal shortcut for the injected power line signal current in the power
grid. Therefore the power line signal current will mainly flow through the coupling
capacitors and hence will not propagate across this point. For the example in Figure 6.13
the power line signal will only propagate to the left. To achieve the best performance
coupling capacitors must be installed as close as possible to the inductive injection point.
The capacitor leads must be kept as short as possible. The available power line signal to
the right of the coupling capacitor is very low. An attenuation of 20 to 40 dB (depending
on the signal frequency and the mains impedances) can be expected. Used properly, this
106

method helps to eliminate the interference between two neighbouring indoor power line
systems, thus avoiding the foreman coordination between them.
t
Figure 6.14: Push-pull signal injection (Source: Ascom [71])
The inductive injection must always be installed such that a push-pull signal is generated.
The induced signal current must always be flowing in opposite directions in the power
mains, as shown in Figure 6.14. The push pull injection greatly reduces the power line
radiation from the mains cabling and enhances the coupling efficiency. Push-pull
injection produces power line signal currents running in opposite direction in the mains
WIres.
Special signal cable is used in connection with the inductive coupling method. This signal
cable must be twisted and double insulated. The electrical connection of the signal cable
is a simple current loop connected to the proper terminals of the power line unit. A
simple loop in connection with ferrite couplers can be used to build a very effective
signal bridge to step over a lossy installation in the power grid. This installation is purely
passive, resulting in low cost and low maintenance. The loss of such a bridge is normally
in the range 10 to 15 dB.
107

6.4 PROPOSED SOLUTION FOR RURAL TELECOMMUNICATION
6.4.1 General
The data that was collected by Statistics SA in KwaZulu-Natal shows that the number of
households with public phones at another location (not nearby) is 104,163 and 174,483
households are without telephones (see Table 6.1). The combination of these two groups
gives about 280 000 households without access. This figure is quite substantial and
cannot be ignored. The word "neighbour" in the table refers to a household that is less
than a kilometre away. Another location nearby implies a location that is between two to
five kilometres away, while another location that is not nearby means any distance above
5 kilometres. There is thus a definite market for more aggressive information access
deployment in rural areas.
Telephone Facility House holds
Fixed telephone and cell 283316 phones in dwelling Fixed telephone in dwelling 219740 only Cell phones in dwelling only 310366
At a neighbour nearby 190731
At a public phone nearby 738306
At another location nearby 65146
At another location not 104163 nearby No access to a telephone 174483
Table 6.1: Rural households with telephone facilities (Source: Statistics SA)
108
The whole idea of rural telecommunication is to bring to the rural communities
affordable information technologies without or very little suffering from the investors in
terms of profit gains. Bringing the technology to the people means that the people need
to be equipped with the necessary skills. Out of the total population residing in rural
areas only a few residents can afford personal computers. Most of the rural residents still
need to be equipped with skills required for accessing these services since most of them
have never seen these technologies before. The best entry point for the introduction of
these services to rural residents is the deployment of these services through telecentres.
Telecentres can be placed so that residents do not walk unacceptably long distances to get
access. For a starting point in sub-rural areas, these distances should be not more than 2
km to get to the information centre (telecentres, shops, schools, etc.)
The primary objective of many telecentres is to create public telephone access and then
introduce a range of other services dependent on this backbone, such as fax, e-mail and
InternetlWeb access. The minimal set-up for a basic telecentre is usually three lines: one
for voice, one for fax and one for Internet access. However, if the PLT is explored there
will be no need for many lines as every thing (voice, fax and the Internet) can be sent
simultaneously over the single power line and even the energy for powering up the
devices can be obtained from the very same line. Provisioning of these services in
telecentres will give opportunity for services awareness and training of the residents. In
rural areas not only the illiterate people are not familiar with these services, it is still
possible to find a well educated person who has never touched a computer. As the people
are being introduced to these services, they will see the need and start making personal
service requests.
Power line technology can play a major role in the connecting of customers to the
telecommunication services. The telecentres, shops and government or tribal offices can
be used as central offices. This can cover a lot of end users. From the experimental
results that were obtained, it can be seen the end users can have speeds of at least 1.5
Mbps, which is just more that enough for a customer in the sub-rural or rural area. The
109

proposed PLT connectivity is as show in Figure 6.19. This connectivity will use a multi
user adapter as it connects to a large number of customers.
6.4.2 Traffic Consideration
To enable us appreciate the network design requirements in a rural area, surveys were
conducted a in certain regions of K waZulu Natal. This survey focused in the rural areas
surrounding Ladysmith (i.e. Emcinseni, S1. Chads, Roosbom and KwaNomlebhelele) and
also in an area south of Umlazi in Durban known as KwaMakhutha. Figure 6.15 shows
the traffic variations on a typical weekday. The figure also shows the traffic during the
busy hour. This is very crucial in the sense that it gives a clear indication of loading
requirements on the system to be designed, that the bandwidth required must be able to
accommodate that maximum traffic. And the network design should be in a way that
gives minimal prescribed traffic loss during the peak hour. The traffic was then calculated
and it could be aggregated according to the demand.
Peak-hour graph 35---
30 .:>
Q. 25 o e> ~ 20 c E> 15 ~
E 10 ;:I c;
5
o 07:00 08:00 09:00 10:00 11:00 12:00 13:00 14:00 15:00 16:00 17:00
08:00 09:00 10:00 11:0012:00 13:00 14:00 15:00 16:00 17:00 18:00
Time(hoUIS)
Figure 6.15: Daily traffic variation in a typical rural area
110

From the traffic variations in Figure 6.15, we can therefore calculate the offered traffic in
Erlangs. If the mean holding time (T) is 5 minutes for each caller [73], then the offer
traffic can be calculated as follows:
nT 33*5 Offered Traffic = - = --= 2.75 Erlangs
t 60 (22)
The offered traffic calculated in (22) is for a single booth. Now given the busy hour
traffic (BHT) as calculated above, using the Erlang B charts, with a grade of service of
2%, the number of lines/trunks is found to be 7. If each trunk uses a bandwidth of 64
kbps, 7 trunks will therefore offer a bandwidth of 448 kbps. The throughputs offered by
the PLT adapter are quite large (in multiples of Mbps) and they therefore can cater for the
BHT without any problems. The problem now lies with the distances between the offices
where the master adapters will be connected.
6.4.3 Distance Between Repeaters
Determining the optimum distances is not quite as simple. These vary depending on
power output, loss during power distribution, and the noise level at the receiving end.
However by applying the results of extensive measurements by Ascom, it is possible to
predict the average distance in a concrete situation with sufficient accuracy (see Figure
6.16).
111

120
100 ,-.. m '0 80 '"" e 0 ;:; II
60 ::I r: G> 40 ~
20
0
0 100 200 300
Distance (m)
400 500
JU§:.;s. 2.4 MHz
4.8 MHz
~ S.4MHz
-19.8MHz
- 22.8 MHz
Figure 6.16: Signal attenuation as a function of distance (Source: Ascom [71])
The adapters use 3 carriers in a frequency band of 2-16 MHz with each carrier having a
power of 20dBm but only one can be used at full throttle while the others are switched
off. If 2 carriers are used then the power of each should be 14dBm and if all 3 are used,
then the power should be set to 14dBm for one and 8dBm for each of the remaining two
which translates to a total transmit power of 30dBm, one can now calculate the distance
at which a repeater can be placed using Figure 6.16. The receiver power is given by:
(23)
where PLis power loss on the line, Pt is transmit power and Pr is receive power.
From Figure 4.1 in chapter 4, the power line noise level between 2 - 6 MHz is -50dBV
which translates to -33dBm at an impedance of 200. For the signal not to be lost in the
channel noise, equation (23) has to hold, where Pn is the line noise power.
~ -PL(dB) ~ ~(dBm) (24)
From the above equation we can then calculate the signal attenuation as in (25).
112

PL(dB) = ~ -Pn(dBm) = 30dBm-(-33dBm) = 63dB (25)
A SNR of 45 dB gives excellent picture quality for video conferences but for our design
we chose 40 dB which is also as good but not perfect. Therefore the minimum received
power to give us a SNR of 40 dB is:
P,.(min) = Pn(dBm) +40dB = -33dBm +40dB = 7dBm (26)
Thus to maintain a SNR of 40dB which is good enough but not the best for e-Iearning,
one needs a received signal level of at least 7 dBm. If the minimum received signal level
is 7 dBm, therefore the allowable attenuation margin is:
Att(dB) = ~ - P,. = 30dBm -7dBm = 23dB (27)
Referring to Figure 6.16, at 2.4 MHz, the repeater spacing required. to give an attenuation
of 23 dB is 180 metres while at 4.8 MHz the spacing is approximately 150 metres. The
distances between the infonnation centres in rural areas are much larger than these values
calculated above. This means that for a distance of 3km, one has to use 15-20 repeaters;
this makes the network more expensive to deploy. A typical rural area is shown in Figure
6.17.
113

Figure 6.17: Rural area near Ladysmith (Roosbom)
RuraI Dwellers
Figure 6.18: Rural layout for Roosbom
114

6.4.4 Final Solution
Figure 6.17 IS a picture of Roosbom which is one of the rural areas surrounding
Ladysmith. Figure 6.17 and Figure 6.18 shows a layout of a rural area with every
household connected to the power line. The distance between neighbours varies greatly
whilst those between large centres can be approximated to a maximum of 3.5 km. If one
examines the area in the Figure 6.17 and Figure 6.18, it can be seen that there are a
cluster of households around an information centre. With such a layout, one can have
houses within a radius of 540 metres connected to the information centre where the
connectivity to other centres or the rest of the world will be via a wireless link. This
allows the designer to use at most 2 repeaters and in turn reduce the cost of the network.
Figure 6.19 shows a proposed connectivity for the households to the information centre.
,--_Te_Iec_O_m_Al:."c_es_s_-,I/
~elessLk PS'IN , I
I
I I I
I
I I __ 18Om ____ --18Om _____ 18Om_
Transfomer Station or friendly customer site
Repeater i f A
1
Indoor PLC at distance < 100m
school 7
2 lines'; shop 7 ~lines
1()Otn~§ . Booths
lOo",~ lines
d<IOOmI customer / premises
'\: 'y customer 7 premises
Figure 6.19: Proposed network connectivity for rural areas
115

The distance can be up to 180 metres without a repeater and if 2 repeaters are used, the
distance can be extended to 540m. The distance between customers, which is less than
100 metres, can be regarded as indoor communication and only one master unit can
shared. Considering the traffic offered in (22), the proposed number of booth lines is a
maximum of 8. The schools and the shop are allocated 3 and 2 lines respectively. Any
apartment equipped with a power line modem (APA-45i/o) can either communicate
directly with the outdoor master (APM-450) or with the indoor repeater (APR-30i). The
outdoor master provides backbone connectivity with the Internet or the public switched
telephony network and controls the repeaters. The master can be located either at the
transformer station, or at a friendly customer site (i.e. shops, telecentres, schools, etc.).
Reachability can be extended with repeaters in order to achieve extended coverage.
For indoor networks with a number of different interference sources, which in many
cases are unstructured, the average values provide no useful indicators since different
types of installation affect the transmission distance of up to 100 metres in very different
ways. With increasing tests and deployments, reliable estimates can also be produced for
indoor systems.
Connecting PLC system into standard backbone architecture generally calls for close
collaboration with the network provider and above all concerns aspects of system
security, connection of PLC equipment to the network management system. A top-down
approach is recommended: beginning with the backbone and proceeding to the outdoor
master and access point, down to the adapter inside the building and the required settings
on the user' s PC.
With the implementation of power line technology rural education centres can now enter
the broadband level that allow the students to work more efficiently and convenient when
they are learning with computers. With the high speeds offered by PLT, the basic needs
such as e-Iearning and e-health can be achieved. It is the basis for communication
platforms to share resources and ideas online between students as well as teachers. In
116
addition it will allow the schools to set up e-learning projects and enhanced information
exchange with other institutions in the near future.
The backbone connectivity can be provided via microwave radio links (or PSTN if there
is any available) on the roof of each school, telecentre or government office. At the same
place the signal is injected to the power grid of the school with an Indoor Master. The 4.5
Mbps modems are in operation for computer rooms where several workstations are
sharing the capacity of one ePE (customer premises equipment). The 1.5 Mbps modems
are providing access to standalone computers as teacher PC's or student terminals in
classrooms.
Subsidising such projects by government can be an effective catalyst in achieving the
goal of bridging the gap between the information rich and the information poor. South
African government and other · African countries have already demonstrated interest
towards this goal, through the development of polices that introduce more competition in
the telecommunications industry, thus opening a broad platform for the investigation and
deployment of cost effective and non existing technologies in the areas that have been
neglected for a long time.
117

CHAPTER SEVEN
7.1 CONCLUSION AND RECOMMENDATIONS
Convergence is a popular tenn used in r~lation to the merging of various industrial
sectors, made possible by digital technologies such as telecommunications, infonnation
technologies, broadcasting, and multimedia. From the above discussion it is clear that the
tenn can be properly used also for the fusion of the energy and infonnation systems. This
tendency will have a large impact on the operations of major industrial sectors, i.e. power
utilities, commercial/residential infonnation product users, and technology/application
suppliers.
While in industrialised countries the traditional telecoms infrastructure achieves a
penetration approaching 100%, in semi-peripheral regions, and even more so in
developing countries, a dramatic lack 'of infrastructure exists. In contrast to traditional
access links, the electricity supply infrastructure covers about 40 % of the rural
population in South Africa. Therefore a great number of households can be connected
using power line communications. Power is available everywhere. PLC communications
achieves two-way broadband bandwidth for all connected households because PLC only
has to cope with a few 100 metres distance, while DSL has to bridge around 4.5
kilometres of copper wire. Therefore traditional broadband links such as cable and ADSL
are not available to a large part of the rural population, power lines connect more people.
In the process of bridging the gap between the "Information rich" and "Information
poor", this thesis has proposed the power line network as a communication medium,
which is based on OFDM to be used for the purpose of providing the telecommunication
services and hence overcoming the deficiency in telecommunication services and combat
the hostile environment which prevail in rural areas. The idea of using the power line grid
as the core networks is to explore its advantages and strength in tenns of coverage,
capacity, easy of operation and maintenance, which are sorely embedded in these
118

systems. This network can provide a common format for communication that can support
all services and can be supported on various transmission systems.
In this work, power line communication systems employing OFDM are described and
compared. Channel information is assumed not to be available at the transmitter side.
Both the situations with and with no channel information at the receiver are regarded. In
order to make a general analysis possible a stochastic power line channel model is
introduced. Incorporating the transmitter and receiver operations of OFDM into the
model and using coding across the OFDM-sub carriers, a slowly tirn~varying frequency
non-selective fading channel is obtained. The capacity of this fading channel is
calculated for the cases of coherent transmission and differentially encoded transmission
with multiple symbol differential detection.
The numerical results of the channel capacity show that the frequency dependent signal
attenuation and the transmission bandwidth largely influence the required average signal
to-noise ratio for reliable communication at the receiver. To combat the signal fading the
application of large signal constellations and low rate codes proves to be convenient.
According to the capacity curves the perfect knowledge of the channel characteristic
leads to considerable gains of the order of some dB in the signal-to-noise ratio.
Increasing the observation interval of the noncoherent detection can reduce the gap
between transmission with and with no channel state information at the receiver.
The theoretical results derived from capacity analysis are affirmed by means of
simulations for 8PSK and 16QAM signal constellations. As well-known for transmission
over fading channels, the interleaving depth is required to largely exceed the coherence
bandwidth of the fading process along the frequency axis. e practical results show that
power lines can be used as a communication medium. In terms of the practical
experiment, we can not report on distance as one of the factor that makes high speed wire
line communications a problem. Looking at the proposed network layout, customers in
sub-rural areas closer to the central office can get access speeds in several Mbps and as
the distance from the central office increases, the speed will decrease. Another problem
119

which is the line noise can be taken care of since the power line units uses regulated
communication similar to fax. As the line noise increases the power line units will
automatically regulate the speed at which they can communicate well.
At present, ADSL is offered to South Africans at a speed not more than 512 kbps if
within the reach of about 4 km and if the line is tested for good quality. South Africa is a
broadband laggard when compare to countries such as Japan, Korea, Denmark and
Iceland. One of the many reasons is the cost of rolling out new broadband technologies.
The South Africans are paying between $70 to $100 per month for a ADSL connection
while Americans typically pay $40 to $50 monthly for a ADSL or cable modem
connection, the Japanese, for example, pay $10 to $15 a month for even faster
connections [74]. This means that South Africans are paying more for less.
The appeal of power line technology is that most of the wiring for the network is in place
which minimises the cost of rolling out new wires. Although data must be carefully
routed over the electric grid to prevent interference and signal degradation, there is no
need to dig up streets or rewire homes. It is also a compelling choice when it comes to
speed as compared to the other existing technologies. The major technical challenge has
been how to send bursts of radio frequency energy over power lines without interfering
with other radio signals, particularly ham radio and public safety frequencies.
Although this is a very good network in terms of coverage, capacity, ease of operation
and maintenance, we recommend this network for sectors of rural telecommunication that
require medium bandwidth. Due to the short distance between repeaters, the trade - off
between bandwidth and distance becomes a major design issue. As rural areas can be
subdivided, this work is recommended for the fast developing rural areas or sub-rural
areas since the distance between neighbours is not that large. For the areas that are
slowly developing, this technology can not be apply to them since they do not have
electricity in their back yard; and if they had electricity, the distance will still play a
major role in hindering the information services being brought to the rural community
which is sparsely distributed. In this case, wireless access is a better option.
120

7.2 FUTURE WORK
An investigation should be launched to investigate the technology that uses microwave
technology to pull data through the magnetic field created by alternating current flowing
through the electrical power grid. The South Afiican electric power system operates at 50
cycles a second or hertz. This means that the electric charges or current flowing in the
system changes direction 50 times every second. The alternating current is what causes
the radiation of the magnetic field that surrounds the electrical wires. Electric fields are
easily shielded or weakened by conductive objects but magnetic fields are not.
Modulating signals onto the magnetic field, instead of the electrical field, is what makes
it possible to transmit signals through transformers, over high voltage electrical,
transmission (500 kV) and distribution (11 kV) lines, at speeds up to 2.5 gigabits per
second.
Microwave signals propagated onto the magnetic flux field can travel up to ~ kilometres without regeneration. The process writes telephone, radio, video, Internet and
satellite data within the magnetic wave by using proprietary software and hardware. This
allows the electrical grid to carry these communications services at near light SP~.JTiris develops a low cost, reliable means of transmitting data, voice and video at high spe~
The distances covered by this technology look very attractive for long distance reach
which is one of the greatest problems in rural telecommunication.
Working on a medium-voltage network can bring a better coverage with enough
bandwidth. An ambitious initiative to bring to the PLC community a wide range of PLC r
products enabling customers to provide a rich bouquet of services and delivering the
promise of the third pipe to the home at a low cost of ownership results in a need for
medium voltage products.
DS2 Wisconsin technology has developed its next generation (2G) broadband PLC
access system. The data rates that these chips can provide are up to 205 Mbps. The latest
power line product family member (API-2000-MV) is a result of synergy between the
121

technically proven Wisconsin chipset from DS2 and the industry wide acknowledged
leadership in system design, industrialization and deployment aspects. The medium
voltage technology is expected to provide a much higher performance and will be
available at lower prices.
122

REFERENCES
[1] J. Anatory, N.H. Mvungi and M.M. Kissaka, "Modelling IP-Based Power Line
Network and Interconnections with Wireless Networks for Communication in
Non-Urban and Low Density Areas of Developing Countries," Proceedings of
SATNAC '2003, George, S.A, Sept 2003
[2] Kilenga A.I, "Wireless internet access for rural applications", University of
Durban-Westville -2003.
[3] N. Pavlidou, AJ Han Vinck, B. Honary, 1. Yazdani, Power line communications:
State of the art and future trends, IEEE Communications Magazine, Apr 2003, pp
34 - 40
[4] PJ. Chitamu, ''Network Planning Paradigm for Low Density traffic Areas",
Proceeding of the Second International Conference (ICEET2001), Dar es salaam,
Tanzania, 10-11 sep.2001 pp. ETI-ET8.
[5] SADC Report - 1999
www.uneca.org/aisiinicilcountry...,ProfileslDocuments _ Englishlsouthpub.en.doc
[6] Sanjeer Mervana and Chris Le, "Design and implementation ofDSL - based
access solution: End to end DSL solution for service providers", Cisco Press 2001
[7] Eskom' s notes on Power Line Carrier, 1998
[8] www.epanorama.netltelecommunications access technologies.html
[9] www.cogency.com/. "Cogency's Report on Home Networking over Power Line,
1999"
123

[10] H. Akkermans, D. Healey, Hans Ottosson: EnerSearch AB, "Report on Data
Transmission over the Electricity Power Line", June 1998
[11] Hrasnica, H.; Lehnert, R: "Powerline Communications for Access Networks -
Performance Study of the MAC Layer"; ill International Conference on
Telecommunications BllITEL 2000; October 23-25 2000, Sarajevo, Bosnia and
Herzegovina
[12] F.J Canete, J.A Cortes, L Diez and J.T Entrambasaguas, "Modeling and Evaluation of the
indoor Power Line Transmission Medium," IEEE Communication Magazine, Vol 41,
Apr. 2003, pp 41-47
[13] J. Abad, A. Badenes, J. Blasco, J. Carreras, V. Dominguez, C. Gomez, S. Iranzo, J.C
Riveiro, D. Ruiz, L.M Torres and J. Comabella, "Extending the Power line LAN up to
the neighbourhood Transformer," IEEE Communication Magazine, Vol 41, Apr. 2003,
pp 64-70
[14] P. Vuckovic and M.L. Dukic, "OFDM as a possible modulation technique for power line
communications," Proceedings of VIII Telekomunikacion forum telfor'2000, Beograd,
21-23 Nov. 2000
[15] J. Anatory, N.H. Mvungi, M.M Kissaka, "Traffic Estimation for Communication
Services Provision Using PLC Networks for Non Urbarn and Lowly Populated Areas of
Developing Countries" Proceeding of the Third International Conference (ICEET2003),
Dar es salaam, Tanzania, 18-19 August .2003 pp. ET16-ET21.
[16] Zimmermann, M.; Dostert, K.: ''The Low Voltage Power Distribution Networks as Last
Mile Access Network - Signal Propagation and Noise Scenario in the HF-Range";
International Journal of Electronics and Communications (ABU), Special issue: "On
Powerline Communications", 54 (2000) No.1; Germany 2000
[17] www.intellon.comlWhite Paper #0032 - OFDM Communications Primer
124

[18] Lutz H.-J. Lampe, Johannes B. Huber, AEU International Journal of Electronic
Commununications: Bandwidth Efficient Power Line Communications Based on
OFDM(2000)
[19] www.citeseer.nj.nec.com!contextl1270097/372909
[20] Powerline Communications For Access Networks - Performance Study
www.ifn.et.tu-dresden.de/-hrasnicalresearchlplc2 .pdf
[21] www.ewh.ieee.orgisoc/pes/pscc
[22] www.cogency.com/. "Cogency's Report on Data Communications over Power
Lines"
[23] www.intellon.com!. "Intellon's ~eport on High Speed Power Line
Communications, 2001"
[24] Maarten van HeIden, City of Tshwane Metropolitan Municipality, Last mile
telecommunications at Tshwane, Energize, 12 January 2004
[25] J.A.C. Bingham. Multicarrier Modulation for Data Transmission: An Idea Whose
Time Has Come. IEEE Communications Magazine, pages 5-14, May 1990.
[26] M. Arzberger, K. Dostert, T. Waldeck, and M. Zimmermann. Fundamental
Properties of the Low Voltage Power Distribution Grid. In Proc. of Int. Symp. on
Power Line Commun. and its Appl. (lSPLC), pages 45-50, Essen, Gennany, April
1997.
[27] M. Zimmermann and K. Dostert. A Multi-Path Signal Propagation Model for the
Power Line Channel in the High Frequency Range. In Proc. of Int. Symp. on
125

Power Line Commun. and its Appl. (ISPLC), pages 45-51, Lancaster, UK, March
1999.
[28] H. Philipps. Modelling of Powerline Communications Channels. In Proc. of Int.
Symp. on Power Line Commun. and its Appl. (ISPLC), pages 14-21 , Lancaster,
UK, March 1999.
[29] A. Papoulis. Probability, Random Variables, and Stochastic Processes. McGraw
Hill, N ew York, third edition, 1991.
[30] P.S. Chow, 1M. Cioffi, and J.A.C. Bingham. A Practical Discrete Multitone
Transceiver Loading Algorithm for Data Transmission over Spectrally Shaped
Channels. IEEE Trans. on Commun., 43:773-775, February/MarchiAprilI995.
[31] R. Fischer and 1 Huber. A new loading algorithm for discrete Multitone
transmission. In Proc. of IEEE Global Telecom. Con! (Globecom) , pages 724-
728, London, November 1996.
[32] M. Bossert, A. Donder, and V. Zyablov. OFDM-Dbertragung iiber
Mobilfunkkanale: Bemerkungen zur Kanalkapazitat (in German). In 2. OFDM
F achgespriich, Braunschweig, Germany, September 1997.
[34] Universitat Erlangen-Niirnberg Lehrstuhl fur Nachrichtentechnik II. Internal
Report. 1998.
[35] R.G. Gallager. Information Theory and Reliable Communication. John Wiley &
Sons, New York, 1968.
[36] A. Svensson. On Differentially Encoded Star 16QAM with Differential Detection
and Diversity. IEEE Trans. on Vehic. Technology, 44(3):586-593, August 1995.
126

[37] W.T. Webb, L. Hanzo, and R. Steele. Bandwidth Efficient QAM Schemes for
Rayleigh Fading Channels. lEE Proceedings-I, 138(3):169-175, June 1991.
[38] D. Divsalar and M.K. Simon. Maximum-Likelihood Differential Detection of
Uncoded and Trellis Coded Amplitude Phase Modulation over A WGN and
Fading Channels - Metrics and Performance. IEEE Trans. on Commun.,
42(1):76-89, January 1994.
[39] L. Lampe, S. Calabro, and R. Fischer. Channel Capacity of Fading Channels for
Differentially Encoded Transmission. lEE Electronics Letters, 35(3):192-194,
February 1999.
[40] M. Harris. Power Line Communications-A Regulatory Perspective. In Proc. of
Int. Symp. on Power Line Commun. and its Appl (ISPLC), pages 131-138,
Lancaster, UK, March 1999.
[41] G. Ungerbock. Channel Coding with MultilevellPhase Signals. IEEE Trans. on
Inf. Theory, 28(1):55-67, January 1982.
[42] L. Lampe and R. Fischer. Comparison and Optimization of Differentially
Encoded Transmission on Fading Channels. In Proc. Of Int. Symp. on Power Line
Commun. and its Appl. (ISPLC), pages 107-113, Lancaster, UK, March 1999.
[43] C.D. Chung. Differentially Amplitude and Phase-Encoded QAM for the
Correlated Rayleigh-Fading Channel with Diversity Reception. IEEE Trans. on
Commun., 45(3):309-321, March 1997.
[44] R.J. McEliece and W.E. Stark. Channels with Block Interference. IEEE Trans. on
Inf Theory, 30(1):44-53, January 1984.
127
[ 45] Ephraim Zehavi. 8-PSK Trellis Codes for a Rayleigh Channel. IEEE Trans. on
Commun., 40(5):pp. 873-884, May 1992.
[46] Giuseppe Caire, Giorgio Taricco, and Ezio Biglieri. Bit-Interleaved Coded
Modulation. IEEE Trans. on In! Theory, 44(3):pp. 927-946, May 1998.
[47] H. Imai and S. Hirakawa. A New Multilevel Coding Method Using Error
Correcting Codes. IEEE Trans. on In! Theory, 23:371-377, 1977.
[48] U. Wachsmann, R. Fischer, and J. Huber. Multilevel Codes: Theoretical Concepts
and Practical Design Rules. IEEE Trans. on In! Theory, pages 1361-1391, July
1999.
[49] U.Wachsmann and 1. Huber. Power and bandwidth efficient digital
communication using turbo codes in multilevel codes. European Trans. on
Telecommun., vol. 6:pages 557-567, Sept.-Oct. 1995.
[50] S.A. Butman and RJ. McEliece. The Ultimate Limits of Binary Coding for a
Wideband Gaussian Channel. JPL Deep Space Network Progress Report 42-22,
pages 78-80, August 1974.
[51] L. Lampe, S. Calabro, R. Fischer, S. Miiller-Weinfurtner, and J. Huber. On the
Difficulty of Bit-Interleaved Coded Modulation for Differentially Encoded
Transmission. In Proc. of IEEE In! Theory Workshop (IJ'!V), page 111, Kruger
National Park, SA, June 1999.
[52] C. Berrou and A. Glavieux. Near Optimum Limit Error Correcting Coding and Decoding: Turbo-Codes. IEEE Trans. on Commun., 44:1261-1271, October 1996.
[53] P. Sutterlin, W Downey, A power line communications tutorial- challenges and
technologies, http://www.echelon.com!solutions/providers/default.htm
128

[54] Cable Testing Standards,
http://www.cabletesting.com!cabletesting/standards/overview.htm
[55] CENELEC, European Committee for Electrotechnical Standardisation,
www.cenelec.org/cenelec/cenelec+in+actionlhorizontal+areas/ictlsc205.htm
[56] IEEE Standards Online Power Systems Communication Standards,
http:/ww.standards.ieee.org/catalog/oils/psystcomm.html
[57] IEC- International Electrotechnical Commission, www.iec.ch
[58] Stefan Ramseier et aI., "MV and LV Power line communication: New Proposed
IEC Standards", 0-7803-5515-6/99, IEEE, 99
[59] EST! - Telecom Standards, http/www.esti.org
[60] Power Systems Overview, http://www.abb.de!plc
[61] "Power Line Telecommunications (PLT): Coexistence of Access and In-House
Power Line Systems", ETSI TS 101 867 vl.1.1 (2000-11)
[62] ACA - A Brief Background: Broadband PLC Systems, Sept 2003,
httpllwww.aca.gov
[63] "How Power Line Networking Works", httpllwww.howstuffworks.com
[64] Gartner PLC Info, Focus Report: "Power Line Communications: An Alternative Local Loop?", httpllwww.gartner.com
[65] "Digital Power Line Communication", httpllwww.vivisimo.com!digital-powerline
129

[66] FCC 03-100, FCC Enquiry on "Current Carrier Systems including Broadband
over Power Line Networks", ET Docket No. 03-104
[67] Last Mile Telecommunication, Energize-12 Jan 2004, Last reviewed for relevance
by Corporate Communications Department
[68] PLC: Demonstrating the convergence capability of the technology; Fernanda
Nogueira; June 2003. http://www.platrand.co.za
[69] Paul Hunt: Communication Media for AMR - Which Technology is the Most
Appropriate?, Metering International, issue 1, 1998, pages 15-19. (cf. also
http://www.metering.com)
[70] Junior Isles: Distributing a Message - Electricity Companies Get Ready to Make
Waves in the Telecomms Business, Power Engineering International, Volume 6,
Issue 1 (January/February 1998), pages 54-58. ISSN 1069-4994 (cf. also
http://www.penwell.com)
[71] Ascom Powerline Communications AG manual note on PLC adapters version 1.2
- August 2002
[72] http://www .spectrum.ieee.org/
[73] Mbatha SJ, "ATM Performance in Rural Areas of South Africa", University of
Durban-Westville -2004.
[74] http://www.theglobeandmail.comlservletistoryIRTGAM.20041028.gtpower
lineoct28lBNStorylT echnology
130

APPENDIX A
Part 15 of the FCC Rules applicable to Power Line Systems
Current Carrier Systems
15.107 Conducted Limits-
This section sets out the conducted limits of devices connected to the AC mains supply.
15.107(a) Limits for all devices except Class A digital devices and the current carrier
systems in part ( c).
Frequency (MHz)
0.15-0.5
0.5-5
5-30
Quasi-peak (dBmV)
66 to 56
56
60
15.107(b) Limits for Class A digital devices
Frequency (MHz)
0.15-0.5
0.5-30
Quasi-peak (dBmV)
79
73
15.107(c) Current Carrier Systems
Average (dBm V)
56 to 46
46
50
Average (dBm V)
66
60
The limits shown in paragraphs (a) and (b) of this section shall not apply to current
carrier systems operating as unintentional radiators on frequencies below 30 MHz. In
Lieu thereof, these current carrier systems shall be subject to the following standards:
131

1) For current carrier systems intended to be received using a standard AM broadcast
receIver.
2) For all other current carrier systems within the frequency band 535-1705 kHz
1000mV.
3) Carrier current systems are also subject to radiated emission limits.
15.1 07 (d) Measurements to demonstrate compliance
15.109 Radiated Emission Limits
15.109(a) Limits for all devices except Class A digital above 30 MHz
15.109(b) Limits for Class A above 30 MHz
15.109(c) Band edge values
15.109(d) CB receivers
15.109(e) Current carrier systems are ~ubject to the radiated limits in 15.209 between
9 kHz and 30 MHz.
15.1 09( f) Receiver terminals
15.109(g) Acceptance of devices which comply with CISPR 22
15.209 Radiated emission limits, general requirements
Frequency(MHz) Field Strength(uV/m) Measurement Distance
0.009-0.490 24001 F(kHz) 300
0.490-1.705 240001 F(kHz) 30
1.705-30.0
30-88
30
100
30
3
132
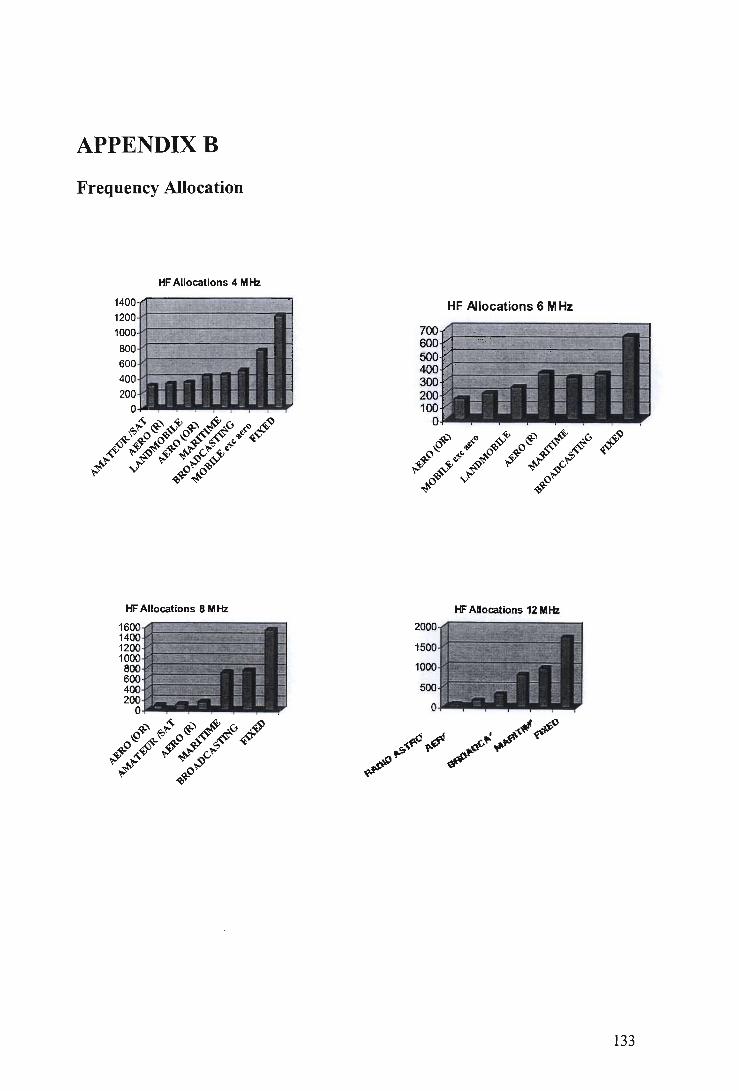
APPENDIXB
Frequency Allocation
HF Allocations 4 MHz
HF Allocations 6 MHz
HF Allocations 8 MHz HF Allocations 12 MHz
133

HF Allocations 16 MHz
1000 800
600 kh~c:-"""""'----400 200 0'---
HF Allocations 22 MHz
HF Allocations 18 MHz
HF Allocations 26 MHz
134

APPENDIXC
The currently proposed limits for PLC interference field strengths
1. NB30.
Frequency (Peak) Disturbance Field Measurement Measurement Range Strength Limit Distance Bandwidth MHz dB(~V/m)
0.009-0.15 40-20*log f (MHz) 3 metres 200Hz
0.15-1 40-20*log f (MHz) 3 metres 9kHz
1-30 40-8.8*log f (MHz) 3 metres 9kHz
2. Norwegian proposal.
Frequency (peak) Disturbance Field Measurement Measurement Range Strength Limit Distance Bandwidth MHz dB(~V/m)
0.15-1 20-20*log f (MHz) 3 metres 9kHz
1-30 20-7. 7*log f (MHz) 3 metres 9kHz
3. BBC proposal.
Frequency (peak) Disturbance Field Measurement Measurement Range Strength Limit Distance Bandwidth MHz dB(~V/m)
0.15-30 21.8-8.15*log f(MHz) 1 metres 9kHz
CISPR 22 B, limit for mains disturbance voltage, measured at the 230 V mains terminal of ITE apparatus classe B, intended for use in residential areas.
Frequency Quasi Peak Disturbance Average Disturbance Measurement Range Voltage limit Voltage limit Bandwidth MHz dB(~V) dB(~V)
0.15 - 0.5 66 - 56 56 -46 9kHz
0.5 - 5 56 46 9kHz 5 - 30 60 50 9kHz
135