Availability of, access to and consumption of fruits and vegetables in a peri-urban area in...
16
Availability of, access to and consumption of fruits and vegetables in a peri-urban area in KwaZulu-Natal, South AfricaMieke Faber*, Ria Laubscher † and Sunette Laurie ‡ *Nutritional Intervention Research Unit, South African Medical Research Council, Tygerberg, South Africa, † Biostatistics Unit, South African Medical Research Council, Tygerberg, South Africa, and ‡ Agricultural Research Council – Vegetable and Ornamental Plant Institute, Private Bag X293, Pretoria, South Africa Abstract Availability and consumption of fruits and vegetables were assessed in peri-urban households in KwaZulu-Natal Province, South Africa. Caregivers of 400 randomly selected grade 6 and 7 learners were interviewed using a questionnaire that included unquantified food frequency questions. Using a repeated 24-h dietary recall, dietary intake was quantified for learners, caregivers and 2- to 5-year-old children in the household. Usual household fruit and vegetable consumption was expressed over three Living Standard Measure (LSM) categories.Average per capita intake of fruit and/or vegetables was 99 g for 2- to 5-year-old children and 124 g for caregivers. For consumers, fruits and/or vegetables contributed towards total dietary intake of fibre (16–21%), calcium (13– 21%), vitamin A (27–31%) and vitamin C (47–62%). For households not consuming fruits (n = 297) and vegetables (n = 178) daily, cost was the major constraint (75%). Of all households, 52% had fruit trees and 25% had a vegetable garden. Animals destroying vegetables was the major constraint to 59% of vegetable growers. Household consumption of fruits and vegetables increased over the LSM categories. Caregivers in the higher LSM group more likely used printed material for information on healthy eating, had fruit trees, were confident about vegetable gardening and sold some of their produce. To enable peri-urban populations of low socio- economic status to consume more frequently a bigger variety of fruits and vegetables, the cost of purchasing these food items needs to be addressed by government and business sector. Households should further receive support to overcome constraints which hamper the success of home gardens. Keywords: children, community, dietary patterns, food consumption, socio-economic factors, micronutrients. Correspondence: Mieke Faber, Medical Research Council, PO Box 19070, Tygerberg 7505, South Africa. E-mail: mieke.faber@ mrc.ac.za Introduction In South Africa the great majority of 1- to 9-year-old children consume a diet deficient in energy and of poor nutrient density, with a large proportion of chil- dren having a nutrient intake of approximately less than half the recommended requirement for a number of important nutrients (Labadarios et al. 2000). Although the latter study showed that KwaZulu-Natal was one of the provinces with the highest mean dietary intake for various nutrients (Labadarios et al. 2000), a national survey done in 2005 showed that it is the most vulnerable province in terms of low vitamin A status (Labadarios 2007). A meta-analysis of dietary surveys done in South Africa from 1983 to 2000 showed that less than 50% of 1- to 5-year-old rural and urban children consumed items from the vegetable group, while 12–18% rural and 27–44% urban South Africans consumed fruit (Nel & Steyn 2002). The National Food Consumption Survey that was done in 1999 showed that fruit was low on the list of commonly consumed food items for DOI: 10.1111/j.1740-8709.2011.00372.x Original Article 1 © 2011 Blackwell Publishing Ltd Maternal and Child Nutrition (2011), ••, pp. ••–••
-
Upload
independent -
Category
Documents
-
view
2 -
download
0
Transcript of Availability of, access to and consumption of fruits and vegetables in a peri-urban area in...

Availability of, access to and consumption of fruits andvegetables in a peri-urban area in KwaZulu-Natal,South Africamcn_372 1..16
Mieke Faber*, Ria Laubscher† and Sunette Laurie‡*Nutritional Intervention Research Unit, South African Medical Research Council, Tygerberg, South Africa, †Biostatistics Unit, South African MedicalResearch Council, Tygerberg, South Africa, and ‡Agricultural Research Council – Vegetable and Ornamental Plant Institute, Private Bag X293, Pretoria,South Africa
Abstract
Availability and consumption of fruits and vegetables were assessed in peri-urban households in KwaZulu-NatalProvince, South Africa. Caregivers of 400 randomly selected grade 6 and 7 learners were interviewed using aquestionnaire that included unquantified food frequency questions. Using a repeated 24-h dietary recall, dietaryintake was quantified for learners, caregivers and 2- to 5-year-old children in the household. Usual householdfruit and vegetable consumption was expressed over three Living Standard Measure (LSM) categories.Averageper capita intake of fruit and/or vegetables was 99 g for 2- to 5-year-old children and 124 g for caregivers. Forconsumers, fruits and/or vegetables contributed towards total dietary intake of fibre (16–21%), calcium (13–21%), vitamin A (27–31%) and vitamin C (47–62%). For households not consuming fruits (n = 297) andvegetables (n = 178) daily, cost was the major constraint (�75%).Of all households, 52% had fruit trees and 25%had a vegetable garden. Animals destroying vegetables was the major constraint to 59% of vegetable growers.Household consumption of fruits and vegetables increased over the LSM categories. Caregivers in the higherLSM group more likely used printed material for information on healthy eating, had fruit trees, were confidentabout vegetable gardening and sold some of their produce. To enable peri-urban populations of low socio-economic status to consume more frequently a bigger variety of fruits and vegetables, the cost of purchasingthese food items needs to be addressed by government and business sector. Households should further receivesupport to overcome constraints which hamper the success of home gardens.
Keywords: children, community, dietary patterns, food consumption, socio-economic factors, micronutrients.
Correspondence: Mieke Faber, Medical Research Council, PO Box 19070, Tygerberg 7505, South Africa. E-mail: [email protected]
Introduction
In South Africa the great majority of 1- to 9-year-oldchildren consume a diet deficient in energy and ofpoor nutrient density, with a large proportion of chil-dren having a nutrient intake of approximately lessthan half the recommended requirement for anumber of important nutrients (Labadarios et al.2000). Although the latter study showed thatKwaZulu-Natal was one of the provinces with thehighest mean dietary intake for various nutrients
(Labadarios et al. 2000), a national survey done in2005 showed that it is the most vulnerable province interms of low vitamin A status (Labadarios 2007).A meta-analysis of dietary surveys done in South
Africa from 1983 to 2000 showed that less than 50%of 1- to 5-year-old rural and urban children consumeditems from the vegetable group, while 12–18% ruraland 27–44% urban South Africans consumed fruit(Nel & Steyn 2002).The National Food ConsumptionSurvey that was done in 1999 showed that fruit waslow on the list of commonly consumed food items for
DOI: 10.1111/j.1740-8709.2011.00372.x
Original Article
1© 2011 Blackwell Publishing Ltd Maternal and Child Nutrition (2011), ••, pp. ••–••

1- to 9-year-old children (Labadarios et al. 2000). Anestimated 11.1 million males and 12.5 million femalesover 15 years of age were affected by a low intake offruits and vegetables in South Africa in 2000(Schneider et al. 2007).A high intake of fruits and vegetables can make a
significant contribution to decreasing mortality fromcertain diseases (Schneider et al. 2007). Increasedconsumption of fruits and vegetables is thereforepromoted. Not only is dietary diversification one ofthe strategies supported by the Integrated NutritionProgramme of the South African Department ofHealth (Department of Health 2002), but the SouthAfrican Food-Based Dietary Guidelines also encour-age South Africans to, among others, ‘eat plenty ofvegetables and fruits every day’ (Love & Sayed 2001).An intake of five portions of fruits and vegetables ispromoted through a number of initiatives such asthe 5-a-Day for Better Health TRUST programme(www.5aday.co.za). The mission of the 5-a-Day forBetter Health TRUST programme is to increaseSouthAfricans’ consumption of vegetables and fruits,in line with the recommendation of theWorld HealthOrganization (WHO) of at least 400 g (five 80-gservings) and the Department of Health’s dietaryguideline ‘Eat plenty of vegetables and fruits everyday’.South Africa has the double burden of under- and
over-nutrition (Labadarios 2007; Schneider et al.2009). Increasing the intake of b-carotene-rich fruitsand vegetables could potentially reduce vitamin Adeficiency (Faber et al. 2002a), which is one of themajor nutritional deficiencies in South African chil-dren (Labadarios 2007). Increasing the intake of fruits
and vegetables could also have a large impact onreducing many non-communicable diseases (Locket al. 2005; Schneider et al. 2007). Fruits and veg-etables are also important to boost the immunesystem of people living with human immunodefi-ciency virus (HIV)/acquired immunodeficiency syn-drome to help them fight infections (Department ofHealth 2007). However, affordability and availabilitymay negatively impact on fruit and vegetable intake(Love et al. 2001).The aim of this study was to determine the avail-
ability of, access to and consumption of fruits andvegetables for grade 6 and 7 learners, their caregiversand 2- to 5-year-old children (if any) in their house-hold in the catchment area of four peri-urban schoolsin KwaZulu-Natal Province.
Materials and methods
Study population
The study was done in a peri-urban site in the Mari-annhill area, Pinetown in the KwaZulu-Natal Prov-ince, South Africa. According to the 2005 NationalFood Consumption Survey-Fortification Baseline,KwaZulu-Natal was the province being most affectedby poor vitamin A status in 1- to 9-year-old children(88.9%). The survey further showed that 21.7% ofchildren and 37.6% of adult females were anaemic;15.1% of children were stunted and 51.5% of adultfemales were either overweight or obese (Labadarios2007). KwaZulu-Natal is the province with highestprevalence of HIV in South Africa (http://www.avert.org/safricastats.htm, accessed 27 August 2011).
Key messages
• Average amount of fruits and vegetables consumed was considerably less than the daily amount recommendedby theWHO. Portion size seemed adequate (approximately 80 g), but variety and frequency were low.
• Consumption of fruit was highest for the 2- to 5-year-old children and lowest for caregivers, while consump-tion of vegetables did not differ across the three age categories.
• Cost was the major constraint prohibiting daily consumption of fruits and vegetables, although less of aconstraint in the higher LSM group. Frequency of usual consumption for both fruits and vegetables increasedover the LSM groups.
• Vegetable gardens were observed in 25% of households and 52% had fruit trees; the lack of fencing and animalsdestroying the vegetables were the major constraints for planting vegetables.
M. Faber et al.2
© 2011 Blackwell Publishing Ltd Maternal and Child Nutrition (2011), ••, pp. ••–••

The study population resided in the catchment areaof four primary schools. Twenty shops within walkingdistance from the four schools were identified. Eachshop was visited at least once per week from Februaryto October 2007. Fruits and vegetables available inthese shops were observed and recorded. DuringMarch andApril 2007, the caregivers of 400 randomlyselected grade 6 and 7 learners were recruited; 100learners per school were systematically selected usingthe grade 6 and 7 class lists. Only one child per house-hold was selected. Exclusion criteria were lack ofconsent by the caregiver, and no adult caregiveravailable in the household. The caregivers wereinterviewed in the local language (isiZulu) by sixexperienced Medical Research Council (MRC)-employed fieldworkers and six local people recruitedto assist with data collection.All data collectors weretrained during a 5-day training workshop, whichincluded piloting of the questionnaire and standardi-sation of the 24-h recall method.
Quantified dietary intake using a repeated 24-hdietary recall
To obtain the mean nutrient intakes for the differentage groups, dietary intake was quantified for grade 6and 7 learners, their caregivers and 2- to 5-year-oldchildren (if any) in the household using a repeated24-h dietary recall (Gibson 2005).Both the learner andthe caregiver were present during the 24-h dietaryrecall. The two repeats were done approximately1 week apart and on different days of the week. Thefieldworkers worked Monday to Friday, and thedietary data collected therefore covered one weekendand four weekdays (Sunday through Thursday).During the 24-h dietary recall interview, a standar-
dised ‘dietary kit’ that included examples of food con-tainers and wrappers, plastic food models, householdutensils and three-dimensional sponge models wasused to help the respondents and fieldworkers visua-lise, quantify and record food consumption for theprevious day. In addition,dry oats was used to quantifyportion sizes of certain food items, especially cookedfood. The caregiver/learner used the dry oats to indi-cate the quantity resembling the amount of food thatwas consumed.The fieldworker quantified the dry oats
with a measuring cup. Directly after completion ofeach 24-h recall, quality checks were done by an expe-rienced full-time employed fieldworker.
Information on the household collectedby questionnaire
Information on socio-demographics, food sources,vegetable gardening practices at household level andconstraints affecting vegetable production was col-lected by questionnaire that was developed using theguidelines of Gross et al. (1997).To gain a better understanding of the different fruits
and vegetables consumed, a set of unquantified foodfrequency questions was used to obtain descriptivequalitative information on the usual consumption offruits and vegetables by children in the householdduring the past month. The set of questions that wasused has been tested for face and content validity andhas previously been used in similar studies (Faber et al.1999, 2002b; Faber & Laubscher 2008). The caregiverhad a choice of fiveoptions to describe the child’s usualintake of listed foods.The five options were the follow-ing: (1) everyday; (2) most days (not everyday but atleast 4 days per week); (3) once a week (at least once aweek, but less often than 4 days a week); (4) seldom(less than once a week/infrequently); and (5) never.The Living Standard Measure (LSM), which is
based on standard of living rather than income, wasused as a measure of wealth. A total of 29 variables,mainly looking at what assets (e.g. fridge and stove)and facilities (tap water and flush toilet) are availablein the household, are used to create the LSM (Haupt2006). Income is not taken into consideration whencalculating the LSM. The LSMs consist of 10 groups,with LSM 1 being the most impoverished whilehouseholds residing in LSM 10 tend to be better offfrom a household asset and socio-economic perspec-tive. The lower LSMs are the poorer and the lessserviced households, while the higher LSMs are thewealthier and more serviced households.
Processing and statistical analysis of the data
For the 24-h recall data, food intake reported inhousehold measures was converted into weight using
Fruit and vegetable consumption in South Africa 3
© 2011 Blackwell Publishing Ltd Maternal and Child Nutrition (2011), ••, pp. ••–••

the MRC Food Quantities Manual (Langenhovenet al. 1991). Coding of the data was done in duplicateand was checked for accuracy. The SAS softwarepackage (version 9.1; SAS Institute Inc., Cary, NC,USA) was used to convert food intake to macro- andmicronutrients, using the SAFOODS2000 database(http://safoods.mrc.ac.za).Summary variables were calculated for all fruits, all
vegetables, and all fruits and vegetables combinedfor each person. Potatoes were excluded from thesummary variables in order to be consistent with inter-national recommendations (WHO 1990). Sweet pota-toes are used interchangeably with potatoes in SouthAfrica and were also excluded. The amounts of fibreand micronutrients supplied by each summary vari-able were calculated and expressed as a percentageof total intake for each nutrient for all the researchparticipants. The analysis was repeated, excludingresearch participants who did not consume any of thefoods covered by the summary variable.Average portion size for commonly consumed fruits
and vegetables was calculated as the total weight ingrams of all occurrences of each food reported for therecall period, divided by the number of occurrences.Daily per capita consumption of the summary vari-ables was calculated. The total amount (in grams)consumed over the 2-day recall period was divided bytwo toobtain the total amount consumed for 1 day,andthis was then divided by the total study population.Data collected by questionnaire were entered into
Microsoft Excel data files and analysed using SPSSfor Windows, version 15 (SPSS Inc., Chicago, IL,USA). Data are presented as descriptive statistics.The households were also grouped into three groups,namely, LSM � 3 (n = 90), LSM 4 (n = 183) andLSM � 5 (n = 125). Differences across the three LSMcategories were determined using chi-squared analy-sis, and statistical significance was set at P < 0.05.
Ethical approval and permission to collect data
This study was part of a larger project ‘School gardensto address vitaminA’ that was approved by the EthicsCommittee of the MRC.Approval and support for the execution of the
overall project were obtained from the school princi-
pals, teachers and school governing bodies of the par-ticipating schools before the onset of the study.Mothers were informed verbally and in writingregarding the aim of the study and they were asked tosign a consent form. A community liaison officerassisted with the negotiations with the schools.
Results
Fruits and vegetables available in local shops
Table 1 shows the frequency of availability of fruitsand vegetables in the 20 local shops as recorded forthe period February to October 2007. Fruits and veg-etables that were never available are not shown in thetable. Apple and banana, and cabbage, onions andtomatoes were available most often.
Household characteristics
Household characteristics were collected for 398households. Nearly all the households had access totoilet facilities (73% pit toilet, 18% flush toilet notconnected to pipe and 9% flush toilet connected topipe), tap water (53% own tap, 43% public tap and3% neighbour’s tap) and electricity (97%). Thehouseholds used mostly electricity (68%) and gas orparaffin (30%) for cooking. Seventy-seven per cent ofthe households received a child support grant (asocial grant paid by the governmental Department ofSocial Development to the primary caregiver of chil-dren who live in poverty).When purchasing fruits andvegetables, this was done mostly from supermarketsin the nearby town (84% of the caregivers).Quantified information on dietary intake was col-
lected for 394 female caregivers (average age:41 � 10 years; 65% had at least 7 years of formal edu-cation), 399 learners (54.2% boys and 45.8% girls;average age: 12.7� 1.2 years) and 73 children agedbetween 2 and 5 years.
Dietary intake as determined by the repeated24-h dietary recall
Foods reported over the repeated 24-h dietary recall period
The 10 most frequently reported food items for the2-day dietary recall period are listed in Table 2. Oil is
M. Faber et al.4
© 2011 Blackwell Publishing Ltd Maternal and Child Nutrition (2011), ••, pp. ••–••

not listed in the table as it was used mostly duringfood preparation and was often not coded separately.It should however be noted that oil was used duringfood preparation for almost all the households. Sevenfood items (sugar, porridge made with maize meal,bread, rice, cordial squash, hard margarine, and teaand legumes) were among the 10 most frequentlyconsumed food items for all three groups (2- to5-year-old children, learners and caregivers). Otherfood items on the top 10 lists were milk (2- to 5-year-old children and caregivers), potato (2- to 5-year-oldchildren and learners), chicken (learners) and non-dairy creamer (caregivers).The fruits and vegetables reported for the 2-day
dietary recall period are listed in Table 3.A variety offruits and vegetables was reported for the total group,but many of these fruits and vegetables were con-sumed by a small proportion of the respondents. The
only fruits and vegetables that were consumed by atleast 20% of the respondents over the 2-day recallperiod were banana (2- to 5-year-old children only),apple, cabbage and mixed vegetables. In addition,imifino was consumed by 15% of learners and 17% ofcaregivers. Imifino is a collective term for variousdark-green leaves that is eaten as a vegetable; theleaves either grow wild or come from vegetables suchas pumpkin, beetroot and sweet potato.The percentage of respondents who consumed
fruits and vegetables over the 2-day recall period andaverage portion size, as well as the average per capitaintake, are given in Table 4. Approximately 90% ofthe 2- to 5-year-old children, learners and caregiversconsumed fruits and/or vegetables over the 2-dayperiod. Approximately 80% of the research partici-pants in the three age categories consumed veg-etables over the 2-day period. Sixty-four per cent of
Table 1. Frequency of availability of fruits and vegetables in 20 local shops, expressed as a percentage of observations
Observations (n)
Feb March May June July Aug Sep Oct
173 39 213 243 304 171 136 239
FruitApple 90 77 89 98 95 99 100 97Avocado – – 7 6 13 8 6 8Banana 83 87 74 64 89 87 94 88Grapes 15 46 10 5 16 11 10 –Grapefruit – – – – – 2 – –Mango 2 5 – – – – – –Naartjie 1 20 19 17 10 37 41 26Orange 52 13 54 91 99 93 100 97Peach, white 1 – – – – – – –Peach, yellow 13 5 – – – – – 2Pear 40 74 54 54 44 34 53 46Pineapple 7 – 4 2 10 13 16 21Plum 17 18 5 18 5 11 21 8
VegetableBeetroot – – – – – – 6 –Butternut 21 62 35 34 52 37 57 59Cabbage 88 92 80 81 82 87 92 95Carrot – 8 17 15 27 27 47 –Gem squash – – – 2 5 – – 3Green beans – – – – 6 – 6 –Onions 92 100 83 81 94 98 98 100Pumpkin – 2 – – – – – –Spinach – – 7 – 4 7 – 8Tomato 91 97 83 90 96 98 100 95
Fruits that were never available were apricot, guava, lemon, litchi, melon, papaya, watermelon and strawberry. Vegetables that were neveravailable were broccoli, brussels sprouts, cauliflower, cucumber, lettuce, mushroom and peas.
Fruit and vegetable consumption in South Africa 5
© 2011 Blackwell Publishing Ltd Maternal and Child Nutrition (2011), ••, pp. ••–••

the 2- to 5-year-old children consumed fruit, and thisdecreased progressively to 48% of learners and 42%of caregivers. The intake of fruit was similar for thethree groups,with the range for the average per capitaintake of 35–48 g per day. The average per capitaintake of vegetables increased from 51 g for 2- to5-year-old children to 91 g for the caregivers. Dietaryintake of fruits and/or vegetables was low and thedaily average per capita intake ranged from 99 g for 2-to 5-year-old children, 109 g for grade 6 and 7 learnersand 124 g for the caregivers.
Nutrient contribution of fruits and vegetables to totalnutrient intake
Total fibre and micronutrient intake are given inTable 5. The contribution of fruits and vegetables tototal intake is expressed as a percentage of the totalnutrient intake for, firstly, all the research participantswithin an age-category and, secondly, those researchparticipants who consumed fruits and vegetablesduring the recall period (consumers). For thoserespondents who consumed fruit, 9–13% of total fibre
Table 2. Ten most frequently reported food items over the 2-day recall period for the 2- to 5-year-old children, learners and caregivers, as well theportion size consumed
Food item Ranking Number oftimes reported
Respondents Averageportion size (g)
Number %
Children 2–5 years (n = 73)Sugar 1 166 70 96 10Maizemeal porridge* 2 165 65 89 175Bread† 3 147 69 94 65Rice 4 122 68 93 85Cordial squash 5 115 52 71 190Hard margarine 6 80 45 62 10Tea 7 69 43 59 175Milk 8 67 38 52 105Legumes 9 67 48 66 90Potato 10 44 31 42 70
Learners (n = 399)Bread* 1 864 371 93 110Sugar 2 745 361 90 15Rice 3 698 358 90 150Cordial squash 4 619 265 66 255Maizemeal porridge† 5 563 323 81 300Tea 6 496 300 75 310Hard margarine 7 470 289 72 20Legumes 8 397 265 66 177Potato‡ 9 267 166 42 100Chicken 10 224 190 48 60
Caregivers (n = 394)Sugar 1 1055 372 94 15Maizemeal porridge* 2 811 347 88 345Bread† 3 697 346 88 110Tea 4 677 323 82 348Rice 5 629 355 90 178Hard margarine 6 407 257 65 15Legumes 7 377 248 63 194Cordial squash 8 291 176 45 290Non-dairy creamer 9 246 196 50 4Milk 10 237 145 37 120
Oil is not listed as it was used during preparation and as such was not always coded separately. *Either as a stiff porridge (phutu) or a softporridge. †Either brown or white bread. ‡Including potato in stews.
M. Faber et al.6
© 2011 Blackwell Publishing Ltd Maternal and Child Nutrition (2011), ••, pp. ••–••
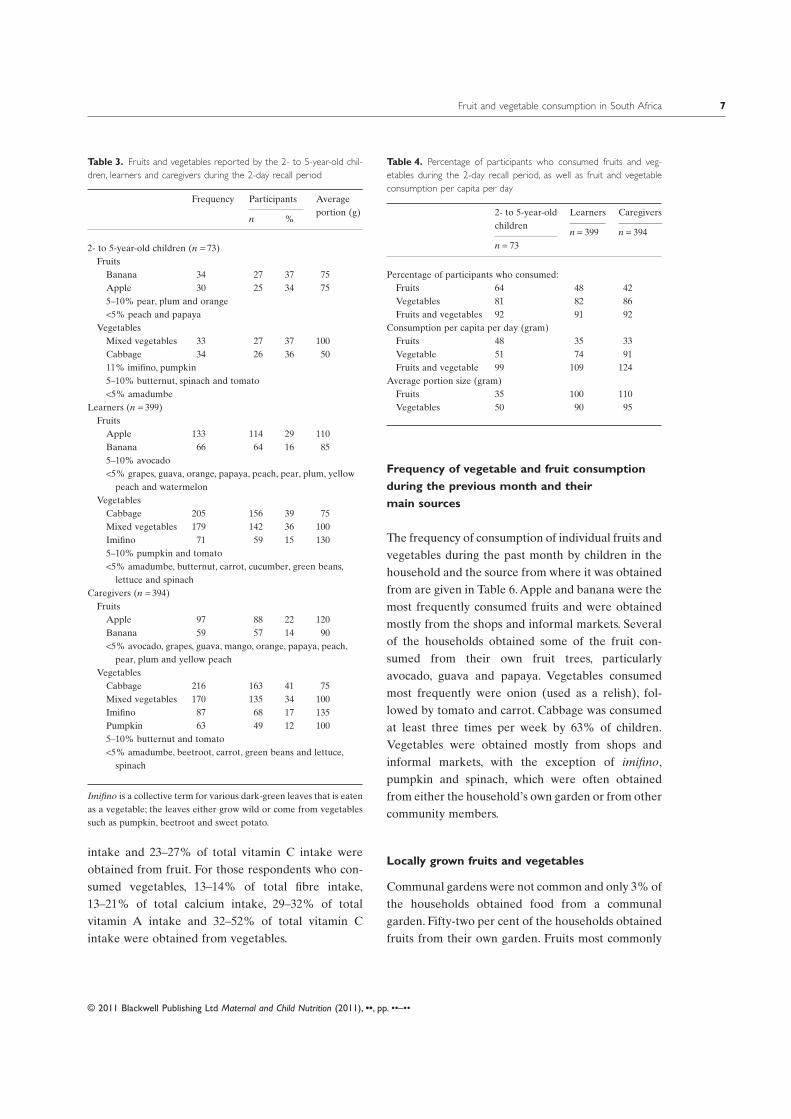
intake and 23–27% of total vitamin C intake wereobtained from fruit. For those respondents who con-sumed vegetables, 13–14% of total fibre intake,13–21% of total calcium intake, 29–32% of totalvitamin A intake and 32–52% of total vitamin Cintake were obtained from vegetables.
Frequency of vegetable and fruit consumptionduring the previous month and theirmain sources
The frequency of consumption of individual fruits andvegetables during the past month by children in thehousehold and the source from where it was obtainedfrom are given in Table 6.Apple and banana were themost frequently consumed fruits and were obtainedmostly from the shops and informal markets. Severalof the households obtained some of the fruit con-sumed from their own fruit trees, particularlyavocado, guava and papaya. Vegetables consumedmost frequently were onion (used as a relish), fol-lowed by tomato and carrot. Cabbage was consumedat least three times per week by 63% of children.Vegetables were obtained mostly from shops andinformal markets, with the exception of imifino,pumpkin and spinach, which were often obtainedfrom either the household’s own garden or from othercommunity members.
Locally grown fruits and vegetables
Communal gardens were not common and only 3% ofthe households obtained food from a communalgarden. Fifty-two per cent of the households obtainedfruits from their own garden. Fruits most commonly
Table 3. Fruits and vegetables reported by the 2- to 5-year-old chil-dren, learners and caregivers during the 2-day recall period
Frequency Participants Averageportion (g)
n %
2- to 5-year-old children (n = 73)FruitsBanana 34 27 37 75Apple 30 25 34 755–10% pear, plum and orange<5% peach and papaya
VegetablesMixed vegetables 33 27 37 100Cabbage 34 26 36 5011% imifino, pumpkin5–10% butternut, spinach and tomato<5% amadumbe
Learners (n = 399)FruitsApple 133 114 29 110Banana 66 64 16 855–10% avocado<5% grapes, guava, orange, papaya, peach, pear, plum, yellowpeach and watermelon
VegetablesCabbage 205 156 39 75Mixed vegetables 179 142 36 100Imifino 71 59 15 1305–10% pumpkin and tomato<5% amadumbe, butternut, carrot, cucumber, green beans,lettuce and spinach
Caregivers (n = 394)FruitsApple 97 88 22 120Banana 59 57 14 90<5% avocado, grapes, guava, mango, orange, papaya, peach,pear, plum and yellow peach
VegetablesCabbage 216 163 41 75Mixed vegetables 170 135 34 100Imifino 87 68 17 135Pumpkin 63 49 12 1005–10% butternut and tomato<5% amadumbe, beetroot, carrot, green beans and lettuce,spinach
Imifino is a collective term for various dark-green leaves that is eatenas a vegetable; the leaves either grow wild or come from vegetablessuch as pumpkin, beetroot and sweet potato.
Table 4. Percentage of participants who consumed fruits and veg-etables during the 2-day recall period, as well as fruit and vegetableconsumption per capita per day
2- to 5-year-oldchildren
Learners Caregivers
n = 73n = 399 n = 394
Percentage of participants who consumed:Fruits 64 48 42Vegetables 81 82 86Fruits and vegetables 92 91 92
Consumption per capita per day (gram)Fruits 48 35 33Vegetable 51 74 91Fruits and vegetable 99 109 124
Average portion size (gram)Fruits 35 100 110Vegetables 50 90 95
Fruit and vegetable consumption in South Africa 7
© 2011 Blackwell Publishing Ltd Maternal and Child Nutrition (2011), ••, pp. ••–••

Table 5. Nutrient intake for 2- to 5-year-old children, learners and caregivers; nutrient contribution of fruits and vegetables for the total group andfor consumers only
Nutrient Total intake % contributionby fruits
% contributionby vegetables
% contribution byfruits and vegetables
Mean (SD)Total group Consumers
onlyTotal group Consumers
onlyTotal group Consumers
only
Children 2–5 yearsn 73 73 47 73 59 73 67Fibre (mg) 14 (4) 8 13 11 13 19 21Calcium (mg) 276 (149) 1 2 10 13 12 13Iron (mg) 8.2 (2.6) 3 4 6 7 9 9Magnesium (mg) 151 (40) 4 6 6 7 9 10Phosphorous (mg) 493 (139) 2 2 4 5 6 6Zinc (mg) 6.5 (2.3) 1 2 3 4 4 5Vitamin A (RE) 378 (212) 1 2 25 30 26 28Thiamine (mg) 2.1 (2.1) 1 2 3 3 4 4Riboflavin (mg) 0.82 (0.48) 2 4 3 4 6 6Niacin (mg) 11.0 (4.0) 2 3 3 3 5 5Vitamin B6 (mg) 2.2 (0.8) 3 5 2 2 5 6Folic acid (mg) 243 (86) 2 4 3 3 5 6Vitamin C (mg) 31 (29) 18 27 26 32 43 47
Learnersn 399 399 190 399 328 399 362Fibre (mg) 20 (6) 4 9 11 13 15 16Calcium (mg) 246 (134) <1 2 15 19 16 18Iron (mg) 12.8 (3.6) 1 2 7 8 8 8Magnesium (mg) 220 (60) 1 3 6 7 7 8Phosphorous (mg) 653 (184) <1 1 4 5 5 6Zinc (mg) 10.0 (3.3) <1 1 3 4 4 4Vitamin A (RE) 511 (317) <1 1 24 29 25 27Thiamine (mg) 2.0 (1.9) <1 1 2 3 3 3Riboflavin (mg) 0.84 (0.44) 2 4 3 4 5 6Niacin (mg) 16.8 (5.9) 1 2 3 3 4 4Vitamin B6 (mg) 3.5 (1.3) 1 2 2 2 3 3Folic acid (mg) 367 (126) <1 2 3 3 4 4Vitamin C (mg) 36 (33) 11 23 33 40 44 49
Caregiversn 394 394 167 394 342 394 361Fibre (mg) 21 (7) 4 9 12 14 16 17Calcium (mg) 265 (168) <1 2 18 21 19 21Iron (mg) 13.0 (3.9) 1 2 8 9 9 10Magnesium (mg) 235 (64) 1 3 7 8 9 9Phosphorous (mg) 684 (194) <1 2 5 6 6 6Zinc (mg) 10.1 (3.3) <1 1 4 4 4 5Vitamin A (RE) 532 (296) <1 1 30 32 29 31Thiamine (mg) 1.9 (1.7) <1 2 3 3 4 4Riboflavin (mg) 0.73 (0.31) 2 4 4 5 6 7Niacin (mg) 15.2 (5.7) 1 2 4 5 5 5Vitamin B6 (mg) 3.0 (1.3) 1 3 3 3 4 4Folic acid (mg) 401 (146) <1 2 3 4 4 5Vitamin C (mg) 33 (36) 12 27 45 52 56 62
RE, retinol equivalents; SD, standard deviation.
M. Faber et al.8
© 2011 Blackwell Publishing Ltd Maternal and Child Nutrition (2011), ••, pp. ••–••

Tabl
e6.
The
frequ
ency
offr
uit
and
vege
tabl
eco
nsum
ptio
ndu
ring
the
past
mon
thfo
rch
ildre
nin
the
hous
ehol
dan
dm
ain
sour
cew
here
the
hous
ehol
dsob
tain
edth
efr
uits
and
vege
tabl
esfro
mth
epr
evio
usm
onth
Frequencyofconsumption*(n
=398)
Mainsource–forconsumersonly†
�4times
perweek
Onetothree
timesperweek
<once
aweek
Never
n‡Shops
Informal
market
Own
garden
Friends,family
andneighbours
FruitApple
468
208
368
6040
––
Avocado
124
1065
140
811
5031
Banana
759
259
363
4935
141
Grape
120
2356
175
5643
11
Guava
211
780
8112
251
35Mango
–32
1948
206
3830
1518
Orange
224
1362
152
5642
2–
Papaya
823
1356
174
98
5033
Peach
526
1356
174
4049
101
Pear
739
2628
288
6237
–1
Plum
–25
2055
180
5842
––
Vegetable
Beetroot
326
566
136
3958
11
Butternut
350
1927
289
3363
41
Cabbage
563
247
371
5247
1–
Carrot
3151
611
356
3958
2–
Cucumber
416
377
9134
65–
1Greenbean
––
––
281
4849
21
Imifino
335
2833
264
1014
40§
35Lettuce
322
372
113
3466
1–
Onion
962
11
394
5048
3–
Pumpkin
332
1748
209
1119
4227
Spinach
123
3344
224
2750
157
Tomato
4039
156
375
6431
4–
*Allvaluesaregivenasapercentage.Theoptions‘everyday’and‘mosttimes’werecombinedandaregivenas‘fourormoretimesperweek’.Fruitsconsumedneverby
>80%
ofhouseholdswere
apricot,lemon,litchi,melon,naartjie,pineappleandwatermelon.Vegetablesconsumedneverby
>80%
ofhouseholdswerecauliflower,broccoli,gemsquashandmushrooms.† Allvaluesaregiven
asapercentage;expressedasapercentageofthosehouseholdsthatconsumedthefruitorvegetablethepreviousmonth.Vegetablesobtainedfrom
acommunalgardenwerebeetroot(2%),carrot
(1%),pumpkin(1%)andtomato(1%).‡ Numberofhouseholdswhoconsumedthefruitorvegetablethepreviousmonth.§Whenobtainedfrom
owngarden,itwasgrowingwildinthehousehold’s
yard.
Fruit and vegetable consumption in South Africa 9
© 2011 Blackwell Publishing Ltd Maternal and Child Nutrition (2011), ••, pp. ••–••

obtained from their gardens were (expressed as apercentage of those who obtained fruit from theirgarden) avocado (66%), banana (61%), papaya(56%),mango (35%), guava (29%), peach (29%) andlemons (23%).Twenty-five per cent of the households reportedly
had a vegetable garden. The main function of thegarden was to produce vegetables for home consump-tion – only 9% of those households with a vegetablegarden sold some of their produce. Table 7 shows themajor constraints experienced with the vegetablegardens as well as the vegetables that were usuallyplanted. Animals destroying the crops were seen asthe major constraint (59%), and this can be linked toa lack of fencing.The households further experiencedproblems with plant diseases (49%) and insect pests(48%); 12% of households with vegetable gardensused pesticides. Thirty-five per cent of those house-holds growing vegetables thought that they lackedsufficient knowledge in terms of gardening practices.Lack of money (29%) and lack of seeds (27%) andother supplies/equipment were further mentioned asconstraints.Pumpkin was the most popular planted vegetable
(80% of those households with vegetable gardens),followed by chilli (eaten as a relish) and spinach.Forty-five per cent of households with gardens felt
that they needed a lot of advice in terms of growingvegetables. For those households with vegetablegardens, one-third did not obtain any advice ongrowing vegetables, while 32% obtained informationon growing vegetables from magazines.
Fruit and vegetable consumption according tothe LSM
Table 8 shows the usual frequency for household con-sumption of fruits and vegetables and the constraintsprohibiting daily intake thereof. The data in Table 8are given for both the total group and per LSM cat-egory. Twenty-six per cent of all households report-edly consumed fruits everyday, and 56% consumedvegetables everyday. For those households not con-suming fruits (n = 297) and vegetables (n = 178) daily,cost was cited as the major constraint prohibiting adaily consumption, 78% and 75%, respectively. Fre-quency of consumption for fruits and vegetables dif-fered across the three LSM categories (P = 0.002),with daily consumption of both fruits and vegetablesincreasing over the LSM categories. Cost was less of aconstraint for daily fruit consumption in the higherLSM group. It should be noted that in Table 8,the values for the constraints prohibiting daily con-sumption are expressed as a percentage of those
Table 7. Constraints that households experienced when growing vegetables, for those households who grow vegetables at home (n = 100)
Problems with gardens % Vegetables planted %
Animals destroying the garden 59 Pumpkin 81Plant diseases 49 Chilli 48Insects 48 Spinach 40Lack of fencing 43 Legumes 25Lack of knowledge 35 Onions 20Lack of money to buy supplies 29 Carrots 15Lack of seeds 27 Butternut 11Lack of pesticides 19 Cabbage 11Lack of garden tools 13 Beetroot 7Lack of fertilisers 13Shortage of water 10 Confidence on growing vegetablesLack of irrigation equipment 9 Confident 21Lack of time 3 Needs a bit of advice 34Nobody to help in the garden 1 Needs a lot of advice 45No problems 18
Households with a vegetables garden,n = 100 (25% of total sample).Values are expressed as a percentage of the number of households who growvegetables at home.
M. Faber et al.10
© 2011 Blackwell Publishing Ltd Maternal and Child Nutrition (2011), ••, pp. ••–••

Tabl
e8.
Freq
uenc
yof
usua
lhou
seho
ldco
nsum
ptio
nof
frui
tsan
dve
geta
bles
,and
the
maj
orco
nstr
aint
sfo
rno
tea
ting
frui
tsan
dve
geta
bles
ever
yday
per
LSM
cate
gory
Fruits
Vegetables
Totalgroup
LSM
category
Totalgroup
LSM
category
(n=398)
LSM
1–3
(n=90)
LSM
4(n
=183)
LSM
�5
(n=125)
(n=398)
LSM
1–3
(n=90)
LSM
4(n
=183)
LSM
�5
(n=125)
Frequencyofconsumption
Daily
2611
2535
5644
5468
4–6daysperweek
1817
1819
1312
1512
1–3daysperweek
2024
1821
1516
1611
<1dayperweek
2734
3017
1218
127
Never
1014
98
410
32
Biggestconstraintfornot
eatingitdaily(%)*
(n=297)
(n=81)
(n=134)
(n=81)
(n=178)
(n=49)
(n=88)
(n=41)
Cost
7882
8169
7576
7671
Seasonality
1310
1020
106
1210
Healthreasons†
35
25
36
15
Personalpreference
31
43
76
612
Availability
22
21
46
32
Unsure
1–
12
1–
2–
Frequencyoffruitconsumption:
P=0.002(chisquared).Frequencyofvegetableconsumption:
P=0.002(chisquared).*Expressedasapercentageofthosewhodonoteatitdaily.†Forexample
flatulence,arthritisandallergies.LSM,LivingStandardMeasure.
Fruit and vegetable consumption in South Africa 11
© 2011 Blackwell Publishing Ltd Maternal and Child Nutrition (2011), ••, pp. ••–••

households who did not eat fruits or vegetables daily.When expressed as a percentage of all households ineach LSM category (irrespective of frequency of con-sumption), cost as a constraint for daily consumptiondecreased from 73% (LSM 1–3) to 45% (LSM� 5)for fruits and from 42% (LSM 1–3) to 23%(LSM � 5) for vegetables.
Caregiver and household characteristicsaccording to the LSM
Table 9 shows caregiver and household characteris-tics according to the three LSM categories. Thehigher LSM (�5) category had the highest percent-age of married caregivers and caregivers who com-pleted grade 12. Calculation of the LSM is based on,among other, services and the higher access to flushtoilets and tap water on their plot in the LSM� 5category was therefore expected. Most householdshad electricity available in their homes, yet thesource of energy used for cooking differed across theLSM groups. Nearly half of the households in theLSM � 3 category usually used either gas or paraffinfor cooking. Ownership of assets used for foodpreparation (electric stove and microwave) andstorage (fridge and deep freezer) increased over theLSM categories. The radio and clinic were the mainsources for information on healthy eating for allhouseholds; in addition, households in the LSM � 5category also obtained information on healthy eatingfrom community health workers and printed mate-rial (newspaper and magazine). Although not statis-tical significant, the higher LSM category tended tohave the highest percentage of households thatobtained fruits from their own garden (49% in theLSM � 3 category, 47% in the LSM 4 category and60% in the LSM � 5 category). The number ofhouseholds with vegetable gardens did not differbetween the LSM categories.
Discussion
Dietary intake of fruits and vegetables was low forcaregivers compared with the average per capitaintake of approximately 200 g previously reported forSouth Africans (Rose et al. 2002) and considerably
less than theWHO recommendation of 400 g per day(WHO 1990). The per capita intake for the childrenwas similar to the reported value of 110 g for 1- to9-year-old South African children as determined by asingle 24-h dietary recall (Naude 2007). A repeated24-h dietary recall was used to determine average percapita intake.The limitations of the 24-h dietary recallare that it relies on the memory of the respondent; itmay be difficult for the respondent to accurately esti-mate the portion size consumed; it is not representa-tive of the usual diet; and it does not account forseasonal availability of fruits and vegetables.When consumed, both fruits and vegetables did
however contribute towards dietary intake of nutri-ents, especially fibre and vitamin C, while vegetablesalso contributed towards dietary intake of calciumand vitaminA.The importance of vegetables, particu-larly those rich in b-carotene towards dietary vitaminA intake, was reflected by data from the SouthAfrican National Food Consumption survey, whichshowed that carrots and green leafy vegetables,respectively, were the second and third biggest con-tributors towards dietary vitamin A intake for 1- to9-year-old children (Steyn et al. 2006). The contribu-tion of vegetables towards dietary calcium intake canprobably be ascribed to the consumption of greenleafy vegetables (mostly imifino).A previous study ina rural village in KwaZulu-Natal showed that dark-green leafy vegetables contributed 21–39% of totaldietary calcium intake for 2- to 5-year-old childrenover a series of seasons (Faber et al. 2007).Data of theNational Food Consumption Survey showed thatgreen leafy vegetables were the third biggest con-tributor to total dietary calcium intake for 1- to9-year-old children (Steyn et al. 2006). The estimatednutrient contribution of fruits and vegetables towardstotal dietary intake may vary depending on the sea-sonal availability of fruits and vegetables.The recommended daily intake of 400 g fruits and
vegetables per day translates to five portions of 80 geach (WHO 1990).The average portion size for fruitsand vegetables consumed by the learners and caregiv-ers therefore seems to be adequate. To achieve ahigher fruits and vegetables intake, a more frequentconsumption of a bigger variety of fruits and veg-etables should be promoted. This could be achieved
M. Faber et al.12
© 2011 Blackwell Publishing Ltd Maternal and Child Nutrition (2011), ••, pp. ••–••

through, for example local production in homegardens, provided that the households receivesupport to overcome the constraints prohibiting suc-cessful home gardens.
Fencing a vegetable garden can be expensive andis often not within the financial reach of the poor.Initiatives are therefore needed to assist the poor inobtaining and maintaining well-fenced vegetable
Table 9. Caregivers and household characteristics according to the Living Standard Measure (LSM)
According to LSM
LSM 1–3 (n = 90) LSM 4 (n = 183) LSM � 5 (n = 125) P-value
Caregiver’s marital status 0.049Married 21 22 41Living together 11 18 9Single 59 51 44Divorced 1 2 2Widowed 7 7 4
Caregivers who completed grade 12 14 12 24 0.009Toilet facilities 0.009Flush toilet 13 20 38Pit toilet 86 79 62None 1 1 0
Source of drinking water 0.0001Own tap (inside dwelling) 6 7 15Own tap (outside dwelling) 27 37 62Public tap 59 52 20Neighbour’s tap 7 4 2River 1 – 1
Electricity in dwelling 90 98 100 nsMain energy source for cooking 0.0001Electricity 47 77 85Gas/paraffin 47 22 14Wood 5 1 1Other 1 – –
Assets for food preparation and storageFridge 67 86 96 0.0001Deep freezer 6 12 40 0.0001Electric stove 66 90 99 0.0001Microwave 3 22 61 0.0001
Source for information on healthy eatingRadio 76 77 74 nsClinic 74 82 80 nsCommunity health workers 7 13 25 0.004School 7 7 14 nsNewspaper 4 5 14 0.022Magazine 10 8 20 0.029Family 7 3 3 nsFriends 1 2 6 ns
Fruit trees at home 49 47 60 nsFood from a community garden 2 3 4 nsCollect food from the wild 77 86 78 nsVegetable garden at home 26 26 24 nsMain function of home garden (n = 23) (n = 47) (n = 30)For home consumption 100 94 97 nsSell some of the vegetables 4 8 13 ns
Values are expressed as a percentage. ns, not significant.
Fruit and vegetable consumption in South Africa 13
© 2011 Blackwell Publishing Ltd Maternal and Child Nutrition (2011), ••, pp. ••–••

gardens. The households also experienced problemswith plant diseases and insect pests. Providing thehouseholds with information on integrated pest man-agement, which is the sustainable control of plantdiseases and insect pests, will enable them tocombine alternative methods of control in a way thatminimises the use of chemical pesticides [WorldEducation (INGO) 2005, Philippines Inc; Depart-ment of Basic Education 2011]. Interestingly, unlikein other reports water for irrigation of the crops wasnot seen as a major problem. It should be noted thatthe study area is in a subtropical zone receiving 800–1000 mm of rain, which should be enough to sustainvegetable production most of the year.The exceptionwill be the dry period from May to August whensupplementary irrigation, e.g. from municipal waterwill be required. The finding that 45% of householdswith gardens felt that they needed a lot of advice interms of growing vegetables highlights the need forgood agricultural extension services in the area.Whereas vegetable gardens need active support andwork, fruit trees are generally more self maintaining.Subtropical fruits such as banana, papaya andavocado can be grown in this area and should beable to supply fruit. Slightly less than half of thehouseholds consumed avocado and papaya duringthe month prior to the survey, and for 50% of thesehouseholds the fruits were obtained from their ownfruit trees.A recent study showed that vitaminA rich fruit and
vegetables, together with eggs and legumes, were theleast consumed foods by South African adults (Laba-darios et al. 2011).With the high prevalence of vitaminA deficiency in South Africa (Labadarios 2007), tar-geted home gardens have been recommended (Faberet al. 2002a). It is therefore encouraging that in house-holds with home gardens more than half plantedpumpkin and spinach, and about a quarter had but-ternut and carrot.We were previously able to show animprovement in the consumption of b-carotene-richvegetables and fruit through an intervention that pro-moted planting of b-carotene-rich vegetables andfruit in home gardens; these fruits and vegetables con-tributed more than 85% of total vitamin A intake of2- to 5-year-old children’s diets (Faber et al. 2002b).Four years after the formal intervention, it has been
reported that b-carotene-rich vegetables and fruitcontributed between 49% and 74% of total dietaryvitamin A intake over a number of seasons (Faber &Laubscher 2008).Cost was the major constraint prohibiting daily
consumption of fruits and vegetables, which is in linewith previously reported findings (Love et al. 2001;Bourne et al. 2007). Cost was less of a constraint fordaily consumption of fruit in the higher LSM group,and the frequency of usual consumption for bothfruits and vegetables increased over the LSM groups.Data from the 24-h dietary recalls did not show adifference in fruit and vegetable consumption overthe LSM groups (data not shown). Owning a fridgealso increased over the LSM groups; storage of per-ishable fruits and vegetables should thus be less of aconstraint in the higher LSM category. Comparedwith the LSM � 3 and LSM 4 categories, caregivers inthe LSM � 5 group were more likely to be married,have completed grade 12 and use printed material assource for information on healthy eating. Althoughnot statistically significant, more households in theLSM � 5 group had fruit trees, were confident aboutvegetable gardening and sold some of their producegrown in their home garden.Previous studies have shown lower dietary diver-
sity in the lower LSM groups in South Africa (Faberet al. 2009; Labadarios et al. 2011), reflecting poorpeople’s ability to access a large variety of foods.With cost being the major constraint prohibitingdaily consumption of fruits and vegetables, the gov-ernment and business sector need to put strategies inplace enabling poor households in peri-urban com-munities to comply with the Food-Based DietaryGuideline ‘eat plenty of vegetables and fruits every-day’ through access to a variety of affordable fruitsand vegetables.
Acknowledgements
We are grateful to the nutrition monitors, BongiDuma, Nhlanhla Hlophe†, Derick Mkhize, LindiweMsiya, Angeline Ntshangase and France Phungula,for recruiting the participants, completing the ques-tionnaires and coding the dietary data; the field-workers for completing the questionnaires; Michael
M. Faber et al.14
© 2011 Blackwell Publishing Ltd Maternal and Child Nutrition (2011), ••, pp. ••–••

Phungula for community liaison and negotiationswith the schools; Lee-Ann Human for dietary codingand data capturing; and the four schools, caregiversand learners who participated in the study.
Source of funding
Funding for this study was obtained from the SouthAfrican Sugar Association (project 196) and Nutri-tion Third World.
Conflicts of interest
The authors declare that they have no conflicts ofinterest.
Contributions
Study design, data collection, data analysis, interpre-tation of results and the drafting of the paper wasdone by MF. 24-h recall dietary nutrient analysis wasdone by RL and SL.Agricultural questions and inter-pretation and editing of the paper was also done bySL.All authors read and approved the final version ofthe paper.
References
Bourne L.T., Marais D. & Love P. (2007) The process fol-lowed in the development of the paediatric food-baseddietary guidelines for South Africa.Maternal and ChildNutrition 3, 239–250.
Department of Basic Education (2011) HorticultureManual for Schools: Part 4 Agricultural Systems for Veg-etables. National School Nutrition Program, Departmentof Basic Education: Pretoria.
Department of Health (2002) Integrated NutritionProgramme. South African Department of Health:Pretoria.
Department of Health (2007) South African NationalGuidelines on Nutrition for People Living with HIV,AIDS, TB and Other Chronic Debilitating Conditions.South African Department of Health: Pretoria.
Faber M. & Laubscher R. (2008) Seasonal availabilityand dietary intake of b-carotene-rich vegetables andfruit of 2-year-old to 5-year-old children in a rural SouthAfrican setting growing these crops at household level.International Journal of Food Sciences and Nutrition 59,46–60.
Faber M., Smuts C.M. & Benadé A.J.S. (1999) Dietaryintake of primary school children in relation to foodproduction in a rural area in KwaZulu-Natal, SouthAfrica. International Journal of Food Sciences and Nutri-tion 50, 57–64.
Faber M., Venter S., Phungula M.A.S., Dhansay M.A. &Benadé A.J.S. (2002a) Home-gardens focusing on theproduction of yellow and dark-green leafy vegetablesincrease the serum retinol concentrations of 2-5-y-oldchildren in South Africa. American Journal of ClinicalNutrition 76, 1048–1054.
Faber M., Venter S.L. & Benadé A.J.S. (2002b) Increasedvitamin A intake in children aged 2–5 years through tar-geted home-gardens in a rural South African commu-nity. Public Health Nutrition 5, 11–16.
Faber M., van Jaarsveld P.J. & Laubscher R. (2007) Thecontribution of dark-green leafy vegetables to totalmicronutrient intake of two- to five-year-old children ina rural setting.Water SA 33 (special issue), 407–412.
Faber M., Schwabe C. & Drimie S. (2009) Dietary diversityin relation to other household food security indicators.International Journal of Food Safety, Nutrition, andPublic Health 2, 1–15.
Gibson R.S. (2005) Principles of Nutritional Assessment.2nd edn, Oxford University Press: New York, NY.
Gross R., Kielmann A., Korte R., Schoeneberger H. &Schultink W. (1997) Guidelines for Nutrition BaselineSurveys in Communities. T.W. System (Thailand) Co.,Ltd.: Thailand.
Haupt P. (2006) The SAARF Universal Living StandardsMeasure (SU-LSM) 12 Years of Continuous Develop-ment. Available at: http://www.saarf.co.za/LSM/lsm-article.htm (accessed 23 December 2007).
Labadarios D. (ed.) (2007) National Food ConsumptionSurvey – Fortification Baseline (NFCS-FB): SouthAfrica, 2005. South African Department of Health:Pretoria.
Labadarios D., Steyn N., Maunder E., Macintyre U., SwartR., Gericke G. et al. (2000) The National Food Con-sumption Survey (NFCS): Children Aged 1–9 Years,South Africa, 1999. South African Department ofHealth, Directorate of Nutrition: Pretoria.
Labadarios D., Steyn N.P. & Nel J. (2011) How diverse isthe diet of adult South Africans? Nutrition Journal 10,33. Available at: http://www.nutritionj.com/content/10/1/33 (accessed 27 August 2011).
Langenhoven M.L., Conradie P.J., Wolmarans P. & FaberM. (1991) MRC Food Quantities Manual, 1991. 2nd edn,South African Medical Research Council: Parow.
Lock K., Pomerleau J., Cause L., Altmann D.R. & McKeeM. (2005) The global burden of disease attributable tolow consumption of fruit and vegetables: implicationsfor the global strategy on diet. Bulletin of the WorldHealth Organization 83, 100–108.
Fruit and vegetable consumption in South Africa 15
© 2011 Blackwell Publishing Ltd Maternal and Child Nutrition (2011), ••, pp. ••–••

Love P., Maunder E., Green M., Ross F., Smale-Lovely J.& Charlton K. (2001) South African food-baseddietary guidelines. Testing of the preliminary guidelinesamong women in KwaZulu-Natal and the WesternCape. South African Journal of Clinical Nutrition 14,9–19.
Love P. & Sayed N. (2001) Eat plenty of vegetables andfruits everyday. South African Journal of Clinical Nutri-tion 14, S24–S32.
Naude C. (2007) Fruit and Vegetable Consumption bySouth African Children, Aged 12 to 108 Months: A Sec-ondary Analysis of the National Food ConsumptionSurvey Data. Master’s Thesis. University of Stellenbosch:Stellenbosch.
Nel J.H. & Steyn N.P. (2002) Report on South AfricanFood Consumption Studies Undertaken Amongst Differ-ent Population Groups (1983–2000): Average Intakes ofFoods Most Commonly Consumed. South AfricanDepartment of Health: Pretoria.
Rose D., Bourne L. & Bradshaw D. (2002) Food andNutrient Availability in South African Households. Devel-opment of a Nationally Representative Database. SouthAfrican Medical Research Council: Parow.
Schneider M., Norman R., Steyn N., Bradshaw D. &The South African Comparative Risk Assessment Col-laborating Group (2007) Estimating the burden ofdisease attributable to low fruit and vegetable intake inSouth Africa in 2000. South African Medical Journal 97,717–723.
Schneider M., Bradshaw D., Steyn K., Norman R. & Laub-scher R. (2009) Poverty and non-communicable diseasesin South Africa. Scandinavian Journal of Public Health37, 176–186.
Steyn N.P., Maunder E.M.W., Labadarios D. & Nel J.H.(2006) Foods and beverages that make significant contri-butions to macro- and micronutrient intakes of childrenin South Africa – do they meet the food-based dietaryguidelines? South African Journal Clinical Nutrition 19,66–76.
WHO (1990) Diet, Nutrition and the Prevention of ChronicDiseases: Report of WHO Study Group. WHO technicalseries report no 797. World Health Organization:Geneva.
World Education (INGO) (2005) Resource Manual onIntegrated Production and Pest Management (IPPM) inVegetables. Philippines Inc: Laguna.
M. Faber et al.16
© 2011 Blackwell Publishing Ltd Maternal and Child Nutrition (2011), ••, pp. ••–••