UNIVERSITY OF KWAZULU-NATAL Effectiveness of SAP ...
96
UNIVERSITY OF KWAZULU-NATAL Effectiveness of SAP Finance Module Implementation in Pick n Pay Retail By Shannon David Whittle 204514502 A dissertation submitted in partial fulfilment of the requirements for the degree of MASTER OF BUSINESS ADMINISTRATION In the Graduate School of Business of University of Kwa-Zulu Natal Supervisor: Professor Rembrandt Klopper July 2010
-
Upload
khangminh22 -
Category
Documents
-
view
1 -
download
0
Transcript of UNIVERSITY OF KWAZULU-NATAL Effectiveness of SAP ...

UNIVERSITY OF KWAZULU-NATAL
Effectiveness of SAP Finance Module Implementation in Pick n Pay Retail
By
Shannon David Whittle
204514502
A dissertation submitted in partial fulfilment of the requirements for the degree of
MASTER OF BUSINESS ADMINISTRATION
In the Graduate School of Business of University of Kwa-Zulu Natal
Supervisor: Professor Rembrandt Klopper
July 2010

Page | 2
DECLARATION
I ………………………………………………………………declare that
(i) The research reported in this dissertation/thesis, except where otherwise indicated, is my original research.
(ii) This dissertation/thesis has not been submitted for any degree or examination at any other university.
(iii) This dissertation/thesis does not contain other persons‟ data, pictures, figures or other information, unless specifically acknowledged as being sourced from other persons.
(iv) This dissertation/thesis does not contain other persons‟ writing, unless specifically acknowledged as being sourced from other researchers. Where other written sources have been quoted, then:
a) their words have been re-written but the general information attributed to them has been referenced:
b) where their exact words have been used, their writing has been placed inside quotation marks, and referenced.
(v) This dissertation/thesis does not contain text, figures or tables copied and pasted from the Internet, unless specifically acknowledged, and the source being detailed in the dissertation/thesis and in the References sections.
Signature:

Page | 3
ACKNOWLEDGEMENTS
There are many people that have offered their time and input to assist in me completing
this research. Without their contribution I would not be able to conclude this dissertation.
However, there are individual‟s without whom this research would not have been
completed and to them go my special thanks and acknowledgement of their contributions.
Firstly, I am indebted to my supervisor Professor Rembrandt Klopper who was my
light-house in the storm. I have no doubt that I would not be writing this section
without his unwavering guidance and support.
Ursula Warner, Pick n Pay SAP project manager responsible for implementing SAP
within Pick n Pay, a huge thank you for all the valuable information and time
shared despite pressing deadlines to meet the subsequent regional SAP modules
within the organisation.
UCS was the selected SAP implementation partner for Pick n Pay and I would like
to thank Tony Nugget for his contribution.
Stephen Berry the regional manager for SAP in the Western Cape, thank you for
the literature related to the SAP success stories. They have made an important
contribution to this research.
Aboubaker Jakoet, Pick n Pay CFO elect effective April 2010, who permitted me to
undertake this research project and assisted in identifying the sample for research
questionnaire purposes and compiling of the relevant research questions
Bronwen Rohland, Pick n Pay CIO and SAP project board sponsor for being my
mentor an inspiration to get to the end.
Finally to my loving wife and beautiful sons Joshua & Luke, I would not have been
successful in completing my research if it were not for the love and support given
to me in this arduous journey of studies. My wife has been my inspiration and with
her support I have soared only where eagles dare to fly.

Page | 5
ABSTRACT
The aim of this study was to determine whether the SAP Finance module implemented in
Pick n Pay retailers was successful or not. In order to establish the success of the
implementation it was necessary to obtain a management and user perspective. In order to
assist in evaluating the effectiveness of the SAP finance module the finance strategy of the
organisation was explored with the group financial director. Information Technology and
systems justification to identify and select and appropriate ERP system are discussed in
this research document. Furthermore, a questionnaire was devised to measure the users‟
response to the effectiveness of the implementation. This questionnaire was circulated to
all the finance users of SAP in the Western Cape corporate division as well as the regional
support office. It included accountants, creditors, expenses, debtors and financial
managers. The data generated revealed that there was a significant relationship between
the training and user acceptance of the SAP system. Furthermore, there was a strong
resistance to system adoption by employees with longer service. This research document
will assist the organisation in identifying obstacles that have impacted on the success of the
implementation of SAP in the business.

Page | 6
Table of Contents
Chapter One ................................................................................................... 11
Introduction ................................................................................................... 11
1.1 RESEARCH PROBLEM ............................................................................................ 11
1.2 CONCEPT MATRIX ................................................................................................ 12
1.3 RESEARCH METHODOLOGY .................................................................................. 12
1.4 OBJECTIVES OF THE RESEARCH ............................................................................ 12
1.5 BACKGROUND OF THE RESEARCH ......................................................................... 13
1.6 A BRIEF DESCRIPTION OF PICK N PAY RETAIL STRUCTURE .................................. 13
1.7 REASON FOR THE RESEARCH ................................................................................ 14
1.8 VALUE OF THE RESEARCH .................................................................................... 15
1.9 LIMITATIONS ........................................................................................................ 15
1.10 STRUCTURE OF THE DISSERTATION ...................................................................... 15
1.11 CONCLUSION ........................................................................................................ 16
Literature Survey .......................................................................................... 18
2.1 INTRODUCTION ..................................................................................................... 18
2.2 STRATEGY ALIGNMENT ......................................................................................... 19
2.3 MANAGEMENT INFORMATION SYSTEMS ............................................................... 20
2.4 ENTERPRISE RESOURCE PLANNING ....................................................................... 22
2.5 JUSTIFYING ERP‟S FOR BUSINESS ......................................................................... 23
2.6 SAP ...................................................................................................................... 25
2.7 THE “TRAPS” OF AN ERP IMPLEMENTATION ......................................................... 29
2.10 EFFECTIVE ADULT LEARNING ............................................................................... 34
2.11 RESEARCH QUESTIONS ......................................................................................... 39
2.9 CONCLUSIONS ...................................................................................................... 40

Page | 7
Chapter 3 ........................................................................................................ 41
Research Methodology .................................................................................. 41
3.1 INTRODUCTION ..................................................................................................... 41
3.2 SAMPLING DESIGN................................................................................................ 41
3.3 RESEARCH DESIGN ............................................................................................... 44
3.3.1 Questionnaires ................................................................................................... 44
3.3.2 The Likert scale ................................................................................................. 45
3.3.3 Developing the questionnaire ............................................................................ 45
3.3.4 Ethical treatment of participants ...................................................................... 47
3.4 DATA COLLECTION............................................................................................... 47
3.5 DATA ANALYSIS ................................................................................................... 48
3.6 LIMITATIONS ........................................................................................................ 48
3.7 CONCLUSION ........................................................................................................ 48
Chapter 4 ........................................................................................................ 49
Discussion of Findings ................................................................................... 49
4.1 INTRODUCTION ..................................................................................................... 49
4.2 DESCRIPTIVE STATISTICS ..................................................................................... 49
4.2.1 Descriptive frequency statistics ......................................................................... 50
4.3 COMPARISON OF DESCRIPTIVE STATISTICS ............................................................ 53
4.3.1 Responses to Phase 3 and SAP ...................................................................... 53
4.3.2 Age dispersion and user acceptance .............................................................. 55
4.3.3 Gender dispersion and user acceptance ........................................................ 57
4.3.4 Race dispersion and user acceptance............................................................. 59
4.3.5 Language dispersion and user acceptance .................................................... 60
4.3.6 Qualifications dispersion and user acceptance ............................................. 62

Page | 8
4.3.7 Length of service dispersion and user acceptance ........................................ 64
4.3.8 Managerial position service dispersion and user acceptance ....................... 65
4.3.10 Appropriateness of SAP training ............................................................... 69
Chapter 5 ........................................................................................................ 75
Recommendations & Conclusion ................................................................. 75
5.1 INTRODUCTION ..................................................................................................... 75
5.2 HAVE THE RESEARCH QUESTIONS BEEN ANSWERED? ............................................ 75
5.3 DISCUSSION .......................................................................................................... 76
5.4 GUIDELINES .......................................................................................................... 79
5.5 RECOMMENDATIONS ............................................................................................ 81
5.6 CONCLUSION ........................................................................................................ 82
Bibliography .................................................................................................. 83
Appendix A - Letter of introduction ........................................................... 87
Appendix B - Letter of informed consent ................................................... 88
Appendix C – Ethical clearance approval .................................................. 89
Appendix D - Research Questionnaire ........................................................ 90
Appendix E - Ethical Clearance Letter ....................................................... 95
Appendix F – Concept Matrix ..................................................................... 96

Page | 9
List of Tables
Table 1: Essential ERP - Its functional scope (Jakovljevic, 2000)) 25
Table 2: Age dispersion of respondents 50
Table 3: Gender dispersion of respondents 51
Table 4: Race dispersion of respondents 51
Table 5: Language dispersion of respondents 51
Table 6: Qualification dispersion of respondents 52
Table 7: Years service dispersion of respondents 52
Table 8: Management position dispersion of respondents 52
Table 9: Computer skills dispersion of respondents 53
Table 10: Responses related to user-friendliness 54
Table 11: Responses related to data reliability 54
Table 12: Responses related to data accuracy 55
Table 13: Age dispersion responses related to user-friendliness 56
Table 14: Age dispersion responses related to data reliability 56
Table 15: Age dispersion responses related to data accuracy 57
Table 16: Gender dispersion responses related to user-friendliness 57
Table 17: Gender dispersion responses related to data reliability 58
Table 18: Age dispersion responses related to data accuracy 58
Table 19: Race dispersion responses related to user-friendliness 59
Table 20: Race dispersion responses related to data integrity 59
Table 21: Race dispersion responses related to data accuracy 60
Table 22: Language dispersion responses related to user-friendliness 61
Table 23: Language dispersion responses related to data reliability 61
Table 24: Language dispersion responses related to data accuracy 62
Table 25: Qualification dispersion responses related to user-friendliness 62
Table 26: Qualification dispersion of responses related to reliability of Phase 3 data 63

Page | 10
Table 27: Qualification dispersion responses related to accuracy of SAP data 63
Table 28: Length of service dispersion responses related to user-friendliness 64
Table 29: Length of service responses related to Phase 3 data reliability 64
Table 30: Length of service dispersion responses related to SAP data being accurate 65
Table 31: Managerial position dispersion responses related to user-friendliness 65
Table 32: Managerial position dispersion responses related to reliability of Phase 3 data 66
Table 33: Managerial position responses related to the accuracy of SAP data 67
Table 34: Computer literacy dispersion responses related to user-friendliness 68
Table 35: Computer literacy dispersion responses related to reliability of Phase 3 data 68
Table 36: Computer literacy responses related to the accuracy of SAP data 69
______________________________________________________
List of Figures
Figure 1: Structure of Pick n Pay retail division (www.picknpay.co.za) 14
Figure 2: Success probability matrix (Robson, 1997) 20
Figure 3: Levels & planning horizons of management activities (Robson, 1997) 21
Figure 4: SAP integration schema (SAP, 2010) 28
Figure 5: SAP ASAP methodology to end-user training 33
Figure 6: Stages in the selection of a sample (Cooper & Schindler, 2003) 41
Figure 7: Types of sampling designs (Cooper & Schindler, 2003) 43
Figure 8: Responses received related to „relevance of training to job and „ease of understanding‟
and „enabling end user to use SAP‟ 70
Figure 9: Responses related to 'classroom versus one-on-one training' 71
Figure 10: Responses related to 'timing of training for go-live' 72
Figure 11: Responses related to 'improved efficiencies' 73

Page | 11
Chapter One
Introduction
1.1 Research Problem
Pick n Pay has implemented the SAP as the Enterprise Resource Planning system. The
main driver for implementing SAP into the business was the fact that the legacy systems
did not provide one truth. The information that was extracted form the legacy system
would differ dependent on where it was extracted from and even to the extent of who
extracted the information. This created inefficiencies from a management reporting
perspective which compromised the integrity of the data.
To date there has been no evaluation of the efficiencies derived by the implementation of
the SAP Finance module. In order to evaluate the anticipated efficiencies it is imperative
that an assessment be conducted to establish the possible correlation of the demographics
of users and user acceptance. This includes an evaluation of the training pre and post SAP
implementation. This study intends to understand whether or not there is in fact a
correlation between demographics and user acceptance in the adoption of a new software
system in the Pick n Pay Finance division. The results of the questionnaire will contribute
to the answering this question of correlation and user acceptance. Ultimately, this
dissertation intends to establish whether or not the SAP implementation in Pick n Pay
Finance divisions achieved the desired results in that operational efficiencies were
improved; whether the implementation was successful; the learning‟s taken from the
impact that training would have as a critical success factor and ultimately whether or not
the implementation of SP has achieved the desired effectiveness within the Finance
division identified for the purposes of this research.
This questionnaire intends to evaluate the improved efficiencies introduced into the
business of the finance division with the implementation of the Finance SAP module. The
research will be limited to the finance divisions within the Western Cape. This includes
the retail finance division and the corporate divisions only.

Page | 12
1.2 Concept Matrix
A concept matrix is utilised for the purpose of the literature review. This concept matrix is
contained in Appendix F. According to Klopper et al., (2007) the concept matrix provides
a systematic approach to the literature review. This approach will ensure that the literature
review c onstitutes a we ll struc tured fr amework of re levant references to the research
project. The concept matrix included above ensures that only relevant research has been
included herein.
1.3 Research Methodology
According to Ghuari et al., (1995) one reason for collecting and using quantitative data is
to a ggregate them to a nalyse an organisation. I n or der to assess the effectiveness and
improved efficiencies of the SAP Finance module in Pick n Pay, the research methodology
to be adopted herein is quantitative in na ture. A questionnaire was distributed to all the
finance pe rsonnel in the two se lected finance divi sions of P ick n P ay. Th is re search
methodology is intended to gather quantitative data from the finance staf f within P ick n
Pay corporate division in Cape Town as well as the Western Cape support office finance
department management. The da ta was aggregated a nd analysed to measure the
relationship be tween demographics, use r acceptance o f the ne w S AP system v ersus the
legacy systems and the training they received on the new system. This questionnaire was
intended to identify the user‟s perception of the improved efficiencies brought about by the
introduction of SAP into their work environment.
1.4 Objectives of the Research
To identify the benefits that an Enterprise Resource Planning (ERP) system should
provide to an enterprise.
To understand the impact of demographics on user acceptance.
To understand the impact of demographics on training provided to implement the
SAP finance module.
To understand whether or not the implementation of the SAP finance module has in
fact improved efficiencies in Pick n Pay Retailers

Page | 13
1.5 Background of the Research
Pick n Pay consists of a decentralized structure with independent finance divisions. The
implementation of the SAP R3 ERP system of Pick n Pay commenced in January 2006
with the Western Cape region as the pilot. The Pick n Pay project manager for this
implementation was Ursula Warner. According to Ursula Warner the SAP implementation
for the Western Cape region was completed on the 17th July 2006. The plan was to
implement one region at a time, stabilize and then move on to the next region. Only the
Western Cape was at the time of the compilation of this study still in progress. It would
not be possible to research and explore the effectiveness or improvement in operational
efficiencies within all the Finance divisions within the organisation as a result of the
implementation of SAP Finance module not being fully implemented. This study will
focus primarily on the implementation of the Finance modules within the Corporate
Finance and Western Cape regional support office Finance division.
1.6 A Brief Description of Pick n Pay Retail Structure
The Pick n Pay retail environment consists of numerous business units. The Pick n Pay
retailing division business is owned and controlled by the Ackerman Family under the
Pikwik holding company. The supermarket division is decentralized according to
geographics. Each geographical region consists of a full regional support office with an
entire buying, HR and finance and administration department.

Page | 14
Figure 1: Structure of Pick n Pay retail division (http://www.picknpay.co.za)
1.7 Reason for the Research
The pr oblem state ment pe rtaining to this study is that as a re sult of th e pr essures and
deadlines relative to an implementation of a n ERP s ystem, seldom is the time taken to
actually evaluate the effectiveness and im proved e fficiencies of such implementations.
The interpretation of the implementation results are at most times prejudiced by members
of a pr oject as their key p erformance indi cators a re b ased on the succ ess of th e
implementation. This study intends to e valuate the effectiveness of the implementation
from an e nd user pe rspective; identifying the e xtent of improved e fficiencies. This
PnP Retail Division
Supermarkets Family
Franchise
Butcheries Financial
Services
Western
Cape
Eastern Cape KwaZulu-
Natal
Gauteng &
OFS
Northern
Region
Hypermarkets

Page | 15
research will include a quantitative questionnaire that will be distributed amongst the
identified finance personnel within the Corporate and Western Cape Support Office
Finance division of Pick n Pay.
1.8 Value of the Research
This will constitute the first independent assessment of the implementation of the SAP
Finance module within Pick n Pay. The business can utilize the research results to adjust
the implementation strategies for subsequent rollouts in the remainder of the regions to
ensure that the ERP system achieves the full effectiveness as per its intended design.
Furthermore, this research will enable the organisation to identify opportunities to improve
the training process to ensure that the users optimize the usage of the SAP system within
their business units to leverage efficiencies.
1.9 Limitations
The research is limited to the Corporate and Western Cape Support finance divisions of
Pick n Pay as the implementation has not taken place in the finance divisions of the
regional support offices. The research will focus on the users‟ interpretation of the
effectiveness of the implementation and will also attempt to identify improved efficiencies
in the finance division of the business.
1.10 Structure of the Dissertation
The study will be structured as follows:
Chapter Two - Literature Review
This chapter will provide a review of the literature required to support the research
questions formulated in Chapter 1 hereof. This chapter will explore strategies for
finance as identified from various literary sources as well as an interview with the
Group Financial Director of Pick n Pay Retailers (Pty) Ltd; defining Information
Technology and the justification of adopting an ERP system within IT; Aligning an
ERP system with the defined business requirements; Identifying the financial

Page | 16
impacts of ERP implementations and the various costs associated with
implementing and ERP system; The selecting of an appropriate ERP system; The
lessons learnt in selecting and implementing an ERP system.
Chapter Three - Research Methodology
This chapter will discuss the various method adopted to establish the effectiveness
of the implementation of the SAP Finance module in Pick n Pay Retailers (Pty) Ltd.
This method is by way of a designed questionnaire that will be completed by a
sample of employees situated in the Western Cape Pick n Pay Support office as
well as the Corporate Finance division in Cape Town. This research will be
followed by a review of the results of the questionnaires collected.
Chapter Four - Discussion of Findings
This chapter will review the empirical findings of the data collected in Chapter 4.
The data will be tabulated and represented as a figure and statistically analyzed.
Chapter Five - Recommendations & Conclusions
This chapter concludes the research as to the effectiveness of the implementation of
the SAP Finance module in Pick n Pay including recommendations for future
implementations to ensure maximum effectiveness and value generation to
maximize cost benefit.
1.11 Conclusion
The problem statement in this chapter has been identified in that there has been no
assessment of the implementation of the SAP Finance module in Pick n Pay. This includes
understanding the correlation between end user acceptance and demographics; the impact
of training on user acceptance and the overall achievement of the desired efficiencies
expected when implementing a new software system within an organisation. These

Page | 17
improved efficiencies include the integrity of data and the ability of management to
produce management reports that are accurate, timeous and relevant to the operational
business units. This study will include a questionnaire that will be distributed to a select
sample group in the Western Cape finance divisions. This questionnaire is structured to
identify the various demographics groups according to age, qualification, gender, status in
the organisation, computer literacy and year‟s service. The second section of the
questionnaire includes questions related to the evaluating end users view of the efficiencies
of the legacy versus the SAP system. The final section of the questionnaire deals with
understanding the end users responses to the impact of their training that they received
relative to user acceptance.
Chapter two includes a literature survey pertaining to aligning business strategy to
Information Systems. Included in this chapter is a survey on what are information
systems; enterprise resource planning (ERP), SAP; Traps of an ERP implementation;
effective adult learning and the research questions that have resulted from the problem
statement and this literature survey.

Page | 18
Chapter 2
Literature Survey
2.1 Introduction
The prime purpose of a literature review is to frame the problem under scrutiny; identify
relevant concepts, methods or techniques and facts and to position the study. The literature
review assists in shaping the research problem (Ghuari et al., 1995). The purpose of this
research project is to evaluate the effectiveness of the SAP implementation in the finance
division of Pick n Retailers (Pty) Ltd.
The chapter includes a discussion on the alignment of business strategies with IT
strategies; a brief discussion on systems and the relevance they have within an
organisation; enterprise resource planning discussion; ERP justification for business;
selection of ERP systems and the pitfalls associated with implementing ERP systems. An
entire section of this chapter will be dedicated to linking change management and training
to support end user preparation. The chapter will be concluded with formulated research
questions that will constitute the next chapter of this research project. The research
questions are intended to answer questions that have been identified as a result of the
literature review that require testing to establish the effectiveness of the SAP
implementation in the selected finance divisions of Pick n Pay retailers. The chapter will
then be summarised in the conclusion. The chapter discusses what systems are and their
functions are in the organisations environment. This chapter reviews how management
information systems support the three levels of business. These topics provide an
introduction into Enterprise Resource Planning (ERP). Included in this chapter are the
characteristics of an ERP system and its associated architecture including a rationale
adopted by an organisation to implement an ERP system. Included is a discussion as to the
benefits of SAP R/3 and the application of SAP best practice incorporating migration
obstacles, ERP implementation traps and business strategy alignment. The chapter will
include a discussion on the SAP ASAP approach to end-user training. In closing the

Page | 19
chapter will incorporate the research questions that remain to be answered by way of a
questionnaire.
2.2 Strategy alignment
Robson (1997) writes that whilst determining the strategy of an organisation is only one of
the functions of management it may be the most significant form of management decision
making. The complexity of modern business ensures that strategic management is, at least
partially, the responsibility of all managers and hence all managers require an awareness of
the business direction of the whole organisation: that is corporate strategy (Robson, 1997).
Robson (1997) continues that it is certainly desirable to plan ahead for the IS function and
that planning should be at a strategic, organisational level. It should not be only at the
level of project planning (Robson, 1997). In the same manner the business strategy flows
through to the functional areas of the business which includes IS and thus there must be a
commitment to the IT strategy which supports and is aligned to the business strategic plan.
Thompson and Strickland (2001) state that the included in the role of every company
manager is that of a strategy-making or strategy-implementing. It is flawed thinking to
view strategic management as solely the province of senior executives (Thompson and
Strickland, 2001). In essence it is a commitment from management in doing his/her job to
implement the chosen business strategy.
With this alignment of strategy between IT and the business in mind, as well as ERP
implementation strategies, Bhuta (2001) writes that top management commitment can be
secured by demonstrating that technological automation enables business strategy to be
realised. A good way to show this is to start with the strategy and then identify the
business processes that are or will be in place to fulfil the strategy. The next step is to
visualise and outline how the new system will help the organisation execute identified
processes (Bhuta, 2001). The success probability matrix by Robson (1997) is presented
below. It represents an organisation‟s chances of success from IS. The matrix simply
sums up the advantages of having consistency between IS and business strategies and
indicates the absence of total certainty even when this is the case. Given the fact that
success probability is increased if consistency is achieved it is not surprising that a great

Page | 20
deal of attention has been given to achieving some certainty of this consistency (Robson,
1997).
IS strategy/ business strategy ARE consistent
IS strategy/ business strategy ARE NOT consistent
Execution of the plan is GOOD Success is LIKELY Success is POSSIBLE
Execution of the plan is POOR Problems are LIKELY Failure is EXPECTED
Figure 2: Success probability matrix (Robson, 1997)
The crafting of an IT strategy has many facets and can be initiated from - amongst others -
business-led, inside-out or infrastructure-led approach (Robson, 1997) . From the review
above, the importance of taking c ognisance of the alignment of the IT a nd busi ness
strategy to improve the success probability of and ERP implementation is noted.
2.3 Management Information Systems
According to Shultheis and Sumner (1988) a system is an integrated set of components or
entities that interact to achieve a particular goal. Systems have characteristics, viz:
Boundaries
Outputs & inputs
Methods of converting inputs to outputs
System interfaces
The focus of this study is on a Management Information System (MIS). An information
system is a subs ystem of the business system of an organisation (Shultheis and Sumner,
1998). Robson (1997) reflects that MIS is perceived as having been developed to service
various levels and aspects of management activities to the extent that each level of MIS has
different emphasis.

Page | 21
Figure 3: Levels & planning horizons of management activities (Robson, 1997)
MIS is constructed for each of the 3–levels contained in Figure 3 above. The effectiveness
of the MIS support to each level is accumulative. The effectiveness of the decision making
derived from each level is dependent on the MIS in that particular level plus the MIS at the
levels below. To this end, strategic planning is dependent on management control, tactical
planning, op erational planning and c ontrol. A s per Shultheis and S umner (1998 ) the
purpose of each level is:
Operational planning & control systems – Collection, validation & record data that
describes the acquisition, disbu rsement of c orporate resources. This includes
financial da ta on creditors, debtors, and pa yroll and c ash takin gs. S hultheis and
Sumner sugg est that these s ystems have the characteristics of re petitiveness,
predictability, historical, detailed, internal origins, are structured in form and have
great accuracy. Ope rational s ystems support d aily tr ansactions. Its source is
internal to the business with a very structured format, and accuracy of the data is
essential.
Tactical systems – Information is structured in a summarised and aggregate format.
These s ystems, according to Shultheis and S umner pr ovide middle management
with the information r equired to c ontrol operations and their allocate re sources
Strategic
planning
Management control &
tactical planning
Operational planning & control
Management Hierarchy Planning
Horizon Long-Term
Short-Term

Page | 22
effectively. The se systems have the followin g characteristics: periodic nature;
unexpected findings; comparative nature in summary form, from both int ernal
and external sources.
Strategic planning – This level is designed for executive management and is used
on a n ad-hoc basis. S hultheis and S umner (1 998) state that the c haracteristics
include: unexpected information, predictive in nature, summary form, external data,
unstructured format and are subjective.
Shultheis and Sumner (1998) conclude that an Information System is a set of procedures
organised to generate information that enables managers to review operational, tactical and
strategic plannin g activities. Management Information Systems are d esigned to provide
the correct information f or e ffective plannin g a nd tac tical decision maki ng. In or der to
achieve this, data is often aggregated to provide these informational requirements. It must
therefore be said that operational level data systems are the bedrock of MIS. In order to
achieve this it is imperative that the transactional data is accurate and reliable.
2.4 Enterprise resource planning
The Ox ford dictionar y onli ne de fines ERP as “enterprise resource planning , th e
management of all the information and resources involved in a company‟s operations by
means of an integrated computer system”. According to Jakovljevic (2000) the acronym
ERP found it origins in defining a sophisticated and integrated software system primarily
utilised in manufacture. ERP s ystems create int eractive environments designed to assist
companies in the management and analysis of the business processes associated with stock,
orders and accounting etc. The definition has since expanded and according to Jakovljevic
(2000) there are 3 major areas of ERP, viz;
Manufacturing & logistics
Finance & accounting
Human resources & payroll

Page | 23
For the purposes of this research project focus will be limited to the finance and accounting
area o f ERP. Ac cording to Jakovljevic (2000) the finance and a ccounting modul e
encompasses bookkeeping and ensuring that debtors and creditors are paid on time. These
modules include general ledger, debtors and creditors, fixed assets, cash flow, budgeting,
cost control and financial consolidations.
ERP systems provide su pport to a ll 3 -levels and planning ho rizons of the management
activities, viz; operational, tactical a nd str ategic. Ac cording to Jakovljevic (2000) the
scope of ERP fina ncial func tionality h as progressed beyond tra ditional transactional
business functions b y enabling organisations to deliver re al-time pe rformance a nalysis
directly to the desktops of CEO‟s, CFO‟s and other relevant business managers. Leading
systems increasingly le verage „On Line Analytical P rocessing‟ (OLAP) technology.
OLAP performs multidimensional analysis of business data and provides the capability for
complex c alculations, trend a nalysis a nd sophi sticated data modelling. It is quickly
becoming the fundamental foundation for intelligent solutions.
2.5 Justifying ERP’s for business
ERP‟s are described by Haag et al ., (2005) a s being c ritical in today‟s business
environment. ERP refers to the methodology of keeping an overview of every part of the
business thus ensuring that a ll facets of the business will be co-ordinated effectively and
efficiently to contribute to the organisations st rategy. J akovljevic writes that there are 3
major reasons why companies elect to implement an ERP system, viz;
Integration of financial data
Standardization of manufacturing processes
Standardization of HR information
The e mphasis for the purposes of thi s research pr oject will be on the integration of
financial da ta. A C EO may find many versions of the truth when int erpreting a n
organisations overall pe rformance. Ea ch busi ness unit ma y w ell ha ve their own set of

Page | 24
numbers that differ from that of finance. An ERP system creates a single version of the
truth that cannot be questioned as everyone accesses the data from the same repository
(Jakovljevic, 2000). Jakovljevic also states that an ERP system is able to achieve this “one
truth” in the fundamental premise that the whole is always greater than the sum of its parts.
Transactions in traditional legacy applications systems are treated separately. These legacy
systems are based on stringent boundaries that are specific to the functions of the intended
organisation. An ERP system does not treat these transactions separately as stand-alone
activities and instead considers them as part of an inter-linked process that constitutes the
entire business.
Typical application systems are designed to store, process and present data in a standard
format that is requested by the end user. Generally there is no link between the application
systems utilised by the various business units. The purpose of the ERP system is to bridge
the application systems of the various business units by using an integrated database
system. All the transactions of the various business units are stored on this database in
tables. These tables integrate the data and enable them to be accessed by multiple users for
multiple purposes and even at multiple destinations dependent on the hardware typology
(Jakovljevic, 2000).
Jakovljevic (2000) also developed a wider ranging rationale for implementing ERP
systems as reflected in table 1 below.

Page | 25
Table 1: Essential ERP - Its functional scope (Jakovljevic, 2000))
Why companies purchase ERP
Strategic Reasons Enabling (tactical) Goals Technical Reasons
Enable new business strategies Reduce cost / improve
productivity
Standardise system platform
Enable globalization Increase flexibility Improve quality & visibility of
information
Enable growth strategies Integrate business processes Enhance technology infrastructure
Extend supply / demand chain Integrate acquisitions
Increase customer responsiveness Standardise business processes
Improve specific business
processes / performances
Jakovljevic (2000) states that in the current dynamic and turbulent business environment
there is a compelling requirement for organisations to be globally competitive.
Technology has enabled organisations to communicate across borders with ease thus
making the competitive business environment throughout the world even smaller. In order
for an organisation to survive this competitiveness they have to be closer to the customer
and deliver value-add products and services to market in shortest lead times as possible.
Speed to market is becoming a single differentiator that provides an organisation with the
required competitive advantage. Integration of business processes enables this process.
This is the stronghold of ERP.
2.6 SAP
Background to SAP
SAP is a German acronym which loosely translated means “Systems Analysis and Program
Development” or “Systems, Application, Products in data Processing”. The company was
founded in 1972 by five former IBM engineers in Mannheim, Baden-Württemburg. They

Page | 26
were Dietmar Hopp, Hans-Werner Hector, Hasso P lattner, Kla us E. Tschira a nd C laus
Wellenreuther (SAP 2010).
SAP is the world‟s largest software company and the third largest independent softwa re
provider in terms of revenues. SAP focuses on six industry sectors, viz;
Process industries
Discrete industries
Consumer industries
Service industries
Financial industries
Public services
SAP currently h as over 92,000 c ustomers worldwide. SAP services ov er 120 c ountries
that a re gr ouped togethe r in three geographical regions, EMEA (Europe, Mi ddle East &
Africa), Americas and Asia P acific Japan (J apan, Austra lia a nd pa rts of Asia ). S AP
employs in excess of 47,598 pe ople thorough these geographical regions. S AP has been
successful within Africa in providing the benefits of their application software.
Benefits of SAP
There are numerous SAP benefits but only those appropriate to this study will be explained
in this section. Important to note is that an ERP system must be an appropriate choice for
the company in order to realise such benefits. These benefits include:
Integration
Online real time environment
Research and development (not relevant for purposes of this research project)
Support (not relevant for purposes of this research project)

Page | 27
Integration - Jakovljevic (2000) states that ERP is the current generation of
resource planning systems that replaces “islands of information” with a singular packaged
software solution integrating all traditional enterprise management functions. ERP
systems utilise database technology and a single interface to control information related to
an organisation. Single application architectures such as SAP would significantly reduce
the numbers of interfaces required to be maintained. An interface is a mechanism that
updates information between systems. According to Strub (2003), if interfaces are not
designed and functioning correctly maintaining information across systems will not be
possible and will result in anomalies. Interfaces are expensive and are essential to ensure
that data is not lost or duplicated from one system to another across business units.
SAP provides seamless integration throughout all its modules. The data is updated
immediately and available for use by all other modules once the user completes the process
stage of a transaction. Integration eliminates the duplication of data and makes the
information available for sharing when the data capture process has been completed.
Figure 4 below reflects the integration schema of SAP and the various modules. This
figure reflects the SAP client that is core to the application. Attached to the SAP client are
all the various SAP modules that are available to end users. The end users may elect which
modules they wish to acquire. An organisation can elect to implement any module of these
modules at any point in time. The SAP client allows all these modules to communicate
with each other seamlessly. This is what is referred to as an integrated ERP system.

Page | 28
Figure 4: SAP integration schema (SAP, 2010)
Online real time environment - The ”R” in SAP R/3 represents “real-time”
and the number 3 relates to the “three-tier a pplication a rchitecture”. T his architecture
consists of:
Presentation layer (client or end user)
Application layer (server)
Database layer
The integrative framework of SAP does not require interfaces, uploads or batch updates to
update a single source of master data. The data is available immediately once it is captured
and reporting can be executed simultaneously to peruse the current status of any part of the
business (SAP, 2010).
CCOO CCoonnttrroolllliinngg
AAMM FFiixxeedd AAsssseettss
MMggmmtt..
WWFF WWoorrkkffllooww
IISS IInndduussttrryy SSoolluuttiioonnss
MMMM MMaatteerriiaallss
MMggmmtt..
HHRR HHuummaann
RReessoouurrcceess
SSDD SSaalleess &&
DDiissttrriibbuuttiioonn
PPPP PPrroodduuccttiioonn PPllaannnniinngg
QQMM QQuuaalliittyy MMggmmtt..
FFII FFiinnaanncciiaall
AAccccoouunnttiinngg
PPMM PPllaanntt
MMaaiinntteennaannccee
SSAAPP
CClliieenntt
SSeerrvveerr

Page | 29
2.7 The “traps” of an ERP implementation
When mi grating to an E RP s ystem one has to be mi ndful of obst acles that may pr esent
themselves in this process. There are many pitfalls when migrating to an ERP system. To
this end it is Turbit (2003) that writes of them a s the “traps” of an ERP implementation.
Management and support is one of such mentioned traps that need to be considered in an
implementation of a n ERP s ystem. To this end it is essential that the busi ness and IT
strategy are w ell a ligned. The im plementations will include but are not limited to the
following:
Corporate culture
Lack of adequate change management
Training
Impact of ERP
Corporate culture - According to Turbit (2003) most managers, who have been
through an ERP implementation, relate that the most affected part of the implementation is
the c orporate culture. This is always the most unde restimated obst acle to ensure the
success of the implementation.
Corporate culture includes:
The calibre of people that a company recruits. These qualities may include their
personal values, skills and habits.
The manner in which a n organisation operates including focus, decision making
process, stability and attitude of staff.
To ensure the success of an ERP implementation an organisation is required to adapt its
corporate culture. The se adoptions include but are not limited to implementing business
practices that are enforced and lived by its employees daily (Turbit, 2003). Turbit further
states that another dimension to cultural change is the time lines in which the change is
made. These mentioned timelines for cultural change will in each instance mean that what
is acceptable in one week may not be the case in the subsequent week.

Page | 30
Change management - It is imperative that a change management program is
included in the company‟s implementation strategy (Bhuta, 2001). An organisation is
required to be adequately equipped to handle the following issues:
The fear of failure: There is an audience that will e lect to be a b ystander in the
process for fear of being part of the project failure. This may result in delaying the
project timelines.
Resistance: Staff will resist change to “protect their turf” or even their positions.
Non-visionaries: There will a lways be people in the business that do not have a
clear understanding of the long-term relevance and importance of the project.
The key to any change management p rogram is that management needs to communicate
the importance of the project throughout the organisation (Bhuta, 2001).
Turbit (2003 ) concurs that management must de dicate efforts to change management.
According to Turbit change management is about managing expectations that enable
change to transition with minimal effort to smooth the transition. C hange management is
when people are taken out of their comfort zones and taken on a journey to the intended
destination. This process, as stated, is intended to be a journey and not just a message that
change is required. This approach to change management is about getting people used to
the idea that point C is the real destination even if they thought they were going to point B.
Turbit further states that the costs to an organisation need to be considered if a system is
forced upon people who feel they have very little ownership. These people will ensure that
the new system never gets off the ground or never achieves it full intended potential. In
both these instances the organisation will never realise its full return on investment (Turbit,
2003). Change management is tipped by Turbit (2003) to be the most important reason for
failure.
Weightman (2003) discusses corporate culture and trying to create a solution incompatible
with the company‟s culture. In the 1990‟s research found that many companies with ERP
projects saw them as a silver bullet that would solve all their problems, even if the „style‟
of solution wasn't compatible with their corporate culture traditions. An executive might
say he or she wants to operate in a g lobally centralised fa shion, to be more li ke a W al-

Page | 31
Mart, with the strength and discipline of a global head office. However, this doesn't work
if the firm's culture is one of decentralised entrepreneurship. It then can't use technology to
force change in the culture of the company. A decentralised structure would be better
suited to implement a decentralised ERP application or recognise the enormous change-
management mountain it faces.
Training - If training is not correctly managed and planned it may have a major
impact on the hidden costs associated with an ERP implementation which may be
detrimental to the success of the implementation. Turbit (2003) conducted a survey of
organisations that have implemented ERP systems and identified 10-common causes that
contributed to the implementation being a disaster. Of these 10-common causes,
insufficient training and a lack of adequate change management were mentioned as the
major contributors to the implementation being rated as a disaster.
ERP systems tend to either replace old manual systems or a “home-grown” system
designed internally specifically for the organisation. These “home-grown” systems, as
discussed earlier in this chapter, do not constitute an integrated ERP system. Therefore
when an organisation embarks on implementing a new ERP system such as SAP, it
constitutes a quantum leap for all areas of the organisation (Turbit, 2003). The entire
organisation is required to make considerable transitions from the legacy system with
which the employees have been working with for a long period of time. Traditionally the
legacy system is what the users are totally comfortable with and the new system may be
viewed as being complex and not user-friendly. According to Turbit (2003) transformation
is required at both technical and business levels. It may mean that the adoption of the new
system is required to be accelerated due to constrained timelines (Turbit, 2003). The
adoption may include a change in business processes as well as the tools of the trade.
The audience to include for training is not merely limited to end users. The resources that
are required to fulfil a support role are also required to be included in the training process.
To this end the IT team will require adequate training to fulfil their support role in the
implementation and post-implementation of the ERP system (Turbit, 2003). The

Page | 32
implementation places demands on an existing IT team equipped to ensure that the legacy
system is stable and also to ensure that they up-skill themselves on the new systems
simultaneously.
Essential to the process is the timing of the training. The sooner training commences the
smoother the transition is at the end. Sufficient time needs to be allocated to train the
identified business owners and super-users of the system. According to Bhuta (2001), if
the users are unable to understand and use the system, the project is a failure even if the
team executed everything else perfectly. That is why it is extremely important that
adequate time is allocated to end user and super user training. The best approach is the
„train the trainer‟ approach, where the end users are trained by one of their own, someone
within the same business unit. Usually the trainers are exposed to the system throughout
the implementation cycle. Users should have access to non-technical user documentation
and should be shown how to access and use the new system. This approach is successful
as the employees being trained will feel more at ease and receptive being trained by „one of
their own‟. It also releases the IT project team for many of the other tasks they are
required for.
Impact of ERP - The benefits of SAP have been discussed, viz; that of
integration and online, real time environments. The challenge that one faces is that there is
a transition from no integration, interface based systems, to that of seamless integration
which creates its own set of difficulties. The quintessence of ERP is the instantaneous
outcome a single transaction bears on all relevant data and modules of the system.
Data integrity becomes essential. The migration from manual to automated processes is
not a simple task. A new ranking of accountability, responsibility, and communication is
now given to the business process owners. Turbit (2003) describes this scenario as if stock
is moved from location A to Location B and the information is not put into the system.
The system will tell someone to get the material from A and when it is not there, they have
to go looking. At the same time it is telling someone else to put new material in B, but B is
full. The first person finds the original material in B and logs it into the system. Double
the quantity is now in the system again and it doesn‟t re-order. And so it goes on and
everyone is blaming the system.
Page | 33
2.9 SAP ASAP approach to training
This section of the chapter will share with the reader the white paper written by Andre
Simcock titled „Proposal for SAP Training and CM for HHEA dd 17/02/2006‟. The
contents of this paper are relevant in that it clearly outlines the ASAP approach to SAP
training. This approach to training is critical in ensuring the success of the training when
implementing a new ERP system such as SAP.
Simcock (2006) writes that well received end-user training is a key element that ensures a
successful implementation. The goal of implementation training should be to enable the
end-user with adequate SAP competency to perform their work with reasonable efficiency
at go-live. As SAP is highly integrated process it is important to emphasize the
development of knowledge of the new business processes as they relate to SAP defined
roles and existing organisational jobs. Therefore the training must be process based, and
must highlight the strategic rationale behind the changes and the associated benefits of the
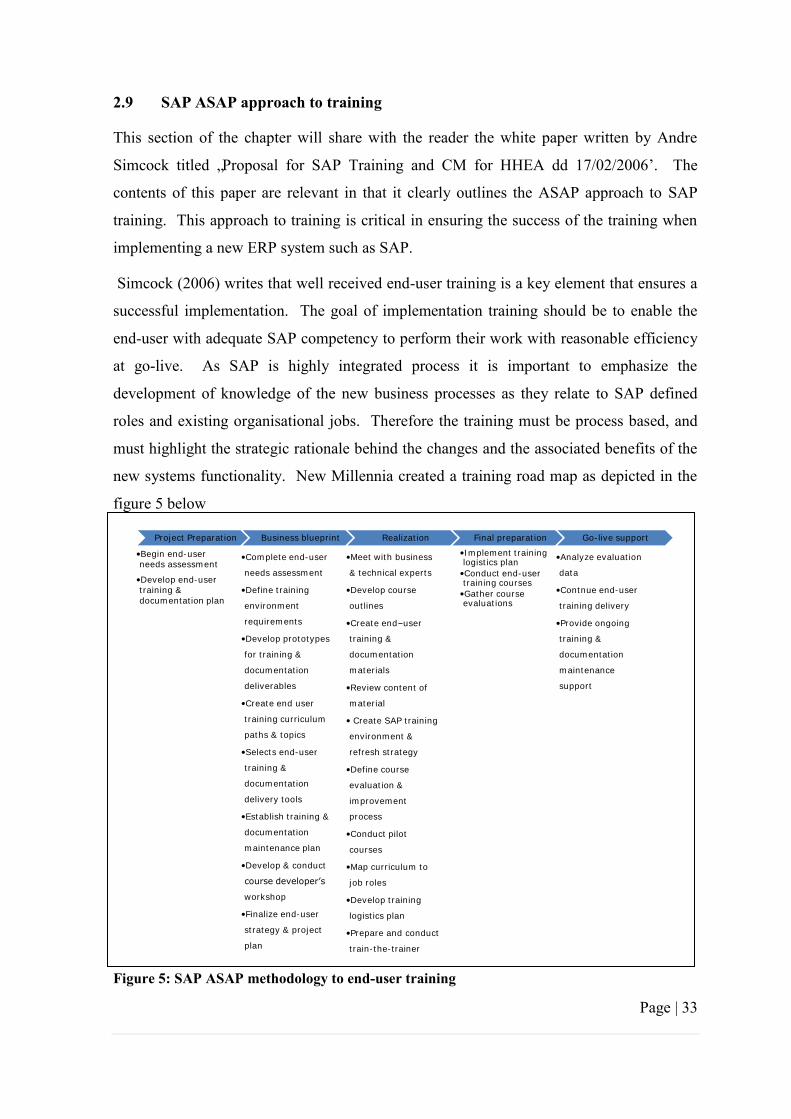
new systems functionality. New Millennia created a training road map as depicted in the
figure 5 below
Project Preparation
•Begin end-user needs assessment
•Develop end-user training & documentation plan
Business blueprint
•Complete end-user
needs assessment
•Define training
environment
requirements
•Develop prototypes
for training &
documentation
deliverables
•Create end user
training curriculum
paths & topics
•Selects end-user
training &
documentation
delivery tools
•Establish training &
documentation
maintenance plan
•Develop & conduct
course developer’s
workshop
•Finalize end-user
strategy & project
plan
Realization
•Meet with business
& technical experts
•Develop course
outlines
•Create end–user
training &
documentation
materials
•Review content of
material
• Create SAP training
environment &
refresh strategy
•Define course
evaluation &
improvement
process
•Conduct pilot
courses
•Map curriculum to
job roles
•Develop training
logistics plan
•Prepare and conduct
train-the-trainer
Final preparation
•Implement training logistics plan
•Conduct end-user training courses
•Gather course evaluations
Go-live support
•Analyze evaluation
data
•Contnue end-user
training delivery
•Provide ongoing
training &
documentation
maintenance
support
Figure 5: SAP ASAP methodology to end-user training

Page | 34
ASAP methodology is a standard process for implementing SAP. It consists of the five
phases as depicted in the figure 4 above; viz:
1. Project preparation: This stage consists of identifying team members and
developing strategies of the way forward
2. Business blue-print: This phase consists of identifying the current processes and
how SAP is to provide the solution
3. Realisation: This phases consists of implementation of all the business process
requirements that have been defined in the blue-print phase
4. Final preparation: It is at this stage that all the end-user testing and training will
occur
5. Go-live & support
2.10 Effective adult learning
The following is an extract from Kolb‟s Learning Style Inventory, as defined by Kolb et
al., (1979), which includes four learning styles:
1. Converger who can be classified as someone who wants to solve a problem and who
relies heavily upon hypothetical-deductive reasoning...to focus on specific problems.
2. Diverger who can be classified as someone who solves problems by viewing situations
from many perspectives and who relies heavily upon brainstorming and generation of
ideas.
3. Assimilator who can be classified as someone who solves problems by inductive
reasoning and ability to create theoretical models.
4. Accommodator who can be classified as someone who solves problems by carrying out
plans and experiments...and adapting to specific immediate circumstances.
These four style are based upon established learning theories as described by Kolb. The
ideas behind assimilation and accommodation originate in Jean Piaget‟s definition of
intelligence as the balance between the process of adapting concepts to fit the external
world (accommodation) and the process of fitting observations into the world of existing

Page | 35
concepts (assimilation). Convergence and divergence are the two essential creative
processes identified by J.P. Guilford‟s structure-of-intellect model. (Kolb, 1979).
To determine a person‟s learning style, the person completes an instrument called
Learning-Style Inventory by answering questions contained in the Self-Scoring Inventory
and Interpretation Booklet (Kolb, 1979).
Kolb has described the learning process as a four-phase cycle in which the learner: (1) does
something concrete or has a specific experience that provides a basis for (2) the learner's
observation and reflection on the experience and his or her own response to it. These
observations are then (3) assimilated into a conceptual framework or related to other
concepts in the learner's past experience and knowledge from which implications for action
can be derived; and (4) tested and applied in different situations.
1. Experiencing or immersing oneself in the "doing" of a task is the first stage in
which the individual, team, or organisation simply carries out the task assigned.
The engaged person is usually not reflecting on the task at this time, but carrying it
out with intention.
2. Reflection involves stepping back from task involvement and reviewing what has
been done and experienced. The skills of attending, noticing differences, and
applying terms help identify subtle events and communicate them clearly to others.
A learner‟s paradigm (values, attitudes, beliefs) influences whether he or she can
differentiate certain events. Vocabulary is also important, since words are
necessary for verbalizing and discussing perceptions.
3. Conceptualization involves interpreting the events that have been noticed and
understanding the relationships among them. At this stage, theory may be
particularly helpful as a template for framing and explaining events. Paradigm
again influences the interpretive range a learner is willing or able to entertain.
4. Planning enables taking the new understanding and translating it into predictions
about what is likely to happen next or what actions should be taken to refine the
way the task is handled.

Page | 36
The logic of the learning cycle is to make many small and incremental improvements.
When many people make these improvements, major improvements result over time.
Likewise, when the learning cycle becomes habitual, the result is continual improvement.
Stage I: Concrete Experience
Learning initially occurs when a person encounters a new concrete experience and deals
with it in terms of observations, feelings, and reactions. Accordingly, the most profound
way to promote Stage I learning is to provide the student with exploratory tools e.g.
concrete experiences and materials. Kolb maintains that learners should become actively
involved in the exploration of the learning experience if they are to get the most out of it.
This can involve drawing up a checklist of things the learner should try to do: actively
observing what‟s going on, producing a log or record of some sort, and formulating
appropriate questions.
Stage II: Observation and Reflection
As the student observes the new situation in Stage I, the student adds to or adjusts his or
her perceptions based on previous learning. This process compels the student to reflect on
past experiences and to think about the current experience as either fitting into previous
patterns or not. This is generally acknowledged as the most difficult stage of the Kolb
cycle, but is probably the most crucial of all. Students and practitioners should reflect on
what they learned, how they learned it, why they learned it, whether the learning
experience could have been more effective, and so on. Discussion of these reflections with
an instructor can prove extremely helpful, as can peer-to-peer discussions, either
informally or at a formal debriefing session of some sort.
Stage III: Concept Formation
If the experience fits a pattern, then the student can form a generalization and a set of
concepts to define the situation. As the student develops these concepts and
generalizations, his or her thinking includes imagining other discrete concrete experiences
that invariably raise new questions. The answers to these questions require further learning

Page | 37
experimentation and the accompanying development of new concepts. Accordingly, the
most profound way to promote Stage III learning is by introducing the student to key
concepts e.g. subject vocabulary and relationship diagrams.
This stage is very often left out of experiential learning programs, but is extremely
important if learners are to gain the maximum possible benefit from such programs. The
main object of this stage is to link the actual learning experience with the theories that
describe it, and/or with a greater understanding of the theories that the learning experience
was designed to illustrate. Again, discussion with an instructor or advisor can prove
extremely helpful during this stage of the Kolb cycle, as can discussion with peers.
Stage IV: Testing Implications in New Situations
When the student realises that the answers constructed in Stage III are not necessarily
complete, further testing is required. The student proposes new concrete experiments and
restarts the learning cycle. Accordingly, the most profound way to promote Phase IV
learning is by helping the student formulate new situations to be tested.
Kolb believes that the learner must be involved in the planning of the learning experience
if experiential learning is to be fully effective. This can be done in a variety of ways
through action planning or preparing a learning contract. The former may involve nothing
more than jotting down a set of things to do, or discussing the proposed procedure with the
instructor. In either case, it is useful for individual learners to set their own objectives for
the action plan. If a formal learning contract is used, this should be drawn up using a
standard checklist.
In summary, the four elements are drawn from two dimensions, each of which forms a
dialectic and represents the two things that can be done with information. The first is to
grasp the information, i.e., to become aware of it. The dialectic lies between grasping
information by first-hand experience (concrete experience), which Kolb refers to as
apprehension, and grasping by calling up a memory (abstract conceptualization), which

Page | 38
Kolb refers to as comprehension. Apprehension is external; the information is only
available in the “here and now.” For example, only when you are touching a piece of ice
does it feel cold. Comprehension is an internal process and is not bound by the instant of
time. The second is to transform the information. Similarly, there is dialectic between the
external process of active experimentation and the internalised reflective observation. This
transformation of information is the key to creating knowledge and is crucial to
understanding that learning is an active process.
Billington (1988) writes that there are seven characteristics of highly effective adult
learning. The seven factors found in learning programs that stimulated adult development
are:
1. An environment where students feel safe and supported, where individual needs
and uniqueness are honoured, where abilities and life achievements are
acknowledged and respected. 2. An environment that fosters intellectual freedom and encourages experimentation
and creativity. 3. An environment where the faculty treats adult students as peers--accepted and
respected as intelligent experienced adults whose opinions are listened to,
honoured, appreciated. Such faculty members often comment that they learn as
much from their students as the students learn from them. 4. Self-directed learning, where students take responsibility for their own learning.
They work with faculty to design individual learning programs which address what
each person needs and wants to learn in order to function optimally in their
profession. 5. Pacing or intellectual challenge. Optimal pacing is challenging people just beyond
their present level of ability. If challenged too far beyond, people give up. If
challenged too little, they become bored and learn little. Pacing can be compared to
playing tennis with a slightly better player; your game tends to improve. But if the
other player is far better and it's impossible to return a ball, you give up,
overwhelmed. If the other player is less experienced and can return none of your

Page | 39
balls, you learn li ttle. Those a dults who reported experiencing hi gh l evels of
intellectual stimulation--to the point of feeling discomfort--grew more. 6. Active invol vement in learning, a s opposed to pa ssively li stening to lectures.
Where students and inst ructors int eract and dial ogue, whe re students try out new
ideas in the workplace, where exercises and experiences are used to bolster facts
and theory, adults grow more. 7. Regular feedback mechanisms for students to tell faculty what works best for them
and wha t they w ant and ne ed to learn--and fa culty who hear and make changes
based on student input.
In contrast, in learning programs where students feel unsafe and threatened, where they are
viewed a s underlings, life a chievements not honoured, those students tend to regress
developmentally, e specially in self-esteem and se lf-confidence. In p rograms where
students are required to take identica l lockstep c ourses, whether relevant to professional
goals or not, and wh ere the y a re of ten expected to spend se veral years working on a
dissertation that is pa rt of a pr ofessor's research pr oject instead of on a topi c of their
choice, they grow less. In other words, students grow more in student-centred as opposed
to faculty-centred programs.
2.11 Research Questions
The literature review has enabled the researcher to identify that there are critical elements
to consider when im plementing a n ew ERP s ystem in an organisation. To this end the
purposes of implementing an ERP system is intended to improve operational efficiencies
and a lign the IT stra tegy to the business strategy. In a ddition to this the impact that
training would ha ve o n user a cceptance is critical to ensuring a succ essful ERP
implementation. To this end the literature re view ha s identified a spects of the ERP
implementation in Pick n Pay‟s finance division that require answering to evaluate the
effectiveness of the implementation in improving efficiencies are concerned.
What is the end-user acceptance to SAP versus the legacy Phase 3 system?
Is the there a possible correlation between demographics, user acceptance and the
appropriateness of the SAP training provided to the end user?

Page | 40
What are the end-user perceptions of the improved efficiencies introduced into the
finance division by implementing SAP?
These research questions will be addressed by means of the research design established in
chapters 3 a nd the finding s of the research qu estionnaire de livered in Chapter 4 o f this
research project.
2.9 Conclusions
The li terature r eview contained in this chapter was not intended to be exhaustive but to
introduce the reader hereof to literature that is perceived to be of relevance to this study.
This chapter int roduces the reader to strategy a lignment; systems and wha t they do;
enterprise resource plan ning (E RP); ERP just ification for busi ness; S AP; traps for ERP
implementations; the SAP ASAP approach to training and effective adult learning. T his
literature review will enable the research to be focused on achieving the objectives of this
research p roject and c reate research que stions that re quire a nswers to c onclude the
research.
Chapter 3 c overs the r esearch methodolo gy th at is applied for the purpose of this
dissertation. This includes the development of adopting the correct method of sa mpling
and designing an appropriate research questionnaire that will suitably address the research
questions formulated in this chapter.

Page | 41
Chapter 3
Research Methodology
3.1 Introduction
The completion of the literature review and definition of the research questions is followed
by the research methodology. Th e purpose of this chapter is to share with the reader the
sampling de sign whic h include s the defining the targeted audience a nd sa mpling
methodology. The research design is reviewed in detail on the development and design of
the questionnaire. The detail related to the data collected will be collated, analyzed and
discussed in this chapter.
3.2 Sampling Design
Zikmund (2003 ) indicates that th e pr ocess of sampling invol ves any pr ocedure using a
small number of items or parts of a whole population to make conclusions regarding the
whole population. A researcher is required to make de cisions on several stages in the
selection of a sa mple prior to making c onclusions of the sample. These sta ges are
according to Cooper and Schindler (2008) and are summarised in Figure 6 below.
Determine the population Determine the parameters of interest Determine the sampling frame Determine the type of sample Determine the size of the sample Select the actual sample units Conduct fieldwork
Figure 6: Stages in the selection of a sample (Cooper & Schindler, 2003)

Page | 42
Cooper and Schindler refer to the population as the total collection of elements about
which a researcher intend to make inferences. In determination of the population, it was
advised by Professor Rembrandt Klopper to limit the research to the Western Cape region.
This would enable the research questionnaires to be controlled to ensure that the response
rate was acceptable.
According to Cooper and Schindler (2003) the parameters of interest are summary
descriptors of variables of interest in the population. Due to the geographic dispersion of
the various business units within Pick n Pay it was decided that the sample would be
limited to the Western Cape region. To this end the corporate finance division and
Western Cape regional support finance division of Pick n Pay was selected as the sample
for the purposes of this study.
Cooper and Schindler et al., (2003) state that the sampling frame refers to a list of elements
from which a sample may be extracted. In consultation with the Aboubaker Jakoet, Pick
n Pay Retail Finance Director and recently appointed Chief Financial Officer (CFO)
effective 1st April 2011, the sample audience was limited to all finance employees within
the finance divisions of corporate and the Western Cape regional support office that were
deemed to be of supervisory (even if clerical) and management only.
According to Cooper and Schindler (2003) the members of a sample are selected on a
probability basis or by another means. Probability sampling is based on the concept of
random selection – a controlled procedure that assures that each population element is
given a known nonzero chance of selection. In contrast, non-probability sampling is
arbitrary (non-random) and subjective. Each member does not have a known non-zero
chance of being included.

Page | 43
There are several types of sampling designs as viewed in the figure 7 below.
Element selection
Representation bias
Probability Non-probability Unrestricted Simple random Convenience
Each population element has an equal chance of being selected into the sample
The sampling procedure used most to obtain those units or people most conveniently available
Restricted Systematic Purposive or Judgement
Selects an element of the population beginning with the random start and following the sampling fraction selects every nth element
An experienced individual selects the sample based upon some appropriate characteristic of the sample members
Cluster Quota
Population is divided into internally homogenous subgroups. Some are randomly selected for further study
The researcher classifies the population pertinent properties , determines desired proportion of the sample from each class and fixes quotas for each interview
Stratified Snowball
Divides the population into subpopulations or strata and uses simple random on each stratum. Results may be weighted and combined.
Initial respondents are selected by probability samples; additional respondents are obtained by referral from initial respondents
Double
Process includes collecting data from a sample using a previously defined technique. Based on the information found, a subsample is selected for further study
Figure 7: Types of sampling designs (Cooper & Schindler, 2003)
This study intends to utilise the non-probability purposive or judgemental sample.
Saunders, Lewis and Thornhill (1997) state that a purposive or judgemental sample will
best enable the respondents to answer the research questions to achieve the objectives of
this study. Furthermore, the retail financial director has also indicated that this approach
would be most suited for the purposes of this study.
The total sample size identified totals 40-employees. Of the 40-employees a total of 2
were on leave and therefore did not respond. A total of 38-employees (95%) responded to
the questionnaire.

Page | 44
3.3 Research Design
The most im portant pa rt of the research fr amework is the method in which data will be
collected (Lubbe a nd Klopper, 2005). Th ere a re two sour ces of d ata, viz; primary and
secondary data. Primary data sources provide an inside view of a particular event or time
period. S econdary da ta sourc e int erprets and a nalyses pr imary sour ces. Ac cording to
Ghauri et al. , (1995) secondary sources relevant to the research pr oblem shoul d be
reviewed before collecting primary data. These sources include, amongst others, textbooks
and other published material, academic as well as organisational journals, newsletters. In
the literary review of this research the source of data used is that of secondary data.
Data has to be collected relevant to the study if secondary data is not available to assist in
answering the research question is known as primary data (Ghauri et al. , 1995). Primary
data sourc es are created by the p erson tha t creates the sou rce e.g. interviews,
questionnaires, speeches, letters and research data.
3.3.1 Questionnaires
As per Gha uri et al. , (1995) the most popular da ta collection methods are surve ys and
questionnaire. According to Lubbe and Klopper (2005) a questionnaire is a document that
consists of a list of questions that the identified respondents are required to answer. Lubbe
and Klopper su ggest that open (or unst ructured) questions can b e used in preliminary
surveys to g et a feel fo r the subject. In thi s instance respondents would enter their
responses in their own words only. Alter nately on e c ould make use of c losed (o r
structured) que stions. This type of que stion i s primarily applied in lar ge-scale da ta
collection. In thi s instance a respondents will se lect their responses from alternatives o r
assign a numerical score or ranking. Likert-type scales (Lubbe and Klopper, 2005) make
use of this closed type of question.
According to Cooper and Schindler (2003) there are six response strategies viz;
Free-response - open-ended questions
Dichotomous - usually s uggests two opp osing re sponses for example a yes or no
answer
Multiple choice - more than two alternatives to choose form

Page | 45
Checklist - allows the participant to give multiple responses to a single question
Rating - requires the participant to position each factor on a caparison scale
Ranking stra tegy - when relative or der of the re sponse is important as the
respondent is asked to place items listed in a ranked order.
3.3.2 The Likert scale
Cooper a nd Schindler ( 2003) indicate th at the Likert scale is the most fr equently used
variation of the summated rating scale. A respondent is requested to agree or disagree with
each state ment. The de gree of the response is determined b y a numer ic score. The
numeric score is generally on a scale of 1-5 and is represented as follows:
1 Strongly agree
2 Agree
3 Undecided
4 Disagree
5 Strongly disagree
Generally 3 would represent an “undecided” response to cater for respondents that wished
to remain neutral in their responses.
3.3.3 Developing the questionnaire
The literature review developed and identified research questions that required responses.
This requirement was a precursor to the development of a questionnaire.
As pe r Lubbe and Klopper (2005 ) the following criteria would constitute a sound
questionnaire:
Must be complete – exacts all required data including demographic questions at the
beginning;
Must be concise – must short enough to enable the respondent to complete quickly;

Page | 46
Questions must be relevant;
Include clear instructions;
Questions must be precise, unambiguous and easily understandable;
Question must not be suggestive;
Primarily makes use of closed-ended questions
The questions must relate to the objectives of the paper (Lubbe and Klopper, 2005).
The questionnaire consists of three parts and 30-questions, viz;
Demographics – 9 questions
Evaluation of the efficiency of the legacy and SAP systems – 12 questions
Evaluation of the users SAP training experience – 9 questions
A five point Likert style mea surement h as also been used for part two and thre e o f the
questionnaire. This Likert scales is represented as follows:
1 Strongly agree
2 Agree
3 Undecided
4 Disagree
5 Strongly disagree
The research objectives intend to answer the research questions. The first section of the
questionnaire is intended to identify the demographics of the sample groups.
The second section of the questionnaire is intended to evaluate the end users responses as
to the efficiencies they experienced using a legacy system versus the new SAP system.
The fina l objective is to understand the impact training had on user a cceptance and a lso
whether or not the training contributed to end user adoption of the new SAP system.

Page | 47
3.3.4 Ethical treatment of participants
The ethical treatment of questionnaire participants is a very important subject. Cooper and
Schindler (2003) describe that wh en ethics are discussed in research design, whether data
is gathered in an experiment, interview, observation, or survey, the respondent has many
rights to be safeguarded. To ensure the rights of the respondent are secured an informed
consent form forms part of the que stionnaire do cument. Cooper a nd Schindler (2003 )
further state that securing informed consent from respondents is a matter of fully disclosing
the procedures of the pr oposed surv ey or other re search d esign before re questing
permission to proceed with the study.
Permission was obtained from Aboubaker Jakoet, Pick n Pay Retailers (Pty) Ltd financial
director and C FO elect effective Ap ril 2011 to conduct the research a nd to send out a
questionnaire to the r espondents. The sa mple o f the questionnaire and l etter of consent
was submitted and approved by the Ethics committee at the University of KwaZulu Natal
prior to being dist ributed to the identified re spondents. The que stionnaire a dvised the
respondents that their participation wa s fully v oluntary a nd all infor mation wa s totally
confidential.
3.4 Data Collection
As the identifie d sa mple gr oup wor k in the same of fice c omplex a s the re searcher, th e
decision was taken to conduct the survey vi a e -mail. Creative Research Systems (2005)
indicates that e-mail surveys are economical and quick. They further add that this method
of data collection often stimulates higher response levels than ordinary mail reviews. This
method of da ta collection wa s decided on due t o the fact that a ll the respondents email
addresses were known. This method is also easy to use and simple for the respondents to
respond to. All t he e mail a ddresses of the participants were suppl ied by th e busi ness.
Each re spondent was e-mailed a c opy of the following doc umentation o n the 13th April
2010:
A letter that advised them of the purpose of the research
A letter of consent that was required to be signed by each respondent
The questionnaire
The documentation was completed and returned by Friday, 30th April 2010.

Page | 48
3.5 Data Analysis
All the answers of the selected respondents is tabulated and presented in figures utilising
Microsoft Ex cel. All amounts are round ed in Excel according to Excel rules. The
approach was to firstly identif y r eport in tabular for mat on the demographics of the
respondents. Thereafter the responses were represented as follows:
Evaluation of efficiency of legacy and SAP system
Each question was compared to the demographics of the respondents to establish
the correlation of demographics and user acceptance
Evaluation of user SAP training experience
Each qu estion in this section w as compared to the demographics of e ach
respondent. The purp ose thereof wa s the identify the relationship be tween
demographics and the SAP training experience of the respondents
3.6 Limitations
The limitation of thi s research is that Pick n Pay Retailers consists of numerous finance
divisions. There is a total of ten various finance division in the retailing division and only
two of such divisions have be en include d in thi s research. Th erefore the selected
respondents cannot be seen to be representative of the entire company.
3.7 Conclusion
The purpose of this chapter to illustrate the practical aspects of the research methodology
and design selected and applied for this study. T his chapter is structured to introduce the
concept of sampling design and the relevant components thereof. Once the correct method
of sa mpling ha s been i dentified the reader is introduced to the research de sign. This
section focuses on the questionnaire development and design. The ethical treatment of the
survey participants was also discussed. The data collection and data analysis discussion
followed. The chapter wa s concluded b y hi ghlighting the limitations in the research
methodology. In the chapter to follow the empirical findings of the survey conducted at
will be discussed.

Page | 49
Chapter 4
Discussion of Findings
4.1 Introduction
Chapter 3 introduced the research methodology that governed the empirical part of this
research undertaken for the purposes of this study. The purpose of this chapter reviews the
empirical findings of the research questionnaire completed by the identified sample group
in Pick n Pay Retailers finance divisions. The questionnaire was distributed to 40
employees in the finance division. There were 38 responses to the questionnaire which
translated to a strike rate of 95% which is perceived to be adequate for the purposes of this
study. The structure of this document is to tabulate and statistically express and interpret
the data gathered. The purpose of the data is to interpret the responses of the selected
respondents. The results hereof will enable the researcher to answer the research questions
posed in Chapter 2 and thus achieve the research objectives of this research. This chapter
will demonstrate statistical analysis of the data and to make recommendations and
conclusions in the final chapter of this research paper.
4.2 Descriptive Statistics
The sample questionnaire was constructed utilizing the Likert scale approach scored from
1–5. To this end the scoring thereof would be represented as follows:
1 Totally agree
2 Partially agree
3 Agree
4 Partially disagree
5 Totally disagree

Page | 50
4.2.1 Descriptive frequency statistics
The tables below depict the demographic statistics of the respondents in Pick n Pay that
participated in the questionnaire. The demographic criteria included herein included:
Age of respondents
Gender dispersion of respondents
Race of the respondents
Language of choice of the respondents
Qualification of the respondents
Years of service of the respondents
Position of the respondents
Computer Literacy
Table 2 below reflects the age group dispersion of the respondents. Th e majority of the
respondents were in the range of 26-40 (53%) and 41-55 (42%) years of age and only 5%
at 55+ years.
Table 2: Age dispersion of respondents
Age Frequency % Valid % Cumulative %
-25 0 0% 0% 0%
26 – 40 20 53% 53% 53%
41 – 55 16 42% 42% 95%
55+ 2 5% 5% 100%
Total 38 100 100
Table 3 below includes the gender dispersion of the respondents. The female respondents
comprised 21 (55%) and the males 17 (45%) of the total sample group.

Page | 51
Table 3: Gender dispersion of respondents
Gender Frequency % Valid % Cumulative %
Male 17 45% 45% 45%
Female 21 55% 55% 100%
Total 38 100 100
Table 4 below reflects the race of the respondents. Of the respondents 19 (50%) are White,
16 (42%) Coloured, 2 (5%) Black and only 1 (3%) Indian.
Table 4: Race dispersion of respondents
Race Frequency % Valid % Cumulative %
Black 2 5% 5% 5%
Coloured 16 42% 42% 47%
Indian 1 3% 3% 50%
White 19 50% 50% 100%
Total 38 100 100
Table 5 below reflects the various languages of the respondents. The majority (82%) of
the respondents were English speaking whilst the remainder (18%) were Afrikaans
speaking.
Table 5: Language dispersion of respondents
Language Frequency % Valid % Cumulative %
English 31 82% 82% 82%
Afrikaans 7 18% 18% 100%
Xhosa 0 0% 0% 100%
Zulu 0 0% 0% 100%
Other 0 0% 0% 100%
Total 38 100% 100%
Table 6 below reflects the various qualifications and education levels of the respondents.
These results were somewhat dispersed in that the majority of the respondents were
matrics (42%) whilst 58% of the respondents were possession of a post graduate degree.

Page | 52
Table 6: Qualification dispersion of respondents
Qualification Frequency % Valid % Cumulative %
High School 16 42% 42% 42%
Technical Diploma 5 13% 13% 55%
Degree 12 32% 32% 87%
Masters Degree 1 3% 3% 89%
Doctoral Degree 0 0% 0% 89%
Other 4 11% 11% 100%
Total 38 100% 100%
Table 7 below reflects the year‟s service of the respondents. The majority of the
respondents have been employed in Pick n Pay for a period longer than 15 years (47%).
Table 7: Years service dispersion of respondents
Years Service Frequency % Valid % Cumulative %
0 – 2 5 13% 13% 13%
2 – 5 8 21% 21% 34%
5 – 10 5 13% 13% 47%
10 – 15 2 5% 5% 53%
15+ 18 47% 47% 100%
Total 38 100% 100%
Table 8 below reflects the management positions of the respondents. The majority of the
respondents are middle management down (81%). Senior management comprised 13%
and executive management only 5%.
Table 8: Management position dispersion of respondents
Position Frequency % Valid % Cumulative %
Clerical 8 21% 21% 21%
Junior Management 13 34% 34% 55%
Middle Management 10 26% 26% 82%
Senior Management 5 13% 13% 95%
Executive Management 2 5% 5% 100%
Total 38 100% 100%

Page | 53
Table 9 below reflects the computer skills proficiency levels of the respondents. Only 3%
of the respondents considered their computer skills to be be low a verage whils t 8%
considered their skills to be exceptional. The majority of the respondents were of the view
that their computer skills were average and above.
Table 9: Computer skills dispersion of respondents
Computer Skills Frequency % Valid % Cumulative %
Below Average 1 3% 3% 3%
Average 22 58% 58% 61%
Above Average 12 32% 32% 92%
Exceptional 3 8% 8% 100%
Total 38 100% 100%
4.3 Comparison of descriptive statistics
The comparative descriptive statistics are displayed in various formats below. Use is made
of table s for the significant findings and the strategic results will be represented in this
section. The data collected will be presented accordingly to answer the research questions.
These are represented as follows:
User responses to Phase 3 and SAP
Possible c orrelation between demographics, user a cceptance a nd the
appropriateness of the SAP training provided to the end user based on responses
User responses regarding their perception of the improved efficiencies introduced
into the finance division by implementing SAP
4.3.1 Responses to Phase 3 and SAP
The tables below reflect the responses received related to the use of Phase 3 and SAP.

Page | 54
Table 10: Responses related to user-friendliness
Questions Totally Agree
Partially Agree Agree Partially
Disagree Totally
Disagree
Phase 3 is more user friendly than SAP 0.00% 18.42% 10.53% 21.05% 50.00%
Phase 3 was more user friendly 0.00% 10.53% 10.53% 23.68% 55.26%
SAP is user friendly 44.74% 23.68% 15.79% 7.89% 7.89%
Table 10 above reflects the 3 questions that were posed regarding the user friendliness of
of the Phase 3 legacy system versus the new SAP system. These questions were cross
referencing in nature in that they tested the consistency of the responses albeit posed in
another manner. The responses reveal that the results produced clearly indicate that
71.05% of the respondents disagree that Phase 3 legacy system is more more user friendly
than SAP. This response is support by the following two questions where the responses
validate this view. A total of 78.94% respondents disagreed that the Phase 3 legacy system
was more use friendly and 84.21% of the respondents agreed that SAP is in fact user-
friendly. The results of the responses to the 3 question above are not contradictory and
therefore lend merit to the interpretation thereof.
Table 11: Responses related to data reliability
Questions Totally Agree
Partially Agree Agree Partially
Disagree Totally
Disagree
Phase 3 data was always reliable 5.26% 7.89% 21.05% 26.32% 39.47%
SAP information is always reliable 18.42% 55.26% 7.89% 13.16% 5.26%
Table 11 above reflects that 2 questions were posed to the respondents regarding the
reliability of the information generated by the 2 systems. A total of 67.59% of the
respondents agreed that the data from the Phase 3 legacy system was always reliable. Only
34.21% of the respondents did not agree that the Phase 3 legacy system information was
reliable.

Page | 55
The responses as to whether SAP information was reliable generated varied responses.
Only 18.42% of the respondents totally agreed that the SAP information is always reliable.
A total of 81.58% of the respondents were convinced that the SAP information is always
reliable. These responses were consistent with the former question on the Phase 3 legacy
system. Therefore these 2 questions did not precipitate contradictory responses in that
respondents agree that phase 3 data was not always reliable and that SAP information is
always reliable. Respondents inferred a low confidence in the Phase 3 legacy system data
whilst they inferred a higher confidence level in the data from newly implemented SAP
system.
Table 12: Responses related to data accuracy
Questions Totally Agree
Partially Agree Agree Partially
Disagree Totally
Disagree
SAP data is accurate 21.05% 47.37% 15.79% 13.16% 2.63%
SAP provides a single truth in that the data is accurate 21.05% 42.11% 21.05% 7.89% 7.89%
Table 12 above reflects the responses received regarding the accuracy of the SAP data.
The objective of these 2 questions was to test whether the responses regarding the accuracy
of the SAP data was answered consistently. In both of these questions 21.05% of the
respondents totally agreed that the SAP data is accurate. In both instance 84.21% of the
respondents agreed that the SAP data is accurate whilst 15.79% of the respondents did not
agree that the SAP data was accurate.
4.3.2 Age dispersion and user acceptance
The following tables reflect the responses from selected questions that may infer the
relationship between age dispersion and user acceptance.

Page | 56
Table 13: Age dispersion responses related to user-friendliness
Question Rating Age
Total 26 - 40 41 – 55 55+
Phase 3 is more user friendly than SAP
Totally agree
Partially agree 7.89% 10.53% 18.42%
Agree 5.26% 5.26% 10.53%
Partially disagree 10.53% 5.26% 5.26% 21.05%
Totally disagree 28.95% 21.05% 50.00%
Total 52.63% 42.11% 5.26% 100%
In order to infer the causality that age may have on the respondents adopting the new SAP
system, the question as to whether Phase 3 was more user-friendly than SAP was selected.
Table 13 reflects the responses received in the age dispersion whereby respondents agreed
SAP was more user friendly than the Phase 3 legacy system comprised 26-40 (75%), 41-55
(63%) and 55+ (100%). Table 13 does not conclusively provide sufficient evidence to
establish a correlation between age and user acceptance.
Table 14: Age dispersion responses related to data reliability
Question Rating Age
Total 26 - 40 41 – 55 55+
Phase 3 data was always reliable
Totally agree 2.63% 2.63% 5.26%
Partially agree 2.63% 2.63% 2.63% 7.89%
Agree 10.53% 10.53% 21.05%
Partially disagree 15.79% 10.53% 26.32%
Totally disagree 23.68% 15.79% 39.47%
Total 52.63% 42.11% 5.26% 100%
Table 14 reflects the responses related to the question as to the reliability of the Phase 3
legacy system data. The responses have been represented according to the age dispersions
included in the research questionnaire. The responses received in the age dispersion where
the respondents do not agree that Phase 3 data was always reliable are represented as 26-40
(75%) and 41-55 (63%). Only 100% of the respondents aged 55+ agreed that Phase 3
legacy system data was always reliable. It may be inferred that new system adoption may
be slower with the older generations.

Page | 57
Table 15: Age dispersion responses related to data accuracy
Question Rating Age
Total 26 - 40 41 - 55 55+
SAP data is accurate
Totally agree 16% 5% 21%
Partially agree 24% 24% 47%
Agree 8% 3% 5% 16%
Partially disagree 5% 8% 13%
Totally disagree 3% 3%
Total 53% 42% 5% 100%
Table 15 reflects the responses received from the respondents that responded to the
question to the question as to whether SAP data is accurate or not. These respondents
represent the age dispersion responses as 26-40 (90%), 41-55 (75%) and 55+ (100%).
These responses infer that the majority of the respondents did agree that SAP data is
accurate. Tables 13 to 15 do not conclusively infer a correlation between the age of the
users and user acceptance.
4.3.3 Gender dispersion and user acceptance
The following tables reflect the responses from selected questions that may infer the
relationship between age dispersion and user acceptance.
Table 16: Gender dispersion responses related to user-friendliness
Question Rating Gender
Total Male Female
Phase 3 is more user friendly than SAP
Totally agree 0%
Partially agree 11% 8% 18%
Agree 11% 11%
Partially disagree 16% 5% 21%
Totally disagree 18% 32% 50%
Total 45% 55% 100%

Page | 58
The responses reflected in the table 16 indicate that 76% males and 67% of the females did
not agree that the phase 3 data was more user friendly than SAP. It may be inferred from
the above that user friendliness of the systems is gender dependent.
Table 17: Gender dispersion responses related to data reliability
Rating Gender
Total Male Female
Phase 3 data was always reliable
Totally agree 5% 5%
Partially agree 8% 8%
Agree 8% 13% 21%
Partially disagree 13% 13% 26%
Totally disagree 11% 29% 39%
Total 45% 55% 100%
The data in the table 17 reflects the gender dispersion responses related to the reliability of
the data. The data reflects that only 47% of the males and 24% of the females agreed that
the SAP data was accurate. Almost double the male respondents are of the view that the
SAP data is accurate. The sample group is equally male and female. The male
respondents therefore agree more with the SAP data.
Table 18: Age dispersion responses related to data accuracy
Question Rating Gender
Total Male Female
SAP data is accurate
Totally agree 11% 11% 21%
Partially agree 21% 26% 47%
Agree 11% 5% 16%
Partially disagree 3% 11% 13%
Totally disagree 3% 3%
Total 45% 55% 100%
Table 18 reflects the responses received related to the age dispersions groups. The
respondents responded as to the accuracy of the SAP data. Of the respondents, 43% of the
male and 42% of the female agreed to an extent that the SAP data was in fact accurate.
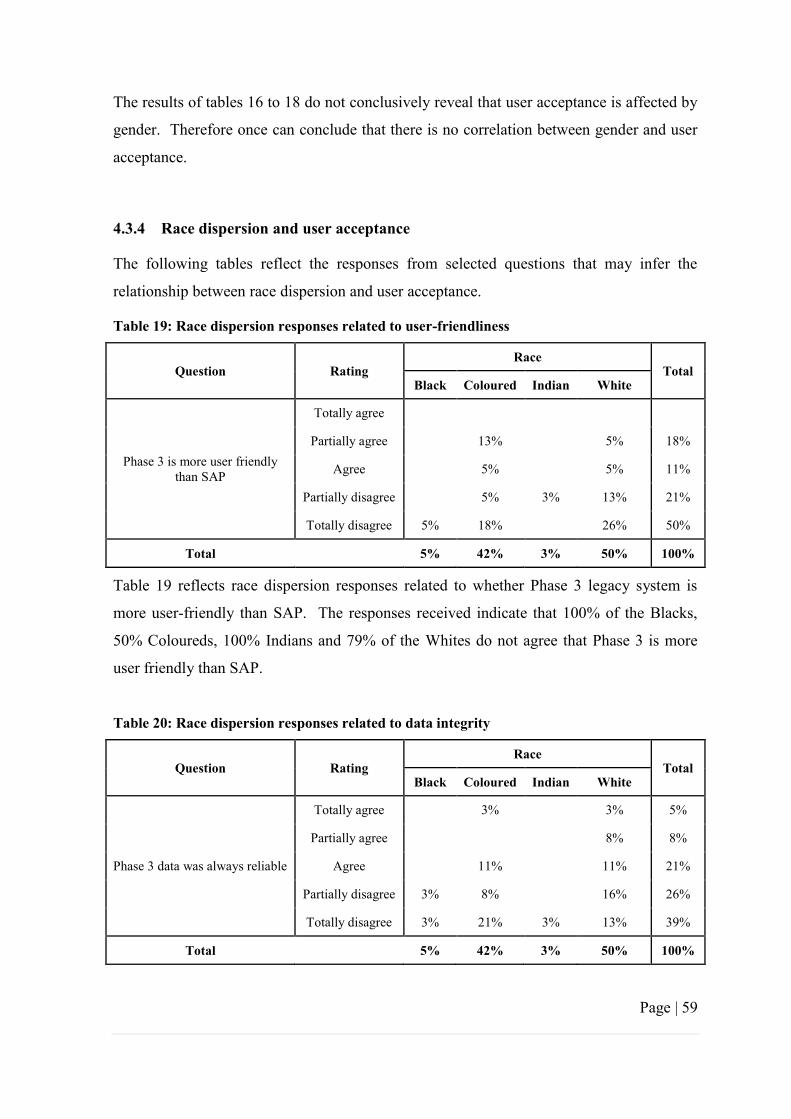
Page | 59
The results of tables 16 to 18 do not conclusively reveal that user acceptance is affected by
gender. Therefore once can conclude that there is no correlation between gender and user
acceptance.
4.3.4 Race dispersion and user acceptance
The following tables reflect the responses from selected questions that may infer the
relationship between race dispersion and user acceptance.
Table 19: Race dispersion responses related to user-friendliness
Question Rating Race
Total Black Coloured Indian White
Phase 3 is more user friendly than SAP
Totally agree
Partially agree 13% 5% 18%
Agree 5% 5% 11%
Partially disagree 5% 3% 13% 21%
Totally disagree 5% 18% 26% 50%
Total 5% 42% 3% 50% 100%
Table 19 reflects race dispersion responses related to whether Phase 3 legacy system is
more user-friendly than SAP. The responses received indicate that 100% of the Blacks,
50% Coloureds, 100% Indians and 79% of the Whites do not agree that Phase 3 is more
user friendly than SAP.
Table 20: Race dispersion responses related to data integrity
Question Rating Race
Total Black Coloured Indian White
Phase 3 data was always reliable
Totally agree 3% 3% 5%
Partially agree 8% 8%
Agree 11% 11% 21%
Partially disagree 3% 8% 16% 26%
Totally disagree 3% 21% 3% 13% 39%
Total 5% 42% 3% 50% 100%

Page | 60
Table 20 reflects the responses received from the race dispersion groups related to the
reliability of the data. The responses received reflect that 100% of the Blacks, 69% of the
Coloureds, 100% Indians and 58% of the Whites agree that that Phase 3 legacy system data
was not always reliable.
Table 21: Race dispersion responses related to data accuracy
Question Rating Race
Total Black Coloured Indian White
SAP data is accurate
Totally agree 3% 13% 5% 21%
Partially agree 3% 21% 3% 21% 47%
Agree 3% 13% 16%
Partially disagree 5% 8% 13%
Totally disagree 3% 3%
Total 5% 42% 3% 50% 100%
Table 21 reflects the responses received related to the accuracy of the SAP data. The
respondents primarily agreed that the SAP data is accurate. The responses received in the
race dispersion agreed were 100% Blacks, 82% Coloureds, 100% Indians and 79% Whites.
Tables 19 to 21 do not conclusively infer that their is a correlation between user acceptance
and race.
4.3.5 Language dispersion and user acceptance
The following tables reflect the responses from selected questions that may infer the
relationship between language dispersion and user acceptance.

Page | 61
Table 22: Language dispersion responses related to user-friendliness
Question Rating Language
Total English Afrikaans
Phase 3 is more user friendly than SAP
Totally agree
Partially agree 16% 3% 18%
Agree 5% 5% 11%
Partially disagree 21% 21%
Totally disagree 39% 11% 50%
Total 82% 18% 100%
Table 22 reflects that 75% of English speaking and 57% of Afrikaans speaking
respondents did not agree that Phase 3 was more user friendly than SAP.
Table 23: Language dispersion responses related to data reliability
Question Rating Language
Total English Afrikaans
Phase 3 data was always reliable
Totally agree 5% 5%
Partially agree 5% 3% 8%
Agree 13% 8% 21%
Partially disagree 24% 3% 26%
Totally disagree 34% 5% 39%
Total 82% 18% 100%
Table 23 reflects that 71% of English speaking and 43% of Afrikaans speaking
respondents did not agree that Phase 3 data was reliable.

Page | 62
Table 24: Language dispersion responses related to data accuracy
Question Rating Language
Total English Afrikaans
SAP data is accurate
Totally agree 18% 3% 21%
Partially agree 37% 11% 47%
Agree 13% 3% 16%
Partially disagree 11% 3% 13%
Totally disagree 3% 3%
Total 82% 18% 100%
Table 24 above reflects that the 84% English speaking and 86% Afrikaans speaking
respondents agree that the SAP data is accurate.
Only 7 of the respondents were Afrikaans speaking. The Afrikaans respondents
represented only 18% of the total sample. As the Afrikaans respondents sample is small,
their responses are deemed to be quite significant when establishing relationships. Tables
22 to 24 above do infer that there is a relationship between language dispersion and user
acceptance. The Afrikaans respondents responded negatively to the user-friendliness of
SAP system and reliability of the SAP data.
4.3.6 Qualifications dispersion and user acceptance
The following tables reflect the responses from selected questions that may infer the
relationship between the qualifications dispersion of the respondents and user acceptance.
Table 25: Qualification dispersion responses related to user-friendliness
Question Rating Qualification
Total Matric Diploma Degree Masters Other
Phase 3 is more user friendly than SAP
Totally agree
Partially agree 8% 3% 5% 3% 18%
Agree 3% 3% 5% 11%
Partially disagree 11% 11% 21%
Totally disagree 21% 8% 16% 3% 3% 50%
Total 42% 13% 32% 5% 8% 100%

Page | 63
Table 25 reflects that 75% matrics, 60% with diplomas, 83% degrees, 50% masters and
34% of other qualifications did not agree that Phase was more user friendly than SAP.
Table 26: Qualification dispersion of responses related to reliability of Phase 3 data
Question Rating Qualification
Total Matric Diploma Degree Masters Other
Phase 3 data was always reliable
Totally agree 3% 3% 5%
Partially agree 3% 5% 8%
Agree 11% 3% 5% 3% 21%
Partially disagree 11% 3% 11% 3% 26%
Totally disagree 18% 8% 8% 3% 3% 39%
Total 42% 13% 32% 5% 8% 100%
Table 26 reflects that 69% matrics, 80% diploma, 58% degree, 50% masters an 67% of
other qualifications do not agree that the Phase 3 data was always reliable.
Table 27: Qualification dispersion responses related to accuracy of SAP data
Question Rating Qualification
Total Matric Diploma Degree Masters Other
SAP data is accurate
Totally agree 5% 5% 8% 3% 21%
Partially agree 21% 5% 16% 3% 3% 47%
Agree 5% 8% 3% 16%
Partially disagree 8% 3% 3% 13%
Totally disagree 3% 3%
Total 42% 13% 32% 5% 8% 100%
Table 27 above reflects that 75% matrics, 80% diploma 100% degree and 67% of other
qualifications agree that SAP data is accurate.
What can be inferred from the tables 25 to 27 is although there may not be a strong
correlation between qualification and user acceptance, there appears to be a trend that

Page | 64
implies that the more qualified respondents appear to be “holding on” to the legacy system
and over a period of time will take convincing before relying entirely on SAP.
4.3.7 Length of service dispersion and user acceptance
The following tables reflect the responses from selected questions that may infer the
relationship between the length of service dispersion of the respondents and user
acceptance.
Table 28: Length of service dispersion responses related to user-friendliness
Question Rating Years of service
Total 0 - 2 2 - 5 5 - 10 10 - 15 15+
Phase 3 is more user friendly than SAP
Totally agree
Partially agree 3% 3% 13% 18%
Agree 3% 3% 5% 11%
Partially disagree 3% 3% 3% 13% 21%
Totally disagree 11% 13% 8% 3% 16% 50%
Total 13% 21% 13% 5% 47% 100%
Table 28 reflects the responses received as per the year‟s service dispersion. The
responses received that did not agree that Phase 3 was more user-friendly than SAP were
0-2 (80%), 2-5 (75%), 5-10 (80%), 10-15 (100%) and 15+ (61%).
Table 29: Length of service responses related to Phase 3 data reliability
Question Rating Years of service
Total 0 - 2 2 - 5 5 - 10 10 - 15 15+
Phase 3 data was always reliable
Totally agree 5% 5%
Partially agree 3% 3% 3% 8%
Agree 8% 3% 3% 8% 21%
Partially disagree 5% 5% 3% 13% 26%
Totally disagree 8% 5% 8% 18% 39%
Total 13% 21% 13% 5% 47% 100%

Page | 65
Table 29 reflects the responses received related to the reliability of the Phase 3 data. The
respondent that did not agree that the Phase 3 data was always reliable were represented in
the length of service dispersions as 0-2 (100%), 2-5 (50%), 5-10 (80%) and 15+ (61%).
Table 30: Length of service dispersion responses related to SAP data being accurate
Question Rating Years of service
Total 0 – 2 2 - 5 5 - 10 10 - 15 15+
SAP data is accurate
Totally agree 5% 3% 5% 8% 21%
Partially agree 5% 11% 5% 5% 21% 47%
Agree 3% 5% 3% 5% 16%
Partially disagree 3% 11% 13%
Totally disagree 3% 3%
Total 13% 21% 13% 5% 47% 100%
Table 30 reflects the responses received related to the accuracy of the data per the length of
service dispersion. The respondents in this length of service dispersion that responded that
agreed that the SAP data was accurate were 0-2 (100%), 2-5 (88%), 5-10 (100%), 10-15
(100%) and 15+ (72%). The responses in tables 28 to 30 would infer that the respondents
that had the least length of service were more positive to the adoption of the new SAP
system. The longer serving respondents were more dispersed in their responses and not
entirely convinced as to the accuracy and reliability of the new system versus the legacy
Phase 3 system.
4.3.8 Managerial position service dispersion and user acceptance
The following tables reflect the responses from selected questions that may infer the
relationship between the managerial position dispersion of the respondents and user
acceptance.
Table 31: Managerial position dispersion responses related to user-friendliness
Question Rating Position Total

Page | 66
Clerical Junior Middle Senior Executive
Phase 3 is more user friendly than SAP
Totally agree
Partially agree 8% 3% 3% 3% 3% 18%
Agree 8% 3% 11%
Partially disagree 3% 3% 5% 8% 3% 21%
Totally disagree 11% 21% 16% 3% 50%
Total 21% 34% 26% 13% 5% 100%
Table 31 reflects the responses per the managerial dispersion related to the user
friendliness of the Phase 3 versus SAP. The respondents from the managerial dispersion
that did not agree that Phase 3 was more user-friendly than SAP were clerical (67%),
junior management (63%), middle management (69%), senior management (80%) and
executive management (50%).
Table 32: Managerial position dispersion responses related to reliability of Phase 3 data
Question Rating Position
Total Clerical Junior Middle Senior Executive
Phase 3 data was always reliable
Totally agree 5% 5%
Partially agree 3% 5% 8%
Agree 5% 8% 3% 5% 21%
Partially disagree 3% 18% 5% 26%
Totally disagree 13% 8% 16% 3% 39%
Total 21% 34% 26% 13% 5% 100%
Table 32 reflects the responses per managerial position of the respondents related to the
reliability of the Phase 3 data. The respondents in the managerial position dispersion that
did not agree that that Phase 3 data was always reliable were clerical (75%), junior
management (77%), middle management (80%) and senior management (20%). All of the
executive management agreed that the Phase 3 data was always reliable.

Page | 67
Table 33: Managerial position responses related to the accuracy of SAP data
Question Rating Position
Total Clerical Junior Middle Senior Executive
SAP data is accurate
Totally agree 3% 5% 11% 3% 21%
Partially agree 8% 18% 11% 8% 3% 47%
Agree 3% 5% 3% 3% 3% 16%
Partially disagree 5% 5% 3% 13%
Totally disagree 3% 3%
Total 21% 34% 26% 13% 5% 100%
Table 33 reflects the responses per managerial position related to the accuracy of SAP
data. The respondents that agreed that the SAP data is accurate are represented by clerical
(63%), junior management (85%), middle management (88%), senior management (80%)
and executive management (100%).
Tables 31 to 33 above infer that across all levels of management there is an appetite for the
new SAP system. As with the years of service in the previous section herein, it would
appear that the executive management are not entirely convinced that the legacy Phase 3
system did not produce accurate and reliable data. The executive management are also
convinced that the new system data is in fact accurate. This may be as a result of the fact
that the clerical and more junior employees utilize the system the more frequently than
executive management and therefore have a higher appetite for new system adoption.
4.3.9 Computer literacy dispersion and user acceptance
The following tables reflect the responses from selected questions that may infer the
relationship between the computer literacy dispersion of the respondents and user
acceptance.

Page | 68
Table 34: Computer literacy dispersion responses related to user-friendliness
Question Rating Computer Literacy
Total Average Above Excellent
Phase 3 is more user friendly than SAP
Totally agree
Partially agree 13% 5% 18%
Agree 5% 5% 11%
Partially disagree 13% 5% 3% 21%
Totally disagree 26% 18% 5% 50%
Total 58% 34% 8% 100%
Table 34 reflects the responses related to Phase 3 being more user friendly than SAP per
the computer literacy dispersion group. The respondents per computer literacy dispersion
that disagreed that Phase 3 was more user friendly than SAP were average (68%), above
average (69%) and excellent (100%).
Table 35: Computer literacy dispersion responses related to reliability of Phase 3 data
Question Rating Computer Literacy
Total Average Above Excellent
Phase 3 data was always reliable
Totally agree 5% 5%
Partially agree 3% 5% 8%
Agree 11% 11% 21%
Partially disagree 21% 3% 3% 26%
Totally disagree 26% 13% 39%
Total 58% 34% 8% 100%
Table 35 reflects the responses related to Phase 3 data always being reliable per the
computer literacy dispersion group. The respondents per the computer literacy dispersion
that did not agree that Phase 3 data was always reliable were average (82%), above average
(46%) and excellent (33%).

Page | 69
Table 36: Computer literacy responses related to the accuracy of SAP data
Question Rating Computer Literacy
Total Average Above Excellent
SAP data is accurate
Totally agree 8% 8% 5% 21%
Partially agree 34% 11% 3% 47%
Agree 5% 11% 16%
Partially disagree 8% 5% 13%
Totally disagree 3% 3%
Total 58% 34% 8% 100%
Table 36 reflects the responses related to accuracy of the SAP data received from the
computer literacy dispersion group. The respondents from the computer literacy dispersion
group that agreed that the SAP data was accurate were average (81%), above average
(85%) and excellent (100%).
Tables 34 to 36 infer that there is no strong correlation between computer literacy and the
user acceptance of the new system. In fact the average skilled person appears to be more
receptive to change than the higher skilled respondents.
4.3.10 Appropriateness of SAP training
The following figures reflect the responses from selected questions that may infer the
appropriateness of the SAP training to the end user. The objective of this section is to
evaluate the end users responses to the SAP training they received.

Page | 70
Figure 8: Responses received related to ‘relevance of training to job and ‘ease of understanding’ and ‘enabling end user to use SAP’
Figure 8 indicates that 81.58% o f the re spondents agreed that the tr aining th at they
received was in fact relevant to their jobs. A mere 18.42% disagreed with this statement.
There is most definitely a similar response pattern regarding the ease of understanding of
the training delivered and the responses to the SAP training enabling end users to use SAP.
These results would infer that the training was relevant to the end users job and was easy to
understand and most certainly enabled the end user to use SAP as intended.

Page | 71
Figure 9: Responses related to 'classroom versus one-on-one training'
Figure 9 indicates that 78.95% of the respondents prefer to learn by themsleves as opposed
to classroom training. How ever, only 52.63% of the respondetns would ha ve pr eferred
one-on-one tr aining at go -live. The re sults above would infe r that user s do not prefer
clasroom training and are more receptive to one-on-one tra ining. This would imply that
they would be assured of special attention and have their personal training needs addressed
on a one-on-one basis rather than in a classoom environment.

Page | 72
Figure 10: Responses related to 'timing of training for go-live'
Figure 10 above reflects the responses recieved to the questions of whether training was
received in sufficient time prior to go-live; whether end users required more training prior
to go li ve and whe ther end user s required re fresher training onc e S AP had gone li ve.
These qu estions were p ertinent to the ti ming of tra ining pr ior to go-live of S AP. The
responses to these 3 questions have been depicted in the same figure to enable the reader to
identify whether in fact there is a re latonship be tween these que stions. To this end the
responses received infer that the respondents do agree (78.95%) that the training that the y
received was in fact delivered in time prior to go-live of SAP. The respondents also agreed
(65.79%) that th ey re quired more S AP training p rior to go-live and 76.32% of th e
respondents agreed that re fresher tainin g would h ave e nabled them to be more e fficient
once SAP had gone live. These results infer that the training was delivered timeously but
attention should have been given to refresher training once SAP had in fact gone live.
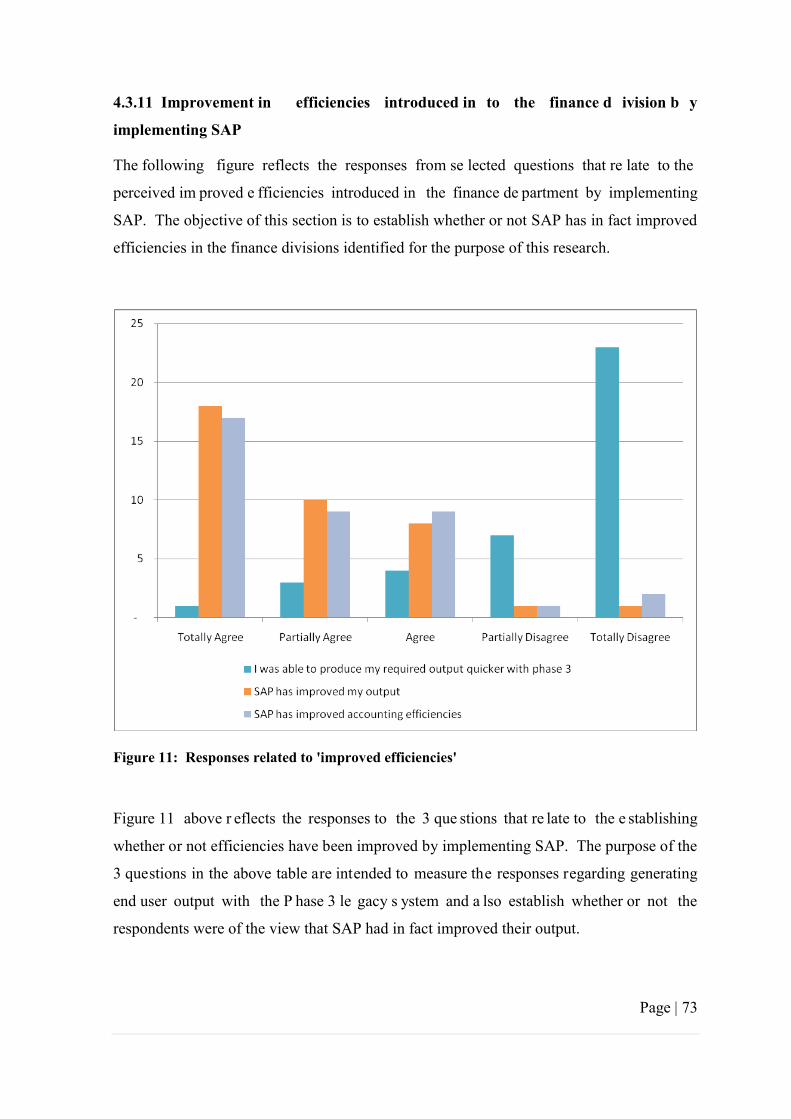
Page | 73
4.3.11 Improvement in efficiencies introduced in to the finance d ivision b y
implementing SAP
The following figure reflects the responses from se lected questions that re late to the
perceived im proved e fficiencies introduced in the finance de partment by implementing
SAP. The objective of this section is to establish whether or not SAP has in fact improved
efficiencies in the finance divisions identified for the purpose of this research.
Figure 11: Responses related to 'improved efficiencies'
Figure 11 above r eflects the responses to the 3 que stions that re late to the e stablishing
whether or not efficiencies have been improved by implementing SAP. The purpose of the
3 questions in the above table are intended to measure the responses regarding generating
end user output with the P hase 3 le gacy s ystem and a lso establish whether or not the
respondents were of the view that SAP had in fact improved their output.

Page | 74
Only one of the respondents totally agreed that the y w ere able to produce their required
output quicker with Phase and the same percentage totally disagreed that the SAP had in
fact improved their output. It can be inferred that this one person is not in fa vour of the
SAP system insofar as increasing productivity are concerned.
A total of 21.05% of the respondents agreed tha t they were in fact able to produce their
required output quick er with Phase 3 le gacy system. An overwhelming 78.95% of th e
respondents did not agree that they were able to produce their output quicker with Phase 3
legacy s ystems. Of thes e re spondents 60.53% of the respondents totally disag reed with
Phase 3 legacy system enabling them to produce their output quicker.
A total of 94.74% of the respondents agree that SAP has improved their output. Of these
respondents, 47.37% totally agree that SAP has improved their output. It may be inferred
from the above responses that the majority of the respondents agree that their output has
improved with the introduction of S AP. The refore the above r esponses infer that the
implementation of S AP ha s improved their efficiencies in the finance divi sions a s
identified for the purposes of this research.
4.3.12 Conclusion
This chapter h as represented the re sponses relevant to answering the research que stions
and thus achieving the research objectives of this study. These research questions being:
What is the end-user acceptance of SAP versus the legacy Phase 3 system?
Is the there a possible correlation between demographics, user acceptance and the
appropriateness of the SAP training provided to the end user?
What are the end-user perceptions of the improved efficiencies introduced into the
finance division by implementing SAP?
The re sponses received in this chapter ha ve c ontributed towa rds inferring c ertain
conclusions fr om the respondents. Chapter 5 will discuss th e re sponses relative to the
literature survey and provide recommendations and conclude this dissertation.

Page | 75
Chapter 5
Recommendations & Conclusion
5.1 Introduction
The results of this research study have provided valuable results for a blue-chip retailing
organisation that ha s im plemented SAP in its business. This implementation wa s to
replace a legacy system that had been in existence for nearly 25-years. In this final chapter
of the research p roject the re searcher intends to draw attention to highlighted r esults of
Chapter 4 a nd c onclude infe rences derived f rom these finding s as well a s providing
guidelines to organisations that intend to implement a new ERP system such as SAP.
This chapter will conclude the research project and further recommendations for additional
research will be included herein. Recommendations will also be put forth for management
and to take cognizance for further SAP implementations in the organisation to ensure that
the high level of success is maintained to improve efficiencies
5.2 Have the research questions been answered?
The re sults of the findings do c onfirm that th e re search qu estion for mulated for the
purposes of this research project have been adequately addressed. The responses received
from the identified sample g roup were suf ficient to deliver adequate results that would
enable the researcher to make certain inferences and recommendations that would assist an
enable an organisation to exact the required value in implementing tan ERP system such as
SAP in the organisation. The research questions being:
What is the end-user acceptance of SAP versus the legacy Phase 3 system?
Is the there a possible correlation between demographics, user acceptance and the
appropriateness of the SAP training provided to the end user?
What are the end-user perceptions of the improved efficiencies introduced into the
finance division by implementing SAP?

Page | 76
The discussion under section 5.3 will demonstrate to what extent the research results
enable the researcher to answer them.
5.3 Discussion
Chapter 1 of this study described that Pick n Pay had developed an in-house system
referred to internally in the organisation as Phase 3. The purpose of this system was
merely to manage inventory. To this end the system would enable the buyers to manage
their stock on hand, cost price, selling prices, gross margins, rebates and other discounts
associated with inventory. This system or “tool” was not intended for any division of the
business other than for the buying divisions within Pick n Pay. As a result of the
decentralised structure of the business, each region would manage their own phase 3
system and data would vary from buying region. Pick n Pay did not have any ERP system
that could be utilised by other divisions of the business to produce MIS reporting
whatsoever. This system was designed to manage inventory only. The system was not an
integrated system and was updated by batches at certain points in time. This meant that the
data was not real time data.
According to Strub (2003), if interfaces are not designed and functioning correctly,
maintaining information across systems will not be possible and will result in anomalies.
This is very apparent in the pick n Pay environment with the legacy system that was
replaced. Jakovljevic (2000) state that an ERP system is the current generation of resource
planning systems. These systems replace the “islands of information with a singular
packaged software solution which integrates all traditional management functions. This
integrated solution dispenses with the data integrity anomalies experienced in the
organisation.
The challenge of the legacy system was that data integrity was questionable. This was
confirmed by the research question of „Phase 3 data was always reliable‟. Only 67.59% of
the respondents did not agree that the data was in fact reliable. The fact that 2/3 of key
finance end-users did not agree that the data was reliable is sufficient evidence to

Page | 77
demonstrate that accuracy and data integrity were in fact prime motivation to implement an
integrated ERP system.
The responses related to SAP „information is always reliable‟ and „SAP data is accurate‟
were 81.57% and 84.21% of the respondents were in agreement with these statements.
These responses clearly infer that the respondents are confident with the reliability and
accuracy of the SAP data that they are accessing. One of the reasons for implementing an
ERP system is to ensure that the same data is available to all business units in the
organisation and the output of such data will be the same. This ensures accuracy and gives
the system reliance. If the end-users believe the data to be accurate and reliable then new
system adoption will occur quicker and the organisation will be in a position to leverage
their huge investments sooner rather than later.
The research compiled regarding a possible correlation between demographics and end-
user acceptance did not yield any significant results. One could infer from the question of
„Phase 3 data was always reliable‟ related to age that the older generations appeared to be
more inclined to the legacy system. Their adoption of the new system might be interpreted
in relation to the other responses as being “slower” to adopt. It must also be noted that
these 2 respondents collectively have 30-years of service and are senior and in executive
management. Their use of the legacy Phase 3 system is somewhat limited and their
responses should be discounted by virtue of this fact. In closing, the research on a
correlation between demographics and user acceptance did not yield sufficient evidence to
enable the researcher to make a conclusive statement on the relationship.
The literature review in Chapter 2 outlines that the SAP ASAP approach to training was
most effective in implementing SAP in the business. To this end Pick n Pay adhered to
this approach. The appropriateness of the training yielded positive results that warranted
discussion. Figure 1 in Chapter 4 indicates that responses received related to the relevance
of SAP training and ease of understanding enabling end-users to us SAP. The majority of
the responses received indicate that the training was designed to be very job specific and
was easy to understand, thus inferring the training to be user-friendly. The ASAP

Page | 78
approach represented in figure 4 of Chapter 2 clearly indicates that the training must b e
designed according to the end-user requirements and should be easy to understand. The
responses received infer that this objective was achieved with an element of success.
The ASAP a pproach in dicates that the end-user training shoul d oc cur in the realization
phase. This phase is prior to go-live of the new ERP system. The responses reflected in
figure 3 of Chapter 4 indicate that the majority of the respondent agreed that the training
was received in sufficient time prior to go-live. It must be noted that in the same figure a
large number of the respondents indicated they required more training prior to SAP going
live and also would have preferred refresher training once SAP had in fact gone live. The
respondents go on to confirm as per the responses reflected in figure 2 of Chapter 4 that
they would have also preferred to have on-on-one training once the SAP system had gone
live as per phase 5 of the ASAP approach.
According to Billington (1998) there a re se ven c haracteristics of hig hly effective a dult
learning. One of these c haracteristics includes se lf directed learning. The re sponses
received to the question re lated to one-on-one training su ggest that thi s approach would
have suited the end-users more than classroom learning. This approach would only have
been more effective at and post go-live of SAP.
The third part of the research was designed to establish whether or not the new ERP system
in fa ct im proved end-users e fficiencies as opposed to the lega cy Phase 3 s ystem. The
benefits of SAP a re discussed in the literature re view c ontained in Chapter 2 of thi s
research project. These benefits include:
Integration
Online real time environment
Research and development (not relevant for purposes of this research project)
Support (not relevant for purposes of this research project)

Page | 79
The be nefit of int egration is designed to provide a sing le a pplication architecture th at
significantly reduces the required int erfaces. S AP pr ovides seamless integration
throughout all its modules and therefore data is real-time once a transaction is concluded.
This integration is intended to remove any fo rms of dupli cation in the data and thus
provide “one-truth”.
This data is then a vailable for sharing. Figure 4 of C hapter 4 re flects the re sponses
received to the questions of:
I was able to produce my required output quicker with Phase 3
SAP has improved my output
SAP has improved accounting efficiencies
The responses that were received to these questions clearly evidence that the respondents
agree that the new SAP system has improved their output and a lso improved accounting
efficiencies in the finance divisions where they are employed. The results produced by this
research have certainly satisfied the researcher that the research questions posed in Chapter
2 of the literature review have been adequately addressed.
5.4 Guidelines
The results of the research have made certain inferences and the responses received from
the respondents enable guidelines to be suggested when implementing an ERP system into
an organisation. These include, but are not limited to:
As per Robson (1997) determining the strategy of a n or ganisation is the most
significant management making d ecisions. Robson also state that a ligning
Information Systems strategies and business strategies will contribute to the success
of the organisation. To this end it is imperative that the business leaders identify
and align these strategies before selecting and implementing a new ERP system
Shulteiss a nd S umner (1998 ) define the characteristics of a Ma nagement
Information System (MIS). These characteristics include boundaries, outputs and

Page | 80
inputs, methods of converting inputs to outputs a nd system int erfaces. Robson
(1997) define the leve ls a nd plannin g ho rizons of mana gement activities. These
levels include operational planning and control which is focused on the short term;
management c ontrol and tac tical planning whic h is focused on the medium term
and stra tegic planning which is focussed on the long term of an organisation. An
ERP system must be able to service all these levels of management and planning
and pr ovide an Information S ystem that enables managers to review operational,
tactical and strategic planning activities in the form of a Management Information
System.
According to Strub (2003) if interfaces are not designed and functioning correctly,
maintaining infor mation a cross systems will no t be possi ble and will re sult in
anomalies. It is imperative that the ERP system that is selected is fully integrated
across the business to ensure data integrity.
Turbit (2003) writes of the „traps of ERP implementations‟. These include but are
not limited to corporate culture, lack of adequate change management and training.
When c onsidering the corporate culture o f an o rganisation the length of se rvice,
qualifications and the period that the end users have been utilising a legacy system
must be considered. The longer a legacy system has been in place the more change
management will be r equired be fore im plementing a ne w E RP s ystem. The se
factors will also impact the approach to training that is going to be adopted. The
training must b e r elevant and e nd user focused a ccording to their a ctual job
functions. S imcock (2006) writes about the SAP ASAP training approach. This
approach has proven to be successful in ensuring that training achieves the desired
outcomes, which are end user acceptance and adoption.
Kolb et al ., defines 4 learning styles being converger, diver ger, a ssimilator and
accommodator. Developing the correct training approach will also depend on the
end user s lea rning style. The de mographics of the end us ers to be tr ained will
influence their learning style and this factor must be considered when developing
training m ethodologies. The tr aining that is to be de livered must b e st ructured
according to the tar get audience. This audience ma y v ary according to
demographics. This includes one-on-one training, c lassroom tra ining,

Page | 81
comprehensive l earner guides, refresher training, on-the-job-training. Th is varied
approach to training the is audience specific will contribute to successful end user
acceptance and accelerate the adoption of e new system
5.5 Recommendations
Pick n Pay embarked on an implementation that was to replace a legacy system that was a
way-of- life for most long serving end-users. What is evident from the li terature review
contained in Chapter 2 and the findings documented in Chapter 4 of this research project is
that implementation of SAP could be measured a “text-book” approach to implementing
SAP in the business. Training that was delivered to the end-users conformed to the ASAP
approach. Thus P ick n Pay was able to reap the positive benefits of the end-user adoption
of the SAP finance module. The areas of opportunities that Pick n Pay should address to
ensure improved end-user adoption would be in the following areas of training:
Figure 2 in Chapter 4 reflects that the majority of the end-users wou ld have
preferred to have one-on-one training at go-live
Figure 3 in Chapter 4 indicates that the majority of the respondents agreed that they
required more training prior to the go-live of Sap
Figure 3 in Chapter 4 o f this research project reflects that the majority of the end-
users would have preferred refresher training once SAP had gone live.
The re sponses reflected a bove indi cate that P ick n P ay shoul d c onsider conducting
refresher c ourses just b efore the actual go-live of S AP. As this is a n ew system it is
essential that end-users are afforded more training to boost their confidence levels.
In addition to the proposed re fresher training, it is recommended that P ick n P ay a lso
introduce one -on-one p ost go-live tra ining for the end user s. It is recommended that
executive mana gement o nly r eceive one-on-one t raining for S AP as they tend to not be
“heavy-users” of the system. Executive management tend to rely on their subordinates to
generate MIS reports. Heavier users (clerical to middle management) should receive one-
Page | 82
on-one training in slightly bigger groups. It is recommended that a facilitator be assigned
to the user group to work with them for a period of time and only attend to their practical
requirements with a live system as a means of training.
5.6 Conclusion
In conclusion it is the researcher‟s opinion that the implementation of the finance SAP
modules in Pick n Pay has delivered the desired results in that there has been a
improvement in the efficiencies in the finance divisions that were included as part of this
research project. The critical success factors that have contributed to the success of the
implementation include, but are not limited to the organisation aligning there is strategy to
their business; selecting a ERP system that is fully integrated across the organisation and
applying the appropriate training strategies and methodologies to the varied demographics
to ensure user acceptance and adoption of the new SAP system in Pick n Pay.
The study has answered the research question posed in Chapter 2 in that the end user
acceptance of the new SAP system has been established; that there is a correlation that can
be inferred between demographics, user acceptance and the appropriateness of the SAP
training provided to the end user; and finally that there are improved efficiencies
introduced into the finance division by implementing SAP.

Page | 83
Bibliography
Bhuta, V. (2001). Eight Mantras to a successful Software Implementation, Viewed 10 July
2006 http://www.gantthead.com/article.cfm?ID=18833.
Billington, Dorothy D. (1988). Ego Development and Adult Education. Doctoral
Dissertation, The Fielding Institute. Dissertation Abstracts International, 49 (7).
(University Microfilms No. 88-16, 275).
Cooper, D.R. and Schindler, P.S. (2003). Business research Methods, 8th edition, McGraw-
Hill.
Ghauri, P., Gronhaug, K. and Kristianslund, I. (1995). Research Methods in Business
Stuies – A Practical Guide, New York, Prentice Hall.
Haag, S., Cummings, M. and McCubbrey, D.J. (2005), Management Information Systems
for the information age, 5th edition, New York, McGraw-Hill/Irwin.
Henke, H. (1996). Learning Theory: Applying Kolb’s learning style inventory with
computer based learning, Viewed July 2010,
http://www.chartula.com/LEARNINGTHEORY.PDF.
Jakovljevic, P.J. (2000). Essential ERP- Its Functional Scope, Viewed July 2010,
http://www.technologyevaluation.com/Research/ResearchHighlights/BusinessApplications
/2000/12/research_notes/prn_TU_BA_PJ_12_27_00_1.asp.
Page | 84
Jakovljevic, P.J. (2005). Essential ERP – Its Underpinning Technology, Viewed July 2010,
<http://www.technologyevaluation.com/Research/ResearchHighlights/BusinessApplication
s/2005/09/research_notes/TU_BA_PJ_09_05_05_1.asp>.
Klopper, Rembrandt, Lubbe, Sam and Hemduth, Rugbeer (2007). The Matrix Method of
Literature Review, in Alternation 14.1 of 2007, pp. 262-276.
Kolb, D. A., Rubin, I.M., and McIntyre, J.M (1979). Organisational Psychology, A Book
of Readings, Third Edition, Prentice-Hall, Inc., Englewood Cliffs, New Jersey, 07632,
Chapter 11: Personal Growth and Career Development, Career Development, Personal
Growth, and Experiential Learning, pages 543-549
Kolb, D.A., (1985), LSI Learning-Style Inventory, McBer & Company, Training Resources
Group, 116 Huntington Avenue, Boston, MA, 02116.
Kolb (2005), The Kolb Learning Style Inventory – Version3.1, Viewed July 2010.
Lubbe, Sam and Klopper, Rembrandt. (2005). Introduction to Research Design: An
Interdisciplinary Approach, 2nd Edition, Dolphin Coast Publishers, Durban, South Africa.
OLAP.com (no date) What is OLAP?, viewed July 2010
http://olap.com/w/index.php/OLAP_Education_Wiki.
Oxford Dictionaries (2010). ERP definition, Oxford University Press. Viewed July 2010
http://www.oxforddictionaries.com/view/entry/m_en_gb0272410#m_en_gb0272410.

Page | 85
Robson, W. (1997). Strategic Management & Information Systems (An Integrated
approach), 2nd edition, Great Britain, Prentice Hall.
SAP (2010). Delivering IT-Powered Business Innovation, Viewed July 2010,
<http://www.sap.com/about/index.epx>
Saunders, M., Lewis, P. and Thornhill, A. (1997). Research methods for business students.
London: Pitman.
Simcock, A. (2006). Proven Approach to Successful SAP Change Management and End
User Training, viewed July 2010.
<www.nd-solutions.com/pdfs/white_EAM/EAM_ChangeMgmt.pdf>
Shultheis, R and Sumner, M. (1998). Management Information Systems: The Manager’s
view, 4th edition, Irwin/McGraw-Hill.
Strub, J. (2003). Best of breed versus fully integrated software: The Pro’s and Con’s,
Viewed July 2010,
http://www.technologyevaluation.com/Research/ResearchHighlights/Erp/2003/08/research
_notes/#1.
Creative Research Systems (2005). The Survey System: Questionnaire Design. Viewed
July 2010 http://www.surveysystem.com/sdesign.htm.
Thompson, A and Strickland A.J. (2001). Crafting and Executing Strategy: Text and
Readings, International Edition, McGraw-Hill.

Page | 86
Turbit, N. (2003). ERP Implementation – The Traps, Viewed July 2010,
http://www.projectperfect.com.au/info_erp_imp.php.
Weightman, C. (2003). Avoiding pitfalls on the way toward the ERP goals: The top 10
ERP mistakes, Viewed July 2010, http://www.sap.info/INT/int/index/Category-
12613c61affe7a5bc-int/0/.
Zikmund, W.G. (2000). Business Research Methods, Florida, Harcourt, Inc.

Page | 87
Appendix A - Letter of introduction
UNIVERSITY OF KWA-ZULU NATAL SCHOOL
Dear Respondent, I, Shannon David Whittle am a MBA student at the Graduate Business School of the University of KwaZulu-Natal. You are invited to participate in a research project entitled Effectiveness of SAP Finance module implementation in Pick n Pay Retailers. The aim of this study is to: Evaluate the SAP Finance module implemented in Pick n Pay and the correlation of demofigureics, SAP training and user acceptance contributing to improved efficiencies within the finance division. Through your participation I hope to understand whether or not the implementation approach to employ for the SAP finance module was effective. The results of the focus group are intended to contribute to evaluating the anticipated efficiencies in the Pick n Pay finance information. Your participation in this project is voluntary. You may refuse to participate or withdraw from the project at any time with no negative consequence. There will be no monetary gain from participating in this survey/focus group. Confidentiality and anonymity of records identifying you as a participant will be maintained by the Name of School, UKZN. If you have any questions or concerns about completing the questionnaire or about participating in this study, you may contact me or my supervisor at the numbers listed above. The survey should take you about 15-minutes to complete. I hope you will take the time to complete this survey. Sincerely
Investigator‟s Signature : ____________________________________
Date : ____________________________________
UNIVERSITY OF KWAZULU-NATAL SCHOOL

Page | 88
Appendix B - Letter of informed consent
MBA Research Project Researcher: SD Whittle (021 – 658 1053)
Supervisor: Professor Rembrandt Klopper (021 – 851 4496) Research Office: Ms P Ximba 031-2603587
CONSENT
I…………………………………………………………………………(full names of
participant) hereby confirm that I understand the contents of this document and the nature
of the research project, and I consent to participating in the research project. I understand
that I am at liberty to withdraw from the project at any time, should I so desire.
SIGNATURE OF PARTICIPANT DATE
………………………………………………………………………………………………

Page | 89
Appendix C – Ethical clearance approval
From: Christel Haddon [mailto:[email protected]]
Sent: 15 April 2010 11:21 AM
To: Shannon Whittle
Cc: [email protected]; Mihalis Chasomeris; Wendy Clarke
Subject: Ethical Clearance Application Approval S Whittle 204514502
Dear Shannon
Your Ethical Clearance application Ref GSB27/10 was approved on the 14 April 2010 and
the form will be forwarded to the Research Office.
You may proceed with your research (conducting your questionnaires/interview)
NB
1. If you at any stage during your research you decide to send questionnaires to a company/organisation where you have not obtained a gatekeepers letter a letter will be required and needs to be submitted to my office.
2. If you change your questionnaire you must submit a copy of the new questionnaire to the committee for approval
3. If you change the title of your research please advise the administrator at your school.
Once I receive the official letter from the research Office I will post you a copy
Kind Regards
Christel Haddon
Assistant Faculty Officer (Post Graduate)
Faculty of Management Studies
Westville Campus,
University of KwaZulu - Natal
Tel : 031 - 260 1553
Fax : 031 - 260 1312
E-mail : [email protected]

Page | 90
Appendix D - Research Questionnaire
Effectiveness o f SAP F inance Module I mplementation i n P ick n P ay
Retailers
______________________________________________________________
Finance regarding SAP Finance module. The information and ratings you provide us will go a long way in helping us identify possible shortcomings in the implementation of SAP Finance. The questionnaire should only take 10-15 minutes to complete. Make sure not to skip any questions. Thank you for participating.
Kindly tick on the applicable answer.
Personal Details
1. Age.
25 or under
26-40
41 - 55
56 or older
2. Gender.
Male Female
3. Race.
Black Coloured Asian White
4. Language Choice (Speak, Read & Write).
English
Afrikaans
Xhosa
Zulu
Other

Page | 91
6. What is the highest level of qualification completed?
High School or Equivalent
Technical Diploma or Equivalent
Degree
Masters Degree
Doctoral Degree
Other
7. Years Service.
0 – 2 2 - 5 5 - 10 10 - 15 15+
8. Which best describes your position in Finance?
Clerical
Junior Management
Middle Management
Senior Management
Executive Management
9. How would you rate your computer skills.
Below Average
Average
Above Average
Exceptional
Evaluate Efficiency of Legacy & SAP System Purpose of this section is to establish the view of users of the SAP finance module. Kindly ensure that you mark your answers on a scale of 1 – 5.
1 – Totally agree
2 – Partially agree
3 – Agree
4 – Partially disagree
5 – Totally disagree
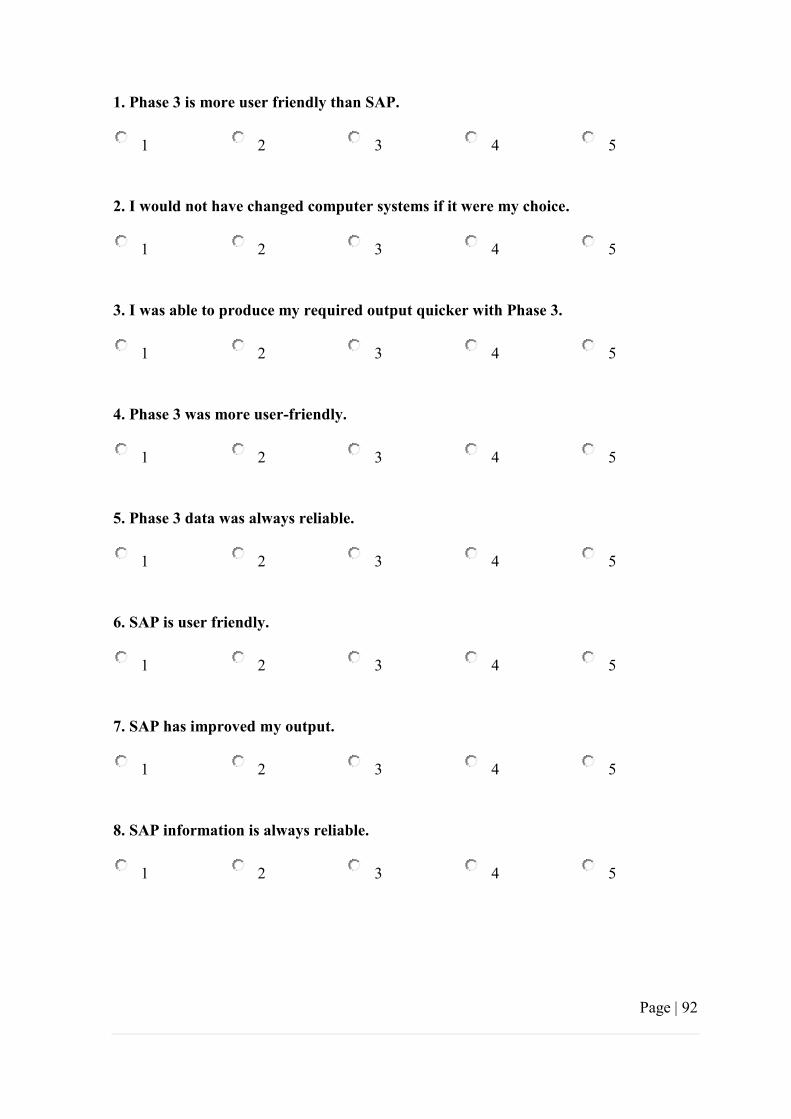
Page | 92
1. Phase 3 is more user friendly than SAP.
1 2 3 4 5
2. I would not have changed computer systems if it were my choice.
1 2 3 4 5
3. I was able to produce my required output quicker with Phase 3.
1 2 3 4 5
4. Phase 3 was more user-friendly.
1 2 3 4 5
5. Phase 3 data was always reliable.
1 2 3 4 5
6. SAP is user friendly.
1 2 3 4 5
7. SAP has improved my output.
1 2 3 4 5
8. SAP information is always reliable.
1 2 3 4 5

Page | 93
9. SAP is a good investment.
1 2 3 4 5
10. SAP data is accurate.
1 2 3 4 5
11. SAP has improved accounting efficiencies.
1 2 3 4 5
12. SAP provides a single truth in that the data is accurate.
1 2 3 4 5
Evaluate User SAP Training Experience The purpose of this section is evaluate the end user SAP training experience pre and post implementation. As per the previous section, select your answer on a scale of 1 – 5.
1. The training I received was relevant to my job function.
1 2 3 4 5
2. The training I received was delivered in sufficient time prior to go-live of SAP.
1 2 3 4 5
3. The SAP training easy to understand.
1 2 3 4 5
4. I required more training prior to go-live of SAP.
1 2 3 4 5
5. My SAP training enabled me to use SAP.
1 2 3 4 5

Page | 94
6. One-on-one T raining at go -live w ould h ave su ited me more th an c lass r oom training.
1 2 3 4 5
7. Refresher training would have enabled me to be more efficient once SAP had gone live.
1 2 3 4 5
8. I prefer to learn by myself rather than in a classroom.
1 2 3 4 5
9. The SAP process was adequate and met my expectations.
1 2 3 4 5

Page | 95
Appendix E - Ethical Clearance Letter

Page | 96
Appendix F – Concept Matrix
Concepts
References
Effective adult learning
SAP A
SAP A
pproach to training
Traps of ERP im
plementations
SAP - B
enefits
SAP - B
ackground
ERP justification for business
Ghuari et al., (1995)
www.picknpay.co.za
Robson W (1997)
Thompson and Strickland (2001)
Bhuta (2001)
Shultheis and Sumner (1988)
Oxford dictionary 2010
Jakovljevic (2000)
Haag et al., (2005)
Strub (2003)
Turbit (2003)
Weightman (2003)
Simcock (2006)
Henke (1996)
Kolb et al., (1979)

Page | 97
Concepts
References
Data collection
Questionnaires
Research design
Sampling design
Effective adult learning
Zikmund (2003)
Cooper & Schindler (2003)
Lubbe & Klopper (2005)
Ghuari et al., (1995)
Creative research systems (2005)
Billington (1988)
Kolb (1985)