Abiotic and Biotic TNT Transformations - Defense Technical ...
Upload
khangminh22Category
view
1download
0
BIOTIC INDICATORS OF GRASSLAND CONDITION IN
KWAZULU-NATAL, WITH MANAGEMENT
RECOMMENDATIONS
By
RICHARD GRANT KINVIG
Submitted in partial fulfilment of the
requirements of the degree of
Doctor of Philosophy,
in the School of Biological and Conservation Sciences
University of KwaZulu-Natal
Pietermaritzburg
2005

DECLARATION
This study was carried out in the School of Biological and Conservation Science,
University of KwaZulu-Natal, Pietermaritzburg from 2001 to 2005 under the
supervision of Professor Michael J Samways. This is the author's original work and
has not been submitted in any form to another university. Where the work of others
has been used, it is dUly acknowledged.
I declare that the above statement is correct
Michael J Samways

ABSTRACT
The South African grassland biome is disappearing rapidly through advancing
development and change in agricultural land use. One of the most threatened
grassland types, Midlands Mistbelt, in the KwaZulu-Natal Midlands is an extremely
diverse and home to many endemic species across an array of taxa. Three taxa,
namely, grasses, grasshoppers and butterflies represent various trophic levels, which
are important to the functioning of the grasslands. Ten grasslands were sampled by
walking ten fifty metre transects for a twelve-month period. The grasslands were
selected as they represented a range of management practices and varying
environmental conditions. Using Indicator Species Analysis (ISA) twenty-two species
of grasshopper were identified as indicators of environmental variables and
management practices. The abundances of the various species indicated the intensity
of the management regimes or disturbances. Using the twenty-two grasshopper
species abundances and a three hundred point sampling assessment of the grasses
creates an assessment tool that can rapidly appraise the management of the
grassland, but due to lack of data for other taxa, cannot assess whether management
practices for the focal taxa create congruent results for non-focal taxa. Two of the
three taxa proved to be good indicators of grassland health, whilst the third, butterflies
were ineffectual, due to low abundance and richness. From the results it was
concluded that burning was taking place to frequently, and required a reduction to
every four years, as this would improve butterfly richness and abundance, and
increase abundance of endemic and flightless grasshopper speCies. A rotational
grazing system needs to be implemented at sites where continual grazing takes place,
wildlife or livestock, impacts on the grassland condition and species diversity.
Increasing habitat heterogeneity increases species diversity, and allows later
successional species to be included in the grasshopper assemblage. Management of
the grasslands in the KwaZulu-Natal Midlands needs to be more responsive and
adaptive. In addition, small fragment management needs to be intensified to provide a
range of habitats and refugia that will suit all species. This study advocates the use of
grasshoppers and grasses as suitable biotic indicators of grasslands in the KwaZulu
Natal Midlands.
Blonc INDICATORS OF GRASSLAND CONDITION IN KWAZULU·NATAL WITH MANAGEMENT RECOMMENDATIONS

CONTENTS PAGE
11
.ABSTRACT 1
CHAPTER 1 1
INTRODUCTION '! •••••••••••••••••••••••1
1.1. Threats to grasslands 21.2. Indicator species 61.3. Invertebrates as indicators 81.4. Orthoptera as indicators.....................................................................•........... 81.5. Potential threats to orthopteran biodiversity 111.6. Lepidoptera as indicators 121.7. Potential threats to butterflies 131.8. Grasses as indicators 151.9. Indicator taxa choices 151.10. Study aims 18
CHAPTER 2 20
SITES, MATERIALS AND METHODS 20
2.1. Study sites 202.2. Sampling ~ 28
2.2.1. Grasses 282.2.2. Grasshoppers 282.2.3. Butterflies 302.2.4. Environmental variables 30
2.3. Statistical analysis 312.3.1. Data transformation 312.3.2. Canonical ordination 322.3.3. Cluster Analysis and evenness indices 332.3.4. Analysis of Variance (ANOVA) 342.3.5. Pearson Correlations ; 342.3.6. Mantels Test 342.3.7. Multiple Response Permutation Procedures (MRPP) 352.3.8. Indicator Species Analysis (ISA) 36
BIOTIC INDICATORS OF GRASSLAND CONDITION IN KWAZULU-NATAL WITH MANAGEMENT RECOMMENDATIONS

Iii
CHAPTER 3 37
RESULTS 37
3.1. Grass species composition and abundance 373.2. Veld condition scores 393.3. Forbaceous species composition and abundance 393.4. Abundanc.e across species 41
3.4.1. Grasshoppers 413.4.2. Butterflies 44
3.5. Richness and abundance across sites 463.5.1. Grasshoppers 463.5.2. Butterflies 52
3.6. Endemic species 563.6.1. Grasshoppers 563.6.2. Butterflies ; 58
3.7. Seasonal variation 593.7.1. Grasshoppers 593.7.2. Individual grasshopper responses to seasonality 683.7.3. Butterflies 72
3.8. Correspondence analysis 803.8.1. Grasshopper species composition 803.8.2. Butterfly species composition 833.8.3. Environmental variables 84
3.9. Species responses to environmental variables 853.9.1. Grasshoppers 853.9.2. Butterflies 87
3.10. Species responses to nominal variables 883.10.1. Grasshoppers 883.10.2. Butterflies 89
3.11. Grasshopper feeding guilds 913.12. Assemblage responses to grazing regimes 91
3.12.1. Grasshoppers 913.12.2. Butterflies 92
3.13. Grasshopper responses to forestry 92
CHAPTER 4 ~ 94
INDICATORS OF GRASSLAND CONDITIONS 94
4.1. Surrogate subsets ofgrasshoppers 944.2. Surrogate subsets for butterflies 964.3. Correlations between grasshoppers, butterflies & grasses 974.4. Grasshopper surrogate subset 984.5. Grasshopper assemblage responses to environmental categories 99
BIOTIC INDICATORS OF GRASSLAND CONDmON IN KWAZULU·NATAL WITH MANAGEMENT RECOMMENDATIONS

Iv
4.6. Grasshopper indicator species..•...•.............•.....................................•......... 994.6.1. Topographic indicators 100
1. Aspect ~ ~ 1004.6.2. Grasshoppers indicative of four vegetation categories 100
1. Proportion of forbaceous plant material 1002. Vegetation height ~ 1013. Grasshopper species representative of grassland veld condition 1014. Grassland type 102
4.6.3. Management Indicators 1031. Grazing 1032. Biennially burnt grasslands 1043. Disturbed grasslands ~ 1044. Season in which the grasslands were burnt 104
4.7. Butterfly assemblage differences 1054.7.1. Topographic indicators 106
1. Aspect 1064.7.2. Vegetative indicators 1064.7.3. Management indicators 107
1. Grazing ~ 1072. Disturbance 1073. Biennially burnt grasslands 1074. Season in which the grassland was burnt. 107
CHAPTER 5 ~ 109
DISCUSSION 109
5.1. Grassland types 1095.2. Impact of abiotic variables on grasshopper assemblages......•............... 111
5.2.1. Slope orientation 1115.2.2. Elevation ~ 112
5.3. Impact ofbiotic variables on grasshopper assemblages...•....•............... 1135.3.1. Vegetation structure and architecture 1135.3.2. Habitat heterogeneity and grasshoppers 115
5.4. Landscape level and the impacts associated with man 1185.4.1. Defoliation 118
1 Livestock grazing 1202. Wildlife grazing 123
5.4.2. Disturbance: its effect on the grasshopper assemblage 1251. Burning 1262. Species responses to burning ~ 1303. Season ofburning 1314. MOWing 133
5.5.Sampling period, grasshopper richness and abundance•...............•........ 1365.6. Dominance of certain species 1375.7. Significance of elevated grasshopper abundance 137
BIOTIC INDICATORS OF GRASSLAND CONDlnON IN KWAZULU-NATAl WITH MANAGEMENT RECOMMENDATIONS

v
CHAPTER 6 139
CONSERVATION BIOLOGY AND ECOLOGICAL
ASSESSMENT 139
6.1. Flagships, umbrella and keystone species...........•....•....•...................•..... 1416.2. Ecosystem management ....................•....................................................... 1446.3. Rapid assessment.....•.........................•...........•....•..•...............................•... 145
6.3.1. Surrogate choice 1491. Families 1492. Functional groups ; 149
6.3.2. Choice of grasshopper species as indicators 1501. Topography 1512. Vegetative characteristics 1523. Indicators of management 154
Grazing 154Season in which the grassland was burnt... 154Biennial burning versus other forms of defoliation 155Disturbance ~ 155
6.3.3. Choice of butterfly species as indicators 158
CHAPTER 7 ~ 159
CONCLUSIONS & MANAGEMENT RECOMMENDATIONS ...159
7.1. Conclusions..•.....•......•........................•.......................•...............•....•.......•.... 1597.1.1. Responses to structural heterogeneity 1597.1.2. Responses to grazing 1597.1.3. Responses to fire ; 1607.1.4. Responses to mowing 1607.1.5. Assessment ofgrasslands 161
7.2. Management recommendations ......•........................•......•.................•....... 1617.2.1. Has past management affected the species assemblage? 1617.2.2. Grassland management to improve biodiversity 162
7.3..Future research 166
ACKNOWLEDGEMENTS 167
REFERENCES 168
Blonc INDICATORS OF GRASSLAND CONDITION IN KWAZULU-NATAL WITH MANAGEMENT RECOMMENDATIONS
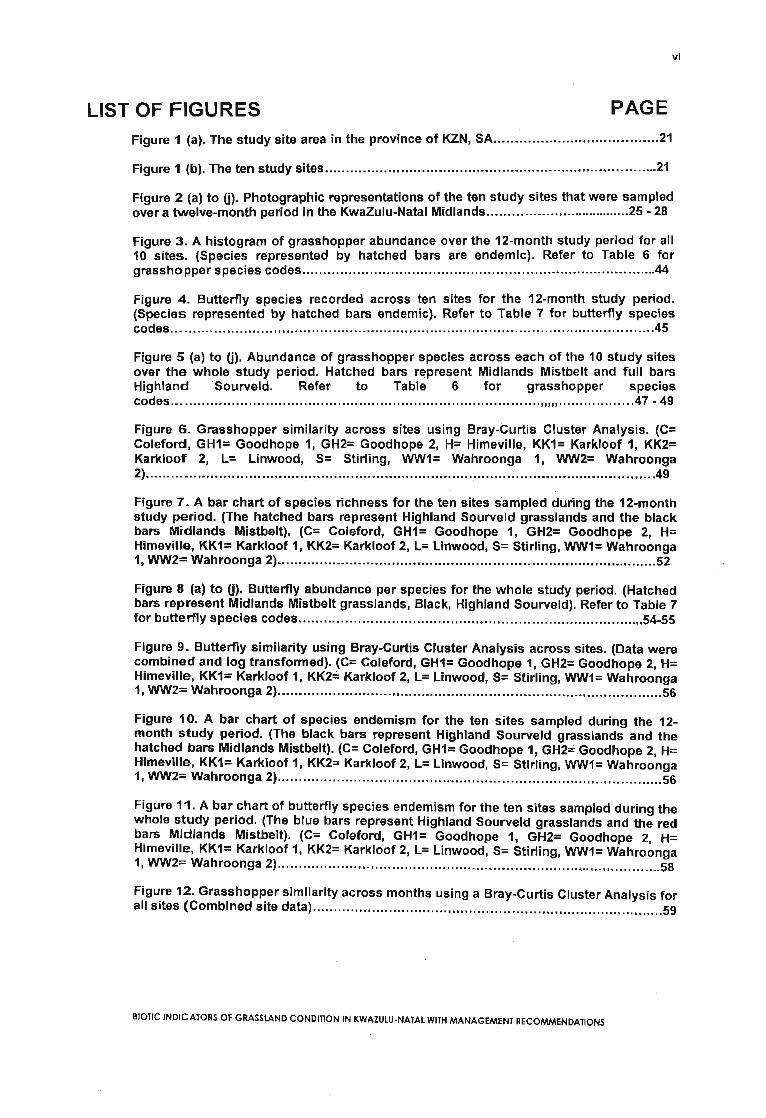
LIST OF FIGURES PAGE
vi
Figure 1 (a). The study site area in the province of KZN, SA 21
Figure 1 (b). The ten study sites 21
Figure 2 (a) to (j). Photographic representations of the ten study sites that were sampledover a twelve-month period in the KwaZulu-Natal Midlands 25 - 28
Figure 3. A histogram of grasshopper abundance over the 12-month study period for all10 sites. (Species represented by hatched bars are endemic). Refer to Table 6 forgrasshopper species codes 44
Figure 4. Butterfly species recorded across ten sites for the 12-month study period.(Species represented by hatched bars endemic). Refer to Table 7 for butterfly speciescodes............•...........................................•.........................................................45
Figure 5 (a) to (j). Abundance of grasshopper species across each of the 10 study sitesover the whole study period. Hatched bars represent Midlands Mistbelt and full barsHighland Sourveld. Refer to Table 6 for grasshopper speciescodes "", 47 ·49
Figure 6. Grasshopper similarity across sites using Bray-Curtis Cluster Analysis. (C=Coleford, GH1= Goodhope 1, GH2= Goodhope 2, H= Himeville, KK1= Karkloof 1, KK2=Karkloof 2, L= Linwood, S= Stirling, WW1= Wahroonga 1, WW2= Wahroonga2) ~ ~ 49
Figure 7. A bar chart of species richness for the ten sites sampled during the 12-monthstudy period. (The hatched bars represent Highland Sourveld grasslands and the blackbars Midlands Mistbelt). (C= Coleford, GH1= Goodhope 1, GH2= Goodhope 2, H=Himeville, KK1= Karkloof 1, KK2= Karkloof 2, L= Linwood, S= Stirling, WW1= Wahroonga1, WW2= Wahroonga 2) 52
Figure 8 (a) to (j). Butterfly abundance per species for the whole stucly period. (Hatchedbars represent Midlands Mistbelt grasslands, Black, Highland Sourveld). Refer to Table 7for butterfly species codes................................•.....•.....................; 54-55
Figure 9. Butterfly similarity using Bray-Curtis Cluster Analysis across sites. (Data werecombined and log transformed). (C= Coleford, GH1= Goodhope 1, GH2= Goodhope 2, H=Himeville, KK1= Karkloof 1, KK2= Karkloof 2, L= Linwood, S= Stirling, WW1= Wahroonga1, WW2= Wahroonga 2) 56
Figure 10. A bar chart of species endemism for the ten sites sampled during the 12month study period. (The black bars represent Highland Sourveld grasslands and thehatched bars Midlands Mistbelt). (C= Coleford, GH1= Goodhope 1, GH2=Goodhope 2, H=Himeville, KK1= Karkloof 1, KK2= Karkloof 2, L= Linwood, S= Stirling, WW1= Wahroonga1, WW2= Wahroonga 2) 56
Figure 11. A bar chart of butterfly species endemism for the ten sites sampled during thewhole stUdy period. (The blue bars represent Highland Sourveld grasslands and the redbars Midlands Mistbelt). (C= Coleford, GH1= Goodhope 1, GH2= Goodhope 2, H=Himeville, KK1= Karkloof 1, KK2= Karkloof 2, L= Linwood, S= Stirling, WW1= Wahroonga1, WW2= Wahroonga 2) , 58
Figure 12. Grasshopper similarity across months using a Bray-Curtis Cluster Analysis forall sites (Combined site data) 59
BIOTIC INDICATORS OF GRASSLAND CONDmON IN KWAZULU·NATAL WITH MANAGEMENT RECOMMENDATIONS

vii
Figure 13. Correspondence Analysis (CA) of months for all sites using gras~hop~er
assemblages. (Only centroid values for each month were plotted). (Only species withgreater than 20% of their variance explained are plotted). Refer to Table 6 forgrasshopper species codes. Axis 1and 2 Eigen values are 0.611 and 0.320respectively...........................................................................•...............................61
Figure 14. Eigenvector scores on the first axis of a Correspondence Analysis (CA) versusmonths to show grasshopper species compositional change over one year for allsites 62
Figure 15. (a) to (I). Grasshopper species recorded across all of the ten sites for eachmonth of the study period. (Summer months are represented by hatched bars and winterby full bars). (Refer to Table 6 for grasshopper speciescodes) 62 - 66
Figure 16. An analysis of variance comparing the summer and winter grasshopperspecies richness for the twelve-month study period 66
Figure 17. Species richness of grasshoppers during the whole studyperiod 67
Figure 18 (a) to (n). Seasonal variation in species that have a cumulative fit of greaterthan 20% of their variation explained for Axis 1 and 2. All data have been log-transformed 69 • 72
Figure 19. Butterfly similarity across months using a Bray-Curtis Cluster Analysis. (Datawere combined and log transformed) 73
Figure 20. Correspondence Analysis (CA) of month distribution according to the butterflyspecies for the 10 sites 74
Figure 21. Eigenvector scores versus month for all the sites for butterflies (each dotrepresents a site) 75
Figure 22 (a) to (I). Butterfly abundances for species in each month of sampling.(Summer months indicated by hatched bars and winter by full bars). (Refer to Table 7 forbutterfly species codes) 75 - 78
Figure 23. Correspondence Analysis (CA) for grasshopper species composition for allsites across all months. (Data were combined and log transformed). Refer to Table 6 forgrasshopper species codes. The Eigen values for Axis 1 and 2 were 0.177 and 0.142respectively 81
Figure 24. The Correspondence Analysis (CA) for the ten sites across the 12·month studyperiod. (Only centroid values are shown for each month). (J= January, F= February, M=March, A= April, MY= May, JE= June, JY= July, AU= August, S= September, 0= October,N= November, D= December).......................................................•..................•.81 - 82
Figure 25. Correspondence Analysis (CA) of butterflies for the whole study period. Referto Table 7 for butterfly species codes. The Eigen values were 0.227 and 0.168 for Axis 1and 2 respectively 83
Figure 26. Partial Correspondence Analysis (PCA) of the environmental variablesmeasured illustrating colinearity between the environmental variables. (Abbreviations asper Table 19) 84
Figure 27. Canonical Correspondence Analysis (CCA) for environmental variablesagainst the sum of the species (Species with 50% variance explained plotted). Thecombined axes were significant (F= 1.301 and p= 0.045) (AbbreViations as per Table 19).Refer to Table 6 for grasshopper species codes 86
BIOTIC INDICATORS OF GRASSLAND CONDITION IN KWAlULU-NATAl WITH MANAGEMENT RECOMMENDATIONS

viii
Figure 28. Canonical Correspondence Analysis (CCA) of butterflies versus environmentalvariables. The combined axes were not significant (F= 1.309 and p= 0.105) (Only specieswith >50% variance explained were plotted). (Grass= overall grass %; Min T= Minimumtemperature recorded at each site during the whole study period). (Refer to Table 7 forbutterfly species codes) 88
Figure 29. Canonical Correspondence Analysis (CCA) for nominal variables againstspecies (Species with 50% variance explained plotted). Combined axes were notsignificant (F= 0.809 and p= 0.290). (Abbreviations as per Table 19). (Refer to Table 6 forgrasshopper species codes) 89
Figure 30. Canonical Correspondence Analysis (CCA) of butterfly species versusnominal variables. (Only species with >50% of their variance explained were plotted). Thecombined axes were not significant (F= 1.226 and p= 0.110) (LG= livestock grazed; WG=wildlife grazed; 82001= burnt in 2001; 82002= burnt in 2002). (Refer to Table 7 forbutterfly species codes) 90
Figure 31. A box and whisker plot diagram comparing species richness and type ofgrazing (LG= livestock, UG= Ungrazed and WG= wildlifegrazed) 91
Figure 32. Total grasshopper species richness plotted against family richness andnumber of endemics for the ten study sites. (C= Coleford,GH1= Goodhope 1, GH2=Goodhope 2, H= Himeville, KK1= Karkloof 1, KK2= Karkloof 2, L= Linwood, S= Stirling,WW1= Wahroonga 1, WW2= Wahroonga 2) 94
Figure 33. Surrogate grasshopper abundance for the ten sites compared to totalgrasshopper abundance. (C= Coleford, GH1= Goodhope 1, GH2= Goodhope 2, H=Himeville, KK1= Karkloof 1, KK2= Karkloof 2, L= Linwood, S= Stirling, WW1= Wahroonga1, WW2= Wahroonga 2) 95
Figure 34. Surrogate grasshopper richness for the ten sites compared to totalgrasshopper richness. (C= Coleford, GH1= Goodhope 1, GH2= Goodhope 2, H= Himeville,KK1= Karkloof 1, KK2= Karkloof 2, L= Linwood, S= Stirling, WW1= Wahroonga 1, WW2=Wahroonga 2) 95
Figure 35. Total butterfly species richness plotted against family richness and endemicsfor the ten study sites. (C= Coleford, GH1= Goodhope 1, GH2= Goodhope 2, H= Himeville,KK1= Karkloof 1, KK2= Karkloof 2, L= Linwood, S= Stirling, WW1= Wahroonga 1, WW2=Wahroonga 2) 96
Figure 36. Surrogate butterfly abundance for the ten sites compared to total butterflyabundance. (C= Coleford, GH1= Goodhope 1, GH2= Goodhope 2, H= Himeville, KK1=Karkloof 1, KK2= Karkloof 2, L= Linwood, S= Stirling, WW1= Wahroonga 1, WW2=Wahroonga 2) 96
Figure 37. Surrogate butterfly richness for the ten sites compared to total butterflyrichness. (C= Coleford, GH1= Goodhope1, GH2= Goodhope 2, H= Himeville, KK1=Karkloof 1, KK2= Karkloof 2, L= Linwood, S= Stirling, WW1= Wahroonga 1, WW2=Wahroonga 2) 97
Blonc INDICATORS OF GRASSLAND CONDITION IN KWAZULU·NATAL WITH MANAGEMENT RECOMMENDATIONS

LIST OF TABLES PAGE
Ix
Table 1. Sites, grassland type, elevation above sea level and the GPS grid reference forthe centre of each site , 20
Table 2. Sites, there locality to an urban centre, the reasons why they were chosen, theremanagement regimes(grazing, burning) and the dominant grass species recorded ateach site. 24
Table 3. The grassland type (Highland Sourveld (H.S.) and Midlands Mistbelt (M.M.»,VC1KEY and VC2Bench are Key and Benchmark scores respectively for grasslands,environmental variables measured (Average temperature, Relative humidity, Minimumtemperature, Slope orientation, Grass, Rock, Forbaceous plants, Bareground andInvasive (alien or indigenous) species as a total percentage of the grassland) andaverage vegetation height (cm). 25
Table 4. Grass species abundances recorded during February 2001 across the ten studysites sampled. (C= Coleford, GH1= Goodhope 1, GH2= Goodhope 2, H= Himeville, KK1=Karkloof 1, KK2= Karkloof 2, L= Linwood, S= Stirling, WW1= Wahroonga 1, WW2=Wahroonga 2) 38
Table 5. A list of the most commonly encountered forbaceous plants and authorities(Germishuizen & Meyer, 2003) recorded during the study period at the ten study sites. 40
Table 6. Grasshopper species recorded during the study period, the code used inanalyses, frequency of encounters for each species, the mean of species abundance, themean per transect and the maximum number of individuals encountered at anyonetransect. 41
Table 7. Butterfly species recorded during the stUdy period. The code used in analysis,frequency of encounters for each species, the mean of species abundance, the mean pertransect and the maximum number of individuals encountered at anyone transect aregiven. 44
Table 8. Grasshopper diversity indices, evenness and species richness for each of the 10sites between February 2001 and October 2002 (Data combined and log transformed).(C= Coleford, GH1= Goodhope 1, GH2= Goodhope 2, H= Himeville, KK1= Karkloof 1,KK2= Karkloof 2, L= Linwood, S= Stirling, WW1= Wahroonga 1, WW2= Wahroonga 2). 46
Table 9. A presence-absence table of grasshopper species for the ten sites over thestudy period (* denotes presence). (C= Coleford, GH1=Goodhope 1, GH2= Goodhope 2,H= Himeville, KK1= Karkloof 1, KK2= Karkloof 2, L= Linwood, S= Stirling, WW1=Wahroonga 1, WW2= Wahroonga 2). 50
Table 10. Presence-absence of butterfly species for the ten sites over the whole stUdyperiod (* denotes presence). (C= Coleford, GH1= Goodhope 1, GH2=Goodhope 2 H=Himeville, KK1= Karkloof 1, KK2= Karkloof 2, L= Linwood, S= Stirling, WW1= Wahro~nga1, WW2= Wahroonga 2). 52
Table 11. Butterfly diversity indices, Shannon-Wiener, evenness and species richness foreach of the ten sites over the whole study period (Data combined and log transformed).(C= Coleford, GH1= Goodhope 1, GH2= Goodhope 2, H= Himeville, KK1= Karkloof 1,KK2= Karkloof 2, L= Linwood, S= Stirling, WW1= Wahroonga 1, WW2= Wahroonga 2). 53
BIOTIC INDICATORS OF GRASSLAND CONDmON IN KWAZULU-NATAl WITH MANAGEMENT RECOMMENDATIONS

Table 12. A presence absence table of endemic grasshopper species for the ten sitesover the 12-month study period (* denotes presence). (Abundance measure, Low = (2-30),Medium = (60-100) and High = (140-647». (C= Coleford, GH1= Goodhope 1, GH2=Goodhope 2, H= Himeville, KK1= Karkloof 1, KK2= Karkloof 2, L= Linwood, S= Stirling,WW1 = Wahroonga 1, WW2= Wahroonga 2). 57
Table 13. A presence absence table of endemic butterfly species for the ten sites over the12-month study period (* denotes presence). (C= Coleford, GH1= Goodhope 1, GH2=Goodhope 2, H= Himeville, KK1= Karkloof 1, KK2= Karkloof 2, L= Linwood, S= Stirling,WW1= Wahroonga 1, WW2= Wahroonga 2). 58
Table 14. A presence absence table of grasshopper species during each month of thestudy period (* denotes presence). 60
Table 15. Grasshopper species richness when the two sampling periods were comparedsummer = October to March, winter = April to September. (*** Denotes significantdifference at p< 0.05). 67
Table 16. Grasshopper diversity indices, evenness and species richness for each of the12 months of the study period (data log transformed). 67
Table 17. Butterfly diversity indices, evenness and species richness for each of the 12months of the study period (data were log transformed). 75
Table 18. A presence absence table of butterfly species for the 12-month study period (*denotes presence). 79
Table 19. The codes and explanations of the codes used in the CanonicalCorrespondence Analysis, and variables omitted as their affects are mirrored by othervariables (* indicates omitted). 85
Table 20. The cumulative fit of the species, for the whole study period, versus theenvironmental variables, as a fraction of the variance, for grasshopper species withgreater than 50% variance. Refer to Table 6 for grasshopper species codes. 86
Table 21. A one-way ANOVA of feeding guilds versus Veld Type (Highland Sourveld andMidlands Mistbelt) for grasshopper species across the ten study sites. 91
Table 22. A one-way ANOVA of species richness and species evenness versus land-usetype (Grazing) for grasshopper species across the ten study sites. 91
Table 23. The LSD post hoc test was undertaken to show any significant differencesbetween grazing strategies and species richness (5% significance denoted by *) (LG=livestock, UG= Ungrazed and WG= wildlife grazed). 92
Table 24. Butterfly richness and abundance when compared across the three differentgrazing types. 92
Table 25. The abundance of grasshoppers when comparing forestry (plantations) withthe indigenous grassland. Figures in parentheses indicate the number of speciesrecorded. 93
Table 26. Pearson's correlation values when comparing like categories between thebutterfly and grasshopper assemblage. * = Significant at the 0.01 level. 98
Table 27. Mantel's test correlations between total and surrogate grasshopper speciesrichness, and total surrogate species abundance. Observed Z greater than average Zfrom the randomized runs indicates a positive association. 98
BIOTIC INDICATORS OF GRASSLAND CONDITION IN KWAZULU·NATAL WITH MANAGEMENT RECOMMENDATIONS
x

xl
Table 28. The number of samples (transects that need to be walked) needed to achievethe relevant confidence intervals (C.I.), for total species assemblage and surrogategrasshopper species assemblage. 98
Table 29. The results of Multiple Response Permutation Procedures (MRPP) for ninecategories using the grasshopper abundance data collected across the ten sites for thetwelve-month study period. (n.s. = Not significant, * = Significant p = 0.05, ** = Significantp = 0.01 and *** = Significant p < 0.01). 99
Table 30. Eight species were indicative of slope orientation (Aspect). Aspect = Warm orCool Slopes. (Warm = -, Cool = +). Refer to Table 6 for grasshopper species codes. 100
Table 31. 21 species were indicative of various vegetative assessments. Forbcon= %forbaceous material (Low = +,High = -), Veg height = vegetation height (cm) (Short = +,Tall = -), VCKey= Veld Condition scores (Poor = ., Good= +) and Grasstype = GrasslandType (Highland Sourveld or Midlands Mistbelt) (Highland Sourveld = +, Midlands Mistbelt= .). ++, - denotes a very strong indicator. Refer to Table 6 for grasshopper speciescodes 103
Table 32. 24 species were indicative of various management regimes. Grazing ,=Livestock or Wildlife grazed (Grazing = +, Not grazed = -), Biennial = Biennially burnt(Biennial = -,Other = +), Disturbed = Disturbance (Over-utilisation) (Low::: -, High = +) andSeason of bum = winter or spring (winter = -, spring = +). -. denotes very strong indicator.Refer to Table 6 for grasshopper species codes. 105
Table 33. The results of Multiple Response Permutation Procedures (MRPP) for ninecategories using the butterfly abundance data collected across the ten sites for thetwelve-month study period. (n.s. = Not significant and * = Significant p = 0.05).. 106
Table 34. Eight species were indicative of slope orientation (Aspect). ASPECT = Warm orCool Slopes. (WARM = -, COOL = +). Table 7 for butterfly species codes. 106
Table 35. Three butterfly species were indicative of various vegetative assessments.Forbcon= % forbaceous material (Low = +, High = -), Veg height = vegetation height (cm)(Short = +, Tall = -), VCKey= Veld Condition scores (Poor = -, Good= +) and Grasstype =Grassland Type (Highland Sourveld or Midlands Mistbelt) (Highland Sourveld = +,Midlands Mistbelt = -). Table 7 for butterfly species codes. 106
Table 36. 10 species were indicative of various management regimes. Grazing =Livestock or Wildlife grazed (GraZing = +, Not grazed = -), Biennial = Biennially burnt(Bienniai =-, Other = +), Disturbed = Disturbance (Over-utilisation) (Low = ., High = +) andSeason of bum = winter or spring (winter = -, spring = +). Table 7 for butterfly speciescodes. 108
Table 37. The 22 species of grasshopper utilised to assess the various managementregimes and responses to environmental disturbance. (The abundance of each of thespecies will need to be recorded in order to assess the intensity of the impact orperturbation). 153
Table 38. Grasses and grasshopper species characteristic of grasslands that fall into oneof three categories, i.e. poor, moderate or excellent. The grasses are sampled using arandom three hundred point sampling technique. The grasshoppers are sampled bywalking ten ~~ metre transects through the grassland. The period in which sampling isundertaken IS Important because of the species richness and distribution across thespecies. The best time to sample grasshoppers is in February and March (greatestspecies richness), with the best sampling time for grasses being February, wheninflorescences are present. It is important to note that this is not a definitive guide tograssland condition, but is based on the findings of this study and directs us towardscertain conclusions. 157
Blonc INDICATORS OF GRASSLAND CONDlnON IN KWAZULU-NATAL WITH MANAGEMENT RECOMMENDATIONS

xii
lilT IS NOT THE STRONGEST OF THE SPECIES THAT SURVIVE,NOR THE MOST INTELLIGENT, BUT THE ONE MOST RESPONSIVE
TO CHANGE."
CHARLES DARWIN
BIOTIC INDICATORS OF GRASSLAND CONDITION IN KWAZULU·NATAL WITH MANAGEMENT RECOMMENDATIONS

CHAPTER 1
INTRODUCTION
There is consensus within the scientific community that the 'current massive
degradation of habitat and extinction of many of the Earth's biota is unprecedented
and is taking place on a catastrophically short timescale' (Novacek &Cleland, 2001).
Between 1989 and 2009 it is estimated that one million species of plant and animal
will be exterminated due to human interference and transformation of natural
ecosystems (Reid & Miller, 1989). Over the next three hundred years it is expected
that between 100 000 and 500 000 species will become extinct (Mawdsley & Stork,
1995). The emerging field of conservation biology is a response to this rapid
collapse of biological integrity and to the decline of biodiversity (Meffe & Carroll,
1994). One of the most important tasks is to identify and follow the changes of biota
in space and time to prevent degradation and further loss of biodiversity (Baldi &
Kisbenedek, 1997; Cincotta et al., 2000). To do this, surveys and comparisons of
different sites must be undertaken and monitoring programmes need to be
developed to maintain the sites with ecological integrity (Baldi & Kisbenedek, 1997).
Insects and all their interactions with the world around them are major components
of biodiversity. These animals are under threat as much as other biota (Samways,
1994). There are however, two major impediments to insect conservation.
Firstly, there is the question of taxonomy, known as the taxonomic impediment
(New, 1984), and, more recently as the taxonomic challenge (Samways, 2002a). It is
difficult to conserve what we do not know, and the fact that more than 80% of
species remain unknown (Hawksworth & Kalin-Arroyo, 1995) means that there is a
massive void in our knowledge. The second is the perceptual impediment. Insects
are viewed by many people as nuisances, but less than one percent of species are
actually pests (Pimentel et al., 1992), with their roles in ecosystem processes not
being wholly appreciated (Samways, 1997). Sotherton and Self (2000) documented
that advancements in farming practices have contributed to the impoverishment of
many invertebrate groups on arable land. The greatest problem facing conservation
BIOTIC INDICATORS OF GRASSLAND CONDITION IN KWAZULU·NATAL WITH MANAGEMENT RECOMMENDATIONS

2
biology, in southern Africa is the lack of taxonomic knowledge concerning insects
and the lack of trained personnel to obtain that knowledge (Scholtz & Chown, 1993).
Therefore insect conservation is at a very low level in southern Africa at a research
and application level. The only species being considered or identified as endangered
are, almost without exception, visible species that have been fortuitously identified
as such (Scholtz & Chown, 1993).
It is therefore essential to increase our knowledge of insects and their behavioural
intricacies so as to understand how and why they are important in ecosystems.
Insects are not only important as a food source for many of the larger more
recognizable vertebrates, but also play a major role in ecosystem functioning as they
often are the largest contributors to overall ecosystem biomass (Gandar, 1982a;
Gangwere, et al., 1997). A prime example of this relationship is a complex series of
interactions between mammals, insects and their host plants in mopane savanna,
with insects exhibiting a key role (Bryant et al., 1991).
1.1. Threats to grasslands
One of the most important drivers in environmental change is the increased
anthropogenic use of land (Sala et al., 2001; Neke & du Plessis, 2004). Under the
pressures of a rapidly increasing human population, and the resultant large-scale
expansion of agriculture, industry and housing, reduces large expanses of
previously undisturbed natural vegetation, into fragments surrounded by a
transformed matrix of alien vegetation or development.
Grasslands are one of the most disturbed and transformed areas in the world
(Hannah et al., 1994; Tarboton, 1997a). They are transformed more easily than
other existing land uses, as there is less effort required to transform them. Effort can
be broken down into two distinct categories, human resources and cost
effectiveness of the transformation.
Grasslands constitute 70% of all land surface (Fuhlendorf & Engle, 2001).
Grasslands in the northern hemisphere alone once covered some 600 million ha,
with very few natural remnants left today. The grassland biome of South Africa
BIOTIC INDICATORS OF GRASSLAND CONDITION IN KWAZULU-NATAL WITH MANAGEMENT RECOMMENDATIONS

3
consists of 25 veld types and covers an area of 349,174 km2 (Neke & du Plessis,
2004) or 16.5% of the land mass vegetative cover (Dawson, 1991). Based on total
habitat loss, degree of fragmentation and estimation of future threat, the South
African grassland biome has been identified as critically endangered (Olsen &
Dinerstein, 1998; Reyers et al., 2001; Foord et al., 2002) and the biome most in
need of conservation attention in the country (Rebelo, 1997). Grasslands are
prevalent in most of the higher elevation areas of South Africa, particularly in the
Eastern Cape, Mpumalanga and KwaZulu-Natal Midlands. The differentiation into
the major plant communities is generally related to climate and elevational change
(O'Connor & Bredenkamp, 1997). Due to good soils and relatively high and
consistent ra infall much of this area has been converted to agricultural and forest
lands (Macdonald, 1989). The grasslands that have not been transformed are
characteristically managed for livestock production (Holechek et al., 1998). This
matrix needs to be managed so that some or all of the original components of the
ecosystem are preserved. This semi'-natural matrix dominates many regions in
KwaZulu-Natal and the world and may contain most of the world's biological
diversity (Pimentel et al., 1992).
Moist Midlands Mistbelt is the most threatened veld type in KwaZulu-Natal (Scott
Shaw, 2002). 131 000 ha (34%) out of 381 000 ha remains untransformed by
cultivation and development. 10 000 ha (8%) remains as natural grassland in
fragments larger than 32 ha (Scott-Shaw, 2002). At least 60% is in an impoverished
condition i.e. it has a greater than 70% loss of species and can play no part in
conservation in the short- or medium-term future (Scott-Shaw, 2002). At present,
approximately 4000 ha (1%) remains, with the potential for conservation in the short
term. Only 928 ha (0.25%) of grasslands are protected in six reserves, with three
reserves having less than ten hectares of grassland between them. Most of the
grassland destruction has come from establishment of forestry plantations
throughout this area.
Pine trees are alien to South Africa (Mirov, 1967). As aliens they are expected to
have a detrimental impact on the indigenous biota and ecosystem functioning.
Afforestation changes the soil, hydrology, habitat structure, microenvironment, food
resources and ecological processes of the landscape (Armstrong & van
BIOTIC INDICATORS OF GRASSLAND CONDITION IN KWAZULU·NATAl WITH MANAGEMENT RECOMMENDATIONS

4
Hensbergen, 1996). The plantations play a major role in the reduction of
underground water with each pine species using 15 litres of water, and a Eucalypt
species 150 litres per day (Pers. Comm. G. Zaloumis). There is considerable debate
in South Africa on the impacts of forestry on biodiversity (Smith, 1974; Johns, 1993;
Cellier, 1994; Armstrong & van Hensbergen, 1996; Armstrong et al., 1996;
Spellerberg & Sawyer, 1996; Pott, 1997; Armstrong et al., 1998).
However, the commercial forestry industry and associated processing industries
form a significant part of the South African economy (Kruger et al., 1995). In 1979
the forestry and associated industries contributed 7.70 billion Rand to the Gross
Domestic Product (GDP), by 1992 the contribution of the timber industry constituted
1.2% of the GDP of South Africa (Forestry South Africa, 1993). The Rand value was
c.a. 9.57 bill ion, an increase of c.a. 20% in 13 years. By 2002 this figure had
increased to 14,28 billion Rand an increase in Rand terms of 33% (Forestry South
Africa, 2004).
In 1979 the amount of land that was under timber was 1,096,455 hectares (ha), by
1992 this figure had increased to 1,307,207 ha and at present in 2002 stands at
1,351,402 ha. The percentage land usage increase over the last ten years has been
a year on year one percent increment (Forestry South Africa, 2004). This industry is
important to the poverty-stricken, local human communities, which it provides with
employment. The importance of forestry to the GDP of South Africa is tangible, but
its growth comes at the sacrifice of land, especially grasslands situated in the
Eastern Cape, KwaZulu-Natal Midlands and Mpumalanga (formerly the Eastern
Transvaal) (Armstrong & van Hensbergen, 1997).
Grasslands therefore need to be viewed as a form of 'natural' capital or
'environmental' asset, as with indigenous forest, in order to compare them with other
land-uses, like forestry. Grasslands are primarily involved in the production of
grazing lands for livestock and conservation areas for biodiversity, which is an
international tourism draw card. Grasslands also play a role in ecosystem
functioning, the protection of local watersheds and supporting the economic
livelihood of indigenous people, who utilise the grasslands for thatching grass,
grazing of livestock and the collecting of plants for medicinal purposes. Therefore,
BIOTIC INDICATORS OF GRASSLAND CONDITION IN KWAZUlU-NATAl WITH MANAGEMENT RECOMMENDATIONS

5
grasslands play an important role in the long-term economic welfare of South Africa,
as they contain a complex disturbance regime composed of frequent large- and
small-scale disturbances that interact with interannual climate variation to affect
spatial and temporal dynamics of species assemblages (Coli ins, 1987; Coffin &
Lauenroth, 1988; Day & Detling, 1990; Bragg, 1995; Frank et al., 1998; Knapp et al.,
1999). When grassland is being conserved, an opportunity cost is being incurred,
through the loss of potential income gained from changing a land-use. If grasslands
are to be an efficient means of holding onto wealth, they must yield a rate of return
that is comparable or greater than that of other land-uses. Therefore, we need to
consider all avenues of wealth that grasslands afford us.
There are many hidden values and services that are not considered when evaluating
grasslands. These services would include recreation, tourism and education. There
are also less tangible values that are lost, for example, the foreclosing of future uses
of the goods provided by the grasslands, as well as knowing that such a system can
no longer be shared with future generations. These values are paramount and need
serious consideration when assessing grasslands, both economically and
environmentally.
As an individual, a species does not exist in isolation, but is always part of a larger,
more complex ecological web, in which the different organisms interact with one
another as predators, prey, competitors or mutualists (Didham et al., 1996;
Memmott, 1999). Disruptions to these intricate relationships, may go unnoticed
because of the survival ability of one or other of the web members, or they
disappear altogether before man has had time to study and assess the relationships.
Understanding species diversity in local assemblages requires knowledge of
processes acting at larger spatial scales, including determinants of regional species
richness and spatial turnover of species (Caley & Schluter, 1997; Sax & Gaines
2003). The general factors that influence species diversity and the ecological web in
terrestrial ecosystems include: climate (Currie, 1991), habitat structure and
productivity (Pianka, 1966, Tilman, 1982; Morris, 1990, Rozenweig & Abramsky,
1993; York, 1999), habitat isolation and habitat area (MacArthur & Wilson, 1967;
Niemela et al., 1993b; Spence et al., 1996; Beaundry et al.) 1997) and habitat
BIOTIC INDICATORS OF GRASSLAND CONDITION IN KWAZULU·NATAL WITH MANAGEMENT RECOMMENDATIONS
6
fragmentation (Kearns et al., 1998; Fuhlendorf et al., 2002). All of these factors are
being increasingly influenced by human undertakings and activities. With the
increased pressure on natural systems, areas for conservation are becoming
smaller, in turn increasing the risk of local and regional extinctions of species
(Saunders et al., 1991; Groom & Schumaker 1993; Hanski, 1994; Alien et al., 1996;
Armstrong & van Hensbergen, 1996; Latchininsky 1998; Andrieu-Ponel & Ponel,
1999).
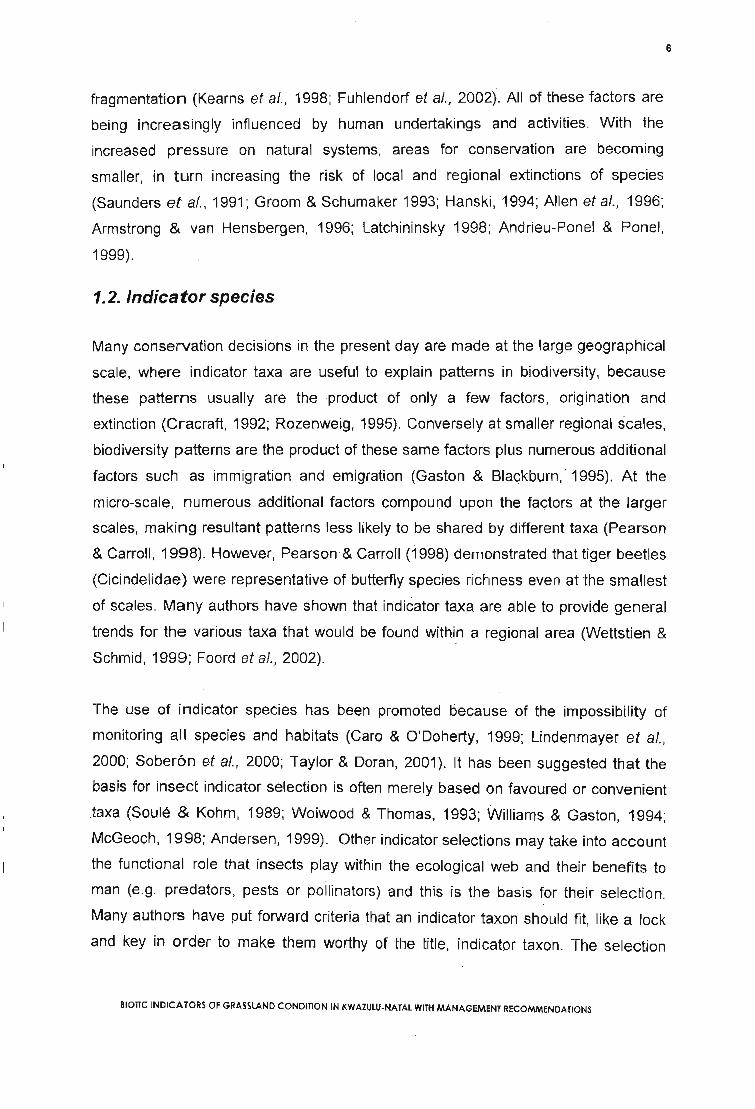
1.2. Indicator species
Many conservation decisions in the present day are made at the large geographical
scale, where indicator taxa are useful to explain patterns in biodiversity, because
these patterns usually are the product of only a few factors, origination and
extinction (Cracraft, 1992; Rozenweig, 1995). Conversely at smaller regional scales,
biodiversity patterns are the product of these same factors plus numerous additional
factors such as immigration and emigration (Gaston & Blackburn,' 1995). At the
micro-scale, numerous additional factors compound upon the factors at the larger
scales, making resultant patterns less likely to be shared by different taxa (Pearson
& Carroll, 1998). However, Pearson & Carroll (1998) demonstrated that tiger beetles
(Cicindelidae) were representative of butterfly species richness even at the smallest
of scales. Many authors have shown that indicator taxa are able to provide general
trends for the various taxa that would be found within a regional area (Wettstien &
Schmid, 1999; Foord et al., 2002).
The use of indicator species has been promoted because of the impossibility of
monitoring all species and habitats (Caro & O'Doherty, 1999; Lindenmayer et al.,
2000; Soberon et al., 2000; Taylor & Doran, 2001). It has been suggested that the
basis for insect indicator selection is often merely based on favoured or convenient
taxa (Soule & Kohm, 1989; Woiwood & Thomas, 1993; Williams & Gaston, 1994;
McGeoch, 1998; Andersen, 1999). Other indicator selections may take into account
the functional role that insects play within the ecological web and their benefits to
man (e.g. predators, pests or pollinators) and this is the basis for their selection.
Many authors have put forward criteria that an indicator taxon should fit like a lock. ,
and key in order to make them worthy of the title, indicator taxon. The selection
BIOTIC INDICATORS OF GRASSLAND CONDITION IN KWAZULU-NATAL WITH MANAGEMENT RECOMMENDATIONS

7
criteria for indicators of environmental health are numerous. Below are six criteria
that have been selected and suggested by several authors (Noss, 1990; Goldsmith,
1991; Spellerberg, 1991; Pearson, 1994; New et al., 1995; Hamer et al., 1997;
McGeoch, 1998).
The indicator must be:
1. Sensitive to change (sensitive to environmental change)
2. Widely distributed
3. Easily and cost effectively measurable, collectable and identifiable (they
m ust have astable taxonomy)
4. Able to differentiate between natural and anthropogenic variations
5. Relevant to ecological phenomena and surrogates for other taxa
6. Economically important
Many authors have only utilised a single taxon for diversity estimates (Greenslade &
Greenslade, 1987; Andersen, 1990; Churchill, 1997; Pearson andCarroll, 1998).
These estimates are often used to assume that variation in the indicator taxon is
representative of the variation in unrepresented taxa (Colwell & Coddington, 1994;
Reid, 1998). Although this may be true in some cases, recent work has suggested
that diversity patterns vary greatly across taxa, and that management practices
based solely on one taxon may not safeguard or predict the diversity of others
(Abbott, 1974; Kremen, 1992; Prendergast et aI., 1993; Baldi & Kisbenedek, 1994;
Launer & Murphy, 1994; HolI, 1995; Thomas, 1995, Shapiro, 1996; Abensperg
Traun et al., 1997; Cranston & Trueman, 1997; Lawton et al., 1998; Niemela & Baur,
1998; Oliver et al., 1998; Reid, 1998; van Jaarsveld et al., 1998; Reyers et al.,
2002a). It is therefore necessary for us to sample a suite of taxa in order to try and
reconcile any potential differences that may occur across taxa, i.e. the "shopping
basket" approach (Hammond, 1994).
Therefore it is of paramount importance that a multiple taxa approach needs to be
taken so as not to misguide management requirements and regimes (McGeoch,
1998, Wettstien &Schmid, 1999; Kotze &Samways, 2001).
BIOTIC INDICATORS OF GRASSLAND CONDITION IN KWAZULU-NATAL WITH MANAGEMENT RECOMMENDATIONS
8
1.3. Invertebrates as indicators
Invertebrate fauna form a major component of ecosystem biodiversity. They fulfill
critical ecological roles (Yen & Butcher, 1997). They are crucial in processes of
pollination, seed dispersal, soil aeration and turnover, the breakdown of organic
matter and nutrient recycling (Taylor & Doran, 2001). Invertebrates form the basis of
many food webs and ecological interactions, promote soil fertility, and provide
mechanisms of biological control. They may also hold many economic and medicinal
benefits, and particUlar species are of cultural,ethical, educational, recreational and
aesthetic im portance. Below are five reasons why invertebrates have been
considered useful indicators (Yen & Butcher, 1997):
1. They are the 'glue and building blocks' of terrestrial eCQsystems (Janzen,
1987; Giller, 1996; Bohac, 1999)
2. They are ecologically and functionally important
3. There are large numbers of species providing a diverse range from which
to choose
4. M any species are habitat specific
5. They are numerically predominant (Holloway & Stork, 1991)
Invertebrates often exhibit smaller distribution ranges (Solem & McKenzie, 1991;
Ponder et al., 1994) and divide habitat on a finer scale when compared with
vertebrates. Hence, they may require habitat management or reservation
prescriptions at a finer level to achieve ecological sustainability than for vertebrates
(Taylor & Doran, 2001). This is an important facet of ecosystem management as
invertebrates contribute heavily to the biomass of ecosystems (McGeoch, 1998).
Invertebrates being such a diverse group and demonstrating different species
responses to disturbance (Lawton et al., 1998; Ghazoul & Hellier, 2000; Lawes et
al., 2005) makes invertebrates potentially good indicator species.
1.4. Orthoptera as indicators
In some articles where desirable qualities have been specified for a viable indicator
group, the habitat of prime concern to the author is tropical forest (Brown, 1991;
BIOTIC INDICATORS OF GRASSLAND CONDmON IN KWAZULU-NATAL WITH MANAGEMENT RECOMMENDATIONS
9
Sutton & Collins, 1991). This habitat is typically devoid in a diverse Acrididoid
assemblage as they are usually associated with more open habitats and therefore
may not fit the criteria that have been laid out. Some authors therefore question the
suitability of Orthoptera to act as an indicator species. However, grasshoppers are
important in many ecological processes (Gandar, 1980; Samways, 1997), are a
particularly valuable food resource in semi-arid systems (Mullie & Kieth, 1993) and
are exceptionally common in grassland systems, the focal habitat of this study. In
addition, grasshoppers are remarkably sensitive to plant species composition
(Joern, 1983), plant morphological characteristics (Fielding et al., 2001), plant
succession (Chambers & Samways, 1998), microclimate and predator-free space
(Otte & Joern, 1975), they are remarkably good indicators of habitat change.
Green (1999) has shown that South African species amount to some 553 described
species. If species yet to be described were included this would raise the total to
approximately 600 species. South Africa is remarkable both for its species richness
and for the high number of endemic species it contains (Brown, 1974; Rentz, 1978;
Johnsen, 1985, 1987).
In comparison to most other African countries, South African grasshopper taxonomy
is relatively well known (Green, 1998). A current estimate has shown that when
comparing East Africa (Kenya, Uganda, Tanzania, Ethiopia and Somalia) to South
Africa, South Africa has twice as many grasshopper species per unit area (Green,
1998). This species richness is exceptional and contrary to general trends, which
dictate that species richness is significantly higher in the tropics (Gaston &
Blackburn, 1996).
It has been postulated that the reason why South Africa has so many grasshopper
endemics (47%) is that the southwestern region is biogeographically isolated and
has resulted in many species radiations, namely in the Pneumoridae, Lentulidae,
Akicerinae and Lithidiinae. Coupled with this is the fact that there were no
Pleistocene ice sheets and long periods of relative geological stability (Samways,
1995). This region appears to be richest in endemic genera, although montane
grasslands farther east are also rich in endemics (Armstrong & van Hensbergen,
1997; Foord et al., 2002). Montane grasslands being rich in endemics make for a
BIOTIC INDICATORS OF GRASSLAND CONDITION IN KWAZULU·NATAL WITH MANAGEMENT RECOMMENDATIONS
10
strong case i.n the conservation of these grasslands,as well as making Orthoptera
an ideal taxon for study, due to the high number of endemics, ease of capture and
high abundances.
Apart from diversity, and endemism, grasshoppers are a major if not dominant group
of herbivorous insects (Gangwere et al., 1997) often contributing half or more of the
total arthropod biomass in the grass layer (Gillon, 1983). Some Orthoptera are
keystone ecosystem components (Quinn et al., 1993). In the South African situation
grasshoppers constitute 93% and 76% of above ground phytophagous insect
biomass for nutrient rich Acac;asavanna and nutrient poor Burkea savanna
respectively (Gandar, 1982b). Gandar (1983) showed that grasshoppers consumed
11.3% of above ground grass production and 5.5% of above ground forb production.
Stebaev (1970) mirrored these findings while working on the Russian steppes. This
implies that Orthoptera are both abundant and fundamental to nutrient recycling.
Although grasshopper assemblages can be strongly influenced by 'top-down' factors
(Rowe-Rowe & Lowry, 1982), especially bird predation (Bock et al., 1992; Belovsky
& Slade, 1993) they are primarily controlled by 'bottom-up' factors (resources) (Isely,
1938, Joern, 1979; Gandar, 1982a; Gangwere et al., 1997).
This makes grasshoppers particularly sensitive to land management practices
(Samways & Moore, 1991; Kemp, 1992; Porter & Redak, 1996), especially when
related to disturbance of the grass layer, by grazing (Jepson-Innes & Bock, 1989;
Quinn & Walgenbach, 1990; Miller & Onsager, 1991; Rivers-Moore & Samways,
1996; Chambers & Samways, 1998; Onsager, 2000) and fire (Gandar, 1982a;
Evans, 1988, Bock & Bock, 1991; Porter & Redak, 1997). Grasshoppers have also
played an im portant role in the conservation of natural areas and preservation of
habitats (Rentz & Weissman, 1981; Devoka & Schmidt, 2000; Kati et al., 2004).
Their local level abundance is able to represent landscape or regional abundance
(Kemp et al., 1990; Sergeev, 1997), and their relative abundance can be a sensitive
indicator of land-usage (Bei-Bienko, 1970; Port & Thompson, 1980; van Wingerden
et al., 1991 a; Prendini et al., 1996; Lockwood, 1997; Samways & Sergeev, 1997)
and plant structure (Joern, 1982; van Wingerden et al., 1991 b, 1992).
BIOTIC INDICATORS OF GRASSLAND CONDmON IN KWAZULU·NATAl WITH MANAGEMENT RECOMMENDATIONS
11
Grasshoppers are well represented by many families in the grasslands of South
Africa (Green, 1998) and in his opinion would perform admirably as an indicator
group in most South African habitats. Several authors, in the South African context,
(e.g. Armstrong & van Hensbergen, 1996; Foord et a/., 2002) have successfully
utilised grasshoppers as indicators of grassland biodiversity. Stewart and Brown
(1995) have successfully used Orthoptera species diversity as an indication of the
state of recovery of areas in the Karoo that had previously been sprayed with
pesticides to control LOGustana pardalina Walker. However, at this point it is
important not to assume that grasshoppers are the perfect umbrella taxon for all
aspects of biodiversity (Lawton et al., 1998; Samways, 1999).
1.5. Potential threats to orthopteran biodiversity
Invertebrates are often sensitive to small environmental changes and even relatively
minor degradation can result in loss of species (Cherrill & Brown, 1990; Collins &
Thomas, 1991; Samways, 1993). Habitat fragmentation leads to many populations
being reduced in size and therefore vulnerable to local extinction (Samways, 1997).
However, Fielding and Brusven (1993b) showed the reciprocal is true as well with
certain species having population outbreaks. Habitat fragmentation and resultant
extinction are particularly true for wingless species of limited vagility (e.g. Lentulidae)
and to certain species where one sex is flightless (e.g. most Pneumoridae and
Porthetinae). Wright (1993) suggests that this is the case for insect fauna in the
Fynbos biome of South Africa and has drawn attention to this threat. Afforestation
can have two affects, 1) it can fragment habitat, and, 2) it destroys montane
grassland habitats, with its characteristic faunal assemblages of Orthoptera
(Armstrong & van Hensbergen, 1997).
Local peoples throughout Africa utilise larger species of Orthoptera as a food
source, but this subsistence use is not a serious threat. Cognisance of growing
human populations must be taken and that these larger species may be faced with
increased demand. Currently, grasshoppers are of no commercial value, but are
seen as more of a pest than something of commercial value. In the past, LOGustana
pardalina Walker posed a major threat to grazing land in the Karoo biome, and
therefore resulted in wide spread pesticide spraying programs, which in many cases
BIOTIC INDICATORS OF GRASSLAND CONDITION IN KWAZULU·NATAL WITH MANAGEMENT RECOMMENDATIONS

12
affected non-target Orthoptera as well as general insect biodiversity (Scholtz &
Chown 1993, Stewart, 1998). However, with on going studies into the field of pest
control many authors are prescribing other methods, which are more
environmentally friendly, and have less far reaching consequences (Latchininsky
1998; Onsager, 2000).
The last maj or threat to Orthoptera is alteration of agricultural practices. Barker
(1985) showed thatovergrazing by cattle in the Kalahari environment has modified
orthopteran faunal composition, with a reduction in faunal diversity mostly owing to
the loss of graminicolous species.
The conservation of the vast majority of Orthoptera will depend principally on how
landscapes are conserved, with management, or how they are preserved, without it.
Their populations may then be viewed as functional, unnamed components of the
ecosystems. Many species will be ecologically redundant, Le. their absence will not
change substantially the physiognomy or processes of the host ecosystems
(Samways, 1997). However, there are others that are keystone species (Quinn et
al., 1993; Chase, 1996), especially in grasslands (Joern & Gaines, 1990;
Kisbenedek, 1995; Chase, 1996). Therefore in order to ensure the survival of as
many species within the orthopteran assemblage as possible ensuring the survival
of processes, by maintaining intact as many large landscapes as possible
(Samways, 1994, 1997; Bridgewater, 1996; Samways & Sergeev, 1997; Sergeev,
1998).
1.6. Lepidoptera as indicators
Several studies have shown how butterfly assemblage structure and diversity
change along a gradient of human disturbance (Erhardt, 1985; Leps & Spitzer, 1990;
Spitzer et al., 1993; Blair & Launer, 1997; Hamer et al., 1997; Wood & Gillman,
1998; Pryke & Samways, 2003).
Butterflies are thought to be the most useful and suitable insects as indirect
measures of environmental change, because of their high sensitivity to local
weather, light levels, host plant specificity and structural changes (Erhlich et al.,
BIOTIC INDICATORS Of GRASSLAND CONDITION IN KWAZULU·NATAlWITH MAN.AGEMENT RECOMMENDATIONS

13
1972; Opler & Krizek, 1984; Weiss et a/., 1987; Thomas 1991; Pollard & Yates,
1993; Hill et a/., 1995; Robertson et al., 1995; Swengel, 1996a & b, Zschokke, et a/.,
2000; Simonson et al., 2001). A rider here, however, is that all these studies have
been undertaken outside of South Africa.
Butterflies are one of the few invertebrate taxa for which accurate distributional, life
history and taxonomic data exist (Brown, 1991; Beccaloni & Gaston, 1995; Kremen,
1994). The taxonomy and life histories of most South African species are well
documented (Henning et a/., 1997), and the adults are generally easily identifiable in
the field. In addition, adult butterflies are important pollinators in grassland systems
(Burd, 1994; Oostermeijer & Swaay, 1998). In the South African context Field (2002)
showed that c.a. 30% of forbs that were stUdied in KwaZulu-Natal Midlands
grassland were pollinated by Lepidoptera with one species, relying solely on this
taxa for pollination. Due to their diverse life histories, they are able to reflect
changes in the vegetation complex and thus act as an indicator of various
anthropogeni c or climatic perturbations.
The combination of these factors make diurnal butterflies an ideal indicator of human
influence on patterns of community diversity and structure.
1.7. Potential threats to butterflies
The two greatest threats to butterfly diversity are: habitat fragmentation (Thomas,
1991; Brown & Frietas, 2000) and habitat loss (Kitahara & Sei, 2001). With the rapid
development of afforestation and the change from natural grazing lands to high
intensity pasture grazing, with many grasslands in the KwaZulu-Natal Midlands
becoming highly fragmented or lost to agriculture or forestry. It is therefore
imperative that remaining grassland be conserved and the plant species required as
larval host plants be studied and protected within these areas. One method of
conserving butterfly species is by the development of linkages between grassland
habitats (Pryke & Samways, 2003). This allows for dispersal as well as gene flow
between source and sink populations as well as allOWing species to investigate new
areas for colonization or utilisation.
BIOTIC INDICATORS OF GRASSLAND CONDITION IN KWAZULU·NATAL WITH MANAGEMENT RECOMMENDATIONS

14
In addition to habitat change and fragmentation, are climate change and over
utilisation and/or collection of butterfly species. Severe drying out caused by
anthropogenic climate change, changes in water levels as well as elevated
temperatures have caused shifts in species distributions as well as extinctions.
Evidence is accumulating that some mobile generalist butterflies (Dennis, 1993;
Parmesan, 1996, Parmesan et al., 1999; Warren et al., 2001) that live in the
northern hemisphere, are showing a pole ward shift in geographical ranges.
Excessively long sUbmergence increases mortality of butterflies (Joy & Pullin 1999;
Webb & Pullin, 1998). The extinction of the British Large copper butterfly Lycaena
dispar dispar and decline of the Heath fritillary Mellicta athalia are likely to herald
changes in insect diversity in wetlands throughout the world, and that localized,
habitat specialists need to be watched very carefully as early responders of possible
permanent change.
Butterflies, by virtue of their bright colours, delicate form, large size and association
with flowers, are among the few insects that charm peoples' hearts (Kellert 1986).
This has led, for example, to removal by tourists of 100 000 Panaxia quadripunctaria
moths per generation in the Valley of Butterflies, Rhodes, Greece (Petanidou et al.,
1991). Like so many aspects of conservation, over collecting must be put in
perspective and on a rational, non-emotive level. For butterflies at least, which
include the most collected of all insects, New (1997) points out that the adverse
effects of collecting are probably far less than that of habitat change and that simple
bans on collecting play only a minor role, if any, in conservation. However, it is
essential that collecting be monitored carefully because certain species with small
total populations, and which may be slow breeders, may be susceptible to over
collecting. Nevertheless, we must be sensitive to the fact that for certain species
over collecting has caused extinction. The British large copper butterfly Lycaena
dispar dispar appears to have been collected out of existence by 1848 (Duffey,
1968). For the 33 species of butterfly listed under the United States Endangered
Species Act, 30% are threatened from over-collecting. Where by-products of
lepidopteran species are utilised, as is the case with the indigenous African silk
moth, it is essential to establish levels of sustainable utilisation (Veldtman et al.,
2002).
BIOTIC INDICATORS Of GRASSLAND CONDmON IN KWAZULU·NATAL WITH MANAGEMENT RECOMMENDATIONS

15
1.8. Grasses as indicators
Grasses have been utilised for many years as indicators of grassland health
(Acock's 1988; Camp & Hardy, 1999; Tainton & Camp; 1999). Grasses are the
major primary producers in a grassland system and are sensitive to disturbance,
particularly to over utilisation (Acock's, 1988). Certain species are indicative of
varying degrees of change within the system. Grasses in South Africa have been
well documented and are easy to identify, when in flower (van Oudtshoorn, 1992).
The potential threats to grass species are over utilisation and loss of habitat, which
are common problems within the KwaZulu-Natal Midlands of South Africa and
around the world.
1.9. Indicator taxa choices
Many people may question the use of these three taxa as opposed to using other
well-known taxa, which have been proved successful indicators of ecosystem
integrity. In the case of ants, carabidsand amphipods their collection is highly labour
intensive. When sampling ants and carabids in the grassland situation, the best
method of sampling is using pitfall traps (Majer, 1980; Jaganyi, 1998; Kotze &
Samways, 2001). Other methods include the removal of turfs, which is highly
destructive as vacuum netting is inadequate for sampling Coleoptera (Morris &
Rispin, 1987). In addition, Whitford et al., (1999) reported that ant species
composition, richness and abundance were unchanged across a gradient of graZing
intensities. The aim of this study was to be able to rapidly assess the study taxa.
This was achieved using visual assessment in conjunction with sweep-netting. The
use of pitfall traps requires setting up the traps and returning to empty them. This
process requi res the researcher to return many times to check and refill the traps.
The traps also reqUire frequent servicing, because of disturbance caused by
monkeys, which pull the traps out of the ground, making them ineffectual. Traps that
are placed along mole runs would also be dug out and they would need to be moved
and replaced.
BIOTIC INDICATORS OF GRASSLAND CONDITION IN KWAZ~LU·NATAL WITH MANAGEMENT RECOMMENDATIONS

16
In this study most of the grasslands were grazed either by livestock (Cattle) or by
wildlife. These animals would crush traps when walking over them, again causing
the trap to lose its worth (Jaganyi, 1998). In addition smaller animals such as rabbits
would dig around the traps, which led to discrepancies in the flushness of the trap
mouth and surrounding ground affecting the efficiency of the trap. Related to setting
up the trap, was the type of soil in which it was placed. Many soils when they are
exposed to less water and hot conditions dry out and crack, again affecting the
levels of soil when compared to the trap opening.
In the KwaZulu-Natal situation, the best sampling period is summer, which is when
the highest rainfall is recorded (Kotze & Samways, 2001; Jaganyi, 1998). The
exposed pitfall traps can often become flooded, and the chemical mixture diluted,
which prevented the ants and carabids from dying when coming into contact with the
chemical mixture, and allowing them to escape. In addition, certain traps could be
less prone to flooding than other traps, thus influencing their total recorded capture.
Many pitfall -traps are also 'raided' by predatory species, which utilise the focal taxa
captured in the pitfall traps as a food resource (Pers. Comm. S. L. Bourquin).
When comparing species abundance estimates across habitats, pitfall capture data
must be utilised with caution (Mitchell, 1963; Greenslade, 1964; Niemela et al.,
1990; Bieringer & Zulka, 2003). It has been reported that, even though pitfall catches
reflect activity and density of the invertebrates (Theile, 1977; Luff, 1982,1986;
Topping & Sunderland, 1992), they are influenced by factors such as temperature
and moisture (Ericson, 1979; Honek, 1988), surrounding vegetation (Greenslade,
1964), materials used in the trap construction (Luff, 1975), preservative used in the
trap (Wagge, 1985), number, size, shape and arrangement of traps (Orbtel, 1971;
Adis, 1979; Niemela et al., 1986b), biology of the species like seasonal activity
rhythms and behaviour (Luff, 1986; Spence & Niemela, 1994). All these factors have
the potential to influence the total capture rate and sampling success.
Finally the issue of time and expertise needs to be raised, as a rapid assessment,
suggested by the name needs to be done quickly and cost effectively. Using pitfall
traps requires the samples to be taken back to the laboratory where they are
identified. In many cases the samples need to be dissected (Jaganyi, 1998) for
BIOTIC INDICA.TORS OF GRASSLAND CONDITION IN KWAIULU·NATAl WITH MANAGEMENT RECOMMENDATIONS

17
successful identification to genus and species level, with many specimens not being
able to go beyond the level of genus. This type of dissection requires expensive
equipment, such as stereomicroscopesand a wealth of knowledge in taxonomy.
Many authors have also indicated the advantage of identification down to species,
which is not possible in many cases due to the high abundances and similarities
between species. The reason for rapid assessments is that time and money are two
important variables, both being rare commodities.
In this study both qualitative and quantitative data were required to answer the
questions posed, therefore, this form of sampling would not be beneficial, as it is
difficult to quantify the abundance of certain species when only being able to identify
species to the genus level or assign the species to a morphospecies or
Recognisable Taxonomic Unit (RTU) category.
Taxa such as Millipedes, were excluded from the potential sampling pool as they
need an expert to identify them, and in South Africa only one taxonomist is able to
identify specimens to species level. Other taxa such as the Collembola are cryptic
taxa that are not considered user friendly, as identification to species level is difficult.
The sampling of birds and small mammals was undertaken in the preliminary stages
of the study, but were excluded from the study as they were sampling at a much
coarser scale (i.e. the landscape level) as opposed to the grasshoppers and
butterflies, which were predominantly restricted to one habitat (i.e. point sampling).
The aim of the study was to be able to get a measure that would rank grasslands
according to the species that utilise the grassland for all facets of their life history.
Having achieved this, recommendations could then be made as to what avenues to
follow and how best to deal with the creation of island grasslands in a sea of forestry
and agricultural development. Birds and small mammals would be better suited to
answering questions about fragmentation as they utilise larger home ranges and
different habitats for the various components that make up their life history. The
creation of the landscape mosaic would alter their perception and utilisation of the
landscape. The different components that comprise the landscape would then act as
differential filters (Ingham & Samways, 1996), either excluding the species or
altering their behaviour.
BIOTIC INDICATORS OF GRASSLAND CONDmON IN KWAZULU-NATAL WITH MANAGEMENT RECOMMENDATIONS

18
The use of geophytes would also prove to bean impediment to sampling effort, as
they need flowers for identification. These specific plants only flower for a very short
space of time and may fall outside the window of regular sampling (Pers. Comm. S.
Johnson).
Beyond the logistical advantages of using these three taxa, they represent a breadth
of ecological trophic levels, including primary producers (grasses) and primary
consumers herbivores/nectivores, (butterflies) and grasshoppers, with grasshoppers
contributing the most to the consumption of vegetation within the study system, and
the butterflies supplementing this consumption at a very low level. In addition, these
three taxa also represent a range of vagility. The grasses are of very limited
dispersal as are the grasshoppers, with a few exceptions, notably the larger more
robust winged species (Ornithacris cyanae (Stoll) and Cyrtacanthacris aeruginosa
(Stoll)) and the butterflies, which show wide local dispersal capabilities.
1.10. Study aims
The general hypothesis is how do species and species assemblages differ between
various grassland types, with the grasslands being separated on old agriculturally
based distinctions, such as, productivity, grass species composition and geology.
Are the differences in species assemblage related to the structure of the
microhabitat or the position of the sites in relation to slope orientation, topography
and elevation (macrohabitat)? Which of the management practices studied (i.e.
grazing, mowing and burning) or combination thereof provides the best species
representation across the three study taxa. The above goals were chosen to
elucidate which aspects, if any played an important role in the local grasshopper and
butterfly assemblage patterns and distribution. In turn these findings will contribute
to conservation planning and management practices utilised by farmers. The results
obtained will provide the first link in the chain of developing a terrestrial rapid
assessment technique that will be utilised to assess grasslands in the Kwa-Zulu
Natal Midlands using a suite of species. These species respond either positively or
negatively to management practices or environmental perturbations. Monitoring of
this suite of species will allow grassland management to adapt in response to
BIOTIC INDICATORS OF GRASSLAND CONDITION IN KWAZULU·NATAl WITH MANAGEMENT RECOMMENDATIONS

19
environmental or anthropogenic stressors, and not detract from the grasslands
productivity.
Blonc INDICATORS OF GRASSLAND CONDITION IN KWAZULU-NATAl WITH MANAGEMENT RECOMMENDATIONS

20
CHAPTER 2
SITES, MATERIALS AND METHODS
2. 1. Study sites
The ten study sites (Fig. 1a & b) were in the KwaZulu-Natal Midlands, South Africa and
were representative of a range of elevations as well as different levels of disturbance
(human, machinery or livestock). Two types of grassland were sampled, namely Moist
Midlands Mistbelt (BRG 5) (Tainton & Camp, 1999) and Moist Highland Sourveld (BRG
8) (Hardy, 1999). The two grassland types were chosen on the grounds that they
represented the most common grassland types in the KwaZulu-Natal Midlands (Table
1). In addition, the Moist Midlands Mistbelt grassland is the most frequently fragmented
and altered grassland type in South Africa, and faces the imminent danger of
disappearing completely. Site selection was based on the above criteria and reinforced
by factors such as their status (Le. Natural Heritage Site), the management regime
imposed upon them, the grazing regime and quality of the grassland (Table 2).
Table 1. Sites, grassland type, elevation above sea level and the GPS grid reference for thecentre of each site
Site
Coleford
Goodhope 1
Goodhope 2
Himeville
Karkloof 1Karkloof2LinwoodStirling
Wahroonga 1
Wahroonga 2
Abbreviation
C
GH1
GH2
H
KK1
KK2
LS
WW1
WW2
Grassland type
Highland SourveldMidlands Mistbelt
Highland Sourveld
Highland Sourveld
Midlands MistbeltMidlands Mistbelt
Highland SourveldHighland Sourveld
Midlands Mistbelt
Midlands Mistbelt
Elevation (m) (asi)
1526 m
1380 m1498 m
1544 m1119 m1125 m1627 m
1474 m1422 m
1466 m
Grid reference
29° 51'S 29° 28'E29° 40'S 29° 58'E29° 38'S 29° 5TE29° 45'S 29° 31'E29° 23'S 30° 1TE29° 24'S 30° 16'E29° 35'S 30° 04'E29° 35'S 30° 08'E29° 36'S 30° aTE
29° 36'S 30° 08'E
BIOTIC INDICATORS OF GRASSLAND CONDITION IN KWAZULU·NATAL WITH MANAGEMENT RECOMMENDATIONS

21
35
35
"---------H -sa
LEGEND_ Stucty Are,a_ KwaZulu~Natalo South Africa
3D
25
25'2015
L-----l--------1~-----__+__}:....-=::::..';,.,~~~=1_-~__r---1I-2-2S
29"20'
19'40'
2!i"SO'
31F~ll'
LEGEND,. StUcIY,Sifes~ KwaZulu-Na1alo SQcth Africa
CoIeford =CGbodN1pe 1 = GHl.Goodhop..2= GH2Himevt)le= flKarkloo.f 1 =. KK1Kil'tklQof2 '"KK2Unwood =L'SMiilQ=SwahroonQa 1 =WWlWahro.on9a 2. = WW2
tll"30'
19"40'
:lS"SIY,
3D30'bU' 30'lD'
.... _ •• - 11 _,..,._ - -- _,,_v ~ -_ _ ,... -.• ,..,..,... .. 'I."" •••,..,. ••__ n ..__ ...,_II_ ...
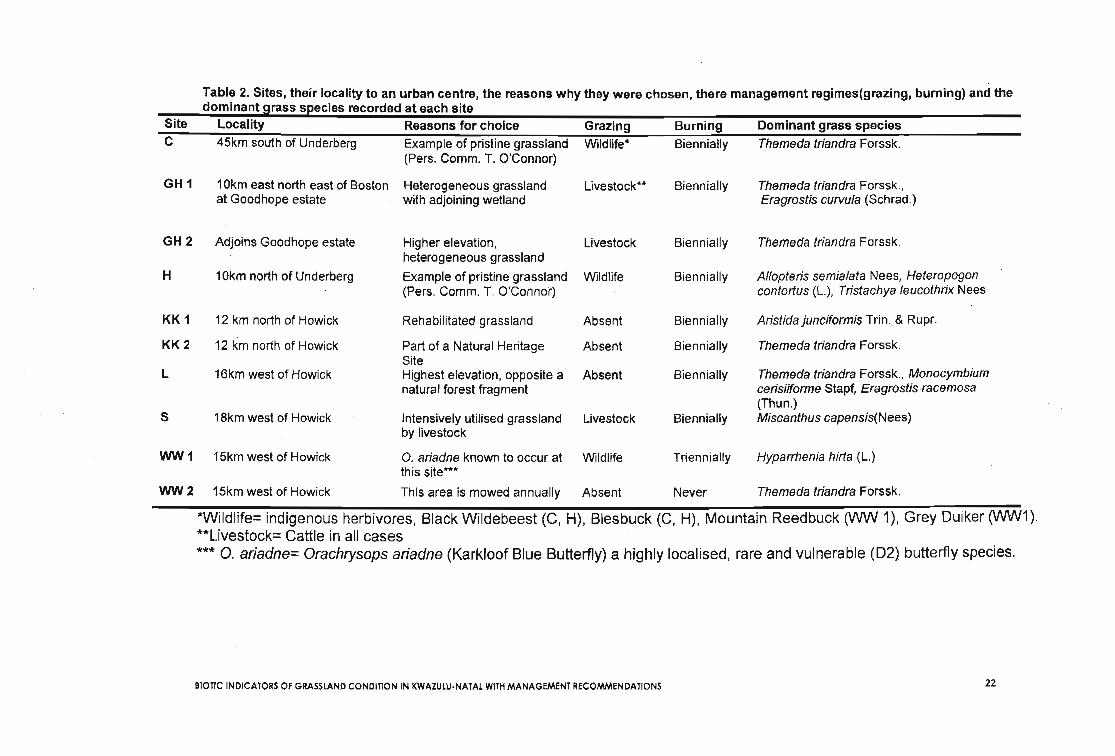
Table 2. Sites, their locality to an urban centre, the reasons why they were chosen, there management regimes(grazing, burning) and thedominant grass species recorded at each site
Site Locality Reasons for choice Grazing Burning Dominant grass speciesC 45km south of Underberg Example of pristine grassland Wildlife* Biennially Themeda triandra Forssk.
(Pers. Comm. T. O'Connor)
GH 1 10km east north east of Boston Heterogeneous grassland Livestock** Biennially Themeda triandra Forssk.,at Goodhope estate with adjoining wetland Eragrostis curvula (Schrad.)
GH2 Adjoins Goodhope estate Higher elevation, Livestock Biennially Themeda triandra Forssk.heterogeneous grassland
H 10km north of Underberg Example of pristine grassland Wildlife Biennially Allopteris semialata Nees, Heteropogon(Pers. Comm. T. O'Connor) contortus (L.), Tristachya leucothrix Nees
KK1 12 km north of Howick Rehabilitated grassland Absent Biennially Aristida junciformis Trin. & Rupr.
KK2 12 km north of Howick Part of a Natural Heritage Absent Biennially Themeda triandra Forssk.Site
L 16km west of Howick Highest elevation, opposite a Absent Biennially Themeda triandra Forssk., Monocymbiumnatural forest fragment cerisiiforme Stapf, Eragrostisracemosa
(Thun.)5 18km west of Howick Intensively utilised grassland Livestock Biennially Miscanthus capensis(Nees)
by livestock
WW1 15km west of Howick O. ariadne known to occur at Wildlife Triennially Hyparrhenia hirta (L.)this site***
WW2 15km west of Howick This area is mowed annually Absent Never Themeda triandra Forssk.
*Wildlife= indigenous herbivores, Black Wildebeest (C, H), Blesbuck (C, H), Mountain Reedbuck (WW 1), Grey Duiker (WW1).**Livestock= Cattle in all cases*** O. ariadne= Orachrysops ariadne (Karkloof Blue Butterfly) a highly localised, rare and vulnerable (D2) butterfly species.
Blonc INDICATORS OF GRASSLAND CONDITION IN KWAZULU-NATAL WITH MANAGEMENT RECOMMENDATIONS 22

Table 3. The grassland type (Highland Sourveld (H.S.) and Midlands Mistbelt (M.M.», VC1 KEY and VC2Bench are Key and Benchmark scoresrespectively for grasslands, environmental variables measured (Average temperature, Relative humidity, Minimum temperature, Slopeorientation, Grass, Rock, Forbaceous plants, Bareground and Invasive (alien or indigenous) species as a total percentage of the grassland) andaverage vegetation height (cm)
Site VITYPE VC1 Key VC2Bench TEMP °c RH% Min TOC Slope %Grass %Forb %Rock %Bare %Invasive AWEGH~C H.S 1.35 1.26 28.23 49.67 20.5 W 85 14 1 0 0 45
GH1 M.M 0.56 0.73 28.78 53.00 21.0 S 72 22 0 3 3 60
GH2 H.S 0.85 0.94 26.87 52.50 19.0 S 75 15 7 3 0 35
H H.S 0.81 0.83 28.00 53.67 21.0 W 74 16 0 10 0 65
KK1 M.M 0.37 0.43 25.46 58.08 19.3 S 45 50 0 5 45 100
KK2 M.M 0.90 1.00 27.72 56.08 20.0 E 85 15 0 0 0 40
L H.S 1.07 1.12 26.68 54.25 18.8 N 72 17 8 3 0 40
S H.S 0.23 0.36 28.03 44.75 20.3 S 45 44 5 5 1 120
WW1 M.M 0.35 0.72 27.44 52.33 21.0 NE 65 30 5 0 0 90
WW2 M.M 0.87 1.06 26.50 57.00 20.3 NW 75 25 0 0 0 30
BIOTIC INDICATORS OF GRASSLAND CONDITION IN KWAZULU·NATAl WITH MANAGEMENT RECOMMENDATIONS 23

(c) Goodhope 2
Blone INDICATORS OF GRASSLAND CONDITION IN KWAZULU·NATAL WITH MANAGEMENT RECOMMENDATIONS
25
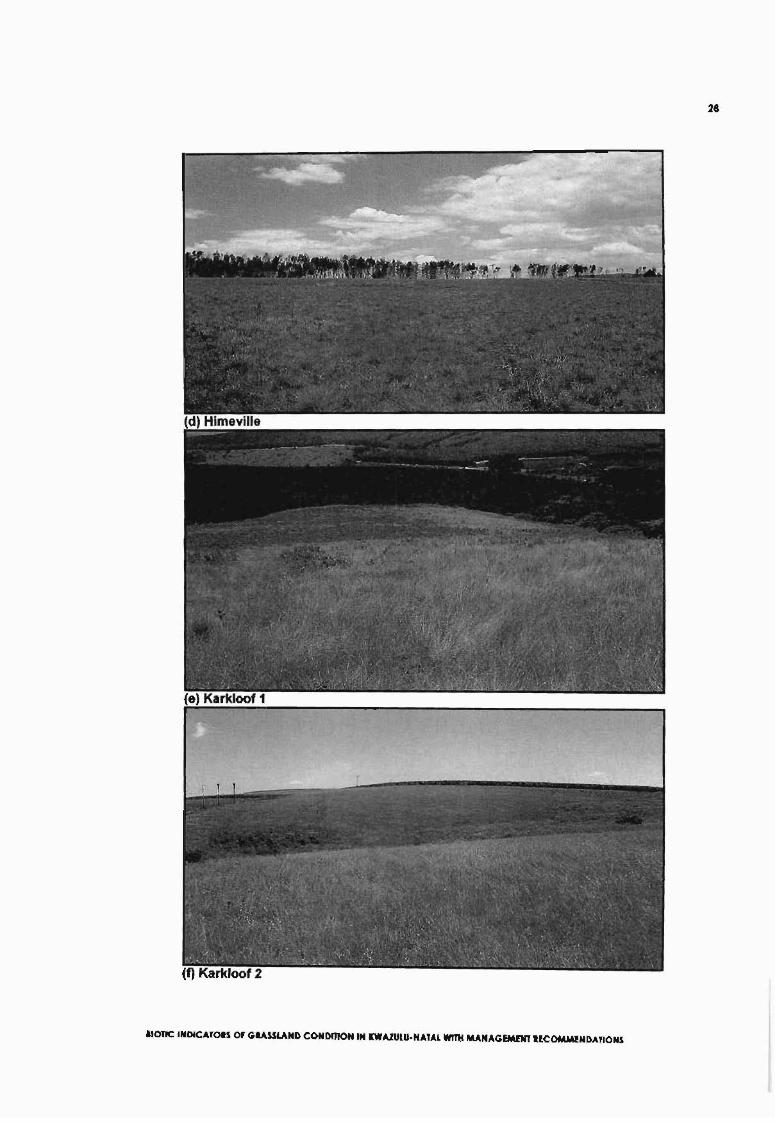
(f) Karkloof 2
IIOTIC INDICATORS OF GRASSLAND CONDmON IN ItWAZULU·NATAL WITH MANAGEMENT RECOMMENDATIONS
26
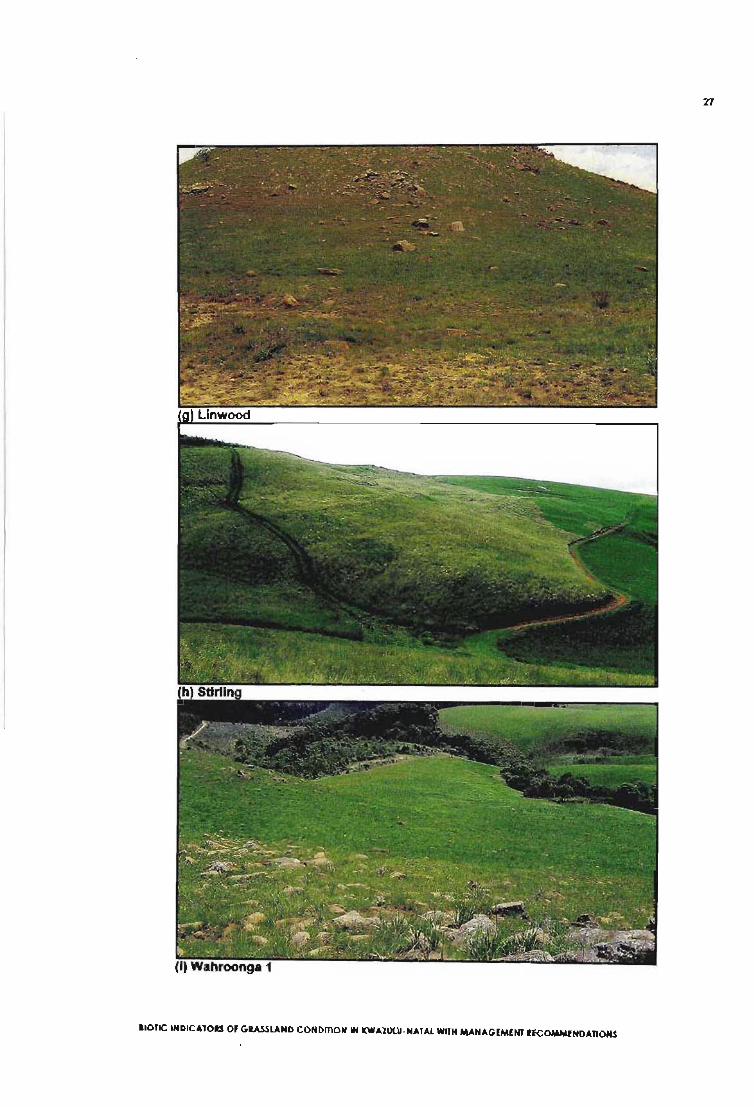
(i) Wahroonga 1
BIOTIC INDICATORS OF GRASSLAND CONDITION IN KWAZULU-NATAL WITH MANAGEMENT RECOMMENDATIONS
27

28
0) Wahroonga 2
Figure 2 (a) to 0). Photographic representations of the ten study sites that weresampled over a twelve-month period in the KwaZulu-Natal Midlands.
2.2. Sampling
2.2.1. Grasses
Grasses were assessed at each site by taking 300 random points throughout
the grassland. Grasses were only sampled once as the study sites were
relatively stable entities. All grass species are perennial species and the
management regime imparted stable, in some cases, it has not been altered
for decades, resulting in a climax dominated species composition. Species
turnover is thus limited due to the management and the stability of the
grasslands sampled. Species turnover would only be noticeable in these
conditions over an elongated time period, which falls outside the parameters
of this study. Sampling was done in February 2001 when species were in
flower for identification (Everson et al., 1990). Grasses were identified using
van Oudtshoorn (1992), Poulter (1993) and with support from Professor N.M.
Tainton.
• IOTIC INDICATORS OF GRASSLAND CONDmON IN KWAZULU-NATAL WITH MANAGEMENT RECOMMENDAnONS
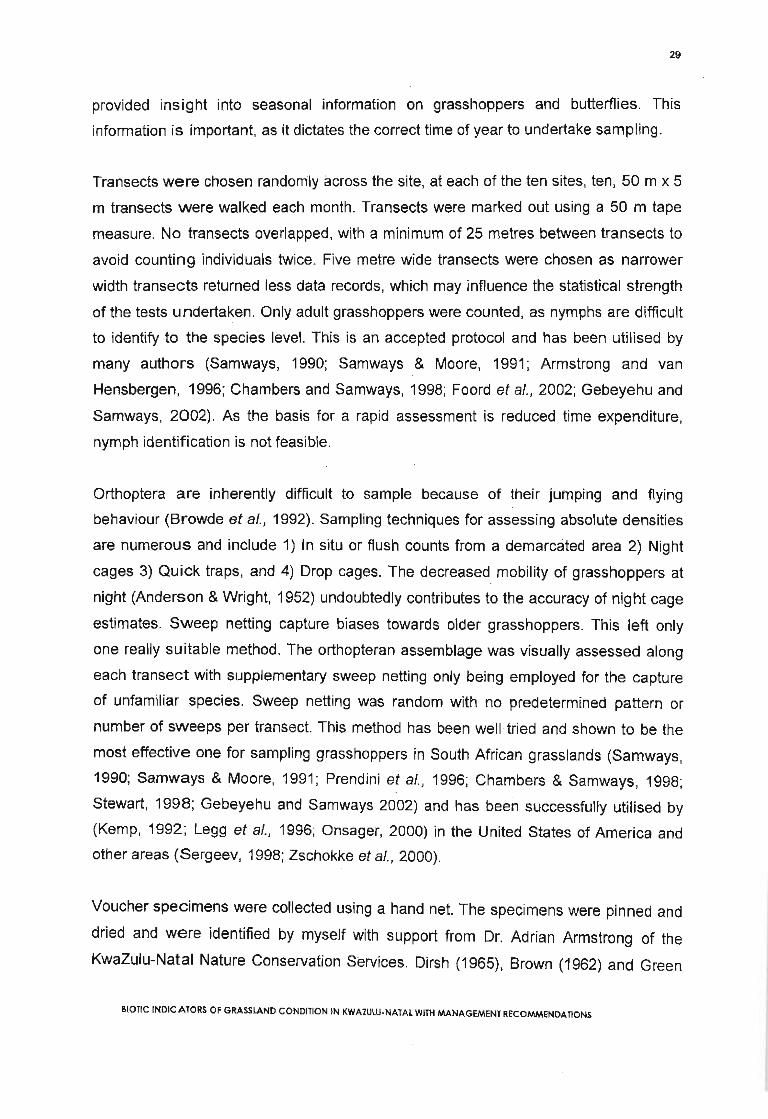
29
provided insight into seasonal information on grasshoppers and butterflies. This
information is important, as it dictates the correct time of year to undertake sampling.
Transects were chosen randomly across the site, at each of the ten sites, ten, 50 m x 5
m transects were walked each month. Transects were marked out using a 50 m tape
measure. No transects overlapped, with a minimum of 25 metres between transects to
avoid counting individuals twice. Five metre wide transects were chosen as narrower
width transects returned less data records, which may influence the statistical strength
of the tests undertaken. Only adult grasshoppers were counted, as nymphs are difficult
to identify to the species level. This is an accepted protocol and has been utilised by
many authors (Samways, 1990; Samways & Moore, 1991; Armstrong and van
Hensbergen, 1996; Chambers and Samways, 1998; Foord et al., 2002; Gebeyehu and
Samways, 2002). As the basis for a rapid assessment is reduced time expenditure,
nymph identification is not feasible.
Orthoptera are inherently difficult to sample because of their jumping and flying
behaviour (Browde et al., 1992). Sampling techniques for assessing absolute densities
are numerous and include 1) In situ or flush counts from a demarcated area 2) Night
cages 3) Quick traps, and 4) Drop cages. The decreased mobility of grasshoppers at
night (Anderson &Wright, 1952) undoubtedly contributes to the accuracy of night cage
estimates. Sweep netting capture biases towards older grasshoppers. This left only
one really suitable method. The orthopteran assemblage was visually assessed along
each transect with supplementary sweep netting only being employed for the capture
of unfamiliar species. Sweep netting was random with no predetermined pattern or
number of sweeps per transect. This method has been well tried and shown to be the
most effective one for sampling grasshoppers in South African grasslands (Samways,
1990; Samways & Moore, 1991; Prendini et al.) 1996; Chambers & Samways, 1998;
Stewart, 1998; Gebeyehu and Samways 2002) and has been successfully utilised by
(Kemp, 1992; Legg et al.) 1996; Onsager, 2000) in the United States of America and
other areas (Sergeev, 1998; Zschokke et al.) 2000).
Voucher specimens were collected using a hand net. The specimens were pinned and
dried and were identified by myself with support from Dr. Adrian Armstrong of the
KwaZulu-Natal Nature Conservation Services. Dirsh (1965), Brown (1962) and Green
BIOTIC INDICATORS OF GRASSLAND CONDITION IN KWAZULU-NATAL WITH MANAGEMENT RECOMMENDATIONS

30
(1999) were used to aid identifications. Three species were not identified to species
level due to their taxonomy being altered regularly as no definitive classification of the
genera in question has been undertaken.
Data were collected between 09hOO and 14hOO, only on days with no wind and no
cloud cover. Before 09hOO, it was still too cool and the grasshoppers were inactive.
After 14hOO, the wind increased, and the study area cooled down rapidly with reduced
grasshopper activity.
All data for each of the sites was collected on the same day, in order to prevent
sampling errors due to varying weather conditions.
2.2.3. Butterflies
Observations were made using the line transect method (Shapiro, 1975; Pollard, 1977,
1984; Thomas, 1983; Thomas & Mallorie, 1985; HolI, 1985; Swengel, 1990; Kremen,
1990; Pollard & Yates, 1993; Harding et al., 1995). The length of transects were 50
metres. This method is now being extensively used to survey and monitor butterfly
populations and assemblages (Shreeve & Mason, 1980; Erhardt, 1985; Warren et al.,
1986; Pollard and Yates, 1993; Kitahara &Sei, 2000). It is a method of significant value
when differences in species abundances among sites are being investigated (Gall,
1985; New, 1991). Transect counts were done once a month for the length of the study
period between 09hOO and 14hOO under fine weather conditions. Walking at a steady
pace along the transect line (50 metre length), the number of adult individuals of each
species sighted within a belt, ca. 5m wide, were recorded. Those individuals not
immediately identified on the wing were captured by net and identified. Butterflies were
identified by myself with support from Ms. Sarah Pryke, using the Natal Museum
Collection and (Pringle et al., 1994; Henning et al., 1997).
2.2.4. Environmental variables
Ten environmental variables were measured to reflect the suspected predominant
conditions of the grasslands for grasshoppers and butterflies: % Grass, % Forb, %
Rock, % Bare ground and % Invasive vegetation were visually assessed, using random
quadrat placements over the extent of the grassland (Table 3). Rock % and Bare
BIOTIC INDICATORS OF GRASSLAND CONDlnON IN KWAZULU·NATALWITH MANAGEMENT RECOMMENDATIONS

31
ground % were measured once off during the sampling of the grass species. The
quadrats (25cm X 25cm ) were placed randomly at 25 points across the site with the
percetage of all the different environmental facets assigned a proportion within the
quadrat boundary. Average vegetation height was measured using a tape measure.
Vegetation height was measured each visit at 25 points across the site. When the
grass sward was significantly altered, Le. the site was burnt or mowed, these
measurements were excluded from the average vegetation height calculation. The
average vegetation of the site was representative of the average dominant
management practice, namely, leaving a standing grass sward for grazing and water
catchment protection. Relative Humidity (%) and Temperature (DC) were measured
using a hygrometer and thermometer respectively each month and were averaged.
Elevation and Slope orientation were measured using a Global Positioning System
(GPS, Garmin 2 plus) (Tables 1 and 3.).
Three other variables were measured, and were related to management practices:
Burning (Burnt in 2001 or 2002), Grazing (Livestock grazed, Wildlife grazed, not grazed
or Mown) (Table 2) and Veld Condition scores. The veld condition scores were
computed for each of the ten grassland sites using Tainton and Camp (1999)
assessment techniques, namely the 'key species' technique and the 'benchmark'
technique. Both of these assessments involve the weighting of important species. In
the 'key species' assessment ecologically important grasses (Tainton and Camp 1999),
and in the 'benchmark assessment' agriculturally important species utilised by grazing
livestock, are considered (Camp and Hardy 1999).
2.3. Statistical analysis
2.3.1. Data transformation
Grasshopper relative abundance values were highly skewed, with one species making
up 50% of all the individuals reco~ded. To overcome the skewed distribution and
normalise the data, records were log transformed. Due to the large number of zeros,
the data were transformed using Y= log (X+1) (Zar, 1984). The data were log
transformed throughout to maintain consistency in the results obtained. All data was
Base 10 transformed. The feeding guild data were ARCSIN transformed, because they
Blonc INDICATORS OF GRASSLAND CONDmON IN KWAZULU·NATAL WITH MANAGEMENT RECOMMENDATIONS

32
were proportional data. The formula used in Excel to convert the proportions to
workable values was:
DEGREES (ASIN (SQRT (Proportion value/100))).
2.3.2. Canonical ordination
Canonical ordination is a class of techniques used for relating species composition of
the community to each of the environmental variables of the sample area (ter Braak &
Smilauer 1998). Correspondence Analyses (CA) were undertaken to express patterns
in grasshopper assemblages. Canonical Correspondence Analyses (CCA) were
undertaken to illustrate relationships between grasshopper species and each of the
environmental variables (Kent & Coker 1992).
Colinearity of environmental variables occurred due to certain variables being strongly
correlated to one another. Collinear environmental and nominal variables were omitted
as one variable could explain their effects as a whole (ter Braak & Smilauer 1998). An
example of colinearity was '%Grass' that could account for and explain the key and
benchmark veld scores. The higher the percentage grass, the better the score and
rank for the veld scores. The %Grass could also account for %Rock, %Bareground,
%Forb and %>Alien invasive because the amount of grass directly affected the amount
of the other variables. These variables were therefore classified as dependent
variables.
Colinearity also occurred among nominal and environmental variables, as the number
of variables was higher than the number of active samples (ter Braak & Smilauer
1998). Due to colinearity having occurred because of a higher number of
environmental variables than active samples, the nominal and environmental variables
were separated and run as two individual groups.
The significance of the relationship between species and environmental variables was
evaluated using Monte Carlo permutations. A Monte Carlo permutation tests statistical
significance by repeated shuffling of the samples (ter Braak & Smilauer 1998). A F-
BIOTIC INDICATORS OF.GRASSLAND CONDITION IN KWAZULU·NATAL WITH MANAGEMENT RECOMMENDATIONS

33
value is worked out for the 199 permutations run under a reduced fit model and this
value is then compared to the F-value for the original data set to prove significance.
Due to the large number of species encountered over the sampling period, only
species with 50% or greater of their variance explained were plotted so as to reduce
the number of species on anyone plot.
A unimodal method of statistical analysis was used as a large number of zeroes
contributed to the species matrix. The absence and species turnover across the sites
and months was high and does not support the use of linear methods of data analysis.
Having used a unimodal method, rare species were haVing an unduly large influence
on the species data analyses. The rare species were down weighted to reduce their
emphasis on the outcome of the Canonical Correspondence Analysis (CCA).
In the Partial Correspondence Analysis (PCA) testing a numerical value was ascribed
to each of the slope orientations recorded during the study period in order to be able to
run the appropriate statistical tests.
The program used to do all the Correspondence Analysis (CA) Canonical
Correspondence Analysis (CCA) and Partial Correspondence Analysis (PCA) was
CANOCO 4 for windows.
2.3.3. Cluster Analysis and evenness indices
Cluster analysis was used to describe a set of numerical techniques in which the main
purpose was to divide the objects of study into discrete groups or categories. These
groups were based on the characteristics of the grasshoppers and its clusters have a
significant role to play in linking similar sites and months. The unweighted, Bray-Curtis
method of comparison was used as all the sites were sampled equally. The advantage
of using the Bray-Curtis coefficient of similarity (Magurran, 1988) is that it is a
quantitative measure that takes into account species abundances (Southwood, 1978;
Magurran, 1988). The program used to undertake the cluster analysis was PC-ORD.
Blonc INDICATORS OF GRASSLAND CONDITION IN KWAZULU-NATAl WITH MANAGEMENT RECOMMENDATIONS

34
2.3.4. Analysis of Variance (ANOVA)
An analysis of variance (ANOVA) was done on the species composition between the
different grazing regimes, feeding guilds and grassland types to measure any
statistically significant difference between them. The level of significance was 95% P =0.05. ANOVA's were done using STATISTICA 4 package and were transformed to
comply with the assumptions that are made when doing an ANOVA (Johnson &
Wichern, 1992).
2.3.5. Pearson Correlations
The general purpose of a Pearson Correlation is to learn more about the relationship
between several independent variables and how congruent they are when comparing
them across a number of samples. The major conceptual limitation of all correlation
techniques is that one can only ascertain relationships, but never be sure about
underlying causal mechanisms. The computer program used to do Pearson
Correlations was STATISTICA 4.
2.3.6. Mantels Test
The Mantel test is used to test the null hypothesis of no relationship between two
square symmetrical matrices. This test evaluates the correlation between distance (or
similarity or dissimilarity) matrices (McCune & Grace, 2002). The distance measure
used for the two matrices is the Sorenson measure (Bray-Curtis). The Mantel test is an
alternative to regressing one correlation matrix against another, circumventing the
problem of partial dependence within each matrix. Because the cells of distance
matrices are not independent of each other, we cannot accept the p-values from
standard techniques that assume independence (for example, Pearson correlation).
Nevertheless, the Pearson correlation r can be used as a measure of the strength of
the relationship between the two distance matrices. In this case, r is called the
standardized Mantel statistic and ranges from -1 to1 (Rohlf & Sokal, 1995).
1000 Monte Carlo simulations are under taken. These simulations randomize the dataI
by shuffling the order of the rows and columns. After each permutation is successfully
completed, Mantel's Z-statistic is calculated with the resulting Z statistics from all
BIOTIC INDICATORS OF GRASSLAND CONDITION IN KWAZULU-NATAL WITH MANAGEMENT RECOMMENDATIONS

35
permutations providing an empirical distribution that is used for the significance test.
PC-ORD was used to undertake the necessary simulations and testing.
2.3.7. Multiple Response Permutation Procedures (MRPP)
MRPP is a non-parametric procedure for testing the hypothesis of no difference
between two classes or entities. Three assumptions need consideration when using
MRPP.
1. The distance measure chosen adequately represents the variation of
interest in the data.
2. The sample units are independent. The usual problems with
pseudoreplication, subsampling and repeated measures are conceptually
the same as with ANOVA.
3. The relative weighting of the variables has been controlled prior to
calculating the distance measure, such that the weighting of variables is
appropriate for assessing the ecological question being asked.
A natural weighting methodology recommended by Mielke (1984) was utilised, and is
the most common weighting measure in recent applications of MRPP, being one of
four offered by PC-ORD. Groups were separated across nine distinct categories. The
categories are: ASPECT, FORB CONTENT, VEGETATION HEIGHT, GRASSLAND
TYPE, VELD CONDITION, GRAZING, BIENNIAL BURN, DISTURBANCE and
SEASON OF BURN. A Sorenson (Bray-Curtis) distance measure was utilised, as it is
more robust and ecologically meaningful measure, as the data set that it tested had a .
high number of zeroes (absence data). The traditional Euclidean distance measure is
less robust and usually only shows more linear discrepancies. The computer program
utilised to elucidate differences in species assemblages between two measured
classes was PC-ORD, Version 4.25.
When interpreting results, the test statistic T, describes the separation between the
groups. The more negative is T, the stronger the separation between the two classes
being compared, and therefore the more statistically significant the p-value.
Blonc INDIC".TORS OF GRASSLAND CONDinON IN KWAZULU·NATAl WITH MANAGEMENT RECOMMENDAnONS

36
2.3.8. Indicator Species Analysis (ISA)This method of assessment combines information on the concentration of species
abundance in a particular group and the faithfulness of the occurrence of that species
to a particular group (Dufrene & Legendre, 1997). A perfect indicator is a species which
is always present within a certain group (category) Le. it is 'faithful' to that group, in
addition it should also be 'exclusive' to that group, never occurring in other groups
(McCune & Grace, 2002).
To achieve a result of whether a species is an indicator or not, the proportional
abundance, and frequency of occurrence of each species is calculated for a particular
group. Both values are then represented as a percentage and combined to produce a
resultant value. The highest indicator value is 100 and the lowest is zero. A good
indicator will have a high percentage for both proportional frequency and abundance;
conversely a poor indicator will have low percentages for the two categories calculated.
To validate the statistical significance of the values, they are randomly reassigned to
different sampling units 1000 times using the Monte Carlo method (McCune & Grace,
2002). The program utilised to undertake ISA was PC-ORD, Version 4.25.
Blonc INDICATORS OF GRASSLAND CONDITION IN KWAZUlU·NATAL WITH MANAGEMENT RECOMMENDATIONS

37
CHAPTER 3
RESULTS
3.1. Grass species composition and abundance
Thirty-two species of grass belonging to seven tribes were sampled during the
February 2001 survey. One species was an exotic species, namely Paspalum urvillei.
Only two species of grass were encountered across all ten sites (Eragrostis curvula
and Themeda triandra) (Table 4). Six species of grass were encountered at one site
only; Brachiaria serrata, Digitaria eriantha, Eulalia villosa, Imperata cylindrica, Melinis
nerviglumis and Miscanthuscapensis. Only two of these species, namely B. serrata
and M. capensis were recorded in abundance, the remainder being rare (recorded ten
times or less). In addition, six species were recorded at more than one site, but were
rare (Table 4).
The most common grass was T. triandra making up greater than 50% of the grass
composition at five of the ten sites (Coleford, Goodhope 2, Karkloof 2, Linwood and
Wahroonga 2) (Table 4), which were predominantly short, opengrasslands with an
average vegetation height of between 30cm and 45cm. The average grass cover was
between 75% and 85% (Table 3).
Wahroonga 1 had one grass species (Hyparrhenia hirta) making up greater than 50%
of all grasses recorded. Stirling had 45% Miscanthus capensis and Karkloof 1, 41 %
Aristida junciformis. A. junciformis is a pioneer and invader species, hence its high
abundance at Karkloof 1, a rehabilitated pine compartment.
Two sites Himeville and Goodhope 1 did not show similar compositional trends to the
other grasslands with 50% or more of the grass composition at
BIOTIC INDICATORS OF GRASSLAND CONDITION IN KWAZULU-NATAL WITH MANAGEMENT RECOMMENDATIONS

38
these sites shared across three species. At Himeville (Allopteris semialata,
Heteropogon contortus and Tristachya leucothrix) and Goodhope 1 (Cymbopogon
plurinodis, Eragrostis curvula and Themeda triandra) (Table 4).
Table 4. Grass species abundances recorded during February 2001 across the tenstudy sites sampled. (C= Coleford, GH1= Goodhope 1, GH2= Goodhope 2, H=Himeville, KK1= Karkloof 1, KK2= Karkloof 2, L= Linwood, S= Stirling, WW1=Wahroonga 1, WW2= Wahroonga 2)
Species C GH1 GH2 H KK1 KK2 L S WW1 WW2
28178 58 159 35
2
1325 172 215 39
5
60ANDROPOGONEAECymbopogon excavatus (Hochst.)Cymbopogon plurinodis (Stapf)Diheteropogon amplectens (Nees)Eulalia villosa (Thun.)Heteropogon contortus (L.)Hyparrhenia hirta (L.)Imperata cylindrica (L.)Miscanthus capensis (Nees)Monocymbium cerissiforme StapfThemeda triandra Forssk.Trachypogon spicatus KuntzeARUNDINELLEAELoudetia simplex (Nees)Tristachya leucothrix NeesCHLORIDAEHarpochloa falx KuntzeRendlia altera (Rendle)ERAGROSTEAEEragrostis capensis (Thun.)Eragrostis curvula (Schrad.)Eragrostis plana NeesEragrostis racemosa (Thun.)PANICEAEAlloteropsis semialata eckloniana NeesBrachiaria serrata (Thun.)Digitaria eriantha Steud.Melinis nerviglumis (Franch)Melinis repens (Willd)Panicum ecklonii NeesPanicum natalense Hochst.Paspalum scrobiculatum L.Paspalum urvillei Steud.Setaria sphacelata sphacelata(Schumach.)SPOROBOLEAESporobolus africanus Robyns & TournaySporobolus pyramidalis P. Beauv.STIPEAEAristida junciformis Trin. & Rupr.Species richness
421
86
11
2
7
8
5129
3231
15
73
5
5
814
12
14
305
342
2
2
739
4
3
3
14
93
65
9
16
86
1
1
111
6
1
12
7
70
5
18
23
4
6
12312
2
77
4
3
22
4471
20
514
30
30
21
88
135
15
306
157
109
2162
42
320
86
2
6
3012
449
58151
14
21
37
Blonc INDICATORS OF GRASSLAND CONDITION IN KWAZULU·NATAL WITH MANAGEMENT RECOMMENDAnONS

39
3.2. Veld condition scores
Coleford had the highest key and benchmark veld condition scores (1.35 and 1.26),
resulting from a high percentage (88%) of the grass composition comprising Themeda
triandra and Tristachya leucothrix (Table 3). These high scores reflect the high
agricultural productivity of these grasslands. Five sites (Linwood, Karkloof2, Wahroonga
2, Goodhope 2 and Himeville recorded scores over 0.8. these scores reflecting good
condition grasslands (Table 3). The remaining four sites scored 0.56 or lower with
Stirling being the poorest with a score of 0.23 and 0.36. This site is dominated by
Miscanthus capensis that is not considered a key grass species in either the
environmental or agricultural assessment (Camp and Hardy, 1998) (Table 3).
3.3. Forbaceous species composition and abundance
As this study was not aimed at determining the floral richness of sites, only species that
were relatively common at any specific site or across sites were identified (Table 5). The
site with the highest species richness was Wahroonga 1, a triennially burnt grassland,
with limited wildlife utilisation. Three species encountered at this site are bulbous, and
are typically excluded at sites, which are regularly burnt, or intensively grazed. The
second most species rich site was Stirling, an over-utilised south facing grassland that
had a profusion of woody plant species such as, Leonotus leonurus, Phymaspermum
acerosum and Rubus cuneifolius. Two of the species encountered at this site were alien
invasives, namely, R. cuneifolius and Verbena bonariensis. P. acerosum is considered
an invasive plant in the midlands and usually becomes a problem in over-utilised lands
or previously disturbed lands. Senecio madagascarensis is also indicative of
disturbance and over-utilisation. The majority of the species found at Stirling were
considered undesirable species, as they are invasive. The three most species poor sites
are Himeville (3) and Coleford (2). Two of the most common species recorded at
Himeville are alien species, with only one species being desirable. At Coleford only two
species were recorded. The reason for the low plant species diversity is as a result of
the farming practice imparted on the land prior to it being declared a nature reserve in
1947. This area when commercially farmed was regularly sprayed with broad-leaved
weed-killers to improve the quantity of grass for grazing.
BIOTIC INDICATORS OF GRASSLAND CONDITION IN KWAZULU·NATAl WITH MANAGEMENT RECOMMENDATIONS
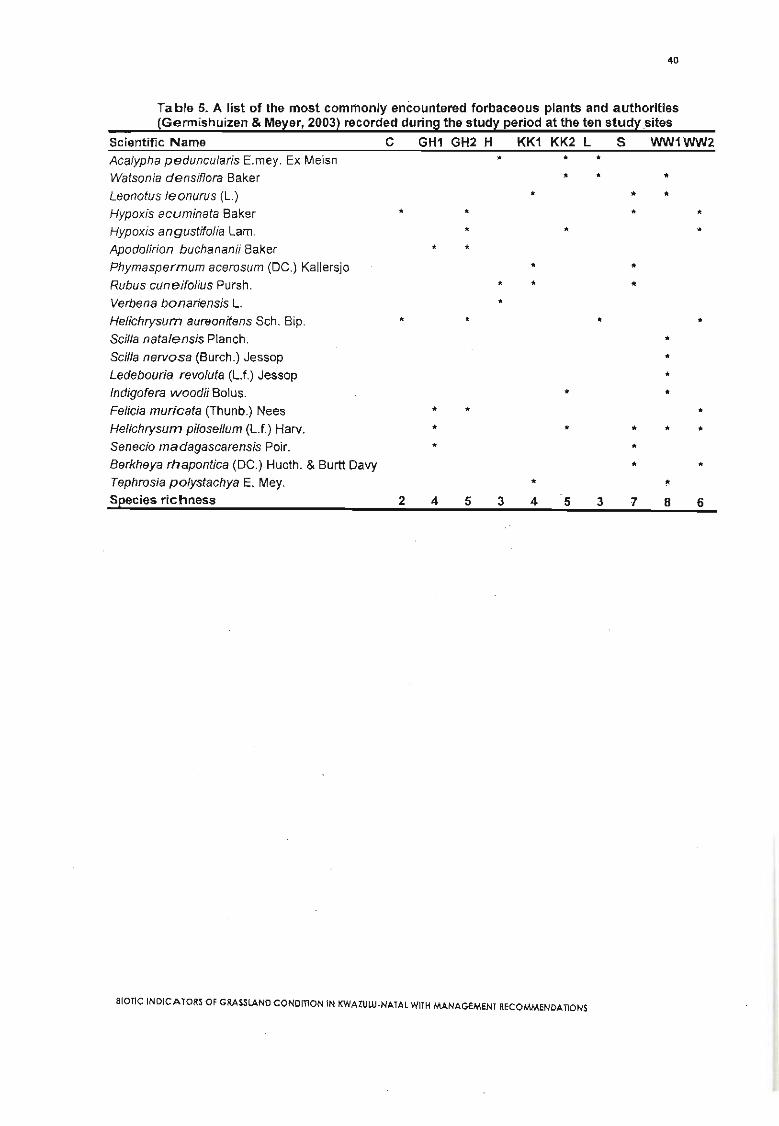
40
Table 5. A list of the most commonly encountered forbaceous plants and authorities(Germishuizen & Meyer, 2003) recorded during the study period at the ten study sites
*
*
*
*
6
**
*
*
*
*
**
*
8
*
*
**
**
7
**
*
3
*
*
5
*
*
*
4
*
*
3
*
*
*
5
***
42
*.
Scientific Name C GH1 GH2 H KK1 KK2 L S WW1 WW2Acalypha peduncularis E.mey. Ex Meisn * * *Watsonia densiflora Baker * *Leonotus /eonurus (L.) *Hypoxis acuminata Baker * *Hypoxis angustifolia Lam. *Apodolirion buchananii Baker * *Phymaspermum acerosum (DC.) Kallersjo
Rubus cuneifolius Pursh.
Verbena bonariensis L.
Helichrysum aureonitens Sch. Bip.
Scilla nata/ensis Planch.
Scilla nervosa (Burch.) Jessop
Ledebouria revo/uta (Lt.) Jessop
Indigofera woodii Bolus.
Felicia muricata (Thunb.) Nees
Helichrysum pilosellum (Lt.) Harv.
Senecio madagascarensis Poir.
Berkheya rhapontica (DC.) Hucth. & Burtt Davy
Tephrosia po/ystachya E. Mey.
Species richness
BIOTIC INDICATORS OF GRASSLAND CONDITION IN KWAZULU-NATAL WITH MANAGEMENT RECOMMENDATIONS

41
3.4. Abundance across species
3.4.1. Grasshoppers
Table 6. Grasshopper species recorded during the study period, the code used in analyses,frequency of encounters for each species, the mean of species abundance, the mean pertransect and the maximum number of individuals encountered at anyone transect
Species Species code Abundance Freq Mean LMean Max
ACRIDIDAE
Acorypha ferrifer (Walker) ACOFER 6 5 1.20 2Acorypha nigrovariegata tibialis (Kirby) ACOTIB 88 46 0.07 1.91 7Acrida sp. ACRUDW 1 1 0.00 1.00 1Acrida acuminata (Stelll.) ACRACC 461 165 0.38 2.79 14Acrida bic%r (Thunberg) ACRBIC 25 23 0.02 1.09 2Anab/epia dregei (Ramme) ANADRE 73 22 0.06 3.32 11Aneuryphymus montanus (Brown) ANEMON 10 8 0.01 1.25 3Anthermus granosus (Stal.) ANTGRA 77 42 0.06 1.83 7Calliptamu/us nata/ensis (Sjostedt) CALNAT 5 4 0.00 1.25 2Cafliptimicus semiroseus (Serville) CALSEM 160 61 0.13 2.62 11Cannula gracilis (Burmeister) CANGRA 16 12 0.01 1.33 3Catantops me/anostictus (Schaum) CATMEL 104 42 0.09 2.48 8Coryphosima stenoptera (Schaum) CORSTE 547 173 0.46 3.16 15Crucinotacris cruciata (I. Bolivar) CRUCRU 8889 607 7.41 14.64 94Cyrtacanthacris aeruginosa (Stoll.) CYRAER 38 25 0.03 1.52 3Dirshia abbreviata (Brown) DIRABB 98 46 0.08 2.13 9Eupropracris cy/indricollis (Schaum) EUPCYL 2 2 0.00 1.00 1Eyprepocnemis p/orans (Charpentier) EYPPLO 103 65 0.09 1.58 4Faureia milanjica (Karsch) FAUMIL 258 62 0.22 4.16 13Faureia rosea (Uvarov) FAUROS 6 5 0.01 1.20 2Gastrimargus crassicollis (Saussure) GASCRA 136 82 0.11 1.66 7Gastrimargus determinatus vitripennis (Walker) GASVIT 11 9 0.01 1.22 2Gastrimargus drakensbergensis (Ritchie) GASDRA 332 108 0.28 3.07 16Gymnobothrus temporalis temporalis (Stal.) GYMTEM 79 33 0.07 2.39 11Heteracris herbacea (Serville) HETHER 62 36 0.05 1.72 4Heteroptemis guttifera (Kirby) HETGUT 6 5 0.01 1.20 2Macheridia bilineata (Stal.) MACBIL 294 158 0.25 1.86 5Omithacris cyanae (Stoll.) ORNCYA 11 10 0.01 1.10 2Orthochtha rosacea (Walker) ORTROS 271 78 0.23 3.47 13Orthochtha zu/uensis (Popov and Fishpool) ORTZUL 15 12 0.01 1.25 3Orthochtha dasycnemis (Gerstaecker) ORTDAS 2496 364 2.08 6.86 69Oxya hy/a hy/a (Serville) OXYHYL 134 13 0.11 10.31 39Paracinema tric%r (Thunberg) PARTRI 12 8 0.01 1.50 3Parga xanthoptera (Stlll.) PARXAN 36 26 0.03 1.38 4Phaeocatantops su/phurius (Walker) PHASUL 33 29 0.03 1.14 2Pnorisa squa/us (Stal.) PNOSQU 88 22 0.07 4.00 9Rhaphotittha cephalica (I. Bolivar) RHACEP 62 17 0.05 3.65 12Scintharista rosacea (Kirby) SCIROS 3 3 0.00 1.00 1Vittacatantops botswana (Jago) VITBOT 350 159 0.29 2.20 14
alonc INDICATORS OF GRASSLAND CONDITION IN KWAZULU·NATAL WITH MANAGEMENT RECOMMENDATIONS

42
LENTULlDAEEremidium basuto (Brown) EREBAS 144 59 0.12 2.44 10
Lentula minuta (Dirsh) LENMIN 647 119 0.54 5.44 28
Lentula obtusifrons (Stal.) LENOBT 302 130 0.25 2.32 12
Qachasia fastigiata (Dirsh) QACFAS 148 64 0.12 2.31 10
PAMPHAGIDAETransvaaliana draconis (Brown) TRADRA 2 2 0.00 1.00
PYRGOMORPHIDAEDictyophorus spumans (Thunberg) DICSPU 23 13 0.02 1.77 4Maura rubroomata (Stal.) MAURUB 1 1 0.00 1.00 1Ochrophlebia caffra (Linnaeus) OCHCAF 91 55 0.08 1.65 5Phymateus leprosus (Fabricius) PHYLEP 2 2 0.00 1.00 1TETRIGIDAEPhloeonotus humilis (Gerstaecker) PHLHUM 109 56 0.09 1.95 10Phloeonotus sp. PHLSPP 6 4 0.01 1.50 2Tettiella aff. arcuata (Hancock) TETARC 12 8 0.01 1.50 3TETTIGONIIDAEConocephalus sp. CONSPP 1346 255 1.12 5.28 30
Gryllidae sp. GRYLLI 11 6 0.01 1.83 3Tettigoniidae sp. TETTIG 1 1 0.00 1.00 1THERlCLEIDAEWhitea a/ticeps (Descamps) WHIALT 30 15 0.03 2.00 7
A total of 18273 individuals in 55 species, belonging to seven families and 18 sub
families, were recorded over a period from February 2001 to October 2002 at ten
different sites (Table 6). The most abundant family was the Acrididae accounting for
71% of all grasshopper species. Two families recorded 7% respectively of the overall
species composition, namely the Lentulidae and the Pygomorphidae. The remaining
six families comprised 13% of the species assemblage. The most abundant species
that occurred at all sites Crucinotacris cruciata, comprising 48.65% (8889 individuals)
of the grasshopper observations (Table 6). The next most common species was
Orthochtha dasycnemis making up 13.66% (2496 individuals) of observations and was
found at nine out of the ten sites sampled. Conocephalus sp. was the third most
common species comprising 7.37% (1346 individuals) of the total observations. 17
species ranged from 3.54% (647 individuals) of observations to 0.56% (103 individuals)
of observations while the remaining 35 species were 0.55% (100 individuals) of
observations or lower (Table 6).
17 species of grasshopper recorded between 650 individuals an.d 100 individuals'J
Lentula minuta (647), Coryphosima stenoptera (547), Acrida acuminata (461),
Vittacatantops botswana (350), Gastrimargus drakensbergensis (332), Lentula
BIOTIC INDICATORS OF GRASSLAND CONDmON IN KWAIULU·NATAl WITH MANAGEMENT RECOMMENDAnONS

43
obtusifrons (302), Macheridia bilineata (294), Orthochtha rosacea (271), Faureia
milanjica (258), Calliptimicus semiroseus (160), Qachasia fastigiata (148), Eremidium
basuto (144), Gastrimargus crassicollis (136), Oxya hy/a hy/a (134), Ph/oeonotus
humilis (109), Catantops me/anostictus (104) and Eyprepocnemis p/orans (103).
15 species recorded less than 100 individuals; Dirshia abbreviata (98), Ochroph/ebia
caffra (91), Pnorisa squa/us (88), Acorypha nigrovariegata tibialis (88), Gymnobothrus
tempora/is temporalis (79), Anthermus granosus (77), Anab/epia dregei (73),
Rhaphotittha cepha/ica (62), Heteracris herbacea (62), Cyrtacanthacris aeruginosa
(38), Parga xanthoptera (36), Phaeocatantops su/phurius (33), Whitea a/ticeps (30),
Acrida bic%r (25) and Dictyophorus spumans (23).
A further 14 species were encountered less than 20 times. Scintharista rosacea,
Calliptamu/us nata/ensis, Acorypha ferrifer, Faureia rosea, Heteroptemis guttifera,
Ph/oeonotus sp., Aneuryphymus montanus, Gryllidae sp., Gastrimargus determinatus
vitripennis, Ornithacris cyanae, Paracinema tric%r, Tettiella aft. arcuata, Orthochtha
zu/uensis and Cannula gracilis. All these species are classed as rare species for the
sites that were sampled. Three species were recorded twice, Transvaaliana draconis,
Phymateus /eprosus and Eupropracris cylindricollis. Three species were recorded only
once; they were Acrida sp., Maura rubroomata and a species of Tettigoniidae sp.
(Table 6).
BIOTIC INDICATORS OF GRASSLAND CONDITION IN KWAZULU-NATAl WITH.MANAGEMENT RECOMMENDATIONS

soo
400
fl 300cIII'0C::s~ 200
44
Figure 3. A histogram of grasshopper abundance over the 12-month study period for all 10 sites.(Species represented by hatched bars are endemic). Refer to Table 6 for grasshopper speciescodes.
3.4.2. Butterflies
Table 7. Butterfly species recorded during the study period. The code used in analysis,frequency of encounters for each species, the mean of species abundance, the meanper transect and the maximum number of individuals encountered at anyone transectare given
Species Species code Abundance Freq Mean LMean MaxLYCAENIDAEActizera lucida (Trimen) ACTLUC 25 18 0.02 1.39 3A/oeides oreas (Tite & Dickson) ALOORE 11 9 0.01 1.22 3A/oeides taikosama (Wallengren) ALOTAI 9 6 0.01 1.5 3Cupidopsis cissus (Godart) CUPCIS 14 10 0.01 1.4 3Harpendyreus noquasa (Trimen & Bowker) HARNOQ 6 6 0.01 1 1Orachrysops ariadne (Butler) ORAARI 1 1 0 1 1Orachrysops /acrimosa (Bethune-Baker) ORALAC 11 10 0.01 1.1 2Orachrysops subravus (Henning) ORASUB 1 1 0 1 1NYMPHALlDAEAcraea horta (Linnaeus) ACRHOR 2 2 0 1 1Cassionympha cassius (Godart) CASCAS 77 46 0.06 1.67 8Catacroptera c/oanthe c/oanthe (Stoll.) CATCLO 11 9 0.01 1.22 2Danaus chrysippus (Schreber) DANCHR 78 64 0.07 1.22 3Dingana bowkeri bowkeri (Trimen) DINBOW 15 10 0.01 1.5 3Hyalites eponina eponina (Cramer) HYAEPO 2 2 0 1 1Pardopsis punctatissima (De Boisduval) PARPUN 14 11 0.01 1.27 3Precis hierta hierta (Fabricius) PREHIE 2 2 0 1 1Precis octavia Cramer) PREOCT 69 46 0.06 1.43 5Pseudonympha varii (Van Son) PSEVAR 64 40 0.06 1.68 5Stygionympha wichgrafi wichgrafi (Van Son)STYWIC 19 3 0 1 1Vanessa cardui (Linnaeus) VANCAR 72 49 0.07 1.8 7
BIOTIC INDICATORS OF GRASSLAND CONDITION IN KWAZULU-NATAL WITH MANAGEMENT RECOMMENDATIONS

45
PAPILlONIDAEPapilio demodocus (Esper) PAPDEM 9 9 0.01 1 1Papifio n;reus Iyaeus (Linnaeus) PAPNIR 2 2 0 1 1PIERIDAEBelenois aurota (Fabricius) BELAUR 35 25 0.03 1.4 3Belenois zochalia zochalia (De Boisduval) BELZOC 21 18 0.02 1.17 2Catopsilia florella (Fabricius) CATFLO 16 15 0.01 1.07 2Colias electo (Fabricius) COLELE 79 50 0.07 1.58 3Eurema brigitta brigitta (Stall.) . EURBRI 33 26 0.03 1.27 3
698 individuals, comprising 27 species and four families were recorded across the ten
sites for the 12-month study period (Fig. 4). The most common butterfly was Vanessa
cardui with 12.61 % (88 individuals) of observations. Five other species were also
abundant: Colias electo 11.31 % (79), Danaus chrysippus 11.17% (78), Cassionympha
cassius 11.03% (77), Pseudonympha varii 9.60% (67) and Precis octavia 9.55% (66).
Four species were rare,only 20-35 individuals recorded: Belenois aurota, Eurema
brigitta brigitta, Actizera lucida and Belenois zochalia zochalia. 17 species were very
rare, recording less than 20 individuals, Catopsilia f10rella (16), Dingana bowkeri
bowkeri (15), Pardopsis punctatissima (14), Cupidopsis cissus (14), Orachrysops
lacrimosa (11), Catacroptera cloanthe cloanthe (11), Aloeides oreas (11), Papilio
demodocus (9), Aloeides taikosama (9), Harpendyreus noquasa (6), Stygionympha
wichgrafi wichgrafi (3), Precis hierta hierta (2), Papilio nireus Iyaeus (2), Hya/ites
eponina eponina (2), Acraea horta (2), Orachrysops subravus (1) and Orachrysops
ariadne (1) (Table 7).
100
90
80
70CD
g 60III'g 50:::J
~ 40
30
20
10
O~~~~~L,II3L,-a.-.~......n...-L,Jlll~-.ItII.,o--,l"'c.,R~"J:lI,I!l,.I,is !:! l!! 'jij !::: u UI 0 0 ..9!UI oC" ,., 'C C' 0 'C U .Cl E .. C GI .. .. u ..
- 0 ~ - 0 ~ ~ $ GI ~ U S .Cl 0 ~ III III :::J GI ~ :::J ~ g III I III§ E ~ ~ m~ m'il UI fti ulllO go C .g ~ E = f ~ ="C ~ e- e GI ~ g_-- ~u uu~cw~~ooo~~~~~:~~
Butterfly species
Figure 4. Butterfly species recorded across ten sites for the 12-month study period. (Speciesrepresented by hatched bars endemic). Refer to Table 7 for butterfly species codes.
. BIOTIC INDICATORS OF GRASSLAND CONDITION IN KWAZOLU·NATAL WITH MANAGEMENT RECOMMENDATIONS
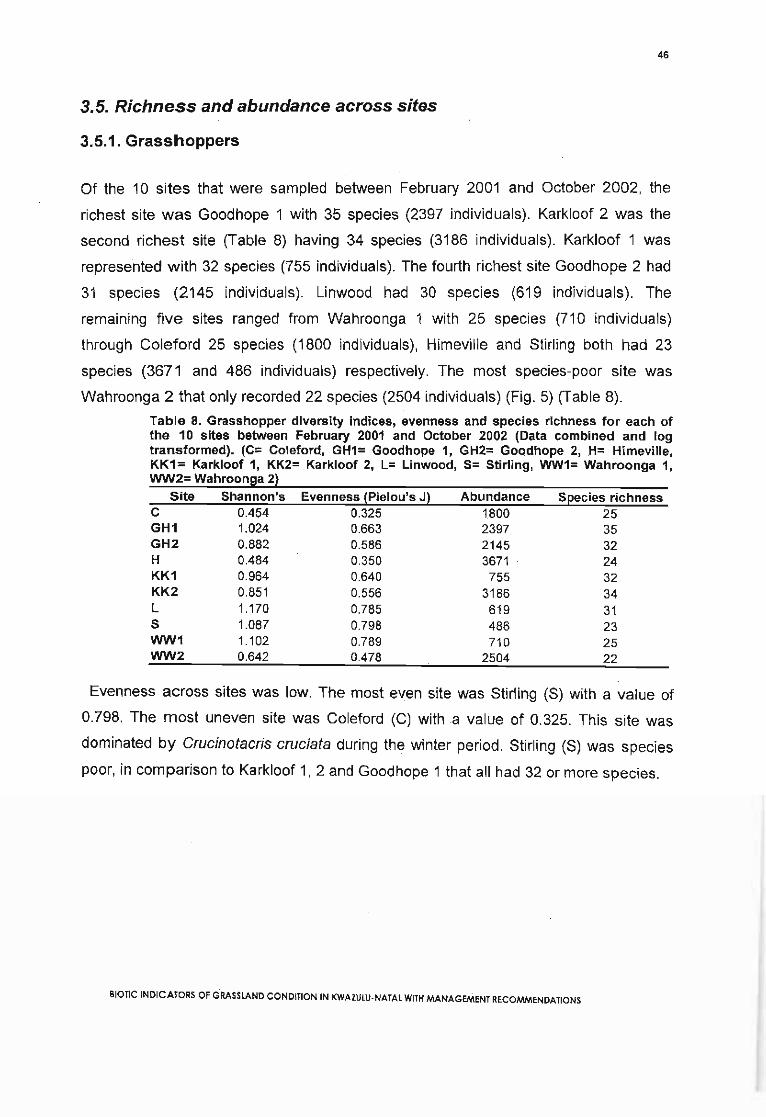
46
3.5. Richness and abundance across sites
3.5.1. Grasshoppers
Of the 10 sites that were sampled between February 2001 and October 2002, the
richest site was Goodhope 1 with 35 species (2397 individuals). Karkloof 2 was the
second richest site (Table 8) having 34 species (3186 individuals). Karkloof 1 was
represented with 32 species (755 individuals). The fourth richest site Goodhope 2 had
31 species (2145 individuals). Linwood had 30 species (619 individuals). The
remaining five sites ranged from Wahroonga 1 with 25 species (710 individuals)
through Coleford 25 species (1800 individuals), Himeville and Stirling both had 23
species (3671 and 486 individuals) respectively. The most species-poor site was
Wahroonga 2 that only recorded 22 species (2504 individuals) (Fig. 5) (Table 8).
Table 8. Grasshopper diversity indices, evenness and species richness for each ofthe 10 sites between February 2001 and October 2002 (Data combined and logtransformed). (C= Coleford, GH1= Goodhope 1, GH2= Goodhope 2, .H= Himeville,KK1= Karkloof 1, KK2= Karkloof 2, L= Linwood, S= Stirling, WW1= Wahroonga 1,WW2= Wahroonga 2)
Site Shannon'sCGH1GH2HKK1KK2LSWW1WW2
0.4541.0240.8820.4840.9640.8511.1701.0871.1020.642
Evenness (Pielou's J)0.3250.6630.5860.3500.6400.5560.7850.7980.7890.478
Abundance1800239721453671
7553186619486710
2504
Species richness25353224323431232522
Evenness across sites was low: The most even site was Stirling (S) with a value of
0.798. The most uneven site was Coleford (C) with a value of 0.325. This site was
dominated by Crucinotacris cruciata during the winter period. Stirling (S) was species
poor, in comparison to Karkloof 1, 2 and Goodhope 1 that all had 32 or more species.
Blonc INDICATORS OF GRASSLAND CONDITION IN KWAZULU·NATAl WITH MANAGEMENT RECOMMENDATIONS

N W -. 01o 0 0 0 0000000
Abundance
AeraeeAerble
AnadreCatmel
ConsppCorsteCrueru jjlllHllllHllllHllllHllllHllllHllllImCyraer
(i) Dirabb~ Erebas~ Eypplo.g Gasera'i Gasdra;;: Lenmln'i Lenobt~. Maeblll/) Ochcaf
OrtrosOrtzul
OrtdasPhlhumQaefasSeirosTetareVitbot
o ~ ~ ~ g:o 0 0 0 0 0
Abundance
AeotlbAeraeeAerbleAnemoAntgra
Calsem,Catme ~gg:'s&&Crueru _~ _
Cyraer
(i) ~:e~~~~ ~Cg\H5" Fauros
"'Cl Gaserai G~::mIII Gymtet.'i Lenmln
2- if~gJltIII Ortdas
OrtrosO~~:wlParxanPhlhumPhlspp
PnOSfQuQaeasRhaeepTetareVitbot
ClooCo:ro't:lCD...I-Q::c...
~ ~ ~ ~ S00000 0
Abundance
AeoferAeotlbAeraeeAnemoAntgra
CalsemCangraCatrilel
ConsppCorste
(i) Crueru Jii,.----iilErebasl:l ~PPloll=- Faumo Fauros:g Gascra1lI Gasdra;;: Gymte'i Hetgutn LenmlnCD LenobtIII Maebll
MaurubOeheafOrtrosOrtdasParxanPhasul
PhlhumPnosquSelrosVitbot
G)ooCo:ro
logNI-Q::cN1-
"'NW-'OI00000
000000
Abundance
AeotlbAerUDAeraeeAerbie
AnadreAntgraCalnat
Calsem~ Consppl:l Corste5" Crueru J)I----
"'Cl Gaserai Gasvit~ Gasdra~ GymtemCD Hetherl/) Maebil
OeheafOrtrosOrtdasPartri
PhasulPhlhum
Vltbot
~I @I I§:, .-::-' I
:::r:3'CD::$.CD
~
'"(5:::!nZcoa~6...C'l~~
>zcnozC=i<5zZ~»Nc:E:Z
E::E~:=»z»C'l
~z....'"mno
~z~ozCl>
~

m5::!nZon~1:/o"It
(j)
~~zcnozc:3ozZ
~~EZ
~~
~
~?i(j)
~mZ....'"mno
~z~5zV>
-:r-~2::1to-Cl)-
~ ~Abundance c: Abundance ~ Abundance Abundance
:::s .., -s~~t~ ~ s~~t~ ~ s~~t~ ~ s~~t~
000000 0 000000 0 000000 000000o 0 ~
Acofer Q. Acrbic .... Acrac;e l\I AeraeeAcracc • - Anadre N Acrblc * Acrble
.... Antgra I- Antgra - Antgra ~Calnat - calsem. _ ~ ccrlnat • g Calsem
Calsem Catmel - N C~~~ ~ .... CatmelConsp - f.:;:: C - Consp --
Catmel I Corste • 8g~~ I=m ~ Corste 11Conspp • Crucru _ Crueru ~ Crucru lIBCorste _ DI.csPu ~ gyraer _ gyraer ~
... Dlrabb Erebas .:;; EupcylCl Crueru I- Cl Erebas '- Cl I;ypplo (j) Eyppr~iil Cyraer iil Eypplo iil Faumil - iil FaumllIII Dlrabb III Gasera III Fauros III Fauros~ :r Gasdra :r Ga.era l1:li :r Gaserao~ ~~ ~~= o~~ Eypplo ill LHethelr I "i G&'~lf i ~~l"R~~.. Ga.era .. enm n .. Hetgut .. Het erIII III Lenobt ~ III L . 11 III "i==mmill Gasdra ill Macbil" ~ L~':,r::m iD 'i l~~r;:~~ CD~, Gymtem ~, Omeya iD' Maebll 1& i- MacbllIII Hetgut III Ortdas ~ III Oeheaf III Oeheaf
. . Ortros Omeya OmeyaHether Parxan grtdas Ortdas ..
Lenmln • Phasul P rtros iE= OrtrosLenobt • Pt~hrm pt'::~ PhasulM b'l yep • Phlhum iD Phlhum
ac I Qaefas Pnos"u QaefasPhasul Tetarc Qaefas Rhaeep ;a
Phlhum Tettlg Rhaeep TetareTradra Vltbot Izm Vltbot
Vltbot • Vltbot Whlalt Whlalt
~

49
(i) Wahroonga 1 (WW1
500
8 400; 300'C
§ 200
~ 100 I m mo -t-,--,-.,..IlI..r-=,JIl.,,JI,n.l1r-n....-a,.-e..,---,.Jl"'II,-.,.a.~IlIll.,--..-,--,.......,..,......,O~E~S2~~!!~~=~~~=c=Jo~
~ ~ ,; g~ 2~ ~ ~ ~ ~ g ~ ~ ~ ~ ~ ~ ~ ~ ~.~~C~UUUD~~~~~~oooo~~a >
Grasshopper species
(j) Wahroonga 2 (WW2)
Figure 5 (a) to (j). Abundance of grasshopper species across each ofthe 10 study sites overthe whole study period. Hatched bars represent Midlands Mistbelt and full bars HighlandSourveld. Refer to Table 6 for grasshopper species codes.
,.---------------------KK1
1...---------------------SIL-- L
~.------------H
I I J GH2
KK2
GH1
WW1
r WW2IL- C
I0.48
I0.4
i0.32
i0.24
I0.16
I0.08
Io
Bray Curtls - Data 109(10) transfonned linking algorithm UPGMA
Figure 6. Grasshopper similarity across sites using Bray-Curtis Cluster Analysis. (C=Coleford, GH1= Goodhope 1, GH2= Goodhope 2, H= Himeville, KK1= Karkloof 1, KK2=Karkloof 2, L= Linwood, 5= Stirling, WW1= Wahroonga 1, WW2= Wahroonga 2).
BIOTIC INOICATORS OF GRASSLAND CONDITION IN KWAZULU·NATAL WITH MANAGEMENT RECOMMENDAnONS

50
The Bray-Curtis Cluster Analysis (Fig. 6) linked together sites that showed similar
species composition. It was interesting to note that the sites did not separate out
according to the different grassland types sampled, Le. Highland Sourveld and
Midlands Mistbelt. There were four separate clusters of sites. The first cluster
comprised of Karkloof 1 Midlands Mistbelt Grassland, a rehabilitated pine
plantation, predominantly made up of Phymaspermum acerosum, a woody plant
species standing about one metre high. Stirling and Linwood were both Highland
Sourveld grasslands. Stirling was predominantly covered by tall vegetation,
comprising woody species and Miscanthus capensis a tall grass species.
The third cluster comprised four sites, Himeville, Goodhope 1, 2 and Karkloof 2.
Himeville and Goodhope 2 were both Highland Sourveld, the other two sites were
Midlands Mistbelt grassland.
The fourth cluster comprised three sites, namely, Wahroonga 1, 2 and Coleford.
Wahroonga 1 and 2 were expected to be similar as they were separated by a
small grassland area. Both were Midlands Mistbelt grasslands, simply exposed to
different management regimes.
Table 9. A presence-absence table of grasshopper species for the ten sites over the studyperiod (* denotes presence). (C= Coleford, GH1= Goodhope 1, GH2= Goodhope 2, H=Himeville, KK1= Karkloof 1, KK2= Karkloof 2, L= Linwood, S= Stirling, WW1= Wahroonga 1,WW2= Wahroonga 2)
Grasshopper Species C GH1 GH2 H KK1 KK2 L S WW1 WW2
ACRIDIDAEAcorypha ferriferAcorypha nigrovariegata tibialisAcrida sp.Acrida acuminataAcrida bicolorAnablepia dregeiAneuryphymus montanusAnthermus granosusCalliptamulus natalensisCalliptimicus semiroseusCannula gracilisCatantops melanostictusCoryphosima stenopteraCrucinotacris cruciataCyrtacanthacris aeruginosaDirshia abbreviataEupropracris cylindricollisEyprepocnemis plorans
***
*****
*
*
**
**
*
*****
*
**
*
**
*****
*
*****
***
**
**
*
*
****
**
**
***
****
*
*
***
**
* *
* ** ** *
** *
* *
*
*
*
**
*
*
**
*
**
*
*
BIOTIC INDICATORS OF GRASSLAND CONDITION IN KWAZULU·NATAL WITH MANAGEMENT RECOMMEN!lATIONS
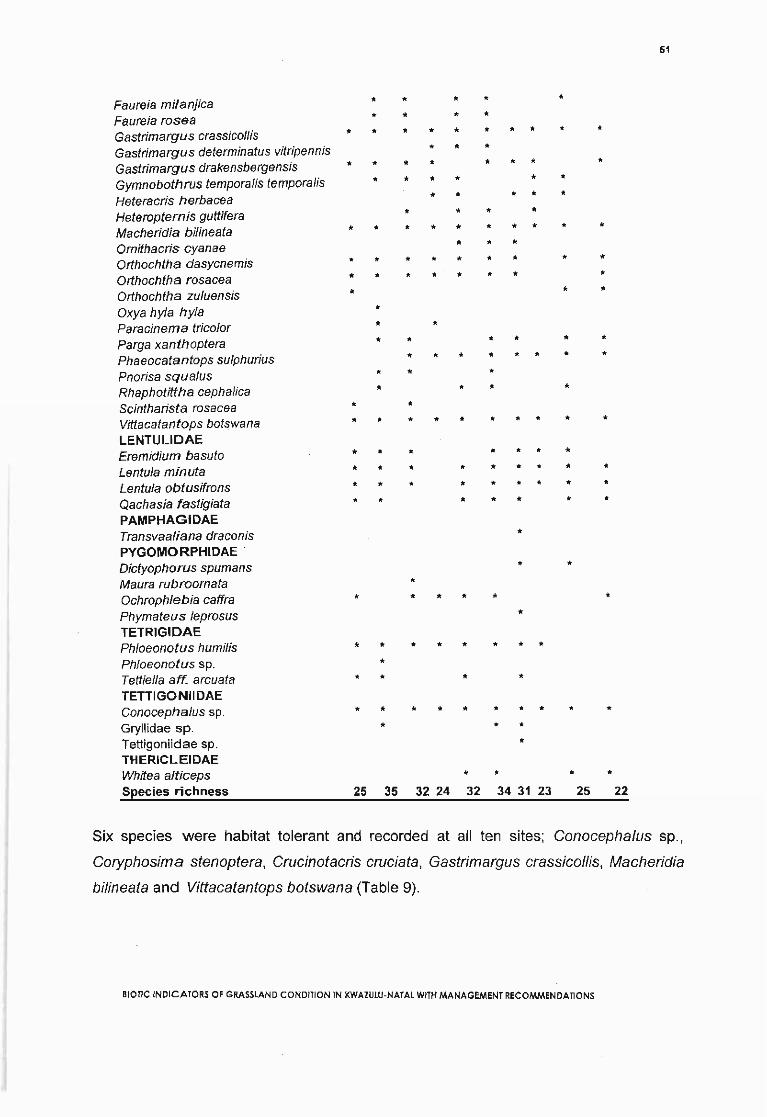
51
* * * * *Faureia milanjicaFaureia rosea * * * *Gastrimargus crassicollis * * * * * * * * * *Gastrimargus determinatus vitripennis * * *Gastrimargus drakensbergensis * * * * * * * *Gymnobothrus temporalis temporalis * * * * * *Heteracris herbacea * * * * *Heteropternis guttifera * * * *
* * * *Macheridia bilineata * * * * * *Omithacris cyanae * * *Orthochtha dasycnemis * * * * * * * * *
* * * * * * * *Orthochtha rosaceaOrthochtha zuluensis * * *Oxya hyla hyla *Paracinema tricolor * *Parga xanthoptera * * * * * *Phaeocatantops sulphurius * * * * * * * *Pnorisa squalus * * *Rhaphotittha cephalica * * * *Scintharista rosacea * *Vittacatantops botswana * * * * * * * * * *LENTULlDAEEremidium basuto * * * * * * *Lentula minuta * * * * * * * * *Lentula obtusifrons * * * * * * * * *Qachasia fastigiata * * * * * * *PAMPHAGIDAETransvaaliana draconis *PYGOMORPHIDAEDictyophorus spumans * *Maura rubroornata *Ochrophlebia caffra * * * * * *Phymateus leprosus *TETRIGIDAEPhloeonotus humilis * * * * * * * *Phloeonotus sp. *Tettiella aft. arcuata * * * *TETTIGONIIDAEConocephalus sp. * * * * * * * * * *Gryllidae sp. * * *Tettigoniidae sp. *THERICLEIDAEWhitea alticeps * * * *Species richness 25 35 32 24 32 34 31 23 25 22
Six species were habitat tolerant and recorded at all ten sites; Conoeephalus sp.,
Coryphosima stenoptera, Crueinotaeris erueiata, Gastrimargus erassiCollis, Maeheridia
bilineata and Vittaeatantops botswana (Table 9).
BIOTIC INDICATORS OF GRASSLAND CONDITION IN KWAZULU-NATAL WITH MANAGEMENT RECOMMENDATIONS

52
Five species were recorded at nine of the ten sites; Acrida acuminata, Eyprepocnemis
plorans, Lentula minuta, Lentula obtusifrons and Orthochtha
dasycnemis. Two species occurred exclusively on Midlands Mistbelt grasslands, both
species were at four of the five sites sampled, Rhaphotittha cephalica and Whitea
a/ticeps. One species, Anablepia dregei occurred exclusively on Highland Sourveld
grasslands (Table 9).
36
30
Xi 24c.z=<.l
;: 18
=U8. 12III
6
oS H c L GH2 WW2 WW1 KK1 KK2 GH1
Sites
Figure 7. A bar chart of species richness for the ten sites sampled during the 12-monthstudy period. (The hatched bars represent Highland Sourveld grasslands and the black barsMidlands Mistbelt). (C= Coleford, GH1= Goodhope 1, GH2= Goodhope 2, H= Himeville, KK1=Karkloof 1, KK2= Karkloof 2, L= Linwood, S= Stirling, WW1= Wahroonga 1, WW2=Wahroonga 2).
3.5.2. Butterflies
Table 10. Presence-absence of butterfly species for the ten sites over the whole studyperiod (* denotes presence). (C= Coleford, GH1= Goodhope 1, GH2= Goodhope 2, H=Himeville, KK1= Karkloof 1, KK2= Karkloof2, L= Linwood, S= Stirling, WW1;:: Wahroonga 1,WW2= Wahroonga 2)
Species C GH1 GH2 H KK1 KK2 L S WW1 WW2
LYCAENIDAEActizera lucida (Trimen}Aloeides oreas (Tite & Dickson)Aloeides taikosama (Wallengren)Cupidopsis cissus (Godart)Harpendyreus noquasa (Trimen & Bowker)Orachrysops ariadne (Butler)Orachrysops lacrimosa (Bethune-Baker)Orachrysops subravus (Henning)NYMPHALlDAEAcraea horta (Linnaeus)Cassionympha cassius (Godart)Catacroptera cloanthe cloanthe (Stoll.)Danaus chrysippus (Schreber)
**
*
*
**
*
*
***
**
**
***
*
**
*
***
****
*
*
*
***
*
*
*
* *** *
*
*
*
***
****
*
***
BIOTIC INDICATORS OF GRASSLAND CONDmON IN KWAZULU-NATAL WITH MANAGEMENT RECOMMENDATIONS

53
Dingana bowkeri bowkeri(Trimen) * *Hya/ites eponina eponina (Cramer) *Pardopsis punctatissima (De Boisduval) * * *Precis hierta hierla (Fabricius) * *Precis octavia Cramer) * * * * * * * * * *Pseudonympha varii (Van Son) * * * * *Stygionympha wichgrafi wichgrafi (Van Son) * * * * * *Vanessa cardui (Linnaeus) * * * * * * * *PAPILlONIDAE
* *Papifio demodocus (Esper) * *Papifio nireus /yaeus (Linnaeus) * *PIERIDAE
* *Be/enois aurota (Fabricius) * * * * * *Be/enois zochalia zochafia (De Boisduval) * * * * * * * *Catopsifia fforella (Fabricius) * * * * * * *Cofias a/ecto (Fabricius) * * * * * * * * * *Eurema brigitta brigitta (Stoll.) * * * * * * * * *Species richness 11 14 16 10 15 15 9 15 16 22
Table 11. Butterfly diversity indices, Shannon~Wiener, evenness and species richness foreach of the ten sites over the whole study period (Data combined and log transformed). (C=Coleford, GH1= Goodhope 1, GH2= Goodhope 2, H= Himeville, KK1= Karkloof 1, KK2=Karkloof 2, L= Linwood, S= Stirling, WW1 = Wahroonga 1, WW2= Wahroonga 2)
Site Shannon's Evenness (Pielou's J) Abundance Species richness
C 0.974 0.936 24 11GH1 0.938 0.818 50 14GH2 0.977 0.812 72 16H 0.724 0.724 110 10KK1 1.030 0.876 76 15KK2 0.959 0.815 96 15L 0.807 0.845 43 09S 1.015 0.863 50 15WW1 0.872 0.725 92 16WW2 1.184 0.882 85 22
The evenness of the values for Pielou's J were similar signifying that individuals were
distributed evenly across the species, with no one dominant species. Certain
sites showed less evenness, namely, Himeville (H) and Wahroonga 1 (WW1) with
values of 0.724 and 0.725 respectively (Table 11).
Bar graphs (Fig. 8 (a) to 0)) represented the number of species and actual abundance
for each of the ten sites over the whole study period. Of the ten sites that were
sampled during this period the most species-rich site was Wahroonga 2, recording 22
species (85 individuals) followed by Wahroonga 1 ahd Goodhope 2 having recorded 16
species with 92 and 72 individuals respectively. Three sites, namely Karkloof 1,
Karkloof 2 and Stirling recorded 15 species with 76, 96 and 50 individuals respectively.
Blonc INDICATORS OF GRASSLAND CONDITION IN KWAZULU·NATAl WITH MANAGEMENT RECOMMENDATIONS
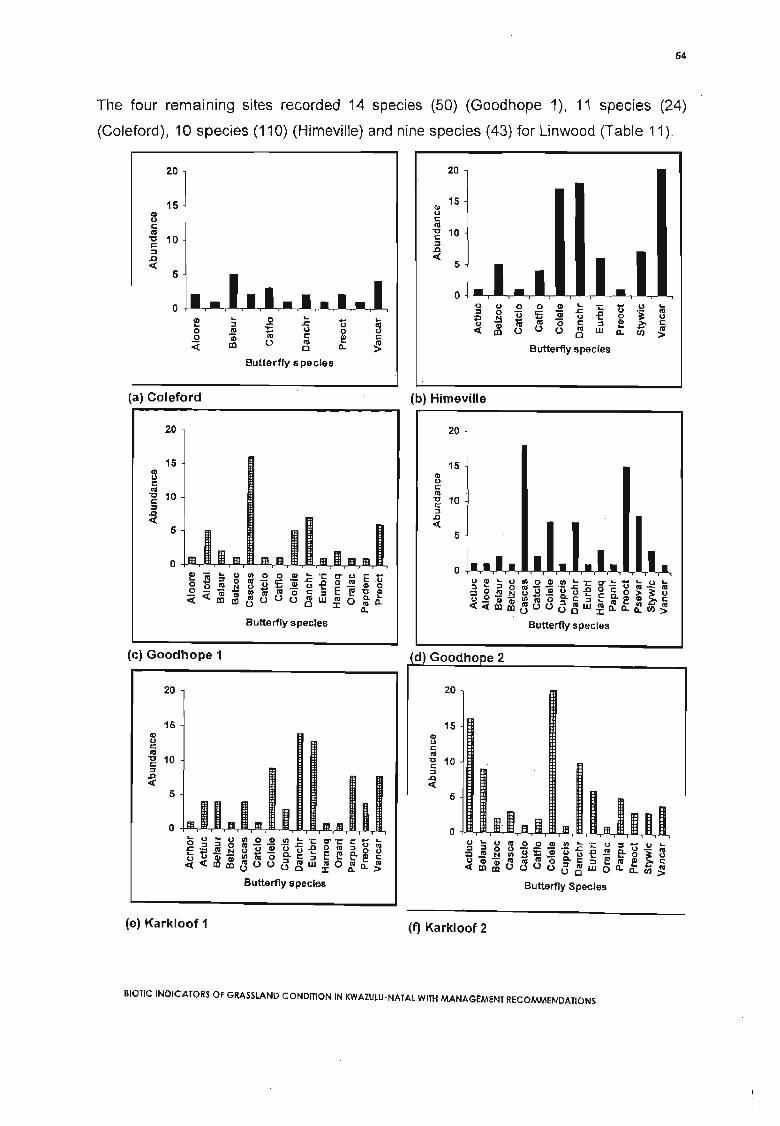
54
The four remaining sites recorded 14 species (50) (Goodhope 1), 11 species (24)
(Coleford), 10 species (110) (Himeville) and nine species (43) for Linwood (Table 11).
0 CD .. i: ... u ..5 Cjj .c .Cl
u
~1lI
U .. 0 U1lI '0 C ::I l!! Cu U 1lI W ~C 0. Cl)
Butterfly species
20 20
15 15Cl)
CD uu cC 1lI1lI "0 10"0 10 cC ::I::I .Cl
.Cl <Cl:<Cl: 5
5
00 u u 0
::I 0 ul!! .. 0 .. u .. n .!:! ...
::I
~.c 1lI CD 1lI
0 1lI U 0 u <Cl: ll:I U.2 Gi c e Cu 1lI
~<Cl: aa 0 0.
Butterfly species
(a) Coleford (b) Himeville
20
158c1lI~ 10::I
.Cl<Cl:
5
01!! 5 .. u rn ° 0 Cl) ...- cr u S'"::I 0 etI- i Gi
.c .. O.!!CDg0 o 1lI .!:! u £ uof0 <:I rn etI '0 C ::I El!'CCD
Ci: CDl3 u u u ~w ~oliltll:I
0.
Butterfly species
20
15CDUC1lI~ 10::I
.Cl<Cl:
5
Ue"urnOCDrn"i:cr"-"u"~ ° i2 ~ u :si 'u '5 of °E .~ g !: "i ~uOCjj-rn'liioQ.c::I -CDCD,i:-C«<aa&ll3uu<3~w~~lt~CI)~
Butterfly species
(c) Goodhope 1
20
15Cl)uC1lI~ 10::I
~5
~g:;g=.2.!.!!!~~cri:CU"€t;-m.!:!li:~~lig:;E~e.~g~«ll:I&ll3UU<3~W~o~o.~
Butterfly species
20
158c1lI~ 10::I.Cl<Cl:
5
(e) Karkloof 1 (f) Karkloof 2
BIOTIC INDICATORS OF GRASSLAND CONDITION IN KWAZULU·NATAl WITH MANAGEMENT RECOMMENDATIONS

55
20
15G)t)Cla-g 10:l.a«
5
(g) Linwood
15flcla-g 10:l
~
(h) Stirling
3) 20
1515fl
CIII ..~10 uc..:l 'g 10.a
"« :i!5
5
u S ~ .. .!! 0 .!! l: ." u E " .!! 1j .. .." " ..
5.i of .!! " !: ..tl .!! .!! u .l! ~
u .. e- J: 0 U.. C " I! 'i e e " c« " tl 0 .. .. ..~« III .. 0 w 0 Q. Q.0 C .. Q. Q.
Q.
Butterfly species
(i) Wahroonga 1 (j) Wahroonga 2
Figure 8 (a) to (j). Butterfly abundance per species for the whole study period. (Hatched barsrepresent Midlands Mistbelt grasslands, Black, Highland Sourveld). Refer to Table 7 forbutterfly species codes.
A Bray Curtis Cluster Analysis (Fig. 9) was done to show the relationship between the
ten sites according to butterfly species assemblages. Linwood and Coleford were the
most dissimilar sites. Karkloof 1, 2 and Himeville were clustered closely, while
Wahroonga 1, 2, Stirling, Goodhope 1and 2 were similar to each other.
B/OTlC INDICATORS OF GRASSLAND CONDITION IN KWAZULU-NATAL WITH MANAGEMENT RECOMMENDATIONS.. .

I
56
r------------------- L
1.----------KK2
I 1L--------KK1.------ill-- H
..-----------~-----WW2'-------I
S'-----------GH2
'--
y,.--------'-----WW1L------------GH1
'--
L-------------------CI
0.6I
0.5I
0.4i
0.3 0.2 0.1 o
Data log(10) transformed linking algorithm UPGMA
Figure 9. Butterfly similarity using Bray-Curtis Cluster Analysis across sites. (Data werecombined and log transformed). (C= Coleford, GH1= Goodhope 1, GH2= Goodhope 2, H=Himeville, KK1= Karkloof 1, KK2= Karkloof 2, L= Linwood, S= Stirling, WW1= Wahroonga 1,WW2= Wahroonga 2).
3.6. Endemic species
3.6.1. Grasshoppers
10
'" 8:lc.c.g 6UIGI
'2 4D.lJ)
2
oH GH2 C s L KK1 WW1 GH1 WW2 KK2
Sites
Figure 10. A bar chart of species endemism for the ten sites sampled during the 12-monthstudy period. (The black bars represent Highland Sourveld grasslands and the hatched barsMidlands Mistbelt). (C= Coleford,GH1= Goodhope 1, GH2=Goodhope 2, H= Himeville, KK1=Karkloof 1, KK2= Karkloof 2, L= Linwood, S= Stirling, WW1= Wahroonga 1, WW2=Wahroonga 2).
A total of 15 species were endemic to South Africa with five species montane
endemics (Table 12). Endemicity did not vary significantly between Highland Sourveld
and Midlands Mistbelt Grasslands, with 14 and 13 species respectively. Linwood had
Blonc INDICATORS OF GRASSLAND CONDITION IN KWAZULU-NATAl WITH MANAGEMENT RECOMMENDATIONS

57
the most endemic species, ten (Fig. 10). Linwood was Highland Sourveld grassland
that was ungrazed and burntbiannually. Karkloof 2 had nine endemic species and was
subject to the same management regime as Linwood. Himeville recorded six endemic
species the lowest of all sites, yet it had the highest abundance of grasshoppers. Six
endemic species were recorded in low abundance, between 2 and 30 individuals, three
species recoded between 60 and 100 individuals and the six remaining species
recorded between 140 and 647 individuals (Table 6).
Table 12. A presence absence table of endemic grasshopper species for the ten sites overthe 12-month study period (* denotes presence). (Abundance measure, Low = (2-30),Medium = (60-100) and High =(140-647». (C= Coleford,GH1= Goodhope 1, GH2= Goodhope2, H= Himeville, KK1= Karkloof 1, KK2= Karkloof 2, L= Linwood, S= Stirling, WW1=Wahroonga 1, WW2= Wahroonga 2)
8
*
**
*
*
*
**
7*
**
*
*
**
8
***
*
**
**
**
*
**
*
**
*
*
9 10
*
*
*
*
*
*
*
*
*
7
*
*
*
***
*
6
*
*
*
*
**
7
*
*
*
*
*
*
8
*
*
**
*
*
8
*
*
**
*
Species Abundance C GH1 GH2 H KK1 KK2 L S WW WW
Anablepia dregei Medium *Aneuryphymus montanus LowCalliptamulus natalensis LowCalliptimicus semiroseus HighDirshia abbreviata Medium * *Eremidium basuto HighGastrimargus drakensbergensis . HighHeteracris herbacea MediumHeteropternis guttifera LowLentula minuta Medium * * *Orthochtha rosacea LowOrthochtha zuluensis LowQachasia fastigiata HighTransvaaliana draconis LowWhitea alticeps LowSpecies richness
BIOTIC INDICATORS OF GRASSLAND·CONDITION IN KWAZULU·NATAL WITH MANAGEMENT RECOMMENDATIONS

58
3.6.2. Butterflies
Table 13. A presence absence table of endemic butterfly species for the ten sites over the12-month study period (* denotes presence). (C= Coleford,. GH1= ~oodhope_ 1, ~~2=Goodhope 2, H= Himeville, KK1= Karkloof 1, KK2= Karkloof 2, L= lInwood, S- Sttrllng,WW1= Wahroonga 1, WW2= Wahroonga 2)Species C GH1 GH2 H KK1 KK2 L S WW1WW2
* *Acraea horta* * * *Aloeides oreas* * * *Aloeides taikosama
Cassionympha cassius * * * * * * * *Dingana bowkeri bowkeri * *Harpendyreus noquasa * * *Orachrysops ariadne *Orachrysops lacrimosa * * * * *Orachrysops subravus *Pseudonympha var;; * * * * *Stygionympha wichgrafi wichgrafi * * * * * *Species ri chness 4 5 5 1 4 3 3 4 4 8
9
8
7
::: 6GIC
'5 5.;:IIIoS! 4uGICoIII 3
2
oH L c s GH2 KK2 KK1 WW1 GH1 WW2
Sites
Figure 11. A bar chart of butterfly species endemism for the ten sites sampled during thewhole study period. (The blue bars represent Highland Sourveld 'grasslands and the redbars Midlands Mistbelt). (C= Coleford, GH1= Goodhope 1, GH2= Goodhope 2, H= Himeville,KK1= Karkloof 1, KK2= Karkloof 2, L= Linwood, S= Stirling, WW1= Wahroonga 1, WW2=Wahroonga 2).
There was no significant difference when comparing species richness across grassland
type with Highland Sourveld (9 species) and Midlands Mistbelt (10 species). 11 species
of butterfly were endemic to South Africa (Table 13). The most speciose site was
, BIOTIC INDICATORS OF GRASSLAND CONDITION IN KWAZULU·NATAL WITH MANAGEMENT RECOMMENDATIONS

59
Wahroonga 2 (WW2) with eight endemics (72%) (Fig. 11). The second most speciose
sites were the two Goodhope sites that recorded five endemics. The most species poor
site was Himeville (H) that only recorded one endemic species of butterfly.
3.7. Seasonal variation
3.7.1. Grasshoppers
A Bray-Curtis Cluster Analysis (Fig. 12), that grouped together similar months in terms
of species composition, agrees with the Correspondence Analysis, grouping together
May through September and December through March. The cluster analysis also
showed that the transitional months tended towards the 'summer' period rather than
the 'winter' period in terms of their species composition. In the 'summer' period
(December to March), the species richness ranged from 29 species (December) to 38
species (March) across all ten sites (Fig. 13, (a), (b), (c) and (I). In the 'winter' period,
species richness declined sharply, and ranged from six species (June) to 20 species
(May) (Fig. 13, (e), (f), (9), (h) and (i»).
JULSEPAUGJUNMAYNOVOCTAPRMARFEBDECJAN
I
o0.120.240.360.480.6
II
-j'---
i I I I I I0.72
Bray Curtls - Data log(10) transformed Unklng algorltJvn UPGMA
Figure 12. Grasshopper similarity across months using a Bray-Curtis Cluster Analysis for allsites (Combined site data).
BIOTIC INDICATORS OF GRASSLAND CONDITION IN KWAZULU-NATALWITH MANAGEMENT RECOMMENDATIONS

60
Table 14. A presence absence table of grasshopper species during each month of the studyperiod (* denotes presence)
Species JAN FEB MAR APR MAY JUN JUL AUG SEP OCT NOV OEC
ACRIOIOAEAcorypha ferriter (Walker) * * *Acorypha nigrovariegata tibialis (Kirby) * * * * * * * * * * *Acrida sp. * * * * * * *Acrida acuminata (Stal.) * * * * * * * *Acrida bic%r (Thunberg) *Anab/epia dregei (Ramme) * * * *Aneuryphymus montanus (Brown) * * * * *Anthermus granosus (Stal.) * * * * * * * * *Calliptamu/us natalensis (Sjostedt) * *Calliptimicus semiroseus (Serville) * * * * * * *Cannula gracilis (Burmeister) * * * *Catantops me/anostictus (Schaum) * * * * * * * *Coryphosima stenoptera (Schaum) * * * * * *Crucinotacris cruciata (I. Bolivar) * * * * * * * * * * * *Cyrtacanthacris aeruginosa (Stoll.) * * * * *Dirshia abbreviata (Brown) * * *Eupropracris cylindricollis (Schaum) *Eyprepocnemis p/orans (Charpentier) * * * *Faureia milanjica (Karsch) * * * * *Faureia rosea (Uvarov) * * *Gastrimargus crassicollis (Saussure) * * * * * * *Gastrimargus determinatus vitripennis (Walker) * * * * * *Gastrimargus drakensbergensis (Ritchie) * * * *Gymnobothrus temporalis temporalis (Stal.) * * * * *Heteracris herbacea (Serville) * * *Heteroptemis guttifera (Kirby) * * * * *Macheridia bi/ineata (Stal.) * * * * * * * * *Omithacris cyanae (Stoll.) * * * * *Orthochtha rosacea (Walker) * * * * * * * * * * *Orthochtha zuluensis (Popov and Fishpool) * * * * * *Orthochtha dasycnemis (Gerstaecker) * *Oxya hy/a hy/a (Serville) * * * * *Paracinema tric%r (Thunberg) * *Parga xanthoptera (Stal.) * * * * * * *Phaeocatantops sulphurius (Walker) * * * * * * * * *Pnorisa squa/us (Steal.) * *Rhaphotittha cephalica (I. Bolivar) * *Scintharista rosacea (Kirby) * * *Vittacatantops botswana (Jago) * * * * * * * * * *LENTULlOAEEremidium basuto (Brown) * * * * * * * * * *Lentula minuta (Dirsh) * * * * *Lentula obtusifrons (Stal.) * * * * * * * *Qachasia fastigiata (Dirsh) * * * * * * * *PAMPHAGIOAETransvaaliana draconis (Brown) * *
Blonc INDICATORS'OF GRASSLAND CONDITION IN KWAZULU·NATAL WITH MANAGEMENT RECOMMENDAnONS

61
* * * *31 37 38 27 20 13 6 17 19 27 23 29
* * *
PYRGOMORPHIDAEDictyophorus spumans (Thunberg)Maura rubroornata (Stal.)Ochrophlebia caffra (Linnaeus)Phymateus leprosus (Fabricius)TETRIGIDAEPhloeonotus humilis (Gerstaecker)Phloeonotus sp.Tettiel/a aft. arcuata (Hancock)TETTIGONIIDAE
Conocephalus sp.Gryllidae sp.
Tettigoniidae sp.THERlCLEIDAEWhitea alticeps (Descamps)Species richness
*
* ***
*
*
*
*
*
*
*
*
*
*
*
*
* **
*
*
*
*
*
**
*
*
The most speciose month was March (38) followed by February (37)(Table. 14). The
most species poor month was July recording only six species. This was sharply down
from June and August that recorded more than double the species (Fig. 17). Only one
species was found throughout the year, Crucinotacris cruciata.
+2.5
DEC__- __-I----<iIIlNOV
JAN
Lenmin • • Conspp
•Corste
MAR•Eypplo
•Acra c
-2.
APR
OCT
AUG JUL
+2.0
Figure 13. Correspondence Analysis (CA) of months for all sites using grasshopperassemblages. (Only centroid values for each month were plotted). (Only species withgreater than 20% of their variance explained are plotted). Refer to Table 6 for grasshopperspecies codes. Axis 1and 2 Eigen values are 0.611 and 0.320 respectively.
BIOTIC INDICATORS OF GRASSLAND CONDITION IN KWAZULU·NATAL WITH MANAGEMENT RECOMMENDATIONS

62
8··oI
l1li,.,mI,e.
Figure 14. Eigenvector scores on the first axis of a Correspondence Analysis (CA) versusmonths to show grasshopper species compositional change over one year for all sites (Thedots represent each site for the year of sampling). .
There was a marked separation of months into two periods, namely, a 'summer' period
and a 'winter' period (Figs 13, 14 and 16). Therefore, it was important to separate the
data to illustrate how the environmental variables were affecting species composition
during the two different periods of the year.
500
400GIU; 300
.'0C
~ 200cc
100
(a) January
BIOTIC INDICATORS OF GRASSLAND CONDITION IN KWAZULU·NATAL WITH MANAGEMENT RECOMMENDATIONS
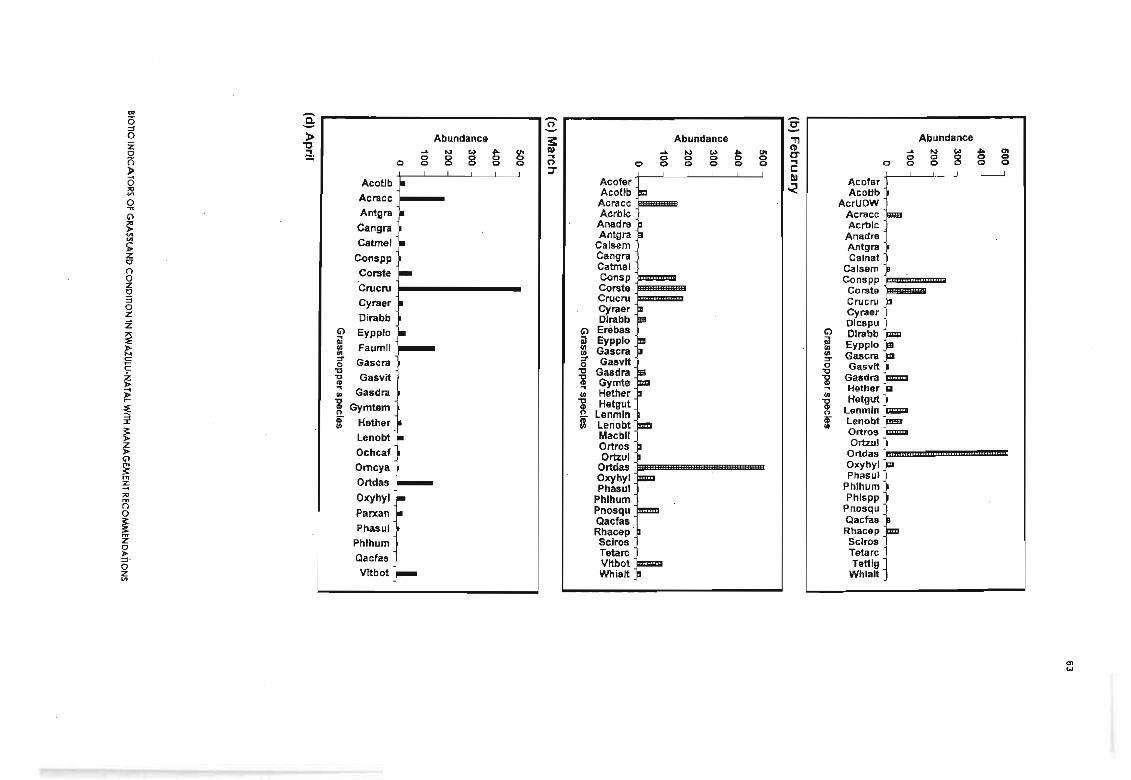
6 c: ----------------- - -~ _ n ~
!? > Abundance i Abundance -::;; Abundance~ ~ "'NW~(Il III "'NW~cn ~ "'NW~cnn =: 088888 c:; 088888 ...c 088808~ j(3 Acotib Acofer .~ Acofer~ Acotlb '< Acotibo Acracc Acracc AcrUDW;;; Antgra Acrbic Acracc~ Cangra Anadre Acrbic~ ~ra ~~> Catmel Calsem Antgra~ Conspp Cangra Calnat() Corste Catmel Calsem~ . Consp Consppc Crucru Corste Corste:3 Cyraer Crucru Crucru~ Cy~ Cy~Z Dirabb Dlrabb Dlcspu;s Ci) Eypplo Ci) Erebas Ci) Dlrabb~ i Faumll i ~YPPIO i Eypplo~ ; ; ascra ; GascraE 0 Gascra 0 Gasvlt 0 Gasvltz :g Gasvlt :g Gasdra :g Gasdra:I> III III Gymte I1l,; ;;; Gasdra ;;; Hether ;;; Hetheri i Gymtem -g Hetgut i LHetgu,t_ !:? !:? Lenmln !l enm n:2 g: Hether IX Lenobt l: Lenobt~ Lenobt Niacbll Ortrosz Ortros Orlzul~ Ochcaf Orlzul Ortdas~ Omcya Ortdas Oxyhyl~ Ortdas Oxyhyl Phasul.... Phasul Phlhum~ Oxyhyl Phlhum Phlspp8 Parxan Pnosqu Pnosqu~ Qacfas Qacfas~ Phasul Rhacep Rhacep~ Phlhum Sclros Sclros:1>. Qacfas Tetarc Tetarcg Vltbot TeUig~ Vltbot Whlalt Whlalt
alW

'"<5 cc 3i -CD::::l - iln Co. Abundance Co. Abundance AbundanceZ c cc -< ... N Co> !i l!!l ::::l ... N Co> !i l!!l ... N Co> !i CII
n 0 0 0 CD 0 0 0 8 0 8 00 0 0 0 0 0 0 0 0 0 0 0 0 0 0 0
»...0
A'~bt'" AcotlbVI
0Acotlb Acracc...
(j)Antgra
~ AntgraVIVI
);Crucru
Cangrazc Crucrun0 Crucruz Cyraer Cyraerc:3 Dlcspu0
Dlcspu •zZ Cl Cl Cl Erebas
~ = Dlcspu = Erebasiil
Faumil ~» IIIN III III IIIc: :r :r :rr- 0 0 0 Faurosc: 't' 't' 't'Z 't' 't' Faumll .. i Gascra» ~ III... ..» III III IIIr- 't'
~ Fauros't'
~ ~ ErebasCIl HetherC)
::::; iD' iD" iD"x Macbil /I--~
III III III
ZMacbll - Ochcaf»
(ilm
Ocheaf Orncya== Macbil ImZ Ortdas •...'"m Ortdasn Parxan0
~ PhasulPhasul
mZ Parxanc Qacfas»::::l Vitbot Vltbot ~0ZVI
Cl)....

...§ e s -s:~ ~ Abundance ~ Abundance;: I Abundance
2 S' "'N~~~ -a ~Nwt~ cS ~~~~:gn C" 088000 CD 008800 r:: 000000
» ~ 3 1 UI~ ... Acotlb go Acotib ... I Acotlb~ Acracc ...... Acrblc Acrblc , I I AcrbicG'l
~ Anadre Anadre r I I A~ nemonr- Anemon A]» ntgra~ Antgra j I I Antgrag Calsem CalsemZ Catmel Catmel2 C~~
g ConsPP Crucru~ Crucru Catmel
~ Q Erebas Q Crucru Q Erebas ~~ iil . iil iil» III Faumrl III III~ ~ ~ Erebas ~ FaurosE 0 Grylli 0 0• "C "C "CZ -g Gymtem 'i Faumil 'i Grylli~ ... ... ...» III Lenmln III III t... 'i 'i Lenobt "C Gymtem .! " Lenobt " ~:i! f Macbil ijl' Macbll if Macbll
~ Ochcaf Ochcaf» Omcya Ochcaf~ Omqa;: Ortdas ~ I I Ortdasm:s Ortros Ortros1:: Phasul ~ I I Parxann O~U
o Phlhum 1 I I Phasul~ Phylep Parxanmg Qacfas Phasu'l·1 1 Phlhum::l Tetarc~ Vitbot Vltbot Vitbot .-
'"
en(JI

66
500
400CDuc 300I'll'l:JC::J 200.aCl:
100
0 ... 'la -; E III ~...C Q. S ::J III
~ l! l! III C.a u l! e I .a :a I'll~ ~
0;; :a 0 Q. .. I'll u 'l:J 0 U III ::J J9 .a0 e Cl! CD 1II I!! u .a Q. u .c 'l:J I'll .c 5.. ... .!l 2 ! Ul Ul C I'll 't: .c I'll {!U~ CD C I'll C 0 ::J I'll I'll CD :lE u I'll :ECl: c Cl: u u 0 u u w w Cl Cl ..J 0 0 Q. Q.
Q. 0Cl: uGrasshopper species
(k) November
500
400CDuc 300I'll'l:JC::J 200.aCl:
100
I11 m ...... m IQ0
~'~~~i~~1§1111~~1111~1~~i~~~1~Cl:~~~8uuw~~ ~~j:E~ooOOo fo~~Cl: Cl
Grasshopper species
(I) DecemberFigure 15 (a) to (I). Grasshopper species recorded across all of the ten sites for each monthof the study period. (Summer months are represented by hatched bars and winter by fullbars). (Refer to Table 6 for grasshopper species codes).
60 .----------~-------~--------....,
40 I
i1 30c.c.g:1 20I/)
o
Io
10
IO'----------~---------~----- _._J
Summer Winter
Season
Figure 16. An analysis of variance comparing the summer and winter grasshopper speciesrichness for the twelve-month study period.
BIOTIC INDICATORS OF GRASSLAND CONDmON IN KWAZULU·NATAL WITH MANAGEMENT RECOMMENDATIONS

67
Figure 1 6. An analysis of variance comparing the summer and winter grasshopper speciesrichness for the twelve-month study period.
Table 15. Grasshopper species richness when the two sampling periods were comparedsummer =October to March, winter =April to September. (*** Denotes significant differenceat p< 0.05)
Sampling period df F-statistic p- valuesummer/winter 1 11.16 0.00***
An analysis of variance that used the divisions of months from the correspondence
analysis and the Bray-Curtis Analysis to determine species richness across the two
sampling periods was highly significant at p < 0.05 (F =11.16 and p =0.00).
40
35
E30
.2 25(,)
·C 20IIIQ)·u 15Q)
fj; 10
5
O+--,----,----,----.---.---.------r------.----.---.--,--------,
JAN FEB MAR APR MAY JUN JUL AUG SEP OCT NOV DECMonth
Figure 17. Species richness of grasshoppers dUring the whole stUdy period.
Table 16. Grasshopper diversity indices, evenness and species richness for each of the 12months of the study period (data log transformed)
Month Shannon's Evenness (Pielou's J) Abundance Species richness
JANFEBMARAPRMAYJUNJULAUGSEPOCTNOVDEC
0.9751.0180.9600.5890.2970.2410.0590.2700.3250.6410.9610.918
0.6530.6490.6080.4110.2280.216
·0.0750.2190.2540.4480.7060.628
1540185623822970201413391035103976012618651212
313738272013061719272329
Grasshopper evenness was markedly different when months of the year were
compared. One species or a suite of species dominated seven months of the study
BIOTIC INDICATORS OF GRASSLAND CONDITION IN KWAZULU·NATAL WITH MANAGEMENT RECOMMENDATIONS

68
period. The months were predominantly winter months (May through August) and three
months were in the Spring/Autumn time of the year (April, September and October)
(Table 16 and Figure 17). In the winter months C. cruciata was very abundant and
there were also fewer species with the onset of colder weather.
3.7.2. Individual grasshopper responses to seasonality
13 species had more than 20% of their variation explained by Axis 1 and 2 and were
plotted to show their seasonal cycle. The species abundances were log transformed for
the 13 species as some species had very high abundances. Of the 13, one species, C.
melanostictus, showed two distinct periods when they were present in the system. This
therefore implies that this particular species had two hatchings in a year (bivoltine),
spring and autumn, with eggs dormant during the extremes of summer and winter (Fig.
18, (b». The other species that appeared to have two hatchings was Faureia milanjica,
but its numbers were affected by the time at which the grassland was burnt. The
numbers increased in September due to recruitment from surrounding unburnt
grasslands.
Nine species showed a clear summer-dominated cycle, having recorded high
abundances during this period and being absent during the winter, starting in April or
May. The species that showed this pattern are Acrida acuminata, Conocephalus sp.,
Coryphosima stenoptera, Eyprepocnemis plorans, Gastrimargus crassicollis,
Gastrimargus drakensbergensis, Lentula minuta, Lentula obtusifrons, Qachasia
fastigiata and Orthochtha dasycnemis (Fig. 18, (a), (c), (d), (f), (i), 0), (k), (I), (m) and
(n».
Macheridia bilineata and Crucinotacris cruciata were adult in winter, appearing in May
December (M. bilineata) , or all year (C. cruciata), but abundance was highest in the
winter period (Fig. 18, (e) and (h».
BIOTIC INDICATORS OF GRASSLAND CONDITION IN KWAZULU·NATAL WITH MANAGEMENT RECOMMENDATIONS

69
3.5
3
g 2.5
~ 2c,g 1.5III
~ 1-J 0.5
o-l--.--,----.-----,.--~...,__...-.,_L-.-----r--"<-,-----,
')~ «$~~ ~~./' ~~ ~'V ~~ (;;)~ OvA.. ~O~ Q~v
Month
(a) Acrida acuminata
~~ ~'V .::>~ ~ CJA.. o~ ~os OS~~O~~
Month
(b) Catantops melanostictus
Month
(c) Conocephalu5 sp.
(d) Coryphosima stenoptera
BIOTIC INDICATORS OF GRASSLAND CONDITION IN KWAlULU-NATAl WlTli MANAGEMENT RECOMMENDATIONS

~~ ~v ~~ ~ oc." ""o~ ",~v'S 'S~c,) ~v
Month
(e) Crucinotacris cruciata
3.5fl 3; 2.5-g 2.E 1.5
~ 1 -
.3 o.~ -t----,r--,----,---,-~_r_--r--_.,.-..,...........,-_,_-_r___,
")~ «~q, ~~fJ:- ~fJ:- ~.;. ~~ ~v ~~ e:,~ ov" ~o~ Q~v
Month
(f) Eyprepocnemis plorans
3.5fl 3; 2.5-g 2.E 1.5~ 1
.3 o.~ -t--r---.-..L-.-------r--,--,--3"'"'""r.....t.~-,_::~-_r____,
")~ «~q, ~~ ~fJ:- ~.;. ~~ ~v ~~ e:,<8 oV" ~o~ Q~v
Month
(g) Faureia milanjica
(h) Gastrimargus crass/collis
BIOTIC INDICATORS OF GRASSLAND CONDITION IN KWAZULU·NATAL WITH MANAGEMENT RECOMMENDATIONS
70
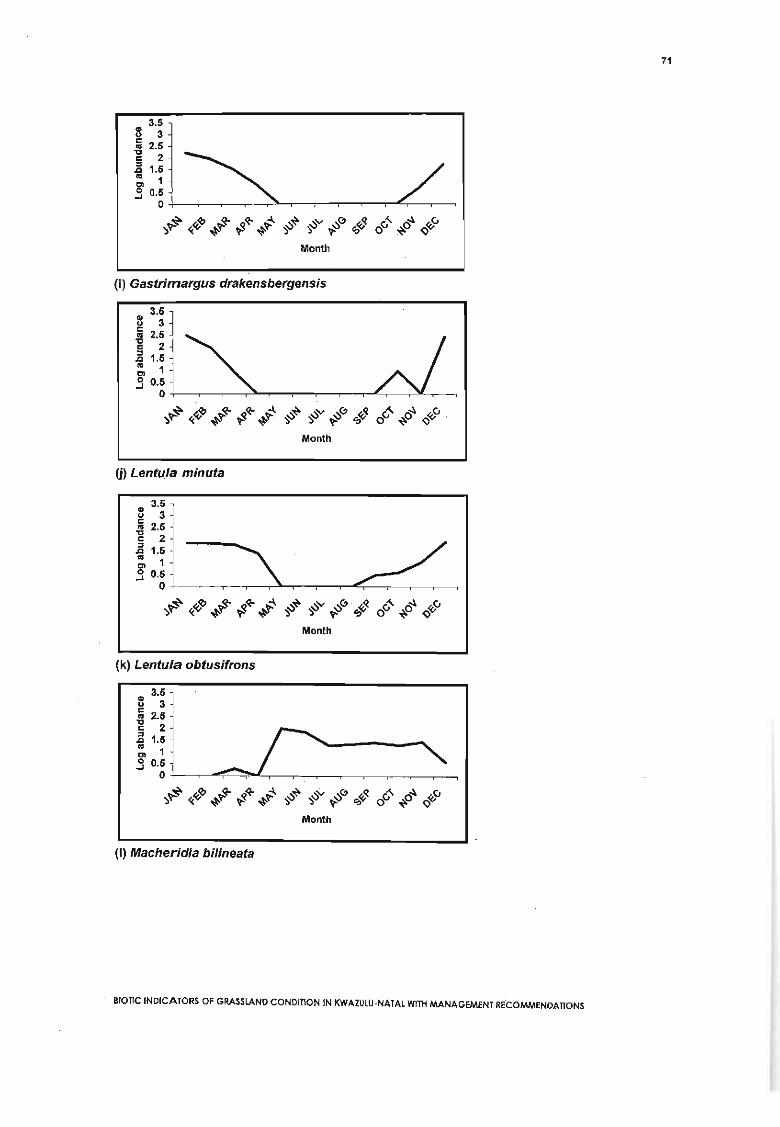
~~ ~v f~ ~~ ov'" ~rS Q~v
Month
(i) Gastrimargus drakensbergensis
(j) Lentula minuta
(k) Lentula obtusifrons
....~ ~v ....~ ,/,~ Cl'" o~ ,/.v~ 'S ~ ~v 0 ~ QV
Month
(I) Macheridia bilineata
BIOTIC INDICATORS OF GRASSLAND CONDITION IN KWAZULU·NATAL WITH MANAGEMENT RECOMMENDATIONS
71

72
i:)~ i:)'V i:)~ ~ ("..... o~ !<,.v~ ~~~O~~
Month
(m) Qachas;a fastig;ata
3.5
Ql 3'1,)
; 2.5-g 2:::J~ 1.5g' 1..J 0.5
O+---r--,-------,---,---,---?""~-r___,____,~_r__,
~ ~q, .fr ~~ ~ i:)~ i:)'V ~~ ~ ("..... o~ !<,.v~ ~~~~'S 'S~~O~~
Month
(n) Orthochtha dasycnem;s
Figure 18 (a) to (n). Seasonal variation in species that have a cumulative fit of greater than20% of their variation explained for Axis 1 and 2. All data have been log-transformed.
3.7.3. Butterflies
A month-by-month Bray Curtis Cluster Analysis (Fig. 19) showed how, two large
clusters were represented (May to September) and (October to April). This distribution
of months into these two large clusters mirrors the situation for grasshoppers, with a
distinct 'summer' and 'winter' period.
Blonc INDICATORS OF GRASSLAND CONDITION IN KWAZULU-NATAl WITH MANAGEMENT RECOMMENDATIONS

73
Data log(10) transformed linkIng algorithm UPGMA
Figure 19. Butterfly similarity across months using a Bray-Curtis Cluster Analysis. (Datawere combined and log transformed).
All months had an even distribution. The most even distribution was shown by May and
July, but species richness was only six and three, with the most uneven months, March
and November with 0.768 and 0.736 and high species richness 17 and 12 respectively
(Table 17).
Correspondence Analysis (CA) (Fig. 20) showed no definite groupings of months into
sampling seasons or periods (only the centroid values were plotted for each month). 11
of the 12 months clustered together around the midpoint of Axis 1 and 2. The 1i h
month was June an outlier with a centroid value of 0.12 and 3.31 for Axis 1 and 2
respectively. The Eigen Values for Axis 1 and 2 were 0.35 and 0.23 respectively, with
the sum of all the Eigen Values 1.35. The cumulative percent variance explained by
Axis 1 and 2 was 43.2%.
Blonc INDICATORS OF GRASSLAND CONDITION IN KWAZULU·NATAl WITH MANAGEMENT RECOMMENDATIONS

74
June-
October
February
March-May
IIIIIIIII
AIt September
ugus _-January: - November
April_ -:----------------~!_---------------------:-
December - July
C)
~ +----.-----.-----r---f----..---..---..----.,.---i-2.0 +2.5
Figure 20. Correspondence Analysis (CA) of month dlstnbutlon according to the butterflyspecies for the 10 sites.
The eigenvector scores from the Correspondence Analysis (CA) were plotted against
month (Fig. 21), Each dot represents a site for each of the 12 months. The sites are
fairly uniform Iy distributed across the months except for October that showed large
dispersal along the vertical axis. This signified that species composition varied
dramatically for the month of October (10).
Blonc INDICATORS OF GRASSLAND CONDITION IN KWAZULU-NATAL WITH MANAGEMENT RECOMMENDATIONS
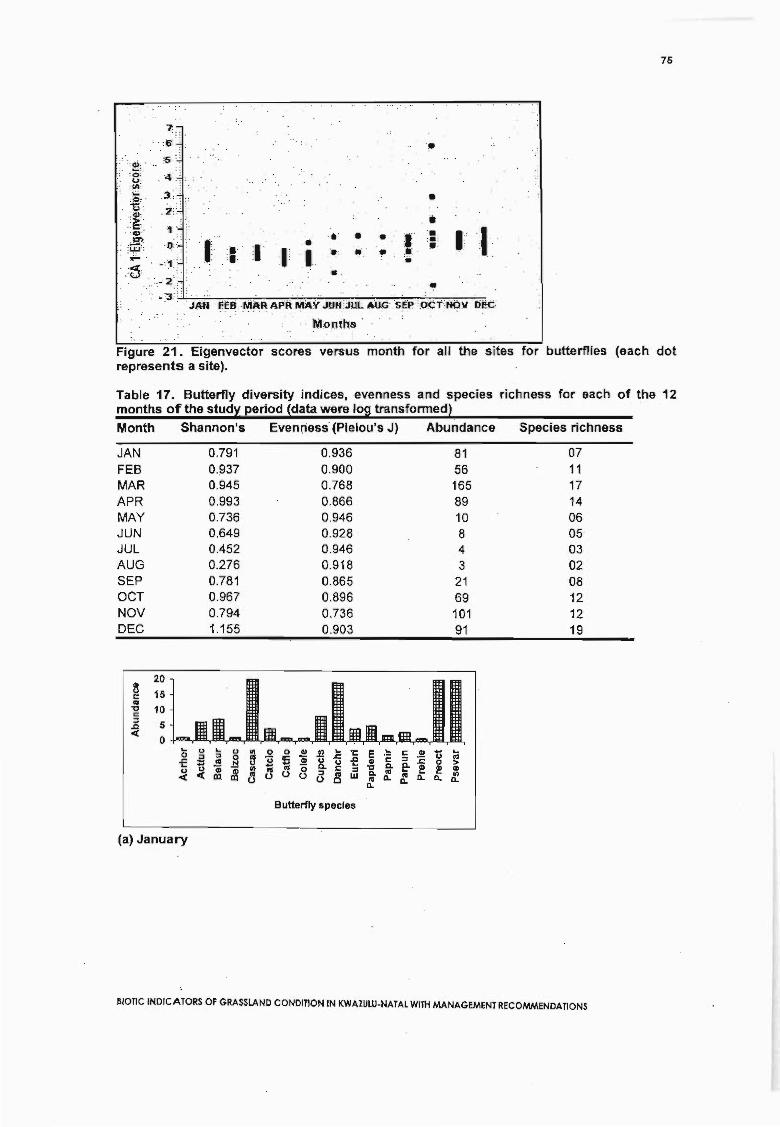
75
11..
•
•
••• •I .,..' ...
7:6
,5, .
. 43
2
1
o~1'
'·":;C
-3, ~~~="""""'''''''''''~,;,,-,;'''''''''~~~~~~='''=-=='::7::"",,==
Figure 21. Eigenvector scores versus month for all the sites for butterflies (each dotrepresents a site).
Table 17. Butterfly diversity indices, evenness and species richness for each of the 12months of the study period (data were log transformed)
Month Shannon's Evenness (PieIou's J) Abundance Species richness
JAN 0.791 0.936 81 07FEB 0.937 0.900 56 11MAR 0.945 0.768 165 17APR 0.993 0.866 89 14MAY 0.736 0.946 10 06JUN 0.649 0.928 8 05JUL 0.452 0.946 4 03AUG 0.276 0.918 3 02SEP 0.781 0.865 21 08OCT 0.967 0.896 69 12NOV 0.794 0.736 101 12DEC 1.155 0.903 91 19
20Glu 15cca'a 10c:::J 5..Q
Ol(0 .. u .. u e 0 0 CIl fII .. 't: E .~ § .! ti ..0
~:::J 0 u 5 :i - .c -e ca
of ca .!:! u u GI Do Do .c 0 >u Gi fII - ca 0 Do C :::J 'C ca .. l!! l!! GlU Gl cacc Ol( m m ca (,) (,) (,) :::J ca w li'a..:,a.. a.. fII
(,) (,) C a..0.
Butterfly species
(a) January
Blonc INDICATORS OF GRASSLAND CONDITION IN KWAZULU·NATAL WITH MANAGEMENT RECOMMENDAnONS

76
20Glu 15cIII
10'0C:= 5.Q«
0 .. 0 0 Ql Ul .. 'C c ... ..u .c u III:= :=~ 5 "i U .Q :=
~uIII U .. eo;:l
"i III '0 Do C := cu III 0 0 := III W III a- ~« m 0 0 c a-
Butterfly species
(b) February
20Gl 15uc
10III'0C 5:=
.Q« 0 ... ..u .. U III 0 0 Ql .. 'C IT 0 E u III:= := 0 ~ u 5 "i .c € 0 Do Gl 0 >~
III ..!:! ... '0u C Ql '0 l!! Q)Gi Ul III III C := .. III Do Ul« m Q) III 0 0 0 III W III >- III a- a-m 0 c :J: :J: a-
Butterfly species
(c) March
20
Q) 15uc 10III'0C 5:=.Q
0« .. 0 .!! .. ... .. ..:= .c u~ III
.!!! 5 Gl U 0 UIII '0 c l!! Ql CQl0 0 III a- Ul IIIm c a- >
Butterfly species
(d) April
20
Q) 15ucIII'0 10c:=.Q
« 5
0 .. Ul ..~
c U:= III .c := 0III U U e DoGi III C .. l!!m III III 0 III a-0 c a-Butterfly species
(e) May
BIOTIC INDICATORS OF GRASSLAND CONDITION IN KWAZULU·NATAL WITH MANAGEMENT RECOMMEND'ATIONS

77
CDuClIS'tlC:::s.aCC
20
15
10
5
O+-.--------.--.J---r-----,----L---,--------,CDGi'0o
coc..lIS:t:
Butterfly species
.a:::sIIIl!o
..lISUC
~
(f) June
20 -
B 15-c{l 10c:::s~ 5
o +-_----l-_'---_-,-_-.J-_'--_-.--__-_~_ _...:::s.!!!I!
l:Iu
5Butterfly species
UlIS
1!o
(g) July
I:~ 1 -.-- --,
Butterfly species
CDQj'0o
(h) August
..lISUC
~
c:::se-llSl1.
CDGi'0o
uo~CD
ID
~ ~: j11 10
~ : f------.--.---..-IL-,--------,---'----.-..l------,--'------,--L.ulIS
1!oButterfly species
(i) September
BIOTIC INDICATORS OF GRASSLAND CONDITION IN KWAZULU·NATAL WITH MANAGEMENT RECOMMENDATIONS

(j) October
~ e 5 ~'i UI ,Ill "0ID ~ '" (,)
Butterfly species
~.QC
i5
ucaeo
1:)oell..
u
1Cl)
78
ell 20g 15ca1 10.E 5c( 0 -+-o,IlIYllL,JlBym"--.,JHI-,.-..,.-,~--,--r-.y...,.."Y"'-r""""""'-r""'-,
g ~~ ~~ e~s~i~~~~etc(~~5",~(,)8~Wo
Butterfly species
(k) November
elliii"0(,)
eooet
...:::JcaiiiID
~ell
ID
lidulid(,)
.c ~g .Q
ca .5Oc cButterfly species
iIIIll..
(I) December
Figure 22 (a) to (I). Butterfly abundances for species in each month of sampling. (Summermonths indicated by hatched bars and winter by full bars). (Refer to Table 7 for butterflyspecies codes).
BIOTIC INDICATORS OF GRASSLAND CONDITION IN KWAZULU·NATAL WITH MANAGEMENT RECOMMENDATIONS
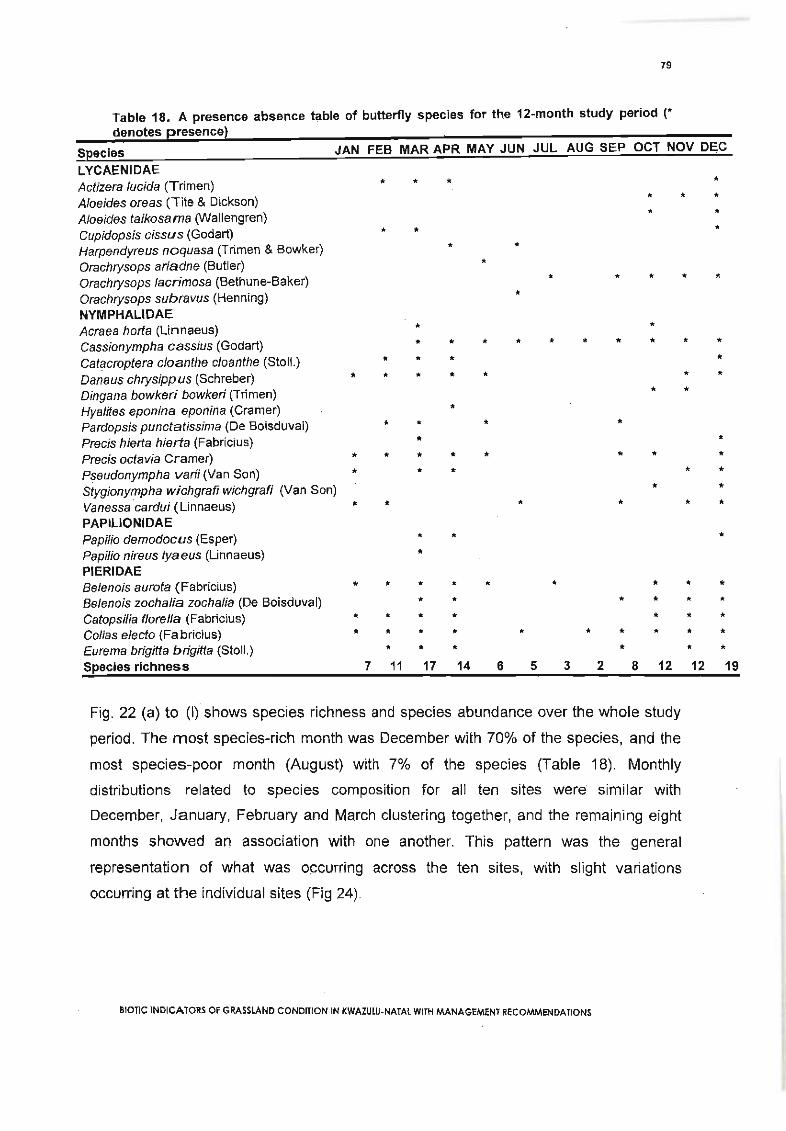
79
Table 18. A presence absence table of butterfly species for the 12-month study period (*denotes presence)
Species JAN FEB MAR APR MAY JUN JUL AUG SEP OCT NOV DECLYCAENIDAEActizera lucida (Trimen)Aloeides oreas (Tite & Dickson)Aloeides taikosama (Wallengren)Cupidopsis cissus (Godart)Harpendyreus noquasa (Trimen & Bowker)Orachrysops ariadne (Butler)Orachrysops lacrimosa (Bethune-Baker)Orachrysops subravus (Henning)NYMPHALlDAEAcraea horta (Linnaeus)Cassionympha cassius (Godart)Catacroptera cloanthe cloanthe (Stoll.)Danaus chrysippus (Schreber)Dingana bowkeri bowkeri (Trimen)Hyalites eponina eponina (Cramer)Pardopsis punctatissima (De Boisduval)Precis hierta hierta (Fabricius)Precis octavia Cramer)Pseudonympha varii (Van Son)Stygionympha wichgrafi wichgrafi (Van Son)Vanessacardui (Linnaeus)PAPILIONIDAEPapilio demodocus (Esper)Papilio nireus Iyaeus (Linnaeus)PIERIDAEBelenois aurota (Fabricius)Belenois zochalia zochalia (De Boisduval)Catopsilia florella (Fabricius)Colias electo (Fabricius)Eurema brigitta brigitta (Stoll.)Species richness
*
**
*
*
**
7
*
*
**
*
*
*
*
***11
*
*
****
****
**
*****17
*
*
***
*
**
*
*****14
*
*
*
*
*
*
6
*
*
*
*
*
5
*
*
*
3
*
*
2
*
*
*
*
*
*
**
8
**
*
**
*
*
*
****
12
*
*
*
**
*
*
*****12
****
*
***
*****
*
*****19
Fig. 22 (a) to (I) shows species richness and species abundance over the whole study
period. The most species-rich month was December with 70% of the species, and the
most species-poor month (August) with 7% of the species (Table 18). Monthly
distributions related to species composition for all ten sites were similar with
December, January, February and March clustering together, and the remaining eight
months showed an association with one another. This pattern was the general
representation of what was occurring across the ten sites, with slight variations
occurring at the individual sites (Fig 24).
Blanc INDICATORS OF GRASSLAND CONDITION IN KWAZULU·NATAL WITH MANAGEMENT RECOMMENDATIONS

80
3.8. Correspondence analysis
3.8.1. Grasshopper species composition
A Correspondence Analysis (CA) (Fig. 23) showed the variation amongst species for
all sites across all months. The data were combined to reduce redundancy. The axes
represent the summed abundance of all species across all sites and months. The
species that were closely clustered together are species which were recorded in similar
abundances. There are two apparent clusters and a number of outliers, with the very
common species, namely,C. cruciata, G. crassicollis, G. Drakensbergenis, O.
dasycnemis and Concephalus sp. clustering together. The other cluster comprised of
less common species that were recorded in relatively high abundance, namely, L.
minuta, L. obtusifrons, Vittacatantops botswana and Eyprepocnemis plorans. The
outliers were present as they were singletons or rarities, and were D. spumans, P.
leprosus, Tettigoniidae sp., T. draconis, E. cylindricollis, Acrida UDW and M.
rubroornata. Eigen values for Axis 1 and 2 were 0.177 and 0.142 respectively. The
sum of all Eigen values was 0.818. The cumulative percentage variance explained by
Axis 1 and 2 was 39%.
BIOTIC INDICATORS OF GRASSLAND CONDmON IN KWAZULU·NATAL WITH MANAGEMENT RECOMMENDATioNS

81
• Dicspu
PhyleplTetliglTradra •
Omcya
•
• Eupcyl
•Ortzul
Cyraer
•
Fauros
•
Ochcaf
Sciros ••
Partri
•
•AerUDW
Acofer.
•Acotib
Pnosqu
•
OxyhylIPhlspp •
•Maurub
I,I,I1,1,I
: Rhacep, .1,I1I,
Faumil Antgra • :• ,Lenmin
Hetgut, • • Tetarc • WhialtGasvit • Lenobt·
Gymtem :. Hether• Parxan • I Eypplo. Gryllid
Anemon • Vrtbot· \ • • Calmel___ . Pl)!h!l'll_!' _ -t!Conspp· -Phasul- - - - - - - - - - - - - - - - - - - --
CangraOrtdas. ·Corsle Acrbic • QacfasGascra.' •
_ • • DirabbAcrace· Crucru Macbil Erebas
Ortros: .:Gasdra • ;Galsem
Calnal:II,,II,,1,I,.I Anadre,,,III
oc7+---~--~--~--~--~---+---...,---...,---...,---...,---...,----I
-3.0 +3.0
Figure 23. Correspondence Analysis (CA) for grasshopper species composition for all sitesacross all months. (Data were combined and log transformed). Refer to Table 6 forgrasshopper species codes. The Eigen values for Axis 1 and 2 were 0.177 and 0.142respectivel .
• N
.0 0.J 0.4
~0... .N S.0
U .MY-1.2 .F .0,(15 -1.2 .F • rH·4~ AE
.0.M -1.7 -1.7
(a) Coleford (b) Himeville
BIOTIC INDICATORS OF GRASSLAND CONomON IN KWAZULU·NATAl WITH MANAGEMENT RECOMMENDATIONS

.0 .N AU0.5 .N O. 0.5 .0 • • JY
.a.J • 0 ..JY - ~ ,....F • AI! S "tit:
-1.2 .J .F 0.46-1.2 0.46 • MY • r.. .MY.M .A.A
-1.7 -1.7
clGoodhooe 1 dlGoodhooe 2 .
• 0 ~ . N
••JD .N .0 .00.5 0.5
.JE J.F -1.2·t t,
-....u
0.46.s
0.46 ~MY-1.2 .M .AU.MY
.A .JE.A
-1.7 -1.7
82
(e) Karkloof 1 (f) Karkloof 2
.0 .0.AU
.J .N.JE .0
.A .MY .N.~s
.F 0.5 .JY 0.5..IJUE.... .. ~., .J
.A JV-1.2 0.46 -~F 0.46
.M .MY
-1.7 -1.7
Tcif Linwood h) Stirlina
.0 .0 .N.0-A .0
.AU 0.5 MY..... , S ..... , .a.n Jv..JEAU
-1.2. F 0.46 ;~ -1.2 ,-0.46 1.M .MY F••M.J
-1.7 -1.7
(i) Wahroonga 1 (j) Wahroonga 2
Figure 24. The Correspondence Analysis (CA) for the ten sites across the 12-month studyperiod. (Only centroid values are shown for each month). (J= January, F= February, M=
Blonc INDICATORS OF GRASSLAND CONDITION IN KWAZULU-NATAL WITH MANAGEMENlRECOMMENDAnONS
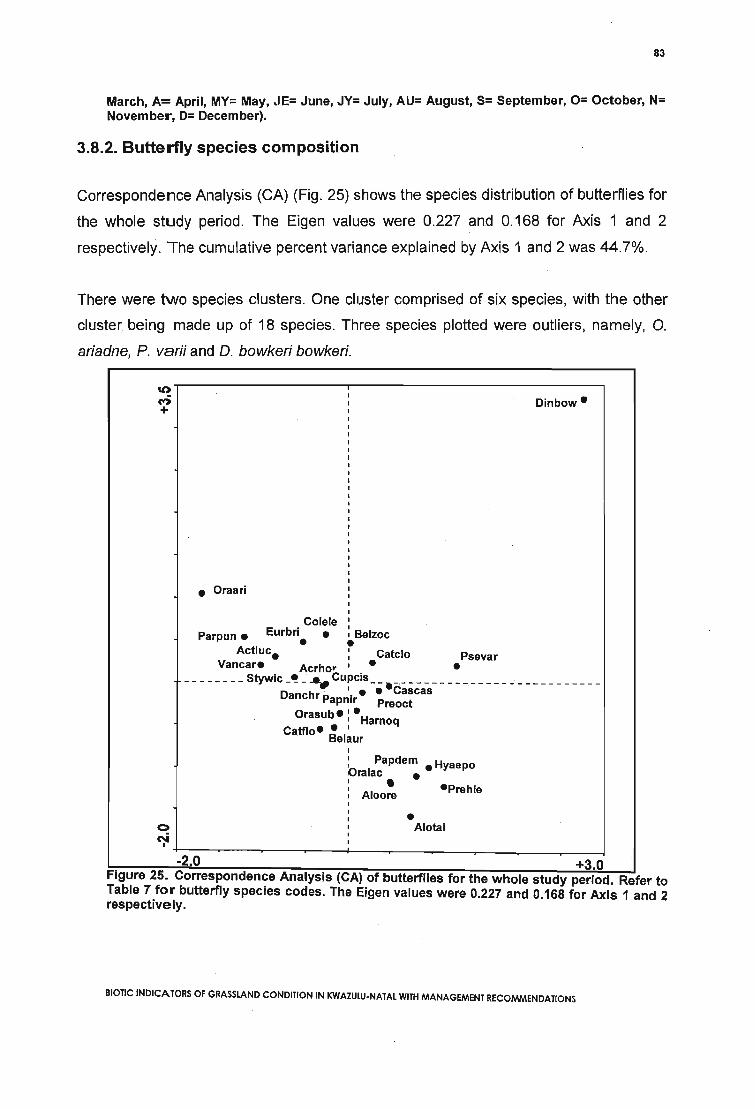
83
March, A= April, MY= May, JE= June, JY= July, AU= August, S= September, 0= October, N=November, D= December).
3.8.2. Butterfly species composition
Correspondence Analysis (CA) (Fig. 25) shows the species distribution of butterflies for
the whole study period. The Eigen values were 0.227 and 0.168 for Axis 1 and 2
respectively. The cumulative percent variance explained by Axis 1 and 2 was 44.7%.
There were two species clusters. One cluster comprised of six species, with the other
cluster being made up of 18 species. Three species plotted were outliers, namely, O.
ariadne, P. varii and D. bowkeri bowkeri.
Dinbow·
• Oraari
ColeleParpun • Eurbri • Belzoc• •Actluc. : Catclo Psevar
Vancar. Acrhor I • •________ Stywic _! CU~Cis__ • _
Danchr . . • • CascasPapmr Preoct
Orasub. I •
•I Harnoq
Catflo. IBelaur
•Alotai
Figure 25. Correspondence Analysis (CA) of butterflies for the whole study period. Refer toTable 7 for butterfly species codes. The Eigen values were 0.227 and 0.168 for Axis 1 and 2respectively.
BIOTIC INDICATORS OF GRASSLAND CONDITION IN KWAZULU·NATAL WITH MANAGEMENT RECOMMENDATIONS
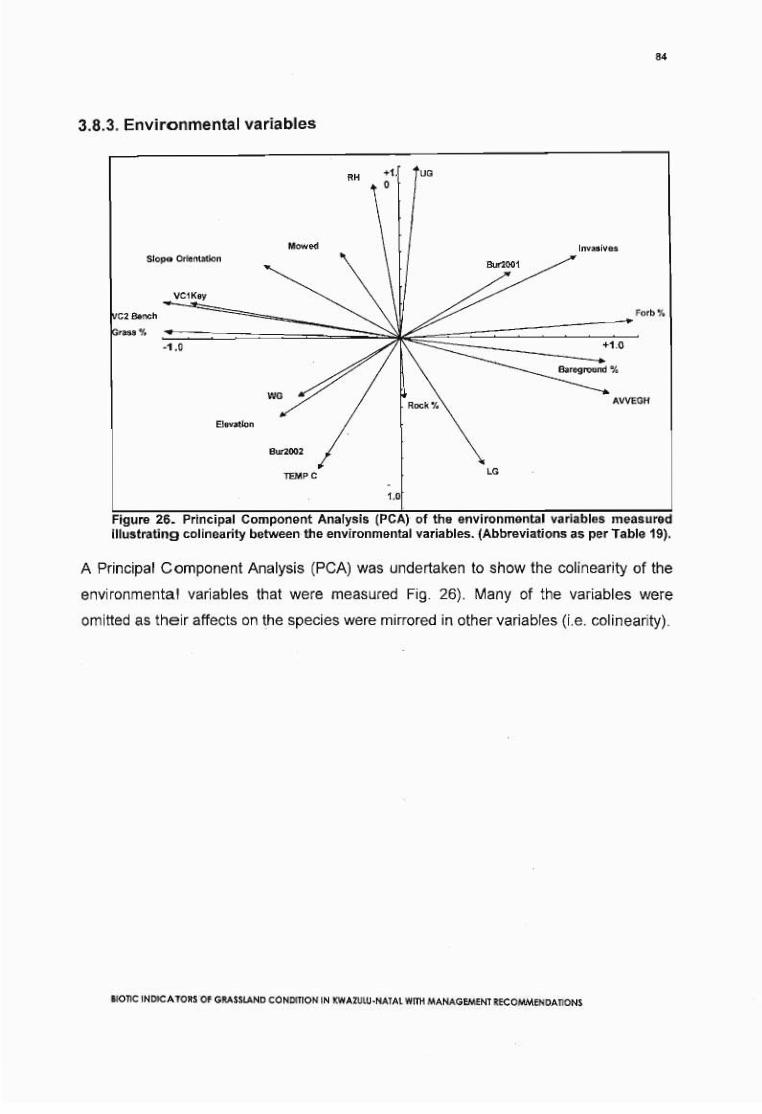
84
3.8.3. Environmental variables
Slope Orientation
VC1Key
C2 Bench ---..:It:::::=====_~rass%
-1.0
Elevation
TEMPC
RH
1.
UG
Invasives
Forb"lo
AWEGH
Figure 26. Principal Component Analysis (PCA) of the environmental variables measuredillustrating colinearity between the environmental variables. (Abbreviations as per Table 19).
A Principal Component Analysis (PGA) was undertaken to show the colinearity of the
environmental variables that were measured Fig. 26). Many of the variables were
omitted as their affects on the species were mirrored in other variables (Le. colinearity).
BIOTIC INDICATORS OF GRASSLAND CONDITION IN KWAZULU-NATAL WITH MANAGEMENT RECOMMENDATIONS
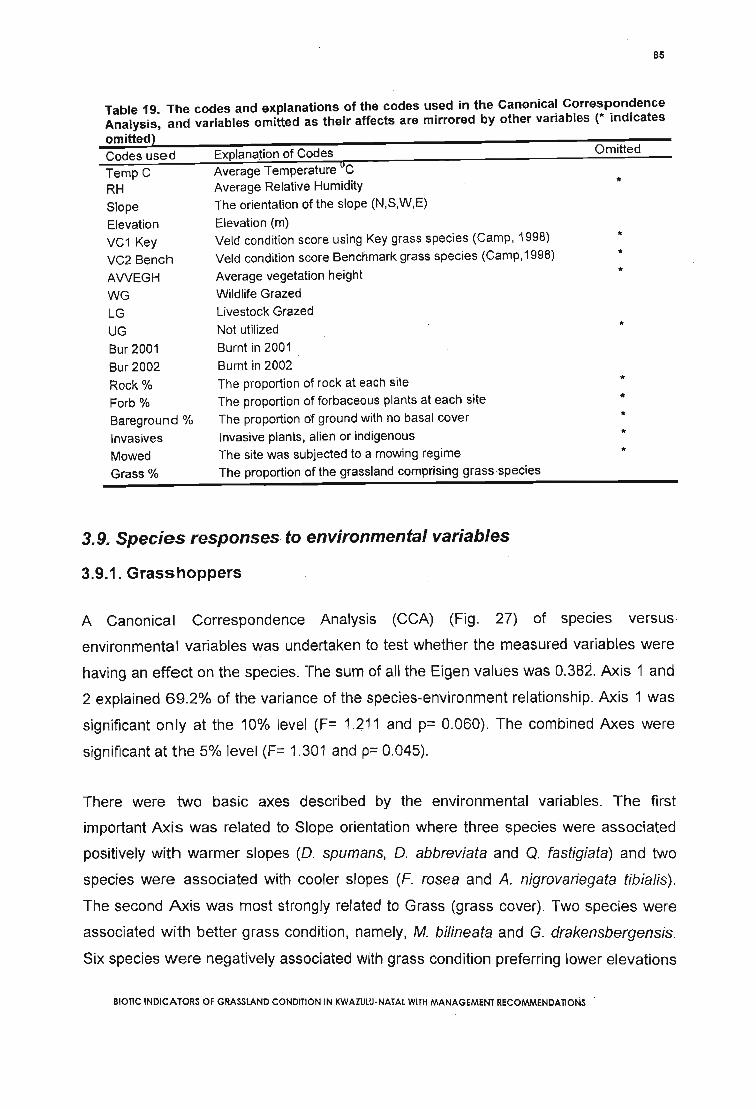
85
Table 19. The codes and explanations of the codes used in the Canonical CorrespondenceAnalysis, and variables omitted as their affects are mirrored by other variables (* indicatesomitted)Codes usedTempCRH
SlopeElevation
VC1 KeyVC2 Bench
AWEGHWGLG
UGBur 2001
Bur 2002
Rock %
Forb %
Bareground %
Invasives
MowedGrass %
Explanation of CodesAverage Temperature DCAverage Relative Humidity
The orientation of the slope (N,S,W,E)
Elevation (m)
Veld condition score using Key grass species (Camp, 1998)Veld condition score Benchmark grass species (Camp,1998)
Average vegetation heightWildlife Grazed
Livestock Grazed
Not utilized
Burnt in 2001
Burnt in 2002
The proportion of rock at each site
The proportion of forbaceous plants at each site
The proportion of ground with no basal coverInvasive plants, alien or indigenous
The site was subjected to a mowing regime
The proportion of the grassland comprising grass species
Omitted
*
***
*
*****
3.9. Species responses to environmental variables
3.9.1. Grasshoppers
A Canonical Correspondence Analysis (CCA) (Fig. 27) of species versus
environmental variables was undertaken to test whether the measured variables were
having an effect on the species. The sum of all the Eigen values was 0.382. Axis 1 and
2 explained 69.2% of the variance of the species-environment relationship. Axis 1 was
significant only at the 10% level (F= 1.211 and p= 0.060). The combined Axes were
significant at the 5% level (F= 1.301 and p= 0.045).
There were two basic axes described by the environmental variables. The first
important Axis was related to Slope orientation where three species were associated
positively with warmer slopes (D. spumans, D. abbreviata and Q. fastigiata) and two
species were associated with cooler slopes (F. rosea and A. nigrovariegata tibialis).
The second Axis was most strongly related to Grass (grass cover). Two species were
associated with better grass condition, namely, M. bilineata and G. drakensbergensis.
Six species were negatively associated with grass condition preferring lower elevations
BIOTIC INDICATORS OF GRASSLAND CONDITION IN KWAZULU·NATAL WITH MANAGEMENT RECOMMENDATIONS

86
and a poorer grass sward (E. cylindricollis, O. cyanae, C. aeruginosa, R. cephalica, L.
minuta and Conocephalus sp.). Little compositional variation was due to minimum
temperature (Min T).
ID
1 • Eupcyl
Omcya.
Rhacep.Cyraer
• Fauros
•
Lenmin
•Conspp•
•Qacfas
•Dirabb
Slope Orientation
•Dicspu
Acotib- -----------~~----
MinT•
,.Macbil Gasdra
\ G~Elevation
ID
<1+----.----r-_--.--_---.-_-+-_--.._--.._-._----._--I
Figure 27. Canonical Correspondence Analysis (CCA) for environmental variables againstthe sum of the species (Species with 50% variance explained plotted). The combined axeswere significant (F= 1.301 and p= 0.045) (Abbreviations as per Table 19). Refer to Table 6 forgrasshopper species codes.
Table 20. The cumulative fit of the species, for the whole- study period, versus theenvironmental variables,as a fraction of the variance, for grasshopper species with greaterthan 50% variance. Refer to Table 6 for grasshopper species codes
Species code Axis 1 Axis 2
ACOTIBCONSPPCYRAERDICSPUDIRABBEUPCYLFAUROSGASDRALENMINMACBILORNCYAQACFASRHACEP
0.610.510.060.240.220.190.060.430.430.030.360.350.19
0.620.660.660.650.530.570.560.540.720.790.500.590.74
BIOTIC INDICATORS OF GRASSLAND CONDITION IN KWAZULU-NATAl WITH MANAGEMENT RECOMMENDATIONS

87
3.9.2. Butterflies
A Canonical Correspondence Analysis (CCA) was undertaken to determine the effect
of the measured environmental variables on the sum of the species encountered. Axis
1 and 2 explained 66.9% of the variance of the species-environment relationship. The
sum ofall the Eigen values was 0.451. Axis 1 was not significant at the 5% level (F=
1.289 and p= 0.170). All the axes combined Were not significant (F= 1.309 and p=
0.105) (Fig. 28).
Two species were positively associated with Min T (QC) preferring an environment with
a cooler mean temperature; species were C. f10rella and D. chrysippus. Two species,
namely, P. varii and D. bowkeri bowkeri were negatively associated with Min T (QC),
preferring warmer north-facing slopes that received high levels of insulation.
Two environmental variables 'Elevation' and 'Grass' were strongly associated to one
another. Three species were negatively associated with this gradient (A. lucida, P.
punctatissima and O. ariadne), these species preferring lower elevations and poor veld
condition (more forbs and woody vegetation than grass).
BIOTIC INDICATORS OF GRASSLAND CONDITION IN KWAZULU·NATAL WITH MANAGEMENT RECOMMENDATIONS

88
Figure 28. Canonical Correspondence AnalysIs (CCA) of butterflies versus environmentalvariables. The combined axes were not significant (F= 1.309 and p= 0.105) (Only specieswith >50% variance explained were plotted). (Grass= overall grass %; Min T= Minimumtemperature recorded at each site during the whole study period). (Refer to Table 7 forbutterfly species codes).
\l)
M Oraari+ •
Parpun I
•Dinbow
•
Actluc•
IPsevar
I •----------------- I ----------------------------------- --------
•~ Slope OrientationDanchr
Grass El tieva onMinT •
Cattlo~.....
-1.5 +4.0. .
3.10. Species responses to nominal variables
3.10.1. Grasshoppers
Canonical Correspondence Analysis (CCA) (Fig. 29) of species versus nominal
variables was run to show the effect of the measured variables on the species. The
sum of all the Eigen Values was 0.431. Axis 1 and 2 explained 55.4% of the variance
of the species-environment relationship. Axis 1 was not significant at the 5% level (F=
0.809 and p= 0.600). The combined Axes test was not significant (F= 0.809 and p=
0.290). Three species showed a positive association with the nominal variables WG
(Wildlife grazed) and Highland Sourveld (A. dregei, A. acuminata and C. cruciata). G.
tempora/is temporalis, P. squa/us, Ph/oeonotus sp. and O. hy/a hy/a were all
BIOTIC INDICATORS OF GRASSLAND CONDITION IN KWAZULU-NATAl WITH MANAGEMENT RECOMMENDATIONS

89
associated with LG (livestock grazing). Midlands Mistbelt grassland had four species
associated with it, namely, F. milanjica, F. rosea, R. cephalica and O. cyanae.
C! I..,I+
Orncya
•
Rhacep•
82001 Midlands Mistbelt Faumil0 0 • Fauros•
I----------------------------------------------------------------Crucru •WG 0 0 82002
Highland Sourveld 0
• o LG
Anadre •Acracc • PhlsppGyrntem •
IOxyhyl
•IPnosquI
IIIIIII
&0 I
~I
-2.5 +3.0.Figure 29. Canonical Correspondence AnalysIs (CCA) for nommal vanables agamst species(Species with 50% variance explained plotted). Combined axes were not significant (F=0.809 and p= 0.290). (Abbreviations as per Table 19). (Refer to Table 6 for grasshopperspecies codes).
3.10.2. Butterflies
Canonical Correspondence Analysis (CCA) (Fig. 30) of nominal variables versus
species the sum of all the Eigen Values as 0.534, with a cumulative percent variance
explained of 52.1 % for Axis 1 and 2. Axis 1 was not significant (F=0.906 and p= 0.650),
nor were the combined axes significant (F= 1.226 and p= 0.110).
Two species associated with burning in the 2001 season were P. punctatissima and E.
brigitta brigitta. A. areas was negatively associated with burning. Midlands Mistbelt
grassland had one associated species, A. taikosama.
Blonc INDICATORS OF GRASSLAND CONDITION IN KWAZULU·NATAL WITH MANAGEMENT RECOMMENDATIONS

oN+ Parpun
•
Alotai
•
Midlands Mistbelt Eurbri820020 0 •
LGo I 0 82001----------------------~------o--------------------------------
WG
oHighland Sourveld
•Aloore
90
It)
~+----.,.----..-------.------f-----r------r------.------1-2.0 +2.0
Figure 30. Canonical Correspondence AnalysIs (CCA) of butterfly species versus nominalvariables. (Only species with >50% of their variance explained were plotted). The combinedaxes were not significant (F= 1.226 and p= 0.110) (LG= livestock grazed; WG= wildlifegrazed; 62001= burnt in 2001; 82002= burnt in 2002). (Refer toTable 7 for butterfly speciescodes).
BIOTIC INDICATORS OF GRASSLAND CONDITION IN KWAZULU·NATAL WITH MANAGEMENT RECOMMENDATIONS
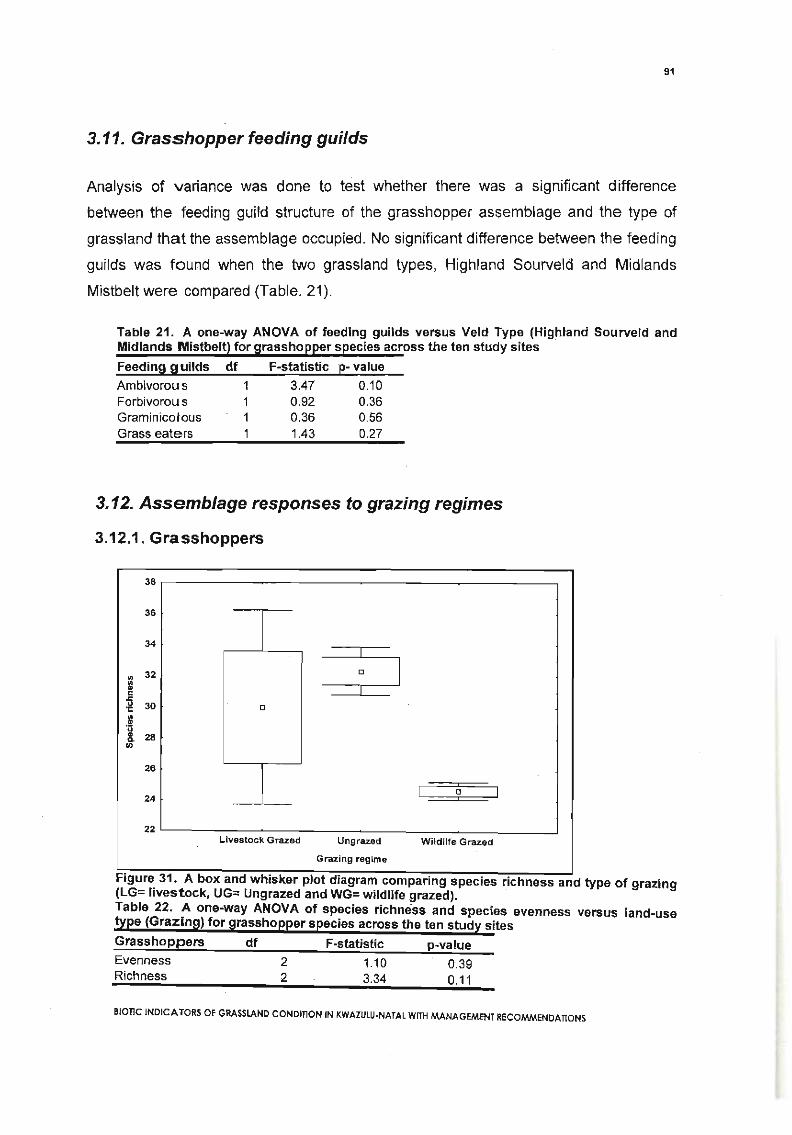
91
3.11. Grasshopper feeding guilds
Analysis of variance was done to test whether there was a significant difference
between the feeding guild structure of the grasshopper assemblage and the type of
grassland that the assemblage occupied. No significant difference between the feeding
guilds was found when the two· grassland types, Highland Sourveld and Midlands
Mistbelt were compared (Table. 21).
Table 21. A one-way ANOVA of feeding guilds versus Veld Type (Highland Sourveld andMidlands Mistbelt) for grasshopper species across the ten study sites
Feeding guilds df F-statistic. p- value
Ambivorous 1 3.47 0.10Forbivorous 1 0.92 0.36Graminicolous 1 0.36 0.56Grass eaters 1 1.43 0.27
3.12. Assemblage responses to grazing regimes
3.12.1. Grasshoppers
38
36
34
'"32
'"..cz:... 30.;:
'"..u.. 28Q,en
26
24
22
[J
Livestock Grazed Ungrazed
Grazing regime
Wildlife Grazed
Figur~ 31. A box and whisker plot diagram comparing species richness and type of grazing(LG= livestock, UG= Ungrazed and WG= wildlife grazed).Table 22. A one-way ANOVA of species richness and species evenness versus land-usetype (Grazing) for grasshopper species across the ten study sites
Grasshoppers df F-statistic p-value
Evenness 2 1.10 0.39Richness 2 3.34 0.11
BIOTIC INDICATORS OF GRASSLAND CONDITION IN KWAZULU-NATAL WITH MANAGEMENT RECOMMENDATIONS

92
Table 23. The LSD post hoc test was undertaken to show any significant differencesbetween grazing strategies and species richness (5% significance denoted by") (LG=livestock, UG= Ungrazed and WG= wildlife grazed)
Grazing LG UG WG
Mean richness 30 32.3 24.67LG 0.47 0.13UG 0.47 0.05"WG 0.13 0.05"
Wildlife grazed sites were significantly different in terms of species richness from
ungrazed sites at the 5% level (Table 23). The species richness means were 32.3 and
24.7 for ungrazed and wildlife grazed lands respectively (Fig. 31 and Table 23).
3.12.2. Butterflies
No significant difference was found when comparing butterfly species richness across
the three different grazing regimes at the ten sites. The same could be said for
abundance with no significant variation across the different grazing regimes (Table 24).
No significant results were achieved when undertaking a post hoc LSD test, for species
richness across the various grazing types.
Table 24. Butterfly richness and abundance when compared across the three differentgrazing types
Sample
Butterfly richnessButterfly abundance
df
22
F-statistic
1.450.05
p-value
0.300.95
3.13. Grasshopper responses to forestry
During the months of February and March the forestry compartments that adjoined
Goodhope 1 were sampled for grasshopper species. The sampling was concluded
after the findings for the two months indicated that, forestry did not provide suitable
habitat for grasshoppers, especially Acridoidea that were totally absent. Table 25
represents the findings and comparisons between plantations and open grassland.
Blonc INDICATORS OF GRASSLAND CONDmON IN KWAZULU·NATAL WITH MANAGEMENT RECOMMENDATIONS

93
Table 25. The abundance of grasshoppers when comparing forestry (plantations) with theindigenous grassland. Figures in parentheses indicate the number of species recorded
Month Forestry Grassland
February
March
6 (2)
22 (2)
188(11)
466 (19)
BIOTIC INDICATORS OF GRASSLAND CONDITION IN KWAZULU·NATAL WITH MANAGEMENT RECOMMENDATIONS

94
CHAPTER 4
INDICATORS OF GRASSLAND CONDITIONS
4.1. Surrogate subsets ofgrasshoppers
The surrogate subset comparisons were undertaken in order to test whether or not
family richness and endemic richness in this study would be representative of the total
species richness, in order to facilitate the use of families or endemics as surrogates for
the entire species richness.
40 mFamilies
• Richness35 mEndemics
30
25IIIIIICDc 20.cCola:
15
10
5
0H s C GH1 GH2 WW1 WW2 KK1 KK2 L
Sites
Figure 32. Total grasshopper species richness plotted against family richness and numberof endemics for the ten study sites. (C= Coleford, GH1= Goodhope 1, GH2= Goodhope 2, H=Himeville, KK1= Karkloof 1, KK2= Karkloof 2, L= Linwood, S= Stirling, WW1= Wahroonga 1,WW2= Wahroonga 2).
BIOTIC INDICATORS OF GRASSLAND CONDITION IN KWAZULU-NATAL WITH MANAGEMENT RECOMMENDATIONS

95
4000
3500Uc 3000ca"Clc
2500::s.acaa; 2000Q,Q,0 1500.cIIIIIII! 1000Cl
SOO
0
mSurrogate abundance
• Total abundance
S L WW1 KK1 C GH2 GH1 WW2 KK2 H
Sites
Figure 33. Surrogate grasshopper abundance for the ten sites compared to totalgrasshopper abundance. (C= Coleford, GH1= Goodhope 1, GH2= Goodhope 2, H= Himeville,KK1= Karkloof 1, KK2= Karkloof 2, L= Linwood, S= Stirling, WW1= Wahroonga 1, WW2=Wahroonga 2).
ID Surrogaterichness
• Total richness
C WW1 L KK1 GH2 KK2 GH1
Sites
40
35v.III 30GIC.cu 25'C...GI
20Q,Q,0.c 15III
'"I! 10Cl
5
0WW2 S H
Figure 34. Surrogate grasshopper richness for the ten sites compared to total grasshopperrichness. (C= Coleford, GH1= Goodhope 1, GH2= Goodhope 2, H= Himeville,KK1= Karkloof1, KK2= Karkloof2, L= Linwood, S= Stirling, WW1= Wahroonga 1, WW2= Wahroonga 2).
BIOTIC INDICATORS OF GRASSLAND CONDITION IN KWAZULU·NATAL WITH MANAGEMENT RECOMMENDATIONS

96
4.2. Surrogate subsets for butterflies
25
20
:g 15Glc~uii: 10
5
o
lllIFamilies
• Richness
Il!lEndemics
L H C GH1 KK1 KK2 S GH2 WW1 WW2
Sites
Figure 35. Total butterfly species richness plotted against family richness and endemics forthe ten study sites. (C= Coleford, GH1= Goodhope 1, GH2= Goodhope 2, H= Himeville, KK1=Karkloof 1, KK2= Karkloof 2, L= Linwood, S= Stirling, WW1= Wahroonga 1, WW2=Wahroonga 2).
120
100~CIII 80'l:lc::I..c
60III
~'t:! 40::Ia:I
20
0
IIJSurrogateabundance
• Total abundance
C L GH1 S GH2 KK1 WW2 WW1 KK2 H
Sites
Figure 36. Surrogate butterfly abundance for the ten sites compared to total butterflyabundance. (C= Coleford, GH1= Goodhope 1, GH2= Goodhope 2, H= Himeville, KK1=Karkloof 1, KK2= Karkloof 2, L= Linwood, S= Stirling, WW1= Wahroonga 1, WW2=Wahroonga 2).
BIOTIC INDICATORS OF GRASSLAND CONDITION IN KWAZULU·NATAL WITH MANAGEMENT RECOMMENDATIONS

25
20
Xi.E 15.g=E'~ 10III
5
o
mSurrogaterichness
• Total richness
97
L H C GH1 KK1 KK2 S GH2 WW1 WW2
Sites
Figure 37. Surrogate butterfly richness for the ten sites compared to total butterfly richness.(C= Coleford, GH1= Goodhope 1, GH2= Goodhope 2, H= Himeville, KK1= Karkloof 1, KK2=Karkloof 2, L= Linwood, S=Stirling, WW1= Wahroonga 1, WW2= Wahroonga 2).
4.3. Correlations between grasshoppers, butterflies &grasses
When comparing species richness across the three sample taxa a significant
correlation was apparent between grasshopper species richness and grass species
richness (Table 26). There was a negative correlation between grasshopper species
richness and butterfly species richness. Butterfly and grass species richness showed
no correlation. When comparing endemic grasshopper and butterfly richness across
the sites there was a negative correlation. No correlations were done for endemic
grasses and butterflies and grasshoppers as only one species of grass encountered
was exotic (only recorded at two sites) and endemism richness would closely mirror
total species richness.
At the family richness level no correlation was found between grasshoppers and
grasses, as at the species level. When comparing grasshoppers to butterflies and
grasses to butterflies they were negatively correlated, but not significant (Table 26).
BIOTIC INDICATORS OF GRASSLAND CONDJnON1N KWAZULU·NATAl WITH MANAGEMENT RECOMMENDATIONS
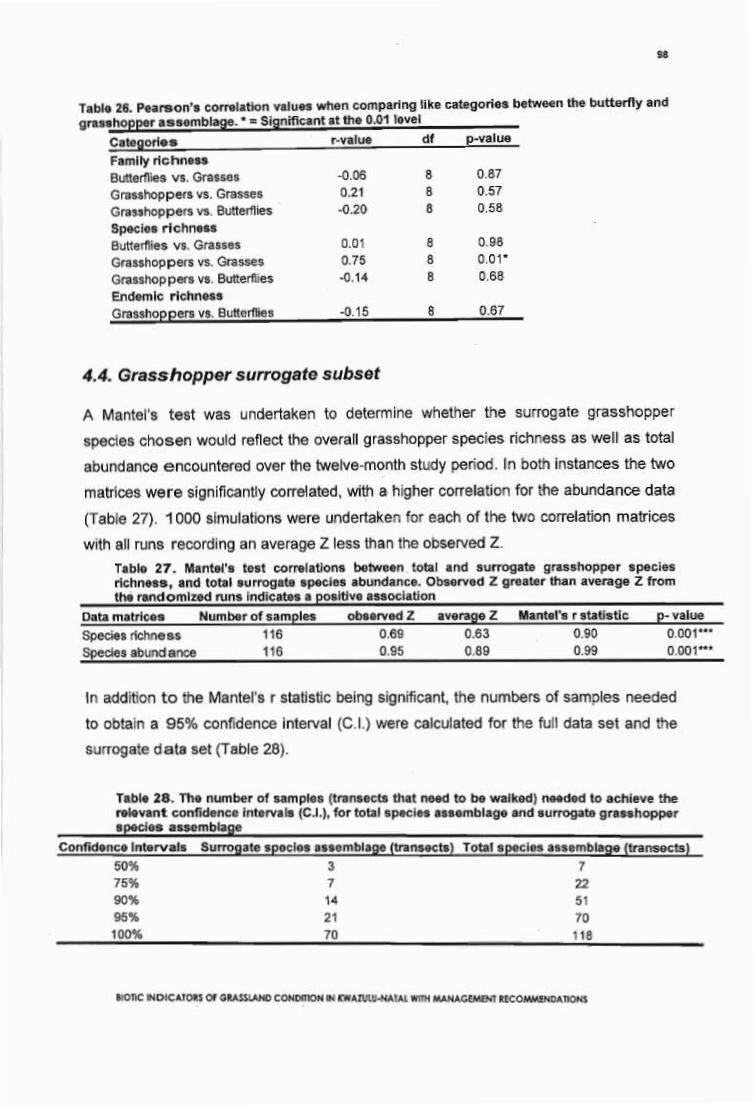
98
Table 26. Pearson's correlation values when comparing like categories between the butterfly andgrasshopper assemblage. * = Significant at the 0.01 level
Categories r-value df p-value
Family richnessButterflies vs. Grasses -0.06 8 0.87
Grasshoppers vs. Grasses 0.21 8 0.57
Grasshoppers vs. Butterflies -0.20 8 0.58
Species richnessButterflies vs. Grasses 0.01 8 0.98
Grasshoppers vs. Grasses 0.75 8 0.01*
Grasshoppers vs. Butterflies -0.14 8 0.68
Endemic richnessGrasshoppers vs. Butterflies -0.15 8 0.67
4.4. Grasshopper surrogate subset
A Mantel's test was undertaken to determine whether the surrogate grasshopper
species chosen would reflect the overall grasshopper species richness as well as total
abundance encountered over the twelve-month study period. In both instances the two
matrices were significantly correlated, with a higher correlation for the abundance data
(Table 27). 1000 simulations were undertaken for each of the two correlation matrices
with all runs recording an average Z less than the observed Z.
Table 27. Mantel.'s test correlations between total and surrogate grasshopper speciesrichness, and total surrogate species abundance. Observed Z greater than average Z fromthe randomized runs indicates a positive association
Data matrices Number of samples observed Z average Z
Species richness 116 0.69 0.63Species abundance 116 0.95 0.89
Mantel's r statistic0.900.99
p-value0.001***0.001***
In addition to the Mantel's r statistic being significant, the numbers of samples needed
to obtain a 95% confidence interval (C.I.) were calculated for the full data set and the
surrogate data set (Table 28).
Table 28. The number of samples (transects that need to be walked) needed to achieve therelevant confidence intervals (C.I.), for total species assemblage and surrogate grasshopperspecies assemblage
Confidence Intervals Surrogate species assemblage (transects) Total species assemblage (transects)
50% 3 775% 7 2290% 14 5195% 21 70100% 70 118
BIOTIC INDICATORS OF GRASSLAND CONDITION IN KWAZULU-NATAL WITH MANAGEMENT RECOMMENDATIONS

99
In order to obtain 95% of the species richness for the total species assemblage, 70
transects would need to be walked to achieve the desired sampling efficiency as
opposed to 21 transects for the surrogate species assemblage (Table 28).
4.5. Grasshopper assemblage responses to environmental categories
Nine categories were selected for, to compare compositional differences in
grasshopper abundance and frequency of occurrence across the ten study sites. All
nine categories were subdivided into two classes. These classes represented divisions
in forb percentage (HIGH/LOW). Vegetation Height (TALL/SHORT), Aspect
(COOLlWARM), Veld condition (GOOD/POOR), Grazing (GRAZED/NOT GRAZED),
Biennial Burning (BIENNIEUOTHER), Grassland type (MIDLANDS
MISTBELT/HIGHLAND SOURVELD), Disturbance (HIGH/LOW) and Season in which
the grassland was burnt (SPRINGIWINTER).
Of the nine categories tested using Multiple Response Permutation Procedures
(MRPP) three categories were not significant p > 0.05, one was significant at p = 0.05
and four were highly significant at p =0.01 (Table 29). The more negative the T
statistic the greater the separation between the two categories tested.
Table 29. The results of Multiple Response Permutation Procedures (MRPP) for ninecategories using the grasshopper abundance data collected across the ten sites for thetwelve-month study period. (n.s. = Not significant, * = Significant p =0.05, ** =Significant p =0.01 and *** =Significant p < 0.01) . .
Category
ASPECTFORS CONTENTVEGETATION HEIGHTGRASSLAND TYPEVELD CONDITIONGRAZINGBIENNIAL BURNDISTURBANCESEASON OF BURN
Test Statistic (T)
-3.64-3.38
-14.15-1.70-9.09-2.02-0.77-1.66-2.29
p- value Significance
0.01 **
0.01 **
0.00 ***
0.07 n.s.0.00 ***
0.05 *
0.18 n.s.0.07 n.s.0.04 *
4.6. Grasshopper indicator species
33 species of grasshopper were significantly different when comparing categories of
topography, vegetation structure, architecture and management. The species are
separated according to their categories and detailed in the subsequent pages.
Blonc INDICATORS OF GRASSLAND CONDITION IN KWAZULU·NATAl WITH MANAGEMENT RECOMMENDATIONS
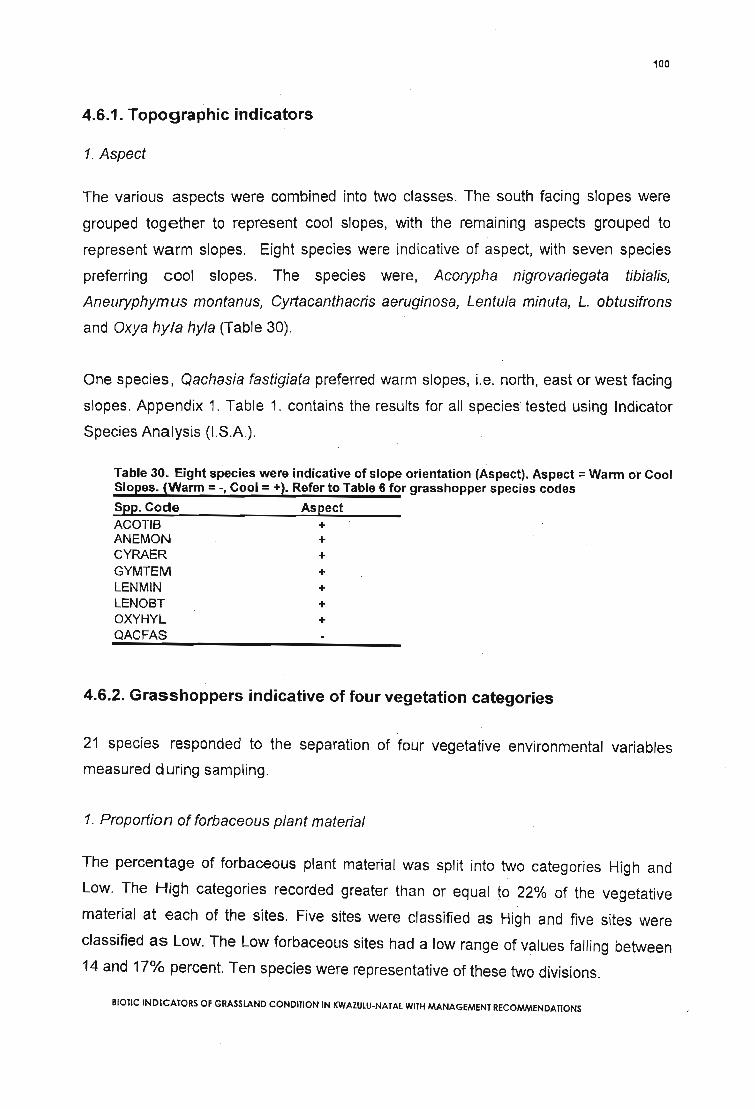
100
4.6.1. Topographic indicators
1. Aspect
The various aspects were combined into two classes. The south facing slopes were
grouped together to represent cool slopes, with the remaining aspects grouped to
represent warm slopes. Eight species were indicative of aspect, with seven species
preferring cool slopes. The species were, Acorypha nigrovariegata tibialis,
Aneuryphymus montanus, Cyrtacanthacris aeruginosa, Lentula minuta, L. obtusifrons
and Oxya hyla hyla (Table 30).
One species, Qachasia fastigiata preferred warm slopes, Le. north, east or west facing
slopes. Appendix 1. Table 1. contains the results for all species tested using Indicator
Species Analysis (I.S.A.).
Table 30. Eight species were indicative of slope orientation (Aspect). Aspect =Wann or CoolSlopes. (Wann =., Cool = +). Refer to Table 6 for grasshopper species codes
Spp. Code AspectAGOTIS +ANEMON +GYRAER +GYMTEM +LENMIN +LENOST +OXYHYL +QAGFAS
4.6.2. Grasshoppers indicative of four vegetation categories
21 species responded to the separation of four vegetative environmental variables
measured during sampling.
1. Proportion of forbaceous plant material
The percentage of forbaceous plant material was split into two categories High and
Low. The High categories recorded greater than or equal to 22% of the vegetative
material at each of the sites. Five sites were classified as High and five sites were
classified as Low. The Low forbaceous sites had a low range of values falling between
14 and 17% percent. Ten species were representative of these two divisions.
BIOTIC INDICATORS OF GRASSLAND CONDITION IN KWAZULU·NATAL WITH MANAGEMENT RECOMM.ENDATIONS

101
Three species, Lentula minuta, Heteropternis guttifera and Eyprepocnemis plorans
were positively indicative of grasslands that had a High forbaceous content, while six
species were indicative of grasslands that had Low forbaceous content. The species
were Acorypha nigrovariegata tibialis, Calliptimicus semiroseus, Crucinotacris cruciata,
Eremidium basuto, Gastrimargus drakensbergensis and Ochrophlebia caffra (Table
31). Appendix 1. Table 2. contains the results 'for all species tested using Indicator
Species Analysis (I.S.A.).
2. Vegetation height
Vegetation height was separated into two distinct categories. Seven sites were
representative of short grasslands, Le. the vegetation was 65 cm or less. Eight species
of grasshopper were representative of these two classes (Table 31).
The tall grasslands were represented by three sites with an average vegetation height
of greater than 90cm and less than 120cm. Six species were indicative of short
grassland, namely, Acorypha nigrovariegata tibialis, Crucin0 tacris cruciata,
Gastrimargus drakensbergensis, Ochrophlebia caffra, Orthochtha dasycnemis and
O.rosacea.
Two species were indicative of tall grasslands, Heteropternis guttifera and Lentula
minuta. Appendix 1. Table 3. contains the results for all species tested using Indicator
Species Analysis (I.S.A.).
3. Grasshopper species representative of grassland veld condition
The Key Veld Condition scores were split into two categories, Poor condition and Good
condition. Six sites represented Good condition, with the remaining four sites
representing Poor condition. 12 species of grasshopper were representative of these
two classes. Seven species were indicative of Good veld condition. The species were,
Acorypha nigrovariegata tibialis, Calliptimicus semiroseus, Crucinotacris cruciata,
Gastrimargus drakensbergensis, Ochrophlebia caffra, Orthochtha dasycnemis and O.
rosacea.
'Blonc INDICATORS OF GRASSLAND CONDITION IN KWAZULU-NATAL WITH MANAGEMENT RECOMMENDATIONS

102
Five species of grasshopper represented Poor veld condition scores. The species
were, Cyrtacanthacris aeruginosa, Heteropternis guttifera, Lentu/a minuta, L.
obtusifrons and Oxya hy/a hy/a (Table 31). Appendix 1. Table 4. contains the results for
all species tested using Indicator Species Analysis (I.S.A.).
4. Grass/and type
The grasslands were split into two categories based on the grassland type described
by Camp (1998). The two categories were Highland Sourveld and Midlands Mistbelt.
13 species of grasshopper were indicative of the two grassland divisions (Table 31).
Acorypha nigrovariegata tibialis, Acrida acuminata, Catantops me/anostictus,
Erimidium basuto and Ochroph/ebia caffra were indicative of Highland Sourveld
grasslands. Eight species of grasshopper were indicative of Midlands Mistbelt
grasslands. The species were, Anthermus granosus, Conocepha/us sp., Faureia
milanjica, Lentu/a minuta, Orthochtha dasycnemis, Oxya· hy/a hy/a, Rhaphotittha
cephalica and Whitea a/ticeps. Appendix 1. Table 5. contains the results for all species
tested using Indicator Species Analysis (I.S.A.).
BIOTIC INDICATORS OF GRASSLAND CONDITION IN KWAZULU-NATAL WITH MANAGEMENT RECOMMENDATIONS

103
Table 31. 21 species were indicative of various vegetative assessments. Forbcon= %forbaceous material (Low = +, High = -), Veg height = vegetation height (cm) (Short = +, Tall= _), VCKey= Veld Condition scores (Poor = -, Good= +) and Gras~type = G!'!ssland Type(Highland Sourveld or Midlands Mistbelt) (Highland Sourveld = +, Mldla~ds Mlstbelt = -). ++,__ denotes a very strong indicator. Refer to Table 6 for grasshopper specIes codes
Spp. code Forbcon Veg height VCKey Grasstype
ACOT'S + +ACRACC 0 0ANTGRA 0 0CALSEM + 0CATMEL 0 0CONSPP 0 0CRUCRU ++ ++CYRAER 0 0ERESAS + 0EYPPLO 0FAUMIL 0 0GASORA + +HETGUTLENMIN 0LENOST 0 0OCHCAF + +ORTOAS 0 ++ORTROS 0 +OXYHYL 0 0RHACEP 0 0WHIALT 0 0
4.6.3. Management Indicators
+ +o +o+ 0o +o++ 0
oo +oo+ 0
o
o+ +
++ 0
oo
24 species of grasshopper were indicative of the various management regimes
encountered through the study period. The four testable regimes were, grazing,
biennial burning of the grassland patches, whether the grassland were over-utilised
(Disturbance) and the season in which they were burnt (Table 32).
1. Grazing
Four grasshopper species, Acorypha nigrovariegata tibialis, Acrida acuminata,
Gymnobothrus temporalis temporalis and Ochrophlebia caffra were positively
associated with grazing, while five species were indicative of rested or not grazed
grassland (Table 32). The species were Catantops melanostictus, Conocephalus sp.,
GRYLLlDAE, Omithacris cyanae and Qachasia fastigiata. Appendix 1. Table 6.
contains the results for all species tested using Indicator Species Analysis (I.S.A.).
BIOTIC INDICATORS OF GRASSLAND CONDITION IN KWAZULU-NATAL WITH MANAGEMENT RECOMMENDATIONS

104
2. Biennially burnt grass/ands
Six species of grasshopper were positively and negatively associated with the
periodicity of burning. Only one species responded positively to biennial burning,
Phloeonotus humilis.
Five species of grasshopper preferred the grassland to be burnt triennially or not at all.
Dirshia abbreviata, Eyprepocnemis plorans, Heteropternis guttifera, Qachasia fastigiata
and Whitea alticeps (Table 32). Appendix 1. Table 7. contains the results for all species
tested using Indicator Species Analysis (I.S.A.).
3. Disturbed grass/ands
Five species of grasshopper were indicative of the amount of disturbance of
grasslands. Three species were positively associated with disturbed grasslands, Acrida
acuminata, Calliptamulus natalensis and Calliptimicus semiroseus. Orthochtha
dasycnemis and Qachasia fastigiata were positively associated with grasslands where
their was no or limited disturbance (Table 32). Appendix 1. Table 8. contains the
results for all species tested using Indicator Species Analysis (I.S.A.).
4. Season in which the grass/ands were burnt
Nine species of grasshopper indicated a preference for the season in which grasslands
were burnt (Table 32). Only one species was positively correlated with spring burning,
Acrida acuminata. The remaining eight species preferred grasslands that were burnt
during the winter period. The species were Anthermus granosus, Cyrtacanthacris
aeruginosa, Faureia milanjica, Gastrimargus crassicollis, G. determinatus vitripennis,
Ornithacris cyanae, Phaeocatantops sulphurius and Rhaphotittha cephalica. Appendix
1. Table 9. contains the results for all species tested using Indicator Species Analysis
(I.S.A.).
BIOTIC INDICATORS OF GRASSLAND CONDITION IN KWAZULU·NATAL WITH MANAGEMENT RECOMMENDATIONS

105
Table 32. 24 species were indicative of various management regimes. Grazing =Livestockor Wildlife grazed (Grazing = +,Not grazed = -), Biennial = Biennially burnt (Biennial = -,Other = +), Disturbed = Disturbance (Over-utilisation) (Low = -, High =+) and Season of burn= winter or spring (winter = -, spring = +). -- denotes very strong indicator. Refer to Table 6for grasshopper species codesSpp.Code Grazing Biennial Disturbed Season ofburn
ACOTIB + 0 0 0ACRACC + 0 + +ANTGRA 0 0 0CALNAT 0 0 + 0CALSEM 0 0 + 0CATMEL 0 0 0CONSPP 0 0 0CYRAER 0 0 0DIRABB 0 + 0 0EYPPLO 0 + 0 0FAUMIL 0 0 0GASCRA 0 0 0GASVIT 0 0 0GRYLL 0 0 0GYMTEM + 0 0 0HETGUT 0 + 0 0OCHCAF + 0 0 0ORNCYA 0 0ORTDAS 0 0 0PHASUL 0 0 0PHLHUM 0 0 0QACFAS + 0RHACEP 0 0 0WHIALT 0 + 0 0
4.7. Butterfly assemblage differences
The categories utilised for butterfly compositional difference were the same as the
categories used when comparing grasshoppers. Of the nine categories tested
using MRPP only one (Season of burn) was significant at p =0.05 (Table 33) the
remainder were not significant.
BIOTIC INDICATORS OF GRASSLAND CONDITION IN KWAZULU·NATAL WITH MANAGEMENT RECOMMENDATIONS

106
Table 33. The results of Multiple Response Permutation Procedures (MRPP) for ninecategories using the butterfly abundance data collected across the ten sites for the twelvemonth study period. (n.s. = Not significant and *= Significant p =0.05)
Category Test Statistic (T) p - value Significance
Aspect 1.22 0.92 n.s.Forb content -0.18 0.38 n.s.Vegetation height -0.30 0.33 n.s.Grassland type -0.48 0.28 n.s.Veld condition 0.39 0.60 n.s.Grazing -0.26 0.34 n.s.Biennial burn -1.57 0.07 n.s.Disturbance 0.50 0.64 n.s.Season of burn -2.56 0.02 *
4.7.1. Topographic indicators
1. Aspect
Only one butterfly species, Harpendyreus noquasa was associated with aspect.
This species was indicative of cool slopes, Le. southerly slopes.
Table 34. Eight species were indicative of slope orientation (Aspect). ASPECT = Warm orCool Slopes. (WARM = -, COOL =+). Table 7 for butterfly species codes
Spp. code Aspect
HARNOQ +
4.7.2. Vegetative indicators
Three species were significant when comparing vegetative characteristics.
Belenois zochalia zochalia was indicative of short grassland with a low veld
condition score. Colias e/ecto and Papilio demodocus were indicative of high and
low forbaceous plant content respectively (Table 35).
Table 35. Three butterfly species were indicative of various vegetative assessments.Forbcon= % forbaceous material (Low = +, High = -), Veg height = vegetation height (cm)(Short = +, Tall = -), VCKey= Veld Condition scores (Poor = -, Good= +) and Grasstype =Grassland Type (Highland Sourveld or Midlands Mistbelt) (Highland Sourveld = +, MidlandsMistbelt = -). Table 7 for butterfly species codes
Spp. Code Forbcon Veg height VCKey GrasstypeCOLELE 0 0 0PAPDEM + 0 0 0BELZOC 0 + 0
Blonc INDICATORS OF GRASSLAND CONDITION IN KWAZULU·NATAL WITH MANAGEMENT RECOMMENDATIONS

107
4.7.3. Management indicators
In terms of management, butterfly species were more prone to be indicative of
various management regimes, as opposed to vegetative characteristics and
topography. Ten species were indicative of the four management categories.
1. Grazing
Two species, Actizera lucida and Pardopsis punctatissima punctissima were
indicative of grasslands that were not exposed to any form of graZing (Table 36).
2. Disturbance
Vanessa cardui and Catopsilia florella were indicative of highly disturbed
grassland patches. Their abundance was highest at these patches, and in the
case of V. cardui it was the most abundant butterfly species. (Table 36).
3. Biennially burnt grasslands
Five species of butterfly were indicative of grasslands that were not exposed to fire
or were triennially burnt (Table 36).
4. Season in which the grassland was burnt
Four species of grasshopper were indicative of the season in which the grasslands
were burnt. Three species were indicative of grasslands that were burnt in winter,
and one species was indicative of grasslands burnt in spring (Table 36).
Blone INDICATORS OF GRASSLAND eONOlnON IN KWAZULU·NATAl WITH MANAGEMENT RECOMMENDAnONS

108
Table 36. 10 species were indicative of various management regimes. Grazing = Livestockor Wildlife grazed (Grazing = +, Not grazed = -), Biennial = Biennially burnt (Biennial = -,Other =+), Disturbed = Disturbance (Over-utilisation) (Low = -, High = +) and Season of burn=winter or spring (winter = -, spring = +). Table 7 for butterfly species codes
Spp. Code Grazing Disturbance Biennial Season of burn
ACTLUC 0 0COLELE 0 0 0PARPUN 0 0ALOORE 0 0 + 0BELAUR 0 0 + 0ORALAC 0 0 + 0PAPDEM 0 0 + 0PSEVAR 0 0 + +CATFLO 0 + 0 0VANCAR 0 + 0 0
BIOTIC INDICATORS OF GRASSLAND CONDITION IN KWAZULU·NATAL WITH MANAGEMENT RECOMMENDATIONS

109
CHAPTERS
DISCUSSION
5.1. Grassland types
Spatial scale is of paramount importance when the focus of the study is invertebrate
assemblages and the development of patterns across grasslands (Gaston et al., 1993,
Palmer & White, 1994; Thomas & Abery, 1995). The behaviours of organisms are
influenced by the scale at which the landscape pattern is perceived (Kotliar & Wiens,
1990; With, 1994). The finest resolution of scale that is perceived by an organism
("grain") is contrasted with the broadest perceptual resolution ("extenf) (Mclntyre &
Wiens, 1999). Weather also has a major impact on grasshopper species (Kindvall,
1996) and assemblages (Gandar, 1982a; Rodell, 1997) both directly and on the plants
on which the insects depend.
Yoshino (1965) has categorized spatial scale into three major units:
1. Microscale- the smallest unit, plant size both vertically and horizontally,
plant architecture and the area directly surrounding the plant. This would be the
microhabitat in which invertebrates live.
2. Mesoscale- this is a medium sized region, for example, the grassland area
as a complete entity, with movement being undertaken over several hundreds of
metres. The invertebrates may utilise this whole entity, or part thereof depending on
specific requirements during their lifecycles. Uvarov (1977) showed that local
migrations occur within grasslands from hatching through the various instars of
development in grasshopper species as requirements change. Only a proportion of
individuals become involved in these movements, while return movement to breeding
habitats are not pronounced (Stebaev, 1970). When grasshoppers need to oviposit
they require areas of bareground that have high light intensity and equivalent heat units
(Onsager, 1963; Anderson & Hastings, 1966, Uvarov, 1977). Feeding grasshoppers
require a well-vegetated area, because food resources and protection are in close
Blonc INDICATORS OF GRASSLAND CONDITION IN KWAZULU-NATAL WITH MANAGEMENT RECOMMENDATIONS

110
proximity. Local topography, disturbance and management of the grasslands
determine grasshopper assemblages. These factors combine to determine the
mesoscale and influence grasshopper assemblages.
3. Macroscale- this is the largest unit of scale, constituting a massive area, for
example, a biome or a country that show similar traits throughout (Brown, 1995). In this
study the macroscale are the two grassland types, Highland Sourveld and Midlands
Mistbelt. Camp (1999) refers to these grasslands as Bioresource Units, distinguishable
by abiotic and biotic variables, such as grass composition, soil type, rainfall and
elevation.
Species diversity, therefore, at anyone point in the landscape is determined by
multiple factors acting at multiple scales (Turner, 1989; Turner & Gardner, 1991;
Wiens, 1989; Debinski et al., 2001).
One of the important questions that requires answering is, 'Can this distinction that is
being made at the grassland type, macroscale level (separation into Midlands Mistbelt
and Highland Sourveld for example) be applied to invertebrate taxa living within the
grasslands?' In this study, no significant differences in grass and grasshopper species
richness and abundance were found when comparing grassland type (Combining of
the five Highland Sourveld grasslands and the five Midlands Mistbelt grasslands into,
two separate categories). This suggests that the climatic factors and 'grassland type'
were relatively uniform for the ten different sites.
Differences in species composition, richness and abundance however are significant
when assessing the grasslands as single entities and comparing them. In this study, it
was possible to compare individual sites, as the grassland type in terms of
grasshopper assemblages at the macroscale are not significantly different and any
significant variation is due to the meso- and micro-scale.
BIOTIC INDICATORS OF GRASSLAND CONDITION IN KWAZULU·NATAl WITH MANAGEMENT RECOMMENDATIONS
111
5.2. Impact of abiotic variables on grasshopper assemblages
5.2.1. Slope orientation
Slope orientation can have a significant affect on the local distribution of grasshopper
species. The thermal environment is extremely important to grasshoppers because
temperature affects all biological functions and ultimately fitness (Willott & Hassall,
1998; Pitt, 1999). Two sites in this study, one north facing, the other east facing,
showed significantly higher species richness, which mirrored what Samways (1990)
found in the Natal Drakensberg. Grasshoppers orientate themselves in this manner to
gain a thermal advantage (Anderson et al., 1979; Chappell, 1983; Lactin & Johnson,
1997, 1998: Chappell & Whitman, 1990) as insolation is affected dramatically by
aspect, with the limiting constraints on the grasshopper assemblage being light
intensity, heat units and food (Uvarov, 1977; Porter & Redak 1996). Insolation can lead
to substantial thermal differences between slope faces. Chappell (1983) demonstrated
that overheating in montane and alpine species of grasshopper is essentially
impossible, and the grasshoppers consistently expose their bodies to direct sunlight for
the optimal body temperature required for their life activities. In semi-arid areas like the
Karoo grasshoppers have a different behaviour, where equivalent time is spent basking
and sheltering from heat as they are generally exposed to extremely high mean
temperatures (Gebeyehu & Samways, 2002).
Fry and Lonsdale (1991) found that in the United Kingdom, a northern hemisphere
country, that slope aspect had a significant affect on species richness and the
presence of rare species. In the northern hemisphere southerly slopes are equivalent
to northly facing slopes in South Africa. Studies conducted on the wart-biter (Decticus
verrucivorus) a member of the Tettigoniidae showed that slope orientation played a
significant role in the rate of instar development (Ingrisch, 1986) and the fecundity of
females (Haes et al., 1990). The two sites, (Linwood and Karkloof 2) which had the
greatest number of grasshopper endemics/rarities, were the warmer more sheltered
slopes, confirming that local topography does have an affect on grasshopper
assemblages.
Blonc INDICATORS OF GRASSLAND CONDITION IN KWAZULU·NATAL WITH MANAGEMENT RECOMMENDATIONS
112
5.2.2. Elevation
Elevation has a significant affect on species richness, which declines with increasing
elevation (Mani, 1961, Claridge & Singhrao, 1978; Currie, 1991; Thomas, 1991;
Kennedy, 1994; Wettstien & Schmid, 1999).
20% of the sites in this study did not follow the trend of decreasing species richness
with increasing elevation. The first site was more heterogeneous in terms of grass
composition than other sites and hence the higher species richness (Otte, 1976;
Gebeyehu & Samways, 2002). The other site is at high elevation, north facing and just
below the crest of a hill. Samways (1990) showed that hilltops act as thermal refugia
for grasshoppers. It is probable that elevation and aspect have a strongly interactive
relationship, adding further variation to grasshopper assemblages. The probable
explanation for increased richness is cold air drainage, which takes place on still winter
nights, where the cold air drains down into the valleys, leaving the warmer air to
blanket the hilltops. Cold air drainage is basically the stratification of air at various
levels, increasing in temperature from valley floor to hilltop. Tyson and Crimp (1998)
showed major fluctuations in diurnal temperatures, ranging from 14°C in the summer
and 20°C in the winter. Such a large temperature fluctuation is going to have an affect
on grasshopper species, as they are small, ectothermic and require high heat units for
survival (Chappell, 1983). This effect is magnified if the grassland is burnt (Samways,
1990) or over-utilised, as it removes vegetation that would comprise grasshopper
microhabitats. At cool body temperatures «15°C), grasshoppers move slowly and are
unable to feed, whereas at high body temperatures (>45°C) enzymes denature and
death occurs (Chappell & Whitman, 1990). The optimal field temperature for
grasshoppers is much narrower ranging between 35-42°C (Dempster, 1963; Chappell
& Whitman, 1990). Grasshopper abundance figures, did not show a similar trend, with
elevation not appearing able to predict abundance levels, as they are more closely
related to management practices (Onsager, 1993, 2000).
Blonc INDICATORS OF GRASSLAND CONDITION IN KWAZULU·NATAL WITH MANAGEMENT RECOMMENDAnONS

113
5.3. Impact ofbiotic variables on grasshopper assemblages
5.3.1. Vegetation structure and architecture
Vegetation structure appears to play an important role in the determination of
grasshopper species richness and abundance. Within grassland areas, vegetation
shows a gradation of variation in grass and forbaceous species (Tainton, 1984a;
Acocks, 1988). Vegetation structure is determined by many factors, the three main
factors being soil type, amount of 'v4ater retained in the soil and light intensity.
Grass species demonstrate trade-ofts between being tall and developing a large root
system (Tilman, 1982). Taller species occurring in this study area directed the majority
of their resources to the development of large leaf areas, with little development of their
roots. Root development is secondary as the soils in which these particular species
grow are nutrient rich with plants not requiring large root masses to accumulate water
and nutrients for growth and development. The grasses also need to grow tall so as to
compete for light with the taller forbaceous species that occur in these wetter areas.
Grasses (Themeda triandra, Tristachya leucothrix) that grow on slopes where the soil
is denuded of moisture and are shallower, direct the bulk of their resources to the
development of expansive root systems that can accumulate the water and resources
needed for growth and development (Tilman, 1982). These grass species tend to be
more important in terms of nutritional value for livestock (van Oudtshoorn, 1992).
Trade-ofts allow grasses to compete better with one another for nutrients, water and
light. Light intensity plays a significant role in the prediction of grass species (Tilman,
1982). Where the taller species of grass occur, they outcompete the shorter speCies
and hence patchiness develops within the grassland. Acocks (1988) found that grass
species growing in deeper, wetter soils and areas of shading, were sweeter and had a
higher nutritional value, in terms of livestock grazing. The grass compositions in these
areas were usually tall grass species (>90cm). The species encountered were
Miscanthus capensis, Cymbopogon excavatus and Hyparrhenia hirta. These three
species are considered poor in terms of their grazing value, with the exception of H.
hirta, which is of average value when regrowth appears after defoliation. The suitability
of any area of grassland for anyone species is dependent on two variables. Firstly, the
BIOTIC INDICATORS OF GRASSLAND CONDITION IN KWAZULU·NATAL WITH MANAGEMENT RECOMMENDATIONS

114
presence, absence or abundance of its food plant{s) and, secondly, vegetation
structure.
Many authors have shown that vegetation height and structure has a limiting affect on
grasshopper assemblages, by not allowing enough light and heat to penetrate deep
into the sward where the grasshoppers are situated, thus defining their habitats
(Anderson, 1964; Mulkern, 1967; Otte, 1976; Uvarov, 1977; Karieva, 1983; Evans,
1988a,b; Kemp et al., 1990; Quinn et al., 1991; van Wingerden et al., 1991a; Fielding &
Brusven, 1993a; Kisbenedek, 1995; Thomas & Marshall, 1999; Meek et al., 2000). The
taller grass height frequently resulted from the presence of species (e.g. Cymbopogon
excavatus, Hyparrhenia hirta and Miscanthus capensis) , which harbour fewer
grasshoppers than the lower, more even sward (Gandar, 1983, Chambers and
Samways, 1998). Tall, dense vegetation often implies more shelter (Bossenbroek et
al., 1977), more food (Gandar, 1983) and greater microclimatic stability (Duffey et al.,
1974; Samways & Moore, 1991). There is however likely to be more shading and lower
temperatures within areas of tall dense vegetation (Anderson, 1964; van Wingerden et
al., 19991b). Grasshoppers are ectotherms, requiring light and heat for survival and are
unable to benefit from the advantages associated with increased vegetation height.
Samways and Moore (1991), working in the same geographical area as this study,
found that grasshoppers showed a definite preference for areas that were sunlit. Joern
(1982) considers temperature to be a more important factor than light in habitat
selection, although here there was a definite preference forsunlit areas. This may be
due to tolerances in some environmental changes so as to preserve uniformity in
others (e.g. direct sunlight). Optimal field temperature and RH (relative humidity) for
grasshoppers are 35-42oC and 50-75% respectively (Dempster, 1963; Chappell &
Whitman, 1990), and periods during which this is the case, grasshopper abundances
are much higher. Consequently, irradiance has a very pronounced influence in habitat
selection by grasshoppers. The taller the vegetation the more shading effect occurs,
reducing the number of sites where grasshopper species can oviposit and bask, thus
reducing abundance and richness. Grasshoppers will therefore abandon these areas
(Lockwood, 1993) and make small migrations to areas better suited to their
requirements.
BIOTIC INDICATORS OF GRASSLAND CONDITION IN KWAZULU·NATAL WITH MANAGEMENT RECOMMENDATIONS

115
This study concurs with these findings, showing that areas where the grass sward is
less than 45cm had the highest species richness and abundance, with the exception of
Wahroonga 2 where the richness of grasshopper species was the lowest of all sites
studied. It could be postulated that the reason for such low species richness, was that
this particular site was regularly mowed and never burnt, affecting the natural process,
which in turn molds the grasshopper assemblage.
It can therefore be concluded that grasshopper biomass is highly reduced when
vegetation height is greater than 90cm, supporting the findings of other authors that
plant physiognomy, rather than composition (Gandar, 1982a), play an important role in
the formation and prediction of grasshopper assemblages.
5.3.2. Habitat heterogeneity and grasshoppers
The term heterogeneity can have many meanings (Kolasa & Pickett, 1991), but the
relevant parameters in the current study derive from variability in vegetation structure,
composition, density and biomass. This type of heterogeneity influences species
diversity, the variety of habitats and ecosystem functioning (Christensen, 1997; Wiens,
1997; Bailey et al., 1998; Fuhlendorf & Engle, 2001). Environments are heterogeneous
in space and time (Mclntyre & Wiens, 1999). In this study patterning results from a
number of contributing factors, namely, slope, aspect, management geology and
elevation. Patterning therefore is more natural than uniform of the grasslands that were
sampled. The patterning of this heterogeneity affects the abundance and distribution of
organisms and the array of population, community, and ecosystem patterns that follow
from distribution and abundance (Robinson et al., 1992). Therefore, heterogeneity is
the precursor to diversity at most levels of ecological functioning and should serve as
the foundation for ecosystem and conservation management (Christensen, 1997;
Wiens; 1997). Maintenance of a heterogeneous landscape, where a variety of habitats
is conserved, is essential for the full array of local invertebrate species, from
bumblebees (Kells & Goulson, 2003) to dragonflies (Steytler & Samways, 1995).
British bumblebees need a variety of field and forest boundary types, while South
African dragonflies need a variety of lakeside vegetational structural types.
Heterogeneity also impacts upon grasshopper assemblages. Heterogeneity depends
on scale, with the relationship between ecological productivity and species diversity
BIOTIC INDICATORS OF GRASSLAND CONDITION IN KWAlULU-NATAL WITH MANAGEMENT RECOMMENDATIONS

116
changing with spatial scale (Chase & Leibold, 2002). Grassland may appear
heterogeneous to humans as the scale at which we view the grassland is at a much
lower resolution. Humans define grassland heterogeneity along the lines of plant
species diversity, proportion of grasses to forbaceous plants as well as the proportion
of vegetation in relation to bare ground (Fuhlendorf & Engle, 2001; Gutzwiller, 2002).
For small invertebrates Le. grasshoppers landscape is viewed at a much higher
resolution, with changes in plant architecture and structure being more influential on
the behaviour of individuals and species (Mclntyre & Wiens, 1999).
In general, the more diverse the mix of plant species surviving in a community, the
greater the potential to support a diversity of specialist invertebrates dependent on
specific plant hosts (MacArthur, 1972; Crawley, 1983; Mullen et al., 2003) and resultant
creation of a more diverse array of habitats (Mulkern, 1967; Skinner, 2000; Beckerman,
2000). Landsberg et al., (1999) showed that continual utilisation reduces floral diversity
and impacts the indigenous biota thus reducing habitat heterogeneity. Ants, bees,
Coleoptera and Lepidoptera are known to switch between habitats daily, while they
undertake their daily routines of foraging, resting and reproduction (Duelli, 1997). The
feeding habits and environmental requirements of exopterygotan insects are similar in
the young and adult stages (Samways & Sergeev, 1997). Yet, the various life stages
may be characterized by differing responses to landscape form and pattern at the
various spatial scales. Invertebrates benefit from greater structural variety resulting
from a fine scale mosaic of different sward heights (Fry & Lonsdale, 1991) as well as
increased diversity amongst the plant species. Davidowitz and Rosenzweig (1998)
showed that there is a positive correlation between habitat complexity and species
diversity: the greater the heterogeneity of the habitat the greater the number of species
in that habitat (Greatorex-Davies et al., 1994; Mullen et al., 2003; Weibull et al., 2003).
In a mosaic landscape, a combination of varying biotopes and ecotones, the habitat
heterogeneity is increased and all species appear to profit from this increased
complexity. Increasing habitat heterogeneity reduces density fluctuations and extinction
risk of local populations of the bush cricket Metrioptera bicolor (Kindvall, 1996). This
has been substantiated by studies undertaken on butterflies, where local populations
are more stable with increased habitat heterogeneity (Erhlich & Murphy, 1987; Weiss
et al., 1988; Swengel, 1996a). Within a grasshopper assemblage, individual species
BIOTIC INDICATORS OF GRASSLAND CONDITION IN KWAZULU·NATAl WITH MANAGEMENT RECOMMENDATIONS

117
have different environmental and management requirements as with other taxa. The
problem of catering for these different requirements simultaneously to conserve
maximum species richness and diversity can be solved with a system of rotational
management (Chambers & Samways, 1998). Rotational management allows a wider
spectrum of grasshopper species with respect to food and habitat requirements,
through greater habitat heterogeneity. This however, can lead to conflict between the
management of grasslands for floral diversity and management for diversity in other
groups such as the invertebrates (Van Wieren, 1989; Grant et a/., 1996). It is rare,
however, that all management objectives can be realized within the same area at the
same time (Van Wieren, 1989).
The findings here are in accordance with this notion, as the site with the highest
grasshopper species richness was Goodhope 1 with the greatest compositional
difference in terms of grasses and microhabitats. Overall this grassland comprised
three different habitats: 1) grassland, 2) grassland/wetland interface and 3) wetland.
Grassland/wetland interface and the wetland habitats have a particular species
assemblage, with high abundances of three species, namely, Paracinema tric%r,
Lentu/a obtusifrons, and Oxya hy/a. O. hy/a hy/a was only recorded at this site as it is
adapted to live in marshy areas with expanses of open water, with the evolutionary
development of flattened tibias for swimming.
Karkloof 1 was also highly heterogeneous with two distinct layers within the grassland.
Firstly, the woody plants (Phymaspermum acerosum) provide a unique habitat for the
forbivorous species (Lentula minuta, Cyrtacanthacris aeruginosa, Omithacris cyanae
and Eupropracris cy/indricollis). Secondly, the small grass patches between the stands
of tall woody species prOVide a microhabitat, for the graminicolousspecies, such as
Rhaphotittha cephalica and Gastrimargus vitripennis. In addition to the complex plant
architecture, this grassland is in a state of succession, from being a once forested
area. Rehabilitation involves colonization by new species (Andersen, 1997), and the
speed at which the colonization takes place with further successional development is a
function of distance from the source population, vagility of the species and their method
of dispersal. Andersen et al. (2003) showed that the rehabilitation of mine sites rarely
reconstitutes the original fauna, with functional groups such as cryptic species, cold
climate specialists and specialist predators generally underrepresented, while there is
BIOTIC INDICATORS OF GRASSLAND CONDITION IN KWAZULU-NATAL WITH MANAGEMENT RECOMMENDATIONS

118
a high relative abundance of dominant species, hot climate specialists and/or
opportunists. Although the pioneer species were replaced by later successional
species, the nature of the succession was patchy, with earlier successional remnant
assemblages remaining. This may temporarily increase species richness. As the
system stabilizes the species richness may also decline as habitat heterogeneity
declines. However, should the grass/forb proportion remain static then the species
richness could remain similar, but species turnover will take place. Nevertheless, we
are still likely to see future catastrophic regime shifts in some ecosystems, where
accumulation of pressures reach a point where an ecosystem changes from one state
to another and then remains more or less static in the new state (Scheffer &Carpenter,
2003). This has been shown at sites in Germany, where butterfly species richness did
not change during plant succession, although the species composition changed
substantially (Steffan-Dewenter & Tscharntke, 1997). The aim of the custodians of this
grassland is to remove all the Phymaspermum acerosum, returning it to natural
Themedatriandra dominated grassland. With this as the desired end point and the
management structured around achieving this, it will reduce the habitat heterogeneity
and at least once species (Eupropracris cylindricol/is) that is currently only found at this
site will disappear from the grasshopper assemblage.
To maintain species diversity it is therefore imperative that management of grasslands
aims specifically for a heterogeneous landscape (Fuhlendorf & Engle, 2001) with
management practices, particularly grazing, that varies from year to year (Onsager,
2000). Therefore, ranges of taxa need to be sampled and a decision made on which
method supports the highest diversity across taxa.
5.4. Landscape level and the impacts associated with man
5.4.1. Defol iation
Grasslands in South Africa are not considered to be climax vegetation, and are
dynamic. If left without management, they develop into scrub veld and eventually forest
(Acocks, 1988; Hardy, 1999). Therefore an integral part of grassland maintenance is
management. Management revolves around maintaining grasslands in their current
state, (Le. rich in short productive grass species) which rely heavily on defoliation
through relatively frequent burning, mowing or grazing (Belsky 1992; Fuhlendorf &
BIOTIC INDICATORS OF GRASSLAND CONDITION IN KWAZULU·NATAL WITH MANAGEMENT RECOMMENDATIONS

119
Smeins 1997; Osem et al., 2004). This form of defoliation results in the removal of
litter, improving light availability and reducing soil nitrogen (Seastedt et al., 1991;
Ojima et al., 1994) and above-ground net primary productivity (ANPP) (Tainton et al.,
1978; Milchunas & Lauenroth 1993; Snyman 2004).
Farmers and environmental agencies typically undertake the management of
grasslands in South Africa. In the absence of this management important agricultural
and environmental grass species are lost, as their vigour declines and they eventually
die (Kruger, 1984; Tainton, 1984b). With lack of management, the grassland becomes
patchy with large areas of bare ground, leading to soil erosion. Over-utilisation and
repeated burning result in a loss of perennial decreaser species. This occurs through
the loss of perennial grass species that play a key role in soil stabilization (O'Connor,
1996). Topsoil loss through erosion results in a species switch from perennial grasses
to pioneer grasses and deeper-rooted shrubs in the long term (O'Connor, 1996; Dougill
& Trodd, 1999; Manzano & Navar, 2000). Pioneer species along with shrubs are
considered unpalatable by livestock leading to selective grazing, further degrading the
grassland (van Oudtshoorn, 1992) and the development of further bare patches.
Under-utilisation results in similar problems, as the grasslands become moribund,
resulting in the grass tufts dying as light and rain infiltration are limiting factors. With the
tufts dying out bare patches are opened up allowing for invasion by alien species
and/or exposure of the soils to the elements and thus providing the potential for soil
erosion to commence.
Several authors have demonstrated that a reduction in canopy height, and grass cover
has an inverse relationship with grasshopper densities (Rivers-Moore & Samways,
1996; Samways & Lockwood, 1998; Lockwood et al., 2000; Onsager, 2000). The
grasshopper assemblage would constitute the common, more robust species of
grasshopper with a reduction in rare and endemic species through microhabitat loss.
These characteristics were mirrored in this study when the incorrect grazing strategies
were implemented, a prime example being Stirling and Himeville where species
richness was reduced through poor management.
BIOTIC INDICATORS OF GRASSLAND CONDITION IN KWAIULU-NATAL WITH MANAGEMENT RECOMMENDATIONS

120
1 Livestock grazing
Grazing is an important land-use of grasslands in the KwaZulu-Natal Midlands. Grazing
is both beneficial and detrimental. The advantages are only applicable if management
of grazing is well controlled and monitored, as many authors (e.g. Capinera & Sechrist,
1982; Dolek & Geyer, 1997; Zschokke et al., 2000; Kruess & Tscharntke, 2002) have
shown a decline in species richness and abundance. Changes in plant composition by
livestock and wildlife are likely to have the greatest impact on host-specific herbivores,
which are most commonly invertebrates (Crawley, 1983; Beckerman, 2000). Grazing
by large herbivores removes some palatable grasses and forbs, while trampling of the
soil affects its structure and vegetal composition (Taboda & Lavado, 1993). The
trampling of soil and change (switch) in vegetation composition has dramatic affects on
resident invertebrate fauna (Maliha et al., 2000). Continuous grazing has reportedly
had a deleterious affect on other taxa of soil-dwelling and above-ground invertebrates
(King & Hutchinson, 1976). These effects are only noticeable when there is high
intensity grazing on areas with poor resources. It is therefore pertinent at this time to
provide insight into the types of grazing that occur in the study area.
At the sites where livestock grazing took place, the various managers have
implemented three different grazing strategies. At the first site (Stirling) the grassland is
continuously grazed, with typical patterns associated with continuous grazing such as
patchiness and large areas of 'tall' unpalatable grass, such as Miscanthus capensis
that is encroaching on small areas of remnant Themeda triandra. Coupled to the
encroachment by M. capensis and Aristida junciformis, is the increased number of
forbs and woody species that are now able to find a foothold as competition between
themselves and the grasses has been reduced through continual trampling and
grazing. The M. capensis and A. junciformis are beginning to outcompete the perennial
T. triandra. Large areas of bareground are starting to form at this site through the
continual use of paths by livestock, as well as by selective grazing and trampling. M.
capensis is less able to deal with continual trampling, due to its growth form, which
apportions a high percentage of available resources to leaf development, resulting in
poor root mass growth, and SUbsequent soil destabilization. This is additive to the
deleterious affects of continuous grazing. Bare patches are more frequently
Blonc INDICATORS OF GRASSLAND CONDITION IN KWAZULU-NATAL WITH MANAGEMENT RECOMMENDAnONS

121
encountered and open to erosion, notably by water, leading to a complete shift in
vegetal species composition and also a decline in grasshopper richness.
Most grasshopper species avoid sites that are heavily grazed and trampled, and where
there is less food (Holmes et al., 1979; Dukas & Bernays, 2000), minimal shelter from
natural predators (Belovsky & Slade, 1993), and high physical disturbance from hooves
(Roux & Opperman, 1986, Bosch & Gauch, 1991; Rivers-Moore & Samways, 1996;
Samways & Kreuzinger, 2001; Gebeyehu & Samways, 2003). Gibson, et a/~, 1992
reported similar findings for spider diversity with an increase in diversity resulting from
a decline in grazing intensity. At Stirling, all of these effects lead to simplified
vegetation structure, and reduced grasshopper species richness and abundance.
Three species, Acrida accuminata, Calliptamulus· natalensis and Calliptimicus
semiroseus, benefit from the over-utilisation of the grassland (Indicator Species
Analysis) with increased abundance through changes in the vegetal structure and
higher percentages of bare ground. Two .species Orthochtha dasycnemis and
Qachasia fastigiata showed a reciprocal trend. These species tend towards better veld
(grassland matrix) condition areas, where the percentage of Themeda triandra was
high and the grazing light or absent.
Structure plays a role in grasshopper assemblages and to a large extent is determined
by utilisation. Structure however, appears to play less of a role in this instance than
other authors have postulated (Joern, 1979; Gandar 1982b). In the Karoo as with this
study the abundance of O. dasycnemis is affected by utilisation (grazing). It is absent
from sites that are heavily grazed by livestock both in the Karoo and in KwaZulu-Natal
Midlands, and is only common in areas where Themeda triandra dominates the
grassland complex. In grasslands is devoid of large stands of T. triandra so are they
devoid of O. dasycnemis, indicating their preference for T. triandra.
The rotational grazing regime at Goodhope 2 follows separate camps, with each camp
being heavily utilised and rested for a long period before being re-utilised (Savory &
Butterfield, 1999). Using this method of grazing enhances long-term benefits, with
higher seedling recruitment in gaps (Bullock et al., 1994). Grazing defoliation is
distributed over a wider proportion of the plants, reducing selective grazing pressure.
During the resting phase after defoliation, new tillers proliferate and fill the bare areas
BIOTIC INDICATORS OF GRASSLAND CONDITION IN KWAZULU·NATALWITH MANAGEMENT RECOMMENDATIONS

122
created by patch grazing or excessive trampling. Therefore patches made bare during
the first defoliation are occupied by new grass tillers, while dense stands of grass will
be opened up (Onsager, 2000).
Such successional defoliation, by the movement of livestock from camp to camp,
results in a heterogeneous structure within the grassland, comprising a range of plants
with characteristic growth forms, structural attributes and chemical composition (Joern,
1979). Using rotational grazing also benefits the farmer with the weight gains and
overall productivity of the livestock being improved (Onsager, 2000; Boyd et al., 2001).
Rotational grazing also prevents encroachment by undesirable plants and the removal
of valuable perennial grass species.
A system of rotational grazing increases the number of different microhabitats that can
be utilised by grasshoppers and can act in controlling pest species outbreaks
(Samways & Lockwood, 1998; Lockwood et al., 2000; Onsager, 1993, 2000). Several
authors have shown that rotational grazing also improves the richness of other taxa, for
example, grassland butterflies (Morris & Thomas, 1991, Swengel, 1996; Swengel,
2001), Coleoptera (Rushton et al., 1990) and Hemiptera (Morris & Lakhani, 1979;
Morris & Rispin, 1987). Grazing by domestic livestock has proved the best and safest
way of controlling the encroachment of undesirable plants and maintaining biodiversity
in South Africa (Shackleton, 2000). Rotational grazing is the most productive form of
grassland utilisation benefiting both the invertebrate fauna and the farmer.
Cattle opportunistically grazed the third grassland site (Goodhope 1). The cattle are left
to graze over an extensive area with no apparent control. At present the grazing
pressure is low and does not appear to be detrimental, as the characteristic signs of
trampling and 'patchiness' in terms of vegetation structure are not discernable. There
were no patches where continual livestock aggregation took place. Grasslands in the
KwaZulu-Natal Midlands are well vegetated by nutritionally high value grass species,
unlike the Karoo where vegetation is patchy, sparse and adversely affected by the
slightest grazing pressure. In the Karoo where livestock aggregate around watering
points and shade trees, trampling and high-intensity grazing have a major impact on
grasshopper assemblages (Gebeyehu & Samways, 2003), with this situation being
mirrored in Zululand, where aggregation at water holes creates a shift in vegetation,
BIOTIC INDICATORS OF GRASSLAND CONDITION IN KWAZULU·NATAL WITH MANAGEMENT RECOMMENDATIONS
123
species assemblage and resultant changes in the soil dynamics (Rivers-Moore &
Samways, 1996).
Shackleton (2000) found that vegetal species richness was higher on communally
grazed grasslands than on protected area grasslands. Similar results were found in
Spain by Verdu et al. (2000) who studied the effects of protection against grazing on
the biodiversity within in national park. The species richness of the site may be
increased through this method of grazing, but is greater species richness beneficial?
The elevated species richness that occurs may introduce undesirable species that do
not contribute to increased productivity in terms of livestock gains.
Grasslands at present are managed to increase the quantities of a certain suite of
desirable grass species that will benefit the landowner. Muralirangan et al. (1993)
pointed out that agricultural simplification of the landscape, by reducing the number of
plant species, not only encourages the spread of one or more orthopteran species but
also favours a more homogeneous spatial distribution of the species. Therefore by
promoting the development of a certain suite of grass species through management
suggests that grasshopper richness is likewise affected, as the results in this study
have shown that increased grass species richness, habitat heterogeneity and plant
architecture increase grasshopper species richness and abundance.
2. Wildlife grazing
Kruess and Tscharntke (2002) found that sites that are grazed have lower species
richness than ungrazed sites. In this study the contrary was found, with ungrazed sites
and livestock-grazed sites haVing similar species richness, both being significantly
higher than Wildlife-grazed sites. At sites where no grazing took place the grasshopper
densities were greatly increased (Capinera & Sechrist, 1982; Fielding & Brusven,
1995), which appeared to be the case in this situation, with the exception of Himeville.
Rivers-Moore and Samways (1996) found that livestock grazing was more detrimental
than wildlife grazing, as the impact of livestock trampling is more localized than wildlife
grazing. At Coleford and Himeville, the two species of wildlife are Black Wildebeest
(Connochaetes gnou) and Blesbuck (Damaliscus dorcas phillipsJ) , which are
BIOTIC INDICATORS OF GRASSLAND CONDITION IN KWAZULU·NATAL WITH MANAGEMENT RECOMMENDATIONS

124
concentrate/selective grazers (Bothma et al., 2002), choosing a particular suite of
grass species to feed on. The habitat heterogeneity, in terms of vegetation height and
structure, increases through this type of grazing. It could, therefore, be assumed
grasshopper species richness would increase, as habitat heterogeneity has been
shown to increase species richness. This however, does not appear to be the case as
the unpalatable patches are not suitable for grasshoppers as the increase in vegetation
height excludes light and heat, two essential facets required by grasshoppers for
survival (Gandar, 1979).
At Himeville, trampling was highly localized around dung middens and the grassland
was patchy in terms of vegetation structure, with areas of short grass interspersed with
large tracts of long grass and a high proportion of bareground (10%). These communal
middens are points of aggregation for wildlife, suggesting that they play a similar role to
watering points and shaded areas for cattle in the studies conducted by Rivers-Moore
and Samways (1996), Samways and Kreuzinger (2001) and Gebeyehu and Samways
(2003) in m ore arid environments.
Grasshoppers tend to abandon areas of high disturbance Le. communal dung middens
as part of their ecological strategy (Kemp et al., 1990), and move to more suitable
habitats (Lockwood, 1993), where they are more assured of survival. If the high
wildlife-stocking rates continue at Himeville, there may be severe reduction in species
richness, with increased abundance of one particUlar species, Crucinotacris cruciata
reducing th is sites ecological integrity and role in future conservation planning. Cagnolo
et al. (2002) showed that in the grasslands of montane Argentina, abundance,
richness, diversity and biomass of insect assemblages were minimal in the most
intensively cattle-grazed areas. In other studies by Samways and Sergeev, (1997),
results showed a depression of populations of some species but also provided
opportunities for outbreaks of others (Samways & Lockwood, 1998; Lockwood et al.,
2000; Onsager, 2000).
The butterfly assemblage was also affected by the level of grazing intensity with
increased abundance and richness of generalists, particularly at Himeville. The most
abundant species Vanessa cardui, a generalist of the highest order, utilises all forms of
flowering plants as a nectar source. With the alteration of the habitat and the
BIOTIC INDICATORS OF GRASSLAND CONDITION IN KWAZULU·NATAL WITH MANAGEMENT RECOMMENDATIONS

125
dominance of Vanessa cardui came a reduction in species richness, and more
importantly the disappearance of endemic butterfly species, that would traditionally
have made use of the grasslands. The elevated abundances of V. cardui were
associated with the encroachment of Verbena bonariensis, an alien invasive plant, onto
the fringes of the grassland, where traditionally high levels of disturbance from wildlife
movement and aggregation had taken place. A similar trend was noted amongst
monkey beetles (Scarabaeidae, Hopliini) in the Karoo, which are pollinators influenced
by levels of grazing, with an assemblage shift away from perennial and bulb pollinator
guilds towards those favouring weedy annuals in overgrazed areas (Colville et al.,
2002).
Wildlife grazing mirrors the traditional type of land use, but due to human pressure, a
reduction in acceptable grazing area has occurred, concentrating wildlife species onto
smaller parcels of land, elevating grazing intensity, thus influencing grassland
utilisation, and grasshopper and butterfly diversity. Wildlife grazing therefore mimics
intensive continuous livestock grazing that has been shown in this and other studies to
be highly deleterious to the grasshopper and butterfly assemblage and the grassland
as a functioning ecosystem.
5.4.2. Disturbance: its effect on the grasshopper assemblage
The main contributing factor to disturbance within these grasslands is grazing by both
livestock and wildlife and management practices. In South Africa, the most important
contributor towards grasshopper abundance was disturbance from game or domestic
livestock (Samways & Kreuzinger, 2001). The level or intensity of the disturbance
ranged from slight to very intense. Linkages present in the forestry system may be
firebreaks, access points or borders. Parts of these areas are often highly disturbed via
over-utilisation of fire to protect the economically important crop, and the continual
localized disturbance within the linkages by machinery that is required in running a
forestry estate. At sites where levels of disturbance are highest, species richness is
reduced. This reduction however is not necessarily mirrored by the abundance of
species (Turner & Gardner, 1991). Some species apparently thrive on disturbed
patches, as long as it is neither too severe nor frequent. This has been demonstrated
in North America (Fielding & Brusven, 1993a; Porter & Redak, 1996 and Onsager
BIOTIC IN DICATORS OF GRASSLAND CONDITION IN KWAZULU·NATAL WITH MANAGEMENT RECOMMENDATIONS

126
2000), in Russia, (Sergeev, 1998) and in South Africa (Gebeyehu & Samways, 2002).
Most species that respond positively to disturbance are eurytopic (Sergeev, 1998).
At Himeville where grazing intensity and density of grazing species are both high, large
areas are being denuded of the vital grass cover that is required by many species of
grasshopper for survival. This alteration and reduction in microhabitats reduces the
species richness (Onsager, 1993) with many species abandoning these areas
(Lockwood, 1993). The reciprocal however is true for abundance. The alteration of the
habitat favours certain species that are able to take advantage of this change, for
example, Crucinotacris cruciata the dominant species at Himeville with 79% of total
abundance.
1. Burning
Fire is an important component in the maintenance of grassland diversity (Freeman,
1998; Lunt & Morgan, 2002). In South Africa the most important form of defoliation is
burning. Over the millennia natural fires have been responsible for shaping the
structure and composition of grasslands in southern Africa (Frost, 1984; Hall, 1984;
Scott, 1984, Tainton & Mentis, 1984; Armstrong et al., 1996). The use of human
induced fire in management programmes mimics natural events to the benefit of the
grassland biota. If utilised correctly, fire is able to control alien and undesirable plant
species as well as rejuvenating the grassland. Fire removes dead organic material,
allowing light and heat to penetrate into the soil, resulting in greater annual dry matter
production (Ojima et al., 1994; Blair, 1997; Snyman, 2002; Fynn et al., 2003). Fire also
reduces the number of parasites present within the grassland (Cully, 1999; Hardy,
1999). There are, however, drawbacks to the use of fire with the release of undesirable
gases into the atmosphere (Fishman et al., 1991) and posing a threat to economically
important crops, especially forestry. Fire, if utilised too often, may cause a reduction in
overall species richness and abundance across all taxa (York, 1999). Not allowing
complete system recovery, results in the removal of vital leaf litter, moisture and
simplification of habitat structure. The total exclusion of fire results in equally
undesirable changes both in the grassland community and the organisms that it
supports (Kruger, 1984; Tainton & Mentis, 1984).
Blonc INDICATORS OF.GRASSLAND CONDITION,IN KWAZULU·NATAL WITH MANAGEMENT RECOMMENDATIONS
127
Burning in this study did not have a negative impact on grasshopper assemblage
richness and abundance, but did impact on the responses of individual species.
Burning affects patterns of grasshopper population density and distribution both
directly, through mortality, and dispersal and indirectly through induced changes in host
plant communities (Gandar, 1982b; Evans, 1984, 1988a; Samways, 1990). Many
authors have demonstrated that abundance of certain taxa, namely Orthoptera and
Coleoptera (Carabidae) increase post fire (2-12 months) (Rice, 1932; Bulan & Barrett,
1971; Warren et al., 1987; Anderson et al., 1989; Bock & Bock, 1991; Greenslade,
1993; Reed, 1997). Anderson et al. (1989) found that there was no significant response
of the Orthopteran assemblage post fire. Force (1981) showed a general decline in
insect species richness, diversity and abundance during post-fire succession. The
results here support this contention with a decline in species richness from biennially
burnt sites through triennially burnt sites. The most species poor site was Wahroonga
2, which was never burnt. The decline in species richness may be explained by three
possibly interrelated factors.
Firstly, burnt sites are likely to have less plant litter than sites that are burnt less
frequently (Bigalke & Willan, 1984; Frost, 1984; Mentis & Tainton, 1984). The
accumulation of litter reduces the availability and accessibility of suitable oviposition
sites for grasshopper species (Mushinsky &Gibson, 1991).
Secondly, the grasshopper richness and abundance may reflect changes in live grass
biomass, which is known to increase initially post fire (Evans, 1984, 1988a,b; Gandar,
1982b; Rowe-Rowe & Lowry, 1982). The continued absence of fire, promotes dead
grass biomass and a reduction of live grass biomass (Robinson et al., 1979).
Grasshoppers benefit from regular burning, as the crude protein calcium and
phosphate content are all higher in newly burnt grass in the growing season (Oliver et
al., 1978). Therefore the grasses at Wahroonga 1 (triennially burnt) and Wahroonga 2
(never burnt) are likely to be less nutritious and palatable than the regularly burnt
grasslands.
Thirdly, with the absence of fire and or mowing, average grass height increased at the
triennially burnt grassland. This was similar to the results found by (Chambers &
Samways, 1 998). As vegetation height increases and leaf litter accumulates, the
BIOTIC INDICATORS OF GRASSLAND CONDITION IN KWAZULU-NATAL WITH MANAGEMENT RECOMMENDATIONS,-
128
microclimate and particularly the temperature regime changes dramatically. The
ground surface temperatures do not get as high as in short grasslands and the grass
sward temperature is much slower to reach optimal temperatures. These two factors
affect various facets of grasshopper biology, namely, egg development, metabolic rate,
food consumption, digestibility and assimilation, adult life span and prey avoidance
(Uvarov, 1977, van Wingerden et al., 1991). These factors affect species that are
unable to thermoregulate in long grass, as well as thermophilous species and cause
them to be Iess abundant or even abandon the habitat.
Lamotte (1975) proposed that fire-induced habitat changes were important in
determining insect composition. Post fire environments would favour species that
prefer sunny, xeric and grass dominated systems. Species that show this tendency will
be able to colonize these grasslands rapidly and take advantage of these conditions
(Bock & Bock, 19.91). Species that show different preferences requiring forb species to
feed on would decrease (Evans, 1984, 1988a) and are eliminated from the system, as
recently burned grasslands offer less niche diversity than previously unburnt
grasslands as well as forbaceous plant species being highly reduced through burning
(Porter & Redak, 1997).
In the United States, Porter and Redak (1996) found that species richness and
abundance declined as a result of fire. The mitigation for the stark contrast to the
results found in the United States was that in South Africa the grasslands were
predominantly indigenous grass species that have adapted to fire. Porter and Redak
(1996) showed that their grasslands were inundated with exotic grasses that did not
respond well to fire, and the grasshoppers utilised these grasses as their major food
source. After fire the exotic grasses were excluded and therefore so were many
species of grasshopper. The numbers of forbaceous plants are also decreased through
fire use. In the Porter and Redak (1997) study the dominant grasshopper species is a
forbivorous species; hence it declined after fire, due mainly to the lack of edible
vegetative matter. The opposite is true here with the dominant species being
graminicolous, which benefit from fire, because the grass quality improves through the
use of fire as it promotes regrowth and controls undesirable grass species. Chambers
and Samways (1998) found that burning reduced the species richness and abundance
when conducting their cafeteria experiments. These findings may be inappropriate in
BIOTIC INDICATORS OF GRASSLAND CONDITION IN KWAZULU·NATAL WITH MANAGEMENT RECOMMENDATIONS
129
assessing the responses of grasshoppers to fire, as the treatments were done in close
proximity, which does not mirror the situation at the landscape level and at the level of
this study.
The close proximity of these different treatments to one another allowed local
migrations of grasshoppers to areas that were best suited to the needs of the
grasshoppers at one particular time (Stebaev, 1970). Most insect species are vagile
and opportunistic (Panzer et al., 1995; Panzer & Schwartz, 1998; Panzer, 2002). At the
landscape level the scale of these migrations is much larger, and for many species
impossible. Many species sampled are flightless which prohibits large-scale migrations
(Green, 1998), or are very slow to recolonize as they are weak-flying arthropods, and
the fragmented nature of the landscape in which they live (Macdonald, 1989) prohibits
free movement. In many instances plantations surround the grasslands acting as
impenetrable barriers (Armstrong & van Hensbergen, 1996) to dispersal and migrations
by both vertebrates and invertebrates. This was substantiated when a neighbouring
Pinus sp. plantation at Goodhope 1 was sampled for grasshoppers, during the months
of February and March which recorded six and 22 individuals respectively, comprising
two species, compared with the neighbouring grasslands recording 188 and 466
individuals respectively, and representing 11 and 19 species respectively.
The size of the grassland and its distance from nearest neighbour are important, as
this will influence the recolonization of the burnt grassland by grasshopper species.
Recolonization is important as Gandar (1982a) showed that there is almost complete
destruction of the arboreal insect fauna of trees in African savanna. This was mirrored
at Karkloof 1 and 2 where there was total destruction of the grasshopper assemblage.
This means that recruitment from other populations as well as hatching play an
important role in the recolonization process. These results are well supported with what
happened at the two Karkloof sites, which were completely devoid of species post-fire.
Recolonization of Karkloof 1 was slow, firstly, due to the lack of close proximity source
populations, and secondly, the time of year as the system was dormant. No nymphs
were hatching and progression from the nymphal to adult life stage was taking place. In
addition, to the highly fragmented nature of the landscape surrounding these two
remnant grasslands was the size of the area burnt. The entire grassland patch was
burnt at a high intensity. This can be deduced from the large fuel load (high number of
BIOTIC INDICATORS OF GRASSLAND CONDITION IN KWAZULU-NATAL WITH MANAGEMENT RECOMMENDATIONS

130
invasive forbaceous plants), the grassland is not utilised for grazing and was burnt in
winter prior to any rain that may have reduced the temperature of the fire (Tainton,
1984c). If the grassland had only been partly burnt, recolonization would have been
more rapid. At Unwood only half the grassland was burnt facilitating rapid
recolonization, due to the proximity of a source population.
2. Species responses to burning
Fire seemed to increase the abundance and determine the presence of certain
species, namely, Eremidium basuto. Where management excluded fire this species
was absent from the grasshopper assemblage. Armstrong (Pers. Comm.) believes that
this species' hatching may be triggered by fire. Panzer and Schwartz (1998) present
observations of particular species or sites as corroboration that insects specialized to
live in open habitats asserted to be fire-dependent would likewise be fire-adapted,
which concurs with what happens for E. basuto and Acorypha nigrovariegata tibialis
that are only present at sites which are recently and regularly burnt.
Three endemic species (Dirshia abbreviata, Qachasia fastigiata and Whitea alticeps)
were recorded in their highest abundances at Wahroonga 2, indicating that even
though fire is an integral part of grassland functioning (Acocks, 1988), certain species,
in particular flightless endemics, tended to benefit in situations where the grassland
was not burnt, as fire appeared to suppress their abundance. All three species are
flightless and could not escape the effects of fire. By not burning the grassland these
species were able to take advantage of favourable conditions and record elevated
abundances. It can be concluded that to increase grasshopper abundances,
particularly fl ightless endemics, the frequency of fire needs to be reduced or a different
form of landscape management needs to be implemented. Swengel (1996) proposed
that large tracts of grassland should not be burnt all at one time. In preference
managers should burn small patches to forma mosaic effect within the grassland of
burnt and unburnt areas. This will benefit both the fire dependent species, and the
species that are restricted by their lack of mobility.
.Blonc INDICATORS OF GRASSLAND CONDlnON IN KWAZULU·NATAL WITH MANAGEMENT RECoMMENDAnONS

131
3. Season of burning
The time at which the grassland is burnt is important in determining the grass
composition as well as the grasshopper assemblage. In the past grasslands were burnt
during the winter period of June and July. Burning at this time has detrimental effects
on the growth of grasses as they draw heavily on their reserves and when spring and
the first rains arrive the vigour of the plant is highly reduced (Hardy, 1999). Burning
during this period also reduces the amount of mulch (dead organic matter), which
covers the ground and helps with rainwater infiltration into the soil. The survival of
grasshoppers after burning depends to a large extent on the response of the
vegetation. The regrowth of vegetation is dependent on the season of burning, the
method of burning (head burn or back burn) and the suitability of the conditions
(Tainton, 1984b; Tainton & Mentis, 1984; Trollope, 1984a). Research has shown that
the ideal time to burn, for grass productivity, is early spring after the first 'good rains'
(15mm in 24 hours) (Scott, 1955; Tainton, 1984b; Hardy, 1999). Burning at this time of
year ensures that the soil surface is exposed to insolation for a minimum period, with
runoff and erosion reduced to a minimum (Scott, 1955). 78% of the sites are burnt after
the first spring rains, usually between the first and last week of September. Two sites
(Karkloof 1 and 2) are burnt in June. The purpose being to prevent the spread of
Curry's Post Weed Phymaspermum acerosum at Karkloof 1. June burning prevents
seeds from germinating and reduces the recruitment rate of young plants and damages
the mature individuals (Pers. Comm. D. MacFarlane). The control of P. acerosum is
important, because if left it will dominate the grassland, resulting in a complete shift in
the grasshopper species assemblage. The negative impact of winter burning results in
grasshoppers being exposed to frost, with the reduced grass cover accentuating the
thermal influences (Phillips, 1930; Samways, 1990) with similar findings for spiders
(Riechert & Reeder, 1970). In this stUdy Karkloof 1 and 2 recorded no individuals,
which support the findings of Samways (1990), which showed that species with no
refuge suffered 100% mortality. Four species (Anthermus granosus, Faureia milanjica,
Phaeocatantops sulphurius and Rhaphotittha cephalica) are significantly affected by
the time at which sites are burnt, showing significantly elevated abundances when
burning is undertaken in July or left unburnt. This could be related to the time of
hatching (F. milanjica and R. cephalica) and the ability of the species to escape the
effects of fire (Anthermus granosus and Phaeocatantops sulphurius). Reciprocally,
BIOTIC INDICATORS OF GRASSLAND CONDITION IN KWAZULU·NATAL WITH MANAGEMENT RECOMMENDATIONS
132
Crucinotacris cruciata appears to be negatively affected by winter burning with its
abundance reduced.
Spring burning on the other hand is advantageous to a certain suite of grasshoppers as
many species are over-wintering (in the southern hemisphere) as eggs, resulting in
many species being unaffected by fire. The survival of over-wintering adults and
nymphs is dependent on the ability of the species to find enough food and shelter.
Daubenmire (1968) showed that grasslands, which are burnt show superior regrowth
when compared to grasslands that are unburnt. By burning at this time allow nymphs to
hatch and not be decimated by fires later in the season as well as take advantage of
the spring regrowth.
Winter and spring burns both have impacts on species abundance and richness. It is
important therefore to take cognizance of this and develop a system where grasslands
are not burnt at the same time each year. Burning consistently at the same time each
year may favour certain species or communities at the expense of others (Duffey et al.,
1974; Mentis et al., 1974; Krugeret al., 1984; Tainton and Mentis, 1984; Gibson and
Hulbert, 1987; Porter & Redak, 1996 and Chambers & Samways, 1998). Grasshopper
species that are univoltine are more affected than bivoltine species (Swengel, 2001);
as the time of burn may coincide with hatching therefore decimating the population. If
this is undertaken on a continuous basis it may cause the species to be extirpated, as
landscape fragmentation is taking place at such a large scale across the KwaZulu
Natal midlands, that source populations and the chance of recolonization is being
reduced exponentially. Species with asynchronized breeding cycles or multivoltine
species wi 11 be less affected (Swengel, 1996; Panzer, 2002). This was clearly
illustrated here with certain species absent from grasslands burnt in July. In turn,
certain species were only to be found in spring burnt grasslands. It is important for us
to heed the conclusions drawn by (Daubenmire, 1968) that "in nearly every influence of
burning, the time of year, or even the time of day, when the fire occurs is almost as
important as the occurrence of fire itself.
BIOTIC INDICATORS OF GRASSLAND CONDITION IN KWAZULU·NATAL WITH MANAGEMENT RECOMMENDATIONS
133
4. Mowing
Mowing is not feasible throughout African savannas as only small proportions are
conducive to mowing (Scott, 1970). In the KwaZulu-Natal Midlands mowing is not a
very common form of grassland defoliation, due to the problems of access and in many
cases extremely steep gradients that machinery are unable to operate on. Mowing has
similar affects to burning in that it removes a large amount of dry matter from the
grassland. Mowing is an advantageous practice, particularly in aiding species
composition change of grassland. It has been well documented (Fynn et al., 2005) that
mowing promotes Themeda triandra, which is a desirable grass species as it has an
exceptionally high crude protein percentage in comparison with other grass species
naturally occurring in the KwaZulu-Natal Midlands (Bothma et al., 2002). However, it
does not have the benefits of burning as it does not control undesirable plant species,
and often leaves a thick layer of dry vegetation that becomes matted reducing the
number of bare ground patches utilised by grasshoppers for oviP?sition and basking.
Chambers (1992) and Prendini et al., (1996)found that annual mowing had a negative
influence on the species richness of the grasshopper assemblage, which was
substantiated by this study, however, their appeared to be no negative impact on the
grasshopper abundance.
Fire tends to open up the grassland, by burning at different intensities forming a natural
mosaic of grassed areas and patches of bare ground, which are utilised by
grasshoppers as oviposition sites and basking areas. For the more motile species of
grasshopper the type of defoliation is less important as they are able to migrate away
from areas that are potentially hazardous and unfavourable. The reverse is true of
flightless species that are unable to move rapidly and are often consumed by the fire
before being able to breed and oviposit. In areas, which are mowed, forbaceous
species like Helichrysum aureonitens are able to proliferate, due to their prostrate
growth form, which allows them to avoid mechanical damage from mowing, unlike the
more erect species with aerial meristems, which will be removed from the system.
Avoiding mechanical damage allows them to grow, covering larger areas, providing
greater habitat area for one species of grasshopper, Qachasia fastigiata. In addition, in
order for this species to proliferate mowing may be essential to prevent the surrounding
vegetation from growing up around it reducing its access to light, in turn affecting its
BIOTIC INDICATORS OF GRASSLAND CONDITION IN KWAZULU-NATAL WITH MANAGEMENT RECOMMENDATIONS

134
vigour (Fynn et al., 2005). The season during which the grassland was mowed
appeared to have an influence as H. aureonitens. This species flowers from July to
February, avoiding any damage to its reproductive organs. At other sites it is regularly
exposed to fire during flowering, reducing the amount of seed available for recruitment.
Coupled with this is that at burnt sites, competition is greater due to the time periods
between burns. The highest abundance of Q. fastigiata was recorded at the mowed
site (Wahroonga 2), indicating that fire plays an indirect role in determining the
grasshopper's presence as it appeared at other burnt sites. A combination of fire and
competition from more erect grass and forb species suppresses the growth of
Helichrysum aureonitens, which in turn appears to determine the abundance of Q.
fastigiata.
Butterflies appeared to prefer fires to be excluded, as they are more prevalent at
Wahroonga 2 and Wahroonga 1, which were mowed or burnt triennially respectively as
opposed to biennial or annual burning, which was the management regime employed
at the remainder of the sites. Burning impacts flowering plants abundance and
presence/absence. Regular burning removes certain plant species, whilst promoting
others. Many butterfly species have evolved 'hand in hand' with their larval host plant
or food plant, loss of the host plant results in the loss of the butterfly species, which rely
on that specific plant, thus reducing overall species richness.
Mowing does reduce the abundance of grasshopper species, but the recoveries of
species abundance is rapid as many species move away from the immediate
disturbance through sensing vibrations (Chambers, 1992) and later return to recolonize
the area or make use of it. This was shown by the very small change in grasshopper
densities, pre- and post mowing. Bulan & Barrett (1971) recorded similar findings with
arthropod biomass recovering to pre-mowing levels within two weeks.
Through the creation of a homogeneous grass sward by regular mowing in late
summer, has caused a decline in grasshopper species composition, by creating
unsuitable habitat for late successional grasshoppers, namely, Lentula minuta and
Lentula obtusifrons which require tall, complex environmental architecture or specific
food plants that do not grow well under these modified conditions. Chambers (1992)
showed that late season mowing (Le. May as occurring in this study) exposes many
Blonc INDICATORS OF GRASSLAND CONDITION IN KWAZULU-NATAL WITH MANAGEMENT RECOMMENDATIONS
135
over winteri ng adults or nymphs to the more severe winter environmental conditions,
thus having a negative impact on species abundance. In this study however, I would
tentatively disagree with these findings as species richness declined appreciably during
winter at all sites, with a very distinct and depauperate grasshopper assemblage being
representative of the winter period.
Wahroonga 2 as with Coleford and Himeville sites showed high proportions of
Crucinotacris cruciata and lower grass species diversity. Mowing simulates grazing and
due to its uniform nature of defoliation leads to the simplification of the grass sward,
with one species Themeda triandra being favoured (Fynn et al., 2005). A late season
mow can create a nutritious green flush that will favour C. cruciata in particular,
improving the successful progression through the larval instars to adulthood.
Mowing played an important role in the species richness of butterflies and especially
endemic butterflies. Wettstien and Schmid (1999) found that in Swiss montane
wetlands, mowing supports a higher species richness than grazing, which agreed with
this study, where mown sites were richer than a combination of fire and grazing. In
grasslands that are frequently burnt reductions in larval abundances frequently occur,
which is not mirrored in mown areas (McCabe, 1981; Swengel, 1995). In addition, to
the direct mortality as a result of fire, many plants will not fruit or flower for the year
preceding the fire, resulting in a reduction of biotope availability (Wright & Samways,
1998). The species that tend to be lost through the simplification of the butterfly
assemblage as a result of fire are the grassland species and specialists. Haysom and
Coulson (1998) showed a similar trend with uncommon moths increasing with an
equivalent increase in time since last burning. Greater species diversity at mowed sites
is as a result of greater larval recruitment with more larvae surviving the impacts of
mowing than fire. Having said this however, the time of mowing needs to be carefully
considered. Mowing during the middle of summer or in early summer reduces the
number of feeding and breeding sites for invertebrates, when they would be actively
searching out these vital resources (Kirby, 1992; Erhardt, 1995; Feber et al., 1996;
Baines et al., 1998). Mowing at the end of summer (i.e. late May) is the most beneficial
as most larvae will be in the process of over-wintering, reducing their movements and
their need for host plants and nectar. In this instance the time at which this
management tool is used will favour both the butterfly and grasshopper assemblage,
BIOTIC INDICATORS OF GRASSLAND CONDITION IN KWAlULU·NATAL WITH MANAGEMENT RECOMMENDATIONS
136
as disturbance is taking place at the end of the season, reducing potential mortality and
exposure to detrimental conditions.
5.5.Sampling period, grasshopper richness and abundance
It is noticeable from the results that there is a definite shift in species assemblage
through the period of one year. This change can be ascribed to a number of criteria,
namely, temperature variation, food availability and competition. During the winter
period, the number of species is highly reduced, indicating that these three criteria
have a predictive ability in determining the grasshopper assemblage. In the summer
period, the high grasshopper abundance in grasslands are predominantly due to two
species Conocephalus sp. and Orthochtha dasycnemis. These species are present
throughout the warmer wetter part of the year, when the grass is greener and there is
greater food availability. Many authors have postulated that grasshoppers are not
restricted by their food preference to certain habitats, but rather by their resemblance
(camouflage) to the vegetation within the habitat (Fogden & Fogden, 1974, Gandar,
1983; Gebeyehu & Samways, 2003). Both Conocephalus sp. and O. dasycnemis are
green in colour closely resembling the surrounding vegetation. Moreover, O.
dasycnemis appears to align itself along the long axis of grass blades, further
camouflaging itself, providing greater protection against predators (Belovsky & Slade,
1993; Vitt et al., 2000). Chambers (1992) showed that species such as Lentula
obtusifrons, predominantly green in colour, occurs only in long grass. Species that are
brown in colour tend towards areas that are a mixture of short grass and bare ground,
which was mirrored in this study.
In the winter period, the dominant grasshopper species is Crucinotacris cruciafa, which
also shows similar behaviour to O. dasycnemis in its alignment along the long axis of
the grass blades. This species is well adapted to surviving in the drier, colder period of
the year; showing very similar colouration to its surroundings. However, certain
individuals that were captured during the wetter, greener part of the year were less
brown and had obvious patches of green on their bodies. This suggests that
grasshopper species are able to change their colour through responses to
environmental factors, which are influencing them through their developmental stages
(instars) (Ibrahim, 2001; Sword, 2002). The switch from the summer species to the
BIOTIC INDICATORS OF GRASSLAND CONDITION IN KWAZULU·NATAL WITH MANAGEMENT RECOMMENDATIONS

137
winter species demonstrates the different requirements of the grasshopper
assemblage sampled. C. cruciata is found throughout the year, but its numbers are
kept low in summer, presumably by competition from larger bodied species such as O.
dasycnemis, which through better camouflage (overall green colour) are potentially
less exposed to predation pressure from birds and lizards (Belovsky & Slade, 1993).
5.6. Dominance of certain species
Two different suites of species, according to the sampling season, dominate the
KwaZulu-Natal Midlands grasslands. Seventy percent of the recorded abundance is
comprised of three species, two occurring exclusively in summer and one that occurs
predominantly dUring winter. In the United States of America, grasslands appear to
show a similar trait with one or two species dominating the grasshopper assemblage
(Fielding & Brusven, 1993; Onsager, 1993; Porter & Redak, 1996), namely,
Melanoplus sanguinipes. Gebeyehu and Samways (2002) showed a similar finding in
the arid Karoo environment of South Africa with one species dominating the
assemblage. In this study, the dominant species was Crucinotacris cruciata, even
though its numbers are highly reduced during summer. The high occurrence of C.
cruciata (49% of total abundance) implies that it is the consummate generalist, with its
only preference being for short and open grassland. It is a eurytopic species with little
or no host-specificity, allowing it to take advantage of any conditions, namely
conditions that are less desirable for other species of grasshopper.
5.7. Significance of elevated grasshopper abundance
Grasshoppers, being the predominant herbivores in grassland ecosystems, play a
crucial role in ecosystem processes. Notably, they convert plants to nutrient rich frass.
However, so do livestock and wildlife. The fundamental difference being in the size,
which allows the more finely divided insect frass, to become available to plants more
rapidly, than livestock or wildlife dung. Grasshopper frass is a vehicle for rapid
recycling of nutrients (Belovsky, 2000), and with an elevation in their abundance, an
escalation would occur in nutrient turnover. Boshoff (1988) postulated that
grasshoppers will play an essential role in the long-term stability and optimal
functioning of the Karoo. The Karoo differs greatly to the KwaZulu-Natal Midlands, but
Blonc INDICATORS OF GRASSLAND CONDmON IN KWAZULU-NATAl WITH MANAGEMENT RECOMMENDATIONS
138
the principal ecosystem engineers, grasshoppers, fulfill the same role of nutrient
recycling in both systems.
As shown in this study, while grasshopper distribution and abundance patterns are
principally governed by patch heterogeneity, amongst other factors, grasshoppers play
a significant role in the regUlation of ecosystem processes and as engineers creating
landscape patterns.
alonc INDICATORS OF GRASSLAND CONDITION IN KWAZULU-NATAlWITH MANAGEMENT RECOMMENDAnONS

139
CHAPTER 6
CONSERVATION BIOLOGY AND ECOLOGICAL
ASSESSMENT
Conservation biology, being a young and vigorous science, is undergoing considerable
methodological change. In an era of increasing conservation needs and tightening
budgets, an increasing demand is that the scope of conservation management must be
expanded to achieve economies of scale and efficiency (Simberloff, 1998). The first
premise of landscape management is the maintenance of as much quality, natural,
near pristine land as possible. This however is not possible with mans ever-increasing
appetite for land, and his desire to manage and control the environment in which he
lives. The goals of conservation management are proposed at 'maintaining biodiversity
at current levels' (IUCN, 1991). This is biologically and practically unrealistic, as
inevitably there are going to be more extinctions before a leveling out occurs. It is
therefore of paramount importance that a method needs to be developed that will
protect the natural areas that are left. At present the maintenance of every "cog and
wheel"; the so-called art of intelligent tinkering (Leopold, 1953) is the most important
facet of biodiversity conservation. The rivet-popper hypothesis, proposed by Anne and
Paul Ehrlich, is in agreement with the art of intelligent tinkering, with all species playing
a small and significant role within an ecosystem (Baskin, 1994). The pursuance of this
thought process has been questioned by Walker (1992), stating that it is unwise to
place equal significance on each species, as certain species are superfluous, and only
a few key species are the 'drivers' maintaining the ecosystem. Many species are
becoming extinct, both through direct impacts, and, more pervasively, through changes
in ecosystem functioning, often because of mUltiple stressors, or synergistic effects
(Samways, 2005). It is therefore imperative that answers need to be found to suppress
such rapid loss of diversity and be able to maintain functioning ecosystems.
For insects, and much other biodiversity, the 'coarse filter' landscape approach is a
critical approach for biodiversity conservation, where a manager normally has to
consider a range of species, and their responses to different management and
BIOTIC INDICATORS OF GRASSLAND CONDITION IN KWAZULU·NATAL WITH MANAGEMENT RECOMMENDATIONS

140
environmental changes. This has been emphasized by Collinge et al. (2003) who
showed that grassland type was the primary determinant of species richness of
grassland butterflies in Colorado, USA, and that habitat quality was a secondary factor.
In the case of prairie butterflies, living in indigenous remnants, 40% depend entirely on
habitats unmodified by humans (Panzer et al., 1995). The coarse-filter approach at
present appears to be the most realistic approach, especially bearing in mind that less
than 1% of the 10 million or so species have scientific names. The disadvantage of the
'coarse filter' approach is that it is blind to the way in which the immensely complex
contents are being conserved (Haslett, 2001) and what each insect species, each
evolutionarily significant unit and each insect polymorphism needs under all
environmental conditions to survive. This is illustrated by the various movement
patterns in a butterfly assemblage at anyone point. Each species, although
seemingly, simply flying by, is reacting sensitively to the various landscape
vegetationaI structures (Wood & Samways, 1991). This serves to illustrate that
conservation of insect diversity encompasses a vast complexity of interactions that in
themselves vary over space and time. Against this background, the landscape may be
considered as a continuously varying differential filter (Ingham& Samways, 1996), and
try as we may, it cannot always be managed to provide optimal conditions for all
species all of the time. This argues strongly for the conservation of larger spatial scales
(Le. landscapes and larger) such that all aspects of an insect's behaviour, and all types
of insects can be facilitated. Nevertheless, conserving black boxes (Le. whole
landscapes with high connectivity, high ecological integrity and minimal human
disturbance) is one answer in view of the magnitUde of the biodiversity crisis and the
shortage of time to conserve it.
By making use of the black box method of conservation enables the preservation of
unknown species, this is particularly true of members of the invertebrate groups that
have been marginalized due to their small size, even though they are the most highly
adapted and rapidly lost species in the animal kingdom.
This however, is not to condemn the role of behaviour and the need for special, single
species, 'fine-filter' studies in special circumstances, especially when compiling the
Red List (Hilton-Taylor, 2000). Single species management is dependent on
knowledge of the habitat requirements of particular species, which may include some
BIOTIC INDI.CATORS OF GRASSLAND CONDITION IN KWAZULU·NATAL WITH MANAGEMENT RECOMMENDATIONS'
141
disturbance, such as maintaining short and open grassland for the threatened Iycaenid
Aloeides dentatis dentatis in South Africa (Deutschlander & Bredenkamp, 1999) and
maintaining large south facing slopes with dense stands of tall grass and the required
host and feeding plants for Orachrysops ariadne.
A single definition of ecosystem management is not forthcoming with the word being
differentially interpreted by the various parties that use it. Virtually all definitions of
ecosystem management, focus on ecological processes rather than individual species
(Meffe & Carroll, 1994). It is important to establish that the processes per se are not
the valued entity, but the processes are believed to maintain the balance between the
species and within the communities (Franklin, 1993).
6.1. Flagships, umbrella and keystone species
There is limited value attached to umbrella or flagship species, and they must be used
with caution (Andelman & Fagan, 2000).
Flagship species such as the Richmond Birdwing Butterfly Ornithoptera richmondia
(Horwitz et al., 1999) and the Wart-biter Bush Cricket Decticus verrucivorus (Pearce
Kelly et al., 1998) are usually physically large members of taxa that attract attention
and garner sympathy. They are sometimes chosen on the basis of their dWindling
population size or threat status (Dourojeanni, 1990). Their value for biodiversity
conservation lies not so much in their ecological role but in their ability to perform
strategic socio-economic roles (Walpole & Leader-Williams, 2002). For example, they
attract public visitors to reserves, and in doing so, raise funds and local support for
conservation thereby helping conserve wider biodiversity. Butterflies, such as
Swallowtails (Coli ins & Morris, 1985) fulfill these roles among insects, with a reserve
and site gUide developed for viewing these taxa in Britain (Hill & Twist, 1998).
Many conservationists and managers hope that with the conservation of these species,
a top-down effect will occur, in as much as they conserve other species and
assemblages that overlap with their habitat requirements. However, this does not
appear to be the case, with past conservation practices in South Africa having been
blinded by pUblic influence and attention, with most conserved areas having a flagship
BIOTIC INDICATORS OF GRASSLAND CONDITION IN KWAZULU·NATAL WITH'MANAGEMENT RECOMMENDATIONS
142
species as their custodian. A classic example is the acquisition and protection of large
tracts of savanna for the conservation of the White Ceratotherium simum and Black
Rhinoceros Diceros bicornis. These large tracts of land do not incorporate diverse and
heterogeneous units at the landscape level, rather creating a large homogenous area,
with the various landscape attributes being repeated countless times across the
landscape. Thus, many unique areas have been sacrificed due to the single-minded
preservation of the two species of Rhinoceros, with poor management now threatening
their future, as the encroaching alien invasive Chromolena odorata (Triffid Weed)
envelops more of the savanna each year, rendering these areas depauperate in
biodiversity, non-productive and not fulfilling the goals of future conservation
requirements.
Umbrella .species themselves have been poorly defined, have been unproved in
practice and may detract from wider ecosystem conservation priorities (Simberloff,
1998). An umbrella species is a 'protective umbrella' employed where the
conservation goal is to protect a habitat or community of species in a particular area or
type of habitat (Caro & Doherty, 1999). Usually it is a large species, often a mammal.
Although such umbrella species have been widely advocated, there is virtually no proof
of their value for over-arching biodiversity in general. Furthermore, the concern is that
such an umbrella may be highly vulnerable itself, with its protective umbrella value
being patchy and susceptible to dwindling. The term umbrella species seems therefore
to have little currency; this is reflected in the protection of the Northern Spotted Owl
(Strix occidentalis) , whose habitat is artificially improved, to increase numbers of this
species. By managing for this species, it is unable to indicate the 'health' of the system
(Wilcove 1993; Tilman & Downing, 1994) it inhabits and thus its value as an umbrella
species becomes redundant (Simberloff, 1987). However, the face of conservation is
changing with a shift in thought processes to look for other avenues that will have
greater returns in terms of biodiversity conservation than simple single-species
conservation efforts. It is therefore imperative that conservation practitioners move
beyond the flagship and umbrella species concepts, as they tend to make brash
generalizations as to the richness of biodiversity within their spheres of influence.
However they are fundamental in conservation as they provide a tangible example of
conservation and continue to garner sympathy and crucial financial support for
conservation from non-associated bodies and the population in general.
BIOTIC INDICATORS OF GRASSLAND CONDITION IN KWAZULU·NATAl WITH MANAGEMENT RECOMMENDATIONS

143
There are many systems, which are highly threatened, and receive no acclaim, as they
have no poster child to represent them. Many systems with high potential conservation
status, 'hotspots', have been lost through funds not being made available for their
procurement, as well as too little research having been done to realize their potential
importance as ecosystems. A South African example is Braamhoek. This unique
escarpment wetland area situated on the border between KwaZulu-Natal and the Free
State is extremely valuable to conservation efforts due to its size and pristine nature
(Pers. Comm. D. Kotze). It is also a 'hotspot' for a large number of very rare and
endemic birds (Pers. Comm. B. Taylor). This area has now been demarcated to
receive a pump station for the generation of electricity. This will have dire
consequences on the local avian community that utilises the wetland exclusively (Pers.
Comm. B. Taylor). The effective loss of the wetland and surrounding grasslands will be
compounded. With a loss of the birding 'hotspot' will come increased financial pressure
on low-income communities that rely on 'twitchers' for their income. The resultant loss
of income will create the need for the local communities to pursue other avenues of
income generation and may lead to further degradation of the habitat that surrounds
Braamhoek.
Many supposed umbrella/flagship species play no major role in ecosystem functioning
and without them the ecosystem would still function, Le. they are not keystone species
(Simberloff, 1998). Keystone species is another term that is loosely applied. A
keystone species could be considered as one whose impact on its community or
ecosystem is disproportionately large due to its relative abundance (Power et al.,
1996). This concept however, has been criticized as it threatens to erode the utility of
the keystone concept (Hunter, 200Gb). Paine's (1969) original idea was that the
species composition and physical appearance of an ecosystem are greatly modified by
the activities of a single indigenous species high in the food web. Such a keystone
species influences community structure and ecological integrity, with persistence
through time. Mills et al. (1993) have pointed out that the term keystone has since been
applied to a plethora of species, at different levels in food webs, and with very different
effects, both qualitative and quantitative, in their communities. In terms of conservation,
it is not so much the keystone species per se that is significant but its keystone role
(Mills et al., 1993). This returns us to the need for maintaining interactions as
- BIOTIC INDICATORS OF GRASSLAND CONDITION IN KWAZULU·NATAL WITH MANAGEMENT RECOMMENDATIONS

144
advocated by many authors rather than the species as a single entity. Interaction
strengths between species is a much more compelling concept than keystone species
concept, and therefore more likely to be utilised. However, De Maynadier and Hunter
(1994), argue that the term is beneficial as it helps to rally public understanding and
protection for a system. If we are to utilise the keystone concept in practical
conservation we need to understand the underlying implications in order for it to realize
its potential.
6.2. Ecosystem management
The dilemma starts here. How do we manage ecosystems? Does one management
tool encom pass all facets of grassland management, the answer is no. Using one
management system for the good of a specific taxa or species may prove detrimental
to other taxa that are also corner stones of ecosystem functioning (Morris 1981a;
Committee on Scientific Issues in the Endangered Species Act [CSIESA, 1995]). For
example, the Ash Meadows (Las Vegas, U.S.A) naucorid Ambrysus amargosusl is the
only aquatic insect protected under the Endangered Species Act in the United States of
America, and its population is still declining because of habitat alteration to favour the
Devil's Hole pupfish Cyprinodon diabolus (Polhemus, 1993). In this study too, there is
an example of one management practice-favouring the butterfly assemblage over the
grasshopper assemblage. Wahroonga 2 recorded the highest butterfly diversity, but the
poorest grasshopper diversity. Having said this,however, the management regime
utilised favoured certain flightless endemic grasshopper species but not species that
reqUire fire to trigger hatching or provide ash, an essential element of their diet.
Structurally the grassland became more homogeneous through mowing, reducing the
variability of microhabitats required by certain later successional grasshopper species.
Mowing over a long period and in consecutive years has simplified the grass species
composition, further reducing microhabitat diversity. The elevated abundance of a
number of forbaceous plant species present indicated that they benefited from fire
exclusion. This would support the increased number of butterfly species found at the
site by creating a greater food reservoir for exploitation. Therefore a management
program and assessment needs to be developed that will look at a range of taxa within
BIOTIC INDICATORS OF GRASSLAND CONDITION IN KWAZULU-NATAL WITH MANAGEMENT RECOMMENDAnONS

145
the system and alter the strategies to best benefit the ecosystem as a whole and the
landowner, who requires the land to be productive.
The problem with managing ecosystems is that they are highly site specific i.e. one
grassland is not the same as another. Managers like to apply a single brushstroke to
grassland management. The mindset of managers therefore needs to be altered, from
a cellular view (e.g. Beef production) to a more holistic outlook (biological integrity
integrated with productivity). By improving the ecosystem as a unit will have far
reaching consequences, both in terms of ecological value and productivity.
The principles and goals of management first need to be established before any
success is achieved. There are three major facets to management. Firstly, the area
and time frame of management need to reflect landscape-scale patterns and
processes (Gutzwiller, 2002). Secondly, managing a landscape require goals that are
fluid to accommodate natural spatial and temporal variability, and the uncertainty and
surprise in outcomes that result from allowing ecological processes to take their course
(Christensen, 1997). Thirdly, and probably the most important issue is that the
management boundaries need too extend beyond administrative boundaries (Le. all
stakeholders need to 'buy' into the idea and manage areas co-operatively).
6.3. Rapid assessment
A rapid assessment technique will be able to provide the manager with the insight to
alter practices over time, thus benefiting a wider range of taxa and improving the
biological integrity of the ecosystem. The key facet of any management regime is that it
must be fluid not rigid. It needs to develop symbiotically with the system that it is
managing, responding to changes, especially in climate, the greatest threat facing
conservation practitioners at present.
Most rapid assessment techniques that result in a model being formulated and utilised
are in the aquatic context. Examples of these are available from a large variety of
countries, namely the United States of America (Stein & Ambrose, 1998; Costanza &
Mageau, 1999), Australia (Boulton, 1999), United Kingdom (Wright et al., 1984) and
South Africa (Chutter, 1994,1998; Dickens & Graham, 2002). These techniques have
BIOTIC INDICATORS 0' GRASSLAND CONDITION IN KWAZULU·NATAL WITH MANAGEMENT RECOMMENDATIONS

146
been well received and widely used, in assessing the quality of the water within a
stream or body of water. The main reason for these assessments being so
enthusiastically received is that they are fast and cost-effective. They do not measure
biodiversity at the species level, but rather relative abundance across taxa, which in
turn indicate environmental stress on the system. Thus they monitor ecological health
rather than finer aspects of ecological integrity (Resh & Jackson, 1993).
Why should a similar technique not be developed for use in grasslands, which will rate
grasslands in a linear scale from highly modified to pristine? A rapid assessment tool
will be able to predict how the system will change in response to management
practices.
When developing an assessment technique there are a number of important
determinants that need to be factored into the equation:
1. It must be cost-effective,
2. Is it an effective indicator of grassland quality,
3. Can non-specialists undertake it?
The grasslands of the KwaZulu-Natal Midlands are highly altered and c.ontinually
threatened by anthropogenic advancements and perturbations. A multi-taxic approach
is a more holistic approach to management, and will manage the ecosystem rather
than a single focal group or individual species. Many people may argue that a multi
taxic approach will not be cost effective and will require intensive sampling and various
sampling methods.
The taxa sampled were grass species, grasshoppers and butterflies. The first two
species primary producers and primary consumers respectively, with the butterflies
playing an important role in pollination in the KwaZulu-Natal Midlands (Field, 2002).
Sampling of the grasshoppers can be undertaken· at the same time as the butterflies
while walking 50 metre transects. The grasses can be sampled by randomly choosing
three hundred points within the grassland. This method has proved successful and
representative of the entire grassland (Everson et al., 1990).
BIOTIC INDICATORS OF GRASSLAND CONDITION IN KWAZULU-NATAL WITH MANAGEMENT RECOMMENDATIONS

147
A rapid assessment is a community characterization as opposed to a strict inventory
(Longino & Colwell, 1997). Community characterization uses structured sampling to
estimate the distribution of species abundance, community richness and
complementarity with other communities (Colwell & Coddington, 1994). The community
characterization aims at ranking habitats or parcels of land, or to assess them over
time. In contrast, a strict inventory aims to obtain an accurate species list (Longino &
Colwell, 1997). A strict inventory has merits when phylogenetic measures of
conservation value are considered (Raven & Wilson, 1992). The aim ofthis study was
to predict and monitor land management regimes as well as provide recommendations
on, which avenues to pursue for managing biodiversity overall.
Species richness alone does not tell us about the dominance of one species and the
rarity of another. This information is important as it provides a basis on how the
assemblage as a whole is responding to a certain management practice. The use of
species richness as a stand-alone index will not provide information on how the
community structure is changing over time. The presence of a certain species does not
substantiate the suitability of the management for a species, the presence of a large or
dense population does imply this (Swengel, 2001), and therefore assessing the
abundance of the individual indicator species is imperative. An example, from this
study is Crucinotacris cruciata, which is common to all sites, but in varying degrees of
abundance. The abundance of the species is determined by two variables, the time at
which the grassland is burnt and the intensity of the grazing pressure. A presence
absence study alone would not be able to furnish the manager with this information.
Grasslands in the KwaZulu-Natal Midlands are increasingly being fragmented, with
many areas only retaining the common species, as the more specialist interior species
are being lost because the size of the grassland fragments are unable to sustain them.
This therefore shifts the onus of importance from species richness to species
abundance in order to monitor the deleterious effects of anthropogenic influences,
through habitat fragmentation or poor management.
All grasslands in the KwaZulu-Natal Midlands are SUbjected to some form of
management and monitoring is required to assess the management regime imparted.
The most appropriate method of tackling the problem of monitoring is to use
community characterization. The objective of any assessment technique is to find
BIOTIC INDICATORS OF G.RASSLAND CONDITION IN KWAZULU-NATALWITH MANAGEMENT RECOMMENDATIONS
148
particular repeatable measures that accurately reflect the patterns in the underlying
ecological community. This approach has been exemplified by the work of Oliver and
Beattie (1996) who sought out ways to make assessment more efficient using
surrogate sets and recognizable taxonomic units (RTU's/morphospecies).
There has been much debate, especially related to aquatic systems, as to what
taxonomic level (either family or species level) is most suited for biological monitoring
(e.g. Guerold 2000; Lenat & Resh, 2001). The consensus is that, wherever possible
the sorting to species is better (Austin, 1999; Panzer, 2002; Bassett et al., 2004).
However this may not always be possible (Bailey et al., 2001) and when working at
broader geographic scales, using higher taxa appears to be better suited to the task.
In this study the sorting to species level was possible, as species diversity among the
three focal taxa was low in comparison to similar studies undertaken in more tropical
and hence more speciose areas. Basset et al (2004) have shown that studies based on
terrestrial arthropods, sampled as orders or guilds, distributed along disturbance
gradients and confined to small geographic areas only achieved a poor discrimination
of sites. With the increased resolution of the hierarchy (Le. the change from using
guilds to families) improved the indicator ability of the sampled invertebrates. In the
case of this study, species sampling, and the use of named species allowed for the
collection of absolute abundance, thus fine-tuning the focal taxa's ability to provide a
more holistic picture as to the dynamics and responses of the sampled assemblages
within the grasslands studied.
In this stUdy a surrogate sample set of grasshoppers has been teased out of the full
grasshopper sample set. These surrogate grasshopper species represent a range of
families, feeding guilds and respond either positively or negatively to vegetation and
management regimes. The grasshopper surrogate set chosen here answers the
question posed by Jones and Eggleton (2000) "How well does a sample of the target
taxon characterize the variation within its own group?"
Blonc INDICATORS OF GRASSLAND CONDITION IN KWAZULU-NATAL WITH MANAGEMENT RECOMMENDA~ONS

149
6.3.1. Surrogate choice
22 grasshopper species were chosen to fulfill the role of surrogate species for the
entire grasshopper assemblage. These species showed a significant correlation when
compared with the full sample set (Mantel's r = 0.90 and p= 0.001). In terms of
grasshopper abundance the Mantels test showed a stronger correlation between the
surrogate set of species and the full compliment that were recorded (Mantel's r = 0.99
and p = 0.001). These species represent a saving in time and cost of the assessment
technique. The surrogate species were chosen using six criteria:
1. The abundance of the species at each grassland patch,
2. The spatial distribution of the species across grassland patches,
3. Endemicity (six of the 22 species),
4. Specificity to certain habitat types,
5. Feeding guild representation
6. Response to management practices and disturbance.
1. Families
The species chosen were easily identifiable, common and belong to six families of
grasshopper. The Acrididae comprise 71% of the total species richness of these
grasslands. Fourteen of the 22 species (64%) belong to the Acrididae in the surrogate
species measure. Lentulidae were represented by four species, with the remaining four
families were represented by one species each.
2. Funcffonalgroups
The 22 species were representative of the different feeding guilds associated with
KwaZulu-Natal Midlands grasslands, representing all four feeding guilds, namely:
1. Forbivorous species,
2. Graminicolous species,
3. Grass eaters and
4. Ambivorous species.
BIOTIC INDICATORS OF GRASSLAND CONDITION IN KWAZULU-NATAL WITH MANAGEMENT RECOMMENDATIONS

150
The represe ntation of all the feeding guilds would prevent the surrogate set from being
one dimensional, in that it only represents grasshopper species that utilise grasses and
discounts the Forbivorous and Ambivorous species. These species were important as
many South African grasslands have substantial forbaceous plant contributions.
Forbaceous plants are an integral component of grasslands, adding to the structural
heterogeneity of the grasslands and there overall biodiversity (Baskin, 1994).
6.3.2. Choice of grasshopper species as indicators
A total of 33 species of grasshopper were statistically significant, and, indicative of
various environmental and management regimes at p< 0.05. Of these 33 species, only
22 species were utilised in the surrogates' matrix. The 22 species were the most
representative, abundant and environmentally responsive species of the entire
grasshopper assemblage. The reasons for the exclusion of 11 species are discussed
below.
Eight species of grasshopper were excluded as they were only encountered at 30% or
less of the sites sampled. The reasons for the exclusion of these species were that (a)
they may have been poorly sampled by the collection technique; or (b) they may have
been collected from marginal habitats (Novotny & Basset, 2000). When developing an
assessment tool, cognizance must be taken of two important variables that relate to the
grasshopper species. Species presence/absence across sites and the species
abundance at sites determine whether the species would fulfill the role of indicator
species, as assessment is about utilising repeatable measures.
In the case of Acorypha nigrovariegata tibialis it occurs at three of the ten sites. It had a
moderate abundance of 88 individuals. Having said this, its distribution across the sites.
was highly skewed, with 76% of individuals occurring at one of the three sites. It was
excluded on the grounds that when sampling for the rapid assessment model, it would
be unlikely that this species would be regularly encountered, therefore skewing the
results of the assessment model in the favour of sites where it was present.
Six species, Aneuryphymus montanus, Calliptamulus natalensis, Cannula gracilis,
Gryllidae, Gastrimargus determinatus vitripennis and Omithacris cyanae were omitted
Blonc INDICATORS OF GRASSLAND CONDITION IN KWAZULU·NATAL WITH MANAGEMENT RECOMMENDAnONS

151
because they were encountered at three or less sites and recorded abundance values
of less than 20 individuals across the sites at which they were encountered.
Heteropternis guttifera was excluded on the grounds that it was only found at 40% of
the sites and was recorded six times.
Oxya hyla hyla was excluded as it was only encountered at one site Goodhope 1. It
was abundant at this site, having recorded 134 individuals. It was indicative of the
wetland/grassland interface at this site, as it was only recorded at three transects that
traversed the edge of the wetland area. This was its preferred habitat with its modified
tibias for swimming.
Two species Gastrimargus drakensbergensis and Orthochtha rosacea were excluded,
as they were indicative of the same variables as other more abundant species, namely,
Crucinotacris cruciata and Orthochtha dasycnemis respectively.
Grasshopper species either responded positively or negatively to the variables tested.
The grasshopper responses were separated into three distinct sub-groups, which
represented the grasshopper species response to topography, vegetative
characteristics and management regimes.
1. Topography
In the case of topography, only one variable was tested with eight species being
indicative of slope aspect. Seven species were significant in terms of their orientation,
preferring the cooler southern slopes as opposed to the warmer northern, eastern and
western slopes. Three species, namely, Acorypha nigrovariegata tibialis, Oxya hyla
hyla and Aneuryphymus montanus were omitted due to low abundance and/or poor
distribution across sites. Two species Lentula minuta and L. obtusifrons showed a
strong association with poor veld condition as well as high forbaceous content at sites,
which tended to group together during Canonical Correspondence Analysis (CCA), as
high forbaceous content usually represented poor veld condition. It must be stated that
these two species were forbivorous species. South facing slopes in the South African
context, tend towards a higher forbaceous content, and if left unmanaged would, over
time, become natural forest fragments (Acocks, 1988). Bearing this in mind it could be
Blonc INDICATORS OF GRASSLAND CONDITION IN KWAZULU·NATAl WITH MANAGEMENT RECOMMENDAnONS
152
deduced that these two species are equally indicative of forb rich grasslands and a
southerly aspect.
2. Vegetative characteristics
Nine of the 21 species that were indicative of vegetative characteristics were only
indicative of one of the four categories. Five species (Acorypha nigrovariegata tibialis,
Gastrimargus drakensbergensis, Heteropternis guttifera, Orthochtha rosacea and Oxya
hyla hyla) were omitted for the reasons mentioned above. Seven of the remaining 16
species were indicative of the division between Highland Sourveld and Midlands
Mistbelt grasslands.
Two species were indicative of poor veld condition, Cyrtacanthacris aeruginosa and
Lentula minuta. Both of these species were forbivorous species and preferred sites
dominated by forbaceous plants. In general the higher the forb content the lower the
key and benchmark veld condition in these grassland patches. The validity of Lentula
minuta as an indicator of poor veld condition is questionable; as it merely indicates a
higher forb content, which only impacts on the grassland productivity in terms of
livestock utilisation. Cyrtacanthacris aeruginosa, on the other hand is predominantly
found in rank vegetation with long grass or in disturbed areas such as agriculture and
gardens (Picker, Griffiths & Weaving 2002), which would indicate a change in veld
condition for the worse, and validate its ability to indicate poor veld condition. This
could be stretched to encompass areas, disturbed by anthropogenic influences.
Ochrophlebia caffra was indicative of grasslands characterized by low forbaceous
content, short grass sward and good veld condition. In addition, this species was also
indicative of Highland Sourveld grasslands. Calliptimicus semiroseus was also
indicative of low forb content grasslands, which were in good condition, in terms of the
key grass species assessment. Eremidium basuto indicatedgrasslands with low forb
content, as well as preferring Highland Sourveld grasslands to Midlands Mistbelt
grasslands. This would be expected as this species is classified as a montane endemic
(Pers. Comm. Armstrong, 2004; Foord et al., 2002). Eyprepocnemis plorans showed
the reverse of E. basuto, indicating high forb content and a preference for Midlands
Mistbelt grasslands.
Blonc INDICATORS OF GRASSLAND CONDITION IN KWAZULU·NATAl WITH MANAGEMENT RECOMMENDAnONS
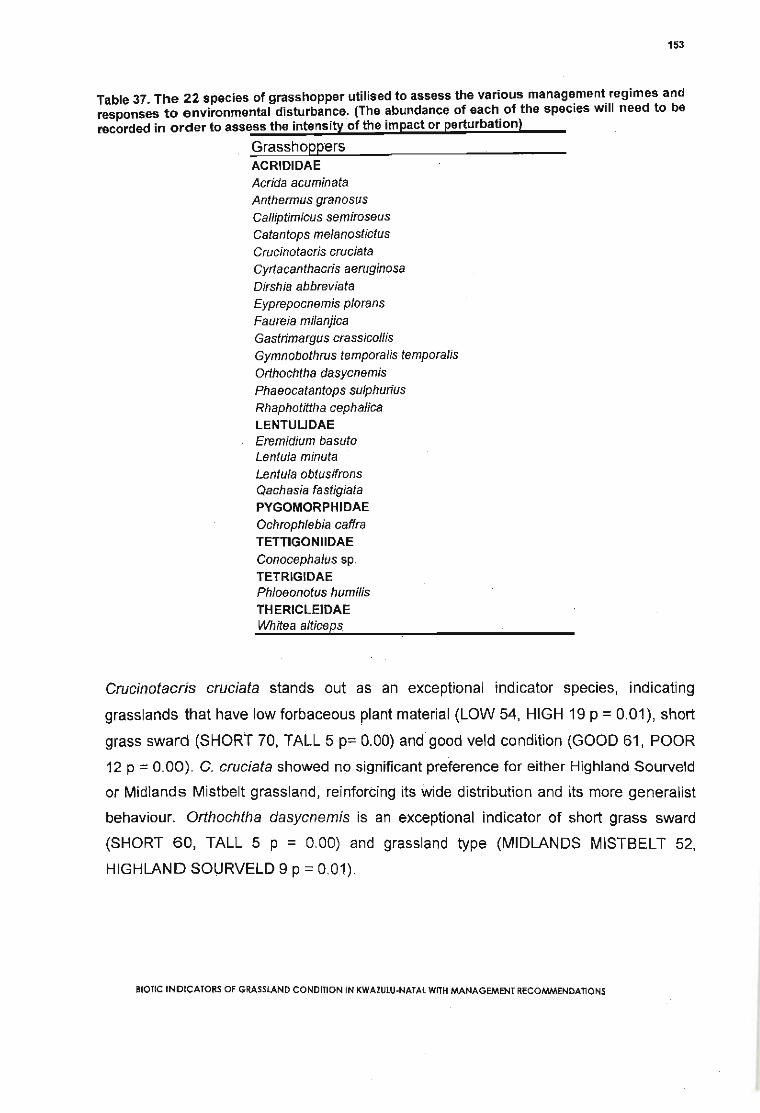
153
Table 37. The 22 species of grasshopper utilised to assess the various manag~ment.regimes andresponses to environmental disturbance. (The abundance of each. of the species will need to berecorded in order to assess the intensity of the impact or perturbation)
GrasshoppersACRIDlDAEAcrida acuminataAnthermus granosusCaJliptimicus semiroseusCatantops melanostictusCrucinotacris cruciataCyrtacanthacris aeruginosa
Dirshia abbreviataEyprepocnemis ploransFaureia milanjicaGastrimargus crassicoJlisGymnobothrus temporalis temporalis
Orthochtha dasycnemis
Phaeocatantops sulphuriusRhaphotMhacephalicaLENTULlDAEEremidium basutoLentula minuta
Lentula obtusifronsQachasia fastigiataPYGOMORPHIDAEOchrophlebia caffra
TETTIGONIIDAEConocephalus sp.TETRIGIDAEPhloeonotus humilisTHERICLEIDAEWhitea alticeps
Crucinotacris cruciata stands out as an exceptional indicator species, indicating
grasslands that have low forbaceous plant material (LOW 54, HIGH 19 P = 0.01), short
grass sward (SHORt 70, TALL 5 p= 0.00) and good veld condition (GOOD 61, POOR
12 P = 0.00). C. cruciata showed no significant preference for either Highland Sourveld
or Midlands Mistbelt grassland, reinforcing its wide distribution and its more generalist
behaviour. Orthochtha dasycnemis is an exceptional indicator of short grass sward
(SHORT 60, TALL 5 P = 0.00) and grassland type (MIDLANDS MISTBELT 52,
HIGHLAND SOURVELD 9 P = 0.01).
BIOTIC INDICATORS OF GRASSLAND CONDITION IN KWAZULU·NATAl WITH MANAGEMENT RECOMMENDATIONS
154
3. Indicators of management
Two species were indicative of three management categories. The species were
Acrida accuminata and Qachasia fastigiata. A. acuminata was indicative of grasslands
that were grazed, highly disturbed grasslands (Himeville and Stirling) and preferred
grasslands that were burnt during the springtime. Q. fastigiata, a flightless endemic,
preferred g rasslands that were not disturbed by grazing and not burnt or burnt
triennially. In this case, it could be assumed that this species preferred grasslands that
were not burnt as the highest abundance of this species was encountered at
Wahroonga 2.
Grazing
Only four species of grasshopper responded to grazing categories with two species
preferring grasslands that were not grazed, Catantops melanostictus and
ConocephaJus sp., with the other two species (Gymnobothrus temporalis temporalis
and Ochrophlebia caffra) preferring grazed grasslands. C. melanostictus and
ConocephaJus sp. preferred grasslands where the sward was dense and moisture was
retained during the heat of the day. G. temporalis temporalis preferred open areas with
patches of bare ground, as well as road verges, and grasslands that were burnt more
regularly, opening up the grass sward and creating more bare ground areas.
Season in which the grassland was burnt
Seven species were indicative of when grasslands were burnt. Six species preferred
the grasslands to be burnt during winter. From this we could tentatively conclude that
there was high nymph mortality from spring burning, which coincides with hatching,
leading to poor recruitment rate. Nymphs may not die as a direct result of the fire, but
may die from food shortage post fire, as the available resources have been significantly
reduced as well as exposure (Samways, 1990) and increased predation pressure
(Belovsky & Slade, 1993). However, in the case of Cyrtacanthacris aeruginosa it was
difficult to assume that this species was responding to the time at which the grasslands
were being burnt, as this species was most common at Karkloof 1. This species was
prevalent at Karkloof 1 not in response to the burning regime but rather due to the
nature of the vegetation at this site (Le. high forb content and rank grassland).
BIOTIC INDICATORS OF GRASSLAND CONDITION IN KWAZULU-NATAL WITH MANAGEMENT RECOMMENDATIONS

155
One species Acrida acuminata preferred the grasslands to be burnt in spring, as this
appeared to have no influence on its nymphs as the adults tended to be recorded later
in the season (January to May) demonstrating that hatching in this particular species
tended to occur only once regrowth was sufficient to preclude elevated levels of
predation and lack of food resources for growth and development of the nymphs.
Biennial burning versus other forms of defoliation
One species was indicative of biennial burning, Phloeonotus humilis. This species was
totally absent from sites that were not burnt Le. mowed (Wahroonga 2) or burnt
triennially Wahroonga 1. This species appeared to prefer grasslands that had a patchy
distribution of vegetation interspersed with areas, which were bare. Fire produces this
mosaic affect, with certain patches more prone to the vagaries of fire. This gave rise to
more structurally heterogeneous grassland. Mowed grassland, was very
homogeneous, due to the even nature of defoliation. The same can be said for the
triennially burnt grasslands. The triennially burnt grassland has a much greater fuel
load than grasslahds burnt biennially. This fuel load allows for much hotter fires, which
will burn more uniformly throughout the grassland, thus causing it to be more
homogeneous in terms of plant structure.
Four species, Dirshia abbreviata, Eyprepocnemis plorans, Qachasia fastigiata and
Whitea alticeps were indicative of alternative regimes Le. mowing and triennial burning.
Three of these species were flightless endemics and as mentioned earlier were more
prone to the effects of fire, as they were not able to escape the fire. The fourth species
E. plorans was most common at Wahroonga 1, a site with tall grass and a relatively
high forb content.
Disturbance
The first site, Himeville, was over-utilised by Blesbuck (Damaliscus dorcas phillips/)
and Black Wildebeest (Connochaetes gnou). The area, which these species were able
to utilise, was small c.a. 4Ha. The number of animal units was 25 animals, or 6.25
AU/Ha. (Pers. Comm. A. Armstrong) reinforced this observation, agreeing that this
area was over-utilised. The second site was Stirling, which was highly disturbed
BIOTIC INDICATORS OF GRASSLAND CONDITION IN KWAZULU·NATAL WITH MANAGEMENT RECOMMENDATIONS
156
through excessive grazing by cattle. This area was traversed by many cattle tracks,
with the cattle appearing to freely graze the area. This can only be assumed, but out of
12 visits to the site cattle were utilising this grassland on 11 occasions. Two species
responded to this high disturbance level, namely, Acrida accuminata and Calliptimicus
semiroseus. Orthochtha dasycnemis and Qachasia fastigiata preferred sites that were
not disturbed. Only 4% of individuals of O.dasycnemis were recorded at the two
disturbed sites. O. dasycnemis's absence or very low abundance points to this species
being a good indicator of disturbance (LOW 54, HIGH 4 P = 0.02). The study
undertaken by Gebeyehu and Samways (2003) reinforces this as they demonstrated
the same presence and absence across a gradient of disturbance.
The above mentioned species were indicative of various facets of grassland structure,
slope orientation and management regimes and will fulfill the role of surrogates for the
grasshopper assemblage, forming the basis for a rapid assessment technique. The
grasshoppers proved to be very useful as indicators of management practices and
environmental variables. Bearing this in mind, it could be postulated that grasshopper
species were the ideal taxon to study as they were abundant,showed significant
species richness differences across grassland sites and were easy to capture, identify
and sampli ng time would be highly reduced, which makes the sampling of
grasshoppers cost-effective as well as representative of the quality of grasslands.
Having said this, however, it would not be pertinent to utilise them as a stand-alone
measure, but in tandem with the grass species assemblage. Grasses and
grasshoppers together provide a metric for rapid assessment of the quality of
grasslands in the KwaZulu-Natal Midlands. While it is not claimed here that this finding
is definitive, it does provide a useful starting point for assessing grassland condition
and for making recommendations for grassland improvement. During such
improvement it is essential to monitor the grass and grasshopper assemblages and to
assess changes in assemblage composition. When conditions improve, not only will
there be a tendency towards increased species richness and greater proportion of rarer
specialist species but also an increase in general grasshopper abundance. Table 38
summarizes this metric.
BIOTIC IND/CAT.oRS OF GRASSLAND CONDITION IN KWAZULU·NATAL WITH MANAGEMENT RECOMMENDATIONS

Table 38. Grasses and grasshopper species characteristic of grasslands that fall into one of three categories, i.e. poor, moderate orexcellent. The grasses are sampled using a random three hundred point sampling technique. The grasshoppers are sampled by walking tenfifty metre transects through the grassland. The period in which sampling is undertaken is important because of the species richness anddistribution across the species. The best time to sample grasshoppers is in February and March (greatest species richness), with the bestsampling time for grasses being February, when inflorescences are present. It is important to note that this is not a definitive guide tograssland condition, but is based on the findings of this study and directs us towards certain conclusions
Grassland Status Characteristic grass species Characteristic grasshopper species Comments on abundance of grasses and grasshoppersPoor Condition
Alloteropsis semialata (a)
Aristida junciformis (b)Cymbopogon excavatus (c)
Eragrostis curvula (d)Miscanthus capensis (e)Sporobolus africanus (1)Sporobolus pyrimidalis (g)
Moderate ConditionHeteropogon contortus (h)Hyparrhenia hirta (I)Eragrostis racemosa (j)
Acrida acuminata (1)
Calliptimicus sem;roseus (2)Catantops melanostictus (3)Gymnobothrus temporalis temporalis (4)Ochrophlebia caffra (5)
Conocephalus sp. (6)
Crucinotacris cruciata (7)
All grass species increase in abundance as grassland condition
deteriorates, with (b, d, f, g) dominating the grasslandSpecies 4 traditionally increases in abundance as conditiondeteriorates in short gtass sward grasslands.Species 1, 3 and 5 usually increase in response to higher forbcontent and a taller grass sward in debilitated areas
The three grass species are more common and in certain instances,(i) will be the dominant species. The two grasshopper species arelow in abundance with less than 30 individuals per ten transects.
BIOTIC INDICATORS OF GRASSLAND CONDITION IN KWAZULU-NATAl WITH MANAGEMENT RECOMMENDATIONS157

158
6.3.3. Choice of butterfly species as indicators
The only significant compositional difference found was when comparing the season
when grasslands were burnt. This is important as it demonstrates the vulnerability of
butterfly species to burning at particular times during the year. Five butterfly species
were indicative of when the grasslands were burnt. Three species preferred the
grasslands to be burnt during the winter period, and one species in spring. All these
species were most abundant at Karkloof 2, a winter burned site. Three of these
species, Aloeides oreas, Orachrysops lacrimosa and Pseudonympha varii utilised
grassland patches exclusively with the other two species, Belenois aurota and Papilio
demodocus appeared to flyover the grasslands, and stop infrequently to utilise plant
species within the grassland patch.
Butterflies have been shown to be good indicators of biological integrity in many
studies, predominantly European studies, (examples Marshall & Haes, 1988; Thomas,
1991; Zchokke et al., 2000) and an American study (Swengel, 1996).
At present this taxa does not provide a true reflection of biological integrity, due to the
low abundances, low species richness and the nature of the species encountered in
this study. Similar results were obtained from the Fynbos with butterfly abundance to
low to provide insight into the processes that were impacting upon the Fynbos (Pers.
Comm. M.J. Samways). In many instances only a certain stage in the butterfly Iifecycle
would make use of the grassland. Most species were in fact not grassland specialists,
but generalists, utilising a range of habitats, from roadsides to the grassland/forest
interfaces.
BIOTIC INDICATORS OF GRASSLAND CONDITION IN KWAZULU·NATAL WITH MANAGEMENT RECOMMENDATIONS

159
CHAPTER 7
CONCLUSIONS & MANAGEMENT RECOMMENDATIONS
7.1. Conclusions
7. 1. 1. Responses to structural heterogeneity
The type of grass sward and the general characteristics exhibited by the grassland play
an important role in determining the grasshopper species assemblage. Grasshopper
species preferred more open, short grass swards, where they were able to access
areas of light and shade easily, thus regulating their body temperature. Tall dense
grass swards tend to prevent the formation of open bare areas that can be utilised as
basking sites, areas of aggregation and oViposition sites. Species of the Acrididae were
noticeably absent from these tall dense grasslands, with the converse true for
members of the Lentulidae, which preferred the taller, damper and more shaded
grasslands.
7.1.2. Responses to grazing
Livestock and wildlife grazing both have a deleterious affect on grasshopper species
richness, if intensively utilised.
Intensity levels need monitoring, as over-utilisation has resulted in a reduction in
species diversity, through excessive trampling and a resultant shift and simplification
(Van Wieren, 1998) in grass and plant species composition. It is therefore important
that correct stocking rates (SR) are adhered too, and at some sites, namely Stirling and
Himeville, the stocking rates need to be revised and reduced.
The best form ofgrazing for commercial returns is a rotational grazing system, which
regularly rests camps and creates heterogeneous landscape utilisation, thus benefiting
the grasshopper assemblage, as well as other invertebrate taxa (Swengel, 2001). The
wildlife grazed sites averaged the lowest species richness.
It is imperative wildlife grazing practices in the KwaZulu-Natal Midlands be reassessed
in order to reduce their impact on grasshopper assemblages, as most grassland
BIOTIC INDICATORS OF GRASSLAND CONDITION IN KWAZULU·NATAL WITH MANAGEMENT RECOMMENDATIONS
160
conservatio n areas are exposed to continuous large ungulate grazing, endangering
their role as conservation areas and threatening their status as hotspots and havens
for biodiversity. Conservation authorities need to shift their focus from large visible
ungulate conservation to the smaller, often more important drivers of grassland
ecosystems.
7. 1.3. Responses to fire
The most species diverse grasshopper assemblages were recorded at grasslands
exposed to some form of fire management. Where burning was utilised less frequently
(triennially), the species richness and abundance was markedly reduced, in response
to the development of unfavourable environmental conditions. At sites where fire was
completely excluded the lowest grasshopper diversity was recorded, but conversely the
highest butterfly diversity. Fire exclusion appeared to have a noticeable effect on the
abundance of individual species (Bei-Bienko, 1970; Chambers, 1992) with certain
brachypterous species showing elevated abundances.
The period in which the grasslands are exposed to fire has an impact on the species
assemblage, abundance and ability to recover. The burning of areas over many
seasons at the same time of year has had an influence in molding the species
assemblage. Burning after the first spring rains appears to be detrimental as many
species' hatching response is triggered by rainfall, and therefore the most vulnerable
period of their life history is exposed to fire and the synergistic effects as a result of fire.
Regular burning, Le. biennial burning is appearing to be impacting on the butterfly
assemblage, with a reduction in specialists and an increase in more generalist species
(e.g. Vanessa cardw). Where fire is excluded for longer periods butterfly richness is
markedly elevated.
7. 1.4. Responses to mowing
The mowing of grasslands creates a scenario where there is no successional
advancement, and so places restrictions on the suite of grasshoppers that will be
encountered. Mowing also tends to influence the richness of grass species that will
BIOTIC INDICATORS OF GRASSLAND CONDITION IN KWAZULU-NATAl WITH MANAGEMENT RECOMMENDATIONS

161
proliferate simplifying and reducing structural heterogeneity (Fynn et al., 2005). The
more eurytopic and stenotopic species will favour conditions produced by this type of
management. Mown areas will therefore exclude those species, which require late
successional plant species or architectural diversity within the plant community.
An increased diversity in butterflies indicates that they are able to take advantage of
the situation, with the abundance of certain nectar plants proliferating, thus creating an
attraction value. Coupled to this is that areas which are exposed too frequent fires
might lose many plant species, resulting in a depauperate plant assemblage and thus a
narrowing and simplifying of the grassland patch (Wright & Samways, 1998, 1999). I
would hypothesize that it is not the mowing per se that influences butterfly species
richness, but a combination of fire exclusion and the period during which the mowing
takes place (late summer).
7.1.5. Assessment of grasslands
A subset of grasshoppers teased out from the species assemblage will be able to
identify management practices and indicate future management paths for the
grasslands. This subset of species will allow for an assessment to be undertaken that
is simple, rapid and cost-effective (small number of species, easily identifiable and only
21 fifty metre transects need to be sampled in order to achieve a 95% C.1. for the
surrogate grasshopper assemblage), and in conjunction with.a random three hundred
point grass survey will provide the practitioner with a management tool that can be
used as a guideline to alter management in response to the various regimes that are
imparted on the receiVing environment.
The utilisation of this type of assessment will also provide conservation practitioners
with a tool that will rapidly assess the health of the grassland, and determine whether
or not it will be able to be rehabilitated or play a role in future conservation goals.
7.2. Management recommendations
7.2.1. Has past management affected the species assemblage?
BIOTIC INDICATORS OF G,RASSLAND CONDmON IN KWAZULU-NATAL WITH MANAGEMENT RECOMMENDATIONS

162
It is of paramount importance that management is ongoing as a site changes
continuously, usually as a result of succession (Morris, 1991). This is true of the South
African situation, where grasslands are not considered climax vegetation types
(Acock's, 1988). However, by managing the system, an impact that is more than simply
maintaining the ecological status quo will be imparted. Inevitably management plays a
role in 'contemporary evolution' (Stockwell et a/., 2003). In this instance management
can be viewed as a type of habitat destruction, with old, little disturbed, mid and late
successional habitats declining as a result of management preventing succession,
which is traditionally unfavourable for the rearing of livestock. On the other hand, the
amount of disturbed early-successional habitats increases. Presently we are managing
an already altered landscape mosaic that is reflecting our historical management
choices? This potential for management-influenced evolution is emphasized by the
effect that burning management has on ants in Australia (Vanderwoude et a/., 1997).
Therefore, a balance needs to be maintained. In this study, it appears that frequent,
same season burning and livestock grazing have impacted upon butterfly richness and
abundance. The low richness and abundance has created a situation that excludes
butterflies from fulfilling the role of indicators of environmental change in this situation.
The grasshopper assemblage appears to have been influenced by frequent fire, with
many of the fire susceptible species excluded from site-specific grasshopper
assemblages.
7.2.2. Grass/and management to improve biodiversity
The environment is ever changing in response to global warming as well as relentless
human influence (Bourn & Thomas, 2002), and one must realize that not all species
will survive. One must assume that past management has had an influence on the
species assemblage, with the current assemblage being a subset of the original. The
current subset may be more depauperate than the original or simply compositionally
altered from the original assemblage. Therefore species required too maintain
ecosystem functions, as they currently exist need identification and management to
prevent the collapse of vital ecosystems, grasslands being one of them.
Most of the extensive grasslands encountered within the KwaZulu-Natal Midlands fall
within the realm of private ownership and are traditionally used for animal production.
BIOTIC INDICATORS OF GRASSLAND CONDITION IN KWAZULU·NATAL WITH MANAGEMENT RECOMMENDATIONS
163
Therefore, it is best to assess the methods that the practitioners are currently utilising
and tease out management principals that best suit the orthopteran assemblage, and
other taxa. As production is important, we must be aware that the management
recommendations must not have any impact on the productivity of the grasslands, as
farmers will not sacrifice productivity to gain biodiversity.
The only two changes that I would propose to current management are, firstly, less
frequent burning events, Le. every fourth year. Fewer burning incidents will improve the
vigour of the grass species allowing greater production, and reducing the formation of
bare patches, allowing for the invasion of undesirable species. Species that prefer
more frequent fires will be able to make use of widespread fire breaks which are burnt
yearly and play an important role in preventing run away fires and resultant loss of
fodder, or destruction of afforested areas. Secondly, I would try to incorporate some
form of mowing regime where the grasslands are mowed in late May once the
grasslands are dormant and most of the invertebrate taxa are less active and entering
their over-wintering phase. This would favour the protection of over-wintering
butterflies, which are usually in their most vulnerable state as larvae or pupae. Mowing
is also beneficial for promoting the spread of valuable production grasses, such as,
Themeda triandra.
Various forms of land use surround isolated grassland fragments. In this matrix
grasslands interface with forestry, natural forest fragments and commercial crop
production, namely maize, potatoes and pastures. These isolated fragments will
require more intensive management than the extensive grasslands. The populations of
invertebrates are smaller and more prone to extirpation (Steffan-Dewenter &
Tscharntke, 2001). Baguette et al., (2000) showed that as the size of fragments
increased so the amount of emigration that was taking place of three butterfly species
decreased. Emigration was in response to the lack of the correct habitat to sustain the
butterfly species. As areas become smaller so management needs to be intensified to
maintain ecosystem processes. Small isolated grasslands should be broken up into a
mosaic of smaller units (Swengel, 2001). These smaller units should not be randomly
selected, and should reflect the heterogeneous nature of the grassland fragment to be
managed. For example, should their be a patch of long grass with a high forbaceous
content, surrounded by short Themeda triandra dominated grassland, I would propose
BIOTIC INDICATORS OF GRASSLAND CONDITION IN KWAZULU·NATAL WITH MANAGEMENT RECOMMENDATIONS

164
that only half the patch be exposed to disturbance under anyone management regime.
This will intensify management, but will ensure that these isolated fragments are able
to maintain viable populations. These smaller units need to simulate natural
disturbance, and would involve rotational management. This form of management
would create refugia/reservoirs of biodiversity within the grassland, which will help with
the recolonizationof the burnt and mowed sub units within the management matrix.
Reserve areas of prairie (Panzer, 2003) can play an important role as source habitats,
having a positive effect on the surrounding areas, applying to plants as well as insects
(Smart et al., 2002).
Some form of light intensity grazing needs to be introduced into areas, which are
presently under-utilised. Grazing will create more habitat heterogeneity, and will result
in the creation of a greater number of niches for colonization. In addition, grazing is
useful, as it helps with the recruitment and germination of grass species. Du Toit,
(1998b) suggests that a mixture of livestock units, Le. sheep and cattle has produced a
more efficient utilisation of resources than by grazing of cattle or sheep separately.
This form of utilisation would mimic what happened prior to human intervention with the
wild concentrate and bulk grazers feeding together.
Mowing should be undertaken on small sections of these grasslands, to create an
open, short grass sward providing an area for basking, oviposition and aggregation. It
is essential that the slashed grass be removed, to prevent smothering of bare areas,
and impacting on soil temperatures, which may also impact on the below ground
invertebrates and have an effect on overwintering eggs oviposited prior to mowing.
The benefit of mowing per se is questionable in· the South African context, as
grasshopper richness is higher in grasslands that are burnt and experience some form
of utilisation. Where the grass is mowed, fire has been excluded, and I would conclude
that the reason for the elevated species richness of butterflies and the elevated
abundance of brachypterous endemic grasshoppers is a response to fire exclusion, not
mowing. In areas where sufficient defoliation is not taking place through grazing, I
would recom mend that small sub-units of the grassland be mowed in order to create a
defoliation event that will mimic fire, but not be as destructive.
Blonc INDICATORS OF GRASSLAND CONDITION IN KWAZULU·NATAL WITH MANAGEMENT RECOMMENDAnONS

165
I would propose that fire in the KwaZulu-Natal Midlands be utilised more infrequently,
i.e. every four years. A reduced burning frequency will favour certain plant species,
promoting flowering and re-establishment, encourage the more specialist butterfly
species to recolonize these areas, and promoting increased abundance of rare and
flightless grasshopper species, such as Dirshia abbreviata, Qachasia fastigiata, Whitea
alticeps. Much of the grassland in the study area, particularly in the Midlands Mistbelt
Category is Themeda triandra dominated, which grows to c.a. 45cm. Only once the
vegetation gets taller than c.a. 90cm that the effects of light and heat exclusion
negatively impact the richness of the grasshopper assemblage. Therefore biennial
burning is not essential to maintain a short Themeda triandra dominated grass sward.
Outside formal reserves, it is necessary to maintain as much-undisturbed habitat as
possible. However, this implies bUilding in management practices that simulate natural
disturbance without imposing anthropogenic disturbance that decreases habitat quality.
Particular species may require appropriate management actions, but these can be
chosen in a way so that both threatened specialists and more abundant generalists can
benefit. Such management may involve multiple approaches (Swengel, 2001), which
also need to be sensitive to other non-insect taxa. We see this with prairie
management, where the fine filter specialist butterfly considerations, as well as coarse
filter total butterfly assemblage approaches, also need to cater for fire-sensitive snails
(Nekola, 2002).
In the case of the rare Iycaenid butterfly Orachrysops ariadne the fine-filter approach
has priority, on the local basis (population nodes), over the coarse-filter approach, (Lu
& Samways, 2002), without this prioritization this species may well go extinct. Once
such highly threatened species have been considered, then a whole landscape
approach can be taken. This form of management has received considerable attention
in recent years with emphasis, for example, on less intensive graZing or a return to
traditional methods to conserve species richness and endemicity of Spanish (Verdu et
al., 2000) and Italian (Barbero et al., 1999) dung beetles, Ukrainian (Elligsen et al.,
1997) and German (Dolek & Geyer, 1997) butterflies, as well as Australian spiders
(Zulka et al.• 1997). The complementarityapproach to conservation is the only avenue
to take in the way forward to prevent ever-increasing rates of extinction, especially
within the invertebrate taxa.
BIOTIC INDICATORS OF GRASSLAND CONDITION IN KWAZULU·NATALWITH MANAGEMENT RECOMMENDATIONS
166
In conclusion it must be stated that no one management type is the most appropriate
or correct method for grassland management. Various factors need to be taken into
consideration prior to instigating a management regime. In order to protect biodiversity
in the KwaZulu-Natal Midlands context I would propose four critical factors need
addressing. These factors influence the species assemblages that were studied.
1. The time between scheduled burns,
2. Management needs to be rotational, both with livestock grazing patterns
and the type of defoliation that the grassland is exposed to,
3. Grazing intensity needs more vigourous· assessment, and certain study
sites require a reduction in animal units, and
4. Monitoring and adaptive management are the key components to ensuring
the survival of rare and endemic species and bolstering biodiversity across
taxa. Management should respond to changes in the target taxa monitored.
7.3. Future research
Certain questions regarding the focal taxa have been answered through the study and
provide an insight into how these relatively common taxa respond to different
management and environmental drivers. I would propose that further sampling and
monitoring of these specific study sites takes place, with subsequent taxa included to
assess the overall benefits of the suggested management recommendations on the
wider cross-section of biodiversity. The additional taxa data will be able to provide an
overall index of the biological integrity and grassland health for the grasslands of the
KwaZulu-Natal Midlands, and thus the development of a rapid assessment technique.
BIOTIC INDICATORS OF GRASSLAND CONDITION IN KWAIULU·NATAL WITH MANAGEMENT RECOMMENDATIONS

167
ACKNOWLEDGEMENTS
I would like to acknowledge the following people for all their assistance.
Firstly, thanks must go to Michael Samways for all his effort and time that he has spent
in assisting me both in terms of the structure and compilation of my PhD and in getting
me funding in order to complete my PhD. I would also like to thank Steven Piper for
helping facilitate the completion of the thesis.
I would like to thank the National Research Fund for the financial support that they
provided in order for this study to be completed.
I would like to thank Craig Morris for all his assistance and time that he spent helping
me with the statistics used to formulate my results and later discussion.
Thanks to must go to Dr. Adrian Armstrong that spent many. afternoons with me
identifying the grasshopper species, his assistance has been invaluable.
Sarah Pryke and Mark Brown, for aiding me with the identification of the butterfly
specimens.
The support staff at the University of KwaZulu-Natal, namely, Jane Flockhart and
Tanya Karalic.
Finally my parents for the financial sacrifices made to afford me the opportunity of
studying for so long and there unwavering belief in my abilities. Unfortunately, dad, you
didn't see the completed thesis, but this is for you.
, Blonc INDICATORS OF GRASSLAND CONDITION IN KWAZULU-NATAL WITH MANAGEMENT RECOMMENDATIONS

168
REFERENCES
Abbott, I., (1974). Numbers of plant, insect and land birds on nineteen remote islands
in the southern hemisphere. Biological Journal of the Linnean Society 6, 143-152.
Abensperg-Traun, M., Arnold, G., Steven, D., Smith, G., Atkins, L., Viveen, J. & Gutter,
M., (1997). Biodiversity indicators in contrasting vegetation types, a case study from
Western Au stralia. Memoirs of the Museum of Victoria 56, 637-641.
Acocks, J.P .H., (1988). Veld types of South Africa. Memoirs of the Botanical Survey of
South Africa 57, 1-146.
Adis, J., (1979). Problems of interpreting arthropod sampling with pitfall traps.
Zoologischer Anzeiger 202, 177-184.
Andelman, S.J. & Fagan, W.F., (2000). Umbrellas and flagships: efficient conservation
surrogates or expensive mistakes? Proceedings of the National Academy ofSciences,
USA 97, 5954-5959.
Andersen, A.N., (1990). The use of ant communities to evaluate change in Australian
terrestrial ecosystems, a review and a recipe. Proceedings of the Ecological Society of
Australia 16, 347-357.
Andersen, A.N., (1999). My bioindicator or yours? Making the selection. Journal of
Insect Conservation 3, 61-64.
Andersen, A.N., Hoffmann, B.D & Some, J., (2003). Ants as indicators of minesite
restoration: community recovery at one of eight rehabilitation sites in central
Queensland. Ecological Management and Restoration 4 (Supplement), 512-519.
Anderson, N. L., 1964. Some relationships between grasshoppers and vegetation.
Annals of the Entomological Society of America 57, 736-742.
Blonc INDICATORS OF GRASSLAND CONDITION IN KWAZULU·NATAL WITH MANAGEMENT RECOMMENDATIONS

169
Anderson, N.L. & Wright, J.C., (1952). Grasshopper investigations on Montana
rangelands. Montana Agricultural Experiment Station Bulletin No. 486.
Anderson, N.L. & Hastings, E., (1966). Some relationships between grasshoppers and
vegetation. Annals of the EntomolOfJical Society ofAmerica 59, 736-742.
Anderson, R.C., Leahy, T. & Dhillion, S., (1989). Numbers and biomass of selected
insect groups on burned and unburned sand prairie. American Midland Naturalist 122,
151-162.
Anderson, RV., Tracy, C.R. & Abramsky, Z., (1979). Habitat selection in two species of
short-horned grasshoppers: the role of thermal and hydric stresses. Oecologia 38, 359
374.
Andrieu-Ponel, V. & Ponel, P., (1999). Human impact on Mediterranean wetland
Coleoptera: an historical perspective at Tourves (Var, France). Biodiversity and
Conservation 8,391-407.
Armstrong A.J. (2004). Personal Communication.
Armstrong, A.J. & van Hensbergen, H.J., (1996). The impacts of afforestation with
pines on assemblages of native biota in South Africa. South African Forestry Journal
175,35-42.
Armstrong, A.J. & van Hensbergen, H:J., (1997). Evaluation of afforestable montane
grasslands for wildlife conservation in the north-eastern Cape, South Africa. Biological
Conservation 81, 179-190.
Armstrong, AJ., van Hensbergen, H.J., Scott, D.F. & Milton, S.J., (1996). Are
plantations 'inhospitable seas' around remnant native habitat within the southwestern
Cape forestry areas? South African Forestry Journal 175, 35-42.
BIOTIC INDICATORS OF GRASSLAND CONDITION IN KWAZULU·NATAL WITH MANAGEMENT RECOMMENDATIONS
170
Armstrong, AJ., Benn, G., Bowland, AE., Goodman, P.S., Johnson, D.N., Maddock,
AH. & Scott-Shaw, C.R, (1998). Plantation forestry in South Africa and its impact on
biodiversity. South African Forestry Journal 182, 59-65.
.Austin, AD., (1999). The importance of "species" in biodiversity studies: lessons from
a mega-diverse group - the parasitic Hymenoptera. In: The other 99%: the
conservation and biodiversity of invertebrates. (Eds. Ponder, W. and Lunney, D.).
Royal Zoological Society of New South Wales, Mosman, Australia.
Bailey, D.W., Dumont, B., Wallis De Vries, M.F., (1998). Utilisation of heterogeneous
grasslands by domestic herbivores: theory to management. Annals of Zootechnology
47,321-333.
Bailey, RC., Norris, RH. & Reynoldson, T.B., (2001). Taxonomic resolution of benthic
macroinvertebrate communities in bioassessments. Journal of North American
Benthological Society 20, 280-286.
Baines, M., Hambler, C., Johnson, P.J., Macdonald, D.W. & Smith, H., (1998). The
effects of arable field margin management on the abundance and species richness of
Araneae (spiders). Ecography 21, 74-86.
Baldi, A & Kisbenedek, T., (1994). Comparative analysis of edge effect on bird and
beetle communities. Acta Zoologica Academiae Scientiarum Hungaricae 40, 1-14.
Baldi, A & Kisbenedek, T., (1997). Orthopteran assemblages as indicators of
grassland naturalness in Hungary. Agriculture, Ecosystems and Environment 66, 121
129.
Barbero, E., Palestrini, C. & Rolando, A, (1999). Dung beetle conservation: effects of
habitat and resource selection (Coleoptera: Scarabaeoidea). Journal of Insect
Conservation 3, 75-84.
Barker, J.F., (1985). The distribution of Acridoidea (grasshoppers) in relation to
overgrazing. Botswana Notes and Records 17, 141-148.
BIOTIC INDICATORS OF GRASSLAND CONDITION IN KWAZULU·NATAl WITH MANAGEMENT RECOMMENDATIONS

171
Baskin, Y., (1994). Ecosystem function of biodiversity: regarding ideal levels of species
richness, the data are few and unclear. Bioscience 44, 657-660.
Basset, Y., Mavoungou, J.F., Mikissa, J.B., Missa, 0., Miller, S.E., Kitching, R.L. &
Alonso, A, (2004). Discriminatory power of different arthropod data sets for the
biological monitoring of anthropogenic disturbance in tropical forests. Biodiversityand
Conservation 13, 709-732.
Beaundry, S., Duchesne, L.C. & Cote, B., (1997). Short-term effects of three forestry
practices on carabid assemblages in a jack pine forest. Canadian Journal for Forestry
Research 27, 2065-2071.
Beccaloni, G.W. & Gaston, K.J., (1995). Predicting species richness of neotropical
butterflies- Ithomiinae (Lepidoptera, Nymphalidae) as indicators. Biological
Conservation 71, 77-86.
Beckerman, A,(2000). Counterintuitive outcomes of interspecific competition between
two grasshopper species along a resource gradient. Ecology 81,948-957.
Bei-Bienko, G.Y, (1970). Orthopteroid insects (Orthopteroidea) of the national park
areas near Kursk and their significance as indices of local landscape. Zhurnal
Obshchei Biologii 31, 30-46. [In Russian, translated].
Belovsky, G.E., (2000). Grasshoppers as integral elements of grasslands. In:
Grasshoppers and Grassland Health. (Eds. Lockwood, J.A, Latchininsky, AV. &
Sergeev, M.G.). Kluwer, Dordrecht, The Netherlands. pp. 7-29.
Belovsky, G.E. & Slade, J.B., (1993). The role of vertebrate and invertebrate predators
in a grasshopper community. Oikos 68,193-201.
Belsky, AJ., (1992). Effects of grazing, competition, disturbance and fire on species
composition and diversity in grassland communities. Journal of Vegetation Science 3,
187-200.
alone INDICATORS OF GRASSLAND eONDmON IN KWAIUlU·NATAl WITH MANAGEMENT RECOMMENDAnONS

172
Bieringer, G. & Zulka, K.P., (2003). Shading out species richness: edge effect of a pine
forest on the Orthoptera (Tettigoniidae and Acrididae) assemblage of an adjacent dry
grassland. Biodiversity and Conservation 12, 1481-1495.
Bigalke, RC. & Willan, K. (1984). Effects of fire regime on faunal composition and
dynamics. In: Ecological effects of fire in South African ecosystems (Eds. Booysen, P.
de V. & Tainton, N.M.) Springer-Verlag, Berlin, Germany. pp. 255-271.
Blair, J.M., (1997). Fire, N availability, and plant response in grasslands: a test of the
transient maxima hypothesis. Ecology 78, 2359-2368.
Blair, RB. & Launer, A. E., (1997). Butterfly diversity and human land use: species
assemblages along an urban gradient. Biological Conservation 80, 113-125.
Bock, C.E. & Bock, J.H., (1991). Response ofgrasshoppers (Orthoptera: Acrididae) to
wildfire in southeastern Arizona grassland. American Midland Naturalist 125, 162-167.
Bock, C.E., Bock, J.H. & Grant, M.C., (1992). Effects of bird predation on grasshopper
densities in an Arizona grassland. Ecology 73, 1706-1717.
Bohac, J., (1999). Staphylinid beetles as bioindicators. Agriculture Ecosystems and
Environment 74,357-372.
Bourquin, S. L., (2002). Personal Communication.
Bosch, O.J. H. & Gauch, H.R, (1991). The use of degradation gradients for the
assessment and ecological interpretation of range condition. Journal of the Grassland
Society of Southern Africa 8,138-146.
Boshoff, C., (1988). Does the brown locust play an important role in the nutrient
recycling? In: Proceedings of the locust symposium in Kimberley, South African
Institute of Ecologists Bulletin. (Eds. McKenzie, B. & Longridge, M.). Johannesburg,
South Africa. pp. 101-117.
Blonc INDICATORS OF GRASSLAND CONDITION IN KWAZULU·NATAL WITH MANAGEMENT RECOMMENDATIONS

173
Bossenbroek, P.H., Kessler, A., Liem, AS.N. & Vlijm, L., (1977). An experimental
analysis of the significance of tuft-structure as a shelter for invertebrate fauna, with
respect to wind velocity and temperature. Journal ofZoology (London) 182, 7-16.
Bothma, J.du P., Van Rooyen, N. & Du Toit, J.G., (2002). Antelope and other small
herbivores. In: Game ranch management. (Ed. Bothma, J.du P.) (4th Edition). Van
Schaik Publishers, Pretoria, South Africa. pp. 149-175.
Boulton, AJ., (1999). An overview of river health assessment: philosophies, practice,
problems and prognosis. Freshwater Biology 41,469-479.
Bourn, N.A. D. & Thomas, J.A., (2002). The challenge of conserving grassland insects
at the margins of their range in Europe. Biological Conservation 104, 285-292.
Boyd, N.S., Astatkie, T., Fredeen, AH. & Martin, RC., (2001). Rotationally stocked
beef cattle responses to daily and weekly residence. Journal of Rangeland
Management 54, 39-43.
Bragg, T.8., (1995). The physical environment of Great Plains grasslands. In: The
changing prairie. (Eds. Joern, A & Keeler, K.H.). Oxford University Press, Oxford,
United Kingdom. pp. 49-81.
Bridgewater, P., Walton, D.W.& Busby, J.R, (1996). Landscape diversity- creating
policy. In: Biodiversity- broadening the debate. (Ed. Longmore, R) ANCA PUblication,
Canberra, Australia. pp. 4-17.
Browde, J.A., Pedigo, L.P., De Gooyer, L.G., Higley, LG., Wintersteen, W.K. & Zeiss,
M.R., (1992). Comparison of sampling techniques for grasshoppers (Orthoptera:
Acrididae) in soybean. Journal of Economic Entomology 85,2270-2274.
Brown, H.D., (1962). New and interesting grasshoppers from southern Africa - 2
(Orthoptera: Acridoidea). Journal of the Entomological Society of Southern Africa 25, 3
19.
BIOTIC INDICATORS OF GRASSLAND CONDITION IN KWAZUlll'-NATAl WITH MANAGEMENT RECOMMENDATIONS

174
Brown, H.D., (1974). Class Insecta, Order Orthoptera, Acridoidea. In: Status of the
taxonomy of the Hexapoda of southern Africa. (Ed. Coaton, W.G.H.). Department of
Agricultural Technical Services Entomological Memoir. 38, pp. 39-42.
Brown, J.H., 1995. Macroecology. Chicago University Press, Chicago, United States of
America.
Brown, K.S., (1991). Conservation of neotropical environments: insects as indicators.
In: The conservation of insects and their habitats. (Eds. Collins, N.M. & Thomas, J.A.)
Academic Press, London, United Kingdom. pp. 349-404.
Brown, K.S., Jr. & Frietas,. A.V.L., (2000). Atlantic forest butterflies: indicators for
landscape conservation. Biotropica 32, 934-956.
Bryant, J.P., Heitkonig, I., Kuropat, P. & Owen-Smith, N., (1991). Effects of severe
defoliation on the long-term resistance to insect attack and on leaf chemistry in six
woody species of the southern African savanna. American Naturalist 137,50-63.
Bulan, C.A. & Barrett, G.W., (1971). The effects of two acute stresses on the arthropod
component of an experimental grassland ecosystem. Ecology 52,597-605.
Bullock, J.M., Hill, B.C., Dale, M.P. & Silvertown, J., (1994). An experimental study of
the effects of sheep grazing on vegetation change in a species-poor grassland and the
role of seedling recruitment into gaps. Journal of Applied Ecology 31,493-507.
Burd, M., (1994). Bateman's principle and plant reproduction: the role of pollen
limitation in fruit and seed set. Botanical Review 60,83-139.
Cagnolo, L., Molina, 5.1. & Valladares, G.R., (2002). Diversity and gUild structure of
insect assemblages under grazing and exclusion regimes in a montane grassland from
Central Argentina. Biodiversity and Conservation 11, 407-420.
Caley, M. J. & Schluter, D., (1997). The relationship between local and regional
diversity. Ecology 78, 70-80.
alonc INDICATORS O~ GRASSLAND CONDITION IN KWAZULU·NATAl WITH MANAGEMENT RECOMMENDAnONS

175
Camp, K.G.T., (1999). The bioresource groups of KwaZulu-Natal. In: Veld in KwaZulu
Natal. (Eds. Hardy, M.B. & Hurt, CR.). KwaZulu-Natal Department of Agriculture. pp.
71-73.
Camp, K.G.T. & Hardy, M.B., (1999). Veld condition assessment. In: Veld in KwaZulu
Natal. (Eds. Hardy, M.B. & Hurt, C.R.). KwaZulu-Natal Department of Agriculture,
South Africa. pp. 18-31.
Capinera, J.l. & Sechrist, T.S., (1982). Grasshopper (Acrididae)- host plant
associations: response of grasshopper populations to cattle grazing. Canadian
Entomologist 114, 1055-1061.
Caro, T. M. & O'Doherty, G., (1999). On the use of surrogate species in conservation
biology. Conservation Biology 13, 805-814.
Cemer, S., (1994). Are all trees green? The forestry industry replies. Africa
Environment and Wildlife 2, 79-85.
Chambers, B.O., (1992). Influences of burning and mowing on grasshopper
(Orthoptera) assemblages in the tall grassveld of Natal. M.Sc. thesis. University of
Natal, Pietermaritzburg, South Africa.
Chambers, B.O. & Samways, M.J., (1998). Grasshopper response to a 40-year
experimental burning and mowing regime, with recommendations for invertebrate
conservation management. Biodiversity and Conservation 7, 985-1012.
Chappell, M.A., (1983). Metabolism and thermoregulation in desert and montane
grasshoppers. Oecologia 56, 126-131.
Chappell, M.A & Whitman, D.W., (1990). Grasshopper thermoregulation. In: Biology of
grasshoppers. (Eds. Chapman, R.F. & Joern, A). Wiley, New York, United States of
America. pp. 143-172.
Blonc INDICATORS OF GRASSLAND CONDITION IN KWAZULU·NATAL WITH MANAGEMENT RECOMMENDATIONS

176
Chase, J.M., (1996). Differential competitive interactions and the included niche: an
experimental analysis with grasshoppers. Oikos 76, 103-112.
Chase, J. M. & Leibold, M. A. (2002). Spatial scale dictates the productivity
biodiversity relationship. Nature 416, 427-430.
Cherrill, A.J. & Brown, V.K., (1990). The life cycle and distribution of the wart-biter
Decticus verrucivorus (L) (Orthoptera: Tettigoniidae) in a chalk grassland in southern
England. Biological Conservation 53, 125-143.
Christensen, N.L., (1997). Managing for heterogeneity and complexity on dynamic
landscapes. In: The ecological oasis for conservation: heterogeneity, ecosystems and
biodiversity (Eds. Pickett, S.T.A., Ostfeld, R.S., Shachak, M. & Likens, G.E.). Chapman
and Hall, New York, United States of America. pp. 167-186.
Churchill, T.B., (1997). Spiders as ecological indicators, an overview for Australia.
Memoirs of the Museum of Victoria 56, 331-337.
Chutter, F. M., (1994). The rapid biological assessment of streams and river water
quality by means of macroinvertebrate communities in South Africa. In: Classification of
Rivers and Environmental Health Indicators. (Ed. Uys, M.C.). Report TT 63/94, Water
Research Commission, Pretoria, South Africa. pp. 217-234.
Chutter, F.M., (1998). Research on the rapid biological assessment of water quality
impacts in streams and rivers. WRC Report No 422/1/98. Water Research
Commission, Pretoria, South Africa.
Cincotta, R.P., Wisnewski, J. & Engelman, R., (2000). Human population in the
biodiversity hotspots. Nature 404, 990-992.
Claridge, M.F. & Singhrao, J.S., 1978. Diversity and altitudinal distribution of
grasshoppers (Acridoidea) on a Mediterranean mountain. Journal of Biogeography 5,
239-250.
BIOTIC INDICATORS Of GRASSLAND CONDITION IN KWAZULU·NATAL WITH MANAGEMENT RECOMMENDAnONS
177
Coffin, D.P. & Lauenroth, W.K., (1988). The effects of disturbance, size and frequency
on a shortgrass plant community. Ecology 69, 1609-1617.
Collinge, S.K., Prudic, K.L. &Oliver, J.C., (2003). Effects of local habitat characteristics
and landscape context on grassland butterfly diversity. Conservation Biology 17, 178
187.
Collins, N.M. & Morris, M.G. (1985). Threatened swallowtail butterflies of the world.
IUCN, Gland, Switzerland and Cambridge, UK.
Collins, N.M. & Thomas, J.A., (1991). The conservation of insects and their habitats.
15th Symposium of the Royal Entomological Society of London. Academic Press,
United Kingdom.
Collins, S.L., (1987). Interactions of disturbances in tall grass prairie: a field
experiment. Ecology 68, 1243-1250.
Colville, J., Picker, M.D. & Cowling, R.M., (2002). Species turnover of monkey beetles
(Scarabaeidae: Hopliini) along environmental and disturbance gradients in the
Namaqualand region of the succulent Karoo, South Africa. Biodiversity and
Conservation 11, 243-264.
Colwell, R.K. & Coddington, J.A., (1994). Estimating terrestrial biodiversity through
extrapolation. Philosophical Transactions of the Royal Society of London Series B.
Biological Sciences 345, 101-118.
Committee of Scientific Issues in the Endangered Species Act (CSIESA) (1995).
Science and Endangered Species Act. National Academy Press, Washington, D.C.,
United States of America.
Costanza, R & Mageau, M., (1999). What is a healthy ecosystem? Aquatic Ecology 33,
105-115.
BIOTIC INDICATORS OF GRASSLAND CONDITION IN KWAZULU-NATAl WITH MANAGEMENT RECOMMENDATlO~S

178
Cracraft, J., (1992). Explaining patterns of biological diversity: integrating causation at
different temporal and spatial scales. In: Systematics, ecology, and the biodiversity
crisis. (Ed. Eldredge, N.). Columbia University Press, New York, United States of
America. pp. 59-76.
Cranston, P.S. & Trueman, J.W.H., (1997). 'Indicator' taxa in invertebrate biodiversity
assessment. Memoirs of the Museum of Victoria 56, 264-267..
Crawley, M.J., (1983). Herbivory: the dynamics of animal-plant interactions. Blackwell
Scientific Publications, Oxford, United Kingdom.
Cully, J.F.J r., (1999). Lone star tick abundance, fire, and bison grazing tall-grass
prairie. Journal of Range Management 52, 139.;.144.
Currie, D.J., (1991). Energy and large...scale patterns of animal and plant species
richness. The American Naturalist 137,27-49.
Daubenmire, R., (1968). Ecology of fire in grasslands. Advanced Ecological Research
5,209-266.
Davidowitz, G. &Rosenzweig, M.L., (1998). The latitudinal gradient of species diversity
among North American grasshoppers (Acrididae) within a single habitat: a test of the
spatial heterogeneity hypothesis. Journal of Biogeography 25, p 553-560.
Dawson, B. L., (1991). South African road reserves: valuable conservation areas? In:
The role of corridors. (Eds. Saunders, D.A. & Hobbs, R.J.). Surrey Beatty and Sons
Publishers, Chipping Norton, United Kingdom.
Day, T.A. & Detling, J.K., (1990). Grassland patch dynamics and herbivore grazing
preference following urine deposition. Ecology 71, 180-188.
De Maynadier, P. & Hunter, M. L., (1994). Keystone support. BioScience 44,2.
BIOTIC INDICATORS OF GRASSLAND CONDITION IN KWAZULU·NATAL WITH MANAGEMENT RECOMMENDATIONS

179
Debinski, D.M., Ray, C. & Saveraid, E.H., (2001). Species diversity and the scale of
the landscape mosaic: do scales of movement and patch size affect diversity?
Biological Conservation 98, 179-190.
Dempster, J.P., (1963). The population dynamics of grasshoppers and locusts.
Biological Reviews 38, 490-529.
Dennis R.L.H., (1993). Butterflies and Climate Change. Manchester University Press,
Manchester, United Kingdom.
Deutschlander, M. S. & Bredenkamp, G. J., (1999). Importance of vegetation analysis
in the conservation management of the endangered butterfly Aloeides dentatis dentatis
(Swierstra) (Lepidoptera, Lycaenidae). Koedoe 42, 1-12.
Devoka, D. & Schmidt, G.H., (2000). Accumulation of heavy-metals in food plants and
grasshoppers from the Taigetos Mountains, Greece. Agriculture, Ecosystems and
Environment 78, 85-91.
Dickens C.W.S. & Graham P.M., (2002). The South African scoring system (SASS)
version 5 rapid bioassessment method for rivers. African Journal of Aquatic Science
27,1-10.
Didham, R.K., Ghazoul, J., Stork, N.E. & Davis, AJ., (1996). Insects in fragmented
forests: a functional approach. Trend in Ecology and Evolution 11, 255-260.
Dirsh, V.M., (1965). The African genera of Acridoidea. Anti-Locust Research Centre
and Cambridge University Press, Cambridge, United Kingdom.
Dolek, M. & Geyer, A, (1997). Influence of management on butterflies of rare
grassland ecosystems in Germany. Journal of Insect Conservation 1, 125-130.
Dougill, A & Trodd, N., (1999). Monitoring and modeling open savannas using
multisource information: analysis of Kalahari studies. Global Ecology and
Biogeography 8,211-221.
BIOTIC INDICATORS OF GRASSLAND CONDITION IN KWAZULU·NATAL WITH MANAGEMENT RECOMMENDATIONS

180
Dourojeanni, M.J., (1990). Entomology and biodiversity conservation in Latin America.
American Naturalist 36, 88-93.
Duffey, E., (1968). Ecological studies on the large copper butterfly Lycaena dispar
Haw. batavus Obth. at Woodwalton Fen National Nature Reserve, Huntingdonshire.
Journal ofApplied Ecology 5, 69-96.
ouffey, E., Morris, M.G., Sheail, J., Ward, L.K., Wells, D~A. & Wells, T.C.E., (1974).
Grassland ecology and wildlife management. Chapman and Hall, London, United
Kingdom.
Dufrene, M. & Legendre, P., (1997). Species assemblages and indicator species: the
need for a flexible asymmetrical approach. Ecological Monographs 67,345-366.
Dukas, R. & Bernays, E.A., (2000). Learning improves growth rate in grasshoppers.
Physiological and Biochemical Zoology 73, 66-76.
Du Toit, P.CV., (1998b). Effects of grazing and resting treatments on animal
performance and vegetation condition in the false upper Karoo at the Grootfontein
Agricultural Development Institute, Eastern Cape. South African Journal of Science 94,
507-512.
Erhardt, A., (1985). Diurnal Lepidoptera: sensitive indicators of cultivated and
abandoned grassland. Journal ofApplied Ecology 22,849-862.
Erhlich, P.R., Breedlove, D.E., Brussard, P.F. & Sharp, M., (1972). Weather and the
regulation of sub alpine populations. Ecology 53,243-247.
Ehrlich, P.R. & Murphy, D. D., (1987). Conservation lessons from long-term studies of
checkerspot butterflies. Conservation Biology 1, 122-131.
Ericson, D., (1979). The interpretation of pitfall catches on Pterstichus cupreus and Pt.
melanarius (Coleoptera: Carabidae) in cereal fields. Pedobiologia 19, 320-328.
Blonc INDICATORS OF GRASSLAND CONDmON IN KWAZULU·NATAL WITH MANAGEMENT RECOMMENDAnONS

181
Elligsen, H., Beinlich, B. & Plachter, H., (1997). Effects of large-scale cattle grazing on
populations of Coenonympha glycerion and Lesiommata megera (Lepidoptera:
Satyridae). Journal of InsectConservation 1, 13-23.
Evans, E.W., (1984). Fire as a natural disturbance to grasshopper assemblages of tall
grass prairie. Dikos 43,9-16.
Evans, E.W., (1988a). Grasshopper (Insecta: Orthoptera: Acrididae) assemblages of
tall grass prairie: influences of fire frequency, topography and vegetation. Canadian
Journal of Zoology 66, 1495-1501.
Evans, E.W., (1988b). Community dynamics of prairie grasshoppers subjected to
periodic fire: predictable trajectories or random walks in time? Dikos 52,283-289.
Everson, T. M., Clarke, G.P.Y. & Everson, C.S., (1990). Precision in monitoring plant
species composition in montane grasslands. Vegetatio 88,135-141.
Feber, R.E., Smith, H. & Macdonald, D.W., (1996). The effects of management of
uncropped edges of arable fields on butterfly abundance. Journal of Applied Ecology
33, 1191 - 1205.
Field, L.F., (2002). Consequences of habitat fragmentation for the pollination of
wildflowers in moist upland grasslands of KwaZulu-Natal. M.Sc. thesis University of
Natal, Pietermaritzburg, South Africa.
Fielding, D.J. & Brusven,. M.A., (1993a). Grasshopper (Orthoptera: Acrididae)
community composition and ecological disturbance on southern Idaho rangeland.
Environmental Entomology 22, 71-81.
Fielding, D.J. & Brusven, M.A., (1993b). Spatial analysis of grasshopper density and
ecological disturbance on southern Idaho rangeland. Agriculture, Ecosystems and
Environment 43, 31-47.
Blonc INDICATORS OF GRASSLAND CONDITION IN KWAZULU·NATAL WITH MANAGEMENT RECOMMENDATIONS
182
Fielding, D.J. & Brusven, M.A, (1995). Grasshopper densities on grazed and ungrazed
rangeland under drought conditions in southern Idaho. Great Basin Naturalist 55, 352
358.
Fielding, D.J., Brusven, M.A, Shafii, B. & Price, W.J., (2001). Spatial heterogeneity of
low-density populations of Melanoplus sanguinipes (Orthoptera: Acrididae) associated
with grazing and vegetation treatments. Canadian Entomologist 133, 843-855.
Fishman, J., Fakhruzzman, K., Cros, B. & Hganga, D., (1991). Identification of
widespread pollution in the southern hemisphere deduced from satellite analyses.
Science 252, 1693-1696.
Fogden, M. & Fogden, P., (1974). Animals and their colours. Crown, New York, United
States of America.
Force, D., (1981). Postfire insect succession in southern California chaparral. The
American Naturalist 117; pp 575-582.
Forestry Council, (1993). South African forestry facts. Forestry Council, Rivonia, South
Africa.
Forestry Council, (2004). South African forestry facts. Forestry Council, Rivonia, South
Africa.
Foord, S.H., Ferguson, J.W.H. & van Jaarsveld, AS., (2002). Endemicity of
afromontane grasshopper assemblages: implications for grassland management.
African Journal of Ecology 40, 318-327.
Frank, D.A, McNaughton, S.J. & Tracy, B.F., (1998). The ecology of the earth's
grazing ecosystems. BioScience 48,513-521.
Franklin, J. F., (1993). Preserving biodiversity: species, ecosystems or landscapes?
Ecological Applications 3, 202-205.
BIOTIC INDICATORS OF GRASSLAND CONDITION IN KWAZULU·NATAl WITH MANAGEMENT RECOMMENDATIONS

183
Freeman, C.C., (1998). The flora of Konza Prairie: a historical review and
contemporary patterns. In: Grassland dynamics: long-term ecological research in
tal/grass prairie. (Eds. Knapp, AK., Briggs, J.M., Hartnett, D.C. & Collins, S.L.). Oxford
University Press, New York, United States of America. pp. 69-80.
Frost, P.G. H., (1984). The responses and survival of organisms in fire prone
environments. In: Ecological effects of fire in South African ecosystems (Eds. Booysen,
P. de V. & Tainton, N.M.) Springer-Verlag, Berlin, Germany. pp. 273-309.
Fry, R & Lonsdale, D., 1991. Habitat conservation for insects - a neglected green
issue. Amateur Entomologists' Society, Middlesex, United Kingdom.
Fuhlendorf, S.D. & Smeins, F.E., (1997). Long-term vegetation dynamics mediated by
herbivores, weather and fire in a Juniperus-Quercus savanna. Journal Vegetation
Science 8,819-818.
Fuhlendorf, S.D. & Engle, D.M., (2001). Restoring heterogeneity on rangelands:
ecosystem management based on grazing patterns. Bioscience 51, 625-632.
Fuhlendorf, S.D., Woodward, AJ.W., Leslie, D.M.Jr. & Shackford, J., (2002). Multi
scale effects of habitat loss and fragmentation on lesser prairie-chicken populations of
the US southern Great Plains. Landscape Ecology 17,617-628.
Fynn, RW.S., Haynes, RJ. & O'Connor, T.G., (2003). Burning causes long-term
changes in the soil organic matter content of a South African grassland. Soil Biology
and Biochemistry 35, 677-687.
Fynn, RW.S., Morris, C.D. & Edwards, T.J., (2005). Long-term compositional
responses of a South African mesic grassland to various combinations of burning and
mowing. Applied Vegetation Science. In Press.
Gall, L.F., (1985). Measuring the size of lepidopteran populatiohs. Journal of Research
on the Lepidoptera 24, 97-116.
Blonc INDICATORS Of GRASSLAND CONDITION IN KWAZULU·NATAL WITH MANAGEMENT RECOMMENDATIONS
184
Gandar, M.V., (1979). Studies on the insects of the herbaceous layer of the Nylsvley
savanna. Final Report to the National Program for Environmental Sciences. 69.
Gandar, M.V., (1980). Short-term effects of the exclusion of large mammals and
insects in broad leaf savanna. South African Journal of Science 76, 29-31.
Gandar, M.V., (1982a). The dynamics and trophic ecology of grasshoppers
(Acridoidea) in a South African savanna. Oecologia 54, 370-378.
Gandar, M.V., (1982b). Description of a fire and its effects in the Nylsvley nature
reserve: a synthesis report. South African National Scientific Programmes Report No.
74. Council for Scientific and Industrial Research.
Gandar, M.V., (1983). Ecological notes and annotated checklist of the grasshoppers
(Orthoptera: Acrididae) of the savanna ecosystem project study area, Nylsvley. South
African National Scientific Programmes Report No. 74. Council for Scientific and
Industrial Research.
Gangwere, S.K, Muralirangan, M.C. & Muralirangan, M., (1997). The bionomics of
grasshoppers, katydids and their kin. CAB International, Wallingford, United Kingdom.
Gaston, KJ. & Blackburn, T.M., (1995). Mapping biodiversity using surrogates for
species richness: macro-scales and New World birds. Proceedings of the Royal
Society of London Series B. Biological Sciences 262, 335-341.
Gaston, K.J. & Blackburn, T.M., (1996). The tropics as a museum of biological
diversity: an analysis of the New World avifauna. Proceedings of the Royal Society of
London Series B. Biological Sciences 263, 63-68.
Gaston, KJ., New, T.R. & Samways, M.J., (Eds.), 1993. Perspectives on insect
conservation. Intercept, Andover, United Kingdom.
Blonc INDICATORS OF GRASSLAND CONDITION IN KWAZULU·NATAL WITH MANAGEMENT RECOMMENDAnONS

185
Gebeyehu, S. & Samways, M.J., (2002). Grasshopper assemblage response to a
restored national park (Mountain Zebra National Park, South Africa). Biodiversity and
Conservation 11, 283-304.
Gebeyehu, S. & Samways, M.J., (2003). Responses of grasshopper assemblages to
long-term grazing management in a semi-arid African savanna. Agriculture,
Ecosystems and Environment 95, 613-622.
Germishuizen, G. & Meyer, N.L., (Eds.), (2003). Plants of southern Africa: an
annotated checklist. Strelitzia 14.National Botanical Institute, Pretoria, South Africa.
Ghazoul. J. & Hellier, A., (2000). Setting critical limits to ecological indicators of
sustainable tropical forestry. International Forestry Review 2,243-253.
Gibson, C.W.D., Hambler, C. & Brown, V.K., (1992). Change in spider (Araneae)
assemblages in relation to succession and grazing management. Journal of Applied
Ecology 29, 132-142.
Gibson, D.J. & Hulbert, L.C., (1987). Effects of fire, topography, and year-to-year
climatic variation on species composition in tallgrass prairie. Vegetatio 72, 175-185.
Giller, S.. (1996). The diversity of soil communities, the 'poor man's tropical rain forest.
Biodiversity and Conservation 5, 135-168.
Gillon, Y., (1983). The invertebrates ofthe grass layer. In: Ecosystems of the world 13:
tropical savannas. (Ed. Bouliere. F.). Elsevier, Amsterdam, The Netherlands. pp. 289
311.
Goldsmith, F. B., (1991). Monitoring for conservation and ecology. Chapman and Hall,
London, United Kingdom.
Blonc INDICATORS OF GRASSLAND CONDITION IN KWAZULU·NATAL WITH MANAGEMENT RECOMMENDATIONS

186
Grant, S.A., Torvell, L., Sim, E.M., Small, J.L. & Armstrong, RH., (1996). Controlled
grazing studies on Nardus grassland: effects of between tussock sward height and
species of grazer on Nardus utilisation and f10ristic composition in two fields in
Scotland. Journal of Applied Ecology 33, 1053-1065.
Greatorex-Davis, J.N., Sparks, T.H. & Hall, M.L., (1994). The response of Heteroptera
and Coleoptera species to shade and aspect in rides of coniferised lowland. Biological
Conservation 12, 1099-1111.
Green, S.V., (1998). The taxonomic impediment in orthopteran research and
conservation. Journal of Insect Conservation 2,151-159.
Green, SV., (1999). South African Acridoidea (Orthoptera) - a review of African
Entomology. Unpublished.
Greenslade, P. (1964). Pitfall trapping as a method of studying populations of
Carabidae (Coleoptera). Journal ofAnimal Ecology 33,301-310.
Greenslade, P., (1993). Australian native steppe-type landscapes: neglected areas for
invertebrate conservation in Australia. In: Perspectives on Insect Conservation. (Eds.
Gaston, K.J., New, T.R & Samways, M.J.) Intercept, Andover, United Kingdom. pp.
51-73.
Greenslade, P. & Greenslade, P.J.M., (1987). Ecological strategies in Collembola, a
new approach to the use of terrestrial invertebrates in environmental assessment. In:
Ecological strategies in Col/embola, a new approach to the use of terrestrial
invertebrates in environmental assessment. (Ed. Striganova, B.R.). Nauka, Moscow.
Russia. pp. 245-252.
Groom, M.J. & Schumaker, N., (1993). Evaluating landscape change: patterns of
worldwide deforestation and local fragmentation. In: Biotic interactions and global
change. (Eds. Karieva, P.M., Kingsolver, J.G. & Huey, RB.). Sinauer Associates
Incorporated, Massachusetts, United States of America. pp. 9-23.
810nc INDICATORS 0F GRASSLAND CONDlnON IN KWAZULU-NATAL WITH MANAGEMENT RECOMMENDATIONS I

187
Guerold, F., (2000). Influence of taxonomic determination level on several community
indices. Water Research 34, 487-492.
Gutzwiller, K.J. 2002. Applying landscape ecology in biological conservation:
principles, constraints, and prospects. In: Applying landscape ecology in biological
conservation. (Ed. Gutzwiller, KJ.). Springer-Verlag Incorporated, New York, United
States of America. pp. 481-495
Haes, E.C.M., Cherrill, A.J. & Brown, V.K, (1990). Meteorological correlates of wart
biter (Orthoptera: Tettigoniidae) abundance. The Entomologist 109,93-99.
Hall, M., (1984) Man's historical and traditional use of fire in southern Africa. In:
Ecological effects of fire in South African ecosystems. (Eds. Booysen, P. de V. &
Tainton, N.M.). Springer-Verlag; Berlin, Germany. pp. 39-54.
Hamer, KC., Hill,· J.K, Lace, L.A & Langan, A.M., (1997). Ecological and
biogeographical effects of forest disturbance on tropical butterflies in Sumba,
Indonesia. Journal of Biogeography 24,67-75.
Hammond, P., (1994). Practical approaches to the estimation of the extent of
biodiversity in speciose groups. Philosophical Transactions of the Royal Society of
London B 345, 119-136.
Hannah, L., Lohse, D., Hutchinson, C., Carr, J.L. & Lankerani, A, (1994). A preliminary
inventory of human disturbance ofworld ecosystems. Ambio 23, 246-250.
Hanski, I., (1994). A practical model of metapopulation dynamics. Journal of Applied
Ecology 63, 151-162.
Harding, P.T., Asher, J. & Yates, T.J., (1995). Butterfly monitoring 1- recording the
changes. In: Ecology and conservation of butterflies. (Ed. Pullin, AS.). Chapman and
Hall, London, United Kingdom. pp. 3-22.
BIOTIC INDICATORS OF GRASSLAND CONDmON IN KWAZULU-NATAL WITH MANAGEMENT RECOMMENDATIONS

188
Hardy, M.B., (1999). Bioresource groups 8 and 9: moist and dry highland sourveld. In:
Veld in KwaZulu-Natal. (Eds. Hardy, M.B. & Hurt, C.R). KwaZulu~NatalDepartment of
Agriculture. pp. 84~87.
Haslett, J.R., (2001). Biodiversity and conservation of Diptera in heterogeneous land
mosaics: a fly's eye view. Journal of Insect Conservation 5, 71-75.
Hawksworth, D.L. & Kalin-Arroyo, M.T., (Eds.), (1995). Magnitude and distribution of
biodiversity. In: United Nations environment program. Cambridge University Press,
Cambridge, United Kingdom. pp. 107-193.
Haysom, K.A. &Coulson, J.C., (1998). The Lepidoptera fauna associated with Cal/una
vulgaris: effects of plant architecture on abundance and diversity. Ecological
Entomology 23, 377-385.
Henning, G.A., Henning, S.F., Joannou, J.G. & Woodhall, S.E., (1997). Living
butterflies ofsouthern Africa (Volume 1). Umdaus Press, Hatfield, South Africa.
Hill, J.K., Kramer, K.C., Lace, L.A. & Banham, W.M.T., (1995). Effects of selective
logging on tropical forest butterflies on Buru, Indonesia. Journal of Applied Ecology 32,
754-760.
Hill, P. & Twist, C., (1998). Butterflies and Dragonflies: a site guide. 2nd edition.
Arlequin, Chelmsford, United Kingdom.
Hilton-Taylor, C., (compiler), (2000). 2000 IUCN Red Lists of Threatened Species.
IUCN, Gland, Switzerland and Cambridge, United Kingdom.
Holechek, J. L., Pieper, RD. & Herbel, C.H., (1998). Range management principles and
practices: upper Saddle River (New Jersey). Prentice Hall, United States of America.
HolI, K.O., (1995). Nectar resources and their influence on butterfly communities on
reclaimed coal surface mines. Restoration Ecology 3, 76-85.
Blonc INDICATORS OF GRASSLAND CONDITION IN KWAZULU·NATAl WITH MANAGEMENT RECOMMENDAnONS

189
Holloway, J.D. and Stork, N.E., (1991). The dimensions of biodiversity: the use of
invertebrates as indicators of human impact. In: The biodiversity of microorganisms
and invertebrates: its role in sustainable agriculture. (Ed. Hawksworth, D.L.). CAB
International, Wallingford, United Kingdom. pp. 37-62.
Holmes, N.D., Smith, O.S. & Johnston, A., (1979). Effect of grazing cattle on the
abundance of grasshoppers on fescue grassland. Journal of Range Management 32,
310-311.
Honek, A., (1988). The effect of crop density and microclimate on pitfall trap catches of
Carabidae, Staphylinidae (Coleoptera) and Lycosidae (Araneae) in cereal fields.
Pedobiologia 32, 233-242.
Horwitz, P., Recher, H. & Majer, J., (1999). Putting invertebrates on the agenda:
political and bureaucratic challenges. In: The other 99%: the conservation of
biodiversity of invertebrates. (Eds. Ponder, W. & Lunney, D.). The Royal Zoological
Society of New South Wales, Mosman, Australia. pp. 398-406.
Hunter, M.L.Jr., (2000b). Refining normative concepts in conservation. Conservation
Biology 14, 573-574.
Ibrahim, K.M., (2001). Plague dynamics and population genetics of the desert locust:
can turnover during recession maintain population genetic structure? Molecular
Ecology 10, 581-591.
Ingham, D. S. &Samways, M. J., (1996). Application of fragmentation and variegation
models to epigaeic invertebrates in South Africa. Conservation Biology 10, 1353-1358.
Ingrisch, S., (1986). The plurennial Iifecycles of the European Tettigoniidae (Insecta:
Orthoptera). Oecologia 70, 606-630.
Isely, F.B., (1938). The relations of Texas Acrididae to plants and soil. Ecological
Monographs 8,551-604.
BlonC-'INDICATORS OF GRASSLAND CONDITION IN KWAZULU·NATALWITH MANAGEMENT RECOMMENDATIONS

190
IUCN/UNEPIWWF (1991) Caring for the Earth. A Strategy for Sustainable Living.
Gland, Switzerland.
Jaganyi, J.N.U., (1998). Response of carabid and cicindelid beetles to various types of
landscape disturbances. PhD thesis. University of Natal, Pietermaritzburg, South
Africa.
Janzen, D.H., (1987). Insect diversity in a Costa Rican dry forest: why keep it and
how? Biological Journal of the Linnaean Society 30, 343-356.
Jepson-Innes, K. & Bock, C.E., (1989). Response of grasshoppers (Orthoptera:
Acrididae) to livestock grazing in southeastern Arizona: differences between seasons
and subfamilies. OecoJogia 78, 430-431.
Joern, A., (1979). Resource utilisation and community structure in assemblages of arid
grassland grasshoppers (Orthoptera: Acrididae). Transactions of the American
Entomological Society 105,253-300.
Joern, A, (1982). Vegetation structure and microhabitat selection in grasshoppers
(Orthoptera: Acrididae). Southwestern Naturalist 27, 197-209.
Joern, A, (1983). Small scale displacements of grasshoppers (Orthoptera: Acrididae)
within arid 9 rasslands. Journal of the Kansas Entomological Society 56, 131-139.
Joern, A & Gaines, S.B., (1990). Population dynamics and regulation in grasshoppers.
In: Biology of grasshoppers. (Eds. Joern, A & Chapman, R.F.). Wiley and Sons, New
York, United States of America. pp. 415-482.
Johns, M., (1993). Are all trees green? A spotlight on forestry. Africa - Environment
and Wildlife 1, 77-85.
Johnsen, P., (1985). Suborder Caelifera. In: Insects of southern Africa. (Eds. Scholtz,
C.H. & Holm, E.). Butlerworths, Durban, South Africa. pp. 86-95.
Blonc INDICATORS Of GRASSLAND CONDJnON IN KWAZULU·NATAL WITH MANAGEMENT RECOMMENDAnONS

191
Johnsen, P., (1987). The status of South African Acridoidea s.L (Orthoptera: Caelifera).
In: Evolutionary biology of orthopteroid insects. (Ed. Baccetti, B.). ElIis Horwood,
Chichester, United Kingdom. pp. 293-295.
Johnson, S., (2005). Personal Communication.
Johnson, R.A & Wichern, D.W., 1982. Applied mu/tivariate statistical analyses.
Prentice-Hall, Englewood Cliffs, New Jersey, United States of America.
Jones, D.T. & Eggleton, P., (2000). Sampling termite assemblages in tropical forests:
testing a rapid biodiversity assessment protocol. Journal of Applied Ecology 37, 191
203.
Joy, J. & Pullin, AS., (1999) Field studies on flooding and survival of overwintering
large heath butterfly Coenonympha tullia larvae on Fennis and Whixall Mosses in
Shropshire and Wrexham, United Kingdom. Ecological Entomology 24,426-431.
Karieva, P.M., (1993). Influence of vegetation texture on herbivore populations:
resource concentrations and movement. In: Variable plants and herbivores in natural
and managed ecosystems. (Eds. Denno, R.F. & McClure, M:S.). Academic Press, New
York, United States of America. pp. 259-289.
Kati, V., De Villiers, P., Dufrene, M., Legakis, A, Vokou, D. & Lebrun, P., (2004).
Testing the value of six taxonomic groups as biodiversity indicators at a local scale.
Conservation Biology 18, 667-675.
Kearns, C.A., Inouye, D.W. & Waser, N.M., (1998). Endangered mutualisms: the
conservation of plant-pollinator interactions. Annual Review of Ecology and
Systematics 29, 83-112.
Kellert, S.R. (1986). Social and perceptual factors in the preservation of animal
species. In: The preservation of species. (Ed. Norton, B.G.). Princeton University
Press, Princeton, United States of America. pp. 50-73.
BIOTIC INDICATORS Of GRASSLAND CONDITION IN KWAZULU·NATAL WITH MANAGEMENT RECOMMENDATIONS

192
Kells, A. R. & Goulson, D. (2003). Preferred nesting sites of bumblebee queens
(Hymenoptera: Apidae) in agroecosystems in the UK Biological Conservation 109,
165-174.
Kemp, W.P., (1992). Rangeland grasshopper (Orthoptera: Acrididae) community
structure. Environmental Entomology 21,461-470.
Kemp, W.P., Harvey, S.J. & O'Neill, KM., (1990). Patterns of vegetation and
grasshopper community composition. Oecologia 83, 299-308.
Kennedy, A.D., (1994). Simulated climate change: a field manipulation study of polar
microarthropod community response to global warming. Ecography 17,131-140.
Kent, M. & Coker, P., (1992). Vegetation description and analysis: a practical
approach. Belhaven Press, London, United Kingdom.
Kindvall, 0., (1996). Habitat heterogeneity and survival in a bush cricket
metapopulation. Ecology 77,207-214.
King, K.L. & Hutchinson, K.J., (1976). The effects of sheep stocking intensity on the
abundance and distribution of mesofauna in pastures. Journal of Applied Ecology 13,
41-56.
Kirby, P., (1992). Habitat management for invertebrates: a practical handbook. The
Royal Society for the Protection of Birds, Berdfordshire, United Kingdom.
Kisbenedek, 1., (1995). The effects of sheep grazing on the community structure of
grasshoppers (Orthoptera). Folia Entomologica Hungarica 56, 45-46.
Kitahara, M. & Sei, K, (2001). A comparison of the diversity and structure of butterfly
communities in semi-natural and human-modified grassland habitats at the foot of Mt.
Fuji, central Japan. Biodiversity and Conservation 10, 331-351.
Blonc INDICATORS OF GRASSLAND CONDITION IN KWAZULU-NATAL WITH MANAGEMENT RECOMMENDATIONS

193
Knapp, A.K., Blair,J.M., Briggs, J.M., Collins, S.L., Hartnett, D.C., Johnson, L.C. &
Towne, E.G., (1999). The keystone role of bison in North American tallgrass prairie.
BioScience 49, 39-50.
Kolasa, J. & Pickett, S.T.A., (1991). Ecological Heterogeneity. Springer-Verlag, New
York, United States of America.
Kotliar, N.B. & Wiens, J.A., (1990). Multiple scales of patchiness and patch structure: a
hierarchical framework for the study of heterogeneity. Dikos 59, 253-260.
Kotze, D., (2004). Personal Communication.
Kotze, D.J. & Samways, M.J., (2001). No general edge effects for invertebrates at
afromontane forest/grassland ecotones. Biodiversity and Conservation 10, 443-466.
Kremen, C., (1990). Identifying indicator taxa for conservation planning: a study of rain
forest butterflies in Madagascar. Bulletin of the Ecological Society ofAmerica 71, 220.
Kremen, C., (1992). Assessing the indicator properties of species assemblages for
natural areas monitoring. Ecological Applications 2,203-217.
Kremen, C., (1994). Biological inventory using target taxa: a case study of butterflies of
Madagascar. Ecological Applications 4, 407-422.
Kruess, A. & Tscharnke, 1., (2002). Grazing intensity and the diversity of
grasshoppers, and trap-nesting bees and wasps. Conservation Biology 16, 1570-1580.
Kruger, F.J., (1984). Effects of fire on vegetation structure and dynamics. In: Ecological
effects of fire in South African ecosystems. (Eds. Booysen, P. de V. & Tainton, N.M.).
Springer-Verlag, Berlin, Germany. pp. 219-243.
Kruger, F.J., Everard, D.A. & Manders, P.T., (1995). Forestry and environmentally
sustainable development in South Africa. Commonwealth Forestry Review 74, 71-75.
BIOTIC INDICATORS OF GRASSLAND CONDITION IN KWAZULU-NATAL WITH MANAGEMENT RECOMMENDATIONS

194
Lactin, D.J. & Johnson, D.L., (1997). Response of body temperature to solar radiation
in restrained nymphal migratory grasshoppers (Orthoptera: Acrididae): influences of
orientation and body size. Physiological Entomology 22, 131-139.
Lactin, D.J. & Johnson, D.L., (1998). Convective heat loss and change in body
temperature of grasshopper and locust nymphs: relative importance of wind speed,
insect size and insect orientation. Journal of Thermal Biology 23, 5~13.
Landsberg, J., O'Connor, 1. & Freudenberger, D., (1999). The impacts of livestock
grazing on biodiversity in natural ecosystems. In: Nutritional ecology of herbivores.
(Eds. Jung, H.G. & Fahley, G.C.Jr.). Proceedings of the 5th International Symposium
on the nutrition of herbivores. American Society of Animal Science, Illinois, United
States of America. pp. 752-777.
Lamotte, M., (1975). The structure and function of a tropical savanna system. In:
Tropical ecology systems. Trends in terrestrial and tropical research. (Eds. Galley, F. B.
& Medino, E.) Springer-Verlag, Berlin, Germany. pp. 179-222.
Latchininsky, AV., (1998). Moroccan locust Dociostaurus marocanus (Thunberg,
1985): a faunistic rarity or an important economic pest? Journal of Insect Conservation
2, 167-178.
Launer, AE. & Murphy, D.D., (1994). Umbrella species and the conservation of habitat
fragments: a case of threatened butterfly and vanishing grassland ecosystem.
Biological Conservation 69, 145-153.
Lawes, M.J., Kotze, D.J., Bourquin, S.L. & Morris, C.D., (2005). Epigaeic invertebrates
as potential ecological indicators of Afromontane forest condition in South Africa.
Biotropica 37, 109-118.
Lawton, J.H., Bignell, D.E., Bolton, B., Bloemers, G.F., Eggleton, P., Hammond, P.M.,
Hodda, M., Holt, R.D., Larson, 1.B., Mawdsley, N.A, Stork, N.E. , Srivastava, O.S., &
Watt, AD., (1998). Biodiversity inventories, indicator taxa and the effects of habitat
modification in tropical forest. Nature 391, 72-76.
BIOTIC INDICATORS OF GRASSLAND CONDITION IN KWAZULU·NATAL WITH MANAGEMENT RECOMMENDATIONS;
195
Legg, D.E., Lockwood, J.A & Brewer, M.J., (1996). Variability in rangeland
grasshopper (Orthoptera: Acrididae) counts when using the standard, visualized
sampling method. Journal ofEconomic Entomology 89, 1143-1150.
Lenat, D.R. & Resh, V.H., (2001). Taxonomy and stream ecology - the benefits of
genus- and species-level identification. Journal of North American Benthological
Society 20, 287-298.
Leopold, A, (1953). Round River. Oxford University Press, New York, USA
Leps, J. & Spitzer, K., (1990). Ecological determinants of butterfly communities
(Lepidoptera: Papilionidae) in the Tam Dao Mountains. Acta Entomologica
Bohemoslovaca 87,182-194.
Lindenmayer, D.B., Margules, C.R. & Botkin, 0.8., (1999). Indicators of biodiversity for
ecologically sustainable forest management. Conservation Biology 14; 941-950.
Lockwood, J.A, (1993). Environmental issues involved in biological control of
rangeland grasshoppers (Orthoptera: Acrididae) with exotic agents. Environmental
Entomology 22, 503-518.
Lockwood, J.A, (1997). Rangeland grasshopper ecology. In: The bionomics of
grasshoppers, katydids and their kin. (Eds. Gangwere, S.K., Muralirangan, M.C. &
Muralirangan, M.). CAB International, Wallingford, United Kingdom. pp. 83-101.
Lockwood, J.A, Latchininsky, AV. & Sergeev, M.G., (2000). Grasshoppers and
grasshopper health: managing grasshopper outbreaks without risking environmental
disaster. Kluwer Academic PUblishers, Dordrecht, The Netherlands.
Longino, J.T., & Colwell, R.K., (1997). Biodiversity assessment using structured
inventory: capturing the ant fauna of a lowland tropical rainforest. Ecological
Applications 7, 1263-1277.
Blonc INDICATORS OF GRASSLAND CONDITION IN KWAIULU·NATAl WITH MANAGEMENT RECOMMENDATIONS

196
Lu, S.S., (2002). Biology and conservation of the threatened Karkloof blue butterfly
Orachrysops ariadne (Butler) (Lepidoptera: Lycaenidae). PhD thesis. University of
Natal, Pietermaritzburg, South Africa.
Lu, S.S. & Samways, M.J., (2002). Conservation management recommendations for
the Karkloof blue butterfly, Orachrysops ariadne (Lepidoptera: Lycaenidae). African
Entomology 10,149-159.
Luff, M.L., (1975). Some features influencing the efficiency of pitfall traps. Oecologia
(Berlin) 19, 345-357.
Luff, M.L., (1982). PopUlation dynamics of Carabidae. Annals of Applied Biology 101,
164-170.
Luff, M.L., (1986). Aggregation of some Carabidae in pitfall traps. In: Carabid beet/es,
their adaptations and dynamics. (Eds. Den Boer, P.J., Luff, M.L., Mossakowski, D. &
Weber, F.). Gustav Fischer, Stuttgart, Germany.
Lunt, I.D. & Morgan, J.W., (2002). The role of fire regimes in temperate lowland
grassland in southeastern Australia. In: Flammable Australia, the fire regimes and
biodiversity of a continent. (Eds. Bradstock, R.A, Williams, J.E. & Gill, AM.).
Cambridge University Press, Cambridge, United Kingdom. pp. 177-196.
Macdonald, I.AW., (1989). Mans role in changing the face of southern Africa. In: Biotic
diversity in southern Africa (Ed. Huntley, B.J.). Oxford University Press, Cape Town,
South Africa. pp. 51-77.
Majer, L., (1980). Report on the study of invertebrates in relation to the Kojonup nature
reserve fire management plan. WAIT Biology Department, Bulletin No. 2.
Maliha, S.N., Waiter, G.W., Justin, V.Z; & Kris, H., 2000. Ant (Hymenoptera:
Formicidae) responses to environmental stressors in the northern Chihuanuan desert.
Environmental Entomology 29, 200-206.
Blonc INDICATORS OF GRASSLAND CONDITION IN KWAZULU·NATAl WITH MANAGEMENT RECOMMENDATIONS

197
MacArthur, R.H., (1972). Geographical ecology. Harper and Row, New York, United
States of America.
MacArthur, R.H. & Wilson, EO., (1967). The theory of island biogeography. Princeton
University Press, New Jersey, United States of America.
MacFarlane, D., (2002). Personal Communication.
Magurran, A.E, (1988). Ecological diversity and its measurement. Princeton University
Press, Princeton, United States of America.
Mani, M.S., 1962. Introduction to high altitude entomology: insect life above the
timberline in northwest Himalaya. Methuen, London, United Kingdom.
Manzano, M.G. & Navar, J., (2000). Processes of desertification by goats overgrazing
in the Tamaulipan thornscrub (matorral) in north-eastern Mexico. Journal of Arid
Environments 44, 1-17.
Marshall, J.A. & Haes, EC.M., (1988). Grasshoppers and allied insects of Great Britain
and Ireland. Harley Books, Colchester, United Kingdom.
Mawdsley, N.A. & Stork, N.E, (1995). Species extinctions in insects: ecological and
biogeographical considerations. In: Insects in a Changing Environment. (Ed.
Harrington, R. & Stork, N.E). Academic Press, London, United Kingdom. pp. 321-369.
McCabe, T.L., (1981). The Dakota skipper, Hesperia dacotae (Skinner): range and
biology, with special reference to North Dakota. Journal of Lepidopterists' Society 35,
179-193.
McCune, B. & Grace, J.B., (2002). Analysis of ecological communities. MJM Software
Design, Oregon, United States of America.
McGeoch, M.A., (1998). The selection, testing and application of terrestrial insects as
bioindicators. Biological Review 73, 181-201.
,BIOTIC INDICATORS OF GRASSLAND CONDmON IN KWAZULU·NATAl WITH MANAGEMENT RECOMMENDATIONS

198
Mclntyre, N.E. & Wiens, J.A., (1999). How does habitat patch size affect animal
movement? An experiment with darkling beetles. Ecology 80, 2261-2270.
Meek, B., Loxton, D., Sparks, T., Pywell, R, Pickett, H. &Nowakowski, M., (2000). The
effect of arable field margin composition on invertebrate biodiversity. Biological
Conservation 106, 259-271.
Meffe, G.K. & Carroll, C.R, (1994). Principles of conservation biology. 2nd Edition.
Sinauer Publishers, Massachusetts, United States of America.
Memmott, J., (1999). The structure of a plant-pollinator food web. Ecology Letters 2,
276-280.
Mentis, M.T., Meiklejohn, M.J. & Scotcher, J.S.B., (1974). Veld burning in Giant's
Castle Game Reserve, Natal Drakensberg. Proceedings of the Grassland Society of
South Africa 9, 26-31.
Mentis, M.T. & Tainton, N.M., (1984). The effect of fire on forage production and
quality. In: Ecological effects of fire in South African ecosystems (Eds. De V. Booysen,
P. & Tainton, N.M.) Springer-Verlag, Berlin, Germany. pp. 245-254.
Mielke, P.W.J., (1984). Meteorological applications of permutation techniques based
on distance functions. In: Handbook of statistics. (Eds. Krishnaiah, P.R. & Sen, P.K.),
Elsevier Science Publishers, New York, pp. 813-830.
Milchunas, D.G. & Lauenroth, W.K. (1993). Quantitative effects of grazing on
vegetation a nd soils over a global range of environments. Ecological Monographs 63,
327-366.
Mills, L.S., Soule, M.E. & Doak, D.F., (1993). The keystone-species concept in ecology
and conservation. BioScience 43,219-224.
BIOTIC INDICATORS OF GRASSLAND CONDITION IN KWAZULU·NATAL WITH MANAGEMENT RECOMMENDATIONS

199
Miller, R.H. & Onsager, J.A., (1991). Grasshopper (Orthoptera: Acrididae) and plant
relationships under different grazing intensities. Environmental Entomology 20, 807
814
Mitchell, B., (1963). Ecology of two carabid beetles, Bembidion lampros (Herbst) and
Trechus quadristriatus (Schrank). 11. Studies on populations of adults in the field, with
specific reference to the technique of pitfall trapping. Journal of Animal Ecology 32,
377-392.
Mirov, N.T., (1967). The genus Pinus. Ronald, New York, United States of America.
Morris, M.G., (1981a). Responses of grassland invertebrates to management by
cutting. Ill. Adverse effects on Auchenorhyncha. Journal of Applied Ecology 18, 107
123.
Morris, M.G., (1990). The Hemiptera of two sown calcareous grasslands. 11.
Differences between treatments. Journal ofApplied Ecology 27, 379-393.
Morris, M.G., (1991). The management of reserves and protected areas. In: The
scientific management of temperate communities for conservation. (Eds. Spellerberg,
I.F., Goldsmith, F.B. & Morris, M.G.). Blackwell Scientific Publications, Oxford, United
Kingdom. pp. 323-347.
Morris, M.G. & Lakhani, K.H., (1979). Responses of grassland invertebrates to
management by cutting. I. Species diversity of Hemiptera. Journal of Applied Ecology
16, 77-98.
Morris, M.G. & Rispin, W.E., (1987). Abundance and diversity of the coleopterous
fauna of a calcerous grassland under different cutting regimes. Journal of Applied
Ecology 24,451-465.
Morris, M.G. & Thomas, J.A., (1991). Progress in the conservation of butterflies. Nota
Lepidoptera 2, 32-44.
BIOTIC INDICATORS OF GRASSLAND CONDITION IN KWAZUlU·NATAlWITH MANAGEMENT RECOMMENDATIONS

200
Mulkern, G.B., 1967. Food selection by grasshoppers. Annual Review of Entomology
12,59-78.
Mullen, K., Fahy, O. & Gormally, M., (2003). Ground flora and associated arthropod
communities of forest road edges in Connemara, Ireland. Biodiversity and
Conservation 12, 87~101.
Mullie, w.e. & Kieth, J.O., (1993). The effects of aerially applied fenitrothion and
chlorpyrifos on the birds in the savanna of north Senegal. Journal of Applied Ecology
30,536-550.
Muralirangan, M.C., Suresh, P. & Dhang, P.P., (1993). Observation on the
grasshopper species diversity, density and distributional pattern in peninsular India.
The Entomologist (London) 201-210.
Mushinsky, H.R & Gibson, D.J., (1991). The influence of fire periodicity on habitat
structure. In: Habitat structure: the physical arrangement of objects in space (Eds. Bell,
S.S., McCoy, E.D. & Mushinsky, H.R). Chapman and Hall, London, United Kingdom.
pp. 237-259.
Neke, K.S. & du Plessis, M.A., (2004).. The threat of transformation: quantifying the
vulnerability of grasslands in South Africa. Conservation Biology 18,466-477.
Nekola, J.C., (2002). Effects of fire management on the richness and abundance of
central North American grassland land snail faunas. Animal Biodiversify and
Conservation 25, 53-66.
New, T.R, (1984). Insect Conservation: an Australian perspective. Junk, Dordrecht,
The Netherlands.
New, T.R, (1991). Butterfly conservation. Oxford University Press, Melbourne,
Australia.
New, T.R (1997). Butterfly Conservation. 2nd edition. Oxford University Press,
Melbourne.
BIOTIC INDICATORS OF GRASSLAND CONDITION IN KWAZULU·NATAL WITH MANAGEMENT RECOMMENDATIONS
201
New, T.R, Pyle,RM., Thomas, J.A., Thomas, CD. & Hammond, P.C., (1995).
Butterfly conservation management. Review of Entomology 40, 57-83.
Niemela, J., Halme, E., Pajunen, T. & Haila, Y., (1986b). Sampling spiders and carabid
beetles with pitfall traps: the effect of increased sampling effort. Annales Entomologici
Fennica 52, 109-111.
Niemela, J., Halme, E & Haila, Y., (1990). Balancing sampling effort in pitfall trapping
of carabid beetles. Entomologici Fennica 1, 233-238.
Niemela, J., Spence, JR., Langor, D.W., Haila, Y. & Tukia, H., (1993b). Logging and
boreal ground-beetle assemblages on two continents: implications for conservation. In:
Perspectives of insect conservation. (Eds. Gaston, K.J., New, T.R & Samways, M.J.).
Intercept, Andover, United Kingdom. pp. 29-50.
Niemela, J. & Baur, B., (1998). Threatened species in a vanishing habitat: plants and
invertebrates in calcareous grasslands in the Swiss Jura mountains. Biodiversity and
Conservation 7, 1407-1416.
Noss, R.F., (1990). Indicators for monitoring biodiversity: a hierarchical approach.
Conservation Biology 4, 355-364.
Novacek, M.J. & Cleland, EE, (2001). The current biodiversity extinction event:
scenarios for mitigation and recovery. Proceedings of the National Academy of
Sciences of the United States ofAmerica 98,5466-5470.
Novotny. V. & Basset, Y., (2000). Rare species in communities of tropical insect
herbivores: pondering the mystery of singletons. Oikos 89,564-572.
O'Connor, T.G.O., (1996). What role for biodiversity in the sustainable use of
rangelands in developing countries? In: Rangelands in a sustainable biosphere.
Proceedings of the 5th International rangeland congress. Society of Range
Management, Colorado 1, 38-42.
BIOTIC INDICATORS OF GRASSLAND CONDllION IN KWAZULU-NATAL WITH MANAGEMENT RECOMMENDATIONS

202
O'Connor, T.J., (2001). Personal Communication.
O'Connor, T.J. & Bredenkamp, G.J., (1997). Grassland. In: Vegetation of southern
Africa. (Eds. Cowling, R.M., Richardson, D.M. & Pierce, S.M.). Cambridge University
Press, Cambridge, United Kingdom. pp. 215-257.
Ojima, D, Schimel, D.S., Parton, W.J.& Owensby, C.E., (1994). Long and short-term
effects of fire on nitrogen cycling in tallgrass prairie. Biogeochemistry 24, 67-84.
Oliver, I. & Beattie, A.J., (1996). Invertebrate morphospecies as surrogates for species:
a case study. Conservation Biology 10,99-109.
Oliver, I., Beattie, AJ. & York, A., (1998). Spatial fidelity of plant, vertebrate and
invertebrate assemblages in multiple-use forest in eastern Australia. Conservation
Biology 12, 822-835;
Oliver, M.D.N., Short, N.M.R. & Hanks, J., (1978). Population ecology of Oribi, Grey
Rhebuck and Mountain Reedbuck in Highmoor state forest land. South African Journal
of Wildlife Research 8, 95-105.
Olsen D.M. & Dinerstein, E., (1998). The global 2000: a representation approach to
conserving the earth's most biologically valuable ecoregions. Conservation Biology 12,
502-515.
Onsager, J.A., (1963). Characteristics of eggs and egg-pods of North Dakota Acrididae
and studies of sites selected for oviposition. PhD Thesis. North Dakota State
University, North Dakota, United States of America.
Onsager, J.A., (2000). Suppression of grasshoppers in the Great Plains through
grazing management. Journal of Range Management 53, 592-602.
BIOTIC INDICATORS OF GRASSLAND CONDITION IN KWAZULU·NATAL WITH MANAGEMENT RECOMMENDATIONS '

203
Oostermeijer. J.G.B. &van Swaay. C.AM.. (1998). The relationship between butterflies
and the environmental indicator values: a tool for conservation in a changing
landscape. Biological Conservation 86, 271-280.
Opler, P.A & Krizek, G.O.• (1984). Butterflies east of the Great Plains. John Hopkins
University Press. Baltimore, United States of America.
Orbtel, R. (1971). Number of pitfall traps in relation to the structure of the catch of soil
surface Coleoptera. Acta Entomologica Bohemoslovaca 68, 300-309.
Osem. Y.• Perevolotsky. A & Kigel, J., (2004). Site productivity and plant size explain
the response of annual species to grazing exclusion in a Mediterranean semi-arid
rangeland. Journal ofEcology 92, 297-309.
Otte. D., (1976). Species richness patterns of New World desert grasshoppers in
relation to plant diversity. Journal of Biogeography 3, 197-209..
OUe, D. &Joern. A, (1975). Insect territoriality and its evolution - population studies of
desert grasshoppers on creosote bushes. Journal ofAnimal Ecology 44, 29-54.
Paine. RT., (1969). A note on trophic complexity and community stability. The
American Naturalist 103, 91-93.
Panzer, R., (2002). Compatibility of predescribed burning with the conservation of
insects in small isolated prairie reserves. Conservation Biology 16, 1296-1307.
Panzer. R. (2003). Importance of in situ survival, recolonization, and habitat gaps in
the postfire recovery of fire-sensitive prairie insect species. Natural Areas Journal 23,
14-21.
Panzer. R. & Schwartz. M.W., (1998). Effectiveness of a vegetation-based approach to
insect conservation. Conservation Biology 12,693-702.
BIOTIC INDICATORS OF GRASSLAND CONDITION IN KWAZULU·NATAL WITH MANAGEMENT RECOMMENDAnONS

204
Panzer, R., Stillwargh, D., Gnaediger, R. & Derkovitz, G., (1995). Prevalence of
remnant dependence among prairie and savanna-inhabiting insects of the Chicago
region. Natural Areas Jouma/15, 101-116.
Palmer, M.W. & White, P.S., (1994). Scale dependence and the species-area
relationship. American Naturalist 144, 717-740.
Parmesan, C., (1996). Climate and species' range. Nature 382,765-766.
Parmesan, C., Ryrholm, N., Stefanescu, C., Hill, J.K., Thomas, C.D., Descimon, H.,
Huntley, B., Kaila, L., Kullberg, J., Tammaru, T., Tennent, W.J., Thomas, J.A &
Warren, M., (1999). Poleward shifts in geographical ranges of butterfly species
associated with regional warming. Nature 399,579-583.
Pearce-Kelly, P., Jones, R., Clarke, D., Walker, C., Atkin, P. & Cunningham, AA,
(1998). The captive rearing of threatened Orthoptera: a comparison of the
conservation potential and practical considerations of two species' breeding
programmes at the Zoological Society of London. Journal of Insect Conservation 2,
201-210.
Pearson, D.L., (1994). Selecting indicator taxa for the quantitative assessment of
biodiversity. Philosophical Transactions of the Royal Society of London Series 345, 75
79.
Pearson, D. L. & Carroll, S.S., (1998). Spatial modeling of butterfly species richness
using tiger beetles (Cicindelidae) as a bioindicator taxon. Ecological Applications 8,
531-543.
Petanidou, T., Vokou, D. & Margaris, N.S., (1991). Panaxia quadripunctaria in the
highly touristic valley of butterflies (Rhodes, Greece): conservation problems and
remedies. Ambio 20, 124-128.
Phillips, J.F.V., (1930). Fire: its influence on biotic communities and physical factors in
South and East Africa. South African Journal of Science 27,352-367.
BIOTIC INDICATORS OF GRASSLAND CONDITION IN KWAZULU·NATAL WITH MANAGEMENT RECOMMENDATIONS

205
Pianka, E.R., (1966). Latitudinal gradients in species diversity: a review of concepts.
The American Naturalist 100, 33-46.
Picker, M., Griffiths, C. & Weaving, A, (2002). Field guide to insects of South Africa.
Struik Publishers, Cape Town, South Africa.
Pimentel, D., Stachow, V., Taknes, D.A, Brubaker, H.W., Dumas, A.R., Meaney, J.J.,
O'Niel, J.A.S., Onsi, D.E & Corzilius, D.B., (1992). Conserving biological diversity in
agricultural/forestry systems. Bioscience 40,354-362.
Pitt, W.C., (1999). Effects of Multiple vertebrate predators on grasshopper habitat
selection: trade-offs due to predation risk, foraging, and thermoregulation. Evolutionary
Ecology 13,499-515.
Polhemus, D.A, (1993). Conservation of aquatic insects. Worldwide crisis of localized
threats. American Zoologist 33, 588-598.
Ponder, W. F., Colgan, D.J., Clark, G.A., Miller, AC. & Terzis, T., (1994).
Microgeographic, genetic and morphological differentiation of freshwater snails - the
Hydrobiidae of Wilsons Promontory, Victoria, southeastern Australia. Australian
Journal of Zoology 42, 557-678.
Pollard, E, (1977). A method for assessing changes in abundances of butterflies.
Biological Conservation 12, 115-131.
Pollard, E., (1984). Synoptic studies On butterfly abundance. In: The biology of
butterflies. (Eds. Vane-Wright, RI. & Ackery, P.R.). Academic Press, London, United
Kingdom. pp. 59-61.
Pollard, E & Yates, T.J., (1993). Monitoring butterflies for ecology and conservation.
Chapman and Hall, London, United Kingdom..
, BIOTIC INDICATORS OF GRASSLAND CONDITION IN KWAZULU·NATALWITH MANAGEMENT RECOMMENDATIONS

206
Porter, E.E. & Redak, RA, (1996). Short-term recovery of the grasshopper
communities (Orthoptera: Acrididae) of a California native grassland after prescribed
fire. Environmental Entomology 25, 987-992.
Porter, E.E. & Redak, RA, (1997). Diet of migratory grasshopper (Orthoptera:
Acrididae) in a California native grassland and the effect of prescribed spring burning.
Environmental Entomologist 26, 234-240.
Pott, RMcC., (1997). Plantation forestry in South Africa and its impact on biodiversity
and water. South African Forestry Journal 180, 45-48.
Poulter, AG., (1993). A leaf key to some common grasses of the Natal Drakensberg.
South African Forestry Research Institute, South Africa.
Port, G.R & Thompson, J.R, (1980). Outbreaks of insect herbivores on plants along
motorways in the United Kingdom. Journal of Applied Ecology 17,649-656.
Power, M.E., Tilman, D. Estes, J.A, Menge, B.A, Bond, W.J., Mills, l.S., Daily, G.,
Castilla, J.C., Lubchenko, J. & Paine, RT., (1996). Challenges in the quest for
keystones. BioScience 46, 609-620.
Prendergast, JR., Quinn, RM., Lawton, J.H., Eversham, B.C. & Gibbons, D.W. (1993).
Rare species, the coincidence of diversity hotspots and conservation strategies. Nature
365, 335-337.
Prendini, l., Theron, L-J., van der Merwe, K. & Owen-Smith, N., (1996). Abundance
and guild structure of grasshoppers (Orthoptera: Acridoidea) in communally grazed
and protected savanna. South African Journal of Zoology 31,120-130.
Pringle, E.l.L., Henning, G.A & Ball, J.B., (1994). Pennington's butterflies of southern
Africa. 2nd Edition. Struik Winchester, Cape Town, South Africa.
BIOTIC INDICATORS OF GRASSLAND CONDITION IN KWAZULU·NATAL WITH MANAGEMENT RECOMMENDATIONS
207
Pryke, S.R. & Samways, M.J., (2003). Quality of remnant grassland linkages for adult
butterflies (Lepidoptera) in an afforested African landscape. Biodiversity and
Conservation 12, 1985-2004.
Quinn, M.A. & Walgenbach, 0.0., (1990). Influence of grazing history on the
community structure of grasshoppers of mixed-grass prairie. Environmental
Entomology 19, 1756-1766.
Quinn, M.A., Kepner, RL., Walgenbach, 0.0., Bohls, RA, Pooler, P.D., Foster, RN.,
Rueter, K.C. & Swain, J.L., (1991). Habitat characteristics and grasshopper community
dynamics on mixed-grass rangeland. The Canadian Entomologist 123,89-105.
Quinn, M.A., Johnson, P.S., Butterfield, C.H. & Walgenbach, 0.0., (1993). Effect of
grasshopper (Orthoptera: Acrididae) density and plant composition on growth and
destruction of grasses. Environmental Entomology 22, 993'-1002.
Raven, P.H. & Wilson, E.O., (1992). A fifty-year plan for biodiversity surveys. Science
258, 1099-1100.
Rebelo, AG., (1997). Conservation. In: Vegetation of southern Africa. (Eds. Cowling,
RM., Richardson, D.M. & Pierce, S.M.). Cambridge University Press, Cambridge,
United Kingdom. pp. 571-589.
Reed, C.C., (1997). Responses of prairie insects and other arthropods to prescription
burns. Natural Areas Journal 17, 380-385.
Reid, W.v., (1998). 8iodiversity hotspots. Trends in Ecological Evolution 13, 275-279.
Reid, W.v. & Miller, K.R, (1989). Keeping options alive: the scientific basis for
conserving biodiversity. World Resources Institute, Washington, United States of
America.
Rentz, D.C.F., (1978). Orthoptera. In: Biogeography and ecology of southern Africa.
(Ed. Werger, M.J.A). W. Junk, The Hague.
Blonc INDICATORS OF,GRASSLAND CONDmON IN KWAZULU·NATAL WITH MANAGEMENT RECOMMENDATIONS

208
Rentz, D.C.F & Weissman, D.B., (1981). Faunal affinities, systematics and bionomics
of the Orthoptera of California Channel Islands. University of California Publications,
Entomology 94, 1-240.
Resh, V.H. & Jackson, J.K, (1993). Rapid assessment approaches to biomonitoring
using benthic macroinvertebrates. In: Freshwater biomonitoring and benthic
macroinvertebrates. (Eds. Rosenberg, D.M. & Resh, V.M.) Chapman and Hall, New
York, United States of America. pp. 195-233.
Reyers, B.. Fairbanks. D. H. K, Wessels, K J. & van Jaarsveld, AS., (2002a). A
multicriteria approach to reserve selection: addressing long-term biodiversity
maintenance. Biodiversity and Conservation 11, 769-793.
Rice, L.A, (1932). Effect of fire on animal communities. Ecology 13, 392-401.
Riechert, S.B. & Reeder, W.C., (1970). Effects of fire on spider distribution in
southwestern Wisconsin prairies. In: Second Northern Illinois Prairie Workshop. (Ed.
Zimmerman, J.H.). Rock Valley College, Illinois, United States of America.
Rivers-Moore, N.A & Samways, M.J., (1996). Game and cattle trampling. and impacts
of human dwellings on arthropods at a game park boundary. Biodiversity and
Conservation 5, 1545-1556.
Robertson, P.A, Clarke, S.A & Warren, M.S., (1995). Woodland management and
butterfly diversity. In: Ecology and conservation of butterflies. (Ed. Pullin, AS.).
Chapman and Hall, London, United Kingdom. pp. 113-122.
Robinson, E.T., Gibbs-Russel, G.E., Trollope, W.S.W. & Downing, B.H., (1979).
Assessment of short-term burning treatments on the herb layer of False Thornveld of
the eastern Cape. Proceedings of the Grassland Society of South Africa 14, 79-84.
BIOTIC INDICATORS OF GRASSLAND CONDITION IN KWAZULU·NATAL WITH MANAGEMENT RECOMMENDATIONS
209
Robinson, G.R, Holt, RD., Gaines, M.S., Hamburg, S.P., Johnson, M.L., Fitch, H.S. &
Martinko, E.A., (1992). Diverse and contrasting effects of habitat fragmentation.
Science 257,524-526.
Rodell, C.F., (1997). A grasshopper model for a grassland ecosystem. Ecology 58,
227-245.
Rohlf, RR., & Sokal, F.J., (1995). Biometry: the principles and practices of statistics in
biological research. 3rd Edition. Freeman and Company, New York, United States of
America.
Roux, P.W. & Opperman, D.P.J., (1986). Soil Erosion. In: The Karoo Biome: a
preliminary synthesis. Part 1- physical environment. (Eds. Cowling, RM., Roux, P.W. &
Pieters, A.J.H.). South African National Scientific Programme Report, Pretoria. 124, pp.
92-111.
Rowe-Rowe, D.T. & Lowry, P.B., (1982). Influence of fire on small mammal populations
in the Natal Drakensberg. South African Journal of Wildlife Research 12, 130-139.
Rozenweig, M.L., (1995). Species diversity in space and time. Cambridge University
Press, New York, United States of America.
Rozenweig, M.L. & Abramsky, Z., (1993). How are productivity and diversity related?
Species diversity in ecological communities. In: Historical and geographical
perspectives. (Eds. Ricklefs, E.R & Schluter, D.). Chicago University Press, Chicago,
United States of America. pp. 52-65.
Rushton, S.P., Eyre, M.D. & Luff, M.L., (1990). The effects of scrub management on
the ground beetles of oolitic limestone grassland at Castor Highlands national nature
reserve, Cambridgeshire, United Kingdom. Biological Conservation 51, 97-111.
BIOTIC INDICATORS OF GRASSLAND CONDITION IN KWAZULU-NATAl WITH MANAGEMENT RECOMMENDATIONS

210
Sala, O.E., Chapin, F.S. Ill, Armesto, J.J., Berlow, E., Bloomfield, J., Dirzo, R., Huber
Sanwald, E., Huenneke, L.F., Jackson, R.B., Kinzig, A., Leemans, R., Lodge, D.M.,
Mooney, H.A., Oesterheld, M., Poff. N.L., Sykes, M.T., Walker, B.H., Walker, M. &
Wall, D.H., (2000). Global biodiversity scenarios for the year 2100. Science 287, 1770
1774.
Samways, M.J., (1990). Land forms and winter habitat refugia in the conservation of
montane grasshoppers in South Africa. Conservation Biology 4, 375-382.
Samways, M.J., (1993). Dragonflies (Odonata) in taxic overlays and biodiversity
conservation. In: Perspectives on insect conservation. (Eds. Gaston, K.J., New, T.R. &
Samways, M.J.). Intercept, Andover, United Kingdom. pp. 111-123.
Samways, M.J., (1994). Insect conservation biology. Chapman and Hall, London,
United Kingdom.
Samways, M. J., (1995). Southern hemisphere insects: their variety and the
environmental pressures upon them. In: Insects in a changing environment. (Eds.
Harrington, R. & Stork, N.E.). Academic Press, London, United Kingdom. pp. 297-320.
Samways, M.J., (1997). Conservation Biology of Orthoptera. In: The bionomics of
grasshoppers, katydids and their kin. (Eds. Gangwere, S.K, Muralirangan, M.C. &
Muralirangan, M.). CAB International, Wallingford, United Kingdom. pp. 481-496.
Samways, M.J., (1999b). Landscape triage for conserving insect diversity. In: The
other 99%: the conservation and biodiversity of invertebrates. (Eds. Ponder, W. &
Lunney, D.). The Royal Zoological Society of New South Wales, Mosman, Australia.
pp. 269-273.
Samways, M.J., (2002a). Caring for the multitude. Biodiversity and Conservation 11,
341-343.
Blonc IN,DICATORS OF GRASSLAND CONDITION IN KWAZULU·NATAL WITH MANAGEMENT RECOMMENDATIONS

211
Samways, M.J. & Kreuzinger, K, (2001). Vegetation, ungulate and grasshopper
interactions inside vs. outside an African savanna game park. Biodiversity and
Conservation 10,1963-1981.
Samways, M.J. & Lockwood, J.A., (1998). Orthoptera conservation: pests and
paradoxes. Journal of Insect Conservation 2, 143-149.
Samways, M.J. & Moore, S.D., (1991). Influence of exotic conifer patches on
grasshopper (Orthoptera) assemblages in a grassland matrix at a recreational resort,
Natal, South Africa. Biological Conservation 57,205-219.
Samways, M.J. & Sergeev, M.G~, (1997). Orthoptera and landscape change. In: The
bionomics of grasshoppers, katydids and their kin. (Eds. Gangwere, S.K,
Muralirangan, M.C. & Muralirangan, M.). CAB International, Wallingford, United
Kingdom. pp. 147-162.
Saunders, D.A., Hobbs, R.J., & Margules, C.R., (1991). Biological consequences of
ecosystem fragmentation: a review. Cbnservation Biology 5,18-32.
Savory, A. & Butterfield, J., (1999). Holistic management: a new framework for
decision-making. Island Press, Washington, United States of America.
Sax, D.F. & Gaines, S.D., (2003). Species diversity: from global decreases to local
increases. Trends in Ecology and Evolution 18, 561-566.
Scheffer, M. & Carpenter, SR., (2003). Catastrophic regime shifts in ecosystems:
linking theory to observation. Trends in Ecology and Evolution 18, 648-656.
Scholtz, C.H. & Chown, S.L., (1993). Insectconservation and extensive agriculture: the
savanna of southern Africa. In: Perspectives on insect conservation. (Eds. Gaston,
KJ., New, T. R. & Samways, M.J.). Intercept, Andover, United Kingdom. pp. 75-95.
BIOTIC INDICATORS OF GRASSLAND CONDITION IN KWAZULU·NATAL WITH MANAGEMENTRECOMMENDATIONS

212
Scott, J.D., (1955). Principles of pasture management. In: The grasses and pastures of
South Africa. (Ed. Meredith, D.). Central News Agency, Johannesburg, South Africa.
pp. 601-623.
Scott, J.D., (1970). Pros and cons of eliminating veld fires. Proceedings of the
Grassland Society of South Africa 5, 23-26.
Scott, J.D., (1984). A historical review of research on fire in South Africa. In: Ecological
effects of fire inSouth African ecosystems. (Eds. Booysen, P. de V. & Tainton, N.M.).
Springer-Verlag, Berlin, Germany. pp. 53-65.
Scott-Shaw, R., (2002). What is Mistbelt Grassland? Notes from a talk given by Rob
Scott-Shaw at KwaZulu-Natal Nature Conservation Head Office, Pietermaritzburg,
South Africa.
Seastedt, T.R., Briggs, J.M. & Gibson, D.J., (1991). Controls of N limitation in tallgrass
prairie. Oecologia 87, 72-79.
Sergeev, M.G., (1997). Ecogeographical distribution of Orthoptera. In: The bionomics
of grasshoppers, katydids and their kin. (Eds. Gangwere, S.K., Muralirangan, M.C. &
Muralirangan, M.). CAB International, Wallingford, United Kingdom. pp. 129-146.
Sergeev, M. G., (1998). Conservation of orthopteran biological diversity relative to
landscape change in temperate Eurasia. Journal of Insect Conservation 2, 247-252.
Shackleton, C.M., (2000). Comparison of plant diversity in protected and communal
lands in the Bushbuckridge lowveld savanna, South Africa. Biological Conservation 94,
273-285.
Shapiro, A.M., (1975). The temporal component of butterfly species diversity. In:
Ecology and evolution of communities. (Eds. Cody, M.L. & Diamond, J.M.) Belknap
Press, Massachusetts, United States of America.
BIOTIC INDICATORS OF GRASSLAND CONDITION IN KWAZUlU·NATAl WITH MANAGEMENT RECOMMENDATIONS
213
Shapiro, A.M., (1996). Status of butterflies. In: Sierra Nevada ecosystem project: final
report to congress. Assessments and scientific basis for management options. (Volume
11). University of California, Centers for Water and Wild land Resources, California,
United States of America.
Shreeve, T.G. & Mason, C.F., (1980). The number of butterfly species in woodlands.
Oecologia 45, 414-418.
Simberloff, D., (1987). The spotted owl fracas: mixing academic, applied and political
ecology. Ecology 68,766-772.
Simberloff, D., (1998). Flagships, umbrellas and keystones: is single-species
management passe in the landscape era? Biological Conservation 83, 247-257
Simonson, S.E., Opler, P.A., Stohlgren, T.J. & Chong, G.W., (2001). Rapid
assessment of butterfly diversity in a montane landscape. Biodiversity and
Conservation 10, 1369-1386.
Skinner, K.M., (2000). The past, present and future of rangeland grasshopper
management. Rangelands 22, 24-28.
Smart, S. M., Bunce, R. G. H., Firbank, L. G. & Coward, P., (2002). Do field
boundaries act as refugia for grassland plant species diversity in intensively managed
agricultural landscapes in Britain? Agriculture, Ecosystems and Environment 91, 73-87.
Smith, K.D., (1974). The utilisation of gum trees by birds in Africa. Ibis 116,155-164.
Snyman, H.A., (2002). Fire and the dynamics of a semi-arid grassland: influence on
soil characteristics. African Journal of Range and Forage Science 19, 137-145.
Snyman, H.A., (2004). Estimating the short-term impact of fire on rangeland
productivity in a semi-arid climate of South Africa. Journal of Arid Environments 59,
685-697.
Blonc INDICATORS OF GRASSLAND CONDmON IN KWAZULU·NATAL WITH MANAGEMENT RECOMMENDAnONS
214
Sober6n, J., Rodriguez, P. & Vasquez-Dominguez, P., (2000). Implications of the
hierarchical structure of biodiversity for the development of ecological indicators of
sustainable use. Ambio 29,136-142.
Solem, A & McKenzie, N.L., (1991). The composition of land snail assemblages in the
Kimberley rainforests. In: Kimberley rainforests. (Eds. Mckenzie, N.L., Johnston, R.B. &
Kendrick, P.G.) Surrey Beatty and Sons, Chipping Norton, United Kingdom. pp. 247
263.
Sotherton, N.W. & Self, M.J., (2000). Changes in plant and arthropod biodiversity on
lowland farmland: an overview. In: Ecology and Conservation of Lowland Farmland
Birds. (Eds. Aebischer, N.J., Evans, AD., Grice, PV. & Vickery, J.A). Proceedings of
the British Ornithologists Union Spring Conference, Tring. pp. 26-35.
Soule, M.E. & Kohm, K.A, (1989). Research priorities for conservation biology. Island
Press, Washington, United States of America.
Southwood, T.R.E., (1978). Ecological methods. Chapman and Hall, New York, United
States of America.
Spellerberg, I.F., (1991). Monitoring ecological change. Cambridge University Press,
Cambridge, United Kingdom.
Spellerberg, I.F. & Sawyer, J.W.D., (1996). Standards for biodiversity: a proposal
based on biodiversity standards for forestry plantations. Biodiversity and Conservation.
5,447-459.
Spence, J.R., & Niemela, J., (1994). Sampling carabid assemblages with pitfall traps:
the madness and the method. The Canadian Entomologist 126,881-894.
Spence, J.R., Langor, D.W., Niemela, J., Carcamo, H.A & Currie, CR., (1996).
Northern forestry and carabids, the case for concern about old-growth species.
Annales Zoologici Fennici 33, 173-184.
Blonc INDICATORS OF GRASSLAND CONDITION IN KWAIULU·NATAl WITH MANAGEMENT RECOMMENDATIONS

215
Spitzer, K., Novotny, V., Tonner, M. & Leps, J., (1993). Habitatpreferences, distribution
and seasonality of the butterflies in a montane tropical rain forest, Vietnam. Journal of
Biogeography. 20, 109-121.
Stebaev, I.V., 1970. Periodic changes in the ecological distribution of grasshoppers in
the temperate and extreme continental Steppe regions, and their importance for the
local ecosystems. In: Proceedings of the international study conference on current and
future problems of acridology. Centre for Overseas Pest Research, London. pp. 207
212.
Steffan-Dewenter, I. & Tscharntke, T., (1997). Early succession of butterfly and plant
communities on set-aside fields. Oecologia 109, 294-302.
Stein, E.D. & Ambrose, R.F.; (1998). A rapid impact assessment method for use in a
regulatory context. Wetlands 18,379-392.
Stewart, D.A.B. & Brown, H.D., (1995). Locust control: assessing the environmental
impact. Plant Protection News 40, 3-4.
Stewart, D.A.B., (1998). Non-target grasshoppers as indicators of the side effects of
chemical locust control in the Karoo, South Africa. Journal of Insect Conservation 2,
263-276.
Steytler, N.S. & Samways, M.J., (1995). Biotope selection by adult male dragonflies
(Odonata) at an artificial lake created for insect conservation in South Africa. Biological
Conservation 72, 381-386.
Stockwell, C.A, Hendry, AP. & Kennison, M.J., (2003). Contemporary evolution meets
conservation biology. Trends in Ecology and Evolution 18, 94-101.
Sutton, S.L. & Collins, N.M., (1991). Insects and tropical forest conservation. In: The
conservation of insects and their habitats. (Eds. Collins, N.M. & Thomas, J.A).
Academic Press, London, United Kingdom. pp. 405-424.
BIOTIC INDICATORS OF GRASSLAND CONDITION IN KWAZULU·NATAL WITH MANAGEMENT RECOMMENDATIONS

216
Swengel, A.B., (1990). Monitoring butterflies using the fourth of July butterfly count.
American Midland Naturalist 124, 395-406.
Swengel, A.B., (1995). Observations of spring larvae of Lycaeides Melissa samuelis
(Lepidoptera: Lycaenidae) in central Wisconsin. Great Lakes Entomologist 28, 155
170.
Swengel, A.B., (1996a). Effects of fire and hay management on abundance of prairie
butterflies. Biological Conservation 85, 73-85.
Swengel, A.B., (1996b). Observation of Incisalia irus (Lepidoptera: Lycaenidae) in
central Wisconsin 1988-1995. Great Lakes Entomologist 29,47-62.
Swengel, A.B., (2001). A literature review of insect responses to fire, compared to
other conservation managements of open habitat. Biodiversity and Conservation 10,
1149-1161.
Sword, G.A., (2002). A role for phenotypic plasticity in the evolution of aposematism.
Proceedings of the Royal Society of London Series B Biological Sciences 269, 1639
1644.
Taboda, M.A. & Lavado, RS., (1993). Influence of cattle trampling on soil porosity
under alternate dry and ponded conditions. Soil Use Management 9, 139-153.
Tainton, N.M., (1984a). Introduction to the concepts of development, production and
stability of plant communities. In: Veld and pasture management in South Africa. (Ed.
Tainton, N.M.). Shuter and Shooter, Pietermaritzburg, South Africa. pp. 1-24.
Tainton, N.M., (1984b). The ecology of the main grazing lands of South Africa. In: Veld
and pasture management in South Africa. (Ed. Tainton, N.M.). Shuter and Shooter,
Pietermaritzburg, South Africa. pp. 25-56.
Tainton, N. M., (1984c). Veld burning. In: Veld and pasture management in South
Africa. (Ed. Tainton, N.M.). Shuter and Shooter, Pietermaritzburg, South Africa. pp.
363-381.
BIOTIC INDICATORS OF GRASSLAND CONDITION IN KWAZULU·NATAL WITH MANAGEMENT RECOMMENDATIONS

216
Swengel, A.B., (1996a). Effects of fire and hay management on abundance of prairie
butterflies. Biological ConseNation 85, 73-85.
Swengel, A.B., (1996b). Observation of Incisalia irus (Lepidoptera: Lycaenidae) in
central Wisconsin 1988-1995. Great Lakes Entomologist 29, 47-62.
Swengel, A.B., (2001). A literature review of insect responses to fire, compared to
other conservation managements of open habitat. Biodiversity and ConseNation 10,
1149-1161.
Sword, G.A., (2002). A role for phenotypic plasticity in the evolution of aposematism.
Proceedings of the Royal Society of London Series B Biological Sciences 269, 1639
1644.
Taboda, M.A. & Lavado, R.S., (1993). Influence of cattle trampling on soil porosity
under alternate dry and ponded conditions. Soil Use Management 9, 139-153.
Tainton, N.M., (1984a). Introduction to the concepts of development, production and
stability of plant communities. In: Veld and pasture management in South Africa. (Ed.
Tainton, N.M.). Shuter and Shooter, Pietermaritzburg, South Africa. pp. 1-24.
Tainton, N.M., (1984b). The ecology of the main grazing lands of South Africa. In: Veld
and pasture management in South Africa. (Ed. Tainton, N.M.). Shuter and Shooter,
Pietermaritzburg, South Africa. pp. 25-56.
Tainton, N.M., (1984c). Veld burning. In: Veld and pasture management in South
Africa. (Ed. Tainton, N.M.). Shuter and Shooter, Pietermaritzburg, South Africa. pp.
363-381.
Tainton, N.M., Booysen, P. de v., Bransby, 0.1. & Nash, R.C., (1978). Long-term
effects of burning and mowing on tall grassveld in Natal: dry matter production.
Proceedings of the Grassland Society of South. Africa 13, 41-44.
BIOTIC INDICATORS OF GRASSLAND CONDITION IN KWAZULU·NATAL WITH MANAGEMENT RECOMMENDATIONS

217
Tainton, N.M. & Camp, K.G.T., (1999). Bioresource groups 5,6 and 7: Moist and Dry
Midlands Mistbelt and Northern Mistbelt. In: Veld in KwaZulu-Nata/. (Eds. Hardy, M.B.
& Hurt, C.R.). KwaZulu-Natal Department of Agriculture. pp. 81-87.
Tainton, N.M. & Mentis, MT., (1984). Fire in grassland. In: Ecological effects of fire in
South African ecosystems. (Eds. Booysen, P. de V. & Tainton, N.M.). Springer-Verlag,
Berlin, Germany. pp. 115-147.
Tarboton, W.R., (1997a). South Africa's grasslands: the cinderella biome. Africa
Birds & Birding 2,57-60.
Taylor, B., (2004). Personal Communication.
Taylor, R.J. & Doran, N., (2001). Use of terrestrial invertebrates as indicators of the
ecological sustainability of forest management under the Montreal Process. Journal of
Insect Conservation 5,221-231.
ter Braak, C.J.F. & Smilauer, P., (1998). Canoco reference manual and user's guide to
Canoco for windows: software for canonical community ordination (Version 4).
Microcomputer Power. Ithica, New York, United States of America.
Theile, H.U., (1977). Carabid Beetles in their environments. Springer-Verlag, Berlin,
Germany.
Thomas, J.A., (1983). The ecology and conservation of Lysandra bellargus
(Lepidoptera: Lycaenidae) in Britain. Journal ofApplied Ecology 20,59-83.
Thomas, J.A., (1991). Rare species conservation: case studies of European butterflies.
In: The scientific management of temperate communities for conservation. (Eds.
Spellerberg, I.F., Goldsmith, F.B. & Morris, M.G.). Blackwell Science, Oxford, United
Kingdom. pp. 149-197.
Thomas, C.D., (1991). Habitat use and geographic ranges of butterflies from the wet
lowlands of Costa Rica. Biological Conservation 55, 269-281.
Blpnc INDICATORS OF GRASSLAND CONDmON IN KWAZULU·NATAL WITH MANAGEMENT RECOMMEioiDAnONS
218
Thomas, C.D., (1995). Ecology and conservation of butterfly metapopulations in the
fragmented British landscape. In: Ecology and conservation of butterflies. (Ed. Pullin,
A.S.). Chapman and Hall, London, United Kingdom. pp. 46-63.
Thomas, C.D. & Abery, J.C.G., (1995). Estimating rates of butterfly decline from
distribution maps: the effect of scale. Biological Conservation 73, 59-65.
Thomas, C.D. & Mallorie, H.C., (1985). Rarity, species richness and conservation:
butterflies of the Atlas Mountains in Morocco. Biological Conservation 35,95-117.
Thomas, C. F.G. & Marshall, E.J.P., (1999). Arthropod abundance and diversity in
differently vegetated margins of arable fields. Agriculture, Ecosystems and
Environment 72, 131-144.
Tilman, D., (1982). Resource competition and community structure. Princeton
University press, Princeton, United States of America.
Topping, C.J. & Sunderland, K.D., (1992). Limitations to the use of pitfall traps in
ecological studies exemplified by a study of spiders in a field of winter wheat. Joumal
ofApplied Ecology 29,485-491.
Trollope, W.S.W., (1984a). Fire in savanna. In: Ecological effects of fire in South
African ecosystems. (Eds. Booysen, P. de V. & Tainton, N.M.). Springer-Verlag, Berlin.
pp. 149-176.
Turner, M.G., (1989). Landscape ecology: the effect of pattern on process. Annual
Review ofEcology and Systematics 20, 171-197.
Turner, M.G. & Gardner, R.H., (1991). Quantitative methods in landscape ecology.
Springer-Verlag, New York, United States of America.
Tyson, P.D. & Crimp, S.J., (1998). The climate of the Kalahari transect.: Transactions of
the Royal Society of South Africa 53,93-112.
BIOTIC INDICATORS OF GRASSLAND CONDITION IN KWAZULU-NATALWITH MANAGEMENT RECOMMENDATIONS

219
Uvarov, S.P., (1977). Grasshoppers and locusts, Vol. 2. Centre for Overseas Pest
Research, London, United Kingdom.
van Jaarsveld, AS., Freitag, S., Chown, S. L., Muller, C., Koch, S., Hull, H., Sellamy,
C., KrOger, M., Endrody-Younga, S., Mansell, M. W. & Scholtz, C. H., (1998).
Biodiversity assessment and conservation strategies. Science 279, 2106-2108.
van Oudtshoorn, F.P., (1992). Guide to grasses of South Africa. Briza Publications,
Arcadia, South Africa.
Vanderwoude, C., Andersen, AN. & House, AP.N., (1997). Community organization,
biogeography and seasonality of ants in an open forest of south-eastern Queensland.
Australian Journal of Zoology 45, 523-537.
Van Wieren, S.E., (1989). The management of populations of large mammals. In: The
scientific management of temperate communities for conservation. (Eds. Spellerberg,
I.F., Goldsmith, F.B. & Morris, M.G.). Blackwell Scientific Publications, Oxford, United
Kingdom. pp. 103-127.
van Wingerden, W.K.R.E., Musters, J.C.M. & Maaskamp, F.I.M., (1991a). The
influence of cattle grazing intensity on grasshopper abundance (Orthoptera: Acrididae).
Proceedings of Experimental and Applied Entomology 2, 28-34.
van Wingerden, W.K.R.E., Musters, J.C.M. & Maaskamp, F.I.M., (1991 b). The
influence of temperature on the duration of egg development in West European
Grasshoppers (Orthoptera: Acrididae). Oecologia 87, 417-423.
van Wingerden, W.K.R.E., Musters, J.C.M., Kleukers, R.M.J.C., Bongers, W. & van
Biezen, J.B., (1991). The influence of cattle grazing intensity on grasshopper
abundance (Orthoptera: Acrididae). Proceedings of Experimental and Applied
Entomology 2,28-34.
BIOTIC INDICATORS OF GRASSLAND CONDITION IN KWAZULU-NATAL WITH MANAGEMENT RECOMMENDATIONS

220
van Wingerden, W.K.R.E, van Kreveld, AR. & Bongers, W., (1992). Analysis of
species composition and abundance of grasshoppers (Orthoptera: Acrididae) in natural
and fertilized grasslands. Journal ofApplied Entomology. 113, 138-152.
Veldtman, R., McGeoch, M.A & Scholtz, C.H., (2002). Variability in cocoon size in
southern African wild silk moths: implications for sustainable harvesting. African
Entomology. 10, 127-136.
Verdu, JR., Crespo, M.B. & Galante, E, (2000). Conservation strategy of a nature
reserve in Mediterranean ecosystems: the effects of protection from grazing on
biodiversity. Biodiversity and Conservation 9, 1707-1721.
Vitt, L.J., Avilapires, T.C.S., Esposito, M.C. & Miles, D.B., (2000). Niche segregation
among sympatric Amazonian Teiid lizards. Oecologia 122, 410-420.
Wagge, B.E., (1985). Trapping efficiency of carabid beetles in glass and plastic pitfall
traps containing different solutions. Fauna Norvegicum Series (B) 32, 33-36.
Walker, B.H., (1992). Biological diversity and ecological redundancy. Conservation
Biology 6, 18-23.
Walpole, M.J. & Leader-Williams, N., (2002). Tourism and flagship species in
conservation. Biodiversity and Conservation 11, 543-547.
Warren, M.S., Pollard, E & Bibby, T.J., (1986). Annual and long term changes in a
population of the wood white butterfly Leptidea sinapis. Journal of Animal Ecology 55,
707-719.
Warren, S.D., Scifres, C.J. & Teel, P.D., (1987). Response of grassland arthropods to
burning: a review. Agriculture, Ecosystems and Environment 19, 105-130.
Webb, M.R. & Pullin, AS., (1998). Effects of submergence by winter floods on
diapausing caterpillars of a wetland butterfly, Lycaena dispar batavus. Ecological
Entomology 23,96-99.
BIOTIC INDICATORS OF GRASSLAND CONDITION IN KWAZULU-NATAL WITH MANAGEMENT RECOMMENDATIONS

221
Weibull, A.C., Ostman, O. & Granqvist, A., (2003). Species richness in
agroecosystems: the effect of landscape, habitat and farm management. Biodiversity
and ConseNation 12, 1335-1355.
Weiss, S.8., White, RR, Murphy, 0.0. & Erhlich, PR., (1987). Growth and dispersal
of larvae of the checkerspot butterfly Euphydryas editha. Oikos 50, 161-166.
Wettstien, W. & Schmid,B., (1999). Conservation of arthropod diversity in montane
wetlands: effect of altitude, habitat quality and habitat fragmentation on butterflies and
grasshoppers. Journal ofApplied Ecology 36, 363-373.
Whitford, W.G., Van Zee, J., Nash, M.S., Smith, W.E. & Herrick, J.E., (1999). Ants as
indicators of exposure to indicators of environmental stressors in North American
desert grasslands. Environmental Monitoring and Assessment 54, 143-171.
Wiens, J.A., (1989). Spatial scaling in ecology. Functional Ecology 3,385-397.
Wiens, J.A., (1997). The emerging role of patchiness in conservation biology. In: The
ecological basis for conservation: heterogeneity, ecosystems and biodiversity (Eds.
Pickett, S.T.A., Ostfeld, RS., Shachak, M. & Likens, G.E.). Chapman and Hall, New
York United States of America. pp. 93-107.
Wiens, J.A., Schooley, RL. & Weeks, RD., (1997). Patchy landscapes and animal
movements: do beetles percolate? Oikos 78, 257-264.
Wilcove, D., (1993). Getting ahead of the extinction curve. Ecological Applications 3,
218-220.
Williams, P.H. & Gaston, K.J., (1994). Measuring more of biodiversity: can higher taxon
richness predict wholesale species richness? Biological Conservation 67,211-217.
Willott, S.J. & Hassall, M., (1998). Life-history responses of British grasshoppers
(Orthoptera: Acrididae) to temperature change. Functional Ecology 12,232-241.
Blonc INDICATORS OF GRASSLAND CONDITION IN KWAZULU·NATAL WITH MANAGEMENT RECOMMENDATIONS

222
With, K.A., (1994). Using fractal analysis to see how species perceive landscape
structure. Landscape Ecology 9,25-36.
Woiwood, I.P. & Thomas, J.A., (1993). The ecology of butterflies and moths at the
landscape scale. In: Landscape ecology in Britain. (Eds. Hannes-Young, R & Bunce,
RG.H.). University of Nottingham Press, Nottingham, United Kingdom. pp. 76-92.
Wood, B. & Gillman; M.P., (1998). The effects of disturbance on forest butterflies using
two methods of sampling in Trinidad. Biodiversity and Conservation 7, 597-616.
Wood, P. A. & Samways, M. J., (1991). Landscape element pattern and continuity of
butterfly flight paths in an ecologically landscaped botanic garden, Natal, South Africa.
Biological Conservation 58, 149-166.
Wright, D.E., Bailey, P. & Swincer, D., (1984). Pest control: recent advances and future
prospects. (Eds. Bailey, P. & Swincer, D.). Proceedings of the Fourth Australian
Applied Entomological Research Conference, Adelaide. 56-60.
Wright, M.G., (1993). Insect conservation in the African Cape Fynbos, with special
reference to endophagous insects. In: Perspectives of insect conservation. (Eds.
Gaston, K.J., New, T.R & Samways, M.J.). Intercept, Andover, United Kingdom. pp.
97-110.
Wright, M.G. & Samways, M.J., (1998). Insect species richness tracking plant species
richness in a diverse flora: gall insects in the Cape Floristic Region, South Africa.
Oecologia 115,427-433.
Wright, M.G. & Samways, M.J., (1999). Plant characteristics determine insect borer
assemblages on Protea species in the Cape Fynbos, andimportahce for conservation
management. Biodiversity and Conservation 8, 1089-1100.
Yen, A.L. & Butcher, R.J., (1997). An overview of conservation of non-marine
invertebrates in Australia. Endangered Species Program. Environment Australia,
Canberra, Australia.
BIOTIC INDICATORS OF GRASSLAND CONDITION IN KWAIULU·NATAL WITH MANAGEMENT RECOMMENDATIONS

223
York, A, (1999). Long-term effects of frequent low-intensity burning on the abundance
of litter-dwelling invertebrates in coastal blackbutt forests of southeastern Australia.
Journal of Insect Conservation 3, 191-199.
Yoshino, M.M., 1965. Climate in a small area. University of Tokyo Press, Tokyo,
Japan.
Zaloumis, G., (2004). Personal Communication.
Zar, J.H., (1984). Biostatistical analysis. 2nd Edition. Prentice-Hall, Englewood Cliffs,
United States of America.
Zschokke, S., Dolt, D., Rusterholz, H-P., Oggier, P., Braschler, 8., Thommen, G.H.,
Ludin, E., Erhardt, A & Baur, B., (2000). Short-term responses of plants and
invertebrates to experimental small-scale grassland fragmentation. Oecologia 125,
559-572.
Zulka, K.P., Milasowszky, N. & Lethmayer, C., (1997). Spider biodiversity potential of
an ungrazed and a grazed inland salt meadow in the National Park 'Neusiedler See
Seewinkel' (Austria): implications for management (Arachnida: Araneae). Biodiversity
and Conservation 6,75-88.
BIOTIC INDICATORS OF GRASSLAND CONDITION IN KWAZULU·NATAl WITH MANAGEMENT RECOMMENDATIONS

APPENDIX 1. Table 1. The grasshopper species response to aspect for the 10 study sites (ISA value = P-value). *= Significant atp =0.05. Refer to Table 7 for grasshopper species codes.
SPP. CODE LOW HIGH P-yalue SPP. CODE LOW HIGH P- valueACOFER 3 0 0.51 HETGUT 0 17 0.00*ACOTIB 18 0 0.00* HETHER 1 2 1.00ACRACC 20 9 0.31 LENMIN 1 26 0.01*ACRBIC 12 1 0.10 LENOBT 7 25 0.07ACRSPP 2 0 1.00 MACBIL 27 14 0.24ANADRE 7 0 0.11 MAURUB 2 0 1.00ANEMON 6 0 0.24 OCHCAF 25 0 0.00*ANTGRA 4 13 0.36 ORNCYA 2 2 1.00CALNAT 2 1 1.00 ORTDAS 42 17 0.17CALSEM 19 0 0.01* ORTROS 13 5 0.36CANGRA 2 2 0.93 ORTZUL 1 1 1.00CATMEL 11 3 0.25 OXYHYL 0 8 0.06CONSPP 19 23 0.74 PARTRI 0 3 0.51CORSTE 14 16 0.84 PARXAN 5 8 0.67CRUCRU 54 19 0.01* PHASUL 10 7 0.71CYRAER 1 10 0.24 PHLHUM 13 5 0.32DICSPU 5 0 0.37 PHLSPP 0 2 1.00DIRABB 1 15 0.06 pHYLEP 2 0 1.00EREBAS 19 1 0.02* PNOSQU 3 1 0.63EUPCYL 0 2 1.00 QACFAS 6 13 0.51EYPPLO 2 22 0.01* RHACEP 1 4 0.57FAUMIL 8 2 0:46 SCIROS 5 0 0.27FAUROS 1 2 1.00- TETARC 3 2 0.96GASCRA 20 6 0-.21 TETTIG 2 0 1.00GASDRA 27 1 0.00* TRADRA 3 0 0.50GASVIT 3 2 0.96 VITBOT 17 17 0.98GRYLL 6 0 0.24 WHIALT 0 9 0.09GYMTEM 5 6 0.86

APPENDIX 1. Table 2. The grasshopper species response to the forbaceous plant content of the 10 study sites combined (ISAvalue = P-value). *= Significant at p =0.05. Refer to Table 7 for grasshopper species codes.
SPP. CODE WARM COOL P- value SPP. CODE WARM COOL P- value
ACOFER 0 6 0.06 HETGUT 8 4 0.67
ACOTIB 0 23 0.00* HETHER 0 6 0.14
ACRACC 10 20 0.37 LENMIN 2 25 0.03*
ACRBIC 11 1 0.19 LENOBT 6 29 0.02*
ACRSPP 1 0 1.00 MACBIL 20 21 0.83
ANADRE 6 0 0.21 MAURUB 0 2 0.38
ANEMON 0 11 0.01* OCHCAF 3 14 0.13
ANTGRA 3 18 0.09 ORNCYA 2 3 0.78
CALNAT 1 1 1.00 ORTDAS 44 14 0.12
CALSEM 14 1 0.14 ORTROS 15 3 0.18
CANGRA 2 3 0.75 ORTZUL 4 0 0.26
CATMEL 7 5 0.81 OXYHYL 0 11 0.01*
CONSPP 18 23 0.68 PARTRI 0 4 0.37
CORSTE 14 16 0.84 PARXAN 4 8 0.63
CRUCRU 46 24 0.16 PHASUL 4 16 0.12
CYRAER 1 13 0.05* PHLHUM 4 15 0.18
DICSPU 6 0 0.23 PHLSPP 0 2 0.41
DIRABB 13 1 0.17 PHYLEP 1 0 1.00
EREBAS 14 3 0.19 PNOSQU 0 6 0.11
EUPCYL 0 2 0.39 QACFAS 26 0 0.00*
EYPPLO 14 5 0.33 RHACEP 1 3 0.64
FAUMIL 5 6 0.80 SCIROS 0 3 0.54
FAUROS 0 6 0.14 TETARC 2 3 0.83
GASCRA 15 11 0.67 TETTIG 1 0 1.aoGASDRA 19 3 0.14 TRADRA 3 0 0.51GASVIT 2 3 0.93 VITBOT 14 22 O.4DGRYLL 5 0 0.40 WHIALT 6 1 0.36GYMTEM 0 19 0.00*

APPENDIX 1. Table 3. The grasshopper species response to vegetation height of the 10 study sites combined (ISA value = p.value). *= Significant at p =0.05. Refer to Table 7 for grasshopper species codes.
SPP. CODE SHORT TALL P- value SPP. CODE SHORT TALL P- valueACOFER 2 1 0.85 HETGUT 0 31 0.00*ACOTIB 17 0 0.04* HETHER 0 5 0.44
ACRACC 21 8 0.26 LENMIN 5 23 0.06ACRBIC 12 0 0.13 LENOBT 12 20 0.36ACRSPP 1 0 1.00 MACBIL 31 9 0.08ANADRE 5 0 0.42 MAURUB 1 0 1.00ANEMON 6 0 0.26 OCHCAF 19 0 0.02*ANTGRA 11 5 0.67 ORNCYA 1 5 0.58CALNAT 1 2 0.85 ORTDAS 60 3 0.00*CALSEM 16 0 0.06 ORTROS 23 0 0.01*CANGRA 1 5 0.33 ORTZUL 2 0 0.87CATMEL 7 6 0.86 OXYHYL 6 0 0.26CONSPP 25 16 0.48 PARTRI 4 0 0.50CORSTE 12 19 0.42 PARXAN 6 7 0.93CRUCRU 70 5 0.00* PHASUL 6 14 0.24
CYRAER 1 12 0.09 PHLHUM 13 3 0.33DICSPU 3 1 0.68 PHLSPP 1 0 1.00DIRABB 7 5 0.82 PHYLEP 1 0 1.00
EREBAS 13 2 0.27 PNOSQU 5 0 0.38
EUPCYL 0 3 0.31 QACFAS 14 5 0.42EYPPLO 6 16 0.23 RHACEP 1 4 0.45FAUMIL 10 1 0.32 SCIROS 4 0 0.56FAUROS 2 1 0.89 TETARC 2 2 1.00
GASCRA 21 6 0.22 TETIIG 1 0 1.00GASDRA 25 0 0.02* TRADRA 2 0 0.61GASVIT 1 4 0.60 VITBOT 21 12 0.49GRYLL 6 0 0.28 WHIALT 2 6 0.36GYMTEM 10 1 0.27

APPENDIX 1. Table 4. The grasshopper species response to veld condition scores for the 10 study sites (ISA value = P-value).*= Significant at p =0.05. Refer to Table 7 for grasshopper species codes.
SPP. CODE LOW HIGH P- value SPP. CODE LOW HIGH P- valueACOFER 0 2 0.70 HETGUT 22 0 0.00
ACOTIB 1 15 0.05 HETHER 3 1 0.71
ACRACC 11 18 0.50 LENMIN 30 1 0.00
ACRBIC 1 11 0.17 LENOBT 29 6 0.02
ACRSPP 0 1 1.00 MACBIL 14 27 0.23
ANADRE 0 6 0.24 MAURUB 0 1 1.00
ANEMON 0 5 0.45 OCHCAF 0 22 0.00
ANTGRA 18 2 0.10 ORNCYA 3 2 0.78
CALNAT 1 1 1.00 ORTROS 0 24 0.00CALSEM 0 17 0.03 ORTZUL 0 3 0.62CANGRA 3 1 0.61 ORTDAS 11 48 0.05CATMEL 4 8 0.62 OXYHYL 11 0 0.01CONSPP 21 21 0.93 PARTRI 4 0 0.39CORSTE 19 12 0.43 PARXAN 10 4 0.43CRUCRU 12 61 0.00 PHASUL 8 9 0.99
CYRAER 13 1 0.04 PHLHUM 8 9 0.89
DICSPU 0 4 0.49 PHLSPP 2 0 0.39DIRABB 4 7 0.80 PHYLEP 0 1 1.00
EREBAS 2 15 0.13 PNOSQU 1 2 0:92
EUPCYL 2 0 0.38 QACFAS 3 16 0.22EYPPLO 16 5 0.14 RHACEP 5 1 0.34FAUMIL 4 6 0.78 SCIROS 0 4 0.28FAUROS 3 1 0.74 TETARC 3 2 0.84
GASCRA 7 19 0.28 TETTIG 0 1 1.00GASVIT 3 2 0.95 TRADRA 0 3 0.52GASDRA 1 25 0.01 VITBOT 20 15 0.65GRYLL 0 5 0.37 WHIALT 4 2 0.80GYMTEM 9 3 0.35

APPENDIX 1. Table 5. The grasshopper species response to Highland Sourveld versus Midlands Mistbelt grassland (ISA value =P-value). *= Significant at p =0.05. Refer to Table 7 for grasshopper species codes.
SPP. CODE HS MM P- value SPP. CODE HS MM P- valueACOFER 5 0 0.25 HETGUT 3 10 0.24ACOTIB 18 0 0.01* HETHER 2 1 1.00ACRACC 26 6 0.04* LENMIN 2 24 0.03*ACRBIC 5 6 0.82 LENOBT 9 23 0.12ACRSPP 2 0 1.00 MACBIL 23 18 0.62ANADRE 7 0 0.13 MAURUB 2 0 1.00ANEMON 6 0 0.23 OCHCAF 23 0 0.00*ANTGRA 1 23 0.01* ORNCYA 1 6 0.24CALNAT 3 0 0.49 ORTDAS 9 52 0.01*CALSEM 16 1 0.08 ORTROS 4 13 0.39CANGRA 2 2 0.89 ORTZUL 1 1 0.86CATMEL 16 1 0.03* OXYHYL 0 9 0.03*CONSPP 6 37 0.02* PARTRI 0 3 0.36CORSTE 14 15 0.91 PARXAN 3 12 0.23CRUCRU 47 25 0.11 PHASUL 9 8 0.88CYRAER 1 10 0.13 PHLHUM 9 8 0.89DICSPU 5 0 0.38 PHLSPP 0 2 0.49DIRABB 1 12 0.22 PHYLEP 2 0 1.00EREBAS 20 1 0.01* PNOSQU 2 1 1.00EUPCYL 0 2 0.47 QACFAS 4 18 0.10EYPPLO 2 22 0.01* RHACEP 0 9 0.03*FAUMIL 1 16 0.03* SCIROS 5 0 0.23FAUROS 0 4 0.30 TETARC 3 2 0.96GASCRA 10 16 0.54 TETTIG 2 0 1.00GASDRA 17 5 0.22 TRADRA 3 0 0.52GASVIT 1 4 0.59 VITBOT 10 26 0.12GRYLL 2 2 1.00 WHIALT 0 12 0.00*GYMTEM 6 5 0.94

APPENDIX 1. Table 6. The grasshopper species response to grazing for the 10 study sites (ISA value = P-value). *= Significantat p =0.05. Refer to Table 7 for grasshopper species codes.
SPP. CODE GRAZED NOT P- value SPP. CODE GRAZED NOT P- valueACOFER 4 0 0.28 HETGUT 11 1 0.25
ACOTIB 19 0 0.00* HETHER 2 2 0.89
ACRACC 36 1 0.00* LENMIN 8 15 0.43
ACRBIC 4 8 0.50 LENOBT 14 17 0.76
ACRSPP 1 0 1.00 MACBIL 25 15 0.42
ANADRE 4 0 0.47 MAURUB 1 0 1.00
ANEMON 7 0 0.15 OCHCAF 18 0 0.02*
ANTGRA 9 10 0.88 ORNCYA 0 13 0.00*CALNAT 2 1 0.71 ORTDAS 13 45 0.10CALSEM 6 8 0.83 ORTROS 3 17 0.12
CANGRA 7 0 0.16 ORTZUL 2 1 0.85
CATMEL 2 16 0.04* OXYHYL 7 0 0.15
CONSPP 11 34 0.05* PARTRI 4 0 0.30CORSTE 19 10 0.39 PARXAN 12 2 0.23
CRUCRU 47 25 0.12 PHASUL 4 17 0.06
CYRAER 2 9 0.31 PHLHUM 9 8 0.85
DICSPU 0 6 0.09 PHLSPP 1 0 1.00DIRABB 2 9 0.51 PHYLEP 0 2 0.39EREBAS 4 14 0.18 PNOSQU 4 0 0.49
EUPCYL 0 2 0.38 QACFAS 2 25 0.01*EYPPLO 11 9 0.81 RHACEP 0 6 0.20FAUMIL 2 10 0.30 SCIROS 4 0 0.28FAUROS 2 2 0.92 TETARC 2 3 0.83
GASCRA 12 15 0.74 TETIIG 0 2 0.40GASDRA 13 7 0.59 TRADRA 0 4 0.15GASVIT 1 5 0.34 VITBOT 18 17 0.90GRYLL 0 8 0.04* WHIALT 0 8 0.08GYMTEM 16 0 0.02*

APPENDIX 1. Table 7. The grasshopper species response to burn frequency of the 10 study sites (ISA value = P-value). *=Significant at p =0.05. Refer to Table 7 for grasshopper species codes.
SPP. CODE BIENNIAL OTHER P- value SPP. CODE BIENNIAL OTHER P- valueACOFER 3 0 0.76 HETGUT 1 19 0.02*
ACOTIS 15 0 0.09 HETHER 4 0 0.60
ACRACC 22 6 0.25 LENMIN 16 7 0.55
ACRBIC 11 1 0.31 LENOBT 23 8 0.26
ACRSPP 1 0 1.00 MACBIL 19 24 0.57
ANADRE 4 0 0.53 MAURUB 1 0 1.00
ANEMON 5 0 0.46 OCHCAF 16 0 0.09ANTGRA 19 0 0.10 ORNCYA 6 0 0.43CALNAT 3 0 0.62 ORTDAS 28 31 0.88CALSEM 16 0 0.13 ORTROS 5 12 0.54CANGRA 0 7 0.08 ORTZUL 0 6 0.10CATMEL 16 0 0.08 OXYHYL 5 0 0.47CONSPP 23 20 0.80 PARTRI 3 0 0.71
CORSTE 17 13 0.74 PARXAN 3 17 0.06CRUCRU 39 28 0.74 PHASUL 14 2 0.31
CYRAER 12 0 0.18 PHLHUM 21 0 0.05*
DICSPU 2 1 1.00 PHLSPP 1 0 1.00DIRABB 0 24 0.01* PHYLEP 1 0 1.00ERESAS 15 1 0.19 PNOSQU 4 0 0.58
EUPCYL 1 0 1.00 QACFAS 2 35 0.00*EYPPLO 2 29 0.01* RHACEP 4 1 0.75FAUMIL 11 1 0.33 SCIROS 3 0 0.63FAUROS 4 0 0.60 TETARC 6 0 0.41
GASCRA 20 6 0.37 TETTIG 1 0 1.00GASDRA 20 1 0.15 TRADRA 2 0 1.00GASVIT 6 0 0.40 VITBOT 21 11 0.54GRYLL 5 0 0.53 WHIALT 0 18 0.00*GYMTEM 12 0 0.24

APPENDIX 1. Table 8. The grasshopper species response to disturbance at the 10 study sites (ISA value = P-value). *-Significant at p =0.05. Refer to Table 7 for grasshopper species codes.
SPP. CODE LOW HIGH P- value SPP. CODE LOW HIGH P- valueACOFER 1 2 1.00 HETGUT 5 9 0.60ACOTIB 8 3 0.70 HETHER 1 3 0.71ACRACC 7 35 0.01* LENMIN 18 3 0.35ACRBIC 11 1 0.33 LENOBT 17 9 0.82ACRSPP 0 4 0.19 MACBIL 29 11 0.21ANADRE 0 4 0.64 MAURUB 1 0 1.00ANEMON 5 0 0.46 OCHCAF 5 13 0.23ANTGRA 14 4 0.43 ORNCYA 6 0 0.43CALNAT 0 8 0.04* ORTDAS 54 4 0.02*CALSEM 2 18 0.03* ORTROS 13 3 0.44CANGRA 5 0 0.52 ORTZUL 3 0 0.73CATMEL 6 6 0.94 OXYHYL 5 0 0.49CONSPP 37 5 0.07 PARTRI 2 1 1.00CORSTE 9 23 0.24 PARXAN 16 0 0.09CRUCRU 24 49 0.13 PHASUL 9 6 0.95CYRAER 7 2 0.63 PHLHUM 8 10 0.72DICSPU 4 0 0.57 PHLSPP 1 0 1.00D1RABB 11 1 0.32 PHYLEP 1 0 1.00EREBAS 12 2 0.45 PNOSQU 4 0 0.55EUPCYL 1 0 1.00 QACFAS 23 0 0.03*EYPPLO 16 3 0.30 RHACEP 5 0 0.47FAUMIL 14 0 0.13 SCIROS 3 0 0.63FAUROS 4 0 0.57 TETARC 6 0 0.43
GASCRA 12 10 0.99 TEITIG 1 0 1.00GASDRA 4 23 0.06 TRADRA 2 0 1.00GASVIT 1 7 0.09 VITBOT 18 17 0.93GRYLL 5 0 0.50 WHIALT 7 0 0.32GYMTEM 7 4 0.72
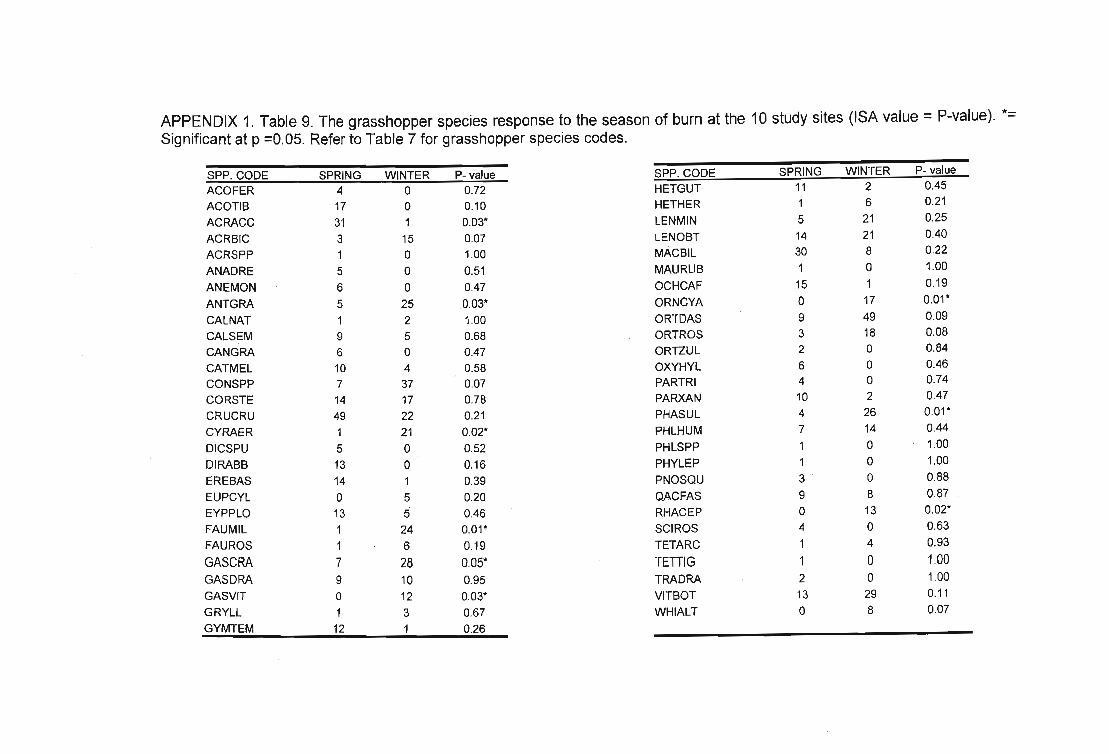
APPENDIX 1. Table 9. The grasshopper species response to the season of burn at the 10 study sites (ISA value = P-value). *=Significant at p =0.05. Refer to Table 7 for grasshopper species codes.
SPP. CODE SPRING WINTER P- value SPP. CODE SPRING WINTER P- valueACOFER 4 0 0.72 HETGUT 11 2 0.45ACOTIB 17 0 0.10 HETHER 1 6 0.21ACRACC 31 1 0.03* LENMIN 5 21 0.25ACRBIC 3 15 0.07 LENOBT 14 21 0.40ACRSPP 1 0 1.00 MACBIL 30 8 0.22ANADRE 5 0 0.51 MAURUB 1 0 1.00ANEMON 6 0 0.47 OCHCAF 15 1 0.19ANTGRA 5 25 0.03* ORNCYA 0 17 0.01*CALNAT 1 2 1.00 ORTDAS 9 49 0.09CALSEM 9 5 0.68 ORTROS 3 18 0.08CANGRA 6 0 0.47 ORTZUL 2 0 0.84CATMEL 10 4 0.58 OXYHYL 6 0 0.46CONSPP 7 37 0.07 PARTRI 4 0 0.74CORSTE 14 17 0.78 PARXAN 10 2 0.47CRUCRU 49 22 0.21 PHASUL 4 26 0.01*CYRAER 1 21 0.02* PHLHUM 7 14 0.44DICSPU 5 0 0.52 PHLSPP 1 0 1.00DIRABB 13 0 0.16 PHYLEP 1 0 1.00EREBAS 14 1 0.39 PNOSQU 3 0 0.88EUPCYL 0 5 0.20 QACFAS 9 8 0.87EYPPLO 13 5 0.46 RHACEP 0 13 0.02*FAUMIL 1 24 0.01* SCIROS 4 0 0.63FAUROS 1 6 0.19 TETARC 1 4 0.93GASCRA 7 28 0.05* TETTIG 1 0 1.00GASDRA 9 10 0.95 TRADRA 2 0 1.00GASVIT 0 12 0.03* VITBOT 13 29 0.11GRYLL 1 3 0.67 WHIALT 0 8 0.07GYMTEM 12 1 0.26
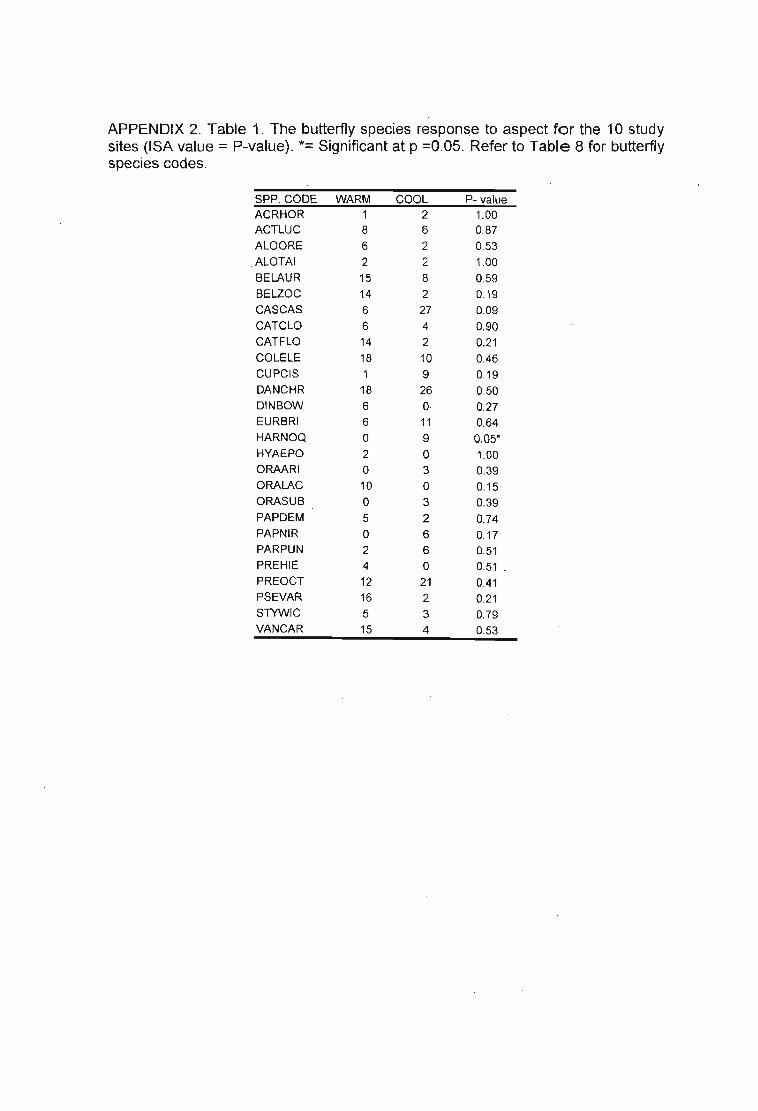
APPENDIX 2. Table 1. The butterfly species response to aspect for the 10 studysites (ISA value = P-value). *= Significant at p =0.05. Refer to Table 8 for butterflyspecies codes.
SPP. CODEACRHORACTLUC
ALOORE
ALOTAI
BELAUR
BELZOC
CASCAS
CATCLO
CATFLO
COLELE
CUPCIS
DANCHR
DINBOW
EURBRI
HARNOQ
HYAEPO
ORAARI
ORALAC
ORASUB
PAPDEM
PAPNIR
PARPUN
PREHIE
PREOCT
PSEVAR
STYWIC
VANCAR
WARM186215146
6
141811866o2o10o5o24
12165·
15
COOL262282274210926o119o3o3266o
21234
P- value1.000.870.531.000.590.190.090.900.210.460.190.500.270.640.05*1.000.390.150.390.740.170.510.510.410.210.790.53
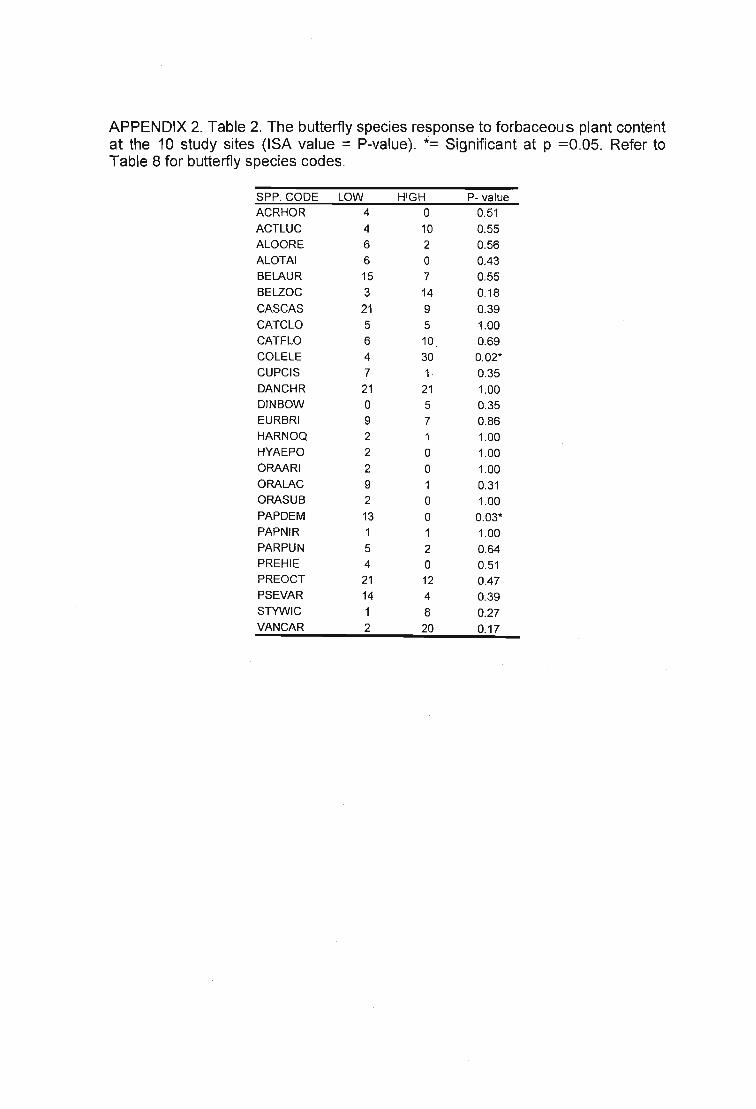
APPENDIX 2. Table 2. The butterfly species response to forbaceous plant contentat the 10 study sites (ISA value = P-value). *= Significant at p =0.05. Refer toTable 8 for butterfly species codes.
SPP. CODEACRHOR
ACTLUCALOORE
ALOTAI
BELAUR
BELlOC
CASCAS
CATCLO
CATFLO
COLELE
CUPCIS
DANCHR
DINBOWEURBRI
HARNOQ
HYAEPO
ORAARI
ORALAC
ORASUB
PAPDEM
PAPNIR
PARPUNPREHIEPREOCT
PSEVAR
STYWIC
VANCAR
LOW446
615
3
21564721o92229213
15
4211412
HIGHo10
2o7
14
9
51030
1
21571oo1oo12o12
48
20
P- value
0.51
0.55
0.56
0.43
0.55
0.18
0.39
1.00
0.69
0.02*
0.35
1.00
0.35
0.86
1.00
1.00
1.00
0.31
1.00
0.03*
1.00
0.640.51
0.47
0.39
0.27
0.17

APPENDIX 2. Table 3. The butterfly species response to vegetation height atthe10 study sites (ISA value = P-value). *= Significant at p =0.05. Refer to Table 8 forbutterfly species codes.
SPP. CODE SHORTACRHOR 1
ACTLUC 7ALOORE 11
ALOTAI 4BELAUR 15
BELZOC 19
CASCAS 9
CATCLO 9
CATFLO 10COLELE 26CUPCIS 2
DANCHR 23
DINBOW 6
EURBRI 7
HARNOQ 3
HYAEPO 2
ORAARI 0
ORALAC 2
ORASUB 0PAPDEM 5PAPNIR 1PARPUN 1
PREHIE 1
PREOCT 16PSEVAR 4
STYWIC 7
VANCAR 14
TALL27o18
o24
255720o10
1
o3
832210
217
16
15
P- value1.00
0.97
0.09
0.74
0.57
0.05*
0.21
0.37
0.61
0.110.43
0.810.40
0.73
0.68
1.00
0.37
0.41
0.35
0.701.00
0.15
1.00
0.88
0.180.51
0.62

APPENDIX 2. Table 4. The butterfly species response to veld condition at the 10study sites (ISA value = P-value). *= Significant at p =0.05. Refer to Table 8 forbutterfly species codes.
SPP. CODEACRHOR
ACTLUC
ALOORE
ALOTAI
BELAUR
BELZOC
CASCAS
CATCLO
CATFLO
COLELECUPCIS
DANCHR
DINBOW
EURBRI
HARNOQ
HYAEPO
ORAARI
ORALACORASUB
PAPDEMPAPNIR
PARPUN
PREHIE
PREOCT
PSEVAR
STYWICVANCAR
LOW1
9
101
15196911272
227812
o2
o41
11
156918
HIGH14o4
81
262
5
55
20o83o3
83
3171
17
11
o3
P- value1.000.72
0.130.550.490.04*0;120.410.460.09
0.800.880.270.980.741.000.430.360.450.901.000.381.000.880.610.210.36
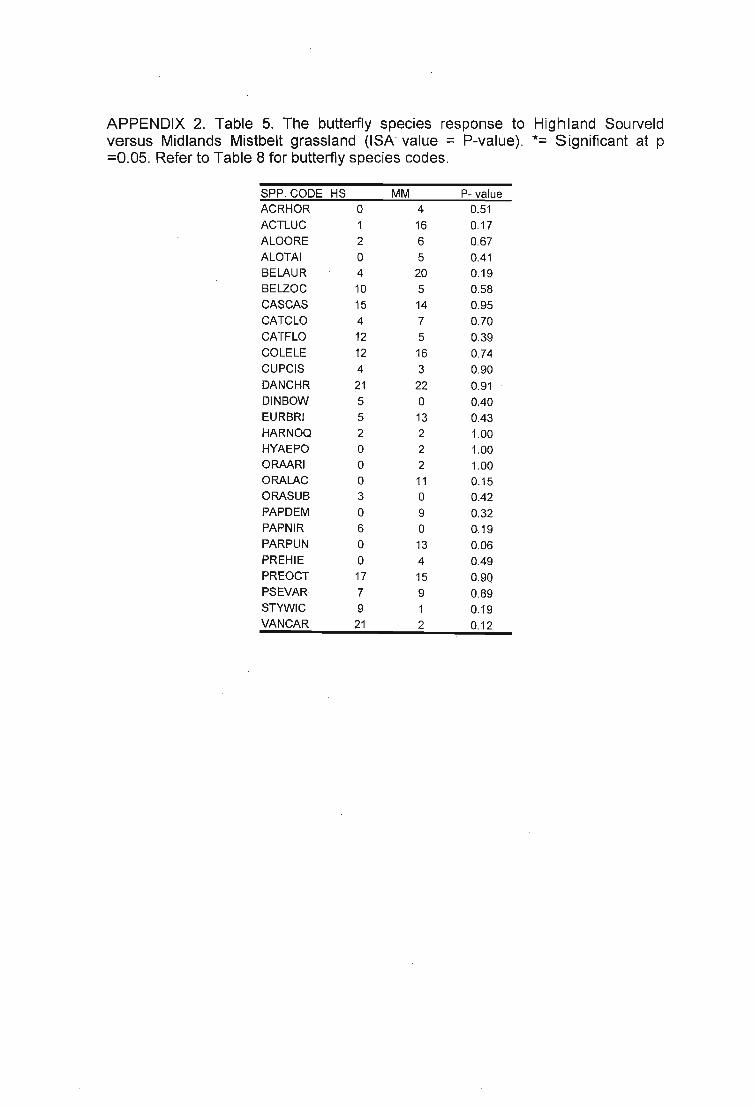
APPENDIX 2. Table 5. The butterfly species response to Highland Sourveldversus Midlands Mistbelt grassland (ISA value = P-value). *= Significant at p=0.05. Refer to Table 8 for butterfly species codes.
SPP. CODE HSACRHOR 0ACTLUC 1ALOORE 2ALOTAI 0BELAUR 4BELZOC 10CASCAS 15CATCLO 4CATFLO 12COLELE 12CUPCIS 4DANCHR 21DINBOW 5EURBRI 5HARNOQ 2HYAEPO 0ORAARI 0ORALAC 0ORASUB 3PAPDEM 0PAPNIR 6PARPUN 0PREHIE 0PREOCT 17PSEVAR 7STYWIC 9VANCAR 21
MM41665205
1475
16322o13222
11o9o13415912
P- value0.510.170.670.410.190.580.950.700.390.740.900.910.400.431.001.001.000.150.420.320.190.060.490.900.890.190.12

APPENDIX 2. Table 6. The butterfly species response to grazing at the 10 studysites (ISA value = P-value). *= Significant at p =0.05. Refer to Table 8 for butterflyspecies codes.
SPP. CODE GRAZEDACRHOR 0ACTLUC 1ALOORE 2ALOTAI 5BELAUR 7BELZOC 4CASCAS 23CATCLO 3CATFLO 14
COLELE 7CUPCIS 2
DANCHR 25DINBOW 0EURBRI 3HARNOQ 3HYAEPO 0ORAARI 0ORALAC 8ORASUB 2
PAPDEM 2PAPNIR 4PARPUN 0PREHIE 1PREOCT 23PSEVAR 10STYWIC 5VANCAR 16
NOT GRAZED6206o1713693
276179171331
o6
o14210724
P- value0.16
0.02*0.51
0.410.320.240.26
0.420.21
0.060.60
0.550.080.110.710.430.430.471.00
0.460.540.03*
1.000.300.770.670.45

APPENDIX 2. Table 7. The butterfly species response to biennial burning at the10 study sites (ISA value = P-value). *= Significant at p =0.05. Refer to Table 8 forbutterfly species codes. .
SPP. CODEACRHOR
ACTLUC
ALOORE
ALOTAI
BELAUR
BELZOC
CASCAS
CATCLO
CATFLO
COLELE
CUPCIS
DANCHR
DINBOW
EURBRI
HARNOQ
HYAEPO
ORAARI
ORALAC
ORASUB
PAPDEM
PAPNIR
PARPUN
PREHIE
PREOCT
PSEVAR
STYWIC
VANCAR
BIENNIAL
o12
1166133
6283
25
2115o2
o2
o36o10
15
20
OTHER4
2
14
7
29
617
10
112
318
15
o5
o19
o19
o1
1125
3321
P- value
0.42
0.56
0.05*
0.19
0.02*
1.00
0.75
0.34
0.65
0.11
1.00
0.69
1.00
0.60
0.59
0.23
1.00
0.02*
1.00
0.01*
1.00
0.63
0.06
0.24
0.00*
0.67
0.20

APPENDIX 2. Table 8. The butterfly species response to disturbance at the 10study sites (ISA value = P-value). *= Significant at p =0.05. Refer to Table 8 forbutterfly species codes.
SPP. CODE LOWACRHOR 3ACTLUC 11ALOORE 9ALOTAI 6BELAUR 21BELZOC 6CASCAS 16CATCLO 8CATFLO 3COLELE 13CUPCIS 2DANCHR 14DINBOW 4EURBRI 8HARNOQ 4HYAEPO 1ORAARI 1ORALAC 10ORASUB 0PAPDEM 5PAPNIR 0PARPUN 9PREHIE 3PREOCT 21PSEVAR 15STYWIC 1VANCAR 1
HIGHo3oo1712
227149
36
o10oooo625
oo1021029
P- value1.000.750.440.600.171.000.830.620.01*0.970.470.100.740.830:76
. 1.00
1.000.330.181.000.370.421.000.600.380.130.03*

APPENDIX 2. Table 9. The butterfly species response to season of burn at the 10study sites (ISA value = P-value). *= Significant at p =0.05. Refer to Table 8 forbutterfly species codes.
SPP. CODE SPRING WINTER P- valueACRHOR 0 5 0.27ACTLUC 1 31 0.00*ALOORE 5 0 0.53ALOTAI 5 0 0.56BELAUR 5 10 0.82BELZOC 8 6 0.81CASCAS 24 6 0.35CATCLO 5 4 1.00CATFLO 13 1 0.28COLELE 6 35 0.01*CUPCIS 2 6 0.52DANCHR 18 25 0.59DINBOW 4 0 0.79EURBRI 2 19 0.06HARNOQ 2 2 1.00ORAARI 0 5 0.26ORALAC 7 1 0.57ORASUB 2 0 1.00PAPDEM 5 0 0.55PAPNIR 4 0 0.61PARPUN 0 23 0.00*PREHIE 2 0 1.00PREOCT 25 6 0.24PSEVAR 22 0 0.05*STYWIC 5 2 0.83VANCAR 12 8 0.81
Copyright © 2022 FDOKUMEN