
Proceedings of the 2019 (9th) International Conference
324
An official publication of the Association of Global Management Studies Proceedings of the 2019 (9 th ) International Conference Association of Global Management Studies Saïd Business School University of Oxford, Oxford United Kingdom July 1 st and July 2 nd (Abstracts and Selected Papers) Conference Proceedings Editors : Dr. Daniel Tomiuk Université du Québec à Montréal, Canada Dr. Mukesh Srivastava University of Mary Washington, USA Print ISSN: 2150-846 Online ISSN: 2150-8488
-
Upload
khangminh22 -
Category
Documents
-
view
0 -
download
0
Transcript of Proceedings of the 2019 (9th) International Conference

An official publication of the
Association of Global Management Studies
Proceedings of the 2019 (9th) International Conference
Association of Global Management Studies Saïd Business School
University of Oxford, Oxford United Kingdom
July 1st and July 2nd (Abstracts and Selected Papers)
Conference Proceedings
Editors :
Dr. Daniel Tomiuk
Université du Québec à Montréal, Canada
Dr. Mukesh Srivastava
University of Mary Washington, USA
Print ISSN: 2150-846
Online ISSN: 2150-8488

Print ISSN: 2150-856
Online ISSN: 2150-8488
© Copyright 2019
Association of Global Management Studies
11807 Clifton Lane
Fredericksburg, Virginia 22408
All Rights Reserved. No part of this publication may be reproduced, stored in a
retrieval system or transmitted in any form or by any means electronic, mechanical
photocopying, recording, or otherwise, without written permission of the Editor
WWW.ASSOCIATION-GMS.ORG
WWW.IJGMS.ORG
WWW.IJGMSP.ORG
© 2019 Association of Global Management Studies

Editorial Board
Mukesh Srivastava, DBA
Editor-in-Chief
University of Mary Washington
Camilla Noonan, Ph. D.
University College Dublin, Ireland
C. E. Tapie Rohn, Ph. D.
California State University-San Bernardino
Chang-tseh Hsieh, Ph. D.
University of Southern Mississippi
Daniel Tomiuk, Ph. D.
Université du Québec à Montréal, Canada
Diana Kay Pence, Ph. D.
University of Houston-Downtown
Hamed Motagi, Ph.D.
Université du Québec en Outaouais, Canada
Jack T. Marchewka, Ph. D.
Northern Illinois University
John Saee, Ph. D.
Reutlingen University, Germany
Pascal Ravesteijn, Ph. D.
University of Applied Sciences Utrecht, Netherland
Ramesh Subramanian, Ph. D.
Quinnipiac University
Seamas Kelly, Ph. D.
University College Dublin, Ireland
Stephen C. Wingreen, Ph.D.
University of Canterbury, New Zealand
Van R. Wood, Ph. D.
Virginia Commonwealth University


Contents Commercial Bank’s Recapitalization and Small Scale Enterprises’ (SMEs) Growth in
Nigeria ............................................................................................................................................ 1
Design and Development of Citizens Information System ...................................................... 20
Can Instagram Convince Information to Users? ..................................................................... 30
Complexity Concepts in Market Dynamics; the Evolution of Market Alliances .................. 51
BASEL III implementation on financial performance. Banking in ASEAN. ....................... 65
Financial Behaviour, E-Trading Satisfaction, E-Trust, and E-Loyalty of E-Trading in
Indonesian Stock Exchange with SEM-PLS............................................................................. 80
The relationship of GCG, company size, liquidity, capital structure, and profitability with
SEM-PLS ..................................................................................................................................... 95
The factors that influence financial distress of Indonesia manufacturing company .......... 109
Complexity concepts in market dynamics; the evolution of market alliances .................... 125
Firm trends in markets and their consequences; mapping evolution of firm behavior using
the deep and surface structures of the market ....................................................................... 139
The Relationship Between Ethical Leadership and Nurse Job Performance: Boundary
Conditions and Influence Processes ........................................................................................ 159
Organization or Human Capital Who Understands the System Better .............................. 182
The national business context for industrial SME cluster development in Pakistan:
constraining and facilitating factors........................................................................................ 183
Impact of transformational leadership on employee’s performance, with the mediating role
of job satisfaction and employees’ commitment .................................................................... 219
Toward a Model for Actual Usage of Social Networks Sites for Educational Purposes in
Jordanian Universities .............................................................................................................. 249
Product/Service Complexity and Choice of Channels for Information Search During the
Purchase Process: A Proposed Model Based on Media-Richness Theory.......................... 261
Firm structures in markets and the supporting lifecycle logic: the case for market evolution
..................................................................................................................................................... 273

Commercial Bank’s Recapitalization and Small Scare Enterprise’ (SMEs) Growth in Nigeria
Okhankhuele and Okhankhuele
_____________________________________________________________________________
______________________________________________________________________________
1
© 2019 (9th) International Conference of the AGMS Proceedings
Commercial Bank’s Recapitalization and Small Scale Enterprises’ (SMEs) Growth in
Nigeria
Omonigho Tonia Okhankhuele
Department of Business Administration,
Federal University of Technology,
Akure, Ondo State, Nigeria.
Tel: +234-806-282-4074
Onolenrekhian Philo Okhankhuele
Department of Business Administration,
Joseph Ayo Babalola University,
Ikeji-Arakeji, Osun State, Nigeria.
Tel: +234-803-464-508
Abstract
This paper examined the relationship between the total loan granted to SMEs by commercial banks
and SMEs share in Gross Domestic Product (GDP) before the last banks’ recapitalization (1982-
2005) in Nigeria, after the last banks recapitalization (2006-2012) and assessed the effect of
commercial banks’ recapitalization on SMEs’ growth in Nigeria (1982-2012). Secondary data on
yearly share of the manufacturing SMEs in Nigeria’s GDP and Total loan granted to all SMEs by
commercial banks in Nigeria from 1982 to 2012, were extracted from the Central Bank of
Nigeria (CBN) Statistical Bulletin (2002; 2008; 2013; 2015), CBN Annual Report and Statement
of Accounts (2011a; 2012a) and National Bureau of Statistics–Job Creation and Employment
Surveys (2012a), and utilized for the study. Data collected were analyzed using Pearson Product-
Moment Correlation Coefficient (PPMCC). The results showed that there was a positive
relationship between SMEs’ growth and total loan granted to SMEs before the 2006 commercial
banks’ recapitalization in Nigeria (1982-2005). The calculated value for the Pearson correlation
was 0.740, there was a negative relationship between the two variables after the 2006
commercial banks’ recapitalization (2006-2012), with calculated value for the Pearson
correlation of -0.664, and there was no significant relationship between SMEs contribution to
total GDP and commercial banks’ loans to SMEs in Nigeria for the period between 1982 and
2012. The calculated value for the Pearson correlation was 0.240. However, the level of
significance of 0.194 was attained which was higher than the table value of 0.05. Therefore, the
study concluded that, there was no significant relationship between SMEs’ growth and
Commercial Banks’ Recapitalization in Nigeria. The study recommended that, the government
inquire into the reason for the reduction in the commercial banks’ loan disbursement to SMEs,
especially after the commercial banks’ recapitalization, and takes necessary actions to solve the
problem.
Keywords: Commercial Bank, Recapitalization, Enterprises, Small Scale, Growth

Commercial Bank’s Recapitalization and Small Scare Enterprise’ (SMEs) Growth in Nigeria
Okhankhuele and Okhankhuele
_____________________________________________________________________________
______________________________________________________________________________
2
© 2019 (9th) International Conference of the AGMS Proceedings
1) Introduction
Small and Medium Enterprises (SMEs) serve as the nurturing and breeding grounds for
technological transformation, technical know-how, managerial capabilities, domestic
entrepreneurial facilities and advancement of an energetic and industrious economy in every
nation (Small and Medium Scale Enterprises Development Agency in Nigeria (SMEDAN,
2010). SME sector is an incubator for economic advancement, an abode for creating innovations
and where novel ideas grow into economically viable businesses. (Craig, 2005). SMEs serve as a
form of survival to a lot of families in countries where the inhabitants do not feel the presence of
government (Motilewa, Ogbari, and Aka, 2015). They make significant contributions to the
productivity of nations and thus, enhance competitiveness and total economic growth. SMEs
have been acknowledged as the highest employer of labor, with enormous potential for
generating employment and creating wealth in every economy (Abiola, Iyoha, and Joseph,
2011).
Despite the fact that the Nigerian SMEs make up more than 90% of Nigerian businesses,
they contribute below 10% to the Gross Domestic Product (GDP) of the nation (Gbandi and
Amissah, 2014), produce only 10-15 percent of the industrial output, even when they employ
70% of the Industrial labor force. More than 50 % of Nigeria SMEs breakdown within the first
five years, about 25 % go bankrupt or fold up (CBN, 2002).
Recognizing the importance of SMEs to nations, successive governments in Nigeria,
have carried out numerous policies to create enabling environment for SMEs to strive in their
countries, foster, develop, assist in innovation and management. Among these agencies and
funding schemes are: the Nigerian Industrial Development Bank (NIDB) (1964), Small Scale
Industries Credit Scheme (SSICS) (1971), Nigerian Bank for Commerce and Industry (NBCI)
(1973), Bank of Industry (2001), Nigerian Agricultural, Cooperative, and Rural Development
Bank (NACRDB), Bank of Agriculture (BOA) (2000), Nigerian Directorate of Employment
(NDE), National Poverty Eradication Programme (NAPEP), African Development Bank (ADP)
(1989), National Economic Reconstruction Fund (NERFUND) (1989), Small and Medium
Enterprises Development Agency of Nigeria (SMEDAN) (2003), Micro Finance Banks (MFB),
Nigerian Export and Import Bank (NEXIM), Small and Medium Industry Development Agency
(SMIDA) (2003), Small and Medium Enterprises Equity Investment Scheme (SMEEIS) (2001)
among others (Real Sector Division Research Department, Central Bank of Nigeria (CBN),
2014; Soludo, 2008; Evbuomwan, Ikpi, Okoruwa and Akinyosoye, 2013; Terungwa, 2012).
Notwithstanding the numerous government intervention schemes, a lot of SMEs still
struggle to survive let alone contribute satisfactorily to the economy. SMEs in Nigeria have
performed below expectation and have not been able to make the anticipated impact on the
economy (Gbandi and Amissah, 2014; Terungwa, 2012). One of the most hindrances of SMEs in
Commercial Bank’s Recapitalization and Small Scare Enterprise’ (SMEs) Growth in Nigeria
Okhankhuele and Okhankhuele
_____________________________________________________________________________
______________________________________________________________________________
3
© 2019 (9th) International Conference of the AGMS Proceedings
Nigeria is the inability to obtain finance from banks and other financial houses, either to start or
expand SMEs.
Although there have been numerous analyses on the impact of bank consolidation,
recapitalization and banking sector reforms on the performance of SMEs in Nigeria (Mamman
and Aminu, 2013; Duru and Lawal, 2012; Obasan and Arikewuyo, 2012; Omah, Durowoju,
Adeoye and Elegunde, 2012), these studies mainly focused on the effect of recapitalization on the
financing of SMEs. In these studies, commercial banks financing before 2006 recapitalization were
compared with their financing after the recapitalization, without comparing the financing with the
SMEs’ output before and after the recapitalization. The idea is that, finance as an input (total loan
granted to SMEs by commercial banks) must be compared with an output (SMEs share in Gross
Domestic Product (GDP)), before the effect of the input on the output can be determine. This is the
area where this study contributed to the already existing literature.
There is no worldwide accepted definition of SMEs. Several common features in the
definition of SMEs include: number of employees, relative size, initial capital outlay, financial
strength, sales value, and types of industry (Carpenter, 2003). The National Policy on MSMEs
(2012) and Small and Medium Enterprises Development Agency of Nigeria (SMEDAN) (2007)
categorised SMEs by Assets and Employment, with Micro Enterprises having below 10
employees and asset base less than 5 million naira (not including land and building), Small
Enterprises, 10 to 49 employees and asset base of 5 to below 50 million naira (not including land
and building), and Medium Enterprises, 50 to 199 employees and asset base of 50 to below 500
million naira (not including land and building). This categorization of SMEs will be adopted for
this study because, SMEs in Nigeria have limited capital and number of employees as depicted
by this categorization.
A commercial bank is a financial institution that has the legal authority to receive and
lend money from institutions, individuals and businesses. Its function among others include:
receiving of deposits from individuals and businesses, disbursing payments, collecting and
transferring funds from and to its customers and other banks on behalf of its customer. That is,
acting as a customer’s agent, safeguard customers ’money, maintaining depositors’ savings and
checking accounts, maintaining custodial accounts (accounts controlled by one person but for the
benefit of another person), lending money, among others. Its role in the economy include among
others, financing capital investment (Wikipedia).
Banking system’s consolidation means a deliberate policy measure to raise the capital
base of banks in order to make the banks sound, safe and viable business entities (Real Sector
Division Research Department, Central Bank of Nigeria (CBN) (2014). Consolidation is a word
used by the Central Bank of Nigeria (CBN) to refer to the collection of some banks within the
country to come together in order to meet CBN’s requisite for capitalization to a minimum of

Commercial Bank’s Recapitalization and Small Scare Enterprise’ (SMEs) Growth in Nigeria
Okhankhuele and Okhankhuele
_____________________________________________________________________________
______________________________________________________________________________
4
© 2019 (9th) International Conference of the AGMS Proceedings
N25 billion (16 million US dollar) (Omah et al., 2012).
The main objective of this study is to evaluate the impact of commercial banks’
recapitalization on SMEs’ growth in Nigeria, while the specific objectives include: to identify the
total loan granted to SMEs by commercial banks and SMEs growth (share in Gross Domestic
Product (GDP)) before (1982-2005) and after (2006-2012) the last banks’ recapitalization in Nigeria,
and assess the impact of the loan on SMEs’ growth (share in Gross Domestic Product (GDP)) before
and after the recapitalization, and from 1982-2012. The related theory to this study is Say’s Law
theory (Emori, Nkamare, and Nneji, 2014). This theory proposes that recapitalization of banks
boosts their capital base and increases the availability of loanable funds in the banks, to the
economy. The result of this is that, interest rate will reduce, and SMEs will be able to borrow
more money from the banks, and this will improve their growth.
2) Literature Review
2.1 Reasons for Recapitalization and the Effect of Recapitalization on Banks and the
Economy
Bank consolidation increases the size of banks, upsurges banks’ returns, via revenue and
cost efficiency gains, and may also decrease the risks of industry via the eradication of banks that
are weak and create better opportunities for diversification (Berger, 2000). The outcome of
recapitalization is: the long-term capital stock of the firm is raised extensively to withstand the
operational undertakings of the business which can have a positive impact on the economy;
credit accessibility and financial stability which would aid the growth of the economy and
encourage banks to play critical role of financial intermediation in the Nigerian economy is
improved (Imoughele and Ismaila, 2014); internal and external balances, full employment,
macroeconomic goals of price stability, high economic growth may be attained (Akpansung and
Gidigbi, 2014); cheap credit to the real sector and financial accommodation for SMEs are made
available (Anyanwu, 2010). Recapitalization leads to an increase in capital base of a bank and
this may help to fortify and aid operational efficiency in banks; aids in attaining operational
synergy via mergers and acquisition; assist to upsurge liquidity efficiency and enhance
diversification that may aid macroeconomic stability and sustainability in the long run; aids
economies of scale through the reduction in banks’ cost of operation occasioned from a decrease
in branch networks, staff overheads, among others, upturns the propensity of banks in the
direction of risk taking via increases in leverage and off balance sheet operations; and makes
available, services that guarantee the development of the economy, (Eferakeya, 2014; De Nicoló
et al., 2003).
However, Asedionlen (2004) asserted that ‘‘recapitalization may raise liquidity in short
term but will not guaranty a conducive macroeconomic environment required to ensure high
asset quality and good profitability’’. In the same vein, Adegbaju and Olokoyo (2008) in their

Commercial Bank’s Recapitalization and Small Scare Enterprise’ (SMEs) Growth in Nigeria
Okhankhuele and Okhankhuele
_____________________________________________________________________________
______________________________________________________________________________
5
© 2019 (9th) International Conference of the AGMS Proceedings
study, revealed that only a small number of banks experienced significant advancement in their
performances while others were worse or remain the same after recapitalization.
2.2 Effect of Recapitalization on Commercial Banks’ Ability to Finance SMEs and Lead
to their Growth
SMEs in Nigeria rely on banks for funding and are therefore susceptible to all the
changes, developments and reforms that take place in the banking system (Mamman and Aminu
(2013). These changes may be advantageous or disadvantageous to SMEs financing. Banks
consolidation may result to banks efficiency via cost synergies or by takeover of inefficient
banks by efficient ones and upturn market power which may stimulate the supply of credit to
SME’s (Degryse, et al., 2005). Banks’ consolidation improves the flow of credit to SMEs, which
would be noticeable in efficiency gains, which would favour borrowing to small firms in the long
run (Real Sector Division Research Department, Central Bank of Nigeria (CBN) (2014). Under
decentralized structure the banks require the services of additional supervisors to lessen the
information asymmetries that take place within a firm. Therefore, decentralized banks manage to
finance more small firms, but suffer higher costs than centralized banks. However, it is not the
banking size that matters, but the organizational structure is key in small business lending
(Takáts, 2004).
Meanwhile, Obasan and Arikewuyo (2012) disclosed that consolidation has been
unsuccessful in fostering a competitive and energetic SMEs sector that could improve the
creation of job and growth in the Nigerian economy. The advent of mega banks led to: shrinkage
of credit to SMEs (Berger and Udell, 2002; Banaccorsi di Patti and Gobbi; 2001) and substantial
reduction of small businesses’ access to credit, but increased credit limit to SMEs (Craig and
Hardee, 2004). CBN (2012b) disclosed that 6.02 per cent of the entire credit to private sectors
was dispensed to SMEs from 2000 to 2005, while between 2006 and 2011, after the last banks’
recapitalization in Nigeria, the entire credit paid out by Deposit Money Banks (DMBs) to SMEs
as a ratio of private sectors’ credit reduced to an average of 0.41 per cent.
Banaccorsi di Patti and Gobbi (2001) concluded that mergers in Italian banks led to
provisional decrease in outstanding credit to all dimensions of borrowers, and loans received
from commercial banks by SMEs as a percentage of total credits reduced from 48.79% in 1992
to 0.15% in 2010 (Luper, 2012). Bigger banks are less likely to lend to SMEs because they
depend on formal framework for determining whether to give credit to SMEs and the amount of
credit to give to them (Craig and Hardee (2004). Since consolidation decreases the number of
smaller banks, it can be concluded that there will be a decrease in SMEs’ financing because these
loans are considered less profitable for large banks (Marsch, Schmieder and Aerssen, 2007; De
Haas et al., 2010). Larger banks normally have a smaller tendency to give loan to SMEs
(Marsch, et al., 2007). The enormous capital attained by the banks during consolidation exercise
is mainly directed towards non-real sector, non-SMEs, and bad and doubtful loans (Adedayo,
2015). After the Post Bank Consolidation in Nigeria, banks still lend at appalling interest rates of
Commercial Bank’s Recapitalization and Small Scare Enterprise’ (SMEs) Growth in Nigeria
Okhankhuele and Okhankhuele
_____________________________________________________________________________
______________________________________________________________________________
6
© 2019 (9th) International Conference of the AGMS Proceedings
about 20% as against zero percent, 5 percent and 3 percent interest rate in China, Japan and
Malaysia (Olutunla and Obamuyi, 2008). While Ojo, (2009) and Duru and Lawal (2012) asserted
that Nigerian banks’ recapitalization led to an increase in SME’s financing and as such increased
their development, Obasan and Arikewuyo (2012), Mamman and Aminu (2013), Eferakeya
(2014), Luper (2013) think otherwise.
3) Research methodology
3.1 The Study Area
The Federal Republic of Nigeria is found in the West Africa region. It lies between
Latitudes 4 o to 14o North and between Longitudes 2o2’ and 14 o 30’ East. It is bounded in the
north by the Niger Republic and Chad; in the west by Benin Republic, in the East by Cameroon
Republic and south by the Atlantic Ocean. The country obtained its name from river Niger, one
of the rivers that divided the country into three. Nigeria has a land area of around 923 769 km2
(Federal Office of Statistics (FOS), 1989; Aregheore, 2005; West African Examinations
Council (WAEC) (2009)). The surface area of Nigeria as 91.07 million hectares (Federal
Ministry of Environment of Nigeria (FMEN), 2001). Nigeria consists of 36 states and the
Federal Capital Territory, Abuja, 744 Local Government Areas and six geographical region
(South-south, South-east, South-west, North-central, North-east, North-west). Today Nigeria is
the most populous country in Africa with an estimated population of 131,859,731 inhabitants
(Aregheore, 2009; West African Examinations Council (WAEC); 2009).
3.2 Methodology
Census sampling was used for this study, because the yearly share of all manufacturing SMEs
(in Nigeria) in GDP (N Million) from 1982-2012 and the Total loan (N Million) granted to all
SMEs by the commercial banks in Nigeria for these years were selected from CBN Statistical
Bulletin (2002; 2008; 2013; 2015), Central Bank of Nigeria, Annual Report and Statement of
Accounts (2011a; 2012a) and National Bureau of Statistics –Job Creation and Employment
Surveys (2012a) and used for the analysis. This means secondary data was used for this study.
The study population comprised all manufacturing SMEs in Nigeria, that contributed to GDP from
1982 to 2012, and all the commercial banks that granted loan to SMEs in Nigeria, within these
years. The Statistical Package for the Social Sciences (SPSS) was used to carry out the analysis
of this research. Data were analyzed with inferential statistics.
Analyses was carried out in three stages. Firstly, the relationship between SMEs growth
(dependent variable) and the commercial bank’s recapitalization (independent variable) was
calculated before the last recapitalization (1982-2005), then after recapitalization (2006-2012),
and then the relationship between the total loan granted by commercial banks to SMEs before

Commercial Bank’s Recapitalization and Small Scare Enterprise’ (SMEs) Growth in Nigeria
Okhankhuele and Okhankhuele
_____________________________________________________________________________
______________________________________________________________________________
7
© 2019 (9th) International Conference of the AGMS Proceedings
and after banks’ recapitalization (1982-2012) in Nigeria and SMEs’ share in GDP during the
same period, was analysed and used to examine the impact of recapitalization on SMEs’
growth in Nigeria within the specified period. Pearson Product-Moment Correlation Coefficient
(PPMCC) was used to measure the strength and direction of the linear relationship between the
two variables. The linear relationship is usually represented by “r”, and the value of r is always
between +1 and –1. if r =1, it means that there is a perfect positive linear relationship between
the dependent and independent variables, while 0 means that there is no relationship between
the two variables. A value above 0 means that a positive relationship exists. The closer the
value of r is to +1, the stronger the linear relationship.
3.3 Model Specification
The model below specified that SMEs growth is influenced by commercial bank’s
recapitalization. That means:
SMEs Growth (Y) = f (commercial bank’s recapitalization (x)
Where Y = Dependent Variable
X = Independent variable
4) Findings/results
4.1 Relationship between Small Scale Enterprises’ (SMEs) Share in GDP and Total
Loan Granted to SMEs by Commercial Banks’ Before Recapitalization in Nigeria
in 2006
Table 1 presents SMEs’ Share in GDP (N’ million) and total loan granted to SMEs by
commercial banks (N’ million), before the last (2006) recapitalization (that is from 1982-2005,
which was used to analyse before the recapitalization. However, 2006 to 2012 was used to
analyse after recapitalization, while 1982-2012 was used to analyse before and after
recapitalization. The table revealed that SMEs’ Share in GDP declined from N7,890.70 million
in 1982, to N4,926.20 million in 1984, rose to N5,903.50 million in 1985, dropped a little to
N5,673.90 million in 1986, and continued to rise from N5,963.20 million in 1987 to N8,046.00
million in 1991. It however dropped to N7,657.20 million in 1992 and continued dropping till
1995, to N6,880.00 million. It increased a little to N6,940.00 million in 1996 and continued to
increase till 2005, to N408,367. 52 million.
On the other hand, the total loan granted to SMEs by commercial banks, increased from
N206.70 million in 1982 to N3,587.30 million in 1986, decreased to N1,445.30 million in
1987, increased to N5,090.00 million in 1988 to N5,900.00 million in 1990, to N20,400.0
million in 1992. It however dropped to N15,462.9 million in 1993, increased to N20,552.5

Commercial Bank’s Recapitalization and Small Scare Enterprise’ (SMEs) Growth in Nigeria
Okhankhuele and Okhankhuele
_____________________________________________________________________________
______________________________________________________________________________
8
© 2019 (9th) International Conference of the AGMS Proceedings
million in 1994, and kept increasing till it rose to N46,824.0 million in 1999. It dropped to
N44,542.3 million in 2000, and rose from N52,428.4 million in 2001 to N90,176.5 million in
2003. It however, dropped to N54,981.2 million in 2004, and further dropped to N50,672.6
million in 2005. The total loan granted to SMEs from 1982 to 2005 was N667,765.7 million, an
average of N27,823.57 million per annum.
4.1.1 Table 1: SMEs’ Share in GDP (N’ million) and Total Loan Granted to SMEs by
Commercial Banks (N’ million), Before Recapitalization (1982-2005), after
recapitalization (2006-2012), and before and after recapitalization (1982-2012)
Sources: CBN Statistical Bulletin (2002; 2008;2013;2015)
Central Bank of Nigeria, Annual Report and Statement of Accounts (2011;2012).
National Bureau of Statistics –Job Creation and Employment Surveys (2012)
Year SMEs’ Share in GDP (N’m) Total Loan Granted to SMEs by
Commercial Banks (N’m) 1982 7890.70 206.70 1983 5549.40 351.30 1984 4926.20 705.70 1985 5903.50 927.20 1986 5673.90 3587.30 1987 5963.20 1445.30 1988 6729.50 5090.00 1989 6840.20 5789.50 1990 7371.40 5900.00 1991 8046.00 7572.30 1992 7657.20 20400.0 1993 7341.00 15462.9 1994 7280.00 20552.5 1995 6880.00 32374.5 1996 6940.00 42302.1 1997 6960.00 40844.3 1998 6980.00 42260.7 1999 7330.00 46824.0 2000 7180.00 44542.3 2001 7480.00 52428.4 2002 507836.82 82368.4 2003 465811.68 90176.5 2004 349316.32 54981.2 2005 408367.52 50672.6 2006 478524.14 25713.7 2007 520883.03 41100.4 2008 585573.04 13512.2 2009 612308.89 16366.5 2010 643070.22 12550.3 2011 694814.15 15611.7 2012 761467.00 13863.5

Commercial Bank’s Recapitalization and Small Scare Enterprise’ (SMEs) Growth in Nigeria
Okhankhuele and Okhankhuele
_____________________________________________________________________________
______________________________________________________________________________
9
© 2019 (9th) International Conference of the AGMS Proceedings
4.1.2 Result of the Correlation Analysis between SMEs’ Share in GDP (N’ million) and
Total Loan Granted to SMEs by Commercial Banks (N’ million), Before 2006 (1982-
2005) Banks’ Recapitalization
H0: There is no significant relationship between SMEs’ growth and Total Loan Granted to
SMEs by Commercial Banks (N’ million), Before the banks’ Recapitalization in Nigeria
Test statistic= Pearson Correlation
Level of significance (α) = 0.05 (5%)
Level of confidence= 0.95 (95%)
Decision rule: The Calculated Value for the Pearson correlation was 0.740 this implies that there
was a positive and strong correlation and therefore a significant and positive relationship
between the dependent variable, SMEs growth and the independent variable (Total loan granted
to SMEs) before the 2006 banks’ recapitalization in Nigeria (1982-2005). Also, the calculated
level of significance was 0.000 which is less than the table value of 0.05, therefore, the null
hypothesis was rejected and the alternate hypothesis which states that, there is a significant
relationship between SMEs’ growth and Total Loan Granted to SMEs by Commercial Banks (N’
million), before the banks’ Recapitalization in Nigeria in 2006, was retained.
4.2 Relationship Between Small Scale Enterprises’(SMEs) Share in GDP and Total
Loan Granted to SMEs by Commercial Banks’ After Recapitalization in Nigeria in
2006
4.2.1 SMEs’ Share in GDP (N’ million) and Total Loan Granted to SMEs by
Commercial Banks (N’ million), After 2006 Recapitalization in Nigeria
On table 1, SMEs’ Share in GDP (N’ million) and total loan granted to SMEs by
commercial banks (N’ million), after the last (2006) recapitalization (from 2006-2012) was also
presented. The table revealed that SMEs’ Share in GDP increased from N478,524.14 N’ million
in 2006, and continued to increase to N761,467.00 million in 2012. While the total loan granted
to SMEs by commercial banks, increased from N25,713.7 million in 2006 to N41,100.4 million
in 2007, declined to N13,512.2 million in 2008, increased to N16,366.5 million in 2009, reduced
to N12,550.3 million in 2010, increased to N15,611.7 million again in 2011, and reduced to
N13,863.5 million in 2012.
These figures revealed that the total loan granted to SMEs by commercial banks, in
Nigeria, reduced after the commercial banks recapitalization in Nigeria in 2006. While the total
loan granted to SMEs from 1982 to 2005 was N667,765.7 million, an average of N27,823.57
million per annum, that of 2006 to 2012 was N138,718.3 million, an average of N19,816.9
million per annum. This is a reduction of 28.78 %, approximately 29% per annum. This result is
not far from that of The CBN (2010) statistics which disclosed that banks loan and advances to

Commercial Bank’s Recapitalization and Small Scare Enterprise’ (SMEs) Growth in Nigeria
Okhankhuele and Okhankhuele
_____________________________________________________________________________
______________________________________________________________________________
10
© 2019 (9th) International Conference of the AGMS Proceedings
SMEs have been decreasing over the years. The statistics revealed that loans given to SMEs by
commercial banks as a percentage of total credit reduced from 48.79 % in 1992 to 32.18% in
1993 and 22.19% in 1994. The trend increased a little to 22.94% in 1995 and 25.00% in 1996.
There was a profound reduction from 25.00% to 16.96 % in 1997 and 15.49% in 1998.The
reduction continued until it got to 0.17% in 2009 and 0.15% in 2010.
4.2.2 Result of the Correlation Analysis between SMEs’ Share in GDP (N’ million) and
Total Loan Granted to SMEs by Commercial Banks (N’ million), After 2005
(2006-2012) Banks’ Recapitalization
H0: There is no significant relationship between SMEs’ growth and Total Loan Granted to
SMEs by Commercial Banks (N’ million), After the banks’ Recapitalization in Nigeria in 2006.
Test statistic= Pearson Correlation
Level of significance (α) = 0.05 (5%)
Level of confidence= 0.95 (95%)
Decision rule: The Calculated Value for the Pearson correlation was -0.664 which implies that
there is a high but negative correlation between dependent variable (SMEs growth) and the
independent variable (Total loan granted to SMEs after banks’ recapitalization in Nigeria). Also,
the calculated level of significance was -0.104 which is less than the table value of 0.05. This
means, there is a high but negative relationship between the dependent and independent
variables, therefore, the null hypothesis was accepted, while the alternate hypothesis which states
that, there is a significant relationship between SMEs’ Share in GDP (N’ million) and Total Loan
Granted to SMEs by Commercial Banks (N’ million) after 2006 banks recapitalization in Nigeria
was rejected.
4.3: Relationship between Small Scale Enterprises’ (SMEs) Share in GDP and Total
Loan Granted to SMEs by Commercial Banks’ Before and After Recapitalization
in Nigeria in 2006
In table 1, Small Scale Enterprises’ (SMEs) Share in GDP and Total Loan Granted to
SMEs by Commercial Banks’ Before and After Recapitalization (1982-2012) in Nigeria were
also presented.
4.3.1: Result of the Correlation Analysis between SMEs’ Share in GDP (N’ million) and
Total Loan Granted to SMEs by Commercial Banks (N’ million), Before and After
2005 (2006-2012) Banks’ Recapitalization
H0: There is no significant relationship between SMEs’ growth and Commercial Banks’
Recapitalization in Nigeria

Commercial Bank’s Recapitalization and Small Scare Enterprise’ (SMEs) Growth in Nigeria
Okhankhuele and Okhankhuele
_____________________________________________________________________________
______________________________________________________________________________
11
© 2019 (9th) International Conference of the AGMS Proceedings
Test statistic= Pearson Correlation
Level of significance (α) = 0.05 (1%)
Level of confidence= 0.95 (95%)
Decision rule: The Calculated Value for the Pearson correlation was 0.240. This implies that
there is a very low correlation, but positive relationship, between SMEs’ growth and Commercial
Banks’ recapitalization in Nigeria from 1982-2012. However, the level of significant 0.194 is
higher than the table value of 0.05. This means that, the null hypothesis which states that there is
no significant relationship between SMEs’ growth and Commercial Banks’ Recapitalization in
Nigeria, from 1982 to 2012 will be retained, while the alternative hypothesis will be rejected.
Hence, it can be concluded that There is no significant relationship between SMEs growth and
commercial banks’ recapitalization in Nigeria.
5) Discussion of findings and conclusion
Finding 1:
There is a significant and positive relationship between SMEs’ growth and Total Loan
Granted to SMEs by Commercial Banks, before the banks’ Recapitalization in Nigeria in 2006.
The Calculated Value for the Pearson correlation was 0.740 which implies that there is a positive
and strong correlation and therefore a significant and positive relationship between the dependent
variable (SMEs growth and the independent variable (Total loan granted by commercial banks to
SMEs) before the 2006 banks’ recapitalization in Nigeria (1982-2005). Also, the calculated level
of significance was 0.000 which is less than the table value of 0.05, therefore, the null hypothesis
was rejected, and the alternate hypothesis was accepted. This finding is in agreement with
Evbuomwan, Okoruwa and Ikpi (2013) and Oleka, Maduagwu and Igwenagu, (2014)’s studies,
which concluded that, credit available to SMEs, has a significant effect on the growth of SMEs,
and their contribution to Nigeria’s GDP. On the other hand, the finding is in disagreement with
Lipsey (2003)’s study, which disclosed that commercial banks in Nigeria could not contribute
significantly to SMEs’ advancement, due to the low entrepreneurial development’s rate of
returns.
Finding 2:
The study also revealed that there is a significant but negative relationship between
SMEs’ Share in GDP and Total Loan Granted to SMEs by Commercial Banks after 2006 banks
recapitalization. The Calculated Value for the Pearson correlation was -0.664 which implies that
there is a high but negative correlation between dependent variable (SMEs growth) and the
independent variable (Total loan granted by commercial banks to SMEs after the banks’
recapitalization in Nigeria). Also, the calculated level of significance was -0.104 which is less
than the table value of 0.05. This means, there is a high but negative relationship between the
dependent and independent variables, therefore, the null hypothesis was accepted.
Commercial Bank’s Recapitalization and Small Scare Enterprise’ (SMEs) Growth in Nigeria
Okhankhuele and Okhankhuele
_____________________________________________________________________________
______________________________________________________________________________
12
© 2019 (9th) International Conference of the AGMS Proceedings
The revelation from this study is in agreement with Obasan and Arikewuyo (2012),
Mamman and Aminu (2013), Luper (2013), Eferakeya (2014), Omah, et al. (2012), and Real
Sector Division Research Department and Central Bank of Nigeria (CBN) (2014)’s conclusion,
that SMEs received no better financing from commercial banks after their recapitalization, that
recapitalization, reduced SME’s financing and as such restricted their development. Also, the
findings are in accord with Berger and Udell (2002), and Banaccorsi di Patti and Gobbi (2001)’s
assertion that, the advent of mega banks led to shrinkage of credit to SMEs, which led to their
inability to grow. However, the study is in disagreement with those of Ojo (2009), Duru and
Lawal (2012), who concluded that, the Nigerian banks’ recapitalization led to an increase in
SME’s financing and as such increased their development.
Finding 3:
The study again found out that, there is no significant relationship between SMEs
growth and commercial banks’ recapitalization in Nigeria. The Calculated Value for the
Pearson correlation was 0.240. This implies that there was a very low correlation, but positive
relationship, between SMEs’ growth and Commercial Banks’ recapitalization in Nigeria from
1982-2012. However, the level of significance 0.194 was higher than the table value of 0.05.
This means that, the null hypothesis which states that there is no significant relationship
between SMEs’ growth and Commercial Banks’ Recapitalization in Nigeria, from 1982 to
2012 was retained, while the alternative hypothesis was rejected. This finding is in agreement
with Lipsey (2003)’s study, which disclosed that commercial banks in Nigeria could not
contribute significantly to SMEs’ advancement, due to the low entrepreneurial development’s
rate of returns. Also, Agumagu (2006), who stated that, the effect of all the credit schemes
established to provide funds to SMEs and contribute to their continuous advancement have
been barely noticeable. Once more, the finding disagreed with those of Ojo (2009), Duru and
Lawal (2012)’s revelation that, the Nigerian banks’ recapitalization led to an increase in SME’s
financing, therefore improved their development.
Conclusion
It can be inferred from the findings of this study above that, there is no significant
relationship between SMEs growth and commercial banks’ recapitalization in Nigeria. The
calculated value for the Pearson correlation between SMEs contribution to total GDP and
commercial banks’ loans to SMEs in Nigeria from 1982 to 2012, was 0.240. This implies that
there was a very low correlation, but positive relationship between these variables. However, the
level of significance of 0.194 was attained which was higher than the table value of 0.05.
Therefore, the study concluded that, there was no significant relationship between SMEs’ growth
and Commercial Banks’ Recapitalization in Nigeria within the study period.
The study recommended that the Nigerian government to makes inquiry into the cause of
reduction in loans disbursed to SMEs by the commercial banks in Nigeria after the
recapitalization (2006-2012) to 28.78 %, approximately 29% per annum, and take positive steps
Commercial Bank’s Recapitalization and Small Scare Enterprise’ (SMEs) Growth in Nigeria
Okhankhuele and Okhankhuele
_____________________________________________________________________________
______________________________________________________________________________
13
© 2019 (9th) International Conference of the AGMS Proceedings
to remedy the situation, in order to enable the commercial banks to allocate more funds to SMEs
in Nigeria, on regular basis. This disbursement was less than that which was disbursed to the
SMEs by the commercial banks in Nigeria before the recapitalization. Nigerian government also
needs to come out with more efficient and effective policy on financing SMEs in Nigeria and
improve their growth and contribution to Nigeria’s GDP.
6) Limitations and direction for future research
This research has led to many key findings. However, the major limitation of the research
was the variation in the figures of SMEs’ contribution to Gross Domestic Product (GDP) and
Total Loan Granted to SMEs by Commercial Banks, reported by the various government
institutions including the Central Bank of Nigeria (CBN), National Bureau of Statistics (NBS),
among others. The variations were however not grave enough to affect the outcome of the
analysis.
In addition, efforts to obtain recent data on SMEs’ contribution to Gross Domestic
Product (GDP) in Nigeria proved abortive. It is therefore suggested that further studies be carried
out on the impact of commercial banks’ recapitalization SMEs’ growth in Nigeria from 2013 till
current date, when such data are available.

Commercial Bank’s Recapitalization and Small Scare Enterprise’ (SMEs) Growth in Nigeria
Okhankhuele and Okhankhuele
_____________________________________________________________________________
______________________________________________________________________________
14
© 2019 (9th) International Conference of the AGMS Proceedings
7) Reference
Abiola, B., Iyoha, F., and Joseph, T. (2011). Microfinance and Micro, Small and Medium
Enterprises Development in Nigeria. Unpublished Article, Covenant University, Ota,
Ogun State, Nigeria.
Adedayo, O. E. (2015). Effect of Bank Size on SME Financing: Evidence from Nigerian
Banking Sector. International Journal of Banking, Finance, Management & Development
Studies. Vol. 3. No. 1. pp. 47-60.
Adegbaju, A. A., and Olokoyo, F. O. (2008). Recapitalization and banks’ performance: a case
study of Nigerian banks. African Economic and Business Review, 6(1).
Agumagu, A. C. (2006). Finance for Industry and Commerce. The Business of Banking.
Lectures and Proceedings at the 26th International Banking Summer School, Oxford.
Akpansung, A, O. and Gidigbi, M. O. (2014). Recent Banking Reforms in Nigeria: Implications
on Sectoral Credit Allocation and Economic Growth. International Journal of Business
and Social Science. Vol. 5. No. 13. December 2014. pp. 91-104.
Anyanwu, M. C. (2010). An Overview of Current Banking Sector Reforms and the Real Sector
of the Nigerian Economy. Central Bank of Nigeria Economic and Financial Review. Vol.
48(4). 31-56.
Aregheore, E. M. (2005). Country Pasture/Forage Resource Profiles, Nigeria. p. 1.
Aregheore, E. M. (2009). Country Pasture/Forage Resource Profiles, Nigeria. Published by Food
and Agriculture Organization (FAO) FIAT PANIS. pp. 1-42.
Asedionlen (2004). For the Economic and Financial Interest of Nigeria. Nigerworld. (1&2).
Banaccorsi, di Patti and G. Gobbi. (2001). The Effect of Bank Consolidation and Market Entry
on Small Business Lending. Banca D'ItaliaTemi di discussion, del ServizoStudi. No. 404,
June 2001.
Berger, A. N. (2000). The Integration of the Financial Services Industry: Where are the
Efficiencies? Finance and Economics Discussion Series, 36. Board of Governors of the
Federal Reserve System (U.S.). Available on
http://dx.doi.org/10.1080/10920277.2000.10595922.
Commercial Bank’s Recapitalization and Small Scare Enterprise’ (SMEs) Growth in Nigeria
Okhankhuele and Okhankhuele
_____________________________________________________________________________
______________________________________________________________________________
15
© 2019 (9th) International Conference of the AGMS Proceedings
Berger, A. N. and Udell, G. F. (2002). Small Business Credit Availability and Relationship
Lending: The Importance of Bank Organizational Structure. The economic
Journal. DOI: 10.1111/1468-0297.00682. Volume 112, Issue 477. February 2002,
pp. F32–F53.
Carpenter, C. (2003). SME Finance in Nigeria. Paper Presented at the Roundtable on Making
Small Business Finance Profitable in Nigeria. Access at
http://www.YAforum.org/news.carpenter on 25/3/2014.
Central Bank of Nigeria (CBN) (2002). Statistical Bulletin, Abuja: Central Bank of Nigeria.
Central Bank of Nigeria (CBN) (2008). Statistical Bulletin, Abuja: Central Bank of Nigeria.
CBN (2010). Statistical Bulletin. CBN, Abuja Nigeria. Central Bank of Nigeria.
Central Bank of Nigeria (2011a). Annual Report and Statement of Accounts.
Central Bank of Nigeria CBN (2011b). Development Finance. Retrieved from
http://www.cenbank.org/Devfin/smefinance.asp
Central Bank of Nigeria (2012a). Annual Report and Statement of Accounts.
CBN (2012b). Summary Report-National Financial Inclusion Strategy. Retrieved from
http://www.cenbank.org
Central Bank of Nigeria (CBN) (2013). Statistical Bulletin, Abuja: Central Bank of Nigeria.
Central Bank of Nigeria (2014). Annual Report and Statement of Accounts.
Central Bank of Nigeria (CBN) (2015). Statistical Bulletin, Abuja: Central Bank of Nigeria.
Craig, J. T. (2005). Small Firm Finance, Credit Rationing, and the Impact of SBA Guaranteed
Lending on Local Economic Growth. Journal of Small Business Management. Vol.
43(4). October 2005. pp. 116-132.
Craig, S. G. and Hardee, P. (2004). The Impact of Bank Consolidation on Small Business Credit.
Availability. Journal of Credit and Banking. Vol. 16(4). Available at http:/www.sba.gov
/advo/research/rs234.pdf. pp. 617-645.
Commercial Bank’s Recapitalization and Small Scare Enterprise’ (SMEs) Growth in Nigeria
Okhankhuele and Okhankhuele
_____________________________________________________________________________
______________________________________________________________________________
16
© 2019 (9th) International Conference of the AGMS Proceedings
Degryse, H., Masschelein, N. and Mitchell, J. (2005). SMEs and Bank Lending Relationships:
The Impact of Mergers. CEPR Discussion Papers 5061. C.E.P.R.
De Haas R., Ferreira D., Taci A. (2010). What Determines the Composition of Banks’ Loan
Portfolios? Evidence from Transition Countries. Journal of Banking and Finance. Vol.
34. pp. 388-398.
De Nicolo, G. Bartholomew, P. Zaman, J. and Zephirin, M. (2003). Bank Consolidation,
Internationalization, and Conglomeration: Trends and Implications for Financial Risk.
IMF Working Paper No. 03/158.
Duru, M. and Lawal, K. M. (2012). Financial Sector Reforms and the Growth of Small and
Medium Scale Enterprises (SMEs) in Nigeria. Universal Journal of Management and
Social Sciences. Vol. 2, No.8. pp. 86-97.
Eferakeya, I. (2014). Nigerian Small and Medium 25Scale Enterprises’ Access to Finance: What
is the story since Bank Consolidation in 2005. International Journal of Innovation and
Applied Studies. ISSN 2028-9324 Vol. 6 No. 4 July 2014, pp. 1111-1122 © 2014
Innovative Space of Scientific Research Journals http://www.ijias.issr-journals.org/
pp.1111-1122.
Emori, E., Nkamare, S., Nneji, I. (2014). The Impact of Banking Consolidation on the Economic
Development of Nigeria. Research Journal of Finance and Accounting. ISSN 2222 1697
(Paper) ISSN 2222-2847 (Online). Vol.5, No.16, 2014. www.iiste.org. pp.113-119.
Evbuomwan, G. O., Okoruwa, V. O. and Ikpi, A. E. (2013). Effect of Deposit Money Banks’
Credit on the Performance of Micro, Small and Medium Enterprises in Nigeria. Central
Bank of Nigeria Economic and Financial Review. Vol. 51, No.2. ISSN 1957 2968.
September, 2013. pp. 63-91.
Federal Office of Statistics (FOS) (1989). Statistical Report, 1989.
Federal Ministry of Environment of Nigeria (FMEN, 2001). National Action Programme to
combat desertification.
http://www.uncd.int/actionprogrammes/Africa/national/2001/Nigeria-eng.pdf
Gbandi, E. C. and Amissah, G. (2014). Financing Options for Small and Medium Enterprises
(SMEs) in Nigeria. European Scientific Journal. January 2014 edition. Vol.10. No 1.
ISSN: 1857 – 7881 (Print) e - ISSN 1857- 7431. pp. 327-340.

Commercial Bank’s Recapitalization and Small Scare Enterprise’ (SMEs) Growth in Nigeria
Okhankhuele and Okhankhuele
_____________________________________________________________________________
______________________________________________________________________________
17
© 2019 (9th) International Conference of the AGMS Proceedings
Imoughele, L. E. and Ismaila, M. (2014). The Impact of Commercial Bank Credit on the Growth
of Small and Medium Scale Enterprises: An Econometric Evidence from Nigeria (1986 -
2012). Journal of Educational Policy and Entrepreneurial Research (JEPER). Vol. 1(2).
pp. 251-261.
Lipsey, H. (2003): Basic Economic Factors in Industrialization. London: Macmillan Books.
Luper, I. (2012). Banking Sector Reforms and SMEs' Financing in Nigeria. Global Journal of
Management Science and Technology. Vol. 1(3). pp. Retrieved from
http://gjmst.com/Current%20Issue/Vol1%20issue%203.pdf. pp. 5-12.
Luper, I. (2013). Rethinking Banks Corporate Social Responsibility (CSR) in Nigeria.
International Journal of Finance and Accounting. DOI: 10.5923/j.ijfa.20130201.05. Vol,
2(1). http://journal.sapub.org/ijfa pp. 30-36.
Mamman, A. and Aminu, K. S. (2013). Effect of 2004 Banking Reforms on Loan Financing of
Small and Medium Scale Industries in Nigeria. International Journal of Small Business
and Entrepreneurship Research. Vol. 1. No 3. September 2013. pp.44-53.
Marsch, K., Schmieder, C. and Aerssen, K. F. (2007). Banking Consolidation and Small
Business Finance-Empirical Evidence from Germany. Discussion Paper, Series 2.
Banking and finance studies. No. 09/2007.
Motilewa, B. D., Ogbari, M. and Aka, D. O. (2015). A Review of the Impacts SMEs as Social
Agents of Economic. International Review of Management and Business Research Vol. 4
Issue 3. September 2015. pp. 903-914.
MSMES Reports (2012). Micro, Small and Medium Enterprises Reports. Retrieved from Bureau
of Statistics, Nigeria on 3rd April, 2016. http://www.bureauofstatistics.gov.ng
National Bureau of Statistics (2012). Job Creation and Employment Surveys.
National Policy on Micro, Small and Medium Enterprises (MSME) (2012). Federal Republic of
Nigeria Draft.
Obamuyi, T. M. (2010). Firms’ Performance and Lending Constraints in Nigeria. Journal of
Entrepreneurship. Vol. 19. No. 2. pp. 179-190.
Obasan, K. A. and Arikewuyo, K. A. (2012). The Effect of Pre-Post Bank Consolidation on the
Accessibility of Finance to SMEs in Nigeria. Business and Management Research, Vol.1.
No.3. pp. 108- 120.

Commercial Bank’s Recapitalization and Small Scare Enterprise’ (SMEs) Growth in Nigeria
Okhankhuele and Okhankhuele
_____________________________________________________________________________
______________________________________________________________________________
18
© 2019 (9th) International Conference of the AGMS Proceedings
Ojo, O. (2009). Impact of Microfinance on Entrepreneurship Development: The Case of Nigeria.
Proceedings of the International Conference on Administration and Business, Nov. 14-
15, Faculty of Administration and Business, University of Bucharest, Romania.
Oleka, C. D., Maduagwu, E. N. and Igwenagu, C. M. (2014). Analysis of the Impact of Micro-
Finance Banks on the Performance of Small and Medium Scale Enterprises in Nigeria.
International Journal of Sciences and Applied Research (IJSAR), Management and
Social Sciences. Vol. 1. pp. 1-3.
Oluitan, R. O., Ashamu, S. O. and Ogunkenu, O. S. (2015). The Effect of Recapitalization on
Bank Performance in Nigeria. International Finance and Banking. Macrothink Institute.
ISSN 2374-2089. Vol. 2. No. 1. pp. 79-90.
Olutunla, G. T. and Obamuyi, T. M. (2008). An Empirical Analysis of Factors Associated with
the Profitability of Small and Medium-Enterprises in Nigeria. African. Journal of
Business. Management. Vol. 2(10). pp. 195-200.
Omah, I., Durowoju, S. T., Adeoye, A. O. and Elegunde, A. F. (2012). Post-Bank Consolidation:
A Debacle in the Survival of SMEs in Nigeria “An Empirical Study”. Australian Journal
of Business and Management Research. Vol.2. No.08. pp. 01-06.
Real Sector Division Research Department, Central Bank of Nigeria (CBN) (2014). Credit
Delivery to Small and Medium Scale Enterprises: Post Bank Consolidation in Nigeria.
Occasional Paper Number 53. October, 2014.
Small and Medium Enterprises Development Agency of Nigeria (SMEDAN) (2007). National
Policy on Micro, Small and Medium Enterprises. Federal Republic of Nigeria,
SMEDAN, Abuja, Nigeria. January, 2007.
SMEDAN. (2010). Survey Report on Micro, Small and Medium Enterprises (MSMEs) in
Nigeria: 2010 National MSME collaborative Survey Retrieved from:
http://smedan.gov.ng/images/collaborative%20survey%20report.smedan-nbs.pdf.
Soludo, C. C. (2008). Making finance work for the poor. A convocation Paper. retrieved from
http://www.cenbank.org/documents/speeches.
Takáts, E. (2004). Banking Consolidation and Small Business Lending. European Central Bank.
Working Paper Series No. 407. November 2004. http://www.ecb.int or
http://ssrn.com/abstract_id=601027. pp. 1-35.
Commercial Bank’s Recapitalization and Small Scare Enterprise’ (SMEs) Growth in Nigeria
Okhankhuele and Okhankhuele
_____________________________________________________________________________
______________________________________________________________________________
19
© 2019 (9th) International Conference of the AGMS Proceedings
Terungwa, A. (2012). Risk Management and Insurance of Small and Medium Scale Enterprises
(SMES) in Nigeria. International Journal of Finance and Accounting. Vol. 1(1). pp. 8-
17.
West African Examinations Council (WAEC) (2009). E-Learning, Geography Paper 2, Nov/Dec.
2009. p. 1.
Wikipedia – Definition and functions of Commercial bank

Design and Development of Citizens Information System
Yutanto
___________________________________________________________________________
______________________________________________________________________________
20
© 2019 (9th) International Conference of the AGMS Proceedings
Design and Development of Citizens Information System
Hariadi Yutanto
STIE Perbanas Surabaya-Indonesia
Abstract
The problems that often arise in the neighborhood of Neighborhood Unit (RT) and Rukun Warga
(RW) are the distribution of information on citizen activities, administration, transparent
financial management, and management of citizen databases as an effort to improve services and
information facilities for residents. The purpose of this study is to support the government in
implementing e-Government-based government systems, by developing Good Local
Governance. The specific target of innovation to be achieved is the development of innovation in
the form of a web-based Citizen Information System (SiWarga) application at the RT / RW level.
The method used in this study uses the System Development Life Cycle (SDLC Waterfall)
method, starting from the first is analyzing the needs by conducting a survey and the feasibility
of developing the system, second is to make a detailed list according to system requirements
specifications, third is to design the system by creating workflow designs and programming
design, the fourth is the development of information systems with coding, the fifth is system
testing, the sixth is the implementation and maintenance of the system
Key words: database management, information systems, SiWarga, system integration
JEL code: A14, C31, M31.
Design and Development of Citizens Information System
Yutanto
___________________________________________________________________________
______________________________________________________________________________
21
© 2019 (9th) International Conference of the AGMS Proceedings
Introduction
In realizing Good Governance the government is currently implementing an e-
government system in a Griya Pesona Asri (GPA) is housing located in Rungkut sub-district and
Medokan Ayu Village, Rukun Warga (RW) 10 Surabaya. The total number of Neighborhood
Unit (RT) is 5 with a population of approximately 400 Head of Families. The housing that has
planned IT-based has made a security system in the residential environment by developing
CCTV security systems in each RT at each vulnerable point that can be monitored online by
residents. The current constraints are administrative management such as managing letters,
paying dues and database of citizens still online even though they have used Microsoft Office
office applications (Word & Excel). The obstacle that many people feel is that every month
residents have to deposit cash payments to the committee.
The implementation of a similar information system, namely the village management
development website, was previously implemented in the village of Bulaksari, which focused on
managing the community database, which can be accessed on the website
http://www.bulaksari7sby.com/, from the previous service program that has been implemented in
more detail with the name of the Citizen information system (SiWarga). The specific objective of
this research is to develop SiWarga in the neighborhood of Neighborhood Groups that can
improve services and information facilities for citizens, in addition residents can also control
citizens' financial statements transparently. It is different from the current conditions which still
use the manual process in carrying out the bookkeeping process and delivering information to
residents by going to the homes of residents one by one. Considering the government's program
in realizing Good Government in Indonesia, the importance of this research must be done to
improve service and comfort of citizens
Theory And Hypotheses
Mainframe Platform
The development of the RT / RW information system has been diverse and has been
implemented in several RT / RW in Indonesia. Broadly speaking, the development of existing
application systems can be divided into three applications. First, desktop-based applications are
applications that can run independently or independently without using a browser or internet
connection on an autonomous computer, with a particular operating system or platform (Akay et
al., 2016; Lin & Lin, 2018). Second, web-based applications are applications that can run on the
basis of web or browser technology. This application can be accessed anywhere as long as there
is an internet connection that supports without the need to install on each computer such as a
desktop application, simply by opening the browser and heading to where the application server
is installed (Bressolles, Durrieu, & Senecal, 2014; Tikno, 2017). Third, mobile based
Design and Development of Citizens Information System
Yutanto
___________________________________________________________________________
______________________________________________________________________________
22
© 2019 (9th) International Conference of the AGMS Proceedings
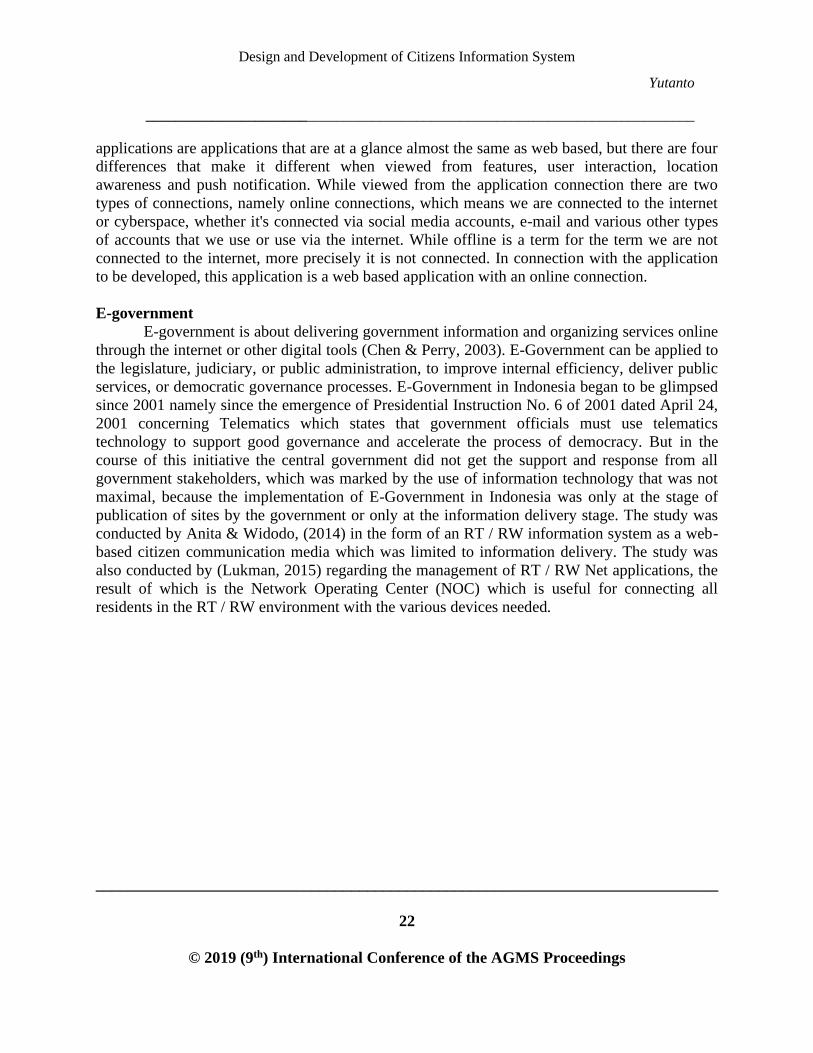
applications are applications that are at a glance almost the same as web based, but there are four
differences that make it different when viewed from features, user interaction, location
awareness and push notification. While viewed from the application connection there are two
types of connections, namely online connections, which means we are connected to the internet
or cyberspace, whether it's connected via social media accounts, e-mail and various other types
of accounts that we use or use via the internet. While offline is a term for the term we are not
connected to the internet, more precisely it is not connected. In connection with the application
to be developed, this application is a web based application with an online connection.
E-government
E-government is about delivering government information and organizing services online
through the internet or other digital tools (Chen & Perry, 2003). E-Government can be applied to
the legislature, judiciary, or public administration, to improve internal efficiency, deliver public
services, or democratic governance processes. E-Government in Indonesia began to be glimpsed
since 2001 namely since the emergence of Presidential Instruction No. 6 of 2001 dated April 24,
2001 concerning Telematics which states that government officials must use telematics
technology to support good governance and accelerate the process of democracy. But in the
course of this initiative the central government did not get the support and response from all
government stakeholders, which was marked by the use of information technology that was not
maximal, because the implementation of E-Government in Indonesia was only at the stage of
publication of sites by the government or only at the information delivery stage. The study was
conducted by Anita & Widodo, (2014) in the form of an RT / RW information system as a web-
based citizen communication media which was limited to information delivery. The study was
also conducted by (Lukman, 2015) regarding the management of RT / RW Net applications, the
result of which is the Network Operating Center (NOC) which is useful for connecting all
residents in the RT / RW environment with the various devices needed.

Design and Development of Citizens Information System
Yutanto
___________________________________________________________________________
______________________________________________________________________________
23
© 2019 (9th) International Conference of the AGMS Proceedings
Figure-1. State of Art
Database
A database is a collection or arrangement of complete operational data from an
organization that is organized or managed and stored in an integrated manner using certain
methods using a computer so that it is able to provide the optimal information needed by the user.
While the database system is a system of compiling and managing records using a computer to
store or record and maintain complete operational data of an organization or company so as to be
able to provide optimal information needed by the user for the decision making process.
According to Marlinda (2004) the understanding of the Database is: "A collection of files that
have a connection between one file and another so that it forms a building of data to inform an
agency company, within certain limits". The conclusion above is the database is a collection of
data that are interconnected with one another, stored in a computer and used software to
manipulate it
PHP
PHP is one of the scripting languages installed in HTML. Most syntax is similar to C,
Java and Perl, plus some specific PHP functions. The main purpose of this language is to enable
web designers to write dynamic web pages quickly. PHP was written and first introduced around
1994 by Rasmus Lerdorf through his website to find out who has accessed the online summary.
PHP is a script-shaped language that is placed on a server and processed on a PHP server is a
script-shaped language that is placed on the server and processed on the server. The results will
be sent to the client, where the user uses the browser. PHP is known as a scripting language,
which integrates with HTML tags, is executed on a server, and is used to create dynamic web
Sistem Informasi RT/RW sebagai
media komunikasi warga berbasis web.
Anita,2014.
Teknologi:
Website online
Fasilitas:
Pengumuman, Saran, Ide, Pengelolaan
Keuangan
Manajemen Aplikasi RT/RW Net
Kampung Haji. Lukman,2015.
Teknologi:
Network Operating Centre, desktop
Fasilitas: Jaringan Internet
setiap warga.
Sistem Manajemen Akuntansi Rukun Tetangga (SMART
Kampung)
Teknologi:
mobile / website based
online internet system
Fasilitas: Pengelolaan keuangan, bisa diakses melalui smartphone,
blog, terintegrasi
Design and Development of Citizens Information System
Yutanto
___________________________________________________________________________
______________________________________________________________________________
24
© 2019 (9th) International Conference of the AGMS Proceedings
pages such as Active Server Pages (ASP) or Java Server Pages (JSP). PHP is an open source
software. In particular, PHP is designed to form a dynamic web. That is, it can form a display
based on current requests. In principle, PHP has the same functions as scripts such as ASP
(Active Serever Page), Cold Fusion, and Perl.
Research Methodology
Objectives, Sample, and Procedure
The objective of this research is Griya Pesona Asri Housing (GPA), Neighborhood Unit 4,
Rukun Warga (RW) 10 Exit Medokan Ayu sub-district Rungkut, Surabaya- Indonesia. The type
of data in this study is primary data using field research, namely research carried out by
approaching the object of research. In this case data collection is done by:
a. Observation (Observation); In collecting data and information in order to complete the results
of this study, the author looks directly at the object of research.
b. Interview; Data collection by means of interviews, the author conducted question and
answer verbally with RT, RW, Kelurahan and related parties.
Research Framework
Research framework in developing Citizen Information Systems (SiWarga), using the
System Development Life Cycle (SDLC) method with the waterfall model (Kute & Thorat,
2014). The Waterfall Model is a sequential software development method. In addition this model
is the most widely used model by software developers.

Design and Development of Citizens Information System
Yutanto
___________________________________________________________________________
______________________________________________________________________________
25
© 2019 (9th) International Conference of the AGMS Proceedings
Figure 3.1 SDLC Modelling
The following is an explanation of the phase phase in the waterfall.
1. Planning
In planning is the initial process of a system development, where at this stage planning steps will
be carried out in developing SIWARGA applications such as extracting information about citizen
data, citizen services, RT bookkeeping systems and reports that can be accessed through an
online system
2. Need analysis (Requirement Analysis)
In the needs analysis data collection is carried out in a study, such as a survey in the form of
observing community activities and interviewing administrators and several residents. System
analysts will dig up as much information as possible from citizens so that a system can do the
desired task. At this stage the document will produce user requirements or can be said as data
that relates to what the user wants in making the system.
3. System design (System Design)
Process design will translate the needs of a software design that can be estimated before the
programming language (coding) is made. This process focuses on data structures, software

Design and Development of Citizens Information System
Yutanto
___________________________________________________________________________
______________________________________________________________________________
26
© 2019 (9th) International Conference of the AGMS Proceedings
architectures, interface representations, and procedural details. At this stage the software
requirment will be produced.
4. Development (Development)
Development or called coding is the translation of design systems in languages that can be
recognized by devices. Programmer who will translate the process requested by the user. At this
stage the programmer starts working on a system in accordance with the design system that has
been designed before
5. Implementation (Testing)
This stage can be said to be final in making a system. After analyzing, designing and coding, the
system that has been created will be used by the user, testing using the black box method ...
6. Maintenance (Maintenance)
At this stage is the process of maintaining the application, starting from the database to the
network, so that the application is user friendly.
Result
E-Government functions to be able to improve the quality of public services, using the
use of information and communication technology in the process of administering local
government so that governance can be formed that is clean, transparent and able to respond to
changing demands effectively, while the criteria of prospects of Information Systems Citizens
(SiWarga) in the neighborhood of neighbors in realizing e-government include the formation of
information networks and public service transactions that are not limited to time and location,
and at a cost that is affordable to the public. In addition, the establishment of a transparent and
efficient management, financial and work process system, thus facilitating transactions,
information and services between government institutions. The impact of the benefits of the
Citizens Information System (SiWarga) in the neighborhood of neighboring neighborhoods is,
among others, improving better service to the community, increasing relations between the
government, business people & the community, the loss of bureaucracy that has become a barrier
for the community to work more effectively and avoid extortion carried out by government
officials and minimize the possibility of corruption.
Implementation and Testing
At the stage of implementation and testing can be done after system development. After
testing the system weaknesses / shortcomings, implementation to users will be carried out in the
form of socialization. To residents who want to connect to the information system server via an
internet connection to the information system and each can download the guide that has been
made. Documentation of the results of the research is also carried out as a guide for making and
implementing the system.
Design and Development of Citizens Information System
Yutanto
___________________________________________________________________________
______________________________________________________________________________
27
© 2019 (9th) International Conference of the AGMS Proceedings
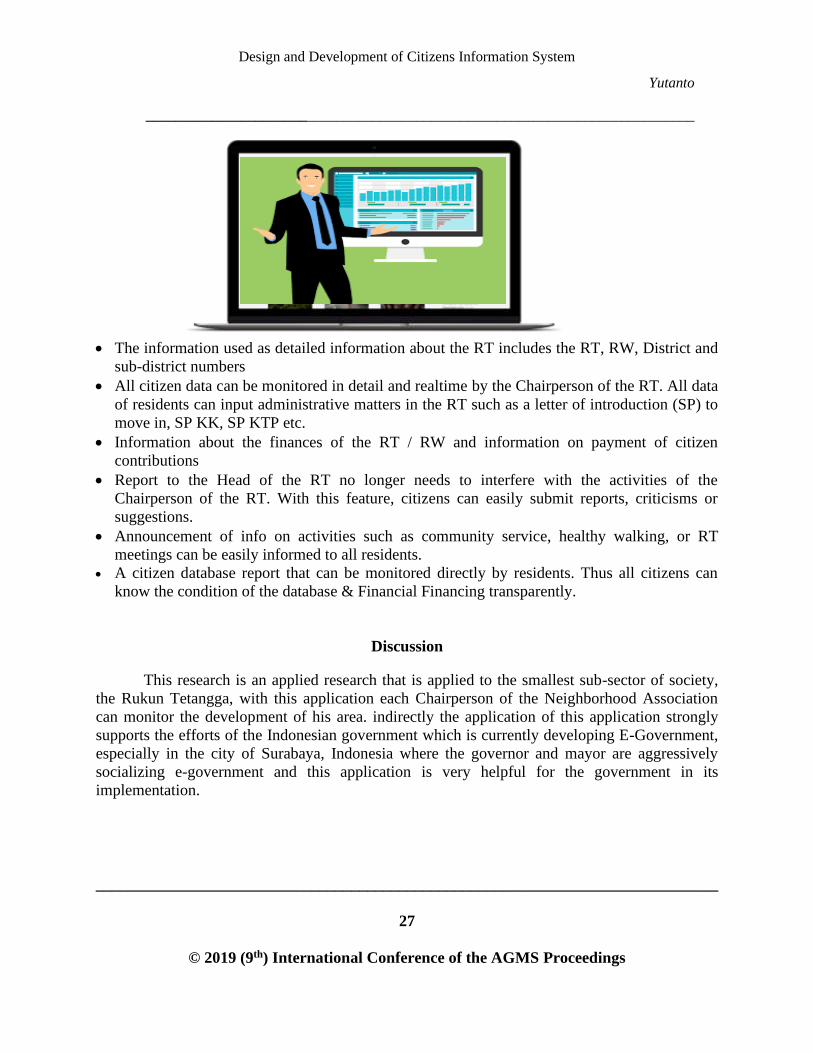
• The information used as detailed information about the RT includes the RT, RW, District and
sub-district numbers
• All citizen data can be monitored in detail and realtime by the Chairperson of the RT. All data
of residents can input administrative matters in the RT such as a letter of introduction (SP) to
move in, SP KK, SP KTP etc.
• Information about the finances of the RT / RW and information on payment of citizen
contributions
• Report to the Head of the RT no longer needs to interfere with the activities of the
Chairperson of the RT. With this feature, citizens can easily submit reports, criticisms or
suggestions.
• Announcement of info on activities such as community service, healthy walking, or RT
meetings can be easily informed to all residents.
• A citizen database report that can be monitored directly by residents. Thus all citizens can
know the condition of the database & Financial Financing transparently.
Discussion
This research is an applied research that is applied to the smallest sub-sector of society,
the Rukun Tetangga, with this application each Chairperson of the Neighborhood Association
can monitor the development of his area. indirectly the application of this application strongly
supports the efforts of the Indonesian government which is currently developing E-Government,
especially in the city of Surabaya, Indonesia where the governor and mayor are aggressively
socializing e-government and this application is very helpful for the government in its
implementation.
Design and Development of Citizens Information System
Yutanto
___________________________________________________________________________
______________________________________________________________________________
28
© 2019 (9th) International Conference of the AGMS Proceedings
Conclusions, limitations and suggestions
In addition, this study provides information about improving an area. This research was
conducted in Indonesia as the country with the largest population in Southeast Asia and the city
of Surabaya as the Capital of East Java, where most of the population is migrants, so it can be
used as a representative.
Design and Development of Citizens Information System
Yutanto
___________________________________________________________________________
______________________________________________________________________________
29
© 2019 (9th) International Conference of the AGMS Proceedings
References
Akay, E., Poputra, A., Kalalo Analisis Aspek Keperilakuan, M., Marantika Akay, E., Poputra, A.
T., B Kalalo, M. Y., … Akuntansi Universitas Sam Ratulangi, J. (2016). Analisis Aspek
Keperilakuan Terhadap Penerapan Sistem Akuntansi Persediaan Pada Pt. Surya Wenang
Indah Manado. 688 Jurnal EMBA, 4(1), 688–697.
Anita, & Widodo, S. (2014). Sistem Informasi Rt / Rw Sebagai Media Komunikasi Warga
Berbasis Web. SMATIKA Jurnal, 4(November), 20–26.
Bressolles, G., Durrieu, F., & Senecal, S. (2014). A consumer typology based on e-service
quality and e-satisfaction. Journal of Retailing and Consumer Services, 21(6), 889–896.
https://doi.org/10.1016/j.jretconser.2014.07.004
Chen, Y.-C., & Perry, J. (2003). Outsourcing for E-Government. Public Performance &
Management Review, 26(4), 404–421. https://doi.org/10.1177/1530957603252590
Kute, S. S., & Thorat, S. D. (2014). A Review on Various Software Development Life Cycle
(SDLC) Models. Ijrcct, 3(7), 776–781. Retrieved from
http://ijrcct.org/index.php/ojs/article/view/784
Lin, S. H., & Lin, T. M. Y. (2018). Demand for online platforms for medical word-of-mouth.
Journal of International Medical Research, (43), 030006051875789.
https://doi.org/10.1177/0300060518757899
Lukman, M. S. (2015). Manajemen Aplikasi RT/RW Net Di Paku Haji. Universitas Mercu
Buana Menteng.
Tikno. (2017). Measuring performance of facebook advertising based on media used: A case
study on online shops in Indonesia. Procedia Computer Science, 111, 105–112.
https://doi.org/10.1016/j.procs.2017.06.016
Venkatesh, V., Thong, J. Y. L., & Xu, X. (2016). Unified Theory of Acceptance and Use of
Technology: A Synthesis and the Road Ahead. Journal of the Association for Information
Systems, 17(5), 328–376. https://doi.org/10.1080/1097198X.2010.10856507
Yandra, A. (2016). E-goverment dengan Memanfaatkan Teknologi Informasi. Jurnal Kajian
Politik Dan Masalah Pembangunan, 12(01), 1769–1780.

Can Instagram Convince Information to Users?
Ilham
___________________________________________________________________________
______________________________________________________________________________
30
© 2019 (9th) International Conference of the AGMS Proceedings
Can Instagram Convince Information to Users?
Romi Ilham
STIE Perbanas Surabaya, Indonesia
Abstract
With social networking everyone can give opinions through electronic word of mouth (eWOM),
this experiment explored how users adopt information on Instagram. The ultimate goal is to
investigate the influence of source credibility and information quality on information adoption
through an attitude toward information and information usefulness.
The proposed research model was tested using partial least square with 368 valid questionnaires
collected in Indonesia. According to the literature review and analysis techniques, we conclude
that source credibility and information quality have an influence on the attitudes and usability of
information in adopting information
Key words: source credibility, information quality, attitude information, information usefulness,
information adoption. JEL code: A14, C31, M31.

Can Instagram Convince Information to Users?
Ilham
___________________________________________________________________________
______________________________________________________________________________
31
© 2019 (9th) International Conference of the AGMS Proceedings
1. Introduction
In recent years, our daily life is inseparable from social networking, and with social
networking can make everyone give opinion through electronic word-of-mouth (eWOM),
therefore make people assume whether the information available on social networking can be
trusted (Pan, Litvin, & Goldsmith, 2008). The Internet has provided several appropriate
platforms for eWOM such as blogs, discussion forums, review websites, shopping websites and
lastly social media websites (C. M. K. Cheung & Thadani, 2012). With the advent of internet
technology, WOM's traditional face-to-face behavior has changed to eWOM, and before making
the right buying decision, consumers can get information about products or services through
eWOM that are on social media (Daugherty & Hoffman, 2014). Instagram is one of the fastest
growing online social media services where users share information with their followers (Statista,
2018), but academic research related to media is limited (Sheldon & Bryant, 2016).
Sussman & Siegal, (2003) conducts research on the relationship of objectivity with
source credibility (SC) on attitudes toward advertising, attitudes toward brands and intention to
buy. As a result, they find source credibility can affect attitudes toward advertising, and can
affect purchase intentions. Several research has been evaluated the interaction between eWOM
source credibility and information adoption and, rarely research has focused on food products.
Therefore, this research was proposed to evaluate the consumer information adoption behavior as
presented by Sussman & Siegal, (2003) and Hussain, Ahmed, Jafar, Rabnawaz, & Jianzhou,
(2017) of food products in the Republic of China through eWOM source credibility and
perceived risk mediated by information usefulness and argument quality.
In this research, we investigate the impact of Instagram upon expertness, trustworthiness,
attractiveness and homophily as eWOM source credibility and quality of information on attitudes
toward information and information usefulness in information adoption. This research was
conducted in the Republic of Indonesia, Indonesia is a developing country that has a variety of
tribes with a population of 260 million and more than 130 million users of social media with 50
million active users of Instagram. Currently in Indonesia there are many Instagram accounts that
review food profiles, this is used by sellers as a marketing tool by buying followers and adding
comments from fake accounts. This is one of the reasons why researchers evaluate consumer
information adoption behavior based on information received.
2. Theory And Hypotheses
Source Credibility
Source credibility is the basis for credibility, which is generally used to describe the
positive influence of messages that are communicated to the recipient or transmitter (Ohanian,

Can Instagram Convince Information to Users?
Ilham
___________________________________________________________________________
______________________________________________________________________________
32
© 2019 (9th) International Conference of the AGMS Proceedings
1990). Source credibility is usually investigated using two dimensions, expertise and trust
(Fanoberova & Kuczkowska, 2016; Carl I Hovland, Janis, & Kelley, 1953; Sussman & Siegal,
2003). Expertise can be defined as "the perceived ability of sources to make valid statements"
(McCracken, 1989). This explains the extent to which sources are able to provide valid
information (Carl Ivan Hovland, Janis, & Kelley, 1953). This level can be determined by
assessing aspects of the source, such as knowledge, experience, or skills (Erdogan, 2010). The
characteristics of expertness are, having confidence in a popular review site or forum can provide
useful information, having confidence in the number of reviews written representing knowledge
in evaluating experience, and having confidence in how long the reviewer has registered on the
review site, then rely on useful reviews according to readers. Trustworthiness is defined as "the
perceived willingness of a source to make a valid statement" (McCracken, 1989) and relates to
consumer confidence that the source of information conveys the message in an objective and
honest manner (Ohanian, 1990). Trustworthiness can be seen as perceived motivation from
information sources to communicate messages without bias (Bressolles, Durrieu, & Senecal,
2014), which is related to honesty and trustworthiness of sources (McGinnies & Ward, 1980).
Source trust depends on the motive of the perceived source to share certain information (Dou et
al., 2012). When consumers evaluate the trust of information sources, they build their opinions
about the causal conclusions they make about source motives for writing product reviews (See-
To & Ho, 2014). The characteristics of trustworthiness are, trust the same situation mentioned by
different reviewers to verify the actual level, trust in using first person pronouns (i.e. "I" or
"We") in the review represents the experience of the reviewer, trust that reviewers provide honest
reviews about their experiences, and feel confident that the length of content in the review shows
the level of effort of the reviewer.
However, some researchers include another dimension for their study of source
credibility. For example, (Ohanian, 1990), adds attractiveness as the third dimension of source
credibility, but it is examined as a physical attraction. Researchers argue that attraction creates
personal influence through communication between the source and recipient (Kiecker & Cowles,
2002). Attractiveness is another dimension of source credibility and is defined as the extent to
which the recipient of information considers an interesting source (Kiecker & Cowles, 2002; Z.
Teng, Nie, Guo, & Liu, 2017). Attractiveness considers social values perceived by sources,
including physical appearance, personality, social status, or similarity with the recipient (Valarie
A. Zeithaml, 2002). There are studies that examine the physical attractiveness of sources, such as
in the study of celebrity support (Ohanian, 1990; Roger-Monzó, Martí-Sánchez, & Guijarro-
García, 2015; Sussman & Siegal, 2003), but not many works discuss the attractiveness in terms
of similarity with recipients. McGuire, (1985) distinguishes attractiveness's dimensions as
perceived familiarity, attractiveness, and source similarity to the recipient of the message. In a
similar vein, (Kiecker & Cowles, 2002) examined the influence of interpersonal source
credibility by examining attraction as "perceived similarities between buyers and
recommendations". The authors state that Attractiveness arises when consumers interact when

Can Instagram Convince Information to Users?
Ilham
___________________________________________________________________________
______________________________________________________________________________
33
© 2019 (9th) International Conference of the AGMS Proceedings
shopping online with friends, family, or fellow consumers who are similar, familiar, and
preferred (Kiecker & Cowles, 2002). The characteristics of Attractiveness are, authoritativeness,
availability, believability, honesty, and bias.
Besides that, Hussain et al., (2017) also adds homophily as the fourth dimension of
source credibility, seen as an important variable that affects personal correspondence.
Homophily is seen as an important variable that has an impact on personal correspondence.
Homophily reduces vulnerability, improves true sentiment, and strengthens the well-being of
interpersonal relationships. This refers to reviews written by people their age, gender groups, and
have similar interests (Hansen & Lee, 2013; Mcpherson, Smith-lovin, & Cook, 2001). The
characteristics of Homophily are, rely on reviews written by people in the same age group, rely
on reviews written by people of the same sex, rely on reviews written by people who have
similar interests, and rely on reviews written by people who buy food products in the same way.
In source credibility, expertness and attractiveness are found to play an important role in
information and social influence (Kiecker & Cowles, 2002; Maddux & Rogers, 1980). Previous
research by Erkan & Evans, (2016), Gunawan & Huarng,(2015) and Wixom & Todd, (2005)
showed a positive relationship between credibility and attitude. Therefore, researchers trying to
test source credibility have a positive effect on attitude towards information. Source Credibility
refers to the credibility that someone feels from the source of information, regardless of what the
information contains. Although the credibility of the source is not related to the information itself,
it can affect customer perceptions of the usefulness of information (Di & Luwen, 2012). The
customer's perception of the usefulness of Information will decrease, if the source is less credible.
• Hypotheses 1. Source credibility will be significantly related to attitude toward information.
• Hypotheses 2. Source credibility will be significantly related to information usefulness.
Information Quality
Information today is very easy to reach. The passage of time must be followed by the
continued emergence of information in the world. Information flow is increasingly unstoppable
with the internet. Whenever and wherever everyone can get and disseminate information.
Various possibilities arise from information spread throughout the community. It can occur
because of marketing, sharing, existence and other reasons. Of the many information available,
one must be able to determine which information must be taken or left behind. This must be done
so as not to absorb information that is not true. Therefore, it is necessary to have a person's
perception of the quality of information on the internet, this is an important element to assess the
information. In his book entitled "Management Information Systems" McLeod & Schell, (2008)
stated that there are 4 dimensions needed to add value to information, namely Relevance,
Accuracy, Actual and Completeness. Many studies related to the quality of information online.
This study adopted the dimensions used by (C. M. K. Cheung, Lee, & Rabjohn, 2008) which

Can Instagram Convince Information to Users?
Ilham
___________________________________________________________________________
______________________________________________________________________________
34
© 2019 (9th) International Conference of the AGMS Proceedings
includes dimensions of relevance, accuracy, timeliness and comprehensiveness. In the study,
timeliness was excluded because it was found to be insignificant by (C. M. K. Cheung et al.,
2008). Timeliness is also often overlooked in online review research (Ives, Olson, & Baroudi,
1983), because websites must be updated regularly to provide valuable information. If this
condition is not met, users can view the website less useful (Liu & Suh, 2017). Similarly, users
pay more attention to websites that contain the latest online reviews (Zhao, Wang, Guo, & Law,
2015). When online reviews are considered to contain valid arguments, the recipient will develop
a positive attitude towards information. On the other hand, if an online review is considered to
have an invalid argument, the recipient will develop a negative attitude towards information (M.
Y. Cheung, Luo, Sia, & Chen, 2009). As a result, online reviews that provide valid and strong
arguments can influence attitudes towards information and sources. The way recipients feel the
quality of information can influence their purchasing decisions. That information meets the
needs and requirements of users, he is more likely to follow recommendations during the
decision making process (Olshavsky, 1985).
Relevance was found to have a significant influence on the usefulness of information and
information adoption (C. M. K. Cheung et al., 2008), which means that the probability of
consumers being convinced by online review is higher when information relevance is high (S.
Teng, Khong, & Goh, 2014). Then accurate about "truth information output" (Bailey & Pearson,
1983). This also refers to the extent to which users perceive information as true because they
may be skeptical about certain claims, which can be seen as true or false (C. M. K. Cheung et al.,
2008). This means that if the review presents information that is known to be the wrong user, he
can refuse the review. If the review contains comments that match what the user believes are
correct, he will be more willing to consider the remaining accurate comments. Markopoulos &
Kephart, (2002) states that reviews including information that is more accurate, have greater
value for consumers.
Therefore, the more accurate the information is, the more useful information is felt by
consumers. Comprehensiveness refers to the completeness of the information (C. M. K. Cheung
& Thadani, 2010), which implies that the information is understandable, informative, has
sufficient breadth and depth. (C. M. K. Cheung et al., 2008; S. Teng et al., 2014). C. M. K.
Cheung et al., (2008) found that the completeness of online reviews played an important role in
the adoption of information because the more comprehensive the review, the more people would
adopt it. Information Usefulness can increase with clear information on information. In
accordance with the statement of Di & Luwen, (2012), in the internet world eWOM can
influence purchasing decisions and consumer behavior. After information quality meets the
needs and requirements of recipients of information, information will be considered more useful.
High information quality will be more persuasive than low information quality (Di & Luwen,
2012).

Can Instagram Convince Information to Users?
Ilham
___________________________________________________________________________
______________________________________________________________________________
35
© 2019 (9th) International Conference of the AGMS Proceedings
• Hypotheses 3. Information quality will be significantly related to attitude toward information.
• Hypotheses 4. Information quality will be significantly related to information usefulness.
Attitude toward information sources and information adoption
Information can have different effects on individuals and produce various responses as
recipients vary in perception and experience (Chaiken & Eagly, 1976). To understand the
influence of information on individuals, the information adoption process is developed (C. M. K.
Cheung et al., 2008). Attitudes toward behavior serve as determinants of behavioral intention
(Ajzen & Fishbein, 2005). Building attitudes in the context of technology acceptance are
attitudes towards using technology (Wixom & Todd, 2005). If someone is satisfied with the
quality of information, he or she holds behavioral beliefs that use this information well. This
implies that information is useful and in turn forms a positive attitude towards the use of
information (Wixom & Todd, 2005). The Attitude Using Information Source characteristics are
acceptance of interesting information, acceptance of unattractive information (inverted items),
believe online testimonials, and do not believe online testimonials.
Attitude is widely recognized as an important concept for marketing research because
attitudes serve as predictors of consumer behavior towards products or services (Nisar &
Prabhakar, 2017). The concept of attitude takes its origin from the field of social psychology.
This is defined as the tendency of an individual to evaluate a particular entity with some degree
of goodness or disadvantage (Wan et al., 2015). The concept of attitude has special importance
for marketing research because marketers want to change consumer behavior, and they try to do
it by influencing attitudes(Bilgihan, 2016). Analysis of individual attitudes gives practitioners the
opportunity to explain and estimate their behaviour (Ajzen & Fishbein, 2005). Therefore, the
investigation of the relationship between attitudes and adoption of information to what extent
people receive the content of messages and believe that meaningful information can help to
develop recommendations for marketers, how to influence consumer behavior online and how to
persuade consumers. Previous studies of online shopping show that attitudes have a significant
influence on behavioral intentions. George, (2004) identifies that attitudes toward online
purchasing influence behavior in making actual purchases. Similarly, Liao, Chang, Wu, &
Katrichis, (2011) in their study of consumer behavior intentions to use internet shopping shows
that attitudes toward Internet shopping have a positive influence on intention. Therefore, an
attitude construct has been added to this study to investigate its effect on behavioral intention.
Through the Theory of Reasoned Action considers attitudes toward behavior as determinants of
behavioral intention (Ajzen & Fishbein, 2005).
• Hypotheses 5. Attitude toward information sources will be significantly related to information
adoption.

Can Instagram Convince Information to Users?
Ilham
___________________________________________________________________________
______________________________________________________________________________
36
© 2019 (9th) International Conference of the AGMS Proceedings
Information usefulness and information adoption
Information Usefulness is defined as the extent to which readers understand valuable
information that can help them make better purchasing decisions (C. M. K. Cheung et al., 2008).
The usefulness of information is an important determinant of information adoption. According to
Zheng, Youn, & Kincaid, (2009) 55% of online media readers are looking for comments from
the authors to be used as benefits and bring the information into consideration when making
purchasing decisions. "The usefulness of information is measured through constructs as
developed by Bailey & Pearson, (1983). The usefulness of information refers to individual
perceptions of opinions that can improve performance using new technology. Valuable,
informative and useful are the three keys that make information useful as discussed by
McKinney, Yoon, & Zahedi, (2002) in their web satisfaction model. Likewise, people feel
information to reduce risk, so, the usefulness of information is an important factor to be useful
for any information because reviewers seek information that can help them and reduce the risks
and results of this hypothesis in accordance with the study of C. M. K. Cheung et al., (2008). The
characteristics of information usefulness are value of information (valuable), information
delivery (informative) and benefits of information (helpful).
Information usefulness is the user's perception of the reliability of information, comments
or reviews on the internet that are valuable or not because the usefulness of perception leads to
the customer's intention to adopt information. Adoption of information is an information
procedure that is useful for customers to engage with comments and opinions that are suggested
for decision making (C. M. K. Cheung et al., 2008; Sussman & Siegal, 2003)
• Hypotheses 5. Information Usefulness will be significantly related to information adoption.
3. Research Methodology
Sample and procedure
To test the hypothesis, a survey was conducted through the distribution of questionnaires
with a purposive sampling method in various regions of the Republic of Indonesia to 420
respondents. With the inclusion criteria at least 1 year active user Instagram, and exclusion
criteria for active users of the age above 17 years.
Determination of this condition aims that the selected respondents actively use the
Instagram application and at least have enough age to use the Instagram application wisely.
Surveys are distributed conventionally and electronically, by attaching a letter informing the

Can Instagram Convince Information to Users?
Ilham
___________________________________________________________________________
______________________________________________________________________________
37
© 2019 (9th) International Conference of the AGMS Proceedings
respondent that the data will be treated confidentially and only used for academic research
purposes. Our final sample consisted of 368 respondents dominated by female (62%); with their
average age is 17-30 years and the level of education are bachelor’s degree.
Measure
All the items were scored on a 5‐point Likert response scale ranging from 1 (strongly
disagree) to 5 (strongly agree) unless otherwise noted.
Data Analyses
The analysis technique uses Partial Least Square (PLS) as a data analysis tool with the
help of SMART PLS application, because Smart PLS is based on covariance, then the number of
respondents above 75 is enough to produce good analysis (Joseph F. Hair, Ringle, & Sarstedt,
2011). Following are the steps in analyzing with PLS: 1. preparing a path diagram, 2.
determining structural equations, and 3. Confidentiality Criteria (convergent validity,
discriminant validity, composite reliability, R-Squared).
The variables in this study consisted of demographic variables that were used to
determine the characteristics of respondents and included gender, age, education, occupation.
Exogenous latent variables including source credibility (expert, trustworthy, attractiveness, and
homophily) are used to determine the value of source credibility and information quality. The
endogenous latent variable consists of attitude towards information, information usefulness and
information adoption. And the last is the manifest variable used to explain and measure latent
variables.

Can Instagram Convince Information to Users?
Ilham
___________________________________________________________________________
______________________________________________________________________________
38
© 2019 (9th) International Conference of the AGMS Proceedings
Figure 1. Model Framework
4. Result
Descriptive statistics
Based on table 1, the majority of Instagram users are 229 respondents (62%), this is in
line with research from Acar, (2008); Rakow, (1992); Sheldon, (2008); Szell & Thurner, (2013),
which states that women tend to have many friends online or social networks and spend more
time involved in telephone conversations. The average age of 17-30 year Instagram users is 159
respondents (43%) followed by age 31-40 years as many as 143 respondents (39%), this is in line
with a survey conducted by the Indonesian Internet Service Providers Association - APJII,
(2017), which results that the penetration of internet users in Indonesia is dominated by ages 19-
34 years old. Educational backgrounds using Instagram at the bachelor’s degree level were 192
respondents (52%) with occupation as students 143 respondents (39%), where 210 respondents
(57%) have used Instagram for approximately 1-3 years and have a tendency to read each post as
many as 297 respondents (81%).
Table 1. Respondent’s demographic for information adoption in Instagram
Frequency (n) Percentage
Gender Male 139 38%
Can Instagram Convince Information to Users?
Ilham
___________________________________________________________________________
______________________________________________________________________________
39
© 2019 (9th) International Conference of the AGMS Proceedings
Female 229 62%
Age 17-30 159 43%
31-40 143 39%
41-50 53 14%
51+ 13 4%
Education High School or lower 99 27%
Diploma 33 9%
Bachelor degree 192 52%
Post graduate degree 44 12%
Occupation Student 143 39%
Civil Servant 47 13%
Labor 126 34%
Professional 52 14%
How long to used instagram 1-3 years 210 57%
3-6 years 91 25%
More than six years 67 18%
Read comments on posts Yes 297 81%
No 71 19%
Technique Analysis
Developed conceptual model was drawn in SmartPLS software or simulation work in
assessing the effect of source credibility (expertness, trustworthy, attractiveness, homophily) and
information quality on information adoption through attitude toward information and information
usefulness. Partial least square simulation of the model is carried out by calculating and
assessing various parameters which include item loading, reliability, and validity tests.
Table 2. Validity and reliability analysis
Construct & item description Cross
Loading AVE
Cronbach's
alpha Result
Source Credibility 0.614 0.953 valid & reliabel
Expertness 0.884 0.938 valid & reliabel
EX1. I believe that popular accounts can provide me with useful
information 0.969
EX2. I believe the number of followers account represents
knowledge in evaluating the experience 0.897
EX3. I believe the longer a reviewer account has registered on a
review site 0.917
EX4. I rely on the comment which other readers believe useful 0.890
Trustworthiness 0.735 0.878 valid & reliabel

Can Instagram Convince Information to Users?
Ilham
___________________________________________________________________________
______________________________________________________________________________
40
© 2019 (9th) International Conference of the AGMS Proceedings
TR1. I believe the same situation mentioned by different reviewers
verifies the actual level 0.878
TR2.I believe the comments in the review represent the experience
of the reviewer 0.884
TR3. I believe reviewers will give honest reviews about their
experiences 0.916
TR4. I believe the length of the comments in the review shows the
level of effort of reviewers 0.740
Attractiveness 0.703 0.789 valid & reliabel
AT1. I believe emotions of reviewers affect the readers' perceptions
of information attractiveness 0.834
AT2. I believe the language used by reviewers influences readers'
perceptions of information interactions 0.845
AT3. I believe reviews written by site editors are more convincing
when accompanied by pictures and words 0.837
Homophily 0.570 0.749 valid & reliabel
HO1. I rely on the reviews written by people who are in my age
group 0.768
HO2. I rely on the reviews written by people who have my same
gender 0.760
HO3. I rely on the reviews written by people who have the same
interests as I have 0.731
HO4.I rely on reviews written by people who have equal education 0.761
Information Usefulness 0.662 0.746 valid & reliabel
IU1. I only follow an Instagram account that has useful information
for me 0.863
IU2. The information presented on Instagram is easy to understand 0.841
IU3. I just follow a useful Instagram account useful for me 0.731
Information Adoption 0.771 0.704 valid & reliabel
IA1. You always follow the advice of positive comments 0.900
IA2. You agree with the comments suggested by the reviewer
account 0.855
Information Quality 0.637 0.715 valid & reliabel
IQ1. Instagram provides complete information 0.694
IQ2. Instagram presents relevant information 0.857
IQ3. Instagram provides information that can be accurate and
reliable 0.833
Attitude Toward Information 0.559 0.779 valid & reliabel
ATI1. Instagram presents information that has the attraction force 0.809
ATI2. Instagram provides information content that has the force
appealing 0.619
ATI3. I don't feel bothered by the information on the Instagram
news feed 0.823
ATI4. Instagram is a dynamic social media application 0.816
ATI5. Instagram can be used with one hand 0.646
After determining the variables, the model process is carried out as shown in Figure 2
using smart pls. From the results of table 2 shows all cross loading values greater than 0.6 thus
Can Instagram Convince Information to Users?
Ilham
___________________________________________________________________________
______________________________________________________________________________
41
© 2019 (9th) International Conference of the AGMS Proceedings
all indicators are declared valid for measure each construct (David Garson, 2016). Convergent
validity internal consistency average variance extracted (AVE) greater than 0.50 (Chin, 1998;
Klarner, Sarstedt, Hoeck, & Ringle, 2013). In this research each construct is declared valid
because the average variance value of the source credibility extract is 0.61, expertness 0.88,
trustworthiness 0.73, attractiveness 0.70, homophily 0.50, information usefulness 0.66,
information adoption 0.77, information quality 0.63, and attitude towards information 0.55.
(David Garson, 2016; Hair, Sarstedt, Hopkins, & Kuppelwieser, 2014) explained that the
Cronbach's alpha value considered adequate for confirmatory purposes must be more than 0.7 to
check the reliability of factor analysis. The Cronbach’s alpha of source credibility 0.95,
expertness 0.93, trustworthiness 0.87, attractiveness 0.78, homophily 0.74, information
usefulness 0.74, information adoption 0.70, information quality 0.71, and attitude towards
information 0.77.
After unidimensionally testing for each latent variable by using Confirmatory Factor
Analysis, the next stage is to do Structural Equation Modeling (SEM) analysis with a complete
model. The next stage uses a variance-based SEM method called SEM-PLS.This method is
explorative assuming the assumptions in the SEM-PLS method are nonparametric, which does
not require many assumptions. (Monecke, A. and Leisch, 2012). The hypothesis raised in this
study is:
The measurement model of indicator significance in the construct can be measured
through the factor of loading, and comparing the values of t with t-table using the following
hypothesis:
H0: λi = 0 (loading factor is not significant in measuring latent variables)
H1: λi ≠ 0 (loading factor is significant in measuring latent variables)
The results of the SEM variance test or SEM-PLS are presented in Figure 3 as follows:

Can Instagram Convince Information to Users?
Ilham
___________________________________________________________________________
______________________________________________________________________________
42
© 2019 (9th) International Conference of the AGMS Proceedings
Figure 3. PLS Outer Model
After a Confirmatory Factor Analysis and an indicator can measure well the latent
variables, then the inner model analysis is performed. Inner model analysis is done to determine
the relationship between latent variables and to conclude the research hypothesis is accepted or
rejected. The test criteria for hypothesis testing are, if the t-statistics value> 1.96 with an alpha
assumption (5% error tolerance) then it can be concluded that the relationship between the two
latent variables is significant (accepted hypothesis) and vice versa. The results of the inner model
analysis for the latent variables are presented in the table as follows:
Table 3. PLS inner model
Causal paths Original
Sample (O)
Sample
Mean (M)
T Statistics
(|O/STDEV|)
P
Values Result
Attitude Toward -> Information Adaption 0.479 0.479 7.979 0.000 Significant
Information Quality -> Attitude Toward 0.416 0.405 5.134 0.000 Significant
Information Quality -> Informational Usefulness 0.309 0.306 3.574 0.000 Significant
Informational Usefulness -> Information Adaption 0.279 0.274 4.411 0.000 Significant
Source Credibility -> Attitude Toward 0.472 0.478 5.632 0.000 Significant
Source Credibility -> Informational Usefulness 0.421 0.421 4.940 0.000 Significant
Based on table 3, source credibility have a positive effects on attitude towards
information and information usefulness with values of 5.63 and 4.94, information quality have a
positive effects on the attitude towards information and information usefulness with values of

Can Instagram Convince Information to Users?
Ilham
___________________________________________________________________________
______________________________________________________________________________
43
© 2019 (9th) International Conference of the AGMS Proceedings
5.13 and 3.57, furthermore information adoption is affected by attitude towards information and
information usefulness with values 7.97 and 4.41 accordingly.
5. Discussion
This study aims to find factors in society in adopting information on social media,
especially Instagram so that the information can be trusted by Indonesian people, by analyze
eWOM source credibility to information usefulness, information quality and attitude towards
information that produces information adoption for Instagram users.
Source credibility can describe the positive influence of the message communicated to
the recipient (Ohanian, 1990; Thoumrungroje, 2014). The dimensions of eWOM's credibility,
such as expertise, trust, objectivity and homophily positively affect attitudes toward information
and information usefulness. It has been observed from previous research by Erkan & Evans,
(2016), Gunawan & Huarng,(2015) and Wixom & Todd, (2005) which show a positive
relationship between sources of credibility and attitudes towards information. The perception of
the usefulness information can be influenced by sources of credibility even though it is not
related to that information (Di & Luwen, 2012). The quality information consisting of relevance,
accuracy and completeness also has a positive relationship to attitude toward information and
information usefulness. The attitude of the recipient to the quality of information can influence
their attitude. When that information meets the needs and requirements that are useful to the user,
he is more likely to follow the recommendations during the decision making process (Di &
Luwen, 2012; Lee & Lee, 2009; Olshavsky, 1985). The attitude towards information has a
positive relationship to information adoption, in a previous study on ecommerce showed that
attitudes have a significant influence on information adoption (Ajzen & Fishbein, 2005; George,
2004; Liao et al., 2011). Information usefulness has a positive relationship to information
adoption, user perception of the usefulness of information is an important determinant of the
user's intention for information adoption (C. M. K. Cheung et al., 2008; Sussman & Siegal, 2003;
Zheng et al., 2009).
6. Conclusions, limitations and suggestions
Furthermore, this study provides recommendations for practitioners regarding increasing
sources of perceived credibility, quality of information and information usefulness of each
source of information to increase the number of users who are willing to use the source during
information retrieval. This research was conducted in Indonesia as a country with the most
population in Asia and a customary group with the surrounding countries, Indonesia can be a
reflection and reference in information adoption on Instagram.
Can Instagram Convince Information to Users?
Ilham
___________________________________________________________________________
______________________________________________________________________________
44
© 2019 (9th) International Conference of the AGMS Proceedings
Users are often hesitant in receiving information because there is a lot of trapping
information, such as the phrase "terms and conditions apply" which are written small in the
corner of the picture, therefore as much as possible to avoid this. Increase the number of
Instagram followers, always update the latest information and don't write too many promises but
can't keep up.
References
Acar, A. (2008). Antecedents and consequences of online social networking behavior: The case
of facebook. Journal of Website Promotion, 3(1–2), 62–83.
https://doi.org/10.1080/15533610802052654
Ajzen, I., & Fishbein, M. (2005). The Influence of Attitudes on Behavior. Journal of Social
Psychology, 44(1), 115–127. https://doi.org/10.1080/00224545.1956.9921907
APJII. (2017). Penetrasi & Perilaku Pengguna Internet Indonesia. teknopreneur (Vol. 2018).
Diambil dari https://web.kominfo.go.id/sites/default/files/Laporan Survei
APJII_2017_v1.3.pdf
Bailey, J. E., & Pearson, S. W. (1983). Development of a Tool for Measuring and Analyzing
Computer User Satisfaction. Management Science, 29(5), 530–545. Diambil dari
https://econpapers.repec.org/RePEc:inm:ormnsc:v:29:y:1983:i:5:p:530-545
Bilgihan, A. (2016). Gen y customer loyalty in online shopping: An integrated model of trust,
user experience and branding. Computers in Human Behavior, 61, 103–113.
https://doi.org/10.1016/j.chb.2016.03.014
Bressolles, G., Durrieu, F., & Senecal, S. (2014). A consumer typology based on e-service
quality and e-satisfaction. Journal of Retailing and Consumer Services, 21(6), 889–896.
https://doi.org/10.1016/j.jretconser.2014.07.004
Chaiken, S., & Eagly, A. H. (1976, Oktober 1). Communication modality as a determinant of
message persuasiveness and message comprehensibility . Journal of Personality and Social
Psychology . https://doi.org/10.1037/0022-3514.34.4.605
Cheung, C. M. K., Lee, M. K. O., & Rabjohn, N. (2008). The impact of electronic word-of-
mouth: The adoption of online opinions in online customer communities. Internet Research,
18(3), 229–247. https://doi.org/10.1108/10662240810883290

Can Instagram Convince Information to Users?
Ilham
___________________________________________________________________________
______________________________________________________________________________
45
© 2019 (9th) International Conference of the AGMS Proceedings
Cheung, C. M. K., & Thadani, D. R. (2010). The effectiveness of electronic Word-of-Mouth
communication: A literature analysis electronic. 23rd Bled eConference eTrust:
Implications for the Individual, Enterprises and Society, (February 2009), 329–345.
https://doi.org/10.1016/j.dss.2012.06.008
Cheung, C. M. K., & Thadani, D. R. (2012). The impact of electronic word-of-mouth
communication: A literature analysis and integrative model. Decision Support Systems,
54(1), 461–470. https://doi.org/10.1016/J.DSS.2012.06.008
Cheung, M. Y., Luo, C., Sia, C. L., & Chen, H. (2009). Credibility of Electronic Word-of-
Mouth: Informational and Normative Determinants of On-line Consumer
Recommendations. International Journal of Electronic Commerce, 13(4), 9–38.
https://doi.org/10.2753/JEC1086-4415130402
Chin, W. W. (1998). The partial least squares approach for structural equation modeling. In
Modern methods for business research. (hal. 295–336). Mahwah, NJ, US: Lawrence
Erlbaum Associates Publishers.
Daugherty, T., & Hoffman, E. (2014). eWOM and the importance of capturing consumer
attention within social media. Journal of Marketing Communications, 20(1–2), 82–102.
https://doi.org/10.1080/13527266.2013.797764
David Garson, G. (2016). Statistical Associates Blue Book Series. Statistical Associates
Publishing. Diambil dari www.statisticalassociates.com
Di, C., & Luwen, W. (2012). Factors affecting e-WOM adoption. Hong Kong Baptist University.
Diambil dari libproject.hkbu.edu.hk/trsimage/hp/09050515.pdf
Dou, T., Xiao, C., Shindell, D. T., Liu, J., Eleftheriadis, K., Ming, J., & Qin, D. (2012). The
distribution of snow black carbon observed in the Arctic and compared to the GISS-
PUCCINI model. Atmospheric Chemistry and Physics, 12(17), 7995–8007.
https://doi.org/10.5194/acp-12-7995-2012
Erdogan, B. Z. (2010). Celebrity Endorsement : A Literature Review Celebrity Endorsement : A
Literature Review. Journal of marketing Management, (772858957), 37–41.
https://doi.org/10.1362/026725799784870379
Erkan, I., & Evans, C. (2016). The influence of eWOM in social media on consumers’ purchase
intentions: An extended approach to information adoption. Computers in Human Behavior,
61, 47–55. https://doi.org/10.1016/j.chb.2016.03.003

Can Instagram Convince Information to Users?
Ilham
___________________________________________________________________________
______________________________________________________________________________
46
© 2019 (9th) International Conference of the AGMS Proceedings
Fanoberova, A., & Kuczkowska, H. (2016). Effects of source credibility and information quality
on attitudes and purchase intentions of apparel products, 1–121.
George, J. F. (2004). The theory of planned behavior and Internet purchasing. Internet Research,
14(3), 198–212. https://doi.org/10.1108/10662240410542634
Gunawan, D. D., & Huarng, K. H. (2015). Viral effects of social network and media on
consumers’ purchase intention. Journal of Business Research, 68(11), 2237–2241.
https://doi.org/10.1016/j.jbusres.2015.06.004
Hair, J. F., Sarstedt, M., Hopkins, L., & Kuppelwieser, V. G. (2014). Partial least squares
structural equation modeling (PLS-SEM): An emerging tool in business research. European
Business Review, 26(2), 106–121. https://doi.org/10.1108/EBR-10-2013-0128
Hansen, S. S., & Lee, J. K. (2013). What drives consumers to pass along marketer-generated
EWOM in social network games? social and game factors in play. Journal of Theoretical
and Applied Electronic Commerce Research, 8(1), 53–68. https://doi.org/10.4067/S0718-
18762013000100005
Hovland, C. I., Janis, I. L., & Kelley, H. H. (1953). Communication and persuasion;
psychological studies of opinion change. Communication and persuasion; psychological
studies of opinion change. New Haven, CT, US: Yale University Press.
Hovland, C. I., Janis, I. L., & Kelley, H. H. (1953). Communication and persuasion. New Haven,
CT, US: Yale University Press.
Hussain, S., Ahmed, W., Jafar, R. M. S., Rabnawaz, A., & Jianzhou, Y. (2017). eWOM source
credibility, perceived risk and food product customer’s information adoption. Computers in
Human Behavior, 66, 96–102. https://doi.org/10.1016/j.chb.2016.09.034
Ives, B., Olson, M. H., & Baroudi, J. J. (1983). The Measurement of User lnformation
Satisfaction. Communications of the ACM, 26, 785–793.
https://doi.org/10.1145/358413.358430
Joseph F. Hair, J., Ringle, C., & Sarstedt, M. (2011). PLS-sem: Indeed a silver bullet. The
Journal of Marketing Theory and Practice (Vol. 19). https://doi.org/10.2753/MTP1069-
6679190202
Kiecker, P., & Cowles, D. (2002). Interpersonal Communication and Personal Influence on the

Can Instagram Convince Information to Users?
Ilham
___________________________________________________________________________
______________________________________________________________________________
47
© 2019 (9th) International Conference of the AGMS Proceedings
Internet: A Framework for Examining Online Word-of-Mouth. Journal of Euromarketing,
11(2), 71–88. https://doi.org/10.1300/J037v11n02
Klarner, P., Sarstedt, M., Hoeck, M., & Ringle, C. M. (2013). Disentangling the effects of team
competences, team adaptability, and client communication on the performance of
management consulting teams. Long Range Planning, 46(3), 258–286.
https://doi.org/10.1016/j.lrp.2013.03.001
Lee, J., & Lee, J. N. (2009). Understanding the product information inference process in
electronic word-of-mouth: An objectivity-subjectivity dichotomy perspective. Information
and Management, 46(5), 302–311. https://doi.org/10.1016/j.im.2009.05.004
Liao, S. H., Chang, W. J., Wu, C. C., & Katrichis, J. M. (2011). A survey of market orientation
research (1995-2008). Industrial Marketing Management, 40(2), 301–310.
https://doi.org/10.1016/j.indmarman.2010.09.003
Liu, R., & Suh, A. (2017). Self-Branding on Social Media: An Analysis of Style Bloggers on
Instagram. Procedia Computer Science, 124, 12–20.
https://doi.org/10.1016/j.procs.2017.12.124
Maddux, J. E., & Rogers, R. W. (1980). Effects of source expertness, physical attractiveness, and
supporting arguments on persuasion: A case of brains over beauty. Journal of Personality
and Social Psychology, 39(2), 235–244. https://doi.org/10.1037/0022-3514.39.2.235
Markopoulos, P. M., & Kephart, J. O. (2002). How Valuable are Shopbots ? Proceedings of the
ACM Conference on Electronic Commerce, (February 2013), 4–11.
https://doi.org/10.1145/545056.545060
McCracken, G. (1989). Who Is the Celebrity Endorser? Cultural Foundations of the
Endorsement Process. Journal Of Consumer Research, 16(December), 310–321. Diambil
dari http://www.sciencedirect.com/science/article/pii/B9780125587020500170
McGinnies, E., & Ward, C. D. (1980). Better Liked than Right. Personality and Social
Psychology Bulletin, 6(3), 467–472. https://doi.org/10.1177/014616728063023
McGuire, W. J. (1985). Attitudes and attitude change. In W. D.Crano & R. Prislin (Ed.), The
handbook of social psychology (3 ed., Vol. 3, hal. 233–346). New York: Random House.
McKinney, V., Yoon, K., & Zahedi, F. (2002). The measurement of Web-customer satisfaction:
An expectation and disconfirmation approach. Information Systems Research, 13(3), 296–
315. https://doi.org/10.1287/isre.13.3.296.76

Can Instagram Convince Information to Users?
Ilham
___________________________________________________________________________
______________________________________________________________________________
48
© 2019 (9th) International Conference of the AGMS Proceedings
McLeod, R., & Schell, G. (2008). Management Information Systems, 10th Edition. Pearson
Education.
Mcpherson, M., Smith-lovin, L., & Cook, J. M. (2001). B IRDS OF A F EATHER : Homophily
in Social Networks. Annual Review of Sociology, 27, 415–444.
https://doi.org/10.1146/annurev.soc.27.1.415
Monecke, A. and Leisch, F. (2012). semPLS : Structural Equation Modeling Using Partial Least
Squares. Journal of Statistical Software, 48(3), 1–32. https://doi.org/10.1108/EBR-10-2013-
0128
Nisar, T. M., & Prabhakar, G. (2017). What factors determine e-satisfaction and consumer
spending in e-commerce retailing? Journal of Retailing and Consumer Services, 39(May),
135–144. https://doi.org/10.1016/j.jretconser.2017.07.010
Ohanian, R. (1990). Construction and Validation of a Scale to Measure Celebrity Endorsers’
Perceived Expertise, Trustworthiness, and Attractiveness. Journal of Advertising, 19(3), 39–
52. https://doi.org/10.1080/00913367.1990.10673191
Olshavsky, R. W. (1985). Towards a More Comprehensive Theory of Choice. Advances in
Consumer Research, 12, 465–470.
Pan, B., Litvin, S., & Goldsmith, R. E. (2008). Electronic Word-of-Mouth in Hospitality and
Tourism Management, (June). https://doi.org/10.1016/j.tourman.2007.05.011
Rakow, L. F. (1992). Gender on the line : women, the telephone, and community life. Illinois
studies in communications.
Roger-Monzó, V., Martí-Sánchez, M., & Guijarro-García, M. (2015). Using online consumer
loyalty to gain competitive advantage in travel agencies. Journal of Business Research,
68(7), 1638–1640. https://doi.org/10.1016/j.jbusres.2015.02.009
See-To, E. W. K., & Ho, K. K. W. (2014). Value co-creation and purchase intention in social
network sites: The role of electronic Word-of-Mouth and trust - A theoretical analysis.
Computers in Human Behavior, 31(1), 182–189. https://doi.org/10.1016/j.chb.2013.10.013
Sheldon, P. (2008). The Relationship Between Unwillingness-to-Communicate and Students’
Facebook Use. Journal of Media Psychology, 20(2), 67–75. https://doi.org/10.1027/1864-
1105.20.2.67

Can Instagram Convince Information to Users?
Ilham
___________________________________________________________________________
______________________________________________________________________________
49
© 2019 (9th) International Conference of the AGMS Proceedings
Sheldon, P., & Bryant, K. (2016). Instagram: Motives for its use and relationship to narcissism
and contextual age. Computers in Human Behavior, 58, 89–97.
https://doi.org/10.1016/j.chb.2015.12.059
Statista. (2018). Penetration of leading social networks in Indonesia as of 3rd quarter 2017.
Statista. Diambil dari https://www.statista.com/statistics/284437/indonesia-social-network-
penetration/
Sussman, S. W., & Siegal, W. S. (2003). Informational In uence in Organizations: An Integrated
Approach to Knowledge Adoption. Information Systems Research, 14(1), 47–65.
https://doi.org/10.1287/isre.14.1.47.14767
Szell, M., & Thurner, S. (2013). How women organize social networks different from men.
Scientific Reports, 3(i), 20–22. https://doi.org/10.1038/srep01214
Teng, S., Khong, K. W., & Goh, W. W. (2014). Conceptualizing Persuasive Messages Using
ELM in Social Media. Journal of Internet Commerce, 13(1), 65–87.
https://doi.org/10.1080/15332861.2014.910729
Teng, Z., Nie, Q., Guo, C., & Liu, Y. (2017). Violent video game exposure and moral
disengagement in early adolescence: The moderating effect of moral identity. Computers in
Human Behavior, 77, 54–62. https://doi.org/10.1016/j.chb.2017.08.031
Thoumrungroje, A. (2014). The Influence of Social Media Intensity and EWOM on Conspicuous
Consumption. Procedia - Social and Behavioral Sciences, 148(November 2012), 7–15.
https://doi.org/10.1016/j.sbspro.2014.07.009
Valarie A. Zeithaml, A. M. A. P. (2002). Service Quality DeliveryThrough Web Sites: A Critical
Review of Extant Knowledge. Journal of the Academy of Marketing Science, 30(4), 362.
https://doi.org/https://doi.org/10.1177/009207002236911
Wan, N., Jadhav, V., Khanna, M., Pettersson, J., Kersmark, M., Staflund, L., … Broekhuizen, T.
(2015). The Conceptualization of Electronic Word-of-Mouth ( EWOM ) and Company
Practices to Monitor , Encourage , and Commit to EWOM - a Service Industry Perspective.
Exjobb, 14(1), 256. https://doi.org/10.1057/palgrave.jt.5740193
Wixom, B. H., & Todd, P. A. (2005). A theoretical integration of user satisfaction and
technology acceptance. Information Systems Research, 16(1), 85–102.
https://doi.org/10.1287/isre.1050.0042

Can Instagram Convince Information to Users?
Ilham
___________________________________________________________________________
______________________________________________________________________________
50
© 2019 (9th) International Conference of the AGMS Proceedings
Zhao, X. (Roy), Wang, L., Guo, X., & Law, R. (2015). The influence of online reviews to online
hotel booking intentions. International Journal of Contemporary Hospitality Management,
27(6), 1343–1364. https://doi.org/10.1108/IJCHM-12-2013-0542
Zheng, T., Youn, H., & Kincaid, C. S. (2009). An analysis of customers’ E-complaints for luxury
resort properties. Journal of Hospitality and Leisure Marketing, 18(7), 718–729.
https://doi.org/10.1080/19368620903170240

Complexity Concepts in Market Dynamics; the Evolution of Market Alliances
Koplyay, Motaghi, and Hurta
___________________________________________________________________________
______________________________________________________________________________
51
© 2019 (9th) International Conference of the AGMS Proceedings
Complexity Concepts in Market Dynamics; the Evolution of Market Alliances
Tamas Michel Koplyay,Ph.D.
Hamed Motaghi, Ph.D. (Corresponding Author)
Hilda Hurta, Ph.D.
Abstract
Market alliances accompany firms during the evolution of the lifecycle and undergo serious
structural transformations from early market ecosystems to late stage value chains. This happens
in an orderly fashion that facilitates the adaptation of the firms to market conditions and
witnesses a migration of complexity from the alliances into the firms. In a sense complexity
migrates from the market into the firm and its immediate neighborhood, such as the value chain.
At some point the firm strategic independence is subsumed by its parent coalition. Along the way
many interesting concepts of complexity arise such as symmetry, random signal-based
adaptation, loose and tight environmental fit, risk mitigation and ability to fend off shock
loading.
This article will examine the principal complexity issues related to this process of market
evolution and significant reasons behind the adaptation logic that correlates with this process.
Key words: Complexity, Market Dynamics, Market Alliances, Structural Transformation

Complexity Concepts in Market Dynamics; the Evolution of Market Alliances
Koplyay, Motaghi, and Hurta
___________________________________________________________________________
______________________________________________________________________________
52
© 2019 (9th) International Conference of the AGMS Proceedings
Introduction
The market appears to function at two distinct levels, the deep and the surface structures,
where the deep structure is defined by the succeeding customer profiles, creates a certain
dynamic of its own (Dobni, C. B., & Luffman, G. (2003)).
Above the deep structure unfolds the surface structure that has a series of crisis points for
the firms, where these are swallowed up progressively at a higher rate into grey holes of deeper
colors and more irreversible nature until the whole market disappears in to black hole which
marks the end of the market.
At the beginning is the white hole that spews firms into the attractive market. This
attractiveness is tied to the high promise of market size, growth, customer price inelasticity and
relative absence of competitors, sort of a blue ocean, although entry rate due to low market
barriers is significant and finally fills the market positions available (Greve 1988).
The lifecycle, the surface structure, follows the deep structure and creates both market
competitive weather and the combines with the deep structure to create the crisis shakeout points
in the market (Klepper, S., & Graddy, E. (1990)).
The succession of crisis points in captured by exhibit 1.
There are two climate zones associated with the lifecycle, an early phase effectiveness
zone where firms try to find their position commensurate with their abilities and the pressures
exercised by competing firms and later the efficiency zone where a position is already acquired

Complexity Concepts in Market Dynamics; the Evolution of Market Alliances
Koplyay, Motaghi, and Hurta
___________________________________________________________________________
______________________________________________________________________________
53
© 2019 (9th) International Conference of the AGMS Proceedings
and firm gets ready to deliver against the inexorable advent of a cost leadership strategy now
given by the market (Cui, Gao, Wang,& Xue (2015)).
Effectiveness zone is associated with marketing positioning whereas efficiency zone is
shaping the productivity capabilities of the firm. A productivity emphasis that is the hallmark of
mature markets.
In effectiveness climate zone the premium is on firm recognition of market possibilities,
nobleness of moves and light baggage to carry around.
This is also the market phase where young firms develop and integrate their functions
starting with product development, marketing and rudimentary supply chain and distribution
channel activities. Later finance, human resources and eventually MIS/IT join into the integrative
process
Therefore, the effectiveness zone is a period of functional development and coordination.
It is a period of integrating the firm’s capabilities into a cohesive whole.
All of this is forged within by the entrepreneurial structural shape of the firm headed by
the critical controller, the outward looking entrepreneur (Simsek, Lubatkin, & Floyd (2003)).
In late stages of the market where the efficiency climate prevails, we see heavier firm
structures, more deliberate moves, if any, and a singular focus on execution of strategy as
opposed to selection thereof.
Furthermore, integration yields to differentiation that creates higher efficiencies for the
firm but also contributes to silo effects among the function s that needs to be countered by better
coordination devices that create more internal structural complexity for the firm (Koplyay, T., Li,
L., & Rochefort, P. (2010)
However, curiously as firm structural development takes place symmetry is preserved
and further enhanced, thereby mitigating some of the effects of internal complexity increases and
pushing the firm towards higher levels of order.
The net effect is a decrease in alliance structure complexity and a corresponding increase
in net structural complexity of firms at the maturity phase of markets (Koplyay, T., & Mitchell,
B. (2014).
The alliance structures evolve from highly complex ecosystems types to simple linear
value chain forms at the end (Pitelis, C. (2012)).

Complexity Concepts in Market Dynamics; the Evolution of Market Alliances
Koplyay, Motaghi, and Hurta
___________________________________________________________________________
______________________________________________________________________________
54
© 2019 (9th) International Conference of the AGMS Proceedings
Ecosystems are ideal for survival, absorption of shocks and replacement of damaged
nodes and offer a good measure of resiliency, whereas value chains respond ideally to demands
of efficiency and productivity signaled by the cost leadership strategy of late markets.
The drawback of value chains is the fact that every component becomes critical, the
structure needs to be actively managed and there’s no recovery from major shocks resiliency is
gone and is replaced by robustness.
It no longer can avid shocks by displacement but rather faces the turbulence with robust
and redundant defenses.
Ecosystems on the other hand, lacking central control, are unpredictable, inefficient and
fragile (Costanza, R., Low, B., Ostrom, E., & Wilson, J. (2000)).
They adapt to shocks by repositioning in the market thereby causing an expenditure of
reserve resources of its constituent members. The future is now.
Exhibit 2 captures the deep structure of the market based on the successive customer
bases.
BowlingAlley
Tornado Tombstone
Shakeout
Mainstreet
Technology Enthusiasts
Visionaries Pragmatists Conservatives Skeptics
Market Dynamics and Customer Base
Chasm
Early market
Of significant interest is a second evolutionary trait of the market that affects firms.
The firms start out in a pure competition environment of the effectiveness zone.
All their moves are dependent on their own awareness of market conditions, but as the
market progresses more and more coordination seeps in to replace the independent early
behavior.
In act a serious coordinative shock is delivered at the platform stage, where firms
coalesce into groups to set standards that is required as a quality assurance to the deep customer

Complexity Concepts in Market Dynamics; the Evolution of Market Alliances
Koplyay, Motaghi, and Hurta
___________________________________________________________________________
______________________________________________________________________________
55
© 2019 (9th) International Conference of the AGMS Proceedings
base, now at the pragmatist stage, and also acts as a defensive measure against further intrusive
innovation by requiring compatibility with the platform standards for all competing firms.
By the time the market reaches the value chain stage, almost all actions of firms are
coordinative.
So, there is a progression form a standalone type competitive stance to one of a collective
effort.
In fact, the value chain comes about just as cost leadership imposes its will on the market
and the linear shape of the chain facilitates the delivery of productivity. The market evolves from
singular competition to collective one as illustrated by the single entrepreneurial firm and later
by the coordinatively constrained value chain.
Exhibit 3 traces the evolution of the market from effectiveness to efficiency climate
zones.
Supply and distribution channels are the most efficient when the structure is linear and
minimal transition times occur between component firms upstream and downstream (Kim, Y.,
Choi, T. Y., Yan, T., & Dooley, K. (2011)).
This quasi linearization happens throughout eh market cycle.
Firms seek out outsourcing, insourcing, offshoring and in shoring to simplify their
resources and product flows upstream and downstream (Kotabe, M., Mol, M. J., & Murray, J. Y.
(2009)).

Complexity Concepts in Market Dynamics; the Evolution of Market Alliances
Koplyay, Motaghi, and Hurta
___________________________________________________________________________
______________________________________________________________________________
56
© 2019 (9th) International Conference of the AGMS Proceedings
UPS has now transformed into a major supplier of insourcing where it enters client
premises and performs all the coordinative tasks of resources acquis ion and product distribution
for medium and small firms that could not afford theses streamlining functions on their own.
UPS in fact provides the economies of scale to these firms (Leamer, E. E. (2007)).
Walmart of course proceeds on its own to develop the most highly integrated global
resources management systems conceivable (Jensen, M. C. (1993)).
Although the chain has a huge disadvantage of having all of its component critical in the
sense that any suppression of a chain component results in failure of the system. However, the
shock loads on the chain are infrequent and defenses can be built to guarantee a reasonable
survival chance under perceived loadings.
This however is not foolproof as Toyota discovered when the transportation links to its
Japan factories were destroyed by a major earthquake.
We can trace the simultaneous development of firm alliances in the market from
ecosystems to value chains and note the remarkable transformation of nonlinear, complex and
resilient structural forms of ecosystems evolve into rigid, efficient, vulnerable and linear forms
of the value chain.
This evolutionary process seems to be imposed by the deep structure, whereas the firm
evolution is dictated by the surface structure (Koplyay, T., Lloyd, D. M., Sanchez, L., & Paquin,
J. P. (2012)).
Exhibit 4 summarizes the structural shapes that accompany firms in their voyage along
the lifecycle

Complexity Concepts in Market Dynamics; the Evolution of Market Alliances
Koplyay, Motaghi, and Hurta
___________________________________________________________________________
______________________________________________________________________________
57
© 2019 (9th) International Conference of the AGMS Proceedings
A related phenomenon, defined by both the deep and surface structures, is the
progression of strategies along the lifecycle (McAdam, M., & McAdam, R. (2008)).
From an open and wide funnel representing the many market position choices of early
markets to the narrowing down of choices to a single one in market maturity. the strategy
funnel is created by an interplay between the deep and surface structures Koplyay, T. M., Lloyd,
D., Jazouli, A., & Farkas, M. F. (2016)).
From the many options available to the firm in early markets to executing at the
acquired final market position in maturity the firms learn how to change their respective
behaviors, structures and critical functions depending on where they are on the curve.
Exhibit 5 shows the continuing whittling down of strategies available as the market
matures.
These are excellent reasons for this curtailed choices as the market evolves.
First of all, there appears to be an anticipatory foresight among all firms to build market
share at any stage of the market.
In fact, the early rush to share and market strength even trumps the eventual need to
produce a profit, the firms know that share price corelates with top line growth and hence
everything is done to buttress revenues, and yet this is not essential to immediate survival but
becomes a factor in late markets. This type of thinking is amply evident in Shopify, where top
line growth is the corporate priority.
So the firms instinctively reach for market share and often dominant market share as
captured by market strength which allows building of brands, a very useful and relatively
inexpensive tool to hold market position ,as it cost a lot more to attack a brand than to defend it.
Complexity Concepts in Market Dynamics; the Evolution of Market Alliances
Koplyay, Motaghi, and Hurta
___________________________________________________________________________
______________________________________________________________________________
58
© 2019 (9th) International Conference of the AGMS Proceedings
The accumulated market share eventually translates into economies of scale and allows
for the implementation of the final strategy, cost leadership (Hitt, M. A., Keats, B. W., &
DeMarie, S. M. (1998)).
The idea to retain here is that the evolution of the firms and their respective adaptive
behaviors anticipate the eventual end game of the market (Lo, A. W. (2004)).
There appears to be a market teleology acting on singular and collective behaviors of
firms and their alliances.
It is almost as if the market had a life of its own and through feedback mechanisms it
guides constituent firms and their alliances to a final resting place, which is known by the time
the market comes into existence.
We can comment on a phase of the market, the M&A phase, that helps fulfil final market
destiny. As the market matures it becomes n more obvious that market share will rule eventually.
Firms try organic growth, but as the market gets depleted of new customers it becomes more
difficult to gain share (Hurta, H., Jazouli, A., Koplyay, T., & Motaghi, H. (2017).
For two reasons, one is the customer acquisition costs go up and retention costs come
down. It’s cheaper to hold on to a customer than to recruit a new one. Second is that share
acquisition becomes zero sum game, the market is not growing anymore and a firms share gain
becomes another firm’s loss. Hence if you can’t beat them you buy them and series of M&A is
unleashed to consolidate the market and often produce an oligopoly, or in the presence of very
strong economies of scale a monopoly, something that government regulators try to prevent,
although often for the wrong reasons.
A further characteristic of market evolution that is worth commenting is the type of
stability available to firms depending on location. In early markets bot the firm and its ecosystem
can relocate under market forces, say competitive pressures or collapse of a customer base, or
even intrusion of an adjacent market. This nomadic ability defines a seeking out of zone stability,
the ability to fine a new competitive position within the developing market.
Later when the first crisis point the chasm is crossed and the blowing alley strategy
developed firm and its alliance become more circumspect and stability can be found only in
limited spaces, the standards platforms to which firms can converge.
There may be several of these standards first but eventually they will decay to one
dominant or maybe two platforms, and then the platforms themselves disintegrate into prototype

Complexity Concepts in Market Dynamics; the Evolution of Market Alliances
Koplyay, Motaghi, and Hurta
___________________________________________________________________________
______________________________________________________________________________
59
© 2019 (9th) International Conference of the AGMS Proceedings
value chains, called clusters that are essentially linear at the core and ecosystem format at the
supplier and distribution channel ends.
The application software providers would fall into the category of suppliers at this stage.
An example being the Sony Beta or a Toshiba VHS platforms, but in the long run this morphed
into one market standard, Toshiba VHS in this case.
By the time the final market phase of maturity arrives, the stability is of a point form, no
chance to move the asset base constraining, the risk avoiding culture and accumulated knowhow
is too heavy to relocate. Just ask GE about its recent experience with software development. The
stability zones in a literal sense define the scope of maneuvering possible for a firm in the
market, and scope decreases until only one option is left in maturity
Exhibit 6 shows the zones of different stability against the market lifecycle.
The small picture; local co-evolution based on complexity
There appears to be a common focus-based evolution of firms and their alliances driving
both towards an unavoidable state of cost leadership where choice of strategy is left behind, and
the execution of the market given strategy prevails. (Koplyay, T., Sanchez, L., & Levy-Mangin,
J. P. (2012)).
Whether the driving force behind this co-evolution is the market or the adaptive behavior
of firms, or both, is immaterial to the final outcome, although of real importance to our
understanding of both market and constituent entities transformations.
Complexity Concepts in Market Dynamics; the Evolution of Market Alliances
Koplyay, Motaghi, and Hurta
___________________________________________________________________________
______________________________________________________________________________
60
© 2019 (9th) International Conference of the AGMS Proceedings
The fact remains firms and their alliances change in an orderly and predictable fashion,
drawn like moths to the flame of final market attractor, markets share based productivity
anchored competition.
If there is a link between the firm’s behavior and the shape of their alliances it should
surface from the study of emergence in the market due to complexity (Koplyay, T. M., Lloyd,
D., Jazouli, A., & Farkas, M. F. (2016)). We shall examine two instances in the market there this
type of evolution does take place. One has to do with the platform and the other with the
emergence of the value chain. For meaningful mergence to occur complexity theory tells us that
we should find phase transition, complexity on the edge of chaos leading to self-organization at
the firm level that eventually produces strong emergence of an alliance that will in turn influence
the lower level conduct of the firms. And in fact, on at least two occasions this happens in
markets.
The first one is the standards platform. After crossing the chasm, the first grey hole in
market where firms are lost, the surviving firms concentrate on building a niche market around a
bowling alley strategy, whereby the firm choses a central customer and starts seeing a complete
product to this customer in the pragmatic segment, and eventually to all other firms in the
customer’s ecosystem.
This vertical marketing where you proceed from the first bowling pin to the next, and in
cautious steps build a whole bowling alley of connected customers, and this contuse until the
market growth takes off where you abandon the vertical marketing for a horizontal one. No more
local customization but ride the tiger through high growth period. So we find two phase
transitions at the same time; One of change for vertical to horizontal marketing And one of study
market growth to high growth. So, the market behavior changes drastically inviting and
evolutionary move from the firm but for such behavior or appear we must have nonlinearity on
the edge of chaos.
Indeed, we just left the highly stable and ordered state of the bowling alley and down-
market looms the chaos, the shakeout. We are on the edge of chaos
The market in of increasing structural complexity, measured by the nonlinearity of
relationships among the firms and their alliances (Koplyay, T., & Mitchell, B. (2014)) with
strong nonlinearities bounding this complexity.
On one side is order and on the other chaos, ripe for some meaningful evolutionary
transition

Complexity Concepts in Market Dynamics; the Evolution of Market Alliances
Koplyay, Motaghi, and Hurta
___________________________________________________________________________
______________________________________________________________________________
61
© 2019 (9th) International Conference of the AGMS Proceedings
And as the firms organize, they give rise to the emergent standards platforms that offers a
way to survive the shakeout by embarking in the life boat of the standards platform, that will
carry them to the other shore of the shakeout
There is emergence and this emergence signals to noncommitted firms the possibility of
survival through various feedback mechanisms such as superior customer commitments to the
platform and equally sustainable growth rates. Hence the emergence is strong
Similarly at the end of the market right after firms transit the M&A phase ,there is strong
stability and order of the oligopoly ,but the execution of the productivity phase still awaits and
for this to occur the supply and distribution relations need to be literally ironed out into linear
shapes (Hurta, H., Jazouli, A., Koplyay, T., & Motaghi, H. (2017)).
Downstream from the M&A lurks the market exit, the final gaping black hole that
swallows all firms, and that point represents chaos. So, we have the stability of the M&A phase,
the edge of chaos of the market exit and in between the nonlinearity of the combined firm and
alliance structures.
By this phase the firms are cooperating seriously with chosen partners and almost value
chain type behavior is evident in the clusters, the end of which need to be ironed out to attain the
value chain. A period on high nonlinearity occurs between the ordered sate and the chaotic exit
that allows for organization the firm level to produce an emerging entity the value chain, which
is markedly different from the firms composing it and endowed with properties that could not be
derived from firm characteristics. Some of these properties are smoothing and tightening of chain
relationships by a dominate member of the chain that henceforth sets chain strategies. The firms
need are submerged into the chain. Although as the chain gains tremendous efficiencies it loses
survival attributes.
It suddenly has, a series of critical nodes, the individual firms, which renders ii equally
exposed to market perturbations at all nodes. Hence it builds redundancy at all nodes of the
linear network, which results in overall robustness. Again, this emergence is occasioned by a
prevailing complexity at the firm level in a period of phase tension between order and chaos
The phase transition is twofold; Transition from mass customization found in oligopolies
and a transition from moderate growth pre and past M&A to zero growth of late markets. Both
marketing and growth conditions change. In anticipation of this event the M&A was unleased to
find market share in a now static market, that faces the calculations of zero-sum market share
changes. Therefore, the competition must shift from further acquisition of share to execution of
productivity at fixed point of interaction with the market

Complexity Concepts in Market Dynamics; the Evolution of Market Alliances
Koplyay, Motaghi, and Hurta
___________________________________________________________________________
______________________________________________________________________________
62
© 2019 (9th) International Conference of the AGMS Proceedings
Conclusions
Market appears to anticipate its own evolutionary profile and exerts forces and creates
adaptive mechanisms for firms and their alliances to proceed I the right direction at the right time
toward a final state where choice is stripped from the firms and a given strategy imposed which
requires a management perspective change from well positioned firms to well managed firms.
From external management emphasis to internal focus. But the market provides the means of
transition at various phases and firms that profit from this opportunity continue to evolve and
arrive well equipped at the final state. The market goes through a series of critical events from
the chasm in early phase to shakeout in mid stage to partial market collapse at M&A and finally
at extinction in market exit. All of them are market exit grey holes for the firms, some go under
some survive. Before each exit point the market allows for preparation by the firms to confront
the crisis and this means is the complex adaptive transitions that lead to emergence of lifeboats
that help navigating the treacherous waters of the grey holes.
Whether it’s the, the platform, the collapse due to M&A or the value chain the transition
prior to these events seems to be based on self-organized based emergence that is initially weak
but later becomes strong by exerting feedback on all firms and draws them to the attractor that
these alliances represent for the firms.

Complexity Concepts in Market Dynamics; the Evolution of Market Alliances
Koplyay, Motaghi, and Hurta
___________________________________________________________________________
______________________________________________________________________________
63
© 2019 (9th) International Conference of the AGMS Proceedings
Selected References
Cui, B., Gao, D. C., Wang, S., & Xue, X. (2015). Effectiveness and life-cycle cost-benefit
analysis of active cold storages for building demand management for smart grid
applications. Applied energy, 147, 523-535.
Costanza, R., Low, B., Ostrom, E., & Wilson, J. (2000). Institutions, ecosystems, and
sustainability. CRC Press.
Dobni, C. B., & Luffman, G. (2003). Determining the scope and impact of market orientation
profiles on strategy implementation and performance. Strategic management
journal, 24(6), 577-585.
Greve, H. R. (1998). Managerial cognition and the mimetic adoption of market positions: What
you see is what you do. Strategic management journal, 967-988.
Hitt, M. A., Keats, B. W., & DeMarie, S. M. (1998). Navigating in the new competitive
landscape: Building strategic flexibility and competitive advantage in the 21st century. The
academy of management executive, 12(4), 22-42.
Hurta, H., Jazouli, A., Koplyay, T., & Motaghi, H. (2017). Mergers and acquisitions from the
perspective of project management. Polish Journal of Management Studies, 15.
Jensen, M. C. (1993). The modern industrial revolution, exit, and the failure of internal control
systems. the Journal of Finance, 48(3), 831-880.
Klepper, S., & Graddy, E. (1990). The evolution of new industries and the determinants of
market structure. The RAND Journal of Economics, 27-44.
Kim, Y., Choi, T. Y., Yan, T., & Dooley, K. (2011). Structural investigation of supply networks:
A social network analysis approach. Journal of Operations Management, 29(3), 194-211.
Kotabe, M., Mol, M. J., & Murray, J. Y. (2009). Global sourcing strategy. The SAGE handbook
of international marketing, 288-302.
Koplyay, T., Li, L., & Rochefort, P. (2010, October). Hi-tech innovation strategies and the
market lifecycle. In Proceedings, American Society of Engineering Management Conference,
Fayetteville, Arkansas.

Complexity Concepts in Market Dynamics; the Evolution of Market Alliances
Koplyay, Motaghi, and Hurta
___________________________________________________________________________
______________________________________________________________________________
64
© 2019 (9th) International Conference of the AGMS Proceedings
Koplyay, T., Lloyd, D. M., Sanchez, L., & Paquin, J. P. (2012, January). Strategy making in hi-
tech markets-the" clock-speed" paradigm. In IIE Annual Conference. Proceedings (p. 1).
Institute of Industrial and Systems Engineers (IISE).
Koplyay, T., Sanchez, L., & Levy-Mangin, J. P. (2012). Evolution of the Marketing Function
under Market and Organizational Constraints.
Koplyay, T. M., Lloyd, D., Jazouli, A., & Farkas, M. F. (2016). THE DYNAMICS OF
ALLIANCES FORMATION IN HIGH-TECH MARKETS; FROM ECOSYSTEMS TO
VALUE CHAINS.
Koplyay, T., & Mitchell, B. (2014, June). The Evolution of Complexity Within Firms.
In Institute of Industrial Engineers, Proceedings of IEE Conference, Montreal, QC.
Koplyay, T. M., Lloyd, D., Jazouli, A., & Farkas, M. F. (2016). DYNAMICS OF MARKETS:
LOCATING A FIRM ON THE LIFECYCLE IN FAST MOVING MARKETS.
Leamer, E. E. (2007). A flat world, a level playing field, a small world after all, or none of the
above? A review of Thomas L Friedman's The World is Flat. Journal of Economic
Literature, 45(1), 83-126.
Lo, A. W. (2004). The adaptive markets hypothesis: Market efficiency from an evolutionary
perspective.
McAdam, M., & McAdam, R. (2008). High tech start-ups in University Science Park incubators:
The relationship between the start-up's lifecycle progression and use of the incubator's
resources. Technovation, 28(5), 277-290.
Pitelis, C. (2012). Clusters, entrepreneurial ecosystem co-creation, and appropriability: a
conceptual framework. Industrial and Corporate Change, 21(6), 1359-1388.
Simsek, Z., Lubatkin, M. H., & Floyd, S. W. (2003). Inter-firm networks and entrepreneurial
behavior: A structural embeddedness perspective. Journal of Management, 29(3), 427-
442.

BASEL II Implementation on Financial Performance. Banking in ASEAN.
Shonhadii
___________________________________________________________________________
______________________________________________________________________________
65
© 2019 (9th) International Conference of the AGMS Proceedings
BASEL III implementation on financial performance. Banking in ASEAN.
Nanang Shonhadji
STIE Perbanas Surabaya, Nginden Semolo 34-36,
Surabaya, Indonesia
+62 5947151
Abstract
The economic and monetary crisis, a regulation was issued by the Basel Committee on Banking
Supervision (BCBS), which in 2008 was marked by the bankruptcy of Lehman Brothers which
discussed the world financial crisis into the submission of world financial assistance from the
Basel Accord I and Basel II which discussed no able to overcome the crisis. Basel III is related to
capital and liquidity which will take effect in 2019. In Basel III provisions, evaluation of
liquidity management uses two approaches, namely Net Stable Funding Ratio (NSFR) and
Liquidity Coverage Ratio (LCR). This research aims to determine NSFR, LCR, and COF
simultaneously have a significant positive effect on ROA in banking sector companies in
ASEAN. The sample used in this study are banks in six countries in ASEAN. The data used is
secondary data, sample collection technique is purposive sampling and multiple linear regression
analysis using the F test and t test. Using the study period from 2014 to 2018. The result from
this study is that the NSFR and COF have significant effect on ROA simultaneously in banking
sector companies in ASEAN. On the other hand, LCR have unsignificant effect on ROA in
banking sector companies in ASEAN. Signal theory shows how companies give signals to users
of financial statements. The signal itself is an action taken by management aimed at the
stakeholders to show the company's capabilities expressed in the annual report. By showing good
performance, it will give a good signal to investors to invest their capital. Some variables have
different result in each country in ASEAN. The results of hypothesis testing indicate the
existence of several weak independent variable influences. This indicates that there are still other
factors beyond research that can affect the dependent variable. Research implication was
increasing the ability of the banking sector to absorb the potential risk of losses due to the
financial and economic crisis, and to prevent the financial sector crisis from spreading to the
economic sector in ASEAN countries
Key words: Financial Performance, Net Stable Funding Ratio and Liquidity Coverage Ratio and
Cost of Fund

BASEL II Implementation on Financial Performance. Banking in ASEAN.
Shonhadii
___________________________________________________________________________
______________________________________________________________________________
66
© 2019 (9th) International Conference of the AGMS Proceedings
1. INTRODUCTION
The commercial bank functions as a financial intermediary or collects funds from the
community and distributes them back to the community for the purpose. Special banks as trust
agents or trust-based institutions, development agents or institutions that mobilize funds for the
country's economic development, and service agents or institutions that provide services to the
public (Monang and Inggrita, 2013). However, the growth of the current economic and monetary
crisis, which provides considerable growth for the people and economic growth.
Based on the economic and monetary crisis, a regulation was issued by the Basel
Committee on Banking Supervision (BCBS), which in 2008 was marked by the bankruptcy of
Lehman Brothers which discussed the world financial crisis into the submission of world
financial assistance from the Basel Accord I and Basel II which discussed no able to overcome
the crisis. The bankruptcy of Lehman Brothers shows weak management policies and
government protection, improper incentive structures and excessive banking industry influence.
Because this prompted BCBS to issue a global financial reform package, better known as Basel
III, which was a continuation of the three pillars in Basel II with additional requirements,
including requiring banks to have a minimum general equity and general liquidity ratio.
The regulation is made so that banks are ready to face risks and can improve their
performance. When bank management succeeds in improving performance in banking
institutions, the success will have implications for increasing the profitability of the banking
industry. Therefore, profitability (ROA) can be used as a valid measure in measuring banking
performance in decision making. ROA is a comparison between pre-tax profit and total assets
held. The greater the value of ROA, the better the performance of the banking company because
the return the company gets is getting bigger (Didik and Bambang, 2013).
Basel III is related to capital and liquidity which will take effect in 2019. In Basel III
provisions, evaluation of liquidity management uses two approaches, namely Net Stable Funding
Ratio (NSFR) and Liquidity Coverage Ratio (LCR). In brief, NSFR is a control of long-term
liquidity flows, while LCR is a control of short-term cash flows. In addition, NSFR and LCR
require banks to increase high-quality liquid assets and obtain stable funding sources and ensure
that they are in accordance with the principles of liquidity risk management.
The first approach is the Net Stable Funding Ratio (NSFR) in Basel III intended to
promote medium and long-term funding of assets and activities of banking organizations. Thus,
NSFR tends to reduce exposure to liquidity risk funding. While the second approach is Liquidity
Coverage Ratio (LCR) which was introduced to improve the ability of banks to overcome short-
term liquidity needs and liquidity market risks. The LCR effect on bank profitability will exceed

BASEL II Implementation on Financial Performance. Banking in ASEAN.
Shonhadii
___________________________________________________________________________
______________________________________________________________________________
67
© 2019 (9th) International Conference of the AGMS Proceedings
the level of net outflows so banks tend to be more careful in investing (Giordana and
Schumacher, 2017).
This study also uses additional variables, namely Cost of Fund (COF), a ratio used to
measure the proportion of own capital compared to external funds in financing banking business
activities. Cost of Fund (COF) is the interest rate that must be paid by a financial institution for
the funds they get (Alfin et al. 2015). Based on research conducted by several previous
researchers, it can be concluded that there are several differences of opinion between several
studies. The purpose of this study is to find out the implementation of Basel III on banking
financial performance in ASEAN.
2. THEORETICAL FRAMEWORK
Signaling Theory
Signal theory is an action taken by a company to provide guidance to investors about how
management views the company's prospects (Brigham and Houston, 2011: 186). According to
Jogiyano (2014) this signal is in the form of information about what has been done by
management to realize the wishes of the owner. Information issued by the company is important
because it has an influence on decision making by parties outside the company. This information
is important for investors and business people because it presents information, notes, or an
overview of both past, present and future conditions for the survival of the company and the
effects on the company. When information is announced, market participants first interpret and
analyze the information as a good news or bad signal. If the announcement of the information is
considered a good signal, the investor will be interested in trading shares, thus the market will
react which is reflected through changes in the volume of stock trading. However, if the
information is a bad signal, investors will become less interested in the company (Suwardjono,
2010).
The relationship between signal theory and financial performance (ROA) is that it can
provide information both inside and outside the company, and can attract investors to invest
because of an increase in profits. If the profit reported by the company increases, the information
can be categorized as a good signal because it indicates a good condition of the company.
Conversely, if reported earnings decline, the company is in a bad condition so that it is
considered a bad signal.
Effect of Net Stable Funding Ratio to Return on Assets
Net Stable Funding Ratio is a comparison ratio of stable funding available or Available
Stable Funding with Required Stable Funding. Available Stable Funding (ASF) is a stable
amount of liabilities and equity for one year to fund bank activities. Whereas what is meant by

BASEL II Implementation on Financial Performance. Banking in ASEAN.
Shonhadii
___________________________________________________________________________
______________________________________________________________________________
68
© 2019 (9th) International Conference of the AGMS Proceedings
Required Stable Funding (RSF) is the number of assets and administrative account transactions
that need to be funded by stable funding. NSFR is included as long-term funding, namely
funding used to meet the needs of companies whose returns are in the long term and the benefits
can be felt in the old times as well. The NSFR value that must be fulfilled by the bank is at least
100% (Financial Services Authority, 2017). The reason management needs long-term funding is
because of the large amount of funds needed for company investment or retained earnings of
companies that do not exist or meet funding needs.
Long-term funding also affects the profits of a company because it is used for investment
or meeting company needs. The higher the long-term funding owned by the bank, the more
companies have investments so that the profits obtained are greater because banks use long-term
funding to obtain longer benefits. This signal theory shows the signal given by management that
is published in financial statements aims to provide information that can make investors
interested in investing in banks. With a high NSFR value, it can be said that the condition of the
bank is getting better because the bank has a long-term investment that can get bigger profits.
According to previous research conducted by Said (2018), the NSFR has an effect on
ROA. But the research conducted by Giordana and Schumacher (2017) and Asraf, et al. (2016)
shows that NSFR does not affect ROA. The hypotheses formulated for this study are as follows:
H1: Net Stable Funding Ratio (NSFR) has an effect on Return On Assets (ROA).
Effect of Liquidity Coverage Ratio to Return on Assets
Banking liquidity is defined as the ability of banks to fulfill their main obligations in the
form of public deposits and other liquid liabilities. One indicator of banking liquidity monitoring
is Liquidity Coverage Ratio, where banks have sufficient stock of High Quality Liquid Assets
(HQLA) consisting of cash or assets. These assets must be converted into cash with little or no at
all which does not result in losing value in the market to meet the liquidity needs of 30 days.
LCR can affect the profits of a bank. If LCR is high, it means that the bank has a stock of
HQLA containing high cash or assets, the banking profit is also high, and vice versa. Because if
LCR is high, the bank has the ability to fulfill its main obligations and other liquid obligations
based on high profits. Signal theory shows that the signal provided by management which is
published in financial statements has the purpose of providing information that can make
investors interested in investing in banks. With a high LCR value, it can be said that the bank's
condition is getting better.
According to previous research conducted by Bruna and Blahova (2016) shows that LCR
affects ROA. However, research conducted by Giordana and Schumacher (2017) shows that
LCR has no effect on ROA. The hypotheses formulated for this study are as follows:

BASEL II Implementation on Financial Performance. Banking in ASEAN.
Shonhadii
___________________________________________________________________________
______________________________________________________________________________
69
© 2019 (9th) International Conference of the AGMS Proceedings
H2: Liquidity Coverage Ratio (LCR) affects Return On Assets (ROA).
Effect of Cost of Fund to Return on Assets
Cost of Fund (COF) is the total interest incurred by the bank to obtain deposit funds in
the form of deposits, savings and time deposits. The total cost of funds depends on how much
interest is set to obtain the desired funds. The greater the interest charged on deposit interest, the
higher the cost of funds as well as vice versa. This total interest cost will affect the bank's profit
because the main bank income is derived from the difference between interest on deposits and
interest on loans (Maryam, 2016). Signal theory that shows signals given by management that
are published in financial statements with the aim of providing information that can make
investors interested in investing in banks. With a large COF value, it can be said that the capital
owned by a large bank is also.
According to previous research conducted by Maryam (2016), it was shown that COF
had an effect on ROA, so the hypothesis for this study was:
H3: Cost of Fund (COF) has an effect on Return On Assets (ROA).
The Research Framework as follows:
3. RESEARCH METHODS
Population and Samples
The population in this study were banking companies in ASEAN for the 2014-2018
period with a total of 130 companies consisting of 16 Philippine banks, 22 Malaysian banks, 44
Indonesian banks, 31 Cambodian banks, 6 Singapore banks, and 11 Thai banks. The sampling
technique is done by using a purposive sampling method with the criteria of banking companies
in ASEAN in 2014-2018 listing on the Stock Exchange. Banking companies in ASEAN that
publish audited financial statements include reports on changes in equity, income statements,
financial position reports, cash flow reports and notes to financial statements that are consistent
Net Stable Funding Ratio (X1)
Liquidity Coverage Ratio (X2)
Cost Of Fund (X3)
Return on Assets (Y)

BASEL II Implementation on Financial Performance. Banking in ASEAN.
Shonhadii
___________________________________________________________________________
______________________________________________________________________________
70
© 2019 (9th) International Conference of the AGMS Proceedings
in 2014-2018, and banking companies in ASEAN that provide data related to the variables in this
study were ROA, NSFR, LCR, and COF.
Research variable
The research variables used in this study include the dependent variable namely return on
assets and the independent variable consisting of the net stable funding ratio, liquidity coverage
ratio, and cost of fund.
Operational Definition of Variables
Return On Assets (ROA)
Return on Assets (ROA) is one indicator of profitability from financial performance that
is used to measure the ability of bank management to obtain profits or profits as a whole. ROA is
a comparison between pre-tax earnings and the average total assets in a period. This ratio can be
used as a measure of financial health. This ratio is very important and is related to the
performance of the bank because it can be used to see the level of business efficiency of a bank
from the profits obtained by using its assets.
𝐑𝐎𝐀 = Earning Before Income Tax
Total Asset
Net Stable Funding Ratio (NSFR)
The net stable funding ratio (NSFR) is the ratio of available Stable Funding (ASF) to
banks that require stable funding (Required Stable Funding).
NSFR = Available Stable Funding (ASF)
Required Stable Funding (RSF)
Liquidity Coverage Ratio (LCR)
Liquidity Coverage Ratio (LCR) is the ratio of liquid assets to estimated cash outflows
under stressful conditions. This standard requires that the ratio is never below 100 percent and
banks are expected to meet these requirements continuously to ensure the bank's resilience to
adverse shocks. Therefore, LCR is used to emphasize that banks hold high quality liquid assets
that are sufficient to meet short-term liquidity needs for at least 30 days.
𝐋𝐂𝐑 =High Quality Liquid Asset
Net Cash Outflows
Cost Of Fund (COF)
BASEL II Implementation on Financial Performance. Banking in ASEAN.
Shonhadii
___________________________________________________________________________
______________________________________________________________________________
71
© 2019 (9th) International Conference of the AGMS Proceedings
Cost of Fund is the total interest expense incurred by the bank to obtain deposit funds in
the form of deposits, savings and time deposits. This ratio describes the total costs that must be
incurred by the bank for each fund that it collects in various sources before it is reduced by
mandatory liquidity.
𝐂𝐎𝐅 = Interest Expense
Third Parties Fund× 100
Analysis Technique
The analysis technique used in this study is multiple linear regression, because this study
supports the relationship between independent variables and the dependent variable. In addition,
this analysis can prove the relationship between the independent variable and the dependent
variable. The following are the research regression model equations:
ROA = α+β1X1+β2X2+β3X3+ɛ
ROA = Return on Assets
X1 = Net Stable Funding
Ratio (NSFR)
X2 = Liquidity Coverage
Ratio (LCR)
X3 = Cost Of Fund (COF)
β1, β2, β3 = Koefisien Regresi
ε = error
4. RESULTS AND DISCUSSION
Descriptive Analysis
Descriptive statistical analysis provides a description or description of one data seen from the
mean, standard deviation, maximum value, and minimum value (Ghozali, 2013). This analysis is
used to obtain a description or description of a data seen from the mean, standard deviation,
maximum value, and minimum value for each variable in this study, namely ROA, NSFR, LCR,
and COF.

BASEL II Implementation on Financial Performance. Banking in ASEAN.
Shonhadii
___________________________________________________________________________
______________________________________________________________________________
72
© 2019 (9th) International Conference of the AGMS Proceedings
Table 1
Descriptive Analysis
N Minimum Maximum Mean Std. Deviation
Statistic Statistic Statistic Statistic Statistic
ROA 575 -.0032 .0356 .01341 .00812
NSFR 575 .0052 .91041 .62042 .13152
LCR 575 -5318.4 4310.84 1.88031 501.251
COF 575 .0021 8.11467 .15512 .5274
Valid N
(listwise) 575
Source: Output SPSS, 2019
Return On Assets (ROA)
Return on Assets (ROA) based on table 1 above shows that the sample value in this study
amounted to 546 banks. The minimum value of ROA is -0.0032 owned by India International
Bank Malaysia Berhad. in 2016 which means that the value of profit before tax is negative and
the total value of assets is positive so that the results of ROA are negative, from these results
indicate that the bank's profit before tax suffers a loss, this indicates that the bank is less efficient
in generating profits. The maximum value of ROA of 0.0356 is owned by ACLEDA Bank PLC,
Cambodia in 2015. This shows that ACLEDA Bank PLC, Cambodia is able to optimize its assets
to generate profits.
The mean or mean value of the ROA variable is 0.01341. While the standard deviation is
0.00812. Based on the results of the mean and standard deviation indicate that the mean value is
greater than the standard deviation, for the ROA variable the spread of the data can be said to be
good and the data is homogeneous.
Net Stable Funding Ratio (NSFR)
Table 1 above shows that the minimum NSFR value is 0.0052 which is owned by Krung
Thai Bank PLC, Phnom Penh Branch, Cambodia in 2016, this indicates that the ASF value is
lower than the RSF value. While the maximum value of NSFR is 0.9104 owned by Rizal
Commercial Banking Corporation, Philippines in 2014 and 2015. This shows that Rizal
Commercial Banking Corporation, Philippines in 2014 and 2015 had sufficient stable funding.
The mean or mean value of the NSFR variable is equal to 0.62042. While the standard deviation
is 0.13152. Based on the results of the mean and standard deviation indicate that the mean value
is greater than the standard deviation, for the NSFR variable the spread of the data can be said to
be good and the data is homogeneous.
Liquidity Coverage Ratio (LCR)
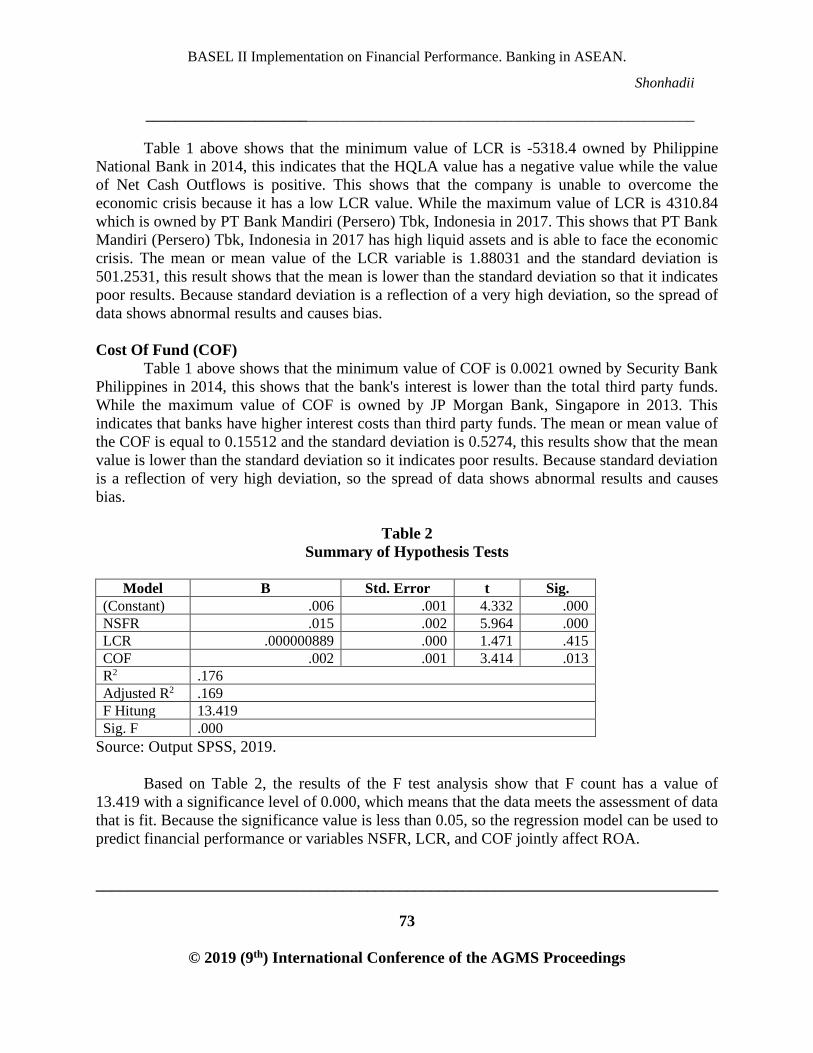
BASEL II Implementation on Financial Performance. Banking in ASEAN.
Shonhadii
___________________________________________________________________________
______________________________________________________________________________
73
© 2019 (9th) International Conference of the AGMS Proceedings
Table 1 above shows that the minimum value of LCR is -5318.4 owned by Philippine
National Bank in 2014, this indicates that the HQLA value has a negative value while the value
of Net Cash Outflows is positive. This shows that the company is unable to overcome the
economic crisis because it has a low LCR value. While the maximum value of LCR is 4310.84
which is owned by PT Bank Mandiri (Persero) Tbk, Indonesia in 2017. This shows that PT Bank
Mandiri (Persero) Tbk, Indonesia in 2017 has high liquid assets and is able to face the economic
crisis. The mean or mean value of the LCR variable is 1.88031 and the standard deviation is
501.2531, this result shows that the mean is lower than the standard deviation so that it indicates
poor results. Because standard deviation is a reflection of a very high deviation, so the spread of
data shows abnormal results and causes bias.
Cost Of Fund (COF)
Table 1 above shows that the minimum value of COF is 0.0021 owned by Security Bank
Philippines in 2014, this shows that the bank's interest is lower than the total third party funds.
While the maximum value of COF is owned by JP Morgan Bank, Singapore in 2013. This
indicates that banks have higher interest costs than third party funds. The mean or mean value of
the COF is equal to 0.15512 and the standard deviation is 0.5274, this results show that the mean
value is lower than the standard deviation so it indicates poor results. Because standard deviation
is a reflection of very high deviation, so the spread of data shows abnormal results and causes
bias.
Table 2
Summary of Hypothesis Tests
Model B Std. Error t Sig.
(Constant) .006 .001 4.332 .000
NSFR .015 .002 5.964 .000
LCR .000000889 .000 1.471 .415
COF .002 .001 3.414 .013
R2 .176
Adjusted R2 .169
F Hitung 13.419
Sig. F .000
Source: Output SPSS, 2019.
Based on Table 2, the results of the F test analysis show that F count has a value of
13.419 with a significance level of 0.000, which means that the data meets the assessment of data
that is fit. Because the significance value is less than 0.05, so the regression model can be used to
predict financial performance or variables NSFR, LCR, and COF jointly affect ROA.

BASEL II Implementation on Financial Performance. Banking in ASEAN.
Shonhadii
___________________________________________________________________________
______________________________________________________________________________
74
© 2019 (9th) International Conference of the AGMS Proceedings
Based on Table 2 which shows the results of the coefficient of determination test of all
variables obtained an adjusted R square value of 0.169 which means that NSFR, LCR, and COF
are only able to explain variations in ROA of 16.9%. While the rest is explained by other factors
outside of research. The t test aims to determine the effect of independent variables individually
on the dependent variable. The results of this test indicate that LCR and CAR have no significant
effect on ROA, while NSFR and COF have a significant effect on ROA. The following is a
discussion of each variable:
Effect of Net Stable Funding Ratio on Return On Assets
The first hypothesis states that the net stable funding ratio affects the return on assets. Net
stable funding ratio (NSFR) is defined as the ratio of available Stable Funding to banks that
require stable funding (Required Stable Funding). Requirements from the Net Stable Funding
Ratio (NSFR) are introduced where banks are required to maintain sufficient liquid funds.
According to the executive summary issued by the Bank for International Settlements (2018),
stable funding is defined as the type and amount of equity and financing obligations that are
expected to be a reliable source of funds for a period of one year under stressful conditions. This
standard also requires the value of the ASF ratio to exceed RSF to ensure that banks have
sufficiently stable funding in accordance with their medium and long-term loans during the
period evaluated.
Based on hypothesis testing (t test) shows that the results have 0,000 (sig <0.05), which
means that NSFR has an effect on ROA. NSFR has an effect on ROA, meaning that banks can
maintain stable funds that are adjusted to the composition of assets and bank account
administrative activities and are able to face economic crises so that they can show good
performance because the greater the NSFR ratio, the greater the bank's ability to obtain stable
funding. According to the theory used in this study, signal theory shows how companies give
signals to users of financial statements. The signal itself is an action taken by management aimed
at the stakeholders to show the company's capabilities expressed in the annual report. By
showing good performance, it will give a good signal to investors to invest their capital. Vice
versa, if the company shows poor performance, then the signal given to investors is also bad.
Therefore, this test shows that a high NSFR ratio that can show a good signal is because the
NSFR ratio has an effect on financial performance (ROA) so that banks can obtain stable
funding from third parties to get the expected benefits. The results of this study are consistent
with the research conducted by Said (2018) which shows that NSFR has an effect on ROA. But
this result is different from the research conducted by Giordana and Schumacher (2017) and
Asraf, et al. (2016) which shows that NSFR does not affect ROA.
Effect of Liquidity Coverage Ratio to Return On Assets
The second hypothesis states that the influential liquidity coverage ratio is aware of
return on assets. Liquidity Coverage Ratio (LCR) is the ratio of liquid assets to estimated cash
BASEL II Implementation on Financial Performance. Banking in ASEAN.
Shonhadii
___________________________________________________________________________
______________________________________________________________________________
75
© 2019 (9th) International Conference of the AGMS Proceedings
outflows under stressful conditions. This standard requires that the ratio value is never below
100% and banks are expected to meet these requirements continuously. The aim is to ensure the
bank's resilience to adverse shocks. Therefore, LCR is used to emphasize that banks hold high
quality liquid assets that are sufficient to meet short-term liquidity needs for at least 30 days
(Said, 2018). In searching for LCR values, using the calculation of High Quality Liquid Assets
(HQLA) divided by Net Cash Outflows where HQLA is cash or assets that can be converted into
cash quickly through sales or can be used as collateral. While net cash outflows are cash
outflows minus cash inflows where outflows consist of deposits from individual customers,
micro and small businesses, funding from corporate customers, collateral funding, other cash
outflows and cash inflows consisting of loans with collateral, bills from the opposite party, and
other cash inflows.
Based on hypothesis testing (t test) shows that this test has a yield of 0.415 (sig> 0.05)
which means that LCR does not affect ROA. LCR does not affect ROA, meaning that the bank is
not able to overcome the economic crisis because the bank is unable to fulfill its obligations on
time so that liquidity cannot be fulfilled and does not benefit because of poor financial
performance. According to the theory used in this study, signal theory shows how companies
give signals to users of financial statements. The signal itself is an action taken by management
aimed at the stakeholders to show the company's capabilities expressed in the annual report. By
showing good performance, it will give a good signal to investors to invest their capital. Vice
versa, if the company shows poor performance, then the signal given to investors is also bad.
This theory describes managers or companies having advantages over information compared to
outside parties and they use certain sizes and facilities to give up the quality of the company.
The results of this study are consistent with research conducted by Giordana and
Schumacher (2017) showing that LCR has no effect on ROA. However, this result is different
from the research conducted by Bruna and Blahova (2016) indicating that LCR affects ROA.
Effect of Cost of Fund on Return On Assets
The fourth hypothesis states that the cost of fund has an effect on the return on assets.
Cost of Fund is the total interest expense incurred by the bank to obtain deposit funds in the form
of deposits, savings and time deposits. The total cost of these funds must be reduced by a
mandatory reserve or Reserve Requirement (RR), while the Cost of Loanable Fund (COLF) is
the cost of funds that must be issued by mandatory liquidity (Maryam, 2016). There are three
methods in calculating the cost of funds according to Maryam (2016), namely the method of
weighted average cost of funds, historical average cost of funds methods, and the method of
marginal funding costs. The method of weighted average cost of funds is an approach that first
pays attention to each source of funds which is indicated by the size of the composition of funds
and other factors that affect the amount of funding costs such as reserverequirement. Then the
method of historical average cost of funds is the method that is considered the easiest because the

BASEL II Implementation on Financial Performance. Banking in ASEAN.
Shonhadii
___________________________________________________________________________
______________________________________________________________________________
76
© 2019 (9th) International Conference of the AGMS Proceedings
bank only sums up the cost of raising funds divided by the total funds raised. However, when
faced with changing interest rates, this method is not applicable because the costs calculated in
this method are past costs. And finally, the marginal cost method is a method that is often used to
make decisions at that time relating to the need for funds or credit to meet prime customers. The
relationship of the COF ratio to financial performance (ROA) is the greater the COF value, the
greater the ROA that is owned because the bank gets funds for bank activities. While the smaller
the COF value, the smaller the ROA owned by the bank is because the bank is less in obtaining
funds used for activities.
Based on hypothesis testing (t test) shows that this test has a result of 0.013 (sig <0.05)
which means COF has an effect on ROA. COF has an effect on ROA, meaning that the bank
obtains funds from third parties used for bank operations. According to the theory used in this
study, signal theory shows how companies give signals to users of financial statements. It can be
said that the high COF ratio shows a good signal because COF has an effect on ROA where
banks have good capital to issue savings funds for the community. The results of this study are
consistent with the research conducted by Maryam (2016) showing that COF has an effect on
ROA. Whereas, the results of research different from the research conducted by Ida and Badera
(2015) indicate that COF does not affect ROA.
5. CONCLUSIONS, LIMITATIONS AND RECOMMENDATIONS
Based on data analysis and hypothesis testing that has been done, conclusions can be
drawn as follows: (1) The ratio of NSFR and COF together has a significant effect on financial
performance (ROA) in the banking sector in ASEAN. Thus the hypothesis which states that
NSFR and COF affect ROA for banks in ASEAN is accepted. (2) The simultaneous NSFR ratio
has a significant positive effect on bank ROA in ASEAN. Thus the hypothesis which states that
Net Stable Fundig Ratio has an effect on Return On Assets is accepted. (3) COF ratio
simultaneously has a significant positive effect on bank ROA in ASEAN. Thus the hypothesis
which states that Cost of Fund has an effect on Return On Assets is accepted. (4) LCR ratio does
not affect bank ROA in ASEAN. This shows that LCR and COF have no effect on ROA because
there are phenomena that occur in bank financial statements in ASEAN.
This study has limitations that can affect the results of the study. The limitations of this
study are: (1) Some annual reports are followed by not using international language (English)
which causes researchers to not be able to read financial statements so that elimination is carried
out. (2) There are several companies in the banking sector whose financial statements cannot be
accessed through a stock exchange but financial statements can be accessed through the web of
each banking sector company. (3) This research has outliers to get data that is normally
distributed, so that the data tested is only a few and the results are not maximal. (4) The results of

BASEL II Implementation on Financial Performance. Banking in ASEAN.
Shonhadii
___________________________________________________________________________
______________________________________________________________________________
77
© 2019 (9th) International Conference of the AGMS Proceedings
hypothesis testing indicate the existence of several weak independent variable influences. This
indicates that there are still other factors beyond research that can affect the dependent variable.
Based on the conclusions and limitations that have been revealed previously, this research is far
from perfection. For this reason, researchers provide suggestions that can be used for further
research in order to obtain maximum results. Suggestions from this study are: (1) For the next
researcher, it should focus on annual reports that use international or other foreign languages
according to the ability of the researcher. (2) Researchers can use the same topic with more
variables and extend the research period. (3) The banking sector should provide easy access in
accessing annual reports.

BASEL II Implementation on Financial Performance. Banking in ASEAN.
Shonhadii
___________________________________________________________________________
______________________________________________________________________________
78
© 2019 (9th) International Conference of the AGMS Proceedings
REFERENCES
Alfin, A., Hermanto, S., & Heni, H. (2015). Factors Affecting Banking Cost Efficiency in the
ASEAN-5 Region. Journal of Technology Management, 14 (3).
Bank for International Settlements. (2018, June 28). Financial Stability Institute. Picked October
27, 2018, from FSI Connect: https://www.bis.org/fsi/fsisummaries/nsfr.pdf
Brigham, E., & Houston, J. (2011). Fundamentals of Financial Management Translation (10th
ed.). Jakarta: Salemba Empat.
Bruna, K., & Blahova, N. (2016). Systemic Liquidity Shocks and Banking Sector Liquidity
Characteristics on Eve of Liquidity Coverage Ratio Application - The Case of the Czech
Republic. Journal of Banking Theory and Practice, 159-184.
Didik, P., & Bambang, S. (2013, March). Factors Affecting Bank Performance (Empirical Study
on the Banking Industry in the Indonesia Stock Exchange). Journal of Business and
Economics (JBE), 20, 25-39.
Ghozali, I. (2013). Application of Multivariate Analysis with IBM SPSS 21 (ed. 07). Semarang:
Diponegoro University Publishing Agency.
Giordana, G. A., & Schumacher, I. (2017). An Empirical Study on the Impact of Basel III
Standards on Banks Default Risk: The Case of Luxembourg. Journal of Risk and
Financial Management, 10.
Ida, A. E., & Badera, I. N. (2015). Effect of the Amount of Credit, Savings, Deposits and
Supervisory Agency Experience on Profitability. Accounting E-Journal of Udayana
University, 11.
Indonesian Bankers Association. (2015). Risk Management 2. Jakarta: Main Gramedia Library.
_________________________. (2016). Risk Management Governance. Jakarta: Main Gramedia
Library.
Jogiyanto, H. (2014). Portfolio Theory and Investment Analysis (10 ed.). Yogyakarta: BPFE
Yogyakarta.
Cashmere. (2014). Financial Statement Analysis (1 ed.). Jakarta: PT Raja Grafindo Persada.

BASEL II Implementation on Financial Performance. Banking in ASEAN.
Shonhadii
___________________________________________________________________________
______________________________________________________________________________
79
© 2019 (9th) International Conference of the AGMS Proceedings
Khaerul, U. (2013). Sharia Banking Management. Bandung: Pustaka Setia Library.
Maryam (2016). Effect of Cost of Funds and Problematic Loans on Profitability in Banking
Listed on the Indonesia Stock Exchange in 2010-2012. Journal of Economic Management
and Accounting, 2.
Monang, R. T., & Inggrita, G. N. (2013, February). Analysis of Factors Affecting Customer
Decisions to Save at BCA Bank Medan City (Case Study of Chinese Ethnics). Journal of
Economics and Finance, 1.
Financial Fervices Authority. (2017). Picked October 8, 2018, from
https://www.ojk.go.id/en/kanal/perbankan/implementasi-basel/Pages/Road-map.aspx
Said, R. M. (2018). Basel III New Liquidity Framework and Malaysian Commercial Banks
Profitablity. S2 Management Journal.
Solikha, O. K., & Zubaidah, N. (2016, November). Analysis of Factors Affecting Banking
Financial Performance in Indonesia. Journal of Islamic Banking, I.
Suwardjono. (2013). Accounting Theory, Financial Reporting Engineering. Yogyakarta: BPFE.

Financial Behaviour, E-Trading Satisfaction, E-Trust, and E-Loyalty of E-Trading in Indonesian Stock
Exchange with SEM-PLS
Armansyah
___________________________________________________________________________
______________________________________________________________________________
80
© 2019 (9th) International Conference of the AGMS Proceedings
Financial Behaviour, E-Trading Satisfaction, E-Trust, and E-Loyalty of E-Trading in
Indonesian Stock Exchange with SEM-PLS
Rohmad Fuad Armansyah
STIE Perbanas Surabaya-Indonesia
Nginden Semolo 34-36, Surabaya-Indonesia
Abstract
The growth of technology today has caused many entrepreneurs and companies to change their
perspective in conducting business and influencing user behaviour, especially financial behaviour.
The online trading system allows traders to enter orders directly into the system via electronic media
immediately and direct, and this condition will affect the level of customer satisfaction while
increasing customer loyalty. Technological developments in this sector quickly changed the dynamics
and process of transactions. Customers can choose to meet their broker or call the office from home
for a deal. This method is considered to be the most recent in its time, but by telephone, it can become
inefficient due to potential errors in communication, restrictions on customer authentication, the
density of telephone lines in peak trading sessions and costs incurred. The online trading system
allows traders to enter orders directly into the system through electronic media such as laptops,
personal computers, and cellular phones with internet network support. The online trading system
does not necessarily make everything go well. Some obstacles and complaints arose from users, began
to have difficulty accessing, features that were less expected, to systems that did not respond when
peak transactions. Conditions like this will affect the level of customer satisfaction, and as an effort to
increase the level of customer satisfaction, the trading system will be perfected regularly for the
convenience of traders. The purpose of this study aims to examine financial behaviour in terms of
satisfaction, trust and loyalty in the use of e-trading in the Indonesian stock exchange. The data are
collected through electronic questionnaires of the Indonesia Stock Exchange investors which are
processed using outer model and inner model by SEM-PLS (Structural Equation Modeling-Partial
Least Square) approach. The results show that the variable financial behaviour, electronic trust (e-
trust), satisfaction of electronic commerce (e-trading satisfaction) have an effect on the creation of
electronic loyalty (e-loyalty) of e-trading users on the Indonesia Stock Exchange.
Keywords: financial behaviour, e-trading, e-loyalty, e-trust, SEM-PLS.

Financial Behaviour, E-Trading Satisfaction, E-Trust, and E-Loyalty of E-Trading in Indonesian Stock
Exchange with SEM-PLS
Armansyah
___________________________________________________________________________
______________________________________________________________________________
81
© 2019 (9th) International Conference of the AGMS Proceedings
Introduction
Today's rapid technological development has caused many entrepreneurs and companies to
change their perspective in doing business. The growth of companies that are lagging in using
technology is lagging in many aspects such as efficiency, connectivity, market expansion, and so on.
The internet has drastically changed the way companies do their business including the financial
industry and capital markets. Technological developments in this sector quickly changed the dynamics
and process of transactions. Customers can choose to meet their broker or call the office from home
for a deal. This method is considered to be the most recent in its time, but by telephone, it can become
inefficient due to potential errors in communication, restrictions on customer authentication, the
density of telephone lines in peak trading sessions and costs incurred.
The online trading system allows traders to enter orders directly into the system through
electronic media such as laptops, personal computers, and cellular phones with internet network
support. The online trading system does not necessarily make everything go well. Some obstacles and
complaints arose from users, began to have difficulty accessing, features that were less expected, to
systems that did not respond when peak transactions. Conditions like this will affect the level of
customer satisfaction, and as an effort to increase the level of customer satisfaction, the trading system
will be perfected regularly for the convenience of traders. Online relationship quality, which is
relationship satisfaction and relationship trust, plays an essential role in strengthening e-loyalty in the
quality of website design (Tsai, 2017). Trust in electronic media or e-trust is believed to increase
online customer loyalty so online merchants must expand their shipping area options and types of
products, so that not only can attract new customers, but also maintain real customer satisfaction, trust
and loyalty (Radionova-Girsa & Lahiža, 2017). Conditions like this will affect the level of customer
satisfaction and as an effort to increase the level of customer satisfaction, the trading system will be
perfected regularly for the convenience of traders. Evaluation of the application of an online trading
system have the aims to improve company performance in an effort to keep the company competitive
against its competitors. This evaluation is needed so that gaps in the system can always be overcome.
This gap will be able to have an impact on the company's image. One negative effect is that poor
system performance can spread and produce a negative image on the company. Furthermore, this
negative image can affect the trust of clients and clients can switch to their competitors thereby
reducing company profits. If the user is not satisfied with the software used, they will look for ways
that the system will no longer be used. In e-commerce, loyal customers are considered very important.
Customer loyalty is generally associated with satisfaction with service quality. Because of online
transactions, trust is a condition for exchange and satisfaction plays an important role in business
continuity.
Belief in electronic media or e-trust is believed to increase online customer loyalty so that
online merchants must expand their shipping area options and product types so that they can not only

Financial Behaviour, E-Trading Satisfaction, E-Trust, and E-Loyalty of E-Trading in Indonesian Stock
Exchange with SEM-PLS
Armansyah
___________________________________________________________________________
______________________________________________________________________________
82
© 2019 (9th) International Conference of the AGMS Proceedings
attract new customers, but also maintain existing customer satisfaction, trust and loyalty. The study of
trust, commitment and satisfaction of banking services conducted by Kingshott, Sharma, & Chung
(2018) using data from 336 small and medium business customers in the New Zealand banking
industry found that the quality of offline and online services affected satisfaction with their e-banking
services, which ultimately affects customers' trust and commitment to the service. The level of
satisfaction and loyalty using e-commerce media also differs between gender, age, and motivation in
its use (Fang, Shao, & Wen, 2016). Research related to loyalty, trust, and satisfaction in using
information technology and e-commerce media are still developing in various aspects, both from the
demographic elements and from the aspects of the industry and human behaviour in finance. Research
from Nisar & Prabhakar (2017) found that there is a direct relationship between e-service quality, e-
satisfaction and e-loyalty in terms of online shopping. However, an analysis shows that e-commerce
still faces challenges compared to offline traders because customers cannot feel and try products, and
may eventually choose products they don't want. This condition allows for further study of behaviour,
especially financial behaviour.
The development of research that focuses on financial behaviour is still developing and
interesting to study. Research on financial behaviour is still little done, mainly related to the
satisfaction of electronic media users in decision making. Based on the description above, this
research is expected to provide additional knowledge and knowledge on behavioural economics so
that investors get further insight into the behaviour that might exist in the Indonesian capital market.
Literature Review
Financial Behaviour
Economic behavior is often a problem in the market. Good behavior tends to make the
market stable or lead to growth. Unlike the case with behavior that is classified as deviant in the
perspective of decision making. The process of decision making by investors in the market
involves a variety of thoughts and underlying factors. These thoughts and factors are sometimes
beyond reason. Different thinking can lead to behavioral anomalies in decision making.
Information plays an important role in decision making because of the information received this
is the cause of diverse investor thinking. Information that receive will determine the outcome of
the investment. Investors seek to find information relating to investment opportunities so that
they will create investors who are sufficiently informed and uninformed.
Financial Behaviour appears in line with the development of the world of business and
technology that involves aspects of behaviour in the process of making financial and investment
decisions. Business actors are human beings who have reason and intuition in decision making
so that it involves a little more behaviour in it. Behavioural finance is a science that studies how

Financial Behaviour, E-Trading Satisfaction, E-Trust, and E-Loyalty of E-Trading in Indonesian Stock
Exchange with SEM-PLS
Armansyah
___________________________________________________________________________
______________________________________________________________________________
83
© 2019 (9th) International Conference of the AGMS Proceedings
humans uncover and react to information obtained to make decisions that can optimise the rate
of return by paying attention to the risks in it (Lintner, 1998).
Behavioural finance is a scientific discipline in which interdisciplinary interactions are
intertwined and continue to integrate so that the discussion cannot be isolated (Ricciardi &
Simon, 2000). It can be concluded that financial behaviour is the study of how humans take
action in making decisions in investing in response to information obtained. Investors do not
always behave rationally and do not deviate and can be modelled quantitatively.
E-Trading Satisfaction
According to Hansemark & Albinsson (2004), e-satisfaction is the fulfilment of
requirements, goals or desires reflected in the overall attitude of customers towards online
merchants, or emotional interaction by respecting what customers expect online with what they
get. Also, global policymakers must be sure that customer satisfaction is the primary key to the
health of national economic performance (Chen, Martin, & Merchant, 2014). Customer
satisfaction is closely related to interpersonal trust (Geyskens, Steenkamp, Scheer, & Kumar,
1996) and is considered an antecedent of trust (Christodoulides & Michaelidou, 2011). The
positive effects of satisfaction on trust can be expected in the online environment too, although
empirical research in this domain is scarce. The positive impact of customer satisfaction on trust
in service providers has been shown for the book industry (Pavlou, 2018). In analogy with these
findings, the experience of satisfying customers with specific e-tailers is expected to increase
their willingness to do more online purchases of e-tailers, as well as their trust in online media
(Hadi Teymoori, maeyam godarzi, & Hameh ghaebi, 2016) based on trust. Satisfaction with
specific applications of the system will increase trust in the system as a whole (Nisar &
Prabhakar, 2017).
E-Trust
Trust is considered another important part of loyalty (Reichheld & Schefter, 2000). The
concept of trust has been studied in various disciplines, and different definitions have been
proposed (Lewicki, McAllister, & Bies, 1998). Trust is consistently related to the vulnerability
of trustees (Bigley & Pearce, 1998; Singh & Sirdeshmukh, 2000) because, without the
vulnerability of the trustee to the given trust, trust becomes irrelevant. In business studies, trust
is essential for building and maintaining long-term relationships (Geyskens et al., 1996; Singh
& Sirdeshmukh, 2000). The commonly used definition of trust is the definition of Moorman,
Zaltman, & Deshpande (2006), which defines it as the desire to depend on exchange partners
where a person has self-confidence. This definition is consistent with initial research, which
links trust with "beliefs in intentions and motives of others", definitions that are still valid
(Lewicki et al., 1998). This research is also repeated by recent research in offline and online
services (Cheung & Lee, 2002), which defines trust as "the level of trust or certainty of
customers in exchange options". Therefore, E-trust is defined as the level of customer trust in
Financial Behaviour, E-Trading Satisfaction, E-Trust, and E-Loyalty of E-Trading in Indonesian Stock
Exchange with SEM-PLS
Armansyah
___________________________________________________________________________
______________________________________________________________________________
84
© 2019 (9th) International Conference of the AGMS Proceedings
online exchanges, or online exchange channels.
Electronic exchange is believed to present many risks to customers (Grabner-Kräuter &
Kaluscha, 2003), while trust seems to be very important to create loyalty when the level of risk
is felt high. Online purchases are considered risky, because customers do not have direct contact
with the company, namely through sales staff or physical stores (Reichheld & Schefter, 2000),
and must submit sensitive information, such as credit card numbers, to complete transactions.
The absence of interpersonal interactions also shows that online trust is mainly cognitive, that is
based on customer judgment about the reliability and ability of traders or exchange channels,
and not trust based on ties between individuals. At present, the lack of empirical studies on trust
in online exchanges is on the effects of e-trust on customer behaviour. Grabner-Kräuter &
Kaluscha (2003) also show a lack of studies on trust in e-tailers, because many previous studies
only investigated website searches, purchase scenario hypotheses, or internet banking. It must
be explicitly acknowledged that there are different types of beliefs, and differences need to be
made between one's disposition, or the tendency to believe, system-based trust and interpersonal
trust (Grabner-Kräuter & Kaluscha, 2003). System-based trust is equal to e-trust and relates to
customer trust in buying or searching for goods/services information online. Lack of trust is
often cited as an excuse not to buy from online traders (Lee & Turban, 2001). In analogy with
findings from traditional loyalty research, positive word of mouth (Hollman, Forrest, Gremler,
& Brown, 1998) can also be expected as a result of trust. However, the lack of e-trust cannot be
directly affected by online traders, which can only affect the trust of their e-tailers.
Trader trust is the most widely studied form of trust in online exchanges, while system-
based trust has been largely ignored (Grabner-Kräuter & Kaluscha, 2003). E-trust is expected to
influence the customer's desire to buy online, but empirical evidence is lacking. A study by
(Radionova-Girsa & Lahiža, 2017) found that e-trust has a significant influence on the use of
internet banking, while trust in the bank itself does not affect.
E-Loyalty
Customer loyalty has been defined as a firm commitment to repurchase or rejuvenate
preferred products/services in the future, thus causing the same brand or purchase of the same
brand, regardless of situational influences and marketing efforts that have the potential to cause
a transition behaviour (Oliver, 2009). This general definition seems to apply to e-loyalty as
well. Another definition, shorter and more specific is given by Rolph E. Anderson & Srini S.
Srinivasan, (2003), who define e-loyalty as an attitude that benefits customers to the electronic
business, which results in repeat buying behaviour. Favorable preferences and attitudes assume
customer satisfaction, which is generally considered to be the primary driver of loyalty (Oliver,
2009; Rolph E. Anderson & Srini S. Srinivasan, 2003), also in online settings (Cho, Im, Hiltz,
& Fjermestad, 2002; Gummerus, Liljander, Pura, & Van Riel, 2004) because it is considered
Financial Behaviour, E-Trading Satisfaction, E-Trust, and E-Loyalty of E-Trading in Indonesian Stock
Exchange with SEM-PLS
Armansyah
___________________________________________________________________________
______________________________________________________________________________
85
© 2019 (9th) International Conference of the AGMS Proceedings
difficult to get loyal customers on the internet (Gommans, Krishnan, & Scheffold, 2001),
satisfaction with traders and their services may be more important online than offline (Kingshott
et al., 2018; Shankar, Smith, & Rangaswamy, 2003). E-commerce itself is also still facing
challenges compared to offline traders because online customers cannot feel and try the product,
so they might end up choosing the product they don't want (Nisar & Prabhakar, 2017).
Methodology
The data used are primary data with the technique of collecting data through electronic
questionnaires distributed to investors of the Indonesia Stock Exchange through brokerage companies,
as many as 1000 respondents have been obtained and used in this study, namely Indonesian Stock
Exchange investment actors who use the Indonesia Stock Exchange e-trading. The sampling technique
used was purposive sampling with certain respondent criteria so that the appropriate data was obtained
for this study. The sample data uses investor data held by brokerage companies with e-survey
questionnaires which are processed using outer model and inner model by SEM-PLS (Structural
Equation Modeling-Partial Least Square) approach and path estimate. Outer model in this study was
divided into 2 namely explanatory factor analysis and confirmatory factor analysis. Explanatory factor
analysis (EFA) is used if indicators that measure latent variables are formative while confirmatory
factor analysis (CFA) is used if indicators that measure latent variables are reflective.
This method is specifically designed to overcome problems in multiple regression. Technically
it aims to produce a model that transforms a set of correlated explanatory variables into a new set of
variables that are not mutually correlated. The outer model obtained is then evaluated based on the
substantive content model by comparing the relative weight and significance of the weight, then the
inner model is evaluated by looking at the percentage variance and looking at the R-square value and
seeing the magnitude of the structural path coefficient. The stability of these estimates was evaluated
using a two-way statistical t-test through the bootstrapping procedure. The inner model describes the
relationship between latent variables. Inner model is divided into 2 stages, namely hypothesis testing
and coefficient of determination. In the hypothesis test, the relationship between latent variables is said
to be significant if the value of P value <α = 0.05 or t-count> 1.96. While the coefficient of
determination there are three criteria, namely, the influence between latent variables is said to be strong
if the value of R2> 0.67; moderate if 0.33 <R2 ≤ 0.67; weak if the value is 0.19 <R2 ≤ 0.33 and is said to
be very weak if the value of R2 is ≤ 0.19.
Results and Discussions
This study aims to examine the behaviour of financial behaviour in terms of satisfaction, trust

Financial Behaviour, E-Trading Satisfaction, E-Trust, and E-Loyalty of E-Trading in Indonesian Stock
Exchange with SEM-PLS
Armansyah
___________________________________________________________________________
______________________________________________________________________________
86
© 2019 (9th) International Conference of the AGMS Proceedings
and loyalty in the use of e-trading in the Indonesian stock exchange using data from 1000 respondents
of the Indonesia Stock Exchange investors. The variables used are financial behaviour, e-trust, e-
trading satisfaction, and e-loyalty. Data is processed using in several stages with Partial Least Square
(PLS) regression method and path estimation. This method is specifically designed to overcome
problems in multiple regression. Technically it aims to produce a model that transforms a set of
correlated explanatory variables into a new set of variables that are not mutually correlated. The outer
model obtained is then evaluated based on the substantive content model by comparing the relative
weight and significance of the weight, then the inner model is evaluated by looking at the percentage
variance and looking at the R-square value and seeing the magnitude of the structural path coefficient.
The stability of these estimates was evaluated using a two-way statistical t-test through the
bootstrapping procedure. The following is the results from SEM-PLS approach.
Outer Model
Figure. 1 Outer Model
Based on the results found in Figure. 1, table. 1 and 2, show that all values of loading
factors from indicators have values above 0.7 AVE values> 0.6 so that these results indicate that
the validity criteria have been met. In table 1 also shows the composite reliability value and
Cronbach alpha has a value above 0.7 so that this result indicates that the reliability criteria have
been met. It can be concluded that the indicators EL1, EL2, EL3 can measure both e-loyalty
variables as well as ET1, ET2, ET3, ETS1, ETS2, ETS3, FB1, FB2, FB3 also have a loading
factor value above 0.7 so they can measure variables well e-trust, e-tradition satisfaction, and
financial behaviour.

Financial Behaviour, E-Trading Satisfaction, E-Trust, and E-Loyalty of E-Trading in Indonesian Stock
Exchange with SEM-PLS
Armansyah
___________________________________________________________________________
______________________________________________________________________________
87
© 2019 (9th) International Conference of the AGMS Proceedings

The Relationship of GCG, Company Size, Liquidity, Capital Structure, and Profitability with SEM-PLS
Effendi
___________________________________________________________________________
______________________________________________________________________________
88
© 2019 (9th) International Conference of the AGMS Proceedings
Table. 1 Outer Model Result
AVE Composite Reliability R Square Cronbach Alpha
EL 0.721286 0.885840 0.597740 0.806997
ET 0.734067 0.892204 0.672735 0.818977
ETS 0.776128 0.912244 0.624007 0.855555
FB 0.796939 0.921712 0.872601
Table. 2 Loading Factor
EL ET ETS FB
EL1 0.829404 0.566301 0.606980 0.597136
EL2 0.875774 0.653058 0.694390 0.667183
EL3 0.842002 0.566554 0.599601 0.610158
ET1 0.655188 0.880877 0.704567 0.711358
ET2 0.608465 0.855642 0.661141 0.647183
ET3 0.537355 0.833146 0.628530 0.628453
ETS1 0.683334 0.663505 0.854622 0.668188
ETS2 0.618327 0.652038 0.884798 0.686898
ETS3 0.675269 0.734999 0.902850 0.730707
FB1 0.647188 0.689461 0.719991 0.884646
FB2 0.621058 0.704345 0.715355 0.897284
FB3 0.707978 0.680151 0.679107 0.896159
Inner Model
Figure.2 Inner Model
Table 3. Hypotheses Test

The Relationship of GCG, Company Size, Liquidity, Capital Structure, and Profitability with SEM-PLS
Effendi
___________________________________________________________________________
______________________________________________________________________________
89
© 2019 (9th) International Conference of the AGMS Proceedings
Path Coefficients T Statistics P value Information
ET -> EL 0.306866 3.622432 <0.001 Affected
ETS -> EL 0.510133 6.213679 <0.001 Affected
ETS -> ET 0.439673 7.621345 <0.001 Affected
FB -> ET 0.427313 6.713279 <0.001 Affected
FB -> ETS 0.789941 27.496941 <0.001 Affected
T Table 1.96
The inner model describes the relationship between exogenous variables and endogenous
variables. In this section, the Inner model is used as a basis for testing hypotheses by looking at
the coefficient of determination and path analysis. In hypothesis testing, the relationship between
latent variables is said to be significant if the value of P value <α = 0.05 or t-count> 1.96. While
the coefficient of determination has three criteria, namely, the influence between variables is said
to be strong if it has a value of R2> 0.67; moderate if 0.33 <R2 ≤ 0.67; weak if the value is 0.19
<R2 ≤ 0.33 and is said to be very weak if the value of R2 is ≤ 0.19.
Financial Behavior (FB)
The size of the parameter coefficient for the Financial Behavior (FB) variable is (original
sample) 0.427, which means that there is a positive influence between Financial Behavior (FB)
on e-trust (ET), or it can be said that the financial behaviour of investors affects e-trust in e-
trading in the Indonesia Stock Exchange supported by the t-statistic value 6.713 and
SIGNIFICANT with a statistical t value greater than t-table 1.96 (6.713> 1.96). So that the first
hypothesis is accepted namely, there is a significant effect of Financial Behavior on e-trust on the
Indonesia Stock Exchange E-trading. Whereas the coefficient of financial behavior parameter
(FB) towards e-trading satisfaction (ETS) is 0.789 which means that it has a positive and
significant influence with a t-statistic value of 27.496 greater than t-table 1.96, and this result
supports the second hypothesis that there is influence significant Financial Behavior towards E-
trading Satisfaction on the E-trading of the Indonesia Stock Exchange.
The influence of financial behaviour (FB) on e-loyalty (EL) through e-trading satisfaction
(ETS) indicated by the indirect parameter coefficient of 0.402 (0.789x0.50) which means
indirectly financial behaviour through e-trading satisfaction has a positive influence towards e-
loyalty and these results support the third hypothesis of this study, namely there is a significant
effect of Financial Behavior through E-trading Satisfaction on e-loyalty in the E-trading of the
Indonesia Stock Exchange.
The Relationship of GCG, Company Size, Liquidity, Capital Structure, and Profitability with SEM-PLS
Effendi
___________________________________________________________________________
______________________________________________________________________________
90
© 2019 (9th) International Conference of the AGMS Proceedings
e-trading satisfaction (ETS)
The size of the parameter coefficient for the e-trading satisfaction (ETS) variable is
(original sample) 0.439 which means that there is a positive influence between e-trading
satisfaction on e-trust (ET), or it can be said that e-trading satisfaction affects e-trust investors in
e-trading of the Indonesia Stock Exchange is also supported by t-statistic value of 7,621 and
significant with a statistical t value greater than t-table 1.96 (7.621> 1.96), so that the fourth
hypothesis is accepted i.e. there is a significant effect of E-trading Satisfaction against e-trust on
the Indonesia Stock Exchange E-trading. While the parameter coefficient of e-trading
satisfaction (ETS) for e-loyalty (EL) is 0.510 which means it has a positive and significant
influence with a t-statistic value of 6.213 greater than t-table 1.96 and this result supports the
fifth hypothesis that is significant influence of E-trading Satisfaction on e-loyalty on the E-
trading of the Indonesia Stock Exchange.
The influence of e-trading satisfaction (ETS) on e-loyalty (EL) through e-trust (ET) as
indicated by the indirect parameter coefficient of 0.134 (0.439x0.306) which means that
indirectly e-trading satisfaction through e-trust has the positive influence on e-loyalty, and this
result supports the sixth hypothesis of this study which is that there is a significant effect of E-
trading Satisfaction through e-trust on e-loyalty in the E-trading of the Indonesia Stock
Exchange.
e-trust (ET)
The size of the parameter coefficient for e-trust (ET) variable is 0.306 which means there
is a positive influence between e-trust (ET) on e-loyalty (EL), or it can be said that e-trust
investors influence e-loyalty investors in e-trading of the Indonesia Stock Exchange is also
supported by t-statistic value of 3.622 and significant with a statistical t value greater than t-table
1.96 (3.622> 1.96), so that the seventh hypothesis is accepted i.e. there is a significant effect of
e-trust on e-loyalty on the Indonesia Stock Exchange E-trading.
Table 1 shows that the R-square value has a range between 0.59 to 0.67, this indicates
that the statistical model formed can explain the variables studied more than 59%, in other
words, these variables have an effect of 59%, and the rest is influenced by other variables outside
the model studied. Table 5.3 shows that the p-value obtained shows less than 0.001 and is
smaller than the value of α 0.05; it can be said that each variable has an influence on e-loyalty on
the Indonesia Stock Exchange.
The results of this study provide additional evidence and updates on previous studies. E-
loyalty in the e-trading of the Indonesia Stock Exchange can be influenced by financial
behaviour, e-trust, and e-trading satisfaction using e-trading. E-loyalty as the focus of the
successful use of e-trading used by the Indonesian stock exchange, because it is strongly
influenced by financial behaviour and investor satisfaction in the use of e-trading, so this study

The Relationship of GCG, Company Size, Liquidity, Capital Structure, and Profitability with SEM-PLS
Effendi
___________________________________________________________________________
______________________________________________________________________________
91
© 2019 (9th) International Conference of the AGMS Proceedings
also supports the statement of Geyskens et al., (1996), Chen et al., (2014) and Christodoulides &
Michaelidou, (2011) where customer satisfaction is the primary key to the health of economic
performance and is an antecedent of trust.
This study also supports the results of research by Radionova-Girsa & Lahiža, (2017)
which states that e-trust has a significant influence on internet use except that the research
focuses on banking, while trust in the institution itself does not affect this is possible because
investors tend to be motivated differently when using e-trading exchanges. Investors have
expectations of the results of their investments in the future, so this thinking will make investors
focus on the type of investment chosen, further encouraging investors to focus on the e-trading
exchange.
This study also supports the research of Ricciardi & Simon, (2000) that finance behaviour
is involved in any activity related to investment decisions or the media used by investments
where the easier it is to obtain information for decision making it will affect investor satisfaction
in using e-trading further influence in trusting the use of e-trading exchanges.
Conclusion and Implication
This research focuses on current technological developments that have increasingly advanced
and influence user behavior, especially financial behavior. Technology that increasingly demands
users to be closer to e-commerce and to make it easier to interact with other users. This study aims to
examine the behaviour of financial behaviour in terms of satisfaction, trust and loyalty in the use of e-
trading in the Indonesian stock exchange using data from 1000 respondents of the Indonesia Stock
Exchange investors that currently active as traders. The variables used are financial behaviour, e-trust,
e-trading satisfaction, and e-loyalty. The results and conclusions obtained are financial behaviour
variables, e-trust, e-trading satisfaction has a significant effect on the creation of e-loyalty e-trading
users of the Indonesia Stock Exchange.
The results of this study provide additional evidence and updates on research on e-loyalty
using e-trading. Investors have considered the convenience and reliability of internet media and e-
trading in making investment decisions so that they can lead to loyalty (e-loyalty). Investors who
understand the investment climate in Indonesia, especially the capital market, will be facilitated in
making decisions and can make good decisions in addition to the availability of information also have
an essential role in the decision-making process.
Suggestions that can be given related to this research are the existence of updates in
methods, data, variables and can more specifically see the scope of the type of investment so
that further research can contribute differently to research specifically related to behavioural

The Relationship of GCG, Company Size, Liquidity, Capital Structure, and Profitability with SEM-PLS
Effendi
___________________________________________________________________________
______________________________________________________________________________
92
© 2019 (9th) International Conference of the AGMS Proceedings
economics, so that similar research can be developed and able to reduce limitations in this study
to produce more comprehensive analysis related to the creation of trust and loyalty. The use of
other approaches is also suggested in the effort to develop this research so that more renewable
research is achieved which can overcome the limitations that exist.
References
Bigley, G. A., & Pearce, J. L. (1998). Straining for shared meaning in organization science:
Problems of trust and distrust. Academy of Management Review, 23(3), 405–421.
https://doi.org/10.5465/AMR.1998.926618
Chen, C. X., Martin, M., & Merchant, K. A. (2014). The effect of measurement timing on the
information content of customer satisfaction measures. Management Accounting Research,
25(3), 187–205. https://doi.org/10.1016/j.mar.2013.12.003
Cheung, C. M. K., & Lee, M. K. O. (2002). Trust in Internet Shopping: Instrumental
Development and Validation through Classical and Modern Approaches. Advanced Topics
in Global Information …, 9(3), 2002–2004.
Cho, Y., Im, I., Hiltz, R., & Fjermestad, J. (2002). The Effects of Post-Purchase Evaluation
Factors on Online vs. Offline Customer Complaining Behavior: Implications for Customer
Loyalty. Advances in Consumer Research, 29(1), 318–326.
https://doi.org/10.16953/deusbed.74839
Christodoulides, G., & Michaelidou, N. (2011). Shopping motives as antecedents of e-
satisfaction and e-loyalty. Journal of Marketing Management, 27(1–2), 181–197.
https://doi.org/10.1080/0267257X.2010.489815
Fang, J., Shao, Y., & Wen, C. (2016). Transactional quality, relational quality, and consumer e-
loyalty: Evidence from SEM and fsQCA. International Journal of Information
Management, 36(6), 1205–1217. https://doi.org/10.1016/j.ijinfomgt.2016.08.006
Geyskens, I., Steenkamp, J. B. E. M., Scheer, L. K., & Kumar, N. (1996). The effects of trust and
interdependence on relationship commitment: A trans-Atlantic study. International Journal
of Research in Marketing, 13(4), 303–317. https://doi.org/10.1016/S0167-8116(96)00006-7
Gommans, M., Krishnan, K., & Scheffold, K. (2001). From brand loyalty to E-loyalty: A
conceptual framework. Journal of Economic and Social Research, 3(1), 43–58.

The Relationship of GCG, Company Size, Liquidity, Capital Structure, and Profitability with SEM-PLS
Effendi
___________________________________________________________________________
______________________________________________________________________________
93
© 2019 (9th) International Conference of the AGMS Proceedings
Grabner-Kräuter, S., & Kaluscha, E. A. (2003). Empirical research in on-line trust: A review and
critical assessment. International Journal of Human Computer Studies, 58(6), 783–812.
https://doi.org/10.1016/S1071-5819(03)00043-0
Gummerus, J., Liljander, V., Pura, M., & Van Riel, A. (2004). Customer loyalty to content-based
Web sites: The case of an online health-care service. Journal of Services Marketing, 18(3),
175–186. https://doi.org/10.1108/08876040410536486
Hadi Teymoori, maeyam godarzi, & Hameh ghaebi. (2016). Studying the Effective Factors on
Formation of Customers’ E-Loyalty in E-Stores in Iran. Journal of Business Management,
8(2), 281–300. https://doi.org/10.22059/JIBM.2016.58692
Hansemark, O. C., & Albinsson, M. (2004). Customer satisfaction and retention: The
experiences of individual employees. Managing Service Quality: An International Journal,
14(1), 40–57. https://doi.org/10.1108/09604520410513668
Hollman, K. W., Forrest, J. E., Gremler, D., & Brown, S. (1998). The loyalty ripple effect:
Appreciating the full value of customers. International Journal of Service Industry
Management, 2(2), 49–65. https://doi.org/10.1108/09564239810199923
Kingshott, R. P. J., Sharma, P., & Chung, H. F. L. (2018). The impact of relational versus
technological resources on e-loyalty: A comparative study between local, national and
foreign branded banks. Industrial Marketing Management, 72, 48–58.
https://doi.org/10.1016/j.indmarman.2018.02.011
Lee, M. K. O., & Turban, E. (2001). A trust model for consumer internet shopping. International
Journal of Electronic Commerce, 6(1), 75–91.
https://doi.org/10.1080/10864415.2001.11044227
Lewicki, R. J., McAllister, D. J., & Bies, R. I. (1998). Trust and distrust: New relationships and
realities. Academy of Management Review, 23(3), 438–458.
https://doi.org/10.5465/AMR.1998.926620
Lintner, G. (1998). Behavioral Finance: Why Investors Make Bad Decisions. The Planner, 13(1),
7–8.
Moorman, C., Zaltman, G., & Deshpande, R. (2006). Relationships between Providers and Users
of Market Research: The Dynamics of Trust within and between Organizations. Journal of
Marketing Research, 29(3), 314. https://doi.org/10.2307/3172742
Nisar, T. M., & Prabhakar, G. (2017). What factors determine e-satisfaction and consumer

The Relationship of GCG, Company Size, Liquidity, Capital Structure, and Profitability with SEM-PLS
Effendi
___________________________________________________________________________
______________________________________________________________________________
94
© 2019 (9th) International Conference of the AGMS Proceedings
spending in e-commerce retailing? Journal of Retailing and Consumer Services, 39, 135–
144. https://doi.org/10.1016/j.jretconser.2017.07.010
Oliver, R. L. (2009). Satisfaction: A Behavioral Perspective on the Consumer, M.E. Sharpe,
Armounk, NY. Satisfaction: A Behavioral Perspective on the Consumer.
Pavlou, P. A. (2018). Consumer Acceptance of Electronic Commerce: Integrating Trust and Risk
with the Technology Acceptance Model. International Journal of Electronic Commerce,
7(3), 101–134. https://doi.org/10.1080/10864415.2003.11044275
Radionova-Girsa, E., & Lahiža, A. (2017). Comparison of E-Trust and Trust Concepts in Online
and Offline Dimensions. Economics and Business, 30(1), 126–133.
https://doi.org/10.1515/eb-2017-0011
Reichheld, F. F., & Schefter, P. (2000). E-Loyalty: Your secret weapon on the web. Harvard
Business Review, 78(4), 105–113.
Ricciardi, V., & Simon, H. . (2000). What is Behavior in Finance? Business, Education, and
Technology Journal, Fall: 1-9.
Rolph E. Anderson, & Srini S. Srinivasan. (2003). E-satisfaction and e-loyalty: A contingency
framework. Psychology and Marketing, 20(2), 123–138. https://doi.org/10.1002/mar.10063
Shankar, V., Smith, A. K., & Rangaswamy, A. (2003). Customer satisfaction and loyalty in
online and offline environments. International Journal of Research in Marketing, 20(2),
153–175. https://doi.org/10.1016/S0167-8116(03)00016-8
Singh, J., & Sirdeshmukh, D. (2000). Agency and trust mechanisms in consumer satisfaction and
loyalty judgments. Journal of the Academy of Marketing Science, 28(1), 150–167.
https://doi.org/10.1177/0092070300281014
Tsai, S. pei. (2017). E-loyalty driven by website quality: The case of destination marketing
organization websites. Journal of Organizational Computing and Electronic Commerce,
27(3), 262–279. https://doi.org/10.1080/10919392.2017.1331674

The Relationship of GCG, Company Size, Liquidity, Capital Structure, and Profitability with SEM-PLS
Effendi
___________________________________________________________________________
______________________________________________________________________________
95
© 2019 (9th) International Conference of the AGMS Proceedings
The relationship of GCG, company size, liquidity, capital structure, and profitability with
SEM-PLS
Moch Bisyri Effendi
STIE Perbanas Surabaya
Jl. Nginden Semolo No. 34-36, 60118,
Surabaya, Indonesia
Abstract
This study aims to investigate the patterns of relationship among GCG, company size, liquidity,
capital structure and profitability. Profitability is measured by ROA (Return on Assets), ROE
(Return on Equity) and NPM (Net Profit Margin). Capital structure is measured by DER (Debt to
Equity Ratio), DAR (Debt to Asset Ratio) and LTD (Long Term Debt). Liquidity is measured by
CR (Current Ratio), QR (Quick Ratio) and CTR (Cash Turnover Ratio). The size of the company
is measured by ln (total of assets) and Ln (total of sales). Good Corporate Governance (GCG) is
measured by corporate governance disclosure index (CGDI). The sample method was used a
purposive sampling technique. The Partial Least Square (PLS) method was used to analyze the
data. The results of this study indicate that in the GCG variable there is no Confirmatory Factor
Analysis because GCG is measured by one indicator. The results of this study indicate that in the
GCG variable there is no Confirmatory Factor Analysis because GCG is measured by one
indicator. The results of the Confirmatory Factor Analysis on liquidity variables, company size
and profitability indicate that each indicator is able to measure well the variables measured (valid
and reliable). Hypothesis test results show that the relationship of influence between significant
variables namely, GCG on capital structure (H1 is accepted), firm size on capital structure (H2 is
accepted) and liquidity on capital structure (H3 is accepted) and capital structure on profitability
(H4 is accepted). The results of the coefficient of determination indicate that the effect of
liquidity, firm size and GCG on the capital structure is quite strong. Subsequent research can use
other companies so that it can be a comparison to other company sector conditions and can
review the mediation of capital structures on the relationship of liquidity, GCG and company
size to profitability.
Keywords: GCG, Company Size, Liquidity, Capital Structure, Profitability
The Relationship of GCG, Company Size, Liquidity, Capital Structure, and Profitability with SEM-PLS
Effendi
___________________________________________________________________________
______________________________________________________________________________
96
© 2019 (9th) International Conference of the AGMS Proceedings
Introduction
A company always needs capital both for business opening and business development.
Capital or funding has various problems, one of the funding problems is how much the
company's ability to meet the funding needs that will be used to operate and develop its business.
Brigham and Houston (2011) state that developing companies need capital that can come from
debt or equity. According to Keown (2010) companies must understand the main components of
the capital structure. The optimal capital structure is the capital structure of the company that will
maximize its stock price. Too much debt can hamper the development of the company, which
will also make shareholders think twice about continuing to invest their capital.
Own capital structure is the proportion of use between debt and equity. Management as a
company manager must certainly be able to balance the use of debt and equity to achieve an
optimal capital structure. In realizing optimal capital structure, financial managers must consider
many things that affect the capital structure. Several factors that influence the capital structure
include company size, liquidity, profitability, and asset structure. This study uses multiple linear
regression models with manufacturing companies listed on the Indonesia Stock Exchange as the
object of research.
At this time the business world is experiencing increasingly intense business
competition between companies, therefore every company must be able to perform important
functions that exist in the company such as marketing functions, sales functions, financial
functions, personnel functions, production functions and accounting functions effective and
efficient, so the company can be superior in the competition faced. This is done to achieve the
company's goals which are basically maximizing the welfare of shareholders through investment,
funding and dividend decisions or policies.
In implementing these functions, the aspects that need to be considered are the aspects of
funding. The funding source can come from the company's internal self, namely by using
retained earnings, issuing shares or originating from external companies, one of which is through
debt policy. This policy is very closely related to the company's capital structure. According to
Sartono (2001), what is meant by capital structure is the balance of the amount of permanent
short-term debt, long-term debt, preferred stock and ordinary shares. Companies are required to
carry out appropriate funding strategies in determining the most optimal capital structure, a
condition where companies can use an ideal combination between debt and company capital by
calculating the cost of capital that appears. The optimal capital structure of the company the cost
of capital to be borne will also be smaller.
The company's capital structure is influenced by many factors. From several previous
studies, there are several factors that influence the capital structure, including profitability,
The Relationship of GCG, Company Size, Liquidity, Capital Structure, and Profitability with SEM-PLS
Effendi
___________________________________________________________________________
______________________________________________________________________________
97
© 2019 (9th) International Conference of the AGMS Proceedings
business risk, insider ownership, growth opportunity, company size, asset structure, liquidity and
so on. Supporting theories about capital structure include agency theory, trade off theory, and
pecking order theory. The variables used in this study are company size, profitability, asset
structure, and liquidity which are tested for their effect on capital structure.
Company size describes the size of a company. Large companies will easily diversify
and tend to have a smaller bankruptcy rate. In large companies with a lot of assets, many would
be more courageous to use capital from loans in buying all assets, compared to companies that
are smaller in size.
Corporate governance is very influential with the acquisition of company capital. If the
corporate governance is good, the capital that will be obtained automatically will be very
optimal. Not only that, good corporate governance can improve the economic stability of the
company itself. Everything can run smoothly if the corporate governance is successful.
Corporate governance also has a major influence on sustainable development and economic
growth, which specifically adds strength from the corporate sector and understands more ability
to attract capital to lubricate the economy (Shleifer and Vishny, 1997)
Liquidity is how much the company's ability to fulfill its short-term obligations.
Liquidity is one of them measured by the debt ratio which is a ratio that measures the percentage
of capital requirements spent with debt (Brigham and Houston, 2006). In accordance with the
pecking order theory, companies will prioritize using internal funds. Companies with high
liquidity will reduce their external funding because the source of internal funds is high.
Profitability is the company's revenue which has been reduced by costs. According to Gitman
(2003), profitability is the relationship between income and costs generated by using company
assets, both smoothly and permanently, in production activities. The company wants a high level
of profitability. From the existing profit the company can allocate it into retained earnings or
business expansion. In accordance with the Pecking order theory, companies that have high
profitability will tend to use funding through internal sources, namely using profits, the higher
the company's profitability, the smaller the proportion of debt usage.
Research on factors that influence capital structure has been done a lot before. Research
conducted by Wimelda and Marlinah (2013) and Adiyana's research (2014), suggested the results
that company size had a positive and significant effect on capital structure. Firnanti (2011)
examines the factors that influence the capital structure which results in the conclusion that
profitability has a negative influence on capital structure. Other research conducted by Liwang
(2011) which proves that asset structure variables have a positive and significant effect on capital
structure, whereas research conducted by Hadianto (2010), shows the results that the asset
structure has a negative and significant effect on capital structure. In the study of Dwilestari
(2010) concluded that liquidity has a negative effect on capital structure.

The Relationship of GCG, Company Size, Liquidity, Capital Structure, and Profitability with SEM-PLS
Effendi
___________________________________________________________________________
______________________________________________________________________________
98
© 2019 (9th) International Conference of the AGMS Proceedings
Manufacturing companies are used in this study because the company is a company
with a large scale of production or has a large trading volume and requires large capital or funds
to develop its products so that it will affect the capital structure or funding of a company. From
the background above and the inconsistent results from previous studies, the authors are
interested in re-examining these variables with the title of research: Influence of Company Size,
Liquidity, Profitability, and GCG on Capital Structure in Registered Manufacturing Companies
on the Indonesia Stock Exchange.
Literature Review
Liquidity to Capital Structure
Liquidity is a ratio used to measure a company's ability to pay short-term obligations
(Van Horne and Wachowicz, 2007). According to the Pecking order theory, companies that have
high liquidity will tend not to use debt financing because they have large funds for internal
funding. The use of alternative funding starts from the least risky securities, namely retained
earnings, debt, and the issuance of new shares. Retained earnings are reinvested in the hope of
increasing corporate profits in the coming year. Ozkan (2016) says that companies with large
liquid assets can use these assets to invest.
A high asset liquidity ratio can be considered by investors to be a positive signal
because it indicates that the company can fulfill its current obligations and is faced with a low
risk of bankruptcy. With large retained earnings, companies will prefer to use retained earnings
for company operations before using debt or issuing new shares.
Profits that are not distributed as dividends will be used for expansion which usually
means the purchase of assets. This is in accordance with the pecking order theory which says that
managers prefer to use financing with the first order retained earnings, then debt and the last sale
of new shares. Another consideration is that the direct costs of financing from within are those
that are detained cheaper than the cost of capital originating from the issuance of new shares
(Dermawan Sjahrial, 2008). Companies that have high liquidity means they have the ability to
pay debts. From this explanation, it can be concluded that Liquidity has a negative effect on
Capital Structure.
H1 : Liquidity to Capital Structure
The Relationship of GCG, Company Size, Liquidity, Capital Structure, and Profitability with SEM-PLS
Effendi
___________________________________________________________________________
______________________________________________________________________________
99
© 2019 (9th) International Conference of the AGMS Proceedings
GCG to Capital Structure
According to Law No. 40 of 2007 concerning the company, in general the director has
the task of leading the company by issuing company policies, selecting, stipulating, supervising
the duties of employees and section heads (managers), approving the company's annual budget,
submitting reports to shareholders on the company's performance. The company will choose a
funding policy through debt because it has a lower risk of the company than issuing shares and to
prevent moral hazard. Research conducted by Serghiescu (2014) concluded that the size of the
board of directors influences the capital structure
An independent commissioner is a person appointed based on a GMS decision from an
unaffiliated party with a major shareholder, member of the board of directors and / or other
members of the board of commissioners. An independent commissioner is an outside company
that assesses the performance of the company and makes decisions for the progress of the
company, not for personal or group interests. The stronger the independent commissioner, the
greater the funding of capital, because it affects the decisions taken. Companies will choose debt
to be used as a source of funding for company capital because they have a smaller risk and to
prevent the occurrence of moral hazard. In addition, independent commissioners also consider if
issuing shares, the interests of shareholders will increase. The independent commissioner will
provide the best advice and policies for the company such as the selection of capital.
Managerial ownership is share ownership by company management. Agency problems
will decrease because they are in harmony between the interests of shareholders and company
management. Managers have a large amount of information because they are within the
operational scope. The manager wants profits for the company as the manager itself and profits
as shareholders. Managers will choose debt to be used as a source of capital funding because it
has a smaller company risk and benefits managers as shareholders who are seen based on the
value of share ownership that is not reduced. The research conducted by Ismiyati (2004)
concluded that managerial ownership influences the capital structure. Based on this, the
hypothesis proposed is as follows:
H2 : GCG to Capital Structure
Company Size to Capital Structure
Companies that experience high growth will need large capital. This is because large
companies have large funding needs and one alternative is to use funds from external funds. On
the contrary, the company in low sales growth, the need for capital is also small.
According to Mas'ud (2008) the larger the size of the company that is indicated by total
assets, the company will use large amounts of debt as well. The larger the size of the company
indicates that the company has a higher number of assets. Companies that are relatively large in

The Relationship of GCG, Company Size, Liquidity, Capital Structure, and Profitability with SEM-PLS
Effendi
___________________________________________________________________________
______________________________________________________________________________
100
© 2019 (9th) International Conference of the AGMS Proceedings
size will tend to use increasingly large external funds. This is because the funding needs also
increase along with the growth of the company. In addition to internal funding, the next
alternative is external funding. This is in line with the pecking order theory which states that, if
the use of internal funds is insufficient, the second alternative is to use debt. The results of this
study are supported by Seftianne and Handayani (2011), Verena and Mulyo (2013) indicating the
size of the company influences the capital structure. Different results from the Firnanti (2011)
study show that the size does not affect the capital structure. Based on this, the hypothesis
proposed is as follows:
H3 : Company Size to Capital Structure
Capital Structure To Profitability
Profitability is the level of net profit that the company can achieve when carrying out
its operations. Profitability reflects the company's ability to generate profits on the management
of company assets which is a comparison between earnings after tax and total assets. Profitability
can be interpreted as a return on capital investment. Companies with high rate of return tend to
use relatively small debt proportions. Because with a high rate of return, funding needs can be
obtained from retained earnings. Companies with high profitability will have more internal funds
than companies with low profitability. The higher profitability shows that the profits obtained by
the company are also high. If the company's profits are high, the company has a substantial
source of funds from within, so the company requires less debt. Besides that, if retained earnings
increase, the debt ratio will naturally decrease, assuming that the company does not add debt.
Therefore, profitability has a negative effect on capital structure. The results of this study are
supported by Verena and Mulyo (2013), Seftiane and Handayani (2011).
H4 : Profitability affects the capital structure
Research Methodology
This research uses quantitative research methods, which means that the study analyzes
data in the form of numbers or statistics with the aim of testing the predetermined hypotheses.
The population used in this study is a manufacturing company listed on the Stock Exchange in
the period 2015 - 2017 .. The selection of samples in this study using purposive sampling
technique. The data collection technique used in this study is documentation. The variables used
in this research consist of 2 variables, namely, endogenous variables and exogenous variables.
The endogenous variable in this study is Profitability measured using ROA (Return on Assets),
ROE (Return on Equity) and NPM (Net Profit Margin). While intervening endogenous variables
in this study are capital structures measured using DER (Debt to Equity Ratio), DAR (Debt to

The Relationship of GCG, Company Size, Liquidity, Capital Structure, and Profitability with SEM-PLS
Effendi
___________________________________________________________________________
______________________________________________________________________________
101
© 2019 (9th) International Conference of the AGMS Proceedings
Asset Ratio) and LTD (Long Term Debt). The Exogenous variable in this study consisted of
Liquidity, GCG and Company Size. Liquidity is measured using CR (Current Ratio), QR (Quick
Ratio) and CTR (Cash Turnover Ratio). The size of the company is measured using ln (total
assets) and Ln (total sales). Good corporate governance (GCG) is measured using corporate
governance disclosure criteria in the company's annual report. This determination of disclosure
index is based on information disclosed by the company in their annual report to stakeholders.
The disclosure items used in this study are based on the Decree of the Chairperson of Bapepam
and LK Number: Kep-134 / BL / 2006 concerning the Obligation to Submit Annual Reports to
Issuers and Public Companies. So, in this study, there were 26 items of corporate governance
disclosure. The method used to assess corporate governance disclosure index (CGDI) is the value
of 1 for items that are disclosed and the value of 0 for items that are not disclosed.
The data analysis technique used in this study is the Partial Least Square (PLS) method.
Partial Least Square is a model of Structural Equation Modeling (SEM) based on variance or
component. Testing using the PLS method basically consists of 2 types of testing, namely the
measurement model (outer model) and structural models (inner models). Outer models used in
this study used the confirmatory factor analysis (CFA) method to measure validity and reliability
provided that the value of loading factors above 0.4 provided the AVE value> 0.5 and the
composite reability value> 0.7. The inner model in this study is used to see the significance of
the path between latent variables and answer the research hypothesis by looking at statistical
values. A path coefficient is said to be significant if the Tstatistic value is> 1.96 or the
significance value / pvalue <0.05 with an error tolerance of 5%.
Analysis and Discussion
SEM-PLS analysis in this study is divided into 2 stages, namely, Outer model and inner
model. Outer model is used to see the relationship between indicators to latent variables,
indicators are able to measure variables well if criteria of validity and reliability are met while
Inner model is used to see the relationship between latent variables.
Outer Models
Outer models in this study used the Confirmatory Factor Analysis method.
Confirmatory Factor Analysis is used in latent variables that are reflective and have more than
one indicator. Confirmatory Factor Analysis is divided into 2 stages, namely validity and
reliability. The validity criteria are fulfilled if the loading value is more than 0.4 and the value of
Average Variance Extracted (AVE) is more than 0.5 while the reliability criteria are fulfilled if
the composite reliability value is more than 0.7

The Relationship of GCG, Company Size, Liquidity, Capital Structure, and Profitability with SEM-PLS
Effendi
___________________________________________________________________________
______________________________________________________________________________
102
© 2019 (9th) International Conference of the AGMS Proceedings
Table 1. Nilai Factor Loading
Variabel Laten Indicator Factor
Loading AVE CR
GCG (Good
Corporate
Governance)
Corporate Governance
Disclosure Index (CGDI) 1 1 1
Capital Structure
DER (Debt to Equity
Ratio), 0.876
0,675
DAR (Debt to Asset Ratio) 0.776 0.787
LTD (Long Term Debt) 0.812
Liquidty
CR (Current Ratio), 0.678
0,578
QR (Quick Ratio) 0.775 0.840
CTR (Cash Turnover
Ratio) 0.756
Profitability
ROA (Return on Asset) 0.786
0.654 0.761 ROE (Return on Ekuitas) 0.886
NPM (Net Profit Margin). 0.790
Table 1 informs that all values of the indicator loading factors of lGCG variables,
liquidity, capital structure and profitability are greater than 0.4 with AVE values> 0.5. so that it
can be concluded that each valid indicator measures its latent variables and criteria for the
validity of an indicator against its latent variables. Table 1 shows that all composite reliability
values of more than 0.7 percent indicate that reliable indicators measure their latent variables and
criteria for the reliability of an indicator against its latent variables are met. The results of
validity and reliability above can be concluded that each indicator can measure its latent
variables well. Next, an inner model analysis will be carried out to determine the significance of
each path between the latent variables of the fund to answer the research hypothesis
Inner Model
The inner model describes the relationship between latent variables. Inner model is
divided into 2 stages, namely hypothesis testing and coefficient of determination. In the
hypothesis test, the relationship of the variable is said to be significant if the value of P value <α
= 0.05 while the coefficient of determination is divided into three criteria, namely, the influence
between latent variables is strong if the R2> 0.67, moderate if the value is 0.33 <R2 ≤ 0.67 ,
weak if the value is 0.19 <R2 ≤ 0.33 and is very weak if the value of R2 is ≤ 0.19. The results of
the SEM-PLS using Warp-PLS are as follows:
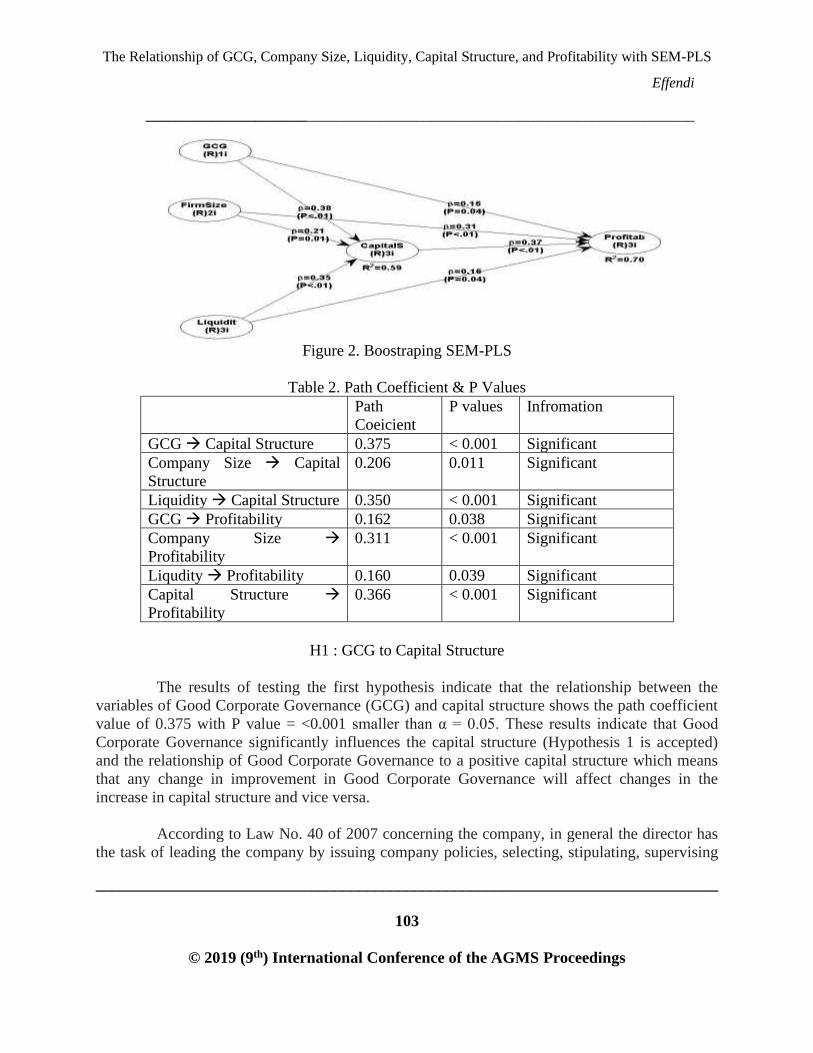
The Relationship of GCG, Company Size, Liquidity, Capital Structure, and Profitability with SEM-PLS
Effendi
___________________________________________________________________________
______________________________________________________________________________
103
© 2019 (9th) International Conference of the AGMS Proceedings
Figure 2. Boostraping SEM-PLS
Table 2. Path Coefficient & P Values
Path
Coeicient
P values Infromation
GCG → Capital Structure 0.375 < 0.001 Significant
Company Size → Capital
Structure
0.206 0.011 Significant
Liquidity → Capital Structure 0.350 < 0.001 Significant
GCG → Profitability 0.162 0.038 Significant
Company Size →
Profitability
0.311 < 0.001 Significant
Liqudity → Profitability 0.160 0.039 Significant
Capital Structure →
Profitability
0.366 < 0.001 Significant
H1 : GCG to Capital Structure
The results of testing the first hypothesis indicate that the relationship between the
variables of Good Corporate Governance (GCG) and capital structure shows the path coefficient
value of 0.375 with P value = <0.001 smaller than α = 0.05. These results indicate that Good
Corporate Governance significantly influences the capital structure (Hypothesis 1 is accepted)
and the relationship of Good Corporate Governance to a positive capital structure which means
that any change in improvement in Good Corporate Governance will affect changes in the
increase in capital structure and vice versa.
According to Law No. 40 of 2007 concerning the company, in general the director has
the task of leading the company by issuing company policies, selecting, stipulating, supervising

The Relationship of GCG, Company Size, Liquidity, Capital Structure, and Profitability with SEM-PLS
Effendi
___________________________________________________________________________
______________________________________________________________________________
104
© 2019 (9th) International Conference of the AGMS Proceedings
the duties of employees and section heads (managers), approving the company's annual budget,
submitting reports to shareholders on the company's performance. The company will choose a
funding policy through debt because it has a lower risk of the company than issuing shares and to
prevent moral hazard. Research conducted by Serghiescu (2014) concluded that the size of the
board of directors influences the capital structure.
An independent commissioner is a person appointed based on a GMS decision from an
unaffiliated party with a major shareholder, member of the board of directors and / or other
members of the board of commissioners. An independent commissioner is an outside company
that assesses the performance of the company and makes decisions for the progress of the
company, not for personal or group interests. The stronger the independent commissioner, the
greater the funding of capital, because it affects the decisions taken. Companies will choose debt
to be used as a source of funding for company capital because they have a smaller risk and to
prevent the occurrence of moral hazzard. In addition, independent commissioners also consider if
issuing shares, the interests of shareholders will increase. The independent commissioner will
provide the best advice and policies for the company such as the selection of capital.
Managerial ownership is share ownership by company management. Agency problems
will decrease because they are in harmony between the interests of shareholders and company
management. Managers have a large amount of information because they are within the
operational scope. The manager wants profits for the company as the manager itself and profits
as shareholders. Managers will choose debt to be used as a source of capital funding because it
has a smaller company risk and benefits managers as shareholders who are seen based on the
value of share ownership that is not reduced. The research conducted by Ismiyati (2004)
concluded that managerial ownership influences the capital structure
H2 : Company size of capital structure
The results of testing the second hypothesis indicate that the relationship of variables
The size of the company influences the capital structure shows the path coefficient value of
0.206 with a value of 0.011 smaller than α = 0.05. These results indicate that the size of the
company has a significant effect on capital structure (Hypothesis 2 is accepted) and the
relationship of firm size to positive capital structure which means that any change in the increase
in company size will affect changes in the increase in capital structure and vice versa.
Companies that experience high growth will need large capital. This is because large
companies have large funding needs and one alternative is to use funds from external funds. On
the contrary, the company in low sales growth, the need for capital is also small.

The Relationship of GCG, Company Size, Liquidity, Capital Structure, and Profitability with SEM-PLS
Effendi
___________________________________________________________________________
______________________________________________________________________________
105
© 2019 (9th) International Conference of the AGMS Proceedings
According to Mas'ud (2008) the larger the size of the company that is indicated by total
assets, the company will use large amounts of debt as well. The larger the size of the company
indicates that the company has a higher number of assets. Companies that are relatively large in
size will tend to use increasingly large external funds. This is because the funding needs also
increase along with the growth of the company. In addition to internal funding, the next
alternative is external funding. This is in line with the pecking order theory which states that, if
the use of internal funds is insufficient, the second alternative is to use debt. The results of this
study are supported by Seftianne and Handayani (2011), Verena and Mulyo (2013) indicating the
size of the company influences the capital structure. Different results from the Firnanti (2011)
study show that the size does not affect the capital structure.
H3 : Liquidity to apital Structure
The results of testing the third hypothesis show that the relationship of variable
liquidity with capital structure shows the path coefficient value of 0.350 with P value <0.001
smaller than α = 0.05. These results indicate that liquidity is significantly to the capital structure
(Hypothesis 3 is accepted) and the relationship of liquidity to a positive capital structure which
means that any change in the increase in liquidity will affect changes in the increase in capital
structure and vice versa.
Liquidity is a ratio used to measure a company's ability to pay short-term obligations
(Van Horne and Wachowicz, 2007). According to the Pecking order theory, companies that have
high liquidity will tend not to use debt financing because they have large funds for internal
funding. The use of alternative funding starts from the least risky securities, namely retained
earnings, debt, and the issuance of new shares. Retained earnings are reinvested in the hope of
increasing corporate profits in the coming year. Ozkan (2016) says that companies with large
liquid assets can use these assets to invest.
A high asset liquidity ratio can be considered by investors to be a positive signal
because it indicates that the company can fulfill its current obligations and is faced with a low
risk of bankruptcy. With large retained earnings, companies will prefer to use retained earnings
for company operations before using debt or issuing new shares.
Profits that are not distributed as dividends will be used for expansion which usually
means the purchase of assets. This is in accordance with the pecking order theory which says that
managers prefer to use financing with the first order retained earnings, then debt and the last sale
of new shares. Another consideration is that the direct costs of financing from within are those
that are detained cheaper than the cost of capital originating from the issuance of new shares
(Dermawan Sjahrial, 2008). Companies that have high liquidity means they have the ability to
pay debts.

The Relationship of GCG, Company Size, Liquidity, Capital Structure, and Profitability with SEM-PLS
Effendi
___________________________________________________________________________
______________________________________________________________________________
106
© 2019 (9th) International Conference of the AGMS Proceedings
H4 : Capital Structure to Profitability
The results of testing the third hypothesis indicate that the relationship of capital
structure variables with profitability shows the path coefficient value of 0.366 with P value
<0.001 smaller than α = 0.05. These results indicate that the capital structure has a significant
effect on profitability (Hypothesis 4 is accepted) and the relationship of capital structure to
positive profitability, which means that any changes in the increase in capital structure will affect
changes in increased profitability and vice versa.
Profitability is the level of net profit that the company can achieve when carrying out
its operations. Profitability reflects the company's ability to generate profits on the management
of company assets which is a comparison between earnings after tax and total assets. Profitability
can be interpreted as a return on capital investment. Companies with high rate of return tend to
use relatively small debt proportions. Because with a high rate of return, funding needs can be
obtained from retained earnings. Companies with high profitability will have more internal funds
than companies with low profitability. The higher profitability shows that the profits obtained by
the company are also high. If the company's profits are high, the company has a substantial
source of funds from within, so the company requires less debt. Besides that, if retained earnings
increase, the debt ratio will naturally decrease, assuming that the company does not add debt.
Conclusions and Suggestions
The results of this study indicate that in the GCG variable there is no Confirmatory
Factor Analysis because GCG is measured by one indicator. The results of the Confirmatory
Factor Analysis on liquidity variables, company size and profitability indicate that each indicator
is able to measure well the variables measured (valid and reliable). Hypothesis test results show
that the relationship of influence between significant variables namely, GCG on capital structure
(H1 is accepted), firm size on capital structure (H2 accepted) and liquidity on capital structure
(H3 accepted) and capital structure on profitability (H4 accepted). The results of the coefficient
of determination indicate that the effect of liquidity, firm size and GCG on the capital structure is
quite strong. Subsequent research can use other companies so that it can be a comparison to other
company sector conditions and can review the mediation of capital structures on the relationship
of liquidity, GCG and company size to profitability.

The Relationship of GCG, Company Size, Liquidity, Capital Structure, and Profitability with SEM-PLS
Effendi
___________________________________________________________________________
______________________________________________________________________________
107
© 2019 (9th) International Conference of the AGMS Proceedings
Reference
Brigham, E. F & Houston, J.F. (2011). Fundamentals of Financial Management. Edition 11st.
Erlangga. Jakarta.
Dwilestari, A. (2010). Effect of Asset Structure, Growth, and Liquidity on the Company's
Capital Structure. Jurnal Riset Akuntansi dan Keuangan. Vol. 6 (2), pp. 153-165.
Firnanti, F (2011). Factors Affecting the Capital Structure of Manufacturing Companies in the
Indonesia Stock Exchange. Jurnal Bisnis dan Akuntansi. Vol. 13(2), pp. 119-128.
Gitman, L. J. (2003). Principles of Manajerial Finance , International Edition, 10th edition,
Pearson Education, Boston.
Hadianto, B & Tayana, C. (2010). The Effect of Systematic Risk, Asset Structure, Profitability
and Company Types on the Capital Structure of Mining Sector Issuers: Testing the Static-
Trade off Hypothesis. Jurnal Akuntansi, Vol. 2(1), pp.15-39.
Horne, V, James C. and John M. W. (2007). Fundamentals of Financial Management, Principles
of Financial Management. Jakarta : Salemba Empat.
Keown A, J, (2010). Fundamentals of Financial Management. Jakarta: Salemba Empat.
Liwang, F.P. (2011). Analysis of Factors Affecting Capital Structure and Its Impact on Stock
Prices in Companies Incorporated in LQ45. National Seminar on Information Technology
and Applied Communication.
Mas’ud, M. (2008). Analysis of Factors Affecting Capital Structure and Its Relationship to
Company Values. Manajemen dan Bisnis. Vol. 7(1).
Nasif, O, Cakan, S and Kayacan, M. (2016). Intellectual Capital and Financial Performance : A
study of the Turkish Banking Sector. Borsa Instanbul Review
Sari, D.V & Haryanto, A.M. (2013). Effect of Profitability, Asset Growth, Company Size, Asset
Structure and Liquidity on Capital Structure in Manufacturing Companies in Indonesia
Stock Exchange 2008 – 2010. Diponegoro Journal Of Management. Vol 2(3), pp. 1.
Sartono, A. (2001). Financial Management Theory and Application. Yogyakarta: BPEF-
Yogyakarta.

The Relationship of GCG, Company Size, Liquidity, Capital Structure, and Profitability with SEM-PLS
Effendi
___________________________________________________________________________
______________________________________________________________________________
108
© 2019 (9th) International Conference of the AGMS Proceedings
Seftianne & Handayani, R. (2011). Factors Affecting Capital Structure in Public Manufacturing
Companies. Jurnal Bisnis dan Akuntansi. Vol.13(1), pp. 39-56.
Shleifer, A & R.W. Vishny. (1997). A Survey of Corporate Governance. Journal of Finance. Vol.
52 (2), pp. 737-783.
Sjahrial, D. (2009). Financial management 3th. Jakarta: Mitra Wacana Media.
Wimelda & Marlinah, (2013). Variables that Influence Capital Structure in Public Companies in
the Non-Financial Sector . Media Bisnis, Vol 5(3), pp. 200-213.

The factors that influence financial distress of Indonesia manufacturing company
Ulum and Nugroho Jati
___________________________________________________________________________
______________________________________________________________________________
109
© 2019 (9th) International Conference of the AGMS Proceedings
The factors that influence financial distress of Indonesia manufacturing company
Achmad Saiful Ulum and Agustinus Kismet Nugroho Jati
STIE Perbanas Surabaya
Jl. NgindenSemolo No. 34-36, 60118,
Surabaya, Indonesia
Abstract
This research is a quantitative research to determine which independent variables are the most
significant influential in determining the condition of financial distress in the manufacturing
company. The sample of this study is the Manufacturing Industry listed on the Indonesia Stock
Exchange in the period of 2012-2016. The sampling technique was purposive sampling
technique, which is selecting samples based on predetermined criteria. The variables that will be
observed by researchers in examining the effect of financial ratios to predict financial distress
conditions in manufacturing companies are the dependent variables, namely financial distress
(Y) and independent variables, that is liquidity (X1), leverage (X2), Firm Size (X4), Profitability
(X6), Managerial Ownership (X7), Institutional Ownership (X8). The results showed that the
logistic regression conformity test was significant. This indicates that logistic regression is able
to predict the company's financial distress in the study period. Hypothesis test results show that
the variables that influence the company's financial distress are leverage, profitability and
institutional. While variables that do not affect the company's financial distress are liquidity, firm
size and managerial ownership. The results showed that the logistic regression conformity test
was significant, this indicates that logistic regression is able to predict the company's financial
distress in the study period. Hypothesis test results show that the variables that influence the
company's financial distress are leverage, profitability and institutional. while variables that do
not affect the company's financial distress are liquidity, firm size and k. managerial. The results
of the accuracy of the model calcification amounted to 76.4%, this indicates that the model can
precisely predict the manufacturing distress of the manufacturing company in the study period of
76.4% or 422 of the 552 observational data. Furthermore, it can add independent variable
variables that are considered capable of predicting company financial distress and also use other
statistical analysis methods that allow more accurate predictions of corporate financial distress
Keywords: Financial Distress, Manufacturing, Logistic Regression

The factors that influence financial distress of Indonesia manufacturing company
Ulum and Nugroho Jati
___________________________________________________________________________
______________________________________________________________________________
110
© 2019 (9th) International Conference of the AGMS Proceedings
INTRODUCTION
At present conditions economic and business developments are characterized by high
levels of competition. In this case, the manager or executive must understand and predict the
condition of the company in the future. It is intended that the company can survive in the long
term and avoid bankruptcy. Some companies that have operated within a certain period of time
often experience bankruptcy due to financial difficulties.
The phenomenon that occurred in Indonesia especially in manufacturing companies in
2015 there were 2 companies that experienced delisting including the PT. Davomas Abadi, Tbk
(DAVO), and PT. Unitex, Tbk (UNTX). In 2017 there is 1 delisting manufacturing company
namely PT. Sorini Agro Asia Corporindo, Tbk (SOBI). PT. Davomas Abadi, Tbk (DAVO) is a
company engaged in cocoa producers who entered the food and beverage sector officially
resigned from the Indonesia Stock Exchange in January 2015. The company resigned because it
was considered to worry about its financial condition. The last few years in the company's
financial statements recorded in the balance sheet show that the equity value is negative, this is
due to an operational loss that has an impact on the company's dividend distribution which will
later be received by the shareholders. In this case it shows that the condition of the company is
experiencing financial difficulties so that later it will impact bankruptcy With the existence of a
company that is delisted from the exchange, it is important for a manager to predict the condition
of financial difficulties which can be known by the company's financial decline in paying off its
obligations prior to liquidation (Widarjo & Setiawan, 2009). According to Rodoni and Ali (2010:
176) to find out the financial condition of the company there are three interrelated conditions as
the cause of financial difficulties, namely insufficient capital, large debt costs and interest, and
suffer losses.
Predicting the condition of financial difficulties of a company can be known by
analyzing financial statements using financial ratios. Financial ratios are a form of financial
statements that describe the company's performance. In this case the financial statements can
provide information and prospects for the company's condition in the future. Based on signaling
theory, if the results of financial statement analysis show good financial performance of the
company, then the company can provide a good signal to external parties such as investors and
creditors.
Widarjo & Setiawan (2009) there are two reasons for conducting research on financial
distress prediction in companies, the first is to examine the relationship and influence between
financial factor variables and measurement of failure or bankruptcy, while the second is to
develop models in forecasting or bankruptcy predictions.

The factors that influence financial distress of Indonesia manufacturing company
Ulum and Nugroho Jati
___________________________________________________________________________
______________________________________________________________________________
111
© 2019 (9th) International Conference of the AGMS Proceedings
Rahayu & Winarti (2016) the development of financial security models is important to
do because the signs of a company before going bankrupt will surely experience financial
difficulties. In this case financial difficulties must be predicted from the start by taking action to
anticipate the occurrence of bankruptcy. In detecting financial difficulties, namely by using a
particular model which of the detection models can help investors or creditors in determining
investment decisions.
According to Lin, Liang and Chen (2011) Factors that influence the prediction of
Financial Distress are the variables used. With the many differences in predictor variables tersut
it will give different results. Most of the studies that predict Financial Distress use more financial
variables, but there are several non-financial variables that can also provide influence in
providing research results.
Most of the research on Financial Distress uses financial ratio variables obtained from the
company's financial statements per year. According to Sun, He and Li (2011) a relatively long
period is to predict within a period of one year, while predictions made less than one year or
shorter are still a small part done. Previous research according to Umi Zhahratun, Budi, and
Stefanus (2013) in the study entitled Financial Distress prediction models in Go Public
manufacturing companies in Indonesia that use financial variables, non-financial variables, and
macroeconomic variables with SVM and LDA processing techniques that result in variable
which significantly affects financial difficulties are financial and non-financial variables while
macroeconomic variables do not contribute.
LITERATURE REVIEW
Financial Distress
Part of a financial reporting process is the definition of financial statements according
to SAK No.1. All transactions that occur during one period will be recorded and reported, so that
functionally, financial statements are one of the media of communication to the parties who have
interests in the company that contain financial information of the company. Financial statements
are important for stakeholders, including investors, including knowing the health of the company
or predicting financial difficulties using financial ratios.
Much of the research that has been done relates to the health of the company and
financial difficulties. The ability of a company to operate its business will be reflected through
the health of the company itself, besides that it can also see the potential for bankruptcy. The

The factors that influence financial distress of Indonesia manufacturing company
Ulum and Nugroho Jati
___________________________________________________________________________
______________________________________________________________________________
112
© 2019 (9th) International Conference of the AGMS Proceedings
potential for bankruptcy arises due to financial difficulties which if left untreated will lead to
bankruptcy.
Agency Theory
Issues of interest arise because of differences in interests that arise between
management and the owners of capital. In the perspective of agency theory, management should
have an interest in prospering the owner because management is an agent of the owner, but
because of the risks that must be borne by management, they will also consider their importance
in decision making (Hardiningsih and Meita, 2012).
Managers have different personal goals and compete with the company's goals of
maximizing the prosperity of shareholders (Brigham and Houston, 2006). Company owners give
managers the power to make a decision. This actually creates a potential conflict of interest
called agency theory. Brigham and Houston (2006) state that agency problems arise when
company managers have less than 100% of the company's shares.
Liquidity with Financial Distress
Liquidity is the ability of a company to pay off its short-term obligations. Research
conducted by Almilia and Kritijadi (2003), shows that the more liquid a company is, the more
probabilities the company will avoid financial distress.
H1 : Liquidity has a negative effect on financial distress
Financial Leverage with Financial Distress
In practice, the source of corporate funding is divided into two, debt capital (debt
capital) and own capital (equity capital) (Gitman, 2000). Funding needs to run company
activities are carried out with a variety of reasons, one of which is due to non-fulfillment of the
needs of funds originating from internal companies in the form of retained earnings
The form of funding from debt certainly has costs in the form of loan interest. The
bigger the debt, the higher the loan interest or interest expense. Based on research conducted by
Seoki et al (2010), it shows that the higher the level of leverage of the company, the higher the
probability of companies experiencing financial distress.
H2: Financial leverage has a positive effect on financial distress
Firm Size to Financial Distress
Company size is a description of the size of a company (Brigham and Houston, 2011).
Large companies tend to have better ability to maintain their level of liquidity because assets
The factors that influence financial distress of Indonesia manufacturing company
Ulum and Nugroho Jati
___________________________________________________________________________
______________________________________________________________________________
113
© 2019 (9th) International Conference of the AGMS Proceedings
owned can be used as collateral. Besides that, companies that have large total assets will easily
diversify so that the probability of companies going bankrupt will be smaller.
H3 : Company size has a negative effect on financial distress
Profitability with Financial Distress
Profitability provides a measure of the level of management effectiveness of a
company, because it shows the ability of profits generated from sales and investment income
(Kasmir, 2012: 197). There are several ratios used to measure profitability, among others, profit
margin on sales, return on total assets, basic earnings power, and return on equity. Research
conducted by Andre (2009) states that the level of profitability has a significant effect on
financial distress. Hapsari's research (2012) shows that profitability has a negative and
significant effect on financial distress. The same thing was also revealed in the results of research
by Widarjo and Doddy (2009).
H4 : Profitability has a negative effect on financial distress
Managerial Ownership with Financial Distress
Managerial ownership is the company's share ownership by the management of the
company (Hartaro and Atahau, 2007). Sujoko and Soebiantoro (2007) revealed that managerial
ownership is the ownership of the company's shares by management which is measured in the
percentage of the number of shares held.
Emiraldi (2007) states that the greater the number of managerial ownership, the greater
the probability of decreasing financial distress potential. In other words, the more the percentage
of share ownership by management will reduce the potential for financial distress.
H5 : Managerial ownership has a negative effect on financial distress
Institutional Ownership with Financial Distress
A high level of ownership by institutions in a company will lead to greater oversight
efforts. This great supervision will directly or indirectly oversee the manager's performance from
decisions that are not in accordance with the interests of the company, in this case the owners of
the company.
Supervision carried out on the management side in carrying out the company's
operations will create opportunities for smaller financial distress (Parulian, 2007). This is also
supported by research conducted by Emiraldi (2007) which states that institutional ownership has
a negative influence on financial distress.
H6 : Institutional ownership has a negative effect on financial distress
The factors that influence financial distress of Indonesia manufacturing company
Ulum and Nugroho Jati
___________________________________________________________________________
______________________________________________________________________________
114
© 2019 (9th) International Conference of the AGMS Proceedings
RESEARCH METHODOLOGY
This research is a type of quantitative research to determine which independent variables are the
most significant influential in determining the condition of financial distress in the company.
This research was conducted on the Manufacturing Industry listed on the Indonesia Stock
Exchange in the period 2012-2016. The object of this research is financial distress. The
population in this study are companies in the manufacturing industry listed on the Indonesia
Stock Exchange in the period 2012-2016. The annual financial statements and summary of
company performance in the period 2012-2016 are used for the calculation of the dependent
variable as a determinant of financial distress. The sampling technique in this study used
purposive sampling technique, namely by selecting samples based on predetermined criteria.
The following are the criteria determined by the researcher for sampling:
1. Companies in manufacturing industries that have been listed on the Indonesia Stock
Exchange in the period 2012-2016
2. Has published annual financial reports and annual reports that are complete in accordance
with the needs of researchers relating to financial ratios with financial statements ending on
31 December and the number of institutional ownership and managerial ownership.
3. Companies included in the manufacturing industry listed on the Indonesia Stock Exchange
in 2012-2016 which presented their financial statements in rupiah.
The variables that will be observed by researchers in examining the effect of financial ratios to
predict financial distress conditions in manufacturing companies are the dependent variables
namely financial distress (Y) and independent variables namely liquidity (X1), Laverage (X2),
Firm Size (X4), Profitability (X6), Managerial Ownership (X7), Institutional Ownership (X8)
Financial Distress
Financial distress is a condition faced by a company if the company experiences
financial difficulties in fulfilling its obligations, which causes the company to suffer losses
continuously. In this study the financial distress criteria are based on the argument that if the
company experiences losses for two consecutive years it shows that the company is not good
enough. If the company continues to leave these conditions without improvement, the impact
that must be received by the company is even worse (bankruptcy). The indicator used is pre-tax
profit, due to avoidance.
Liquidity
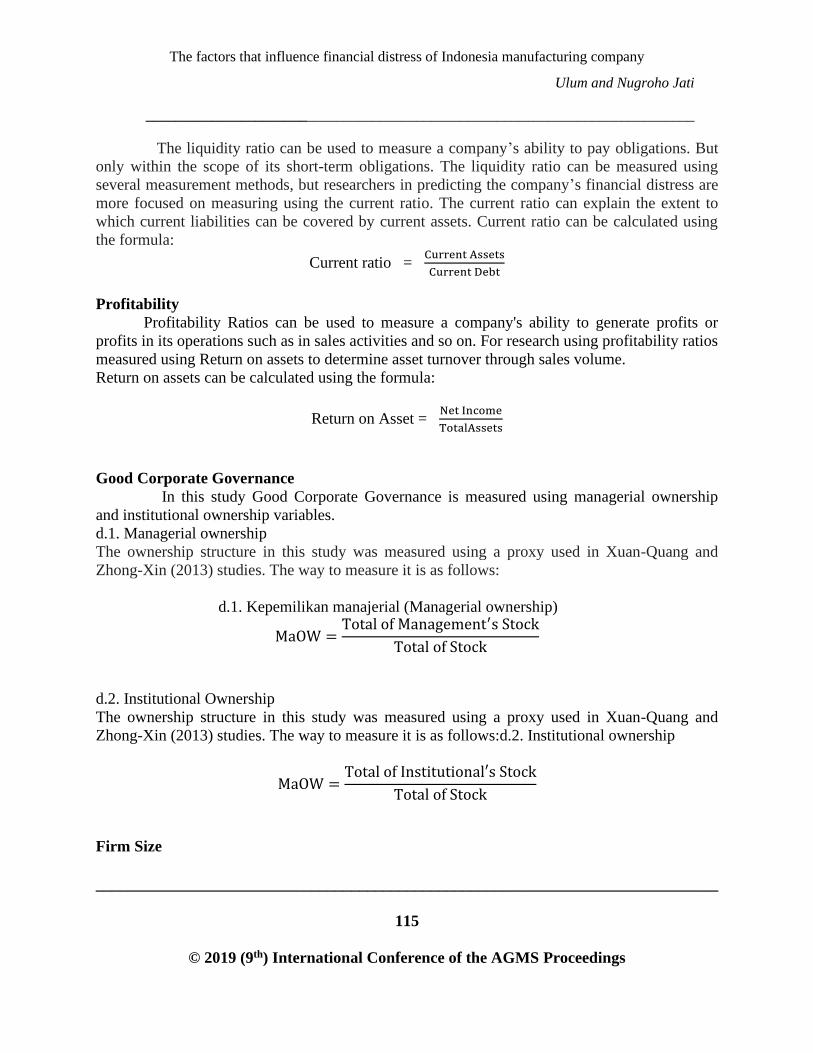
The factors that influence financial distress of Indonesia manufacturing company
Ulum and Nugroho Jati
___________________________________________________________________________
______________________________________________________________________________
115
© 2019 (9th) International Conference of the AGMS Proceedings
The liquidity ratio can be used to measure a company’s ability to pay obligations. But
only within the scope of its short-term obligations. The liquidity ratio can be measured using
several measurement methods, but researchers in predicting the company’s financial distress are
more focused on measuring using the current ratio. The current ratio can explain the extent to
which current liabilities can be covered by current assets. Current ratio can be calculated using
the formula:
Current ratio = Current Assets
Current Debt
Profitability
Profitability Ratios can be used to measure a company's ability to generate profits or
profits in its operations such as in sales activities and so on. For research using profitability ratios
measured using Return on assets to determine asset turnover through sales volume.
Return on assets can be calculated using the formula:
Return on Asset = Net Income
TotalAssets
Good Corporate Governance
In this study Good Corporate Governance is measured using managerial ownership
and institutional ownership variables.
d.1. Managerial ownership
The ownership structure in this study was measured using a proxy used in Xuan-Quang and
Zhong-Xin (2013) studies. The way to measure it is as follows:
d.1. Kepemilikan manajerial (Managerial ownership)
MaOW =Total of Management′s Stock
Total of Stock
d.2. Institutional Ownership
The ownership structure in this study was measured using a proxy used in Xuan-Quang and
Zhong-Xin (2013) studies. The way to measure it is as follows:d.2. Institutional ownership
MaOW =Total of Institutional′s Stock
Total of Stock
Firm Size

The factors that influence financial distress of Indonesia manufacturing company
Ulum and Nugroho Jati
___________________________________________________________________________
______________________________________________________________________________
116
© 2019 (9th) International Conference of the AGMS Proceedings
This activity ratio can measure how the company's activities so far include the activities
of companies in sales, purchases, and so on. In predicting financial distress conditions
researchers measure using activity ratios as measured by sales to total assets that can describe
total assets turnover seen from the volume of sales or describe the extent of the ability of all
assets to create sales.
Sales to total assets can be calculated using the formula:
Sales to total assets = Sales
total assets
ANALYSIS AND DISCUSSION
Compatibility Test of the Logistic Regression Model
Suitability test of logistic regression model to find out whether the model is feasible to
use and further analysis can be carried out. The compatibility test of the logistic regression model
consists of 3 tests namely the Hosmer and Lemeshow's test Goodness of Fit Test, the Omnibus
Test of Model Coefficient and -2 log likelihood.
Table 1. Uji -2 log likelihood.
Iteration
-2 Log
likelihoo
d
Coefficients
Const
ant
Likui
ditas
Lever
age
Firm
Size
Profitab
ility
K.
Manaje
rial
K.
Institusi
onal
Step
1
1 574.585 -
1.675
-.326 .424 -.055 .206 .048 -.149
2 569.092 -
2.120
-.388 .549 -.061 .285 .064 -.224
3 569.010 -
2.180
-.391 .565 -.060 .296 .065 -.237
4 569.010 -
2.181
-.391 .565 -.060 .296 .065 -.237
a. Method: Enter
b. Constant is included in the model.
c. Initial -2 Log Likelihood: 597.863
d. Estimation terminated at iteration number 4 because parameter estimates changed by less than
.001.

The factors that influence financial distress of Indonesia manufacturing company
Ulum and Nugroho Jati
___________________________________________________________________________
______________________________________________________________________________
117
© 2019 (9th) International Conference of the AGMS Proceedings
The test results of the model suitability test with 2 log likelihood indicate that the
model is feasible to use which means that the model is able to predict the company's financial
distress. Test of suitability of the model can also be seen from the value of the omnibus test and
presented in the table as follows:
Table 4.2. Omnibus Tests of Model Coefficients
Chi-square df Sig.
Step 1 Step 28.854 6 .000
Block 28.854 6 .000
Model 28.854 6 .000
The omnibus test table informs that the significance value of the Omnibus test is less
than 0.05, this can be concluded that the model is feasible to use which means that the model is
able to predict the company's financial distress. Test the suitability of the model can also be seen
from the Hosmer and Lemeshow test and presented in the table as follows:
Table 4.3 Hosmer and Lemeshow Test
Step Chi-square df Sig.
1 11.525 8 .174
The Hosmer and lemeshow test tables inform that the significance value of the Hosmer
test and the free test test is more than 0.05, this can be concluded that the model is feasible to use
which means that the model is able to predict the company's financial distress
Hypothesis Testing
This test is used to determine the effect of independent variables on dependents by using
an error tolerance value of 5%. The research hypothesis is accepted if the independent variable
significance value is less than 0.05. The results of hypothesis testing using logistic regression are
presented in the table as follows:
Table 4.4. Hypothesis testing
B Sig. Exp(B) Keterangan
Step 1a Likuiditas -.391 .060 .677 Not Significant
Leverage .565 .003 1.759 Significant
Firm Size -.060 .348 .942 Not Significant

The factors that influence financial distress of Indonesia manufacturing company
Ulum and Nugroho Jati
___________________________________________________________________________
______________________________________________________________________________
118
© 2019 (9th) International Conference of the AGMS Proceedings
Profitabilitas .296 .022 1.345 Significant
Manajerial. O .065 .309 1.067 Not Significant
Institusional.
O
-.237 .009 .789 Significant
Constant -2.181 .000 .113
H1 : Liquidity Influence on financial distress
Based on the results of the study, it shows that the current ratio has a regression
coefficient of -0,391 with a significance level of 0.060> 0.05, so that it can be concluded in this
study that liquidity does not significantly influence the Company's financial distress condition.
Furthermore, it can be concluded that H1 is rejected.
The liquidity ratio shows the company's ability to pay off its short-term debt /
liabilities. This ratio is calculated from working capital, namely current assets and current debt.
The liquidity ratio includes the current ratio, quick ratio and the ratio of cash to current assets.
Current ratio describes the ability of a company to pay off its short-term debt with current assets.
This ratio can be calculated by comparing between current assets divided by current debt. The
greater the value of the current ratio, the less likely the company to experience financial distress
because the company has a number of liquid assets such as cash or money used to pay off its
debt and finance its operational activities both in the transaction period and future period so that
the company does not experience financial difficulties or threatened the continuity of its
business.
The results of this study indicate that the current ratio does not have a significant effect
on financial distress. Based on the results of logistic regression and descriptive statistics of the
current ratio and financial distress, it shows that the current ratio tends to fluctuate while
financial distress increases. A high current ratio signifies the company's high ability to pay off its
current debt using its smooth assets. The results of this study are in line with the research
conducted by Hapsari (2012), Widarjo and Setiawan (2009), Mas'ud and Srengga (2012) and
Widhiari and Aryani (2015) which state that the current ratio does not significantly influence
financial distress. However, it is different from the research conducted by Istiantoro and
Indrawati (2015) and Ray (2011) which states that the current ratio has a significant effect on the
condition of financial distress.
H2 : Leverage Influence onfinancial distress
Based on the results of the study, it shows that the debt ratio has a regression
coefficient of 0.565 with a significance level of 0.003 <0.05, so it can be concluded in this study

The factors that influence financial distress of Indonesia manufacturing company
Ulum and Nugroho Jati
___________________________________________________________________________
______________________________________________________________________________
119
© 2019 (9th) International Conference of the AGMS Proceedings
that leverage has a significant effect on predicting financial distress. Furthermore, it can be
concluded that H2 is accepted.
In practice, the source of corporate funding is divided into two, debt capital (debt
capital) and own capital (equity capital) (Gitman, 2000). Funding needs to run company
activities are carried out with a variety of reasons, one of which is the lack of fulfillment of funds
from internal companies in the form of retained earnings.
The form of funding from debt certainly has costs in the form of loan interest. The
bigger the debt, the higher the loan interest or interest expense. Based on the research conducted
by Seoki et al (2010), it shows that the higher the level of leverage of the company, the higher
the probability of companies experiencing financial distress
H3 : Firm Size Influence on financial distress
Based on the results of the study, it shows that Firm Size has a regression coefficient of
-0.060 with a significance level of 0348> 0.05, so that it can be concluded in this study that Firm
Size has no significant effect in predicting financial distress conditions. Furthermore, it can be
concluded that H3 is rejected.
Company size is a description of the size of a company (Brigham and Houston, 2011).
Large companies tend to have better ability to maintain their level of liquidity because assets
owned can be used as collateral. Besides that, companies that have large total assets will easily
diversify so that the probability of companies going bankrupt will be smaller.
H4 : Profitability Influence on financial distress
Based on the results of the study, it shows that Profitability has a regression coefficient
of 0.296 with a significance level of 0.022 <0.05, so that it can be concluded in this study that
Profitability has a significant effect in predicting financial distress conditions. Furthermore, it
can be concluded that H4 is accepted.
This profitability ratio shows the company's ability to generate profits. this ratio is also
often called the operating ratio. The profitability ratio is the profit margin, return on assets, return
on total assets and return on equity. The smaller the value of return on assets can be made
possible by the company's performance is less effective in processing assets owned to generate
profits so that it can cause losses that result in negative cash flow and the company will
experience financial distress if it occurs within a few years. This is due to an imbalance between
operating expenses and income generated
.

The factors that influence financial distress of Indonesia manufacturing company
Ulum and Nugroho Jati
___________________________________________________________________________
______________________________________________________________________________
120
© 2019 (9th) International Conference of the AGMS Proceedings
The results of this study indicate that return on assets have a significant effect on
financial distress. Based on the results of logistic regression and descriptive statistics of return on
assets and financial distress, it shows that return on assets tends to decrease while financial
distress increases. Decreasing return on assets is due to the relatively small increase in net
income obtained by companies every year, not comparable to the relatively high number of
assets each year. The results of this study are in line with the research conducted by Hapsari
(2012), Widarjo and Setiawan (2009), Mas'ud and Srengga (2012), Ray (2011) and Gong, Bose
and Chen (2015) which state that return on assets has a significant effect towards financial
distress conditions. However, different from the research conducted by Istiantoro and Indrawati
(2015) which stated that return on assets did not significantly influence financial distress
conditions.
H5 Manjerial O Influence on financial distress
Based on the results of the study, it shows that K. Manjerial has a regression coefficient
of 0.065 with a significance level of 0.309> 0.05, so it can be concluded in this study that K.
Manjerial has no significant effect in predicting financial distress conditions. Furthermore, it can
be concluded that H5 is rejected
Managerial ownership is the company's share ownership by the management of the
company (Hartaro and Atahau, 2007). Sujoko and Soebiantoro (2007) revealed that managerial
ownership is the ownership of the company's shares by management which is measured in the
percentage of the number of shares held.
Emiraldi (2007) states that the greater the number of managerial ownership, the greater
the probability of decreasing financial distress potential. In other words, the more the percentage
of share ownership by management will reduce the potential for financial distress.
H6 : Institusional O. Influence on financial distress
Based on the results of the study, it shows that Institutional K. has a regression
coefficient of -0.237 with a significance level of 0.009 <0.05, so it can be concluded in this study
that Institutional K. has a significant effect in predicting financial distress conditions.
Furthermore, it can be concluded that H6 is accepted.
A high level of ownership by institutions in a company will lead to greater oversight
efforts. This great supervision will directly or indirectly oversee the manager's performance from
decisions that are not in accordance with the interests of the company, in this case the owners of
the company.

The factors that influence financial distress of Indonesia manufacturing company
Ulum and Nugroho Jati
___________________________________________________________________________
______________________________________________________________________________
121
© 2019 (9th) International Conference of the AGMS Proceedings
Supervision carried out on the management side in carrying out the company's
operations will create opportunities for smaller financial distress (Parulian, 2007). This is also
supported by research conducted by Emiraldi (2007) which states that institutional ownership has
a negative influence on financial distress
Accuracy of Model Classification
The classification of the model's accuracy shows the accuracy of the model in
predicting the company's finances while the results of the classification of the model's accuracy
are presented in the table as follows
Tabel 4.5 Model Classification
Observed
Predicted
Banking Conditions Percentage
Correct 0 1
Step 1 Banking
Conditions
0 416 8 98.1
1 122 6 4.7
Overall Percentage 76.4
The table above informs that the model is able to predict manufacturing companies that
do not experience financial distress of 416 / (416 + 8) = 98.1%. The model is able to predict
manufacturing companies that experience finacial distress of 6 / (6 + 122) = 4.7%. The accuracy
of the model predicts overall corporate financial distress of (416 + 6) / (416 + 6 + 122 + 8) =
76.4%. Thus it can be concluded that the model correctly predicts financial distress of
manufacturing companies in the study period of 76.4%, namely, 422 of 552 companies.
CONCLUSIONS AND SUGGESTION
The results showed that the logistic regression conformity test was significant, this
indicates that logistic regression is able to predict the company's financial distress in the study
period. Hypothesis test results show that the variables that influence the company's financial
distress are leverage, profitability and institutional. while variables that do not affect the
company's financial distress are liquidity, firm size and k. managerial. The results of the
accuracy of the model calcification amounted to 76.4%, this indicates that the model is able to
predict precisely the manufacturing distress of the manufacturing company in the study period of
76.4% or 422 of the 552 observational data. Furthermore, it can add independent variable

The factors that influence financial distress of Indonesia manufacturing company
Ulum and Nugroho Jati
___________________________________________________________________________
______________________________________________________________________________
122
© 2019 (9th) International Conference of the AGMS Proceedings
variables that are considered capable of predicting company financial distrees and also use other
statistical analysis methods that allow more accurate predictions of corporate financial distress.

The factors that influence financial distress of Indonesia manufacturing company
Ulum and Nugroho Jati
___________________________________________________________________________
______________________________________________________________________________
123
© 2019 (9th) International Conference of the AGMS Proceedings
REFERENCE
Agusti, C.P. (2013). Analysis of Factors Affecting the Possibility of Financial Distress. Essay.
Bachelor of Economics and Business Bachelor Program Universitas Diponegoro.
Almilia, Ls.(2006). Prediction of the condition of financial distress of companies going public by
using multinominal logit analysis. Jurnal Ekonomi dan Bisnis. Vol 7(1).
Eliu, V. (2014). Effect of Financial Leverage and Firm Growth on Financial Distress.Jurnal
Finesta, Vol. 2(2), pp. 6-11.
Evanny, I.H. (2012). Strength of Financial Ratio in Predicting the Conditions of Financial
Distress of Manufacturing Companies on the IDX. Jurnal Dinamika Manajemen.
Vol.3(2).
Geng, B. I. (2015). Prediction of Financial Distress: An Empirical Study of Listed Chinese
Companies Using Data Mining. European Journal of Operating Research, Vol. 241(1),
pp. 236-247.
Imam, M.. & Reva, MS. (2012). Financial Ratio Analysis to Predict the Condition of Financial
Distress of Manufacturing Companies Listed on the Indonesia Stock Exchange. Jurnal
Akuntansi Universitas Jember, Vol.10(2).
Gozali, I. (2013). Multivariate with the Spss Program. Semarang: Badan Penerbit Universitas
Diponegoro.
Jalu, Nasa Istiantoro. (2015). Effect of Financial Ratio on the Condition of Financial Distress
(Study of Textile Companies and Garments Registered on the IDX). Jurnal Ilmiah
Mahasiswa FEB , Vol.3(2).
Kasmir. (2014). Analysis of Financial Statements. Jakarta: PT. Rajawali.
Lee, S.K. (2011). Moderating Effect Capital Intensity on The Relationship Between Leverage
and Financial Distress in The U.S. Restaurant Industry. International Journal of
Hospitality Management. Vol.30(2), pp. 429-438.
Munawir. (2004). Analysis of Financial Statements. Yogyakarta: Liberty.

The factors that influence financial distress of Indonesia manufacturing company
Ulum and Nugroho Jati
___________________________________________________________________________
______________________________________________________________________________
124
© 2019 (9th) International Conference of the AGMS Proceedings
Nasser & Aryati. (2002) . Camel Analysis Model to Predict Financial Distress in the Banking
Sector that Goes Public. Jurnal Akuntansi dan Auditing Indonesia, Vol. 5(2), Pp: 111-
127.
Made, N.L, Widhiari,A., Lely, N.K., and Merkusiwati, L. (2015). Effect of Liquidity Ratio,
Leverage, Operating Capacity, and Sales Growth on Financial Distress. E-Jurnal
Akuntansi Universitas Udayana , Vol.11(2), pp. 456-469.
Platt, H. D., & Platt, M. B. (2002). Predicting Corporate Financial Distress: Reflection on
Choice- Based Sample Bias. Journal of Economics and Finance, Vol.26(2), Pp. 184-199.
Rahmadani, Sujana and Darmawan. (2014). Effect of Liquidity Ratios, Profitability Ratios,
Economic Profit Ratio and Leverage Ratio on Financial Distress Predictions (Case Study
in the Banking Sector on the Indonesia Stock Exchange Period 2009-2013). E-Journal S1
Ak Universitas Pendidikan Ganesha , Vol. 2.(1).
Ray, S. (2011). Assessing Corporate Financial Distress in Automobile Industry of India : An
Application of Altman’s Model. Research Journal of Finance And Accounting, Vol. 2(3),
pp.155-168.
Schmuk, M. (2013). Financial Distress and Corporate Turnaround, An Empirical Analysis of The
Automotive Supplier Industry. Germany: Springer Gabler.
Sofyan, S. H. (2011). Accounting Theory. PT. Raja Grafindo Persada: Jakarta. 2009. Jakarta:
Kencana.
Widarjo, W., and Setiawan, D. (2009). Effect of Financial Ratios on the Condition of Financial
Distress in Automotive Companies. Jurnal Bisnis dan Akuntansi, Vol. 11(2), Pp. 107-
119.

Complexity Concepts in Market Dynamics; the Evolution of Market Alliances
Ulum and Nugroho Jati
___________________________________________________________________________
______________________________________________________________________________
125
© 2019 (9th) International Conference of the AGMS Proceedings
Complexity concepts in market dynamics; the evolution of market alliances
Tamas Michel Koplyay, Ph.D.
Hamed Motaghi, Ph.D. (Corresponding Author)
Hilda Hurta, Ph.D.
Abstract
Market alliances accompany firms during the evolution of the lifecycle and undergo serious
structural transformations from early market ecosystems to late stage value chains. This happens
in an orderly fashion that facilitates the adaptation of the firms to market conditions and
witnesses a migration of complexity from the alliances into the firms. In a sense complexity
migrates from the market into the firm and its immediate neighborhood, such as the value chain.
At some point the firm strategic independence is subsumed by its parent coalition. Along the way
many interesting concepts of complexity arise such as symmetry, random signal-based
adaptation, loose and tight environmental fit, risk mitigation and ability to fend off shock
loading.
This article will examine the principal complexity issues related to this process of market
evolution and significant reasons behind the adaptation logic that correlates with this process.
Key words: Complexity, Market Dynamics, Market Alliances, Structural Transformation

Complexity Concepts in Market Dynamics; the Evolution of Market Alliances
Ulum and Nugroho Jati
___________________________________________________________________________
______________________________________________________________________________
126
© 2019 (9th) International Conference of the AGMS Proceedings
Introduction
The market appears to function at two distinct levels, the deep and the surface structures,
where the deep structure is defined by the succeeding customer profiles, creates a certain
dynamic of its own (Dobni, C. B., & Luffman, G. (2003)).
Above the deep structure unfolds the surface structure that has a series of crisis points for
the firms, where these are swallowed up progressively at a higher rate into grey holes of deeper
colors and more irreversible nature until the whole market disappears in to black hole which
marks the end of the market.
At the beginning is the white hole that spews firms into the attractive market. This
attractiveness is tied to the high promise of market size, growth, customer price inelasticity and
relative absence of competitors, sort of a blue ocean, although entry rate due to low market
barriers is significant and finally fills the market positions available (Greve 1988).
The lifecycle, the surface structure, follows the deep structure and creates both market
competitive weather and the combines with the deep structure to create the crisis shakeout points
in the market (Klepper, S., & Graddy, E. (1990)).
The succession of crisis points in captured by exhibit 1.
There are two climate zones associated with the lifecycle, an early phase effectiveness
zone where firms try to find their position commensurate with their abilities and the pressures
exercised by competing firms and later the efficiency zone where a position is already acquired
Complexity Concepts in Market Dynamics; the Evolution of Market Alliances
Ulum and Nugroho Jati
___________________________________________________________________________
______________________________________________________________________________
127
© 2019 (9th) International Conference of the AGMS Proceedings
and firm gets ready to deliver against the inexorable advent of a cost leadership strategy now
given by the market (Cui, Gao, Wang,& Xue(2015)).
Effectiveness zone is associated with marketing positioning whereas efficiency zone is
shaping the productivity capabilities of the firm. A productivity emphasis that is the hallmark of
mature markets.
In effectiveness climate zone the premium is on firm recognition of market possibilities,
nobleness of moves and light baggage to carry around.
This is also the market phase where young firms develop and integrate their functions
starting with product development, marketing and rudimentary supply chain and distribution
channel activities. Later finance, human resources and eventually MIS/IT join into the integrative
process.
Therefore, the effectiveness zone is a period of functional development and coordination.
It is a period of integrating the firm’s capabilities into a cohesive whole.
All of this is forged within by the entrepreneurial structural shape of the firm headed by
the critical controller, the outward looking entrepreneur (Simsek, Lubatkin, & Floyd (2003)).
In late stages of the market where the efficiency climate prevails, we see heavier firm
structures, more deliberate moves, if any, and a singular focus on execution of strategy as
opposed to selection thereof.
Furthermore, integration yields to differentiation that creates higher efficiencies for the
firm but also contributes to silo effects among the function s that needs to be countered by better
coordination devices that create more internal structural complexity for the firm (Koplyay, T., Li,
L., & Rochefort, P. (2010)
However, curiously as firm structural development takes place symmetry is preserved
and further enhanced, thereby mitigating some of the effects of internal complexity increases and
pushing the firm towards higher levels of order.
The net effect is a decrease in alliance structure complexity and a corresponding increase
in net structural complexity of firms at the maturity phase of markets (Koplyay, T., & Mitchell,
B. (2014).
The alliance structures evolve from highly complex ecosystems types to simple linear
value chain forms at the end (Pitelis, C. (2012)).

Complexity Concepts in Market Dynamics; the Evolution of Market Alliances
Ulum and Nugroho Jati
___________________________________________________________________________
______________________________________________________________________________
128
© 2019 (9th) International Conference of the AGMS Proceedings
Ecosystems are ideal for survival, absorption of shocks and replacement of damaged
nodes and offer a good measure of resiliency, whereas value chains respond ideally to demands
of efficiency and productivity signaled by the cost leadership strategy of late markets.
The drawback of value chains is the fact that every component becomes critical, the
structure needs to be actively managed and there’s no recovery from major shocks resiliency is
gone and is replaced by robustness.
It no longer can avid shocks by displacement but rather faces the turbulence with robust
and redundant defenses.
Ecosystems on the other hand, lacking central control, are unpredictable, inefficient and
fragile (Costanza, R., Low, B., Ostrom, E., & Wilson, J. (2000)).
They adapt to shocks by repositioning in the market thereby causing an expenditure of
reserve resources of its constituent members. The future is now.
Exhibit 2 captures the deep structure of the market based on the successive customer
bases
BowlingAlley
Tornado Tombstone
Shakeout
Mainstreet
Technology Enthusiasts
Visionaries Pragmatists Conservatives Skeptics
Market Dynamics and Customer Base
Chasm
Early market
Of significant interest is a second evolutionary trait of the market that affects firms.
The firms start out in a pure competition environment of the effectiveness zone.
All their moves are dependent on their own awareness of market conditions, but as the
market progresses more and more coordination seeps in to replace the independent early
behavior.
In act a serious coordinative shock is delivered at the platform stage, where firms
coalesce into groups to set standards that is required as a quality assurance to the deep customer

Complexity Concepts in Market Dynamics; the Evolution of Market Alliances
Ulum and Nugroho Jati
___________________________________________________________________________
______________________________________________________________________________
129
© 2019 (9th) International Conference of the AGMS Proceedings
base, now at the pragmatist stage, and also acts as a defensive measure against further intrusive
innovation by requiring compatibility with the platform standards for all competing firms.
By the time the market reaches the value chain stage, almost all actions of firms are
coordinative.
So, there is a progression form a stand alone type competitive stance to one of a
collective effort.
In fact, the value chain comes about just as cost leadership imposes its will on the market
and the linear shape of the chain facilitates the delivery of productivity. The market evolves from
singular competition to collective one as illustrated by the single entrepreneurial firm and later
by the coordinatively constrained value chain.
Exhibit 3 traces the evolution of the market from effectiveness to efficiency climate
zones
Supply and distribution channels are the most efficient when the structure is linear and
minimal transition times occur between component firms upstream and downstream (Kim, Y.,
Choi, T. Y., Yan, T., & Dooley, K. (2011)).
This quasi linearization happens throughout eh market cycle.
Firms seek out outsourcing, insourcing, offshoring and in shoring to simplify their
resources and product flows upstream and downstream (Kotabe, M., Mol, M. J., & Murray, J. Y.
(2009)).
UPS has now transformed into a major supplier of insourcing where it enters client
premises and performs all the coordinative tasks of resources acquis ion and product distribution
for medium and small firms that could not afford theses streamlining functions on their own.
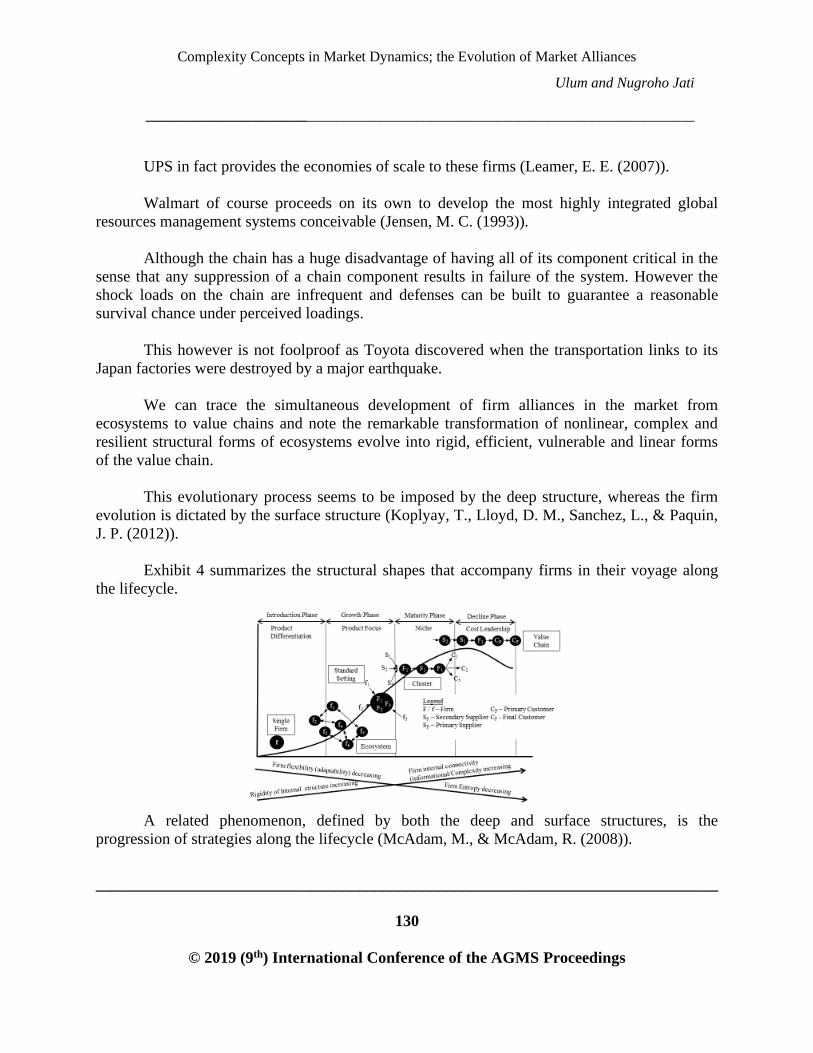
Complexity Concepts in Market Dynamics; the Evolution of Market Alliances
Ulum and Nugroho Jati
___________________________________________________________________________
______________________________________________________________________________
130
© 2019 (9th) International Conference of the AGMS Proceedings
UPS in fact provides the economies of scale to these firms (Leamer, E. E. (2007)).
Walmart of course proceeds on its own to develop the most highly integrated global
resources management systems conceivable (Jensen, M. C. (1993)).
Although the chain has a huge disadvantage of having all of its component critical in the
sense that any suppression of a chain component results in failure of the system. However the
shock loads on the chain are infrequent and defenses can be built to guarantee a reasonable
survival chance under perceived loadings.
This however is not foolproof as Toyota discovered when the transportation links to its
Japan factories were destroyed by a major earthquake.
We can trace the simultaneous development of firm alliances in the market from
ecosystems to value chains and note the remarkable transformation of nonlinear, complex and
resilient structural forms of ecosystems evolve into rigid, efficient, vulnerable and linear forms
of the value chain.
This evolutionary process seems to be imposed by the deep structure, whereas the firm
evolution is dictated by the surface structure (Koplyay, T., Lloyd, D. M., Sanchez, L., & Paquin,
J. P. (2012)).
Exhibit 4 summarizes the structural shapes that accompany firms in their voyage along
the lifecycle.
A related phenomenon, defined by both the deep and surface structures, is the
progression of strategies along the lifecycle (McAdam, M., & McAdam, R. (2008)).

Complexity Concepts in Market Dynamics; the Evolution of Market Alliances
Ulum and Nugroho Jati
___________________________________________________________________________
______________________________________________________________________________
131
© 2019 (9th) International Conference of the AGMS Proceedings
From an open and wide funnel representing the many market position choices of early
markets to the narrowing down of choices to a single one in market maturity. the strategy
funnel is created by an interplay between the deep and surface structures Koplyay, T. M., Lloyd,
D., Jazouli, A., & Farkas, M. F. (2016)).
From the many options available to the firm in early markets to executing at the
acquired final market position in maturity the firms learn how to change their respective
behaviors, structures and critical functions depending on where they are on the curve.
Exhibit 5 shows the continuing whittling down of strategies available as the market
matures.
These are excellent reasons for this curtailed choices as the market evolves.
First of all, there appears to be an anticipatory foresight among all firms to build market
share at any stage of the market.
In fact, the early rush to share and market strength even trumps the eventual need to
produce a profit, the firms know that share price corelates with top line growth and hence
everything is done to buttress revenues, and yet this is not essential to immediate survival but
becomes a factor in late markets. This type of thinking is amply evident in Shopify, where top
line growth is the corporate priority.
So the firms instinctively reach for market share and often dominant market share as
captured by market strength which allows building of brands, a very useful and relatively
inexpensive tool to hold market position ,as it cost a lot more to attack a brand than to defend it.

Complexity Concepts in Market Dynamics; the Evolution of Market Alliances
Ulum and Nugroho Jati
___________________________________________________________________________
______________________________________________________________________________
132
© 2019 (9th) International Conference of the AGMS Proceedings
The accumulated market share eventually translates into economies of scale and allows
for the implementation of the final strategy, cost leadership (Hitt, M. A., Keats, B. W., &
DeMarie, S. M. (1998)).
The idea to retain here is that the evolution of the firms and their respective adaptive
behaviors anticipate the eventual end game of the market (Lo, A. W. (2004)).
There appears to be a market teleology acting on singular and collective behaviors of
firms and their alliances.
It is almost as if the market had a life of its own and through feedback mechanisms it
guides constituent firms and their alliances to a final resting place, which is known by the time
the market comes into existence.
We can comment on a phase of the market, the M&A phase, that helps fulfil final market
destiny. As the market matures it becomes n more obvious that market share will rule eventually.
Firms try organic growth, but as the market gets depleted of new customers it becomes more
difficult to gain share (Hurta, H., Jazouli, A., Koplyay, T., & Motaghi, H. (2017).
For two reasons, one is the customer acquisition costs go up and retention costs come
down. It’s cheaper to hold on to a customer than to recruit a new one. Second is that share
acquisition becomes zero sum game, the market is not growing anymore and a firms share gain
becomes another firm’s loss. Hence if you can’t beat them you buy them and series of M&A is
unleashed to consolidate the market and often produce an oligopoly, or in the presence of very
strong economies of scale a monopoly, something that government regulators try to prevent,
although often for the wrong reasons.
A further characteristic of market evolution that is worth commenting is the type of
stability available to firms depending on location. In early markets bot the firm and its ecosystem
can relocate under market forces, say competitive pressures or collapse of a customer base, or
even intrusion of an adjacent market. This nomadic ability defines a seeking out of zone stability,
the ability to fine a new competitive position within the developing market.
Later when the first crisis point the chasm is crossed and the blowing alley strategy
developed firm and its alliance become more circumspect and stability can be found only in
limited spaces, the standards platforms to which firms can converge.
There may be several of these standards first but eventually they will decay to one
dominant or maybe two platforms, and then the platforms themselves disintegrate into prototype

Complexity Concepts in Market Dynamics; the Evolution of Market Alliances
Ulum and Nugroho Jati
___________________________________________________________________________
______________________________________________________________________________
133
© 2019 (9th) International Conference of the AGMS Proceedings
value chains, called clusters that are essentially linear at the core and ecosystem format at the
supplier and distribution channel ends.
The application software providers would fall into the category of suppliers at this stage.
An example being the Sony Beta or a Toshiba VHS platform, but in the long run this morphed
into one market standard, Toshiba VHS in this case.
By the time the final market phase of maturity arrives, the stability is of a point form, no
chance to move the asset base constraining, the risk avoiding culture and accumulated knowhow
is too heavy to relocate. Just ask GE about its recent experience with software development. The
stability zones in a literal sense define the scope of maneuvering possible for a firm in the
market, and scope decreases until only one option is left in maturity
Exhibit 6 shows the zones of different stability against the market lifecycle
The small picture; local co-evolution based on complexity
There appears to be a common focus-based evolution of firms and their alliances driving
both towards an unavoidable state of cost leadership where choice of strategy is left behind, and
the execution of the market given strategy prevails. (Koplyay, T., Sanchez, L., & Levy-Mangin,
J. P. (2012)).
Whether the driving force behind this co-evolution is the market or the adaptive behavior
of firms, or both, is immaterial to the final outcome, although of real importance to our
understanding of both market and constituent entities transformations.

Complexity Concepts in Market Dynamics; the Evolution of Market Alliances
Ulum and Nugroho Jati
___________________________________________________________________________
______________________________________________________________________________
134
© 2019 (9th) International Conference of the AGMS Proceedings
The fact remains firms and their alliances change in an orderly and predictable fashion,
drawn like moths to the flame of final market attractor, markets share based productivity
anchored competition.
If there is a link between the firm’s behavior and the shape of their alliances it should
surface from the study of emergence in the market due to complexity (Koplyay, T. M., Lloyd,
D., Jazouli, A., & Farkas, M. F. (2016)). We shall examine two instances in the market there this
type of evolution does take place. One has to do with the platform and the other with the
emergence of the value chain. For meaningful mergence to occur complexity theory tells us that
we should find phase transition, complexity on the edge of chaos leading to self-organization at
the firm level that eventually produces strong emergence of an alliance that will in turn influence
the lower level conduct of the firms. And in fact, on at least two occasions this happens in
markets.
The first one is the standards platform. After crossing the chasm, the first grey hole in
market where firms are lost, the surviving firms concentrate on building a niche market around a
bowling alley strategy, whereby the firm choses a central customer and starts seeing a complete
product to this customer in the pragmatic segment, and eventually to all other firms in the
customer’s ecosystem.
This vertical marketing where you proceed from the first bowling pin to the next, and in
cautious steps build a whole bowling alley of connected customers, and this contuse until the
market growth takes off where you abandon the vertical marketing for a horizontal one. No more
local customization but ride the tiger through high growth period. So we find two phase
transitions at the same time; One of change for vertical to horizontal marketing And one of study
market growth to high growth. So, the market behavior changes drastically inviting and
evolutionary move from the firm but for such behavior or appear we must have nonlinearity on
the edge of chaos.
Indeed, we just left the highly stable and ordered state of the bowling alley and down-
market looms the chaos, the shakeout. We are on the edge of chaos.
The market in of increasing structural complexity, measured by the nonlinearity of
relationships among the firms and their alliances (Koplyay, T., & Mitchell, B. (2014)) with
strong nonlinearities bounding this complexity.
On one side is order and on the other chaos, ripe for some meaningful evolutionary
transition.

Complexity Concepts in Market Dynamics; the Evolution of Market Alliances
Ulum and Nugroho Jati
___________________________________________________________________________
______________________________________________________________________________
135
© 2019 (9th) International Conference of the AGMS Proceedings
And as the firms organize they give rise to the emergent standards platforms that offers a
way to survive the shakeout by embarking in the life boat of the standards platform, that will
carry them to the other shore of the shakeout
There is emergence and this emergence signals to noncommitted firms the possibility of
survival through various feedback mechanisms such as superior customer commitments to the
platform and equally sustainable growth rates. Hence the emergence is strong
Similarly at the end of the market right after firms transit the M&A phase ,there is strong
stability and order of the oligopoly ,but the execution of the productivity phase still awaits and
for this to occur the supply and distribution relations need to be literally ironed out into linear
shapes (Hurta, H., Jazouli, A., Koplyay, T., & Motaghi, H. (2017)).
Downstream from the M&A lurks the market exit, the final gaping black hole that
swallows all firms, and that point represents chaos. So we have the stability of the M&A phase,
the edge of chaos of the market exit and in between the nonlinearity of the combined firm and
alliance structures.
By this phase the firms are cooperating seriously with chosen partners and almost value
chain type behavior is evident in the clusters, the end of which need to be ironed out to attain the
value chain. A period on high nonlinearity occurs between the ordered sate and the chaotic exit
that allows for organization the firm level to produce an emerging entity the value chain, which
is markedly different from the firms composing it and endowed with properties that could not be
derived from firm characteristics. Some of these properties are smoothing and tightening of chain
relationships by a dominate member of the chain that henceforth sets chain strategies. The firms
need are submerged into the chain. Although as the chain gains tremendous efficiencies it loses
survival attributes.
It has all of a sudden a series of critical nodes, the individual firms , which renders ii
equally exposed to market perturbations at all nodes. Hence it builds redundancy at all nodes of
the linear network, which results in overall robustness. Again this emergence is occasioned by a
prevailing complexity at the firm level in a period of phase tension between order and chaos
The phase transition is twofold; Transition from mass customization found in oligopolies
and a transition from moderate growth pre and past M&A to zero growth of late markets. Both
marketing and growth conditions change. In anticipation of this event the M&A was unleased to
find market share in a now static market, that faces the calculations of zero-sum market share
changes. Therefore, the competition must shift from further acquisition of share to execution of
productivity at fixed point of interaction with the market.

Complexity Concepts in Market Dynamics; the Evolution of Market Alliances
Ulum and Nugroho Jati
___________________________________________________________________________
______________________________________________________________________________
136
© 2019 (9th) International Conference of the AGMS Proceedings
Conclusions
Market appears to anticipate its own evolutionary profile and exerts forces and creates
adaptive mechanisms for firms and their alliances to proceed I the right direction at the right time
toward a final state where choice is stripped from the firms and a given strategy imposed which
requires a management perspective change from well positioned firms to well managed firms.
From external management emphasis to internal focus. But the market provides the means of
transition at various phases and firms that profit from this opportunity continue to evolve and
arrive well equipped at the final state. The market goes through a series of critical events from
the chasm in early phase to shakeout in mid stage to partial market collapse at M&A and finally
at extinction in market exit. All of them are market exit grey holes for the firms, some go under
some survive. Before each exit point the market allows for preparation by the firms to confront
the crisis and this means is the complex adaptive transitions that lead to emergence of lifeboats
that help navigating the treacherous waters of the grey holes.
Whether it’s the, the platform, the collapse due to M&A or the value chain the transition
prior to these events seems to be based on self-organized based emergence that is initially weak
but later becomes strong by exerting feedback on all firms and draws them to the attractor that
these alliances represent for the firms.

Complexity Concepts in Market Dynamics; the Evolution of Market Alliances
Ulum and Nugroho Jati
___________________________________________________________________________
______________________________________________________________________________
137
© 2019 (9th) International Conference of the AGMS Proceedings
Selected References
Cui, B., Gao, D. C., Wang, S., & Xue, X. (2015). Effectiveness and life-cycle cost-benefit
analysis of active cold storages for building demand management for smart grid
applications. Applied energy, 147, 523-535.
Costanza, R., Low, B., Ostrom, E., & Wilson, J. (2000). Institutions, ecosystems, and
sustainability. CRC Press.
Dobni, C. B., & Luffman, G. (2003). Determining the scope and impact of market orientation
profiles on strategy implementation and performance. Strategic management
journal, 24(6), 577-585.
Greve, H. R. (1998). Managerial cognition and the mimetic adoption of market positions: What
you see is what you do. Strategic management journal, 967-988.
Hitt, M. A., Keats, B. W., & DeMarie, S. M. (1998). Navigating in the new competitive
landscape: Building strategic flexibility and competitive advantage in the 21st century. The
academy of management executive, 12(4), 22-42.
Hurta, H., Jazouli, A., Koplyay, T., & Motaghi, H. (2017). Mergers and acquisitions from the
perspective of project management. Polish Journal of Management Studies, 15.
Jensen, M. C. (1993). The modern industrial revolution, exit, and the failure of internal control
systems. the Journal of Finance, 48(3), 831-880.
Klepper, S., & Graddy, E. (1990). The evolution of new industries and the determinants of
market structure. The RAND Journal of Economics, 27-44.
Kim, Y., Choi, T. Y., Yan, T., & Dooley, K. (2011). Structural investigation of supply networks:
A social network analysis approach. Journal of Operations Management, 29(3), 194-211.
Kotabe, M., Mol, M. J., & Murray, J. Y. (2009). Global sourcing strategy. The SAGE handbook
of international marketing, 288-302.
Koplyay, T., Li, L., & Rochefort, P. (2010, October). Hi-tech innovation strategies and the
market lifecycle. In Proceedings, American Society of Engineering Management Conference,
Fayetteville, Arkansas.

Complexity Concepts in Market Dynamics; the Evolution of Market Alliances
Ulum and Nugroho Jati
___________________________________________________________________________
______________________________________________________________________________
138
© 2019 (9th) International Conference of the AGMS Proceedings
Koplyay, T., Lloyd, D. M., Sanchez, L., & Paquin, J. P. (2012, January). Strategy making in hi
tech markets-the" clock-speed" paradigm. In IIE Annual Conference. Proceedings (p. 1).
Institute of Industrial and Systems Engineers (IISE).
Koplyay, T., Sanchez, L., & Levy-Mangin, J. P. (2012). Evolution of the Marketing Function
under Market and Organizational Constraints.
Koplyay, T. M., Lloyd, D., Jazouli, A., & Farkas, M. F. (2016). THE DYNAMICS OF
ALLIANCES FORMATION IN HIGH-TECH MARKETS; FROM ECOSYSTEMS TO
VALUE CHAINS.
Koplyay, T., & Mitchell, B. (2014, June). The Evolution of Complexity Within Firms.
In Institute of Industrial Engineers, Proceedings of IEE Conference, Montreal, QC.
Koplyay, T. M., Lloyd, D., Jazouli, A., & Farkas, M. F. (2016). DYNAMICS OF MARKETS:
LOCATING A FIRM ON THE LIFECYCLE IN FAST MOVING MARKETS.
Leamer, E. E. (2007). A flat world, a level playing field, a small world after all, or none of the
above? A review of Thomas L Friedman's The World is Flat. Journal of Economic
Literature, 45(1), 83-126.
Leamer, E. E. (2007). A flat world, a level playing field, a small world after all, or none of the
above? A review of Thomas L Friedman's The World is Flat. Journal of Economic
Literature, 45(1), 83-126.
Lo, A. W. (2004). The adaptive markets hypothesis: Market efficiency from an evolutionary
perspective.
McAdam, M., & McAdam, R. (2008). High tech start-ups in University Science Park incubators:
The relationship between the start-up's lifecycle progression and use of the incubator's
resources. Technovation, 28(5), 277-290.
Pitelis, C. (2012). Clusters, entrepreneurial ecosystem co-creation, and appropriability: a
conceptual framework. Industrial and Corporate Change, 21(6), 1359-1388.
Simsek, Z., Lubatkin, M. H., & Floyd, S. W. (2003). Inter-firm networks and entrepreneurial
behavior: A structural embeddedness perspective. Journal of Management, 29(3), 427-
442.

Firm trends in markets and their consequences; mapping evolution of firm behavior using the deep and
surface structures of the market.
Koplyay, Motagh, Hurta, and Malouin
___________________________________________________________________________
______________________________________________________________________________
139
© 2019 (9th) International Conference of the AGMS Proceedings
Firm trends in markets and their consequences; mapping evolution of firm behavior using
the deep and surface structures of the market
Tamas Michel Koplyay, Ph.D.
Hamed Motaghi, Ph.D.
(Corresponding Author)
Hilda Hurta, Ph.D.
Mario Malouin, CPA
Abstract
At the core of the market, are the customer profiles, which define the demand forces, bubbling
up along the lifecycle? The lifecycle itself pushes the market over the core as if it were a
continental drift. We have deep structure defined by the customer profile, a path of evolution
defined by the lifecycle and a sequence of characteristic events, which are related to both. The
deep structure gives rise to a surface structure that defines specific significant market events;
these events begin with the volcano, a white hole, which spews firms into the young market, then
fades away as the lifecycle moves on to a series of grey holes, ever darker, ever deeper which
culminate in the final black hole and market exit. Furthermore, the surface structure organizes
market collaborative groupings such as platforms, clusters and value chains that result in very
different competitive strategies; from the singular to the collaborative. This paper will review the
structure of these interactions and examine the class of intensifying and diminishing trends at the
firm level that create and constrain market dynamics. Furthermore, it will summarize market
behavior based on both the deep and surface structures, the associated strategies and the market
landscape. Among the key observations is the fact that early markets function in an effectiveness
climate zone and late markets in an efficiency zone. A period of transition connects during the
market leveling off growth.
Key words: Firm evolution, Market trends, Grow Consequences, Market Structure

Firm trends in markets and their consequences; mapping evolution of firm behavior using the deep and
surface structures of the market.
Koplyay, Motagh, Hurta, and Malouin
___________________________________________________________________________
______________________________________________________________________________
140
© 2019 (9th) International Conference of the AGMS Proceedings
Introduction
The market appears be organized at two levels, the deep and surface structures. The first
consists of the customer base that influences what happens at the surface, especially at the
market lifecycle level, providing a template for the market that creates a dynamic independent of
the firms in the market.
This dynamic shapes the behavior of the firms and dictates a consistent development for
the emergence of the many lifecycles that drift over the deep structure. Among these, are the
lifecycles of the firm, its associated alliances that range from ecosystems to value chains and
various behavioral lifecycles of the firm that track its evolution such as HR, finance, innovation,
compensation, decision making, and project management.
The deep structure is analogous to the core of the earth over which float the continents at
the level of the mantle and undergo changes themselves as competitive pressures and the deep
and surface structure combine influences.
We seem to have a succession of surface structure events, climate and weather patterns
that shape the market; with the key features of the deep and market surface structures relatively
immutable but the weather like competitive pressures building and eroding the surface structure
in real time.
This article explains these forces and links the various mechanisms that create market
reality.
The deep structure of the market “the core”
We are going to examine the market dynamics from the perspective of the hi-tech
industry because things happen a lot faster and a lot more often in this sector.
In fact the hi-tech market is on steroids that borders on dynamic overdrive, often
churning through stages of the lifecycle at hurricane pace, leaving both accumulation of
astounding wealth and utter devastation behind; and frequently bipolar firm behavior is evident
when under the same corporate umbrella, two different firms reside; such is the case now with
Blackberry, an almost has been trying to reposition in the late stages of the lifecycle on the back
of its corporate affiliate QNX, the rising star in self-driving vehicles; or Amazon and Whole
Foods (Forbes, 2017), where the acquisition of the latter may lead to its unrecognizable
reorganization as an advanced warehousing staging point for Amazon goods to be shipped to

Firm trends in markets and their consequences; mapping evolution of firm behavior using the deep and
surface structures of the market.
Koplyay, Motagh, Hurta, and Malouin
___________________________________________________________________________
______________________________________________________________________________
141
© 2019 (9th) International Conference of the AGMS Proceedings
customers; and Whole Foods vocation may change from focus on foods to focus on drone and
robot delivery just being developed by Amazon (CNBC, 2015). All of this may end up in
corporate indigestion but right now the collective appetite for online sales and immediate
delivery of goods to the customer is huge. As we note, not incidentally that Whole Foods
acquisition solves an important choke point for Amazon, the backflow or the return of goods.
Having the storage space of the acquisition does an end run of the eternal dilemma of online
sales; where to drop off undesired purchases.
The ample parking surrounding Whole Foods outlets makes for convenient drop off
points, and of course this interim solution will soon be enhanced with much vaster acquisitions
of outlets of similar configuration to Whole Foods, but his time just for the storage and parking
space. Eventually big retailers suffering from precipitous decline in sales such as Sears may yield
their facilities to Amazon, the very competitor that ruined them (Sears actually went through
bankruptcy and its mall locations may up for Amazon occupancy already).
In the first case [Blackberry] a new phoenix rising from inside the firm (Forbes, 2017), in
the second a potential phoenix subsumed to a new parent interests [Amazon] (Forbes, 2017).
At the most fundamental level, at the core of the market, lays the customer profile that
defines much of the dynamics of the market, the firm and its accompanying alliances. The core
consists of successive customer groups with which the firm interacts after it enters the market
(Jazouli, A. (2016)).
Initially the early market is populated by technology enthusiasts and visionaries who seek
out the breakthrough offerings of the young firm (Koplyay & Mitchell, 2014). They even help to
test the offering and provide significant feedback on product or service performance, somewhat
akin to a beta test.
These two groups are risk taking, mostly immune to higher prices, thereby reinforcing
price inelasticity of early market behavior and consequently create richer margins for the firm,
which compensates to some extent for the lack of volume (Koplyay & Mitchell, 2014).
This customer base is quite small compared to the next two groups, the pragmatists and
the conservatives, but they play an extremely important role of signaling the usefulness of the
offering to the customer groups following them.
Furthermore, they assist the firm in making genuine progress towards completing the
product configuration to make it more palatable to the market majority, which is shy of

Firm trends in markets and their consequences; mapping evolution of firm behavior using the deep and
surface structures of the market.
Koplyay, Motagh, Hurta, and Malouin
___________________________________________________________________________
______________________________________________________________________________
142
© 2019 (9th) International Conference of the AGMS Proceedings
experimenting with new product features, is risk averse, and asks for the complete product that
fits seamlessly with the existing internal operations.
To get to the gold mine of the market, majority the firms offering the breakthrough
products need to cross the chasm (Moore, 1995) which is possible when the product is completed
with specific target clientele in mind, accompanied by prototype channels of delivery that are
filled during the growth phase of the market and by a succession of moves, vertical marketing,
where links among target firms are exploited for organic growth purposes. An example may be
the banking industry, where acceptance by the banks of a cyber security sensitive product
becomes an endorsement for banks’ alliance firms (Reuters, 2017).
The market majority, representing about 70% of the market consists of the pragmatics
and the conservatives. The pragmatics will endure new technology and even show willingness to
adopt it if it has been pretested by the preceding two groups, if it shows real promise as a
competitive advantage and comes with seamless integration guarantees.
Moreover, the group asks for the end of all product experimentation and allows only the
complete product, with some local customization, into the firm’s premises. The spirit of
experimentation with new ideas is replaced by the cautious optimism associated with working
with promising ideas that fit the market and competitive reality.
The group will hold back until the competitive pressures unleash a stampede towards the
new technology, such as was with the internet, iPhone, online shopping and the pending invasion
of AI coupled to big data.
The conservatives on the other hand are reluctant customers, although they love
technology as long as it is out of sight and requires zero maintenance, accompanied by good
price/performance or value proposition. As in the technology available in BMW or a Mercedes.
Furthermore, now it’s “we’re going with this unavoidable technology ” and not as with
the pragmatics, “we are going with this useful value added technology”. But the combination of
the pragmatics and conservatives, which together constitute the majority market, about 70%
unleashes the tornado or the period of intensive growth where vertical marketing metamorphoses
into horizontal marketing and all pretense of customization is abandoned and products are
pushed out into the market as fast as possible.
Amazon, as big as it is, may be entering this period of its market, horizontal sales, as it
completes the transformation from online book sales to an online platform of all sales. To
accomplish the final step of this vocational change, it had to acquire Whole Foods (Forbes, 2017)

Firm trends in markets and their consequences; mapping evolution of firm behavior using the deep and
surface structures of the market.
Koplyay, Motagh, Hurta, and Malouin
___________________________________________________________________________
______________________________________________________________________________
143
© 2019 (9th) International Conference of the AGMS Proceedings
to have the storage space for pending shipments and more importantly to deal with backflow of
items, the difference between gross and net sales.
Beyond the previously discussed main market, at the tail end are the skeptics who refuse
to adopt new products, technology or otherwise, until and unless they are compelled.
In general, hi-tech markets ignore this customer base, but occasionally, on a risky basis, a
living can be eked out, as was done by Lucent, which serviced on a legacy basis this laggard
group in the communications sector.
The general market tends to linger with the skeptics until the market collapse but hi-tech
usually undergoes a rejuvenation of the market through breakthrough and disruptive
introductions before this stage is reached.
One of the predictable effects of the coming AI revolution will be the early termination of
markets before the maturity stage is reached. In all markets where AI plays a dominant role or is
at least at the technology core of the market, innovation will rule the market landscape, keeping
firms in constantly rejuvenated young markets where productivity is not an issue, as volumes are
never generated in sufficient quantity to deploy the cost leadership strategy. Rather imagination-
based innovation will rule the unending disruption of markets through new ideas.
We see this phenomenon already in Twitter or Yahoo challenging Facebook and then
flaming out or stagnating or Tesla beating all auto manufacturers in market capitalization then
starting a downward drift (Forbes, 2013).
Competition will shift to the imagination driven innovation, that will keep firms in high
margin and low volume territory, but there may be serious ramping up of volumes during market
high growth stage [tornado] but this will be an unstable period ever likely to be terminated by a
great new disruptive idea flowing from the constant probing of opportunities through AI guided
big data analysis.
Exhibit 1 captures the essence of the deep structure consisting of the succeeding customer
profiles and the associated transition points and phases of the market.

Firm trends in markets and their consequences; mapping evolution of firm behavior using the deep and
surface structures of the market.
Koplyay, Motagh, Hurta, and Malouin
___________________________________________________________________________
______________________________________________________________________________
144
© 2019 (9th) International Conference of the AGMS Proceedings
Exhibit 1. Market Dynamics and Customer Base (adapted from Moore, 1991).
BowlingAlley
Tornado Tombstone
Shakeout
Mainstreet
Technology Enthusiasts
Visionaries Pragmatists Conservatives Skeptics
Market Dynamics and Customer Base
Chasm
Early market
The strategic choices tracking the deep structure
“A critical manifestation of the deep structure”.
In early markets, the strategic choices are many as the firms jockey for positioning by
trying to balance their core competencies and capabilities with the available market opportunities
[competency is what you can do on your own and capability is what you can enhance with the
help of your ecosystem, essentially the first is what you can do on your own and the second is
what you can do with your partners].
The ecosystem represents the first partnership of the firm in the market and continues
through several transformations of this partnership throughout the market development.
Essentially the partnerships represent what you can do collectively as opposed to just on your
own. These partnerships go from a very lose and shock resistant format of low productivity,
such as the ecosystem, to a brittle yet very efficient structure of the value chain. (Koplyay &
Mitchell, 2015). Exhibit 2 captures the evolution of the market alliances.

Firm trends in markets and their consequences; mapping evolution of firm behavior using the deep and
surface structures of the market.
Koplyay, Motagh, Hurta, and Malouin
___________________________________________________________________________
______________________________________________________________________________
145
© 2019 (9th) International Conference of the AGMS Proceedings
Exhibit 2. Evolution Of Market Alliances (Koplyay et al, 2015)
In early markets, the choices are as many as product variants that can be introduced to the
market. The funnel is wide but is narrowed down to just cost leadership by the mature market
stage. Exhibit 3 summarizes the strategic funnel during the market lifecycle.
Exhibit 3. Strategic Bandwidth Market Customer Base Drivers (Koplyay and Mitchell, 2014a).
Product platforms whittle down the initial positioning choices then developing channels
of distribution further curtail choices. Consolidation of the market during the M&A period
further erodes the range of strategic choices as the underlying customer base, the conservatives
have very real expectations about price/quality, reliability and functionality. The funnel of
convergence of strategies has an interesting implication.

Firm trends in markets and their consequences; mapping evolution of firm behavior using the deep and
surface structures of the market.
Koplyay, Motagh, Hurta, and Malouin
___________________________________________________________________________
______________________________________________________________________________
146
© 2019 (9th) International Conference of the AGMS Proceedings
At first firms must find their right place in the market through positioning and then, in
late markets, their place is given to them and the choice becomes executing the best internal
strategy to deliver against this single choice, cost leadership.
From the M&A phase on, the market rapidly converges to the single choice of cost
leadership, which shifts the focus of the firm from external market conditions, by now quite
simple and predictable, to the internal functioning of the firm to deliver the best price anchored
value proposition. One of the important lessons of the strategic funnel is that in early markets,
finding the best place in the market commensurate with the firm endowments is the key to
success, whereas in late markets, once the choice is whittled down to just one, cost leadership,
the emphasis is on execution of the market dictated strategy.
The surface structure: the landscape of the market
We will now turn to the surface structure as shaped by the deep structure: Early markets
are endowed with low market barriers and much promise embodied in the relative price
inelasticity leading to high gross margins and the usually exaggerated hype of the future.
Different critical tasks await the firms at each stage of the market. Firstly, it must find its
proper place and differentiate itself from competitors to create some market distance and
competitive breathing space. This task is effectiveness imbued and often forgives mistakes of
positioning.
Furthermore, the adaptability and survival chances of the young firms are enhanced by its
relatively flexible ecosystem that yields space under market shocks. Like a spider web, it
deforms and then reforms. A young firm will have flexibility of positioning as it can easily
modify its product designs without having to worry about dragging expensive asset base along
from one position to another; and as its place in the ecosystem is not tightly bounded it can move
and locate a new position in its existing ecosystem or find a new one.
Survival is portable and exactly accommodated by the flexible arrangements of the
ecosystem as opposed to the late stage alliance, the value chain (Koplyay et al, 2015).
Not much has been written on the progression of the alliances on the lifecycle that accompanies
the firm and seems to be tailor made by the market to allow the firm to cope with issues of
effectiveness in early market stages and efficiency in late ones.
For the sake of completeness, we include it here and note that alliances lifecycle
(Koplyay et al, 2015) is an expression of the surface structure dynamic.

Firm trends in markets and their consequences; mapping evolution of firm behavior using the deep and
surface structures of the market.
Koplyay, Motagh, Hurta, and Malouin
___________________________________________________________________________
______________________________________________________________________________
147
© 2019 (9th) International Conference of the AGMS Proceedings
We note that early alliances tend to be nonlinear and complex, which provides some
measure of protection against early market turmoil, and this structure, is resilient, resistant to
shocks but quite inefficient. The alliance flattens out in late market into a simple value chain that
is very efficient, but brittle and subject to real damage due to strong perturbations (Koplyay et al,
2015).
A striking example of disruption is the recent effect of Cambridge Analytics on the
reputation and market value of Facebook, which clearly illustrates the symbiotic relations that
prevail of the net.
We can trace the evolution and transformation of ecosystems into value chains as the
market matures.
The key research question is what causes the flattening of alliances from ecosystems into
value chains?
Is the market sending signals, which the alliances and the firms interpret and adapt to
throughout the cycle and if so what are the adaptive mechanisms and the enabling forces.
We do know that there is high complexity in early markets, many chaotic events and
stable structures that attract the firms .such as platforms and clusters, and that these
circumstances are an essential prerequisite for meaningful adaptation, or purposeful evolution
Exhibit 3. Evolution and transformation of ecosystems into value within The Market Lifecycle
(Koplyay & Mitchell, 2014a&b)

Firm trends in markets and their consequences; mapping evolution of firm behavior using the deep and
surface structures of the market.
Koplyay, Motagh, Hurta, and Malouin
___________________________________________________________________________
______________________________________________________________________________
148
© 2019 (9th) International Conference of the AGMS Proceedings
The market does have a life of its own, and there is very much like a blue ocean behavior
in early markets that provides freedom of movement which only possible for firms with
exceedingly light asset base to drag along (Kim & Mauborgne, 2005). In fact, when the market
starts to demand efficiency and as soon as the concept of productivity is raised escape to blue
ocean markets becomes progressively more difficult and in late mature markets impossible. The
only way a firm can escape the moribund market is to redeploy the assets in nascent new
markets, essentially to incubate a startup, and again the necessity of financial reserves to
accomplish this drastic move must be underlined. In addition, this is what Blackberry is doing
with smart cars affiliate QNX (Forbes, 2017) and Nortel did with its internet security firm
Entrust; but to do it, cash reserves need to be there as borrowing in yet unpromising markets is
problematic, hence the attention to Earnings Before Interest, Taxes, Depreciation and
Amortization and rent (EBITDAR) for firms in declining markets.
Again, to compute the surface structure emergence, evolution and fade out, we have
chosen the powerful unifying capabilities of the lifecycle to illustrate its collective impact (what
we call surface structure is essentially the unfolding market dynamic with its crisis pit stops).
At the earliest stage of the market when the enthusiasts and early adaptor client base
dictate the deep structure dynamic, the market entry is akin to a volcano, in essence a white hole
that spews the young firms in hyperdrive of expectations into the market. In addition, this is
possible as market promise is high with rich margins and high growth potential and barriers are
low, as no real asset base is required to operate, nor usually any IP or license agreements. The
market is pristine and blue with not a shark in sight.
This endures until the chasm (Moore, 1991) is reached and the next stage and most
important stage of customer base needs to be conquered. To cross the chasm the firm must make
a major adjustment and put aside its blue-sky product development, instill some marketing
discipline, complete its product configuration and start thinking price/quality.
Failure to achieve this will leave the firm in the abyss of the chasm, which is the first
grey hole of the market that swallows unresponsive firms.
These grey holes (Koplyay et al, 2014) get bigger and darker throughout the cycle until,
at market exit, it a big yawning black hole from which there is no return [but as in physics if and
when a firm disappears for good, information about it is not lost but lingers on the event horizon,
so we can write the obituary and draw the appropriate lessons.

Firm trends in markets and their consequences; mapping evolution of firm behavior using the deep and
surface structures of the market.
Koplyay, Motagh, Hurta, and Malouin
___________________________________________________________________________
______________________________________________________________________________
149
© 2019 (9th) International Conference of the AGMS Proceedings
The majority client base of the deep structure progressively instills constraints of
price/quality nature and product must be become more reliable, more user friendly, cheaper and
perfectly aligned with existing firm operations.
Among other things, the supplying firms adjust at the surface by transferring more power
to marketing, production and limited customization of offerings. However, before they can
declare victory, they must survive two more grey holes, guaranteed by the sheer size of the
majority customer base, during the high growth phase: The first is the standard setting platform.
As the market settles down after the initial burst of creativity and witnesses the chaotic profusion
of product variants, the merging bigger players start a process to create product platforms that
ensures a competitive advantage by adding real bringing new to the platform by third party
suppliers (applications for iPhone for instance (Tiwana et al, 2010)).
This process also guarantees market leadership for the platform initiator and acts as a
rearguard device to eliminate new breakthrough competition by forcing all to align with the
platform. Usually two of three platforms emerge but one becomes dominant; iPhone, Blu-Ray or
IP protocol. In addition, even Amazon can be thought of as a sales platform. The important
development for future competition is that from this point on platforms compete and not just
individual firms, and ones that don’t find a home linked to a platform struggle and later exit the
market; so the platform’s net effect is reduction of the number of firms.
The platform formation creates the first major entry barrier to the market (Koplyay et al,
2014), but high growth and still reasonable margins keep attracting new entrants. The platform is
also a marketing device to assure large customers that stability of the supplier is increasing and
offers commensurate size to the customer to assure future cordial and competitive relationships;
and this doesn’t stop until the growth levels off and all of a sudden too many firms are trapped in
the market for the given market size. Then an inevitable major reckoning happens with the
formation of the very grey hole, the shakeout, which eliminates numerous firms.
An unquestioned principle of good management is that all firms should always plan, but
during the shakeout, this is not true, in fact planning can get you into deeper trouble.
Planning is a time and effort consuming exercise and you have neither during the
turbulence of the shakeout. When in a hurricane batten down the hatches furl the sails and hope
for the best. Furthermore, for planning or, which is the same, seeking or confirming direction of
evolution of the market requires a quantum of time to draw appropriate conclusions and transfer
the lessons from the planning exercise to the firm. In addition, time is lacking in the hurricane of
the shakeout and this period cautions “life is what happens to you while you are busy making
plans”.

Firm trends in markets and their consequences; mapping evolution of firm behavior using the deep and
surface structures of the market.
Koplyay, Motagh, Hurta, and Malouin
___________________________________________________________________________
______________________________________________________________________________
150
© 2019 (9th) International Conference of the AGMS Proceedings
GE appears to pass this stage now as it tries to reposition from a manufacturing firm
status to one of generation of software, blissfully unaware that these two functions are
incompatible under the same roof as manufacturing is high discipline, efficiency focus and late
market function whereas software is creative, effectiveness and malleable culture market
undertaking
Amazingly in the shakeout, it’s not firms with great technology which tend to survive but
ones with either strong financial reserves or parents with deep pockets, and this proves the old
adage that the cumulative past management acumen, expressed in total profitability has a huge
impact on the future. When shareholders agitate for share buybacks or higher dividends, they
tend to miss this point and could endanger the future of the firm by insisting on higher share
price today at the expense of missing opportunities in the future, or entirely missing the market
beat. Beyond the shakeout, two more major grey holes loom on the horizon; consolidation and
market exit.
Market exit is obvious, but it has an interesting psychology of interim survival to cope
with. Some firms can and do make a good living in declining markets as long as they have a
decent tolerance for risk, however, in general, late stage firms seem to have very little tolerance
for risk (Koplyay et al, 2015). And the risk is the sudden unanticipated collapse of the market as
opposed to a foreseeable fade out, which leaves the asset base stranded as sunk costs; coupled
with this risk is the ramp up of potential new firms from other promising markets; GE in
software (ZDNET, 2015) or Google in smart cars (CNN, 2015).
How fast should we divert funds from our EBITDAR, financial reserves or leverage to
ramp up the new business but not to bleed the old one dry?
Consolidation is a surface expression of the underlying late majority base, the
conservatives who want to have the lowest possible price and to execute on a demand the firm
has to have markets share to be able to use economies of scale, reduce its cost structure, and
thereby create wider margins. Here we see the clear transition zone from positioning, or
effectiveness, to productivity, or efficiency.
By this stage, because of the price sensitivity of the conservative deep structure, the price
is given to all firms, and hence the competitive firms need to deliver on the best cost leadership.
Moreover, the reason is that cost leadership creates the best margins and cumulatively and for
each competitive iteration the best profits.

Firm trends in markets and their consequences; mapping evolution of firm behavior using the deep and
surface structures of the market.
Koplyay, Motagh, Hurta, and Malouin
___________________________________________________________________________
______________________________________________________________________________
151
© 2019 (9th) International Conference of the AGMS Proceedings
Normally to achieve this, the firm needs economies of scale to spread its costs over
higher volumes and this explains the previous round of M&A that has its goal the maximization
of market share.
Among other factors, this implies that during the high growth period of the tornado, the
firm’s growth should be superior to that of competitors to gain not just market volume but
relatively higher volume than its close competitors should, namely market share should.
As the cost of customer retention falls and customer recruitment rises due to the now
stagnant market growth, (each competitor needs the customer for the same reason, to maintain
significant market share) and the firms are faced with a zero-sum game “But if you can’t beat
them, you can buy them”. Hence a major round of M&A is unleashed on the market (Koplyay &
Hurta, 2016), with firms having better financial reserves, debt carrying capacity and higher share
value becoming predators. However, the bolder and more risk tolerant predators may undertake
reverse takeovers by forcing the acquired firm to carry the debt related to the acquisition, and
this is not without risks, as the acquired firm is now hamstrung if a market crisis, demanding
reliance on cash reserves “intrude”. Many M&A unravel due to this curtailing of strategic
financial reserves.
In early markets, the firm can create its own strategy, but by late markets must run with
the given strategy; early markets forgive mistakes due to high margins linked customer price
inelasticity and high growth, which gives recovery time to the firm that, commits a mistake. But
late markets are not forgiving as asset bases to produce goods for the market balloon, hence
mistakes of mismatch between asset base and emerging demand become costly even fatal. From
strategic choice of where to be, to implementation choice of how to produce where we are, is the
evolutionary pattern.
In essence, from our perspective, strategic choice becomes a match between the deep
structure of demand and the surface structure of supply, a supply that is conditioned by the firm’s
ability and the company to keep in step with its associated alliance.
Significant trends in the surface of the market: “the market climate”
As the firm progresses along its lifecycle in a given market, some competitive factors
increase and others decrease, and these have influence on the competitive stance of the firm and
its relationship to the deep and surface structures.
Moreover, the factors become a constraint or an opportunity set for its choice of
strategies vis a vis its competitors (generally in a monopolistic market the firm would choose the

Firm trends in markets and their consequences; mapping evolution of firm behavior using the deep and
surface structures of the market.
Koplyay, Motagh, Hurta, and Malouin
___________________________________________________________________________
______________________________________________________________________________
152
© 2019 (9th) International Conference of the AGMS Proceedings
best profit generating strategy, but in a competitive situation it must cope with both the
shareholder expectations and the constraints imposed by the competitive landscape, so it makes
tradeoffs). Monopolies produce less at a higher price and pure competition produces more at a
lower price, but potentially with more unsold products or waste.
In a conservation of resources, environment monopoly may be preferable to pure
competition.
Early markets are characterized by higher uncertainty, but many options to find the right
niche aligned with the firm’s competencies. This is known as market positioning and is a critical
means to escape the shocks imposed by the market turbulence, young firms yield to pressure and
move out of harm’s way whereas more established firms in late markets build defenses against
perturbations and shock loads and remain at the same market positions.
They cannot move due to the constraints of the significant asset base and shareholders
would not forgive sunk costs occasioned by such moves; older firms stand and fight.
Effectiveness considerations and late one by efficiency dominate the early market
scenario; finding the right place is the key to early success and executing the best cost focuses
strategy is key to late market success and this aligns perfectly with deep and surface structure
signals.
Early market customers exhibit price inelasticity and will pay the premium for the
innovative product, hence productivity is a non-issue, but by mature markets there is complete
price elasticity as products commoditize and the price is given to the firm which must now
execute against a cost leadership strategy that maximizes margins and profits.
Deep structure sends signals from the majority customer base that among other things
demands the best price for the uniform product; and the surface structure that defined the
strategy funnel now progresses to a single choice “cost leadership”.
The regime shift from effectiveness to efficiency seems to occur around the emergence of
the platform (Koplyay, 2015), This is also the emergence point of the collective strategy of an
alliance, the platform in this case, dominating the individual firm strategy.

Firm trends in markets and their consequences; mapping evolution of firm behavior using the deep and
surface structures of the market.
Koplyay, Motagh, Hurta, and Malouin
___________________________________________________________________________
______________________________________________________________________________
153
© 2019 (9th) International Conference of the AGMS Proceedings
Exhibit 5. Zones of effectiveness and efficiency in strategy (Koplyay et al, 2015).
Along with the transition from effectiveness to efficiency, we see another interesting shift
in market profile induced by the surface structure.
As the market landscape settles down and the deep structure eruptions diminish both in
intensity and frequency, market adaptation as defined by the ability to relocate diminishes, and
firm resiliency, the capacity to yield to perturbations decreases (if the capacity is not tested, it
loses its importance and atrophies, sort of an evolutionary trait). However, the robustness, which
represents the firm, is and associated alliance’s ability to resist shocks, in situ, increases.
One of the key features is that the firm gets more submerged and committed to its
alliance, cluster or value chain and in the process loses significant identity and independence of
choice.
Nevertheless, collective defense is gained in the process, it is no longer fight or flight but rather
dig in a fight.
Furthermore, we find that symmetry of both firm and its alliance structure increases (as
we draw a vertical line through mid-structure of a value chain, we find a reflexive symmetry
which implies complexity of the structure is decreasing, and this is also true of its constituent
firms which are now rigid and well defined, symmetric around the center).
The simplicity implied by this symmetry leads to better controls both at the value chain
and the firm level, hence planning and execution of plans is more feasible. This is again in line
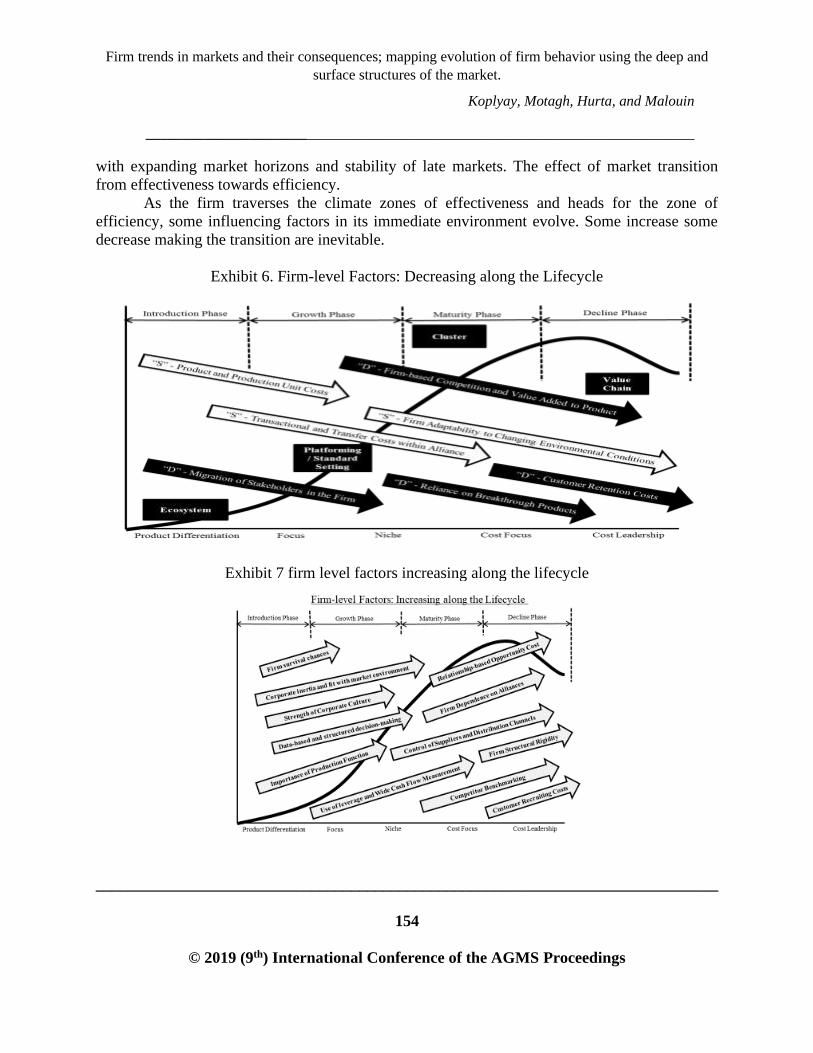
Firm trends in markets and their consequences; mapping evolution of firm behavior using the deep and
surface structures of the market.
Koplyay, Motagh, Hurta, and Malouin
___________________________________________________________________________
______________________________________________________________________________
154
© 2019 (9th) International Conference of the AGMS Proceedings
with expanding market horizons and stability of late markets. The effect of market transition
from effectiveness towards efficiency.
As the firm traverses the climate zones of effectiveness and heads for the zone of
efficiency, some influencing factors in its immediate environment evolve. Some increase some
decrease making the transition are inevitable.
Exhibit 6. Firm-level Factors: Decreasing along the Lifecycle
Exhibit 7 firm level factors increasing along the lifecycle

Firm trends in markets and their consequences; mapping evolution of firm behavior using the deep and
surface structures of the market.
Koplyay, Motagh, Hurta, and Malouin
___________________________________________________________________________
______________________________________________________________________________
155
© 2019 (9th) International Conference of the AGMS Proceedings
On the increasing trends side, we note the slow loss of firm identity and the contribution
by its alliance to the value added of the product
The firm is progressively subsumed into its alliance until at the value chain stage it no
longer has strategy independence but must play second violin to the value chain strategy, usually
dictated by the dominant partner.
Honda as an engine company plays a very different role in its chain than Toyota, the car
company
The firm adaptability is also submerged into that of its alliance until at the end it’s the
whole value chain that survives or nothing does.
Transaction costs within the alliance also decrease as the market progresses and the
alliance starts to flatten until it is completely linear making the flow of goods more secure and
cheaper and through supply chain and distribution channels management. But this flattening
makes every component of the chain critical and suppression of any component causes the chain
to fail. Similarly, as the firm progresses along the lifecycle, its need for customers increases just
as its costs to recruit those increases as well.
The market is heading for zero sum game, the customer I lose becomes the customer
some competitor gains.
Yet the firm needs them more than ever to execute against the economies of scale
strategy.
This dilemma is often solved through an intense period of M&A and the net result is a
becalming of market behavior and an oligopolistic equilibrium.
As soon as this event transpires the market horizons become clearer, the customer base
predicable and soon enough the only real strategic insights are gained from following the
competition’s moves resulting tin the rise of competitive benchmarking as the key strategic
function within the firm
The uptake of breakthrough innovation diminished as markets mature and firms start to
focus on incremental innovation to improve productivity. Every diminishing factor seems to
drive the firm to a cost focus that finally slows the evolution of the market into a stalemate.

Firm trends in markets and their consequences; mapping evolution of firm behavior using the deep and
surface structures of the market.
Koplyay, Motagh, Hurta, and Malouin
___________________________________________________________________________
______________________________________________________________________________
156
© 2019 (9th) International Conference of the AGMS Proceedings
Similarly, we see the increasing factors exert similar pressures. As corporate arteries
harden and culture becomes more risk averse and sclerotic, less breakthrough ideas filter into the
firm.
In addition, the risk avoidance instills more corporate inertia and opportunity costs of
dealing with firms outside the prevailing alliance increase until only one option of operating
within the chosen alliance remain.
Nevertheless, this is fortuitous, as the cost leadership strategy will demand a close
cooperation within alliances to produce the best product at the lowest cost, which will create the
competitive margins necessary for survival
From survival of the nimblest in early markets to survival of the fattest in late markets.
As the firm grows in size it gains both width and depth, more functions and more layers
within functional groupings, and again this leads to better execution of efficiency strategies as
narrower tasks and higher repetition of the same task generates learning curves and results in a
better adapted firm to its chosen position in the market.
These efficient and stable structures can now better interact with suppliers that are now
locked into the firm’s universe to help deliver higher productivities. From lose supply chains to
highly integrated ones
In addition, there looms the value chain as soon as distribution channels are mastered the
way the supply chain is.
Conclusions
It appears that in the market universe all roads lead to Rome. There is an amazing
coincidence and correspondence between the various elements of market evolution, from the
deep to the surface structure, from one climate zones the next from the crises points along the
surface to the strategies being pursued by the firm or it is ever tightening alliance.
We see that the singular survival struggle of the firm in the effectiveness zone to the
cooperative and collective survival mode of the efficiency zone, all answer to a logical
imperative of survival through adaptation that is linked both to the strategic acumen of the firm
or its collective house and the market signals that light the way along the lifecycle.

Firm trends in markets and their consequences; mapping evolution of firm behavior using the deep and
surface structures of the market.
Koplyay, Motagh, Hurta, and Malouin
___________________________________________________________________________
______________________________________________________________________________
157
© 2019 (9th) International Conference of the AGMS Proceedings
The market does have a life of its own and it exerts a very plausible discipline on the
firms in the market, furthermore this market life is evolving as the firms move along the lifecycle
in very predictive fashion
If I know where you are on the cycle, I can predict your past and future.
There is very little surprise in market demands and a very standard response to these
demands by the firms.
Our series of articles on this surprising predictability leads to the same conclusion every
time.
Starting with the deep structure and a surface structure supported lifecycle thee market
and firms behavior can be symmetrically forecasted in time once the firm and its accompanying
alliance can be located on the cycle.

Firm trends in markets and their consequences; mapping evolution of firm behavior using the deep and
surface structures of the market.
Koplyay, Motagh, Hurta, and Malouin
___________________________________________________________________________
______________________________________________________________________________
158
© 2019 (9th) International Conference of the AGMS Proceedings
Selected References
Chan Kim, W., & Mauborgne, R. (2005). Value innovation: a leap into the blue ocean. Journal
of business strategy, 26(4), 22-28.
Jazouli, A. (2016). THE DYNAMICS OF ALLIANCES FORMATION IN HIGH-TECH
MARKETS; FROM ECOSYSTEMS TO VALUE CHAINS. In Proceedings of the
International Annual Conference of the American Society for Engineering
Management. (pp. 1-9). American Society for Engineering Management (ASEM).
Koplyay, T., Mitchell, B., & Cohn, S. (2015). Stability of firms under nonlinear and linear
market conditions. In Proceedings of the 2015 Industrial and Systems Engineering Research
Conference.
Koplyay, T., & Hurta, H. (2016). “Clock speed” theory of strategy making along the life
cycle. Polish Journal of Management Studies, 13.
Koplyay, T., Mitchell, B., & Cohn, S. (2015). Stability of firms under nonlinear and linear
market conditions. In Proceedings of the 2015 Industrial and Systems Engineering Research
Conference.
Koplyay, T., & Mitchell, B. (2014). The Evolution of Complexity Within Firms. In Institute of
Industrial Engineers, Proceedings of IEE Conference, Montreal, QC.
Moore, M. H. (1995). Creating public value: Strategic management in government. Harvard
university press.
Tiwana, A., Konsynski, B., & Bush, A. A. (2010). Research commentary—Platform evolution:
Coevolution of platform architecture, governance, and environmental
dynamics. Information systems research, 21(4), 675-687.
The Relationship Between Ethical Leadership and Nurse Job Performance: Boundary Conditions and
Influence Processes
Chen and Tian
___________________________________________________________________________
______________________________________________________________________________
159
© 2019 (9th) International Conference of the AGMS Proceedings
The Relationship Between Ethical Leadership and Nurse Job Performance: Boundary
Conditions and Influence Processes
Zhihong Chen (Corresponding author)
Institute for International Students, Nanjing University
Address: No. 22, Hankou Road, Nanjing, 210093, China
Telephone: 86-15051892288
Feng Tian
Business School, University of Newcastle
Newcastle, NSW2230, Australia.
Telephone: 61-2-49215981
Abstract
A study was carried out amongst 363 supervisor–subordinate dyads to investigate the effect
mechanism of ethical leadership on nurses’ job performance. It was found that ethical leadership
is positively related to nurses’ job performance, with psychological ownership as the mediator.
Emotional support from colleagues was discovered to moderate the effect on the relationship
between psychological ownership and job performance, while the moderation role of
professional commitment on between psychological ownership and job performance was not
validated. Our findings suggest that ethical leadership not only has a normative role by
encouraging ethical behavior among followers, but also has a positive impact on in-role
performance by strengthening followers’ individual motivational propensity and alignment in
goals between leaders and followers.
Key words: Ethical leadership, Psychological ownership, Emotional support, Professional
commitment, Nurses

The Relationship Between Ethical Leadership and Nurse Job Performance: Boundary Conditions and
Influence Processes
Chen and Tian
___________________________________________________________________________
______________________________________________________________________________
160
© 2019 (9th) International Conference of the AGMS Proceedings
THE RELATIONSHIP BETWEEN ETHICAL LEADERSHIP AND NURSE JOB
PERFORMANCE: BOUNDARY CONDITIONS AND INFLUENCE PROCESSES
I. Introduction
Nursing work is an important part of medical and health undertakings. It plays an
important role in safeguarding the health interests of the people, ensuring the safety of patients,
establishing harmonious doctor-patient relationship and sustainable development of hospitals.
There is a comprehensive recognition that the present status of public healthcare system requires
significant reforms in China. In addition, although the quality of them has great influences on
patients (Lin, Huang & Lu, 2013), the reality sees the deficiency of nursing human resources and
loss of frontline nurses, which negatively influence the function of the whole medial service
system. Therefore, it is an urgent issue to develop strategies to help improve nurses’ work
performance.
In the field of nurse management, the effects of leadership on nurse’s work performance
are validated (Laschinger, Finegan, Wilk, 2009), which can ultimately benefit nursing profession,
the patients and the organization. Most researches focus on transformational leadership
(Salanova et al.,2011; Khan et al., 2018), authentic leadership (Laschingeret al.,2013;
Dirik et al. 2017; Alilyyani et al., 2018), and empowering leadership(Bobbio et al.,2012;
Freire et al., 2015). However, in the recent two years, with frequent occurrence of ethical and
moral incidents in the field of health care such as hospitals (Aitamaa et al., 2010), which is not
conducive to the sustainable development of hospitals, more and more attention is required to be
paid to the role of ethical leadership in nurse management (Islam et al., 2018; Ozden et al.,
2017). The link between ethical leadership and employee outcomes have been validated in a
number of studies, including citizenship behaviors, deviant behaviors, and employees’ ethical
conduct and cognitions (Avey, Luthans & Youssef-Morgan, 2010; Piccolo, Greenbaum, Hartog
& Folger, 2010; Schaubroeck, Hannah, Avolio, Kozlowski, Lord, Trevino, Dimotakis & Peng,
2012; Walumbwa et al., 2010). However, research on the mechanism and contextual factors of
the impact of ethical leadership on work performance is quite far from enough.
Employees’ psychological ownership for the organization has been proved to be
positively related to job satisfaction, organizational commitment, organizational citizenship
behavior (O’Driscoll, Pierce, & Coghlan, 2006; Van Dyne & Pierce, 2004), and performance
(Park et al. 2015; Aryee et al. 2009). In this sense, it is of certain value and significance for
researches to approach the effect mechanism of ethical leadership, that is boundary conditions
and influence processes with psychological ownership as a potential mediator variable included.
The Relationship Between Ethical Leadership and Nurse Job Performance: Boundary Conditions and
Influence Processes
Chen and Tian
___________________________________________________________________________
______________________________________________________________________________
161
© 2019 (9th) International Conference of the AGMS Proceedings
There are more scholars focusing on the antecedent or outcome variables of
psychological ownership than those discussing the moderating factors between psychological
ownership and employees' outcome variables (Dawkins et al., 2017). Only five researchers are
found to explore the boundary conditions between psychological ownership and work results
(Brown et al., 2014; Ramos et al., 2014). This paper attempts to discuss the boundary conditions
between psychological ownership and employee performance.
More and more researchers realize the importance of support from colleagues in the study
of influencing mechanism on nurses' working attitude and behavior(Li, Early, Rao Evans,,
Goldman Z W, Booth-Butterfield, M., 2017). Colleague support is expressed as emotional
attention to employees, information provision and the creation of a harmonious interpersonal
atmosphere (Tse, Dasborough, & Ashkanasy, 2008,Morgan, 2011). Working in a stressful
environment, nurses inevitably face negative emotions such as anxiety and fear. Support from
colleagues, especially emotional support, is very important to help nurses relieve stress and
improve self-efficacy.
Moreover, nursing is a humanistic profession with a unique scientific body and needs
theoretical education, practical skill, and professional autonomy (Jafaragaee, Parvizy, Mehrdad
& Rafii, 2012). Nursing has specific criteria, including a strong commitment to offering services
to the society, belief in each individual’s respect and value, commitment to education and
autonomy. Highly committed nurses are more responsible for delivering health care for the
patients,which provides an important factor for the establishment of a sustained doctor-patient
relationship.
Taken together, for the sustainable development of hospitals and to fulfill the social
responsibility, we thus seek to disclose the controlling effect of ethical leadership on employee
work performance and attempt to make certain contributions as follows: firstly, the role of a
motivational resource (i.e., psychological ownership) is identified and verified as a critical
mechanism for ethical leadership to influence work performance positively; secondly, the
moderating role is focused on, yet scarcely investigated, in the ethical leadership–employee work
performance link, that is, affective support from colleagues and career commitment in caring
service. This study addresses the above-mentioned challenges based on the theories of social
exchange and social learning, which help suggest our study’s hypotheses. And the conceptual
framework developed is shown in Figure 1.

The Relationship Between Ethical Leadership and Nurse Job Performance: Boundary Conditions and
Influence Processes
Chen and Tian
___________________________________________________________________________
______________________________________________________________________________
162
© 2019 (9th) International Conference of the AGMS Proceedings
Figure 1. The Conceptual Framework
II. Hypothesis Development
1. Ethical Leadership and Work performance
Leaders' ethical behavior not only affects their own credibility, but also their
subordinates' moral behavior (Brown et al., 2005, p.120). Ethical leadership is defined as “the
demonstration of normatively appropriate conduct through personal actions and interpersonal
relationships, and the promotion of such conduct to followers through two-way communication,
reinforcement, and decision making” (Brown et al., 2005, p.120). Ethical leadership not only
embodies the leader himself as an ethical person characterized by honesty, integrity, fairness and
approachability, but also as an ethical manager sets up a moral example, guides subordinates to
abide by good moral norms, and adopts ethical strategies to influence employees' behavior.
This study suggests that ethical leadership plays a positive role in nurses' work
performance. Social learning theory and social exchange theory can be used as important
explanatory frameworks (Ahn, Lee, &Yun, 2018). According to social learning theory (Bandura,
1977), individuals are influenced by other people's attitudes and behaviors. In other words,
individuals observe other people's behavior and choose acceptable and normative behavior.
Leadership is an important source for subordinates to imitate and learn normative behavior.
Ethical leadership shows high work ethics, caring for subordinates, and two-way communication
psychological
ownership Ethical
leadership
Emotional
support
Job performance
Career
commitment

The Relationship Between Ethical Leadership and Nurse Job Performance: Boundary Conditions and
Influence Processes
Chen and Tian
___________________________________________________________________________
______________________________________________________________________________
163
© 2019 (9th) International Conference of the AGMS Proceedings
with subordinates. (Brown, Treviño & Harrison, 2005; Islam et al., 2018), so it can be a better
source of subordinate behavior guidance (Brown and Treviño, 2006, Brown & Mitchell 2010).
Some empirical studies have also shown that ethical leadership has a positive impact on
organizational commitment (Nuebert et al. 2009) and organizational citizenship behavior (Mayer
et al. 2009). Nurses' work is required to abide by medical ethics, do their best and care for others.
Therefore, a nurse with ethical leadership is often influenced by leadership's role model effect,
and will be more concerned about patients. She/he demands her/his work with higher medical
ethics standards, thus having higher work performance.
According to the theory of social exchange, the exchange between individuals and
organizations includes not only material exchanges (such as remuneration for work, etc.) but also
psychological (or social) ones, such as trust, support, respect, etc. (Blau, 1964). In the process of
social exchange, based on the principle of "reciprocity", individuals will make greater efforts to
behave in favor of organization, which is manifested by high organizational commitment, job
performance, organizational citizenship behavior and so on. Leaders are often seen as agents of
organizations. Studies have indicated that ethical leaders are sincere to their subordinates, care
for their needs, respect their subordinates, and communicate with them fully, thus establishing a
high-quality LMX (Walumbwa et al., 2011). When they establish the relationship of trust with
their leaders, nurses perceive the concern and support of leaders for their work, the fairness of
job performance evaluation, and based on the principle of reciprocity nurses will devote more
efforts to work, and they will be able to solve problems more actively in response to the pressure
of work, showing a higher level of work performance.
Therefore, it is proposed as follows:
H1: Ethical leadership is positively related to work performance.
2. Mediation Effect of Psychological Ownership on the Relationship between Ethical
Leadership and Work performance
In order to explore feasible strategy to reduce the rate of turnover and even eliminate
turnover, group/organizational management perspective can be an important organizational
contextual effect strategy, which highlights ethical leadership in effective changing individual
attitude and behaviors.
Ethical leadership can effectively change individual working attitude and behavior, which
becomes an important group/organizational contextual effect strategy. Treviño et al (2006)
pointed out that an ethical leader is a moral person at first, which means he/she follows a series
of basic ethic morals and puts into effect during daily life and work (Brown, 2007); secondly,
he/she should be a moral manager, urging subordinates to understand the value of ethic morals,
The Relationship Between Ethical Leadership and Nurse Job Performance: Boundary Conditions and
Influence Processes
Chen and Tian
___________________________________________________________________________
______________________________________________________________________________
164
© 2019 (9th) International Conference of the AGMS Proceedings
leading them to do right things by setting up goals, caring about subordinates, sharing power,
emphasizing integrity, upholding justice, ethic guiding and focusing on sustainability
(Kalshoven, K., Den Hartog, D. N., & De Hoogh, A. H., 2011). In addition, ethic leader is
willing to listen to employees’ thinking about work (Kalshoven et. al, 2011), and employees tend
to feedback in time about work schedule. Besides, the work performance is not the only focus of
this kind of leader, and work experience of employees is also concerned by him/her (Brown et
al., 2005).
Specifically, when interacting with contextual factors, ethic leadership in this case,
employees’ psychological ownership is strengthened or weakened, which thereupon create
positive or negative effects on their work performance. Furby (1978) believes that ownership can
stimulate the responsibility effecting on behaviors. When the three basic motives of employees
(place, self-efficacy and self-identity) are satisfied, employees will be active at protecting
organization and completing the actions expected in their roles in the organization (Dyne &
Pierece, 2004). Therefore, the mediation effect of psychological ownership on the relationship
between ethic leadership and work performance is proposed.
H2: Psychological ownership mediates the relationship between ethical leadership and work
performance.
3. Moderation Effect of Career Commitment and Emotional Support
Career commitment (CC). Psychological ownership is concerned about “to what extent
do I feel this organization is mine?”, which is not naturally transferred to positive working
behaviors. The effect of psychological ownership on work performance is still dependent on the
answer to “why do I need to protect my status in the organization”, which we interpret as
career/occupational commitment. Career/occupational commitment is defined as the
“psychological link between an individual and his/her career/occupational that is based on an
affective reaction to that career/occupation” (Lee, Carswell, & Allen, 2000, p. 800).
Studies have indicated that career commitment is positively related with job satisfaction
(Satoh, Asakura, Watanabe, & Shimojo, 2015), and negatively associated with job stress (Lee et
al., 2000; Wang, Smailes, Sareen, Schmitz, Fick G, & Patten, 2012). If an employee experiences
low career commitment, he/she tends to leave the job, easily get stressed and seldom enjoy the
satisfaction from work, it is reasonable for him/her to ensure the quality of work, never to talk
about work performance. On the contrary, an employee can be better able to cope with work-
related stress if he/she has higher career commitment.
Unlike individuals in other fields who might not have the opportunity to use their
professional skills regularly, clinical staff are constantly and actively engaged in the very

The Relationship Between Ethical Leadership and Nurse Job Performance: Boundary Conditions and
Influence Processes
Chen and Tian
___________________________________________________________________________
______________________________________________________________________________
165
© 2019 (9th) International Conference of the AGMS Proceedings
behaviors that define their professional role. Commitment to promoting caring abilities satisfying
of being a nurse and belonging to the nursing profession are identified in the fieldwork phase.
Research found that nurse’s career commitment has a positive impact on patient safety and care
quality (Teng, Dai, Shyu, Wong, Chu, and Tsai ,2009). Therefore, the moderation role of career
commitment in the effects of psychological ownership on work performance is proposed.
H3: Career commitment positively moderates the relationship between psychological ownership
and work performance.
Emotional support (ES). Ethical leadership can create positive working environment,
leading to a certain extent of psychological ownership. However, the direct support from the
peers can exactly decide the final success of the job. Researches validate that social support is
negatively related with work burnout by providing buffer effect (Walsh M, Dolan B, Lewis A,
1998), less of which focus on the support from coworkers. Especially in China's culture of higher
power distance, employees are more likely to talk with colleagues than to leaders when they
encounter difficulties. Therefore, emotional support from colleagues may be an important
contextual factor affecting employee performance. When employees have higher psychological
ownership, they perceive a higher sense of belonging and have self-efficacy in overcoming
difficulties and learning when they encounter difficulties in their work(Avey et al.,2009).
But at the same time, some scholars have found that high level of PO may also be negatively
related to individual physical and mental health, leading to workaholism (Oates, 1971) and job
burnout (Maslach & Goldberg, 1998). Nurses' work needs more help from colleagues and team
work is the main form, since there are many emergencies and exceptions in their work. When the
level of workplace friendships is high, the positive effect of psychological ownership will be
stronger. In the case of job burnout or depression caused by high psychological ownership,
colleagues' emotional support can effectively alleviate the generation of stress, thus producing
more positive emotions, and thus improving job performance. While if the emotional support of
colleagues is very low, it is easier to enhance the possibility of negative consequences of
psychological ownership and reduce its positive role.
Therefore, the moderation role of emotional support on the effect of psychological
ownership is also proposed.
H4: Emotional support from coworkers positively moderates the relationship between
psychological ownership and work performance.

The Relationship Between Ethical Leadership and Nurse Job Performance: Boundary Conditions and
Influence Processes
Chen and Tian
___________________________________________________________________________
______________________________________________________________________________
166
© 2019 (9th) International Conference of the AGMS Proceedings
III. Methodology
1. Research Design and Setting
A paper-and-pencil questionnaire including measures of ethical leadership, psychological
ownership, career commitment, emotional support, work performance, demographic questions
was administered to nursing staff and their immediate leader of eight Chinese hospitals.
Participation to the study was voluntary and questionnaires were completed during working
hours. Data were collected from two sources to avoid single source bias: one is frontline nurses
and the other is their immediate supervisors. Before the survey was conducted, a training was
delivered by heads of each department to all the participants about the purpose of this survey to
assure the confidentiality and anonymity of the responses, and to emphasize the voluntary nature
of participation.
We number coded the surveys to match the responses of each nurse with those of his/her
supervisor. After deleting invalid, incomplete and unmatched questionnaires, a total of 363 valid
supervisor–subordinate dyad questionnaires constituted the final sample for the study, which
represented 75.6 percent of all the respondents we surveyed. Of the 363 subordinate respondents,
all female nurses, relatively young (aged between 20 and 35 years covered 83.2 percent), and
well educated (holding bachelor degree and above covered 86.2 percent). The average job tenure
was 9.83 years.
2. Measures
The Chinese version of questionnaires were created following the translation and back-
translation procedures (Brislin,1986), which were measured on a 7-point Likert scale by asking
for agreement with the statements (1 = strongly disagree,7 = strongly agree).
Ethical leadership. This was measured by eight items (e.g. ‘my leader listened to what
an employee had to say.’ my leader disciplined an employee who violated ethical standards)
taken from the study from Lin, Ma and Johnson (2016). The Cronbach’s alpha for this scale
was .88.
Psychological ownership. Nurses completed the psychological ownership scale,
Psychological ownership for the organization was measured using Van Dyne and Pierce’s (2004)
Seven-item scale (e.g. This is MY organization; I sense that this organization is OUR hospital).
The Cronbach’s alpha for this scale was .93.

The Relationship Between Ethical Leadership and Nurse Job Performance: Boundary Conditions and
Influence Processes
Chen and Tian
___________________________________________________________________________
______________________________________________________________________________
167
© 2019 (9th) International Conference of the AGMS Proceedings
Career commitment. The Macleod Clark Professional Identity sub-scale (Licata & Klein
2002) was used to measure career commitment. Specifically, five items were taken (e.g. ‘I’m
proud to be a nurse/physician’). Previously reported reliability for the whole scale was a = 0.83.
Emotional support. Emotional Support was measured using the five-item scale
developed by Methot, Lepine, Podsakoff and Christian (2015). Sample items are “My coworkers
share related personal experiences as an alternative perspective to my problems. “My coworkers
listen to me when I’m frustrated about something and need to vent”. The Cronbach’s alphas of
the scale was 0.93.
Work performance. Work performance was measured by the immediate supervisors,
using the six-item scale developed by Singh, Verbeke and Rhoads (1996) with Cronbach’s
reliability coefficient of 0.90.
Control variables. Several control measures were used to eliminate influences related to
outcomes in our model: age, gender, marital status, education level and job tenure.
3. Results
Confirmatory factor analyses. We performed a series of CFAs to assess the
discriminant validity of the study variables. We also compared model with a series of alternative
models. The results indicated that the hypothesized five-factor model (χ2= 1361.48, df= 424; CFI
= 0.89; TLI = 0.88; RMSEA = 0.08) presented a significant change in chi-square compared with
other models.
Table 1. Results of confirmatory factor analyses
Model χ2 Df RMSEA CFI TLI
Five-factor model 1361.48 424 0.08 0.89 0.88
Four-factor modela 1701.18 428 0.09 0.85 0.83
Three-factor
modelb 2407.20 431 0.11 0.76 0.74
Two-factor modelc 3139.12 433 0.13 0.68 0.65
Single-factor
modeld 3761.42 434 0.15 0.60 0.57
a Combines CC and ES into one factor.
b Combines PO, CC, and ES into one factor
c Combines EL and PO into one factor, other variables are combined into one
factor
d Combines all variables into one factor

The Relationship Between Ethical Leadership and Nurse Job Performance: Boundary Conditions and
Influence Processes
Chen and Tian
___________________________________________________________________________
______________________________________________________________________________
168
© 2019 (9th) International Conference of the AGMS Proceedings
Following the suggestions of Podsakoff, Mackenzie, Lee and Podsakoff (2003), the
results of a Harman one-factor test indicated that the fit was unacceptable (χ2/df = 8.67; CFI =
0.60; TLI = 0.57; RMSEA = 0.15). Meanwhile, the data was collected from different sources. In
conclusion, we are assured that our findings were not seriously threatened by common method
bias.
Correlations among study variables. Table 2 displays the means, standard deviation
and correlation Coefficients among the variables. The correlations indicate that ethical leadership
is significantly associated with psychological ownership and work performance (r=0.68, p<0.01;
r=0.45, p<0.01, respectively). We also found that the psychological ownership was significantly
related to work performance (r=0.59, p<0.01).
Table 2 Mean Values, Standard Deviation and Correlation Coefficients
Variables 1 2 3 4 5 6 7 8 9
1.Age 1.00
2.Marital
status 0.08 1.00
3.Educatio
nn
.418*
* 0.03 1.00
4.Tenure .764*
* 0.10 .462
** 1.00
5.EL -0.04 -
0.06 0.01 -
0.05 1.00
6.PO -0.04 -
0.08 0.03 -
0.04
.68*
* 1.00
7.ES -0.08 0.00 -
0.01
-
0.09
.56*
*
.65*
* 1.00
8.CC -0.04 -
0.08 0.04 -
0.08
.35*
*
.42*
*
.34*
* 1.00
9.JP -0.01 -
0.04 0.05 -
0.01
.45*
*
.59*
*
.61*
*
.37*
* 1.00
Mean
value 2.71 1.83 2.38 117.
95 5.07 5.15 5.32 5.19 4.67
SD 0.81 0.47 0.72 100.
30 1.30 1.40 1.46 1.26 1.42
Note:** p < 0.01,* p < 0.05;
Regression models. In addition, we followed Kenny, Kashy and Bolger’s (1998)
procedure to test the mediating effects of psychological ownership. In step 1, ethical leadership is
expected to be significantly related to work performance, which was tested and verified model 2,
r =0.33; P<0.01), offering support for H1. In step 2, the relationship between ethical leadership
and psychological ownership was also validated (model 7, r=0.67; p<0.01). In the last step, for
full mediation of the effect of our mediating variables, the relationship between ethical
leadership and work performance become non-significant (model3, r=0.11, ns). In a word, the
results reveal that the relationship between ethical leadership and work performance was
completely mediated by psychological ownership, offering support for H2.

The Relationship Between Ethical Leadership and Nurse Job Performance: Boundary Conditions and
Influence Processes
Chen and Tian
___________________________________________________________________________
______________________________________________________________________________
169
© 2019 (9th) International Conference of the AGMS Proceedings
Table 3. Model results
Note:** p < 0.01,* p < 0.05;
Hypotheses 3 and 4 predicted that career commitment and emotional support enhanced
the psychological ownership–work performance relationship. From Table 3, We found that the
psychological ownership–career commitment interaction term is not significantly related to work
performance (model 5, r =0.04, ns,), Hypotheses 3 is not supported. We further found that the
Variable JP PO
Control variable M1 M2 M3 M4 M5 M6 M7
Age 0.0
3 0.04 0.06 0.06 0.06 -
.07 -0.03
Marital status -.07 -.05 -0.04 -.041 -0.04 -
.08 -0.04
Education .08 .07 0.05 0.05 0.05 .07 0.04
tenure -.13 -.12 -.11 -.121 -0.12 -
.02 0.01
Independent
variable
EL .33*
* .11 .67**
Mediation
variable
PO .33** 0.28*
*
0.32*
*
CC 0.17*
* 0.14
ES 0.04 0.12
Interaction effect
PO× CC 0.04
PO × ES 0.18*
*
Adjusted R2 0.0
1 0.11 0.17 0.19 0.21 0.0
0 0.45
∆R2 0.0
2
0.11
**
0.06*
* 0.18 0.03*
*
0.0
1
0.44*
* F 1.5
0
9.81
**
12.92
**
12.26
**
11.47
**
1.1
0
56.96
**

The Relationship Between Ethical Leadership and Nurse Job Performance: Boundary Conditions and
Influence Processes
Chen and Tian
___________________________________________________________________________
______________________________________________________________________________
170
© 2019 (9th) International Conference of the AGMS Proceedings
psychological ownership–emotional support interaction term significantly related to work
performance (model 5, r = 0.18, p < .01), thereby supporting Hypothesis 4. Figure 2 was plotted
following Aiken and West’s (1991) procedure to illustrate the nature of the significant
interactions. Figure 2 shows that ethical leadership had stronger positive effects on work
performance when employees received higher levels of emotional support. Such evidence further
supported Hypotheses 4.
Figure 2. Interaction of PS and ES on Job Performance.
IV. Discussion
This study found that ethical leadership has a significant positive impact on nurses' work
performance in the medical system. Based on social learning theory and social exchange theory,
ethical leadership shows integrity, honesty, fairness, concern for subordinates, two-way
communication and a strong sense of ethics and morality, which can improve the performance of
subordinates. Secondly, ethical leadership affects employees' performance through psychological
ownership. Psychological ownership plays a complete mediation role. Ethical leadership
stimulates the improvement of employee's psychological ownership through the satisfaction of
subordinates' place, self-efficacy and self-identity, and then improves the level of work
performance. Thirdly, colleagues' emotional support has a significant moderating effect between
psychological ownership and work performance. Colleagues' emotional support can alleviate the
possible pressure and depression caused by high psychological ownership, thus enlarging the
positive role of psychological ownership.
1. Theoretical Implications
The purpose of this paper is to reveal how ethical leadership of nurses in the medical
system can promote nurses to show higher performance in the workplace. There are three main
theoretical contributions in this study: firstly, this study explores the mediating mechanism and
regulating role of ethical leadership and nurses' work performance, and expands the application
context of existing researches. Most of the existing literatures discuss the impact of ethical
4.0
5.0
6.0
7.0
low PS high PS
Low ES
High ES
The Relationship Between Ethical Leadership and Nurse Job Performance: Boundary Conditions and
Influence Processes
Chen and Tian
___________________________________________________________________________
______________________________________________________________________________
171
© 2019 (9th) International Conference of the AGMS Proceedings
leadership on employees' attitudes and behaviors in the field of enterprises. With the reforming
of China's medical system and increasing concerns about the relationship between doctors and
patients, there are endless violations of medical ethics and social ethics. The impact of ethical
leadership on the hospital system needs to be paid attention to; secondly, in the previous
literature, when discussing the relationship between leadership behavior and work performance,
the main research line is social exchange theory. This study combines social learning theory and
social exchange theory, introduces psychological ownership as an important mediating variable,
and goes deep into the characteristics of nurses' work with job commitment and colleague
support added as contextual factors, which can be beneficial supplement to the existing
researches (Kark & Van Dijk 2007; Schaubroeck et al., 2012); thirdly, this paper also finds that
colleague support has a significant moderating effect between psychological ownership and work
performance, which is also an appeal for the study of moderating factors between psychological
ownership and outcome variables (Dawkins et al.,2017). In a word, this research model has
established close links in leadership, psychological ownership, work performance and other
fields, thus expanding the understanding of the relationship between leadership behavior and
work performance.
2. Managerial Implications
This study’s findings also have substantial practical implications besides the above
theoretical implications,
Firstly, considering the sustainable development of hospitals and better fulfillment of
social responsibility, hospitals should value ethics and treat it as a primary pillar on which the
foundation of their organizational culture is built. Steps need to be taken to enhance supervisors’
agreeableness and conscientiousness, since these two personal traits can lead them to exhibit
higher level of ethical leadership (Walumbwa & Schaubroeck, 2009). The personal traits, such as
integrity, transparent information sharing and accountability, need to be taken into consideration
when recruiting and promoting a nursing manager. Organizations need to invest in ethics training
and guidance on accountability, self-discipline, fairness, communications, and ethical dilemmas
to help managers improve ethical leadership (Grojean, Resick, Dickson, & Smith, 2004; Mayer,
Kuenzi, Greenbaum, Bardes, & Salvador, 2009).
Secondly, it is helpful to promote nurses’ psychological ownership to handle with poor
working environment. psychological ownership influences employees’ in-role behaviors,
promoting their initiative and accordingly reducing the cost of management and enhancing the
performance effectively. Service organizations expect employees to have higher ownership and
feel proud of being members, thus their behaviors can be favorable to the organization.

The Relationship Between Ethical Leadership and Nurse Job Performance: Boundary Conditions and
Influence Processes
Chen and Tian
___________________________________________________________________________
______________________________________________________________________________
172
© 2019 (9th) International Conference of the AGMS Proceedings
In China, nurses are under high stress, behind which the top reasons include huge work
intensity, strained relationship between patients and doctors and nurses and long working hours.
A survey reports that 90.42% nurses work over 40 hours per week and 39% of nurses even over
50 hours with at least 2 night-shifts to take care of dozens of patients per nurse. On the contrary,
the salary for over half of the nurses is less than 4000 yuan, while the average salary in the
society is 6800 yuan. It also shows that more than 50% of the nurses has psychological wounded
caused by work and even 41.2% experience offensive behavior from patients and their families.
With an aim to enhance nurses’ psychological ownership, it is suggested that
management provide vision for front-line nurses in terms of career, improve position working
conditions, and enhance the security system.
Nurses cannot be fully concentrated on their job if they see no hope or future.
Management need to satisfy their career development needs, provide chances of professional
education and training. Organizational should timely release job vacancy information and
promise fair competition. Furthermore, as to the particularity of nurse job targets and contents,
safe and health working environment is the foundation for nurses’ daily work. Regular medical
examination, strengthening disinfection, isolation and protection work and establishing medical
care personnel health files can reduce the frequency of occupational injury. Flexible working
time and shifts can adjust the potential consequences of work intensity. Besides, external buffer
area, linkage with public security early-warning department, psychological counseling activities
can help bolster the sense of security, reduce the risks on work, and relax the pressure of nurses.
From the perspective of relationship between colleagues, the organization can provide
training and guidance to promote positive relationships between colleagues and warm and
supportive work environment.
3. Limitations and Future Research Directions
There exist some limitations in this study, especially about the study design. Firstly,
although the data in this paper are from different sources, the design of the questionnaire is still
cross-sectional design, which cannot explain the causality well. Longitudinal research design can
be adopted in the future to further verify the causality. Secondly, psychological ownership of this
study is mainly at the individual level. With the increasing attention of scholars to collective
psychological ownership, the influence of leadership behavior on collective ownership and team
performance in the future, and expand the research level of the effect of ethical leadership. In
addition, the impact model of ethical leadership and work performance only considers two
contextual factors: individual career commitment and colleague support. In the future, other
factors, such self-management team atmosphere and power distance at team level can be
considered.

The Relationship Between Ethical Leadership and Nurse Job Performance: Boundary Conditions and
Influence Processes
Chen and Tian
___________________________________________________________________________
______________________________________________________________________________
173
© 2019 (9th) International Conference of the AGMS Proceedings

The Relationship Between Ethical Leadership and Nurse Job Performance: Boundary Conditions and
Influence Processes
Chen and Tian
___________________________________________________________________________
______________________________________________________________________________
174
© 2019 (9th) International Conference of the AGMS Proceedings
REFERENCE
Ahn J, Lee S, Yun S, et al. (2018). Leaders’ Core Self-evaluation, Ethical Leadership, and
Employees’ Job Performance: The Moderating Role of Employees’ Exchange Ideology.
Journal of Business Ethics, 148(2): 457-470. DOI:10.1007/s10551-016-3030-0
Aitamaa E, Leinokilpi H, Puukka P, et al. (2010). Ethical problems in nursing management:
The role of codes of ethics. Nursing Ethics. 17(4): 469-482. DOI
10.1177/0969733010364896
Aiken, L. S., & West, S. G. (1991). Multiple regression: Testing and interpreting interactions.
Thousand Oaks, CA: Sage.
Alilyyani B, Wong C A, Cummings G G, et al. (2018). Antecedents, mediators, and outcomes
of authentic leadership in healthcare: A systematic review. International Journal of
Nursing Studies, 83: 34-64. https://doi.org/10.1016/j.ijnurstu.2018.04.001
Aryee, S., Sun, L. Y. and Zhou, Q. (2009). Employee-organization relationship, psychological
ownership and contextual performance: a social exchange perspective. In Academy of
Management Proceedings. Academy of Management. 1, pp. 1-6.
Avey, J. B., Luthans, F., & Youssef, C. M. (2010). The additive value of positive psychological
capital in predicting work attitudes and behaviors. Journal of Management, 36,430-452.
DOI: 10.1177/0149206308329961
Bandura A. (1977). Self-efficacy: Toward a unifying theory of behavioral change. Psychological
Review, 84,191-215. DOI: 10.1037/0033-295X.84.2.191
Bandura A. (1986). The explanatory and predictive scope of self-efficacy theory. Journal of
Clinical and Social Psychology, 4, 359-373. DOI: 10.1521/jscp.1986.4.3.359
Blau, P. M. (1964). Exchange and power in social life. New York: Wiley.
Blau, G. (1993). Operationalizing direction and level of effort and testing their relationships to
individual job performance. Organizational Behavior and Human Decision Processes,
55,152-170. DOI: 10.1006/obhd.1993.1028
Bobbio, A., Bellan, M., & Manganelli, A. M. (2012). Empowering leadership, perceived
organizational support, trust, and job burnout for nurses: a study in an Italian general

The Relationship Between Ethical Leadership and Nurse Job Performance: Boundary Conditions and
Influence Processes
Chen and Tian
___________________________________________________________________________
______________________________________________________________________________
175
© 2019 (9th) International Conference of the AGMS Proceedings
hospital. Health Care Management Review, 37(1), 77. DOI
10.1097/HMR.0b013e31822242b2
Brislin R.W. (1986). The wording and translation of research instruments. In W. J. Lonner &
J. W. Berry (Eds.), Cross-cultural research and methodology series, Vol. 8. Field Methods
in Cross-cultural Research (pp. 137-164). Thousand Oaks, CA: Sage Publications
Brown, G., Crossley, C., & Robinson, S. L. (2014). Psychological ownership, territorial
behavior, and being perceived as a team contributor: The critical role of trust in the work
environment. Personnel Psychology, 67, 463–485. DOI:10.1111/peps.12048
Brown, M. E., & Trevin˜o, L. K. (2006). Ethical leadership: A review and future directions.
The Leadership Quarterly, 17(6), 595–616. DOI:10.1016/j.leaqua.2006.10.004
Brown M.E, Mitchell, M. S. (2010). Ethical and unethical leadership: Exploring new avenues
for future research. Business Ethics Quarterly, 20, 583-616. DOI: 10.5840/beq201020439
Brown M. E., Trevin˜o L. K, Harrison D. A. (2005). Ethical leadership: A social learning
perspective for construct development and testing. Organizational Behavior and Human
Decision Processes, 97,17-134. DOI: 10.1016/j.obhdp.2005.03.002
Brown M.E. (2007). Misconceptions of ethical leadership: How to avoid potential pitfalls.
Organizational Dynamics, 36, 140-155. DOI: 10.1016/j.orgdyn.2007.03.003
Cranmer, G A., Goldman Z W, Booth-Butterfield, M. (2017). The mediated relationship
between received support and job satisfaction: An initial application of socialization
resources theory. Western Journal of Communication, 81,64-86. DOI:
10.1080/10570314.2016.1231931
Dawkins S, Tian A W, Newman A, et al. (2017). Psychological ownership: a review and
research agenda. Journal of Organizational Behavior, 38(2): 163-183. DOI
10.1002/job.2057
Dirik, H. F., & Seren Intepeler, S. (2017). The influence of authentic leadership on safety climate
in nursing. Journal of Nursing Management. Journal of Nursing Management. 25(5):
392- 401. DOI:10.1111/jonm.12480
Dyne Van, L., & Pierce, J. L. (2004). Psychological ownership and feelings of possession: three

The Relationship Between Ethical Leadership and Nurse Job Performance: Boundary Conditions and
Influence Processes
Chen and Tian
___________________________________________________________________________
______________________________________________________________________________
176
© 2019 (9th) International Conference of the AGMS Proceedings
field studies predicting employee attitudes and organizational citizenship behavior.
Journal of Organizational Behavior, 25, 439-459. DOI: 10.1002/job.249
Freire, C. M. F. D. C., & Azevedo, R. M. M. (2015). Empowering and trustful leadership: impact
on nurses’ commitment. Personnel Review, 44(5), 702-719. DOI 10.1108/PR-01 2014-
0021
Furby L. (1978). Possession in Humans: Exploratory study of its meaning and motivation.
Social Behavior & Personality, 6, 49-65. DOI: 10.2224/sbp.1978.6.1.49
Grojean, M. W., Resick, C. J., Dickson, M. W., & Smith, D. B. (2004). Leaders, values and
organizational climate: examining leadership strategies for establishing an organizational
climate regarding ethics. Journal of Business Ethics, 55, 223-241. DOI: 10.1007/s10551-
004-1275-5
Jafaragaee F., Parvizy S., Mehrdad N., Rafii F. (2012). Concept analysis of professional
commitment in Iranian nurses. Iranian Journal of Nursing and Midwifery Research, 17,
472-479.
Jamal, M. (2007). Job stress and job performance controversy revisited: An empirical
examination in two countries. International Journal of Stress Management,14, 175-187.
DOI: 10.1037/1072-5245.14.2.175
Kalshoven, K., Den Hartog, D. N., & De Hoogh, A. H. (2011). Ethical leadership at work
questionnaire (ELW): Development and validation of a multidimensional measure.
Leadership Quarterly, 22,51-69. DOI: 10.1016/j.leaqua.2010.12.007
Kark R, Van Dijk D. (2007). Motivation to lead, motivation to follow: The role of the self-
regulatory focus in leadership processes. Academy of Management Review, 2007, 32,500
528. DOI: 10.5465/AMR.2007.24351846
Kenny, D. A., Kashy, D. A., & Bolger, N. (1998). Data analysis in social psychology. In D. T.
Gilbert, S. T. Fiske, & G. Lindzey (Eds.), The Handbook of Social Psychology, Vols. 1
and 2 (4th ed., pp. 233-265). New York, NY: McGraw-Hill.
Khan, B. P., Griffin, M. T. Q., Fitzpatrick, J. J. (2018). Staff nurses' perceptions of their nurse
managers' transformational leadership behaviors and their own structural empowerment.
Journal of Nursing Administration, 48(12): 609-614. DOI:
10.1097/NNA.0000000000000690

The Relationship Between Ethical Leadership and Nurse Job Performance: Boundary Conditions and
Influence Processes
Chen and Tian
___________________________________________________________________________
______________________________________________________________________________
177
© 2019 (9th) International Conference of the AGMS Proceedings
Kruger L.J. (1997). Social support and self-efficacy in problem solving among teacher
assistance teams and school staff. Journal of Educational Research, 90,164-168. DOI:
10.1080/00220671.1997.10543772
Laschinger, H. K., Finegan, J., & Wilk, P. (2009). Context matters: the impact of unit leadership
and empowerment on nurses’ organizational commitment. Journal of Nursing
Administration, 39, 228–235. DOI: 10.1097/NNA.0b013e3181a23d2b
Laschinger H K, Wong C A, Grau A L, et al. (2013). Authentic leadership, empowerment and
burnout: a comparison in new graduates and experienced nurses. Journal of Nursing
Management, 21(3): 541-552. https://doi.org/10.1111/j.1365-2834.2012.01375.x
Lee, K., Carswell, J. J., & Allen, N. J. (2000). A meta-analytic review of occupational
commitment: relations with person- and work-related variables. Journal Applied
Psychology, 85,799-811. DOI: 10.1037/0021-9010.85.5.799
Li A, Early SF, Mahrer NE, et al (2014). Group cohesion and organizational commitment:
protective factors for nurse residents’ job satisfaction, compassion fatigue, compassion
satisfaction, and burnout. Journal or Professional Nursing, 30(1): 89-99. DOI
10.1016/j.profnurs.2013.04.004
Licata L., Klein O. (2002). Does European citizenship breed xenophobia? European
identification as a predictor of intolerance towards immigrants. Journal of Community &
Applied Social Psychology, 12,323-337. DOI: 10.1002/casp.684
Lin H.L., Huang H.Y. & Lu M.S. (2013). The development of nursing workforce allocation
standards for acute care general wards in Taiwan. Journal Nursing Research, 21 ,298–
306. DOI: 10.1097/jnr.0000000000000002
Lin S, J., Ma, J., Johnson R., E. (2016). When ethical leader behavior breaks bad: how ethical
leader behavior can turn abusive via ego depletion and moral licensing. Journal of
Applied Psychology, 101,815-830. DOI: 10.1037/apl0000098
Liu, D., Liu, J., Kwan, H. K., & Mao, Y. (2009). What can I gain as a mentor? The effect of
mentoring on the job performance and social status of mentors in China. Journal of
Occupational & Organizational Psychology, 82, 871-895. DOI:
10.1348/096317908X380664
Liu, J., Kwan, H. K., Fu, P. P., & Mao, Y. (2013). Ethical leadership and job performance in

The Relationship Between Ethical Leadership and Nurse Job Performance: Boundary Conditions and
Influence Processes
Chen and Tian
___________________________________________________________________________
______________________________________________________________________________
178
© 2019 (9th) International Conference of the AGMS Proceedings
China: the roles of workplace friendships and traditionality. Journal of Occupational &
Organizational Psychology, 86(4), 564-584. DOI: 10.1111/joop.12027
Maslach, C., & Goldberg, J. (1998). Prevention of burnout: New perspective. Applied &
Preventative Psychology, 7, 63–74. DOI:10.1016/S0962-1849(98)80022-X
Mayer, D. M., Kuenzi, M., Greenbaum, R. L., Bardes, M., & Salvador, R. (2009). How low
does ethical leadership flow? Test of a trickle-down model. Organizational Behavior &
Human Decision Processes, 108,1-13. https://doi.org/10.1016/j.obhdp.2008.04.002
Methot, J. R., Lepine, J. A., Podsakoff, N. P., & Christian, J. S. (2015). Are workplace
friendships a mixed blessing? Exploring tradeoffs of multiplex relationships and their
associations with job performance. Personnel Psychology, 69,311–355. DOI:
10.1111/peps.12109
Meyer, J. P., Allen, N. J., & Smith, C. A. (1993). Commitment to organizations and occupations:
Extension and test of a three-component conceptualization. Journal of Applied
Psychology, 78,538–551. DOI: 10.1037//0021-9010.78.4.538
Morgan MA, Small BJ, Donovan KA, et al. (2011). Cancer patients with pain: The
spouse/partner relationship and quality of life. Caner Nurs, 34(1): 13-23. DOI
10.1097/NCC.0b013e3181efed43
Neubert M J, Carlson D S, Kacmar K M, et al. (2009). The Virtuous Influence of Ethical
Leadership Behavior: Evidence from the Field. Journal of Business Ethics, 90(2): 157-
170. DOI:10.1007/s10551-009-0037-9
Niessen, C. (2006). Age and learning during unemployment. Journal of Organizational
Behavior, 27(6), 771-792. DOI: 10.1002/job.400
Oates, W. E. (1971). Confessions of a workaholic: The facts about work addiction. New York:
World
O'Connell, C. B. (2014). Gender and the experience of moral distress in critical care nurses.
Nursing Ethics, 22(1), 32-42. DOI:10.1177/0969733013513216
O’Driscoll, M P, Pierce J L, Cogh Lan A. (2006). The Psychology of Ownership: Work
Environment Structure, Organizational Commitment, and Citizenship Behaviors, Group

The Relationship Between Ethical Leadership and Nurse Job Performance: Boundary Conditions and
Influence Processes
Chen and Tian
___________________________________________________________________________
______________________________________________________________________________
179
© 2019 (9th) International Conference of the AGMS Proceedings
& Organization Management, 31, 388-415. DOI: 10.1177/1059601104273066
Ouweneel, E., Taris, T. W., Van Zolingen, S. J., & Schreurs, P. J. (2009). How task characteristics
and social support relate to managerial learning: empirical evidence from Dutch home care.
Journal of Psychology, 143,28-44. https://doi.org/10.3200/JRLP.143.1.28-44
Ozden D, Arslan G G, Ertugrul B, et al. (2017). The effect of nurses’ ethical leadership and
ethical climate perceptions on job satisfaction. Nursing Ethics. DOI
10.1177/0969733017736924
Park C H, Kim W, Song J H, et al. (2015). The Impact of Ethical Leadership on Employees’
In‐Role Performance: The Mediating Effect of Employees’ Psychological Ownership.
Human Resource Development Quarterly, 26(4): 385-408. DOI:10.1002/hrdq.21217
Piccolo, R. F., Greenbaum, R. L., Den Hartog, D. N., & Folger, R. (2010). The relationship
between ethical leadership and core job characteristics. Journal of Organizational
Behavior, 31 ,259-278. DOI: 10.1002/job.627
Podsakoff, P. M., Mackenzie, S. B., Lee, J. Y., & Podsakoff, N. P. (2003). Common method
biases in behavioral research: a critical review of the literature and recommended
remedies. Journal Applied Psychology, 88,879-903. DOI: 10.1037/0021-9101.88.5.879
Raja, U., Johns, G., & Ntalianis, F. (2004). The impact of personality on psychological
contracts. Academy of Management Journal, 47(3): 350-367. DOI: 10.2307/20159586
Ramos, H. M., Man, T. W. Y., Mustafa, M., & Ng, Z. Z. (2014). Psychological ownership in
small family firms: Family and non-family employees’ work attitudes and behaviors.
Journal of Family Business Strategy, 5, 300–311. DOI:10.1016/j.jfbs.2014.04.001
Rao A, Evans L, Mueller C, et al (2014). Nursing home directors of nursing and the
interprofessional ream: a nerwork of support. Nursing Research, 63(2): 84.
Salanova M, Lorente L, Chambel M J, et al. (2011). Linking transformational leadership to
nurses' extra-role performance: the mediating role of self-efficacy and work engagement.
Journal of Advanced Nursing, 67(10): 2256-2266. https://doi.org/10.1111/j.1365
2648.2011.05652.x
Satoh, Asakura, Watanabe, & Shimojo. (2015). Reliability and validity of the Japanese version

The Relationship Between Ethical Leadership and Nurse Job Performance: Boundary Conditions and
Influence Processes
Chen and Tian
___________________________________________________________________________
______________________________________________________________________________
180
© 2019 (9th) International Conference of the AGMS Proceedings
of the occupational commitment scale. Journal of Japan Academy of Nursing Science,
35,63-71. DOI: 10.5630/jans.35.63
Schaubroeck, J., Hannah, S. T., Avolio, B. J., Kozlowski, S. W., Lord, R. G., Trevino, L. K., ...
& Peng, A. C. (2012). Embedding ethical leadership within and across organizational
levels. Academy of Management Journal, 55,1053-1078. DOI: 10.5465/amj.2011.0064
Shepherd, D. A., Covin, J. G., & Kuratko, D. F. (2009). Project failure from corporate
entrepreneurship: managing the grief process. Journal of Business Venturing, 24,588-600.
DOI: 10.1016/j.jbusvent.2008.01.009
Singh, J., Verbeke, W., & Rhoads, G. K. (1996). Do organizational practices matter in role
stress processes? A study of direct and moderating effects for marketing-oriented
boundary spanners. Journal of Marketing, 60,69-86. http://dx.doi.org/10.2307/1251842
Talat Islam, Ishfaq Ahmed, Ghulam Ali, (2018). Effects of ethical leadership on bullying and
voice behavior among nurses: Mediating role of organizational identification, poor
working condition and workload. Leadership in Health Services.
https://doi.org/10.1108/LHS-02-2017-0006
Teng, C., Dai, Y., Shyu, Y. L., Wong, M., Chu, T., & Tsai, Y. (2009). Professional commitment,
patient safety, and patient-perceived care quality. Journal of Nursing Scholarship, 41,
301- 309. DOI: 10.1111/j.1547-5069.2009.01289.x
Toor, S., & Ofori, G. (2009). Ethical leadership: Examining the relationships with full range
leadership model, employee outcomes, and organizational culture. Journal of Business
Ethics, 12,533-547. DOI: 10.1007/s10551-009-0059-3
Treviño, L. K., Weaver, G. R., & Reynolds, S. J. (2006). Behavioral ethics in organizations: A
review. Journal of Management, 32,951-990. DOI: 10.1177/0149206306294258
Tse, H. H., Dasborough, M. T., & Ashkanasy, N. M. (2008). A multi-level analysis of team
climate and interpersonal exchange relationships at work. Leadership Quarterly, 19,195-
211. DOI: 10.1016/j.leaqua.2008.01.005
Wagner, S. H., Parker, C. P., & Christiansen, N. D. (2003). Employees that think and act like
owners: effects of ownership beliefs and behaviors on organizational effectiveness.
Personnel Psychology, 56(4), 847-871. DOI: 10.1111/j.1744-6570.2003.tb00242.x
The Relationship Between Ethical Leadership and Nurse Job Performance: Boundary Conditions and
Influence Processes
Chen and Tian
___________________________________________________________________________
______________________________________________________________________________
181
© 2019 (9th) International Conference of the AGMS Proceedings
Walsh M, Dolan B, Lewis A. (1998). Stress and burnout among A & E nurses. Emerg Nurse,
6(2): 23-30.
Walumbwa, F. O., & Schaubroeck, J. (2009). Leader personality traits and employee voice
behavior: mediating roles of ethical leadership and work group psychological safety.
Journal of Applied Psychology, 94,1275-1286. DOI: 10.1037/a0015848
Walumbwa F. O., Mayer D. M., Wang P, Wang H, Workman K., Christensen A.L. (2011).
Linking ethical leadership to employee performance: The role of leader-member
exchange, self-efficacy, and organizational identification. Organizational Behavior and
Human Decision Processes, 115,204-213. https://doi.org/10.1016/j.obhdp.2010.11.002
Walumbwa, F. O., Wang, P., Wang, H., Schaubroeck, J., & Avolio, B. J. (2010). Psychological
processes linking authentic leadership to follower behavior. Leadership Quarterly, 21(5),
901-914. https://doi.org/10.1016/j.leaqua.2010.07.015
Wang, J., Smailes, E., Sareen, J., Schmitz, N., Fick, G. H., & Patten, S. B. (2012). Three job-
related stress models and depression: a population-based study. Social Psychiatry &
Psychiatric Epidemiology, 47,185-193. DOI: 10.1007/s00127-011-0340-5
Zhu, W., May, D. R. Avolio, B. J., (2004). The impact of ethical leadership behavior on
employee outcomes: The roles of psychological empowerment and authenticity. Journal
of Leadership and Organizational Studies, 11,16-26.
https://doi.org/10.1177/107179190401100104

Organization or Human Capital Who Understands the System Better
Mandal
___________________________________________________________________________
______________________________________________________________________________
182
© 2019 (9th) International Conference of the AGMS Proceedings
Organization or Human Capital Who Understands the System Better
Susanta Mandal
Susanta Mandal, VIL Office ,
Xavier Labour Relations Institute (XLRI),
Jamshedpur, C.H. Area (East),
Jamshedpur – 831001, Jharkhand , India
Abstract
The concept of work has to be understood from the aspect of how easily it can be done even if it
means lifting and shifting of workloads through use of roles , structures , technology and
different ways of institutionalizing partnerships . In the course of my work two important factors
have been targeted “Labour” i.e . employee and “Organization” i.e. the way things can be
organized wherein cost dynamics play an important role . Cost factors in employing of labour as
well as in selecting of the processes to get the work done have been explained through a
framework as well as a Cost Dynamics Model .

The national business context for industrial SME cluster development in Pakistan: constraining and
facilitating factors
Fayyaz, Raud, and Syed
___________________________________________________________________________
______________________________________________________________________________
183
© 2019 (9th) International Conference of the AGMS Proceedings
The national business context for industrial SME cluster development in Pakistan:
constraining and facilitating factors
Anjum Fayyaz, Assistant Professor
Suleman Dawood School of Business (SDSB),
Lahore University of Management Science (LUMS),
Sector U, DHA Lahore, Pakistan 54792.
Hassan Rauf, Assistant Professor
University of Central Punjab (UCP) Business School,
Khayaban-e-Jinnah Road, Johar Town, Lahore, Pakistan.
Jawad Syed, Professor
Suleman Dawood School of Business (SDSB),
Lahore University of Management Science (LUMS),
Sector U, DHA Lahore, Pakistan 54792.
Abstract
This article adds to the literature of small and medium enterprises (SME) clusters by developing
a framework around the context in which industrial SMEs clusters operate. The study uses a
PESTEL analysis to review and identify the factors which facilitate or constrain the development
of SME clusters in a developing economy like Pakistan. The framework developed in this study
helps to understand how political, economic, social, technological, environmental, and legal
factors interact in either facilitating or constraining the development of SME clusters. The review
is also informed by the experiences and interactions of the authors with SME clusters in
Pakistan. The review suggests that almost all the components under the political, technological,
environmental and legal context constrain the development of SMEs clusters in Pakistan. Only
one out of four economic components, i.e., the performance of small-scale sector, is a facilitating
factor for SME development. Within the social context, the large percentage of the productive
age population and the subcontracting culture are some of the facilitating factors for SME cluster
development.
Keywords: Cluster Development, Context, Facilitating and Constraining Factors, PESTEL
Analysis, SMEs
The national business context for industrial SME cluster development in Pakistan: constraining and
facilitating factors
Fayyaz, Raud, and Syed
___________________________________________________________________________
______________________________________________________________________________
184
© 2019 (9th) International Conference of the AGMS Proceedings
The national business context for industrial SME cluster development in Pakistan:
Constraining and facilitating factors
Introduction
The literature on small and medium enterprises (SMEs) highlights the importance of
SMEs not only for policy makers but also for the economic growth of developing countries
(Andersson et al., 2004; Nichter & Goldmark, 2009; Wang, 2016). SMEs contribute to
employment generation, poverty reduction, a wider distribution of wealth, and innovation
capabilities (Gray, 2006; Nolan & Garavan, 2016). Therefore, SME development provides a
major window of opportunity for the policy makers of the host country and for international
donors and NGOs in developing countries (UNIDO, 2001). However, while the literature
highlights the importance of SMEs for policy makers and for economic growth, there is dearth of
research (barring a few notable exceptions such as Hazlina Ahmad et al., 2010; Muhammad et
al., 2010) about the context and the business environment in which these SMEs and policy
makers operate.
Cooperation among SMEs provides economies of scale and scope to overcome the
limitations of their size; for example, clusters of SMEs enjoy the advantages of flexibility and
responsiveness. They can be more competitive than large firms (Humphrey & Schmitz, 1995;
Andersson et al., 2004). SMEs that participate in clusters can benefit from a specialized
infrastructure, an increased ability to penetrate new markets, a qualified workforce, the ability to
meet clients’ needs, and cost reduction in manufacturing operations (Malakauskaitė & Navickas,
2009).
The literature on industrial districts and small-firm clusters has focused on interfirm
networks using the examples of Italian industrial districts; in addition, it has emphasized how the
development of small firms can provide high incomes and sustainable growth through
continuous upgrading and development (Humphrey, 2003). The literature provides reasons to
develop clusters and networks to promote SMEs, but it does not shed much light on the macro-
environment in which SMEs operate. Clearly, there is a gap in the literature regarding how SME
cluster development is influenced by the contexts in which such development occurs. This article
addresses this gap by focusing on the particular context of Pakistan.
Pakistani economy has experienced growth over recent decades, but the growth of SME
clusters has been lagging behind. In the early years of Pakistan’s development during the post-
independence period, the manufacturing sector’s growth rate was in the range of 8-10%, but it
decreased to 2.8% because of the 1971 war with India (Hasan, 1997). The overall manufacturing

The national business context for industrial SME cluster development in Pakistan: constraining and
facilitating factors
Fayyaz, Raud, and Syed
___________________________________________________________________________
______________________________________________________________________________
185
© 2019 (9th) International Conference of the AGMS Proceedings
sector recorded growth of approximately 10% in the mid-2000s, but the Pakistani government
primarily focused on the large-scale sector instead of SMEs and SME clusters (Saif113sb, 2015).
This article reviews the Pakistani context by conducting a PESTEL analysis of the
national context in which SME clusters operate in Pakistan. It examines the implications of
macro-environmental issues and their effects on SME development in Pakistan. The importance
of this article increases when it explains the context of the Pakistani business environment for
SMEs, remaining mindful of the effect of this environment on SMEs and their attitudes towards
competitors, buyers and support institutions when they respond to the international markets. This
article provides an overall understanding of Pakistan’s business environment.
The article is structured as follows. In the next section, we explore the role of each
component of the PESTEL framework to understand the implications of these components for
SME development in Pakistan and how they positively or negatively affect the development of
SME clusters in Pakistan. In the concluding section, we discuss the constraining and the
facilitating factors, related to the Pakistani macro context and its implications for the
development of SME clusters.
PESTEL Analysis
The article uses a PESTEL (political, economic, socio-cultural, technological,
environmental and legal) analysis to describe a framework of contextual factors that affect SME
cluster development. PESTEL is part of an external analysis when conducting a strategic analysis
or doing market research and gives a holistic overview of relevant macro-environmental factors.
It is a strategic tool for understanding business position, market trends and potential and
direction for operations (CIPD, 2018). The study is informed not only a review of relevant local
and international literature but also by the authors’ extensive work on Pakistani SMEs and SME
clusters.
1. Political context for SME development
The political structure of the Islamic Republic of Pakistan is a federal parliamentary
democracy in which the President (ceremonial Head of State) and the Prime Minister (Head of
Government) are the executives. The National Assembly (the lower house) has 342 members,
and the Senate (the upper house) has 100 members. Historically, whichever party forms the
government tends to implement its own policies and agendas thus disrupting continuity with the
previous rulers’ policies (Ahmed, Saleem & Iftikhar, 2012).

The national business context for industrial SME cluster development in Pakistan: constraining and
facilitating factors
Fayyaz, Raud, and Syed
___________________________________________________________________________
______________________________________________________________________________
186
© 2019 (9th) International Conference of the AGMS Proceedings
In the 1990s, at the end of the Afghan War, foreign loans and debt relief were withdrawn
from Pakistan. Debt-servicing pressures caused by the low savings rates and the balance of
payment deficits related to low export growth and poor infrastructure, which combined to reduce
gross domestic product (GDP) growth, resulting in a protracted economic recession (John, 2009).
The 1990s were marked by democratically elected regimes that were kept in strict check by the
military establishment and were also characterised of inefficiencies and corruption (Burki, 1999;
Hussain, 2012). By the late 1990s, three key elements of a crisis threatened the state: (i) a
collapsing economy, (ii) threat to the life and property of citizens resulting from rampant crime
and the emergence of armed militant groups of religious extremists, and (iii) the erosion of many
institutions of effective governance (Hussain, 2012). In May of 1998, Pakistan conducted its first
nuclear test. Economic sanctions were imposed against Pakistan by Western governments
(Ahmad, 2006) and the country was almost at the brink of default on its external payments
(Hussain, 2004).
Pakistan’s industrial policy has a chequered history. Industrial policies were made either
as a part of Pakistan’s medium-term development plans or in response to a crisis. Five industrial
policies or distinct approaches have left a lasting impression on the structure of Pakistan’s
industry (Burki, 2008; Chaudhry, 1996).
The First Five-Year Plan (1955-1960) focused more on new venture creation, the
increase in the production capacities of existing units and enhancements in exports, which
positively affected the industrial sector’s share in Pakistan’s GDP (Bengali, 1999). The Second
Five-Year Plan (1960-1965) shifted the focus of new establishments from consumer goods to
heavy industry to improve industrial performance. The Third Five-Year Plan (1965-1970) was a
partial success because of natural disasters and reduced foreign aid to Pakistan. The period of the
Fourth Five-Year Plan (1970-1975) was disappointing because of the war with India, the
devaluation of Pakistan’s currency, the nationalization of industries by the government, labour
unrest and the unfavourable investment climate (White, 2015). The Fifth Five-Year Plan (1978-
1983) was a failed attempt to rejuvenate the disappointing performance of the Fourth Five-Year
Plan because of the war in Afghanistan, increased international oil prices and increased defence
expenditures. The Sixth Five-Year Plan (1983-1988) shifted towards the private sector with
heavy reliance on imported energy and low spending on health and education (Bengali, 1999).
The Seventh Five-Year Plan (1988-1993) more strongly emphasized private investment but there
was pressure on public-sector corporations to improve their financial performance. The Eighth
Five-Year Plan (1993-1998) was not implemented because of the successive changes in
government during 1993. From 2004 onwards, the government of Pakistan began developing
Medium-Term Development Frameworks (MTDF) instead of Five-Year Plans and developed a
plan for 2005 to 2010 (Chaudhary, Iqbal & Gillani, 2009). In 2015, Pakistan attained a fairly
diversified base of manufactured products ranging from essential consumer goods to chemicals,

The national business context for industrial SME cluster development in Pakistan: constraining and
facilitating factors
Fayyaz, Raud, and Syed
___________________________________________________________________________
______________________________________________________________________________
187
© 2019 (9th) International Conference of the AGMS Proceedings
steel, heavy engineering and machine tool industries. The domestic production of items such as
refined sugar steel, fertilizer, cement, etc. has helped in import substitution and has saved a
substantial amount of foreign exchange (IPRI, 2014; Saif113sb, 2015).
There have been various policy approaches to industrialization in Pakistan in the last six
decades, beginning with industrialization by General Ayub Khan through the establishment of
finance companies such as the Pakistan Industrial and Commercial Investment Corporation (the
PICIC) and the Industrial Development Bank of Pakistan (the IDBP) (James & Naya, 1990). The
objective of this approach was to influence the scope of industrialization; this was an era of
growth without development. The second approach to industrialization occurred during the first
few months of Zulfikar Ali Bhutto’s tenure and was based on his decision to nationalize the
large-scale industry, which introduced several distortions into the management of the economy
and included widespread corruption (Noman, 1991). The third approach of the democratic
administrations in the 1990s was to bring back the private sector as the leader in economic
development by privatizing some of the state’s economic assets with minimal impact on
Pakistan’s industrial activity (Burki, 2008). The old industrial families had their assets restored
and went about conducting their business as before. General Pervez Musharraf’s government
played a prominent role in the private sector by providing considerable room to the financial
sector to participate in the industrialization process based on market considerations (Burki, 2008;
Khan et al., 2014).
Despite the above-mentioned approaches to industrial development, the private sector did
not develop enough confidence amongst the entrepreneurial class to stand independently and
address the changes occurring in the global economic system without government intervention
(Khan et al., 2014). Because of the frequent changes in industrial policy noted above, the
industrial sector has remained relatively backward compared to developments in other large
Asian economies (Burki, 2008).
For a long time, the mainstay of Pakistan’s industrialization strategy was large-scale
manufacturing, which recorded an 8.78% growth rate during 1950-2003 because it was
consistently supported by a set of macroeconomic policy measures. The small-scale sector also
registered an impressive growth rate of 5.06% during 1950-2003; that growth also occurred
without the direct benefit of policy support. However, the small-scale sector essentially existed
in the shadow of the large-scale manufacturing sector (Amin, 2004).
In 2009, a politically unstable Pakistan emerged as a new global hub for anti-West
militancy (Yusuf, 2014). Some of the key incidents in Pakistan, including the capture of Osama
Bin Laden on May 2, 2011 from Abbottabad, Pakistan, and the terrorist attack on the Mehran
Naval Base in Karachi, Pakistan, on May 22, 2011 (Shafqat & ul Haque, 2011), shook the

The national business context for industrial SME cluster development in Pakistan: constraining and
facilitating factors
Fayyaz, Raud, and Syed
___________________________________________________________________________
______________________________________________________________________________
188
© 2019 (9th) International Conference of the AGMS Proceedings
foundations of the Pakistani security establishment and alarmed the public about the
vulnerability of the Pakistani state (Shafqat, 2011). These incidents created scepticism about the
armed forces’ ability to protect Pakistan’s physical infrastructure, air space and citizens.
Consequently, this concern led to the formation of a joint military offensive by the Pakistan
Armed Forces against various militant groups. The operation was launched on June 15, 2014, in
North Waziristan along the Pakistan-Afghanistan border as a renewed effort against militancy in
the wake of the June 8 attack on the Jinnah International Airport in Karachi by Tehrik-i-Taliban
Pakistan (TTP) and the Islamic Movement of Uzbekistan (Khan, 2010; Shafqat, 2011).
These issues appear to be serious constraining factors for SME development in Pakistan
because it is difficult to expect SME development or any socio-economic development to occur
with inconsistent policies, an unstable government, a poor focus on the small-scale sector and an
insecure business environment in Pakistan. Therefore, the three major constraining factors of
SME cluster development in Pakistan’s political context include: a) inconsistent industrial
policies and unstable political governments; b) the political regimes’ major focus on the large-
scale sector; and c) the poor application of counterterrorism policies.
2. Economic context
Pakistan is one of the few developing countries that achieved an average growth rate of
more than 5% over a four-decade period ending in 1988-89. Consequently, the incidence of
poverty had declined from 40 to 18% by the end of the 1980s (Husain, 2005). Pakistan was a
country with 30 million people in 1947 that could not feed themselves and had to import all food
from abroad. In 2002, Pakistan’s farmers not only were able to fulfil 145 million people’s
domestic needs for wheat, rice, sugar and milk at a much higher per capita consumption level but
also exported wheat and rice to the rest of the world (Lasi, 2008). Pakistan had hardly any
manufacturing industries in 1947 (Hussain, 2004). Five decades later, the manufacturing
production index was 12,000 with a base of 100 in 1947. Steel, cement, automobiles, sugar,
fertilizer, cloth and vegetable ghee, industrial chemicals, refined petroleum and a variety of other
industries manufacture products not only for the domestic market but in many cases for the
world market as well (Ahmad, 2006; Hussain, 2004).
Pakistan’s manufactured exports in the 1960s were higher than those of Malaysia,
Thailand, Philippines and Indonesia, reaching $12 billion in 2003 (Hussain, 2004). In 2014,
agriculture accounted for more than one-fifth of output and two-fifths of employment. Textiles
accounted for most of Pakistan's export earnings (MOF, 2011). Pakistan’s inflation rate averaged
7.99% between 1957 and 2015, reaching an all-time high of 37.81% in December 1973 and a
The national business context for industrial SME cluster development in Pakistan: constraining and
facilitating factors
Fayyaz, Raud, and Syed
___________________________________________________________________________
______________________________________________________________________________
189
© 2019 (9th) International Conference of the AGMS Proceedings
record low of -10.32% in February 1959. Pakistan suffered the only economic decline in its GDP
between 1951 and 1952 (Siddiqi, 2007).
Pakistan’s population has grown rapidly from approximately 30 million in 1947 to more
than 130 million in 1996. Its rate of annual growth has averaged 3% since 1960 (Husain, 2010).
Pakistan's average economic growth rate since independence has been higher than the world
economy’s average growth rate during the same period. Average annual real GDP growth rates
were 6.8% in the 1960s, 4.8% in the 1970s, and 6.5% in the 1980s. Average annual growth fell
to 4.6% in the 1990s, with significantly lower growth during the second half of that decade
(Hasan, 1997).
According to the Pakistan Bureau of Statistics (PBS), the manufacturing sector contributes
13.3% to GDP and 14.2% to Pakistan’s total labour force with a decrease in registered growth
from 4.45% in 2013-14 to 3.62% in 2014-15 (Economic Survey of Pakistan 2014-15). The large-
scale manufacturing sector contributes 10.6% to GDP and 20% to Pakistan’s industrial labour
force with a decrease in registered growth from 4.6% in 2013-14 to 2.5% in 2014-15. The small-
scale manufacturing sector contributes 1.7% to GDP and 80% to Pakistan’s industrial labour
force with a minor decrease in registered growth from 8.29% in 2013-14 to 8.24% in 2014-15
(Economic Survey of Pakistan 2014-15). Pakistan’s major economic sectors include textiles,
food, beverages and tobacco, coke and petroleum products, pharmaceuticals, chemicals,
automobiles, iron and steel products, fertilizers, electronics, leather products, paper and board,
engineering products, rubber products, non-metallic mineral products and wood products (see
chapter 3 of the Economic Survey of Pakistan 2014-15).1
Of the fourteen major industrial sectors in Pakistan, nine show a decreased percentage of
registered growth compared to the previous financial year, whereas only five sectors show an
increased percentage. These sectors include light engineering, iron and steel, automobiles,
electronics/information technology (IT) and pharmaceuticals. Therefore, it can be assumed that
there is a possibility of SME development and SME cluster and network development in these
sectors, but there are some additional factors such as inflation, exchange-rate fluctuation and the
number of SMEs in these industries.
The inflation rate measured by the changes in consumer price index in Pakistan averaged
8.7% during July 2013-April 2014 compared to 7.7% in July 2012-April 2013 (PES, 2014a). The
average food inflation in July 2013-April 2014 was estimated at 9.3% and the average non-food
inflation was 8.2% compared to 7.1% and 8.2% in the corresponding period of 2012-13,
respectively (Economic Survey of Pakistan – Budget Special 2014-15). In 2013, the Pakistani
1 http://www.finance.gov.pk/survey_1415.html
The national business context for industrial SME cluster development in Pakistan: constraining and
facilitating factors
Fayyaz, Raud, and Syed
___________________________________________________________________________
______________________________________________________________________________
190
© 2019 (9th) International Conference of the AGMS Proceedings
rupee depreciated to an all-time low—i.e., 106 rupees to the dollar—because of the high demand
for import payments (Bilawal et al. 2014). Depreciation of the rupee further inflates the import
bill and increases the domestic price level, thus reducing purchasing power and causing inflation
(Shaheen, 2013).
After independence, Pakistan had no currency, and for at least six months Pakistan used
India’s currency. Pakistan used a fixed exchange rate until the first half of 1982. In 1991, the
Pakistani rupee began to float in the open market as the result of economic and fiscal reforms.
However, there has been constant interference from the State Bank of Pakistan in Pakistan’s
exchange markets to stabilize the exchange rate (PKR/dollar). In 2014, the exchange rate of the
Pakistani rupee to the dollar was approximately 100:1 (Bashir, Shakir, Ashfaq, Hassan, 2014).
This exchange-rate fluctuation also affected the growth of multinational companies in Pakistan
and increased the degree of risk for financial institutions such as banks, stock exchanges and
firms. Moreover, exchange-rate fluctuation affected macroeconomic factors in Pakistan such as
market prices, inflation rates, interest rates, wages, and unemployment and output levels (Bhutt,
ur Rehman & ur Rehman, 2014).
Government statistics showed that Pakistan’s SME sector recorded impressive growth of
14.7% during from 1987/88-1996/97 (Haneef, 2010). In 2005, SMEs’ contribution to Pakistan’s
economy, employment and poverty reduction was noted in the fact that 90% of all private-sector
manufacturing units employed fewer than 99 workers, and SMEs employed 78% of the non-
agricultural labour force. SMEs in Pakistan contributed to approximately 30% of Pakistan’s GDP
and 140 billion rupees to exports, which represented 25% of the total manufactured goods
exported from Pakistan (Husain, 2005).
The literature on the poor growth of Pakistan’s large-scale sector and major industries
does not directly address the effect of that growth on Pakistan’s small-scale sector. In addition,
Pakistan’s rising inflation is not clearly linked to the small-scale sector, but it appears to be a
constraining factor for SME cluster development in Pakistan. Depreciation of the Pakistani rupee
and the fluctuating exchange rate are also constraining factors for SME development in Pakistan.
The only facilitating component linked to economic factors is the positive growth of the small-
scale sector in a developing economy such as Pakistan. Therefore, the major components that
facilitate and/or constrain the development of SMEs and SME clusters in Pakistan include: a)
poor growth of the large-scale sector and the industrial sector; b) inflation; c) depreciation of the
Pakistani rupee and exchange-rate fluctuations; and d) better performance of the small-scale
sector.

The national business context for industrial SME cluster development in Pakistan: constraining and
facilitating factors
Fayyaz, Raud, and Syed
___________________________________________________________________________
______________________________________________________________________________
191
© 2019 (9th) International Conference of the AGMS Proceedings
3. Social context
In Pakistan, the 40 most powerful business groups and individuals include 5
conglomerates and 30 family businesses. Of the 30 family businesses, 7 represent the Chinioti
Sheikh Beraderi, 2 represent the Chinioti Vohras Beraderi, 5 represent the Memon Clan, 1
represents the Ismaeeli Sheikh, 1 is headed by the Maliks from the Arian Punjabi family, and the
other 14 represent non-Beraderi and non-clan family businesses. Ten businesses are headed by
individual entrepreneurs, of which only one appears to be an SME cluster-based business. Most
of the Beraderi- or clan-based entrepreneurs have also taken leadership positions in politics
(governor or mayor), chambers of commerce, business associations / societies or government-
formed commissions in partnership with the private sector.
In Pakistan, minority cultures are known for their enterprising behaviour. For example,
Gujratis Karachi are reputed to be brilliant financial managers. The Chiniotis, Memon, Vohras,
Sheikhs, Ismaeelis and Sialkotis were observed to have a flair for trade and textile manufacturing.
Traders in Bara markets could sell almost anything (Sayeed & Memon, 2007).
The country’s gravest problem is its precarious law-and-order situation (Sheikh, 2009;
Mustafa, Akhter & Nasrallah, 2013). At the end of the 1990s, more than one-third of Pakistan’s
households were below the poverty line; that number reached nearly 40% for the rural areas. A
large chunk of the population lives below the poverty line (Arif, 2000) in miserable conditions.
Consequently, we read crime stories in newspapers that characterized the lower orders of society
as going through illegal channels to obtain the financial prosperity that they cannot achieve
otherwise (Sheikh, 2009; Javaid, 2015).
Illiteracy is yet another problem in Pakistan. The literacy rate has stalled at 56%;
ironically, that rate includes people who can read and write their name in Urdu. In the last few
decades, the upward trend in the Pakistan’s illiteracy rate (Sheikh, 2009; SBP, 2002) is
aggravated by the fact that more than 50% of children in Pakistan do not complete their primary
education. Uneducated adults make only a negligible contribution to the national exchequer.
Corruption is another significant social problem. According to the latest report of
Transparency International, Pakistan has been ranked the 42nd most corrupt nation in the world.
From clerics to high officials and bureaucrats, all are involved in corruption of some sort (TIP,
2011; Sheikh, 2009). Corruption in government departments is deeply embedded. There is a lack
of accountability: wealthy people and those in power believe they cannot be held responsible for
their actions. Thus, they continue to loot national treasures and find ways to legalize their black
money (Farooq, Shahbaz, Arouri & Teulon, 2013).

The national business context for industrial SME cluster development in Pakistan: constraining and
facilitating factors
Fayyaz, Raud, and Syed
___________________________________________________________________________
______________________________________________________________________________
192
© 2019 (9th) International Conference of the AGMS Proceedings
Unemployment is another major social problem. A major portion of Pakistan’s population
consists of youth, but a large number of young people who have the ability and willingness to
work are unemployed (Ali, 2010). Pakistan’s official unemployment rate is 7.4%, but according
to some private estimates, the rate of unemployment is 12%. There are many reasons for
unemployment, such as technology upgrades and the defective education system. Individuals
who cannot find work in Pakistan migrate to other countries with better prospects (Chaudhary &
Hamid, 1998; Qayyum & Siddiqui, 2007).
Child labour is widespread in Pakistan. In both large cities and small villages, innocent,
malnourished children are employed in various forms of labour (Sheikh, 2009). They work as
welders, mechanics, plumbers, electricians and in industries such as carpet-weaving, glass and
football making. These children receive only meagre wages, and no educational facilities are
provided (Boje & Khan, 2009). Pakistani children, particularly older girls, drop out of school
unable to participate in the labour market (Ray, 2000).
Population expansion has been an issue of concern for all governments (Adil, 2015; Omer,
2014). The decade of 1941-51 experienced a fairly high population increase of 19.4%, because
of excess immigration from India following the partition of the Subcontinent. The exceptional
population increase of 27.0% in the period 1951-61 was primarily the result of an excess of
births over deaths resulting from a sharp decrease in the death rate caused by improved
environmental conditions and health facilities (Afzal & Hussain, 1974). After peaking at more
than 3% in the 1960s and 1970s, reaching approximately 3% in the 1980s and then falling below
3% in the 1990s, annual growth rates have begun to show a declining trend. From 1981-1998,
the annual growth rate was 2.6%. In 2001, the estimated annual growth rate was 2.1%, which
was still one of the highest in the region (Hakim & Mahmood, 2001).
Inflation is another key challenge. According to the Economist Pakistan Report (2007) on
Pakistan’s economic problems, the prices of consumer products in general and food products in
particular are skyrocketing. Core inflation soared to 18.85% in the first quarter of 2009 until the
State Bank of Pakistan took steps to curb inflation through tight monetary policies (Hassan &
Malik, 2014). Increased oil prices internationally and Pakistan’s internally unfavourable business
conditions are two important factors responsible for the high rate of inflation. The Consumer
Price Index (CPI) and the Wholesale Price Index (WPI) are at all-time highs. In contrast, the
purchasing power of the masses is at an all-time low (Sheikh, 2009).
Unemployment is already prevalent, and now the question of providing employment to
internally displaced persons has also become a serious concern. This unproductive population is
a growing economic problem in Pakistan (Shaikh, 2013; Sheikh, 2009; Sonu, 2012).

The national business context for industrial SME cluster development in Pakistan: constraining and
facilitating factors
Fayyaz, Raud, and Syed
___________________________________________________________________________
______________________________________________________________________________
193
© 2019 (9th) International Conference of the AGMS Proceedings
Entrepreneurs in the manufacturing industry of Pakistan have been found to operate in a
strong, close-knit “Beradari” system. For example, in the light engineering sector of Punjab,
Mughals, Bhuttas, Lohars, Skeikhs and Kashmiris were the primary castes involved in the
manufacturing business. Although many of them were close relatives, their overall business
environment had a sense of jealousy and leg-pulling (Mehmood & Haroon, 2006). Cut-throat
price competition amongst manufacturers had resulted in products with compromised quality,
reduced value and a culture of mistrust, collectively served as a barrier to the growth of these
industrial clusters (Farooqi & Haroon, 2006; Mehmood & Haroon, 2006).
Like all less-resourceful firms, SMEs typically had skill deficiencies and were unable to
compete with the larger firms’ better-qualified manpower. Inter-firm transfer of skilled labour
was a common phenomenon directly influenced by relative wage levels. In this game, the larger
firms had an advantage over SMEs (Quader & Abdullah, 2009).
The average educational attainment of Pakistan’s labour force was very low. In 2007-2008,
only 55% of the country’s working-age people were literate. The unemployment figures for
2003-04 indicated that 59.2% of the unemployed were literate or semi-literate, with the “pre-
matric” group being the largest at 29.5% (Batool, Naeem & Sana, 2009; Chaudhary & Hamid,
1998; Malik, 2014). The lack of formal management skills at all levels has resulted in poor shop-
floor organization and labour management in Pakistan. Most units were either managed by
entrepreneurs themselves or by the “Munshi” (lower-level managers/supervisors) to run business
operations and day-to-day tasks. The skills were transferred to the newcomers through the
conventional system of “Ustad/Shagird”2. All of the training was essentially provided on the
shop floor (Bhatti, 2006)3.
In 2012-13, 41% of Pakistan’s population was in the 0-14-year-old age group; this group is
economically unproductive and requires food, clothing, education, and medical care. Fifty-one
percent of the population was in the 15-59-year-old age group. This productive-age population
was the main source of accelerated economic growth (Asghar & Javed, 2011). Pakistan has the
tenth-largest labour force in the world. Statistics showed that Pakistan’s total labour force
increased from 50.0 million in 2005-06 to 59.7 million in 2012-13 (PES, 2014b), means that
more than 9 million people joined the labour force during this period. However, the employed
labour force increased from 46.95 million to 56.0 million during the same period, indicating that
the increase in the labour force could not be adjusted for completely in the employment sector;
therefore, there was an increase in unemployment from 3.10 to 3.73 million during this period
2 Conventional way of learning through the supervisor or senior skilled worker on the shop floor. 3 Interviews with the Cluster Development Agent and the Network Development Agent, UNIDO Cluster
Development Programme, Pakistan.

The national business context for industrial SME cluster development in Pakistan: constraining and
facilitating factors
Fayyaz, Raud, and Syed
___________________________________________________________________________
______________________________________________________________________________
194
© 2019 (9th) International Conference of the AGMS Proceedings
(Hassan, 2014). In 2012-13, fourteen percent of Pakistan’s total labour force was employed in
the manufacturing sector, which was composed of 15% of the total male labour force and 11% of
the total female labour force in Pakistan (PES, 2014b).
Subcontracting in Pakistan is prevalent in the manufacturing sector and to some extent, in
the trade and service sectors. Sixty-three percent of manufacturing-sector firms practice
subcontracting, which is generally performed for formal-sector enterprises (Kemal & Mahmood,
1998). Subcontractors are sometimes provided with raw materials for processing, primarily
because they want the design and quality of their products to match the specifications (Kemal &
Mahmood, 1998).
When more than 70% of the population is living in villages, a major proportion of them
below the poverty line because of an insufficient ability to supply their basic needs, there is an
increased possibility of crimes instead of business development as Pakistan’s economically
underprivileged adopt illegal methods of achieving financial prosperity (Sheikh, 2009).
Pakistan’s large businesses are not only family-based but also clan/Beraderi-based, thus
aggravating the divide between rich and poor (Tariq & Alamgir, 2013). It is difficult to expect
SME development in an environment in which Chinioties, Memons, Vohras, Sheikhs and
Ismaeelis dominate industries and the big players are reluctant to assist smaller producers.
(Asghar & Javed, 2011).
Two major social-context aspects that are expected to facilitate SME development in
Pakistan include subcontracting and the more than 50% of the productive population that fall into
the age range of 15-59 years.
Social and cultural factors have a direct bearing on the emergence, survival, and growth
of entrepreneurship and SME development in a developing country such as Pakistan. The
cultural factors in the context of Pakistani business communities are driven by a family history of
entrepreneurship, educational background, the entrepreneur’s age and his or her attitude towards
business management (Chachar, De Vita, Parveen, & Chachar, 2013). Although most of the
factors mentioned above negatively affect the development of SME clusters in Pakistan. The
family-based businesses can affect SME cluster development positively because of the
outsourcing of large enterprises in the cluster (Bakunda, 2014). Furthermore, SME clusters are
platforms where the government can improve the education of children working in the factories
and facilitate the skill level of workers in the specific industrial clusters. Government policies,
chambers and associations can also work to facilitate the addition of more females into the
labour force to increase the pool of employable labourers in a specific cluster (Perrons &
Plomien, 2013).
The national business context for industrial SME cluster development in Pakistan: constraining and
facilitating factors
Fayyaz, Raud, and Syed
___________________________________________________________________________
______________________________________________________________________________
195
© 2019 (9th) International Conference of the AGMS Proceedings
4. Technological context
Firms in developing countries operate with an imperfect knowledge of technological
alternatives, in addition to lacking new skills and knowledge to efficiently utilize new
technologies (Lall, 2000). To understand more about industrial success, the role of internal
technological factors and their link to the exporting behaviours of enterprises in a developing
economy cannot be ignored. Enterprises’ productivity, growth and trade performance facilitate
the process of obtaining the ability to innovate and utilize new technologies, which is linked to
enterprises’ exporting behaviour in terms of their technological development and export
performance (Ulku, 2007).
Keeping in mind the importance of manufacturing enterprises as the primary actors in the
process of accumulating technological capabilities, Wignaraja (2002) proposes a technology
development index (TDI) based on factors that affect enterprise level, technological development
and export performance (Rodríguez & Rodríguez, 2005). Firm size, technical manpower,
training expenditures, and external technical assistance were some of the ingredients that were
positively related to the technology index. The capability literature emphasizes that enterprises
must make a conscious investment to convert imported technologies into productive use
(Wignaraja, 2002).
Technological capability is also related to R&D capability. Although R&D is necessary
for competitiveness, new strategies include people, their contacts and their skills as a vital basis
for firms’ success both in new technologies and in alliances. Small firms and entrepreneurship
are examined as a crucial part of a well-functioning regional economy (Malecki, 1997;
Braunerhjelm, 2010). Research has demonstrated a close relationship between entrepreneurship
and regional and local development. Innovativeness developed within local interfirm networks
both supports existing firms and presents opportunities for starting new businesses to serve
newly identified markets. Networks of firms complement and sometimes substitute for a firm's
own technological capability (Malecki, 1997). New technological capabilities can also be
acquired through interfirm linkages because network firms complement member firms in these
aspects (Basant, 2004).
The global value chain (GVC) approach shows how international linkages play a crucial
role in accessing technological knowledge and enhancing learning and innovation (Gereffi, 1999;
Kaplinsky, 1998; Humphrey & Schmitz, 2002). While focusing on the internal process of
technological capability, we also must understand the knowledge flow within and between
different GVCs, which in turn will make it easier to unravel why some firms and/or clusters
benefit from being part of GVCs (Morrison, Pietrobelli & Rabellotti, 2008).

The national business context for industrial SME cluster development in Pakistan: constraining and
facilitating factors
Fayyaz, Raud, and Syed
___________________________________________________________________________
______________________________________________________________________________
196
© 2019 (9th) International Conference of the AGMS Proceedings
Pakistan’s problem of industrial backwardness is primarily the result of slackness in
productivity growth, which in turn was a result of technological underdevelopment. For Pakistan,
where highly skilled workers, capital, and foreign exchange are scarce, the growth of total factor
productivity is of special significance (Kemal, 2006). Technological development is a key
element in enhancing industrial productivity and growth in Pakistan, which would make it
possible to improve competitiveness and produce new products.
Although Pakistan still lags in the technology index, there were significant improvements
from 2004 to 2006. For example, from 2004-05 to 2005-06, Pakistan’s technology index rank
improved from 87 to 80 and its growth competitive index rank improved from 91 to 83.
Although most Pakistani firms continue to occupy the lower end of the technology spectrum,
domestic firms may be facilitated to compete in the world market through technological up-
gradation, investment, and innovative capabilities (Kemal, 2005). The share of medium- or high-
technology products in manufacturing exports in 2002 remained low at 10 percent in Pakistan
compared to 20 percent for India, 46 percent for China, 70 percent for the Republic of Korea and
76 percent for Malaysia.
UNIDO (2005) has also developed an industrial-cum-technological advance (ITA) index.
In 2002, Pakistan was 0.104 on the index compared to 0.198 for India, 0.235 for China, 0.338 for
the Republic of Korea and 0.269 for Malaysia. Until 2000, Pakistan had ignored or given very
little emphasis to higher education, science and technology and research and development. In
Pakistan, tertiary enrolment (percent of the population aged 17-23 years) levels are
approximately 4 percent compared to 10.5 percent in India and 28.2 percent in Malaysia. On the
index of availability of scientists and engineers, Pakistan’s rank is 61 out of 93 countries. In
2000, Pakistan had 100 scientists and engineers per million people compared to 149 in India, 350
in China and 500 in Malaysia. According to the Global Competitiveness Report (2005),
Pakistan’s position was 87 on the technology index compared to India (63) and China (62), with
the United States on top (Amjad, 2006). Lack of emphasis on higher education in Pakistan has
weakened the linkages between universities, research institutes and industry, which are
considered the soft side of technological intervention (Khan and Anwar, 2013).
Accordingly, most of Pakistan’s problems were related to the software rather than the
hardware side of technology (Mahmood & Siddiqui, 2000). Functional linkages between various
components of the science and technology (S & T) system (universities, research institutes, and
industry) were missing. International alliances of local research institutes (hereinafter RIs) were
missing. Generally, RIs were experiencing funding, planning, and organizational problems.
Consequently, the private sector’s participation in technological development was negligible.
There was a weak conditioning of local customers in favour of better-quality products
(Mahmood, 2000).

The national business context for industrial SME cluster development in Pakistan: constraining and
facilitating factors
Fayyaz, Raud, and Syed
___________________________________________________________________________
______________________________________________________________________________
197
© 2019 (9th) International Conference of the AGMS Proceedings
Pakistan scores relatively low on export sophistication, reflecting its specialization in low
technology products. Within these categories, Pakistan performs poorly on products that are at
the low-commodity ends of the sophistication spectrum (Kemal, 2005; Amjad, ul Haque &
Colclough, 2005). Even for textile and clothing exports, Pakistan must match its competitors in
terms of technology, skills, designs and quality, and the main drivers of competitiveness—
human resources, technological effort, technology inflows and supporting institutions—are weak
and not improving over time in response to growing international challenges (ADB, 2002).
SMEs in Pakistan are known to rely on low, obsolete technology. This reality is
associated with the lack of technical skills required to produce quality products. There is a
general absence of information on opportunities for technological up-gradation (Khan &
Qureshi, 2007). One part of the problem is linked to SMEs’ inability to acquire sophisticated
equipment and R&D facilities, which is manifested in the adoption of labour-intensive
production methods associated with lower productivity levels and overall economic efficiency
(Kemal, 2005; Amjad, 2006). A typical small Pakistani firm uses old, indigenous machines,
produce low-quality, low-priced products and sell them accordingly (Sherazi et al., 2013).
Like all less-resourceful firms, SMEs typically have skill deficiencies and are unable to
compete with larger firms’ better-qualified manpower. In this game, the larger firms have
advantages over SMEs, particularly in situations of skill shortages, which may occur in Pakistan
as a result of the migration of labour to the Middle East and other countries (Mian & Qureshi,
2011). Consequently, a smaller firm may not be able to compete with a larger firm because of
limited funds, despite its need for highly skilled workers (Asad, Haider, Akhtar & Javaid, 2011).
The industrial backwardness and technology underdevelopment, a lack of emphasis on
higher education and R&D, Pakistan’s weak performance on sophisticated manufactured exports,
skill deficiencies and the migration of skilled labour to other countries are some of the major
constraining factors on SME cluster development in Pakistan. The literature does not highlight
SMEs’ technological problems, the role of soft-side intervention on SMEs, or the reasons for the
migration of skilled labour and their effects on SME development in Pakistan.
5. Environmental context
Most Pakistani industries are located around major cities and are increasingly polluting
streams, rivers and the Arabian Sea through untreated toxic waste (Luken, 2000). Pakistan’s
tanning industries are causing severe environmental problems because of the disposal of their
untreated effluents on land and in bodies of water. In the past few decades, developing countries
have witnessed a sharp increase in leather production because such activities have declined in the
The national business context for industrial SME cluster development in Pakistan: constraining and
facilitating factors
Fayyaz, Raud, and Syed
___________________________________________________________________________
______________________________________________________________________________
198
© 2019 (9th) International Conference of the AGMS Proceedings
developed world because of more stringent environmental pollution-control requirements and
high labour costs. Accordingly, Pakistan witnessed a rise in its leather exports from US$ 672
million in 2002 to 1.13 billion in 2007, which indicated an increase of 68% in a span of 5 years
(Haydar & Aziz, 2009). There are 442 organized textile units in Pakistan and except for a few,
all of the units are discharging effluents without any treatment. As a result, the natural water
bodies, which were rich sources of food and irrigation water a few years ago, have now become
wastewater drainage. (Iqbal, Nadeem & Shafiq, 2007).
In Pakistan, two types of environmental policies directly address environmental problems
(Magsi & Atif, 2012). The first policy is based on command and control to apply environmental
quality standards on emissions, effluents, technology type or input use. Because the regulating
institutions are weak and financial resources and technical know-how for monitoring and
enforcement are scarce in Pakistan, there is no effective implementation of NEQS. The second
policy is based on incentive by using prices to affect pollution and resource use. Pakistan’s
government subsidized energy use by keeping prices below economic levels, thus undermining
incentives for energy conservation. Under this incentive scheme, Pakistan’s government reduced
the gap between petrol and diesel prices to shrink diesel usage to mitigate the problem of air
pollution. The government also increased the price of water to discourage the inefficient use and
waste of water; moreover, they encouraged the implementation of a self-monitoring and -
reporting system (Magsi & Atif, 2012; Luken, 2000).
Industries in Pakistan’s major cities are discharging untreated wastewater into sewerage
or public water sources. In most urban areas, there is no space for individual or combined
wastewater treatment facilities (Kahlown, Ashraf, Hussain, Salam & Bhatti, 2006). Except for
large factories, none of the factories have installed pollution control systems (Luken, 2000).
Although Pakistan’s implementation of environmental protection laws is questionable, SMEs
still face a threat of closure in the case of non-compliance with environmental standards,
particularly in exporting industries. The effect of global standards on local producers is primarily
the result of SMEs’ lack of financial resources, poor awareness and lack of technical capabilities
to comply with environmental requirements (Nadvi, 2004; Lund-Thomsen & Nadvi, 2010).
Since 2013, a massive shortage of electricity, long-continued failures, unreliable service,
rampant corruption, unauthorized connections, and consumers’ refusal to pay for the irregular
power supply are some of the reasons for Pakistan’s energy crisis. Pakistan experienced its worst
energy crisis in 2007, when production fell by 6,000 megawatts (Javaid et al., 2011; Nawaz, Arif
& Masood, 2013). Power shortage is a serious issue in Pakistan. The main problem related to
Pakistan’s poor electricity production results from political instability, coupled with the growing
demand for power and a lack of efficacy (Haque, 2011).

The national business context for industrial SME cluster development in Pakistan: constraining and
facilitating factors
Fayyaz, Raud, and Syed
___________________________________________________________________________
______________________________________________________________________________
199
© 2019 (9th) International Conference of the AGMS Proceedings
Power shortages threaten to undermine the government’s credibility and legitimacy and
to further stress Pakistan’s social fabric. The power crisis did not suddenly emerge. It is the
direct result of unwise, inattentive energy policies over the last three decades (Arshad et al.,
2014). Pakistan's energy bankruptcy is ultimately the result of a massive institutional and
governance failure (Kessides, 2013).
Pakistan has a gas-supply shortage of approximately 20%. Natural gas supplies fell by
33% in 2010 compared to 2009 (Mills, 2012). In December of 2001, this situation prompted the
government to announce gas rationing to counter the deficit. It has been estimated that domestic
oil and gas supplies would be exhausted by 2025 and 2030, respectively. Pakistan already
imports approximately 30% of its energy, mainly from Iran (Mills, 2012). Pakistan’s government
is likely to deregulate the CNG sector and its consumer pricing from under the Oil and Gas
Regulatory Authority’s (OGRA) regulation (Malik, 2008).
Water scarcity in Pakistan could threaten all aspects of the national economy. The
International Monetary Fund (IMF) has blamed Pakistan for its lack of proper water
management. Pakistan is amongst the world’s 36 most water-stressed countries, and the situation
will worsen as the population increases (Iqbal, 2015). Pakistan depends on a single source, the
Indus system and its tributaries, for most of its water supply needs (Bhatti & Farooq, 2014). Fed
mostly by snow and glacier melt in the greater Himalayas, water availability in the Indus system
is highly seasonal, with 85% of annual river flows occurring during the June-September period,
which coincides with the concentration of rainfall during monsoon season. Rainfall varies from
1,500 millimetres per year in Northern Punjab to 150 millimetres per year in the upper Sindh
province (Ahmad, 2007). Pakistan is also exposed to extreme weather conditions, including
severe episodes of floods and droughts that wreak significant damage on the country’s
agricultural, livestock, and water infrastructure. Many of these costs have been attributed to the
lack of adequate storage capacity and control structures. Total dam storage in Pakistan represents
only 30 days of average demand, compared to 1,000 days for Egypt and 220 days for India
(Akhtar, 2010).
More than 35% of the population lacks access to safe drinking water. Pakistan has huge
hydro potential through the construction of new dams and hydropower projects (Ali, 2014). The
country’s two existing mega-hydropower dams—Mangla and Tarbela—were commissioned in
1967 and 1976, respectively; however, they are losing their storage capacity because of rapid
silting (Izhar-Ul-Haq & Sheikh and WAPDA, 2011). Pakistan is one of the world’s most arid
countries, with an average rainfall of less than 240 millimetres annually. On the consumption
side, when evaluating 100,000 households (or approximately 900,000 people), Pakistanis use
100 gallons of water per person per day, whereas the world’s average is 10 gallons per day
(Khalid & Begum, 2013; Salman, 2015).

The national business context for industrial SME cluster development in Pakistan: constraining and
facilitating factors
Fayyaz, Raud, and Syed
___________________________________________________________________________
______________________________________________________________________________
200
© 2019 (9th) International Conference of the AGMS Proceedings
A major portion of the Pakistani population still resides and works in the agrarian
sector, with poor application of land rights leading to political decisions that have economic
implications (Ali, 2012). In Pakistan, the army is involved in fertilizer production in that
prominent ministers engage in corporate farming. Furthermore, donors are attempting to fund
the computerization of land records to further facilitate agribusiness without addressing the
basic land-tenure rights of the rural poor (Ali, 2012). Analysing the class character of land
reform in India and Pakistan shows that the conflict between the old landlords and Pakistan’s
emerging middle class is not as sharply articulated as in India, and land policy therefore has a
more pronounced pro‐landlord bias than in India. In Pakistan, at best, land policy denotes the
tension between the old declining class and a new, dynamic landlord class (Joshi, 1974).
Pakistan’s industrial sectors are causing serious pollution and hazardous contamination;
however, because of limited financial resources and technical capacity, industry is not able to
implement pollution-control measures (Khan, 1998). Even with the poor implementation of
environmental protection laws, Pakistan’s SMEs are threatened with closure because of their
non-compliance with these standards. SMEs involved in the exporting industrial clusters are
confronted by a lack of financial resources, have poor awareness and lack the technical ability to
comply with international compliance requirements (Nadvi, 2004; Lund-Thomsen & Nadvi,
2010).
The environmental compliance requirements, power crisis, macroeconomic instability,
natural-gas shortages, water scarcity and poor application of land rights in Pakistan are major
constraining factors, but it appears difficult to directly link these factors to the development of
SMEs and SME clusters in Pakistan. Poor access to raw materials is one of the major
constraining factors because of the lack of access to cheaper capital by SMEs. Therefore, the
major environmental factors constraining the development of SMEs and SME cluster
development include the following: electricity shortages, macroeconomic instability, natural-gas
shortages, water scarcity, poor application of land rights and poor access to raw materials.
6. Legal context
The Supreme Court is the highest court of ultimate appeal in Pakistan. There are High
Courts in each province and a High Court for Islamabad. This level is the highest provincial-
level court in Pakistan (Heydarian, 2013; Hussain, 2011). The Federal Shariat Court of Pakistan
has the power to examine and determine whether Pakistan’s laws are in accordance with Islamic
injunctions (Lau, 2002 & 2005). The Subordinate Courts handle the civil and criminal cases
under their jurisdiction pursuant to the powers and functions specified in the statutes creating
them (Hussain, 2011).

The national business context for industrial SME cluster development in Pakistan: constraining and
facilitating factors
Fayyaz, Raud, and Syed
___________________________________________________________________________
______________________________________________________________________________
201
© 2019 (9th) International Conference of the AGMS Proceedings
Pakistan’s industry-related laws include procedural laws, competition laws, consumer
laws (Khan & Hafeez, 1999), and labour laws (ILO, 2002). The procedural laws prescribe the
procedure for proceedings in civil cases. The Competition Law enforces an act to provide for
free competition in all spheres of commercial and economic activity to enhance economic
efficiency and to protect consumers from anti-competitive behaviour (Javed, 2012). The
consumer laws are generally absent, although there is a commission called the Consumer Rights
Commission of Pakistan (CRCP), but it is ineffective in protecting consumer rights against
powerful multinationals. Pakistan’s Environmental Protection Act was passed in 1997, but poor
implementation increased Pakistan’s vulnerability to natural disasters (APP, 2012). Finally,
Pakistan’s labour laws are extremely complex and push small enterprises to operate outside the
domain of these laws (Amjad, 2005).
Corruption, nepotism, and political manipulation are widespread and damage the
integrity, credibility, and public image of Pakistan’s judiciary and police. An additional
impediment to criminal law enforcement is the ineptitude of Pakistan’s judicial sector (Abbas,
2011). Criminal litigation in Pakistan is a series of retributive legal actions and as such, the
courts are left with the onerous and uninspiring task of sifting through cases to determine which
are genuine and which are not. Because a very small percentage of litigants are tried for
malicious prosecution, the trend of using the law to settle scores is both very common and
deployed with great tact and skill (Imam, 2011). Similarly, arduous civil litigation is made even
more cumbersome by the delaying tactics that are employed by lawyers. Civil litigation has
become a practice that is widely used by disputing parties as a means of bargaining, i.e., the
process usually entails favourable status quo orders, followed by a deliberate delay (Siddique,
2011). Investigators are poorly trained and lack access to basic data and modern investigation
tools. Prosecutors who are also poorly trained are not closely involved in investigations (Lillah,
2012). Corruption, intimidation and external interference in trials, including by the military’s
intelligence agencies, compromise cases before they even reach court. (Hussain, 2012).
In Pakistan, the police are notorious bullies and are used to control the people instead of
protecting them. Historically, the police were used by the colonial administration as a means of
implementing policy (Imam, 2011). Inevitably, Pakistan’s victims of police brutality lack
influential patronage or support from the legal system of Pakistan. This situation is further
compounded by the low awareness of legal rights and procedures; thus, the poor and vulnerable
are disconnected from the formal justice system, resulting in a glaring trust deficit. The entire
nature of Pakistan’s legal system is oriented towards delaying justice at all costs (Raymond &
Shackelford, 2013).
A good advocate is defined by his ability to prevail upon the judge to obtain a stay order
and how long he can delay matters to force the other party to come to the table (Kardar, 2014).

The national business context for industrial SME cluster development in Pakistan: constraining and
facilitating factors
Fayyaz, Raud, and Syed
___________________________________________________________________________
______________________________________________________________________________
202
© 2019 (9th) International Conference of the AGMS Proceedings
Consequently, thousands of cases are pending before almost every bench of every High Court in
the country, with no real end in sight. There are cases that have become “infructuous” because
either the litigants have passed away or the cause of action has ceased to exist. In short, there is a
legal crisis in Pakistan (Wasseem, 1992).
SMEs and entrepreneurs experience a complex legal, tax and administrative environment
in Pakistan; thus, every firm is anxious to avoid the economic obligations associated with
registered status. Although small firms’ unregistered status has a negative effect on their access
to institutional finance, they prefer to remain in the informal sector (Fajnzylber, Maloney and
Montes-Rojas, 2011). In this situation, it is difficult to expect SME development when larger
enterprises have leverage to manipulate the system and the markets either by creating cartels or
through other mechanisms (Siddiqui, 2008).
The complex legal, tax and administrative environment are some of the major constraining
component, which is why SMEs are willing to operate in an informal environment, thus
ultimately creates difficulty for the development of SMEs and SME clusters in Pakistan.
Similarly, corruption, nepotism and political manipulation of Pakistan’s judicial system are also
constraining factors for SME development. The poor attitudes of advocates, judges and police
constrain the development of Pakistan’s small-scale sector.
Discussion
To learn how the above factors affected the development of SME clusters in Pakistan, it
is important to understand how political, economic, social, technological, environmental, and
legal factors interact in either facilitating or constraining the development of SME clusters in
Pakistan. The lack of continuity of industrial policies and Pakistan’s unstable government, along
with the government’s policy focus on the large-scale sector, are some of the constraining factors
for SME cluster development in Pakistan. Furthermore, insecurity and terrorism in Pakistan play
a negative role in SME development in Pakistan.
In addition, the poor growth of the large-scale sector, inflation and the depreciation of
Pakistan’s currency and exchange-rate fluctuations are the economic constraining factors for
SME cluster development in Pakistan. The only economic factor that helps grow SME cluster
development in Pakistan is the performance of the small-scale sector despite the government’s
support of the large-scale sector.
On the social side, poverty, illiteracy, corruption, unemployment, child labour and
population expansion are some of the major constraining factors for SME development in a

The national business context for industrial SME cluster development in Pakistan: constraining and
facilitating factors
Fayyaz, Raud, and Syed
___________________________________________________________________________
______________________________________________________________________________
203
© 2019 (9th) International Conference of the AGMS Proceedings
developing country such as Pakistan. Furthermore, the power crisis, lack of foreign investment,
economic meltdown and political instability, uncontrolled inflation, the War on Terror, the
strong beradari/clan system, entrepreneurs’ low education, their lack of management skills and
the scarcity of skilled labour are also constraining the development of SMEs in Pakistan.
However, the proportion of the productive-age population and frequent subcontracting facilitate
the process of SME cluster development in Pakistan.
In Pakistan, industry is generally backwards in the area of technological development,
with a poor emphasis on higher education and R&D. Pakistani producers are weak performers
with respect to technology-intensive and sophisticated products; moreover, there is a deficiency
of skilled labour and labourers frequently migrate. All of these factors constrain the development
of SME clusters in Pakistan.
Pakistani SMEs and entrepreneurs fail to comply with international buyers’
environmental requirements, particularly when SMEs are operating in international markets.
Furthermore, the power crisis and macroeconomic instability, shortage of natural gas, scarcity of
water, poor application of land rights and poor access to raw materials are some of the major
constraining factors for SME development in Pakistan.
Pakistan has a complex legal, tax and administrative environment that constrains the
development of SME clusters. Some of the additional factors such as corruption, nepotism,
political manipulation of the judicial system, an incompetent judiciary and delays in criminal and
civil litigation negatively affect SME development in Pakistan. Pakistan’s police system is
notorious for corruption; additionally, manipulative lawyers and judges force people to settle
disputes out of court. These factors also constrain the development of SMEs in Pakistan.
We summarize this review through a conceptual framework to show how political,
economic, social, and technological environmental and legal factors are linked to SME cluster
development in Pakistan. Figure 1 seeks to display both how these factors are interrelated and
their effects on the existence and development of SME clusters. It shows the extent to which
these contextual factors either facilitate or constrain the prospects for collective action by SMEs.

The national business context for industrial SME cluster development in Pakistan: constraining and
facilitating factors
Fayyaz, Raud, and Syed
___________________________________________________________________________
______________________________________________________________________________
204
© 2019 (9th) International Conference of the AGMS Proceedings
Figure 1: Link between political, economic, social, technological, environmental and legal
factors and SME cluster development in Pakistan.
POLITICAL FACTORS
1. Lack of continuity of industrial policies
and instable government (Undermining)
2. Focus of government on the large-scale
sector (Undermining)
3. Insecurity and terrorism (Undermining)
SOCIAL FACTORS
1. Poverty; illiteracy; corruption
(Undermining)
2. Unemployment (Undermining) 3. Child labour (Undermining)
4. Population expansion (Undermining)
5. Power crisis and lack of foreign investment (Undermining)
6. Economic meltdown & political
instability (Undermining) 7. Uncontrolled inflation (Undermining)
8. War on terror (Undermining)
9. Strong beradari/clan system (Undermining)
10. Low education of entrepreneurs; lack of
management skills (Undermining) 11. Scarcity of skilled labour (Undermining)
12. More than fifty percent productive
population (Facilitating) 13. Subcontracting (Facilitating)
ENVIRONMENTAL FACTORS
1. Environmental compliance requirements
(Undermining)
2. Power crisis and macroeconomic instability
(Undermining)
3. Natural gas shortage (Undermining)
4. Water scarcity (Undermining) 5. Poor application of land rights (Undermining)
6. Poor access to raw materials (Undermining)
TECHNOLOGICAL FACTORS
1. Industrial backwardness; technology
underdevelopment (Undermining)
2. Poor emphasis on higher education and R&D 3. Weak performance of Pakistan on technology-
intensive, sophisticated products
(Undermining) 4. Skill deficiencies and migration of labour
force (Undermining)
LEGAL FACTORS
1. Complex legal, tax and administrative
environment (Undermining) 2. Corruption, nepotism and political manipulation
of the judicial system (Undermining)
3. Incompetent judiciary (Undermining) 4. Delay in criminal and civil litigations
(Undermining)
5. Notorious police (Undermining) 6. Manipulative lawyers and judges (Undermining)
7. Out of court dispute settlement (Undermining)
SME CLUSTER
DEVELOPMENT
ECONOMIC FACTORS
1. Poor growth of the large-scale sector (Undermining)
2. Inflation (Undermining) 3. Depreciation of Pakistani currency and exchange rate
fluctuation (Undermining) 4. Performance of the small-scale sector (Facilitating)

The national business context for industrial SME cluster development in Pakistan: constraining and
facilitating factors
Fayyaz, Raud, and Syed
___________________________________________________________________________
______________________________________________________________________________
205
© 2019 (9th) International Conference of the AGMS Proceedings
Managerial Implications
First, it is clear that Pakistani SME managers, support organizations and relevant
stakeholders may improve the business environment for SME cluster development. They may
identify a way to manage Pakistan’s corrupt political setup to improve the predictability of the
country’s policies.
A second implication of this article for SME managers is to change Pakistani policy
makers’ focus from large-scale enterprises to the small-scale sector specifically that of SMEs and
SME clusters, to improve the performance of Pakistan’s SMEs. Keeping in mind the strong SME
base in Pakistan, SME managers should work on profiling both SMEs and SME clusters to
understand the actual number and strength of SMEs in Pakistan.
Third, SME managers may work in close collaboration with local and international
nongovernmental organizations (NGOs) and federal and provincial SME support departments to
improve literacy and reduce the power crisis, particularly in Pakistan’s industrial clusters.
Fourth, SME managers may work on the technological and R&D capabilities of
Pakistan’s entrepreneurs and SMEs in spite of their imperfect knowledge of technological
alternatives, the absence of new skills and their poor access to capital that would allow SMEs to
acquire new technologies.
Fifth, SME managers may pay attention to the variables attached to the information flow,
trust, reciprocity and connectedness of SME network members and how they obtain economic
benefits through collective action. SME managers may also learn how SMEs and entrepreneurs
in Pakistan survive in an environment in which most of the political, economic, social and
environmental indicators constrain the growth and development of SMEs and SME clusters.
Finally, this article highlights the importance for government policy makers to pay
attention to the issues of poverty, inflation, exchange-rate fluctuation, power and gas shortages,
the land mafia and Pakistani SMEs’ poor access to input materials. Policy makers may
investigate the country’s corruption, macro-economic instability, political instability, crimes,
theft and poor law-and-order situation, which is causing poor development of both SMEs and
entrepreneurship.
The national business context for industrial SME cluster development in Pakistan: constraining and
facilitating factors
Fayyaz, Raud, and Syed
___________________________________________________________________________
______________________________________________________________________________
206
© 2019 (9th) International Conference of the AGMS Proceedings
Research Implications
First, this article has identified some links to the PESTEL factors, but there is no clear
relationship between SME development and SME cluster development with the individual
components of these factors. Future research can explore and test Figure 1 in similar contexts of
developing economies while exploring the co-relations of the subcomponents of political,
economic, social, technological, environmental and legal factors.
Second, it is important to understand the link between poverty, inflation and depreciation
of Pakistan’s currency and the development of SMEs and SME clusters in developing economies
(such as that of Pakistan).
Third, scholars might need to determine how to develop SMEs and SME clusters around
unstable environments and how to initiate the change process in a country such as Pakistan.
Fourth, further exploration is necessary to determine how to improve the tax, legal and
police system for SMEs in a developing country such as Pakistan, where lawsuits are retributive
and individuals are using the law to settle scores by delaying justice at all costs.
Fifth, it may be important to identify the effects of the corrupt judicial system and
unethical decisions on the development of SME clusters and how to improve the trust deficit not
only to bring large, medium and small enterprises into the tax net but also to enable them to grow
and add value to the economy.
Finally, the article highlights the need to explore how to change the mind-set of police in
a developing country such as Pakistan. How do we initiate the change process in Pakistan? Must
we explore the possibility of involving the huge productive population and subcontracting in
Pakistan’s business environment?

The national business context for industrial SME cluster development in Pakistan: constraining and
facilitating factors
Fayyaz, Raud, and Syed
___________________________________________________________________________
______________________________________________________________________________
207
© 2019 (9th) International Conference of the AGMS Proceedings
References
Abbas, H. (2011). Reforming Pakistan’s Police and Law Enforcement Infrastructure. US Institute
of Peace, Washington, DC.
ADB (2002). Poverty in Pakistan: Issues, Causes, and Institutional Responses. Manila: Asian
Development Bank.
Adil, C. M., (2015). Socio Economic Problems of Pakistan, Hamari Web Society and Culture
Articles, January, Available at: www.hamariweb.com.
Ahmad, K. (2006). Pakistan: Vision and reality, past and future. The Muslim World, 96(2), 363-
379.
Ahmad, S. (2007). Land and Water Resources of Pakistan—A Critical Assessment. The Pakistan
Development Review, 911-937.
Ahmed, M., Saleem, S., & Iftikhar, I. (2012). Political System of Pakistan. History, 2(10-11), 1-
11.
Afzal, M., & Hussain, M. (1974). The population of Pakistan. Paris: Committee for International
Coordination of National Research in Demography.
Akhtar, S. (2010). Emerging challenges to Indus Water Treaty. FOCUS, 28(3).
Ali, A. (2010). Economic cost of terrorism: A case study of Pakistan. Strategic Studies.
Ali, E. J. (2014). Exploring the Hydro Power Potential through Existing Water Supply Lines
from Simly Dam to Islamabad City under Gravity Flow. 1st International Conference on
Emerging Trends in Engineering, Management & Sciences. December 29-30. Islamabad.
Ali, S., M. (2012). The Political Economy of Land in Pakistan, The Express Tribune, 23 July.
Amin, K (2004). Promoting Greater Regional Integration in South Asia: Opportunity for and the
Role of Private Sector in Pakistan, World Bank/IMF 2004 Annual Meeting Seminar,
Washington.
Amjad, R. (2005). Pakistan's poverty reduction strategy: why employment matters.

The national business context for industrial SME cluster development in Pakistan: constraining and
facilitating factors
Fayyaz, Raud, and Syed
___________________________________________________________________________
______________________________________________________________________________
208
© 2019 (9th) International Conference of the AGMS Proceedings
Amjad, R. (2006). Why Pakistan must break-into the knowledge economy.
Amjad, R., ul Haque, N., & Colclough, C. (2005). Skills and Competitiveness: Can Pakistan
Break Out of the Low-level Skills Trap?. The Pakistan Development Review, 387-409.
Andersson, T., Schwaag-Serger, S., Sörvik, J., & Wise, E. (2004). Cluster Policies Whitebook.
IKED-International Organisation for Knowledge Economy and Enterprise Development.
APP, (2012). Poor implementation of environmental laws Steps sought to curb losses, The
Nation, 03 September.
Arif, G. M. (2000). Recent rise in poverty and its implications for poor households in
Pakistan. The Pakistan Development Review, 1153-1170.
Arshad, W., Sharif, M. N., Mohsin, S., Sattar, A., & Sultan, F. (2014). Power Crisis: A Result of
Mismanagement Rather Than Unavailability of Resources. In 12th International
Conference (p. 301).
Asad, M., Haider, S. H., Akhtar, M. B., & Javaid, M. U. (2011). Human Resource Practices and
Enterprise Performance in Small and Medium Enterprises of Pakistan.
Asghar, S., & Javed, S. A. (2011). On Measuring Inclusiveness of Growth in Pakistan. The
Pakistan Development Review, 50(4-II), pp-879.
Bakunda, G. (2014). Effect of Local Business Culture on SME Outsourcing Choice by TNCs in
Uganda.
Basant, R. (2004). US-India technology cooperation and capability building: The role of inter-
firm alliances in knowledge-based industries.
Bashir, R., Shakir, R., Ashfaq, B., Hassan, A., (2014). The Efficiency of Foreign Exchange
Markets in Pakistan: An Empirical Analysis. The Lahore Journal of Economics, vol. 19,
no. 1, pp. 133–149.
Batool, N., Naeem, S., & Sana, F. (2009). Effect of Education on Unemployment in Pakistan.
Bengali, K. (1999). History of educational policy making and planning in Pakistan. Sustainable
Development Policy Institute.

The national business context for industrial SME cluster development in Pakistan: constraining and
facilitating factors
Fayyaz, Raud, and Syed
___________________________________________________________________________
______________________________________________________________________________
209
© 2019 (9th) International Conference of the AGMS Proceedings
Bhatti, M. N., & Farooq, M. (2014). Politics of Water in Pakistan. Pakistan Journal of Social
Sciences (PJSS), 34(1), 205-216.
Bhatti, S., (2006). Diagnostic Study, Lahore Garments Cluster. UNIDO Cluster Development
Programme for Pakistan, 2001 to 2009.
Bhutt, S. K., ur Rehman, M., & ur Rehman, S. (2014). Analysis of exchange rate fluctuations: A
study of PKR vs USD. Journal of Managerial Sciences Volume VIII Number, 1, 42.
Bilawal, M., Ibrahim, M., Abbas, A., Shuaib, M., Ahmed, M., Hussain, I., & Fatima, T. (2014).
Impact of Exchange Rate on Foreign Direct Investment in Pakistan. Advances in
Economics and Business, 2(6), 223-231.
Boje, D. M., & Khan, F. R. (2009). Story-branding by empire entrepreneurs: Nike, child labour,
and Pakistan’s soccer ball industry. Journal of Small Business &
Entrepreneurship, 22(1), 9-24.
Braunerhjelm, P. (2010). Entrepreneurship, Innovation and Economic Growth-past experience,
current knowledge and policy implications.
Burki, S. J. (1999). Pakistan: fifty years of nationhood. Basic Books.
Burki, S. J. (2008). Industrial policy: Domestic challenges, global imperatives, and Pakistan’s
choices [Special Edition]. Lahore Journal of Economics, 13, 23–34.
Chachar, A. A., De Vita, C. F., Parveen, S., & Chachar, Z. A. (2013). The Impact of Cultural
Factors on the Growth of Small and Medium Enterprises in Hyderabad,
Sindh. International Journal.
Chaudhary, A. R., Iqbal, A., & Gillani, S. Y. M. (2009). The nexus between higher education
and economic growth: An empirical investigation for Pakistan. Pakistan Journal of
Commerce and Social Sciences, 3(1), 1-9.
Chaudhry, S. A. (1996). Competition Policy and Democracy in Pakistan. Democracy, 1972, 78.
Chaudhary, M. A., & Hamid, A. (1998). Unemployment in Pakistan. Pakistan Economic and
Social Review, 147-170.

The national business context for industrial SME cluster development in Pakistan: constraining and
facilitating factors
Fayyaz, Raud, and Syed
___________________________________________________________________________
______________________________________________________________________________
210
© 2019 (9th) International Conference of the AGMS Proceedings
CIPD (2018). PESTLE Analysis. December 17. Available at:
https://www.cipd.co.uk/knowledge/strategy/organisational-development/pestle-analysis-
factsheet
Fajnzylber, P., W. F. Maloney and G.V. Montes-Rojas (2011), “Does formality improve micro-
firm performance? Evidence from the Brazilian SIMPLES program”, Journal of
Development Economics 94(2).
Farooq, A., Shahbaz, M., Arouri, M., & Teulon, F. (2013). Does corruption impede economic
growth in Pakistan?. Economic Modelling, 35, 622-633.
Farooqi, S., A., & Haroon, A., (2006). Diagnostic Study, Fan Cluster Gujrat, Pakistan, under
UNIDO Clusters and Networks Development Programme. Source:
https://www.unido.org/fileadmin/user_media/UNIDO_Worldwide/Offices/UNIDO_Offic
es/Pakistan/DS_Fans_Final_june_28_06.pdf.
Gray, C. (2006), ‘e-Governance Issues in SME Networks, IKD Working Paper No. 10, The Open
University Business School’s Innovation, Knowledge & Development Centre.
Gereffi, G. (1999). International trade and industrial upgrading in the apparel commodity
chain. Journal of international economics, 48(1), 37-70.
Hakim, A., & Mahmood, M. A. (2001). Population Policy Shifts and Their Implications for
Population Stabilisation in Pakistan [with Comments]. The Pakistan development review,
551-573.
Haneef, T. (2010). Barriers to Growth of SMEs in Lahore and Their Effects on SMEs.
Haque, A., (2011). The Solution to Pakistan’s Energy Crisis, The Express Tribune, 05 July.
Hassan, B., (2014). Finding the right mix between land, labour and organisation, Need for human
resource management, Pakistan Today, 01 November, www.pakistantoday.com.pk.
Hassan, M., & Malik, A. W. (2014). Effects of Socio-Economics and Political Factors on
Success/Failure of Software Based Projects in Pakistan. International SAMANM Journal
of Marketing and Management. ISSN 2308-2399, Vol. 2, No. 3. 45.
Hasan, P. (1997) Learning from the Past: A Fifty-Year Perspective of Pakistan’s Development.
The Pakistan Development Review 36:4, 355–402.

The national business context for industrial SME cluster development in Pakistan: constraining and
facilitating factors
Fayyaz, Raud, and Syed
___________________________________________________________________________
______________________________________________________________________________
211
© 2019 (9th) International Conference of the AGMS Proceedings
Heydarian, N. (2013).Pakistan Provincial High Courts and Lower Courts,
http://www.pakistanilawyers.com, 28 March.
Haydar, S., & Aziz, J. A. (2009). Characterization and treatability studies of tannery wastewater
using chemically enhanced primary treatment (CEPT)—a case study of Saddiq Leather
Works. Journal of Hazardous Materials, 163(2), 1076-1083.
Hazlina Ahmad, N., Ramayah, T., Wilson, C., & Kummerow, L. (2010). Is entrepreneurial
competency and business success relationship contingent upon business environment? A
study of Malaysian SMEs. International Journal of Entrepreneurial Behavior &
Research, 16(3), 182-203.
Humphrey, J., & Schmitz, H. (1995). Principles for promoting clusters & networks of
SMEs (Vol. 1). Vienna: UNIDO.
Humphrey J. and Schmitz H. (2002), ‘How does insertion in global value chains affect upgrading
in industrial clusters?’ Reg. Studies 36, 1017–1027.
Humphrey, J. (2003). Opportunities for SMEs in developing countries to upgrade in a global
economy. International Labour Office.
Hussain, A. (2012). A perspective on Pakistan’s economic history: growth, economic structure
and governance.
Hussain, A. (2012). Judicial Reforms: A Need of Time, Pakistan Analysis, 25 April.
Hussain, I. (2004). Economy of Pakistan past-present and future, Conference on Pakistan
economy. Washington D.C, January 2004.
Husain, I. (2005). “Key Issue in Managing Pakistan’s Economy”, An Inaugural Address, The
Lahore Journal of Economics, Special Issue.
Husain, I. (2005, May). SME financing: Issues and Strategies. In Welcome Address at the
Conference on SME Financing—Issues and Strategies.
Husain, I. (2010). Pakistan’s Growth Experience. Business Review,5(2).
Hussain, F. (2011). "The Judicial System of Pakistan," (Islamabad: Registrar, Supreme Court of
Pakistan, 2011).
The national business context for industrial SME cluster development in Pakistan: constraining and
facilitating factors
Fayyaz, Raud, and Syed
___________________________________________________________________________
______________________________________________________________________________
212
© 2019 (9th) International Conference of the AGMS Proceedings
ILO, 2002. Creating a Conducive Policy Environment for Micro, Small and Medium Sized
Enterprises in Pakistan; SEED Working Paper No.29.
Imam, K. (2011). Police and the rule of law in Pakistan: A historical analysis.Berkeley Journal of
Social Sciences, 1(8).
IPRI, (2014). Roadmap for Economic Growth of Pakistan. Conference held on October 22-23,
2014 at Marriott Hotel, Islamabad by the Islamabad Policy Research Institute (IPRI).
Iqbal, A. (2015). Water scarcity may threaten national economy: IMF, The Dawn News, 09 June.
Iqbal, M. K., Nadeem, A., & Shafiq, T. (2007). Biological treatment of textile waste water by
activated sludge process. Journal of the Chemical Society of Pakistan, 29(5), 397-400.
Izhar-Ul-Haq, D. R., & Sheikh, M. Hydropower Potential of Pakistan.
James William E. and Naya Seiji, (1990). Trade and Industrialization Policies for an Accelerated
Development in Pakistan. The Pakistan Development Review, Vol. 29, No. 3/4, pp. 201-
222.
Javaid, (2015). Pakistan Crisis, Problem and Solutions, The Media Point, 23 April,
www.themediapoit.com.
Javaid, A. M., Hussain, S., Maqsood, A., Arshad, Z., Arshad, A., & Idrees, M. (2011). Electrical
energy crisis in Pakistan and their possible solutions. International Journal of Basic &
Applied Sciences IJBAS-IJENS, 11(05), 38.
Javed, S. U. (2012). Globalization of Competition Law-Challenges for Pakistan's Competition
Regime. Available at SSRN 2035813.
John, W. (2009). Pakistan: the struggle within. Pearson Education India.
Joshi, P. C. (1974). Land reform and Agrarian change in India and Pakistan since 1947: 1. The
Journal of Peasant Studies, 1(2), 164-185.
Kahlown, M. A., Ashraf, M., Hussain, M., Salam, H. A., & Bhatti, A. Z. (2006). Pakistan
Council of Research in Water Resources Khyaban-e-Johar, H-8/1, Islamabad.

The national business context for industrial SME cluster development in Pakistan: constraining and
facilitating factors
Fayyaz, Raud, and Syed
___________________________________________________________________________
______________________________________________________________________________
213
© 2019 (9th) International Conference of the AGMS Proceedings
Kaplinsky, R. (1998). Globalisation, industrialisation and sustainable growth: the pursuit of the
nth rent (No. 365). Institute of Development Studies, University of Sussex.
Kardar, S. (2014). Need for judicial reforms, The Dawn News, Karachi, 11 November.
Kemal, A. R. (2006). Key issues in industrial growth in Pakistan. The Lahore Journal of
Economics, 11, 49-74.
Kemal, A. R. (2005). Skill development in Pakistan. The Pakistan Development Review, 349-57.
Kemal, A. R., & Mahmood, Z. (1998). The Urban Informal Sector of Pakistan. Some Stylized
Facts (No. 1998: 161). Pakistan Institute of Development Economics.
Kessides, I. N. (2013). Chaos in power: Pakistan's electricity crisis. Energy policy, 55, 271-285.
Khalid, I. and I. Begum. 2013. Hydro-politics in Pakistan: perceptions and misperceptions. South
Asian Studies: A Journal of South Asian Studies, Vol. 28(1): 7-23.
Khan, H. A. (1998). Implementing NEQS: Pakistan's Experience in Industrial Pollution Control.
Sustainable Development Policy Institute.
Khan, M. I., & Qureshi, M., A. (2007). The small and medium enterprises Act as catalyst for
economic growth and development in Pakistan: Economic growth and development
perspective.
Khan, M. R., Kausar, A., Gul, F. & Iqbal, M. (2014). The impact of privatization on the financial
performance of banking industry: a comparison of privatized and public banks in
Pakistan. First International Conference on Emerging Trends in Engineering,
Management and Sciences. December 28-30, 2014 (ICETEMS-2014) Peshawar,
Pakistan.
Khan, M. S. and Hafeez, A. (1999). Consumer Laws in Pakistan, Consumer Rights Commission
of Pakistan pp.1-88.
Khan, S. (2010). The Endgame in Afghanistan: The Mcchrystal Plan and its Impact on
Pakistan’s Security. Reflections, (2).
Khan, S. B., & Anwar, S. (2013). University-industry partnership for development of
knowledge. Asian journal of social sciences & humanities, 2(2), 268-274.

The national business context for industrial SME cluster development in Pakistan: constraining and
facilitating factors
Fayyaz, Raud, and Syed
___________________________________________________________________________
______________________________________________________________________________
214
© 2019 (9th) International Conference of the AGMS Proceedings
Lall, S. (2000). The Technological structure and performance of developing country
manufactured exports, 1985‐98. Oxford development studies, 28(3), 337-369.
Lasi, S., (2008). Economics of Pakistan, Civil Service of Pakistan Forum,
www.cssforum.com.pk, 24 October.
Lau, M. W. (2002). The role of Islam in the legal system of Pakistan (Doctoral dissertation,
School of Oriental and African Studies (University of London)).
Lau, M. (2005). The role of Islam in the legal system of Pakistan. Brill.
Lillah, W. (2012). Criminal justice system needs revision: experts, The Business Recorder, 30
November.
Luken, R. A. (2000). Industrial Policy and the Environment in Pakistan. United Nations
Industrial Development Organization (UNIDO), 11 December.
Lund-Thomsen, P., & Nadvi, K. (2010). Global value chains, local collective action and
corporate social responsibility: a review of empirical evidence. Business Strategy and the
Environment, 19(1), 1.
Mahmood, Z., & Siddiqui, R. (2000). State of technology and productivity in Pakistan's
manufacturing industries: Some strategic directions to build technological
competence. The Pakistan Development Review, 1-21.
Magsi, H., & Atif, S. (2012). Water management, impacts and conflicts: case of indus water
distribution in Sindh, Pakistan. International Journal of Rural Studies.
Malakauskaitė, A., & Navickas, V. (2009). The impact of clusterization on the development of
small and medium-sized enterprise (SME) sector. Journal of Business Economics and
Management, (3), 255-259.
Malecki, E. J. (1997). Technology and economic development: the dynamics of local, regional,
and national change. University of Illinois at Urbana-Champaign's Academy for
Entrepreneurial Leadership Historical Research Reference in Entrepreneurship.
Malik, A. (2008). How Pakistan is coping with the challenge of high oil prices.
Malik, N. (2014). Corporate Social Responsibility and Development in Pakistan. Routledge.
The national business context for industrial SME cluster development in Pakistan: constraining and
facilitating factors
Fayyaz, Raud, and Syed
___________________________________________________________________________
______________________________________________________________________________
215
© 2019 (9th) International Conference of the AGMS Proceedings
Mehmood, A., & Haroon, A., (2006). Diagnostic Study, Cutlery Cluster Wazirabad, Pakistan,
under UNIDO Clusters and Networks Development Programme. Source:
https://www.unido.org/fileadmin/user.../DS_Aug_06_Cutlery_uu.pdf.
Mian, S. A. & Qureshi, M. S., (2011). Global Entrepreneurship Monitor (GEM) Report 2011 on
Pakistan. Institute of Business Administration, Karachi Pakistan.
Mills, E. (2012). Pakistan's Energy Crisis. US Institute of Peace.
MOF, (2011). Overview of Economy. Economic Survey of Pakistan 2010-11. Ministry of
Finance, Islamabad, Pakistan – www.finance.gov.pk.
Morrison, A., Pietrobelli, C., & Rabellotti, R. (2008). Global value chains and technological
capabilities: a framework to study learning and innovation in developing
countries. Oxford development studies, 36(1), 39-58.
Muhammad, M. Z., Char, A. K., bin Yasoa, M. R., & Hassan, Z. (2010). Small and medium
enterprises (SMEs) competing in the global business environment: A case of Malaysia.
International Business Research, 3(1), 66.
Mustafa, D., Akhter, M., & Nasrallah, N. (2013). Understanding Pakistan’s water-security
nexus. United States Institute of Peace, 2301.
Nadvi, K. (2004). 11. The effect of global standards on local producers: a Pakistani case
study. Local enterprises in the global economy: Issues of governance and upgrading,
297.
Nawaz, W., Arif, M., & Masood, B. (2013). Energy Crises Mitigation through Available Energy
Potential in Pakistan. Superior University, 1-10.
Nichter, S., & Goldmark, L. (2009). Small firm growth in developing countries. World
Development, 37(9), 1453-1464.
Nolan, C. T., & Garavan, T. N. (2016). Human resource development in SMEs: a systematic
review of the literature. International Journal of Management Reviews, 18(1), 85-107.
Noman, A. (1991). ‘Industrial Development and Efficiency,’ Pakistan Development Review,
30(4). (Winter).

The national business context for industrial SME cluster development in Pakistan: constraining and
facilitating factors
Fayyaz, Raud, and Syed
___________________________________________________________________________
______________________________________________________________________________
216
© 2019 (9th) International Conference of the AGMS Proceedings
Omer, M., (2014). 6 Areas Where Pakistani BBA and MBA Degrees Fall Short, The Dawn
News, Karachi, 6 December, www.dawn.com.
Perrons, D., & Plomien, A. (2013). Gender, inequality and the crisis. Women and Austerity. The
economic crisis and the future for gender equality, 295-313.
PES, (2014a). Pakistan Economic Survey (PES) 2013 – 14. Inflation, Chapter 07, Ministry of
Finance, Government of Pakistan, www.finance.gov.pk
PES, (2014b). Pakistan Economic Survey (PES) 2013 – 14. Population, Labor Force &
Employment, Chapter 12, Ministry of Finance, Government of Pakistan,
www.finance.gov.pk
Qayyum, W., & Siddiqui, R. (2007). Causes of Youth Unemployment in Pakistan [with
Comments]. The Pakistan Development Review, 611-621.
Quader S. & Abdullah M., (2009). Constraints to SMEs: A Rotated Factor Analysis Approach, A
Research Journal of South Asian Studies, 24(2): 334 -350.
Ray, R. (2000). Analysis of child labour in Peru and Pakistan: A comparative study. Journal of
Population Economics, 13(1), 3-19.
Raymond, A. H., & Shackelford, S. J. (2013). Technology, Ethics, and Access to Justice: Should
an Algorithm Be Deciding Your Case. Mich. J. Int'l L., 35, 485.
Rodríguez, J. L., & Rodríguez, R. M. G. (2005). Technology and export behaviour: A resource-
based view approach. International Business Review,14(5), 539-557.
Saif113sb, (2015). Industrial Development in Pakistan. http://saif113sb.hubpages.com, 16 June.
Salman, A., (2015). Many Pakistanis using 10 times more water than world average, The
Express Tribune, 08 March.
Sayeed, A., & Memon, R., (2007). Beyond the Investment Climate: Towards Understanding the
Investment Conundrum in Pakistan.
SBP, (2002). Socio-economic Update, State Bank of Pakistan (SBP) Annual Report, Financial
Year, 2002, Chapter 11.
The national business context for industrial SME cluster development in Pakistan: constraining and
facilitating factors
Fayyaz, Raud, and Syed
___________________________________________________________________________
______________________________________________________________________________
217
© 2019 (9th) International Conference of the AGMS Proceedings
Shafqat, S., (2011). Saving Pakistan: Devising an Agenda for Counter Terrorism Strategy,
Centre for Public Policy and Governance (CPPG), F.C. College Lahore, Pakistan. 01,
April.
Shafqat, S., & ul Haque, R. (2011). Quarterly Research.
Shaheen, F. (2013). Fluctuations in Exchange Rate and its Impact on Macroeconomic
Performance of Pakistan. Dialogue, 8(4), 411.
Shaikh, Z. A., (2013). Growing Economic Problems of Pakistan. Department of Economics,
Shah Abdul Latif University, Khairpur, Pakistan, April, 2013.
Sheikh, S., (2009). Socio Economic Problems of Pakistan, Civil Service of Pakistan Forum, 23
December, www.cssforum.com.pk.
Sherazi, S.K., Iqbal, M.Z.; Asif, M.; Rehman, K. and Shah, S.S.H. (2013). Obstacles to Small
and Medium Enterprises in Pakistan. Principal Component Analysis Approach. Middle-
East Journal of Scientific Research, 13(10), 1325-1334.
Siddiqi, A., A., (2007). After 60 Years – are we there yet? The News, Lahore, 14 August.
Siddique, O. (2011). DPRC Working Paper 4.
Siddiqui, S. (2008). Breaking the cartels, The Dawn News Editorial, 19 May.
Sonu, (2012). Socio-economic Problems of Pakistan, published on TafreeMela.com, 9
November.
TIP, (2011). Transparency International Pakistan (TIP) Annual Report, covering TIP’s activities
in Pakistan from January to December 2011.
Ulku, H. (2007). R&D, innovation, and growth: evidence from four manufacturing sectors in
OECD countries. Oxford economic papers, 59(3), 513-535.
UNIDO (2001), ‘SME Brochure: Development of Clusters and Networks of SMEs,’ Private
Sector Development Branch, Investment Promotion and Institutional Capacity Building
Division, UNIDO Vienna, Austria.

The national business context for industrial SME cluster development in Pakistan: constraining and
facilitating factors
Fayyaz, Raud, and Syed
___________________________________________________________________________
______________________________________________________________________________
218
© 2019 (9th) International Conference of the AGMS Proceedings
Wang, Y. (2016). What are the biggest obstacles to growth of SMEs in developing countries? An
empirical evidence from an enterprise survey. Borsa Istanbul Review, 16(3), 167-176.
Wasseem, M. (1992). Pakistan's lingering crisis of dyarchy. Asian Survey, 617-634.
Wignaraja, G. (2002). Firm size, technological capabilities and market-oriented policies in
Mauritius. Oxford Development Studies, 30(1), 87-104.
Yusuf, M. (2014). Pakistan’s Militancy Challenge. Pakistan's Counterterrorism Challenge, 15.

Impact of transformational leadership on employee’s performance, with the mediating role of job
satisfaction and employees’ commitment
Khan, Khan, and Khan
___________________________________________________________________________
______________________________________________________________________________
219
© 2019 (9th) International Conference of the AGMS Proceedings
Impact of transformational leadership on employee’s performance, with the mediating role
of job satisfaction and employees’ commitment
by
Muhammad Shahid Khan, Marina Khan, and Rukhsar Khan
Abstract
This study investigates the underlying mechanisms and boundary conditions that explain the
relationship between transformational leadership and employee performance with the mediating
effect of job satisfaction and employee commitment. In this study the data is collected from
Telenor Telecom Pakistan through questionnaires where 220 respondents participated in the
survey. SmartPLS software is used to analyze the data. To check the reliability of the instrument
composite reliability technique is used, and for checking validity, construct validity is being
used. The research shows that transformational leadership plays an important role in enhancing
employee’s interpersonal relationship with his supervisor and also increases job satisfaction in
the organization.
Keywords: transformational leadership, employee performance, job satisfaction, employee
commitment
Corresponding Author, Muhammad Shahid Khan, PLC Group Malaysia,

Impact of transformational leadership on employee’s performance, with the mediating role of job
satisfaction and employees’ commitment
Khan, Khan, and Khan
___________________________________________________________________________
______________________________________________________________________________
220
© 2019 (9th) International Conference of the AGMS Proceedings
1.1 Background of the study
In Pakistan, there are numerous service sectors, Telecommunication sector is one of the
growing service sector. The flow of communication and networking is affected by the smooth
and effective functioning of this sector. Like in other organizations, the role of leadership is
considered quite crucial for it’s success. Similarly, leadership is also found necessary for the
success of Telecommunication companies. If we talk about other factors like that of
advancement in information technology, culture and organizational structure are important for
the success of a firm, just like that role of leadership is also becoming important in the
organizations. In the field of management, it always came forward as an important and
challenging topic. If an employee is highly satisfied with his job then he will definitely perform
well (Walumbwa et al., 2011). Researchers and different analysts focused on finding the
relationship between style of leadership and performance of an employee.
Leadership style also differs from person to person according to different situations and
the requirements (Bass & Bass, 2009). There are various theories of leadership and they give
some sort of knowledge and explanation about leadership process (Bass & Bass, 2009).
Behavioral, trait and contingency theories are known as traditional theories and transformational
leadership theory is now-a-days considered, a quite emerging and new style of leadership theory.
In management researches, transformational leadership theory is getting popular and seeking
more attention.
Different styles of leadership theories and their connection with employee performance is
also getting popular and gaining attention of researchers. Numerous scholars and researchers
have stated that those employees who are highly committed with their jobs often perform well
(Walumbwa & Hartnell, 2011). In order to meet the challenges of growing World and while
being in such a competitive environment, organizations are focusing towards employee’s
performance (Wofford et al., 2001). It is also suggested and assumed that the development of
organization depends on leadership, and there should be love and harmony between the leader
and the employees. The main job of the leader is to run the organization towards fulfilling goals,
tasks and operations. Other researchers have also stated that to improve the performance of
employees, leadership is needed. The main focus of our study is to find out that how
transformational leadership affects and influences the job performance of employees through job
satisfaction and employee commitment in Telecom sector of Pakistan. It is discussed and
expected that transformational leadership style is better than transactional leadership style
because transformational leadership helps employees to work better and produce much more
outcome in the organization (Bass & Bass, 2009). Transactional leadership does not have an
impact in the success of an organization (Bass, 1998; Masi and Cooke, 2000).

Impact of transformational leadership on employee’s performance, with the mediating role of job
satisfaction and employees’ commitment
Khan, Khan, and Khan
___________________________________________________________________________
______________________________________________________________________________
221
© 2019 (9th) International Conference of the AGMS Proceedings
Leadership is considered to be important for the success of organizations (Kouzes &
Posner, 2008), it is necessarily important for those organizations who faces great amount of
change and uncertainty (Bass, 1990), as leadership affects employee commitment towards
change (Waldman et al., 2001). In general, employee commitment is very much important in
achieving the aims of the organizations (Rossy & Archibald, 1992). In the same way
transformational style of leadership also has significant impact on employees’ commitment and
performance (Avolio, Weichun, Koh, & Bhatia, 2004; McColl-Kennedy & Anderson, 2005; G.
Wang, Oh, Courtright, & Colbert, 2011). The main focus of the study is to find out the
relationship of transformational leadership and employee performance while job satisfaction and
employee commitment are there as mediators in Telecom sector of Pakistan.
The previous research done by Naeem and Khanzada (2018) in health sector of Pakistan
has gathered data only from hospitals located at Rawalpindi, Lahore and Islamabad with a small
sample, convenience sampling technique was used and job satisfaction was a mediator between
transformational leadership and employee performance. M. Asrar-ul-Haq (2016) conducted
research in banking sector of Pakistan has collected data from few banks which did not represent
the entire banking sector of Pakistan. The research done by Jyoti and Bhau (2015) was resrtricted
to government degree colleges in Jammu. Gyensare et al., (2016) conducted research in
Ghanaian SLCs also used a small sample. The research should be conducted in other countries
to provide broader insights into the effects of transformational leadership and proactive
personality on employee outcomes, to see the relationship between transformational leadership
and employee performance other factors could be assess as a mediator (Buil, Martínez, &
Matute, 2019) .Therefore, the aim of this study is to identify the relationship between
transformational leadership and employee performance with the mediating effect of job
satisfaction and employee commitment.
All the previous researchers have set few limitations and a gap in the literature i.e.
researches were done on specific sectors, small sample were drawn, and the use of variables and
sampling techniques were different. So, the study aims to fill these gaps.
This research is conducted to add more knowledge in the area and field of leadership that
how transformational leadership impacts employee performance through job satisfaction and
employee commitment. This research aim is also to contribute for further growth of leadership
concepts. It’s basically purpose is to provide both theoretical and practical information to
corporate stakeholders and policy makers who uses it for the growth of an organization and also
the role of transformational leadership should not harm employee as a person while increasing
productivity.
Impact of transformational leadership on employee’s performance, with the mediating role of job
satisfaction and employees’ commitment
Khan, Khan, and Khan
___________________________________________________________________________
______________________________________________________________________________
222
© 2019 (9th) International Conference of the AGMS Proceedings
LITERATURE REVIEW
As competition is increasing day by day and change in business management is calling
for a need of leadership. Leadership has remained one of the most important topic and there are
several definitions which has come forward. As discussed by Jong and Hartog, (2007), explained
leadership as it is a way of persuading and convincing people to achieve what they aim for.
Andersen (2016) highlighted leaders are those people who shows the roadmap to their followers
and encourage them to achieve the aims and objectives of their targeted goals. Different types of
leader uses different methods of leadership in order to encourage their followers. Lok and
Crawford (2004) stated that leaders can easily see and guess the future of an organization. This
research aims to find the impact of transformational leadership on employee’s performance
through job satisfaction and employee commitment in Telecom sector of Pakistan.
Different researchers have different views about leadership and how it brings success and
failure to the firms. But most of them agree that it is quite profitable for the organization to have
transformational style of leadership. There are various theories related to leadership. The first
originated theory was Trait theory which says that leaders are born. Later the second theory
emerged by the name Behavioral Theory which says that leaders have some specific traits and
behavior which can learnt and built. The third theory also came into existence i.e Contingency
Theory which states that there are multiple traits and forms of behavior which leader exhibits in
varying situations. But among all these famous and profound theories, we see that
Transformational leadership theory is the most acceptable and recognizing in research field.
There are two types of leadership theories i.e few are known as traditional and few are
taken as modern. Trait, behavioral, and contingency are known as traditional leadership theories.
On the other side transformational and transactional are known as modern leadership theories.
Leadership is one of the most crucial topic, discussed by the researchers from different
parts of the world (Kuchler, 2008). According to Jong and Hartog (2007) explained leadership in
a way that it is the phenomena which inspires people so that they perform well and get the
desired output. Crawford and Lok (2004) claimed that leadership plays an essential role to
identify the organization’s success and failure. Gill (2006) further discussed that leaders
motivates, to make them more active, develop their interest, encourage their participation and to
highlight their strengths to achieve the desired results.
2.3.1 Transformational Leadership
The word transformational leadership was initially introduced by Burns (1978). He states
that he came up with the word leadership when he observed that it is the leader who encourage
his followers, motivate them, boost up their morale, highlight their strengths and help them
Impact of transformational leadership on employee’s performance, with the mediating role of job
satisfaction and employees’ commitment
Khan, Khan, and Khan
___________________________________________________________________________
______________________________________________________________________________
223
© 2019 (9th) International Conference of the AGMS Proceedings
overcome their weaknesses also their perception and belief by aligning with the objectives of the
firm in order to achieve the key results. Schepers et al. (2005) further stated that transformational
leaders help employees to come up with innovative ideas, give them to room to analyze the
problem from every angle and try to solve the problem through creative and new methods and
allow them to find and explore better solutions to the given problem by accessing technology.
Transformational leadership also reduces the employees’ burn out, burden and stress during
work in the organization Gill et al. (2006). Kirkan (2011) stated that transformational leadership
is that kind of leadership in which leaders change the the current or present situation after
looking towards the problem then he inspires, persuades and make the followers excited enough
to achieve goals of the firm. Ghadi et al. (2013) highlighted four dimensions of transformational
leadership. First one is idealized influence that is leader should know how to increase loyalty,
identification and dedication while ignoring the self-interest. Second is inspirational motivation
that is leader should be capable of creating a vision which will force workers to work diligently
for the success of organization. Third is intellectual stimulation which says that a leader should
also be capable of helping employees in terms of innovation or when it is to take risk. The last
and the fourth one is empowerment where leader should interact and coordinate with employees.
This is done in order to make employees to take decisions and can also deliver them.
There are several researches done on transformational leadership; Abu-Ruman (2016) has
done research on the influence of transformational leadership on crisis management preparedness
in Arab Potash Company and Jordan Phosphate Mines Company. The results which were drawn
from the studies have shown importance of transformational style of leadership that the Jordan
Phosphate Company and the Arab Potash Company’s top management should bring
transformational style of leadership. Para-Gonza`lez et al. (2018) have identified different
meditors i.e learning, innovation and HRM that may found between organizational performance
and transformational leadership. Boamah et al. (2017) identified the influence of nurse
managers’ transformative leadership behavior on patient safety outcome and job satisfaction in
Ontario. It proved that transformational leadership has impact on workplace empowerment
which increases job satisfaction of nurses and avoid risky patient outcomes.
Al-Jeditawi (2014) highlighted the influence of transformational leadership i.e the
president’s role on job satisfaction of the department chairman and dean at Jordanian
universities. The study discovered that the role of transformational style of leadership was
medium. Ghadi et al. (2013) also has done research on impact of transformational leadership on
work engagement where meaning in work is taken as a mediator. Majali (2014) also highlighted
the influence of transformational leadership on performance where entrepreneurial orientation
was taken as a mediator in industrial Jordanian company, it also revealed the same result that
transformational leaders role is again medium. Al-Fattih (2013) also conducted research in

Impact of transformational leadership on employee’s performance, with the mediating role of job
satisfaction and employees’ commitment
Khan, Khan, and Khan
___________________________________________________________________________
______________________________________________________________________________
224
© 2019 (9th) International Conference of the AGMS Proceedings
Saudi security services on the association of transformational leadership with organizational
learning and found out that significant relationship exists between these two variables.
Transformational leaders are the one who creates a vision and then guide and encourage
their employees to achieve the desired results. They also convince their followers to think
beyond limit (Hater & Bass, 1988; Doucet, Fredette, Simard, & Tremblay, 2015). These kinds of
leaders always try to show first a vision to their employees. Transformational leaders fall
somewhat into the category of charismatic leaders because they basically motivate their
followers by showing them their charismatic powers. Burns (1978) was the first person who
came forward with transformational style of leadership. He discussed that this style of leadership
moulds the behavior of an employee. These type of leaders persuade and guide their employees
to achieve their best in life. As discussed by Rouche, Baker, and Rose (1989) and Tajasom,
Hung, Nikbin, and Hyun, (2015), transformational leaders guide, persuade, convince and
encourage their employees to achieve and accomplish goals of the organization. They basically
persuade their followers and mould their behavior. Transformational leader changes a person so
much that he thinks more than getting rewards. Transformational leadership is that kind of
leadership in which followers get emotionally attached with their leader. This get evident when
we see the followers do everything what the leader says. Followers start liking their leader and
respect him. They are ready to do whatever the leader says (Barbuto, 1997).
In 1997, four factors of transformational leadership was presented by Bass. First one was
idealized influence. It is that quality of a leader who always stands as a role model. His
personality is quite different. Every word of a leader is considered important. Second one is
inspirational motivation in which a leader believes that every action will bring good outcomes
and strive to achieve them. He motivates his followers to achieve the goals. Third one is
intellectual stimulation in which they make sure that employees should know their problem and
should also know how to solve them. They are also trained to solve their problem in short period
of time. They make them so smart that they solve them quickly and efficiently (Bass & Avolio,
1997). The fourth one is individual consideration which says that everyone should be
individually treated as people are different from one another. They should be taught separately
and guided individually. By treating them individually they work more diligently and efficiently.
2.3.2 Relation between transformational leadership and employee performance
Transformational leadership is one of the most discussed and commonly used technique
of leadership. Previous researchers also have proved that there is a positive relationship between
transformational leadership and organizational effectiveness (Brand et al., 2000).
Transformational leaders are upright, straight, firm and honest. They also have clear objectives
and insight and can easily communicate with their followers to explain the vision and objectives
(Bass & Bass , 2009). It is also stated that transformational style of leadership will bring success

Impact of transformational leadership on employee’s performance, with the mediating role of job
satisfaction and employees’ commitment
Khan, Khan, and Khan
___________________________________________________________________________
______________________________________________________________________________
225
© 2019 (9th) International Conference of the AGMS Proceedings
to organizations where both the leader and the employee are devoted and passionate for the
development of their organization (Burns, 2003).
Transformational leaders just not only develop the skills and competencies of their
employees, they even combine and relate the objectives of employees with the objectives of
organization. It is also discussed in numerous studies that employees fulfill the obligation of the
organization efficiently when they are lead with transformational style of leadership (Arnold et
al., 2001). Walumbwa et al. (2008) stated that the impact of transformational leadership on
managerial performance in banking sector. Other researchers have also proved the impact of
transformational leadership on the performance of an employee in different sectors (Liao and
Chuang, 2007; Wang et al., 2005).
The employee can only perform well, when he is satisfied and highly committed towards
his job or work task (Walumbwa and Hartnell, 2011). The most important work and concern of
an organization is to increase the performance of an employee, so that he competes in a
challenging and competitive environment. There are numerous theories that came into existence
to represent some sort of connection between employee performance and style of leadership
(Vigoda-Gadot, 2007; Pedraja-Rejas et al., 2006). Leaders are always willing to support and
encourage their followers, i.e employees. Transformational leaders are also kind of trainers
because of their kind nature and great thought and they are also capable of meeting the objectives
of employees with the objectives of organization (Horwitz et al., 2008). With the passage of time
transformational leaders are also getting popular and helpful to educational institutes,
information technology based organizations and hospitals. Previous research and studies have
also shown some of interdependencies between transformational leadership and employee’s
productivity and job satisfaction.
According to Voon et al. (2011) he stated that job satisfaction is basically a different
mind-set of individuals towards the job. Job satisfaction and job contentment is find when an
employee is happy and experience a positive state of mind and it gets apparent when an
employee shows professional skills and perform good while dealing with his work tasks
(Shahzad and Benish, 2017). Voon et al. (2011) also stated that only those employees will
perform well who are satisfied with their job and get rewarded. Job satisfaction always leads to
high employee performance and success of an organization (Belias and Koustelios, 2014). Those
employees who are contented towards their job, experience positive state of mind which gets
apparent from their skills and performance (Rezvani et al., 2016).
It is proved in literature that the behavior of transformational leadership leads to positive
outcome. Transformational leadership has positive impact on employee motivation, self-efficacy,
organizational performance and creativity (Bronkhorst, Steijn, & Vermeeren, 2015; Bronkhorst

Impact of transformational leadership on employee’s performance, with the mediating role of job
satisfaction and employees’ commitment
Khan, Khan, and Khan
___________________________________________________________________________
______________________________________________________________________________
226
© 2019 (9th) International Conference of the AGMS Proceedings
et al., 2015; Newland, Newton, Podlog, Legg, & Tanner, 2015; Kim & Yoon, 2015; Jyoti &
Bhau, 2015).
There is evidence in literature that achievement of goals and group performance is related
to the style of leadership because it directly influences behavior of employee. It makes them to
put extra effort on job and also to perceive and think their leaders influencing and effective. In
literature it shows that the style of transformational leadership has significant relationship with
the willingness of follower’s to put extra effort on job (Spano-Szekely, Griffin, Clavelle, &
Fitzpatrick, 2016; Yahaya & Ebrahim, 2016). The findings of Yahya and Ebrahim (2016) and
Spano-Szekely (2016) identified that when leaders adopted different leadership styles it leads to
different level of job satisfaction e.g leaders’ recognition and encouragement increases job
satisfaction among workers. Since every culture is different from one another so things are not
same across culture it varies (Bhagat & Steers, 2009).
Performance of an employee in his/her job has always been a crucial concern for top
managers in organisations (Kelidbari, Dizgah, & Yusefi, 2011). However employee performance
is a main key for firms therefore those aspects which lead to high performance must be critically
checked by the firms in order to be successful (Abbas & Yaqoob, 2009). Lee, et al., (2011), in
one of his study has defined job performance of an employee is counted as a total performance in
order to meet the challenges and achievement of given tasks within a specific timeframe set by
the organization. Similarly Ahmad and Shahzad (2011) stated that the performance of an
employee embodies the overall belief of an employee about their contributions towards
achieving their tasks and also their code of conduct while doing so and they further added that
compensating employee, his/her performance evaluation and promotions are also the
determinants of employee performance. According to Anitha, (2013) explained that employee
somewhat changes financial condition of a firm by performing according to organization’s goals
and objectives. She further said through teamwork and coordination among colleagues lead
employees to perform efficiently. So, in short those employees who perform well also innovate
new ideas and bring improvement in the organization, by doing this they generate customer
satisfaction (Sadikoglu & Cemal, 2010).
2.3.3 Job Satisfaction
The term Job Satisfaction has not only clicked the minds of employees but also of the
researchers (Lu et al., 2005). It is the emotional feedback of the employee towards his/her task or
the place where he/she works which results from his/her job experience. Luthans (2007, p.141)
stated that job satisfaction is a pleasure or positive vibes of an individual which results from
one’s job appraisal or experiencing job. Job satisfaction results in excellent performance of
employees and their commitment towards organization which guarantees organizational success
and development (Spector, 2003).

Impact of transformational leadership on employee’s performance, with the mediating role of job
satisfaction and employees’ commitment
Khan, Khan, and Khan
___________________________________________________________________________
______________________________________________________________________________
227
© 2019 (9th) International Conference of the AGMS Proceedings
Okpara (2004) who came up with the five parameters of job satisfaction: supervision,
promotion, pay, coworkers and work itself. Oshagbemi (2003) found out in the universities of
UK that there are personal reasons that relate to one’s satisfaction towards his/her job. He also
determined that age, ranking and duration of service and the one’s ability to perform his task has
to do a lot in increasing the level of his satisfaction. Okpara (2004) stated the personal attributes
that were taken in account were age, gender, education and experience in order to determine
whether they are the reasons for the job satisfaction of the IT managers or not.
Job satisfaction is one of the most important factors of an organization to function and it
seems to be affected by organization’s leadership style and internal culture of an organization.
Job satisfaction is derived from a worker’s appreciation towards his/her work or his/her working
experience (Locke, 1976). According to Kennerly (1989) who stated that the behaviors of
employees in an organization e.g unity and togetherness between employees, collaboration and
trust, mutual understanding, respect among superiors and employees are predicted as the
significant and positive elements of the job satisfaction that are experienced mostly by the
employees. Furthermore, Cross and Billingsley (1992) concluded that due to low conflict rates,
support of leadership and employee’s involvement in his/her work can also be the predicting
elements of job satisfaction, job commitment and not to quit his/her job. Generally job
satisfaction is a pleasant and positive emotional state of mind and researchers believe that
relation among job commitment, leadership, job satisfaction and organizational culture are
interrelated to each other and are broadly studied.
There are various tools that are developed to measure the job satisfaction that are mostly
being experienced by the workers in the organization.
2.3.4 Transformational leadership association with Job Satisfaction
Well, there are tremendous styles of leadership that have an influence on employees’
commitment towards organization and job satisfaction, but we mainly focus on transformational
leadership. We have selected transformational leadership since it’s innovative in nature,
productive and supportive. Cumming et al. (2010) exclaimed that leadership that only is
concerned with the outcomes of their employees and does not even care about their emotions and
feelings are unable to achieve diligent efforts from the workers. The study further stated that this
leadership style should be taken into account in order to avoid turnover of employees, work
environment, selection and also to improve employees’ satisfaction. Miles and Mangold (2002)
claimed that employees are satisfied with the performance of the leader and his effective
supervision skills and interaction. Leaders’ ability to spot and solve the problems of the
employees identified how employees’ perceive their leaders’ and his performance. Al-Hussami
(2007) finally summarized that transformational leadership has positive effects on employees’
satisfaction towards his/her job. According to Hamidifar (2009) who conducted his study in the
Impact of transformational leadership on employee’s performance, with the mediating role of job
satisfaction and employees’ commitment
Khan, Khan, and Khan
___________________________________________________________________________
______________________________________________________________________________
228
© 2019 (9th) International Conference of the AGMS Proceedings
University Islamic Azad in Tehran also concluded that out of many leadership styles
transformational leadership style has significant and positive influence on employees’
satisfaction towards his/her job. Among different leadership styles employees are far more
satisfied with the transformational leadership one.
Leadership plays an important role and have significant impact on employee’s job
satisfaction and job contentment (Mujkic et al., 2014). Different scholars and researchers have
identified that different types of leadership styles have different sort of affect on employee’s job
satisfaction according to the varying situations (Voon et al., 2011; Mujkic et al., 2014;
Mangkunejara, 2016). Voon et al. (2011) highlighted that transformational style leader surely
increases job satisfaction and job contentment of employees because it basically increases
employees’ responsibility towards job and intellectual inspiration. Transformational leaders are
capable of motivating their employees as to become more accountable and autonomous towards
work task (Long et al., 2014) which actually increases their job contentment and make them
capable of accomplishing goals.
2.3.5 Job Satisfaction association with employee performance and Job Satisfaction as
mediator among transformational leadership and employee performance
It is justifiable to say that job satisfaction to some extent improves and increases
employee performance (Rezvani et al., 2016). Later and more precisely (Mangkunegara, 2016;
Mujkic et al., 2014) stated that those employees who are contented and happy with their work,
they show more interest and are enthusiastic to achieve mission and vision of the organization.
Furthermore Rezvani et al. (2016) highlighted that those employees who are satisfied with their
job, they often perform well and also participate in problem solving and decision making
activities. Fisher (2003) also stated while engaging in this argument that those employees who
are not happy and contented with their jobs usually perform bad, because they are not
enthusiastic and passionate to work harder and diligently. Discontented employees also will not
work with due responsibility and keenness (Judge, 2001).
Managers who adopt appropriate leadership style can bring improvement and efficiency
in productivity, employee performance and workers job satisfaction. Leadership can be taken as
a code of conduct, behavior, ability of a leader or supervisor who increases the standards of
organization and employee performance (Voon et al., 2011; Shahzad and Benish, 2017).
Leadership is crucial, vital and plays an important role in increasing job satisfaction of
employees. Leadership is basically management because it’s main aim is to control people and
build public relation. It inspires people or employees to perform efficiently and work for
organization’s success (Voon et al., 2011; Mangkunegara, 2016). Researchers have also
concluded this after doing various researches that transformational leadership style has

Impact of transformational leadership on employee’s performance, with the mediating role of job
satisfaction and employees’ commitment
Khan, Khan, and Khan
___________________________________________________________________________
______________________________________________________________________________
229
© 2019 (9th) International Conference of the AGMS Proceedings
significant relationship with job contentment, which also increases employee’s performance and
efficiency of organization (Berson and Linton, 2005; Seo et al., 2004).
The point of view of other researchers, clarifies that transformational leadership actually
increases employee’s job contentment and job fulfillment. Therefore, job satisfaction may act as
a mediator between transformational leadership and employee performance (Kozlowski and
Ilgen, 2006).
2.3.6 Transformational Leadership and Employees’ Commitment
Many researches are conducted on the transformational leadership in the past which
consistently proved that there is a significant associations among transformational leadership and
employees’ attitudes (e.g commitment towards organization and satisfaction level with the
leader) behaviors (e.g followers performance on job) at group, individual and organizational
levels (e.g., Judge and Piccolo, 2004; Wang et al., 2011). Recently researchers have made
significant progress to comprehend that how and when the behaviors of transformational
leadership are more influencing to affect the behaviors and attitudes of employees’ (Avolio et al.,
2009).
In the recent study, Mercurio (2015) in his conceptual framework proposed that the
emotional attachment towards the organization and affective commitment is viewed as the most
important aspect of organizational commitment. Further in the leadership-commitment literature,
the researchers argue that transformational leaders inspire and influence their followers’ to get
emotionally attached and involved in the organization. Leroy et al. (2012), states that the theory
of social exchange which serves as the pillar to show the relation between affective commitment
and transformational leadership. Precisely, leaders continuous communication and sharing values
with employees built trust, norm of reciprocity and identification which implies that employees
are determine with leaders and the qualities and values that leaders possess enroot in them and
organization. According to Braun et al. (2013) further argue that this determination and
identification of followers and their attachment to the leader increase the employees
commitment.Through some studies (Chandna and Krishnan, 2009; Chiun et al., 2009) found out
that transformational leadership have significant impact on employees affective commitment by
using data from Africa.
2.4 Hypothesis
H1: Transformational leadership has significant and positive impact on job satisfaction.
H2: Job satisfaction has significant and positive impact on employee performance.
H3: Job satisfaction has significant mediating role between transformational leadership and
employee performance.

Impact of transformational leadership on employee’s performance, with the mediating role of job
satisfaction and employees’ commitment
Khan, Khan, and Khan
___________________________________________________________________________
______________________________________________________________________________
230
© 2019 (9th) International Conference of the AGMS Proceedings
H4: Transformational leadership has significant and positive impact on employee commitment.
H5: Employee commitment has significant and positive impact on employee performance.
H6: Employee commitment has significant mediating role between transformational leadership
and employee performance.
2.5 Conceptual Framework
Figure 1.1: Conceptual Framework of the Study
The above mentioned model represents transformational leadership as an independent variable
(IV), employee performance as a dependent variable (DV), job satisfaction and employee
commitment are mediating variables (MV). It indicates that transformational leadership has
significant impact on employee performance and job satisfaction and employee commitment are
mediators between the two.
3. METHODOLOGY
3.2 Research Design
It is also known as a plan of action taken by the researchers to gather answers of research
questions and it is also known as the framework of the study or researcher’s blueprint (Kerlinger,
1973). Research design of the study is a survey method. Orodho (2003) defined this method as
Job Satisfaction
(MV)
Employee Performance
(DV)
Employee Commitment
(MV)
Transformational
Leadership
(IV)

Impact of transformational leadership on employee’s performance, with the mediating role of job
satisfaction and employees’ commitment
Khan, Khan, and Khan
___________________________________________________________________________
______________________________________________________________________________
231
© 2019 (9th) International Conference of the AGMS Proceedings
the way of collecting and gathering data or information through questionnaires and interviews.
The aim of survey research design is to present specific characteristics of group of people,
institutions and objects by means of questionnaires (Jaeger, 1988). This research is explanatory
in it’s form as it is conducted to analyze the problem in more detailed manner which was not
studied well before. It is basically to look for those problems which were not identified before or
were not studied in depth. It also helps us to understand the problem more clearly and efficiently.
It is a quantitative research. The quantitative techniques present numerical information. It is a
deductive approach to research as it is testing the theory. It is basically concerned with
developing a hypothesis which is based on existing theory. Deductive approach does not
generate a new phenomenon or theory.
3.3 Target Population
The target population of study is the employees of Telenor (Karachi) and the sample of
220 respondents is taken.
3.4 Sample and Sampling Techniques
A sample is basically a sub-group or a smaller group of the population (Mugenda and
Mugenda. 1990). Each and every member of the sample is known as a respondent, subject or
interviewee. Sampling is basically a method of selecting a sub-group from the population who
will take part in the study as a respondent or participant (Ogula, 2005). It is the procedure or
process of choosing number of respondents for the survey in a way that those respondents will
represent the whole population from where they have been selected. Data is collected by means
of purposive sampling. It is a non-probability sampling. The sample of 220 respondents is taken
and the population is unknown. According to Hair et al. (2010) sample size should be 10 times
of the number of items in the instrument followed by adding 50. So, the sample is drawn by
applying the stated formula.
3.5 Instrument Selection
Questionnaires are used to gather primary quantitative data. It also allow respondents to
take enough time and fill it out with the sense of security i.e confidentiality. It is also free from
the bias that is of revealing personal characteristics of the respondents which mostly happens in
interviews (Owens, 2002).
3.6 Validity and Reliability Tests
Validity is basically to measure what is aim to be measured. According to Mugenda and
Mugenda (1999), it tests the accuracy and meaningfulness of the results. It is validated in terms
of construct validity. To assess scale validity, convergent validity is used in this study.

Impact of transformational leadership on employee’s performance, with the mediating role of job
satisfaction and employees’ commitment
Khan, Khan, and Khan
___________________________________________________________________________
______________________________________________________________________________
232
© 2019 (9th) International Conference of the AGMS Proceedings
On the other hand reliability is checked when the research instrument shows consistent
results when it is measured again and again or after repeated trials. It is also stated that if
researcher runs a test twice and gets the same result in both attempts then reliability is found in
that instrument (Mugenda and Mugenda, 1999). Reliability is found when results are consistent,
dependable and stable (Nachmias & Nachmias, 1996). The test re-test technique is used to
measure or check the reliability of the instrument i.e the same group of respondents is tested
twice in terms of Cronbach Alpha. Composite reliability is also used to assess the internal
consistency
3.7 Data Analysis Tools and Techniques
The data is analyzed by means of descriptive statistics. Tables are used as key tools to
present the data. Data is analyzed by means of linear regression analysis. Smart PLS is used as a
software to analyze the data.
4. Results and Findings
4.2 Reliability and Validity
Table 1
Reliability and Validity
Construct Cronbach's
Alpha rho_A
Composite
Reliability
Average
Variance
Extracted
(AVE)
Employee Commitment 0.909 0.909 0.908 0.665
Employee Performance 0.882 0.882 0.881 0.597
Job Satisfaction 0.879 0.880 0.878 0.547
Transformational
Leadership 0.932 0.936 0.931 0.732

Impact of transformational leadership on employee’s performance, with the mediating role of job
satisfaction and employees’ commitment
Khan, Khan, and Khan
___________________________________________________________________________
______________________________________________________________________________
233
© 2019 (9th) International Conference of the AGMS Proceedings
Figure 2 Factor Analysis
Reliability & Validity:
Table no. 1 shows composite reliability and Cronbach’s Alpha of variable Employee
Commitment have (α = 0.909) reliability, Employee Performance (α = 0.882), Job Satisfaction (α
= 0.879) and Transformational Leadership have (α = 0.932) reliability, hence the data is reliable.
In the above Table 1, Average Variance Extracted (AVE) shows convergent validity, which is
above 0.5 for all variable, the threshold for the convergent validity is 0.5 (Hair et al 2010).
Figure 2 shows the factors loadings for all the items, all factors for each item were above 0.7,
which is the desired level as explained by hair et al., (2010).
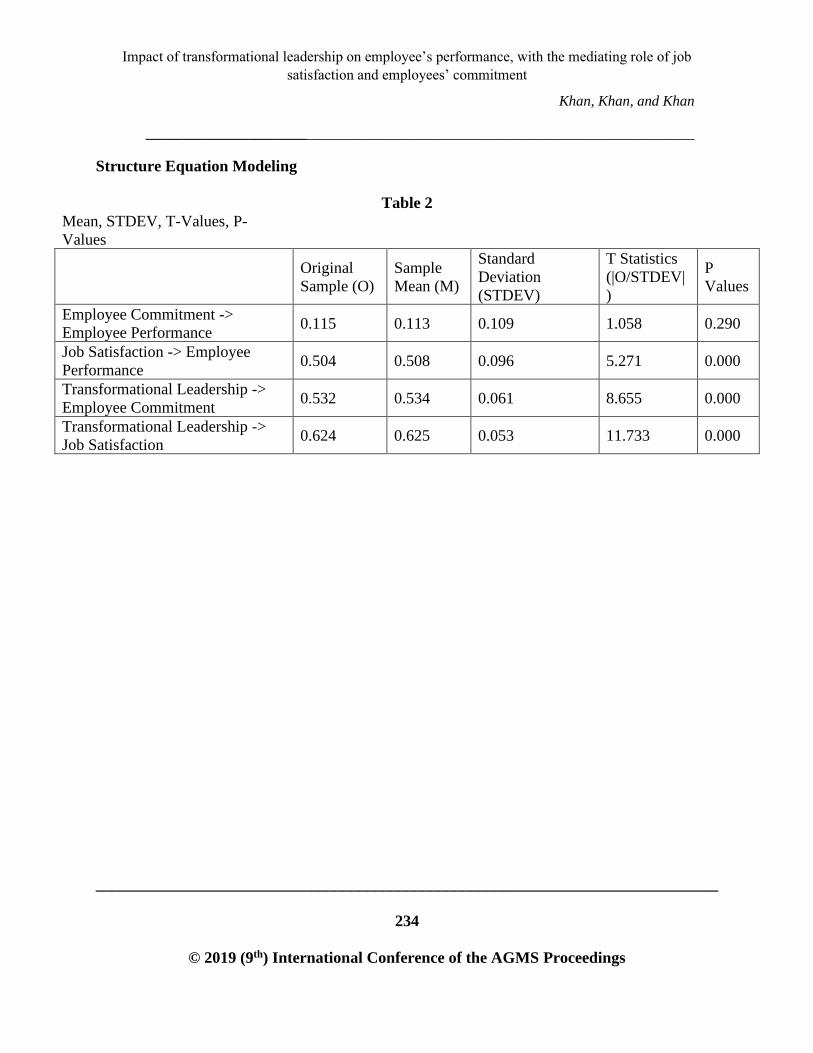
Impact of transformational leadership on employee’s performance, with the mediating role of job
satisfaction and employees’ commitment
Khan, Khan, and Khan
___________________________________________________________________________
______________________________________________________________________________
234
© 2019 (9th) International Conference of the AGMS Proceedings
Structure Equation Modeling
Table 2
Mean, STDEV, T-Values, P-
Values
Original
Sample (O)
Sample
Mean (M)
Standard
Deviation
(STDEV)
T Statistics
(|O/STDEV|
)
P
Values
Employee Commitment ->
Employee Performance 0.115 0.113 0.109 1.058 0.290
Job Satisfaction -> Employee
Performance 0.504 0.508 0.096 5.271 0.000
Transformational Leadership ->
Employee Commitment 0.532 0.534 0.061 8.655 0.000
Transformational Leadership ->
Job Satisfaction 0.624 0.625 0.053 11.733 0.000

Impact of transformational leadership on employee’s performance, with the mediating role of job
satisfaction and employees’ commitment
Khan, Khan, and Khan
___________________________________________________________________________
______________________________________________________________________________
235
© 2019 (9th) International Conference of the AGMS Proceedings
H1: Transformational leadership has significant impact on job satisfaction.
Refer to Table no. 2 and 3, the adjusted R square is 0.387. This shows 38% variances observed in
dependent variable i.e job satisfaction. The significant value p should be less than 0.05. There is
significant relationship between transformational leadership and job satisfaction. Refer to table
no 4.7, (β = 0.624, p = 0 .000). Hence the above hypothesis is justified and we conclude that
there is significant and positive effect of Transformational leadership on job satisfaction.
H2: Job satisfaction has significant impact on employee performance.
Refer to table no 2 and 3, the adjusted R square is 0.344. This shows 34% variances observed in
dependent variable i.e Employee Performance. The significant value p should be less than 0.05.
There is significant relationship between job satisfaction and Employee Performance. Refer to

Impact of transformational leadership on employee’s performance, with the mediating role of job
satisfaction and employees’ commitment
Khan, Khan, and Khan
___________________________________________________________________________
______________________________________________________________________________
236
© 2019 (9th) International Conference of the AGMS Proceedings
table no 4.7, (β = 0.504, p = 0 .000). Hence the above hypothesis is justified and we conclude
that there is significant and positive effect of job satisfaction on Employee Performance.
H4: Transformational leadership has significant impact on employee commitment.
Refer to Table no. 2 and 3, the adjusted R square is 0.280. This shows 28% variances observed in
dependent variable i.e Employee Commitment. The significant value p should be less than 0.05.
There is significant relationship between transformational leadership and Employee
commitment. Refer to table no 4.7, (β = 0.532, p = 0 .000). Hence the above hypothesis is
justified and we conclude that there is significant and positive effect of transformational
leadership on Employee Commitment.
H5: Employee commitment has significant impact on employee performance.
Refer to Table no. 2 and 3, the adjusted R square is 0.344. This shows 34% variances observed in
dependent variable i.e Employee Performance. The significant value p is greater than 0.05. There
is insignificant relationship between Employee Commitment and Employee Performance. Refer
to table no 4.7, (β = 0.115, p = 0 .290). Hence the above hypothesis is not justified and we
conclude that there is insignificant and negative effect of Employee Commitment on Employee
Performance.
4.4 Mediation
Table 4
Specific Indirect Effects
Mean, STDEV, T-Values, P-Values
Original
Sample
(O)
Sample
Mean
(M)
Standard
Deviation
(STDEV)
T
Statistic
s
(|O/STD
EV|)
P
Value
s
Transformational Leadership ->
Employee Commitment ->
Employee Performance
0.061 0.060 0.059 1.046 0.296
Transformational Leadership -> Job
Satisfaction -> Employee
Performance
0.314 0.318 0.068 4.607 0.000

Impact of transformational leadership on employee’s performance, with the mediating role of job
satisfaction and employees’ commitment
Khan, Khan, and Khan
___________________________________________________________________________
______________________________________________________________________________
237
© 2019 (9th) International Conference of the AGMS Proceedings
H3: Job satisfaction has significant mediating role between transformational leadership and
employee performance.
As per Table no. 4.8, Indirect effect (β is 0.314 and p value is 0.000). Hence the above
hypothesis is justified and this study concludes that job satisfaction mediates between
transformational leadership and employee performance. Partial mediation is observed in this
study.
H6: Employee commitment has significant mediating role between transformational leadership
and employee performance
As per table no 4.8, Indirect effect (β is 0.061 and p value is 0.296). Hence the above hypothesis
is not justified because p value is greater than 0.05. This study concludes that employee
commitment does not mediate between transformational leadership and employee performance.
CONCLUSION
5.1 Discussion
The aim of this research was to identify the relationship between transformational
leadership and employee performance through employee commitment and job satisfaction as
mediators. As it was already established and predicted that transformational leadership plays an
important role in the performance of an employee. The qualities of transformational leadership
influence, inspire and motivate employees to perform high through their job satisfaction and
employee commitment.
Hypothesis 1 is tested and analyzed to find the relationship between transformational
leadership and job satisfaction and that was well acknowledged. This study’s findings are similar
to the previous researches. The role of a Transformational leader and its techniques will enhance
workers’ job satisfaction and they will also perform well. This research will also explain and
highlight that employees can only become satisfied and contented with their jobs if the leader
successfully acquires and adopt transformational leadership skills. This study and it’s findings
are quite similar to the previous researches which stated that techniques of transformational
leadership to some extent enhances job satisfaction and job contentment (Bass, 1990; Voon et
al., 2011; Mujkic et al., 2014; Long et al., 2014; Cavazotte et al., 2013; Niehoff, 1990) .
Furthermore Hypothesis 2, results and findings are also similar to the previous researches that
too states and highlights that job satisfaction has significant impact on employee performance.
Because when employees will be satisfied with their jobs the will work with more devotion and
keenness (Rezwani et al., 2016; Mangkunegara, 2016; Fisher, 2003; Cheung et al., 2003).

Impact of transformational leadership on employee’s performance, with the mediating role of job
satisfaction and employees’ commitment
Khan, Khan, and Khan
___________________________________________________________________________
______________________________________________________________________________
238
© 2019 (9th) International Conference of the AGMS Proceedings
Hypothesis 3 related to the mediator that there is relationship between transformational
leadership and workers performance and job satisfaction is the mediator. Results related to the
hypothesis are also quite similar to the previous findings. The study found out and recognized
that job satisfaction is vital and important in making managers competent and effective (Shahzad
and Benish, 2017; Mangkunegara, 2016; Berson and Linton, 2005; Chou et al., 2013; Skansi,
2000; Martin, 1990).
H4 is also tested to find the impact of transformational leadership on employee
commitment and the findings were also similar to the previous study. Transformational leaders
do enhance employees’ commitment towards their job. H5 is based on the relationship of
employee commitment and employee performance does not reveal the same results as other
researchers have identified. If employees are committed towards their jobs then it is not
necessary that they will perform well.
H6 is also related to the mediator that there is relationship between transformational
leadership and employee performance and employee commitment is the mediator. Results of the
hypothesis are not similar to the previous researches.
5.2 Theoretical and Practical Implications
This study adds work related to the role of transformational leadership, job satisfaction
and employee commitment as a model in Telecom sector of Pakistan. Findings of this study
explains and states that job satisfaction mediates between transformational leadership and
employee performance, whereas employee commitment does not mediate. The findings of the
study proved our perceptions that transformational leadership has a significant and positive
impact on employee performance and job satisfaction mediates between the two. This research
basically helps in revealing the paths and ways that how qualities and techniques of a
transformational leader takes up the credit for employees’ excellent performance by showing the
importance of job satisfaction as a mediator. Adoption or introduction of transformational style
of leadership helps in increasing job satisfaction that way employees perform well. Employee
performance can only be increased if organizations promote job satisfaction among their
employees. This study’s findings and results indicate that job satisfaction mediates between
transformational leadership and employee performance and employee commitment does not
mediate between them.
Few more results are also found that is managers and employees working in Telenor
Karachi, transformational style of leadership improves their performance through job
satisfaction. Another practical implication of the study is that managers and employees of
Telenor company should be trained to learn the techniques of transformational leadership so that
they can improve their performance and organization’s performance. Training regarding

Impact of transformational leadership on employee’s performance, with the mediating role of job
satisfaction and employees’ commitment
Khan, Khan, and Khan
___________________________________________________________________________
______________________________________________________________________________
239
© 2019 (9th) International Conference of the AGMS Proceedings
transformational leadership should focus on increasing job satisfaction among workers in order
to achieve aims and objectives of the firm.
5.3 Limitations and Directions for Future Research
This study set few limitations and the first one is time constraint i.e data is gathered only
from Telenor Karachi. In future if data is gathered from different parts of the country will
overcome this limitation and provide a different result.
The second limitation is data compilation method where questionnaires are only used to
collect the data. In future data can be collected by using multiple techniques.
Again due to time constraint, purposive sampling technique is used to collect the data.
This is why any other sampling technique can be used to collect data in future.
Although, the study has achieved its objectives but in future if researchers are interested
may add other relevant variables to the study.
5.4 Conclusion
Performance and productivity of a firm totally depends upon employees’ satisfaction
towards his job, and only then it can yield high profits. Transformational leadership plays an
important role to enhance employee’s interpersonal relationship with his supervisor and also
increases job satisfaction in the organization. Transformational style of leadership helps workers
to become innovative, creative and generate new ideas which can help organization to compete
in the challenging environment. So, organizations should adopt transformational style of
leadership so that they could improve their workers’ performance. This research’s findings
conclude that managers and employees of Telenor telecom should be trained to learn the
techniques and qualities of transformational style of leadership so that they can bring growth and
development in the organization.
Impact of transformational leadership on employee’s performance, with the mediating role of job
satisfaction and employees’ commitment
Khan, Khan, and Khan
___________________________________________________________________________
______________________________________________________________________________
240
© 2019 (9th) International Conference of the AGMS Proceedings
References
Abu-Ruman B (2016). The impact of transformational leaders-hip in crisis management
preparedness. Journal of Business Administration 12 (3).
Aga DA, Noorderhaven N, Vallejo B (2016) Transformational leadership and project success:
The mediating role of team-building. International Journal of Project Management 34:
806-818.
Al-Fattih A (2013) Relationship of transformational leadership applications to organizational
learning in the security servi-ces: a comparative study on the general directorate of public
security and general directorate of passports in Riyadh. Unpu-blished PhD thesis, Saudi
Arabia: Prince Nayef University for Security Sciences.
AL-Hussami, M. (2008). A study of nurses' job satisfaction: the relationship to organizational
commitment, perceived organizational support, transactional leadership, transformational
leadership, and level of education. European Journal of Scientific Research, 22(2), 286-
295.
Al-Jeditawi J (2014) Impact of transformational leadership of university presidents on job
satisfaction of deans and heads of academic departments in Jordanian universities.
Unpublished PhD thesis, Jordan: University of Islamic Sciences.
Anantatmula VS (2010) Project manager leadership role in improving project performance.
Engineering Management Journal 22: 13-22.
Arnold KA, Barling J, Kelloway EK (2001) Transformational leadership or the iron cage: which
predicts trust, commitment and team efficacy? Leadership & Organization Development
Journal 22: 315-320.
Asrar-ul-Haq, M., (2015). Impact of leadership styles on employee organizational commitment:
evidence from the banking sector of Pakistan, paper presented at Academy of Human
Resource Development, 18 February–21 February, Saint Louis, MO. USA, available at:
⟨http://ahrd2015.conferencespot.org/57172-ahrd-1.1994787/t-005-1.1995133/f-025-
1.1995191/a-071-1.1995198/an-071-1.1995199⟩ Accessed 27.02.15.
Avolio, B. J., Weichun, Z., Koh, W., & Bhatia, P. (2004). Transformational leadership and
organizational commitment: Mediating role of psychological empowerment and
moderating role of structural distance. Journal of Organizational Behavior, 25, 951-968.

Impact of transformational leadership on employee’s performance, with the mediating role of job
satisfaction and employees’ commitment
Khan, Khan, and Khan
___________________________________________________________________________
______________________________________________________________________________
241
© 2019 (9th) International Conference of the AGMS Proceedings
Bass BM (1997) Personal selling and transactional/transformational leadership. Journal of
Personal Selling & Sales Management 17: 19-28.
Bass BM (1998) Transformational leadership: Industry, military, and educational impact:
Mahwah. NJ: Erlbaum, p: 208.
Bass BM (1999) Two decades of research and development in transformational leadership.
European Journal of Work and Organizational Psychology 8: 9-32.
Bass BM, Avolio BJ (1990) Transformational leadership development: Manual for the
multifactor leadership questionnaire: Consulting Psychologists Press, Palo Alto, CA, p:
65.
Bass BM, Bass R (2009) The Bass handbook of leadership: Theory, research, and managerial
applications: Simon and Schuster.
Bass, B. M. (1990). Bass & Stogdill’s handbook of leadership— Theory, research and
managerial applications. New York, NY: Free Press.
Belias D, Koustelios A (2014) Transformational leadership and job satisfaction in the banking
sector: A review. International Review of Management and Marketing 4: 187-200.
Berson Y, Linton JD (2005) An examination of the relationships between leadership style,
quality, and employee satisfaction in R&D versus administrative environments. R&D
Management 35: 51-60.
Bhagat, R. S., & Steers, R. M. (2009). Cambridge handbook of culture, organizations, and work.
Cambridge, UK: Cambridge University Press.
Boamah SA, Spence Laschinger HK, Wong C, Clarke S (2017) Effect of transformational
leadership on job satisfaction and patient safety outcomes. Nursing Outlook, 1–10.
https://doi.org/10.1016/j.outlook.2017.10.004
Brand C, Heyl G, Maritz D (2000) Leadership In Organizational Development and
Transformation in South Africa. Durban: Butterworths.
Braun, S., Peus, C., Weisweiler, S. and Frey, D. (2013), “Transformational leadership, job
satisfaction, and team performance: a multilevel mediation model of trust”, The
Quarterly, Vol. 24 No. 1, pp. 270-283.
Impact of transformational leadership on employee’s performance, with the mediating role of job
satisfaction and employees’ commitment
Khan, Khan, and Khan
___________________________________________________________________________
______________________________________________________________________________
242
© 2019 (9th) International Conference of the AGMS Proceedings
Bronkhorst, B., Steijn, B., & Vermeeren, B. (2015). Transformational leadership, goal setting,
and work motivation: The case of a Dutch municipality. Review of Public Personnel
Administration, 35(2), 124–145.
Burns JM (2003) Transforming leadership: A new pursuit of happiness. Grove Press, p: 35.
Burns, J. M. (1978). Leadership. New York: Harper and Row.
Buil, I., Martínez, E., & Matute, J. (2019). Transformational leadership and employee
performance: The role of identification, engagement and proactive personality.
International Journal of Hospitality Management, 77(October 2017), 64–75.
https://doi.org/10.1016/j.ijhm.2018.06.014
Cacioppe R (1997) Leadership moment by moment! Leadership & Organization Development
Journal 18: 335-345.
Cavazotte F, Moreno V, Bernardo J (2013) Transformational leaders and work performance: the
mediating roles of identification and self-efficacy. BAR-Brazilian Administration Review
10: 490-512.
Chandna, P. and Krishnan, V.R. (2009), “Organizational commitment of information technology
professionals: role of transformational leadership and work-related beliefs”, Journal of
Management Studies, Vol. 4 No. 1, pp. 1-13.
Chiun, M.L., Ramayah, T. and Min, H.W. (2009), “Leadership styles and organizational
commitment: a test on Malaysia manufacturing industry”, African Journal of Marketing
Management, Vol. 1 No. 6, pp. 133-139.
Chou HW, Lin YH, Chang HH, Chuang WW (2013) Transformational leadership and team
performance: the mediating roles of cognitive trust and collective efficacy. SAGE Open
3: 1-10.
Cummings, G. G., Macgeregor, T., Davey, M., Lee, H., Wong, C. A., Lo, E., Muise, M., &
Stafford, E. (2010). Leadership styles and outcome patterns for the nursing workforce
and work environment: A systematic review. International Journal of Nursing Studies,
47, 363-385.
De Jong, J. P. J., & Hartog, D. N. D. (2007). How leaders influence employees' innovative
behaviuor. European Journal of Innovation Management, 10(1), 41-64.

Impact of transformational leadership on employee’s performance, with the mediating role of job
satisfaction and employees’ commitment
Khan, Khan, and Khan
___________________________________________________________________________
______________________________________________________________________________
243
© 2019 (9th) International Conference of the AGMS Proceedings
Fisher CD (2003) Why do lay people believe that satisfaction and performance are correlated?
Possible sources of a commonsense theory. Journal of Organizational Behavior 24: 753-
777.
Ghadi M, Fernando M, Caputi P (2013) Transformational leadership and work engagement: the
mediating effect of meaning in work. Leadership & Organization Development Journal
34 (6): 532-550. https://doi.org/10.1108/LODJ-10-2011-0110
Gill, A. S., Flaschner, A. B., & Shacha, M. (2006). Mitigating stress and burnout by
implementing transformational-leadership. International Journal of Contemporary
Hospitality Management, 18(6), 469-481.
Hamidifar, F. (2009). A study of the relationship between leadership styles and employee job
satisfaction at Islamic Azad University branches in Tehran, Iran. AU-GSB- e-Journal, 1-
13.
Horwitz IB, Horwitz SK, Daram P, Brandt ML, Charles Brunicardi F, et al.
(2008) Transformational, transactional, and passive-avoidant leadership characteristics
of a surgical resident cohort: analysis using the multifactor leadership questionnaire and
implications for improving surgical education curriculums. Journal of Surgical Research
148: 49-59.
House RJ, Aditya RN (1997) The social scientific study of leadership: Quovadis? Journal of
Management 23: 409-473.
Judge TA, Piccolo RF (2004) Transformational and transactional leadership: a meta-analytic test
of their relative validity. Journal of Applied Psychology 89: 755-768.
Judge TA, Thoresen CJ, Bono JE, Patton GK (2001) The job satisfaction–job performance
relationship: a qualitative and quantitative review. Psychological Bulletin 127: 376-407.
Judge, T.A. and Piccolo, R.F. (2004), “Transformational and transactional leadership: a meta-
analytic test of their relative validity”, Journal of Applied Psychology, Vol. 89 No. 5, pp.
755-768.
Jyoti, J., & Bhau, S. (2015). Impact of transformational leadership on job performance. SAGE
Opening, 5(4).

Impact of transformational leadership on employee’s performance, with the mediating role of job
satisfaction and employees’ commitment
Khan, Khan, and Khan
___________________________________________________________________________
______________________________________________________________________________
244
© 2019 (9th) International Conference of the AGMS Proceedings
Kim, S., & Yoon, G. (2015). An innovation-driven culture in local government: Do senior
manager's transformational leadership and the climate for creativity matter? Public
Personnel Management, 44(2), 147–168.
Kirkan K (2011) The effect of emotional intelligence on emotio-nal intelligence on emotional
competence and transformational leadership. PR Quest UME Dissertation Publishing.
Kouzes, J. M., & Posner, B. Z. (2008). Leadership challenge. San Francisco, CA: Jossey-Bass.
Kozlowski SW, Ilgen DR (2006) Enhancing the effectiveness of workgroups and teams.
Psychological Science in The Public interest 7: 77-124.
Kuchler, W. J. (2008). Perceived leadership behavior and subordinates' job satisfaction in
Midwestern NCAA division 3 athletic departments. The Sport Journal, 11(2).
Leroy, H., Palanski, M.E. and Simons, T. (2012), “Authentic leadership and behavioural
integrity as drivers of follower commitment and performance”, Journal of Business
Ethics, Vol. 107 No. 3, pp. 255-264.
Liao H, Chuang A (2007) Transforming service employees and climate: a multilevel,
multisource examination of transformational leadership in building long-term service
relationships. Journal of Applied Psychology 92: 1006-1019.
Lok, P., & Crawford, J. (2004). The effect of organizational culture and leadership style on job
satisfaction and organizational commitment: A cross-national comparison. Journal of
Management Development, 23(4), 321-338.
Long CS, Yusof WMM, Kowang TO, Heng LH (2014) The impact of transformational
leadership style on job satisfaction. World Applied Sciences Journal 29: 117-124.
Lu, H., While, A. E., & Barriball, K. L. (2005). Job satisfaction among nurses: A literature
review. International Journal of Nursing Studies, 42, 211-227.
Luthans, F. (2007). Organizational Behavior. New York: McGraw-Hill.
Majali R (2014) The impact of transformational leadership in the performance of Jordanian
industrial firms: entrepreneurial orientation as a mediating variable. Unpublished
dissertation, Jordan: University of Islamic Sciences.
Impact of transformational leadership on employee’s performance, with the mediating role of job
satisfaction and employees’ commitment
Khan, Khan, and Khan
___________________________________________________________________________
______________________________________________________________________________
245
© 2019 (9th) International Conference of the AGMS Proceedings
Mangkunegara AAP (2016) The Effect of Transformational Leadership and Job Satisfaction on
Employee Performance. Universal Journal of Management 4: 189-195.
Martin BJ (1990) A successful approach to absenteeism. Nursing Management 21: 45-48.
Masi RJ, Cooke RA (2000) Effects of transformational leadership on subordinate motivation,
empowering norms, and organizational productivity. International Journal of
Organizational Analysis 8: 16-47.
Masi RJ, Cooke RA (2000) Effects of transformational leadership on subordinate motivation,
empowering norms, and organizational productivity. International Journal of
Organizational Analysis 8: 16-47.
McColl-Kennedy, J. R., & Anderson, R. D. (2005). Subordinate– manager gender combination
and perceived leadership style influence on emotions, self-esteem and organizational
commitment. Journal of Business Research, 58, 115-125.
Mercurio, Z.A. (2015), “Affective commitment as a core essence of organizational commitment:
an integrative literature review”, Human Resource Development Review, Vol. 14 No. 4,
pp. 389-414.
Miles, S. J., & Mangold, G. (2002). The impact of team leader performance on team members'
satisfaction: the subordinate's perspective. Team Performance Management: An
International Journal, 8(5/6), 113-121.
Mujkic A, Sehic D, Rahimic Z, Jusic J (2014) Transformational leadership and employee
satisfaction. EkonomskiVjesnik / Econviews: Review of Contemporary Business,
Entrepreneurship and Economic issues 27: 259-270.
Newland, A., Newton, M., Podlog, L., Legg, W. E., & Tanner, P. (2015). Exploring the nature of
transformational leadership in sports: A phenomenological examination with female
athletes. Qualitative Research in Sport, Exercise and Health, 7(5), 663–687.
Niehoff BP, Enz CA, Grover RA (1990) The impact of top-management actions on employee
attitudes and perceptions. Group & Organization Studies 15: 337-352.
Okpara, J. O. (2004). Personal characteristics as predictors of job satisfaction: An exploratory
study of IT managers in a developing economy. Information Technology & People,
17(3), 327-338.

Impact of transformational leadership on employee’s performance, with the mediating role of job
satisfaction and employees’ commitment
Khan, Khan, and Khan
___________________________________________________________________________
______________________________________________________________________________
246
© 2019 (9th) International Conference of the AGMS Proceedings
Oshagbemi, T. (2003). Personal correlates of job satisfaction: Empirical evidence from UK
universities. International Journal of Social Economics, 30(12), 1210–1232.
Para-González L, Jimenez-Jimenez D, Martínez- Lorente ÁR (2018) Exploring the mediating
effects between transforma-tional leadership and organizational performance. Employee
Relations: The International Journal.
Pedraja-Rejas L, Rodríguez-Ponce E, Delgado-Almonte M, Rodríguez-Ponce J
(2006) Transformational and transactional leadership: a study of their influence in small
companies liderazgo transformational y transactional: un studio de su influencia en las
pequeñas empresas. Ingeniare 14: 159-166.
Rezvani A, Chang A, Wiewiora A, Ashkanasy NM, Jordan PJ, et al. (2016) Manager emotional
intelligence and project success: The mediating role of job satisfaction and trust.
International Journal of Project Management 34: 1112-1122.
Ristow AM, Amos TL, Staude GE (1998) Transformational leadership and organizational
effectiveness in the administration of cricket in South Africa. Unpublished M Comm
Thesis. Grahams Town: Rhodes University 30: 1-5.
Rossy, G. L., & Archibald, R. D. 1992. Building commitment in project teams. Project
Management Journal, 23, 5-14.
Schepers, J., Wetzels, M., & Ruyter, K. D. (2005). Leadership styles in technology acceptance:
do followers practice what leaders preach? Managing Service Quality, 15(6), 496-508.
Seo Y, Ko J, Price JL (2004) The determinants of job satisfaction among hospital nurses: a
model estimation in Korea. International Journal of Nursing Studies 41: 437-446.
Shahzad N, Benish K (2017) Impact of Transformational Leadership in Attainment of Project
Success: The Mediating Role of Job Satisfaction. International Journal of Business and
Social Science 8: 168-177.
Skansi D (2000) Relation of managerial efficiency and leadership styles-empirical study in
Hrvatska elektroprivreda D.D. Management 5: 51-67.
Spano-Szekely, L., Griffin, M. T.Q., Clavelle, J., & Fitzpatrick, J. J. (2016). Emotional
intelligence and transformational leadership in nurse managers. Journal of Nursing
Administration, 46(2), 101–108.

Impact of transformational leadership on employee’s performance, with the mediating role of job
satisfaction and employees’ commitment
Khan, Khan, and Khan
___________________________________________________________________________
______________________________________________________________________________
247
© 2019 (9th) International Conference of the AGMS Proceedings
Spector, P.E. (2003). Industrial and organizational psychology – Research and practice (3rd Ed.).
New York: John Wiley & Sons, Inc.
Vigoda-Gadot E (2007) Leadership style, organizational politics, and employees' performance:
An empirical examination of two competing models. Personnel Review 36: 661-683.
Voon ML, Lo MC, Ngui KS, Ayob NB (2011) The influence of leadership styles on employees’
job satisfaction in public sector organizations in Malaysia. International Journal of
Business, Management and Social Sciences 2: 24-32.
Waldman, D. A., Ramírez, G. G., House, R. J., & Puranam, P. (2001). Does leadership matter?
CEO leadership attributes and profitability under conditions of perceived environmental
uncertainty. Academy of Management Journal, 44, 134-143.
Walumbwa FO, Avolio BJ, Zhu W (2008) How transformational leadership weaves its influence
on individual job performance: The role of identification and efficacy beliefs. Personnel
Psychology 61: 793-825.
Walumbwa FO, Hartnell CA (2011) Understanding transformational leadership employee
performance links: The role of relational identification and self-efficacy. Journal of
Occupational and Organizational Psychology 84: 153-172.
Wang H, Law KS, Hackett RD, Wang D, Chen ZX (2005) Leader-member exchange as a
mediator of the relationship between transformational leadership and followers'
performance and organizational citizenship behavior. Academy of Management Journal
48: 420-432.
Wang, G., Oh, I.-S., Courtright, S. H., & Colbert, A. E. (2011). Transformational leadership and
perfomance across criteria and levels: A meta-analytic review of 25 years of research.
Group & Organization Management, 36, 223-270.
Wofford JC, Whittington JL, Goodwin VL (2001) Follower motive patterns as situational
moderators for transformational leadership effectiveness. Journal of Managerial 13: 196-
211.
Yahaya, R., & Ebrahim, F. A. (2016). Leadership styles and organizational commitment:
Literature review. Journal of Management Development, 35(2), 190–2016.

Impact of transformational leadership on employee’s performance, with the mediating role of job
satisfaction and employees’ commitment
Khan, Khan, and Khan
___________________________________________________________________________
______________________________________________________________________________
248
© 2019 (9th) International Conference of the AGMS Proceedings
Yammarino FJ, Spangler WD, Dubinsky AJ (1998) Transformational and contingent reward
leadership: Individual, dyad, and group levels of analysis. The Leadership Quarterly 9:
27-54.
Yang LR, Huang CF, Wu KS (2011). The association among project manager's leadership style,
teamwork and project success. International Journal of Project Management 29: 258-
267.
Zwikael O, Unger-Aviram E (2010). HRM in project groups: the effect of project duration on
team development effectiveness. International Journal of Project Management 28: 413-
421.

Toward a Model for Actual Usage of Social Networks Sites for Educational Purposes in Jordanian
Universities
Gharrah, Aljaafreh, Al-Ma’aitah
___________________________________________________________________________
______________________________________________________________________________
249
© 2019 (9th) International Conference of the AGMS Proceedings
Toward a Model for Actual Usage of Social Networks Sites for Educational Purposes in
Jordanian Universities
Ala’a Abu Gharrah, (M.S.), Corresponding Author
Management Information Systems Department, Mutah University, Jordan.
Ali Aljaafreh, Assistant Professor
Management Information Systems Department, Mutah University, Jordan.
Noor Al-Ma'aitah, Assistant Professor
Business Administration Department, Mutah University.
Abstract
Social network sites (SNs) are used to transform the traditional ways of education. Although SNs
is very common in different countries all over the world, its’ adoption by students in Jordan for
educational purposes is still limited. This paper addresses an important issue related to the
factors affecting the students’ actual usage of SNs for educational purposes. The paper proposes
a model aims to understand and analyze the impact of underlying factors (Effort expectancy,
Performance expectancy, Social influence, Facilitating condition, Habit, Hedonic motivation,
lecturer support, and student related factors) on students’ actual usage of SNs for educational
purposes. The proposed model will assist Jordanian Universities in understanding the factors that
may affect their students’ actual usage of SNs for educational purposes.
Keywords: Social network sites, educational purposes, Jordanian universities.

Toward a Model for Actual Usage of Social Networks Sites for Educational Purposes in Jordanian
Universities
Gharrah, Aljaafreh, Al-Ma’aitah
___________________________________________________________________________
______________________________________________________________________________
250
© 2019 (9th) International Conference of the AGMS Proceedings
INTRODUCTION
Due to the rapid development in information technology (IT), companies have been
affected and changed their way of doing business. The tools and capabilities offered by IT have
increased the efficiency and maximized the perceived benefits for users. The educational sector
is one of many other sectors that have benefited from information technology in delivering the
teaching process to learners (students). The interactive and collaborative environment offered by
Web 2.0 technology facilitates the communication process between teachers and students, taking
into account the propagation of these services, especially Social Networking Sites (SNS). These
social web-based sites, such as Twitter, Facebook, YouTube, and other social networking sites
are able to build a network of friends who share reciprocal concerns through blogs, virtual
classes and broadcasting that are provided for free reciprocal (Balakrishnan, 2017; Tan, Shao, &
Yu, 2014)
Social networks (SNs) refer to " a web service(s) that allow individuals to construct a
public or semi-public profile within a system with definite boundaries, articulate a list of other
participants in the system whom they share a connection and, view and explore their list of
connections and of those made by others in the system. "(Moran & Gonyea, 2003) SNs are the
most commonly used services in Web2.0, which allow users to share interests, meet, collaborate,
and interact with others (Seely Brown & Adler, 2008). A number of studies reported the
importance of using SNs in educational settings (Al-Zedjali, Al-Harrasi, & Al-Badi, 2014;
Balakrishnan, 2017). SNs can be used in the learning process; for example, Facebook and
Twitter may be used in order to stimulate thoughtful discussions on specific classroom topics,
and Pinterest website could also be used to share the learning resources. Users may draw upon a
variety of digital learning resources, such as YouTube videos, virtual reality, podcasts and
infographics in order to heighten the content knowledge, nurture an appreciation for a diversity
of viewpoints, and stimulate critical thinking.
However, there is a lack of studies that examined the factors influencing student’s actual
usage of SNs for educational purposes, especially in Middle East, Jordan as a case. The current
paper aims to address an important two-fold gap in the topic under investigation. The first gap is
an empirical one that addresses the lack of studies that examined the factors affecting students'
usage of SNs for educational purposes. Although an extensive body of literature discusses what
the motivations of students for academic usage of SNs are, literature has showed a few studies
that build unified model (Bonilla Polo & Osman, 2017), none of them were conducted in Jordan.
The second gap is a theoretical one; therefore, the current study proposed a new research
model, where an extension to the second version of the Unified Theory of Acceptance and Use
of Technology (UTAUT2) will be added in order to investigate the factors affecting the students’
Toward a Model for Actual Usage of Social Networks Sites for Educational Purposes in Jordanian
Universities
Gharrah, Aljaafreh, Al-Ma’aitah
___________________________________________________________________________
______________________________________________________________________________
251
© 2019 (9th) International Conference of the AGMS Proceedings
intention to use SNs for academic purposes. This extension is represented by the teacher's
(lecturer) support(Bonilla Polo & Osman, 2017),and student related factors(Al-Zedjali et al.,
2014). This paper is organized as follows. Section two addresses the theoretical background and
a literature review for this study. Section three presents the research model. Section four
discusses the research model. Finally, the researchers cited the conclusion of this study.
LITERATURE REVIEW AND BACKGROUND
Social networking sites have developed, where the first site of SixDegrees was launched
in 1996. While SixDegrees attracted millions of users, it failed to become a sustainable company.
In 2000, the service was terminated. Then, there was a development of many networks, such as
Facebook 2004, BitRetit 2010, Astacram 2010 and SnapeSat 2011, in addition to other sites that
the student can use in education. SNs have become an essential part in life (Kaplan & Haenlein,
2012). According to SNs Stats Jordan(lStats, Mar 2018 - Mar 2019), (78.3%) of social media
users in Jordan are using Facebook, almost (18.23%) use YouTube, less than (1.93%) use
Twitter, (.97%) use Pinterest, less than (0.22%) use Instagram (see figure 1 ) There are many
studies which show how social network tools can improve the learning experience by enabling
interaction, collaboration, active participation, information & resource sharing (Selwyn, 2009).
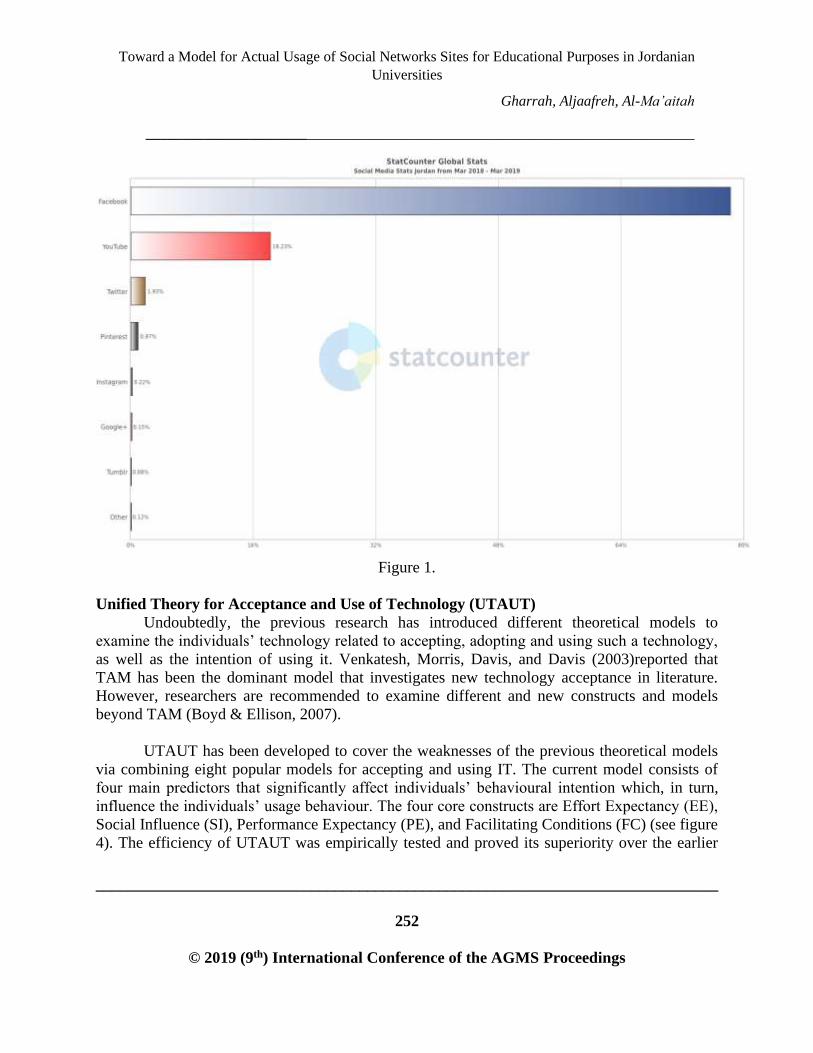
Toward a Model for Actual Usage of Social Networks Sites for Educational Purposes in Jordanian
Universities
Gharrah, Aljaafreh, Al-Ma’aitah
___________________________________________________________________________
______________________________________________________________________________
252
© 2019 (9th) International Conference of the AGMS Proceedings
Figure 1.
Unified Theory for Acceptance and Use of Technology (UTAUT)
Undoubtedly, the previous research has introduced different theoretical models to
examine the individuals’ technology related to accepting, adopting and using such a technology,
as well as the intention of using it. Venkatesh, Morris, Davis, and Davis (2003)reported that
TAM has been the dominant model that investigates new technology acceptance in literature.
However, researchers are recommended to examine different and new constructs and models
beyond TAM (Boyd & Ellison, 2007).
UTAUT has been developed to cover the weaknesses of the previous theoretical models
via combining eight popular models for accepting and using IT. The current model consists of
four main predictors that significantly affect individuals’ behavioural intention which, in turn,
influence the individuals’ usage behaviour. The four core constructs are Effort Expectancy (EE),
Social Influence (SI), Performance Expectancy (PE), and Facilitating Conditions (FC) (see figure
4). The efficiency of UTAUT was empirically tested and proved its superiority over the earlier
Toward a Model for Actual Usage of Social Networks Sites for Educational Purposes in Jordanian
Universities
Gharrah, Aljaafreh, Al-Ma’aitah
___________________________________________________________________________
______________________________________________________________________________
253
© 2019 (9th) International Conference of the AGMS Proceedings
theories. UTAUT is able to account for (70%) of the variance in adopting the behaviour in
comparison with (27%-40%) for the previous theories (Venkatesh et al., 2003).
However, UTAUT has been criticized due to its complexity, its approach was less
parsimonious, as well as its weakness in explaining the usage behaviour (Casey & Wilson-
Evered, 2012; Van Raaij & Schepers, 2008). Therefore, Venkatesh et al. (2012) developed
UTAUT and extended it to UTAUT2 (figure 5). The new version focuses on the factors that
affect specifically on the consumer's behaviour. This includes Habit (HA), Price Value (PV), and
Hedonic Motivation (HM), thus increasing the ability to apply and generalize it in both
organizational and consumer contexts. The efficacy of UTAUT2 exceeded UTAUT in terms of
explaining more variance in technology usage, as well as BI.
The following is an explanation of the dimensions of UTAUT2.
Performance Expectancy
Performance expectancy (PE) is defined as” the degree to which an individual believes
that using the system will help him or her to attain gains in job performance” (Venkatesh et al.,
2003). This factor addresses its usefulness for the students who use social media for academic
purposes. The literature showed that PE has a significant impact on the individual’s intention
towards using technology. For instance, Kijsanayotin et al. (2009) examined PE in the context in
Thailand and suggested that it has a positive impact on the user’s intention to use technology.
Also, Umrani-Khan and Iyer (2009) developed a model called ELAN to examine PE effect on
the student’s intention to use eLearning and found similar results. In the context of this study
related to adopting social media for academic purposes, studies revealed that there is a
significant positive relationship between PE and intention to use (Balakrishnan, 2017; Wang,
Wu, & Wang, 2009)
Effort Expectancy
Effort Expectancy (EE) is referred to “the degree of ease associated with the use of the
system” (Venkatesh et al., 2003 In this study, this factor relates to how easy it is for the student
to use social networking platforms for educational purposes.. Alalwan, Dwivedi, and Rana
(2017) suggested that effort expectancy significantly affected individuals’ intention to use
mobile banking in Jordan. Another study that examined the factors contributing to the acceptance
of social media as a platform among students showed that effort expectancy also had a
significant effect (Nawi, Nasir, & Al Mamun, 2016).
Social influence
Social Influence (SI) is referred as “the degree to which an individual perceives that
important others believe he / she should use the new system”(Venkatesh et al., 2003). This factor

Toward a Model for Actual Usage of Social Networks Sites for Educational Purposes in Jordanian
Universities
Gharrah, Aljaafreh, Al-Ma’aitah
___________________________________________________________________________
______________________________________________________________________________
254
© 2019 (9th) International Conference of the AGMS Proceedings
addresses the ways of encouraging the community, family, friends, and partners to use SNs for
the academic purposes. A study showed that SI has a significant impact on the intention of using
e-commerce in Saudi Arabia.(Alkhunaizan & Love, 2012). In addition, The findings of the study
conducted by (Abelmonaim, 2013)revealed that SI had a significant impact on the Moroccan
student's intention to accept the spirit of e-initiative. The finding of this study is similar to the
results of Al-Zedjali et al. (2014) which revealed that there is a significant positive relationship
between SI and intention to use SNSs in education. According to (Escobar-Rodrguez, Carvajal-
Trujillo, & Monge-Lozano, 2014)the factors which affect the perceived benefits and relevance
of Facebook site as an educational tool suggest that there is a significant impact for the perceived
social impact for Facebook and the perceived benefits related to that.
Facilitating conditions
Facilitating Conditions (FC) is defined as “the degree to which an individual believes that
an organizational and technical infrastructure exists to support use of the system” (Venkatesh et
al. 2003). In UTAUT, facilitating conditions have a direct impact on usage; this factor addresses
whether and to what extent the university environment can provide tools for students in order to
use them for academic purposes, such as electricity, the Internet, computers and others. The
factors affecting the adoption of mobile banking in Jordan were studied and it was suggested that
the facilitating conditions have an important role in predicting the actual usage of mobile
banking services (Alalwan et al., 2017). Also, several studies revealed that there is a significant
positive relationship between FC and actual usage (Nawi et al., 2016; Venkatesh et al., 2003).
Hedonic motivation
In UTAUT2, the hedonic motive is the decisive determinant of behavioral intent. (HM) is
referred to as "fun or pleasure derived from the use of technology" (Brown & Venkatesh, 2005).
HM has been described as the perceived enjoyment of using information technology, which has
manifested its impact on the intention of using technology (Alhazmi, Rahman, & Zafar, 2014;
Nawi et al., 2016)argued that HM is the extent to which a student feels pleasure while using SNs
in the learning process. (Kumar, 2013)demonstrated that the perceived enjoyment has a strong
relationship with the behavioral intention to use 3G technology in Shimla, India. In addition,
Alalwan et al. (2017) suggested that HM was an empirical guide and a decisive factor affecting
the intention of the Jordanian customers to employ mobile banking services.
Habit
Habit is defined as the extent to which people tend to perform behaviors automatically
because of learning (Limayem, Hirt, & Cheung, 2007). This factor investigates whether students'
habits have any influence on their intentions to use social media for the academic purposes. In
many studies, the habit proved its significant impact on the intention of the individual to use new
technologies (Limayem & Hirt, 2003; Venkatesh, Thong, & Xu, 2012). Moreover, Al-Zedjali et

Toward a Model for Actual Usage of Social Networks Sites for Educational Purposes in Jordanian
Universities
Gharrah, Aljaafreh, Al-Ma’aitah
___________________________________________________________________________
______________________________________________________________________________
255
© 2019 (9th) International Conference of the AGMS Proceedings
al. (2014) indicated that habits strongly predict the students' behavioral intention with regard to
using Facebook in their studies.
Actual usage
Actual usage AU is defined as “the actual usage of SNs for learning” (Balakrishnan,
2017)The role of Actual Usage as a predictor has been well established in the literature
(Balakrishnan, 2017; Tan et al., 2014; Venkatesh et al., 2003; Venkatesh et al., 2012)
Model extension variables
This study also attempts to extend UTAUT2 by adding new variables such as lecturer
support (Bonilla Polo & Osman, 2017) and student related factors (Al-Zedjali et al., 2014) which
had significant impact on students’ decisions to use SNS for educational purposes. The following
is an explanation for those factors:
Lecturer Support: Lecturers find SNs as a very useful tool for promoting teaching and
learning(Bexheti, Ismaili, & Cico, 2014). There are many studies that consider lecturer support
as an important factor for students to use SNs for academic purposes (Alhazmi et al., 2014;
Bonilla Polo & Osman, 2017). According to Bryson and Hand (2007), students' participation and
learning is promoted when faculty members actively participate in teaching and learning
activities. Finally, lecturer support is considered as an essential element with regard to the intent
to use SNs for educational purposes.
Student- related-factors: The current study defined this factor in terms of including
collaboration, sharing, and interaction. Firstly, collaboration is defined as "the extent to which
SNs support collaboration activities”; for example, the students' cooperation to do the homework
and study for the exam. Secondly, sharing is defined as “the extent to which SNs support sharing
of academic materials”. Thirdly, student’s interaction is defined as "the extent to which SNs
enhance interaction between students”, such as student interactions through the construction of
educational chat rooms, educational groups or creating pages on SNs to serve other students
(Balakrishnan, 2017; Umrani-Khan &Iyer, 2009). Moreover, Moran and Gonyea (2003)indicated
that peer interaction is the strongest predictor for engagement.

Toward a Model for Actual Usage of Social Networks Sites for Educational Purposes in Jordanian
Universities
Gharrah, Aljaafreh, Al-Ma’aitah
___________________________________________________________________________
______________________________________________________________________________
256
© 2019 (9th) International Conference of the AGMS Proceedings
Research Model
Based on the above discussion, the following research model is proposed (Figure 2).
Model UTAUT2
DISCUSSION
This paper introduced the educational SNs Model in Middle East, Jordan as a case. The
model provided a set of important factors influencing students’ actual usage of social networks
sites for educational purposes and their relationships. The model was also developed based on
the analysis of existing models and theories; and addressed their shortcomings. Most of the
factors of the proposed model were distilled from the related models and theories discussed the
issue of actual usage. However, the research model was distinguished from existing model:
Actual usage of
SNS for
educational
purposes
Effort expectancy
Social influence
Habit
Performance expectancy
Facilitating condition
Hedonic motivation
Student-related
factors Lecturer
support
Model Extension

Toward a Model for Actual Usage of Social Networks Sites for Educational Purposes in Jordanian
Universities
Gharrah, Aljaafreh, Al-Ma’aitah
___________________________________________________________________________
______________________________________________________________________________
257
© 2019 (9th) International Conference of the AGMS Proceedings
firstly, it discussed the research model in the specific context of Jordan, which had not been
studied before. Secondly, the proposed model included UTAUT2 (Effort expectancy,
Performance expectancy, Social influence, Facilitating condition, Habit, Hedonic motivation)
and additional important factors of (Student-related-factors, Lecturer Support). The proposed
model had both academic and practical implications. The model was intended to fill the research
knowledge gap due to the lack of studies in the context of Factors Influencing Students’ Actual
Usage of Social Networks Sites for Educational Purposes.
CONCLUSION
This paper presented educational SNs model in the context of Jordan in the Middle East
region. The paper analyzed and integrated the Unified Theory for Acceptance and Use of
Technology (UTAUT2) with an extension, in order to identify the Factors Influencing Students’
Actual Usage of Social Networks Sites for Educational Purposes. This new model presented a
number of new ideas related to the factors influencing student’s actual use of SNs for educational
purposes. The current study aimed to bridge the research gap due to the lack of studies dealing
with SNs for educational purposes in the context of Jordan. The model would be further
evaluated and updated if necessary; and the research results would be reported as an on-going
contribution to both research and industry.
Toward a Model for Actual Usage of Social Networks Sites for Educational Purposes in Jordanian
Universities
Gharrah, Aljaafreh, Al-Ma’aitah
___________________________________________________________________________
______________________________________________________________________________
258
© 2019 (9th) International Conference of the AGMS Proceedings
Reference
Abelmonaim, A. (2013). Acceptance of E-entrepreneurship: case of Morocco.
Al-Zedjali, K. H., Al-Harrasi, A. S., & Al-Badi, A. H. (2014). Motivations for using social
networking sites by college students for educational purposes. World Academy of
Science, Engineering and Technology, International Journal of Social, Behavioral,
Educational, Economic, Business and Industrial Engineering, 8(8), 2577-2580.
Alalwan, A. A., Dwivedi, Y. K., & Rana, N. P. (2017). Factors influencing adoption of mobile
banking by Jordanian bank customers: Extending UTAUT2 with trust. International
Journal of Information Management, 37(3), 99-110.
Alhazmi, A. K., Rahman, A. A., & Zafar, H. (2014). Conceptual model for the academic use of
Social Networking Sites from student engagement perspective. Paper presented at the
2014 IEEE Conference on e-Learning, e-Management and e-Services (IC3e).
Alkhunaizan, A., & Love, S. (2012). What drives mobile commerce? An empirical evaluation of
the revised UTAUT model. International Journal of Management and Marketing
Academy, 2(1), 82-99.
Balakrishnan, V. (2017). Key determinants for intention to use social media for learning in
higher education institutions. Universal Access in the Information Society, 16(2), 289-
301.
Bexheti, L. A., Ismaili, B. E., & Cico, B. H. (2014). An analysis of social media usage in
teaching and learning: The case of SEEU. Paper presented at the Proceedings of the 2014
International Conference on Circuits, Systems, Signal Processing, Communications and
Computers.
Bonilla Polo, P. A., & Osman, M. (2017). Is social the new smart?: Factors influencing students
on their decision to use social media for academic purposes.
Boyd, D. M., & Ellison, N. B. (2007). Social network sites: Definition, history, and scholarship.
Journal of computer‐mediated Communication, 13(1), 210-230.
Brown, S. A., & Venkatesh, V. (2005). Model of adoption of technology in households: A
baseline model test and extension incorporating household life cycle. MIS quarterly,
29(3).

Toward a Model for Actual Usage of Social Networks Sites for Educational Purposes in Jordanian
Universities
Gharrah, Aljaafreh, Al-Ma’aitah
___________________________________________________________________________
______________________________________________________________________________
259
© 2019 (9th) International Conference of the AGMS Proceedings
Casey, T., & Wilson-Evered, E. (2012). Predicting uptake of technology innovations in online
family dispute resolution services: An application and extension of the UTAUT.
Computers in Human Behavior, 28(6), 2034-2045.
Escobar-Rodrguez, T., Carvajal-Trujillo, E., & Monge-Lozano, P. (2014). Factors that influence
the perceived advantages and relevance of Facebook as a learning tool: An extension of
the UTAUT. Australasian Journal of Educational Technology, 30(2).
Kaplan, A. M., & Haenlein, M. (2012). Social media: back to the roots and back to the future.
Journal of Systems and Information Technology, 14(2), 101-104.
Kumar, S. (2013). The moderating factors of 3G user acceptance technology in Shimla (India)
using UTAUT model. International Journal of Computer Science & Engineering
Technology (IJCSET), 4(6).
Limayem, M., & Hirt, S. G. (2003). Force of habit and information systems usage: Theory and
initial validation. Journal of the Association for Information Systems, 4(1), 3.
Limayem, M., Hirt, S. G., & Cheung, C. M. (2007). How habit limits the predictive power of
intention: The case of information systems continuance. MIS quarterly, 31(4).
lStats, S. C. G. (Mar 2018 - Mar 2019). Browser Market Share Worldwide March 2018 - March
2019. Retrieved from http://gs.statcounter.com/social-media-stats/all/jordan
Moran, E. T., & Gonyea, T. (2003). The Influence of Academically-Focused Peer Interaction on
College Students' Development.
Nawi, N. B. C., Nasir, N. A. B. M., & Al Mamun, A. (2016). Factors contributing to the
acceptance of social media as a platform among student entrepreneurs: A review.
Mediterranean Journal of Social Sciences, 7(2), 42.
Seely Brown, J., & Adler, R. (2008). Open education, the long tail, and learning 2.0. Educause
review, 43(1), 16-20.
Selwyn, N. (2009). Faceworking: exploring students' education‐related use of Facebook.
Learning, media and technology, 34(2), 157-174.
Tan, M., Shao, P., & Yu, P. (2014). Factors influencing engineering students’ use of social media
in learning. World Trans. Eng. Technol. Educ, 12(4), 648-654.

Toward a Model for Actual Usage of Social Networks Sites for Educational Purposes in Jordanian
Universities
Gharrah, Aljaafreh, Al-Ma’aitah
___________________________________________________________________________
______________________________________________________________________________
260
© 2019 (9th) International Conference of the AGMS Proceedings
Umrani-Khan, F., & Iyer, S. (2009). ELAM: a Model for Acceptance and use of e-Learning by
Teachers and Students. Paper presented at the Proceedings of the International
Conference on e-Learning, Institute of Technology Bombay, Mumbai, India.
Van Raaij, E. M., & Schepers, J. J. (2008). The acceptance and use of a virtual learning
environment in China. Computers & Education, 50(3), 838-852.
Venkatesh, V., Morris, M. G., Davis, G. B., & Davis, F. D. (2003). User acceptance of
information technology: Toward a unified view. MIS quarterly, 425-478.
Venkatesh, V., Thong, J. Y., & Xu, X. (2012). Consumer acceptance and use of information
technology: extending the unified theory of acceptance and use of technology. MIS
quarterly, 36(1), 157-178.
Wang, Y. S., Wu, M. C., & Wang, H. Y. (2009). Investigating the determinants and age and
gender differences in the acceptance of mobile learning. British journal of educational
technology, 40(1), 92-118.
Product/Service Complexity and Choice of Channels for Information Search During the Purchase
Process: A Proposed Model Based on Media-Richness Theory
Essebi, Tomiuk, Plaisent, and Bernard
___________________________________________________________________________
______________________________________________________________________________
261
© 2019 (9th) International Conference of the AGMS Proceedings
Product/Service Complexity and Choice of Channels for Information Search During the
Purchase Process: A Proposed Model Based on Media-Richness Theory
Elyes Caid Essebsi
University of Quebec in Montreal
Daniel Tomiuk
University of Quebec in Montreal
Michel Plaisent
University of Quebec in Montreal
Prosper Bernard
University of Quebec in Montreal
Summary
Today, ubiquitous technologies such as smartphones and the Internet enable online purchasing.
This benefits both sellers and buyers (e.g., new markets, greater selection). Consumers' choice of
channels during the purchasing process is influenced by many factors (promotions, previous
channel experience, demographics, product/service characteristics, channel features and
situational factors). To our knowledge, no study has explored whether channel richness helps
explain channel choice for information search during the purchasing process. Our conceptual
model proposes that product/service complexity influences channel choice by increasing buyers'
preference for richer channels. We conclude with a discussion and recommendations for
companies using multiple sales channels.
Product/Service Complexity and Choice of Channels for Information Search During the Purchase
Process: A Proposed Model Based on Media-Richness Theory
Essebi, Tomiuk, Plaisent, and Bernard
___________________________________________________________________________
______________________________________________________________________________
262
© 2019 (9th) International Conference of the AGMS Proceedings
Introduction
The Internet and telecommunication networks have become ubiquitous, particularly in
retailing where they enable a company to offer more channels to consumers facilitating their
information search and their purchasing of its products/services (Singh and Swait, 2017). New
online sales channels are made possible through Web and mobile technologies and are
increasingly supported by social media. For companies, these multiple channels offer several
potential advantages, such as, access to new markets, 24/7 availability, cost savings, etc.
However, this also adds to the complexity of running a business. Challenges include how to best
manage multiple channels so as to reduce cannibalisation and create synergies between available
channels (Beck and Rygl, 2015).
Consumers as well can benefit from having access to several channels. These provide
more flexibility during the multiple stages of the purchasing process (Butler and Peppard, 1998,
Kotler and Keller, 2006). Research shows that new buying behaviors have indeed emerged.
Today, consumers use a combination of different channels at different stages of their purchasing
process (Singh and Swait, 2017). According to a study done by CEFRIO (2017), 51% of
consumers are showrooming (searching for information in physical stores before making an
online purchase) while up to 80% do webrooming (search information on the Internet to make a
purchase in store). Reportedly, around 38% of online shoppers pick up their product in a physical
store after having bought it online and up to 27% return products bought online at physical
stores.
Studies reveal that consumers' choice of channels during the purchasing process is
influenced by several factors such as: the promotional activities of the company, the previous
experience of the buyer, demographic factors, social effects, product / service characteristics,
channel characteristics and situational factors, and many more that remain unexplored. In
parallel, e-commerce research shows that making rich information available to consumers on
Websites influences their satisfaction during the purchasing process (Pinsonneault, Li and
Tomiuk, 2010). However, to our knowledge, no study has yet investigated whether media
richness theory (Daft and Lengel, 1986) can help better explain consumers' channel choices
during the purchasing process. The main objective of our study is to propose a model that links
the complexity of the product/service and the information richness supported by the channel
chosen by the buyer when searching for information during the purchasing process. We conclude
our paper by discussing the implications of this study for more effective management of multi-
and omni-channel selling environments.
Product/Service Complexity and Choice of Channels for Information Search During the Purchase
Process: A Proposed Model Based on Media-Richness Theory
Essebi, Tomiuk, Plaisent, and Bernard
___________________________________________________________________________
______________________________________________________________________________
263
© 2019 (9th) International Conference of the AGMS Proceedings
The Purchasing Process
Purchasing is a multistage process (see Figure 1). Typically, consumers go through five
stages. Each one includes different decisions (Butler and Peppard, 1998; Kotler and Keller,
2006). The stage that lies at the heart of our study is stage two: information search. Initially
(stage 1), the consumer identifies a need. At stage 2, (s)he collects relevant information about
potential solutions that will satisfy that need. In stage 3, (s)he evaluates and compares among the
alternatives found. A subset of choices can be retained which will then be re-evaluated before
making a final decision. The choice among alternatives happens in stage 4. The last stage (5) is
where post-purchase behaviors occur and is guided by the customer's degree of
satisfaction/dissatisfaction (Butler and Peppard, 1998) at which point the customer may decide to
go on a Website or use social media to leave comments about the product or company (s)he
purchased.
Stage 2 (information search), which is of interest to us in this study, is among the stages
that take the most time. It's based on economic evaluation, a mental calculation done by the
consumer on whether to stop his/her search for additional information (because it engenders
search costs) or to continue in the hope of finding new and useful information (Stigler, 1961).
The search costs include time, effort and money. The benefit attained from searching is the
reduction of risk. As such, stage 2 comes down to a cost-benefit analysis made by the consumer
on whether it is worth it or not to continue to search for additional information in order to further
reduce the risks associated with making a bad or suboptimal purchasing decision (Bugday, Sener
and Babaogul., 2016).

Product/Service Complexity and Choice of Channels for Information Search During the Purchase
Process: A Proposed Model Based on Media-Richness Theory
Essebi, Tomiuk, Plaisent, and Bernard
___________________________________________________________________________
______________________________________________________________________________
264
© 2019 (9th) International Conference of the AGMS Proceedings
Figure 1 - The purchasing process
With today's Internet- and mobile-based technologies further facilitating the purchase and
sale of products and services, consumers find themselves with several channels available for use
at each of the stages of the purchasing process. In parallel, companies are increasingly interested
in making the best use of these several when selling their products/services to consumers by
adopting multi- and omni-channel strategies (Rigby, 2011). "Multi"-channel selling is about
better understanding and managing the substitutability among a company's available channels.
"Omni" is from Latin meaning "everything". The challenge for companies is more combinatorial
in nature. It's about better integration between channels. Omni-channel selling consists of
figuring out how to effectively use all physical and virtual channels in complementary ways.
Successful integration among various channels can generate added value, not only for the
customer but for the company as well. For instance, a company that allows its customers to
retrieve, at one of their physical stores, products ordered online, also increases its chances of
making another sale once that customer enters the store to pick up his/her order (Montoya-Weiss,
Voss and Grewal, 2003).
Research into understanding how to best use and combine the several channels available
to companies is increasing in popularity. But it's still in its infancy. Many researchers have
highlighted the importance of better understanding consumer behavior in multi- and omni-
channel environments (e.g., Chatterjee and Kumar 2017; Luo, Fan and Zhang, 2016; Park and
Lee 2017). The factors that explain consumers' choice of channel are still not well understood
1 - Problem recognition
2 - Information search
3 - Evaluation of alternatives
4 - Purchase decision
5 - Post-purchase evaluation/behavior

Product/Service Complexity and Choice of Channels for Information Search During the Purchase
Process: A Proposed Model Based on Media-Richness Theory
Essebi, Tomiuk, Plaisent, and Bernard
___________________________________________________________________________
______________________________________________________________________________
265
© 2019 (9th) International Conference of the AGMS Proceedings
(Singh and Swait, 2017). In multi- and omni-channel selling environments, it has become
necessary to investigate, not only the factors that can influence the number of channels used by
customers, but also what factors lead consumers to prefer particular channels relatively to others.
Arguably, such research can help companies develop more optimal portfolios of channels to
better serve its customers throughout the purchasing process while reducing the risk of
cannibalization among the companies' channels.
Factors Influencing Channel Choice
Past research has identifies several factors that can explain customers' channel choices
during the purchasing process (e.g., Gensler, Verhoef, and Böhn, 2012; Hummel, Schacht, and
Maedche, 2016; Neslin et al., 2006; Singh and Swait, 2017; Valentini, Montaguti and Neslin,
2011). A review of these studies reveals the following categories of factors: (1) the company's
promotional activities (2) past consumer experiences with a channel (3) individual differences
(4) demographic factors (5) social influences (6) product/service characteristics (7) channel
characteristics and (8) situational factors. To the best of our knowledge, we did not find any
study that has explored whether Media Richness Theory (Daft and Lengel, 1986) can help
explain channel choice during the purchasing process.
Media Richness Theory
Media Richness Theory (Daft and Lengel, 1986) was developed to explain managers'
choices among available communication channels in organizational settings. According to the
theory, certain channels are better adapted at conveying certain types of messages. Channel
richness reduces message ambiguity. The richer the channel, the better it is in conveying
complex/equivocal messages. The theory proposes that channel richness is characterized by the
following four factors:
1- Multiplicity of cues: Cues include vocal intonations, facial expressions and gesturing. The
greater the cues supported by a channel, the greater its support for more complex
communications between sender and receiver.
2- Immediacy of feedback: Channels that support real-time communications are richer than those
that do not.
3- Personalization: Describes the channel's ability to adjust and shape the message to the needs
and preferences of a user.
4- Linguistic variety: Verbal communications are judged to be richer than a written
communications (Gimpel, Huber and Sarikaya, 2016).
Product/Service Complexity and Choice of Channels for Information Search During the Purchase
Process: A Proposed Model Based on Media-Richness Theory
Essebi, Tomiuk, Plaisent, and Bernard
___________________________________________________________________________
______________________________________________________________________________
266
© 2019 (9th) International Conference of the AGMS Proceedings
The theory proposes that companies can hierarchically rank their available channels on a
scale of richness. Accordingly, the richest channel is face-to-face, followed by
videoconferencing, telephone, chat, emails, static Website and written documents, being the
lowest.
Several research studies have attempted to adapt Media Richness Theory to the
context of e-commerce. Pinsonneault et al. (2010) proposed a concept called "information
richness" that can be applied to new electronic channels such as Websites. Jahng, Jain and
Ramamurthy (2007) adopted a similar strategy and proposed the concept of " richness of
interactions" between buyers and sellers operating online. Rukundo, Tomiuk and Motaghi (2018)
showed that richer channels could help companies to better deal with service failure recovery
efforts when the problems were more serious and difficult to solve. Results from these studies
support the usefulness of the richness concept when applied to e-commerce. In sum, all of these
studies show that richness can have a beneficial influence on consumers' attitudes, especially
when the consumer perceives complexity (e.g., message, problem, product) to be high.
Model and Hypotheses
Our proposed model seeks to help explain consumers' choice of channels when
searching for product/service information during the purchasing process. It takes into account the
following constructs: "product/service complexity", "channel richness", "channel convenience",
"use of online channels" and "use of off-line channels" (see Figure 2).
The model proposes that, during the information search stage of the purchasing
process, the greater the perceived complexity of the product/service by the buyer, the more (s)he
will show preference for richer channels. This preference for richer channels will make the buyer
more likely chose offline channels (e.g.., physical store, traditional bank branch where face-to-
face encounters prevail). Our model also predicts that when the product/service complexity
decreases, consumers will prefer more convenient channels instead. All else being equal, when
product/service complexity is low, the desire for convenience (rather than richness) will make
buyers more likely to use online channels rather than to take the time and make the effort to
travel to physical locales.

Product/Service Complexity and Choice of Channels for Information Search During the Purchase
Process: A Proposed Model Based on Media-Richness Theory
Essebi, Tomiuk, Plaisent, and Bernard
___________________________________________________________________________
______________________________________________________________________________
267
© 2019 (9th) International Conference of the AGMS Proceedings
Figure 2. Conceptual Model
Product/service complexity is an important factor influencing consumers' channel
choice and promotes multi-channel behaviors (e.g., Frambach, Roest and Krishnan, 2007,
Kushwaha and Shankar, 2013). It's defined as the extent to which the consumer perceives that a
product/service is difficult to understand or use (Nicholson, Clarke and Blakemore, 2002). This
brings us to our first set of hypotheses.
According to Media Richness Theory, complex (equivocal) communications require
rich communication channels so as to reduce ambiguity. In the context of information search for
products/services, the theory suggests that, the more complex the products/services consumers
seek to buy, the more the consumer will tend to choose a rich channel during the information
seeking stage of the purchasing decision process. Moreover, since the traditional store (or
branch) supports the richest communications (i.e., having direct face-to-face access to a
company's representative), we propose the following hypothesis:
H1a: The greater the perceived product/service complexity, the more the consumer will prefer
rich channels when searching for product/service information.
As for less complex products/services, the theory suggests that less rich channels
would be more appropriate information sources. This brings us to our next hypothesis deduced
directly from the theory:
H1b: The lesser the perceived product product/service complexity, the less the consumer will
prefer richer channels when searching for product/service information.
Product/service
Complexity
Preference for
convenient
channel
Preference for
rich channel
Use of online
channels
Use of offline
channels H1a(+)
H1b
H2(-)
H3(+)
H5(+)
H4
H6

Product/Service Complexity and Choice of Channels for Information Search During the Purchase
Process: A Proposed Model Based on Media-Richness Theory
Essebi, Tomiuk, Plaisent, and Bernard
___________________________________________________________________________
______________________________________________________________________________
268
© 2019 (9th) International Conference of the AGMS Proceedings
The scientific literature reveals that perceived convenience plays a predominant role in
the choice of channels during the buying process for consumers (Frambach et al., 2007, Gensler
et al., 2012, Nicholson and Van Heems, 2009, Verhoef, Neslin and Vroomen, 2007).
Convenience relates to saving time and minimizing effort (Berry, Poortinga, Segall and Dasen,
2002). We therefore propose that, when product/service complexity is low, it will be
convenience (rather than richness) that will drive channel preference during the information-
seeking step of the purchasing process. This brings us to our next hypothesis:
H2: The lesser the perceived product product/service complexity, the more the consumer will
prefer channels that are convenient to use when searching for product/service information.
We conclude by proposing that there is a direct relationship between channel preference
and actual channel use. Because off-line channels are considered the richest (Pinsonneault et al.,
2010), we expect that:
H3: A positive relationship exists between the preference for rich channels and the use of offline
channels (e.g., store visit / branch) when searching for product/service information.
Although we recognize that, today, online channels can be designed so as to
convey more richness (Pinsonneault et al., 2010) about a company's products/services (e.g., by
adding videos, creating virtual reality environments, and adding chat bots), media richness
theory predicts that face-to-face (interpersonal) interactions are still the richest of channels. We
therefore propose that:
H4: Although a positive relationship between preference for rich channels and use of online
channels may exist, on average, this relationship will be relatively weaker when compared to the
positive and significant relationship between preference for rich channels and use of offline
channels (i.e., traditional stores).
In terms of information retrieval, research indicates that online channels reduce efforts
related to information searches and making it more convenient for users (e.g., Gupta, Su and
Walter, 2004). Arguably, a consumer can more easily browse the Web or his/her smartphone for
information on a product/service they are interested in buying than to physically travel to
physical stores. Consequently, we propose the following two hypotheses:
H5: A positive relationship exists between the preference for more convenient channel (e.g.,
Websites, mobile applications) and the use of online channels when searching for
product/service information.
Product/Service Complexity and Choice of Channels for Information Search During the Purchase
Process: A Proposed Model Based on Media-Richness Theory
Essebi, Tomiuk, Plaisent, and Bernard
___________________________________________________________________________
______________________________________________________________________________
269
© 2019 (9th) International Conference of the AGMS Proceedings
H6: Although a positive relationship between preference for convenient channels and use of
offline channels may exist, on average, this relationship will be relatively weaker when
compared to the positive and significant relationship between preference for convenient channels
and use of online channels.
Proposed Methodology
The next step in our research will be to develop and validate our questionnaire.
Definitions of concepts under study will be used to come up with questionnaire items (Churchill,
1979). We will develop Likert type scales with multiple items for each of the constructs being
measured to more richly reflect the complexity of these concepts/constructs (McIver and
Carmines, 1981). Card sorting (Moore and Benbasat, 1991) will be employed for content validity
purposes. The questionnaire will be distributed across various IS/IT classes at the bachelor's
level at the University of Quebec in Montreal during summer 2019.
Partial Least Squares (PLS) (Kock, 2016) is a form of Structural Equation
Modeling (SEM) that is widely used for causal research in several fields such as in IS and
communications. It will be used to test our model. The PLS approach was chosen because it
allows for the estimation of complex causal relationships between latent variables and is
advantageous when used with smaller sized samples (Hair, Ringle and Sarstedt, 2012).
Discussion
The Internet and mobile technologies continue to contribute to the evolution of e-
commerce by providing more purchasing options and affecting the buyer's purchasing process
(Bucklin and Sismeiro, 2009, Singh and Swait, 2017). Many factors have been identified to
explain why consumers chose particular channels during the purchasing process rather than
others. Our study seeks to show that the concept of richness (Daft & Lengel, 1986, Pinsonneault
et al., 2015) can also help explain the choice of channels made by consumers while searching for
information on a product/service. Our model proposes that the selection of richer channels will
be preferred by customers searching for information on more complex products/services. If
supported, our results will be of help to companies looking to more effectively manage their
available sales channels. Information provided for complex products and services are best to be
done using channels such as traditional stores or Websites designed to communicate very rich
information to consumers. For less complex products and services, companies should focus of
providing consumers with convenience rather than richness. The actual empirical results for this
study are expected in the Fall of 2019.

Product/Service Complexity and Choice of Channels for Information Search During the Purchase
Process: A Proposed Model Based on Media-Richness Theory
Essebi, Tomiuk, Plaisent, and Bernard
___________________________________________________________________________
______________________________________________________________________________
270
© 2019 (9th) International Conference of the AGMS Proceedings
References
Beck, N. & Rygl, D. (2015). Categorization of multiple channel retailing in Multi-, Cross-, and
Omni‐Channel Retailing for retailers and retailing. Journal of Retailing and Consumer
Services, 27, 170-178.
Berry, J. W., Poortinga, Y. H., Segall, M. H. & Dasen, P. R. (2002). Cross-Cultural Psychology:
Research and Applications Cambridge University Press.
Bucklin, R. E. & Sismeiro, C. (2009). Click here for Internet insight: Advances in clickstream
data analysis in marketing. Journal of Interactive Marketing, 23(1), 35-48.
Bugday, E. B., Sener, A. & Babaogul, M. (2016). Multi-Channel Information Search:
Consumers' Trust Level and Frequency of Use. Tüketici ve Tüketim Araştırmaları
Dergisi= Journal of Consumer and Consumption Research, 8(2), 1-27.
Butler, P. & Peppard, J. (1998). Consumer purchasing on the Internet:: Processes and prospects.
European Management Journal, 16(5), 600-610.
CEFRIO. (2017). Le Commerce Électronique au Québec, NETendances 2017.
Chatterjee, P. & Kumar, A. (2017). Consumer willingness to pay across retail channels. Journal
of Retailing and Consumer Services, 34, 264-270.
Churchill Jr, G. A. (1979). A paradigm for developing better measures of marketing constructs.
Journal of Marketing Research, 16(1), 64-73.
Daft, R. L. & Lengel, R. H. (1986). Organizational information requirements, media richness and
structural design. Management science, 32(5), 554-571.
Frambach, R. T., Roest, H. C. & Krishnan, T. V. (2007). The impact of consumer internet
experience on channel preference and usage intentions across the different stages of the
buying process. Journal of Interactive Marketing, 21(2), 26-41.
Gensler, S., Verhoef, P. C. & Böhm, M. (2012). Understanding consumers’ multichannel choices
across the different stages of the buying process. Marketing Letters, 23(4), 987-1003.
Product/Service Complexity and Choice of Channels for Information Search During the Purchase
Process: A Proposed Model Based on Media-Richness Theory
Essebi, Tomiuk, Plaisent, and Bernard
___________________________________________________________________________
______________________________________________________________________________
271
© 2019 (9th) International Conference of the AGMS Proceedings
Gimpel, H., Huber, J. & Sarikaya, S. (2016). Customer Satisfaction in Digital Service
Encounters: the Role of Media Richness, Social Presence, and Cultural Distance
Gupta, A., Su, B.-C. & Walter, Z. (2004). An empirical study of consumer switching from
traditional to electronic channels: A purchase-decision process perspective. International
Journal of Electronic Commerce, 8(3), 131-161.
Hummel, D., Schacht, S. & Maedche, A. (2016). Determinants of Multi-Channel Behavior:
Exploring Avenues for Future Research in the Services Industry.
Jahng, J., Jain, H. & Ramamurthy, K. (2007). Effects of interaction richness on consumer
attitudes and behavioral intentions in e-commerce: some experimental results. European
Journal of Information Systems, 16(3), 254-269.
Kock, N. (2016). Non-normality propagation among latent variables and indicators in PLS-SEM
simulations. Journal of Modern Applied Statistical Methods, 15(1), 299-315.
Kotler, P. & Keller, K. (2006). Marketing Management. 12th edition : Pearson Prentice Hall,
Upple Saddle River, New Jersey.
Kushwaha, T. & Shankar, V. (2013). Are multichannel customers really more valuable? The
moderating role of product category characteristics. Journal of Marketing, 77(4), 67-85.
Luo, J., Fan, M. & Zhang, H. (2016, May 2016). Information Technology, Cross-Channel
Capabilities, and Managerial Actions: Evidence from the Apparel Industry. Journal of the
Association for Information Systems, 17(5), 308-327.
McIver, J. & Carmines, E. G. (1981). Unidimensional scaling (vol. 24) Sage.
Montoya-Weiss, M. M., Voss, G. B. & Grewal, D. (2003). Determinants of online channel use
and overall satisfaction with a relational, multichannel service provider. Journal of the
Academy of Marketing Science, 31(4), 448-458.
Moore, G. C. & Benbasat, I. (1991). Development of an instrument to measure the perceptions of
adopting an information technology innovation. Information Systems Research, 2(3),
192-222.
Product/Service Complexity and Choice of Channels for Information Search During the Purchase
Process: A Proposed Model Based on Media-Richness Theory
Essebi, Tomiuk, Plaisent, and Bernard
___________________________________________________________________________
______________________________________________________________________________
272
© 2019 (9th) International Conference of the AGMS Proceedings
Neslin, S. A., Grewal, D., Leghorn, R., Shankar, V., Teerling, M. L., Thomas, J. S. & Verhoef,
P. C. (2006). Challenges and opportunities in multichannel customer management.
Journal of Service Research, 9(2), 95-112.
Nicholson, M., Clarke, I. & Blakemore, M. (2002). 'One brand, three ways to shop': situational
variables and multichannel consumer behaviour. The International Review of Retail,
Distribution and Consumer Research, 12(2), 131-148.
Nicholson, P. & Van Heems, R. (2009). Orientations d'achat et comportement multi-canal du
client. Management & Avenir, (1), 136-156.
Park, S. & Lee, D. (2017). An empirical study on consumer online shopping channel choice
behavior in omni-channel environment. Telematics and Informatics, 34(8), 1398-1407.
Pinsonneault, A., Li, S. & Tomiuk, D. (2010). Effect of Web Channel Richness and Web
Information Richness On Satisfaction and Learning: A Study of Simple and Complex
Products. Systèmes d'Information & Management, 15(4), 141-169.
Rigby, D. (2011). The Future of Shopping. Harvard Business Review, 89(12), 64-75.
Rukundo, P., Tomiuk, D., & Motaghi, H. (2018). Channel Richness and Customers' Satisfaction
with Online Service Failure Resolution, Conference Proceedings, Association of Global
Management Studies, Concordia University (Sir William Campus) Montreal, Canada,
June 21-22, 2018), 86-95. Available at: https://www.association-gms.org/wp-
content/uploads/2018/09/2018-ICAGMS-Proceedings.pdf. Last visit: June 20, 2019.
Singh, S. & Swait, J. (2017). Channels for search and purchase: Does mobile Internet matter?
Journal of Retailing and Consumer Services, 39, 123-134.
Valentini, S., Montaguti, E. & Neslin, S. A. (2011). Decision Process Evolution in Customer
Channel Choice. Journal of Marketing, 75(6), 72-86.
Verhoef, P. C., Neslin, S. A. & Vroomen, B. (2007). Multichannel customer management:
Understanding the research-shopper phenomenon. International Journal of Research in
Marketing, 24(2), 129-148.

Firm structures in markets and the supporting lifecycle logic: the case for market evolution
Koplyay, Motaghi, Hurta, and Malouin
___________________________________________________________________________
______________________________________________________________________________
273
© 2019 (9th) International Conference of the AGMS Proceedings
Firm structures in markets and the supporting lifecycle logic: the case for market evolution
Tamas Michel Koplyay, Ph.D.
Hamed Motaghi, Ph.D., Corresponding Author
Hilda Hurta, Ph.D.
Mario Malouin, CPA
Abstract
The structural forms of companies on the market lifecycle change substantially as the lifecycle
unfolds. These changes are both structural and topological in concert with what is happening in
the market. The firm shapes and substance evolve in a fashion that suggests an environmental
adaption dictated by the market or more precisely anticipated by the firms as they read the
market signals. This article traces the logic that defines the modes and results of this adaptation.
The lifecycle itself has been demonstrated to be a powerful device by the principal author and
colleagues, in a series of articles, to be symmetrically predictive in time, forecasting both the
future and the past. This predictive capacity applies to structural evolution of the firm and the
constraints that the distinct organizational shape of the structure will place on the firm.
Furthermore, knowing the present shape, one can define both the past and successor structures
and their fit to the enabling environment. The environment itself can be traced to market deep
and surface structures and the closely correlated strategy landscape dominant at each stage of the
market.
Keywords: Market Lifecycle, evolution of firm, organizational structure, strategy, customer
profile

Firm structures in markets and the supporting lifecycle logic: the case for market evolution
Koplyay, Motaghi, Hurta, and Malouin
___________________________________________________________________________
______________________________________________________________________________
274
© 2019 (9th) International Conference of the AGMS Proceedings
The market landscape; the deep and surface structure of the market
The deep structure of the market is defined by the underlying customer base that sends
specific signals to the surface structure captured by the lifecycle , on how to address the needs of
the customer base over which the particular firm is trending along the lifecycle (Vernon 1992).
In high tech markets (Pavitt 1984) the underlying customer profiles define the
fundamental dynamics of the market demand response, and this concept is easily extended to all
markets that are characterized by a succession of demand profiles as the firms drift along the
market lifecycle, which is the surface structure.
The deep structure customer profile is distributed as a bell curve, consisting of innovators
and early adaptors who set the tone for the interactions between the entrepreneur suppliers and
the early risk taking and curious client base.
Exhibit 1 captures the drift of the surface structure, the lifecycle over the deep structure, the
customer base.
BowlingAlley
Tornado Tombstone
Shakeout
Mainstreet
Technology Enthusiasts
Visionaries Pragmatists Conservatives Skeptics
Market Dynamics and Customer Base
Chasm
Early market
Exhibit 1 – Market dynamics
These represent a small portion of the market and the first major survival test for the
entrepreneurs does not happen until reach the chasm and cross into market client majority with a
complete product, where they need to work of their localized expansion strategy defined by the
bowling alley. This initial breakthrough into the core of the market, consisting of the pragmatics
and the conservatives is a carefully husbanded period of creating significant market traction by

Firm structures in markets and the supporting lifecycle logic: the case for market evolution
Koplyay, Motaghi, Hurta, and Malouin
___________________________________________________________________________
______________________________________________________________________________
275
© 2019 (9th) International Conference of the AGMS Proceedings
building customized products defined by a product theme, such as security, as was the case with
Entrust, and cross selling to the core customer’s ecosystem though endorsement of the target
customer.
Entrust, after gaining the confidence of the banks, used their satisfaction to penetrate the
banks’ supply and distribution channel ecosystem and the concept of vertical marketing to move
up and down the banks’ value chains and establish closely knit colony of customers where cross
endorsements became a vital marking tool. Unfortunately Entrust did not build this business fast
enough (Fagerberg 2002) and was bypassed on growth curve by Verisign (W3Techs), which
eventually used its accumulated market value, due to its superior growth, to dominate Entrust.
This cautionary tale illustrates the dual aspect of early market strategy, grow fast to
penetrate the market and grow faster than the immediate competition or face the prospects of
dominance (Schumpeter 2010). Not just market share but relative market share, or market
strength, defines your future.
Once the market growth really takes off, the bowling alley is left behind, growth is
pursued at all costs, in fact in early markets stock price is correlated with market growth and
market strength, and profits don’t matter.
Shopify has been using this concept successfully by creating incentive regimes for
existing customers to recruit others through a well-known concept of “churn”, use every means
to increase the top line and strengthen your share price vis a vis the competition (Shopify 2018).
Once into the high growth phase of the market where the early majority customers,
pragmatics seek you out, marketing stance shifts from carefully designed penetration strategies
through vertical marketing, premised on ample local customization, to horizontal marketing
strategy where the firm abandons all pretext of catering to selected customer groups and tries to
follow the market growth through any path available to reach an eventual dominant market
share.
This race to the top is accompanied by both the opportunity to start building brand
strategies, which are less expensive to defend than to attack and seeking out market partnership
to establish product standards platforms (Porter 2011). This is the first instance of cooperation in
the market as standards slow down subsequent intrusions of new technology, and therefore act as
a defensive measure and send out assurance signals for the cautious clientele, hiding out in the
conservative category.
In fact we have demonstrated in previous articles (Paquin and Koplyay 2007) that market
competition continually shits from a standalone approach in early markets, where a firm is

Firm structures in markets and the supporting lifecycle logic: the case for market evolution
Koplyay, Motaghi, Hurta, and Malouin
___________________________________________________________________________
______________________________________________________________________________
276
© 2019 (9th) International Conference of the AGMS Proceedings
loosely linked to an ecosystem, to a full cooperative mode of the value chain where competition
is between chains and the voice of the individual firm is lost, drowned by the needs of the chain.
Somewhere along the growth part of the lifecycle, but when growth slows down and the
exponential portion of growth reaches the inflection point, too many firms are present in the
market and a shakeout ensues. This blind and mad scramble to reduce market supply side to the
prevailing deep structure demand conditions takes a significant toll on the number of
competitors. Usually firms with deeper pockets survive, or ones with parents with deeper
pockets. Once the shakeout dies down the market becomes a much of stable entity, with both
supply and demand side exhibiting reasonable and predictable attributes (Nelson 2009).
When market horizons lengthen, product introductions diminish and innovation assumes
incremental risk aversion mounts and generally a modus vivendi is reached among competitors
(Koplyay and Hurta 2016). At this point to enhance competitive advantage a round of M&A
ensues to build market share as organic growth becomes difficult, and this purchase of
competitors leads to a superior ability to execute against the final strategy of the market, cost
leadership, which are given the to the firms (Nonaka 2008).
Market share acquired through an M&A allows to economies of scale which is the
principal means to respond to cost leadership, by increasing margins, which after a few rounds
leads to superior profits or cash flows, called economic value added, and defines share price. In
early markets the value added is share price increase in late markets its profits. Interestingly there
seems to a rationale to this market encompassing logic and is illustrated by the sequence of
strategies given to the firms ,from early market positioning strategies to find your place to
execute the best you can against the place you occupy. Exhibit 2 provides the overview to the
succession of strategies available during the lifecycle.

Firm structures in markets and the supporting lifecycle logic: the case for market evolution
Koplyay, Motaghi, Hurta, and Malouin
___________________________________________________________________________
______________________________________________________________________________
277
© 2019 (9th) International Conference of the AGMS Proceedings
Exhibit 2 – Succession of strategies
An important fact to note is that the strategy funnel is continually decreasing with myriad
of options in early market positioning reduced to one by market maturity. This implies among
other things that the strategic premium in early markets is nimbleness of finding the best market
position for the firm and hence the attention is paid to the market dynamics, whereas in late
markets the position is given, so that essence of strategy shifts from choice of strategy to
execution of strategy, from positioning to execution. In other words, from effectiveness to
efficiency.
The lifecycle then moves from two climate zones in the market; a zone of effectiveness
that starts at incubation and lasts until about just past the standards platform and efficiency that
truly demands attention past the shakeout crisis point and lasts throughout the rest of the market
life. During a brief period they overlap when the standards platform is formed. But the firms in
the market sense this evolution and start aiming for market share right at the beginning of the
market to be able to execute eventually against the requirements of cost leadership (Utterback
1996). Both the market and the instinctive evolution of the firms aim for such long term
transition from effectiveness to efficiency.
It is as if the market forces shaping the competitive universe and the incremental
evolutionary forces of the firms, leading to adaptive behavior, both exert forces on the firms in
the same direction. And we’ll see the effects of this combined effort on the structural succession
of firm organization later. Exhibit 3 displays the two climate zones of the market.

Firm structures in markets and the supporting lifecycle logic: the case for market evolution
Koplyay, Motaghi, Hurta, and Malouin
___________________________________________________________________________
______________________________________________________________________________
278
© 2019 (9th) International Conference of the AGMS Proceedings
Exhibit 3 – Climate zones
In general effectiveness zone requires swift adjustments, flexibility under market forces
and adaptive capacity to follow market signals, whereas efficiency zone demands progressively
more focus on delivering against a given strategy, ability to resist and attenuate market forces
and a capacity to cooperate and coordinate with partner firms which eventually coalesce into
value chains and the market offers the right circumstances for both to succeed.
Early markets forgive mistakes of positioning by offering high growth to cover up
mistakes, high margins to compensate for lack of total volumes and late markets offer much
more stable environments, longer planning horizons and sluggish competitive moves to
compensate for the heavy structural burdens now carried by the firms.
The shape and growth of corporate structures under the market climate zones
A well-known fact from organizational theory is the structural forms assume specific
shapes and succeed each other in orderly fashion along the lifecycle (Vernon 1992). Exhibit 4
depicts the evolution of organizational types along the cycle.

Firm structures in markets and the supporting lifecycle logic: the case for market evolution
Koplyay, Motaghi, Hurta, and Malouin
___________________________________________________________________________
______________________________________________________________________________
279
© 2019 (9th) International Conference of the AGMS Proceedings
Exhibit 4 – Organizational types
This is quite interesting as the question now that can be raised is why these forms and not
others? Strictly from a network perspective other competing shapes could be selected, but the
firms always assume the same sequence of organizational types, with the controlling entity at the
top and having horizontal and vertical dimensions that mutate as the firm grows.
Why is this? With the central controller at the top, especially in early markets, allows for
the quick decisions that makes real time repositioning possible. One person decides and the firm
follows.
There is a price to pay for this audacious freedom, the firm has a critical component the
CEO, which if suppressed leads to disintegration of the whole firm. But it offers interesting
advantages beyond quick reaction time in turbulent markets.
The average path to any member of the firm is minimized and is equal at any level of the
firm, hence sharing of unfiltered yet critical information is maximized, and everyone remains on
the same level of awareness about the environment.

Firm structures in markets and the supporting lifecycle logic: the case for market evolution
Koplyay, Motaghi, Hurta, and Malouin
___________________________________________________________________________
______________________________________________________________________________
280
© 2019 (9th) International Conference of the AGMS Proceedings
In general, when the CEO is suppressed in early markets the firm is in survival danger
whereas in late markets the departure of the CEO may lead to much needed rejuvenation.
However, in late markets, when firms align in value chains, it’s no longer the CEO who
is critical to survival but the rather survival of the whole firm determines the state of the chain.
The critical units become impersonal and much bigger in late markets.
Furthermore, entrepreneurial CEO’s tend to be market focused and constantly weigh their
chances at the market position they occupy, ready to move a slightest uncomfortable conspiracy
of circumstances the market contrives. In addition, the market doesn’t lack surprises, from
intruding new technologies, to market convergence of substitute markets to wild migration of
client bases, the odds of remaining at a position of choice is shim.
In general, we see the importance of the horizontal and vertical dimensions of a firm
structure. The horizontal dimension contributes to the completion of functional elements of the
firm starting with product development, to marketing, to finance and then on to production with
the overhead functions of HR, supply chain/distribution channels management following as
necessary (Penrose 2009). For example, HR does not really materialize until employees can be
retained. And investments in employees can be made, such as training and promotion which
become long term investments in the individual.
Early market employees are nomadic and are often lost to competitors when the
innovation rush is more palpable on competitors’ premises. The first sign of successful retention
possibilities occurs when the firm begins to offer pension, education and savings plans. Being
mostly horizontal in shape, early firms adapt well and fast to changes having just minimal
baggage to drag along. However, once the efficiency climate zone starts intruding the shape
changes drastically
Sensing the eventual need to for productivity the firms begin the vertical process of task
delineation by adding progressively more layers to the organization.
This allows for tighter focusing of tasks, more specialization, higher level of repetition of
the same tasks, resulting in superior execution against productivity demands. However, there is a
price to pay, as the lower levels in the firm lose environmental perspective and a long term
planning capability.
This leads to differentiation of compensation, a CEO is compensated on a five year cycle
a VP, maybe on three and a production worker on a weekly basis. But for a short time period
until the new culture takes hold the firm is on a dual track.
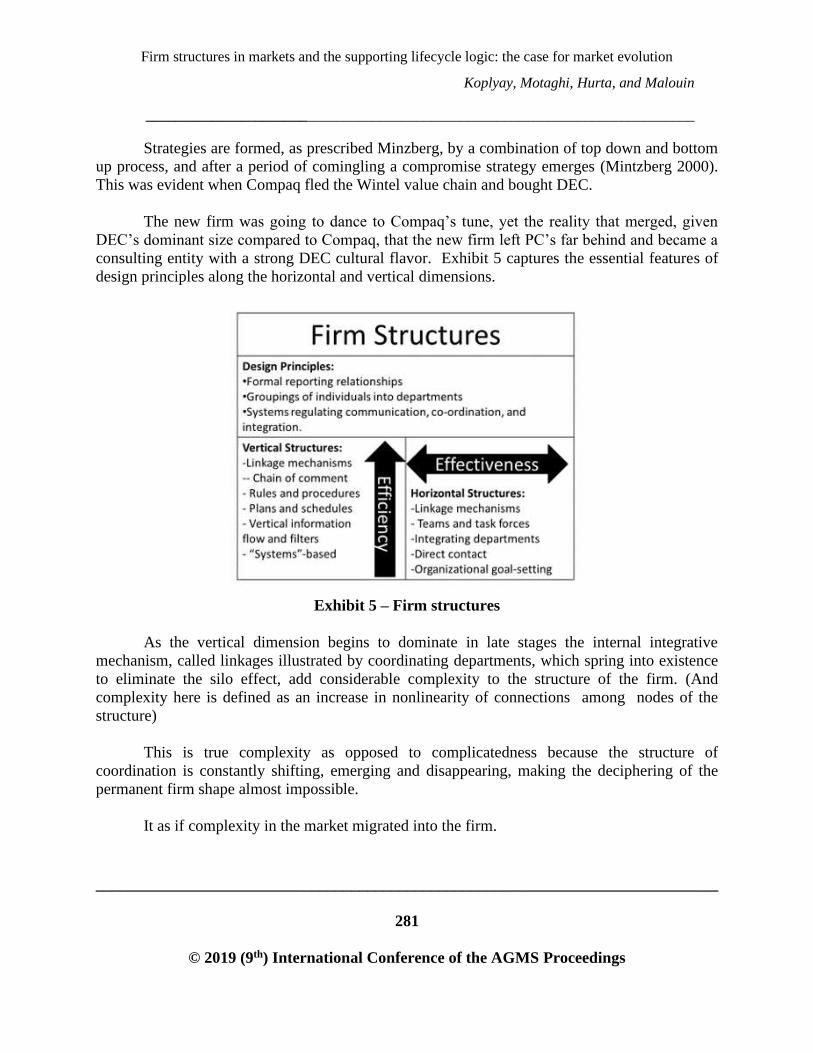
Firm structures in markets and the supporting lifecycle logic: the case for market evolution
Koplyay, Motaghi, Hurta, and Malouin
___________________________________________________________________________
______________________________________________________________________________
281
© 2019 (9th) International Conference of the AGMS Proceedings
Strategies are formed, as prescribed Minzberg, by a combination of top down and bottom
up process, and after a period of comingling a compromise strategy emerges (Mintzberg 2000).
This was evident when Compaq fled the Wintel value chain and bought DEC.
The new firm was going to dance to Compaq’s tune, yet the reality that merged, given
DEC’s dominant size compared to Compaq, that the new firm left PC’s far behind and became a
consulting entity with a strong DEC cultural flavor. Exhibit 5 captures the essential features of
design principles along the horizontal and vertical dimensions.
Exhibit 5 – Firm structures
As the vertical dimension begins to dominate in late stages the internal integrative
mechanism, called linkages illustrated by coordinating departments, which spring into existence
to eliminate the silo effect, add considerable complexity to the structure of the firm. (And
complexity here is defined as an increase in nonlinearity of connections among nodes of the
structure)
This is true complexity as opposed to complicatedness because the structure of
coordination is constantly shifting, emerging and disappearing, making the deciphering of the
permanent firm shape almost impossible.
It as if complexity in the market migrated into the firm.

Firm structures in markets and the supporting lifecycle logic: the case for market evolution
Koplyay, Motaghi, Hurta, and Malouin
___________________________________________________________________________
______________________________________________________________________________
282
© 2019 (9th) International Conference of the AGMS Proceedings
Exhibit 6 demonstrates the essence of this still unproven proposition; market complexity
migrates in the firm from their respective alliances
The special case of matrix and organizations and merging value chains
We know for a fact that firm resilience associated with effectiveness and firm robustness
required to resist shocks in efficiency zones head in opposite directions. Early firms yield to
market shock by seeking out a different position and in the process absorb shocks by accepting
structure deformations, they are adaptable to the hostile early market turbulence.
Therefore, late stage firm are anchored at specific positions and must remain there to
protect their accumulated asset investments, they resist shocks by robustness of structure their
own and that of their value chain alliance. Nor can they afford structural deformations that
destroys linearity of the alliance as linearity is a prerequisite for efficient flow of resources
through the chain. So they resist any shocks that could deform the alliance structure
Resilience is akin to adaptation by avoiding the full impact of the market force whereas
robustness is equivalent to absorbing the force. Resilience depends on survival after
displacement and robustness indicates building high level of tolerance and redundancy into the
firm and its alliance structure to survive planned magnitude of shocks. Exhibit 7 illustrates the
relative dominance of resilience vs robustness during the lifecycle.
Exhibit 7 – Robustness and resilience
Interestingly both the firm structures under evolution in the market and the associated
alliances, from ecosystems to value chains exhibit a high level of symmetry. This implies an

Firm structures in markets and the supporting lifecycle logic: the case for market evolution
Koplyay, Motaghi, Hurta, and Malouin
___________________________________________________________________________
______________________________________________________________________________
283
© 2019 (9th) International Conference of the AGMS Proceedings
importance of symmetry to the firm and its neighborhood. Why? The answer can be found in the
basic property of symmetry, the implication of order which preserves desirable qualities such as
control with minimal information flows.
A symmetric organization (left looks the same as right under a reflection around an axis
in the middle) is easier to inform and direct as the MIS effort is same for both sides. This means
the organization is faster to respond to crisis either of displacement or a resistance nature, in
almost real time as the environmental shock unfolds. So the preservation of firm and alliance
symmetry contributes greatly to survival chances.
Now let us look at a specific instance in the lifecycle where both resilience and
robustness matter and are of equal importance. This is the crossover point of the two curves
where usually matrix type organizations occur on the lifecycle.
The matrix is a compromise structure, neither fish nor fowl that carries attributes of both
curves.
It is reasonably resilient and robust, corresponding to a period of indecision in the market,
when the firm is hesitant about line of business expansion and preservation of resources in light
of uncertain prospects.
The matrix is weak or strong depending whether the functional (horizontal) or the line of
business (vertical0 dimension dominates. It is highly unstable and tends to degenerate into one of
the two modes. It is essentially a resources sharing mechanism, that loses its valued symmetry
temporarily ,is hard to control due to existence of dual direction (either line of business of
functional management can control, and sometimes both).
Furthermore, the matrix goes against the grain of adapting to an efficiency climate that
looms in the market. It is mostly project based where the assignment of functional skills is done
on a temporary basis to the line of business that represents the project but hopefully will grow
into a sustainable business.
Hence the matrix is the ultimate compromise in the market, it’s hedging bets that major
shocks won’t intrude in the expectation, that in the meanwhile, firm resource expenditures can be
husbanded.
Given its instability the matrix takes conscious and substantial effort to manage,
especially to preserve its inherently unstable shape. Whenever a crisis intrudes, such as more
market turbulence, inherent in effectives zones it reverts to a functional form; gives up on the
line of business expansions.

Firm structures in markets and the supporting lifecycle logic: the case for market evolution
Koplyay, Motaghi, Hurta, and Malouin
___________________________________________________________________________
______________________________________________________________________________
284
© 2019 (9th) International Conference of the AGMS Proceedings
If the market forces on the other hand strongly signal the advent of the efficiency zone
then the matrix degenerates into the line of businesses dimension, which it does anyway in the
long run to help with the productivity concerns of each line of business. It gives up resources
sharing and develops a resource base for each business. Exhibit 8 shows the essential features of
the matrix.
Exhibit 8 – Matrix structure
Of particular significance are the facts that the matrix exists during a period of high
uncertainty and is adequate a solution to a compromise situation between effectiveness and
efficiency, a period when the two climate zones overlap.
It is not optimal for control or adaptation to change market conditions, but it preserves
firm resources when the market signals become contradictory or conflicting. Indeed most of the
time as the market progresses towards efficiency the matrix transforms into a divisional structure
and the functional units are built within each line of business.
With respect to the emergence of the value chain after eh matrix dilemma is left behind,
some curious phenomena can be observed. The value chain is completely linear network,
implying that everyone of its constituent component is critical. If one is suppressed the chain

Firm structures in markets and the supporting lifecycle logic: the case for market evolution
Koplyay, Motaghi, Hurta, and Malouin
___________________________________________________________________________
______________________________________________________________________________
285
© 2019 (9th) International Conference of the AGMS Proceedings
goes under. There is precious little resiliency left and all is invested into robustness, the ability
to withstand shocks.
In contrast the early ecosystem exhibits practically no criticality as no node is essential to
survival, this system is very redundant in structure and hence resilient. The important question is
what in the market forces unfolding compels the linearization of the ecosystem into a value
chain, which of course is necessary to the delivery of productivity? Or if not, market forces is it
then the firm and alliance adaptive process that leads to these changes? Or is it the combination
of the two?
From highly nonlinear, complex structures that are extremely well suited to yielding to
market forces to rigid linear structure that delivers the best efficiency but is vulnerable to shock
loads. The authors best informed intuition is that it is a combination of the market forces and the
adaptive capacities of the firms and their alliances that produces this evolution.
The market has a life of its own and the progression of market circumstances signals
firms to adapt and evolve, although there may be temporary deviances from evolution and
emergence of compromise structures such as the matrix.
Conclusions
The firms evolve in their markets according to the dictates of forces found along the
market lifecycle and this evolution choses certain structural forms that best fit the market
requirements and the firm needs to control and respond (Penrose 2009).
The observed firm structures in markets display a logical response to market pressures
and forms selected form all those available are the optimal in the sense of fitting into market
constraints at the given point of the cycle, while providing the firm with levers to manage its
internal operations, minimize information requirements through preservation of organizational
symmetry and through the changes in horizontal and vertical dimensions of its structure deliver
against the two principal climate zones of its market existence.
Further research should elucidate whether the market forces dominate the process of
adaptation by imposing inescapable constraints or the firms possess an internal mechanism that
responds to market signaling and, unforced, goes through an adaptive process that finds a new
structural equilibrium. Or perhaps it is a combination of the two? An unresolved phenomenon is
still the selection of the classical pattern of a central controller from all the network patterns
available for the firm structure, it’s always central controller at the top.

Firm structures in markets and the supporting lifecycle logic: the case for market evolution
Koplyay, Motaghi, Hurta, and Malouin
___________________________________________________________________________
______________________________________________________________________________
286
© 2019 (9th) International Conference of the AGMS Proceedings
This is partly explained by the need to keep communication paths minimal to all levels of
the organization and hence an efficient MIS system, but it’s not enough. Central control is after
all a risky choice in early markets as the suppression of the CEO results most of the time in the
demise of the firm. A solution appears now on the horizon with the advent of AI and blockchain
to guarantee the success of distributed control and transparency (Tapscott and Tapscott 2016).
We can expect therefore that in the future we shall find alternate forms chosen from
available structural patterns that can compete successfully with the classical form and avoid the
risks of central control. Finally, we would like to comment on the important feature of
productivity in late markets. Productivity as key component of efficiency is a must to survive in
a cost leadership environment. It is the basic tool of competition. But is it always necessary?
The answer in short is no. In fact, when intrusive new innovations constantly rejuvenate
the market productivity is a non-issue as the market does not mature but returns to a growth
stage.
This happened when Apple reinvaded the portable communications market with its iX
products. The markets returned to high growth mode and are still on that trajectory, with
productivity nowhere in sight, rather constant innovation rules the day. Similarly Google
transiting to an affiliate status within Alphabet is leading to continued market expansion of the
parent and the new product lines are still some distance from maturity.

Firm structures in markets and the supporting lifecycle logic: the case for market evolution
Koplyay, Motaghi, Hurta, and Malouin
___________________________________________________________________________
______________________________________________________________________________
287
© 2019 (9th) International Conference of the AGMS Proceedings
Selected References
Fagerberg, J. (2002). "Technology, growth and competitiveness." Books.
Koplyay, T. and H. Hurta (2016). "“Clock speed” theory of strategy making along the life cycle."
Polish Journal of Management Studies 13.
Mintzberg, H. (2000). The Rise and Fall of Strategic Planning, Financial Times Prentice Hall.
Nelson, R. R. (2009). An evolutionary theory of economic change, harvard university press.
Nonaka, I. (2008). The knowledge-creating company, Harvard Business Review Press.
Paquin, J.-P. and T. Koplyay (2007). "Force field analysis and strategic management: A dynamic
approach." Engineering Management Journal 19(1): 28-37.
Pavitt, K. (1984). "Sectoral patterns of technical change: towards a taxonomy and a theory."
Research policy 13(6): 343-373.
Penrose, E. T. (2009). The Theory of the Growth of the Firm, Oxford university press.
Porter, M. E. (2011). Competitive advantage of nations: creating and sustaining superior
performance, Simon and Schuster.
Schumpeter, J. A. (2010). Capitalism, socialism and democracy, routledge.
Shopify (2018): https://investors.shopify.com/Investor-News-Details/2018/Shopify-Announces-
First-Quarter-2018-Financial-Results/.
Tapscott, D. and A. Tapscott (2016). Blockchain Revolution: How the Technology Behind
Bitcoin Is Changing Money, Business, and the World, Penguin Publishing Group.
Utterback, J. M. (1996). Mastering the Dynamics of Innovation, Harvard Business School Press.
Vernon, R. (1992). International investment and international trade in the product cycle.
International Economic Policies and their Theoretical Foundations (Second Edition),
Elsevier: 415-435.
W3Techs: https://w3techs.com/technologies/comparison/sc-entrust,sc-verisign.

Retail Customer Experience: A Comparative Study Between Physical, Online, and Omnichannel Retail
Jain, Mora, and Werth
___________________________________________________________________________
______________________________________________________________________________
288
© 2019 (9th) International Conference of the AGMS Proceedings
Retail Customer Experience: A comparative study between Physical, Online and
Omnichannel Retail.
Shubham Jain
AWS-Institut für digitale Produkte und Prozesse,
D 5 1 Uni-campus
Saarbrücken, Germany
Daniel Mora
AWS-Institut für digitale Produkte und Prozesse,
Saarbrücken, Germany
Dirk Werth
AWS-Institut für digitale Produkte und Prozesse,
Saarbrücken, Germany
Author Note
This research is a part of the European Training Network project PERFORM
that has received funding from the European Union’s Horizon 2020 research
and innovation programme under the Marie Skłodowska-Curie grant
agreement No 765395. This research reflects only the authors' view, the
European Commission is not responsible for any use that may be made of the information it
contains.
Retail Customer Experience: A Comparative Study Between Physical, Online, and Omnichannel Retail
Jain, Mora, and Werth
___________________________________________________________________________
______________________________________________________________________________
289
© 2019 (9th) International Conference of the AGMS Proceedings
Abstract
In the 1990s, many retailers went bankrupt in an attempt to transition from traditional to online
retail and currently, retailers are facing the same challenges evolving into the omnichannel model
due to lack of tools and knowledge to facilitate the transition. Retail managers need to
understand the different dynamics and aspects of customer experience in retail as well as how
they differ from previous business models. To address these problems, there is a need to create
knowledge which can be done by reviewing the conceptual and theoretical literature around
customer experience across all retail models as customer experience is considered as the most
important aspect of omnichannel retail. This paper provides a comparative analysis to understand
the differences between traditional physical in-store retail, online e-commerce and omnichannel
retail to facilitate retailers to comprehend the concepts and further create strategies to transition
into the omnichannel retail successfully.
Keywords: Omnichannel Retail, Digital Retail, Customer Experience.
Retail Customer Experience: A Comparative Study Between Physical, Online, and Omnichannel Retail
Jain, Mora, and Werth
___________________________________________________________________________
______________________________________________________________________________
290
© 2019 (9th) International Conference of the AGMS Proceedings
Difference between Traditional Physical, Online and Omnichannel Retail Customer
Experience
The retail industry, as a sector accounted for $26.29 trillion in sales in 2019 (Statista,
2019) and proliferating, which makes it a significant part of the world economy (Limited,
2018). The industry started with the concept of in-store physical retailing, and eventually, with
the development of different technologies like the Internet and World Wide
Web, concepts like digital retail came into existence. Digital retail started with e-
commerce websites like Amazon in the 1990s (Anderson, 2018) and moved on to
multichannel system when the retailers and researchers pointed out the synergies between the
online and offline channels of retail (Schoenbachler & Gordon, 2002). While the retail sector
saw the birth of e-commerce, there were a lot of retail businesses closing down (Berman, 2019;
Rigby, 2011) due to the abrupt growth of online retailers and the need that the retailers felt to
transition into online retail without dwelling on the dynamics of the transition and the business
model. In the current times, retail is at the verge of transitioning again into the model of
omnichannel retail (von Briel, 2018) which right now is more of a buzzword but is defined in
different ways by different authors (Lazaris and Vrechopoulos, 2014; Juaneda-Ayensa,
Mosquera, & Sierra Murillo, 2016). To facilitate this transition, retail managers and researchers
need to have a complete understanding of the concept and how it differs from the previous
models of retail. This makes a valid motivation in our understanding to study those differences
and motivate researchers to bring out the insights.
Customer experience can be estimated as the single most important factor in omnichannel
retail as it follows a customer-driven approach (Carroll & Guzmán, 2013). It needs to be given
more attention in terms of research to understand the concept of customer experience in
different models of retail and to understand the different constraints attached to it.
Research Question
How can omnichannel retail be differentiated from mono channel-based retail models:
online retail and traditional physical retail in the context of customer experience?
Proposed Solution
We propose to answer the developed question by conducting research in the form of
analysis and review of literature in the sector of customer experience in traditional physical,
online and omnichannel retail and examine those researches to find common grounds for
comparison.
Aim
The paper aims to present a comparative analysis of the three different models of retail
sector: traditional physical retail, online retail and omnichannel retail towards the context of
Retail Customer Experience: A Comparative Study Between Physical, Online, and Omnichannel Retail
Jain, Mora, and Werth
___________________________________________________________________________
______________________________________________________________________________
291
© 2019 (9th) International Conference of the AGMS Proceedings
customer experience. The conducted research will present the differences explicitly in a tabular
manner, along with a discussion based on those differences and focusing on future challenges
and strategies.
Originality/value
The article adds value to the literature as the three models have not been studied together
to be compared explicitly in terms of the constraints attached to customer experience in different
environments.
Paper Structure
The following content of the paper is divided into five further sections starting with
stating the used methodology followed by the literature and background in the next section.
Analyzation will be done in section three, followed by description and discussion. The article
will be concluded with the ‘Conclusion and Future Work’ section as section five and used
references will be stated at the end of the article.
Methodology
In the presented article, the methods used for selection of search results merged a
protocol-driven methodology in which the search strategy is defined at the beginning of the study
with a snowballing technique, where the search strategy emerges as the study unfolds as
mentioned in Greenhalgh and Peacock (2005) and, Ravasi and Stigliani (2012).
The search strategy consisted of individual searches as stated in Table 1. The articles
were selected and handpicked by reviewing the titles and abstracts and analyzing the relevance to
the proposed research. The ‘Google Scholar’ online database was used to collect the articles. To
scope the concepts and different perspectives present in the literature, a combination of the retail
model and the term ‘customer experience’ was used to form usable keywords. The term
“Omnichannel Retail Customer Experience” collected 17 articles, while “Online Retail Customer
Experience” brought 35 articles, making an initial set of 52 articles.
In the case of traditional physical retail, a number of searches had to be done to collect
relevant articles. As the term “traditional” is vague in the scientific literature, we used different
synonyms to the concept that had to be analyzed. A search session with three different
combinations of keywords: “Physical Retail customer experience”, “In-store customer
Experience” and “Brick and Mortar Retail customer experience” contributed to the literature set
with 21 articles, extending the set to 73 articles.
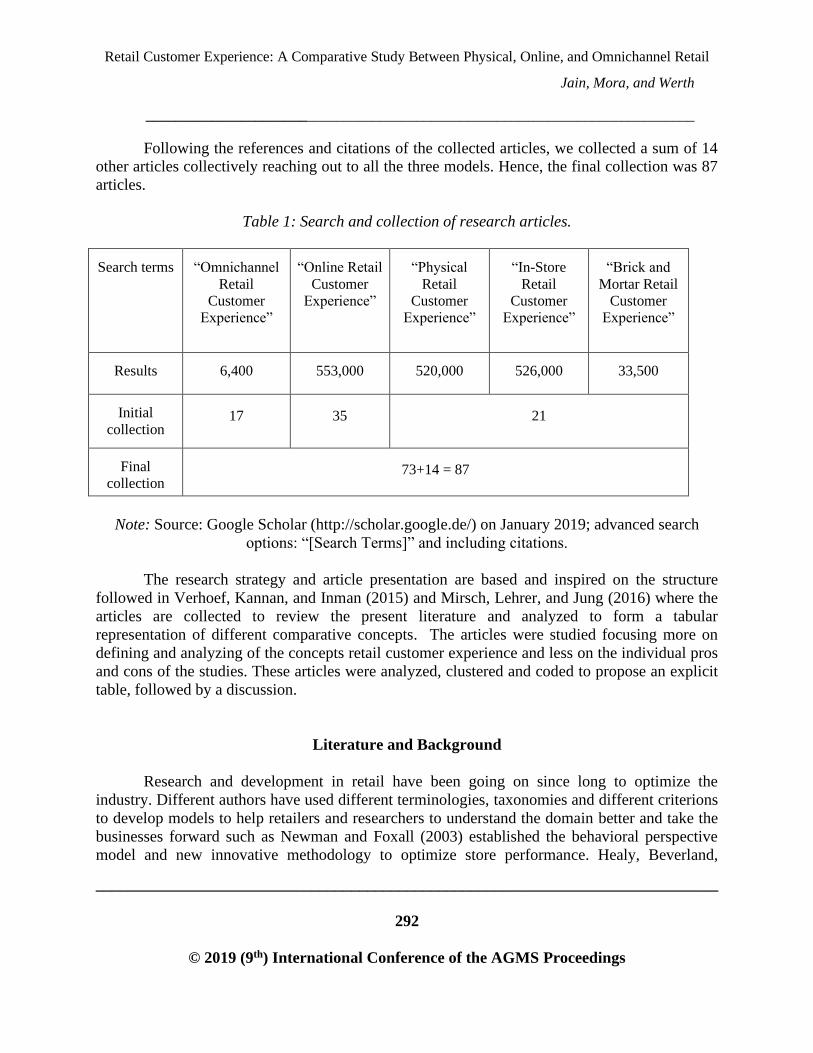
Retail Customer Experience: A Comparative Study Between Physical, Online, and Omnichannel Retail
Jain, Mora, and Werth
___________________________________________________________________________
______________________________________________________________________________
292
© 2019 (9th) International Conference of the AGMS Proceedings
Following the references and citations of the collected articles, we collected a sum of 14
other articles collectively reaching out to all the three models. Hence, the final collection was 87
articles.
Table 1: Search and collection of research articles.
d
Search terms s
“Omnichannel
Retail
Customer
Experience”
s “Online Retail
Customer
Experience”
a “Physical
Retail
Customer
Experience”
s “In-Store
Retail
Customer
Experience”
s “Brick and
Mortar Retail
Customer
Experience”
Results
6,400
553,000
520,000
526,000
33,500
Initial
collection
17
35
21
Final
collection
73+14 = 87
Note: Source: Google Scholar (http://scholar.google.de/) on January 2019; advanced search
options: “[Search Terms]” and including citations.
The research strategy and article presentation are based and inspired on the structure
followed in Verhoef, Kannan, and Inman (2015) and Mirsch, Lehrer, and Jung (2016) where the
articles are collected to review the present literature and analyzed to form a tabular
representation of different comparative concepts. The articles were studied focusing more on
defining and analyzing of the concepts retail customer experience and less on the individual pros
and cons of the studies. These articles were analyzed, clustered and coded to propose an explicit
table, followed by a discussion.
Literature and Background
Research and development in retail have been going on since long to optimize the
industry. Different authors have used different terminologies, taxonomies and different criterions
to develop models to help retailers and researchers to understand the domain better and take the
businesses forward such as Newman and Foxall (2003) established the behavioral perspective
model and new innovative methodology to optimize store performance. Healy, Beverland,
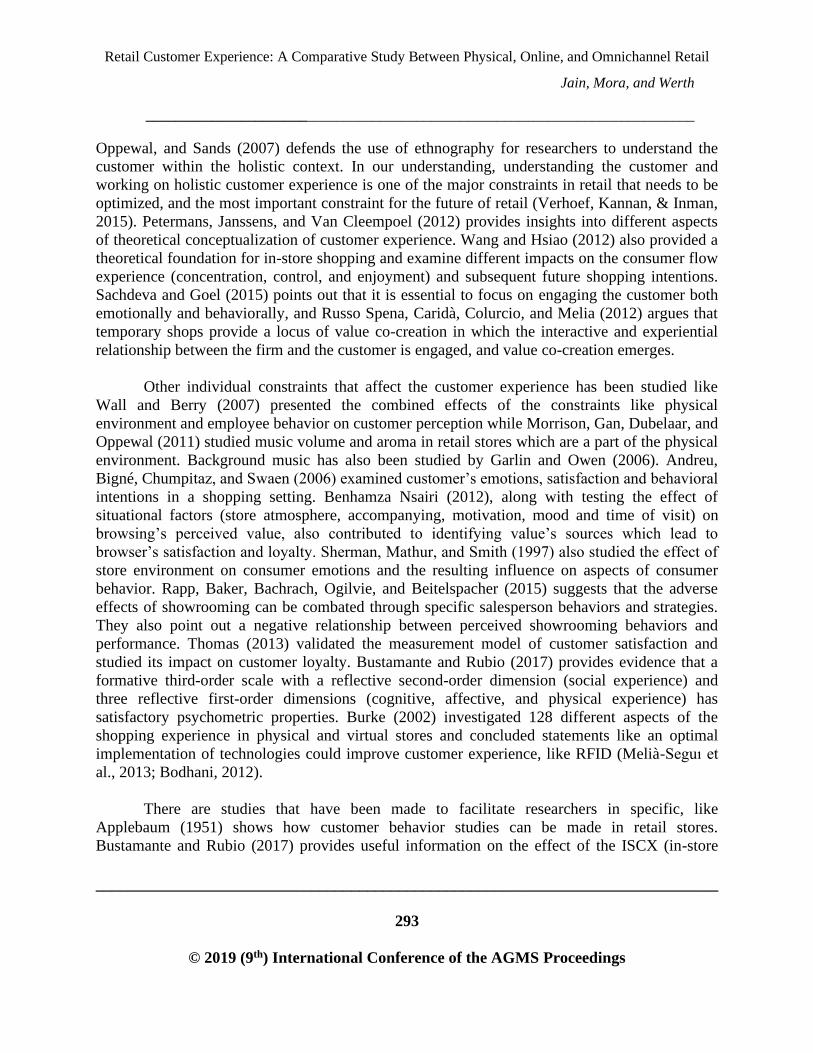
Retail Customer Experience: A Comparative Study Between Physical, Online, and Omnichannel Retail
Jain, Mora, and Werth
___________________________________________________________________________
______________________________________________________________________________
293
© 2019 (9th) International Conference of the AGMS Proceedings
Oppewal, and Sands (2007) defends the use of ethnography for researchers to understand the
customer within the holistic context. In our understanding, understanding the customer and
working on holistic customer experience is one of the major constraints in retail that needs to be
optimized, and the most important constraint for the future of retail (Verhoef, Kannan, & Inman,
2015). Petermans, Janssens, and Van Cleempoel (2012) provides insights into different aspects
of theoretical conceptualization of customer experience. Wang and Hsiao (2012) also provided a
theoretical foundation for in-store shopping and examine different impacts on the consumer flow
experience (concentration, control, and enjoyment) and subsequent future shopping intentions.
Sachdeva and Goel (2015) points out that it is essential to focus on engaging the customer both
emotionally and behaviorally, and Russo Spena, Caridà, Colurcio, and Melia (2012) argues that
temporary shops provide a locus of value co-creation in which the interactive and experiential
relationship between the firm and the customer is engaged, and value co-creation emerges.
Other individual constraints that affect the customer experience has been studied like
Wall and Berry (2007) presented the combined effects of the constraints like physical
environment and employee behavior on customer perception while Morrison, Gan, Dubelaar, and
Oppewal (2011) studied music volume and aroma in retail stores which are a part of the physical
environment. Background music has also been studied by Garlin and Owen (2006). Andreu,
Bigné, Chumpitaz, and Swaen (2006) examined customer’s emotions, satisfaction and behavioral
intentions in a shopping setting. Benhamza Nsairi (2012), along with testing the effect of
situational factors (store atmosphere, accompanying, motivation, mood and time of visit) on
browsing’s perceived value, also contributed to identifying value’s sources which lead to
browser’s satisfaction and loyalty. Sherman, Mathur, and Smith (1997) also studied the effect of
store environment on consumer emotions and the resulting influence on aspects of consumer
behavior. Rapp, Baker, Bachrach, Ogilvie, and Beitelspacher (2015) suggests that the adverse
effects of showrooming can be combated through specific salesperson behaviors and strategies.
They also point out a negative relationship between perceived showrooming behaviors and
performance. Thomas (2013) validated the measurement model of customer satisfaction and
studied its impact on customer loyalty. Bustamante and Rubio (2017) provides evidence that a
formative third-order scale with a reflective second-order dimension (social experience) and
three reflective first-order dimensions (cognitive, affective, and physical experience) has
satisfactory psychometric properties. Burke (2002) investigated 128 different aspects of the
shopping experience in physical and virtual stores and concluded statements like an optimal
implementation of technologies could improve customer experience, like RFID (Melià-Seguı et
al., 2013; Bodhani, 2012).
There are studies that have been made to facilitate researchers in specific, like
Applebaum (1951) shows how customer behavior studies can be made in retail stores.
Bustamante and Rubio (2017) provides useful information on the effect of the ISCX (in-store
Retail Customer Experience: A Comparative Study Between Physical, Online, and Omnichannel Retail
Jain, Mora, and Werth
___________________________________________________________________________
______________________________________________________________________________
294
© 2019 (9th) International Conference of the AGMS Proceedings
customer experience) scale on key performance variables such as satisfaction and loyalty to the
store.
Traditional physical in-store retail has been compared to online retail, and this
comparison has been studied in different ways. Enders and Jelassi (2000) discusses the
advantages and disadvantages of traditional store-based and online retailing. Rajamma, Paswan,
and Ganesh (2007) suggests that services are more likely to be associated with the online
shopping mode, whereas more tangible products are likely to be associated with bricks and
mortar stores.
The authors that worked on customer experience in the context of online retail pointed
out some other constraints that could affect customer reaction and perception like Hausman and
Siekpe (2009) talks about the visual dynamics of online retail and discussed the effect of web
pages on customer experience in online retail. Hernández, Jiménez, and Martın (2010) worked
along with the technology acceptance model (TAM) and provided significant insights for the
effect of perception of customers on the e-commerce experience and Çelik (2011) tried to find
the impact on PU (perceived usefulness), PEOU (perceived ease of use) and BI (behavioral
intentions) in online customer experience. (Morgan-Thomas and Veloutsou (2013)) demonstrates
that trust and perceived usefulness positively affect online brand experience. Grewal, Levy, and
Kumar (2009) provides seven articles that contribute to customer experience: promotion, pricing,
merchandise and brand, supply chain, location, retail metrics, and customer behavior. Insley and
Nunan (2014) point out the importance of including game elements to enhance the retail
experience. Chang and Chen (2008) proposed an integrating conceptual framework focusing on
the relationships among customer interface quality, satisfaction, switching costs, and e-loyalty.
Rose, Clark, Samouel, and Hair (2012) describes online customer experience (OCE) to be
“a psychological state manifested as a subjective response to the e-retailer’s website” and Martin,
Mortimer, and Andrews (2015) proposed an extended model of OCE. Rose, Hair, and Clark
(2011) also add to the understanding of OCE in the purchase context. (Hsu, 2008) provides an
evolved ACSI (American Customer Satisfaction Index) mode: E-CSI (Trust, E-SQ (service
quality) and Perceived Value). In (Pentina, Amialchuk, & Taylor, 2011), a new type of online
shopping experience (interactive/engagement) was identified. Online service quality and trust
have also been studied in (Herington & Weaven, 2007; Nusair & Kandampully, 2008; Janda,
Trocchia, & Gwinner, 2002), though Herington & Weaven (2007) proposes different conclusions
as to Hsu (2008).
Ofir & Simonson (2007) studies effects of stating expectations on customer satisfaction
and shopping experience and O. Pappas, G. Pateli, N. Giannakos, and Chrissikopoulos (2014)
studied prior experience in retail and related it with expectancy and intention to purchase.
Bagdare and Jain (2013) conceptualizes retail customer experience as a reliable and valid

Retail Customer Experience: A Comparative Study Between Physical, Online, and Omnichannel Retail
Jain, Mora, and Werth
___________________________________________________________________________
______________________________________________________________________________
295
© 2019 (9th) International Conference of the AGMS Proceedings
multidimensional construct, explained in four dimensions: leisure, joy, distinctive and mood.
Gilmore and Pine (2002) and Bridges and Florsheim (2008) discussed customer experience from
a more progressive point of view to provide customers a more hedonic and social experience to
keep up with the current scenario. Trevinal and Stenger (2014) defines online shopping
experience (OSE) through four core dimensions: the physical, ideological, pragmatic and social
dimension. Philipp Klaus (2013) identifies functionality and psychological factors as the two
main dimensions of online customer service experience. Liu, He, Gao, and Xie (2008) suggests
that eight constructs – information quality, web site design, merchandise attributes, transaction
capability, security/privacy, payment, delivery, and customer service – are strongly predictive of
online shopping customer satisfaction, while the effect of response time is not significant. Kim
(2005) defines e-customer satisfaction and develops an index using a weighted sum model.
Customer loyalty in online retail is studied by Bilgihan (2016). Chen and Chang (2003) identifies
three common online shopping components: interactivity, transaction, and fulfillment.
There are certain strategies researchers and retailers can follow to study and work with
these aspects like Petre, Minocha, and Roberts (2006) developed an empirically-grounded
evaluation instrument: E-SEQUAL. Nambisan and Watt (2011) proposed a four-dimensional
construct – online community experience (OCE) examined its impact on customer attitudes
regarding the product, the company, and the quality of service. Novak, Hoffman, and Yung
(2000) developed a structural model that embodies the components of what makes for a
compelling online experience. Richardson (2010) talks about how to use customer journey maps
to improve and asses customer experience using a four-fold Framework. Phil Klaus and Nguyen
(2013) highlights current and future roles of online channels, social media and their strategic
implications for the retail banking services sector, and subsequent segmentation practices.
Rowley (2009) discusses online branding that could be useful for retailers to work on.
Other factors like impact of service system design and flow experience on customer
satisfaction (Xin Ding, Hu, Verma, & Wardell, 2010) and relationship between a customer’s
experience of product returns, subsequent shopping behavior (Griffis, Rao, Goldsby, & Niranjan,
2012) have been studied in the context of online customer experience.
As the sector is transitioning into omnichannel retail, which is still a developing concept,
researchers are putting up articles to make retailers understand the future of retail. The concept of
omnichannel customer experience differs from both online and physical retail in a way that it
integrates both the channels. Bell, Gallino, and Moreno (2014) developed a customer-focused
framework based on product delivery and fulfillment, creating a matrix of 4 quadrants where all
retail models can be put. Frazer and Stiehler (2014) expanded the body of knowledge of
omnichannel retail customer experience, talking about the “Shopper experience” and the
omnichannel experience.

Retail Customer Experience: A Comparative Study Between Physical, Online, and Omnichannel Retail
Jain, Mora, and Werth
___________________________________________________________________________
______________________________________________________________________________
296
© 2019 (9th) International Conference of the AGMS Proceedings
There is enough evidence to make sure that omnichannel concept works like in
(Sopadjieva, Dholakia, & Benjamin, 2017), authors presented a study of 46,000 shoppers and
argued that customers like to use multiple channels and the system is more efficient and every
customer is more valuable in an omnichannel or multichannel system. (Carroll & Guzmán, 2013)
is a report by Accenture where they go over the concept of omnichannel retail strategies and
understanding for communication service providers. They discuss the funnel system, and about
the customer-driven cyclic methodology. (Hansen & Sia, 2015) mentions key lessons Hummer, a
European sports fashion company learned from the transition into an omnichannel business.
Their total sales increased from $170 million in 2010 to $240 million in 2013. They mentioned
the roles of Chief Executive Officer (CEO), Chief Information Officer (CIO), Chief Digitization
Officer (CDO) along with the extent of change requires and the need to embrace industry
partners.
Cook (2014) discuss the omnichannel customer and its attributes and mentions the
dynamics of the change to the omnichannel environment that needs to be understood. The paper
also mentions the role of physical stores in retail and how it will change in the coming future.
Parise, Guinan, and Kafka (2016) mention the “crisis of immediacy” where customers want
immediate services in omnichannel retailing and suggested solutions to improve customer
experience in the context of immersion, flow, cognitive fit and emotional fit. Von Briel (2018)
presents a four-stage Delphi study concluding major challenges, trends, technologies, and
customer touchpoints. Bennett and El Azhari (2015) discusses omnichannel customer experience
and analyze the in-store shopping experience and the impact of different digital technologies and
other changes in the store.
Different authors tried to publish on customer experience in the context of omnichannel
retailing such as Juaneda-Ayensa, Mosquera, and Sierra Murillo (2016) worked on different
constraints that could affect the purchase intention of customers namely: Habit, Hedonic
influence, social influence, effort expectancy and performance expectancy. They also provide
different constraints on which different models of retail can be compared while comparing
multichannel and omnichannel systems. Lazaris and Vrechopoulos (2014) also provides a
literature review for the comparison between multichannel to omnichannel retail and the
transition. They propose an elongated multidisciplinary research agenda for logical outcomes in
the domain while Picot-Coupey, Huré, and Piveteau (2016) sheds light on the concept of multi,
cross and omnichannel retail and talks about the challenges retailers face and the solutions to
overcome them and to provide a good customer experience. Verhoef, Kannan, and Inman (2015)
provides literature for multichannel retail and compares it with omnichannel. They study the
literature in three different contexts: (1) Impact of channels on performance, (2) Shopper
behavior across channels and (3) Retail mix across channels.

Retail Customer Experience: A Comparative Study Between Physical, Online, and Omnichannel Retail
Jain, Mora, and Werth
___________________________________________________________________________
______________________________________________________________________________
297
© 2019 (9th) International Conference of the AGMS Proceedings
Peltola, Vainio, and Nieminen (2015) argues that providing a good omnichannel
experience has two key factors: (1) Reducing the risk of losing the customer during customer
journey by providing a unified and integrated services and customer experience and (2)
Encouraging the customer to proceed in the customer journey with the company by providing
seamless and intuitive transitions across channels in each touch-point to match customer
preferences, needs, and behavior. Brynjolfsson, Hu, and Rahman (2013) provides seven different
strategies to compete in the omnichannel system and to enrich and deliver customer experience.
Krueger (2015) stipulates a brief report on the omnichannel transition and to understand
consumer behavior. Piotrowicz and Cuthbertson (2014) mentioned another seven different
themes to be studied in the omnichannel system.
To sum up, within the scope of our research, traditional retail can be understood as a
mono-channel physical store-based retail system. Considering traditional retail before the arrival
of online-based retailers in the 90s (Anderson, 2018), traditional brick and mortar stores follows
a company-centric and product-centric approach (Kotler and Armstrong, 2010) to sell the right
products to the customers optimizing three main sectors: What to produce? Where to sell? And,
how to cover a broader market. As there is no specific definition for “traditional retail”, the term
is changeably used with physical store retail with no to a minimal use of technology and
customer preferences.
Similarly, online retail can be understood as a form of electronic commerce which allows
consumers to directly buy goods or services from a seller over the internet using a web browser.
In online retail, consumers find a product of interest by visiting the website of the retailer
directly or by searching among alternative vendors using a shopping search engine, which
displays the same product's availability and pricing at different e-retailers. Customers can shop
online using a range of different computers and devices, including desktop computers, laptops,
tablet computers, and smartphones.
Omnichannel retail refers to the integration of retail channels like stores, online, and
mobile into a single, seamless customer experience. The term started to get popularity after 2011,
when Rigby (2011) presented the future of shopping.
In the current scenario, mono-channel retailers are trying to expand by introducing
different channels into the architecture of their business models to form an omnichannel
experience (Piotrowicz & Cuthbertson, 2014). Omnichannel systems are customer-centric
systems providing the right touch points for the right services (Lemon & Verhoef, 2016).
Wiener, Hoßbach, and Saunders (2018) discuss the different synergies and tensions that
arise when online and offline channels co-exist in an industry although it specifically talks about
those attributes in publishing and retailing industries. As omnichannel approach of retail offers

Retail Customer Experience: A Comparative Study Between Physical, Online, and Omnichannel Retail
Jain, Mora, and Werth
___________________________________________________________________________
______________________________________________________________________________
298
© 2019 (9th) International Conference of the AGMS Proceedings
an efficient integration of all the channels present in the system, we can expect that it aims to
contain the advantages of every individual channel along with providing the customer the option
to switch between channels/touch points and helping them to get over the disadvantages present
in the channel/touch point they switched from.
Analysis
The analysis of the collected literature to compare and synthesize the three different retail
models were done by reading and critically analyzing the core concepts of customer experience
mentioned in each paper. To keep the process structural, a list was made to summarize every
article and different criterions and constraints of customer experience mentioned in the articles
with a brief explanation of how those constraints relate to customer experience. The next step
was to cluster down the different aspects that were found in the literature.
To cluster down the different factors that appeared during the analysis, we used the clusters
used in (Willems, Smolders, Brengman, Luyten, & Schöning, 2017) as the criterions can be
perfectly summed up in these three clusters. In combination of knowledge and dynamics of these
clusters, the Affinity Diagram method was used to further validate the clusters. The results
obtained from the process could easily be translated into the formation of these groups:
1. Product Level
2. Customer Level
3. Retail Level.
Described in (Willems, Smolders, Brengman, Luyten, & Schöning, 2017), these clusters
deviate a little from the original context in this article. Originally these clusters talk about retail
technologies and how they can be deployed on different levels to improve customer experience.
While here we morph the context of these clusters to validate them in the present article. The
identified constraints or criterions in the literature can be clustered in one of these categories.
During the analysis, some constraints were found to be ambiguous due to the relevance of those
factors in more than one aspect. The same factors can be studied in myriad of manners.
Product Level: Groups all the factors that affect the customer experience which runs
along the customer journey or the purchase path of a product. The product or customer journey is
divided into pre, during and post purchase sections in the product life cycle as mentioned by
Vandermerwe (2000).
Customer Level: These include the constraints that are mostly customer dependent which
includes customer attributes, how does a customer interact with the whole retail environment and

Retail Customer Experience: A Comparative Study Between Physical, Online, and Omnichannel Retail
Jain, Mora, and Werth
___________________________________________________________________________
______________________________________________________________________________
299
© 2019 (9th) International Conference of the AGMS Proceedings
how does the individuality and subjective constraints of a customer affect the customer
experience. The subcategories are based on the discussions made in the previous section.
Retail Level: Clusters the general attributes of the retail model and how those
characteristics and strategies affects customer experience. These are mostly the factors that are
driven by retailers that affect the experience of the customer. These also include the attributes of
the retail model which develops because of the theoretical concept around the particular retail
environment.
Based on the discussion made above and in the previous section, the differences between
traditional physical retailing, online retail and omnichannel retail customer experience are
summarized in Table 2.

Retail Customer Experience: A Comparative Study Between Physical, Online, and Omnichannel Retail
Jain, Mora, and Werth
___________________________________________________________________________
______________________________________________________________________________
300
© 2019 (9th) International Conference of the AGMS Proceedings
Table 2: Differences between Physical, Online and Omnichannel Retail.
Cluster Constraints Physical Online Omnichannel
Product Pre
Physical stores,
catalogs and flyers.
Web pages and
social media.
Store and multiple
remote digital
channels.
During
Staff assistance
and
physical
information.
Fulfillment in
physical stores.
Access to physical
attributes.
Recommender
Systems and
digital
information.
Fulfillment by
delivery.
Access to only
digital attributes.
Physical and
online
information.
Fulfillment by
pickup, in-store or
delivery.
Optimal attribute-
oriented product
placement.
Post
Complaint desks.
Feedback Forms.
Physical Returns.
Online and
telephone
customer support.
Data collection
and reviews.
Postal returns.
Multiple
touchpoints to
facilitate support,
feedback and
returns.
Customer Attributes
Part of the product/
retail driven
approach and
hence has minimal
to no role in
shaping the
business.
Characterized by
the need for
efficiency, ease
of use.
Mostly driven by
cost, speed and
quality of service.
Knowledgeable,
Demanding,
Empowered,
Collaborative,
Diverse,
Interactive.
Increasingly on
the move.
Expectations and
perception.
Product-oriented. Service-oriented. Experience-
oriented.
Interaction Single physical Single channel Multiple channels:

Retail Customer Experience: A Comparative Study Between Physical, Online, and Omnichannel Retail
Jain, Mora, and Werth
___________________________________________________________________________
______________________________________________________________________________
301
© 2019 (9th) International Conference of the AGMS Proceedings
channel interaction
based.
interaction:
online.
integrated
interaction.
Technology
acceptance
Doesn’t play a role
in physical retail.
Internet.
TAM
Different
technologies.
Retail Customer
journey
Funnel Funnel Cyclic
Services and
information
consistency
Working hours. 24 hours of
information.
24 hours of
information and
delivery.
Role of physical
facilities
The only touch
point.
Warehousing and
administration.
Transformed to
facilitate research,
pleasure, etc.
Staff
characteristics
Interactive and
decision making.
Facilitates
support.
More technical
and interactive.
Marketing
Physical and social
mouth to mouth.
Social media and
service.
Experience stores,
along with digital
and physical
mediums.
Management
CEO CEO & CIO CEO, CIO and
CDO
Distributions and
supply chain
Warehouse to
shelves.
Warehouse to
customers.
Flexible and
dynamic.
Layout and
infrastructure
Physical
No third parties.
Digital
Third parties
usually for
payment.
Integrated
Multiple third
parties.

Retail Customer Experience: A Comparative Study Between Physical, Online, and Omnichannel Retail
Jain, Mora, and Werth
___________________________________________________________________________
______________________________________________________________________________
302
© 2019 (9th) International Conference of the AGMS Proceedings
Customer
experience value
Hedonic: Store
aesthetics and store
environment.
Utilitarian: Product
value
Hedonic: Web
page interface.
Utilitarian: Fast
and lower-price
oriented service.
Hedonic: Making
the customer
journey enjoyable.
Utilitarian:
Shopping
assistance
Social /
Community
Human physical
interaction.
Online
communities,
social media.
Communities
based on different
touch points.
Description and Discussion
Product Level
The three different retail models differ on the product level extensively. This cluster of
differences is based on the buying behavior stages from (Kalakota & Whinston, 1996), the
customer-activity cycle (Vandermerwe, 2000), and customer delivery value chain as stated by
Kalyanaram and Aung (2015). These also include all the dynamic of the interaction with the
product which is the soul of the retail industry. ‘Pre’ means the information collection before the
actual shopping process. These can include product research, need analysis, and identification.
While ‘During’ means the shopping process in a store or a digital channel which can be
identification, assessing options and payment. ‘Post’ includes the feedback, returns (Griffis, Rao,
Goldsby, & Niranjan, 2012), and reviews. The pre-purchase phase in physical retail is more
towards community (Bustamante & Rubio, 2017) and physical mediums like flyers (Wiener,
Hoßbach, & Saunders, 2018), direct mails, and catalogs. In online retail, digital is the only
medium; thus, information for products are only prompted through digital interfaces (Nambisan
& Watt, 2011), and communication channels like e-mail, cellphones, etc. During purchase, the
physical retail assistance and decision making rely on staff (Healy, Beverland, Oppewal, &
Sands, 2007) and physical information on products. Likewise, online retail uses reviews,
recommender system, and products description. Under the same circumstances, omnichannel
integrates all the channels allowing customers to fulfill their necessities in both channels (in-
store and delivery) and matching them based on preferences such as click and collect. In brick
and mortar, post-purchase is done through physical mediums. Besides, in the online setting, the
post-purchase is done by assistance on phone or online support. In the omnichannel retail system,
there are multiple touchpoints which facilitate customers in terms of support and returns, both in

Retail Customer Experience: A Comparative Study Between Physical, Online, and Omnichannel Retail
Jain, Mora, and Werth
___________________________________________________________________________
______________________________________________________________________________
303
© 2019 (9th) International Conference of the AGMS Proceedings
physical and digital settings. Product fulfilment in physical and online retail is done in stores and
by delivery respectively while as stated above, an omnichannel customer can choose either of
them or other services like click and collect for product fulfilment. Bell, Gallino, and Moreno
(2014) described this relationship of product information and delivery, which also mentions the
difference of data gathered by the customer during the shopping process based on product
attributes i.e., digital channels of retail impose uncertainty about non-digital attributes for the
customer.
Customer Level
Customers perspectives can differ in different retail settings. Customer experience is
studied with varying terminologies by different authors like experience, satisfaction, perceived
value, etc. Different attributes define a consumer in different retail settings. As Carroll and
Guzmán (2013) stated as future of omnichannel systems, due to the presence of a plethora of
information at the fingertips of every user, a progressive customer is more aware. The futuristic
customer is more driven by service quality and experience instead. Perception and expectations
of a customer is an essential part of the ACSI model used to asses customer satisfaction in retail
settings. The traditional ACSI model uses ‘Expectations’, ‘Perceived value’ and ‘Perceived
quality’ where the approach is more product and staff-oriented while in online retail, as
described in the e-CSI model (Hsu, 2008), service quality and trust, plays a major role in
determining the satisfaction. As omnichannel retail concept is centered around customer
experience, the expectations and perceptions of an omnichannel system will surround the
experience factor focusing majorly on the hedonic and holistic value of the service provided by
the retailer. The Interaction between the retail system and the customer which is basically the
channel difference between the retail models is the most explicit difference among others, as
physical retail system uses only single channel, which is the physical medium, while online retail
system uses internet as the only channel. Omnichannel retail system deploys an integrated
customer journey which is characterized by touch points and includes multiple channels of
interaction between the retailer and the customer. Also, technology acceptance has a different
role in the three models in a way that traditional in-store retail involves no use of technology,
hence it cannot affect the customer experience while in online retail, a customer’s perception on
internet and usability of the web pages plays an important role. Technologies are an integral part
of omnichannel retail, hence customer’s perception over those different technologies could affect
over their holistic customer experience.
Retail Level
In the last decades, different retail models have led the retail sector to have different roles
concerning the way they address the business needs. These can vary from enhancing customers
and staff needs to the way they use their infrastructure.

Retail Customer Experience: A Comparative Study Between Physical, Online, and Omnichannel Retail
Jain, Mora, and Werth
___________________________________________________________________________
______________________________________________________________________________
304
© 2019 (9th) International Conference of the AGMS Proceedings
Traditionally, retailers have understood the shopping journey as a linear path, which
followed the classic funnel approach from marketing, this has changed with the arrival of
omnichannel which interprets that buyers “continuously cycle through the stages of the journey,
without ever exiting the evaluation process” (Carroll & Guzmán, 2013). Other than that, physical
stores conventionally had limitations offering services to consumers for more than 8 hours a day
and one of the advantages that online retailers have taken to disrupt the market is offering
shopping services 24 hours a day, allowing their customers to have more flexibility that led even
loyal customers of physical stores to switch, as stated by Enders and Jelassi (2000). Omnichannel
retail also follows the same concept of continuity of information and services. These primary
differences also led managers to adopt different marketing strategies for their businesses.
Marketing in physical retail is more product oriented and as mentioned in pre-purchase section of
the product level cluster, is based on social trend and physical flyers, etc. While online retail
marketing is hugely based on digital mediums like social media (Phil Klaus & Nguyen, 2013)
and service. Omnichannel retail is based on marketing the experience of shopping and providing
the customers with a holistic experience.
In contemplation of management perspectives, physical stores have relied on the
conventional role of the chief executive officer (CEO), to direct the company's strategies. In
online, businesses have had to include the role of the chief informatic officer (CIO) in addition to
the CEO to support the retail goals related to information technology. Taking into consideration
that the CIO needs to evolve having more information technology (IT) capacities, omnichannel
retail needs to integrate a chief digital officer (CDO) in charge of the digital department (Hansen
& Sia, 2015).
Management must also take care of the transitioning role of staff in the hours of customer
service changes depending on the model they follow. In traditional physical stores, employees
tend to be a means of social interaction and support when making decisions related to purchases
(Healy, Beverland, Oppewal, & Sands, 2007), and the staff of the online stores is based on
giving support to the customer. In contrast, the role of omnichannel staff is more technical and is
towards technological assistance (Cook, 2014). The staff also allows customers to experience a
better shopping experience in different channels by providing utilitarian and hedonic support.
In the context of physical facilities, brick and mortar stores are the point where
consumers can go, analyze the available products, interact with staff, make their purchases and
go if they need to return any product, making the store as a single point of contact with
customers. While in online retail, the physical facilities are used as warehousing and operations
center. In omnichannel retail, these facilities are transformed to facilitate research of products
and a center of pleasure for customers, etc. (Juaneda-Ayensa, Mosquera, & Sierra Murillo,
2016). Regarding the use of these facilities for distribution and supply chain frameworks, brick
and mortar stores are more focused to maneuver large volumes of products from warehouses to

Retail Customer Experience: A Comparative Study Between Physical, Online, and Omnichannel Retail
Jain, Mora, and Werth
___________________________________________________________________________
______________________________________________________________________________
305
© 2019 (9th) International Conference of the AGMS Proceedings
the store racks. On the other hand, the online retailer is selling over the web, this demands an
entirely different framework which is capable of delivering consumers' goods to their preferred
locations, as claimed by the authors in (Enders and Jelassi, 2000). More recently, omnichannel
retail has evolved to use the stores as points of distribution too (Cook, 2014).
The physical stores traditionally have been designed for product visibility, which means
the store layout design is product-oriented and stores for economic reasons “typically adopt a
standardized approach to interior layouts and format designs” (Newman & Foxall, 2003). On the
other hand, the design of the website for online retailers is more customer-oriented (Petre,
Minocha, & Roberts, 2006). In omnichannel retail, the design of the channels needs to be
customer experience oriented both in online and physical channels which can be achieved by
strategies like hiring a third-party company to create hedonic or utilitarian value to the customer
journey. Brynjolfsson, Hu, and Rahman (2013) describes that “in some cases, the location-based
applications aren’t managed by the retailers but by third parties. For instance, RedLaser, an eBay
company, allows consumers to scan UPC codes to determine whether specific products are
available nearby and at what price”. Third parties have almost no involvement in traditional
retail, while online retailers can use third parties like PayPal to ease out payments, etc.
Although stores are product-oriented in traditional retail, stores are also a space that can
add hedonic value to the customer experience by stimulating the customer esthetically and
influencing the purchase intentions of the customers positively (Russo Spena, Caridà, Colurcio,
& Melia, 2012). Store environment needs to have pleasing interiors for the customer (Petermans,
Janssens, & Van Cleempoel, 2012). In contrast, online retailers provide hedonic value through
the website interface, focusing and elaborating on the relationships among customer interface
quality and satisfaction (Chang & Chen, 2008). In (Hausman & Siekpe, 2009), the authors
suggested strategies to optimize web design to provide a better experience to customers. In
omnichannel retail, making the customer journey enjoyable is the primary strategy for hedonic
value. Also, as a part of customer experience, utilitarian experience value in physical retail is
affected by products and how customers perceive them during the actual purchase. While online
customer perception is more service-oriented, it offers faster purchasing and lower-price
(Rajamma, Paswan, & Ganesh, 2007). This is due to the deficiency of physical contact with
products and staff, and the time gap between delivery and arrival of the shopping products. This
utilitarian value has been evolved in the recent past to be shopping experience-oriented for the
customer in omnichannel retail.
In (Bustamante & Rubio, 2017), the authors discuss different dimensions of in-store
customer experience and conclude “physical retail service environment offer an extraordinary
opportunity for human interaction” on the grounds that “a variety of customers enjoy themselves
when they socialize with others (shoppers or employees) when they visit the store, essentially
seeking the opportunity to socialize outside the monotony of their everyday lives”, which suggest

Retail Customer Experience: A Comparative Study Between Physical, Online, and Omnichannel Retail
Jain, Mora, and Werth
___________________________________________________________________________
______________________________________________________________________________
306
© 2019 (9th) International Conference of the AGMS Proceedings
that social experience in-stores provides a great significance in determining the psychometrics
properties of satisfaction. The online retailers consider online communities as a medium for the
customer to socialize between each other and interact with the vendor representatives (Nambisan
& Watt, 2011). The online community experience “can play a crucial role in shaping customers'
perceptions regarding the product, the company, as well as the service quality”. Regarding social
media, Phil Klaus and Nguyen (2013) stated that retailers can use it to gain customer insights,
which could help them to provide a better customer experience. Creating the omnichannel
communities, as mentioned by Hansen and Sia (2015) creates new challenges for the retailers
since all the campaigns need to be coordinated in the different channels available based on the
customer experience expectations.
Challenges
The most common consequences of the retail system are described in the ACSI model as
customer loyalty and customer complaints. Customer loyalty has been defined as a ‘‘deeply held
commitment to re-buy or re-patronize a preferred product/service consistently in the future’’
(Oliver, 1999) while a “complaint can be defined as a conflict between the customer and the
organization” (Oliver, 1999). Retailers need to manage these issues and figure out how to
develop trust among users in the business which could be associated with several factors in retail.
As the omnichannel system is surrounded around customer experience, retailers need to
study their customers to provide tailored services. The literature suggests that the concept of
tailored services imposes another problem of personalization vs. privacy. With the introduction
of different privacy laws, retailers need to find a balance between personalization and
compromising the privacy of the user, which could be subjective. These subjective constraints in
retail could be handled by clustering the customers based on different criterions. Though, with all
these advanced strategies and technological development, it imposes another problem of a raised
customer expectation. An omnichannel customer starting the purchase journey with a lot of
expectations could be affected at his satisfaction level.
The literature points out several factors that affect customer experience: Physical
environment, social, cognitive, emotional, etc. These factors could contain a lot of complexity
which retailers need to tackle by optimizing these aspects of customer experience to sustain their
businesses. The differences pointed out in the above section could be interpreted as challenges
which needs to be strategized, for example transitioning the role of physical facilities/space,
administration strategies, staff characteristics, etc. needs to be transformed to form a relevant
omnichannel business. Implementation of technologies has proved to be beneficial in businesses,
though deployment and assessing the acceptance of them can pose as a big challenge for retail
managers as the deployment should be optimal in terms of finances and value to contribute to
businesses. The differences can be interpreted as the theoretical explanation of what retailers can
aim for in terms of results of strategies, and work on each of them to have a perfect omnichannel

Retail Customer Experience: A Comparative Study Between Physical, Online, and Omnichannel Retail
Jain, Mora, and Werth
___________________________________________________________________________
______________________________________________________________________________
307
© 2019 (9th) International Conference of the AGMS Proceedings
system. Omnichannel retail promises a seamlessly integrated customer experience, and this
integration is both of a challenge, and a blessing to business owners as proper execution of these
strategies to convert into an omnichannel environment can lead businesses to profit higher.
.
Conclusions and Future Work
In the article, three different retail models that are based in different eras of history have
been studied in the context of customer experience. It was established between the review that
the modern era of retail is centered around customer experience, and it is an essential part of the
retail transition. The findings in the article answers the proposed research question: “How can
omnichannel retail be differentiated from mono channel-based retail models: online retail and
traditional physical retail in the context of customer experience?” by presenting a definitive and
explicit comparison between the retail models in terms of how the constraints work in context to
customer experience. As stated in the literature section, there have been a lot of authors
publishing about customer experience and different models and terminologies have been used to
define various aspects of customer experience. Omnichannel retail is the buzzword in current
times and most anticipated future of the retail sector. The literature suggests that there is a
plethora of challenges in front of retailers to understand the dynamics of the transition that is
happening before them. In the article, we tried to solve the problem by explicitly pointing out the
differences between traditional physical retailing, online retailing and omnichannel retailing. The
differences can be studied in the form of 3 clusters: Product level, Customer level, and Retail
level. Each cluster deals with a different set of constraints that are attached to customer
experience. Sometimes these constraints can be ambiguous as physical and omnichannel being
on the extreme ends of the retail timeline cannot be directly compared in some ways. The
differences pointed out in the article extends the contemporary literature and facilities the
understanding of the different dynamics to asses retail sector. This understanding and differences
can facilitate retail managers to understand better the steps they need to take to move to
omnichannel retail.
In the article, the impact of retail transition was briefly discussed as consequences and
challenges of the model. Taking into account this literature, retail managers can save their
businesses from a fall back in the age of change by keeping up with the trends in the sector and
bending their ways to create efficient firms. Though the article discusses only the factors which
contribute to customer experience, which could fall as a limitation of this research. Some aspects
like marketing and operations, can be addressed further, which we propose as a part of the future
research agenda. Also, the study of other factors than customer experience like business models
(value creation, value architecture, value finance, value network) can be done to extend the
literature further. The constraints discussed in the paper can also be studied further for more
descriptive and deep explanations. Technology implementation and providing a seamless

Retail Customer Experience: A Comparative Study Between Physical, Online, and Omnichannel Retail
Jain, Mora, and Werth
___________________________________________________________________________
______________________________________________________________________________
308
© 2019 (9th) International Conference of the AGMS Proceedings
experience to customers is the goal of retailers, and we motivate researchers to contribute both
research and development in the field to take the sector forward as a whole.

Retail Customer Experience: A Comparative Study Between Physical, Online, and Omnichannel Retail
Jain, Mora, and Werth
___________________________________________________________________________
______________________________________________________________________________
309
© 2019 (9th) International Conference of the AGMS Proceedings
References
Anderson, S. (2018). The amazon grows in Seattle. URBAN JOURNAL, 6.
Andreu, L., Bigné, E., Chumpitaz, R., & Swaen, V. (2006). How does the perceived retail
environment influence consumers’ emotional experience? evidence from two retail settings.
Int. Rev. of Retail, Distribution and Consumer Research, 16 (5), 559–578.
Applebaum, W. (1951). Studying customer behavior in retail stores. Journal of marketing, 16(2),
172–178.
Bagdare, S. & Jain, R. (2013). Measuring retail customer experience. International Journal
of Retail & Distribution Management, 41(10), 790–804.
Bell, D. R., Gallino, S., & Moreno, A. (2014). How to win in an omnichannel world. MIT Sloan
Management Review, 56(1), 45.
Benhamza Nsairi, Z. (2012). Managing browsing experience in retail stores through
perceived value: implications for retailers. International Journal of Retail &
Distribution Management, 40(9), 676–698.
Bennett, D. & El Azhari, J. (2015). Omni-channel customer experience: an investigation into
the use of digital technology in physical stores and its impact on the consumer’s
decision-making process.
Berman, B. (2019). Flatlined: combatting the death of retail stores. Business Horizons, 62(1),
75–82.
Bilgihan, A. (2016). Gen y customer loyalty in online shopping: an integrated model of trust,
user experience and branding. Computers in Human Behavior, 61, 103–113.
Bodhani, A. (2012). Shops offer the e-tail experience. Engineering & Technology, 7(5), 46–49.
Brynjolfsson, E., Hu, Y. J., & Rahman, M. S. (2013). Competing in the age of
omnichannel retailing. MIT.
Burke, R. R. (2002). Technology and the customer interface: what consumers want in the
physical and virtual store. Journal of the academy of Marketing Science, 30(4), 411–
432. Bustamante, J. C. & Rubio, N. (2017). Measuring customer experience in physical
retail environments. Journal of Service Management, 28(5), 884–913.
Retail Customer Experience: A Comparative Study Between Physical, Online, and Omnichannel Retail
Jain, Mora, and Werth
___________________________________________________________________________
______________________________________________________________________________
310
© 2019 (9th) International Conference of the AGMS Proceedings
Carroll, D. & Guzmán, I. (2013). The new omni-channel approach to serving customers.
Accenture. com.
Çelik, H. (2011). Influence of social norms, perceived playfulness and online shopping anxiety
on customers’ adoption of online retail shopping: an empirical study in the turkish
context. International Journal of Retail & Distribution Management, 39(6), 390–413.
Chang, H. H. & Chen, S. W. (2008). The impact of customer interface quality, satisfaction and
switching costs on e-loyalty: internet experience as a moderator. Computers in Human
Behavior, 24(6), 2927–2944.
Chen, S.-J. & Chang, T.-Z. (2003). A descriptive model of online shopping process: some
empirical results. International Journal of Service Industry Management, 14(5),
556–569.
Cook, G. (2014). Customer experience in the omni-channel world and the challenges and
opportunities this presents. Journal of Direct, Data and Digital Marketing Practice,
15(4), 262–266.
Enders, A. & Jelassi, T. (2000). The converging business models of internet and bricks-
and-mortar retailers. European Management Journal, 18(5), 542–550.
Frazer, M. & Stiehler, B. E. (2014). Omnichannel retailing: the merging of the online and off-
line environment. In Global conference on business & finance proceedings (Vol. 9, 1,
p. 655). Institute for Business & Finance Research.
Garlin, F. V. & Owen, K. (2006). Setting the tone with the tune: a meta-analytic review of the
effects of background music in retail settings. Journal of Business Research, 59(6), 755–
764.
Gilmore, J. H. & Pine, B. J. (2002). Customer experience places: the new offering frontier.
Strategy & Leadership,30 (4), 4–11.
Greenhalgh, T. & Peacock, R. (2005). Effectiveness and efficiency of search methods in
systematic reviews of complex evidence: audit of primary sources. Bmj, 331(7524),
1064–1065.
Grewal, D., Levy, M., & Kumar, V. (2009). Customer experience management in
retailing: an organizing framework. Journal of retailing, 85(1), 1–14.

Retail Customer Experience: A Comparative Study Between Physical, Online, and Omnichannel Retail
Jain, Mora, and Werth
___________________________________________________________________________
______________________________________________________________________________
311
© 2019 (9th) International Conference of the AGMS Proceedings
Griffis, S. E., Rao, S., Goldsby, T. J., & Niranjan, T. T. (2012). The customer
consequences of returns in online retailing: an empirical analysis. Journal of
Operations Management, 30(4), 282–294.
Hansen, R. & Sia, S. K. (2015). Hummel’s digital transformation toward omnichannel retailing:
key lessons learned. MIS Quarterly Executive, 14(2).
Hausman, A. V. & Siekpe, J. S. (2009). The effect of web interface features on consumer online
purchase intentions. Journal of Business Research, 62(1), 5–13.
Healy, M. J., Beverland, M. B., Oppewal, H., & Sands, S. (2007). Understanding retail
experiences-the case for ethnography. International Journal of Market Research, 49(6),
751–778.
Herington, C. & Weaven, S. (2007). Can banks improve customer relationships with high
quality online services? Managing Service Quality: An International Journal, 17(4),
404–427.
Hernández, B., Jiménez, J., & Martın, M. J. (2010). Customer behavior in electronic
commerce: the moderating effect of e-purchasing experience. Journal of business
research, 63(9-10), 964–971.
Hsu, S.-H. (2008). Developing an index for online customer satisfaction: adaptation of american
customer satisfaction index. Expert systems with Applications, 34(4), 3033–3042.
Insley, V. & Nunan, D. (2014). Gamification and the online retail experience. International
Journal of Retail & Distribution Management, 42(5), 340–351.
Janda, S., Trocchia, P. J., & Gwinner, K. P. (2002). Consumer perceptions of internet retail
service quality. International Journal of Service Industry Management, 13(5), 412–
431.
Jayawardhena, C., Tiu Wright, L., & Dennis, C. (2007). Consumers online: intentions, orientations
and segmentation. International Journal of Retail & Distribution Management, 35(6),
515–526.
Juaneda-Ayensa, E., Mosquera, A., & Sierra Murillo, Y. (2016). Omnichannel customer
behavior: key drivers of technology acceptance and use and their effects on purchase
intention. Frontiers in psychology, 7, 1117.
Retail Customer Experience: A Comparative Study Between Physical, Online, and Omnichannel Retail
Jain, Mora, and Werth
___________________________________________________________________________
______________________________________________________________________________
312
© 2019 (9th) International Conference of the AGMS Proceedings
Kalakota, R. & Whinston, A. B. (1996). Frontiers of electronic commerce. Addison-Wesley
Reading, MA.
Kalyanaram, G. & Aung, Z. Z. (2015). Value-added ecosystem and customer experience
enhancement framework. Kindai Management Review, 3, 49–62.
Kim, H.-R. (2005). Developing an index of online customer satisfaction. Journal of
financial services marketing, 10(1), 49–64.
Klaus, P. [Phil] & Nguyen, B. (2013). Exploring the role of the online customer experience
in firms’ multi-channel strategy: an empirical analysis of the retail banking services
sector. Journal of Strategic Marketing, 21(5), 429–442.
Klaus, P. [Philipp]. (2013). The case of amazon. com: towards a conceptual framework of online
customer service experience (ocse) using the emerging consensus technique (ect).
Journal of Services Marketing, 27(6), 443–457.
Kotler, P. & Armstrong, G. (2010). Principles of marketing. Pearson education. Krueger,
J. (2015). Omni-channel shoppers: an emerging retail reality. Think with Google,
Accessed, 6, 2016.
Lazaris, C. & Vrechopoulos, A. (2014). From multi-channel to “omnichannel” retailing: review of
the literature and calls for research. In 2nd international conference on contemporary
marketing issues, (iccmi) (pp. 18–20).
Lemon, K. N. & Verhoef, P. C. (2016). Understanding customer experience throughout the
customer journey. Journal of marketing, 80(6), 69–96.
Limited, D. T. T. (2018). Global powers of retailing 2018. Retrieved February 20, 2019, from
https://www2.deloitte.com/content/dam/Deloitte/at/Documents/about-deloitte/global-
powers-of-retailing-2018.pdf
Liu, X., He, M., Gao, F., & Xie, P. (2008). An empirical study of online shopping
customer satisfaction in china: a holistic perspective. International Journal of
Retail & Distribution Management, 36(11), 919–940.
Martin, J., Mortimer, G., & Andrews, L. (2015). Re-examining online customer experience to
include purchase frequency and perceived risk. Journal of retailing and consumer
services, 25, 81–95.

Retail Customer Experience: A Comparative Study Between Physical, Online, and Omnichannel Retail
Jain, Mora, and Werth
___________________________________________________________________________
______________________________________________________________________________
313
© 2019 (9th) International Conference of the AGMS Proceedings
Melià-Seguı, J., Pous, R., Carreras, A., Morenza-Cinos, M., Parada, R., Liaghat, Z., & De
Porrata-Doria, R. (2013). Enhancing the shopping experience through rfid in an actual
retail store. In Proceedings of the 2013 acm conference on pervasive and ubiquitous
computing adjunct publication (pp. 1029–1036). ACM.
Mirsch, T., Lehrer, C., & Jung, R. (2016). Channel integration towards omnichannel management:
a literature review.
Morgan-Thomas, A. & Veloutsou, C. (2013). Beyond technology acceptance: brand
relationships and online brand experience. Journal of Business Research, 66(1), 21–27.
Morrison, M., Gan, S., Dubelaar, C., & Oppewal, H. (2011). In-store music and aroma
influences on shopper behavior and satisfaction. Journal of Business Research, 64(6),
558–564.
Nambisan, P. & Watt, J. H. (2011). Managing customer experiences in online product
communities. Journal of Business Research, 64(8), 889–895.
Newman, A. J. & Foxall, G. R. (2003). In-store customer behaviour in the fashion sector:
some emerging methodological and theoretical directions. International Journal of
Retail & Distribution Management, 31(11), 591–600.
Novak, T. P., Hoffman, D. L., & Yung, Y.-F. (2000). Measuring the customer experience in
online environments: a structural modeling approach. Marketing science, 19(1), 22–42.
Nusair, K. & Kandampully, J. (2008). The antecedents of customer satisfaction with online
travel services: a conceptual model. European Business Review, 20(1), 4–19.
O. Pappas, I., G. Pateli, A., N. Giannakos, M., & Chrissikopoulos, V. (2014). Moderating
effects of online shopping experience on customer satisfaction and repurchase
intentions. International Journal of Retail & Distribution Management, 42(3), 187–
204.
Ofir, C. & Simonson, I. (2007). The effect of stating expectations on customer
satisfaction and shopping experience. Journal of Marketing Research, 44(1), 164–
174.
Parise, S., Guinan, P. J., & Kafka, R. (2016). Solving the crisis of immediacy: how digital
technology can transform the customer experience. Business Horizons, 59(4), 411–
420.

Retail Customer Experience: A Comparative Study Between Physical, Online, and Omnichannel Retail
Jain, Mora, and Werth
___________________________________________________________________________
______________________________________________________________________________
314
© 2019 (9th) International Conference of the AGMS Proceedings
Peltola, S., Vainio, H., & Nieminen, M. (2015). Key factors in developing omnichannel
customer experience with finnish retailers. In International conference on hci in
business (pp. 335–346). Springer.
Pentina, I., Amialchuk, A., & Taylor, D. G. (2011). Exploring effects of online shopping
experiences on browser satisfaction and e-tail performance. International Journal of
Retail & Distribution Management, 39(10), 742–758.
Petermans, A., Janssens, W., & Van Cleempoel, K. (2012). A holistic framework of
customer experiences in retail stores: studying designers’, retailers’ and consumers’
viewpoints.
Petre, M., Minocha, S., & Roberts, D. (2006). Usability beyond the website: an empirically-
grounded e-commerce evaluation instrument for the total customer experience.
Behaviour & Information Technology, 25(2), 189–203.
Picot-Coupey, K., Huré, E., & Piveteau, L. (2016). Channel design to enrich customers’
shopping experiences: synchronizing clicks with bricks in an omni-channel perspective–
the direct optic case. International Journal of Retail & Distribution Management, 44(3),
336–368.
Piotrowicz, W. & Cuthbertson, R. (2014). Introduction to the special issue information
technology in retail: toward omnichannel retailing. International Journal of Electronic
Commerce, 18(4), 5–16.
Rajamma, R. K., Paswan, A. K., & Ganesh, G. (2007). Services purchased at brick and mortar
versus online stores, and shopping motivation. Journal of Services Marketing, 21(3),
200–212.
Rapp, A., Baker, T. L., Bachrach, D. G., Ogilvie, J., & Beitelspacher, L. S. (2015).
Perceived customer showrooming behavior and the effect on retail salesperson self-
efficacy and performance. Journal of Retailing, 91(2), 358–369.
Ravasi, D. & Stigliani, I. (2012). Product design: a review and research agenda for management
studies. International Journal of Management Reviews, 14(4), 464–488.
Richardson, A. (2010). Using customer journey maps to improve customer experience. Harvard
Business Review, 15(1), 2–5.
Rigby, D. (2011). The future of shopping. Harvard business review, 89(12), 65–76.

Retail Customer Experience: A Comparative Study Between Physical, Online, and Omnichannel Retail
Jain, Mora, and Werth
___________________________________________________________________________
______________________________________________________________________________
315
© 2019 (9th) International Conference of the AGMS Proceedings
Rose, S., Clark, M., Samouel, P., & Hair, N. (2012). Online customer experience in e-retailing:
an empirical model of antecedents and outcomes. Journal of Retailing, 88(2), 308–322.
Rose, S., Hair, N., & Clark, M. (2011). Online customer experience: a review of the
business-to-consumer online purchase context. International Journal of
Management Reviews, 13(1), 24–39.
Rowley, J. (2009). Online branding strategies of UK fashion retailers. Internet Research, 19 (3),
348–369.
Russo Spena, T., Caridà, A., Colurcio, M., & Melia, M. (2012). Store experience and co-
creation: the case of temporary shop. International Journal of Retail & Distribution
Management, 40(1), 21–40.
Sachdeva, I. & Goel, S. (2015). Retail store environment and customer experience: a paradigm.
Journal of Fashion Marketing and Management, 19(3), 290–298.
Schoenbachler, D. D. & Gordon, G. L. (2002). Multi-channel shopping: understanding what
drives channel choice. Journal of consumer marketing, 19(1), 42–53.
Sherman, E., Mathur, A., & Smith, R. B. (1997). Store environment and consumer purchase
behavior: mediating role of consumer emotions. Psychology & Marketing, 14(4), 361–378.
Sopadjieva, E., Dholakia, U., & Benjamin, B. (2017). A study of 46,000 shoppers shows that
omnichannel retailing works. Harvard Business Review, 3, 1–2.
Statista, I. (2019). Total retail sales worldwide from 2015 to 2020 (in trillion u.s. dollars).
Retrieved February 20, 2019, from https://www.statista.com/statistics/443522/global-
retail-sales/
Thomas, S. (2013). Linking customer loyalty to customer satisfaction and store image: a structural
model for retail stores. Decision, 40(1-2), 15–25.
Trevinal, A. M. & Stenger, T. (2014). Toward a conceptualization of the online shopping
experience. Journal of Retailing and Consumer Services, 21(3), 314–326.
Vandermerwe, S. (2000). How Increasing Value to Customers Improves Business results.
Sloan Management Review, 42 (1), 27-37.
Verhoef, P. C., Kannan, P. K., & Inman, J. J. (2015). From multi-channel retailing to omni-
Retail Customer Experience: A Comparative Study Between Physical, Online, and Omnichannel Retail
Jain, Mora, and Werth
___________________________________________________________________________
______________________________________________________________________________
316
© 2019 (9th) International Conference of the AGMS Proceedings
channel retailing: introduction to the special issue on multi-channel retailing. Journal of
retailing, 91 (2), 174–181.
Von Briel, F. (2018). The future of omnichannel retail: a four-stage delphi study. Technological
Forecasting and Social Change, 132, 217–229.
Wall, E. A. & Berry, L. L. (2007). The combined effects of the physical environment and
employee behavior on customer perception of restaurant service quality. Cornell hotel
and restaurant administration quarterly, 48 (1), 59–69.
Wang, L. C. & Hsiao, D. F. (2012). Antecedents of flow in retail store shopping. Journal of
retailing and consumer services, 19(4), 381–389.
Wiener, M., Hoßbach, N., & Saunders, C. (2018). Omnichannel businesses in the publishing and
retailing industries: synergies and tensions between coexisting online and offline business
models. Decision Support Systems, 109, 15–26.
Willems, K., Smolders, A., Brengman, M., Luyten, K., & Schöning, J. (2017). The path-to-
purchase is paved with digital opportunities: an inventory of shopper-oriented retail
technologies. Technological Forecasting and Social Change, 124, 228–242.
Xin Ding, D., Hu, P. J.-H., Verma, R., & Wardell, D. G. (2010). The impact of service system
design and flow experience on customer satisfaction in online financial services. Journal
of Service Research, 13(1), 96–110.
Shubham Jain
Early Stage Researcher in project PERFORM with the research title “Using Mixed Reality for
Enhanced Product Experience”.
AWS-Institut für digitale Produkte und Prozesse
Daniel Mora
Early Stage Researcher in project PERFORM with the research title “Recommender Systems for
a Connected Customer Journey”.
AWS-Institut für digitale Produkte und Prozesse
Dr. Dirk Werth
Managing and Scientific director,
AWS-Institut für digitale Produkte und Prozesse


Notes

Association of Global Management Studies
11807 Clifton Lane
Fredericksburg, Virginia 22408 USA