Conference Proceedings 2016
206
-
Upload
khangminh22 -
Category
Documents
-
view
4 -
download
0
Transcript of Conference Proceedings 2016


1 | P a g e
Background
Today’s world has created new environment and opportunities setting new expectations, competition and challenges. Organizations and markets are in transition towards digital, smart and network age. Emerging trends and practices have established higher standards creating new benchmarks. The organizations have to innovate and adopt new business management practices to survive and grow in the highly competitive and dynamic markets marked with uncertainties, risks and highly demanding customers. And we thought at DSIMS to serve to this need for research guiding new practices. So, we kept the theme on Emerging Management Practices”.
The “Remsons International Research Conference” aims to decode the developments in emerging business world and humbly contribute to the creation and dissemination of new knowledge through research. It endeavours to dive into exemplary research insights that point at a new direction. Participants gain new perspectives from concrete facts that they might include in their strategies and their own practices as they prepare for the future. There were this year multiple tracks such as Human Resource Management, Marketing, Finance, International Business, General Management, Information Technology and Operations Management to enable academicians, researchers and practicing managers to share their research findings, issues, concerns, doubts and perspectives for the future vis-à-vis specific domains of knowledge and practice.
In the third year of organising the international research conference, we are really thrilled and grateful for the research contribution that we receive with the increasing standards of quality each year. The conference was held on 6th February, 2016 at DSIMS campus, Mumbai. The conference was inaugurated by chief guest, Dr. G Vishwanathan – Founder & Chancellor of VIT University, Vellore. The Guest of honour, Dr. N. Jayasankaran is the Director General of the Bharathidasan Institute of Management - BIM, Trichy and the former Vice Chancellor of Kanchi University. He is a prominent Academician & a renowned Educationist and Researcher. The august international gathering of eminent researchers, academicians, practitioners and regulators in the conference had lively discussions and thought provoking presentations over sharing of diverse spectrum of viewpoints. Through collective wisdom of learned speakers and research paper presentations the conference provided an opportunity to learn and develop a new view of business practices. Research papers presented at the conference have been selected by subject experts through blind review process and being included in this book of proceedings. The book is a compendium of research papers presenting outcome of research on topical issues of management.
Chief Convenor Convenor Dr. Sharad Kumar
Prof. Nehal Joshipura

2 | P a g e
Flow of Events at the conference
The conference was inaugurated by chief guest, Dr. G Vishwanathan – Founder & Chancellor of VIT University, Vellore. Dr. GV’s passion for societal development and compassion for the underprivileged have resulted in the introduction of several schemes for uplifting the women and unemployed youth in the region to help them become self-reliant. He offers scholarships to students from disadvantaged sections of the society to enable them to pursue higher studies. He has adopted several villages in an effort to improve the quality of lives of the rural people.
Dr. Vishwanathan emphasised the need for revamping of management education and provided the direction for the future of management education. He shared his experiences at Harvard business school. He mentioned the US Government role in universities is limited to recognize the accreditation agencies only. While in India, we have government controlling how universities should operate. He mentioned that wherever there is over-control, there is corruption. He also talked about the balance of teaching hours spent at the school or college for a student. He cited the extreme examples of North Korea and Finland. In North Korea, students used to spend more than 10 hours a day at the school and government had to say that classes beyond 10pm will not be allowed. Whereas in Finland, number of days and hours a day are both quite less, but good amount of homework is given to the students.
The Guest of honour, Dr. N. Jayasankaran is the Director General of the Bharathidasan Institute of Management - BIM, Trichy and the former Vice Chancellor of Kanchi University. Dr. Jayasankaran is a prominent Academician & a renowned Educationist and Researcher. He is also President Nominee for Pondicherry University, Member, UGC Panel, Advisor and Professor Emeritus to NMIMS University, Mumbai and Advisor to Symbiosis University, Pune. He had drawn the real picture of management education in India and highlighted the areas of immediate attention to prepare the students to enhance their employability. The President of RSET and the Chairman of DSIMS, Mr. Ashok Saraf, highlighted the vision of RSET and the efforts being made by the RSET to establish a Private University. Dr Nandkishore Kondap, Director General, RSET highlighted the importance of Management Research and shared his vision on the management research to support the corporates and industry to resolve practical problems faced by them through management research and consultancy.
The guest of honour address was followed by technical sessions of research paper presentations. The 3 technical sessions were moderated by Dr. Srini Srinivasan, Dr. Smita Shukla, and Dr. Ashish Pandey.
Dr.Srini Srinivasan is currently an associate professor in the area of Strategic Management and Retail Marketing at Jamnalal Bajaj Institute of Management Studies (JBIMS), Department of Management Studies, Mumbai University is an acclaimed researcher and a member on the Advisory Board of Journal of Business Retail and Marketing Business Management (JBRMR), Journal of Development Research (JDR). He is editor in chief of Journal

3 | P a g e
of Indian Retail (JIR) and also authored three text books namely Mall Management, Strategic Retail Management and Cases in Retail Management. He is consulted by many organisations in the area of strategic Marketing and retail strategies. Dr. Srini had moderated the session by giving feedback to the presenters for further enhancement of work to improve the value of their research.
Dr. Smita Shukla is professor and Director In-Charge at Alkesh Dinesh Mody Institute for Financial and Management Studies, University of Mumbai. In past, she has worked with Jamnalal Bajaj Institute of Management Studies, University of Mumbai. Dr. Shukla holds masters in Economics as well as Business Management (Finance). She was awarded University Gold Medal for academic excellence in her management program. She has done her Ph.D. in management in area of Private Equity. She has also acquired certification in Commodities Market (NCFM), Derivatives (NCFM), As a moderator, she has offered very constructive suggestions to the presenters for further research.
Dr. Ashish is a faculty member at Shailesh J. Mehta School of Management, IIT Bombay in the area of Human Resources Management and Organizational Development. He had obtained his Fellow (Ph.D.) from MDI, Gurgaon. His doctoral research work was on “Spiritual Climate and its Impact on Culture”. He has extensive experience of Industry, Research and Consultancy and received prestigious awards from Infosys Leadership Institute, Mysore, Indian Institute of Science, Bangalore and Indian Institute of Management, Indore. As a moderator, he analysed the work of researchers and offered very useful suggestions.
Research papers were presented in various areas including strategy, human resource management, finance and marketing covering various emerging dimensions of business management. Papers were presented by industry and academic participants both. Participants and attendees included people from various parts of India and one paper was received from an eminent academician from Mexico.

4 | P a g e
Track Schedule
Track 1 A Time: 11:30 am to 1:30
pm Room No. 624
Session Chair
Prof. (Dr) Srini R Srinivasan Jamanalal Bajaj Institute of Management Studies
Sr. Track Time Reference code
AREA Title
1 1A 11:30 RIRC52 HR How Not to Be An Alien: Moulding Global Human Resource through Cultural Sensitisation
2 1A 11:50 RIRC53 GM Growth Strategies : GRUPO POSADAS
3 1A 12:00 RIRC66 HR An Investigation of Turnover Intentions of Sales Employees: Evidences from India
4 1A 12:25 RIRC68 HR Employees’ Cost and Productivity – A Comparative Study of Traditional and Modern Banks in India During 1997 to 2015
5 1A 12:50 RIRC69 GM Economic Regulation of Airports in India: Toward Structural Adjustment in Till Model
6 1A 13:10 RIRC65 HR Emerging Management Practices- TALENT MANAGEMENT

5 | P a g e
Track 1 B Time: 11:30 am to 1:30 pm Room No. 623
Session Chair
Prof. (Dr) Smita Shukla Alkesh Dinesh Mody Institute for Financial and Management Studies
1 1B 11:30 RIRC58 M Internet Marketing– The Way Ahead! 2 1B 12:10 RIRC67 F Review of Literature of Asset Pricing Models
3 1B 12:30 RIRC56 M Social And Legal Implications Of Advertising In India
4 1B 12:50 RIRC62 OP Humanitarian Logistics: an Indian Perspective
5 1B 13:10 RIRC63 OP Role Of Supply Chain Management in SME Sector
6 1B 13:30 RIRC64 HR Employee engagement practices at Yes Bank

6 | P a g e
Track 2 Time: 2:15 am to 4:15 pm Room No. 624
Session Chair
Prof. Ashish Pandey Shailesh J Mehta IIT Mumbai
Sr. Track Time Reference
code AREA Title
1 2 2:15 RIRC54 F An analytical review of the portfolio construction by large diversified equity funds in the context of Markowitz portfolio theory
2 2 2:30 RIRC60 F Impact of M&A announcement – Trading strategies in short run of both Acquirer and Target companies
3 2 2:45 RIRC61 F A literature review on disposition effect and tendency to sell winners and hold on to losers
4 2 3:00 RIRC59 F Co-Integration of Indian Stock with Us Stock Market
5 2 3:15 RIRC55 F Innovative Banking Regulations : BASEL-III

7 | P a g e
LIST OF PAPERS
Sr No
Title Author Affiliation
1 Economic Regulation of Airports in India: Toward Structural Adjustment in Till Model
Dr. Sumana Chaudhuri
DSIMS
2 Growth Strategies: GRUPO POSADAS Dr. José G. Vargas-Hernández
University of Guadalajara
3 An Analytical Review of the Portfolio Construction by Large Diversified Equity Funds in the Context of Markowitz Portfolio Theory
Dr. Akshay Damani, Dr. Nandip Vaidya
NMIMS University, NMIMS University
4 Innovative Banking Regulations: BASEL-III Siddharth Shukla Pandit Deendayal Petroleum University, Gandhinagar
5 Impact of Corporate Announcement (Merger & Acquisition) on Stock Returns, Volatility and Liquidity: an Empirical Study
Vivek Gupta AVP - Citibank (Financial Planning and Analysis)
6 Co-Integration of Indian Stock with US Stock Market
Dr. Abhay Kumar NMIMS University
7 A Literature Review on Disposition Effect and Tendency to Sell Winners and Hold onto Losers
Madhumita Ghosh NMIMS University
8 An Investigation of Turnover Intentions of Sales Employees: Evidences from India
Sarika Jain, Dr. Shreekumar K. Nair
DSIMS, NITIE
9 Role of Supply Chain Management in SME Pooja Somani, Amal Shankar Roy
L&T Infotech Ltd, DSIMS
10 Social and Legal Implications of Television Advertising in India
Dr. Tejal Jani, Sardar Himani H
GLS (J P Shah) IBA, GLS (J P Shah) IBA
11 Internet Marketing – The Way Ahead Rohit Pawar MET Institute of Management
12 Humanitarian Logistics: an Indian Perspective Arti Chandavarkar, Amal Shankar Roy
Mahindra Logistics Limited, DSIMS
13 Employee engagement practices at Yes Bank Dr. Sangeeta Jain, Priyadarshini Nidhan
Institute of Management Studies, Indore, Lala Lajpat Rai Institute of Management Studies
14 Emerging Management Practices- Talent Management
Shagun Barabde, Vijayan Pankajakshan
Welingkar Institute of Management, Welingkar Institute of Management
15 How Not to Be an Alien: Moulding Global Human Resource through Cultural Sensitisation
Dr. Preeti Shirodkar MET Institute of Management

8 | P a g e
Economic Regulation of Airports in India: Toward Structural Adjustment in Till Model
Dr Sumana Chaudhuri
This article assesses the economic regulation of airports, with focus on emerging models of Public Private Partnership (PPP) Airports in India. Newly privatized airports in India can have persistent market power in providing aeronautical services. Due to the concern that these entities can take advantage of this market power and increase user charges to maximize returns, necessitated the formation of Airports Economic Regulatory Authority of India (AERA) to exercise price regulation of Indian Airports. All forms of airport pricing are regulated by AERA to minimize welfare losses. The article examines the optimal economic regulation of PPP airports in India that can result in a higher social welfare through cross subsidization of enhanced non – aeronautical revenues, thus re–balancing the till model in favour of the air passengers.
Keywords: Economic Regulation, Non – Aeronautical Revenue, AERA, Public Private Partnership, Till Model
1. Introduction
The conventional wisdom regarding economic regulation is replete with the thought is that it is an imperfect instrument at the perusal of the airport regulators to replicate the macroeconomic environment of a perfectly competitive airport market structure. There has been often a need felt to encourage airport competition to reduce the regulatory oversight. However, in certain circumstances, it is often desirable to have economic regulation of airports, particularly, when competition cannot work effectively to make economic regulation superfluous. Introducing airport regulation then becomes economically legitimate, particularly if there is an apprehension of market failure resulting in allocative inefficiency, inadequate cost control or bad investment decisions (Kupfer , Meersman, Pauwels, Struyf, Voorde, Vanelslander, 2013). Lypczynski et al. (2009) assert that government regulates ‘‘particularly in cases where average costs tend to fall over the entire range of industry output; in other words, when the industry operates under cost conditions that give rise to a natural monopoly’’. In practice, economic regulation is introduced to make an industry more cost efficient and to increase output to a level that promotes economic prosperity. Economic regulation should be
1

9 | P a g e
designed in such a manner that the regulated firm is able to produce a socially optimal level of output. Regulation should also be contextual, in a sense that it should reflect the broad macroeconomic rubric of the nation. Starkie (2002) puts it as follows: ‘‘It is only when the market does not work well, when there is a clear case of natural monopoly and when regulation can reasonably be expected to improve matters that the regulatory option is worthwhile. Market imperfections alone are not a sufficient justification for intervention’’.
This article takes the perspective of economic regulation in the airport industry in general with a focus on changed management paradigms in Public Private Partnership Airports in India. The purpose is to investigate which type of economic regulation is most appropriate for Indian Airports, taking into account the concepts of natural monopoly and market power.
2. Literature Review
In the aviation industry, airports and airlines must jointly perform to achieve synergies in operational effectiveness, cost and revenue structures. The central tenet of airport economics concerns airport competition. While airports used to be considered as something akin to natural monopolies, this is no longer the case. Airports in the contemporary times compete for both passengers and airlines, which are now more spoilt for choices than in the past. The fact that airports have become more commercially focused reiterates that airports have now become far more competitive in the changing dynamic equilibrium.
The growing air travel both for business and business and leisure warrants that multi-billion dollar airport infrastructure investment are needed globally to accommodate growth of the industry, and ensure the social and economic benefits that airport infrastructure brings to the regional and national economy. Airport investments are always in large quantum accompanied with long gestation periods. Investors and airport operators have to look forward to an optimized business model to manage and gain from airport investment portfolios by judiciously leveraging on the aeronautical and non - aeronautical revenues.
According to Forsyth (2008), the objective of economic regulation is “to give the firm an incentive to maximize profit but to constrain its use of market power in a way that did not weaken, to any great extent, its incentive to minimize costs.”
In general, economic regulation promotes economic efficiency. This is achieved by providing aeronautical services at the least cost and at the quality level which have both affordability and users willingness to pay. It ensures efficient levels of investment and cost reflective price structures that enable cost

10 | P a g e
recovery at minimum deadweight loss. Economic regulation of airports encourages airline-airport alliance, builds healthy competition leading to hub formation and promotes non-aeronautical services that complement the existing airport business model. Economic regulation generates inducements for the airport operators to be more efficient. At the heart of economic regulation lies the belief that the “first best” is rarely attainable, therefore a proper balance between the objectives should be established so that all concerned stakeholders are equally benefitted.
In pursuit of the “best attainable” economic regulatory model, airport operators attempt to seek the most appropriate economic regulation that promotes efficiency while enhancing the financial returns on their investment. While regulatory structures of some countries looks promising, other countries are still experimenting with the various regulatory structures, trying to assess as how to gain efficiency while recognizing the constraints imposed by the non-efficiency objectives of the respective governments. The issue of regulatory structure is an important decision criterion for all privatized airports. In this section, each of these regulatory models are reviewed and assessed based on their respective merits.
There are several different airport regulation models being used to operate airports. They are classified according to the incentives they offer the regulated industries toward cost minimization (Marques, Oliveira – Brochado, 2007). In this regard, three main forms of economic regulation warrant discussion. First, there is what is commonly referred to as rate-of- return or rate-based regulation, the traditional approach used in the US. This traditional approach ties the allowed profits of the firm to its use of capital but in so doing provides the firm with an incentive to substitute capital for labor. The effect is to encourage excessive investment and, if uncertainty is also present, it can lead the regulatory firm to gold plate investment and to provide excessive service quality (Averch and Johnson, 1962). Although the approach has now been improved upon, in recent years it has been superseded by incentive regulation. Incentive regulation is applied generally to UK utilities, a sector wherein the approach was devised (Littlechild, 1983) and honed before being exported to other parts of the world; it is now applied for example to much of the US telecom sector (Littlechild, 2003). The third regulatory form is conduct regulation, which, in contrast to the previous two, is applied ex-post. It is embodied in much of the anti-trust legislation such as Articles 81/82 of the EU
Treaty and it is also evident in price monitoring now applied to Australian airports (Forsyth, 2004). The classification scheme is shown below.

11 | P a g e
Figure 1: Regulatory Methods
In the classification scheme shown above, the regulatory models range from rate of return regulation at one end of the continuum and incentive regulation at the other end. The economic regulatory equation is shown below –
P = k + βC
P is the maximum price allowed by the regulator, k is cost independent from the regulated firm’s own costs and C represents the firms’ own cost. β represents the cost pass-through coefficient.
On one side of the spectrum there is the Cost of Service (CoS)/Rate of Return (RoR) regulation model, where β = 1 and k = 0. On the other end of the spectrum, there is the high powered pure incentive regulation model, where, β=0
The continuum of regulatory models lies in the range of 0 < β < 1
3. Regulation of airports
There is a strong ground for analyzing the economic regulation of airports.
Air passengers and airliners must be guarded against any monopoly pricing by the developers of airport infrastructure at the same time the latter must be ensured return on investment and security of their expectations. Therefore, regulation as a governance structure has to protect both parties’ reasonable interests; otherwise inefficient outcomes will occur.

12 | P a g e
Around the world there has been extensive reform of airports. Airports have been either corporatized or privatized. Ownership status has changed for the airport operators. Economic regulation as a discipline emerged to incentivize airport developers to produce and price efficiently. It is important for us to discuss the objectives of these institutional and regulatory reforms. The overriding objective is to promote economic efficiency. This involves production at minimum cost, provision of services at a quality level which users are willing to pay for, efficient levels of investment, price structures that reflect cost or ration capacity efficiently where it is in short supply, or which enable cost recovery at minimum dead weight loss. It also involves provision of adequate services to facilitate airline competition, and the development of non-aeronautical services which are complementary to the main business. The institutional and regulatory framework should create incentives for the pursuit of efficiency, although it must be recognized that a balance between objectives will normally have to be sought, and that a “first best” is rarely attainable (Forsyth et al, 2008).
4. Regulatory Environment: Experience with Developed and Developing Countries
Developed Countries
Cost of service regulation or Rate of Return Regulation (RoR) was first introduced in USA in the public utility industries in the early 1900s (Crew and Kleindorfer, 1996, 2002). Countries such as Netherlands, Spain and Portugal also followed RoR regulation. There was however quite a few drawbacks associated with RoR regulation. To overcome these difficulties, Price-cap regulation was introduced in the 1980s by UK Treasury economist Stephen Littlechild (Beesley and Littlechild, 1983), which has been applied to all of the privatized British network utilities. This form of regulation is also known as Consumer Price Index (CPI – X) Regulation or Retail Price Index (RPI – X) Regulation. Most of the European Union countries, including Australia and New Zealand also followed Price-cap regulation. RoR and Price Cap Regulation are the two main types of globally adopted regulatory mechanism. They however have their own merits and demerits. To keep the efficiency by balancing risk and incentives, different countries have taken flexible and light handed regulation. It has many variants like Sliding Scale Regulation (Austria), Earnings Sharing (USA) and Price Monitoring (Australia).

13 | P a g e
Table 1: Type of Regulation in select European Union Airports (Sources: Gillen and Niemeier, 2007, Graham 2004)
Developing Countries
Airport regulation around the world is much talked about and its economic impact has been researched. Recognizing this strategic importance of regulation, many developing nations have tried to incorporate the successful regulatory framework of the developed nations in governance of their airports. Guasch (2001), while conducting a study for World Bank, observed that price cap regulation is the well established and preferred form of Economic Regulation in Latin American countries. Iossa & Stroffolini, 2002, while observing the PCR in developing countries found that higher profits could be earned through increase in efficiency, which in turn is a welfare enhancing measure. Welfare is enhanced through gain in both productive and allocative efficiencies (at periodic reviews of the regulatory regime). To hold on to the allocative efficiency, firms try to reduce the cost, thus leading to underinvestment. This in turn leads to reduction in service quality and deterioration of capital stock over time with consequential damaging effect in the long run.

14 | P a g e
The environment of business in a developing economy is volatile in nature, with high degree of perturbation in the inflation; cost and revenue could not be reasonably represented well in advance and high regulatory uncertainty.
Under this circumstance, economic thought would dictate a government to opt for a regulation that optimizes the benefits of price cap and rate of return regulation. Rate of return regulation could be a possible choice for airport regulation, which is easy to implement and monitor and conducive to a developing economy as it provides a stable and secure environment by minimizing price fluctuations.
4.1 Airport Regulation in India
According to Observations on White Paper No. 01/ 2009-10 issued by Airports Economic Regulatory Authority (AERA) of India on 22 December 2009, Airports Council International (ACI) submitted their views on 5 January 2010 (ACI, 2010), which clearly favor an incentive based regulatory model. The major reason to opt for incentive based regulation is that it gives the regulated firm to keep costs at a minimum, while maintaining productive efficiency. Incentive based regulation also promotes and remunerates investment, increases service quality, results in diversification of airport revenues and allows for flexibility between aircraft related and passenger related charges. ACI also recommends a Dual Till Approach in the context of Indian Airports.
It is important to differentiate the various till structures. There are three models to calculate charges at the airports — single till, dual till and hybrid till. In the single-till model, both aeronautical and non-aeronautical charges are taken into account to calculate the airport charges. In the dual-till model, aeronautical charges are calculated on the basis of revenues from aeronautical and non-aeronautical charges on the basis of collections from non-aeronautical. In the Hybrid model, the charges are calculated by taking all the aeronautical and 30 per cent of the non-aeronautical revenue into account. Charges at the Delhi and Mumbai airports are calculated on the basis of hybrid model. The Airports Economic Regulatory Authority of India (AERA) feels the single-till model to calculate charges is the best for consumers, as they have to pay the least under this model. The two major models are illustrated as in the figure below.
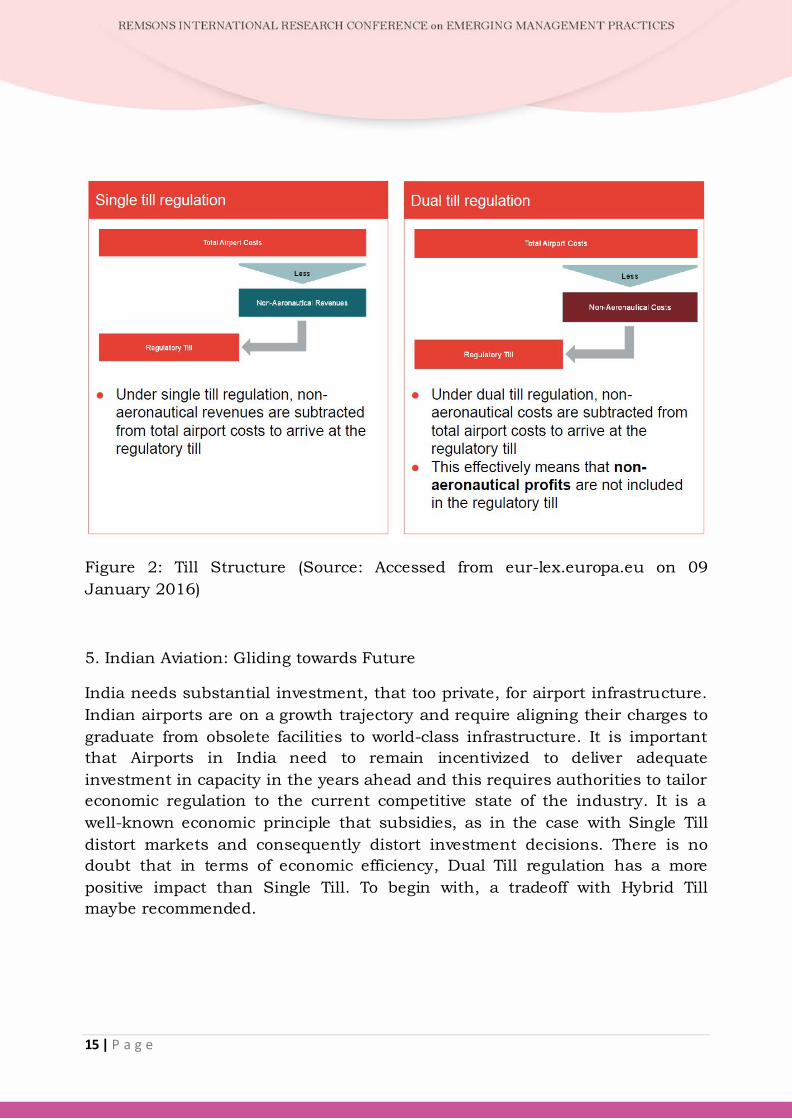
15 | P a g e
Figure 2: Till Structure (Source: Accessed from eur-lex.europa.eu on 09 January 2016)
5. Indian Aviation: Gliding towards Future
India needs substantial investment, that too private, for airport infrastructure. Indian airports are on a growth trajectory and require aligning their charges to graduate from obsolete facilities to world-class infrastructure. It is important that Airports in India need to remain incentivized to deliver adequate investment in capacity in the years ahead and this requires authorities to tailor economic regulation to the current competitive state of the industry. It is a well-known economic principle that subsidies, as in the case with Single Till distort markets and consequently distort investment decisions. There is no doubt that in terms of economic efficiency, Dual Till regulation has a more positive impact than Single Till. To begin with, a tradeoff with Hybrid Till maybe recommended.

16 | P a g e
References
Averch, H., and L.L. Johnson (1962), “Behaviour of the Firm under Regulatory Constraint,” American Economic Review, Vol. 52 (5), pp. 1052 – 1069
Beesley, M. and Littlechild, S.C. (1983) ‘‘The Regulation of Privatized Monopolies in the United Kingdom’’, RAND Journal of Economics, Vol. 20, No. 3, pp. 454 – 472
Crew, M.A. and Kleindorfer, P.R. (1996), ‘Incentive Regulation in the United Kingdom and the United States: Some Lessons’, Journal of Regulatory Economics, Vol. 9, pp. 211 – 225
Crew, M.A. and Kleindorfer, P.R. (2002) ‘Regulatory Economics: Twenty Years of Progress?’ Journal of Regulatory Economics, Vol. 21, No. 1, pp. 5 – 22
Domah, P., Pollitt, M. G., Stern, J. (2003), “Modelling the costs of electricity regulation: evidence of human resource constraints in developing countries,” Risk Regulation, Accountability and Development Workshop, University of Manchester, Manchester, 26/27 June
Forsyth (2008), “The economic regulation of airports,” German Aviation Research Society, Ashgate Publishing, pp. 67
Franziska Kupfer, Hilde Meersman, Tom Pauwels, Els Struyf, Eddy Van de Voorde (2013), “The Economic regulation of airports: The case of Brussels Airport,” Case Studies on Transport Policy, Vol. 1 (1), pp. 27 – 34
Gillen David and Niemeier Hans-Martin, (2007), “Comparative Political Economy of Airport Infrastructure in the European Union: Evolution of Privatization, Regulation and Slot Reform,” Research Papers and Publications in Transportation and Logistics (TLOG), Sauder School of Business
Graham, A. (2004), Managing Airports: an International Perspective, 2nd ed. Elsevier
Guasch, J.L. (2001) ‘Contract renegotiation in LAC’, mimeo, World Bank: Washington, DC.
Hartmut Wolf (2002), “Airport Privatisation and Regulation — Getting the Institutions Right,” Second German Aviation Seminar, 8 – 9 November 2002, Bremen, accessed from Institut für Weltwirtschaft, http://www.ifw-kiel.de

17 | P a g e
Iossa, E. and Stroffolini, F. (2002) ‘Price cap regulation and information acquisition’, International Journal of Industrial Organization, Vol. 20, pp. 1013-36.
Lypczynski, J., Wilson, J.O.S., Goddard, J., (2009), Industrial Organisation, Competition Strategy Policy, 3 ed. Prentice Hall, Harlow
Starkie, D., (2002), “Airport regulation and competition,” Journal of Air Transport Management, Vol. 8 (1) pp. 63 – 72

18 | P a g e
Growth Strategies: GRUPO POSADAS Dr. José G. Vargas-Hernández
José G. Vargas-Hernández, M.B.A.; Ph. D.
Pamela Macías Álvarez
Maestría en Negocios y Estudios económicos
University Center for Economic and Managerial Sciences, University of Guadalajara
Periférico Norte 799, Edif. G. 201-7, Núcleo Universitario, Los Belenes, Zapopan, Jalisco, 45100, México
[email protected], [email protected], [email protected]
Abstract This paper attempts to describe the growth strategy of the largest hotel company in Latin America, Grupo Posadas SA de CV, through an analysis of its evolution, on the theory of resources and capabilities, identifying the competitive advantage that has positioned itself in the market against competitors, before the dynamic environment of the tourism sector, seeking competitiveness through development of integrated work teams information technologies. Likewise, the ability of the company to create a corporate culture aligned with the commitment to the interests of the same, has allowed him to implement successful strategies so, favouring its growth through brand diversification, reduction costs, and economies of scale.
Keywords: Business administration, acquisitions, business economics, mergers, hotel industry, competitive advantage.
2

19 | P a g e
1. Introduction
Tourism is a sector of great economic and social importance in the world. In Mexico this sector has an important contribution to the creation of jobs, and a contribution of 8.7% of GDP (INEGI, 2012). In terms of international tourist arrivals, it refers to the country level as a leader in Latin America, recognized among the fifteen countries with the highest percentage in this area, which generates an outlay of 13.9 billion dollars of revenue for Mexico (OMT, 2013).
Within the growth strategies of hotel companies are identified management contracts, centralized services and standardization, as reservations, service evaluation systems, cost reduction and optimization of resources, which could be summarized in distribution networks. On the other hand, it can find strategic alliances and "joint ventures", mergers and acquisitions, which guarantees the company a competitive continued growth, focusing on different market segments, and a large "top of mind", that is, customer recognition of through brand loyalty (Slattery, 1991).
In developing this document, first review the history of Grupo Posadas, then the unit of analysis is performed, identifying strategies that strengthen its competitiveness in the hosting industry nationwide. Later, in the conceptual framework, a relationship was done with the theory of strategic management, concluding that information technologies are resources that guarantee the creation of competitive advantage of the company, and has been the key success element in the growth strategies of the company.
The influence of information technology has become a key issue in the tourism sector, generating changes in operating companies that comprise it and the quality of services offered. This action results in an approach to customer needs and thus better service, optimizing resources, encouraging customer loyalty and recommendation, and productivity. It can be seen that in activities such as reservations and selling services via the Internet, it is through the implementation of information technologies in tourism businesses. This application creates a more dynamic interaction with customers, and gives added value to the company. Peppard (1993) defines information technology as a mechanism that facilitates the handling and information flow in a company and between companies.

20 | P a g e
2. Background
The leading chain in Latin America of hosting services named Grupo Posadas S.A. de C.V. currently operates 127 hotels with a total of 21, 094 quarts, of which 99% are concentrated in Mexico and 1% in Texas. with a focus on diversified services according to different market segments promoted through seven brands Live Aqua, Fiesta Americana, Fiesta Americana Grand, Fiesta Inn, One Hotels Fiesta Americana Vacation Club and Gamma, and renowned for its high standards in customer service, continuous innovation in the training of its human capital, creating jobs for 14,000 employees (Emis, 2013), and a strong investment in information technology, which will be mentioned throughout this work in evolutionary chronological description of the company.
The foundation of Grupo Posadas was recorded in1967 by Gaston Azcarraga Tamayo under the name Promotora Mexicana Hotel, SAby operating the Fiesta Palace, now Fiesta Americana Reforma, registering in 1969the merger with American Hotels, a strategy that led to Operadora Mexicana de Hoteles SAde C.V., in order to manage hotels.
Finally in 1990, after a transaction of "joint ventures" to find that the hotel management was more profitable than only operate, specifically the acquisition of Posadas de Mexico SAde CV, andit is at that moment that comes this great Mexican hotel company with 13 hotels under operation, developing own brands: "Fiesta Americana" and "Fiesta Inn. The latter focused on the business segment and established destinations in town. The company decides to join the Mexican Stock Exchangein1992, which defined its present name: Grupo Posadas, SAde CV.
In seeking to internationalize, Grupo Posadas decide to purchase the Caesar Park chain, buying the right of the brand in Latin America in 1998 and began its expansion in South America, but in 2012 sold these properties to the company Accor SA de C.V. focusing its operations in Mexico. Since 2002, Grupo Posadas reach a total of 64 hotels in operation, and starts a process of transformation focused on the training of human capital and closer to the customer, and reducing costs through vertical integration, creating companies suppliers facilitating own processes through diversification, caring property rights which have increased the economic value of resources (Libecap, 1989).
In strengthening the sales force, a commercial advantage is created through investment in the training program Posadas Sales Methodology (MVP), improving processes in this area, and creating centralized information and operation point’s sale, allowing knowing the customer's needs and as a result of this information to develop strategies to strengthen their competitive advantage steadily. It is then that consolidates the design of the technological tool Revenew Management with the objective of Price Optimization and Inventory (OPI).OPI currently operates in coordination with the Time Zero tool that focuses on developing strategies for maximizing rate and availability control, coupled with this system in 2003, it developed the Conectum tool, a centralized platform that manages accounting and administrative transactions

21 | P a g e
maximizing profitability, adding effort in 2010 create SUMMAS generating shopping savings in supplier’s selection.
The centralization of inventory through a direct distribution channel, which give the opportunity to maximize revenues by understanding available inventory, was achieved in 2004, the year in which investment was also performed in a model of satisfaction considering the guest experience, involving strong campaigns of training before the restructuring policies and procedures, focusing managers in monitoring and quality assurance, where Grupo Posadas also made investment in a tool that would ensure compliance "Prometheus", the guest assessment tool "System Guest satisfaction "migrated to a virtual platform in 2008 to LINC.
In 2013, the unit of analysis, creates a trust with Fibra Hotel, making the sale of the own hotels, and begins scanning the market as a franchisor, in order to strengthen the group's brands and distribution network, continuing the role operator, that through centralized management and marketing, creates a competitive advantage fulfilling the promise of the brand in delivering guests advantage.
3. Theoretical framework
For analysis of growth strategies and sustainability of competitive advantage Grupo Posadas, it begins with the conceptualization of strategy ... "as the guideline or address given to internal resources of an organization to change, to lead, adapt and the worst to survive the environmental conditions " (Vargas-Hernandez, Guerra-Garcia, Bojórquez- Gutiérrez, Bojorquez Gutiérrez, 2014; 61), related to the internal resources to the environmental conditions.
The study of the companies’ growth within the markets, according to the contribution of Penrose (1959), should be focused on the analysis and identification of these internal resources. Additionally Peng (2012) brings the tripod of the strategy to ensure the success of the company through sustained competitive advantage in the frame VRIO resources, valuable, rare, difficult to imitate, organization, noting that innovation generates higher level of competitiveness. In this sense, the approach is justified in theory of resources and capacity for this analysis.
Grupo Posadas has innovated in the process, which has brought a sustained competitive advantage and that in response to changes in the redesigned environment, resulting in continuous improvement. One of the advantages the company has over other competitors in the same market, understood as a competitive advantage (Porter, 1982), is the training and development of employees in the new designs of systems that generate a personalized service, and unlike the competition. This advantage can be identified as unique as those created and designed by Posadas. Systems are proper and recorded property rights; therefore, within the diamond Porter (1987) is identical as follows. In an industry analysis, using Porter's five forces in Figure 1, explained below, can be identified Grupo Posadas as competitive.

22 | P a g e
Figure 1. Diamond Porter of Grupo Posadas. Source: Prepared.
A. Providers, where the unit of analysis has not dependency from any service supplier of the services that Grupo Posadas provides. This is due to the vertical integration of enterprises that are responsible for securing the final service, among others like Summas and Conectum, focused on the selection of suppliers to ensure the quality of products and amenities, as well as coordination of procurement and cost reduction (Hill and Jones, 2004).
B. With regard to customers, the company has a strong advantage in approaching them favoring loyalty, through programs of satisfaction like LINC and PROMETHEUS generating feedback and guarantee the company to improve its services and detect failures in a timely manner, additional to customizing generated in DELPHOS platform where the company can meet the customer preference in any hotel of the chain where he is located, and finally reward the customer for their loyalty with the Fiesta Rewards program.
C. The rivalry between competitors, where the hotel industry is very competitive, influenced by prices where the company through benchmarking remains at market prices. Also by the continued investment in the opening of new hotels in different destinations, diversifying its products and currently has 7 brands to satisfy different market niches, and the sales force, which is characterized by a rapid and efficient response to the client, using systems such as Time 0 coordinating requests with Revenew-OPI that also optimize not only response time but also customer revenue, facilitated by centralizing inventory of Konexo.
Suppliers-SUMMAS
Clients-DELPHOS
-LINC-FIESTA
REWARDS
Rivalry between
competitors-TIEMPO 0
-OPI-KONEXO
New competitors-Franchise GAMMA
-New image
Sustitutes-
Technologica
innovation

23 | P a g e
D. The chain has created barriers to entry to potential competitors, creating GAMMA franchise offering brand guarantee backed by the "top of mind" of the company, in addition to the advantage of integrated services. And with the recent creation of a trust with FIBRAHOTEL, with which not only guarantees remodeling properties sold but the company has generated a large sum of capital which concluded the opening of 20 hotels in 2014, and will implement the project 40 new openings in 2017 (Posadas, 2014).
E. Finally, substitutes in this sector are infinite, but not exceed the investment in information technology of the group.
Further to the five revised forces, Porter (1982) suggests three strategies to be followed by the company, which in this analysis are the following:
A. Cost leadership. Grupo Posadas remains within this struggle with their business strategies benchmarking, experience in the market and its continued expansion through economies of scale.
B. Differentiation. The company has variety of products or brands aimed at different market segments differentiated according to the needs and preferences of customers, with personalized service and recognition of customer loyalty.
C. Approach. Geographically the hotel chain cover about 60 cities, making sure that depending on the area where it operates the customer needs are met.
With regard to the experience of management, and the company's success is the result of changes in the knowledge gained and the change in the ability to use that knowledge in their tasks. Using the Schumpeter (1975) framework, it is possible to identify Grupo Posadas del follows:
A. Innovative. The ability to create of the Azcárraga family through technology development by implementing interesting combinations generating service.
B. Role of acquisition and exploitation of information. The company keeps abreast of new trends, forward- looking, encouraging its creativity in innovation of products to meet different market segments.
C. The role of organization and coordination of distribution of production. The structure of the company has been shaped by the ability of managers in management.

24 | P a g e
The development of competitive advantage results from the relationship between resources and processes of an organization. In this sense, Javier Barrera, CEO of Grupo Posadas New Business highlights in the annual report that technology is the facilitator in the development of unique competitive advantages for guests because of the interaction with the distribution channels,
through the use of information technologies and best practices, to promote their hotels (Posadas, 2014).
Investment in technology is the differentiator feature of Grupo Pozadas with its competitors, achieving customer satisfaction and brand recognition "Top of Mind", efficient operational processes for determining the continuous training "know how" in developing of its functions and commitment of employees participation in the implementation of strategies, cost reduction and increased productivity (Grant, 1991).
4. Method of study
The chronological analysis of the evolution of Grupo Posadas it is descriptive because it tries to specify the characteristics of business growth (Hernández, Fernández and Baptista, 2010).Reviewing the strategies that positioned as the leader in the hotel industry, to find that identifying internal resources can create competitive advantage in the market and linking strategies to theories of strategic management, mainly resources and capabilities, suggesting further analysis with a special review on the influence of information technology as it has been the resource that has driven the different strategies of the company.
Finally, through empirical testing of other authors (Bakos and Treacy, 1986; Goldhar and Jelinek, 1985; Porter and Millar, 1986) claiming that the role of technology information of hosting companies allows to understand the influence of this resource in business management.
5. Conclusion and results
The information technology is a competitive resource for creating competitive advantages that remain over time, also influencing better management of the company, because these resources have a strong relationship with the increase in productivity in the processes of the company. This resource gives Grupo Posadas innovation capacity in the process, resulting in the creation of differentiation based on competitive advantages, strengthening the competitiveness of the company in the sector.
25 | P a g e
Also, it can be seen the customization capabilities and reconfiguration in business processes, extending the range of products, based on information obtained on the preferences of its customers. Finally, the theory of resources and capabilities allows knowing strengths and weaknesses of the companies, allowing develop opportunities and neutralize threats, benefiting the development of strategies.
References
Bakosy Treacy, (1986). Information technology and corporate strategy: a research perspective. MIS Quartely, vol 10. No 2.
EMIS, (2013). Grupo Posadas SAB de CV (México). Company Profile. www.securities.com/emis/professional (recuperado 7 de abril de 2015)
Goldhar y jelinek, (1985). Economías de la variedad basadas en la tecnología. Harvard- Deusto Business Review.
Grant, R.M. (1991): The Resource-Based theory of competitive advantage: implications for strategy formulation, California Management Review, vol 33, p.p. 114-135.
Hernández, R. y Fernández, C. y Baptista, P (2010). Metodología de la investigación. McGraw Hill.
Hill, C. y Jones, G. (2004). Strategic management theory an integrated approach.Houghton Mifflin (ed.), Texas, Washington University.
INEGI.Anuario 2012-2013. www.inegi.org.mx (Recuperado 5 abril de 2015).
Libecap, G.D. (1989).Contracting for property rights. New York: Cambridge University Press.
OMT. Ranking del turismo mundial 2013. www.siimt.com/en/siimt/ranking_mundial_omt (Recuperado 2 abril de 2015).
Peng, M. W. (2012). Estrategia global.Editorial Cengage Learning. 2da edición, pp. 254-259.
Penrose, E.T (1959) A theory of the Growth of the firm. The firm in theory. New York, Wiley.
Peppard, J. (1993). IT Strategy for Business. Pitman, London

26 | P a g e
Porter, M. y Millar, V.E. (1986). Como obtenerventajas competitivas, pormedio de la información, Harvard Deusto Business review, 1er trimestre, p.p. 3-20
Porter, M. (1987). Ventaja competitiva. Creación y sostenimiento de un desempeño superior; México. Editorial Compañía continental 1982, reimpresión 2005
Posadas, (2014). ReporteAnual 2014. www.posadas.com (Recuperado 7 abril de 2015)
Schumpeter, J. (1975). Economía general: sucarácter y contenido, en Historia del análisiseconómico, Ed. FCE, Mexico, pp. 118-163.
Slatery, P. (1991) The Argumentative, Multiple-Source Paper: College Students Reading, Thinking, and Writing about Divergent Points of View. Journal of Teaching Writing. Vol.10. No. 2, 181-199.
Vargas-Hernández, Guerra-García, Bojórquez - Gutiérrez, Bojórquez - Gutiérrez, (2014). Gestión estratégica de organizaciones. Ediciones Insumos Latino americanos.

27 | P a g e
An Analytical Review of the Portfolio Construction by Large Diversified Equity Funds in the Context of Markowitz Portfolio Theory
Dr. Akshay Damani, Dr. Nandip Vaidya
Dr. Akshay Damani
FCA, MBA, Ph.D.
NMIMS (deemed to be) University, Mumbai - Assistant Professor – Finance
Prof. Nandip Vaidya
B.Tech. (IIT Mumbai), PGDM (IIM Ahmedabad)
NMIMS (deemed to be) University, Mumbai - Associate Professor – Finance
Abstract
In this paper an attempt is made to analyze and review portfolio construction and its components by fund managers based on ex-post returns of stocks in the portfolio. The analyses aim to understand dynamics of portfolio construction through the Modern Portfolio theory as given by Harry Markowitz.
The study aims to evaluate mutual fund returns based on Sharpe ratio for the period December 01, 2015 to December 24, 2015. The study aims to review stock holdings within selected mutual funds by applying the Modern Portfolio Theory and compare the model portfolio based on the application of the theory with the actual portfolio on ex-post basis. The paper, further, aims to evaluate stocks that could have been eliminated by fund managers which in turn might have generated a better risk-return trade-off using the Sharpe ratio. The paper covers possibility of an ex-post superior alpha as compared to the returns generated by fund managers. The stocks that have been analysed in the portfolio are based on their performance calculated on the daily closing holding period returns of last sixty months ending November 2015. The paper has used BSE Sensex as surrogate for market performance and ten year g-sec returns as surrogate for risk free rate of return. The findings indicate that certain stocks have “implied alpha” as these stocks though not meeting ideal weights of modern portfolio theory have found a place in the portfolio. In case stocks outperform over a period of time, it would suggest superior stock picking skills by the fund manager.
Keywords: Mutual Funds, Beta, Standard Deviation, Sharpe ratio
3

28 | P a g e
INTRODUCTION
The Modern portfolio theory as given by Nobel Laureate Harry Markowitz has changed the way fund managers construct portfolios and develop trading and investment strategies. His contribution to the financial economics and corporate finance domain has been immense. His ground breaking work has been laid down in the Modern portfolio theory which has been an innovative and a game changer in the investment framework from the varied stakeholders` perspectives including fund managers. His essay, Portfolio Selection published in 1952, in The Journal of Finance, and more extensively in his book, Portfolio Selection: Efficient Diversification in 1959 has led to a revolutionary change in which fund managers have been managing portfolios since the last seven decades in the modern complex investment environment. The theory is grounded on the premise of how risk and return work together in portfolio construction. This enables the fund managers to develop and be innovative in their investment strategies. According to Rani (2012), the Modern Portfolio Theory (MPT) is a theory of investment which attempts to maximize the portfolio expected return for a given amount of portfolio risk or equivalently minimizes risk for a given level of expected returns, by carefully choosing the proportions of various assets. The theory has been widely used for portfolio construction; however, there have been many critics of the modern portfolio theory. According to Mangram (2013), one unique problem to the theory is that there are multiple complex statistics-based mathematical modeling and formulas. Further, Joan (2010) states that the most widespread criticism of modern portfolio theory is that it treats both upside and downside volatility as risk. The theory dwells upon the "normal distribution" of portfolio returns above and below a mean, known as mean variance. He further adds that, in the real world investors don't experience upside volatility as risky at all. However, in case of extra bad outcomes (say the 2008 crisis); the theory has been found wanting on the normal distribution curves ‘fat tail’ in its skewness. To deal with fat tails, an alternative called Post-Modern Portfolio Theory (PMPT) is gaining traction among some practitioners by concentrating on downside risk. The PMPT allows managers to construct more defensive portfolios (Joan, 2010). Phayre (2011) suggested a contrarian view and dismisses the critics of the modern portfolio theory. He adds that the Modern portfolio theory may have its critics, but the discipline of a systematic mathematical approach to portfolio construction should result in consistent above-benchmark returns. According to him, fund managers are influenced by events that are specific to each stock, sector and industry at varied points of time during the portfolio holding period. Fund managers are also subject to human traits and show different reactions and strategies to past traumatic or dramatic events and thereby indicating that qualitative factors do affect fund managers stock selection and portfolio construction strategies. This may result in a stock selection and portfolio construction activity which is less understood in terms of pure economic factor risk (Phayre, 2011).
Equity diversified large cap mutual funds in India largely invest in the large cap stocks, which account for nearly sixty five to eight five percent of the portfolio holdings. The paper focuses on selected Equity diversified large-cap mutual funds and reviews analytically the ex-post stock

29 | P a g e
holdings of these selected funds. The actual weights of these stock holdings have been compared with the model weights for the same stocks. The model weights are derived based on the application of the modern portfolio theory leading to the optimal “Mean Variance” portfolio. As a corollary, the paper makes an attempt to identify stocks that may possibly be eliminated with the use of the Mean-Variance Optimization.
LITERATURE REVIEW
a) According to Markowitz (1952), there are efficient and inefficient portfolios which can be referred to as mean-variance combinations. He further states that the set of efficient portfolios are piecewise linear, that is, made up of connected straight lines) and the set of the efficient mean-variance combinations are piecewise parabolic. One of the most important assumptions of the theory has been that there are no negative investments and hence each stock has some weights. This leads to fund managers identifying an optimal weight for the best possible risk-return trade-off (Markowitz, 1999).
b) Biswas (2015) undertook a comparative study of a non-diversified and diversified stock portfolio consisting of six stocks in each category which was equally weighted and these securities were listed on the national stock exchange. The paper aimed to evaluate the performance of some selected diversified and non-diversified portfolio in respect to risk and return from the period January 2009 to June 2014. The findings suggested that the diversified portfolio gave a return (8.98%) better than the non–diversified portfolio (8.38%), additionally, the risk was lower for the non-diversified portfolio (1.47) as compared to the diversified portfolio (1.56), and thus suggesting that diversification is an important element of portfolio construction for fund managers too.
c) According to Grover and Lavin (2007), aimed to analyze a practical solution to the strategic asset allocation problem that investors face when attempting to construct an optimal portfolio. They selected the TIAA-CREF fund data which are largely, annuity retirement plan mutual funds and attempted to create an optimization model, in Excel. The optimization problem was attempted on selected mutual funds stock portfolio using the capital asset pricing model (CAPM) principles to determine security (fund) valuation and the Sharpe Ratio to identify an optimal or efficient combination of the available funds. Their findings indicate that using the optimization model, investors can take better and informed decisions.
d) The decision to select the right security plays an important role in asset allocation and portfolio returns. Kritzman and Page (2007) in their study found that selection of the securities was a more significant and dominant factor as compared to return of asset allocation, country allocation and sector allocation.
e) Studies undertaken by Drobertz and Kohler (2002) indicate that asset allocation policy involves distributing funds to different asset classes and diversification of the portfolio in different securities and asset classes to maximize the returns.

30 | P a g e
RESEARCH OBJECTIVES, METHODOLOGY AND DATA ANALYSIS
Objectives
a) To review the stock holdings within selected mutual funds by applying the Modern Portfolio Theory and compare the model portfolio based on the theory with the actual portfolio on ex-post basis.
b) To review the overall portfolio returns by optimizing their weights so as to maximize the Sharpe ratio using SOLVER OPTMISATION tool from MS-Excel for the same portfolio stock holdings for the sixty month period ending November 2015.
Sampling design
The sample of study includes four open-ended equity diversified mutual fund schemes as registered with SEBI and AMFI. The schemes considered are:
a) Birla Sunlife Frontline Equity b) ICICI Prudential Focused Bluechip Fund c) SBI Bluechip Fund d) Religare Invesco Dynamic Equity Fund
The BSE Sensex has been taken as a benchmark for the long term market return for the review of the modeled portfolio return performance.
Justification of Sampling Method
The sampling method used has following advantages:-
a) The sample represents high rated funds by CRISIL and Value Search.
b) It is illustrative of the analysis sought to be carried out which can be directly applied to other funds in the equity funds universe.
Data Sources
1. The monthly factsheets of these funds for the stock holdings and their weights as on the 30th November, 2015
2. Historical daily closing market prices of various stocks for the past five years from the Bombay Stock Exchange (bseindia.com).
3. Historical values of the BSE Sensex on daily closing basis for the past five years from the Post-tax return from the Bombay Stock Exchange (bseindia.com).

31 | P a g e
4. Betas for the stocks are not taken from an outside source like Reuters and are derived using the price data to make them consistent with the stock variances and co-variances.
5. Statistically, the standard deviation has been used to evaluate risk and arithmetic mean to be evaluating the holding period returns.
Data Analysis and out-of-sample testing of the model
1. Daily returns were computed for each stock using the price data as Ri = (Closing price on day 1 – Closing price on day 0)/Closing price on day 0
2. The stock wise Betas were calculated by regressing the daily stock wise returns on the daily Sensex returns for the past five years and taking the slope of the regression as the estimate for Beta.
3. Stock wise expected excess annual returns were calculated using the Betas and the expected excess annual return from the Sensex.
4. Portfolio excess return was the weighted average of the stock wise excess returns using the actual weights in each of the funds.
5. For each fund, the stock wise daily returns in the matrix form were used as the input to compute variance co-variance matrix using the Analysis tool pack on MS Excel
6. The variance co-variance matrix along with the stock wise actual weights led to the portfolio variance and standard deviation.
7. Sharpe ratio was computed for each fund using the actual weights.
8. The weights were then optimized using the Solver function on MS Excel with a view to maximizing the Sharpe ratio.
9. The constraints imposed for the optimization process were
a. Stock wise weights to add to 100% for a portfolio
b. Weighted average Beta using the actual weights was to be maintained for the model portfolio as well (i.e. after the changes in the weights in the optimization process)
10. The optimization exercise led to different weights for the same set of stocks in each of the funds. The output for the optimization was obtained using the GRG nonlinear method (i.e. the local optima) in the Solver function of the MS Excel.
11. Testing of the optimal weights vis-à-vis the actual weights

32 | P a g e
a. The optimization analysis was done based on fund portfolios as on 30th November, 2015.
b. Hence the testing period/ out-of-sample period was taken from 1st December,2015 onwards
c. The last date for the testing period was taken as 24th December, 2015 as market activity is usually very low in the last week of December.
d. Holding period returns from 1st December, 2015 to 24th December, 2015 were calculated for each stock using the closing prices on those two dates.
e. Composite portfolio returns were calculated under two scenarios viz
i. Actual stock wise weights ( adjusted to 100% total; to make them comparable with the model weights)
ii. Model stock wise weights
f. The holding period return during the testing period obtained using the model weights was compared with that using the actual weights for each fund, as reported below.
FINDINGS
The portfolios analyzed were as on the 30th November. Hence the model was evaluated vis-à-vis the actual for the period of 1st December to 24th December 2015.
1. The observed returns in the four instances were higher for the model portfolio than those for the actual portfolio.
Table 1: Return (%)
Actual Model
Birla Sunlife Frontline Equity fund -1.84% -0.90%
SBI Bluechip Fund 0.05% 1.08%
ICICI Prudential Focused Bluechip fund -1.46% -1.41%
Religare Invesco Dynamic Equity Fund -0.76% 0.21%

33 | P a g e
2. It was also observed that the model dropped stocks from the actual portfolios, as can be seen below:
Table 2: # of stocks for investment
Actual Model
Birla Sunlife Frontline Equity fund 64 28
SBI Bluechip Fund 47 37
ICICI Prudential Focused Bluechip fund 44 39
Religare Invesco Dynamic Equity Fund 16 13
3. The Sharpe ratio was the parameter maximized by changing the relative weights across the portfolio for each of the funds.
Table 3: Sharpe
Actual Model
Birla Sunlife Frontline Equity fund 0.51 0.52
SBI Bluechip Fund 0.44 0.48
ICICI Prudential Focused Bluechip fund 0.52 0.53
Religare Invesco Dynamic Equity Fund 0.47 0.47
4. The actual and the model weights for the stocks in the portfolio are shown in the Appendix I.
LIMITATION OF THE STUDY
1. Sample size for the funds chosen – only 4 funds were chosen, as the exercise was meant to be exploratory leading to further investigation.
2. Back data is daily closing prices for the past five years only

34 | P a g e
3. The focus was on the stocks in the portfolios and hence the other components in a fund’s portfolios (such as CDs, CPs, Nifty derivatives etc.) were not considered.
DISCUSSION
1. The weights given in the actual portfolios differ from the weights derived using the portfolio theory.
2. In this optimization process, it was assumed that the expected return for each stock was driven by its Beta and the expected market return. This implies that the fund managers are imputing alphas to the stocks which are lowered in their weights or are dropped by the model.
3. If these alphas get reflected in the ex-post performance over time in a consistent manner; this would suggest the security selection skill of the fund managers
4. Also, if multiple funds are suggesting alpha for the same stock vide such analysis; that would seem to suggest a bullish sentiment for that stock among the domestic institutional investors.
CONCLUSION
The limited analytical review of the four diversified equity funds based on the Portfolio theory is leading to the hypothesis of “implied alphas” for certain stocks. Reduction in the weights of certain stocks in the model vis-à-vis the actual implies that the fund manager would have assumed certain alphas from these stocks over and above the excess returns implied by the Beta of these stocks . This can be further investigated by expanding the same analysis over longer time frame and across more equity funds.

35 | P a g e
References
Rani, A., (2012). The Modern Portfolio Theory: As An Investment Decision Tool. International Journal of Management Research and Review. 2(7), 1164-1172.
Mangram, M., (2013). A simplified perspective of the Markowitz Portfolio Theory. Global Journal of Business Research. 7(1), 59-70.
Joan, W., (2010). Rethinking Modern Portfolio Theory: Are we all doing it wrong- or is the theory in need of updating and repair? Bank Investment Consultant. 18(2).
Phayre, S., (2011). Dismissing the critics of Modern Portfolio Theory. Investment Week, 62-63.
Markowitz, H., (1952). ‘Portfolio Selection’, Journal of Finance, 7(1), 77-91.
Markowitz, H., (1999). Perspectives - The Early History of Portfolio Theory: 1600-1960. Financial Analysts Journal, 5.
Grover, J., and Lavin, A., (2007). Modern Portfolio Optimization: A Practical approach using an Excel Solver Single Index-Model. The Journal of Wealth Management, 10(1), 60-73.
http://search.proquest.com/docview/237028711/73BA21136F754B3APQ/4?accountid=32277# [Accessed date: 26.12.2015]
Kritzman, M., and Page, S., (2007). The Relative Importance of Asset Allocation and Security Selection: Comment. Journal of Portfolio Management, 33(4), 111.
Drobertz and Kohler (2002). The Contribution of the Asset Allocation Policy to Portfolio Performance. WWZ/Department of Finance, Working paper no. 2 / 02, 1-22.
WEBSITE:
www.bseindia.com/

36 | P a g e
Appendix I

37 | P a g e

38 | P a g e
Innovative Banking Regulations: BASEL-III
Siddharth Shukla
Ph.D. Student at School of Petroleum Management, Pandit Deendayal Petrolium University, Gandhinagar, Gujarat
Abstract
In Indian context when it comes to the investment, banks are considered to be among one of the safest avenues available. The reason behind it is that banks are subjected to various fierce regulations in India. One of the positive effects of these regulations was seen at the time of financial crises in late 2000s. When entire world economy was suffering from slack and many internationally well known financial institutions failed across the world, most of Indian banks could sustain the economic thrust very well. However one of the reasons behind this was given the less exposure of Indian banks in international market but major reasons behind failures were excessive exposure to subprime loans, securitization and derivatives backed by low quality and amount of capital which resulted in systematic failures and subsequent cascading effect. These were some of the drawbacks of Basel-II, which formed the basis for evolution of Basel-III. Banks in India besides being subjected to domestic regulations have to comply with international regulations as well; which are suggested by Reserve Bank of India from time to time. Basel –III regulations are the latest one. This paper is an attempt to measure the impact of Basel-III regulations on Indian banks. The opening part discusses major recommendations made by the Basel committee, effectiveness of Basel-III regulations in preventing systematic crisis and flexibilities offered to concerned country’s regulators are discussed in middle part, challenges faced by Indian banks in implementation of Basel-III are placed in conclusive part along with research outcomes.
Keywords: Basel-II, Basel III, systematic crises
4

39 | P a g e
INTRODUCTION
Capital per se in any business plays very crucial role in deciding health of the business concern. This fact holds true in case of banking as well. Considering remarkable fall in capital ratios and increased credit risk, the first ever this kind regulation directly affecting bank’s capital was introduced by Basel Committee on Banking Supervision (BCBS) in form of Basel Accord I in year 1988. These regulations were mainly focused on credit risk, however later on in year 1995 importance of market risk was realised and incorporated in Basel-I Accord. These regulations were more kind of ‘one-size-fits-all’ approach. As per Basel- I regulations bank assets were classified under five broad categories and were assigned pre-decided risk weightage depending upon the category under which they fell; without much consideration to the creditworthiness of the borrower.
These shortcomings of Basel-I were reviewed by the Basel Committee and new set of accords named as Basel II were suggested in year 2004. Following which the capital standards were revised and improved by adding new rules for market risks and possible losses. In June 2006 full version of the new accords was published. Basel II was built on three pillars viz: (a) minimum capital requirements for measurement of minimum capital for credit risk, market risk and operational risk (b) supervisory process for quality supervision and (c) market discipline for enhanced reporting and disclosure for stakeholders. Various approaches were suggested under Basel II for calculation of credit risk, market risk and operational risks. The effect of Basel II implementation was based upon the utilised approach and bank’s risk profile. However the global financial crises in 2007-08 raised question on effectiveness of Basel II Accords in achieving desired goals. Some of the reasons as put forward by BCBS (V.R.Iyer-2015) behind non-achievement of desired outcome by Basel II, were (1) Basel II Accords left enough scope for banks for minimization of core capital, ambiguity in definition of capital across jurisdictions (2) Inadequate coverage of counterparty risk (It was realised many banks held large volume of complex credit products but only accounted for default risk) (3) liquidity and maturity mismatch resulting into liquidity crunch and subsequent credit and trading losses (4) Underestimation of the securitised products and inherent risk besides their treatment more like a corporate debt resulted into less risk provisioning for these products. (5) Excessive Leverage which had gratifying effect at the time of crises. (6) The level of disclosures prescribed under Basel II proved to be insufficient for making a comparative assessment with regard to the adequacy or otherwise of capital and its quality across different banks. (7) Excessive credit growth and no control over the use of capital during the time of excessive credit growth resulted in to considerable amount of losses. (8) The interconnection of various institutions in the banking system was not considered in the design of the Basel II regulatory framework which resulted into systematic risk. The failure of one the systematically important financial institution and its cascading effect on other institutions resulted into bigger impact on system as whole.

40 | P a g e
Considering above mentioned factors and self analysis of suggested past regulations BCBS came out with new set of regulations called Basel III in year 2010. The focus points for Basel III are enhancing quality and quantity of capital, liquidity risk management, valuation practises, pro-cyclicality and resolution mechanism for systematically important banking institutions.
MAJOR RECOMMANDATIONS UNDER BASEL III
However the basic structure of Basel Accords III is similar to earlier Accords, some major changes introduced under this Accord are as follows:
1. Tier-I Capital: The loss absorbing component, that is, common equity and retained earnings are declared as the predominant form of Tier-I capital and have been stipulated to be maintained at 4.5 per cent of risk weighted assets, which was allowed as low as 2% under Basel II.
2. Capital Conservation Buffer: Over and above the minimum capital requirements, Capital Conservation Buffer to the extent of 2.5 per cent of risk weighted assets, in the form of Tier-I common equity is to be maintained, there was no specified Capital Conservation Buffer under Basel-II.
3. Counter-Cyclic Buffer: This type of Capital buffer to control excessive growth during economic upturn and to maintain sustainable growth during slack period. The range specified is up to 2.5 per cent of risk weighted assets in the form of equity capital which was missing in earlier accords i.e. Basel II.
4. Leverage Ratio: It is suggested to maintain leverage ratio i.e. ratio of Tier I capital to on-balance sheet and off-balance sheet exposures of the bank, above 3%. This ratio was not specified under Basel II. Given the fact that balance sheet exposure is not permitted to be reduced by physical or financial collaterals, guarantees or instruments purchased to reduce exposures neither permitted to net loans and deposits (BCBS, 2011, p. 61-63)., this ratio will serve as simple indicator and prevent misrepresentation of the information value.
The other major features of Basel-III are global standards for banks’ liquidity. With the introduction of Liquidity Coverage Ratio (LCR) i.e. ratio of highly liquid assets and total net cash outflow for 30 days for the bank and Net Stable Funding Ratio (NSFR) i.e. ratio of amount available for stable funding to amount required for stable funding for a year, short-term and long-term liquidity respectively will be ensured in the system.

41 | P a g e
FLEXIBILITIES OFFERED TO COUNTRY SPECIFIC REGULATOR UNDER BASEL III
The Reserve Bank of India (RBI) has been proactive to ensure that the banks in India put a robust risk management system in place to control systemic risk. Further RBI has agreed to implement Basel III in line with international standards and suggested a road map for the same. The full implementation of Basel III accords in India is expected to be completed by March-2019. The regulator of the concerned country are allowed to set higher requirement for minimum amount of capital and accordingly RBI has specified Capital Adequacy Ratio (CAR) to be maintained at 11.5% which is one percent higher than the specified Basel Accords III norms as prudential measures. Minimum common equity Tier-I ratio has been specified to be maintained at 5.5% against the suggested level of 4.5% by BCBS. Thus minimum common equity coupled with Capital Conservation Buffer will have to be maintained at 8% in India against the suggested level of 7% by BCBS. In September 2014, the Reserve Bank of India (RBI) revised some of its rules governing instruments that qualify as bank capital under Basel-III. The key change is the removal of certain limits on the amount of Additional Tier-1 (AT-1) that a bank can use for calculating its Tier-1 capital, which effectively earlier limited AT-1 issuance to 1.5 per cent of risk-weighted assets (RBI circular). Further according to new rules banks are permitted to issue Tier-I bonds to retail investors which was not permitted earlier. EFFECTS OF BASEL III ON INDIAN BANKS The implementation of Basel accords will affect Indian Banking Industry significantly because of rise in minimum level of core capital, introduction of Counter-Cyclical Buffer and Capital Conservation Buffer. The liquidity standards set in term of Liquidity Coverage Ratio and Net Stable Funding Ratio will ensure enough liquidity in system in short term as well as extended period of time. It is expected that new accords will ensure reduced systematic risk and higher levels of capital coupled with liquidity which will help in better management of various kind of risks arising from counterparty default or liquidity stressed period. Further it is worth consideration that not so strong banks may find it difficult to cope up with required higher capital standards and this situation may force them to merge with stronger bank in terms of capital. The stringent norms of interbank liability will help in lowering interdependence of the banks and leading to mitigation of possibility of systematic crisis.

42 | P a g e
LITERATURE REVIEW Considerable amount of research work has been done in context to Basel III and its effects. These studies show the impact of Basel III on various economic parameters. For example the study conducted by Vighneswara Swamy (2013) addresses both quantitative and qualitative impacts of Basel – III in Indian context in term of loan spread, estimation of additional capital requirement and cost of crisis. Studies have been conducted to access the impact of Basel III on overall economy as well. One such research was carried out by Abdel-Baki, M. A. (2012), where researcher accessed the effect of Basel III implementation on GDP growth of 47 emerging market economies. Peter Went (2010) in his paper stated probable effects of Basel III implementation on banking industry as a whole, on the future of banking, risk management, and risk managers. Adrian Blundell-Wignall and Paul Atkinson (2010) carried out research to estimate if the desired goals of better risk management and effective control on inherent risks will be achieved by implementation of Basel III and suggested that as long as risk weighted framework remains same, it will be difficult to achieve the desired results. Chorafas (2012) has analysed Basel III and its possible effects in his book named Basel III, Devil and Global Banking where he cited the major shortcoming of Basel III starting from valuation of Special Purpose Vehicle (SPV), non inclusion of High Frequency Trading (HFT) and technical trading. Moreover he claimed the Basel III regulatory framework has impact of lobbying by bankers as well. Martin Hellwig (2010) in his paper stated that entire Basel regulation needs to move away from risk calibration because raising capital requirements vary substantially as risk calibrated capital requirements allow banks to be undercapitalised prior to crisis. In IIM Bangalore Review, M. Jayadev (2013), discussed the issues and challenges faced by Indian banks in implementation of Basel III. Few major issues highlighted were requirement of additional capital infusion, balancing between the growth and financial stability of the economy, decline in Return of Equity (ROE), identification of the trigger point for the release of buffers etc. Bank of Ghana, in its working paper (2011) stated however Basel III is aimed at raising capital of the banks and improving loss absorbing capacity; the risk weighted system used under Basel III suffers from portfolio variance and some important issues like corporate governance, account manipulation and full disclosures are not addressed. It is observed that most of earlier research work done is mainly on entire economy or focuses on corrective measures to be associated under Basel-III Accord. Further Basel III regulations are yet to be implemented fully in India so it is worth to study the probable effects of these regulations in Indian parlance in terms of its relationship of CAR with level of advance and level of NPA. After getting the quantified relationship, the changes which are likely to happen in level of advance and level of NPA can be calculated by variation in CAR. Further to check if the ownership affects the CAR of the banks suitable statistical tool can be applied as discussed in following section.

43 | P a g e
RESEARCH METHODOLOGY This study mainly focuses on relation of Capital Adequacy Ratio (CAR) with level of advances and level of NPA. Further it analyzes whether ownership of the bank has significant effect on CAR of the bank. Data source and sample size: The data required for this research work was taken from the database of Indian Banks’ Association and database of RBI. The details about CAR, level of advance and NPA level were considered for 26 public sector banks and 20 private sector banks from March-2011 to March-2015. The data collected for the purpose of this study is shown below. Table 1: Details of level of advance, level of NPA and CAR of various public and private sector banks (Values for advances and NPA in Rs. Crores)
Year
Average level of
Advance for 26* public sector banks
Average level of
Advance for 20** private sector banks
Average level of
CAR for 26 Private Sector Banks
Average level of
CAR for 20 Private Sector Banks
Average level of NPA for 26 public sector banks
Average level of NPA for 20 private
sector banks
2011 127139.53 36615.5 13.36 14.4 1387.34 221.6 2012 149127.2 44022.3 12.97 15.4 2275.46 215 2013 165660.91 57162.4 12.15 15.6 3459.61 299.72 2014 188931.2 67146.7 11.91 14.5 5013.84 443.07 2015 202824.05 77195.8 11.94 14.33 6152.81 684.01
Average value 166736.58 56428.54 12.47 14.84 3657.81 372.68 Source: Indian Banks’ Association year book 2011 to 2013, www.iba.org.in, *list of 26 public sector banks is given in appendex-1, ** list of 20 private sector banks is given in appendex-2. A) Relationship between CAR and level of advance: Based on the data available from secondary data sources scattered plot was constructed to check the linearity between the two variables i.e. CAR and level of advance. It was revealed there exists linear relationship between these variables.

44 | P a g e
a) For Public Sector Banks:
The correlation co-efficient obtained statistically between CAR and level of advance is - 0.94.
Through this we can state that both the variables are negatively related and have large effect of change in CAR on level of advance and vice versa.
Through regression analysis, we find following equations.
Level of Advance = 704869.1-43149.1*CAR
b) For Private Sector Banks:
The correlation co-efficient obtained statistically between CAR and level of advance is - 0.29.
Through this we can states that both the variables are negatively related and have medium effect of change in CAR on level of advance and vice versa.
Through regression analysis we find the equation for best fitting line as follows
Level of Advance =177433-8154*CAR.
B) Relationship between CAR and level of NPA: Based on the data available from secondary data sources the scattered plot was drawn for linear relation of CAR and NPA and accordingly correlation and regression analysis was carried out as follows:
a) For Public Sector Banks:
The correlation co-efficient obtained statistically between CAR and level of NPA is -0.91. Through this we can state that both the variables are negatively related there is large effect of change in CAR on level of NPA.

45 | P a g e
Through regression analysis we find following equations. Level of NPA= 37481.51-2712*CAR
b) For Private Sector Banks:
The correlation co-efficient obtained statistically between CAR and level of NPA is - 0.54.
Through this we can states that both the variables are negatively related and have large effect of change in CAR on level of NPA. Through regression analysis we find the equation for best fitting line as follows Level of NPA= 3015.781-178.0*CAR
C) Relationship between ownership and CAR: Here we have collected the samples of CAR for public sector banks and private sector banks from year 2011 to 2015 as below:
Table: 2 Details of CAR of private and public sector banks Type of ownership / Year 2011 2012 2013 2014 2015 Average Public Sector f0 13.3657 12.9788 12.15 11.9164 11.9462 12.4714 Private Sector f0 14.4 15.4 15.6 14.5 14.33 14.846 Average of the CAR fe 13.65
Source: Indian Banks’ Association year book 2013, www.iba.org.in We can form null hypotheses and alternative hypothesis as follows:
H0: CAR1=CAR2, where CAR1 and CAR2 are the capital adequacy ratio for public sector and private sector
bank respectively. H1: CAR1 is not equal to CAR2.
Based upon the data obtained contingency table can be formed as follows:

46 | P a g e
Table 3: Calculation of Chi-Square parameter
f0 Fe f0-fe Squarer of (f0-fe) Squarer of (f0-fe)/ fe
13.3657 13.65 -0.2842 0.0807 0.00591 12.9788 13.65 -0.6711 0.4504 0.0329
12.15 13.65 -1.5 2.25 0.1648 11.9164 13.65 -1.7336 3.0053 0.2201 11.9462 13.65 -1.7037 2.9027 0.2126
14.4 13.65 0.75 0.5625 0.0412 15.4 13.65 1.75 3.0625 0.2243 15.6 13.65 1.95 3.8025 0.2785 14.5 13.65 0.85 0.7225 0.0529
14.33 13.65 0.68 0.4624 0.0338
Value of Chi Square 1.2675 Source: Authors’ compilation For degrees of freedom = (no. of raws-1)*(no. of columns-1) i.e. 1x4 =4 at significance level of 0.05 we get value of chi square as 9.488. So we can accept the null hypothesis i.e. CAR of the banks is independent of type of ownership of the banks.
FINDINGS As we can see from the fact that co-relation co-efficient for level of advance and CAR is negative for both Private and Public sector banks however in varying magnitude. We can infer that level of advance is affected more in public sector banks as compared to private sector banks due to variation in CAR. One of the possible explanations for this can be the fact that Public Sector Banks (PSBs) have level of advance much higher than their private counter parts so even the smaller change in CAR brings considerable change in level of advances. The co-relation co-efficient for level of NPA and CAR is negative in both PSBs and private banks. However the magnitude is higher for PSBs as compared to private banks highlighting the fact that CAR has much larger effect in level of NPA for PSBs as compared to Private Banks. Again here the quantum of loans floated by PSBs is much higher as compared to Private Banks, which supports the above inference of larger effect. Further the results of chi-square tests show that there is no significant effect of bank’s ownership on the CAR.

47 | P a g e
CONCLUSION If we consider the preparedness of Indian Banks towards implementation of Basel III Accords we can note that the precautionary measures taken by RBI well before the crisis like raising CAR to 9% as compared to internationally suggested level of 8%; have made it somewhat easier for Indian banks to implement Basel III but the need of additional capital infusion to maintain Capital Conservation Buffer and Counter-Cyclical Buffer is a real hurdle for banks. NPA management is also one of the critical issues as the gap between actual NPA and reported NPA is much wider. To bridge this gap banks will have to acknowledge the actual NPA and will have to infuse additional capital. The transparency and credit worthiness of balance-sheet of the banks are also major concerns. The Higher Loss Absorbance (HLA) capital requirement for Domestic Systematically Important Banks (D-SIBs) in line with Globally Systematically Important Banks (G-SIBs) will compel D-SIBs to raise more capital. Further as discussed before, with higher amount of capital being blocked under Basel - III, banks will be left with fewer amount of funds available for lending which in turn will result into raised interest rates to maintain similar level of earning and may result into decline in demand of loans. Thus implementation of Basel III will be trade-off between growth and stability however growth thus achieved will be balanced and sustainable. For improving capital efficiency and optimization banks will have to strengthen their risk management system. Increased capital and minimum liquidity requirements are likely to adversely impact the return on equity. Moreover the fact that inconsistent implementation of Basel III across the different countries may affect global financial stability cannot be overlooked. LIMITATIONS OF THE STUDY In this study one to one relationship between level of advance with CAR and level of NPA with CAR were derived considering all other affecting factors constant, however in practical sense there may be many more factors which affect these dependent variables like bank’s book size, Government policies and other macro economic conditions. So this study can be extended to include the effect of all these variables for much more practical approach. Further data taken in this study is for time period 2011 to 2015 however for much better approach the data for extended period of time can be considered. References
Abdel-Baki Monal A., ‘The Impact of Basel III on Emerging Economies’, Global Economy Journal (2012), Volume 12, issue 2, pp 1-33
Basel Committee for Banking Supervision, ‘A Global Regulatory Framework for More Resilient
Banks and Banking Systems’, Bank for International Settlements, publications, June 2011.

48 | P a g e
Basel Committee on Banking Supervision, Operational Risk – Supervisory Guidelines for the
Advanced Measurement Approaches, Bank for International Settlements, publications, June 2011, p. 3.
Bank of Ghana (2011), ‘was Basel III necessary and will it bring about prudent risk
management in banking’, downloaded from https://www.bog.gov.gh/privatecontent/Publications/Staff_Working_Papers/2011/Was%20Basel%20III%20necessary%20and%20will%20it%20bring%20about%20prudent%20risk%20management%20in%20banking.pdf
Blundell-Wignall, A., Atkinson, P., Thinking beyond Basel III: Necessary Solutions for Capital and Liquidity, OECD Journal: Financial Market Trends 2010.
Chorafas, Dimitris N, ‘Basel III, the Devil and Global Banking’,Palgrave MacMillan Studies in
Banking and Financial Institutions (2012), 175 Fifth Avenue, New York, NY 10010. Dilip M.Nachane, Aditya Narain, Saibal Ghosh , Satyananda Sahoo, ‘Capital Adequacy
Requirement and The Behaviour of Commercial Banks –An Analytical and Empirical Study’, Working Paper Department of Economics, Reserve Bank of India, Mumbai, September 20, 2000.
Dr. Madhavankutty. G.,’ Basel-III bonds - How effective are they in shoring up capital
adequacy?,’Bank Quest, The Journal of Indian Institute of Banking & Finance Vol.86 No.3 January-March (2015), pp. 27-31.
Duvvuri Subbarao, ‘Basel-III in International and Indian Contexts: Ten Questions We Should Know the Answers for’, Inaugural Address by Governor, Reserve Bank of India at the Annual FICCI-IBA Banking Conference, Mumbai, 4 September 2012.
Indian Banks’ Association, ‘Indian Banking Year Book 2013’, The Publications Department,
IBA, Veer Nariman Road, Mumbai.
Indian Institute of Banking & Finance (2015), ‘Master Circular on Basel III Capital Regulations’ downloaded from http://iibf.org.in/documents/BASEL-III.pdf
M. Jayadev, ‘Round Table Basel- III Implementation: Issues and Challenges for Indian Banks’,
Peer – review, IIM Bangalore Management Review, vol. 25, May 2013, pp. 115–30.

49 | P a g e
Martin Hellwig, ‘Capital Regulation after the Crisis: Business as Usual, Pre-Prints, Max Planck
Institute for Research on Collective Goods, July 2010.
Max Kubat,’Does Basel III bring anything New? A comparison between capital accords
Basel II and Basel III’, 2nd Economic and Finance Conference, Vienna, 03 June 2015.
Oana Miruna Danila, ‘Impact and Limitations Deriving from Basel II within the Context of the Current Financial Crisis’, Theoretical and Applied Economics, Volume XIX (2012), No.
6(571), pp. 121-134.
Peter Went, ‘Basel III Accord: Where do we go from here?’, Risk Professional, GARP Research
Center-USA, December 2010, pp. 36-43. Reserve Bank of India (2013),’Master Circular – Basel III Capital Regulations’, Circular No.
RBI/2013-14/70 DBOD.No.BP.BC. 2/21.06.201/2013-14, July 1, 2013 downloaded from https://www.rbi.org.in/scripts/BS_ViewMasCirculardetails.aspx?Id=8142&Mode=0
Reserve Bank of India (2014),’ Reserve Bank of India (2014),’ Implementation of Basel III Capital Regulations in India – Amendments’, Circular No. RBI/2014-15/201 DBOD.No.BP.BC.38/21.06.201/2014-15, September 1, 2014 downloaded from https://www.rbi.org.in/scripts/NotificationUser.aspx?Id=9202&Mode=0
V.R.Iyer, ‘Risk Management & Regulation in Indian Banking Sector - New Paradigm’, Bank
Quest, The Journal of Indian Institute of Banking & Finance Vol.86 No.3 July-September (2015), pp. 17-23
Vighneswara Swamy, Basel-III Implications for Indian Banking, Research Report published by Indian Institute of Banking and Finance, Mumbai, October 2013.

50 | P a g e
Annexure
Annexure-1: List of Public Sector Banks taken under Study
Sr. No. Name of the Bank
1 Allahabad Bank 2 Andhra Bank 3 Bank of Baroda 4 Bank of India 5 Bank of Maharashtra 6 Canara Bank 7 Central Bank of India 8 Corporation Bank 9 Dena Bank
10 Indian Bank 11 Indian Overseas Bank 12 Oriental Bank of Commerce 13 Punjab & Sind Bank 14 Punjab National Bank 15 Syndicate Bank 16 UCO Bank 17 Union Bank of India 18 United Bank of India 19 Vijaya Bank 21 State Bank of Bikaner & Jaipur 22 State Bank of Hyderabad 23 State Bank of Mysore 24 State Bank of Patiala 25 State Bank of Travancore 26 IDBI Bank Ltd.

51 | P a g e
Annexure-2: List of Private Sector Banks taken under Study
Sr. No. Name of the Bank
1 City Union Bank Ltd. 2 ING Vysya Bank Ltd. 3 Tamilnad Mercantile Bank Ltd. 4 The Catholic Syrian Bank Ltd. 5 Dhanlaxmi Bank Ltd 6 The Federal Bank Ltd. 7 The Jammu & Kashmir Bank Ltd. 8 The Karnataka Bank Ltd. 9 The Karur Vysya Bank Ltd.
10 The Lakshmi Vilas Bank Ltd. 11 Nainital Bank Ltd. 12 RBL Bank 13 The South Indian Bank Ltd. 14 Axis Bank Ltd. 15 Development Credit Bank Ltd. 16 HDFC Bank Ltd. 17 ICICI Bank Ltd. 18 Indusind Bank Ltd. 19 Kotak Mahindra Bank Ltd. 20 YES Bank

52 | P a g e
Impact of Corporate Announcement (Merger & Acquisition) on Stock Returns, Volatility and Liquidity: an Empirical Study
Vivek Gupta
The primary objective is to examine impact of M&A announcement on stock returns and other stock characteristics like volatility and liquidity. The study has many implications for various stakeholders. It uses standard event study methodology for 205 acquirer companies and 137 target companies involved in M&A during the period 2005-2014, in India. Cross-border M&A deals are excluded. On ex-post basis, individual analysis suggests that there is significant impact of M&A announcement on stock returns for almost half of the sample acquirer companies. Results related to price reaction are however mixed, as positive abnormal returns occur as often as negative abnormal returns on post-event basis. These findings are consistent with the finding of many other related studies. I also offer evidence for significant abnormal returns even before M&A announcement for both acquirer and target companies.
Results indicate that there is no significant difference in these stock characteristics, on pre and post event windows, for both acquirer and target companies.
Keywords: Co-movements, Corporate Announcement, Event Study, Market Efficiency
5

53 | P a g e
1. INTRODUCTION
1.1. Mergers and Acquisitions: An Introduction
Mergers and Acquisitions (M&As) are often used as preferred tools of corporate structuring to serve a variety of business objectives. It is also observed that M&A activities have a tendency to cluster as they may be triggered by the changes in the business environment caused by economic, political or social developments. Changes in business environment may cause change in the optimal size of a firm in a given industry, which in turn may create opportunities for taking advantage of synergies by restructuring. On the other hand, many studies offer evidence of value destruction by M&A activities.
1.2. M&A Announcement and Market Reaction: Emerging Issues
The recent increase in M&A activity in India presents an important question for corporate strategists and investment managers: Do M&A announcements create value for the shareholders of acquirer and target companies in the short term? Are shareholders of the target and acquirer companies better off after the M&A an announcement? How does the stock market react to such announcements? Are there some variables that moderate the impact of such announcements?
The present study focuses on such issues and aims at examining the relationship between M&A announcement and stock returns as well as other characteristics such as stock volatility and liquidity with reference to the M&As in Indian companies.
1.3. Relevance and Motivation of the Study
With a huge amount of the investment involved, it is important to examine the impact of M&A activity on various stakeholders, particularly on the shareholders. With the increasing divorce between shareholders and management, it becomes all the more important to understand whether M&A decisions serve any purpose of the shareholders or not. Although, several studies has proved that on average target shareholders gain substantially from M&A announcement, the wealth effects of M&A announcements on shareholders of acquirer companies continue to be a matter of ongoing debate.
1.4. Research Objectives
The primary objective of the study is:
a. To examine the impact of M&A announcement on stock returns in the short run for investors of Acquirer Company as well as Target Company.
b. To examine the impact of M&A announcement on other stock characteristics such as stock return volatility and trading liquidity in the short run for investors of Acquirer Company as well as Target Company.

54 | P a g e
1.5. Organization of the Study
The study is divided into next five sections as follows. Second section delineates the review of literature in India and abroad, while section three deliberates on the methodology. The next two sections present the analysis for acquirer and target companies respectively. The last section summarizes the findings and concludes the study.
2. REVIEW OF LITERATURE
In this section, I attempt to review studies on impact of M&A activity on shareholder’s wealth and factors that may have influence on such impact.
2.1. Studies in India
Pandey (2001) analyzes the effect of open offer announcement on the target firm’s stock returns for 14 takeovers during 1997-2001. Perhaps the earliest study in India on market reaction to M&A announcements in India, the study analyzes abnormal returns for 200-day (-51, 0, +150) event period. The study documents existence of significant abnormal returns during run up to announcement period. The abnormal returns are up by 28-30% prior to a month of announcement and are around 10% during three days announcement window. Interestingly, the abnormal returns are insignificant in the 5-day period of post announcement date. He observes that most of the abnormal returns for the target shareholders run up to 30-day period prior to the date of announcement and there is a significant reduction in abnormal returns thereafter.
Agarwal & Singh (2002) focus on the possibility of insider trading around the date of M&A announcement. They analyze abnormal returns for 42 companies during the period of 1996-1999. The sample is further sub divided into 28 group merger companies, 12 non-group merger companies and 2 BIFR (Board of Industrial and Financial Restructuring) companies. The time interval is t = -50 to + 14 days. They observe that 37% of total build up in cumulative abnormal returns is seen during a period of 10 days prior to the merger announcement and less than half of the total effect is seen during a month prior to the announcement date. Both readings are significant at 5% level. The study underlines the possible presence of insider trading activity in the Indian capital market around the M&A announcement.
Sehgal, Singh & Choudhary (2005) examine the relationship between corporate takeovers and share prices of Indian market for 31 target firms during 1997-2001.The study finds significant positive abnormal returns during pre-event period.

55 | P a g e
Mishra & Goel (2005) examine the impact of RIL and RPL merger on the wealth of the shareholders by observing the daily excess returns that accrue to the shareholders of both acquirer and target companies, close to the merger announcement date. The study concludes that shareholders of the target company RPL get positive excess returns and shareholders of acquiring company RIL get negative excess returns. Further, for the combined company, the RIL-RPL merger experiences negative returns.
Malhotra & Zhu (2006) examine cross border acquisition by Indian companies. The study examines the market reaction to the acquisition for 96 Indian international acquisitions of U.S. firms made in the period 1999-2005 in both short term and long-term using standard event study method. For measuring the short term effect, the research uses -120 to -90 day period as estimation period and -5 till +15 day period as test period from the announcement date and for measuring post acquisition long term performance, the research uses -1 to +24 month period from the date of the announcement. They conclude that Indian domestic market has significant positive response to the announcement of Indian firms’ acquisition of U.S. firms in short run, leading to significant cumulative abnormal returns (CARs) the first three days after the announcement. Further, they observe that the positive impact of the announcement does not persist for a long time. Interestingly, the post-acquisition long-term effect to the acquirer is significantly different than in short run. The stocks of bidder companies consistently underperform the market. The two-year average CAR of the sample firms is as low as -30%. The study revealed that although international acquisition announcements by Indian firms create significant short-term shareholders’ wealth, long run impact of international acquisitions on shareholders’ wealth is negative.
Anand & Singh (2008) examine the impact of merger announcement on shareholder returns for five banks in India during 1999-2005 using estimation window of -120 days to -40 days, pre event window as -41 days to -1 day and post event window of 0 to +40 days. They find CAR for 21-day (-10, +10) window; 31-day window (-15, +15) and 81-day window (-40, +40). The study observes that average cumulative abnormal returns for the bidder banks are positive while moving from a three-day window, to a five-day window and then to an eleven-day event window and increases from 6.67 percent to 7.10 percent to 9.97 percent. These results are also statistically significant. The cumulative abnormal returns for 21-day (-10, 0, +10) window are 12.81 percent. The cumulative abnormal returns for 31-day (-15, 0, +15) window and 81-day (-40, 0, +40) event window are 10.48 percent and 10.19 percent respectively. They conclude that the bidder banks get significant positive abnormal returns. The combined cumulative abnormal returns for all target banks are positive, significant, and substantial. As the window increases from a 2-day (-2, 0, +2) window to a 40-day (-40, 0, +40) window, cumulative abnormal returns increase from 6.78 to 35.1 per cent. The study concludes that the merger announcements in the Indian banking industry have positive and significant shareholder wealth effect both for the bidder and the target banks. However, study has a major limitation of its small sample.

56 | P a g e
Kumar & Panneerselvam (2009) examine the impact of mergers and acquisitions on the wealth of shareholders of acquirer and target firms in Indian context. The study is based on a sample of 252 acquirer and 58 target companies involved in acquisitions, and 165 acquirer and 18 target firms involved in mergers during the period 1998–2006. In the case of acquisitions, the market model adjusted average abnormal returns for the acquirer firms on days -1 and 0 are 0.57% and 0.82% respectively. The 2-day and 11-day window around the M&A announcement experience statistically significant cumulative abnormal returns. The average abnormal return during the 20-day post-merger window (+1, +20) is negative for the acquirer companies. In the case of target companies, the average abnormal returns on days -1 and 0 are 0.008% and 0.039% respectively.
The cumulative abnormal return during the 41-day window around the M&A announcement (-20, +20) is negative (-0.02%) and statistically significant. For the time windows surrounding the announcement period like (-15, +15), (-10, +10), (-5, +5), (-3, +3) there are low positive cumulative abnormal returns. The comparison of these results reveals that shareholders of both the acquirer and the target companies experience cumulative abnormal returns, which are positive and statistically significant.
Kashiramka & Rao (2012) examine the abnormal returns near the M&A announcements for target companies in Indian IT and ITes sector during 1999 to 2009. Using the standard event study methodology, cumulative average abnormal returns are estimated using single factor market (SFM) model and multiple factor market (MFM) model. Target firms on an average gain significantly on the announcement of an acquisition; in case of mergers, positive wealth gains are made but they dissipate in post announcement period. Both the SFM and the MFM models yield the same result.
Kumar & Kumar (2013) examine the impact of merger announcements on shareholder’s wealth for the bidder banks in India, focusing on three stock characteristics namely, stock returns, volatility and liquidity of the bidder banks. They find that the merger announcement has a mixed impact on returns of the bidder banks. Five banks had significantly positive abnormal returns; four banks have significantly negative abnormal returns and four banks show no significant abnormal return.
2.2. Studies Abroad
Asquith et al. (1983) while examining the takeover bids during 1962-1976 observes that unsuccessful target firms has significantly positive return of 7.0% on the day of the announcement of the bid, and unsuccessful acquirer firms witness positive return of 0.5% on the announcement day and −0.2% on the outcome day. The study reveals that acquirer companies witness significant positive abnormal returns during the 21 day run during the pre-announcement period.

57 | P a g e
Mitchell & Lehn (1990) examine abnormal returns of 228 hostile targets, 240 friendly targets, and 232 bidders in US during 1980-88. They observe abnormal returns of −1.66% four acquiring firms that are restructured following the bid and 0.70% to acquiring firms that are not restructured in the post-bid period (both significant).
Smith & Kim (1994) examine the abnormal returns of 177 bidders and targets companies in US during the window 5 days before the initial bid and 5 days later. They observe that bidders lose −0.23% over −1 to 0 days (significant). However, they also observe 0.7% (insignificant) abnormal returns for bidders in tender offers during the fourth M&A wave.
Gregory (1997) suggests significant abnormal returns from −8.15% to −11.25% over the 24-month post-acquisition period. He evaluates of post-takeover performance of a sample of 420 UK firms for transactions occurred during 1955-1985.
Holl & Kyriazis (1997) examine the relationship between, wealth creation and bid resistance for a sample of 178 successful takeover bids during 1979-1989 in the U.K. using event study approach. The results report the presence of managerial and financial synergy but the absence of operational synergy and negative abnormal returns of −1.25% to bidders two months after the bid announcement (significant).
Walker (2000) examine abnormal returns during the five-day event window (-2, +2) for a sample of 278 acquisitions, 230 mergers and 8 tender offers happened during 1980-1996. The study reports presence of significant negative market adjusted abnormal return.
Frederikslust, Wal & Westdijk (2005) analyze a sample of 101 Dutch mergers for a period 1954 till 1997. They find overwhelming evidence in support of the proposition shareholders of target firms earn abnormal returns on M&A announcement, while the acquirer firms experience negative abnormal stock returns.
Higgins & Beckman (2006) examine market reaction to M&A announcement among Japanese companies during 1990 till the end of 2000 for 152 Japanese acquirers. The study observes that acquirers for domestic targets achieve significant cumulative abnormal returns over the 41-day period (CAR is 4.73%, significant at 5% level). While on the other hand, CAR of global acquirers is insignificant.
Ma, Pagan & Chu (2009) examine the behaviour of abnormal returns to shareholders of the acquiring firms around the date of mergers and acquisition announcements for ten emerging Asian countries. The Asian markets are significantly different than developed markets. Using a sample of 1,477 different M&A transactions in ten countries, the study concludes that stock markets have expected positive cumulative abnormal returns in three event windows: 2-day (0,1), 3-day (-1,0,1) and 5-day (-2,0,2). Statistically significant effects of information leakages on valuation of the firm are also observed.

58 | P a g e
Davis (2010) reports that raising capital acts as both a statistically and economically significant signal of a forthcoming takeover attempt, using sample of 1060 acquisitions during 1981-2006. He estimates short-run target cumulative average abnormal returns (CAARs) occurring at the time of bidding firm’s last announced capital raising prior to the acquisition, on average 225 days prior to the acquisition announcement date. The study observed statistically significant abnormal returns over the (-1, 0) period centered on the issue date announcement of the bidding firm. The study also offers partial explanation of the pre-announcement abnormal returns, supporting the market anticipation hypothesis as opposed to insider trading.
Alexandridis, Petmezas & Travlos (2010) compare the impact of M&A announcement in most competitive market economies with less competitive market economies during 1990-2007 period. Competitiveness of the markets is determined by the percentage of completed transactions of the listed companies. They classify US, UK and Canada as the most competitive countries. The mean (median) premiums paid in acquisitions in these countries are 41% (47%) higher than those paid in the rest of the world. Acquirers beyond US, UK and Canada get statistically significant (at the 1% level) abnormal gains of 1.56% around the acquisition announcement.
Sehgal, Banerjee and Deisting (2012) examine market reaction to M&A announcements in BRICKS countries during the period 2005-2009. Significant pre-event returns are observed for 5 out of 6 sample countries. Three of the BRICKS countries, i.e. India, South Korea and China provide significantly negative post-event returns while strong positive returns are observed in case of South Africa. They further observe that M&A announcements do not significantly alter the trading liquidity and pricing efficiency of the sample stocks. However, return volatility does decline on post event basis. They find the stock financed mergers to be value creating, cash financed mergers to be value destroying in the short run.
The above reviews bring out the fact that despite a number of studies focused on M&A announcement and their impact on shareholders wealth, there is dearth of clear upstanding that could be generalized. Studies in different countries at different stages of maturity of capital market offer different results in this regard.
3. METHODOLOGY
3.1. Data Collection
The sample companies are drawn from a population comprising of all Indian listed companies that went for some M&A event in the domestic market during 2005-2014, collected from Capitaline plus and Bombay Stock Exchange (BSE) website.

59 | P a g e
The ten years period of study (2005-2014) is chosen to ensure reasonable size of the sample. I have excluded M&As for whom the price and other information not available for a period of 121 days immediately preceding the M&A announcement and 20 days after M&A announcement. Cross border M&As are excluded. Initially, 356 acquirer companies and 194 target companies are identified to have carried out M&A transactions. Non-availability of share price and other information due to re-structuring, Non Listed companies and renaming of the companies particularly the target companies restricted the size of the sample. Finally, the sample consisted of M&A transactions relating to 205 acquiring companies and 137 target companies.
The data comprises of adjusted daily closing share prices and trading volume on BSE for the sample companies around the announcement date, drawn from Capitaline Plus. The data also includes information about the date of first public announcement of M&A deal.
3.2. Research Methodology
Standard Event study methodology, as developed by Fama & Fisher (1969), Jensen & Roll (1969) and Brown & Warner (1985), has been used for the purpose of this study. Capital markets react to the signals contained in the corporate events such as M&A announcement, stock splits, and earnings/dividend announcements. The studies using event study methodology use an appropriate ‘event window’ for the examination of share price returns and an appropriate ‘benchmark’ to calculate abnormal returns. Market return is generally used as the benchmark
return for calculating the abnormal return. Even though there is no overall consistency between the event windows chosen in existing studies, they can be broadly classified as being either short run or long run. Short run refers to days or months around the announcement of the bid, while long run refers to periods of months or years. The present study uses short run window.
We calculate post-announcement period’s cumulative abnormal return (CAR) for each acquirer and target Company as the sum of abnormal returns over the 20 days from initial public announcement of the bid including the day of M&A announcement. The event date labelled ‘day 0’ is the date of M&A announcement. CAR is also calculated for pre-announcement period of 20 days from -1 day to -20 day. Daily closing stock price series for the period of 141 days (day -120 to +20) is used for computing returns. The following paragraphs describe, in brief, the methodology used in computation of cumulative abnormal return (CAR), cumulative average abnormal return (CAAR) and other stock characteristics, along with testing the values for statistical significance.

60 | P a g e
(a) Computation of CAR
For the purpose of individual analysis, CAR is computed for each of the sample companies. The date of M&A announcement is labelled as ‘day 0’. Daily closing stock price series for the period of 141 days (day -120 to day +20) is used for computing returns. This daily price series is
converted into daily lognormal return series using the formula ln � 𝑃𝑃𝑖𝑖 ,𝑡𝑡𝑃𝑃𝑖𝑖 ,𝑡𝑡−1
�.
Where Ri,t is the return on Day t for the stock i, Pi, t and Pi, t-1 are the closing prices on days t and t-1 respectively of the stock I and benchmark return is calculated using BSE Sensex.
Next, we use the single factor market model (Sharpe, 1963), which relates the return of a security to the return of the market index as shown:
(Where E[εi,t ] = 0 and Var[εi,t ] = σ2 )
Εi where Ri,t and Rm, t are the Day t returns on security i and the market index respectively. ε i,t
is the zero mean error term and αi, βi and σ2 εi are the estimated parameters of the market model.
The single factor market model is estimated using Ordinary least squares (OLS) regression. The estimation window comprise of 100 days (day -120 to -20). With the help of this procedure, values of α and β, for our event window (day -20 to +20) are obtained. These estimated values of parameters are used to obtain values of expected returns for each day of event window.
The single factor market (SFM) model has been used for estimating the parameters because this is the most widely used model for estimating abnormal returns as it is considered to be simple yet robust under various circumstances. (Wooldridge & Warner, 1985) Moreover, in the Indian context, results with multiple factor model indicated similar results as for single factor model with respect to the direction of CAAR (either positive or negative) and also in terms of significance of the results in almost all windows (Kashiramka & Rao, 2012)
Next step is to define the abnormal return for each day during the 41 days event window, which is obtained as follows:
Where (Actual Return)i,t is the realized return of the security i on day t and (Expected Return) it is calculated according to equation 2 for Ri,t. The daily abnormal returns are computed for the pre-event window, (day -20 to day -1) and the for the post event window (day 0 to day +20).

61 | P a g e
For the purpose of analysis and drawing inferences about the impact of M&A announcement, the abnormal returns are aggregated for pre-event window and post- event window. The aggregation is carried out along 2 dimensions: through time for each stock (Cumulative Abnormal Return or CAR) and across stocks for each day (Average Abnormal Return or AAR).
The Cumulative Abnormal Returns (CARs) for the stocks are obtained as follows:
Where CARi and CARj are the pre-event and post-event Cumulative Abnormal Returns, respectively.
The CAR values are standardized as follows:
Where SECAR is the standard error of CAR calculated as:
Where 𝜎𝜎𝑠𝑠 are the standard deviations of the abnormal returns (ARs), for the pre-event and post-event periods. Here, T=20 for pre-event window and T= 21 for the post-event window.
The SCAR values follow t-distribution and hence, compared to t-statistic, at 5% confidence level, 2-tailed with (T-1) degrees of freedom. This procedure is used to find which of the sample companies have significant abnormal returns in the pre-event and post-event windows and is used for individual analysis.
For aggregate analysis, average of abnormal returns on stocks of all the sample companies, for each day in the event window is computed. The average for each day is called Average Abnormal Return (AAR) for that day. The AARs are cumulated for the pre-event and post-event windows to obtain CAARi and CAARj respectively. The CAARs are standardized as follows:
where SECAAR is the standard error of CAAR:

62 | P a g e
Where T is the number of days in the event window (20 days in pre-event and 21 days in post-event window)
σp is given by the Markowitz Portfolio formula:
where n = number of sample companies and T is the number of days in the event window (20 days in pre-event and 21 days in post-event window)
The SCAAR values follow t-distribution and now compared to t-statistic, at 5% confidence level, 2-tailed. This allows us to find significant average abnormal returns in the pre-event and post-event windows. We also perform aggregate market analysis using CAAR methodology. However, in this case, we take the average daily abnormal returns for all the sample companies before proceeding with further estimation.
In order to examine the impact of M&A announcement on other stock characteristics, changes in the trading volume and stock price volatility are observed. For testing any changes in trading activity, the data regarding total number of shares traded each day in the event window is used. For pre-event and post event windows, the average of logarithm of the daily trading volumes are calculated for each of the sample companies.
For evaluating the significance of change in trading volume, we use the two-sample pooled t-test, equal variances, at 5% significance level.
Here the assumptions are that of normal populations (or T1 + T2 > 40) and independent observations and that population standard deviations, σ1 = σ2 where σ1 and σ2 are unknown.
T1 = sample 1 size, T2 = sample 2 size, s1 = sample 1 standard deviation, s2 = sample 2 standard deviation

63 | P a g e
3.3. Research Hypotheses
The study postulates and tests the following research hypotheses:
Impact of M&A announcement on Stock Returns (Pre-Announcement Period)
Null Hypothesis (H00): M&A announcement have significant impact on Stock Returns of Acquirer Company and Target Company in Pre-Announcement period.
Alternate Hypothesis (H11): M&A announcement have insignificant impact on Stock Returns of Acquirer Company and Target Company in Pre-Announcement period.
Impact of M&A announcement on Stock Returns (Post-Announcement Period)
Null Hypothesis (H20): M&A announcement have significant impact on Stock Returns of Acquirer Company and Target Company in Post-Announcement period.
Alternate Hypothesis (H21): M&A announcement have insignificant impact on Stock Returns of Acquirer Company and Target Company in Post-Announcement period.
Relationship of Abnormal Returns (Pre and Post Announcement Period)
Null Hypothesis (H30): Significant Relationship of Abnormal Returns of Acquirer Company and Target Company.
Alternate Hypothesis (H31): Insignificant Relationship of Abnormal Returns of Acquirer Company and Target Company.
Impact of M&A announcement on Stock Return Volatility
Null Hypothesis (H40): M&A announcement have insignificant impact on stock return volatility of Acquirer Company and Target Company.
Alternate Hypothesis (H41): M&A announcement have significant impact on stock return volatility of Acquirer Company and Target Company.
Impact of M&A announcement on Trading Liquidity
Null Hypothesis (H51): M&A announcement have insignificant impact on trading liquidity of Acquirer Company and Target Company.
Alternate Hypothesis (H51): M&A announcement have significant impact on trading liquidity of Acquirer Company and Target Company.
In addition to testing of the above hypothesis, Abnormal Returns in Different Time Windows is also studied to help investment analysts in developing profitable trading strategies.

64 | P a g e
4. M&A Announcement And Shareholder’s Wealth: Acquirer Company In this section, an attempt has been made to examine the impact of M&A announcement on stock returns and other stock characteristics of the acquirer companies included in the sample. This section has been divided into three sub-sections.
4.1: M&A Announcement and Stock Returns
This section focuses on the impact of M&A announcement on stock returns for the acquiring companies. Generally, one would expect the impact of M&A announcement on stock returns only after the announcement is made. However, it has been noticed that in many cases there has been a significant change in the share prices during the pre-announcement period. The present study examines the impact on M&A announcement both during the pre-announcement period and post-announcement period. The study also examines the relationship between the post-announcement period abnormal returns with the pre-announcement period abnormal return.
4.1.1: Post-Announcement Period
The relationship between M&A announcement and stock returns is examined for the post announcement period (0 day to +20 days).
Summary of Post-Announcement (CARj)
Individually, the number of cases where the CAR is significant is 101 out of 205 cases (50%). This would mean that semi strong efficiency does not hold for acquirer company stocks with regard to M&A announcement, at individual company level. Out of the cases where CAR is significant, in 50 cases CAR is positive and in 51 cases, it is negative. Thus, the results are mixed and there are equal chances of positive and negative abnormal returns.

65 | P a g e
On an aggregate basis, CAARj is negative and though statistically not significant. It stood at -0.57% for the twenty days period. As there are almost equal numbers of significantly positive and negative cases, the abnormal returns in a portfolio may be offsetting, thus explaining the aggregate results. Thus, at the portfolio level, abnormal returns are not statistically significant due to offsetting of negative abnormal returns by positive abnormal returns, individually. Thus, the hypothesis that “M&A announcement have significant impact on Stock Returns” is not supported at the aggregate level. Though, it cannot be rejected at company level analysis as in half of cases, significant abnormal returns are observed during the post-announcement period significant abnormal returns exist in half of the cases.
The above findings are consistent with the finding of a number of studies regarding M&As in India (Sehgal, Banerjee & Deisting, 2012; Kumar & Panneerselvam, 2009; Sehgal, Singh & Choudhary, 2005) and M&As abroad (Mitchell & Lehn, 1990; Smith & Kim, 1994; Walker, 2000).
These findings offer valuable inputs for investment analysts. Although, at the portfolio level, abnormal returns are not statistically significant, due to offsetting of negative abnormal returns by positive abnormal returns, in a large proportion of cases, there are significant abnormal returns after M&A. Thus, the investment analyst cannot ignore the information regarding the M&A deals. One need to be selective in this regard as there may be other factors such as mode of investment financing used for the transaction which may influence the direction of the abnormal returns on such stocks.
4.1.2: Pre-Announcement Period
Developed countries have well developed regulatory framework for corporate governance and investor protection. However, in the emerging market economies like India, such framework is at its infancy and there is lack of strong enforcement mechanism to ensure that insiders are not able to exploit their advantage of having access to information, which other shareholders do not have. Thus, information leakages may take place in such markets. Such leakages may be reflected in the movement of stock prices during the period prior to the announcement of M&A. Even in mature markets, pre-announcement effect of M&A has been observed. Therefore, in the present study, an attempt has also been made to examine the impact of M&A announcement during the pre-announcement period taking the 20 days window (-1 day to -20 day).

66 | P a g e
Summary of Pre-Announcement (C)
Individually, more than two-third (70%) of the sample companies witnessed statistically significant CAR values during the pre-announcement period. Out of 205 acquirer companies in the sample, 41% have positive and significant pre-announcement period CAR values, as compared to 25% during the post-announcement period. However, only 28% of companies have significant negative CAR during the pre-announcement period. Individually, it is more likely that CAR is significantly positive than negative during pre-announcement period. On aggregate level, for all acquirer companies as a whole, the CAAR is positive (4.89%) and statistically significant at 5% level of significance, during the pre-announcement period.
Thus, the hypothesis that “M&A announcement have significant impact on Stock Returns” is supported, both for the individual level analysis as well as aggregate level analysis. However, in the individual level analysis, the results are mixed with regard to direction of abnormal returns and positive abnormal returns occur more often than negative abnormal returns, during the pre-announcement period. On aggregate basis, there are positive and significant abnormal returns. The results in the aggregate level analysis are consistent with that in the individual level analysis as the positive abnormal returns occur more often that the negative abnormal returns.
The existence of statistically significant CAR in many cases during the pre-announcement period points toward possibility of leakages of M&A information which may be exploited by the market traders on pre event basis. As CAR is statistically significant in majority (70%) of the cases and not in exceptional cases, and it should be matter of concern for the market regulator (viz. SEBI). This reflects the inefficiency of the market and needs to be corrected for healthy development of the market. SEBI should improve it surveillance mechanism regarding price manipulation and insider trading, particularly around the M&A announcement.
The results of the study provide clinching evidence in support of the contention that market reacts significantly to any leakage of information regarding possible M&A deal before the date of announcement, as it does exhibit significant abnormal returns in the pre-announcement period. These abnormal returns could arise either due to the rumours or possible leakage of information regarding the impending M&A announcement resulting in reactions from some of the players even before the public announcement of M&A deal. For the regulator, it may be difficult to regulate and completely eliminate the possibility of rumours. But if the pre-announcement period

67 | P a g e
CAR arises due to leakage of information, it reflects weak regulation and presence of insider trading. In the following analysis, an attempt has been made to examine this issue and determine whether the significant pre-announcement CAR could be attributed to rumours or to leakage of information.
4.1.3: Post-Announcement and Pre-Announcement Windows
An important research question is whether there exists any significant relationship between CAR in the post announcement period and that in the pre-announcement period. An understanding of such relationship could help in investment decision during the post-announcement period. The nature and direction of such relationship could also provide some clues regarding the reasons and sources of abnormal activity and CAR during the pre-announcement period.
In order to examine the relationship between the pre-announcement CAR and post-announcement CAR, the sample companies are divided into three sets. Set I consisted of the cases in which pre-announcement CAR (CARi) is found to be positive and statistically significant. Set II contained cases in which pre-announcement CAR (CARi) is found to be negative and statistically significant. The remaining cases are those in which CARi is not found to be statistically significant and are included in Set-III. For each of the cases in the three sets, individual comparisons are made between the pre-announcement CAR and post-announcement CAR.
Summary of Relationship between Pre (CARi) and Post (CARj)
As may be observed, out of 85 cases where the pre-announcement CAR is positive, in almost one-fourth of the cases (26%), post-announcement CAR is also positive. For the remaining 63 cases where the pre-announcement CAR is positive, in 13 cases post-announcement CAR is negative and in 50 cases it is statistically insignificant. Thus, a negative post-announcement only in 15% of the cases follows a positive pre-announcement CAR. The results indicate that in most cases where market builds up positive expectations prior to the event date, the pre-event

68 | P a g e
optimism seems to die out immediately after the event, when the terms and conditions of M&A deal are publicly known. This may happen due to the belief that the synergy gains have been over-estimated or due to the belief that overbidding of Target Company resulting in its higher valuation. It is only 26% of the cases where market builds up positive expectations prior to the event date, the pre-event optimism continues even after the M&A announcement.
Above results indicate that the direction of the pre-announcement CAR for the acquirer companies provides useful information regarding the direction of CAR in the post announcement period. Thus, the hypothesis “Significant Relationship of Abnormal Returns during Pre and Post Announcement period” is supported. Further, it may be generally concluded that for shares of acquiring companies, the positive or negative expectations built-up during pre-announcement period tend to die out more quickly than in cases where there are no significant expectations.
The above findings offer important clues for the investment managers, who might be looking for opportunities for extra normal returns around the date of announcement of M&A deals. Thus, in case of shares of acquirer companies, there is significant relationship between abnormal returns during the pre-announcement period and post announcement period.
4.2: M&A Announcement and other Stock Characteristics This section is devoted to the discussions regarding the impact of two important stock characteristics that may have impact on the shareholder’s wealth. 4.2.1: M&A Announcement and Volatility An important characteristic of share prices is the degree of volatility in the stock returns. Generally, increase in volatility will have negative impact on shareholder’s wealth and decreased stock return volatility will have value creation effect for the shareholders. In this study, an attempt is made to compare the volatility in share prices before and after the merger announcement during the pre-event and post event windows. In other words, the volatility is measured for the window - 1 to -20 days for pre-announcement period (σi2) and the window 0 to +20 days for the post-announcement period (σj2). Variance in stock returns has been used as a measure of volatility. The impact of merger announcement on stock return volatility has been examined on daily returns. The ratio between σi2 and square of σj2 for each of the sample companies is computed for the purposes of comparison. The below summary presents the pre-announcement (σi2) and post-announcement volatility (σj2).
Summary of M&A Announcement and Change in Return Volatility

69 | P a g e
Impact of M&A announcement on volatility would depend upon the difference in the expected risk of integration and the diversification gains that may accrue in case the cash flows of the two companies are imperfectly correlated. In majority of the cases (57%), there is no significant change in the volatility. Among the cases, where the volatility did change significantly, more commonly it is increase in volatility.
Thus, the hypothesis “M&A announcement have insignificant impact on stock return volatility” is supported. The above results are consistent with the findings of Kumar et al. (2013) but contrary to the findings of Sehgal, Banerjee & Deisting (2012). The findings differ perhaps due to the difference in the period of study.
4.2.2: M&A Announcement and Trading Liquidity Liquidity, as a characteristic of an asset, reflects the degree to which it can be bought or sold in the market without affecting its price. Liquidity in the context of securities is characterized by high level of trading activity as reflected in the trading volume. Increased in trading liquidity of a share would generally mean value creation and any decline in the trading liquidity will have negative effect on the shareholder’s wealth. In order to examine, the impact of M&A announcement on trading liquidity, changes in the daily trading volumes in terms of number of shares are compared during the pre-announcement period and post-announcement period. Trading liquidity is estimated by first calculating natural log of the daily trading volumes and then finding the means of the pre-announcement (µi) and post announcement (µj) windows. The difference between the means is tested using t-test. The t-value is ascertained by dividing this difference by the standard error. Pre-event trading liquidity has been calculated from -1 to -20 days and is termed as µi. Post-event trading liquidity has been calculated from 0 day to +20 days and is termed as µj. The results are tested at 5% level of significance.
Summary of M&A Announcement and Change in Trading Liquidity
As may be observed, in more than half of the cases (59%), there is no significant change in the liquidity after the M&A announcement. In 24% cases, there is significant increase in the trading liquidity and in 17% cases there is significant decrease in the liquidity. Thus, M&A announcement have insignificant impact on trading liquidity. These results are consistent with the findings of Sehgal, Banerjee & Deisting (2012) and Kumar et al. (2013).

70 | P a g e
The results indicate that return volatility and trading liquidity characteristics of sample acquirer stocks do not vary significantly in the pre and post-event period. This is not surprising in light of the fact that there seems to be pre-event leakage of information. The informational content start getting reflected in the stock characteristics even prior to the event date, resulting no significant difference in pre-and post-event volatility and liquidity for majority of sample stocks. From the perspective of investment analyst, stock return volatility trading liquidity does not seem to provide any additional information for framing trading strategies.
4.3: Average Abnormal Returns in Different Time Windows
We analyze the behaviour of average abnormal returns for the acquirer companies during different time windows. Such an analysis may be useful in understanding the pattern of price reaction and also in formulating profit making trading strategies.
4.3.1. Post-Announcement Period For generating abnormal returns, the behaviour of average abnormal returns (AARs) and cumulative average abnormal returns (CAARs) are examined for 20 windows, each window being bigger than the previous one by a day. AARs, CAARs and the t-values for various time windows during the post announcement period of 20 days. (day 0 to day 20) An analysis of direction of AARs during the post announcement period for the acquiring companies suggests no specific pattern. However, a noteworthy feature of AARs in this window is that AAR for the day 0 is positive (1.13% for a day) and exceptionally higher than those for the other days in the window. CAAR for acquiring companies is statistically insignificant for each of the windows during the post-announcement period, except for windows 0, 10; 0, 11 and 0, 12. This explains the insignificant CAAR for the post-announcement period. Moreover, the cumulative average abnormal returns tend to die out after first 13 days. Thus, it may be concluded that opportunities for abnormal returns are rare on the shares of acquirer companies during the post-announcement period.

71 | P a g e
Summary of Average Abnormal Returns Post-Announcement Period
Moreover, significant cumulative average abnormal returns are not necessarily clustering in the narrow windows close to the date of announcement and may occur at later dates but the interest of the investor in these shares starts fading away after 10 days of M&A announcement. It may also be noted that the CAAR for the window (11, 20 days) is negative and statistically significant. This implies that after the 10 days, the CAAR is negative and significant and positive returns are primarily in the first 10 days of announcement.
4.3.2. Pre-Announcement Period An analysis of the behaviour of AAR and CAAR during the pre-announcement period is examined during 20 windows, each window being bigger than the previous by a day.
Summary of Average Abnormal Returns Pre-Announcement Period
As may
be
observed, AAR is positive from day -4 to -1. It is reminded that CAAR for the pre-announcement window (day -1 to -20 days) is positive (0.048868) and significant. CAAR for acquiring companies is positive and statistically significant for each of the windows during the pre- announcement period without any exception. This explains the positive and significant CAAR for the pre-announcement period. Moreover, the cumulative abnormal returns show a

72 | P a g e
tendency to increase as we expand the window, indicating that average abnormal returns are high as early as 20 days before the M&A announcement. It is interesting to note that CAAR is 0.028387 and statistically significant during the window -11, -20 day, as compared to CAAR is 0.020480 for the window -1, -10. Thus, it may be concluded that there are opportunities for generating abnormal returns in each of the windows selected during the pre-announcement. Moreover, it is also observed that longer is the window, greater is the value of CAAR during the 20 days pre-announcement period and positive AARs are higher in the earlier half of the window as compared to the one close to the date of announcement.
4.3.3. During 41 Days around the Date of Announcement
An attempt is also made to examine the behaviour of cumulative abnormal returns during the time windows covering both the pre-announcement and post-announcement period. For this purpose, 20 windows are formed by adding one day before the announcement and one day after the announcement to the previous window.
As may be observed, CAAR for acquiring companies is positive and statistically significant for each of the windows during the 41-day period around the date of announcement, without any exception. This is perhaps because of high positive abnormal returns during the pre-announcement period and insignificant average abnormal returns during the post-announcement period. However, the cumulative abnormal returns do not exhibit any fixed pattern of behaviour in either direction. This is perhaps due to the negative though insignificant average abnormal returns during the post-announcement period. Thus, it may be concluded that there are opportunities for generating abnormal returns in each of the windows selected during the 41-day period around the date of announcement date.
Summary of CAAR around the Announcement Date

73 | P a g e
Summary of AAR around the Announcement Date
The above chart points towards an important window that offers opportunities for developing trading strategies is -4, 0. For this five-day window, the CAAR is 3.15%, which is very high for such a short window. Another window of opportunity for developing profitable trading strategy is -19,-20 which has a CAAR of 2.01% for a small window of 2 days. The investment manager can go long during these windows and earn extra-normal returns. For the remaining period, no specific pattern is observed.
5. M&A Announcement And Shareholder’s Wealth: Target Company
While an acquiring company is expected to create value through synergies when it acquires a target company, the shareholders of target can be lured to sell their shares if acquirer offers a substantial premium. This premium should immediately reflect in the share price of target. This section examines the impact of M&A announcement on stock returns and other stock characteristics of the target companies included in the sample.
5.1. M&A Announcement and Stock Returns
This section focuses on the impact of M&A announcement on stock returns for the target companies during the pre-announcement period and post-announcement period.
5.1.1 Post-Announcement Period
The impact of M&A announcement on stock returns is examined for the 20 days period (day 0 to +20).
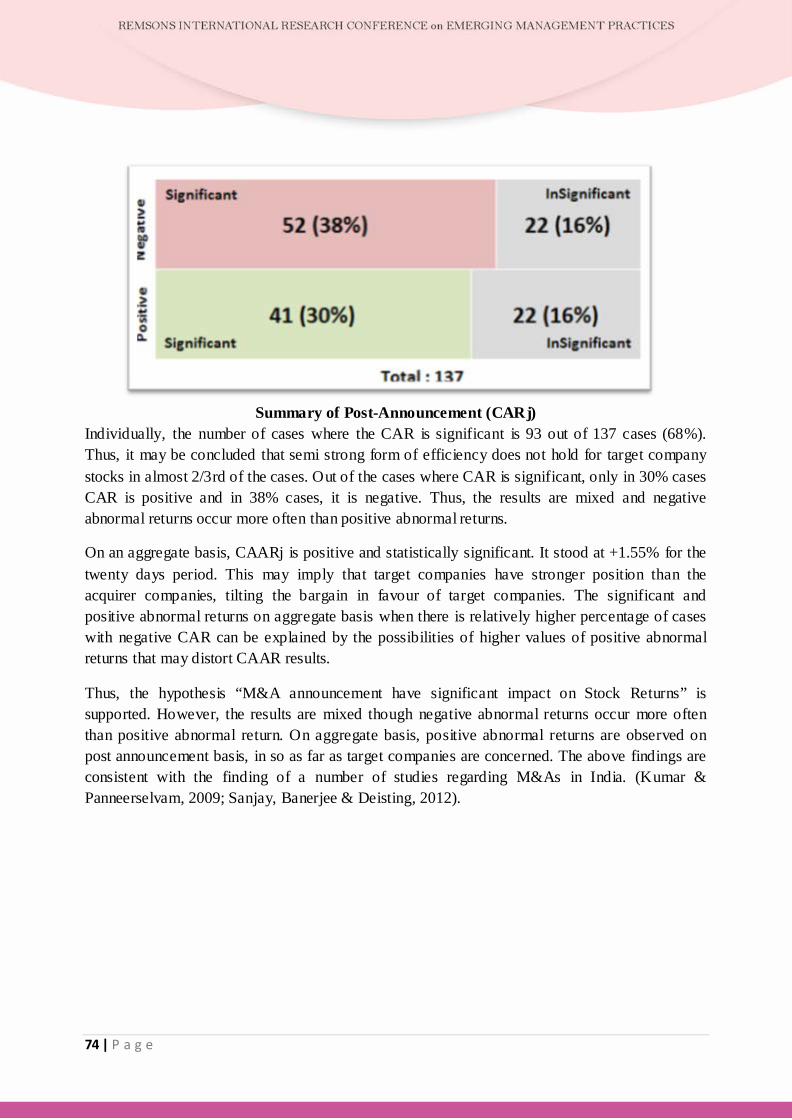
74 | P a g e
Summary of Post-Announcement (CARj) Individually, the number of cases where the CAR is significant is 93 out of 137 cases (68%). Thus, it may be concluded that semi strong form of efficiency does not hold for target company stocks in almost 2/3rd of the cases. Out of the cases where CAR is significant, only in 30% cases CAR is positive and in 38% cases, it is negative. Thus, the results are mixed and negative abnormal returns occur more often than positive abnormal returns.
On an aggregate basis, CAARj is positive and statistically significant. It stood at +1.55% for the twenty days period. This may imply that target companies have stronger position than the acquirer companies, tilting the bargain in favour of target companies. The significant and positive abnormal returns on aggregate basis when there is relatively higher percentage of cases with negative CAR can be explained by the possibilities of higher values of positive abnormal returns that may distort CAAR results.
Thus, the hypothesis “M&A announcement have significant impact on Stock Returns” is supported. However, the results are mixed though negative abnormal returns occur more often than positive abnormal return. On aggregate basis, positive abnormal returns are observed on post announcement basis, in so as far as target companies are concerned. The above findings are consistent with the finding of a number of studies regarding M&As in India. (Kumar & Panneerselvam, 2009; Sanjay, Banerjee & Deisting, 2012).

75 | P a g e
5.2. Pre-Announcement Period
M&A announcement is one of the biggest events in the life of a company that is being acquired. With wide spread consensus on the possibilities of positive impact on share prices of target companies, corporate insiders can take undue advantage of prior access to information regarding M&A transaction, resulting in significant abnormal returns much prior to the public announcement of M&A. Even in developed markets like USA, a great deal of insider trading takes place before M&A announcements, in spite of the fact that such countries have well-developed regulatory framework for corporate governance and investor protection. In August 2006, the New York Times reported that securities of over 40% of the companies receiving buyout bids exhibited suspicious trading in the weeks before the deals became public. In the emerging markets like India, information leakages may take place resulting in abnormal returns in pre-announcement period.
In this section, I examine impact of M&A announcement on the share prices of target companies, during pre-announcement period taking 20-day window (day -1 to day -20).
Summary of Pre-Announcement (CARi)
On individual basis, almost three-fourth (71%) of the sample companies witnessed statistically significant CAR during the pre-announcement period. Out of 137 target companies in the sample, 56 (41%) have positive and significant pre-announcement period CAR values as compared to 41 (30%) companies have significant negative CAR during the pre-announcement period. For all the target companies as a whole, the CAAR is positive 3.15% and statistically significant at 5% level of significance, during the pre-announcement period. These results are consistent as the proportion of positive CAR cases is higher than that of negative CAR cases in the pre-announcement period.
Thus, M&A announcement have significant impact on Stock Returns. However, results are mixed and positive abnormal returns occur more often than negative abnormal returns, during pre-announcement period. These results are consistent with the findings of earlier studies in India (Kumar & Singh, Kumar & Panneerselvam 2009, Sanjay, Banerjee & Deisting, 2012)

76 | P a g e
The existence of statistically significant CAR in vast majority (71%) of the target companies during the pre-announcement period points toward possible leakage of M&A information, which may be exploited by the corporate insiders during the pre-event period. For the target companies, significant abnormal returns in the pre-announcement period are witnessed, which could be caused by rumours or possible leakage of information regarding the M&A transaction before the public announcement of M&A deal. For the regulator, it may be difficult to regulate and completely eliminate the possibility of rumours. But the market regulator should be concerned if the pre-announcement period CAR exists due to leakage of information, as it reflects weak regulation and possible presence of insider trading.
So, I conclude that the market believes that shares of target companies to be relatively underpriced. The market participants seem to pre-empt this information and the optimism continues even after M&A announcement. Empirical results support the investor behaviour as significantly positive CAAR values are observed both on pre as well as post-event basis.
5.3. Relationship between Abnormal Returns for Target Companies in Post-Announcement and Pre-Announcement Windows
The relationship between CAR in the post announcement period with that of the pre-announcement period, could be interesting as it may provide some insight into the causes of abnormal returns and CAR during the pre-announcement period. In the following analysis, an attempt has been made to examine the relationship between pre-announcement CAR and post-announcement CAR. To examine the relationship between pre-announcement CAR and post-announcement CAR, target companies are divided into three sets. Set I consisted of the cases in which pre-announcement (CARi) is found to be positive and statistically significant. Set II, contained cases in which pre-announcement (CARi) are found to be negative and statistically significant. The remaining cases are those in which CARi is not found to be statistically significant and are included in Set-III.

77 | P a g e
Summary of Relationship between Pre (CARi) and Post (CARj)
As may be observed, out of 56 cases where the pre-announcement CAR is positive and significant, in one-fourth of the cases (15), post-announcement CAR is also positive. In other words, only in 27% of the cases, positive pre-announcement CAR is followed by positive post announcement CAR. In slightly greater proportions (33%), positive pre-announcement CAR is followed by negative post-announcement CAR. Seems that in most cases where market builds up positive expectations prior to the event date, the pre-event optimism seems to die out immediately after the event, when the terms and conditions of M&A deal are publicly known. Further, the possibility of optimism (positive CARi) giving way to pessimism (Negative CARj) is very low (33%).
Out of 41 cases where the pre-announcement CAR is negative, only in 11(27%) cases, post-announcement CAR is positive. Negative pre-announcement CAR is followed by a negative post-announcement CAR in 45% of the cases. The results indicate that in the case of negative CAR, the market is absorbing the information relatively slow as negative pre-announcement CAR is followed by negative post announcement CAR in 45% of the cases. It seems that if market builds up negative expectations prior to the event date, there are more chances that pre-event pessimism continues after the event, when the terms and conditions of M&A deal are publicly known. Further, the possibility of pessimism giving way to optimism is very low (27%).
If there is no significant movement in the share prices during the pre-announcement period, it is less likely to result in insignificant CAR during the post-announcement period. In 40 cases the pre-announcement CAR is not significant. Out of these, in 38% cases, insignificant pre-announcement CAR is followed by positive post announcement CAR. The post-announcement CAR is found to be negative in 36% cases and statistically insignificant in only in 27% cases. Thus, insignificant CAR in pre-announcement period does result in some surprise element in the post event period and the positive CAR is as often as negative CAR in post announcement period. This leads to the conclusion that in case of target companies, if pre-announcement CAR is insignificant, reversal to significant (positive or negative) CAR is highly likely (72%) in the post announcement. Further, there are equal chances of insignificant CAR in pre-announcement

78 | P a g e
period giving way to positive or negative CAR in post-announcement period.
Above results indicate that the direction of the pre-announcement CAR for the target companies does provide some clues regarding the direction of CAR in the post announcement period. Thus, the hypothesis that “Significant Relationship of Abnormal Returns during Pre and Post Announcement period” is supported. Further, it may be generally concluded that positive and expectations built-up during pre-announcement period die out more quickly than the negative expectations.
The above findings offer important clues for the investment managers, who might be looking for opportunities for extra normal returns in the share prices of target companies around the date of announcement of M&A deals. It may be concluded that pre-announcement positive CAR is an early warning of most likely negative or insignificant CAR in the post announcement period, with the exceptions limited to only one-fourth of the cases. Pre-announcement negative CAR is also more likely followed by negative CAR in the post announcement period. If the pre-announcement CAR is insignificant, it is highly likely that it will be followed by significant positive or negative CAR in the post announcement period.
Thus, in case of shares of target companies, there is significant relationship between abnormal returns during the pre-announcement period and post announcement period. Further, it may be generally concluded that positive expectations built-up during pre- announcement period die out more quickly than the negative or insignificant expectations.
5.4: M&A Announcement and other Stock Characteristics
This section is devoted to the discussions regarding the impact of two important stock characteristics that may have impact on the shareholder’s wealth. These are stock return volatility and trading liquidity of the shares of the target company.
5.4.1: M&A Announcement and Return Volatility M&A announcement may have impact on the volatility in the stock returns. Generally, increase in return volatility will have negative impact on shareholder’s wealth and decreased volatility will have value creation effect for the shareholders. The return volatility is measured for the window - 1 to -20 days for pre- announcement period (σi2) and the window 0 to +20 days for the post-announcement period (σj2). Variance of stock returns has been used as a measure of volatility. The impact of merger announcement on volatility has been examined on daily returns. The ratio between σi2 and σj2 for each of the sample companies is computed for the purposes of comparison.

79 | P a g e
Summary of M&A Announcement and Change in Return Volatility
Impact of M&A announcement on volatility would depend upon the difference in the expected risk of integration and the diversification gains that may accrue in case the cash flows of the two companies are imperfectly correlated. As may be observed from the above table, in majority of the cases (62%), there is no significant change in the return volatility. Among the cases, where the volatility did change significantly, it is only decrease in volatility. Thus, the hypothesis that “M&A announcement have insignificant impact on stock return volatility” is supported.
The above results are consistent with the findings of Kumar et al. (2013) but contrary to the findings of Sanjay, Banerjee & Deisting (2012). The findings differ perhaps due to the difference in the period of study.
5.4.2: M&A Announcement and Trading Liquidity
Liquidity, as a characteristic of an asset, reflects the degree to which it can be bought or sold in the market without affecting its price. Liquidity in the context of securities is characterized by high level of trading activity as reflected in the trading volume. Increased in trading liquidity of a share would generally mean value creation and any decline in the trading liquidity will have negative effect on the shareholder’s wealth.
In order to examine the impact of M&A announcement on trading liquidity, changes in the daily trading volumes in terms of number of shares are compared during the pre- announcement period and post-announcement period. Trading liquidity is estimated by first calculating natural log of the daily trading volumes and then finding the means of the pre-announcement and post announcement windows. The difference between the means is tested using t-test. The t-statistic is ascertained by dividing this difference by the standard error. Pre-event trading liquidity has been calculated from -1 to -20 days and is termed as µi. Post-event trading liquidity has been calculated from 0 day to +20 days and is termed as µj. The results are tested at 5% level of significance.
Summary of M&A Announcement and Change in Trading Liquidity

80 | P a g e
As may be observed, in more than half of the cases (57%), there is no significant change in the trading liquidity during the M&A announcement. Only in 22% of cases, there is significant increase in the trading liquidity and in equal proportion of the cases; there is significant decrease in the trading liquidity.
Thus, the hypothesis “M&A announcement have insignificant impact on trading liquidity” is supported. The results are consistent with the findings of Sanjay, Banerjee & Deisting (2012).
5.5: Abnormal Returns for Target Companies in Different Time Window
An attempt is also made to analyze the behavior of cumulative average abnormal returns for the sample target companies during different time windows. Such an analysis may be useful in understanding the aggregate results and also in formulating profitable trading strategies.
5.5.1. Post-Announcement Period
It may be re-called that CAAR for the post-announcement window (day 0 to +20 days) is positive (+0.01546) and significant. In order to get some clues regarding the potential opportunities for generating abnormal returns, the CAAR is examined for the target companies during 20 windows, each window being bigger than the previous by a day.
Summary of Average Abnormal Returns Post-Announcement Period
As may be
observed, CAAR for target companies is statistically significant for each of the windows during the post-announcement period, without any exception. This explains the significant CAAR for the post-announcement period for the target companies. However, it may be noted that for the latter half of the post- announcement period (+11, +20), CAAR is negative and statistically significant, while the earlier half of the period (0, +10) has the positive and significant CAAR. This implies that the earlier gains in the first11 days of the post-announcement period are to some extent offset by the negative AARs in the remaining 10 days of the post- announcement period.

81 | P a g e
5.5.2. Pre-Announcement Period
An analysis of CAAR during the pre-announcement period is examined during 20 windows, each window being bigger than the previous by a day. Summary of cumulative daily average abnormal returns in the post announcement period of (day 0 to 20) is given below.
Summary of Average Abnormal Returns Pre-Announcement Period
As may be observed from the above table, CAAR for target companies is positive and statistically significant for each of the windows during the pre-announcement period without any exception. This explains the positive and significant CAAR for the pre- announcement period for the target companies. Moreover, the cumulative abnormal returns show a tendency to increase as we expand the window till 10 days prior to announcement, indicating that average abnormal returns are high as early as 10 days before the M&A announcement. It is interesting to note that CAAR is negative (-0.011514) and statistically significant during the window -11, -20 day, as compared to CAAR is 0.040006 for the window -1, -10. Thus, it may be concluded that there are opportunities for generating abnormal returns in both of these windows during the pre- announcement period. Going long during the 10 days prior to announcement and short- selling strategies during the -11,-20 windows may be profitable trading strategies in case of shares of target companies.
5.5.3. During 41 Days Around the Date of Announcement
An attempt is also made to examine the cumulative abnormal returns during the time windows covering both the pre-announcement and post-announcement period. For this purpose, 20 windows are formed by adding one day before the announcement and one day after the announcement to the previous window.

82 | P a g e
Summary of CAAR around the Announcement Date
As may be observed, AAR for target companies is positive and statistically significant for each of the windows during the 41-day period around the date of announcement, without any exception. This is perhaps because of high positive abnormal returns in narrow windows around the date of announcement. Interestingly, CAAR is highest during the window -10, +10. After that CAAR does not exhibit any specific pattern of behaviour in either direction. Thus, it may be concluded that there is some noticeable pattern in CAAR 20 days around the date of announcement, which offers opportunities for formulating profitable trading strategies. In the case target companies, positive CAAR is observed in the window (-10, +10) and also during the narrower windows.
Summary of AAR around the Announcement Date
In the above chart, two distinct windows deserve attention, the 10-day window (-6, +3) and 3 day window (1, +1). Both these windows exhibit positive CAARs. The 10 day window has a positive CAAR of more than 9.5% and the 3 day narrower window witnessed 5.35% CAAR. These CAAR values are very high and indicative of opportunities for formulating highly profitable trading strategies. Thus, I conclude that the investment analyst may be able to build profitable trading strategies during the10-day window (-6, +3) and 3-day window (1, +1).

83 | P a g e
6. FINDINGS AND CONCLUSIONS
The present section provides, in brief, the context and research design of the study along with a summary of the findings of the study and the implications emerging from these findings. It also identifies the contribution and the limitations of the study. Based on these limitations, the attempt has also been made to suggest directions of future research in the area.
6.1. Findings of the Study
The findings of the study can be broadly summarized under two broad heads namely, a) M&A announcement and shareholder’s wealth of Acquirer company, b) M&A announcement and shareholder’s wealth of Target company 6.2.1. M&A Announcement and Shareholder’s Wealth: Acquirer Company The results of this study offer very useful conclusions about the market reaction to M&A announcement for acquirer companies in India. On ex-post basis, individual analysis suggests that there is significant impact of M&A announcement on stock returns for almost half of the sample acquirer companies. In other words, the Indian stock market is not efficient in the semi-strong form with respect to M&A announcement information for acquirer companies. Thus, the investment analyst cannot ignore the information regarding the M&A deals. The results relating to the direction of price reaction are, however, mixed as positive abnormal returns occur as often as negative abnormal returns on post-event basis. On aggregate basis, CAARj is statistically not significant. It stood at -0.57% for the twenty days period.
During the pre-announcement period, more than two-third of the sample companies witnessed statistically significant CAR values. Individually, positive CAR occurs more often than the negative CAR during this period. At aggregate level, the CAAR is positive and statistically significant with a value of 4.89%. Thus, the study offers a clinching evidence for existence of significant abnormal returns even before the M&A announcement. The existence of statistically significant CAR in many cases during the pre-announcement period points toward possibility of leakages of M&A information which may be exploited by the market traders on pre event basis.
These findings are consistent with the finding of a number of studies regarding M&As in India (Sehgal, Banerjee & Deisting, 2012; Kumar & Panneerselvam, 2009; Sehgal, Singh & Choudhary, 2005) and M&As abroad (Mitchell & Lehn, 1990; Smith & Kim, 1994; Walker, 2000). It is further observed that the direction of the pre-announcement CAR for the acquirer companies provides useful information regarding the direction of CAR in the post announcement period. The study documents significant relationship between the pre and post-announcement abnormal returns for acquirer companies. Further, it may be generally concluded that for shares of acquiring companies, positive or negative expectations built-up during pre-announcement period tend to die out more quickly than in cases where there are no significant expectations.
As regards the impact of M&A announcement on other stock characteristics, no significant impact is observed on stock return volatility and trading liquidity, in so far as the acquirer

84 | P a g e
companies are concerned. In other words, return volatility and trading liquidity characteristics of sample acquirer stock do not vary significantly in the pre and post-event period. Hence, from the perspective of investment analyst, stock return volatility and trading liquidity do not seem to provide any additional information for framing trading strategies.
An analysis of post-event abnormal returns during various time windows also provides very useful clues for investment analysts. Observing the pattern of post- event CAARs for different short-term event windows, significantly positive CAAR of almost 1.10% is reported over the first 11 days (including the event day). This in contrast with CAAR during later half of the post event period (11,-20 day) which is -1.65%. Thus, investors seem to be optimistic in the first phase of post event period, which is followed by correction in the second phase resulting in negative returns. From the perspective of investment analyst, the best portfolio formation window seems to be (-4, 0 day), promising a cumulative return of about 3.15% for the 5 day period. Thus, the investment analyst can build profitable trading strategies by taking long positions in acquiring company’s stocks 4 days prior to the M&A announcement date and exit at the end of the event day.
6.2.2. M&A Announcement and Shareholder’s Wealth: Target Company
A number of implications emerge from the results of the study for the shareholders of target companies in India. On ex-post basis, individual analysis suggests that there is significant impact of M&A announcement on stock returns for more than two-third of the target companies in the sample. Hence, semi-strong form of efficiency is defied for Indian equity market in the case M&A information for the target companies, as well. Thus, M&A announcement is an event, which cannot be ignored by any investment analyst and information about the M&A deal can be highly useful in understanding the behavior of stock returns for target companies. The results relating to direction of price reaction are, however mixed. On aggregate basis, CAARj is positive and statistically significant. It stood at +1.55% for the twenty days period. This may imply that target companies have stronger bargaining position than the acquirer companies, tilting the terms of M&A deal in favor of target companies.
During the pre-announcement period almost two-third (71%) of the sample companies witnessed statistically significant CAR. The results support the contention that there is a possibility of leakage of information even before the announcement of M&A, which should be a matter of concern and investigation for the market regulator. Individually, positive CAR occurs more often than the negative CAR during this period. On aggregate basis, the CAAR for the target companies is +3.15% and statistically significant, during the pre-announcement period. These results are consistent as positive CAR occur more often negative CAR in the pre-announcement period. These findings are consistent with the findings of a number of studies regarding M&As in India (Sehgal & Banerjee 2012; Kumar & Panneerselvam 2009; Sehgal, Singh & Choudhary 2005) and M&As abroad (Mitchell & Lehn 1990; Smith & Kim 1994; Walker 2000).

85 | P a g e
As regards the relationship between the pre and post-announcement abnormal returns for target companies, the study documents that the direction of the pre-announcement CAR for the target companies does provide some clues regarding the direction of CAR in the post announcement. Further, it may be generally concluded that positive expectations built-up during pre-announcement period die out more quickly than the negative expectations. The results also indicate that pre-announcement positive CAR is an early warning of most likely negative or insignificant CAR in the post announcement period, with the exceptions limited to only one-fourth of the cases. An analysis of the stock return volatility and trading liquidity for the sample target companies indicates that there is no significant difference in these stock characteristics, on comparing pre and post event windows. These findings are similar to those for acquirer companies. On careful examination of CAARs over different short-term windows, interesting patterns are observed. CAAR is significant and positive for the first phase of 11 days (0,10 day) in the post event period, while it turns negative and statistically significant in the remaining 10 days (+11,+20 day) of the post event period. These findings are similar to those for acquirer companies. From the perspective of investment analyst, target company’s stocks provide more profitable trading strategies vis-à-vis the acquirer company’s stocks. The CAAR for the 10-day window (-6, +3 day) is about 9.5%. Investor can develop a trading strategy by going long on shares of target companies 6 days before the M&A announcement and exit by the end of third day in post announcement period.
6.3. Implications and Suggestions
The study has a number of implications for various stakeholders in M&A transactions. Some of the important implications for the shareholders of the acquirer companies, shareholders of target companies, investment analysts and market regulator are identified in the following paragraphs. The present study has a number of implications for an investment analyst, Moreover, existence of significant pre-announcement CAR indicates opportunities for abnormal returns, if the analyst is able to pre-judge the possible acquisition, using superior analysis. Further, the results of the study suggest that target company’s stocks provide more profitable trading strategies vis-à-vis the acquirer company’s stocks. It is possible to develop a profitable trading strategy by going long on shares of both acquirer as well as target companies a few days before the M&A announcement and exit by the within a day or so in post-announcement period. The study re-confirms the relationship between abnormal returns in the pre-announcement period and post announcement period. Thus, investment analysts can closely examine the pre-announcement abnormal returns to get some clues regarding the direction of abnormal returns. For example, in case of shares of acquiring companies, the positive or negative expectations built-up during pre-announcement period tend to die out more quickly than in cases where there are no significant expectations. However, for the shares of target companies, positive expectations built-up during pre-announcement period die out more quickly than the negative expectations. Further, the price reaction is much stronger during the narrower windows. These finding can help in designing trading strategies.

86 | P a g e
References:
Alexandridis G., Petmezas D. &Travlos, N.G.(2010). Gains from Mergers and Acquisitions Around the World: New Evidence, Financial Management, Winter 2010,1671-1695.
Anand M and Singh, J. (2008). Impact of Merger Announcements on Shareholders Wealth: Evidence from Indian Private Sector Banks. Vikalpa, Volume 33, No 1, January–March 2008, 35-54.
Brown. S. J. & Warner J.B. (1985). Measuring Security Price Performance. Journal of Financial Economics, (8), 1980, 205-258.
Davis F. J.(2010). Capital Punishment: Signaling Takeover Intentions by Raising Capital. Retrieved from
Fama E, Fisher L., Jensen M. C., & Roll, R. (1969). The adjustment of stock prices to new information. International Economic Review, 1969, vol. 10, 1-21.
Van Frederikslust Ruud, van der Wal Vincent, Westdijk Huib (2005). Shareholder Wealth Effects of Mergers and Acquisitions, EFMA annual meeting, Milan, Italy; retrieved on May 18, 2009 from http://www.efmaefm.org/efma2005/papers/262-vanfrederikslust_paper.pdf
Gregory, A. (1997). An examination of the long run performance of UK acquiring firms,. Journal of Business Finance and Accounting, 24, 971–1007.
Higgins, H. N. & Beckman, J. (2006).Abnormal returns of Japanese acquisition bidders- impact of pro-M&A legislation in the 1990s, Pacific-Basin Finance Journal, 14 (2006) 250–268.
Holl., P. & Kyriazis, D. (1997). Wealth creation and bid resistance in UK takeover bids. Strategic Management Journal,(18), 483–498.
Kashiramka S., & Rao, N.V.M. (2012). Do Target Firms Gain on M&A Announcement Evidence from Indian IT & ITeS Sector, International Journal of Research in Management, Issue 2, Vol. 5 (September-2012), 116-129
Kumar. B.R., Panneerselvam S. and Siddaganga S., (2009) Mergers, Acquisitions and Wealth Creation: A Comparative Study in the Indian Context. IIMB Management Review, pp. 222-244.
Kumar.M., Kumar S., & Deisting F. (2013). Wealth effects of bank mergers in India: a study of impact on share prices, volatility and liquidity, Banks and Bank Systems, Volume 8, Issue 1, 2013. 125-133
Ma., J., Pagan, J.A, & Chu, Y. (2009) Abnormal Returns to Mergers and Acquisitions in Ten Asian Stock Markets. International Journal of Business, 14(3), 2009.
Malhotra S.& Zhu, P. (2006). Shareholder Benefits and Firm Performance: An Empirical Analysis of International Acquisitions by Firms from a Developing Economy. (Sprott School of

87 | P a g e
Business, Carleton University, Ottawa, Canada. AIB-Se USA Annual Meeting, 2006.)
Mishra.A.K., & Goel, R. (2005). Returns to Shareholders from Mergers: The Case of RIL and RPL Merger. IIMB Management Review, September 2005. 69-80
Mitchell., M. L. & Lehn K. (1990). Do Bad Bidders Become Good Targets Journal of Political Economy, 98, 372-98.
Pandey A., (2001). Takeover Announcements, Open Offers, and Shareholder’s Returns in Target Firms. Vikalpa Vol. 26, No. 3, July-September 2001, 19-30.
Sehgal S., Banerjee S. & Deisting, F.(2012) The impact of M&A announcement and financing strategy on stock returns: Evidence from BRICKS markets. International Journal of Economics and Finance; Vol. 4, No. 11; 2012, 76-90
Sehgal S., Singh A., Choudhary, A., (2005). The Relationship between corporate takeovers and share prices for the target firms: Evidence for the Indian stock market. Journal of Accounting, Business and Management, Vol. 12 (2005), 171-186.
Smith A. & Kim, J. (1994). The combined effects of free cash flow and financial slack on bidder and target stock returns. Journal of Business, 67, 281– 310.
Walker, M. (2000). Corporate Takeovers, Strategic Objectives and Acquiring Firm Shareholder Wealth. Financial Management, 53– 66.

88 | P a g e
Co-Integration of Indian Stock with US Stock Market
Dr. Abhay Kumar
The paper investigates long term relationship of Indian stock market with US stock market. Daily closing data of NASDAQ and Nifty leading index of US stock market and Indian market was obtained from Bloomberg. Total 4600 datasets for 11 years from 01 January 2004 to 30 December 2014 were collected. After cleaning 2416 synchronized data set is used for analysis. The researcher has employed Johansen Co-integration test and Granger causality test to confirm co-movements and causal relationship of Indian stock markets with the markets of developed countries. Unit root test using dickey fuller, augmented dickey fuller and Philip & Peron test is employed to check stationarity of the series. Unit root test suggest the indices are I (1) process. Johansen Co-integration test by both Trace test and Eigen value test confirms no co- integration of Indian financial market with US market. Unrestricted VAR test confirms lag 1 and lag 2 of NIFTY is significant to influence NDX. Further Granger Causality test result shows Indian market do not granger cause or caused by US market.
Keywords: Co-movements, Co- integration, Stationarity, Mean reversal, Causality, Unit root
6

89 | P a g e
1. Introduction: Co-integration theory of econometrics has created lots of interest among economists in the last decade. It helps in understanding the long term relationship of two or more non-stationary time series data. If the combination of two non-stationary time series data is stationary, the series are cointegrated. A lots of economic series behaves like I(1) processes, i.e. they seem to drift all over the place but the second thing to notice is that they seem to drift in such a way that they do not drift away from each other. This means they are cointegrated. In this paper, Johansen test is employed to examine the co- integration. This method is popular tool for testing cointegration of two or more than two time series. This test is preferable than the Engle–Granger test as it permits more than one cointegrating relationship. The result of Johansen co-integration test showed no cointegration of Indian market with US market. Therefore for further research, Unrestricted VAR and granger causality test is employed. VAR helps in analyzing auto regression effect with its own lag and lag value of other variable. Granger causality test clarifies the cause and effect relations in time series variables. The paper is divided into four sections. Section one deals with the introduction and motivation for the research, in section 2 data and methodology is covered. Section 3 deals with empirical analysis. Last section presents brief analysis of results and conclusion.
1. 1. Motivation for the Research Numerous studies have been conducted on stock market integration. Markets of open economy have exhibited tighter co-movements with one and other. Several studies have also examined the relationships of Asian stock markets with US and other developed markets for different periods and the results are mixed. Some of the researchers have found co-movement some did not. Bhattacharya and Banerjee (2004) in their study for Germany, France, Korea, UK, Hong Kong, Japan, USA, Singapore, Taiwan, Mexico and India found that Causality effects are prominent in Asian capital markets. Ghosh et al. [1999] observed some evidence of cointegration among stock markets in Asian countries and the US whereas Chan et al. [1992] found no evidence of cointegration among the stock indices. Ripley (1973) studied co- integration for USA, UK, Austria, Belgium, Denmark, France, Germany, Italy, Netherlands, Norway, Sweden, Switzerland, Canada, Japan, Finland, Ireland, Australia, New Zealand, South Africa and observed that USA, Canada, Switzerland and Netherland move together. Liu et al. (1998) in his study of six countries – the U.S, Japan, Hong Kong, Singapore, Taiwan and Thailand for the period 1985-1990 found that U.S market possesses an influential role affecting the Asian-Pacific markets and degree of interdependence among the these markets increased substantially after the 1987 stock market crash. Eun and Shim (1989) studied the market movement for USA, UK, Australia, Canada, France, Germany, Hong Kong, Japan, Switzerland and found that USA exerts dominant influence. Pan, Liu and Roth (2000) in their research for the period from period 1988-1994 found that the US and five Asia-Pacific stock markets (Australia, Hong Kong, Japan, Malaysia and Singapore) were highly integrated. Bayers and Peel (1993) examined for co- integration among the markets of USA, UK, Germany, Japan and Holland and observed no interdependency among the markets. Alexander and Thillainathan [1995] in their study found Granger causality but did

90 | P a g e
not found cointegration among Asian stock markets. Arshanapalli and Doukas (1993) examined co-movement and interdependency of USA, UK, France, Germany and Japan and found Increasing degree of interdependence among world capital markets since the 1987 stock market crash, with Japan’s Nikkei Index being exception. Hui (2005) has studied co-integration among the markets of USA, Australia, Hong Kong, Japan, New Zealand, Philippines, Singapore, South Korea, Taiwan and Thailand and observed that diversification exists in Asian countries. Pukthuanthong and Roll (2009) have studied a sample of 81 countries and found marked increase in stock market integration over the last three decades. 2. Data and Methodology: Co-integration analysis is one of the most important tool to find long term relationship in the time series variables. The other tool that helps in establishing the relationship is Correlation analysis. But correlation analysis has a big limitation that it does not distinguish between real and spurious relation. So it is said that “correlation does not imply causation”. This is the reason why co- integration is preferable over correlation. Co-integration analysis helps in establishing genuine co-movement where the cause and effect of variables is clearly visible. To check cointegration of Indian stock market with US market, daily data set (closing price) of Nifty (India) and NDX (USA) is taken from 01 January 2004 to 30 December 2014 (11 years) from Bloomberg database. The data set includes 2416 synchronized daily observations of closing prices. Stationarity test and cointegration can be carried out on level series, but unit root tests such as: DF, ADF & PP test of level series has accepted the null hypothesis that it contains unit root. Therefore log difference series (LN(Yt) – LN(Yt-1) is tested for unit root. All the three unit root tests DF, ADF & PP test suggest the indices are I (1) process. Log difference series is preferred over log return series because it stabilizes the behaviour of level series by reducing the scales without changing the character. Log difference series is denoted by prefixing L with the name of level series. 2.1. Johansen Co-integration test Johansen test for co- integration can be tested by two methods i.e. trace test and Eigen value test. Both the test may give inferences with small difference. Both methods of test address the co-integration presence hypothesis. Co-integration of time series variables assume the presence of common non-stationary (i.e. series are I (1)) processes underlying the input time series variables.
The number of independent linear combinations (k) is related to the assumed number of common non-stationary underlying processes (p) as follows:
So, let’s consider the following three possible outcomes: 1. . When time series variables are not co- integrated 2.0 < k < m, 0 < p < m. When the time series variables are co- integrated.

91 | P a g e
3. . When all the time-series variables are stationary ( to start with. Here co-integration is not relevant. When we are examining the number of independent combinations, we are also examining the co-integration existence hypothesis indirectly. 2.1.1. Trace Test The trace test tries to find out the number of linear combinations ( ) to be equal to a given value ( ), and the alternative hypothesis for to be more than
In the trace test, we set (assuming no cointegration), and examine whether we can reject
null hypothesis. If we find at least one cointegration relationship, we reject null hypothesis to establish the presence of Cointegration between the variables. 2.1.2. Maximum Eigen value Test In maximum eigen value test, we can reject the null hypothesis if there is only one possible linear combination of the non-stationary variables to yield a stationary process.
The test may become less powerful than the trace test for the same values.
2.2. Vector autoregression (VAR) The VAR is used to capture the linear interdependencies among multiple time series. Each variable has an equation explaining its evolution based on its own lags and the lags of the other model variables. A VAR model describes the evolution of a set of k variables (called endogenous variables) over the same sample period (t = 1, ...,T) as a linear function of only their past values. The variables are collected in a k × 1 vectort, which has as the ith element, yi,t, the observation at time "t" of the ith variable. For example, if the ith variable is GDP, then yi,t is the value of GDP at time t. A p-th order VAR, denoted VAR(p), is
Where the l-periods back observation yt−l is called the l-th lag of y, c is a k × 1 vector of constants (intercepts), Ai is a time-invariant k × k matrix and et is a k × 1 vector of error terms satisfying 1. Every error term has mean zero; 2. — the contemporaneous covariance matrix of error terms is Ω (a k × k positive-semi definite matrix); 3. for any non-zero k there is no correlation across time; in particular, no serial correlation in individual error terms. A pth-order VAR is also called a VAR with p lags. Lag selection is very important as inference can be different for different lags.

92 | P a g e
2.3. Granger Causality Test Direction of causality between variables can be predicted by granger causality test as co-integration does not reveal anything about direction of causality. A variable x is said to Granger cause another variable y if past values of x help predict the current level of y if all other information are available. The simplest test of Granger causality requires estimating the following two regression equations; these are given as equation (1) and equation (2).
Where p is the number of lags that adequately models the dynamic structure so that the coefficients of further lags of variables are not statistically significant and the error terms e are white noise. The error terms may, however, be correlated across equations. If the p parameters are jointly significant then the null that x does not Granger cause y can be rejected. Similarly, if the p parameters are jointly significant then the null that y does not Granger cause x can be rejected. This test is usually referred to as the Granger causality test. 3. Empirical Analysis
Table1: Summary Statistics of log difference series of investigated indices
LNDX LNIFTY Mean 0.044 0.060
Maximum 10.368 16.226
Minimum -11.115 -21.247 Std. Dev. 1.448 1.746 Skewness -0.377 -0.933 Kurtosis 8.867 20.454 Jarque-bera 3525.56 31044.66
Probability 0.000 0.000

93 | P a g e
Table 2: Correlation Matrix (Level series) NDX NIFTY NDX 1 0.845477 NIFTY 0.845477 1
Table 3: Correlation Matrix (Log difference series)
LNDX LNIFTY LNDX 1 0.215931 LNIFTY 0.215931 1
Unit Root Test: To check the stationarity of the data Unit root test as conducted on level series and log difference series with and without trends. All the three methods DF, ADF and PP test were employed, and the results are as follows;- Table 4: Summary of Unit root test result (level series- Without Trend)
Level series- Without Trend DF ADF PP
Variables 1% level t-Statistic 1% level t-Statistic 1% level t-Statistic
NDX -2.565919 2.269653 -3.432860 1.214916 -3.432860 1.538632
NIFTY -2.565919 1.185910 -3.432860 -0.549767 -3.432860 -0.546037 Table 5: Summary of Unit root test result (level series- With Trend and Intercept)
Level series With Trend and Intercept
Variables DF ADF PP Indices 1% level t-Statistic 1% level t-Statistic 1% level t-Statistic
NDX -3.480000 -0.583105 -3.961840 -0.820647 -3.961840 -0.576886
NIFTY -3.480000 -2.310425
-3.961840 -2.252562 -3.961840 -2.298478

94 | P a g e
Table 6: Summary of Unit root test result (log difference series- Without Trend)
Log difference series- Without Trend Variables DF ADF PP Indices 1% level t-Statistic 1% level t-Statistic 1% level t-Statistic
LNDX -2.565925 -4.666556 -3.432861
-53.82860 -3.432861 -54.03393
LNIFTY -2.565924 -7.257182 -3.432861
-49.84929 -3.432861 -49.84521
Table 7: Summary of Unit root test result (log difference series- With Trend and Intercept)
Log difference series With Trend and Intercept
DF ADF PP Indices 1% level t-Statistic 1% level t-Statistic 1% level t-Statistic
LNDX -3.480000 -9.865815 -3.961841 -53.84701 -3.961841 -54.06079
LNIFTY -3.480000 -48.13350
-3.961841 -49.84024 -3.961841 -49.83629
*LDAX indicates log difference series of DAX. When value of t statistics (absolute value) more than the value at 1%, we can reject null hypothesis, Means the series are stationary. The result of all the three test DF,ADF & PP for log difference series shows that we can reject null hypothesis. So it is clear that level time series in study have a unit root at a level of significance of 1%. (T-statistic is always higher). But their difference series do not have a unit root. Therefore they are all I (1) process and there is chances of co- integration.
A graphical presentation of log difference series is shown below. It is obvious from Graph that the series are mean reverting and therefore stationary. Figure 2: Log difference series

95 | P a g e
-25
-20
-15
-10
-5
0
5
10
15
20
250 500 750 1000 1250 1500 1750 2000 2250
LNIFTY
-12
-8
-4
0
4
8
12
250 500 750 1000 1250 1500 1750 2000 2250
LNDX
-25
-20
-15
-10
-5
0
5
10
15
20
250 500 750 1000 1250 1500 1750 2000 2250
LNIFTY
3.2 To confirm long term relationship between two or more time series variables, Co-integration test is most popular and suitable test. There are two methods of conducting Co-integration test,

96 | P a g e
3.3 they are Trace test and Eigen value test. The Co- integration test of Nifty and NDX is conducted by both the methods.
Result of Co-integration test at 5% level for Nifty and NDX is given below:
Unrestricted Cointegration Rank Test (Trace) Hypothesized Trace 0.05 No. of CE(s) Eigen value Statistic Critical Value Prob.**
None 0.001977 6.699867 15.49471 0.6128 At most 1 0.000796 1.921554 3.841466 0.1657
Trace test indicates no cointegration at the 0.05 level * denotes rejection of the hypothesis at the 0.05 level **MacKinnon-Haug-Michel is (1999) p-values
Unrestricted Cointegration Rank Test (Maximum Eigen value) Hypothesized Max-Eigen 0.05 No. of CE(s) Eigen value Statistic Critical Value Prob.**
None 0.001977 4.778314 14.26460 0.7695 At most 1 0.000796 1.921554 3.841466 0.1657
Max-eigen value test indicates no cointegration at the 0.05 level * denotes rejection of the hypothesis at the 0.05 level **MacKinnon-Haug-Michel is (1999) p-values Johansson co-integratin test outcome: Both trace test and Eigen value test indicates no cointegration at the 0.05 level. Therefore Null hypothesis cannot be rejected. Therefore, Nifty and NDX has no cointegration and no long run association between them.
3.4 Vector Auto Regression (VAR) tries to find out the interdependencies of a time series
variable with itself and with others. VAR assumes that each variable is a function of past value (lag value) of its own and past value of other variable. The VAR of Nifty and NDX was tested to check the interdependency between the two. The result is as follows:

97 | P a g e
VAR of NIFTY with NDX NIFTY NDX
NIFTY(-1) 0.977824 -0.002681 (0.02032) (0.00786) [ 48.1227] [-0.34100]
NIFTY(-2) 0.018303 0.002841 (0.02029) (0.00785) [ 0.90190] [ 0.36192]
NDX(-1) 0.486381 0.945243 (0.05329) (0.02062) [ 9.12633] [ 45.8468]
NDX(-2) -0.478204 0.055511 (0.05341) (0.02066) [-8.95375] [ 2.68667]
C 2.143419 -1.122115 (4.52090) (1.74896) [ 0.47411] [-0.64159] IFTY = C(1,1)*NIFTY(-1) + C(1,2)*NIFTY(-2) + C(1,3)*NDX(-1) + C(1,4)*NDX(-2) + C(1,5)
NDX = C(2,1)*NIFTY(-1) + C(2,2)*NIFTY(-2) + C(2,3)*NDX(-1) + C(2,4)*NDX(-2) + C(2,5)VAR Model - Substituted Coefficients: NIFTY = 0.97782378152*NIFTY(-1) + 0.0183034449931*NIFTY(-2) + 0.486380626193*NDX(-1) - 0.478204381847*NDX(-2) + 2.14341861837 NDX = - 0.00268053279059*NIFTY(-1) + 0.00284146306611*NIFTY(-2) + 0.945242920087*NDX(-1) + 0.0555108979424*NDX(-2) - 1.12211490292 Result: NIFTY(-1), NIFTY(-2), NDXI (-1), NDX (-2) is significant to influence NDX at 5% level.
3.4Granger Causality Tests helps to understand whether one time series is useful in forecasting other time series i.e. the future values of one series can be predicted using past values of another time series.

98 | P a g e
Result of Granger Causality Tests of Nifty with NDX is given below:
Pair wise Granger Causality Tests Date: 08/27/15 Time: 10:32 Sample: 1 2419 Lags: 2
Null Hypothesis: Obs F-Statistic Prob. NIFTY does not Granger Cause NDX 0.09463 0.9097
===================================================
Outcome shows that Nifty neither granger cause NDX nor caused by it.
4. Conclusion
Financial markets across the world may fluctuate randomly but some of them might share long term equilibrium when they are co-integrated. This co- integration of stock market is very useful tool that helps portfolio managers to develop strategy on global diversification. If the indices of the countries are co- integrated, then diversification may not fetch desired result in risk minimization and return maximization. To confirm co- integration relationship, time series of daily closing value of both the indices have been tested for unit root. All the three unit root test DF, ADF & PP have confirmed the process are I (1). After that Johanssen cointegration test is performed on NDX with NIFTY and no cointegration is detected between the two markets. For testing auto regression, unrestricted VAR test is applied by taking lag of 2. When serials are not co-integrated unrestricted VAR gives better result. Unrestricted VAR shows that lag 1 and lag 2 of NDX is not significant to influence Nifty at 5% level. At the same time lag 1 and 2 of nifty is significant to influence NDX. Granger causality test reveals that NDX does not granger cause NIFTY or caused by NIFTY.

99 | P a g e
References:
M. Bhattacharyya, A. Banerjee (2003), Integration of Global Capital markets: An empirical exploration, International journal of Theoretical and Applied finance 7(4), 385-405 A. Ghosh, R. Saidi and K. H. Johnson, (1999) Who moves the Asia-Paci_c stock markets US or Japan? Empirical evidence based on the theory of cointegration, The Financial Review 34, 159-170. C. Alexander, R. Thillainathan, (1995) The Asian connections, Emerging Markets In-vestor 2(6), 42-46 M.S. Pan, Y. A. Liu and H. J. Roth, (1999), Common stochastic trends and volatility in Asian-Paci_c equity markets, Global Finance Journal 10(2), 161-172. Bekaert, G., Harvey, C.R., 1997. Emerging equity market volatility. Journal of Financial Economics, 43, 29–77. Bekaert, G., Urias, M.S., 1996. Diversification and emerging market closed end funds. Journal of Finance 51, 835–869. Bennett, P., Keleher, J., 1988. The international transmission of stock price disruption in October 1987, Federal Reserve Bank of New York. Quarterly Review 13, 17–33. Bodurtha, J. Jr., Cho, D., Senbet, L., 1989. Economic forces and the stock market: an international perspective. The Global Finance Journal 1, 21–46. Campbell, J., Hamao, Y., 1992. Predictable stock returns in the United States and Japan: a study of long-term capital market integration. Journal of Finance 47, 43–66. Dwyer, G.P., Hafer, R.W., 1988. Are national stock markets linked? Federal Reserve Bank of St.Louis Review 70, 3–14. Eun, C.S., Shim, S., 1989. International transmission of stock market movements. Journal of Financial and Quantitative Analysis 24, 241–256. K. C. Chan, B. E. Gup and M.-S. Pan, (1992), An empirical analysis of stock prices in major Asian markets and the United States, Financial Review 27(2), 289-307
Johansen, S. (1991): Estimation and Hypothesis Testing of Cointegration Vectors in Gaussian Autoregressive Vector Models. Econometrica 59(2), 1551–1580

100 | P a g e
A Literature Review on Disposition Effect and Tendency to Sell Winners and Hold onto Losers
Madhumita Ghosh
This paper reviews the literature on disposition effect i.e. investors sell their winning stocks rather fast compared to their losing stocks. Empirical studies provide evidence of this behavioral trait in various stock markets and it is all pervasive in investors: individual to professionals. The relevance of disposition effect and associated theories on Indian Investors participating in the stock market through application of Odean (1998)* / Grinblatt and Han (2005) is being tested. The ratio of realized gains/ realized loss should be greater than 1. The difference between proportion of gain realized (PGR) and proportion of loss realized (PLR) is a measure for the extent of the disposition effect.
Keywords: Disposition Effect, Behavioural Finance, Market Efficiency
7

101 | P a g e
Introduction
Stock markets throughout the world are witness to investors emotions like euphoria, greed, hope,fear,herd-mentality overconfidence and various other traits. The bbehavioural traits integrate classical economics and finance with psychology and the decision-making sciences.
The structure map shows propensity to invest with the risk return profile, the stakeholders participating and the various economic and social variables which influence the investors mind and develop behavioural traits within them.
Behavioural biases lead to:
• Investment in wrong instrument at wrong time • Investment at right instrument at wrong time and Investment in wrong instrument at right
time • Investors naively extrapolate a continuation of fast growth for growth firms and slow
growth …. • Slow growers tend to improve and fast growers slow their growth in the future • Errors by investors overprice growth firms and under-price value firms. • Sell winners and hold on to losers.
The behavioural traits has been highlighted in Annexure 1 comprises of Herd mentality, framing, overconfidence, anchoring, disposition effect and others
Individual Investor
Situation• Emergency of need to invest in
stock market• Access to information• Years of experience
Stock Market•listed cos and market making• FII Investments• Liquidity•Convenience /simplicity• Stock market intermediaries
Macro/Micro linkages
• Society/background• City• State• Affluence
The risk return profile of the individual and propensity to invest
Structural Map
102 | P a g e
“Disposition Effect” has been identified as one of the vital traits present in most investor class wherein the investors are prone to sell winning stocks quickly and hold losing stocks patiently. Various Empirical studies provide evidence of this trait in various markets and is all pervasive in investors individual to professionals. The applicability of disposition effect and associated theories on Indian Investors participating in the stock market was the main objective. Indian Investors comprising of Fund managers and retail investors. The ratio of realized gains/ realized loss should be greater than
The minor objectives are as follows:
• Influence of disposition effect on individual traders wherein the above ratio becomes positive
• Influence of short term capital gains on the ratio and disposition effect • Influence of financial results and news on disposition effect • Influence of age or gender of individual on disposition effect • Influence of disposition effect on employees having ESO
Purpose of Research
The purpose of this study is to get insight into various behavioural patterns of various classes of stock market participants (stakeholders) in the industry, analyze interpret and measure the quantum of the “Disposition Effect” and finally create strategies based on this for enhancing investors return. The research will explore the extent of opportunity which is created due to the behavioural tendencies in individual minds
• Add value to the prevalent Traditional methods of investment decision and form integrated investment strategy taking into account traditional theories, fundamental analysis and controlling the behavioral aspects to optimize return
• Develop investment strategies that minimize the “Disposition Effect” factor and leads to successful Investment Advising.
• The research focuses on the application of psychological and economic principles for the improvement of individual financial decision-making process and taking advantage of situations where others are exhibiting such behavioral traits.
• It would also be helpful if it is added in the investment management curriculum in institutes
• Popularize behavioral traits like “Disposition Effect” in India where it is at an infancy and develop products based on this philosophy

103 | P a g e
Literature Review
Behavioural Finance has emerged from the origins of psychology and behavioural economics during the last 25 years. The last ten to twelve years has seen a substantial increase in the
research, publication, and investment strategies associated with the science of behavioural finance.
Daily movements in asset prices are the main characteristic in financial markets and are very hard to forecast with certainty. The reason behind this is that it is very difficult to predict the behaviour of participants in the markets, as people use their own reasoning in the decision making. The fundamental variable in asset pricing is the price.
Behavioral Finance and the Investment Process A typical investment process is described below, with the most common biases encountered in each phase. Investment Process Phase Steps in this Phase Common Behavioral Biases Investment Philosophy Clear philosophy and statement of
competitive edge Product objectives
Over-confidence
Data collection & Screening Articulation of process Clear screening philosophy Appropriate resources Consistent application
Confirmat ion
Research & analysis Defined process and inputs Good coverage ratios Framework for evaluation Value-added knowledge Efficient communicat ion
Anchoring Recency Confirmat ion Optimism
Issue selection Relative evaluation framework Risk/return objectives for each security Clear selection rat ionale
Framing Overconfidence Confirmat ion Cognitive dissonance
Post initial investment during the monitoring and holding period other traits start surfacing. Disposition effect is one trait which can be singled out as having a great influence in the post investment and monitoring phase. Disposition effect has significant contribution in the performance of Fund/Portfolio as both professionals and individuals fall prey to it.
The common traditional theory is:
Efficient Market Hypothesis Expected Utility; Rational Expectations

104 | P a g e
As opposed to Traditional theory Behavioural finance revolves around various theories propagated by numerous authors. :
Summary of Literature on Behavioural Finance
Leon Festinger(1956) Theory of cognitive dissonance
Behaviour based on beliefs
Tversky and Kahneman (1973) Availability heuristic A judgmental heuristic in which a person evaluates the frequency of classes or the probability of events by availability, i.e. by the ease with which relevant instances come to mind.’
(De Bondt and Thaler1985).
Mental accounting is the set of cognitive operations used by individuals and households to organize, evaluate and keep track of financial activities
Kahneman, Knetsch and Thaler (1990)
loss aversion and the endowment effect
Persist even in market settings with opportunities to learn and conclude that they are fundamental characteristics of preferences.
Tversky and Kahneman (1991) losses and disadvantages have greater impact on preferences than gains and advantages.
present a reference-dependent model of riskless choice, the central assumption of the theory being loss aversion, i.e
Grinblatt, Titman and Wermers (1995)
Momentum strategies and herding.
analyzed the behavior of mutual funds and found evidence .
Odean (1999)
Overconfidence and Disposition Effect
Demonstrated that overall trading volume in equity markets is excessive, and one possible explanation is overconfidence. He also found evidence of the disposition effect which leads to profitable

105 | P a g e
stocks being sold too soon and losing stocks being held for too long.
Gilovich, Griffin and Kahneman (2002)
compiled “The Psychology of Intuitive Judgment”
a book that comprises most influential research in the heuristics and biases tradition since the initial collection in 1982.
Victor Ricciardi March 2005.
A Unique Perspective of Behavioral Finance”
This paper puts thrust on the aggregate market implications of the behavioral biases based on then literature identified.
Greg Davies 2006 “Recency effect” Real estate having captured the mind space of investors, they began to lose their rationality because they'd known nothing but gains for several years
George Loewenstein 2008 Ostrich Effect "What’s most recent in our minds stands out”. When value of investments are moving up one feels they are less risky
Frick, Robert Kiplinger's Personal Finance Nov2009
“Be a better investor” Emotion, not logic, usually rules our investing habits. Investors cling to losers that should be sold, ignore threats to wealth and follow the investing herd off a cliff again and again
Michael Pompian January 3, 2012
How to Build Optimal Portfolios That Account for Investor Biases
He applies knowledge of 20 of the most prominent individual investor biases into "behaviorally-modified" asset allocation decisions
The various theories contribute towards the actual decision of the investors. This is a vast study as has been depicted from the literature summary.

106 | P a g e
Expected utility theory is unable to explain why people are often simultaneously attracted to both insurance and gambling. Kahneman and Tversky’s (1979) prospect theory suggests that investors facing risky choices act as if they were maximizing the value/utility function shown in Exhibit 2 found empirically that people underweight outcomes that are merely probable in comparison with outcomes that are obtained with certainty; also that people generally discard components that are shared by all prospects under consideration. Convexity of the utility function in the loss quadrant implies risk seeking behaviour by the investor when facing losses.
Under prospect theory, value is assigned to gains and losses rather than to final assets; also probabilities are replaced by decision weights. The value function is defined on deviations from a reference point and is normally concave for gains (implying risk aversion), commonly convex for losses (risk seeking) and is generally steeper for losses than for gains (loss aversion) (see Exhibit 2). Decision weights are generally lower than the corresponding probabilities.
• Risk-averse investors get increasing utility from higher levels of wealth, but at a decreasing rate.
• Research shows that while risk aversion may accurately describe investor behavior with gains, investors often show risk seeking behavior when they face a loss.

107 | P a g e
Prospect theory is potentially a useful ingredient in a model of the disposition. In disposition effect investors hold losing stocks for longer period compared to winning stock. This defies the concept of cutting loss and allows the winners to run further. The different investor categories are affected by this anomaly although the quantum could vary and this leads to creation of patterns in volumes of stock. When good news is announced, the price of an asset does not immediately rise to its value because of premature selling (Weber, 1998). Similarly, when bad news is announced, the price falls less because investors are reluctant to sell expecting partial recovery. The disposition effect always involves a reference point. Literature on disposition effect
Shefrin and Statman (1985) introduced disposition effect theory based on the prospect theory of Kahneman and Tversky’s (1979).The original model constitute other ingredients besides prospect theory: mental accounting, regret aversion, and self-control. Each of the ingredients serves to explain some aspect of investor behaviour.
A study conducted by Prof Sankar De and his team at Indian School of Business (ISB) reveals that Indian retail investors would have lost Rs 8,376 crore between January 2005 and June 2006, which means around 0.2% of the population lost 0.7% of the gross domestic savings during this period.
The total number of investors who traded at least once between January 2005 and June 2006 stands at 25 lakhs. If one mirrors a secular trend over the years, the total losses for Indian individual investors would be around Rs 20,700 crores or Rs 82,800 per active investor per year.
According to him India has the highest level of disposition effect among markets like USA, Japan, China and Finland as Indian investors are much more behavioural than other investors. Investors in emerging markets like India and China are more open to taking risks than their counterparts in advanced countries.
Table depicting Literature on disposition effect
Author Year Proposition/analysis Remarks
Shafrin & statman 1985
Sell winners than losers
Started the research
Barber and Odean (1999),
1999 Disposition effect and tax concerns influence the selling by investors.
Oeheler 2003
Weber & Camerar 1998
Odean 1998 Analyses the frequency at which winning and
Trading records of 10000 private

108 | P a g e
losing stocks are sold accounts from 1987 to 1993
Grinblatt and Keloharju
2001 Finnish stock market Tax loss selling activ ities
Krishnan and Booker 2002 Investors using analyst recommendation
Reduces disposition effect for winnin stock but not of loosing stock
Dhar & zhu 2002
Individual basis
Major discount brokerage
investors with more experience
in trading and better access to financial market
informat ion show a smaller disposition effect
Locke and Mann
2005
Professional future traders of Chicago stock
exchange
least successful traders have the longest holding
period for losers
Frazzin i 2006 Mutual fund holdings
to show an under reaction of stock prices to public news due to
disposition effect
Frino 2004 Comparison of future
traders on floor and off floor
Information advantage of local traders shows stronger disposition effect.
Suzanne O'Curry Fogel & Thomas
Berry 2006
The Disposition Effect and Individual Investor Decisions: The Roles of
Regret and Counterfactual
Alternative
The investors regret more for the holding of losing stock too long than
selling the winning stock too soon
Shumway and Wu 2006 Chinese stock exchange Disposition drives momentum
Markku Kaustia 2010 Prospect theory
unlikely to exp lain disposition effect
Relative importance of prospect theory and few
explanations for the disposition effect
(Mukherjee & Shankar, 2012)
2012 Aggregate and individual level
analysis,
Distribution of informat ion has strong
implications for investor behaviour observed
Teng yuan Cheng, Chun I lee, Chao
Hsien Linc 2013
Relationship between the disposition effect and gender, age, the traded security, and
bull–bear market conditions in Taiwan
future exchange
Traders who trade financial-sector futures contracts exhibit stronger
disposition effect
109 | P a g e
Manuel Ammanna, Alexander Isingb and Stephan Kessler in his article on Disposition effect and mutual fund performance in (2012) has analysed the literature of various authors, taken few concepts and tried to ascertain the impact of Disposition Effect on Fund managers in US. He has tried to investigate the links between the disposition effect and the investment styles of mutual fund managers. Secondly the effect of fund characteristics (turnover) and the economic environment on the disposition effect exhibited by mutual fund managers. Another major contribution of this article is the analysis of the interaction between the disposition effect and the performance of mutual funds. Earlier Odean 1999 has tested disposition effect by 10000 accounts at a large brokerage house. Shumway and Wu (2006) find that Chinese investors also show the disposition effect, and their findings reinstate that disposition does indeed drive momentum. Most of them follow Odean’s methodology based on individual trading data. Are Investors Ever Rational? Paper by Saptarshi Mukherjee and Sankar De focuses pre announcement uncertainty and post announcement Disposition effect. Badrinath and Lewellen (1991) look for evidence of tax-motivated trading and find that the ratio of stocks sold for a loss to those sold for a gain rises as the year progresses. Excellent theory has resulted from years of research into behavioral biases. The gap exists between this theory and real world applications in most of them except the recent article by Manuel Ammanna, Alexander Isingb and Stephan Kesslera, on US Fund managers. Some outstanding psychologists such as Daniel Kahneman and Amos Tversky have also made major contributions to behavioral finance. However, gap remains in the form of
• Lack of integration of various theories and applicability in Indian scenario taking into account the various demographic, economical and social parameters.
Indian stock markets have not launched products based on these theories. Investor perceptions are not mapped regularly to prove the theories. The impact of various patterns of behavior has not been quantified.
In Indian context having various backgrounds and culture, we need to put emphasis on the psychological factors governing each of the stakeholders while taking investment decision and convert it into a study to help ascertain the emotional factor contribution in the stock market movement.
The effect of disposition effect in Indian context needs to be ascertained through data analysis and statistical models although few authors have taken some efforts with application of models. Application of Odean (1998) /Grinblatt and Han (2005) model in Indian stock market with various investor category needs to be ascertained to get a full ledged picture of disposition effect.

110 | P a g e
After the review we may be interested in studying the application it in our markets .This would involve data collection and thereafter a detailed study
The process of data analysis would include interpretation of the various responses of investors looking into the background experience, status and the industry he belongs to.
A historical analysis can do to understand the conception, development and implementation of the concepts in the market. Interviews can be conducted with key personnel of organization on whose behalf they take decisions.
Firstly, the analysis (as mentioned above) will be done for individual cases following which all the cases will be analyzed for similar and dissimilar findings. Based on the patterns of similarity in the behaviour and responses of situations studied the hypotheses would be derived on the strategies which would help in providing operational efficiency and competitive advantage. The data collected from these samples will also guide to come up with hypotheses on factors that drive the behavioural pattern and the hindrances faced in.
Process As per Odean’s methodology, one can start by calculating the gains and losses (as per earlier literature) for each mutual fund and then aggregate these numbers across the different mutual funds in the sample. The amount of shares bought or sold by a mutual fund is derived from changes in the total number of assets held. Some of the mutual funds in the sample hold shares before our data set starts. Since we cannot determine purchase prices and dates for these shares, we only include the holdings whose purchasing quarter and price is known to us. Purchasing time and price is used to determine a reference price for calculating gains and losses of mutual funds. For the calculation of gains and losses at each reporting date, we compare the actual price of a share to its average purchase price.
We classify a position as unrealized gain (paper gain) if the average purchase price is smaller than the actual share price and as an unrealized loss (paper loss) otherwise. If the actual price equals the average purchase price, the respective position is neither a paper gain nor a paper loss. If the change of the holding size of a specific stock is smaller than zero (i.e. shares are sold), we obtain a realized gain for positions with an actual share price greater than the average purchase price and a realized loss otherwise. All gains and losses are calculated on an amount of share basis and on a INR basis. Gains and losses on a INR basis are obtained by multiplying the amount of shares sold with the difference of actual share price minus average purchasing share price.

111 | P a g e
The shares which are not sold in a given period are separated in positions which trade above and below their purchasing price, resulting in unrealized gains and losses, respectively. The unrealized gains (losses) are calculated as the differences between the purchasing price of a position and its price at the respective reporting date. For each mutual fund these figures are added up for all positions. Gains and losses on an amount of share basis are determined as the number of sales that are a realization of a profit or loss, respectively, where it does not matter how many shares are sold (see Odean (1998)). Equities which are not sold in a given period generate an unrealized gain (loss) if the present share price is above (below) the average purchase price
To test for the existence of the disposition effect we calculate the proportion of gains realized (PGR) and the proportion of losses realized (PLR) using methodology by Odean (1998a)
PGR = realized gains
(realized gains + unrealized gains) PLR = realized loss
(Realized loss + unrealized loss) Since the disposition effect refers to the observation that investors tend to realize profits earlier than losses, the difference between PGR and PLR is a measure for the extent of the disposition effect (see Odean (1998) for a detailed discussion). Thus, we define the disposition effect measure, DEM, as DEM =PGR - PLR. DEM for a mutual fund will define the strength of the disposition effect exhibited by the respective fund manager by pooling all positions of all mutual funds together we would calculate a DEM for the whole industry. Statistical tools like t test DEM for a mutual fund will define the strength of the disposition effect exhibited by the respective fund manager will determine the hypothesis.
Expected Theories / Outcome generated and concepts validated
Investors suffer from disposition effect Volatile market gives emergence to opportunities to maximize return as behavioral traits
play an important role. Winners are sold faster compared to losers of same magnitude. All stakeholders are behaving irrationally (degree varies) while trading or investing on
stock sometimes or always Conclusion
We employ some of the methods proposed by Barber, Odean, and Zhu (2009). To check the impact on prices of the disposition prone investors we use a method proposed by Goetzmann and Massa (2008). We then study the impact through proper data analysis.
112 | P a g e
References
(n.d.). Retrieved from . http://www.investopedia.com/articles/mutualfund/09/analyzing-mutual-fund-risk.asp#ixzz1WEBg4pMK .
a, T. Y. (2013). An Examination of the Relationship between the Disposition Effect and Gender, Age,.
a, T. Y. (n.d.). An Examination of the Relationship between the Disposition Effect and Gender, Age,and traded security.
Berry, S. O. (n.d.). he Disposition Effect and Individual Investor Decisions: The Roles of Regret and Counterfactual Alternatives. Journal of Behavioral Finance, 7(2), 107-116.
Cheng, y. T., Chun, L. I., & Linc, H. C. (2013). An Examination of the Relationship between the Disposition Effect and Gender, Age,.
D, D. J. (2005). “Acquisitions, Overconfident Managers and Self-Attribution Bias”. working paper, Old Dominion University.
Daniel K D, H. D. (1998). Investor Psychology and Security Market Under- and Over-Reactions . Journal of finance, 53, 1839-1886.
Daniel K D, H. D. (2001). “Overconfidence, Arbitrage and Equilibrium Asset Pricing” . (3, Ed.) Journal of Finance, 56, 921-65.
Ferris Stephen, H. R. (1988). “Disposition Effect” . Journal of Finance, 43(3), 677-697.
Frazinni, A. (2006, August). The Disposition Effect and Underreaction. THE JOURNAL OF FINANCE , LXI(2).
Frick, R. K. (november 2009). Be a better investor (11 ed., Vol. 63).
Grinblatt, M. a. (2000). “The Investment Behavior and Performance of Various Investor Types: A Study of Finland’s Unique Data.”. Journal of Financial Economics, 55(1), 43-67.
Herbert, S. (1955). "A Behavioral Model of Rational Choice." Quarterly Journal of Economics. Pp. 99-118. 99-118.
http://www.behaviouralfinance.net/ . (n.d.).
http://www.jpmorganfunds.com/pdfs/other/FINALBehavioralFinanceWhitePaper.pdf . (n.d.).
Liatukas, K. Č. (2011). Behavioral biases of the disposition effect and overconfidence and their impact on the Estonianstock market.

113 | P a g e
Liu Liu Kong+, M. B. (2013). Is the Disposition Effect Related to Momentum in the Chinese Stock Market.
Markku, K. (2010). Prospect Theory and the Disposition Effect. Journal of financial and quantitative analysis.
Mukherjee, S., & Shankar. (2012). Are Investors Ever Rational?
Odean, T. (1998). Are Investors reluctant to realise their losses. Journal of Finance, 53(5), 1775-1798.
Parekh, P. (n.d.). Value investing and behavioral finance.
Ray, K. K. (2009, September). Investment Behavior and the Indian Stock Market Crash 2008: An Empirical Study of Student Investors. UP Journal of Behavioral Finance , 6(3/4), 41.
Shah, D. D. (2012). Testing applicability of Indian Investors.
Silverman, D. ( 2009, november 16). Doing qualitative research. sage(3rd edition), 472.
Statmen, H., & Meir, S. (1985, June). The Disposition to Sell Winners Too Early and Ride Losers Too Long:theory and evidence. Journal of Finance, XL(3).
Weber, M. a. (1998). “The Disposition Effect in Securities Trading: An experimental analysis. Journal of Economic behavior and organisation.
www.mutualfundindia.com . (n.d.).

114 | P a g e
Annexure 1
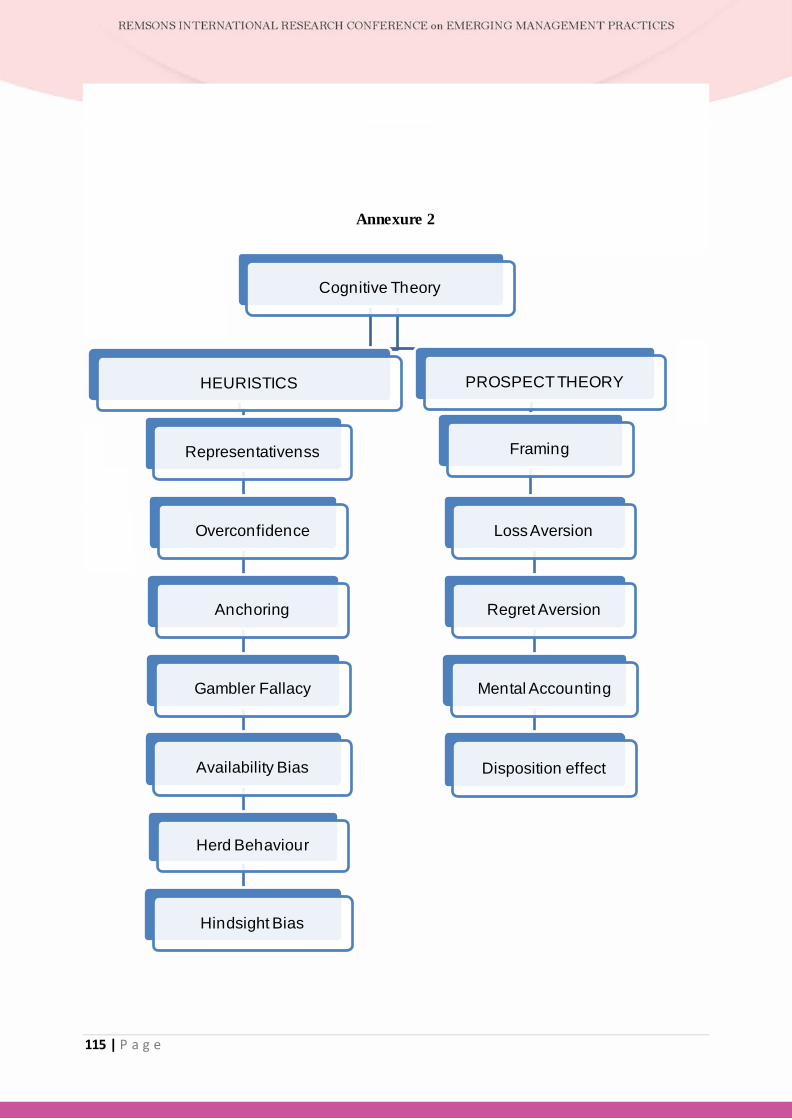
115 | P a g e
Cognitive Theory
HEURISTICS
Representativenss
Overconfidence
Anchoring
Gambler Fallacy
Availability Bias
Herd Behaviour
Hindsight Bias
PROSPECT THEORY
Framing
Loss Aversion
Regret Aversion
Mental Accounting
Disposition effect
Annexure 2

116 | P a g e
An Investigation of Turnover Intentions of Sales Employees: Evidences from India
Prof. Sarika Jain, Dr. Shreekumar K. Nair
1. Prof. Sarika Jain, Assistant Professor, Durgadevi Saraf Institute of Management Studies (DSIMS), (Fellow Student, NITIE), Mumbai. [email protected], [email protected]
2. Dr. Shreekumar K. Nair, Professor (OB & HRM), National Institute of Industrial Engineering (NITIE), Mumbai – 400 087 India, [email protected], [email protected]
Turnover and turnover intentions appear to be an important variable for study in sales management. The sample for the current study are sales employees as they are required to respond to multiple demands from coworkers, customers and members from their respective families as well, which finally leads to negativity in form of stress. This in turn leads to withdrawal decision process that would lead to final quitting. Of importance to the study is turnover intentions measurement. The study first validated the modified version of Ku (2007) scale in Indian context using exploratory factor analysis (EFA) and Confirmatory factor analysis (CFA). The results of the data analysis are in line with the indications in the literature. Further this study explored the impact of demographic variables on turnover intentions of salespersons in India. The study will contribute to the sales management literature by identifying the key demographic variables that can have an effect on sales employee’s turnover intentions. Further results indicated that age, marital status, hierarchy and annual salary are significantly associated with both work to family conflict and family to work conflict. Implications of these findings are discussed.
Keywords: Turnover Intentions, EFA, CFA, SEM, Demographic Variables, ANOVA, Post Hoc Scheffe’s Test, Sales employees, India
8

117 | P a g e
INTRODUCTION
To remain competitive in the swiftly intensifying global economy and to keep pace with latest advancements in businesses, organizations worldwide requires a workforce with robust institutional knowledge. As a result, employee retention or reducing turnover is of great importance to business communities (Becker, 2007).This is all the more important for sales professionals as they are ones who generates revenue for the organizations.
Since past three decades turnover and turnover intention appears to be an important variable in sales management (Batt & Valcour, 2003). Both theoretical as well as experiential models of turnover intentions very strongly supported that behavioural intentions comprise the most immediate determinant of actual behaviour (Triandis, 1980), more specifically turnover (Lee & Mowday, 1987). Prior literature has identified that work related factors and personal characteristics are core determinants of turnover intentions (Tyagi & Wotruba, 1993). Certain studies even claim that there are significant correlations between turnover intention and certain demographic variables (Randhawa, 2007). Most of the studies are found to have ignored sales employees across a wide spectrum of sectors as a sample for study though sales is one of the most important functions of an organization.
Hence the study aims to test the current status of Turnover Intentions though assessment of demographic variables (viz., gender, age, marital status, level in an organization, tenure with a respective organization, hours in office, number and ages of children and annual salary). The study will contribute to the sales management literature by identifying the key demographic variables that had an effect on sales employee’s turnover intentions.
REVIEW OF LITERATURE
TURN OVER INTENTIONS Turnover intent is expressed as a conscious and deliberate willfulness to depart from an organization (Tett & Meyer, 1993). Mobley et al. (1978) defined employee turnover intention as the withdrawal decision process that would lead to final quitting. Researches on turnover intention suggest that it is the single best indicator of an individual’s actual turnover behavior (Steel & Ovalle’s, 1984; Cotton & Tutttle, 1986; Hayes et al., 2006). This indicated that real turnover could be avoided through understanding predictors of turnover intention. Therefore, early exposure of employee job dissatisfaction through turnover intention measure would be more useful than taking remedial action after actual turnover had occurred.

118 | P a g e
TURN OVER INTENTIONS AND DEMOGRAPHIC VARIABLES
Turnover intentions are found to be affected by gender among IT professionals (Thatcher et al., 2002) i.e. females have higher turnover intentions as compared to men (Marsh & Mannari, 1977). However turnover intentions are found to be negatively associated with marital status (Cotton & Tuttle, 1986) as marital status act as a restrain to resign (Chompookum & Derr, 2004).
H01: Gender is significantly associated with Turnover intentions (TOI). H02: Marital Status is significantly associated with Turnover intentions (TOI).
It was established that age (Cotton & Tuttle, 1986) and designation are negatively correlated with turnover intentions (Randhawa, 2007) .The probable justification is provided by Lewis (1991, p. 147), “As people age, they generally get a clear idea of what they want to do, establish stronger ties to a community that discourage geographical moves, and become more attached to a particular employer.” So it can be hypothesized that:
H03: Age is significantly associated with turnover intentions.
Weisberg & Kirschenbaum, (1991) suggests that lower organizational levels are negatively associated with an employee’s turnover intentions. Long working hours are found to result in higher turnover intentions (Dawson, McCulloch & Baker, 2001). Job level with high demands have been related to turnover intentions (Almer & Kaplan, 2002). Income is found to be negatively related with turnover intentions (Cotton & Tuttle, 1986; Chen & Francesco, 2000; Grzywacz & Marks, 2000; Marsh & Mannari, 1977). So it can be hypothesized that:
H04: Hierarchy is significantly associated with turnover intentions.
H05: Income is significantly associated with turnover intentions.
To summarize, the study aims to assess the impact of demographic factors on Turn over intentions. The schema of the relationships examined in the study is given below:

119 | P a g e
Figure 1 Demographic Variables and Turnover Intentions
Methodology
The study is non-experimental and quantitative in nature. Quantitative approaches are considered to be appropriate for cross-sectional studies (Creswell, 2009). The survey method using standardized questionnaires was used to collect data from sales respondents across various sectors namely, Banking and Financial services, IT, FMCG, Manufacturing and Pharmaceuticals.
Sample
Out of the 280 sales employees who were approached for the purpose of the study, 230 employees responded leading to a response rate of 82%. The sample comprised of entry level (52%) and middle management level (48%) employees working in various organizations based in Mumbai, India.
Measures
This research used a set of standardized self-report questionnaires. It comprised of 2 parts. While section-1 focused on the demographic profile of the respondent, section-2 primarily captured the turnover intentions of the participants under study.
Turn Over Intentions Scale
Turn over Intentions represents an employee’s desire to leave an organization. It is evaluated using modified version of Mitchel (1981) scale (Ku, 2007).
Age
Marital Status
Level in an organization
Turnover Intentions Demographic variables
Annual salary
Gender

120 | P a g e
Demographic Variables Participants were asked to report demographic information including age, education, etc. Also family related information like number of children, time spent in household tasks, spouse employment was collected from the participants. Work related demographics including occupation, number of hours worked per week and tenure in their respective organization were captured from the participants.
DATA ANALYSIS
To meet the defined objectives, the data were analyzed using SPSS-20. The following statistical procedure was taken into account for attaining the objectives of the study:
Reliability Testing: For assessing the inter item as well as construct reliability, cronbach alpha values were calculated.
Current Status testing: In order to study the role of demographic variables such as gender, age, marital status, hierarchy, tenure with a respective organization, hours in office, number and ages of children, employed spouse, and annual salary on turnover intentions, one-way analysis of variance (i.e., ANOVA) was utilized. Further, Post Hoc Scheffe’s test was conducted to isolate the specific difference between category means that were significantly different. Calculations were done and the significance levels were determined at P < 0.05 as well as p< .01 levels.
RESULTS AND DISCUSSIONS
Reliability
Table 1 represents Descriptive Analysis and Internal Consistency Estimates of the scales under study. TOI scale is found to be having excellent internal consistency (George & Mallery, 2003).
Table 1 Descriptive Analysis and Internal Consistency Estimates
Mean Std. Deviation
Reliability
TOI 1 4.26 1.438
.903 TOI 2 4.34 1.291
TOI 3 4.17 1.389
TOI 4 4.24 1.445

121 | P a g e
Further Table 2 signifies that the sample primarily comprises of males (90.9%) as compared to females (9.1%). This indicates that sales profession is primarily dominated by males.
Table 2 Demographic Characteristic of the Participants S. No Demographic
Characteristic
Frequency
(N 230)
Mean
1. Gender Male 209 17.19
Female 21 15.14
2. Age
≤ 25 Years 38 19.29
26-30 Years 111 16.78
31-35 Years 41 16.56
> 35 Years 40 15.90
3. Marital Status
Married 149 16.32
Unmarried 81 18.26
4. Hierarchy Entry 119 17.72
Middle 111 16.23
5. Annual Salary
1-5 Lacs 59 18.73
5-10 Lacs 80 16.76
> 10 Lacs 91 16.10
ANOVA ANALYSIS Table 3 indicates the impact of different demographic variables (Gender, age, marital
status, hierarchy and annual salary) on Turnover intentions of sales employees.
ANOVA results show that gender is not a significant source of variance in the scores of turnover intentions at p<.05 level for the three conditions, (F (1, 228) =3.367, p=.075). This indicated that both male and female have similar view towards turn-over intentions. A probable reason for such a finding could be lesser number of females in the overall sample.

122 | P a g e
Marital Status is found to be a significant source of variance in the scores of turnover intentions at p<.01 level for the three conditions, (F (1, 228) =8.461, p=.004). This indicated that marriage brings in a set of responsibilities and hence impacts turnover intentions. This is supported by Cotton and Tuttle (1986) as well as Chompookum and Derr, (2004) who confirmed that marital status prevents sales professionals from resigning.
Table 3 Turnover Intentions and Demographic variables Factor Sum of Squares df Mean Square F
Gender
Between Groups
80.080 1 80.080 3.367
Within Groups 5422.916 228 23.785 Total 5502.996 229
Age
Between Groups
260.671 3 86.890 3.746* Within Groups 5242.324 226 23.196
Total 5502.996 229
Marital Status
Between Groups 196.903 1 196.903
8.461** Within Groups 5306.092 228 23.272
Total 5502.996 229
Hierarchy
Between Groups
127.237 1 127.237 5.396*
Within Groups 5375.759 228 23.578 Total 5502.996 229
Annual Salary
Between Groups
254.737 2 127.369 5.509** Within Groups 5248.258 227 23.120
Total 5502.996 229 Note: *p <0.05; * * p <0.01
A significant affect of age on turnover intentions was observed at p<.05 level for the three conditions, (F (3, 226) =3.746, p=.012). In addition to this post hoc comparison using Scheffe’s test (refer Table-4) indicates that mean score for age ≤ 25 years (M=19.29) was significantly different from that for age > 35 years (M=15.90). This means that with age the level of turn over intentions decreases. A probable justification is provided by Lewis (1991, p. 147) who suggests that with increasing age sales employees are clearer about their aims and goals and hence avoid moving from one organization to the other leading to lower turnover.

123 | P a g e
Table 4 Scheffe’s Test for Age
The mean difference is significant at the 0.05 level.
Hierarchy is found to be a significant source of variance in the score of turnover intentions at p<.05 level for the three conditions, (F (1, 228) =5.396, p=.021). This indicates that as sales employees move up in the hierarchy, turn over intentions reduces. The primary reason behind this is the reduction in the number of available jobs as hierarchy increases. Further as sales people move up in hierarchy they tend to seek stability which in turn reduces turnover intentions.
Annual salary is found to be a significant source of variance in the scores of turnover intentions at p<.01 level for the three conditions, (F (2, 227) =5.509, p=.005). In addition to this post hoc comparison using Scheffe’s test (Refer Table 5) indicated that mean score for annual salary of 1-5 lacs (M=18.73) was significantly different from the score for an annual salary of >10 lacs (M=16.10). This suggested that salary plays an important role in ones turn over intentions. The result confirms the finding of Cotton and Tuttle (1986) who proposed that higher household income tends to reduce ones propensity to leave an organization.
Dependent Variable
(I) Age (J) Age Mean Difference (I-J) Std. Error
TOI
LESS THAN EQUAL TO 25
26-30 2.506 .905 31-35 2.728 1.085 MORE THAN 35 3.389* 1.091
26-30
LESS THAN EQUAL TO 25 -2.506 .905
31-35 .223 .880 MORE THAN 35 .884 .888
31-35
LESS THAN EQUAL TO 25 -2.728 1.085
26-30 -.223 .880 MORE THAN 35 .661 1.070
MORE THAN 35
LESS THAN EQUAL TO 25
-3.389* 1.091
26-30 -.884 .888 31-35 -.661 1.070
124 | P a g e
Table 5 Scheffe’s Test for Annual Salary
Dependent Variable
(I) Annual Salary (J) Annual Salary Mean Difference (I-J)
Std. Error
TOI
1-5 LACS
5-10 LACS 1.966 .825
MORE THAN 10 LACS
2.630* .804
5-10 LACS
1-5 LACS -1.966 .825
MORE THAN 10 LACS
.664 .737
MORE THAN 10 LACS
1-5 LACS -2.630* .804
5-10 LACS -.664 .737
The mean difference is significant at the 0.01 level.
CONCLUSION
Turnover intentions are found to be significantly associated with demographic variables like age, marital status, hierarchy and annual salary. This indicates that an individual intent to leave an organization is associated with both work and family related domains. However contradictory results were observed wrt gender in relation to turnover intentions. A probable reason for such a finding could be lesser number of females in the overall sample.
Limitation of the study
The present study has some limitations that need to be taken into account. First, the study is cross-sectional nature and thus causal conclusion cannot be drawn. Also, only Mumbai city has been chosen for data collection. However, choice of Mumbai was made as this city is considered to be the financial hub and hence having presence of maximum business houses.
125 | P a g e
REFERENCES
Almer, E.D., & Kaplan, S.E. (2002). The effects of flexible work arrangements on stressors, burnout, and behavioral job outcomes in public accounting. Behavioral Research in Accounting, 14, 1−34.
Batt, R. & Valcour, P.M. (2003). Human Resources Practices as Predictors of Work-Family Outcomes and Employee Turnover. Industrial Relations, 42, 2.
Becker, F. (2007). Organizational ecology and knowledge networks. California Management
Review, 49(2), 42–61.
Chen, Z.X. & Francesco, A.M. (2000). Employee Demography, Organizational Commitment, and Turnover Intentions in China: Do Cultural Differences Matter? Human Relations, 53(6): 869-887.
Chompookum, D., & Derr, C.B. (2004). The effects of internal career orientations on organizational citizenship behavior in Thailand. Career Development International, 9(4), 406−423.
Cotton, J & Tuttle, J. (1986). Employee turnover: A meta-analysis and review with implication for research. Academy of Management Review, 11 (1), 55-70.
Creswell, J. W. (2009). Research design: qualitative, quantitative, and mixed methods approaches (3rd ed.), Sage Publications, Thousand Oaks.
Dawson, D., McCulloch, K. & Baker, A. (2001). Extended Working Hours in Australia—Counting the Costs, The Centre for Sleep Research, The University of South Australia, Adelaide.
Ford, J. K., MacCallum, R. C. & Tait, M. (1986). The Application of Exploratory Factor-Analysis in Applied- Psychology - a Critical-Review and Analysis. Personnel Psychology, 39(2), 291-314.
George, D. & Mallery, P. (2003). SPSS for windows step by step: A sample Guide & reference Boston; Allyn & Bacon.
Grzywacz, J. G. & Marks, N. F. (2000). Reconceptualizing the work–family interface: An ecological perspective on the correlates of positive and negative spillover between work and family. Journal of Occupational Health Psychology, 5 (1), 111–126.
Harrington, D. (2009). Confirmatory Factor Analysis. New York: Oxford University Press.
Hayes, L.J., O’Brien-Pallas, L., Duffield, C., Shamian, J., Buchan, J., Hughes, F., Laschinger, H.K.S., North, N. & Stone, P.W. (2006). Nurse Turnover: a literature review. International Journal of Nursing Studies, 43(2), 237-63.
126 | P a g e
Jöreskog, K. & Sörbom, D. (1993), LISREL 8: Structural Equation Modeling with the SIMPLIS Command Language. Chicago, IL: Scientific Software International Inc.
Ku, M. (2007). An examination of work-family conflict and intention to leave among college and university foodservice managers. Dissertation Abstracts International: Section A: Humanities and Social Sciences, 68(4-A), 1547
Lee, T. W. & Maurer, S. D. (1999). The effects of family structure on Organizational Commitment, Intention to leave and Voluntary Turnover. Journal of Managerial Issues, 11(4), 493-513.
Lee, T. W., & Mowday, R. T. (1987). Voluntary leaving of organization: An empirical investigation of Steers and Mowday’s model of turnover. Academy of Management Journal, 30,721-743.
Lewis, G. B. (1991). Turnover and the Quiet Crisis in the Federal Civil Service. Public Administration Review, 51(2), 145-55.
Marsh, R.M., & Mannari, H. (1977). Organizational commitment and turnover: A prediction study. Administrative Science Quarterly, 22(1), 57–75.
Mitchel, J.O. (1981). The Effect of Intentions, Tenure, Personal, and Organizational Variables on Managerial Turnover. The Academy of Management Journal, 24 (4), 742-751.
Mobley , W., Horner , S., & Hollingsworth , A. (1978). An evaluation of precursors of hospital employee turnover. Journal of Applied Psychology, 63(4), 408.
Randhawa G.,(2007).Relationship between Job Satisfaction and Turnover Intentions: An Empirical Analysis. Indian Management Studies, 11, 149-159.
Steel, R.P. & Ovalle, N.K. (1984). A review and meta-analysis of research on the relationship between behavioural intentions and employee turnover. Journal of Applied Psychology, 69(4), 673–686
Tabachnick, B. G., & Fidell, L. S. (2001). Using Multivariate Statistics. Boston: Allyn and Bacon.
Tett, R.P., & Meyer, J.P. (1993). Job satisfaction, organizational commitment, turnover intention, and turnover: Path analyses based on meta-analytic findings. Personnel Psychology, 46, 259-293.
Thatcher, J. B., Stepina, L. P., and Boyle, R. J. (2002). Turnover of Information Technology Workers: Examining Empirically the Influence of Attitudes, Job Characteristics, and External Markets. Journal of Management Information Systems, 19(3), 231-261.

127 | P a g e
Triandis, H.C. (1980). Values, attitudes, and interpersonal behavior. In Nebraska symposium on motivation 1979: beliefs, attitudes and values. University of Nebraska Press, Lincoln, 195-259.
Tyagi, P.K. & Wotruba, T.R. (1993). An exploratory study of reverse causality relationships among sales force turnover variables. Journal of the Academy of Marketing Science, 21, 143-153.
Weisberg, J., & Kirschenbaum, A. (1991). Employee Turnover Intentions: Implications from a national sample. International Journal of Human Resource Management, 2(3), 359 – 375.

128 | P a g e
Role of Supply Chain Management in SME
Pooja Somani, Amal Roy
Supply chain in SMEs is a set of business activities including purchase from open market, manufacturing or processing of subcomponents within the plant & delivery to large enterprises using hired transportation to enhance value of end product& in-turn ensure long-term regular PO’s.
SMEs form the largest group of manufacturing firms, which provide manufacturing & support services to Large Enterprises. In today’s dynamic business environment coupled with globalization, survival of SMEs will be determined by their ability to produce more, at a lower cost, defect & time; considering SCM as a strategic weapon to improve performance in the competitive marketplace.
The research report provides a broad view of SCM over SMEs including challenges and benefits implementing on their respective SME scenarios. It concludes by providing recommendations for SMEs growth & development.
Keywords: Logistics, Operations management
10

129 | P a g e
1. Introduction Supply Chain Management integrates industry partners, from supplier to the end user, in order to maximize profit and efficiency throughout the chain. Use of technology, sourcing strategies and buyer supplier relationships are among several approaches that helps firm remain competitive against local as well as global competition.
The opportunity to develop innovative and value added service, modern supply chain concepts can generate significant value for SME’s as they have been neglected in the supply chain.
Small and Medium sized Enterprises have limited power in the supply chain and limited resources to invest in technology systems that will help them to compete in markets. This makes it difficult for SME’s to cope with the changing customer preferences such as mass customization which puts higher demands on the SMEs ability to flexibly change its production as per customer demand.
To be competitive in this growing market, SMEs need to harness the power of IT. The conventional process of information gathering and dissemination is inadequate in these “business at the speed of thought” times. The need of hour is IT enabled systems.
The globalization of supply chains, and the necessity to move goods from one part of the globe to another makes the supply chain vulnerable to disruptions and delays. Some of them are act of God. Disturbingly large no. of them are due to human errors and this places a huge pressure on SMEs to put their act in place to meet disruptions.
SMEs are vital cog in the economy. There has been new awakening interest in SMEs both from production point of view and employment opportunities they create. Another factor that shapes SME ecosystem is globalization.
SME’s have traditionally been laggards in the adoption of global best practices-be it in technology HR or even SCM. SME’s are mostly unaware of the benefits of an integrated supply chain which can drive business processes remarkably.
The structure and size of SMEs need to be understood in greater depth. Atypical SME will have a few suppliers from whom he sources material and even fewer customers. This makes them vulnerable and dependent on their customers. Short age of skilled personnel is a major constraint in an SME. Another major challenge is finances-loans are difficult to come by, alternate sources of financing are horrendously expensive and payment terms from their customers are most often loaded against them. They lack the ability to drive a hard bargain and end up with the payment terms that are not very attractive. This combination of lack of finances and skills leads to a slower adoption of Technology.

130 | P a g e
SMEs provide 40% of the industrial output and contribute a major chunk of exports. Across the world, firms are waking up to the benefits of an efficient supply chain. If we project the current business trends, in not too distant future, competition will be between supply chains networks rather than individual firms. And SMEs need to master the art and science of running an efficient supply chain as its no more a back office job, tucked away in remote corner. It’s a complex and comprehensive approach of demand, sourcing, production, sales and distribution, and managing the inventory and distribution of the product to the customer, including the multiple intermediaries between the producer and the consumer. It is a network that includes all parties involved directly or indirectly through physical distribution, flow of information and finances.
Literature Review
Jitesh Thakkar, Arun Kanda, S. G. Deshmukh (2008) says, The purpose of this paper is to review the literature on supply chain management (SCM) practices in small and medium scale enterprises (SMEs) and outlines the key insights. Mainly, issues are explored under three categories: supply chain integration, strategy and planning and implementation. This has supported the development of key constructs and propositions. The research outcomes are three fold. Firstly, paper summarizes the reported literature and classifies it based on their nature of work and contributions. Second, paper demonstrates the overall approach towards the development of constructs, research questions, and investigative questions leading to key proposition for the further research. Lastly, paper outlines the key findings and insights gained. Survival of SMEs will be determined first and foremost by their ability to provide/produce more, at less cost, in less time, with few “defects”. The key to this is effective SCM. Paul Hong, Jungsik Jeong, (2006) says, The purpose of this research is to show that SMEs have significant impacts on supply chain performance. They may take the roles of suppliers, producers, distributors, and customers. In this paper large firms and SMEs are compared in terms of strategic and operational choices. SMEs are classified on two dimensions – chain relationship position and strategic focus. Four types of SME characteristics are discussed: efficiency, coordination, collaboration & innovation. The theoretical contribution to the nature of SMEs & their supply chain relationships is threefold: the differences between large enterprises & SMEs have been examined in terms of key management practices; key characteristics of four types of SMEs have been identified in terms of their supply chain relationship position and strategic focus; & the transition paths that SMEs may follow in moving from one type to another have been shown. The growth paths that have been outlined for SMEs display diverse patterns. Managerial implications include: SME executives may diagnose their current business position and strategically plan intended changes by enhancing their operational capabilities & chain relationship positions, in view of changing market realities; most importantly, may strive to take practical steps to evolve from Efficiency SMEs all the way to Innovation SMEs.

131 | P a g e
Rajesh K. Singh, Suresh K. Garg, S. G. Deshmukh, (2008) says, SMEs are considered as engine for economic growth all over the world. After the globalization of market, SMEs have got many opportunities to work in integration with large‐scale organizations. This paper tries to identify the major areas of strategy development by SMEs for improving competitiveness of SMEs in globalised market. SMEs have not given due attention for developing their effective strategies in the past. They are localized in functioning. On export fronts SMEs face many constraints due to lack of resources and poor innovative capabilities. For sustaining their competitiveness, they have to benchmark their assets, processes and performance with respect to the best in industry. There is also need for developing a framework for quantifying the competitiveness by adopting a holistic approach. Jitesh Thakkar, Arun Kanda, S.G. Deshmukh (2008) says, This paper aims to propose a role interaction model for understanding a supply chain orientation of small and medium scale enterprises (SMEs). The paper defines various role players and logic for the quantification of conceptual role model. An applicability of proposed logic is demonstrated for a case of XYZ tin‐container manufacturing SME. The study provides an identification of various roles, development of role interaction model and its 13 combinations to gain insights into the SCM issues of SMEs are the major contributions. The paper proposes a simple, logical and easy‐to‐use approach that could even be understood and applied by SMEs managers with a limited knowledge base. The contributions of the paper are three‐fold: it reports contemporary literature on supply chain management in SMEs, it develops a conceptual role interaction model; and it demonstrates the application of proposed approach for the real life case example. Michael Quayle, (2003) says, This paper provides the outcomes of a supply chain management (SCM) practice survey designed to identify current trends in UK industrial small‐ to medium‐sized enterprises. The analysis identifies the adaptation of SCM techniques and relationships between customers and smaller suppliers. The outcomes, based on a survey of 288 firms, indicates a lack of effective adaptation from traditional adversarial relationships to the modern collaborative “e” – supply chain; identifies issues businesses need to address to improve the performance of their supply chains, and so improve their competitive position by grasping the benefits of effective SCM. Simone Regina Didonet1, Guillermo Díaz2, says Supply chain management (SCM) is an area of increasing importance among enterprises and of growing academic interest (Mentzer and Gundlach, 2010). It is based on the concept of firms as part of multiple organizations oriented to the provision of goods and services for the final customer (Lambert and Cooper, 2000). From this perspective, several studies have verified that integration and collaboration in the supply chain can provide important benefits to the companies involved. Among these benefits are added value, the creations of efficiencies and client

132 | P a g e
satisfaction (Stock, Boyer and Harmon, 2010; Chow et al, 2008), which are represented by the reduction in inventories, improvements in service delivery and quality and shorter product development cycles (Corbett, Blackburn and Wassenhove, 1999).
Roslin, Rosmimah Mohd,Ismail, Noraini(2008) says, This study starts with an inter-organizational approach where relational elements are incorporated in the analysis of Supply Chain Management (SCM) of Small and Medium Enterprises (SMEs). This is in line with the study's main intention of assessing the determinants or drivers for effective SCM of small businesses and their impact on the realization of competitive advantage. The findings suggest an interesting perspective on SCM and distribution channel functions among SMEs where elements of information sharing, cooperation, and integration are linked to competitive advantage. The correlation amongst the three independent variables of cooperation, information sharing, and integration with competitive advantage are all significant, depicting the relevance for SMEs to focus on these relational elements. The highest correlation between information sharing and integration and this definitely makes sense as SMEs strive to integrate their functions that are moving towards the attainment of common goals. Thus, the more integrated the functions amongst supply chain and distribution partners, the more likely that information would be shared amongst them. However, it is interesting to note that predictive ability of the relational elements of cooperation, information sharing, & integration on competitive advantage is not supported through regression analysis. There are perhaps other factors that should be considered besides relational elements influencing competitive advantage. Walnut Creek, CA, May 10, 2011 says, Netfira, a B2B software solutions provider, is the featured solution in a new research paper on the logistics of Supply Chain Management (SCM). In their paper, “Small Businesses NEED Logistics Too!” the authors confirm that seamless and easy to use logistics continue to be a critical requirement for successful SMEs (Small to Medium size Enterprises) but that this need has been too costly and difficult to implement – until now. The paper cites Netfira as the premier example of how even the smallest business is now able to integrate state-of-the-art supply chain/ERP logistical solutions into the business software they already use. Cloud-based solution to facilitate the logistics of buying product. Netfira not only offers REAL-TIME product and pricing visibility in a business’s supply chain, it eliminates the costs, delays and errors of manual entry systems.”The research paper concludes, “Netfira provides the missing link to supply chain for small business.”

133 | P a g e
S.C. Lenny Koh, Mehmet Demirbag, Erkan Bayraktar, Ekrem Tatoglu, Selim Zaim, (2007) The purpose of this study is to determine the underlying dimensions of supply chain management (SCM) practices and to empirically test a framework identifying the relationships among SCM practices, operational performance and SCM‐related organizational performance with special emphasis on small and medium size enterprises (SMEs) in Turkey. Based on exploratory factor analysis (EFA), SCM practices were grouped in two factors: outsourcing and multi‐suppliers (OMS), and strategic collaboration and lean practices (SCLP). The results indicate that both factors of SCLP and OMS have direct positive and significant impact on operational performance. In contrast, both SCLP and OMS do not have a significant and direct impact on SCM‐related organizational performance Perhaps, the most serious limitation was its narrow focus on Turkish manufacturing SMEs. By developing and validating a multi‐dimensional construct of SCM practices and by exhibiting its value in improving operational performance of SMEs, it provides SCM managers with useful tool for evaluating the efficiency of their current SCM practices. Second, the analysis of the relationship between SCM practices and operational performance indicates that SCM practices might directly influence operational performance of SMEs. . Andreas R. Holter, David B. Grant, James Ritchie, Nigel Shaw, (2008) says, The purpose of this paper is to present a framework for purchasing transport services to enable small and medium size enterprises (SMEs) to improve relationships with logistics service providers (LSPs) and enhance their own competitive advantage and profitability. A framework using several tools for purchasing transport services and improving transport performance has emerged from this research. Benefits from using this framework were enjoyed by both the focal company and its LSPs .The research and resulting framework are based on a single case study and have not been tested in other firms or markets. However, the proposed framework may be applied in other contexts, entirely or in parts. Neil Towers, Bernard Burnes, (2008) says, This paper seeks to examine the factors which influence the ability of SMEs to align their enterprise‐planning systems with the requirements and constraints of supply chain relationships in order to meet their own and their customers' strategic and operational requirements. The objectives are to: identify the range of trading relationships that exist between an SME in the manufacturing sector and its customers and suppliers; examine the implications of these external relationships for the SME's internal enterprise‐planning system; develop a composite framework of enterprise planning and supply chain management which allows manufacturing SMEs to understand how these interact and can be aligned. The paper develops a composite framework that allows first‐ or second‐tier manufacturing SMEs to identify the types of relationships in which they are involved and how they can understand and address their internal arrangements in order to meet their external obligations. In developing a composite framework, the primary objective is to understand how short‐term enterprise planning and supply chain trading

134 | P a g e
relationships interact. The paper has shown the developed understanding of aligning trading relationships and enterprise planning for the benefit of the supply chain. A manufacturing SME's strategic and operational requirements may be an area where those supplying products upstream have an advantage over their bigger manufacturing brethren. For a manufacturing SME, these issues and mechanisms will be the responsibility of only a few people whose interactions are likely to focus on short‐term issues, but they can begin to move their perspective from day‐to‐day pressures and take a more holistic, long‐term view of the business. Fernando Alonso Mendo, Guy Fitzgerald, (2005) says, This paper sets out to critique the applicability of e‐commerce staged models in explaining the progression of small and medium‐sized businesses (SMEs) in their use of internet technologies. The premise of this study is that examining the evolution of web sites over time gives us insights into actual evolving strategies and motivations behind internet investments. An alternative multidimensional framework is proposed that combines three different dimensions of organizational change (process, content, and drivers). The study describes the different approaches (monitoring, content analysis and case studies) and the characteristics of changes on these web sites. It was found that the main evolution strategies were “content updates” and “dormant sites”. The proposed framework is argued to be useful to academics, providing multiple perspectives, enabling more insightful study of SMEs' e‐business adoption and progression, and avoiding over‐simple a priori theory, e.g. staged models. The framework is also argued to be useful for SME managers seeking to make the most of their limited resources in this context. Rajesh K. Singh, (2011) says, The purpose of this paper is to develop a framework for improving the coordination in supply chain and development of an index for coordination. The interpretive structural modelling (ISM) approach has been employed to develop the structural relationship among different factors of coordination and responsiveness in supply chain to take strategic decisions. This framework is also used to evaluate coordination index for an organization. It has been further illustrated with the help of a case study. In total, 32 enablers for coordination in a supply chain have been identified based on literature review. These are grouped into six categories such as top management commitment, organizational factors, mutual understanding, flow of information, relationship and decision making and responsiveness. It is observed that all of these factors have strong mutual linkage and top management commitment is a major driver for improving the coordination among these factors. As ISM methodology is based on experts' opinion, this framework needs further validation with empirical data and detailed case studies.

135 | P a g e
B.A. Wagner, Ian Fillis, U. Johansson, (2003) says, The purpose of this research was to investigate e-business and e-supply strategies in Scottish small and medium-sized enterprises (SMEs). The paper reviews academic literature and recent survey reports on the degree of e‐business adoption in the UK and Republic of Ireland. The qualitative methodology undertaken is described, findings are discussed and implications from this study for e-business strategies outlined. This was an exploratory study using a small sample with possible geographic biases. Nevertheless, the data so far are in line with findings from larger studies. The role of support agencies is examined, as well as how government could better serve the SMEs. Finally conclusions and future research plans are presented. Joanne Meehan, Lindsey Muir, (2008) says, This paper aims to present the results of a study of supply chain management (SCM) practice in small to medium-sized enterprises (SMEs) in Merseyside, UK. The results reveal the perceived benefits of SCM to SMEs, which centre on SCM as a means to improve customer responsiveness. It also reveals concerns over SMEs' ability to adapt to these new working relationships and therefore gain the desired benefits. Analysis of these barriers highlights that they reside at the individual, relational and organizational level, thus increasing the complexity of adapting to SCM. Given the focus of the paper, this only looked at SMEs in the Merseyside area. The paper provides thoughts on how SMEs can improve SCM within their own organizations and supply chains. This includes the adoption of a multi- faceted change management approach to facilitate the adoption of SCM. This needs to cover the individual, relational and organizational levels. Rajat Bhagwat , Felix T.S. Chan , Milind Kumar Sharma (2008) says, In Supply Chain Management (SCM), performance measurement can facilitate understanding and integration among the supply chain partners. The purpose of this paper is twofold: first, to review the existing SCM performance measurement framework based on the Analytical Hierarchy Process (AHP) and Balanced Scorecard (BSC) models reported in the literature. Second, based on the prioritization of the suggested performance measures/metrics and performance at different decision levels, a mathematical model is developed to optimize the overall performance measurement of SCM for Small- and Medium-sized Enterprises (SMEs). Mohd Nishat Faisal, D.K. Banwet, Ravi Shankar (2007) says, The purpose of this paper is to identify barriers to risk management in supply chains of Small and Medium-sized Enterprises (SMEs) and to understand their mutual relationships. Interpretive Structural Modelling (ISM) was applied to present a hierarchy-based model and the contextual relationships among these barriers. The research shows that there exists a group of barriers that have high driving power and low dependence and are of strategic importance. The proposed model provides a useful tool for SME supply chain managers to focus on those variables that are most important for effective risk management in supply chains.

136 | P a g e
Methodology of Study
Defining Population: Population means whole set of the observation that will be studied in the project. Sample size will be the sub set of population on which the analysis will be carried out. Population size will include approximately 30 respondents, which include SME’s, funding agencies and customers. These people are right to target in order to do research and get real scenario which is in the industry the company belongs to. Sampling Frame of this project will be approximately 100 respondents belonging to this industry. Data Collection and Sampling Method: Data collection for this study will include Primary Data Collection and Secondary data Collection. Primary data will be collected through questionnaire and Secondary data will be derived from the researcher’s earlier research projects based on case studies and literature reviews. Primary data collected through questionnaire will help in identifying the company discipline and the influencing factors (drivers and barriers) and basic characteristics of the sector. Primary Data Collection: Primary Data Collection includes Questionnaire format, One to One conversation, Interview and Online Survey. Questionnaire designed may be of multiple choice, ratings and open ended. Secondary Data Collection: Secondary Data Collection includes survey done by research analysts. Various research papers available will be used for secondary data collection. Data will be collected from internet, various journals, articles and some websites. Research Design: Research Design is the planned structure and strategy to investigation conceived, so as to obtain answers to research questions and to control variance. Research methods could be broadly divided into two groups: analytical and empirical. Analytical methods are further categorized as conceptual, mathematical or statistical, and empirical methods include experimental design, statistical sampling or case studies. Issues are explored under three categories for study of role of SCM in SME –
o Supply chain integration, o Strategy and planning, o Implementation.
A classification framework is structured to enable a holistic conceptual and issue based analysis of the chosen context:

137 | P a g e
Category I aim to capture the understanding on supply chain integration decisions like alliances, collaborations, use of IT, implementation of integration, etc. Category II deals with the strategy and planning which focuses on formulation of strategy and linking of logistics strategy with business strategy. Category III explores the implementation issues like involvement of suppliers and customers (internal and external), identification of key risks, consistent communication, choice of information technology, etc. Statistical techniques to be used in this study:- Descriptive Statistics: Descriptive Statistics is the discipline of quantitatively (includes tabulation, graphs and pie chart) describing the main features of collection of data. Analytical methods which can be used: Hypothesis Testing
Hypothesis Test: In statistical hypothesis testing two hypothesis are compared, which are called the null hypothesis and the alternative hypothesis.
The null hypothesis is the hypothesis which states that there is no relation between the occurrences whose relation is under examination, or at least not of the form given by the alternative hypothesis. The alternative hypothesis, as the name suggests, is the alternative to null hypothesis: it states that there is some kind of relation.
Regression analysis: Regression analysis is a statistical process for estimating the
relationships among variable. It includes many techniques for modelling and analyzing several variables, when the focus is on the relationship between a dependent variable and one or more independent variables. More specifically, regression analysis helps one to understand how the typical value of the dependent variable changes when any one of the independent variables is varied, while the other independent variables are held fixed.
Correlation: correlation is a statistical measure that indicates the extent to which two or more variables fluctuate together. A positive correlation indicates the extent to which those variables increase or decrease in parallel, a negative correlation indicates the extent to which one variable increases as the other decreases.

138 | P a g e
Research on factors affecting growth of SMEs has focused primarily on entrepreneurial personality, organization development, functional management skills and sector economics. The Questionnaire covers the personal aspects, social aspects and company benefits and rewards and benefits. Questionnaire designed for data collection:
• The questionnaire contains 24 items with the likert type scale.
Scaling Technique:
The scaling technique is the 5 point likert scale which ranges from strongly agree to strongly disagree.
• The scoring of the scale is:
Strongly Agree/ Very Important/Always – 5 Agree / Important/Sometimes – 4 Neutral/Often – 3 Disagree / Less Important/Rare – 2 Strongly Disagree / Least Important/Sometimes – 1
The questions are related to the research and are adopted from various related research papers relating to variables. The questionnaire has been adopted under the expert guidance.

139 | P a g e
2. Data Analysis
Data Collection & Analysis Techniques For the purposes of the current study, a questionnaire was developed which elicited information on the demographic characteristics of the respondents as well as the profile of the SMEs. It also elicited data on the challenges faced by SMEs and the benefits realized by SMEs in the implementation of logistics strategies. Research Questions (RQ) and Investigative questions (IQ)
1. Age
Below 25 yrs 26-30 yrs 31-35 yrs 36-40 yrs 40 yrs &above
5 25 35 20 15
2. Educational Qualification
Under Graduate
Graduate
Post Graduate
0 64 36

140 | P a g e
3. At present is there a proper match between supply chain philosophy and SMEs logistical activities?
Yes No Not aware 40 35 25
We can infer from the above data that approximately 40% of are in favour that there is a proper match between supply chain philosophy and SMEs logistical activities. But still 25% stays unaware. 4. Is it possible for SMEs to generate common pool of finance and inventory through integration among themselves or with LEs to cater the changing demand? Yes No Not aware 60 35 5
40%
35%
25%
SMEs logistical activities
Yes
No
Not aware

141 | P a g e
We can infer from the above data that it is not possible for majority of SMEs to generate common pool of finance and inventory through integration among themselves or with Les to cater the changing demand. 5. Are SMEs receptive to the adoption of IT for the improvement of their supply chain functions? Yes No Not aware 70 20 10
60%
35%
5%
Yes
No
Not aware
70%
20%
10%
Adoption of IT
Yes
No
Not aware

142 | P a g e
We can infer from above pie diagram that SMEs are receptive to the adoption of IT for the improvement of their supply chain functions 6. Can formalized purchasing procedures help SMEs to improve the effectiveness of their supply chain? Yes No Not aware 68 32 0
We can infer from above chart diagram that formalized purchasing procedures help SMEs to improve the effectiveness of their supply chain. 7. Can alliances help SMEs to speed up their product development process and technological up gradation? Yes no Not aware 72 20 8
68
32
0
0 10 20 30 40 50 60 70 80
YES
NO
NOT AWARE
Purchasing Procedures

143 | P a g e
We can infer from the chart that alliances help SMEs to speed up their product development process and technological up gradation. 8. Is there a fit between supply chain strategy and business strategy of SMEs? Yes No Not aware 48 35 17
01020304050607080
0 0.5 1 1.5 2 2.5 3 3.5
Axi
s Ti
tle
Axis Title
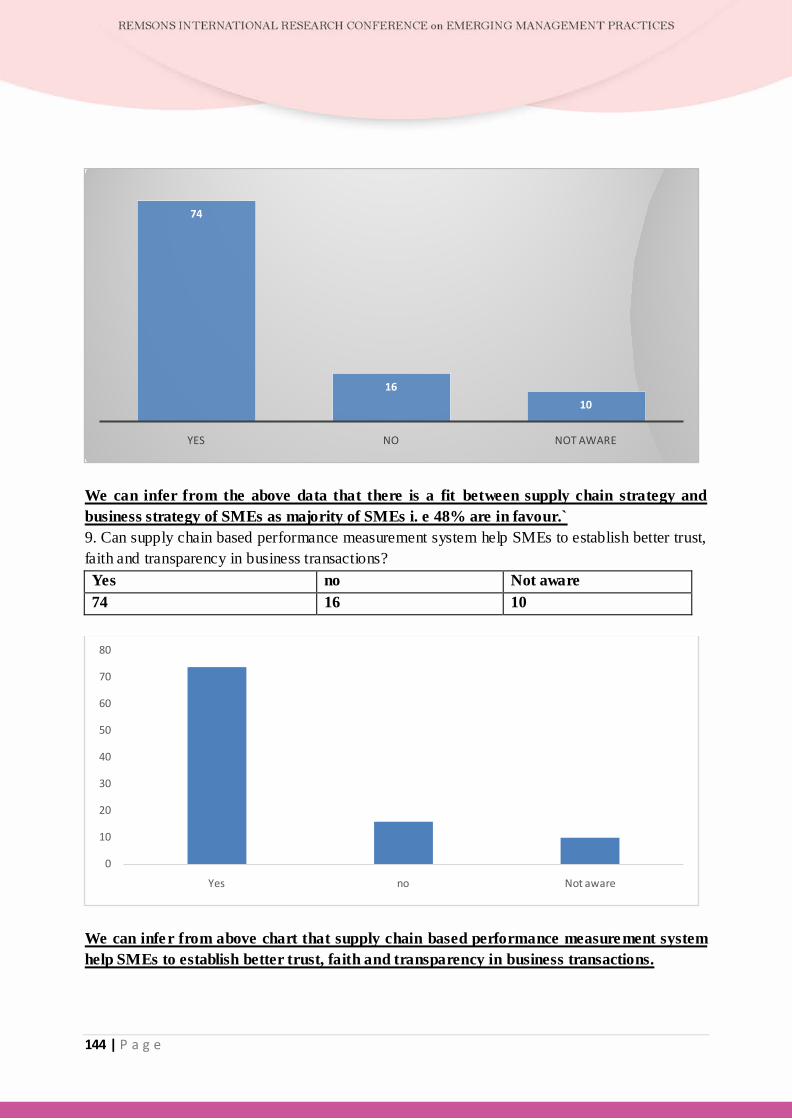
144 | P a g e
We can infer from the above data that there is a fit between supply chain strategy and business strategy of SMEs as majority of SMEs i. e 48% are in favour.` 9. Can supply chain based performance measurement system help SMEs to establish better trust, faith and transparency in business transactions? Yes no Not aware 74 16 10
We can infer from above chart that supply chain based performance measurement system help SMEs to establish better trust, faith and transparency in business transactions.
74
16
10
YES NO NOT AWARE
0
10
20
30
40
50
60
70
80
Yes no Not aware

145 | P a g e
10. Do SMEs consider SCM as part of their businesses strategy? Yes no Not aware 58 35 7
11. Does LEs involve SMEs in their supply chain with right attitude? Yes no Not aware 10 64 26
We can infer from above line diagram that LEs doesn’t involve SMEs in their supply chain with right attitude 12. Are SMEs receptive to SCM philosophy of LEs?
Yes No Not aware 62 38 0
58%35%
7%
Yes
no
Not aware
0
10
20
30
40
50
60
70
Yes no Not aware

146 | P a g e
13. Is there a proper understanding, trust and transparency among SMEs? Yes No Not aware 70 20 10
From the above Line Diagram we can infer that there lies a proper understanding, trust and transparency among SMEs. 14. Is there a proper kind of value sharing model vis-à-vis profit sharing arrangement exist between SMEs and LEs or among SMEs? Yes no Not aware 10 64 26
0
10
20
30
40
50
60
70
Yes No Not aware
0
10
20
30
40
50
60
70
80
0 0.5 1 1.5 2 2.5 3 3.5

147 | P a g e
From the above Chart Diagram we can infer that there is no proper kind of value sharing model vis-à-vis profit sharing arrangement exist between SMEs and LEs or among SMEs. 15. What is the present status of IT implementation in SCM functions in SMEs? Always Sometimes Often Rare Never 46 28 10 8 8
16. Are there barriers to the adoption of IT, e-commerce in SMEs? Yes no Not aware 34 48 18
0
10
20
30
40
50
60
70
Yes no Not aware
46%
28%
10%
8%8%
Always
Sometimes
Often
Rare
Never

148 | P a g e
17. Are SMEs facing problems from their vendors? Always Sometimes Often Rare Never 35 29 15 13 8
18. At present, Do SMEs are following kind of procedures for vendor selection, development and at large for (supplier relationship management SRM)?
Yes no Not aware 20 54 26
34%
48%
18%
Yes no Not aware
0
5
10
15
20
25
30
35
40
Always Sometimes Often Rare Never

149 | P a g e
19. Buyer–supplier relationships are needed among SMEs-LEs and SMEs-SMEs for improving the effectiveness of SME’s supply chain? Yes no Not aware 74 10 16
20. Does large organization support involves SME in their product development process? Yes no Not aware 10 64 26
0
10
20
30
40
50
60
Yes no Not aware
74%
10%
16%
Yes
no
Not aware

150 | P a g e
21. Can SMEs improve their performance by having an appropriate position in the supply chain of LEs? Yes No Not aware 40 50 10
22. Do you adopt new measures that should be included to improve the supply chain function of SMEs? Yes No Not aware 45 29 26
10%
64%
26%
Yes
no
Not aware
40
50
10
YES NO NOT AWARE

151 | P a g e
23. What are the parameters SMEs consider while formulating their business strategy?
lead time inventory turnover ratio
fill rate late delivery customer satisfaction index
24. What priority do they adhere to SCM?
lead time inventory turnover ratio
fill rate late delivery customer satisfaction index
1 3 4 5 2
45
29
26
0 5 10 15 20 25 30 35 40 45 50
YES
NO
NOT AWARE

152 | P a g e
25. Are the measures include supply chain based performance measures like lead time, inventory turnover ratio, fill rate, late delivery, customer satisfaction index etc.? Yes no Not aware 35 42 33
35%
42%
33%Yes
no
Not aware

153 | P a g e
Data-Analysis(Tables)
Table1::Challenging factors in implementing logistics strategies
Challenges Rating of Challenges Position in
rank order 1(%) 2(%) 3(%) 4(%) 5(%) Financial constraints 3.81 10.68 23.66 24.42 33.58 1 Lack of skills/competences among workforce 4.93 14.74 17.03 29.24 34.06 2 High cost of information technology 6.11 7.29 23.9 33.82 27.24 3 Rapid technological advancement 4.58 7.98 27.19 26.43 33.82 4 Logistics excellence among competitors 2.55 12.85 24.26 30.31 30.1 5 Greater demands from order givers 3.05 16.79 15.27 28.24 31.3 6 Increased use of third-party logistics services 5.38 16.92 26.38 26.92 17.69 7 Competition on domestic 5.34 13.74 19.08 25.19 31.3 8 Increased global competition 4.85 14.62 15.38 34.62 22.31 9 Lack of quality logistics personnel 6.11 13.74 20.61 25.19 25.95 10 Organizational transformation 3.82 12.21 25.19 27.48 22.9 11 Refocusing of activities on basic skills 6.87 7.63 24.43 29.01 23.66 12 High customer expectations 3.82 6.87 19.08 26.72 38.17 13 Lack of knowledge on how to use current logistical techniques 5.43 18.05 18.05 26.36 28.68 14 Environmental concerns (Green logistics) 4.58 15.27 21.37 27.48 22.14 15 Inventory-management complications 5.34 16.79 18.32 24.43 29.01 16
Average percentage per response 4.54 12.4 20.72 27.56 27.89 KEY: 1 = Not important 5 = Very important Left over : Unaware

154 | P a g e
Inferences:
1. The analysis of the results as illustrated in Table 1 yields two streams of observations. Financial constraints, the lack of skills among employees in SMEs, the high cost of information technology and rapid technological advancements emerged as the most important challenges among SMEs. At the bottom-most quadrants of the matrix were inventory management complications and environmental concerns. Financial constraints emerged as the top ranking challenge that SMEs face in implementing logistics strategies. To investigate modalities of financing SMEs acknowledged that a majority of SMEs are undercapitalised and are unable to obtain assistance from financial institutions because they do not have sufficient collateral.
2. The lack of personnel who are adequately skilled to implement logistics strategies emerged as the second most important challenge. It is generally acknowledged that India as a country faces a crippling shortage of skilled labour.
3. Moreover, in situations where there is a scarcity of qualified skills, the few available skilled personnel are likely to demand higher remuneration, which can only be sustained by larger enterprises rather than SMES.
4. One of the main factors that influences in the success or failure of enterprise is technology. In this study, technological issues emerged as the third and fourth most important challenges facing SMEs. The best use of technology doubtlessly helps the enterprise in reducing costs of production, maintaining consistency in quality, improving productivity and to develop the competitiveness of the enterprise. However, the diffusion of technology into the SME sector remains a daunting challenge, all round.
5. The technology used by SMEs in their operations is imported, which presents a cost–related albatross for SMEs, since they are inadequately financed to meet the expense Furthermore, rapid technological advancements linked to logistics, such as Electronic Data Interchange (EDI), Distribution Resources Planning (DRP), Automated Storage/Retrieval Systems (AS/RS) and are capital intensive in terms of adoption. Therefore, it is only natural that both the high cost of information technologies and the fast pace at which technology is changing have become major threats to SMEs as they implement logistics strategies
6. In the study, complications related to the management of inventory emerged as the least important challenge among SMEs. This result demonstrates that SMEs perceived that inventory management has not yet posed a severe threat to their implementation of logistics strategies. To appreciate the possible reasons for this result, one needs to understand the most common cause of inventory complications. Inventory-related challenges are mostly linked to a phenomenon known as the bullwhip effect, which

155 | P a g e
relates to overwhelming variations in inventory as triggered by the unpredictability of market demand of a particular product.
7. Typical consequences of the bullwhip effect include either stock-outs or over-stock situations in the supply chain, which have the further effect of complicating planning. The demand of inventory in the market is in turn associated with economic factors, such as whether there is a recession or there is prosperity.
8. Environmental concerns emerged as the second least important challenge. The results of the current study demonstrate that environmental concerns, such as the call for the implementation of green logistics, have little importance to SMEs in their implementation of logistics strategies. This is interesting, since the phrase ‘Green logistics’, which relates to the adoption of environmentally friendly logistics strategies, has captivated the world in the past few decades.
9. Lack of knowledge and experience, and a plethora of technical, information and managerial barriers, all which tend to overwhelm SMEs are therefore factors compelling SMEs to be least concerned with environmental issues.

156 | P a g e
Table 2: Benefits of implementing logistics strategies
Benefits Benefit Rating Position in rank order
1(%) 2(%) 3(%) 4(%) 5(%) Gaining competitive advantages 1.53 7.63 16.79 25.95 44.27 1 Increased sales 2.29 11.45 16.79 32.06 35.11 2 Reduction in operational costs 3.08 8.46 19.23 32.31 32.31 3 Increased turnover 1.54 6.15 17.69 32.31 40.77 4 Reduce inventory level 0.79 10.24 20.47 32.28 33.07 5 Reduce lead-time in production 3.08 5.38 13.08 24.62 53.08 6 Resource planning & cost-saving 1.53 8.4 12.21 29.01 46.56 7 Improved coordination in depts. 1.54 6.15 18.46 30 39.23 8 Increase in coordination between suppliers 2.29 7.63 9.92 35.88 42.75 9 Increase in coordination with customers 1.53 5.34 13.74 32.06 46.56 10 Forecasting 3.05 6.11 16.03 31.3 43.51 11 Support of information systems 3.08 12.31 15.38 26.92 40 12 More accurate costing 5.38 10 16.15 28.46 34.62 13 Difference in actual & forecast demand 4.62 16.15 20.77 23.08 30.77 14 Frequent changes to orders 2.31 16.92 20.77 26.15 26.15 15 Shorter manufacturing lead-time 4.65 6.98 17.83 31.78 32.56 16 Customers' special demands 3.08 7.69 14.62 27.69 45.38 17 Customers' satisfaction 0.76 3.82 11.45 19.85 62.6 18 Improvement in customers' service 0.78 8.53 22.48 27.13 37.21 19 Provides support in achieving objectives 0.76 3.82 16.79 32.06 42.75 20 Quick response to customer needs 2.31 3.85 10 29.23 53.08 21 Quick facilitation of the business processes 0 5.34 12.98 32.06 45.8 22 Uniqueness of the product 3.82 6.87 14.5 29.77 41.98 23 Anticipation of customer needs 2.31 6.15 13.85 33.85 42.31 24 Flexibility 2.29 9.16 12.98 28.24 45.8 25 Ability to innovate 0.76 5.34 9.92 31.3 51.15 26 Reduced labour turnover 0 4.58 12.21 22.14 58.78 27 Average percentage per response 2.19 7.79 15.45 29.17 42.52 KEY: 1 = Not important 5=Very important Left over : Unaware

157 | P a g e
Inferences:
1. An analysis of the results of the study in terms of the benefits derived from implementing logistics strategies (Table 2) reveals that gaining competitive advantages, increased sales and a reduction in operational costs were the most important paybacks to SMEs. Reduced labour turnover and the ability to innovate occupied the two lowest quadrants in the matrix.
2. Competitive advantage occupied the highest position among the benefits derived from
implementing logistics strategies. Logistics provides competitive advantage through an array of its associated areas that include quick response systems, efficient consumer response, cross docking, management of incoming raw materials, production, storing of finished goods, its delivery to the customer as well as after sales service.
3. The findings of this study seem to suggest that most SMEs have realized this fact, and
are therefore deriving sustainable competitive advantage from their logistics strategies.
4. The results of this study also reveal that increased sales were the second highest ranking benefit. This finding demonstrates that by implementing logistics strategies, SMEs experience increased sales, which they consider to be a very important benefit. This is important, since increased sales are an antecedent to increased profits, which is the very reason for existing in business.
5. The reduction of operational costs emerged as the third most important benefit
attributable to the implementation of logistics strategies by SMEs. The fact that efficient logistics pushes down costs is well established. Besides increased sales, profit may also be increased by reducing operational costs. The rational is that if logistics costs are suppressed, the funds that have been saved are available to the company and may also be used to boost operational profits. This principle is manifested through the Theory of Constraints (TOC), a conceptaimed at ensuring organizational effectiveness and efficiency in supply chains through reducing costs rather than through increasing sales.
6. Reduction of labour turnover and increased innovation emerged as the lowest ranking
benefits. This implies that SMEs have not been able to link any decreases in turnover of manpower to the implementation of logistics strategies.
158 | P a g e
7. With regard to innovation, respondents gave innovation a ‘less important’ tag, which suggests that they did not link it to the implementation of logistics strategies. This finding, however, contradicts previous studies which reveal that the adoption and implementation of logistics strategies by SMEs has a stimulus effect on innovation in the organization.
Conclusion and Recommendation
The purpose of the study was to investigate role of SCM in SME Sector, i.e. the challenges encountered as well as the benefits derived by SMEs from the implementation of logistics strategies. Although the findings of the study are not surprising, they provide extended evidence regarding the perceptions of SME owners and managers towards these challenges and benefits. The study acknowledges the dominating influence and importance of four challenges namely, finance, skills shortages among logistics practitioners, high costs associated with information technology and rapid technological developments faced by SMEs in implementing logistics strategies. Inventory management complications and environmental concerns emerged as the least important challenges experienced by SMEs in implementing logistics strategies. Increase in competitive advantage, increased sales and the reduction of operational costs emerged as the most important benefits that SMEs realize in implementing logistics strategies. However, the reduction of labour turnover and increases in innovation were the least important benefits to SMEs. Based on the findings of the study, several recommendations can be made:
• To address the challenges related to financial capitalization, SMEs could seek financial assistance from government initiatives.
• Further financial assistance could be accessed through collaborative efforts between the SMEs and their suppliers. As a remedy to the extensive skills shortages, SMEs could invest in sustained training and development programs aimed at enhancing the logistics-related skills of their workforce.
• To deal with the complications associated with technology, SMEs could ensure that
technology issues are co-opted into strategic planning initiatives, such that they form part of the goals and vision of the enterprise.
However, this can only be attained when SMEs have managed to obtain adequate financial assistance, since the adoption of technology also depends on the availability of financial resources. If implemented, these strategies will effectively assist SMEs to proactively deal with nagging challenges encountered during the implementation of logistics strategies.

159 | P a g e
The disagreements for the adoption of SCM in SMEs are primarily based on the reasons that these organizations are relatively opportunistic and in contact with relatively few rivals; more cash focused, short term and instil better communications and incentives for exploiting internal knowledge restricts the application of supply chain practices in SMEs.
• SMEs can consider SCM as strategic weapon to improve their performance in competitive market.
• SCM can help SMEs to establish better relationships with their OEM or large enterprises and hence derive the opportunity to improve their learning curve.
• Adoption of SCM by first-tier and second-tier SMEs can help to consolidate the component level requirements of their OEM customers at few stages and in turn it can help to boost the profit of their own and overall supply chain.
• Coordinated efforts can help to reduce waste and buffer inventories at SMEs factory and
warehouses.
• SMEs generally face problems in meeting erratic demands of their OEM customers.
• SCM can help them to improve forecasts and hence purchasing schedules by streamlining inter and intra organizational activities.
• SCM can help SMEs to smoothen their financial flow and inventory flow by improving
upon the supply chain relationships.
Briefly, this study offers a number of managerial implications.
• By developing and validating a multi-dimensional construct of SCM practices and by exhibiting its value in improving operational performance of SMEs, it provides SCM managers with a useful tool for evaluating the efficiency of their current SCM practices.
• The analysis of the relationship between SCM challenges and benefits indicates that SCM practices might directly influence operational performance of SMEs. The SCM managers should also be cognizant of the intermediating effect of operational performance that SCM-related organizational performance could only be enhanced by improving operational performance in the first place.

160 | P a g e
• The findings of this study tend to support the view that the implementation of SCM practices will have a significant impact on the operational efficiency of SMEs in an emerging country context.
Researchers can use the findings herein to generate ideas for future studies, and top managers can glean important knowledge about how effective SCM impacts SME’s performance.
Bibliography
http://www.academia.edu/Supply_Chain_Management_for_Small_and_Medium_Size_Enterprises
Asian Productivity Organization 2002 ; ISBN: 92-833-2319-X www.smechamberofindia.com/ www.supplychain-forum.com

161 | P a g e
SOCIAL AND LEGAL IMPLICATIONS OF TELEVISION ADVERTISING IN INDIA Dr. Tejal Jani
Associate Professor, English Department (GLS {J P Shah} IBA) Ms. Himani Sardar
Assistant Professor, Accountancy Department (GLS {J P Shah} IBA)
Advertising is a form of marketing communication through which the inherent quality of a product or service is promoted. It is considered to be the prime motivator in the increase in consumer demand. Advertisers generally advertise their products or services either in newspapers, or magazines, or direct mail, or radio, or television, or internet, or outdoor signs. Amongst the various media, advertisements on television are considered to be the most effective way of product or service promotion because of two reasons; 1) it is easily accessible medium of communication and 2) it brings audio-visual action to the homes of potential consumers. Owing to the vast mass appeal of the television medium, the advertisers often use such strategies which might be in violation to social, ethical and legal norms of the country. Under such circumstances, the television advertisements in India and its social as well as legal implications make an interesting study. At the same time, it would be interesting to know whether any regulatory mechanism exist to monitor such advertisements.
Keywords: advertising, advertisements, social, legal, regulatory
INTRODUCTION
Williams Arens defined advertising as the structured and composed non-personal communication of information, usually paid for and usually persuasive in nature, about products (goods, services, and ideas) by identified sponsors through various media (2005). Amongst the various media, advertisements on television are considered to be the most effective way of product or service promotion because of two reasons; 1) it is easily accessible medium of communication and 2) it brings audio-visual action to the homes of potential consumers. For this reason, Lawrence Samuel considered television as ‘a surrogate salesman’ (Samuel, 2002).
Lynne Ciochetto believed that advertising affected social attitudes (2004). It is a proven fact that ‘advertising can persuade/influence someone to buy a product that they have never previously purchased’ (Khandai & Agrawal, 2012). Ms. Hemamalini. K. S and Ms. Shree Kala Kurup have
11

162 | P a g e
been of the opinion that advertisements influenced customers’ interest for purchasing or to the desire for purchasing (2014). K C Gopakumar while tracing the history of television advertising in India in his thesis Advertising in Kerala: its Influence on Select Consumer Non-durables stated that the first television commercial was introduced on 1st January 1976 and that the advent of colour television and satellite TV catapulted television advertising to an unprecedented height (2004).
Television advertising promotes sales of products because they succeed in manipulating ‘people’s strongest desires and greatest fears to convince them to buy the proffered products’ (Kanner & Soule). As stated on the website of Indian Brand Equity Foundation, by 2017, Indian advertising industry is estimated to be Rs 63,000 crore (US$ 10 billion) with both print and TV having a share of 38-40% each by 2017 (Advertising and Marketing Industry in India). A report in Business Standard stated that TV ad volume grew 111% (Majumder, 2015). A report in live Mint suggested that expenditure on television advertising has been driven up by sectors like e-commerce, automobiles, fast-moving consumer goods (FMCG), consumer durables, and banking, financial services and insurance (Bansal, 2015). On the other hand while debating over international advertising in the book Advertising and Societies: Global issues, K T Frith and Barbara Mueller have put across their observation about the way in which advertisements apart from providing information, transmit values and influence behaviour of both individual as well as value-forming institutions (2010). Under such circumstances, though Television advertising in India promotes the economic activity, it becomes necessary to study its social and legal implication.
RESEARCH METHODOLOGY
Objectives of the study:
-To analyze the Social Implications of TVCs in India
-To understand the Legal Provisions made for TVCs in India
-To study the different effects of TVCs on society
Type of Research:
-Textual Analysis has been done on this research paper
Sample Size:
-Different Advertisements of different categories mentioned in ASCI Code has been taken.
Type of Data:
-Secondary Data has been used

163 | P a g e
Source of Data:
-Televisions Commercials have been considered.
-Rules for TVCs mentioned in ASCI code have been considered.
Limitations:
-Only selected TV Commercials have been considered.
-Two aspects i.e. Social and Legal aspects have been studied
-Only Indian TVCs have been studied.
DATA ANALYSIS
Before we understand the implicit significance of television advertising in India, it is necessary that we understand the scenario of advertising in India at the outset. Every industry has a watchdog so that its fair and just functioning is ensured. Every kind of advertising in India is monitored by Advertising Standards Council of India which is a self-regulatory voluntary organization established in 1985 and is formed by constituents like advertisers, advertising agencies and media. It seeks to ensure that advertisements are honest representations, non-offensive to public, against harmful products and situations, and fair in competition. Interestingly, “ASCI’s code of self-regulation in advertising is now made part of the mandatory advertising code under the provision of the Cable TV Act-the violation of which results in a breach of the rules of the Government of India” (Shah, 2014).
Laws like The Press Council Act 1978, Cable Television Network Rules, 1994, Emblems and Names (Prevention of Improper Use) Act, 1950, Young Persons (Harmful Publications) Act, 1956, Companies Act, 1956, Standards of Weight & Measures Act, 1976, Indecent Representation of Women (Prohibition) Act, 1986, Consumer Protection Act, 1986, Laws related to intellectual property rights, The Drugs and Cosmetic Act, 1940, The Transplantation of Human Organs Act, 1994, The Drugs and Magical Remedies (Objectionable Advertisements) Act, 1954, The Prenatal Diagnostic Techniques (Regulation and Prevention of Misuse) Act, 1994, Advocates Act, 1961, Infant Milk Substitutes, Feeding Bottles and Infant Foods (Regulation of Production, Supply and Distribution) Act, 1992, Securities and Exchange Board of India Act, 1992, The Prize Chits and Money Circulation Schemes (Banning) Act, 1978, Cigarettes and other Tobacco Products (Prohibition of Advertisement and Regulation of Trade and Commerce, Production, Supply and Distribution) Act, 2003, Public Gambling Act, 1867, the Lotteries (Regulation) Act, 1998 and the Prize Competitions Act, 1955, Indian Medical Council (Professional Conduct, Etiquette and Ethics) Regulations, 2002, The Food Safety and Standards Act, 2006 form the crux of ASCI code.

164 | P a g e
Self – regulation guidelines for advertising states that the content editor of Broadcasting Service Provider (BSP) will preview each advertisement to certify that its content complies with ASCI code. But then the question is: is there any compliance with this code? We need to study certain TVCs to assess this compliance.
We shall first try to understand if there is legal compliance or not. As per the code, the TVCs should not be misleading. The TVC of Set-Top-Box matlab Dish TV begins as if it is an awareness commercial launched by the government with a view to implement digitization of Cable Services. In the first half, the viewer’s attention is grabbed by making him understand the importance of installing set-top-box. In the second half, using the same span of attention, the advertiser positions his product by asserting Set-Top-Box matlab Dish TV. Such TVC tends to exploit the viewers’ lack of knowledge by misleading them about the concept and the availability of set-top-boxes in the market. In the same way, the TVCs of Nutrislim and Nutrigain promise the viewers about the magical efficacy of the products wherein the advertisers seem to be silent
about the possible side effects of their products. These TVCs seem to be silent about their research /assessment as well. According to the advertising code, the super in the TVC should be in the same language as the audio of the advertisement (2013). However, in the TVCs of Nutrigain and Nutrislim , the super about the products is in English.
The advertising code explicitly prohibits showing women in indecent way. However, majority of the advertisers titillate sexual stimuli of the viewers by associating the availability or obtainment of their products with the obtainment of the female. In the TVCs of Engage deo as well as Wild Stone deo, the females are shown craving for the male company and behaving unacceptably under the impact of these deos. Unfortunately, the females in TVCs seem to be predominantly in the role of a seductress whether it is required or not for promotion of the product. Lux Soap Roop Tera Mastana tvc featuring Deepika Padukone and Imran Khan are shown indulging in physical proximity which of course, can be avoided. Showing females scantily dressed has become the trend of the day. The ad campaign of Amazon Online shopping has all its females showing the skin. The TVC of Milk food 100% Dairy whitener shows the female scantily dressed. In the TVC of Paras Masala endorsed by Arbaaz Khan, the advertiser has objectified the females as ingredients used in paan masala. Touching the scantily dressed female’s body with a golf ball is considered success in the ad of Denver deo. The TVC of Parachute Advansed Body Lotion shows as the female as a sex object and has presented her body curves in the way in which one cannot see with the family. In the same way, the ad campaign of Manforce Condoms violates the code by its indecent portrayal of the female along with the celebration of the bodily desire—the idea which goes against the Indian ethos. Incidentally, the females are used to promote products meant for the males.

165 | P a g e
It seems our advertisers rarely follow the advertising code. According to this code, such advertisement is prohibited which adversely affects friendly relations with a foreign State (2013). Despite this, the latest TVC of Fogg Border derides the intellectual level of the Pakistanis. Had the ad got over with the confusion on the face of a Pakistani, it would have been slapstick but juxtaposing it with the dog’s understanding gives an ugly touch to it.
The advertising code insists that the TVC should not be create in children any interest in unhealthy practices or shows them begging or in an undignified or indecent manner. Unfortunately, all health drinks – be it Complan, Horlicks or Bournvita – all target children and their pester power to increase the sales of their products. Knorr Soupy Noodles, Yippee noodles, Maggie noodles, Chocos, Kisaan Tomato Ketch up and many more food TVCs feature children as their characters. Incidentally, the food they advertise for and the food style they promote generally belongs to the category of junk food which is considered to be harmful to health. In the TVC of Surf Excel Matic - As Good As Mom's Hand Wash, the child is shown not just repairing the cycle but also using washing machine to clean his t-shirt which goes against the code of not showing minors using or playing with mechanical or electrical appliances.
By and large, there appears to be gross violation of the code promulgated by ASCI. The characters in the role of doctors are shown promoting products like Lizol, Patanjali Tooth paste, Sensodyne or Colgate in order to make their products authentic which is nothing but a fraudulent way of product promotion. Patanjali noodles use the colours of Indian tricolor to sell its product by appealing the patriotic sense of the Indians. Imperial Blue – Branded liquor is advertised by the promotion of musical CDs. McDowells, Haywards 5000 promote liquor by promoting soda. Branded whiskey- Officer’s Choice tend to promote its product by promoting righteousness in public life. Though there is a restriction regarding the advertisements of hospitals, Vasan Eye Care promoted the hospital as well as lasik surgery by showing how the boy benefits after getting his spectacles removed with the surgery. Advertisements of tobacco products and gutkhas are legally prohibited but they are still promoted in the name of paan masalas like Pan Parag, Pan Vilas, Paras and so on.
In its Self - Regulation Guidelines on Advertisements for Automotive vehicles, ASCI Advertisements should not show speed maneuverability in a manner which encourages unsafe or reckless driving, which could harm the driver, passengers and/or general public or show Stunts or actions, which require professional driving (2013). Tata Safari Storme as well as Mahindra TUV 300 shows all stunts to emphasize the toughness of the vehicle. Mahindra TUV 300 unintentionally also shows violence against children as well as promotes the use of such vehicle in criminal doings. Stunts are being performed while promoting Continental tyres. In the same way, there is a guideline for Educational Institutions and Programs. However, TVCs of Lovely Professional University, Amity University appear to fail in elucidating about their affiliations as well as programmes they offer.

166 | P a g e
The interesting thing about TVCs is that they often carry disclaimers / qualifications of claims through supers as mandated by ASCI, but these supers are written in such font size that they are hardly readable. Such loophole allows the advertisers to promote their products without being pursued for any illegal portrayal of content.
The social impact of television commercials is difficult to measure but the kind of message they pass on can be ascertained on the basis of their textual analysis. TVCs promote a feel good but elusive lifestyle. As the TVC claims, Ponds Age Miracle makes you look younger by 10 years but it does not allow you accept ageing in a dignified way. TVCs of Fair and Lovely Fairness Cream and Anti Marks Cream strongly put forth the idea that a woman would become confident and successful only if she has a fair look. Genetically, nothing can change one’s skin colour, but such advertisements inculcate the sense of ignominy in dark-skinned females.
The role of females is largely shown to be subservient to males. Females in the majority of TVCs are shown not as somebody who has the authority to say something about the product. In case of Harpic Flushmatic, the male salesman enters the house and reasons out with the homemaker as why she should use the product. Ad campaign of Syska LED lights with wife as well as sister shows that the females do not have idea about the kind of lights to be used in the house.
The latest TVC of OLX- Aadhe Tere – Aadhe Mere show the powerlessness of an educated working woman at its best. An educated working woman has to depend on her husband not just for transportation but also in deciding to buy a personal vehicle for her. It would be interesting to note that over a period of time, the dressing of females in TVCs have changed from traditional to modern. Consequently, the females are portrayed showing skin – be it office as in OL Aadhe Tere – Aadhe Mere X, in bedroom as in Milk food 100% Dairy whitener, in drawing room as in Syska LED with sister. However, there is a very little change in their role of a homemaker. Madhuri Dixit in Aqua Guard Water Purifier, Juhi Chawla in Chocos, Farida Jalal in Godrej No 1 Soap, Hema Malini in Kent Water purifier is shown looking after the well-being of the family. TVCs of Moov, Iodex, Clinic Plus Shampoo, Stayfree Secure Cottony Soft XL, Bournvita Swimmer show the female as proactive homemakers.
On the other hand, the rough and tough image of the men is consolidated by the commercials like Thums Up, MRF Wanderer - Tread Anywhere, Dollar Big boss, and so on. The infidelity of men is not just shown in the TVC of Imperial Blue but is accentuated by its tag line-Men will be men.
As stated on the website of India Brand Equity Foundation, advertisers normally indulge in occasion based marketing to promote their products. It would be interesting to observe that the product promotion and discount offers are facilitated only during Hindu festivals. Such marketing strongly sends out a message that people of other religions in India occupy peripheral positions. By and large, the characters of TVCs are Hindus and sometimes Sikhs but not of any other religion which speaks volumes about the religious dynamics of India.
167 | P a g e
The kind of India that is being presented in TVCs fail to create a very good impression of India as a society. Lifebuoy’s TVC of ‘help a child reach 5’ not only throw light on prevalent status of health and hygiene but circumstantially promote an act of superstition in illiterate, rural setup. Ad campaign of CP Plus CCTV Camera unintentionally shows the execution of various crime in an attempt to promote the product. It also shows the vulnerability of weaker section in our country. TVCs in India, by and large, seem to rework value system by associating happiness with beauty, fitness, skin colour, materialistic achievement and possession. The TVC of New Powerful Rin at Hotel sadly reflects the undercurrent of the Indian Society.
Television advertising stands at the intersection of the culture and the economy. So, there is a need to set up a mechanism which works in favour of the culture as well as the economy. This can be done by taking up certain measures as under:
India has a voluntary, self-regulating body consisting of various constituents of Advertising industry to monitor advertising. Instead of this, India should have a statutory, autonomous body consisting of members from various walks of life.
This body should have separate committees for print advertising, television advertising, online advertising and so on.
This body should have centres in every state so that it can monitor advertising in vernaculars as well.
Television commercials should not be broadcasted without the prior certification of this body due to the outreach and impact of television commercials.
As of now there is a tab of lodging complaints about advertising on the website of ASCI. However, unavailability of internet across the country as well as digital illiteracy would hamper such process. So, a toll free number should be introduced so that the public can register their complaints about TVCs. This number should again operate in various vernaculars spoken across the country.
The proposed statutory body should launch an awareness campaign regarding grievance redressal number.
At the same time, all television networks should be mandated to scroll this number at the interval of 15 minutes throughout the transmission of programmes.
The grievance should be redressed within the fortnight of lodging complaints.
Any laxity either on the part of grievance redressal mechanism or the advertiser should be made a punishable crime.

168 | P a g e
CONCLUSION
One cannot do away entirely with the concept of television advertising. It is an inevitable tool through which the economic activity of sales is initiated. However, it is equally related with the culture of a nation. Lynne Ciochetto in her research paper entitled Advertising and globalization in India has expressed her apprehension about advertising having impacts on culture, through the undermining of traditional habits and behaviors, the creation of new wants and desires, often for products like soft drinks that have no nutritional benefit, and also by strategies that rework cultural values and beliefs (2004). All the TVCs analyzed gives the results that there are many commercials which do not follow the ASCI code very formally and secondly there is no control of ASCI over all such issues which could be handled by them. So, it becomes the responsibility of the society to prevent this sector from wielding distorted influence, mutating values and undermining culture.
WORKS CITED
Advertising and Marketing Industry in India. (n.d.). Retrieved January 11, 2016, from Indian
Brand Equity Foundation: http://www.ibef.org/industry/advertising-marketing- india.aspx
Arens, W. (2005, April 25). What Is Advertising Today? Retrieved January 10, 2016, from
Advertising Educational Foundation: http://www.aef.com/pdf/arens_ch01.pdf
Bansal, S. (2015, September 16). Advertising expenditure on TV grows 21% in first half of
2015. Retrieved January 11, 2016, from Mint:
http://www.livemint.com/Consumer/RjAvu3qr3pQQIV4vQCeVuK/Advertising-
expenditure-on-TV-grows-21-in-first-half-of-201.html
Ciochetto, L. (2004, June 14). Advertising and globalisation in India. Retrieved January 11,
2016, from Swedish South Asian Studies Network:
http://www.sasnet.lu.se/EASASpapers/7LynneCiochetto.pdf
Dictionary. (n.d.). Retrieved January 10, 2016, from American Marketing Management:
https://www.ama.org/resources/Pages/Dictionary.aspx?dLetter=A Frith, K. T., &
Mueller, B. (2010). Advertising and Societies: Global Issues. New York: Peter Lang .

169 | P a g e
Gopakumar, K. C. (2004, January 29). Advertising in Kerala its influence on select consumer
non durables. Retrieved January 11, 2016, from Shodhganga:
http://ietd.inflibnet.ac.in/bitstream/10603/375/7/07_chapter2.pdf
Hemamalini, K. S., & Kurup, S. K. (2014). Effectiveness of Television Advertisement on
Purchase Intention. International Journal of Innovative Research in Science , 9416-9422.
Kanner, A. D., & Soule, R. G. (n.d.). Globalization, Corporate Culture and Freedom. Retrieved January 12, 2016, from Ecopsychologist: www.ecopsychologist.com/publications-writings/ecopsychology-and-consumer-culture
Khandai, S., & Agrawal, B. (2012). Impact of Television Commercials upon the Purchase
Behavior of Urban Indian Children. International Journal of Marketing and Technology,
72-91.
Majumder, A. (2015, October 28). TV ad volume grows 111%. Retrieved January 11, 2016,
from Business Standard: http://www.business-standard.com/article/companies/tv-ad-
volume-grows-111-115102800016_1.html
Samuel, L. R. (2002). Brought to You by: Postwar Television Advertising and the American
dream. Austin: University of Texas Press.
Shah, K. (2014). Advertising and Integrated Marketing Communication. New Delhi: McGraw
Hill Education.
The Code for Self- regulation in Adverising. (2013, October 24). Retrieved January 12, 2016,
from Advertising Standards Council of India:
http://www.ascionline.org/images/pdf/asci_code2new.pdf

170 | P a g e
How Not to Be an Alien: Moulding Global Human Resource through Cultural Sensitisation Dr. Preeti Sharatchandra Shirodkar
Associate Professor, Communication and Soft Skills, MET Institute of Management
There is no denying that, since the 1990s, with globalisation and the throwing open of boundaries, employees at all levels, across industries and despite where they find themselves – at home or abroad – are expected to efficiently deal with situations and people, who belong to cultures other than their own. Moreover, while on the one hand, one’s exposure to diversity and knowledge resources, which can help keep one updated, are multitudinous, on the other, one is still caught unawares, given the complexity of situations that unfold. This issue, as a result of the fact that no specific training is available to deal with this diversity, at the microcosmic level; though at times efforts are made by companies and individuals to provide such knowledge, at the macrocosmic level. The result that can emerge from this ignorance can, moreover, range from the hilarious to the disastrous. Furthermore, though there is no denying that, however well-equipped one believes oneself to be, one cannot be prepared for all situations at all times, a basic preparedness can not only boost confidence, but can also save a lot of embarrassment to the self and others. Against this backdrop, my paper would like to examine, by citing real life scenarios, how cultural sensitivity is an essential soft skill that needs to be built into the workforce, so that the global human resource, we have, becomes so in spirit and not merely in letter. Keywords: Cultural sensitisation, effectiveness, global human resource
“At least half of the exercise I get every day comes from jumping to conclusions.”
- Bruce Dexter, Journalist
12

171 | P a g e
The history of humankind is replete with examples of how human interactions have been dogged by deep set unpleasantness and hatred, as much as understanding and affection, especially in the context of the ‘other’; and in a world where globalisation rules the day, this attitude - leaning more towards ranging from indifference to hatred/phobia, rather than towards an awareness of the ‘other’ - can prove to be detrimental: whether to an individual or an organisation. Inspired by George Mikes’ book How To Be An Alien, written in 1946 to tell the English what he ‘thought about them’, my title is an attempt to show how the situation has changed since; and today, in a world where diversity has transcended national boundaries and has been embraced more as a rule than an exception, it is time that we move from letting others know what we think about them, to knowing them, so as to facilitate our contribution to both the personal and professional space.
There is no denying that cultural diversity is now a norm, post the onset of globalisation and the throwing open of doors to a global workforce; and though India may consider itself to have an edge in its exposure to diversity, given the multicultural nature of our nation and our long history of being colonised, it is a lead we need to struggle to keep, given the torrential gush of cultural diversity today; if one desires not to be swept off one’s feet.
Culture, simply put, can be defined as “a shared system of meanings, beliefs, values, behaviours, through which experience is interpreted and carried out” (Attitudes & Behaviour “Cultural Awareness”, 2003). As a result, it latently implies the emotional, physical, psychological and geographical grouping of people over a space of time. Given its context, its unsaid is also that people are not merely habituated to their culture, as it constitutes their identity over time, but also, as a result, are fairly involved with and attached to it. Consequently, as A Study on Pragmatic Failure in Cross-cultural Communication, Sino-US English Teaching (2010) points out, “As a rule, people are much less tolerant of cultural “bumps” and cultural shocks than they are of grammatical mistakes and lexical insufficiency.”
Incidentally, as documented by Chebium (2015), organisations are getting increasingly culturally diverse; for example SAP, which is a software giant based in Walldorf, Germany, has locations in 130 countries and 89 nationalities are represented among the headquarters staff alone; and, if one desires to flourish in such a space, whether as an organisation or individual, rather than floundering or failing, not developing and exhibiting cultural sensitivity is not an option. While this is a given, what actually complicates matters is that what is effective in one culture may be ineffective, or even inappropriate, in other cultures (Jhunjhunwala, 2012) and the faux pas that may result from the absence of this trait/skill can range from the humorous and embarrassing to ones that can prove to be disastrous for the individual, the organisation or both. Contrapuntally, developing, nurturing and exhibiting this skill can prove to be turning point in an individual’s or organisation’s life for better or worse. And, while there is no denying that given the vast scope and possibilities that lie latent in this diversity, the task is humongous and one that it may not be easy to master, it is a journey that every working professional and organisation needs to embark on.

172 | P a g e
In fact studies (Enhancing Relationships through Cultural Competence, 2012) have shown that cultural sensitivity translates into cultural competence and in the long run serves both the individual and the organisation. While in the case of the former it results in the ability to value the differences/similarities between persons and groups and recognise the importance of a person’s life context , in order to make the most of interpersonal relationships, in both the personal and professional space; in the latter, it chiefly aids in improving the quality of services and outcomes, gaining a competitive edge, in the marketplace, and enhancing the workplace environment, so as to ensure the best performance from employees.
Furthermore, in the twenty first century, the focus, for assessing workplace fit and efficiency, has gradually, but definitely, moved from an emphasis on the prospective employee’s Intelligence Quotient (IQ) and Emotional Quotient (EQ) to that on the Cultural Quotient (CQ) – a concept that was first introduced by two business researchers – Christopher Earley and Soon Ang - in their book Cultural Intelligence: Individual Interactions across Cultures (2003).
Cultural Quotient is a dimension that quantifies a set of capabilities that include cultural knowledge, cultural drive, cultural strategy and cultural action and thereby reflects the ability of a person to be successful in a culturally diverse environment. In fact, a study done by the Cultural Intelligence Center, Michigan has revealed that not only are persons with higher CQs more personally and professionally effective, they also have an edge in a crowded job market and enjoy greater personal satisfaction and less burnout in multicultural situations, but also help increase company revenue within 18 months by up to a 100%.
While there is no denying that scoring high on Cultural Quotient is not simple, given the diverse areas it covers and the multitudinous cultures, at both the local and global levels, it encompasses, and improving one’s CQ is a challenge that needs to be tackled head on and systematically; and, if that is done, the results are very encouraging.
The world has come a long way from a community based existence to one where diversity is more a norm than an exception, so much so that even at the individual level, a person who is ‘pure’, as regards his/her culture or traditions, can be found, if at all, with extreme difficulty. What makes diversity interesting is not merely that it is moving from a macrocosmic to a microcosmic level, but that it is reflected through varied areas and aspects that inevitably and inadvertently crop up, in both the personal and professional space.
What can serve as a beginning in the quest to acquire cultural competence and develop cultural sensitivity though is an understanding of the chief areas, through which cultural difference manifests itself:
• APPROACH TO TIME: As basic a thing as time is approached in extremely different ways across continents and this is difference in approach is bound to prove consequential in any cross cultural interaction, whether in the form of meetings or negotiations, among varied others. According to Huang L. (2010), European and American cultures view time as unilinear and valuable, believing it to be a thing that can be saved, spent or wasted, thus focusing on

173 | P a g e
scheduling their activities. The approach of other cultures is however very different - the Russians consider time as the cheapest of commodities and an inexhaustible source; the Chinese look upon it as elastic, believing that time can be stretched or contracted and the Arabs and Indians often lack a strict sense of time, resulting in the acronym IST being expanded, in jest, in India, as Indian Stretchable Time. In fact, in Germany, the Inter City Express train timings are calculated to the second and even a few moments delay, in the most rare and extreme situations, is accompanied by profuse apologies, while in India, when one embarks on a journey, one learns to check beforehand, if trains are on schedule, especially on long distance routes.
• COMMUNICATION: In a global context, language becomes a basic means of idea exchange, not only in its verbal and nonverbal aspects, but also in the manner in which one communicates. Given its vast scope, communication becomes not merely a challenge, but one of the primary challenges that one faces in an international context, often resulting in not merely miscommunication but also a great deal of losses.
Unlike popular belief, not knowing the language proves to be the least of the problems, as the bigger issue is that words often mean very different things in different countries. As Fang J.’s (2010) study documents ‘never mind’ is often used by the Chinese instead of ‘thanks’, while in most other countries and contexts, it is said in response to an apology and is meant to offer consolation. Furthermore, the same word can have different connotations, as the associations that result in meaning being ascribed to them are very different. Varied research cites the example of the diverse evocations of the word ‘dog’, which is associated with loyalty, bravery and intelligence in the Western world, while it is used derogatively by the Chinese and is looked upon by the Arabs as something unclean. As a result, if a ‘dog’ is used as a part of an advertisement or trademark, it would evoke extremely diverse reactions from different people.
The association that words evoke, therefore needs to be carefully studied, based on the context and space, in which one desires to use them, as discovered by the UK sports manufacturer Umbro, to their peril in 2002, when they had to withdraw their new sneakers called Zyklon, as they received complaints from many organisations and individuals, who maintained that it was the name of the gas used by the Nazi regime, to murder millions of Jews in concentration camps (Kwintessential, 2014).
Moreover it is important to not merely pay close attention to cultural references associated with words; as seemingly innocuous words can create a lot of misunderstanding, but also be careful while translating. One can only imagine the amusement generated by the notice at the Budapest Zoo, which read “Please do not feed the animals. If you have any suitable food, give it to the guard on duty”.

174 | P a g e
Ironically, in the absence of words, people often choose to rely on nonverbal communication, in order to establish connect with another person/culture. However, whether it is signs and symbols or gestures, the possibility of miscommunication is much higher than may be envisaged. Even within the same country, a gesture can mean different things, depending on as small a variation as the palm being pointed inside or out. The victory sign made with the raising of the index and middle finger requires that the palm is facing the person viewing the gesture; if the palm is pointing the person making the sign, the same gesture is considered an insult.
So too, signs and symbols which have seeming international recognition can cause a great deal of problem as Kwintessential’s article on Cross Cultural Marketing Blunders (2014) points out, “the staff at the African port of Stevadores saw the "internationally recognised" symbol for "fragile" (i.e. broken wine glass) and presumed it was a box of broken glass. Rather than waste space they threw all the boxes into the sea!”, an action that must have caused both a great loss and inconvenience.
Against this backdrop, the manner of communication, which encompasses a person’s approach to style and use of humour and idioms, can only result in a greater number of issues. While the kind of humour used is very different in different cultures, for example, the stiff upper lip British humour versus the gregarious guffaws of the Americans, it’s very manifestation and presence can also both prove to be problematic. While some cultures would dismiss humour as frivolous, others would consider it as icebreaking or even a symbol of intelligence.
Moreover, considering that idioms are essentially a product of the socio-cultural milieu, their implications might be totally lost to a person not intricately familiar with the language and culture. Incidentally, there are very few idioms, which are common across cultures and some sayings/idioms can in fact be opposing. For example the phrase ‘adkityatlisupari’, referring to a betel nut held in a betel nut cracker, used to refer to a situation, where one feels caught between two opposing things, may be totally lost in western cultures, where eating betel nut or even paan (betel leaf digestive) is unheard of.
Given also that the style of expression may change, from one group to another, it might be very difficult to understand what the communicator is trying to convey, through what is being said. The Japanese, for example, are known to say ‘yes’ during negotiations, but this response is meant to communicate that they have understood, and not that they agree.
• VALUES: A primary and significant difference among cultures is both the personal and professional values that people belonging to a community hold. While personal values would cover an individual’s approach to family, gender, race and marital status as well as greeting habits and would get manifested in the kind of questions, s/he would ask and consider acceptable in the personal context, or his/her acceptance of varied cultures, without prejudice, professional values cover the approach to work- life balance, the behaviour and values displayed at the workplace, organisational hierarchy, dress code, approach to meetings, commitments and

175 | P a g e
deadlines, attitude towards change, a result versus process orientation, manner of dealing with disagreements, style of engaging in negotiations and the nature of interpersonal relationships.
Interpersonal relationships being extremely valuable for a smooth workplace relationship, how they pan out in different cultures would cover the kinds of questions that can be asked to the other person and the nature of invitation that can be extended as also the manner in which it is accepted, rejected or treated. While Indians consider a guest equal to God (Atithi Devo Bhava), Westerners believe in being cordial, while yet giving the other person his/her personal space. This may result in Indians viewing Westerners as extremely indifferent, while the latter may view the former as excessively effusive, to the point of being smothering.
So too, in most countries, in the Indian subcontinent, approach to gender and marital status is extremely different, when compared to Europe and America. The latter regions do not consider it of any consequence in the professional space, while the former not merely place great value on it, but may often discriminate against an individual or probe into these issues, by asking the other extremely personal questions, to the face, without considering it offensive.
Moreover, while in most Western countries, hierarchy in an organisation is extremely flat, in the Indian subcontinent, it is highly defined and top down, raising issues of accountability, power and responsibility, within an organisation. Working with organisations in the Indian Subcontinent may thus be found to be cumbersome by some cultures, due to the delays that this structure most often results in.
A fall out of this is also the need to prove oneself and the manner of functioning in an organisation, the former of which results in people putting in long working hours, throwing work- life balance totally off gear. Westerners however are likely to consider this a sign of inefficiency, as they believe in enjoying their weekends and personal space with family, friends or spending them in nurturing their hobby. In fact, this researcher was quite taken aback by the definition of a weekend in Magdeburg, Germany, where people would disappear by mid-afternoon on Friday for a weekend and return only by mid-morning on Monday, while in India people are still struggling to gain a five day working week.
• CULTURAL SYSTEMS: Established over time, cultural systems comprise customs and beliefs that people of a community follow, making them almost rigid givens with the passage of time. Given that they are extremely close to people’s emotions, violation of cultural systems can, in fact, create a diverse number of issues. One such belief is recorded in a New York Times article on Going Global (Mohn T., 2010). It cites the case of an American businessman, who gave four antique clocks, wrapped in white paper, to a prospective client in China. What the man did not realise was that the words in Mandarin for clock and the number four are similar to the word for death and white is a funeral colour in many Asian countries. This resulted in the deal being called off.

176 | P a g e
On a more general note, while in some cultures, gifts are expected and not giving them is considered rude, in others, gifts are considered an attempt to bribe/influence, and therefore offensive. Moreover, what kind of gifts can be given, as also when they should be given, i.e. whether immediately on arriving or while departing, when they should be opened – in front of the giver or later and to whom they should be given – the lady of the house or the gentleman are all matters that can cause significant misunderstanding, to say nothing of what can/cannot be given as a gift.
A more common custom that can prove a hindrance is the manner of greeting whether by hugging, bending forward or joining the palms, the frequency of which resulting in errors is so high that it has become a common subject for cartoons and humour on cross cultural communication faux pas.
• RELIGIOUS BELIEFS AND PRACTICES: A subject extremely close to communities, religious beliefs and practices can often result in building barriers among people. While some cultures believe in covering their heads, in places of religious worship, others believe in going in barefoot or following diverse practices in prayer. Without meaning to, it would be fairly easy to offend a person of another religion merely due to ignorance about his/her religious beliefs and practices. The consequences of this can range from the hilarious to moments that may define extreme seriousness and can result, very easily, in violence. A Jewish girl, who had gone for a Sikh friend’s wedding, in a skirt, realised that she could not enter the gurudwara, where the rituals were taking place, without covering her head; finding nothing that would bail her out of the situation, she ultimately relied on pinning a handkerchief to her hair, making the situation extremely comic. On the other hand, walking into a temple with shoes on can incite an extreme reaction, from staunch believers.
• EATING HABITS: An extremely important and pressing issue in cross cultural sensitivity are the eating habits of people – both what they eat and how. It is not uncommon to see Non-Asians turning the chapatti into a roll and ladling the accompaniments separately with a spoon in the mouth at the same time. In rare cases, they use rice as an accompaniment to chapatti, not knowing what to do with it. Over and above developing taste for a cuisine that one is not familiar with, a primary issue that can result in the context of eating is what one eats. In contrast to most Western nations and some communities from the Eastern world, which largely eat non-vegetarian food, there are those who eat only vegetarian fare or communities, which eat only certain kinds of vegetables etc. (e.g. the Jains). Not being aware of this can prove to be quite an embarrassment, if one has invited another person at home or outside for a meal. Very often, in Western countries, getting basic vegetarian food in cafeterias can also prove to be a challenge, as this researcher experienced in Germany, though this trend is gradually changing, due to people turning vegetarian or vegan for health reasons or for appearing trendy. So too, food trends that emerge from one culture may be totally unknown to another, like the emergence of the vegan culture, which took a long time to become known, even in predominantly vegetarian societies.

177 | P a g e
• ENVIRONMENT: Encompassing both the weather and the working ambience, environment can prove to be an extremely crucial and a bothersome concern. The weather in England, with its constant possibility of rain can, for example, prove to be very distressing for somebody who is used to a great deal of sunshine. On the other hand, even the winter sun, in certain countries, can prove to be quite uncomfortable for those from cooler climates. A lack of knowledge about the weather conditions, in the place one is travelling to, can result in a great deal of inconvenience, given that one may not be equipped with the right kind of clothes/gear, to deal with it.
On the other hand, considering the number of hours spent in the workplace, a hostile/distressing work ambience can result in reducing the efficiency of a person. Simple things like a differentiable or gender friendly workplace, which may be taken for granted in certain countries, may be unheard of in most others and may create a great deal of inconvenience or obstacles, for professionals, like Sheena Ivengar, who regularly travel across the globe, for professional reasons.
• LIFE: Encompassing an approach to life that is inclined to a belief in fate or free will, a focus primarily on the self or others, approaches to fitness and manner of medical treatment, cultural sensitivity towards the ‘life philosophy’ of various communities is extremely consequential for ensuring effective cross cultural interaction, as it can give rise to numerous prejudices about the ‘other’. One such long standing generalisation is the belief that most Westerners are extremely self-centred, since they ascribe a lot of value to the self, in their worldview.
Furthermore, an absence of knowledge about another community’s approach to life can also result in a more basic issue like that of providing appropriate health care. While many medical cases have been recorded of delay in a patient’s recovery, due to his/her belief, in the treatment being provided, which when supplemented by a treatment that the patient was more comfortable in has shown significant results, a simpler but more pressing issue may be that of being treated by a male/female doctor or the kind of clothes one may be expected to wear, while in a hospital.
Though significant and major, these may not be the only areas that hinder/enhance cross cultural interaction/competence. However, it is important to note that the consequences of absence of cross cultural competence can range from a misunderstanding to personal/professional/organisational failure, on the one hand, to a more latent manifestation, in the form of stereotyping and prejudices, on the other. The latter, in turn, can become self-fulfilling prophecies or may take a deeper form – ethnocentrism, hetero sexism, discrimination, racism and oppression.
Given the manifold and damaging effects that the absence of cultural competence can have, Bennett (1993) describes six stages that can aid in the development in intercultural sensitivity. Based on how people or groups tend to think and feel about cultural difference, the developmental Model of Intercultural Sensitivity explains that the experience of cultural difference usually moves through six stages – denial, defence, minimisation, acceptance, adaptation and integration. While the first three are deemed ethnocentric, the latter three signify

178 | P a g e
an ethno-relative phase. The first stage involves the denial of cultural differences, the second reflects an ‘us vs them’ or defensive approach, the third a benign approach that rests on the belief that people everywhere are essentially the same, the fourth involves acknowledging the cultural differences between people and placing them within the lived context, the fifth involves an alteration of approach and attitude, in an attempt to establish a connect, and the sixth and final one manifests in the ability to move freely between cultural, depicting adaptation.
Moreover, though one may like to believe that one would move between these stages naturally, with the passage of time, and in some of the cases it may in fact be so, this is not likely to always happen; and, more importantly, the cost that one may incur, in the process, at diverse levels, in the intervening period, may be one that may prove to be extremely high.
The wise therefore would rather consciously adopt various concrete steps to enhance cultural competence and avoid the pitfalls that lack of cultural sensitivity can result in. Though not exhaustive this list can, at the very least, include:
• A commitment to treating every employee, customer and client with respect and defining what that means - using no racial terms, jokes or language
• Organising activities for fostering cultural sensitivity
• Adopting universal conventions
• Forming a culturally specific support team
• Stopping, listening and thinking – adopting a "go to the balcony" approach, when the situation gets tense
• Conducting assessments to measure cultural competence, diversity and inclusion, within the organisation
• Diversifying, developing and retaining a culturally competent workforce
• Reading, observing, asking
• Acquiring formal training
However, over and above this, in order to really work towards and acquire cultural competence, by nurturing cultural sensitivity, it is important to remember, as pointed out in a presentation made by Proceed Inc. (2012), that everything we do exists within a cultural context and thus becoming aware of our own personal cultural filters is an essential and primary step towards achieving this goal. What is bound to stand one in good stead, in this challenging and often daunting, though necessary, inevitable and extremely interesting task is the realisation that becoming culturally competent is a process, not an endpoint, for this alone will make every milestone an indicator of achievement and not a laurel to rest on or a symbol of the destination.

179 | P a g e
Like goals that constantly need to be redefined, this is a journey that needs to be undertaken for its own value, rather than with the desire to reach its end.
REFERENCE LIST
Books
Cotton, G. (2013). Say Anything to Anyone, Anywhere: 5 Keys To Successful Cross-Cultural Communication. United States: Wiley Publishers
Earley, C. P., & Ang, S. (2003). Cultural Intelligence: Interactions across Cultures. United States: Stanford Business Books.
Meyer, E. (2014). The Culture Map. United States: Public Affairs.
Mikes, G. (1966). How to be an Alien: A Handbook for Beginners and Advanced Pupils. United Kingdom: Penguin.
Molinsky, A. (2013). Global Dexterity. United States of America: Harvard Business Review Press.
Web Sources
(2003). Attitudes & Behaviour: “Cultural Awareness” [PowerPoint slides]. Retrieved from https://www.coursehero.com/file/10697716/05-B-Cultural-Awareness/
Biswas, S. (2006, Sep 25). Expats! Mind Your Culture Quotient. The Economic Times. Retrieved from http://articles.economictimes.indiatimes.com/2006-09-25/news/27448520_1_expats- ikan-relocations-cross-cultural-training
Brown Mariah, J. How Can Cultural Differences Affect Business Communication? The Houston Chronicle. Retrieved from http://smallbusiness.chron.com/can-cultural-differences-affect-business-communication-5093.html
Chebium, R. (2015, January-February). How to Create an Effective Cross-Cultural Training Program. SHRM Magazine, 60(1).
http://www.shrm.org/publications/hrmagazine/editorialcontent/2015/010215/pages/010215-cross-cultural-training.aspx
Cummings, M. Diversity & Sensitivity [PowerPoint slides]. Retrieved from www.atlantictraining.com/blog/wp.../diversitysensitivity-by-NSKN.ppt

180 | P a g e
Delphin-Rittmon, M.E., Andres-Hyman, R., Flanagan, E.H., & Davidson, L. (2013). Seven Essential Strategies for Promoting and Sustaining Systemic Cultural Competence. Psychiatric Quarterly, 84, 53-64. doi: 10.1007/s11126-012-9226-2.
Enhancing Relationships through Cultural Competence: In-Service Training [PowerPoint slides]. Retrieved from www.proceedinc.com/_.../PROCEED_EPICProgram_Facilitator_Guide_.
Fang, J. (2010). A Study on Pragmatic Failure in Cross-cultural Communication. Sino-US English Teaching, 7 (12), 42-46. http://www.davidpublishing.com/davidpublishing/upfile/4/26/2012/2012042685756409.pdf
Gray, S. (2012). A Study of Negotiation styles Between Business Managers from UK and Indian cultural Backgrounds. (Bachelor of Arts dissertation). Available from Scribd.
Hirschkorn, J. (2014, Jan 30). Business Etiquette: The Importance of Cultural Sensitivity. The Telegraph. Retrieved from http://www.telegraph.co.uk/sponsored/business/sme-home/business-tips/10607741/business-etiquette-cultural-sensitivity.html
Hanks, G. Examples of Company Failure Due to Cultural Mistakes. The Houston Chronicle. Retrieved from http://smallbusiness.chron.com/examples-company-failure-due-cultural-mistakes-70712.html
Huang, L. (2010). Cross-cultural Communication in Business Negotiations. International Journal of Economics and Finance, 2(2), 196-199. www.ccsenet.org/ijef
Lorz, A., Eslan, A. Cultural Competence and Awareness Training. [PowerPoint slides]. Retrieved from http://www.proyectoideas.jsi.com/our_work.htm
Victoria’s Volunteering Portal. (2012). Working with People from Culturally Diverse Backgrounds. Retrieved Dec 18, 2015, from https://www.volunteer.vic.gov.au/manage-your-volunteers/encouraging-diversity/working-with-people-from-culturally-diverse-backgrounds
Jhunjhunwala, S. (2012). Review of Indian Work Culture and Challenges Faced by Indians in the Era of Globalisation. Interscience Management Review, 2(2), 67-70. http://interscience.in/IMR_Vol2Iss2/IMR_paper13.pdf
Kaput Batton, M. The Importance of Cultural Sensitivity in Business Dealings. The Houston Chronicle. Retrieved from : http://smallbusiness.chron.com/importance-cultural-sensitivity-business-dealings-20503.html
Kwintessential. (2014). Cross Cultural Awareness - 'Big Brother' in Arabia. Retrieved Dec 20, 2015, from http://www.kwintessential.co.uk/cultural-services/articles/cross-cultural-awareness.html

181 | P a g e
Kwintessential. (2014). Cross Cultural Marketing Blunders. Retrieved Dec 20, 2015, from http://www.kwintessential.co.uk/cultural-services/articles/crosscultural-marketing.html
Kwintessential. (2014). Results of Poor Cross Cultural Awareness. Retrieved Dec 20, 2015, from http://www.kwintessential.co.uk/cultural-services/articles/results-of-poor-cross-cultural-awareness.html
Kwintessential. (2014).Using a Translation Service. Retrieved Dec 20, 2015, from http://www.kwintessential.co.uk/translation/articles/using-translation-service.html
Mohn, T. (2010. Mar 8). Going Global, Stateside. The New York Times. Retrieved from http://www.nytimes.com/2010/03/09/business/global/09training.html?_r=0
Molinsky, A. (2015). The Mistake Most Managers make with Cross-Cultural Training. Harvard Business Review. https://hbr.org/2015/01/the-mistake-most-managers-make-with-cross-cultural-training
PennState Extension. Cultural Sensitivity in the Workplace. Retrieved Dec 22, 2015, from http://extension.psu.edu/plants/tree-fruit/workplace-communication/cultural-sensitivity- in-the-farm-business
Seibert, P., Stridh-Igo, P., Zimmerman, C. G. (2001). A Checklist to Facilitate Cultural Awareness and Sensitivity. Journal of Medical Ethics, 28(3), 143-146. http://jme.bmj.com/content/28/3/143.full
Proceed Inc. (2012). Enhancing Relationships through Cultural Competence. Retrieved December 17, 2015, from http://www.proceedinc.com/national- training/our-services/national-resources/epic-social-marketing-campaign
The Manager’s Resource Handbook. (2014). 5 Simple Ways You Can Promote Cultural Awareness At Work Today. Retrieved Dec 22, 2015, from http://www.managersresourcehandbook.com/5-ways-to-promote-cultural-awareness-at-work/
UKPRO edits Professional Editing, Translation and Corporate Communication. (2012). Ten Examples of Cross-cultural Blunders. Retrieved Dec 21, 2015, from http://ukproedits.com/uncategorized/ten-examples-of-cross-cultural-mistakes/
Warrier, S. (2006, Oct 10). The Success Story of Global Adjustments. Rediff.com. Retrieved from http://www.rediff.com/money/2006/oct/10spec.htm

182 | P a g e
Internet Marketing – The Way Ahead
Rohit Pawar
Management eMBA Student
MET Institute of Management
“If your business is not on the internet, then your business will be out of business” -Bill Gates
As Digital Marketing industry is growing at the rate of knots, the existence of any business on the internet today cannot be overlooked. It is arguably the best interactive medium across the globe and plays a vital role in the promotion of products and services. Moreover, the extensive reach with accurate targeting and the cost benefit which is an added incentive, has taken marketing to the next level. Internet marketing has given birth to various Search Engine Strategies(SEO), Social Media Strategies (SMM), Content Marketing Strategies, Email Campaigns and adding more it also provides a 24/7 customer support. As it is rightly stated by the Infosys, “Driving revenue growth through better consumer engagement is the goal of every Digital Marketing campaign”. The motive of this paper is to study the impact of Digital Marketing trends on current businesses and whether Traditional Marketing is losing the race against Digital Marketing. Keywords: Digital Marketing Industry growth, Search engine optimization, Social Media Marketing.
“Innovation needs to be part of your culture. Consumers are transforming faster than we are, and if we don’t catch up, we’re in trouble.”
-Ian Schafer
13

183 | P a g e
Ian Schafer clearly states that the constant transformation in this fast paced world is the key to success. Likewise, traditional marketing now has a new angle attached to it, which is e-marketing or Internet Marketing also called Digital Marketing by some. Today, Internet plays a very pivotal role in the promotion of any business. The competition amongst different brands is nothing but fierce. Every business out there is trying hard from its core to expand its reach and promote its brand to draw benefits for its business. Although the ways and means to reach out so far have been through print media, newspapers, magazines, etc., the viability and reach is not as good as the Internet.
The exposure given to any business through the Internet is tremendous. On an average, 60% of a marketers' time is devoted to digital marketing activities, fuelling demand for digital marketing skills, which are gaining popularity across globe due to its distinct features. Digital marketing surpasses geographic restriction, requires less overall operating cost, which makes it economical as compared to Traditional Marketing, is time saving, uses crystal clear web analytics and provides bang on accurate targeting. These are the few aspects, which sets apart Internet Marketing and makes it surely the way forward.
Success today is directly to web analytics, which provides an analysis of customers or visitors visiting your website. 60 related % of B2B marketers use web traffic(where – on their website or on search engines) to measure their success. Moreover, it becomes easier to measure the reach and the ROI with reliable analytics. Digital Marketers can talk in precise numbers; they can give an exact count of visitors visiting their websites, for e.g. 100 visitors visited my website from 9am -10am of which 20 users were from Mumbai, 50 users were from Rajkot and the remaining 30 users were from Bangalore. This feature gives any business a clear picture of their online campaigns or their product/service launch. The increasing ubiquity of Internet access and the frequency with which people interact with it raise the possibility of using the Web to better observe, understand, and monitor several aspects of human social behaviour. Websites with large numbers of frequently returning users are ideal for this task. If these sites belong to companies or universities, their usage patterns can furnish information about the working habits of entire populations.
Talking about various indicators of successful internet marketing, let’s begin with SEO i.e. Search Engine Optimisation. It basically affects the visibility of a particular website on the search engine. A search engine is a developed-software, designed to conduct searches on the World Wide Web. The results can be in the form of images, web links etc. Any search query by any individual will be answered by the search engine in a line of results known as search engine results pages (SERPs). The list of information displayed below the search bar offers the most relevant searches offered by the search engine to its users. The one at the top of the search list is leading the race, but not winning the race, as there is a constant battle to reach the top spot. There are a number of factors, which help websites top that search list, using On page and Off page SEO techniques. On page is basically getting all the header tags - H1 tag, H2 tag in their

184 | P a g e
respective places. These tags should consist of all the relevant keywords. Off page SEO refers directory submissions and business listing. The search engine gets the information from its web crawlers known as spiders. These spiders crawl and in hunt for titles, page content, headings, as evidenced by the standard HTML mark-up of the informational content, or its metadata in HTML meta tags. As per the records, showing search engine popularity, from September 2015, for the search engines, Google tops the charts by acquiring a market share of 69.24%, followed by Bing 12.26%, Yahoo 9.19% and the rest by others.
Social Media Marketing (SMM) is a medium through which we can divert traffic to our websites. The purpose of social media is to attract attention and encourage viewers to share it across their social network, as globally out of 3.010 billion active Internet users, 2.078 billion are active on social media with 1.685 billion active on social media via mobile. As regards the Indian context, out of 243 million active Internet users, 118 million are active on the social media, with 100 million active on the social media via the mobile. Growth in the number of active mobile social accounts saw a spike of 39%, since January 2014. So too, the average daily television viewing time for Internet users is close to 2 hours, but the average daily use of social media via any device is 2 hours 31 minutes. This makes it pretty evident that the potential of Social Media is immense. Great content, good high quality images are the keys to social media success. As Eric Qualman has once stated, “We don’t have a choice whether we DO social media, the question is how well we DO it.”
Facebook, Twitter, Google+, Instagram, Youtube, Pinterest are all prime examples of social media websites. Facebook is now over 11 years old and heading towards platform puberty and is still the standout leader of the pack. There are nearly 1.4 billion Facebook users; 47% of all Internet users are on Facebook; 4.5 billion likes are generated daily on Facebook and direct uploads of user videos to Facebook now exceed YouTube. On the other hand, nearly 75% of Facebook’s revenue comes from mobile advertising.
So too, Maximillion, surveyed event organisers, to understand how they use social media for their jobs and 75% said it was "very important" to use social for event promotion. Facebook was the most popular channel for doing so, at 78%, followed by Twitter (56%) and LinkedIn (49%).
A careful study of social media trends also reveals that marketing professionals are 50% more likely than consumers to like a brand on Facebook, 400% more likely to follow brands on Twitter, 100% more likely to make a purchase, as a result of seeing something on Facebook and 150% more likely to make a purchase as a result of a tweet, thus reflecting how B2B marketing professionals have crossed individuals, in responding to digital marketing. The top three social networks used by B2B marketers are LinkedIn (91%); Twitter (85%); and Facebook (81%). However, just 62% of marketers say that LinkedIn is effective, while 50% say the same for Twitter and only 30% of B2B marketers view Facebook as effective.

185 | P a g e
Twitter is also known to be a great platform for brand awareness, it has 284 million active users with 500 million tweets per day. Google+ took off a bit late in the social media race, though it currently has 363 million users and the +1 button, which is Google+’s way of denoting alike, is hit 5 billion times per day. On the other hand, Instagram, which is a picture or image sharing social networking website, is owned by Facebook. They saw that the social media and the mobile embodied a powerful intersection of synergies and they were right! Instagram has 300 million users, with 70 million photos and videos being sent daily. So too, 53% of internet users aged 18-29 use Instagram, which shows that the potential of reaching out the youth across globe is immense and the ways of reaching out to them are also many.
Another strategy in Digital Marketing, Email Marketing is basically transferring a commercial message to a group of people via emails. This group of people, in a broader sense, constitutes potential customers. Every time an email is sent to a potential customer, it is referred to as email marketing. The purpose, while conducting an email campaign, is well defined - it may be usually done to send ads regarding your business, build loyalty or engage in customer retention tactics. The campaigns are conducted for the predefined list of customers or a sold database of customers, which is usually procured from data selling agencies. Email marketing yields an average 4,300% return on investment for businesses in the United States. The motive or purpose is of enhancing the relationship of a merchant with his/her current or previous customers, to encourage customer loyalty and repeat business, acquiring new customers or convincing current customers to purchase something immediately and adding advertisements to email messages sent by other companies to their customers. Email marketing is a powerful vehicle for delivering messages directly to your target audience. Small business owners estimate that getting an extra hour in their day back from doing their own email marketing (and other activities) is worth$273/hour.
With the advent of digital India, the emphasis on mobile marketing is tremendous. It basically has gained popularity, due to the rise in the use of smart phones. As per records shared by the annual mobile report of Ericsson, there are 2.6 billion current smart phone subscriptions made globally and the number will shoot upto 6.1 billion by the end of 2020. Moreover, mobile marketing directly reaches out the customers - it provides customers with location sensitivity as well as information regarding goods and services.
When we talk about mobile marketing, the very first that thing strikes us is SMS marketing. Short Messaging Service was at its peak during the 2000s. SMS is a text messaging service, which uses certain communication protocol and allows fixed lines to exchange messages. 3rd December 2015 marks 23 years, since the very first text message was sent. In 1992, an engineer sent the text message "Merry Christmas" to a mobile device on Vodafone's UK network. Currently, 90% of people worldwide exchange text at least once per day, Over 350 billion text messages are thus sent each month globally.

186 | P a g e
All in all to sum up the entire story, out of the total 1.252 billion Indian population, currently only a small chunk of 243 million uses the internet. The expected growth in that number is about 500 Million by the end of 2018. The penetration of smart phone users is 200 Million. Users active on Social Media, through their smart phone, are 92+ Million. Digital media has changed the outlook of many marketers and businessmen. The transition phase has already taken place and the following statistics only reflect that the figures are only going to get better. The online advertising market in India has touched Rs. 2,938 crores. Indians are very active on different social networks and 88% of users share content on their social profiles and are also increasingly spending time on various social networking sites. Facebook is the most browsed social network on the social media, with a large base of 100 Million users and it is clearly not fading away anytime soon in India. More than 80% of these users access Facebook via their mobile phone. The total number of Twitter users in India is 33 Million and, of this base, 76% of users access it via their mobile phone. LinkedIn has 26 Million India users, of the total 300+ Million users. Of the total chunk of 70 Million total users in Pinterest, 5.5 Million belong to India. As regards, Instagram the usage is more dominated by men in comparison to women; the ratio being 75:25. It shows that only 1/4th of the women population in India is on Instagram, making it appear that selfies are more appreciated by men than women!
In a world defined by global competition to stay ahead or even survive, it is important to learn to play by the rules of the international space. It is time that we use our capabilities to move from a developing nation towards being a developed one; more so, even in our capacity to draw international business to our nation we are currently facing stiff competition from China. Furthermore, our Prime Minister, Narendra Modi has voiced the dream of Make in India and also undertaken a digital India campaign, which is attempting to deal with the commanding change in the requirements of the today’s business. In this light it is time that digitization in various spheres is taken up more consistently and seriously, ensuring that these activities should not only complement the traditional approach but should be adopted as a mainstream activity. For only then can India march ahead in the international space.

187 | P a g e
References
Web Sources
• Ajmera, H. (2014, Aug. 17) Statistics over Social Media and Digital Media on India retrieved from http://blog.digitalinsights.in/important-statistics-digital-and-social-media-users- in-india/05224987.html
• Lunden, I. (2015, June. 2) Statistics on global smart phone users retrieved from http://techcrunch.com/2015/06/02/6-1b-smartphone-users-globally-by-2020-overtaking-basic- fixed-phone-subscriptions/#.ib8yf6v:RPIH
• Pfannkuch, K. (2015, Jan. 4) Statistics on top Digital Marketing strategies retrieved from http://www.business2community.com/digital-marketing/10-statistics-top-digital-marketing-strategies-2015-01112002#sBQ5F7FphGrYuElv.97
• Bullas, J. Social Media statistics for the year 2015 retrieved from http://www.jeffbullas.com/2015/04/08/33-social-media-facts-and-statistics-you-should-know-in-2015/
• Naidu, P. (2015, Mar 2) Indian Social, Digital and Mobile market in 2015 retrievedfrom http://lighthouseinsights.in/indian-social-digital-and-mobile-market-in-2015.html/
• Balinas, T. (2015, Feb 3) Email marketing statistics retrieved from http://www.outboundengine.com/blog/20-shocking-email-marketing-stats-business-owners-know/

188 | P a g e
Employee engagement practices at Yes Bank Dr. Sangeeta Jain, Prof. Priyadarshini Nidhan
Author Details:
1. Dr. Sangeeta jain Professor, Institute of management studies, Indore
2. Ms. Priyadarshini Nidhan Asst. Professor, Lalalajpatrai institute of management studies, Mumbai
Employee engagement shows dedication and commitment of an employee toward his work and organization. An organization need to engage employee to achieve high performance levels and superior business results. In recent years lot of study has done on employee engagement in which researchers find out various factors which affects employee engagement in the organization like career development opportunities, leadership, performance appraisal, empowerment, compensation, family friendliness, health and safety, job satisfaction, communication and culture in the organization. Banking sector choose for this study because since the establishment of the first bank in India in 17th century it seen lot of evolution both in organization as well in customers and in recent years post liberalization we have public sector banks, private sector banks, MNCs and corporation banks. To sustain in this economic, social, organizational and legal changes it is imperative to have engaged employee. Engaged employee will stay with the banks be an advocate for its services and contribute to bottom line business success. This research paper based on secondary data which describe employee engagement practices at Yes Bank.
Keywords: Logistics, Employee engagement, human resources
This research paper based on secondary data which describe employee engagement practices at Yes Bank.
14

189 | P a g e
Introduction
Employee engagement is the willingness of employee to “go the extra mile” to achieve the organizational vision. According to IES (institute of employment studies) “employee engagement is a positive attitude held by the employee towards the organization and its values”. Thus employee engagement determines the association of person with the organization. Engagement – the extent to which people value, enjoy and believe in what they do. To compete today, companies need to win over the minds and hearts of the employee in a way that leads to extra ordinary effort.
Impacts of employee engagement
• Employee engagement has a direct impact on employee productivity. Engaged employee perform better and beneficial for the organization.
• Employee engaged has direct impact on how long an employee work with the organization. Engaged employees will stay with the company, be an advocate of the company and its products and services and contribute to business success.
• Employee engagement has impact on motivational level of employee. Engaged employee ready to take more responsibility, energetic and inspiring.

190 | P a g e
Evolution of banking sector in India
The first bank of India, called the general bank of India was established in the year 1786. The east India Company established the bank of Bengal/Calcutta (1809), bank of Bombay (1840) and bank of madras (1843). The next bank was bank of Hindustan which was established in 1870. These three individual units (bank of Calcutta, bank of Bombay and bank of madras) were called as presidency banks. In 1955, the imperial bank of India was nationalized and was given the name “state bank of India”, to act as the principal agent of RBI and to handle banking transactions all over the country. It was established under state bank of India act, 1955. Seven banks forming subsidiary of state bank of India was nationalized in 1960.On 19th July, 1969, major process of nationalization was carried out. At the same time 14 major Indian commercial banks of the country were nationalized. In 1980, another six banks were nationalized, and thus raising the number of nationalized banks to 20. Seven more banks were nationalized with deposits over 200 crores. Till the year 1080 approximately 80% of the banking segment in India was under government ownership. On the suggestions of narsimhan committee, the banking regulation act was amended in 1993 and thus the gates for the new private sector banks were opened.
From Bank of Hindustan in 1770, the evolution of banking in India can be divided into three different periods as follows:
Phase I- Early phase from 1786 to 1969 of Indian banks
Phase II-Nationalization of banks in and up to 1991 prior to Indian banking sector reforms.
Phase III- New phase of Indian banking system with the advent of Indian financial and banking sector reforms after 1991.
Currently, India has 96 scheduled commercial banks, 27 public sector banks, 31 private banks and 38 foreign banks.
Employee engagement at Yes bank
Yes bank today is India’s fastest growing bank, and has been built on the foundation of professional entrepreneurship. Since inception in 2004, Yes bank has created a paradigm in Indian banking through innovation and excellence. Yes bank promoted their employees by creating entrepreneurial culture which stimulated creativity and enabling bank to deliver superior, customer centric financial products and best services to valuable clients and continuously working to achieve excellence in industry. Since inception of the bank they working on creative management frameworks, innovation and latest technology to ensure development and emerge as the “Professionals Bank of India”. Yes bank “creating and sharing values”, with a vision to build an organization driven by professional entrepreneurship, where all Yes bank employees truly partner to direct, manage and accelerate the development of Yes Bank as the “Professionals bank of India” and the bank for “Future businesses of India”.

191 | P a g e
Human capital of high quality is the power of Yes bank which they recognizes that the only real source of sustainable competitive advantage for an organization. In this kind of entrepreneurial environment they foster a leadership mindset that rewards people as per their performance and exceptional competency. Employee engagement practices enhance its human capital and building a high performance culture to attain a leadership position in India, achieve its vision of becoming the Best quality bank of the world in India. This engagement practices at yes bank, developing the yes bank as an “Employer of choice” which leads to attracting and retaining the best talent from India and abroad.
Some of the key features of Yes Bank employee engagement practices:
1. Yes Bank 5 Cs Employee engagement model
Career: People in the organization should be provided challenging and meaningful work with opportunities for career advancement. Most people want to get out of routine and monotonous work. Good leaders have to challenge employee; but challenge can be feasible and make all resources available for them, so it can leads to motivation. Yes bank helps in career development of employees and practices career and succession planning for them.
Connect: Employees should feel that their work being valued and should feela sense of connectivity with their superiors. Having a gap can lead to employee isolation and a sense of non-belongingness to the organization. At Yes bank employee feel connected to management as well community.
Culture: Culture includes the organization values, visions, norms, working language, systems, symbols, beliefs and habits. Culture helps in understanding variables like job satisfaction, organizational commitment self-efficacy and employee work related attitude. Yes bank core values inculcate in bankers which creates strong intentional culture

192 | P a g e
Communication: Communication refers to understand and explain an idea from one mind to another. It is also serves as a tool for emotional expression. Yes bank promotes open and honest communication among employees.
Care: Employees are living force which gives life to the organization otherwise organization is just infrastructure, polices and product. To keep this vital force alive organization need to work for employee welfare. Yes bank care their employees by practicing best HR practices in the industry.
2. Grooming, wellness and Attitude Yes bank provides highly conductive business environment, best in architect and systems in all its branches and offices. Focus of bank is on employee well-being and prosperity. This motivates and encourages employees to live healthy, dress smartly and demonstrate best professional and personal conduct. To enhance personal and professional effectiveness of employees bank work on their personality, wellness and health which are important factors to impact on employee life, business communities and society.
3. Yes-Mentor The bank institutionalized the Yes-Mentor program in 2006 which is focusing on engaging employees, ensure their finest well-being through a team of senior management team members identified as Yes Mentors who integrate entrepreneurial culture and build high professional bankers.
Yes-Mentors guides and support employees for: • Superior interpersonal engagement among them. • Enhance formal and informal communication including grievance management. • Creating an environment which promotes high office discipline culture, high level
of morale and motivation. • Help to understand and adapt culture at Yes Bank
4. LEAP-Learning Enhancement Action Program
As a part of executive development Yes Bank launched a professional development initiative L.E.A.P- learning enhancement action program. Virtual job rotation scheme is the concept behind LEAP which helps the participating executive to gain knowledge and get exposure in other areas while continuing in his/her current assignment, since a full job rotation may not be feasible in all cases. Objectives:
• To enhance team spirit and bonding and build mutual professional respect for each other.
• To encourage innovation and execution of creative ideas and solutions. • To get exposure and gain knowledge of other areas as well understand their
problems.

193 | P a g e
5. Yes Connect This team bonding program was launched in July 2009 with a view to provide employees a platform to celebrate together, bonding with colleagues and share best practices to enhance individual and group productivity and team building. Yes connect celebrates the spirit of togetherness in the following manner:
• On first Friday of every month, an evening get-together organizes in every branch in which all team members participated.
• Inviting the newly joined executives with their spouse/family to meet the team members.
• Recognize and applauding employees. • Celebrating birthdays of team members.
Conclusion
In recent years, many studies reveals about importance of employee engagement and its link to company performance, turnover, productivity and employee motivation. Studies highlight the role of employee engagement in today’s business environment. At Yes bank they generously caring for their employees and it reflects in their strong employee engagement practices like 5 Cs employee engagement model, mentoring, Yes connect, LEAP and grooming, wellness and attitude program, which makes Yes bank a “Great place to work” with highest levels of “Happiness and Trust”.
References
1. Mishra BN, Tripathy S K, “Employee Engagement and HR Initiatives”, Himalaya publishing house, first edition 2011.
2. Sarangipratima, Patnaik SK, “A success story on employee engagement: A case study at tata AIG general insurance company”, 2011, Himalaya publishing house, ISBN: 978-93-5024-944-4.
3. Sarangi S, Srivastav RK, “Driving employee engagement in nationalized banks in India”, international conference on economics, business innovation, IPEDR, volume 38,2012
4. Sarangi S, ”Impact of organizational culture and communication on employee engagement”, thesis submitted to SNDT Womens University, 2011.
5. Podder CK, “Understanding employee engagement- concepts and practices”, 2011, Himalaya publishing house, ISBN: 978-93-5024-944-4.

194 | P a g e
Emerging Management Practices- Talent Management
Prof. Shagun Barabde, Prof. Vijayan Pankajakshan
Principal Author:
Name: Assistant Professor Shagun Barabde.
Institution Name and Address: Principal L N Welingkar Institute of Management Development and Research,Mumbai Campus, L Napoo Road, Matunga East, Mumbai - 400019
Position/Department: HR Academics
Co-Author:
Name: Professor.Vijayan Pankajakshan
Institution Name and Address:Principal L N Welingkar Institute of Management Development and Research,Mumbai Campus, L Napoo Road, Matunga East, Mumbai – 400019
Position/Department: Dean- HR Academics, Research & Industry Interface
Abstract:
Talent Management today has assumed critical importance and hence the attention of senior leaders in various organisations. The process of Talent Management has evolved, from being ‘HR department owned’ to one of being a strategic organisational resource. This reality has placed enormous challenges and responsibility. Talent development in an organisation is facilitated and accelerated, when each employee – in a holistic manner – aligns and ‘signs up’ for the challenges posed by the organisation’s mission, vision and values. Distinct improvement in performance levels of organisations have been observed, when the latter have selected and placed talented employees. Talent Management, for many years, focused on retention of valuable employees. However, now it has greater attention on other HR processes too. This paper addresses the processes of Talent Management that are representing the emerging landscape, being painted by progressive companies in India.
Keywords: Talent Management, Processes, strategies.
15

195 | P a g e
Review of Literature The literature reviews various research studies on talent management that explore topics such as talent management processes so as to understand the employee, talent management strategies to retain the employees and how talented employee when placed accordingly in alignment with their skills results in better performance in the organisation and helps in gaining success for the organisation. This research paper covers topics which aid in better understanding of Talent Management and provides source of information on the same. Following are the topics induced comprehensively in relation to talent management.
1. Definition and Introduction
2. Talent Management Process
3. Talent – DEVELOPABLE OR INHERENT?
4. Talent Management and Organization Success
5. Conclusion
1. Definition and Introduction According to the definition, Talent management refers to the anticipation of required human capital for an organization and the planning to meet those needs. This field increased in popularity after McKinsey’s 1997 research and the 2001 book on ‘The War for Talent’. (https://books.google.co.in/books?id=JL8lAgAAQBAJ&pg=PT54&lpg=PT54&dq#v=onepage&q&f=false)
Talent Management is identified to be one of the most important factors and a key component of sustainable competitive advantage as well as efficiency in any organization (Shaemi et al., 2011).
Having talented individuals on the payroll is one thing; leveraging their capabilities to secure Competitive advantage is another (Lawler, 2009). Talent management emerges as being different from traditional HRM, incorporating new knowledge, rather than being a simple repackaging of old techniques and ideas with new labels (Chuai, Preece, & Iles)

196 | P a g e
According to Branham, 75 per cent of the senior executives admit that employee retention is a major concern today, the obvious reason being the ‘increasing rate of turnover’.
Talent Management is a valuable function for the organisation as well as for the employees It emphasises on observing& identifying the employee’s generic skills, personality, traits and accordingly align the job/role/Project etc. To ensure there isn’t any kind of dissatisfaction, ideally, every employee should be included in the above process, so that their distinct skills are matched with their job/ role. It is the role of the HR department to anchor the process of Talent Management, to help the organisation avoid unnecessary &additional costs of hiring, re-training, productivity loss etc. The approach of talent management is not to be limited to recruiting the right person for the right job. Talent Management should also help enhance/discover the visible/invisible and other exceptional traits of employees. This should then lead to facilitating the nurturing of these qualities, towards the achievement of organisation and personal/professional goals. Along with retaining of employees, organisations now are also focusing on varied HR processes, i.e. Attracting, assessing, selecting, developing, engaging, rewarding, career planning. (http://www.careeronestop.org/businesscenter/trainandretain/manageandretainemployees/retention-strategies.aspx#sthash.g6i4UuPr.dpuf n.d.)
Due to the above premise, the task of any organisation is not to only ‘acquire the best talent,’ but also retain the employee and hence strengthen the organisation’s performance &Culture ( including values, rituals and traditions).Due to the brutal competitive business environment, companies have to ‘captivate’ and attract/absorb talent. It is hence necessary to consider Talent Management as an organisation progress that influences the organisation design, structure and policy. According to survey conducted by Michael Page Global HR Barometer, The top priorities in India are talent management (51 per cent in India versus 33 per cent globally) and talent acquisition/recruitment (45 per cent in India versus 32 per cent globally), but globally, talent management and training & development top the list. Globally, 80 per cent of HR leaders have identified Talent Management as a significant part of their overall role and responsibilities. http://articles.economictimes.indiatimes.com/2015-09-22/news/66792426_1_talent-management-cent-hr-leader
According to a recent Monster.com study, nearly 80% of CEOs mentioned that HR issues are core to a company's success. Around 73% of CEOs spend a fourth of their time in talent development, with a similar percentage focus on retention of their best performers. Nearly 61% have employee satisfaction as an integral part of their goals.

197 | P a g e
Mr Amar Babu, MD of Lenovo India says his “focus is on talent: coaching, team-building and making the right pitch for the right people. “Talent management today tops my agenda and role”. He further stated that people and team go together in making the organisation successful. “Especially at the middle and senior management levels, it is becoming increasingly difficult to acquire good talent who match the company's culture, possess execution skills and understands the business.”
(http://articles.economictimes.indiatimes.com/2011-06-28/news/29712818_1_talent-management-real-estate-sector-tops n.d.)
3. Talent management process: http://www.managementstudyguide.com/talent-management-new-generation.htm. (n.d.).

198 | P a g e
1. Preliminary organisation strategy i.e. understanding and analysing the demand of talents required in the company. This is the most decisive step, as this step lead to the progress of the integral process.
2. Recruitment comprises of widening the aspect in the industry and focuses upon choosing the finest talent as per the requirements in the task. Through innovative methods, the process of recruitment is conducted.
3.Performance Management includes aligning the accurate performance of an employee so as to analyse his or her adequacy and capability.it is to review if the employee can be equipped with additional assignment or not 4. Training and Development is the vital process focusing on raising the talent and skills of employees and leveraging it with the progress of organisation and development builds in developing the individual as well as company goals and objective.
5. Succession Planning indicates an extensive plan of who would be considered to take the charge of responsibility in the coming years. The organisation needs to prepare structure as to when and how the succession plan would take place and depending upon the dedication and capability of the employee, results in advantage of being at the prominent post.
6.Compensation and Benefits exhibits not only the salary of the employee but also the indirect benefits which he/she is entitled for.in relation for retaining their talent, attractive compensation benefit packages are offered so as to motivate and captivate them.
7. Career Planning is the key element currently for the organisations to look into, as each employee in the organisation has certain personal goals to be achieved, in order to fulfil that organisations needs to assist them and prepare plan of action so as to develop where they are currently lacking.HR in organisations shows the path to accomplish their needs.
8. Critical Skills gap analysis verifies what level of skill-set is currently available and what is expected out of the employee. It prepares standard measure, which the employee talent needs to recognize and fulfil it. Management works more closely with the employee’s skills so as to achieve the desired goals.

199 | P a g e
4. Talent– DEVELOPABLE OR INHERENT?
It is often believed that each person has certain talents, which are innate/born with, but may not obtain the proper arena/opportunity/moment to exhibit the same. Hence, we start with the premise that every individual (hence every employee) has to be considered as being talented, to begin with. Every employee has a /some well-developed competency that enables him/her to perform extraordinary at some work, while being ‘average’ at other kinds of work. No employee can be expected to perform equally well on all kinds of work. Hence, the critical role of the HR department/ TM function in an organisation, is to have robust processes, systems and platforms that assess and align as many employees’ capabilities and competencies (that they are very good at) with the type of work/nature of goals to be achieved. This approach will result in the organisation enlarging the pool of talented people within the organisation.
Gallup defines’ talent as the natural capacity for excellence’. People can learn skills develop knowledge and gain experience, but they can't acquire talent -- it's innate. When individuals have the right talent for their role, they're energized by their work, rarely thinking of it as "work" at all. For others, whose talent is not the best fit, the same work can feel draining. Talent is the stabilizer. It paves the way for the individual and organisation to be consistently performing well. Hence organisations need to focus on the job profile and its key requirements, and then do the scan of the internal talent, within the organisation. If there is no such talent available, then the organisation may choose to go the external hiring route. While assessing internal talent for a particular job role, the organisation should look for the best fit of the target talent with the key requirements of the role (rather than searching for the impractical 100 % fit on all requirements). Best fit to the extent of 70% is a ball park metric to go for.
It is hence, essential that an organisation be open to hiring/spotting talented employees, who are diverse in their backgrounds. Diversity is a big enabler to Talent Management. It may be the case that some employees are completely ready for the role, while some other may not. That should not lead to dropping them from the talent scan. The organisation should instead examine what is the learning agility of the employee and how much ‘development gap’ needs to be bridged in the ‘time that is available at the bare minimum.’

200 | P a g e
Coaching, guiding, teaching is the most value added, profitable and endurable method of nurturing and building talent in an organisation. It is always beneficial if talented employees are given opportunities to learn/observe/work alongside high performing co-workers, so that they get to know what it takes to be productive early and raise one’s level of competence in job performance. There are times when employees feel they are misfits in the allotted job role, when compared to their area of interest, and hence are not able to work effectively and deliver desired results. In such contexts, the organisation needs to play a proactive role in understanding the employee’s situation, engage with them and understand deeply the latter’s concerns. As part of this conviction building process, the organisation could facilitate such an employee to interact with other employees, who had faced similar contexts in the past and had been able to come out of the logjam.
One of the most important decisions, organisation make is with reference to whom they chose as the Manager. Despite this intention, Gallup studies have found they usually get it wrong: Companies fail to choose the candidate with the right talent for the job, 82% of the time. The scope for improvement is huge!!! Great managers are scarce, because the talent required to be one is not populated in large numbers. Gallup's research shows that about one in 10 employees possess high talent to manage others. Though many employees possess some of the necessary traits, few have these traits combined with unique talent needed to help a team achieve excellence levels, expected by the organisation and its stakeholders. When the above quoted, 10% of those who are put in Manager roles, they naturally engage team members and customers, retain top performers and sustain a culture of high productivity. To establish a framework for spotting, assessing and assigning employee talent to the work that they would best fit, is a challenging competency to built into the organisational/HR leadership.
http://www.gallup.com/businessjournal/182378/one-people-possess-talent-manage.aspx. (n.d.).
Further down the context it illustrates that when the organisation makes best use of their talented employees its enduring leads to positive success for their organisation and in addition it also assists in the development of the employee. A renowned Author Anne M. Mulcahy has well written, “Employees who believe that management is concerned about them as a whole person – not just an employee – are more productive, more satisfied, more fulfilled. Satisfied employees mean satisfied customers, which leads to profitability.”

201 | P a g e
5. Talent Management and Organisation Success
Performance management is an integral component of talent management. This ensures that Talent Management works towards ensuring organizational goals are met productively and conveniently, in simultaneity with the employees being able to manifest their talent through individual and collective performance.
Talented employees hasten the growth of organisation. It is said that it’s your employee who ‘make’ the company can as well as ‘break’ the company. It is hence, essential that the organisation staffs (internal or external talent) the right job, with the right employee, at the right time. If these parameters match, organisation success is a natural outcome. Talent Management largely would spend disproportion of their time and effort on those employees who are in key/strategic roles and /or have the potential to grow quickly. This razor sharp focus of nurturing and developing them , helps the organisation to access talent in the organisation as and when required. Talent Management also leads to higher levels of affirmation at the individual, group and organisation level.
In the highly competitive world, talented employees easily get noticed by competitors, Hence the degree of difficulty of retaining top talent, is even more challenging. The company needs to hence focus considerably on retaining their special talent, so that the aspirations of the organisation are met. Different organisations are using different and impactful strategies to retain their top employees, which include Career Development discussions. Regular feedback on how both the employee is perceiving the organisation and how the latter ‘ holds’ the talent is an essential requirement. Flexible work schedules, competitive and attractive rewards and benefits (customised to the individual needs) are also common elements in the Talent management strategy. Two risks in TM that need to be avoided: the cost of mismatch of employees and skills, and the cost of losing the talent, after having invested in him/her. (Cappelli, 2009)
The benefits of TM, in the context of PMS (performance management systems) include both financial and non-financial. Financial outcomes include growth in sales, reduction in costs, organizational alignment with the vision and mission, decrease in lead times etc. In addition, employee engagement levels are known to move up in an organisation, that focuses on Talent Management and Development. The efficiency of reward packages (mix of fixed and variable) also is seen to improve. Organisations are also doing more due diligence in choosing those professional development programs that would lead to faster and better learning of the focused employees. The organisation is also to enhance the perceived value of their Human capital. Gallup research shows that, when people use their talents they can learn a role faster and adapt to variability in the role more quickly. These individuals not only produce more, but also generate a higher quality. Gallup has also found powerful links between top talent and crucial business outcomes, including higher productivity, sales, and profitability, lower turnover and fewer unscheduled absences. (http://www.gallup.com/businessjournal/182378/one-people-possess-talent-manage.aspx)

202 | P a g e
While most HR functions measure their success with functional metrics like number of hires, number of development programs offered, and customer satisfaction, talent management should instead measure its success by assessing its contribution on overall business impact. Business impact is measured by the overall increase in the productivity of the workforce (employees) . In other words, you don’t improve develop, recruit, or retain just to improve them. Instead, you do all the above to improve these people processes in order to increase the output of your workforce. The ultimate metric of effective talent management is the change in the return on investment, made in employee development &management, measured by the ratio between spend (total employee costs) and the monetary value of the employees output (value, volume, revenue)
It is hence essential to use a business case for investment in Talent Management. Augmenting, preserving and conserving current talent is the need of the hour.
5. Conclusion This research on Talent Management indicates how organisation needs to develop a talent mind-set and why it is important to introspect for the organisation. Although the publication of McKinsey’s “The War for Talent” ignited interest in the importance of identifying and nurturing talent, our research suggests that despite their assertion “the calibre of a company’s talent increasingly determines success in the marketplace. Talent Management has essentially become important as it help the organisation to grow and develop and achieve its overall goals and objectives and that it possible only if they have talent employee whose skills –set are matched as per the requirements in the organisation, mismatch will surely lead to disintegration in the organisation.

203 | P a g e
References
(http://www.eremedia.com/ere/talent-management-defined-is-it-a-buzzword-or-a-major-breakthrough/#). (n.d.).
http://articles.economictimes.indiatimes.com/2011-06-28/news/29712818_1_talent-management-real-estate-sector-tops. (n.d.).
http://articles.economictimes.indiatimes.com/2015-09-22/news/66792426_1_talent-management-cent-hr-leaders. (n.d.).
http://www.careeronestop.org/businesscenter/trainandretain/manageandretainemployees/retention-strategies.aspx#sthash.g6i4UuPr.dpuf. (n.d.).
http://www.eremedia.com/ere/talent-management-defined-is-it-a-buzzword-or-a-major-breakthrough/#. (n.d.).
http://www.gallup.com/businessjournal/182378/one-people-possess-talent-manage.aspx. (n.d.).
http://www.managementstudyguide.com/talent-management-new-generation.htm. (n.d.).
https://books.google.co.in/books?id=JL8lAgAAQBAJ&pg=PT54&lpg=PT54&dq#v=onepage&q&f=false. (n.d.).
McKinsey's 1997 research and the 2001 book on ‘ The War for Talent’. (n.d.).