IAI ACADEMIC CONFERENCE PROCEEDINGS - International ...
74
INTERNATIONAL ACADEMIC INSTITUTE IAI ACADEMIC CONFERENCE PROCEEDINGS International Virtual Academic Conference Education and Social Sciences Business and Economics 15 November & 14 December 2021
-
Upload
khangminh22 -
Category
Documents
-
view
4 -
download
0
Transcript of IAI ACADEMIC CONFERENCE PROCEEDINGS - International ...

INTERNATIONAL ACADEMIC INSTITUTE
IAI ACADEMIC CONFERENCE PROCEEDINGS
International Virtual Academic Conference
Education and Social Sciences Business and Economics
15 November & 14 December 2021

IAI Academic Conference Proceedings Virtual Conference, November & December, 2021 ________________________________________________________________________________________________________
2
IAI Academic Conference Proceedings Editor: Hristina Rucheva Tasev, Dr. Sci, Ss. Cyril and Methodius University, Skopje, Republic of N. Macedonia Editorial Board: Milena Apostolovska-Stepanoska, Dr. Sci, Ss. Cyril and Methodius University, Skopje, Republic of N. Macedonia Vasko Naumovski, Dr. Sci, Ss. Cyril and Methodius University, Skopje, Republic of N. Macedonia Meic Pearse, Dr. Sci, Houghton College NY, USA Elif Uckan Dagdemir, Dr. Sci, Anadoly University, Turkey Mary Mares-Awe, MA, Fulbright Association, Chicago, USA Prof. Massimo Introzzi, Bococca University – Milan, Italy Dr. Zahida Chebchoub, UAE University, Al-Ain Dr. Benal Dikmen, Associate Professor, T.C. İstanbul Yeni Yüz Yıl University Ass. Prof. Arthur Pantelides, American University, Bulgaria Marija Boban, Dr. Sci, Faculty of Law, University of Split, Croatia Gergana Radoykova, Dr. Sci Sofia University St. Kliment Ohridski, Bulgaria Anthon Mark Jay Alguno Rivas, MA, Taguig City University, Philippines Snezana Knezevic, Dr. Sci Faculty of Organizational Sciences, Belgrade,Serbia Eva Pocher, Ph.D., University of Glasgow Ass. Prof. Mariam A. Abu Alim, Yarmouk University, Jordan Ass. Prof Aleksandra Mitrović, University in Kragujevac, Serbia Dr. Dorjana Klosi, University of “Ismail Qemali”, Vlore, Albania Secretary and editing: Filip Stojkovski International Academic Institute Ul. Todor Aleksandrov br.85-4 Skopje, Republic of N. Macedonia ISSN 2671-3179
IAI Academic Conference Proceedings Virtual Conference, November & December, 2021 ________________________________________________________________________________________________________
3
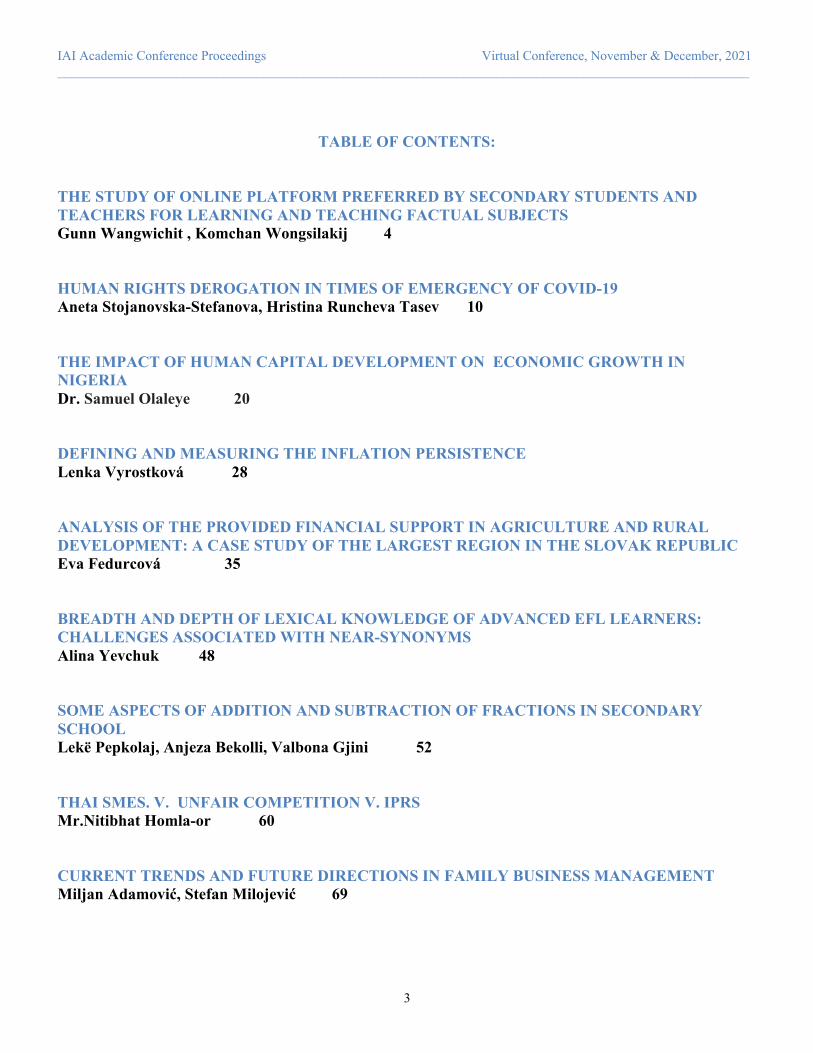
TABLE OF CONTENTS:
THE STUDY OF ONLINE PLATFORM PREFERRED BY SECONDARY STUDENTS AND TEACHERS FOR LEARNING AND TEACHING FACTUAL SUBJECTS Gunn Wangwichit , Komchan Wongsilakij 4
HUMAN RIGHTS DEROGATION IN TIMES OF EMERGENCY OF COVID-19 Aneta Stojanovska-Stefanova, Hristina Runcheva Tasev 10 THE IMPACT OF HUMAN CAPITAL DEVELOPMENT ON ECONOMIC GROWTH IN NIGERIA Dr. Samuel Olaleye 20 DEFINING AND MEASURING THE INFLATION PERSISTENCE Lenka Vyrostková 28
ANALYSIS OF THE PROVIDED FINANCIAL SUPPORT IN AGRICULTURE AND RURAL DEVELOPMENT: A CASE STUDY OF THE LARGEST REGION IN THE SLOVAK REPUBLIC Eva Fedurcová 35
BREADTH AND DEPTH OF LEXICAL KNOWLEDGE OF ADVANCED EFL LEARNERS: CHALLENGES ASSOCIATED WITH NEAR-SYNONYMS Alina Yevchuk 48
SOME ASPECTS OF ADDITION AND SUBTRACTION OF FRACTIONS IN SECONDARY SCHOOL Lekë Pepkolaj, Anjeza Bekolli, Valbona Gjini 52
THAI SMES. V. UNFAIR COMPETITION V. IPRS Mr.Nitibhat Homla-or 60
CURRENT TRENDS AND FUTURE DIRECTIONS IN FAMILY BUSINESS MANAGEMENT Miljan Adamović, Stefan Milojević 69
IAI Academic Conference Proceedings Virtual Conference, November & December, 2021 ________________________________________________________________________________________________________
4
The Study of Online Platform Preferred by Secondary Students and Teachers for Learning and Teaching Factual Subjects
Gunn Wangwichit 1, Komchan Wongsilakij2
1High School Student in Sarasas Ektra School, Bangkok, Thailand
2 Department of Secondary Education, Faculty of Education, Bangkok, Thailand
*Corresponding Author: e-mail: [email protected]
Abstract In the second quarter of 2021, Thailand has encountered the third wave of the SARS-CoV2 virus outbreak, which caused all school lessons to be virtual. Although numerous online platforms are utilized in delivering the lessons online, teaching and learning effectively face challenges and obstacles. The objectives of this research are to determine the best online platform for both students and teachers and compare the result of the preferred platform in teaching and learning factual subjects such as Math and Science. The data were gathered by using three online surveys, one of them was for teachers which consisted of 15 questions about educational platforms, while the other two were for middle and high school students, which each had 5 questions related to the platforms. STATA version 13.1 was used to analyze the results, including mean, standard deviation, and one-way ANOVA. It was found that the online platform that both teachers and students believe can maximize their productivity during online classes was Quizizz, and the main reason was that it is easy and convenient to use, and although a majority of responses stated that there is no limitation, it can be suggested that in order to make the online platform more productive, the platform should fix technical problems for users. Keywords: SARS-CoV2 Virus, Online Platform, Teachers, Students, Productivity, Online Classes
1. Introduction In the second quarter of 2021, Thailand had encountered the outbreak of the SARS-CoV2 virus, which was the biggest wave that
Thailand had ever encountered. Subsequently, Thailand’s ranking, based on the total cases, was up to 24th place globally and had more than 2 million confirmed cases (Worldometer, 2021). With this, the government stated most schools during that time needed to educate their students in virtual lessons such as Google Meet. However, with this new method of teaching, most teachers agreed that there are challenges when teaching virtually (Rosalina, Nasrullah, & Elyani, 2020). Thus, it is crucial to find tools such as online platforms that can enhance the productivity of an online class. The information about online platforms in this research was gathered from sources that are reliable in November. The collected
information involved the effectiveness of using an online platform in online lessons and popular educational online platforms that can enrich both teachers and students. The objective of this research was to determine the best online platform for both students and teachers. It is important to find an
online platform that both sides (students and teachers) can use to optimize the lesson. This study also compared the results of the preferred platforms in teaching and learning factual subjects. This comparison can find which online platform that both students and teachers agree can enhance the productivity of online classes. 2. Literature Review 2.1. Related Research
Safarati, N. and Rahma, R., 2020 researched the effectiveness of online learning using Quizizz during the Covid-19 pandemic in applied Physics courses. This research’s main purpose is to see the effectiveness of using Quizizz in online learning in applied physics. The respondents of this research were the group of students that studied in the Almuslim University Physics Education

IAI Academic Conference Proceedings Virtual Conference, November & December, 2021 ________________________________________________________________________________________________________
5
Study Program and enrolled in applied physics lectures. Data were collected via quizzes and questionnaires. This study found that Quzizz is one of the most effective online learning tools used during the Covid-19 pandemic in applied physics courses.
Furthermore, other research conducted by Ndihokubwayo, K., Uwamahoro, J., and Ndayambaje, I., 2020 questioned the
effectiveness of teaching physics by using Physics Educational Technology (PhET) simulations and YouTube in order to improve the learning of optics in Rwandan secondary schools. The subjects of this research were 136 senior-4 physics students that were divided into 3 groups: the first group was taught with the regular teaching method, whereas, the other two were the usual teaching method that used PhET simulations and watched YouTube videos pertaining to the topic. All three groups were given the same questions from the Geometric Optics Conceptual Understanding Test. It was found that students that use PhET and YouTube video gain 12% and 11% respectively, whereas, students that are being taught by the usual teaching method gained only 2%. Lastly, it can be stated that both PhET simulations and YouTube videos are effective. 2.2. Example of Online Platform Used to Support Online Classes
These are some of the most popular online platforms that use in classes in order to improve academic processes and engage collaboration amongst their peers (Chauhan, A., 2018. & Ekaran, S., 2018.). 2.2.1. ClassDojo
ClassDojo is an online platform that has been for improving student behavior. To illustrate, teachers can provide instant feedback to good students by giving students rewards (points). The list of scores about student behavior can be shared with others (administrators and parents) via the ClassDojo website. 2.2.2. Kahoot!
Kahoot! is an educational online platform that is based on gamified questions. With this online platform, teachers can create questionnaires or discussions that can use to support academic classes. Moreover, it can be projected in the class and let the questions be answered by students. This online platform increases students to create a dynamic, social, and entertaining educational environment. 2.2.3. Socrative
Socrative is a cloud-based student response system that allows teachers to create a test (mini-quizzes) to check student understanding and assign it to students on laptops or smartphones. Quizzes in this platform can be in various forms, namely multiple choices, short answers, open-ended short responses, or true-false. The strength of this platform is the “on the fly” assessment method that provides teachers with valuable feedback. 2.2.4. Quizlet
Quizlet, an online platform that allows teachers and students to create and share their learning materials like flashcards with others. It engages students to stay active and communicate with others in order to win. 3. Research Methodology
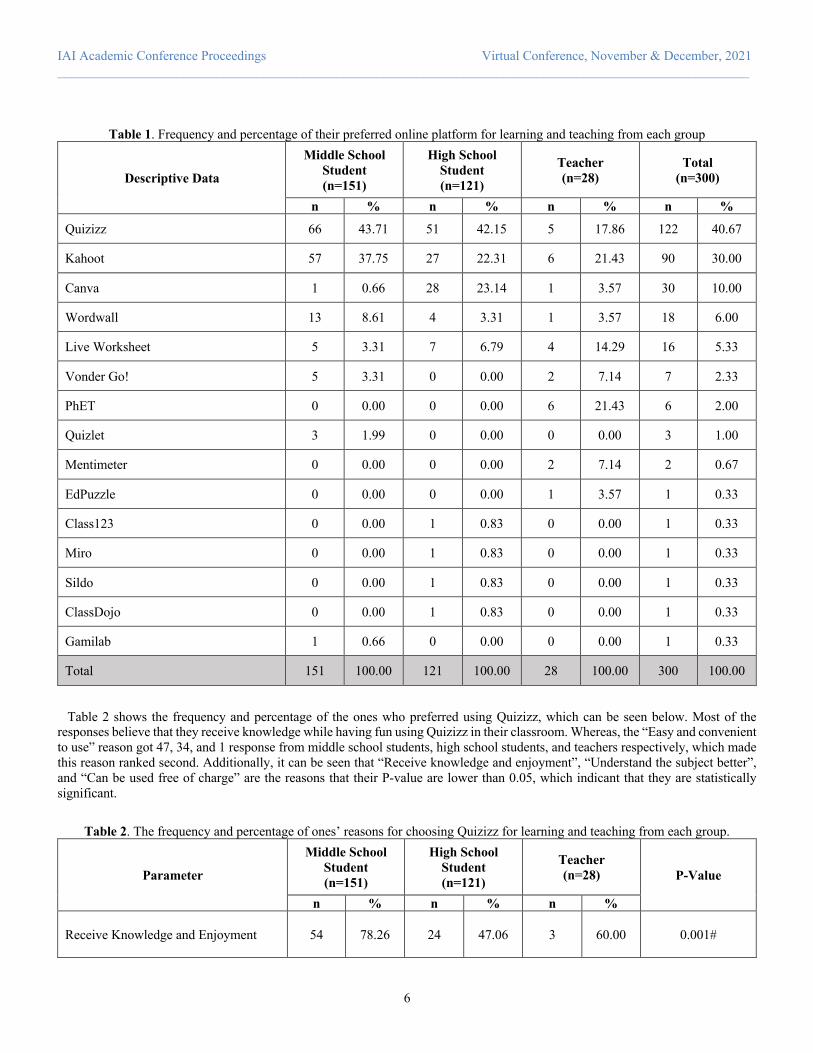
This research is quantitative survey research, which was collected from middle school students, high school students, and teachers in an independent school. The data was gathered by using an online questionnaire (Google Form). There were 3 surveys for each group in order to avoid error and the surveys are checkboxes questionnaire except the first question (table 1) and the last question (table 4) are in multiple choices. The questions for the students consist of 5 questions, while the teacher’s one consists of 15 questions. The questions are related to their opinions about their preferred online platforms, which were checked under expert guidance. Then, during the data collection stage, 300 responses were received, which consists of 151, 121, and 28 from middle school students, high school students, and teachers respectively. After that, the raw data had been sorted and statistically analyzed through Mean, Standard Deviation, and one-way ANOVA. 4. Findings Table 1 illustrates the frequency and percentage of all group respondents participating in the surveys. Major responses were from Middle school students (n = 151). According to the table, the vast majority of responses stated that the online platform was Quizizz (40.67%).
IAI Academic Conference Proceedings Virtual Conference, November & December, 2021 ________________________________________________________________________________________________________
6
Table 1. Frequency and percentage of their preferred online platform for learning and teaching from each group
Descriptive Data
Middle School Student (n=151)
High School Student (n=121)
Teacher (n=28)
Total (n=300)
n % n % n % n %
Quizizz 66 43.71 51 42.15 5 17.86 122 40.67
Kahoot 57 37.75 27 22.31 6 21.43 90 30.00
Canva 1 0.66 28 23.14 1 3.57 30 10.00
Wordwall 13 8.61 4 3.31 1 3.57 18 6.00
Live Worksheet 5 3.31 7 6.79 4 14.29 16 5.33
Vonder Go! 5 3.31 0 0.00 2 7.14 7 2.33
PhET 0 0.00 0 0.00 6 21.43 6 2.00
Quizlet 3 1.99 0 0.00 0 0.00 3 1.00
Mentimeter 0 0.00 0 0.00 2 7.14 2 0.67
EdPuzzle 0 0.00 0 0.00 1 3.57 1 0.33
Class123 0 0.00 1 0.83 0 0.00 1 0.33
Miro 0 0.00 1 0.83 0 0.00 1 0.33
Sildo 0 0.00 1 0.83 0 0.00 1 0.33
ClassDojo 0 0.00 1 0.83 0 0.00 1 0.33
Gamilab 1 0.66 0 0.00 0 0.00 1 0.33
Total 151 100.00 121 100.00 28 100.00 300 100.00
Table 2 shows the frequency and percentage of the ones who preferred using Quizizz, which can be seen below. Most of the responses believe that they receive knowledge while having fun using Quizizz in their classroom. Whereas, the “Easy and convenient to use” reason got 47, 34, and 1 response from middle school students, high school students, and teachers respectively, which made this reason ranked second. Additionally, it can be seen that “Receive knowledge and enjoyment”, “Understand the subject better”, and “Can be used free of charge” are the reasons that their P-value are lower than 0.05, which indicant that they are statistically significant.
Table 2. The frequency and percentage of ones’ reasons for choosing Quizizz for learning and teaching from each group.
Parameter
Middle School Student (n=151)
High School Student (n=121)
Teacher (n=28) P-Value
n % n % n %
Receive Knowledge and Enjoyment 54 78.26 24 47.06 3 60.00 0.001#

IAI Academic Conference Proceedings Virtual Conference, November & December, 2021 ________________________________________________________________________________________________________
7
Easy and Convenient to Use 47 68.12 34 66.67 1 20.00 0.110
Use Technology for Learning to Be Useful 19 27.54 17 33.33 2 40.00 0.649
Understand the Subject Better 31 44.93 9 17.65 2 40.00 0.004#
Evaluate Their Own Academic Performance 23 33.33 12 23.53 3 60.00 0.146
Easy to Access 21 30.43 20 39.22 0 0.00 0.186
Can Be Used Free of Charge 6 8.70 27 27.45 1 20.00 0.017#
Allows students to interact more with their peers 3 4.35 8 15.69 1 20.00 0.061
#p < 0.05: Statistics Significant
Table 3 provides the information about the frequency and percentage of the limitations that one who preferred using Quizizz find. Parameters that have an asterisk are created specifically for teachers. It can be seen that, despite the fact that most of the responses believe that Quizizz has no limitation, a minority of responses believe the platform can occur technical problems while using it.
Table 3. The frequency and percentage of ones finding Quizizz’s limitations for learning and teaching from each group.
Parameter
Middle School Student (n=151)
High School Student (n=121)
Teacher (n=28) P-Value
n % n % n %
Understanding of Learning 6 8.70 3 5.88 N/A N/A 0.816
Tools in The Program 7 10.14 5 9.80 0 0.00 1.000
Technical Problem 7 10.14 9 17.65 N/A N/A 0.364
Cannot Be Applied in Practice 9 13.04 8 15.69 N/A N/A 0.901
Can Be used in Specific Platform 4 5.80 1 1.96 N/A N/A 0.507
System Stability 2 2.90 6 11.76 N/A N/A 0.143
Difficulty in Making Teaching Materials* N/A N/A N/A N/A 0 0.00 -

IAI Academic Conference Proceedings Virtual Conference, November & December, 2021 ________________________________________________________________________________________________________
8
Evaluation Error* N/A N/A N/A N/A 1 20.00 0.040
Additional Cost* N/A N/A N/A N/A 1 20.00 0.040
No Limitation 46 66.67 29 56.86 3 60.00 0.549
*limitation for teacher
Table 4 presents the percentage of satisfaction and benefits of the ones who chose Quizizz from each group. For satisfaction, all of the group’s mean is over 80 percent. Whereas, benefit, though the mean of middle school students and teachers group exceeds 80 percent, the mean of high school students is lower than 80 percent by over 3 percent.
Table 4. The percentage of satisfaction and benefits of the ones who chose Quizizz from each group.
Parameter Middle School
Student (n=151)
High School Student (n=121)
Teacher (n=28) Total P-Value
Satisfaction** 82.73 ± 13.98 80.78 ± 13.24 88 ± 17.89 82.13 ± 13.80 0.473
Benefit** 80 ± 15.69 74.51 ± 17.47 88 ± 17.89 78.03 ± 16.75 0.084
**Mean ± SD
5. Conclusions In conclusion, during these times where most lessons need to be virtual, tools like online platforms have the potential to enhance the productivity of lessons. Hence, a survey was conducted for students and teachers, it was found that most respondents preferred Quizizz because the main reason is that the students can receive knowledge while enjoying the lesson. However, some of the respondents believe that there is a limitation that should be accounted for, for instance, the technical problem of both teacher and learner. Despite the limitation, according to Mahmoud and Tani (2014), Quizziz being a gamified quiz platform, increases the learner’s motivation and helps learners to sustain their interest in the class. Furthermore, this research has one limitation, which is that respondents might lack online platform knowledge, in other words, the respondents might not know the potential of all the provided online platforms. Thus, their decision might be narrow or biased. Lastly, for further research, it can be recommended that information of all provided platforms should be changed to both students and teachers in order to acquire more effective results. Acknowledgment This research was supported and advised with great care of Kanlaya Panjapornpon (M.D,), Asst. Prof. Roungtiva Muenpa (B.Phram, M.Phram., BCP, Ph.D.), and the director of Sarasas Ektra School. References Chauhan, A., 2018. 11 Digital education tools for teachers and students. Retrieved from: https://elearningindustry.com/digital-education-tools-teachers-students Ekaran, S., 2018. Top 10 Tools For The Digital Classroom. Retrieved from: https://elearningindustry.com/tools-for-the-digital-classroom-top-10 Mahmoud, A.A.A. and Tanni, Z.A., 2014. Using games to promote students’ motivation towards learning English. Al-Quds Open University Journal for Educational & Psychological Research & Studies, 2(5), pp.11-33. Ndihokubwayo, K., Uwamahoro, J. and Ndayambaje, I., 2020. Effectiveness of PhET simulations and YouTube videos to improve the learning of optics in Rwandan secondary schools. African Journal of Research in Mathematics, Science and Technology

IAI Academic Conference Proceedings Virtual Conference, November & December, 2021 ________________________________________________________________________________________________________
9
Education, 24(2), pp.253-265. Rosalina, E., Nasrullah, N. and Elyani, E.P., 2020. Teacher’s Challenges towards Online Learning in Pandemic Era. LET: Linguistics, Literature and English Teaching Journal, 10(2), pp.71-88. Safarati, N. and Rahma, R., 2020. The effectiveness of online learning using quizizz education game media during the Covid-19 pandemic in applied physics courses. Indonesian Review of Physics, 3(2), pp.52-56. Worldometer., 2021. Thailand Coronavirus Cases. Retrieved from: https://www.worldometers.info/coronavirus/country/thailand/#graph-cases-daily

IAI Academic Conference Proceedings Virtual Conference, November & December, 2021 ________________________________________________________________________________________________________
10
Human Rights Derogation in Times of Emergency of Covid-19
Aneta Stojanovska-Stefanova, PhD1*, Hristina Runcheva Tasev, PhD2 1* University Goce Delchev-Shtip
2 Law Faculty “Iustinianus Primus”, Ss Cyril and Methodius University Skopje *Corresponding Author: e-mail: [email protected]
Abstract The Covid-19 pandemic has prompted governments around the world to take restrictive measures against the pandemic, also the governments around the world have been challenged to respect human rights, democracy and the rule of law in the fight against the pandemic. In an effort to deal with the immediate catastrophic effects of the virus, nations have resorted to various measures, including restricting freedom of movement and closing national borders. Under international human rights law, states can restrict the exercise of most human rights if it is necessary to protect the rights of others or collective interests. The paper aims to make an analysis and presentation of the exceptional circumstances caused by the global pandemic Covid-19, that are leading to human rights restrictions in emergency time, varying in scope and duration. The authors will also provide a theoretical overview of the derogation according to the European Convention on Human Rights (ECHR) that can apply ‘in times of war or other public emergency threatening the life of the nation’. More recent legal instruments usually do not refer to ‘war’ but contain similar reference to public emergency. The authors also presented the specific right of states to deviate from human rights in conditions of public emergency and conditions of legitimate deviation in the context of Covid-19. At the end of the paper, conclusions and recommendations are given, that the respect for human rights during the Covid-19 pandemic calls for multilateral cooperation and solidarity at all levels. Within states, measures to combat the pandemic should be motivated by the conviction of all people to contribute to preventing the virus’ spread, while states must stand by those most at risk. All states in Europe, whether they are members of the Council of Europe or the European Union, have committed to upholding human rights, democracy and the rule of law, including under the European Convention on Human Rights, the EU Charter of Fundamental Rights and UN treaties. Keywords: Covid-19 pandemic, human rights, restrictions, emergency time, ECHR.
1. Introduction Countries, as the main players on the international level, in mutual relations are often seen as sovereign, which means they are not vulnerable to any higher political authority. The duty which corresponds to the right of sovereignty is non-interventional, an obligation not to interfere in actions which essentially fall within the domestic jurisdiction of sovereign countries. Human rights, which usually imply the treatment of its own citizens by the country in its own territory, traditionally belong to the domain of domestic jurisdiction. The aspiration to protect the human dignity of all human beings is central to the concept of the human rights. This concept at the center leaves the man and the common universal system of values dedicated to the sanctity of life and provides a framework for building a human rights system protected by internationally accepted norms and standards1. In March 2020, a global pandemic caused by the corona virus was declared, which in 2021 is still ongoing. The virus destroys many lives, but in the fight against the infection, the main challenge besides preserving human health was not to allow the pandemic to violate human rights and not to destroy the basic values of free societies. The pandemic has prompted governments around the world to take restrictive measures against the virus, and the Council of Europe has urged governments across Europe to respect human rights, democracy and the rule of law during the Covid - 19 crisis. Human rights are key in shaping the pandemic response, both for the public health emergency and the broader impact on people’s lives and livelihoods. Human rights put people centre-stage. Responses that are shaped by and respect human rights result in better outcomes in beating the pandemic, ensuring healthcare for everyone and preserving human dignity. But they also focus our attention on who is suffering most, why, and what can be done
1 Stojanovska-Stefanova, Aneta and Atanasoski, Drasko and Chacorovski, Zoran (2017) Human Rights as a subject of world politics. US China Law Review, 14 (6). pp. 321-334. ISSN 1548-6605 (Print) 1930-2061 (online)
IAI Academic Conference Proceedings Virtual Conference, November & December, 2021 ________________________________________________________________________________________________________
11
about it. They prepare the ground now for emerging from this crisis with more equitable and sustainable societies, development and peace2. Hence the biggest social, political and legal challenges which the countries faced were their abilities to respond effectively to this crisis, while ensuring that the measures they take would guarantee the preservation of the core values of human rights, democracy and the rule of law.
2. Methodology The main hypothesis of the authors for writing this paper is that "the Covid-19 pandemic caused the derogation of human rights". Auxiliary hypotheses are that "the freedom of movement is one of the basic human rights enshrined in many international conventions" and “the pandemic calls for a co-operative, transparent, science-based and coordinated global response". The hypotheses are tested and discussed by the authors through the available data, analysis of European Convention on Human Rights, EU Charter of Fundamental Rights and UN treaties, as well as analyzes of the knowledge and proposed measures by governments and international organizations such as Council of Europe and United Nations. The authors will try to prove the basic and auxiliary research hypothesis through a process of analysis and synthesis, abstraction and concretization.
3. Literature review The existence of international norms, by itself, does not give authority to the United Nations to explore how the countries implement or not implement them. The Acts for Human Rights, along with the Universal Declaration, represent an authoritative exhibiting of the norms of international human rights, standards of behavior in which all countries should strive for. These three documents, which collectively are called International acts of human rights, represent the summarized exhibition of the minimum social and political guarantees recognized by the international community as necessary for a decent life in the modern world3. The duty to protect requires the country to prevent violence and other human rights violations among the people on its territory. According to this, human rights also have a “horizontal dimension”, which has become increasingly important in the era of globalization, raising the question of social responsibility of international corporations. Another trend of development is the growing emphasis on the prevention of the human rights abuse by structural measures, respectively through national institutions or by including the dimension of the human rights in the operations of peacekeeping. Prevention is also a priority and access of human security to human rights.4 Behind the current country of human rights on an international level, stands a long process of acquiring certain rights, their affirmation and promotion of their practice. In international relations, the central role is given to the individual, and thus human rights play an important role in international relations. Theorists speak about three groups of developmental stages of human rights. The first group includes those rights that should allow the release of the man from the pressure of the country, i.e. rights aimed at freedom, and they include civil and political rights. As such, they should allow a person active engagement in the management of the country and its control. Among civil and political rights include: the right to life, liberty and security of person, freedom of thought and expression, the right to a fair trial, the right to effective remedies, and freedom of association. Some of these rights can also be restricted, for example, in the case of an emergency or crisis in the country. The second group includes: economic, social, and cultural rights, i.e. rights aimed at protecting the man. They enable the existence of man, adequate standard of living, employment, social, and health care and so on. The third group of rights is called collective rights that are still called solidarity, because their realization requires cooperation on the international level. In order for all three groups of rights to implement, promote, and protect, it is extremely important that the country, as a subject of international law, finds ways and models on how to successfully support individuals in finding the way to their accomplishments5. Hartman F. Joan noted that international protection of human rights is essential in crisis situations where states suspend basic freedoms and frequently commit massive violations of human rights treaties6. Stojanovska-Stefanova A and Runcheva-Tasev H, argued that human rights should be a central focus of states, both in times of prosperity and in times of crisis. Thus, the Covid-19 pandemic posed serious challenges to effective access by providing measures
2 United Nations, (2020), “Covid-19 and Human Rights, We are all in this together”, available at: UNSDG | COVID-19 and Human Rights: We are all in this together, last accessed: 24.09.2021 3 Donnelly Jack, (2004), International human rights, (MI-AN, Skopje), pg.17 4 Understanding the human rights (2008), The Macedonian Information Center in Cooperation with the Directorate for Public Diplomacy, Ministry of Foreign Affairs of Macedonia, Printing House Europe 92, Kocani, pg.34. 5 Stojanovska-Stefanova, Aneta and Atanasoski, Drasko and Chacorovski, Zoran (2017) Human Rights as a subject of world politics. US China Law Review, 14 (6). pp. 321-334. ISSN 1548-6605 (Print) 1930-2061 (online) 6 Hartman F Joan, (1984) Derogation from Human Rights Treaties in Public Emergencies-A Critique of Implementation by the European Commission and Court of Human Rights and the Human Rights Committee of the United Nations,

IAI Academic Conference Proceedings Virtual Conference, November & December, 2021 ________________________________________________________________________________________________________
12
to deal with the health and economic crisis, while at the same time exposing them to the need to preserve the core values of democracy and the rule of law7. Marinelo T, argues that it is difficult to compromise between defending national interests and protecting individual rights during public emergencies.8 In such situations, insistence on special individual interests can have serious detrimental effects on community welfare, said Schreuer Christoph. The need to accommodate both sets of claims is recognized in international documents dealing with the protection of human rights as well as in national instruments safeguarding basic rights and fundamental freedoms. While it is clear that individual rights are not absolute, the international community must guard against spurious invocations of community interests to excuse violations of human rights9. Hartman F. Joan, notes that states of emergency involving the suspension of fundamental right for the purported reason of national self-protection10. The coronavirus tested the (un) readiness of the countries worldwide to deal with the health crisis, and then with the severe economic crisis caused by restrictions on freedom of movement. As of April 7, 2020, Ireland was the only EU country that did not impose restrictions on state borders for entry / exit of its own and third-country nationals. A total of 26 EU member states have closed colleges, schools, kindergartens, museums, libraries, etc., while Sweden was the only country that decided to practice the method of acquiring collective immunity without the introduction of restrictions and quarantines.
Having in mind that we are approaching the two years’ period since the coronavirus appeared on European field and was then declared a pandemic by the World Health Organization, the question that arises is whether the measures restricting freedom of movement were legitimate and whether they helped fight the virus? The answer is obvious if we analyze the increasing number of active cases, first in the Balkans, then at the European and generally at the global level11.
The Council of Europe, in order to assist the 47 Member States, has issued an Information Document12, as a tool designed to assist countries in taking action during the current crisis, in order to remain proportionate to the threat of the spread of the virus and to have a time limit.
The document covers four key areas: - derogation from the European Convention on Human Rights in emergencies, respect for the rule of law and democratic principles in emergencies, including restrictions on the scope and duration of emergency measures; -basic standards for human rights, including freedom of expression, privacy and data protection, protection of vulnerable groups from discrimination and the right to education; -protection and protection of victims of crime, especially in relation to gender-based violence. -the document aimed to facilitate the process of implementing corona virus protection measures that in many countries included restrictions and bans on movement, in addition to the already known rules for wearing masks and maintaining social distance. Also, the United Nations has available a powerful set of tools, in the form of human rights, that equip States and whole societies to respond to threats and crises in a way that puts people at the centre. Observing the crisis and its impact through a human rights lens puts a focus on how it is affecting people on the ground, particularly the most vulnerable among us, and what can be done about it now, and in the long term. Although this paper presents recommendations, it is worth underlining that human rights are obligations which States must abide by13.
7 Stojanovska-Stefanova, Aneta and Runcheva-Tasev, Hristina (2021) Современи предизвици за заштита на човековите права. Правен дијалог (23). pp. 5-13. ISSN 1857-7644 8 Mariniello, T. (2019). Prolonged emergency and derogation of human rights: Why the European Court should raise its immunity system. German Law Journal, 20(1), 46-71. doi:10.1017/glj.2019.3 9 Christoph Schreuer, Derogation of Human Rights in Situations of Public Emergency: The Experience of the European Convention on Human Rights, 9 YALE J. INT'L L. (1982). Available at: https://digitalcommons.law.yale.edu/yjil/vol9/iss1/6 10 Hartman, J. F. (1984). [Review of States of Emergency: Their Impact on Human Rights, by International Commission of Jurists]. Human Rights Quarterly, 6(1), 125–132. 11 Стефановска В. (2020), Импликации врз слободата на движење за време на пандемијата Ковид-19, IHR - Платформа блог, 22.09.2021 12 Council of Europe, Informative document SG/Inf(2020)11, link: https://rm.coe.int/covid-toolkit-ms-mkd/16809e3c21, last accessed 11.09.2021 13 United Nations, (2020), “Covid-19 and Human Rights, We are all in this together”, available at: UNSDG | COVID-19 and Human Rights: We are all in this together, last accessed: 24.09.2021

IAI Academic Conference Proceedings Virtual Conference, November & December, 2021 ________________________________________________________________________________________________________
13
4. State measures as a response to Covid-19 pandemic In accordance with human rights standards, states must use their maximum available resources to fully realise economic and social rights as expeditiously and effectively as possible. They must avoid retrogressing in service standards, and ensure substantive equality by mitigating disproportionate impacts on those most at risk. This should be carried out transparently and with the meaningful participation and consultation of those affected. Both states and the EU’s economic response must keep in line with these human rights principles14. The world is currently facing one of its most severe public health crises. At the time of this paper, there are more than 234.863.214 confirmed cases of Covid-19 worldwide.15
The Covid-19 pandemic is far more than a health crisis: it is affecting societies and economies at their core. While the impact of the pandemic will vary from country to country, it will most likely increase poverty and inequalities at a global scale, making achievement of SDGs even more urgent. Without urgent socio-economic responses, global suffering will escalate, jeopardizing lives and livelihoods for years to come. Immediate development responses in this crisis must be undertaken with an eye to the future. Development trajectories in the long-term will be affected by the choices coun- tries make now and the support they receive. The UN Development System therefore has a dual imperative. It must respond urgently to stem the impact, and it must do so by helping govern- ments and populations respond in a way that builds a better future. Speed is of the essence; but how we accelerate our development offer of support must be fully consistent with the principles that underpin the United Nations Secretary-General’s global call. The responses should aim to protect people and planet; pre- serve gains across all the SDGs; ensure equal- ity; promote transparency, accountability, and collaboration; increase solidarity; and place the voice, rights and agency of people at the center16. The UN development system is placing all of its relevant assets in support of an immediate development response to com- plement the humanitarian and emergency health interventions. These assets include17: -A wide and deep presence -The required knowledge - а broad mandate - а large development portfolio to build on - A wide and flexible range of support modalities -The ability to deliver integrated, coordinated support -Established funding modalities for rapid disbursements -Strong partnerships for greater reach and impact -An impartial, normative approach -An operational infrastructure fit for purpose. The Covid-19 crisis impacts the world’s poorest and most vulnerable hardest, with significant intergenerational implications for poor families. As demonstrated during the 2008 financial crisis, countries with strong social protection systems and basic services suf- fered the least and recovered the fastest. Over the next few months, governments around the world will need to adapt, extend and scale-up cash transfers, food assistance programmes, social insurance programmes and child ben- efits to support families, among others. However, 4 billion people – accounting for 55 percent of the world population, including two out of three children – have no or inad- equate social protection to start with. Social protection responses must consider differ- entiated impacts of Covid-19 on vulnerable groups, women and men and those surviving on income in the informal sector, as well as those now shouldering additional unpaid care work. Therefore, the scope of the challenges ahead requires an extraordinary scale-up of support18. The Covid-19 crisis is a brutal reminder of the importance of ensuring lasting progress with respect to social rights enjoyment, particularly through the development of universal public health services. The pandemic shows in practical terms the indivisibility of human rights.
As the Covid-19 disease pandemic continues to develop, preventing spread of infection to and from health care workers and patients relies on effective use of personal protective equipment. A critical shortage of all of these is putting health care workers
14 European Network of National Human Rights Institutions, (2020), Statement The EU must put economic and social rights at the heart of its economic response to COVID-19, link: http://ennhri.org/statement-covid-19-esr/, (22.03.2021)
15 Coronavirus COVID-19 Global Cases by the Center for Systems Science and Engineering (CSSE) at John Hopkins, link> https://gisanddata.maps.arcgis.com/apps/opsdashboard/index.html#/bda7594740fd40299423467b48e9ecf6, (03.10.2021) 16 United Nations, (2021), A UN framework for the immediate socio-economic response to COVID-19, link:
https://www.un.org/sites/un2.un.org/files/un_framework_report_on_covid-19.pdf, (22.03.2021) 17 Ibid 18 UN, (2020), A UN framework for the immediate socio-economic response to COVID-19, link:
https://www.un.org/sites/un2.un.org/files/un_framework_report_on_covid-19.pdf, (22.03.2021)

IAI Academic Conference Proceedings Virtual Conference, November & December, 2021 ________________________________________________________________________________________________________
14
at risk. The right of every worker to a safe and healthy working environment, enshrined in the Article 3 of the European Social Charter, is a widely recognised principle, stemming directly from the right to personal integrity, one of the fundamental principles of human rights. It applies to the whole economy, covering both the public and private sectors, employees and the self-employed.
Older persons face special challenges during the Covid-19 crisis. In the global response to Covid-19, it is essential that States protect the rights of older persons on an equal basis with others without discrimination and without exception and in line with international standards. The rights of elderly persons are protected under Article 23 of the European Social Charter19. The main purpose of Article 23 is to enable elderly persons to remain full members of society and requires States Parties to establish an adequate legal framework making it possible to combat age-based discrimination and providing for a procedure for “assisted decision-making”20. Article 11 of the European Social Charter (“the Charter”) enshrines the right to protection of health. In terms of that right, States Parties have undertaken to take appropriate measures designed, inter alia, to prevent epidemic diseases (Article 11§3), remove the causes of ill health (Article 11§1), and provide advisory facilities for the promotion of health and the encouragement of individual responsibility in matters of health (Article 11§2). In times of pandemic, during which the life and health of many people are under serious threat, guaranteeing the right to protection of health is of crucial importance, and governments should take all necessary steps to ensure that it is effectively guaranteed. In the light of this, States Parties must ensure that the right to protection of health is given the highest priority in policies, laws and other actions taken in response to a pandemic. In this regard, the Committee recalls that the right to protection of health includes the right of access to healthcare, and that access to healthcare must be ensured to everyone without discrimination. This implies that healthcare in a pandemic must be effective and affordable to everyone, and that groups at particularly high risk, such as homeless persons, persons living in poverty, older persons, persons with disabilities, persons living in institutions, persons detained in prisons, and persons with an irregular migration status must be adequately protected by the healthcare measures put in place21.
The Covid-19 crisis has demonstrated just how crucial multilateral institutions are to our collective health, prosperity, and security. The Covid-19 pandemic is a wake-up call for multilateralism. Trying to cope with the immediate devastating effects of the virus, nations have turned toward imposing unprecedented executive measures, including closing borders. However, a virus knows no borders. All countries are affected. We must remain united in our shared humanity. The fight against this global pandemic, which is taking so many lives and challenging our societies, requires more and enhanced international cooperation and worldwide solidarity. Containing and countering this pandemic calls for a co-operative, transparent, science-based and coordinated global response. We are concerned by the serious threat to all countries, particularly developing and least developed countries, countries in situations of conflict and post-conflict countries, where health systems are less prepared, as well as the particular risk faced by refugees and displaced persons.We realise that the pandemic poses a serious threat to the essential right to the highest attainable standard of physical and mental health. At the same time, in a situation of emergency, it is of utmost importance to maintain principles of democracy and the rule of law. We call on all governments to strictly ensure that any measures taken to counter the pandemic must be necessary and proportionate, pursue legitimate purposes, be limited in time, non- discriminatory and respectful of international law, including human rights law. Adopting a gender-responsive approach will be essential22.
5. Human rights derogation according the European Convention on Human Rights
Controlling the virus, and protecting the right to life, means breaking the chain of infection: people must stop moving and interacting with each other. The most common public health measure taken by States against Covid-19 has been restricting freedom of movement: the lock-down or stay-at-home instruction. This measure is a practical and necessary method to stop virus transmission, prevent health-care services becoming overwhelmed, and thus saves lives.
19 Council of Europe, The Charter in four steps, link: https://www.coe.int/en/web/european-social-charter/about-the-charter, link: https://www.coe.int/en/web/european-social-charter/about-the-charter, (29.09.2021) 20 Council of Europe, (2021), Council of Europe Social Rights in times of pandemic, link:
https://www.coe.int/en/web/european-social-charter/social-rights-in-times-of-pandemic, (23.03.2021) 21 EUROPEAN COMMITTEE OF SOCIAL RIGHTS COMITE EUROPEEN DES DROITS SOCIAUX, (2020), Statement of interpretation on the right to protection of health in times of pandemic, link: https://rm.coe.int/statement-of-interpretation-on-the-right-to-protection-of-health-in-ti/16809e3640, 22.03.2021 22 The Organization of American States, Alliance of Multilateralism, link: http://www.oas.org/fpdb/press/Declaration-AfM-COVID-final.pdf, last accessed 10.09.2021

IAI Academic Conference Proceedings Virtual Conference, November & December, 2021 ________________________________________________________________________________________________________
15
However, the impact of lockdowns on jobs, liveli- hoods, access to services, including health care, food, water, education and social services, safety at home, adequate standards of living and family life can be severe. As the world is discovering, freedom of movement is a crucial right that facilitates the enjoyment of many other rights. Individual human rights, by their very nature, are limited by the correlative rights of other individuals and by the legitimate needs of society23. International human rights lays down the obligations of Governments to act in certain ways or to refrain from certain acts, in order to promote and protect human rights and fundamental freedoms of individuals or groups24. While international law permits certain restrictions on freedom of movement, including for reasons of security and national emergency like health emergencies, restrictions on free movement should be strictly necessary for that purpose, proportionate and non-discriminatory. The availability of effective and generalised testing and tracing, and targeted quarantine measures, can mitigate the need for more indiscriminate restrictions25. Sommario E. noted that the existence of a public emergency of significant magnitude may temporarily exonerate States from the duty to fully respect their human rights commitments, either through the operation of specific clauses that are included in the relevant treaties (so-called “derogation clauses”), or - where no such provision is present - by invoking certain justifications recognized in international law as valid excuses for the non-performance of legal obligations26. Hafner-Burton E. et al.27 defined derogations as a rational response to [the] uncertainty, enabling governments to buy time and legal breathing space from voters, courts, and interest groups to combat crises by temporarily restricting civil and political liberties. According to Shraga, D “a clear delimitation of the State's power to derogate, as well as theabsolute entrenchment of certain fundamental human rights and free-doms-such as the right to life, freedom from torture, freedom fromslavery and from retroactive application of criminal laws-are neces-sary, however, to guarantee that the State does not abuse its power of derogation28. According to the European Convention on Human Rights (ECHR), derogation can apply ‘in times of war or other public emergency threatening the life of the nation’. More recent legal instruments usually do not refer to ‘war’ but contain similar reference to public emergency29. Article 15 (derogation in time of emergency) of the European Convention on Human Rights affords to the governments of the States parties, in exceptional circumstances, the possibility of derogating, in a temporary, limited and supervised manner, from their obligation to secure certain rights and freedoms under the Convention. The use of that provision is governed by the following procedural and substantive conditions30: -the right to derogate can be invoked only in time of war or other public emergency threatening the life of the nation; - a State may take measures derogating from its obligations under the Convention only to the extent strictly required by the exigencies of the situation; - any derogations may not be inconsistent with the State’s other obligations under international law; - certain Convention rights do not allow of any derogation: Article 15 § 2 thus prohibits any derogation in respect of the right to life, except in the context of lawful acts of war, the prohibition of torture and inhuman or degrading treatment or punishment, the prohibition of slavery and servitude, and the rule of “no punishment without law”; similarly, there can be no derogation from Article 1 of Protocol No. 6 (abolishing the death penalty in peacetime) to the Convention, Article 1 of Protocol No. 13 (abolishing the death penalty in all circumstances) to the Convention and Article 4 (the right not to be tried or punished twice) of Protocol No. 7 to the Convention; - lastly, on a procedural level, the State availing itself of this right of derogation must keep the Secretary General of the Council of Europe fully informed.
23 Lauterpacht H., (1950), International Law and Human Rights, pg.366 24 United Nations, International Human Rights Law, link: https://www.un.org/en/global-issues/human-rights, (03.10.2021) 25 United Nations (2020), Covid-19 and the Human Rights, link: https://data2.unhcr.org/en/documents/download/75828, (22.03.2021) 26 Sommario E. (2012) Derogation from Human Rights Treaties in Situations of Natural or Man-Made Disasters. In: de Guttry A., Gestri M., Venturini G. (eds) International Disaster Response Law. T.M.C. Asser Press, The Hague, The Netherlands. https://doi.org/10.1007/978-90-6704-882-8_14 27 Hafner-Burton, E., Helfer, L., & Fariss, C. (2011). Emergency and Escape: Explaining Derogations from Human Rights Treaties. International Organization, 65(4), 673-707. doi:10.1017/S002081831100021X 28 Shraga, D. (1986). " Human Rights in Emergency Situations under the European Convention on Human Rights". In Israel Yearbook on Human Rights. Leiden, The Netherlands: Brill | Nijhoff. doi: https://doi.org/10.1163/9789004423008_009 29 Audrey Lebret, COVID-19 pandemic and derogation to human rights, Journal of Law and the Biosciences, Volume 7, Issue 1, January-June 2020, lsaa015, https://doi.org/10.1093/jlb/lsaa015 30 European Court of Human Rights, (2020), Guide on Article 15 of the European Convention on Human Rights Derogation in time of emergency, link: https://www.echr.coe.int/documents/Guide_Art_15_ENG.pdf, (22.03.2021)
IAI Academic Conference Proceedings Virtual Conference, November & December, 2021 ________________________________________________________________________________________________________
16
According to Neuman L. Gerald 31, derogation clauses do not, contradict the notion human right but may on the contrary contribute to their effective protection. In March and April 2020, in the context of the Covid-19 health crisis, Latvia, Romania, Armenia, the Republic of Moldova, Estonia, Georgia, Albania, North Macedonia, Serbia and San Marino, notified the Secretary General of the Council of Europe of their decision to use Article 15 of the Convention32. Under international human rights law, States can limit the exercise of most human rights if it is necessary to protect the rights of others or collective interests. The exceptional circumstances brought by the Covid-19 global pandemic lead to more extensive, on both their scope and their duration, restrictions of human rights than in usual times33. Respect for human rights during the Covid-19 pandemic calls for solidarity at all levels. Within states, measures to combat the pandemic should be motivated by the conviction of all people to contribute to preventing the virus’ spread, while states must stand by those most at risk. As the pandemic knows no borders, states need to collaborate in their efforts, and the Council of Europe and European Union should mutually reinforce each other to help states align their actions with human rights.34 All states in Europe, whether they are members of the Council of Europe or European Union, have committed to upholding human rights, democracy and the rule of law, including under the European Convention on Human Rights, EU Charter of Fundamental Rights and UN treaties. Beyond the current management of this emergency, this crisis shows the fragility of health systems, urging governments to review their strategies and to (re)invest massively in the healthcare sector.35 Hafner-Burton E. et al., argue that derogations are a rational response to domestic political uncertainty. They enable governments facing serious threats to buy time and legal breathing space from voters, courts, and interest groups to confront crises while signaling to these audiences that rights deviations are temporary and lawful36. Marinello T, argues that the recent emergency laws and their widespread and apparently indiscriminate implementation present the risk of destabilizing the whole European system of protection, it becomes ever more necessary that the European Court of Human Rights depart from its previous jurisprudence and adopt a more rigorous and principled scrutiny of the derogation conditions under Article 15 of the Convention37. Crisis or emergency situations usually involve violence and the imminent or actual breakdown of minimum order. In such situations, insistence on special individual interests can have serious detrimental effects on community welfare38. The making of a derogation need not be a concession that the State will not be able to guarantee the rights contained in the Convention. Indeed, the practice when lodging a derogation has been for the Contracting State to state that the measures it is taking “may” involve a derogation from the Convention39. The year 2020 has been a disastrous year for human rights in Europe, in the rethoric of the Council of Europe Commissioner for Human Rights. In her speech on Human Rights Day at the end of 2020, she goes on to argue: “While, increasingly, commitment to upholding human rights standards has been faltering all over the continent for several years, the Covid-19 pandemic has accelerated the erosion of the democratic fabric of our society, on which protection of human rights ultimately depends”. The Western Balkans have not been an exception to this trend. On the contrary, the states in the region, including North Macedonia have imposed strict restrictions and have struggled to keep up with the multiple human rights challenges brought about by the pandemic.
31 Neuman L Gerald., Constrained Derogation in Positive Human Rights Regime, in Evan J. Criddle, Human Rights in Emergencies (CUP, 2026), pp. 15–31. 32 European Court of Human Rights (2020), Derogation in time of emergency, link: https://www.echr.coe.int/documents/fs_derogation_eng.pdf, (21.03.2021) 33 Lebret Audrey, COVID-19 pandemic and derogation to human rights, Journal of Law and the Biosciences, Volume 7, Issue 1, January-June 2020, lsaa015, https://doi.org/10.1093/jlb/lsaa015 34 European Network of National Human Rights Institutions (ENNHRIs), Now is the time for solidarity on human rights, link available: http://ennhri.org/statement-on-covid-19/, last accessed 26.09.2021 35 Audrey Lebret, COVID-19 pandemic and derogation to human rights, Journal of Law and the Biosciences, Volume 7, Issue 1, January-June 2020, lsaa015, https://doi.org/10.1093/jlb/lsaa015 36 Hafner-Burton, E., Helfer, L., & Fariss, C. (2011). Emergency and Escape: Explaining Derogations from Human Rights Treaties. International Organization, 65(4), 673-707. doi:10.1017/S002081831100021X 37 Mariniello, T. (2019). Prolonged emergency and derogation of human rights: Why the European Court should raise its immunity system. German Law Journal, 20(1), 46-71. doi:10.1017/glj.2019.3 38 Christoph Schreuer, Derogation of Human Rights in Situations of Public Emergency: The Experience of the European Convention on Human Rights, 9 YALE J. INT'L L. (1982). Available at: https://digitalcommons.law.yale.edu/yjil/vol9/iss1/6 39 European Court of Human Rights (2021), Guide on Article 15 of the European Convention on Human Rights, link: https://www.echr.coe.int/documents/Guide_Art_15_ENG.pdf, (03.10.2021)

IAI Academic Conference Proceedings Virtual Conference, November & December, 2021 ________________________________________________________________________________________________________
17
In this context, the pandemic is likely to broaden the already existing gap between legislation and reality in human rights protection in the country. When one looks at the fundamental rights protection in the country over the years it is clear that despite the increasing obligations to implement international standards, the pace of their enforcement at the national level lags behind40. The Covid-19 pandemic altered the lives of everyone in the European Union in 2020, with some member states more affected than others by the public health emergency and socioeconomic consequences of lockdown measures. Despite some efforts at the EU and national levels to mitigate the worst impacts, the public health crisis had a disproportionate impact on certain groups—older people, people in poverty, marginalized groups including people with disabilities, Roma, and migrants—and deepened existing fault lines in EU societies and politics41. The Secretary General of the Council of Europe, has called for increased multilateral cooperation among the organisation’s member states to draw lessons from the pandemic crisis and enhance preparedness for addressing health concerns on the basis of common principles and best practices. The Council of Europe urged member states to engage in a new multilateral cooperation project to be launched by the Council of Europe. The cooperation activities will be conducted on the ground in order to identify the most acute issues and effective solutions42. There are few doubts that this health crisis is an emergency threatening the life of the nation. If states have some discretion to determine the emergency, international human rights courts will scrutinize the necessity of the measures adopted to face it by applying the principle of proportionality. States must pay particular attention to vulnerable populations in order to ensure they are not disproportionally affected. In their scrutiny, international courts would rely on different indicia to determine if, at the time they were adopted, less severe measures could have achieve the same results43.
3. Conclusion The scope of measures taken in response to the current Covid-19 threat and the manner in which they are implemented vary considerably from country to country, at different points in time. The Covid-19 pandemic is greatly affecting our healthcare systems. There is need for anticipating the challenges and assessing the capacities needed requires efficient management in line with ethical principles and respect for human dignity. While some restrictive measures adopted by Council of Europe member states may be explained on the basis of the articles of the European Convention on Human Rights (the Convention) relating to the protection of health (see Article 5 paragraph 1d, paragraph 2 of Articles 8 to 11 of the Convention and Article 2 paragraph 3 of Protocol No. 4 to the Convention), measures of an exceptional nature may require derogation from the obligations of States under the Convention. This analysis suggests that states need to be respecting and protecting human rights. It is up to each state to assess whether the measures it takes justify such derogations, depending on the nature and extent of the restrictions applied to the rights and freedoms protected by the Convention. The ability of states to implement such measures is an important characteristics of the system, which allows the continued application of the Convention and its oversight machinery even at the most critical times. Any derogation will be assessed by the European Court of Human Rights (Court) in cases before it. In March and April 2020, in the context of the Covid-19 health crisis, Latvia, Romania, Armenia, the Republic of Moldova, Estonia, Georgia, Albania, North Macedonia, Serbia and San Marino, notified the Council of Europe of their decision to use Article 15 from the Convention. Therefore, we may conclude that the Covid-19 pandemic caused the derogation of human rights. Observing the crisis and its impact through a human rights lens puts a focus on how it is affecting people on the ground, particularly the most vulnerable among us, and what can be done about it now, and in the long term. The freedom of movement as one of the basic human rights enshrined in many international conventions was restricted trough the taken measures. Therefore, the pandemic strongly calls for a co-operative, transparent, science-based and coordinated global response that guarantee human rights protection. The Council of Europe recommended that "the key function of the judiciary - especially the constitutional courts, where they exist - should be maintained. It is important that judges are able to examine the most serious human rights restrictions imposed by
40 Kacarska S, (2021), Human rights protection and COVID-19 in North Macedonia: Patching or rebuilding a system?, link: https://europeanwesternbalkans.com/2021/03/02/human-rights-protection-and-covid-19-in-north-macedonia, (22.03.2021) 41 Human Rights Watch, (2021), World Report: European Union: Events of 2020, link: https://www.hrw.org/world-report/2021/country-chapters/european-union-a-system/, (22.03.2021) 42 Council of Europe (2020), ACouncil of Europe contribution to support member states in addressing healthcare issues in the context of the present public health crisis and beyond, link:
https://www.coe.int/en/web/human-rights-rule-of-law/-/secretary-general-member-states-must-work-together-to-learn-covid-19-health-crisis-lessons, (22.03.2021)
43 Audrey Lebret, COVID-19 pandemic and derogation to human rights, Journal of Law and the Biosciences, Volume 7, Issue 1, January-June 2020, lsaa015, https://doi.org/10.1093/jlb/lsaa015

IAI Academic Conference Proceedings Virtual Conference, November & December, 2021 ________________________________________________________________________________________________________
18
emergency legislation. Procrastination, expediting or group handling of certain categories of cases may be allowed, and the preliminary court authorization may in some cases be replaced by ex-post judicial control44“. According to Article 15, derogation does not depend on the formal declaration of a state of emergency or a similar regime at the national level. At the same time, for each derogation there must be a clear basis in domestic law that allows protection against arbitrariness and it must be strictly necessary for the fight against public emergency. States must bear in mind that all measures taken must strive to protect the democratic order from threats to it, and must do their utmost to protect the values of a democratic society, such as pluralism, tolerance and open-mindedness. Although the court has accepted the derogations to justify certain exceptions to the standards of the Convention, they can never justify any action that is contrary to the most important requirements of the Convention on legality and proportionality. The rule of law in this context includes not only acts of Parliament, but also, for example, decrees of the executive branch in emergency situations, provided that there is a basis for them in the constitution. Many constitutions provide special legal regime that increases the powers of the executive in the event of war or a major natural disaster or other disaster. Also, it is possible for the legislature to enact emergency laws specifically designed to deal with the current crisis that go beyond existing legal rules. Any new legislation of this kind should be in accordance with the constitution and international standards and, where applicable, be subject to review by the Constitutional Court. A fundamental principle of the rule of law is that the actions of the state must be in accordance with the law. Even in a state of emergency the rule of law must prevail. The recommendations are that the respect for human rights during the Covid-19 pandemic calls for multilateral cooperation and solidarity, the pandemic calls for a co-operative, proactive, transparent, science-based and coordinated global response. References
[1]. Audrey Lebret, COVID-19 pandemic and derogation to human rights, Journal of Law and the Biosciences, Volume 7, Issue 1, January-June 2020, lsaa015, https://doi.org/10.1093/jlb/lsaa015
[2]. Christoph Schreuer, Derogation of Human Rights in Situations of Public Emergency: The Experience of the European Convention on Human Rights, 9 YALE J. INT'L L. (1982). Available at: https://digitalcommons.law.yale.edu/yjil/vol9/iss1/6
[3]. Coronavirus COVID-19 Global Cases by the Center for Systems Science and Engineering (CSSE) at John Hopkins, link> https://gisanddata.maps.arcgis.com/apps/opsdashboard/index.html#/bda7594740fd40299423467b48e9ecf6, (03.10.2021)
[4]. Council of Europe (2020), A Council of Europe contribution to support member states in addressing healthcare issues in the context of the present public health crisis and beyond, link:
[5]. Council of Europe, (2021), Guide on Article 15 of the European Convention on Human Rights, link: https://www.echr.coe.int/documents/Guide_Art_15_ENG.pdf, (22.03.2021)
[6]. Council of Europe, (2021), Council of Europe Social Rights in times of pandemic, link: [7]. Council of Europe, Informative document SG/Inf(2020)11, link: https://rm.coe.int/covid-toolkit-ms-mkd/16809e3c21, last
accessed 11.09.2021 [8]. Council of Europe, Secretary General: member states must work together to learn COVID-19 health crisis lessons, link:
https://www.coe.int/en/web/human-rights-rule-of-law/-/secretary-general-member-states-must-work-together-to-learn-covid-19-health-crisis-lessons, (22.03.2021)
[9]. Council of Europe, Social Rights in times of pandemic, https://www.coe.int/en/web/european-social-charter/social-rights-in-times-of-pandemic, (23.03.2021
[10]. Council of Europe, The Charter in four steps, link:: https://www.coe.int/en/web/european-social-charter/about-the-charter, (29.09.2021)
[11]. Donnelly Jack, (2004), International human Rrights, (MI-AN, Skopje), pg.17 [12]. European Court of Human Rights, (2020), Guide on Article 15 of the European Convention on Human Rights
Derogation in time of emergency, link: [13]. EUROPEAN COMMITTEE OF SOCIAL RIGHTS COMITE EUROPEEN DES DROITS
SOCIAUX, (2020), Statement of interpretation on the right to protection of health in times of pandemic, link: https://rm.coe.int/statement-of-interpretation-on-the-right-to-protection-of-health-in-ti/16809e3640, 22.03.2021
[14]. European Court of Human Rights (2021), Guide on Article 15 of the European Convention on Human Rights, link: https://www.echr.coe.int/documents/Guide_Art_15_ENG.pdf, (03.10.2021)
[15]. European Court of Human Rights, (2020), Derogation of human rights in times of emergency, https://www.echr.coe.int/documents/fs_derogation_eng.pdf, (21.03.2021)
[16]. European Network of National Human Rights Institutions (ENNHRIs), Now is the time for solidarity on human rights, link available: http://ennhri.org/statement-on-covid-19/, last accessed 26.09.2021
44 Совет на Европа, Информативни документи, SG/Inf(2020)11, https://rm.coe.int/covid-toolkit-ms-mkd/16809e3c21, last accessed 26.09.2021

IAI Academic Conference Proceedings Virtual Conference, November & December, 2021 ________________________________________________________________________________________________________
19
[17]. European Network of National Human Rights Institutions, (2020), Statement The EU must put economic and social rights at the heart of its economic response to COVID-19, link: http://ennhri.org/statement-covid-19-esr/, (22.03.2021)
[18]. Hafner-Burton, E., Helfer, L., & Fariss, C. (2011). Emergency and Escape: Explaining Derogations from Human Rights Treaties. International Organization, 65(4), 673-707. doi:10.1017/S002081831100021X
[19]. Hartman J. F., (1984) Derogation from Human Rights Treaties in Public Emergencies-A Critique of Implementation by the European Commission and Court of Human Rights and the Human Rights Committee of the United Nations,
[20]. Hartman, J. F. (1984). [Review of States of Emergency: Their Impact on Human Rights, by International Commission of Jurists]. Human Rights Quarterly, 6(1), 125–132.
[21]. Human Rights Watch, (2020), European Union, link: https://www.hrw.org/world-report/2021/country-chapters/european-union-a-system/, (22.03.2021)
[22]. Human Rights Watch, (2021), World Report: European Union: Events of 2020, link: [23]. Kacarska S, (2021), Human rights protection and COVID-19 in North Macedonia: Patching or rebuilding a
system?, link: https://europeanwesternbalkans.com/2021/03/02/human-rights-protection-and-covid-19-in-north-macedonia, (22.03.2021)
[24]. Lauterpacht H., (1950), International Law and Human Rights, pg.366 [25]. Mariniello, T. (2019). Prolonged emergency and derogation of human rights: Why the European Court should
raise its immunity system. German Law Journal, 20(1), 46-71. doi:10.1017/glj.2019.3 [26]. Mariniello, T. (2019). Prolonged emergency and derogation of human rights: Why the European Court should
raise its immunity system. German Law Journal, 20(1), 46-71. doi:10.1017/glj.2019.3 [27]. Neuman L Gerald., Constrained Derogation in Positive Human Rights Regime, in Evan J. Criddle, Human Rights
in Emergencies (CUP, 2026), pp. 15–31. [28]. Shraga, D. (1986). " Human Rights in Emergency Situations under the European Convention on Human Rights".
In Israel Yearbook on Human Rights. Leiden, The Netherlands: Brill | Nijhoff. doi: https://doi.org/10.1163/9789004423008_009
[29]. Sommario E. (2012) Derogation from Human Rights Treaties in Situations of Natural or Man-Made Disasters. In: de Guttry A., Gestri M., Venturini G. (eds) International Disaster Response Law. T.M.C. Asser Press, The Hague, The Netherlands. https://doi.org/10.1007/978-90-6704-882-8_14
[30]. Stojanovska-Stefanova, Aneta and Atanasoski, Drasko and Chacorovski, Zoran (2017) Human Rights as a subject of world politics. US China Law Review, 14 (6). pp. 321-334. ISSN 1548-6605 (Print) 1930-2061 (online)
[31]. Stojanovska-Stefanova, Aneta and Runcheva-Tasev, Hristina (2021) Современи предизвици за заштита на човековите права. Правен дијалог (23). pp. 5-13. ISSN 1857-7644
[32]. The Organization of American States, Alliance of Multilateralism, link: http://www.oas.org/fpdb/press/Declaration-AfM-COVID-final.pdf, last accessed 10.09.2021
[33]. Understanding the human rights (2008), The Macedonian Information Center in Cooperation with the Directorate for Public Diplomacy, Ministry of Foreign Affairs of Macedonia, Printing House Europe 92, Kocani, pg.34.
[34]. United Nations (2020), Covid-19 and the Human Rights, link: https://data2.unhcr.org/en/documents/download/75828, (22.03.2021)
[35]. United Nations, (2020), Covid-19 and Human Rights, We are all in this together, available at: UNSDG | COVID-19 and Human Rights: We are all in this together, last accessed: 24.09.2021
[36]. United Nations, (2021), A UN framework for the immediate socio-economic response to COVID-19 [37]. United Nations, International Human Rights Law, link: https://www.un.org/en/global-issues/human-rights,
(03.10.2021) [38]. United Nations,(2020), UN Framework for the immediate socio-economic response to Covid-19, link:
https://www.un.org/sites/un2.un.org/files/un_framework_report_on_covid-19.pdf, (22.03.2021) [39]. Совет на Европа, Информативни документи, SG/Inf(2020)11, https://rm.coe.int/covid-toolkit-ms-
mkd/16809e3c21, last accessed 26.09.2021 [40]. Стефановска В. (2020), Импликации врз слободата на движење за време на пандемијата Ковид-19,
достапно на: IHR - Платформа блог, последно пристапено 22.09.2021
IAI Academic Conference Proceedings Virtual Conference, November & December, 2021 ________________________________________________________________________________________________________
20
The Impact of Human Capital Development on Economic Growth in
Nigeria
Dr. Samuel Olaleye Lagos State University, Ojo
*Corresponding Author: [email protected]
Abstract The study evaluated the role of the impact of human capital on Nigerian economic growth.The scope of the study was restricted to a period of thirty five (35) years (1981-2015). In line with the research objective, the study sought to analyze the effect of education on economic growth, investigate the impact of health on economic growth, and verify if there is a causal relationship among education, health and economic growth. Ex-post facto type of research design was adopted. The error correction technique was used to estimate the relationship between the variables in the study. Findings in the study revealed that;Education expenditure is negatively but significantly impacts economic growth proxy by GDP. Its value of 0.0302 implies that while keeping constant health expenditure and primary school enrollment a percentage increase in education expenditure brought about 3.02% increase in economic growth proxy by GDP. Health expenditure is positively and significantly related economic growth proxy by GDP. Human capital index proxied by primary school enrolment positively and significantly impacts the economic growth proxy by GDP as a percentage increase in Human capital index proxied by primary school enrolment leads to 0.13% increase in the economic growth proxy by GDP while holding other variable constant. The R-squared value of 0.925 implies that over 92.5% variation in economic growth proxy by GDP is explained by the explanatory variables in the model. There exists a causal relationship between Primary School Enrollment and education expenditure. There exist a causal relationship between Primary School Enrollment and health expenditure. It was recommended that; the challenges of human capital development should best be addressed through a qualitative education system. Government should provide the enabling environment by ensuring macroeconomic stability that will encourage increased private sector investment, Education and health care delivery system should be given priority attention through increased budgetary provisions at all levels of government. Government should mobilize additional resources for education by cutting down on enormous waste characteristic of government expenditure in other areas. Government must be more alert to its responsibility to ensure that resources meant for human capital development projects are judiciously applied. There is an urgent need for reforms, transparency, accountability and probity in the management of public resources.
Introduction Human capital is recognized as an agent of national development in all countries of the world. Providing education and health services to people is one of the major ways of improving the quality of human resources. Apart from being issues of social concern, both provide an economy with healthy trained human resources required for economic growth and development. According to Onakoya and Shomoye (2013) human capital is an important factor used in converting all resources to benefit mankind. Human capital development is strategic to the Scio-economic development of a nation and includes education, health, labour, employment and woman affairs. Investing in human capital development is therefore critical as it is targeted of ensuring that the nation’s human resources endowment is knowledgeable, skilled, productive and healthy to enable the optimal exploitation of other resources to produce growth and development. In a nutshell, investment in human capital development means expenditure on health, education, and social services in general but in a narrow sense, it is capable of measuring all expenditure on social services Enefiok and Sunday (2014) attest that Human resources development is a continuum, a continuing process from childhood to old age, and a must for any society or enterprise that wishes to survive under the complex challenges of a dynamic world. For the individual it should be a life-long process, because of the continuously changing environment to which one must also continuously adapt. Such development enables the persons involved to move vertically or laterally in the economic and social environment. Oboh, Rahmah, and Abu (2010) recognised that there can be no significant economic growth in any country without adequate human capital development. Over the years emphasis have been laid on accumulation of physical capital with as an impetus for attaining the desired level of development and growth in an economy without the recognition of the important role played by human capital

IAI Academic Conference Proceedings Virtual Conference, November & December, 2021 ________________________________________________________________________________________________________
21
in the development process. However, the inevitable role of human capital in recent times have revealed that people are the most valuable assets required by an economy to attain the desired level of output as human capital plays a vital role fabrication of physical capital. As such it is essential for human development that these assets be deployed sensibly. A defective incentive system can result in a waste of human resources, higher incidence of poverty and greater inequality in the distribution of income. It is not enough to use existing resources wisely, we must also add to the existing resources through human capital formation (Adenuga, 2002). Adebayo (2009) observed that it is the human resources of any nation, rather than its physical, capital and material resources, which ultimately determine the character and pace of its economic and social development. Human capital is thus the integral contributing factor that can enhance the desired level of growth and development in any economy. In Nigeria, the provision of education and healthcare by the government dates as far back as the colonial era, although these were not properly geared towards developing the human capacity in the country, but to serve as a means to ensure proper communication between the colonial masters and the Nigerian people. However, after the attainment of independence, the country witnessed greater involvement by indigenous government towards improving the human capacity through the provision of tertiary institutions and healthcare facilities for the people. However, both the educational and health sectors of the economy experienced negative changes. For the health sector, the introduction of the User-fee charges during the 1980s caused this negative trend. In the 1980s, Nigeria suffered a set-back due to the oil glut as world demand for oil dropped in the global market. The huge revenue from the oil sector which had contributed no less than 80% of the government's expenditure dropped drastically. This decrease adversely affected economic growth and macroeconomic indicators in the country, therefore in order to rescue the economy; Nigeria adopted the Structural Adjustment Programme (SAP). While adopting the programme, the government's involvement in the economy reduced, as there was a drop in the public health financing. The introduction of user-fee charges and other subsequent reductions in government health financing in Nigeria impacted negatively with the country's health care system. This increase in private health financing worsened the state of health system in the country as it ranked 187th position among 191 member states of the World Health Organization in the year 2000 (WHO Report, 2000). Health facilities at all levels were either dilapidated or non functional. In addition to this bad situation in the health sector, there were fake, sub-standard, adulterated and unregistered drugs in the Nigerian drug market, while the supplies of safe and affordable drugs and other health consumables were irregular (Ebigwei, 2005). Besides, the poor and deplorable state of the available health personnel only translates to inefficient and ineffective health care delivery (chukwunwike, 2005). Similarly, the economic crisis witnessed in Nigeria during the 1980s has affected the educational system. The Nigerian educational system was associated with the following characteristics: shortage of qualified teachers, increasing poor performance in national examinations like WAEC GCE and JAMB, insufficient number of schools to accommodate the growing population, inadequate funding of the schools, and poor remunerations of teachers in schools which have often resulted in strikes in the primary schools, secondary schools and universities. Between 2006 and 2011 average performance in technology inclined subjects such as Maths, Physics, Chemistry, Biology and Technical Drawing, including other subjects such as English, Accounting and Economics had poor performances less than 45% (NBS, 2011). Okojie (2003); and Abiodun & Wahab (2011) berated the quality of the educational sector in Nigeria and blamed its poor state as a regard of the government’s poor funding of the sector. The inadequate contributions of the Nigerian government to the education sector resulted to the incessant strike by Academic Staff Union of Universities (ASUU) and National Union of Teachers (NUT). From the foregoing, government has not contributed positively to its social obligations of improving human capital development in the country. Rather public attention has always been drawn to the earnings from the oil sector which has failed in the 1980s and in recent times as the economy was declared to be experiencing recession in 2016 by the National Bureau of Statistics. For an economy that seeks to guarantee sustainable economic growth and development, the role of human capital development is paramount. Hence this study seeks to investigate the impact of human development on economic growth in Nigeria. Research Objectives
The specific objectives of the study are to investigate: • The impact of investments on education on economic growth of Nigeria.
• The impact of investments on health on economic growth of Nigeria.
• The existence of causal relationship among education, health and economic growth.
Research Questions • Does investment in education have any significant impact on economic growth in Nigeria?
• Does investment in health have any effect on economic growth in Nigeria?
• Does investment in education and health have a causal relationship with economic growth in Nigeria?
IAI Academic Conference Proceedings Virtual Conference, November & December, 2021 ________________________________________________________________________________________________________
22
Hypotheses
To obtain empirical answers to the research questions, research hypotheses are developed. They are stated below in null form:
H01: Investment in education does not have a significant impact on economic growth of Nigeria. H02: Investment in health does not have a significant impact on economic growth of Nigeria. H03: Investment in education and health does not have a causal relationship with economic growth of Nigeria. Significance of the Study
This study is justified on the aforementioned challenges and shortcomings in the literature of human capital development and economic growth in Nigeria. It is imperative to produce a study that reconciles variations in results obtained from pat empirical studies on the subject matter. More so, past studies have shortfalls in literature review by not giving a thorough review on the role of government towards providing both recurrent and capital expenditures to health and education sectors. This study will give a detailed review on such issues. The essence of an improved study such as this is to guide towards apt policy making in the health and education sectors. Scope/Limitation of the Study This scope of the study will cover a period of 35 years from 1981 to 2015. The study will be restricted to investment in education proxied by government expenditure in education, investment in health proxied by government health expenditure, primary school enrollment and economic growth proxied by GDP. Theoretical Framework Lucas Theory of Human Capital and Economic Growth A notable theory that adequately captures investment in human capital is the Lucas theory of human capital by Lucas, (1988). Lucas posits that the average level of human capital in any economy determines the level of total factor productivity. The model considers human capital as the engine ‘of growth because human capital accumulation raises the productivity of both labour and physical capital. The proposition of the model is that people divide their time between work and training. This results in a trade-off because when taking on training, people give up part of their work income, but raises their future productivity, and therefore their future wages. Thus, the decisions concerning the accumulation of human capital depend on the dynamic features of the economy, which make it endogenous. Since human capital accumulation is the engine of growth, growth will itself be endogenous too. The model assumes that consumers’ welfare is given by an inter-temporal constant-elasticity of substitution utility function. This implies that the effectiveness of training, that is, the rate at which productivity rises as a result of one additional unit of training is exogenous. Generally, the model postulates that the higher the quality of training, the higher will be the increase in the marginal product of labour that follows training and hence the higher the future wage rate. Thus, the higher incentives to training results in greater growth rate of the economy. Similarly, the higher the consumer‘s preference for future consumption, the more will workers be willing to forsake present consumption to dedicate themselves to training. Therefore, the higher will be the rate of economic growth. The basic Lucas model is of the form; 𝑌 = 𝐴𝐾!(𝑢ℎ𝐿)"#!-------------------------------------------------------------------(1) Where Y, A, K and L are aggregate output, level of technology, capital stock and labour respectively. 0 < α < 1. The variable u is defined as the proportion of total labour time spent working, and h is what Lucas calls the stock of human capital. The production function can be rewritten in per-capita terms as; 𝑌 = 𝐴𝐾!(𝑢ℎ)"#!-------------------------------------------------------------------(2) k denotes the per capita stock of physical capital. Equation (2) is constant returns to scale production function in k and uh. According to this model, an increase in educational attainment assuming this is related to human capital, leads to an increase in output. Lucas’ model implies that human capital may increase even without any increase in educational attainment. Stevens and Weale (2004) noted that although the human capital of individuals may decay over time, there is a public body of knowledge which the accumulation of human capital can add to. The implication of this is that even when educational attainment has stopped increasing, human capital can continue to increase and thus continuing growth is possible. Model Specification In order to appropriately capture the effect of human capital development on economic growth in Nigeria, this study adapted the model from Oluwatobi and Ogunrinola (2011). Econometrically, the model is specified as follows: 𝑌 = 𝐴𝐾!(ℎ𝐿)$𝑈 When transformed into a log-linear form, we have, 𝑌 = 𝛼% +𝛼" ln K+𝛼&InhL + 𝜇
IAI Academic Conference Proceedings Virtual Conference, November & December, 2021 ________________________________________________________________________________________________________
23
𝑊ℎ𝑒𝑟𝑒 = 𝛼% = log𝐴𝑎𝑛𝑑 𝜇 = 𝑙𝑜𝑔𝑈 To achieve a robust result in the context of the Nigerian environment, the model would be modified to take an additional variable. This is government total expenditure on education and government expenditure on health, primary school enrollment. This additional variable is necessary because the development of the educational sector is one major way of achieving the human capital development. The Expanded model is stated as follows: Economic growth = f (GEEXP, GHEXP, PSE, GCE, U) InECO = 𝛼% +𝛼" ln GEEXP+𝛼&InGHEXP + 𝛼' ln PSE+𝛼(InGCE + 𝜇The econometric form of the model can be expressed as: Where: Economic Growth = Real gross domestic product; GEEXP = Government Expenditure on Education; GHEXP = Government Expenditure on health PSE = Primary school enrollment GCE = Government capital expenditure αi= Coefficients of variables or parameter to estimate in the regression; μ = Error term Expected Relationship The expected relationship between government education expenditure (GEEXP) and economic growth is positive (∝"> 0) The expected relationship between government health expenditure (GHEXP) and economic growth is positive (∝&> 0) The expected relationship between primary school enrollment (PSE) and economic growth is positive (∝'> 0) The expected relationship between government capital expenditure (GCE) and economic growth is positive (∝(> 0) Estimation Technique The ordinary Least Square estimation technique will be used to examine the impact of education expenditure on economic growth in Nigeria. The use of ordinary least square is justified because of its distinguishing attributes. It is said to produce a best linear unbiased estimate. Also, the ordinary Least Square estimation technique will be used to examine the impact of government health expenditure on economic growth in Nigeria. The causal relationship between education expenditure and economic growth will be determined using the granger causality test. The researcher will thus run the regression exercise using the error correlation approach and Granger causality test. The estimated parameters are subjected to evaluation by using other test: student t-statistic test and F-statistic test. While, the overall stability of the specified empirical model is tested using multiple co-efficient of determination (R2), adjusted R2 and Durbin-Watson test. In estimating the multiple regression model for the unrestricted Ordinary Least Square (OLS) is used. Before estimation, the research will perform a stationarity (unit root) test that excludes the intercept and trend. Data Analysis Presentation of Data The data used for analysis were collected from secondary sources. Data used for the analysis covered a period of thirty five (35) years from 1981-2015. The time series data employed for the estimation of the empirical model specified to investigate the role of human capital development and economic growth from 1981-2015 is presented in appendix 1. Unit Root Test The data used for analysis is based on time series data assumes that most time series are stationary. But it is now a well-known fact that most time series are non-stationary (Dickey-Fuller, 1979). In such a case, applying standard regression models to non-stationary data is inappropriate because of the possibility of obtaining spurious relationship, which makes hypothetical test results unreliable. Hence, to avoid a spurious relationship, detecting the stationary or non-stationary of time series is crucial. To test for a unit root in each series, the researcher employs the augmented Dickey-Fuller (ADF) test. The result of ADF test is given as follows;
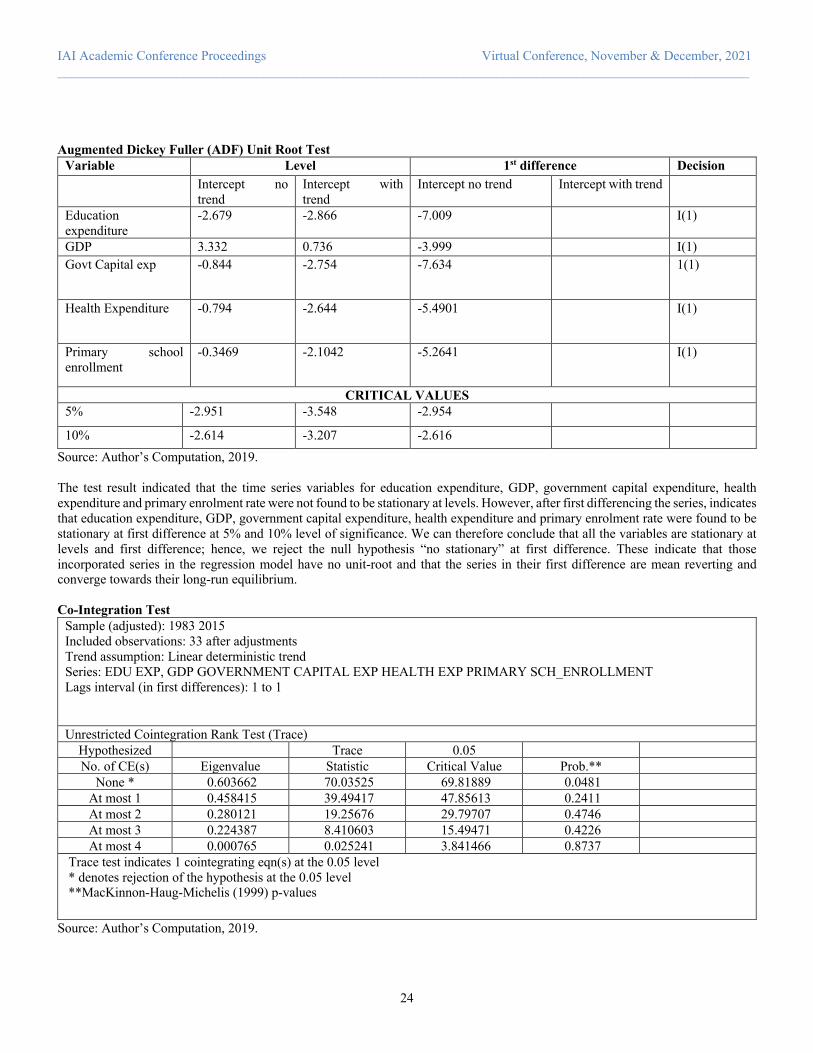
IAI Academic Conference Proceedings Virtual Conference, November & December, 2021 ________________________________________________________________________________________________________
24
Augmented Dickey Fuller (ADF) Unit Root Test
Variable Level 1st difference Decision Intercept no
trend Intercept with trend
Intercept no trend Intercept with trend
Education expenditure
-2.679 -2.866 -7.009
I(1)
GDP 3.332 0.736 -3.999
I(1) Govt Capital exp -0.844 -2.754 -7.634
1(1)
Health Expenditure -0.794 -2.644 -5.4901
I(1)
Primary school enrollment
-0.3469 -2.1042 -5.2641
I(1)
CRITICAL VALUES 5% -2.951 -3.548 -2.954
10% -2.614 -3.207 -2.616
Source: Author’s Computation, 2019. The test result indicated that the time series variables for education expenditure, GDP, government capital expenditure, health expenditure and primary enrolment rate were not found to be stationary at levels. However, after first differencing the series, indicates that education expenditure, GDP, government capital expenditure, health expenditure and primary enrolment rate were found to be stationary at first difference at 5% and 10% level of significance. We can therefore conclude that all the variables are stationary at levels and first difference; hence, we reject the null hypothesis “no stationary” at first difference. These indicate that those incorporated series in the regression model have no unit-root and that the series in their first difference are mean reverting and converge towards their long-run equilibrium. Co-Integration Test
Sample (adjusted): 1983 2015 Included observations: 33 after adjustments Trend assumption: Linear deterministic trend Series: EDU EXP, GDP GOVERNMENT CAPITAL EXP HEALTH EXP PRIMARY SCH_ENROLLMENT Lags interval (in first differences): 1 to 1
Unrestricted Cointegration Rank Test (Trace) Hypothesized Trace 0.05 No. of CE(s) Eigenvalue Statistic Critical Value Prob.**
None * 0.603662 70.03525 69.81889 0.0481 At most 1 0.458415 39.49417 47.85613 0.2411 At most 2 0.280121 19.25676 29.79707 0.4746 At most 3 0.224387 8.410603 15.49471 0.4226 At most 4 0.000765 0.025241 3.841466 0.8737
Trace test indicates 1 cointegrating eqn(s) at the 0.05 level * denotes rejection of the hypothesis at the 0.05 level **MacKinnon-Haug-Michelis (1999) p-values
Source: Author’s Computation, 2019.

IAI Academic Conference Proceedings Virtual Conference, November & December, 2021 ________________________________________________________________________________________________________
25
The co integration test result revealed that: the trace statistic indicates that there exists one co-integrating equations at 5% significance level. Hence, there does exist long-run equilibrium relationship exists between the variables considered in the study and that there exists co-integrating vector.
Unrestricted Cointegration Rank Test (Trace) Hypothesized Trace 0.05 No. of CE(s) Eigenvalue Statistic Critical Value Prob.**
None * 0.603662 70.03525 69.81889 0.0481 At most 1 0.458415 39.49417 47.85613 0.2411 At most 2 0.280121 19.25676 29.79707 0.4746 At most 3 0.224387 8.410603 15.49471 0.4226 At most 4 0.000765 0.025241 3.841466 0.8737
Trace test indicates 1 cointegrating eqn(s) at the 0.05 level * denotes rejection of the hypothesis at the 0.05 level **MacKinnon-Haug-Michelis (1999) p-values
Source: Author’s Computation, 2019. Both trace statistic and Maximum-eigenvalue statistic indicates that there is one co-integrating equation at 5% significance level. Hence, there is long-run equilibrium relationship between the variables and that there exist co-integrating vector. Test of Hypotheses Regression Analysis
Dependent Variable: GDP Method: Least Squares Sample (adjusted): 1982 2015 Included observations: 34 after adjustments Variable Coefficient Std. Error t-Statistic Prob. C -18268.63 11275.76 -1.620168 0.1160 EDUEXP -0.030218 0.005348 -5.650588 0.0000 HEALTHEXP 0.085982 0.010953 7.849825 0.0000 PRIMARY SCH ENROLLMENT 0.001299 0.000754 1.722504 0.0956
U(-1) 0.961653 0.105179 9.142974 0.0000 R-squared 0.925945 Mean dependent var 18348.71 Adjusted R-squared 0.915730 S.D. dependent var 28342.31 S.E. of regression 8227.552 Akaike info criterion 21.00342 Sum squared resid 1.96E+09 Schwarz criterion 21.22788 Log likelihood -352.0581 Hannan-Quinn criter. 21.07997 F-statistic 90.65007 Durbin-Watson stat 1.853177 Prob(F-statistic) 0.000000
Test for Causal Relationship between Education, Health and Economic Growth in Nigeria Granger Causality Tests
NO CAUSALITY BI-CASUALITY UNI DIRECTIONAL CAUSALITY GDP and education expenditure None Primary School Enrollment to education
expenditure Education expenditure and HEALTH expenditure
Primary School Enrollment to health expenditure
Health Expenditure and GDP Discussion of Findings

IAI Academic Conference Proceedings Virtual Conference, November & December, 2021 ________________________________________________________________________________________________________
26
The analysis revealed that; i. Education expenditure is negatively but significantly impacts economic growth proxy by GDP. Its value of 0.0302 implies that while keeping constant health expenditure and primary school enrollment a percentage increase in education expenditure brought about 3.02% increase in economic growth proxy by GDP. ii. Health expenditure is positively and significantly related economic growth proxy by GDP. A percentage increase in health expenditure causes economic growth proxy by GDP to rise by almost 8.6% while keeping other explanatory variables constant. It thus shows that health expenditure is very important in the quest to raise economic growth proxy by GDP. iii. Human capital index proxied by primary school enrolment positively and significantly impacts the economic growth proxy by GDP as a percentage increase in Human capital index proxied by primary school enrolment leads to 0.13% increase in the economic growth proxy by GDP while holding other variable constant. iv. The R-squared value of 0.925 implies that over 92.5% variation in economic growth proxy by GDP is explained by the explanatory variables in the model. Even after removing the effect of insignificant estimators, the adjusted R-squared value of 0.916 implies that about 91.6% variation in economic growth proxy by GDP is still explained in the model. v. There exist a causal relationship between Primary School Enrollment and education expenditure. Granger causality runs one-way from Primary School Enrollment to education expenditure and not the other way. This further affirms that human capital index proxied by primary enrolment rate is a relevant predictor of economic growth in the Nigerian context. vi. There exist a causal relationship between Primary School Enrollment and health expenditure. Granger causality runs one-way from Primary School Enrollment to health expenditure and not the other way. This further affirms that human capital index proxied by primary enrolment rate is a relevant predictor of economic growth in the Nigerian context. Conclusion and Recommendation It is no gainsaying that economic performance in Nigeria has not been encouraging. This can be largely attributed to the slow pace of human capital development experienced in the country. A defective incentive system can result in a waste of human resources, higher incidence of poverty and greater inequality in the distribution of income. It is not enough to use existing resources wisely, there is need to also add to the existing resources through human capital formation. The finding in this research clearly spelt out that the role of investment in human capital on economic growth cannot be overemphasized, as Human capital is considered as the most valuable asset and needs to be mobilized. As such the role of human capital development cannot be emphasized. The essence of human resources development becomes one of ensuring that the workforce is continuously adapted for, and upgraded to meet, the new challenge of its total environment. This is because the economy is a dynamic entity, which is constantly changing in response to various stimuli such as introduction and discoveries of new products or techniques of production. Therefore, those already on the job require retraining, reorientation or adaptation to meet the new challenges. The persistence of many of the problems in spite of the various policy formulation and responses points to the need for a more responsive, functional and qualitative educational system. To contribute significantly to economic growth and development, education must be of high quality and also meet the skill-demand needs of the economy; therefore, the Nigerian government should increase spending on education as well as incentives to meet up with the UNESCO budget recommendation of 26%. Government should provide the enabling environment by ensuring macroeconomic stability that will encourage increased investment in human capital by the private sector. To increase physical capital formation in the education sector, Government should increase spending on social and economic infrastructure in order to enhance the efficiency of the labour force and enhance productivity, and by implication, economic growth. The efforts of Government in increasing primary school enrolment through the free compulsory Universal Basic Education should be sustained and made free up to the end of the junior secondary school.
REFERENCES Adelakun O.J (2011). Human Capital Development and Economic Growth in Nigeria. European Journal of Business and
Management. 3(9);29-38 Danmola R.A, Olateju A.O and Abba M.K(2013). Nexus between public expenditure and economic growth by testing Wagner’s law
time series: Evidence from Nigeria. International Journal of Development and Sustainability.2(4); 2383-2395 Jaiyeoba, S.V (2015). Human Capital Investment and Economic Growth in Nigeria. An International Multidisciplinary Journal,
Ethiopia. 9(1);30-46. Hanganipai, N, Mangena M and Yewukai, R (2014). The Impact of Government Spending on Economic Growth: Case South Africa.
Mediterranean Journal of Social Sciences.5(1);109-118 Ifeoma C. M; Emmanuel I. M; Jonathan E. O and Chizoba H. I (2013). Human Capital Development and Economic Growth in
Nigeria. Journal of Economics and Sustainable Development.4(18);48-52 Maku, O E (2014). Public Expenditure and Economic Growth Nexus in Nigeria: A Time Series Analysis. Public Policy and
Administration Research.4(7);97-109
IAI Academic Conference Proceedings Virtual Conference, November & December, 2021 ________________________________________________________________________________________________________
27
Mutiu A.O and Olusijibomi A (2013). Public expenditure and economic growth nexus: Further evidence from Nigeria. Journal of Economics and International Finance. 5(4);146-154
Njoku J.U and Onyegbula J.C (2017). Human Capital Development as a Strategy for Sustainable Development in the Nigerian Education System. An international multi-disciplinary journal, Ethiopia.11(2);178-189
Robinson M.O, Eravwoke K.E and Ukavwe A (2014). Government Expenditures and Economic Growth: The Nigerian Experience. Mediterranean Journal of Social Sciences.5(10);89-94
Taiwo A S and Agbatogun K K (2011). Government expenditure in Nigeria: a sine qua non for economic growth and development. JORIND 9(2);155-162
Wakeel and Alani (2013). Human capital development and economic growth: empirical evidence from Nigeria. Asian Economic and Financial Review 2(7):813-827
Zainab A and Anas I K (2017). An Empirical Analysis of the Causal Relationship between Government Spending and Economic Growth in Nigeria (1985-2015). International Journal of Innovative Research in Social Sciences & Strategic Management Techniques.4 (1); 1-12

IAI Academic Conference Proceedings Virtual Conference, November & December, 2021 ________________________________________________________________________________________________________
28
Defining and measuring the inflation persistence
Lenka Vyrostková1
1*Department of Economics, Faculty of Economics, Technical University of Košice, Slovakia
*Corresponding Author: e-mail: [email protected]
Abstract
It is in the interest of central banks to analyse inflation persistence in order to improve inflation forecasts and respond to inflation shocks, as various macroeconomic shocks, including changes in economic activity or production costs, may temporarily deviate inflation from central bank inflation target. For this reason, an understanding of the process of inflation formation, in particular the rate of inflation, is crucial for a central bank whose policy is focused on price stability. Inflation persistence then refers to the tendency of inflation to slowly approach its long-term value in response to these shocks. While the inflation persistence is generally well documented in the empirical literature, fundamental features of the recent crisis and post-crisis periods changed the response patterns of inflation to the various types of macroeconomic shocks. The main objective of the paper is to provide a summary of theoretical and empirical evidence on the inflation persistence and to show various econometric models and methods that are used to measure inflation persistence. Comprehensive review of the literature enables us to understand the key features of inflation and a variety of the baseline aspects that central banks should consider when shaping the framework for the stability of inflation. Keywords: inflation persistence, monetary policy, exchange rate regime, economic shocks
1. Introduction
Inflation is a well-known economic phenomenon reported and corrected by monetary policy, which indicates a country's inflation target. In the short term, various macroeconomic shocks, including changes in the economic activity of the economy, may cause inflation to deviate from its steady state. This is one of the profound meanings of why it is important to understand the process of inflation and the rate of convergence of inflation to a steady state. The speed of inflation convergence to its steady state has an impact on monetary policy, the associated price stability and the country's performance. The impetus for examining inflation persistence is the economic crisis, which has come with a change in the conditions for conducting monetary policy in countries.
The crisis, which caused a decline in gross domestic product, and increase in unemployment also brought with it an increase in inflation. In an economy with deflationary pressures coupled with near-zero inflation and a rise in gross domestic product and thus a recovery in economic growth, central banks responded to the price stability outlook by adopting a number of non-standard monetary policy measures, including purchases of assets and government bonds on the secondary market, with an aim to improve price stability and the efficiency of the monetary policy transmission mechanism. It is the conditions with low levels of inflation and also interest rates, which are the reason for the adoption of unconventional approaches by central banks, that require a change in the approach to the conduct of monetary policy. In this article, we examine the persistence of inflation, which will allow us to know more about the context and structural features of inflation in the euro area countries. Meller and Nautz (2012) analysed the persistence of inflation in euro area countries before and after the third stage of Economic and Monetary Union - the adoption of the single currency. Central banks are analysing the persistence of inflation in 2006 in order to improve inflation forecasts and assess the dynamic response to inflation shocks. A certain degree of inflation persistence has a strong impact on the conduct of monetary policy. This is also the reason why the degree of inflation persistence is increasingly used as an indicator of a country's monetary policy. This degree of persistence is defined as the rate at which inflation approaches equilibrium after a certain shock to a country's monetary policy (Willis, 2003). If the inflation persistence is high, then the shocks that could hinder the controllability of inflation are of a long-term nature. Conversely, if the inflation persistence is low, the management of inflation expectations is more effective, and inflation can be achieved more quickly in line with the target. However, the degree of inflation persistence may not be exogenous. Monetary theory emphasizes that reduced inflation persistence may also be the result of better monetary policy and inflation expectations (Benati, 2008).
Our article is divided into two main parts, the first of which maps the current state of inflation persistence. We deal with the various definition of inflation persistence and its distribution. In the individual subchapters, we have provided an overview of studies examining the persistence of inflation during different phases of the economic cycle, different exchange rate regimes and differently developed countries. Other authors examined the relationship between price stability and inflation persistence and examined
IAI Academic Conference Proceedings Virtual Conference, November & December, 2021 ________________________________________________________________________________________________________
29
persistence based on inflation expectations. We devoted the last subchapter of the first part to unemployment and inflation persistence. In the second part of our article, we provide an overview of the measurement of the examined inflation persistence, focusing on individual methods and models. 2. Defining inflation persistence
As mentioned in the introduction, it is in the interest of central banks to analyse inflation persistence in order to improve inflation forecasts and respond to inflation shocks, as various macroeconomic shocks, including changes in economic activity or production costs, may temporarily deviate inflation from central bank inflation target. For this reason, an understanding of the process of inflation formation, in particular the rate of inflation, is crucial for a central bank whose policy is focused on price stability. Inflation persistence then refers to the tendency of inflation to slowly approach its long-term value in response to these shocks. Willis (2003) defines the degree of persistence as the rate at which inflation approaches equilibrium after a certain monetary policy shock. Fuhrer (2010) defines two groups of inflation persistence - reduced and structural. While the reduced form of inflation persistence does not provide us with its sources and causes, in estimating the size of the structural form of persistence, it is important and desirable to know the sources of persistence, such as various exogenous shocks. Angeloni (2006) stated that there is a so-called internal and external inflation persistence. Internal persistence is called the response to changes in wage and price setting, assuming a slow response of inflation to these changes, as wages and prices are seldom adjusted, so deviations in response to this change will be included in the inflation rate over several consecutive periods. The indexation of prices and wages, which introduces a retrospective view of inflation, also contributes to the internal persistence of inflation. The external inflation persistence is called the reaction of inflation to various macroeconomic shocks, for example, there are persistent deviations of output from its potential level. Fuhrer (2005) speaks of external inflation persistence as the so-called inherited. The source of inherited inflation persistence is the output gap, i.e. the difference between potential and real output. According to Fuhrer, it is the New Keynesian Phillips curve that captures and reveals that inflation must "inherit" this persistence. As the second source of inflation persistence, similar to Angeloni (2006), the author cites the indexation of wages and prices and calls the response to these changes’ external inflation persistence. Fuhrer (2005) concluded that the persistence of all inflation persistence is dominated by internal persistence and inherited persistence is only a very small part of persistence as such. 2.1 Inflation persistence during different phases of the economic cycle
As is well known, the main goal of the European Central Bank is to achieve price stability. High inflation persistence in the post-World War II period was revealed by studies by Nelson and Plossere (1982), Fuhrer and Moore (1995) and Pivetta and Reis (2004). These authors emphasized that to achieve the inflation target, the central bank should respond much more than with a low inflation persistence. Caporin and Gupta (2016) examined the persistence of inflation during the recessions and expansions of the United States economy. They used monthly data from 1920 to 2014 for the research, examining the persistence of inflation and structural changes in the economy using a heteroskedastic model with a coefficient distinguishing the period of expansion and recession. Research has shown that inflation persistence changes during structural changes in the economy. The research by Caporino and Gupta (2016) concludes that the inflation persistence is higher during the expansion period than during the recession. This conclusion is also beneficial for the political direction of the country. Authors Gupta, Jooste, and Ranjbar (2017) examined core and headline inflation and its persistence during the inflation targeting period in South Africa using a quantile structural break test on inflation data from 1975 to 2015. Using the model, the authors conclude that during inflation targeting, inflation persistence is lowest in South Africa, regardless of the inflation rate. The persistence in core inflation, which quantifies the rate of growth of the price level on an incomplete consumer basket - adjusted for the effect of regulated prices, changes in indirect taxes and subsidies, is constant throughout the period under review. Thus, there is a difference between the estimated persistence in core inflation and headline inflation. Overall inflation persistence is rising due to higher quantiles. Fluctuations in energy and food prices can thus destabilize headline inflation. 2.2 Inflation persistence during different exchange rate regimes, in different developed countries un the world
Alogoskoufis (1992) examined the inflation persistence, the differences in inflation during the period of different monetary regimes in OECD countries in the period after the Second World War, based on the model of the inflation process. He concluded that adjusting to price shocks could lead to higher inflation, but a mild accommodative monetary policy leads to low inflation. However, accommodative monetary policy should not be applied for a long period of time, as this could lead to negative and undesirable results.
Further empirical research has shown that during the 1980s and 1990s there was a rapid and strong convergence in price differences between euro area countries, especially in countries with higher inflation rates in the past. According to Björksten and Syrjänen (2000), the convergence of inflation rates stopped in the mid-1990s, raising concerns that a single monetary policy was not adequate for several economies. These were expected to be unjustified and soon to be rejected by the adoption of the single currency - by removing market segmentation, increasing competition in the market. However, the ECB itself (2004) stated that inflation disparities
IAI Academic Conference Proceedings Virtual Conference, November & December, 2021 ________________________________________________________________________________________________________
30
between countries are a natural phenomenon and that monetary policy alone cannot influence them. According to the ECB (2003), the persistence of inflation gaps within the countries of the European Monetary Union is one of the arguments why the inflation target is officially set at a value less than or close to two percent in the medium term.
Kočenda and Papell (1997) examined the consequences of convergence of inflation rates in the European Union. The research also focused on whether the Exchange Rate Mechanism contributed to accelerating the convergence of inflation in its member countries. Not all economic theories support the idea that a change in the nominal exchange rate regime will have a real effect. Baxter and Stockman (1989) found that the real exchange rate is the only macroeconomic aggregate that systematically depends on the exchange rate system. They found no important evidence that the behavior of the economic cycle of real output, consumption, trade flows and government systematically depend on the type of nominal exchange rate regime. Therefore, it is not clear whether the exchange rate should help to reduce inflation within the group of countries participating in the ERM and lead to inflationary convergence over time. Anderton (1997), Kočenda and Papell (1997) investigated inflation persistence in ERM member and non-member countries. Anderton (1997) used the unit-root test and the F-test, concluding that deflationary policies could lead to a reduction in the level of inflation, but that ERM membership was not sufficient to achieve the inflation target. One of the conclusions of Kočenda and Papell (1997) based on the sensitivity analysis is that the process of inflation persistence was not significantly affected by the crisis in the ERM during 1992 to 1993.
Alogoskoufis and Smith (1991) examined inflation persistence during the variable and fixed exchange rate periods. For the countries of Great Britain and the USA, they applied an autoregressive estimate of the coefficients for the annual change in the gross domestic product deflator. A simple regression suggests that with floating exchange rates, inflation is more persistent, and it is more likely that monetary policy will adjust to the inflation shock compared to a period with a fixed exchange rate. A year later, Alogoskoufis (1992) applied the same method to OECD countries, confirming the previous conclusion. Like Alogoskoufis (1992), Obstfeld (1995) examined the persistence of inflation during a floating and fixed exchange rate, for example in twelve OECD countries. The conclusion of his research is that during the period with a floating exchange rate the inflation persistence is higher than during the period with a fixed exchange rate. The exception was the United States, in which the Bretton Woods monetary system was based, based on fixed exchange rates. Jo-Wei Wu and Jyh-Lin Wu (2018), like the above-mentioned authors, examined the persistence of inflation during periods of variable and fixed exchange rates. They found that inflation persistence depends on the exchange rate regime, not internal inflation persistence but partly external. In their article, the authors used unit root panel tests - unit root regression and a dynamic panel model.
In their research, Canarella and Miller (2017) examined the persistence of inflation in various developed and emerging countries in comparison with the United States economy and the German economy. Using fractional and cointegration methods, they came to the conclusion that the three developed countries examined (Canada, Sweden and the United Kingdom) have a common inflation persistence compared to the American and German economies, and are therefore fractionally integrated. In the case of developing countries (Chile, Israel and Mexico), it is not possible to speak of the same inflation persistence with the American and German economies. Gajewski (2018) examined the persistence of inflation on the quarterly data of the CPI of Poland as a representative of the region of Central and Eastern Europe. The data series of the CPI index used were at the NUTS-2 level (level of basic regions) for the years 2015 to 2016. The author of the research used unit root tests (autoregressive model and dynamic Phillis curve). The results of the panel regression pointed to the fact that the inflation persistence is higher in the eastern (backward) part of Poland than in the western part of the country. The visible difference between housing, transport, health and other categories also points to the fact that inflation persistence depends on the response of current inflation to shocks and shocks from the past. It is these shocks and the reaction to them that divide the country of Poland as a representative of the CEE region into an eastern - backward and western - more developed part. Levin and Piger (2002) are other authors examining inflation persistence in various developed countries. In their study, they focused on a group of twelve industrial economies (Australia, Canada, France, Germany, Italy, Japan, the Netherlands, New Zealand, Sweden, Switzerland, the United Kingdom and the USA) and characterized the behavior of inflation dynamics in these countries using classical and Bayesian econometric methods. The analysis focuses on the period from 1984 to 2003 using four basic price indicators: the GDP deflator, the personal consumption expenditure price index, the consumer price index, and the basic consumer price index. The results of econometric models suggest that high inflation persistence is not an internal characteristic of the studied industrialized countries. The hypothesis was rejected at a 95 percent confidence interval for both methods used.
2.3 The combination of price stability and inflation persistence
A more recent study by Kočenda and Varga (2017) was to measure the combination of price stability and inflation persistence in 68 countries around the world. The authors used four methods of measuring inflation persistence and a time-varying estimation technique. The conclusion of this study is that there are structural pauses of inflation persistence as endogeneity in policy strategies with respect to persistence as such. Kanellopoulos and Koutroulis (2016) examined the persistence of inflation in euro area countries using a dynamic nonlinear panel model. They found that the degree of inflation persistence depends on whether the inflation rate is
IAI Academic Conference Proceedings Virtual Conference, November & December, 2021 ________________________________________________________________________________________________________
31
much higher, lower, or negative in relation to the European Central Bank's inflation target. Stabilization policy in the short term will have longer-term effects. 2.4 Inflation persistence based on the inflation expectations
The authors Rodriguez-Fuentes, Olivera-Herrera and Padrón-Marero (2004) tried to outline the conclusions of the European Central Bank's application of monetary policy. In their study, they empirically examined the rate of inflation and its persistence in euro area countries compared to the Spanish and some US regions during 1980-2002. The fulfilment of the Maastricht criteria and monetary unification in reducing inflation disparities can play an important role in this trend. Empirical evidence has revealed the existence of high inflation persistence in euro area countries during the 1980s and 1990s. In addition, the persistence is much higher than in the Spanish and United States regions. The causes are not very clear. However, it is important to note that this high estimated persistence should be interpreted as a measure of the unconditional persistence of inflation, as the literature does not take into account that the inflation-generating process is composed of several different components, each with its own persistence. Therefore, there are various factors on which measured historical inflation is based. Changes in the monetary policy strategy of industrialized economies have led to changes in the inflation targeting of central banks, which have introduced a non-stationary component of inflation. The first is information asymmetry and imperfect credibility, which can cause private agents' perceptions of the central bank's inflation target to differ from the actual inflation target (Dossche and Everaert, 2005). Angeloni (2006) called these deviations persistence based on expectations. 2.5 Inflation persistence and unemployment persistence
One of the other major authors and contributors to the study of inflation persistence is Amano (2007). In this work, he uses the New Keynesian Phillips curve and contributes to the knowledge that there is a positive relationship between the rate of inflation and demand, and there is a negative relationship between the rate of inflation and the unemployment rate. Similarly, the relationship between inflation and unemployment was examined by Taylor (1980) with his structural model and Cogley and Sargent (2001) by a nonlinear stochastic model with US time series. The knowledge of Amano's analysis (2007) is also the optimal strategy, which assumes that inflation is white noise, regardless of its true persistence. Thus, the monetary authority's best strategy for uncertainty about inflation is to underestimate the degree of persistence. 3. Measurement of inflation persistence
Various econometric models and methods are used to measure inflation persistence. The structural time series model considers possible changes in central bank inflation targeting, expectations-based persistence, internal persistence and external persistence. The structural time series model uses two approaches – one-sided and multidimensional. The one-sided approach is based only on time series of inflation data (usually the HICP index). The aim of a simple autoregressive model is to define and assess the persistence of inflation. Nelson and Plosser (1982), Fuhrer and Moore (1995), Pivetta and Reis (2004), Dossche and Everaert (2005) and others have measured historical inflation. Their research consisted of estimating unilateral autoregressive time series models and measuring persistence as the sum of estimated autoregressive coefficients. The multidimensional structural econometric model also includes real output data and the central bank's key interest rate, with its main task being to explain inflation behavior.
The basic structural model is defined as: , (1) , (2) , (3)
where is inflation targeting of central bank, is the perceived inflation target, is observed inflation rate and is the output gap - the percentage deviation of real output from potential output. is the delay operator, so and are the same independent processes with zero mean white noise.
In equation 1, determines the changes in the bank's inflation targeting that are considered permanent. These are changes representing changes in the central bank's preferences over alternative values of inflation or an implicit change in the central bank's inflation target created by the misconception of the natural rate of various real variables. These changes are unlikely to translate into inflation expectations. Castelnuovo et al. (2003) present data on inflation expectations over a long period of time. They suggest that, as a result of changes in monetary policy, the convergence towards a new equilibrium is evolving over time. In the literature, this is often attributed to asymmetric information and signal extraction, false information, or imperfect credibility. According to Kozicki and Tinsley (2003), the source of information asymmetry may be a lack of information about the bank's inflation target or the uncertainty of central bank inflation preferences over real activity (Cukierman and Meltzer, 1986; Tetlow and Muehlen, 2001). When private agents obtain information on the central bank's inflation target under the monetary policy rule, the signal-to-noise ratio rule determines the uncertainty that private agents face in allocating temporary and permanent political shocks, and thus the speed with which they recognize permanent policy shocks. Although the central bank will set a new inflation target, it will also incorporate the

IAI Academic Conference Proceedings Virtual Conference, November & December, 2021 ________________________________________________________________________________________________________
32
long-term expectations of private agents into this target. Private agents must create expectations regarding the inflation target , so Equation 2 expresses the perceived inflation target , which expresses the beliefs of private agents about the central bank's inflation target . The expectation variable in Equation 2 is expressed as , which represents the weighted average and .
Equation 3 represents the Phillips curve, which indicates the observed rate of inflation πt to the perceived inflation target , q delays inflation and the production gap . The perceived inflation target is in line with the inflation expectations of private agents, which serve as a medium-term inflation anchor. Economic cycle shocks are reflected in the output gap, as well as cost shocks, measured . The adjustment of in response to the reduction of cost shocks is measured as the sum of the AR coefficients . This is an internal inflation persistence, which is probably related to the price and wage setting mechanism. The adjustment of in response to shocks in the business cycle is also determined by the persistence of the output gap in response to shocks in the business cycle. This is the so-called external inflation persistence (Dossche and Everaert, 2005).
The New Keynesian Phillips Curve (NKPC) is also used many times in studies analyzing inflation persistence. In his study, Amano (2007) examines the interaction between monetary policy and structural inflation persistence, and his work contributes to the question of how monetary policy should respond to persistent inflation. The analysis assumes that the process of generating data for aggregate inflation can be represented as the New Keynesian Phillips curve (NKPC) with inertia, which is present in many empirical dynamic models of general equilibrium. In these unfavorable price models, there is a positive relationship between the rate of inflation and demand, as well as a negative relationship between the rate of inflation and the unemployment rate. This New Keynesian Phillips curve suggests that rising inflation can reduce unemployment not only temporarily but also permanently. After adjusting the tiered pricing model to allow individual prices to be indexed to a recent aggregate price index, the NKPC uses the following model:
(4) where:
β and determine the effect of quasi-differentiated expected inflation and the output gap on inflation, 0 < ρ < 1 indicates the degree of indexation or structural persistence, Et the expectation operator is conditioned by period information t, yt is a measure of the output gap, vt is a shock caused by costs.
Amana (2007) assumes that the monetary policy authority believes that inflation is based on the equation: (5) where: 0 1 is an estimate ρ of the monetary policy authority. The difference between actual and perceived inflation is given by: a .
δ is the degree of misunderstanding of inflation persistence (equal to ρ - ), while δ < 0, means that the monetary policy authority has underestimated the true degree of inertia of inflation; δ > 0 indicates overestimation and if δ = 0, then the monetary policy authority's estimate was accurate.
Furthermore, the thesis specifies the socio-theoretical loss function of the central bank as: (6) where: is the relative weight of the output gap deviation.
The model assumes that the central bank controls the nominal values and the aim is to minimize the stated objective function. The challenge for policy is to choose the right time to use monetary policy instruments and to minimize objective function. The central bank is unable to influence future behavior and considers the private sector. This means that there are no endogenous state variables, so a political problem simplifies the sequence of static optimization problems. The degree to which the monetary authority changes the level of the output gap is indirectly related to the relative weight of output deviations from their trend and is directly related to the response of inflation to the output gap and the degree of perceived inflation persistence. The analysis conclusion is the optimal strategy with an assumption, that inflation is white noise regardless of its true persistence. Thus, the monetary authority's best strategy for uncertainty about inflation is to underestimate the degree of persistence.
As we stated above, economic literature is not unanimous about the definition of inflation persistence. Batini and Nelson (2001) in their research distinguished between three types of persistence: positive serial correlation in inflation, lags between systematic monetary policy actions and their effect on inflation and lagged responses of inflation to non-systematic policy actions, i.e. policy shocks. The first type of persistence is a reduced-form property of inflation that manifests the underlying pricing process, the conduct of monetary policy, and the expectations formation process of price-setting agents. This type of persistence has been documented in post-war data for various countries. Second type of persistence refers to the number of periods it takes for a change in monetary settings to have its maximum effect on inflation. Type 3 of inflation persistence relates to the number of lags it takes for inflation to respond to a policy shock. Current practice in model evaluation does not attach much weight to type 2 persistence. Attention is mainly focused on type 1 or type 3 persistence (Batini, 2006). 4. Conclusions

IAI Academic Conference Proceedings Virtual Conference, November & December, 2021 ________________________________________________________________________________________________________
33
Comprehensive review of the literature enables us to understand the key features of inflation and helps us in our further analysis. Our article consists of two main parts. The aim of the first part of article was to create a comprehensive review of the theoretical and empirical literature dealing with persistence in inflation. In the article we defined inflation persistence from different perspectives. In the second part of the article we show the various econometric models and methods that are used to measure inflation persistence. An overview of the literature and methods used to measure inflation persistence will allow us to further focus on inflation persistence in euro area countries, examine the rate of convergence of inflation to a steady state, and assess the effectiveness of monetary policy in relation to price stability in euro area countries.
Supported by the grant No. 1/0793/19 of the Grant Agency VEGA. References ALOGOSKOUFIS, George S. Monetary accommodation, exchange rate regimes and inflation persistence. The Economic Journal,
1992, 102.412: 461-480. ALOGOSKOUFIS, George S.; SMITH, Ron. The Phillips curve, the persistence of inflation, and the Lucas critique: Evidence from
exchange-rate regimes. The American Economic Review, 1991, 1254-1275. ANDERTON, Robert. Did the underlying behavior of inflation change in the 1980s? A study of 17 countries. Weltwirtschaftliches
Archiv, 1997, 133.1: 22-38. ANGELONI, Ignazio, et al. New evidence on inflation persistence and price stickiness in the euro area: implications for macro
modeling. Journal of the European Economic Association, 2006, 4.2-3: 562-574. AMANO, Robert. Inflation persistence and monetary policy: A simple result. Economics Letters, 2007, 94.1: 26-31. BATINI, Nicoletta. Euro area inflation persistence. Empirical Economics, 2006, 31.4: 977-1002. BATINI, Nicoletta; NELSON, Edward. The lag from monetary policy actions to inflation: Friedman revisited. International
Finance, 2001, 4.3: 381-400. BAXTER, Marianne; STOCKMAN, Alan C. Business cycles and the exchange-rate regime: some international evidence. Journal
of monetary Economics, 1989, 23.3: 377-400. BENATI, Luca. Investigating inflation persistence across monetary regimes. The Quarterly Journal of Economics, 2008, 123.3:
1005-1060. BJÖRKSTEN, Nils; SYRJÄNEN, Miika. How problematic are internal euro area differences?. 2000. CANARELLA, Giorgio; MILLER, Stephen M. Inflation targeting and inflation persistence: New evidence from fractional
integration and cointegration. Journal of Economics and Business, 2017, 92: 45-62. CAPORIN, Massimiliano; GUPTA, Rangan. Time-varying persistence in US inflation. Empirical Economics, 2017, 53.2: 423-439. CASTELNUOVO, Efrem; NICOLETTI ALTIMARI, Sergio; RODRIGUEZ-PALENZUELA, Diego. Definition of price stability,
range and point inflation targets: The anchoring of long-term inflation expectations. 2003. COGLEY, Timothy; SARGENT, Thomas J. Evolving post-world war II US inflation dynamics. NBER macroeconomics annual,
2001, 16: 331-373. CUKIERMAN, Alex; MELTZER, Allan H. A theory of ambiguity, credibility, and inflation under discretion and asymmetric
information. Econometrica: journal of the econometric society, 1986, 1099-1128. DOSSCHE, Maarten; EVERAERT, Gerdie. Measuring inflation persistence: a structural time series approach. National Bank of
Belgium Working Paper, 2005, 70. ECB, June. The outcome of the ECB's evaluation of its monetary policy strategy. Monthly Bulletin, 2003, 79: 92. ECB. The monetary policy of the ECB, European Central Bank, 2004. FUHRER, Jeff; MOORE, George. Inflation persistence. The Quarterly Journal of Economics, 1995, 110.1: 127-159. FUHRER, Jeffrey C. Intrinsic and inherited inflation persistence. 2005. FUHRER, Jeffrey C. Inflation persistence. In: Handbook of monetary economics. Elsevier, 2010. p. 423-486. GAJEWSKI, Paweł. Patterns of regional inflation persistence in a CEE country. The case of Poland. Economic research-Ekonomska
istraživanja, 2018, 31.1: 1351-1366. GUPTA, Rangan; JOOSTE, Charl; RANJBAR, Omid. South Africa’s inflation persistence: a quantile regression
framework. Economic Change and Restructuring, 2017, 50.4: 367-386. KANELLOPOULOS, Nikolaos C.; KOUTROULIS, Aristotelis G. Non-linearities in euro area inflation persistence. Economic
Modelling, 2016, 59: 116-123. KOČENDA, Evzen; PAPELL, David H. Inflation convergence within the European Union: A panel data analysis. International
Journal of Finance & Economics, 1997, 2.3: 189-198. KOČENDA, Evzen; VARGA, Balázs. The impact of monetary strategies on inflation persistence. 2017. KOZICKI, Sharon; TINSLEY, Peter. Permanent and Transitory Policy Shocks in an Empirical Macro Model with Asymmetric
Information, 2003, Federal Reserve Bank of Kansas City Working Paper 03-09. LEVIN, Andrew T.; PIGER, Jeremy. Is inflation persistence intrinsic in industrial economies?. FRB of St. Louis Working Paper
No, 2002.

IAI Academic Conference Proceedings Virtual Conference, November & December, 2021 ________________________________________________________________________________________________________
34
MELLER, Barbara; NAUTZ, Dieter. Inflation persistence in the Euro area before and after the European Monetary Union. Economic Modelling, 2012, 29.4: 1170-1176.
NELSON, Charles R.; PLOSSER, Charles R. Trends and random walks in macroeconomic time series: some evidence and implications. Journal of monetary economics, 1982, 10.2: 139-162.
OBSTFELD, Maurice; DORNBUSCH, Rudiger; MCKINNON, Ronald. International currency experience: new lessons and lessons relearned. Brookings papers on economic activity, 1995, 1995.1: 119-220.
PIVETTA, Frederic; REIS, Ricardo. The persistence of inflation in the United States. Journal of Economic dynamics and control, 2007, 31.4: 1326-1358.
RODRIGUEZ-FUENTES, Carlos J.; OLIVERA-HERRERA, Antonio; PADRON-MARRERO, David. Monetary policy and inflation persistence in the Eurozone. 2004.
TAYLOR, John B. Aggregate dynamics and staggered contracts. Journal of political economy, 1980, 88.1: 1-23. TETLOW, Robert J.; VON ZUR MUEHLEN, Peter. Simplicity versus optimality: The choice of monetary policy rules when agents
must learn. Journal of Economic Dynamics and Control, 2001, 25.1-2: 245-279. WILLIS, Jonathan L., et al. Implications of structural changes in the US economy for pricing behavior and inflation
dynamics. Economic Review-Federal Reserve Bank of Kansas City, 2002, 88.1: 5-28. WU, Jo-Wei; WU, Jyh-Lin. Does a flexible exchange rate regime increase inflation persistence?. Journal of International Money and Finance, 2018, 86: 244-263.

IAI Academic Conference Proceedings Virtual Conference, November & December, 2021 ________________________________________________________________________________________________________
35
Analysis of the provided financial support in agriculture and rural
development: a case study of the largest region in the Slovak Republic
Eva Fedurcová1
1* PhD student, Department of Finance, Faculty of Economics, Technical university of Košice, Slovak Republic
*Corresponding Author: e-mail: [email protected]
Abstract The aim of this article was to analyse financial support for agriculture and rural development in the biggest region in Slovak Republic, the Prešov region, in the period from 2011 to 2017 with emphasis mainly on mutual comparison of its 13 districts. The analysis considers district disparities, particularly development of relevant indicators in the field of agriculture and rural development. Article contains both detailed analysis of financial support (volume, sources from which it flows, development in the observed period) and comparison among the districts, whereas we related all of the stated to the relevant indicators that these districts reported in the period 2011-2017, such as area of agricultural land and forest land, the intensity of breeding of selected livestock, the number of enterprises, sole traders and the registered number of workers in the agricultural sector or level of agricultural production. The area of agricultural land in the districts seems to have proved to be one of the determining factors when it comes to the amount of aid paid. Analysis shows that higher volumes of support flowed to districts with larger absolute areas of agricultural land. Exceptional cases were only those districts which had very high success rate of the project support. The analysis also revealed paradoxical cases where the district, despite the lowest support per hectare of agricultural land, shows the highest average values of agricultural production per hectare and these values even increased in the observed period (case of the district Snina or Sabinov). Keywords: financial support, least developed districts, agriculture, rural development, Common agricultural policy
1. Introduction The article is devoted to the detailed analysis of financial support, which was provided in the research area in Prešov region, Slovak Republic, in the years 2011-2017 (its volume, resources from which it flows and its development) with emphasis on comparison at the district level. Another important part is devoted to the connection of all stated above with the relevant region and district indicators such as area of agricultural land and forest land, the intensity of breeding of selected livestock, the number of enterprises, sole traders and the registered number of workers in the agricultural sector or level of agricultural production, etc. The uniqueness of the article lies in the analysis of as yet unprocessed and unpublished data, which were provided for the purposes of this work by the relevant responsible state institutions. Methodology The descriptive method and the method of literary research are used in the processing of this article, which leads to the definition of the theoretical basis of generally accepted conclusions in the researched area. Theoretical foundations are formed by characterizing and defining rural development, its areas and indicators, as it is necessary to perceive it in the context of this work. The starting points were publications and articles by Massot et al. (2018), Bebbington (2001), Blandford (2010), Brezzi et al. (2011), Copusa (2010) and Freshwater (2009). Official information and financial reports, authored by institutions and bodies such as the European Commission, the European Parliament, the Ministry of Agriculture of the Slovak Republic and the Research Institute of Agricultural and Food Economics, were also important. The empirical part of the work is based on methods of analysis, synthesis and also comparison. Collection of data related to the provided financial support in the field of agriculture and rural development in Prešov region and its districts in the period 2011-2017 was carried out primarily through the so-called info requests pursuant to Act no. 211/2000 Coll. on free access to information. We have chosen this path due to the incompleteness and often insufficientness of the
IAI Academic Conference Proceedings Virtual Conference, November & December, 2021 ________________________________________________________________________________________________________
36
data that is officially available. The request was addressed to the Ministry of Agriculture of the Slovak Republic and the Agricultural Paying Agency in Slovakia. The criterion for the payments to be included in the data we worked with was whether they were eventually paid out. We analyze the total volume of support provided in the region as a whole according to the source and compare for what individual purposes in the years 2011-2017 the funds went and what was the development of their financing in that period. At the district level, we examine and compare the distribution of total support and its development, as well as the share of the district in the total support of regions and the development of this share. We also compare districts in terms of sources of support. The analysis of financial support is performed in connection with the relevant indicators related to the region in the field of agriculture and rural development and their development in the years 2011-2017. Data on the area of agricultural land and forest land, the intensity of breeding of selected livestock, the number of enterprises, sole traders in the sector and the registered number of workers in the surveyed sector were drawn from the Statistical Office of the Slovak Republic. Simple recalculations of data per ha or per employee were carried out in some cases by us (we draw data on the area from the Statistical Office of the Slovak Republic) or in some cases we used already recalculated data from the Green Reports on Agriculture and Food in the Slovak Republic. 2. Analysis of provided financial support 2.1 Overall distribution of financial support in the region: We will classify financial support in agriculture and rural development (hereinafter referred to as financial support) in the following categories on the basis of the sources from which it originated in the following 4 groups: national support, direct support (direct payments in the 1st pillar of the CAP, 2nd pillar of the CAP and payments within the so-called market organization), project support and state aid. Table below provides a brief overview of the relevant funding options in the field of agriculture and rural development in Slovakia, which we discuss in more detail in the following sections. Table 1. Overview of support options in agriculture and rural development and their financing (source: own processing according
to the Ministry of Agriculture of Slovak Republic and the Agricultural Paying Agency) Type of financial support Financing
National support • in the form of a subsidy à from the state budge
State aid
• various forms (non-refundable cash contribution, direct payments, subsidies ...) a) State (or minimum) aid schemes under rural development program measures à
2nd pillar of CAP b) State (or minimum) aid schemes outside the measures of the Rural
Development Program à2nd pillar of CAP
Direct support
• in the form of direct payments (separate / tied) and non-refundable cash contributions à 1st pillar of CAP
a) separate direct payments b) coupled direct payments c) financing of the market organization
Project support • form of non-repayable financial contribution à 2nd pillar of CAP The following graph will show which parts in absolute and relative terms formed the individual sources of support in the years 2011-2017 for the total financial support in the whole region.

IAI Academic Conference Proceedings Virtual Conference, November & December, 2021 ________________________________________________________________________________________________________
37
Figure 1 Distribution of total financial support in Prešov region in 2011-2017 by source (source: own calculations and processing according to data from the Ministry of Agriculture of Slovak Republic and the Agricultural Paying Agency)
The following chart shows the development of the volume of financial support within individual groups by source in the observed period. The largest fluctuations in the observed period can be observed in the volume of project support, where from 2011 to 2015 there was a sharp decline in absolute numbers from 43.53 mil. € to 2.10 mil. €. In 2016, there was a renewed, but only one-off increase to 27.84 mil. €. In 2017, radically less project funds (€ 3.44 million) was paid out again. The other 3 groups showed a relatively stable development in the observed period.
Figure 2 Development of overall financial support by source in 2011-2017 in mil. € (source: own calculations and processing
according to data from the Ministry of Agriculture of Slovak Republic and the Agricultural Paying Agency)
2.2 Support and its development over time at the district level: In this part we will move to the district level of Prešov region. The following graph shows the distribution of the total package of financial support in agriculture and rural development in, including all sources from which such support could have flowed in each of the 13 districts in absolute and relative terms.
It can be seen that the highest amount of funds in the period under review went to the districts of Prešov (€ 83.46 million), Poprad (€ 83.47 million), Bardejov (€ 80.05 million) and Stará Ľubovňa (76.25 million)). In total, these 4 districts absorbed up to 48.09% of the total support, i.e. almost half of the total support going to the whole region. On the other hand, the least funds went to the
National support0,44%
Project support17,86%
Direct support81,27%
State aid 0,43%
546, 30
120,03 2,91 mil. 2,97
0,0041
43,5269
71,1032
0,0160
0,0057
22,9372
83,3437
0,5531
0,1405
11,5664
78,2582
1,8680
0,6285
8,6170
76,8149
0,2078
2,0972
2,0999
73,5511
0,0042
0,0130
27,8423
77,7257
0,0061
0,0858
3,4413
85,4983
0,2588
0,00 40,00 80,00
Národné podpory
Projektové…
Priame podpory
Štátna pomoc…
support provided (mil. €)
2011 2012 2013 2014 2015 2016 2017
National support
Project support
Direct support

IAI Academic Conference Proceedings Virtual Conference, November & December, 2021 ________________________________________________________________________________________________________
38
districts of Medzilaborce (€ 16.35 million), Snina (€ 24.09 million), Stropkov (€ 33.69 million), Svidník (€ 34.13 million), Sabinov (36, € 44 million) and Levoča (€ 39.21 million). In total, only 27.36% of the total funds went to these 6 districts.
Figure 3 Distribution of total financial support in mil. € in 2011-2017 in individual districts of Prešov region and their share in the
total (source: own calculations and processing according to data from the Ministry of Agriculture of Slovak Republic and the Agricultural Paying Agency)
The districts that were most supported in terms of the total volume of financial support (taking into account the median for the period 2011-2017) include Prešov (€ 12.55 million), Poprad (€ 12.50 million), Bardejov (11 , € 80 million) and Stará Ľubovňa (€ 10.50 million). On the other hand, the highest annual volumes of support were provided in the districts of Medzilaborce (€ 2.15 million), Snina (€ 3.18 million), Svidník (€ 4.70 million), Stropkov (€ 5.10 million) and Sabinov. (€ 5.30 million). The development of the total volumes of financial support can be monitored within the following summary chart. In the monitored period, the support in whole region was directed mainly to the so-called disadvantaged areas (67.36%) – that is e.g. on areas with natural constraints, mountain areas, etc. The second highest volume of funds went to purposes related to ecology, environment and climate in agriculture and forestry (25.86%). 4.43% of the support was aimed at improving the welfare of farmed animals and 2.18% as an investment in forest areas and improving their viability. Within the NATURA 2000 project, 0.18% of funds were allocated, which represented almost € 340 000. The fact that the subsidy of disadvantaged areas formed, in terms of volume, the largest component in direct payments from the 2nd pillar in the whole region, but it must also be supplemented by the information that it decreased in absolute numbers. The year-on-year increase was not recorded until 2017. The financing of other components was relatively stable. From 2015, we can see an increase in the financing of environmental, ecological and climate measures in agriculture and forestry, together with an increase in investment in the development of forest areas.
Bardejov80,05 mil. €
Humenné48,47 mil. €
Kežmarok60,23 mil. €
Levoča39,23 mil. €
Medzilaborce
16,35 mil. €Poprad
83,47 mil. €Prešov83,46 mil. €
Sabinov36,44 mil. €
Snina24,09 mil. €
Stará Ľubovňa
76,25 mil. €
Stropkov33,69 mil. €
Svidník34,13 mil. €
Vranov nad Topľou
56,34 mil. €
8,3811,91
7,2
8,96
5,08
2,412,42 12,42
5,42 %3,58
11,3
5,01
5,84
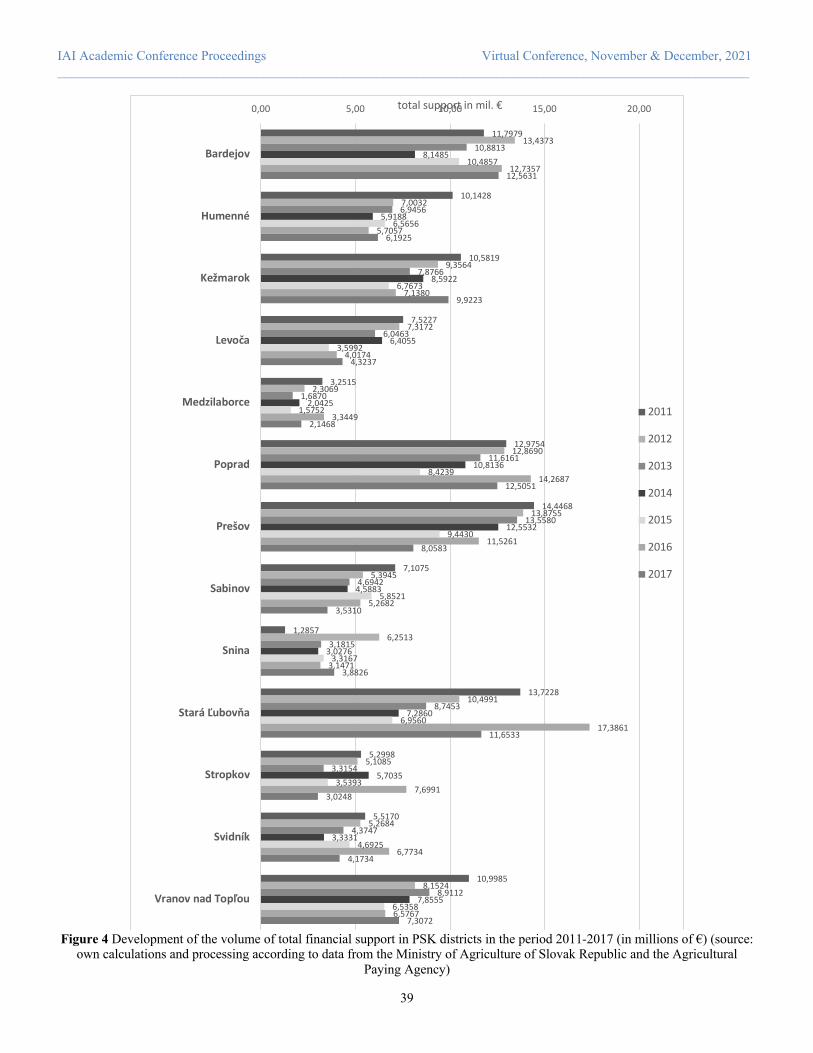
IAI Academic Conference Proceedings Virtual Conference, November & December, 2021 ________________________________________________________________________________________________________
39
Figure 4 Development of the volume of total financial support in PSK districts in the period 2011-2017 (in millions of €) (source:
own calculations and processing according to data from the Ministry of Agriculture of Slovak Republic and the Agricultural Paying Agency)
11,7979
10,1428
10,5819
7,5227
3,2515
12,9754
14,4468
7,1075
1,2857
13,7228
5,2998
5,5170
10,9985
13,4373
7,0032
9,3564
7,3172
2,3069
12,8690
13,8755
5,3945
6,2513
10,4991
5,1085
5,2684
8,1524
10,8813
6,9456
7,8766
6,0463
1,6870
11,6161
13,5580
4,6942
3,1815
8,7453
3,3154
4,3747
8,9112
8,1485
5,9188
8,5922
6,4055
2,0425
10,8136
12,5532
4,5883
3,0276
7,2860
5,7035
3,3331
7,8555
10,4857
6,5656
6,7673
3,5992
1,5752
8,4239
9,4430
5,8521
3,3167
6,9560
3,5393
4,6925
6,5358
12,7357
5,7057
7,1380
4,0174
3,3449
14,2687
11,5261
5,2682
3,1471
17,3861
7,6991
6,7734
6,5767
12,5631
6,1925
9,9223
4,3237
2,1468
12,5051
8,0583
3,5310
3,8826
11,6533
3,0248
4,1734
7,3072
0,00 5,00 10,00 15,00 20,00
Bardejov
Humenné
Kežmarok
Levoča
Medzilaborce
Poprad
Prešov
Sabinov
Snina
Stará Ľubovňa
Stropkov
Svidník
Vranov nad Topľou
total support in mil. €
2011
2012
2013
2014
2015
2016
2017
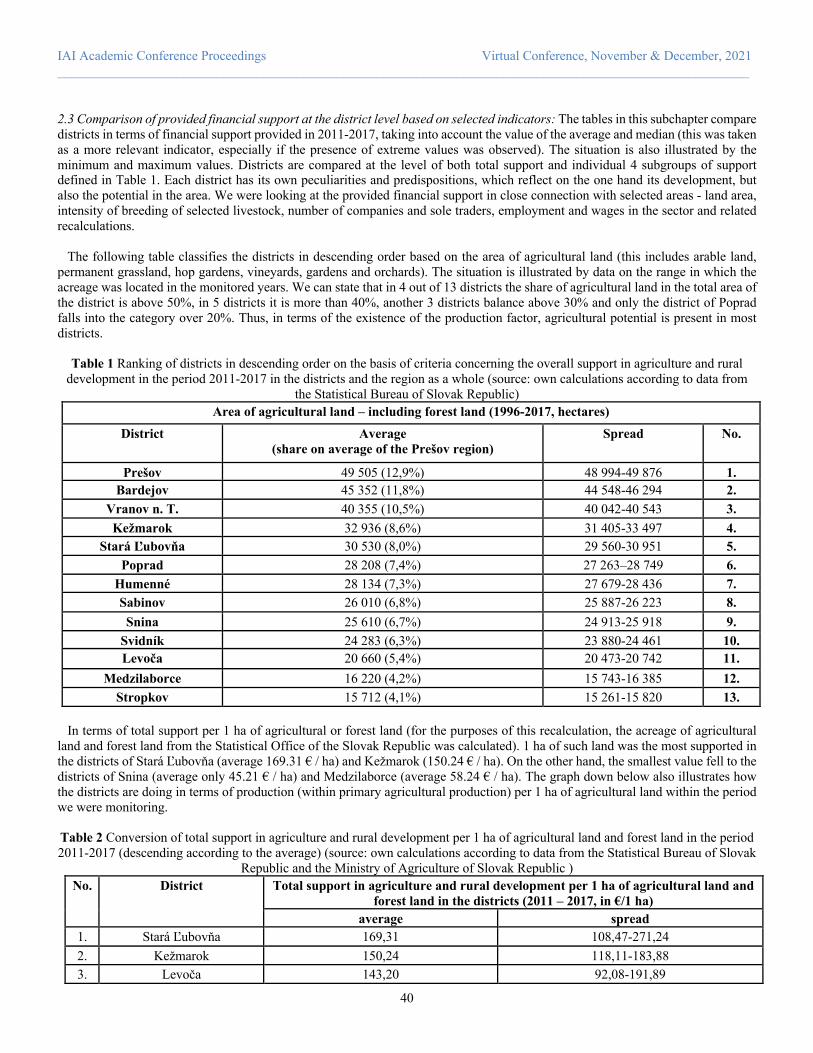
IAI Academic Conference Proceedings Virtual Conference, November & December, 2021 ________________________________________________________________________________________________________
40
2.3 Comparison of provided financial support at the district level based on selected indicators: The tables in this subchapter compare districts in terms of financial support provided in 2011-2017, taking into account the value of the average and median (this was taken as a more relevant indicator, especially if the presence of extreme values was observed). The situation is also illustrated by the minimum and maximum values. Districts are compared at the level of both total support and individual 4 subgroups of support defined in Table 1. Each district has its own peculiarities and predispositions, which reflect on the one hand its development, but also the potential in the area. We were looking at the provided financial support in close connection with selected areas - land area, intensity of breeding of selected livestock, number of companies and sole traders, employment and wages in the sector and related recalculations. The following table classifies the districts in descending order based on the area of agricultural land (this includes arable land, permanent grassland, hop gardens, vineyards, gardens and orchards). The situation is illustrated by data on the range in which the acreage was located in the monitored years. We can state that in 4 out of 13 districts the share of agricultural land in the total area of the district is above 50%, in 5 districts it is more than 40%, another 3 districts balance above 30% and only the district of Poprad falls into the category over 20%. Thus, in terms of the existence of the production factor, agricultural potential is present in most districts.
Table 1 Ranking of districts in descending order on the basis of criteria concerning the overall support in agriculture and rural development in the period 2011-2017 in the districts and the region as a whole (source: own calculations according to data from
the Statistical Bureau of Slovak Republic) Area of agricultural land – including forest land (1996-2017, hectares)
District Average (share on average of the Prešov region)
Spread No.
Prešov 49 505 (12,9%) 48 994-49 876 1. Bardejov 45 352 (11,8%) 44 548-46 294 2.
Vranov n. T. 40 355 (10,5%) 40 042-40 543 3. Kežmarok 32 936 (8,6%) 31 405-33 497 4.
Stará Ľubovňa 30 530 (8,0%) 29 560-30 951 5. Poprad 28 208 (7,4%) 27 263–28 749 6.
Humenné 28 134 (7,3%) 27 679-28 436 7. Sabinov 26 010 (6,8%) 25 887-26 223 8. Snina 25 610 (6,7%) 24 913-25 918 9.
Svidník 24 283 (6,3%) 23 880-24 461 10. Levoča 20 660 (5,4%) 20 473-20 742 11.
Medzilaborce 16 220 (4,2%) 15 743-16 385 12. Stropkov 15 712 (4,1%) 15 261-15 820 13.
In terms of total support per 1 ha of agricultural or forest land (for the purposes of this recalculation, the acreage of agricultural land and forest land from the Statistical Office of the Slovak Republic was calculated). 1 ha of such land was the most supported in the districts of Stará Ľubovňa (average 169.31 € / ha) and Kežmarok (150.24 € / ha). On the other hand, the smallest value fell to the districts of Snina (average only 45.21 € / ha) and Medzilaborce (average 58.24 € / ha). The graph down below also illustrates how the districts are doing in terms of production (within primary agricultural production) per 1 ha of agricultural land within the period we were monitoring. Table 2 Conversion of total support in agriculture and rural development per 1 ha of agricultural land and forest land in the period 2011-2017 (descending according to the average) (source: own calculations according to data from the Statistical Bureau of Slovak
Republic and the Ministry of Agriculture of Slovak Republic ) No. District Total support in agriculture and rural development per 1 ha of agricultural land and
forest land in the districts (2011 – 2017, in €/1 ha) average spread
1. Stará Ľubovňa 169,31 108,47-271,24 2. Kežmarok 150,24 118,11-183,88 3. Levoča 143,20 92,08-191,89
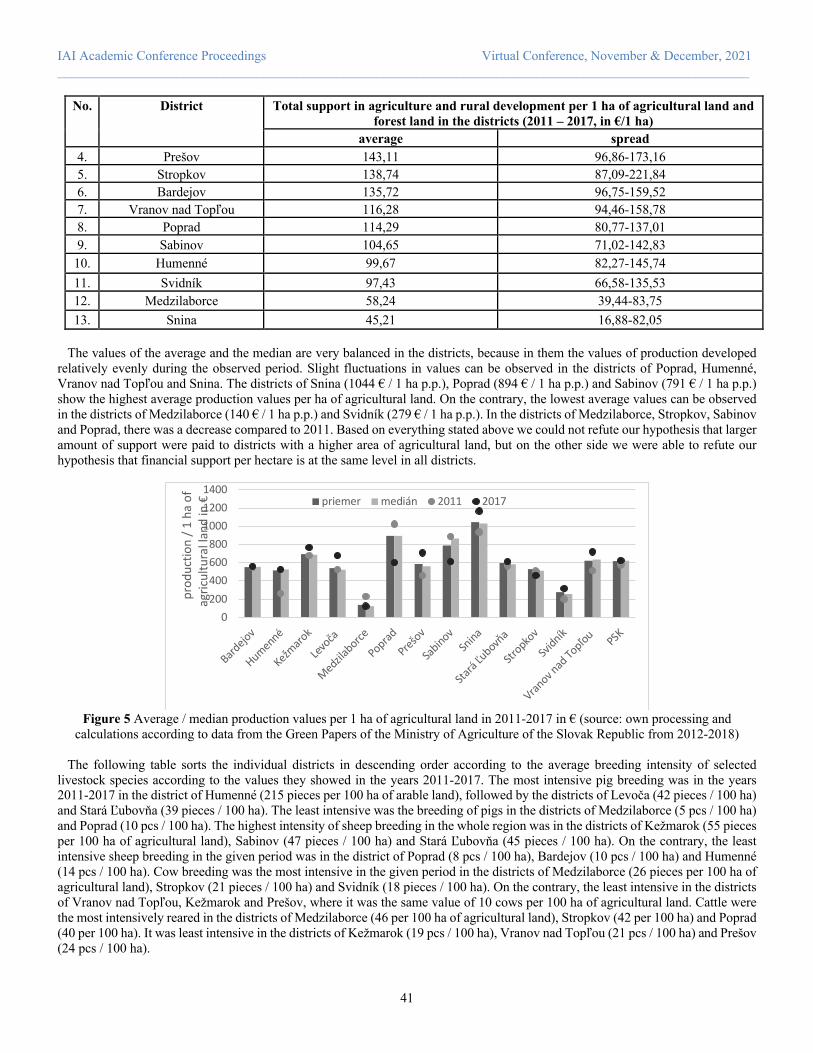
IAI Academic Conference Proceedings Virtual Conference, November & December, 2021 ________________________________________________________________________________________________________
41
No. District Total support in agriculture and rural development per 1 ha of agricultural land and forest land in the districts (2011 – 2017, in €/1 ha)
average spread 4. Prešov 143,11 96,86-173,16 5. Stropkov 138,74 87,09-221,84 6. Bardejov 135,72 96,75-159,52 7. Vranov nad Topľou 116,28 94,46-158,78 8. Poprad 114,29 80,77-137,01 9. Sabinov 104,65 71,02-142,83 10. Humenné 99,67 82,27-145,74 11. Svidník 97,43 66,58-135,53 12. Medzilaborce 58,24 39,44-83,75 13. Snina 45,21 16,88-82,05
The values of the average and the median are very balanced in the districts, because in them the values of production developed relatively evenly during the observed period. Slight fluctuations in values can be observed in the districts of Poprad, Humenné, Vranov nad Topľou and Snina. The districts of Snina (1044 € / 1 ha p.p.), Poprad (894 € / 1 ha p.p.) and Sabinov (791 € / 1 ha p.p.) show the highest average production values per ha of agricultural land. On the contrary, the lowest average values can be observed in the districts of Medzilaborce (140 € / 1 ha p.p.) and Svidník (279 € / 1 ha p.p.). In the districts of Medzilaborce, Stropkov, Sabinov and Poprad, there was a decrease compared to 2011. Based on everything stated above we could not refute our hypothesis that larger amount of support were paid to districts with a higher area of agricultural land, but on the other side we were able to refute our hypothesis that financial support per hectare is at the same level in all districts.
Figure 5 Average / median production values per 1 ha of agricultural land in 2011-2017 in € (source: own processing and
calculations according to data from the Green Papers of the Ministry of Agriculture of the Slovak Republic from 2012-2018)
The following table sorts the individual districts in descending order according to the average breeding intensity of selected livestock species according to the values they showed in the years 2011-2017. The most intensive pig breeding was in the years 2011-2017 in the district of Humenné (215 pieces per 100 ha of arable land), followed by the districts of Levoča (42 pieces / 100 ha) and Stará Ľubovňa (39 pieces / 100 ha). The least intensive was the breeding of pigs in the districts of Medzilaborce (5 pcs / 100 ha) and Poprad (10 pcs / 100 ha). The highest intensity of sheep breeding in the whole region was in the districts of Kežmarok (55 pieces per 100 ha of agricultural land), Sabinov (47 pieces / 100 ha) and Stará Ľubovňa (45 pieces / 100 ha). On the contrary, the least intensive sheep breeding in the given period was in the district of Poprad (8 pcs / 100 ha), Bardejov (10 pcs / 100 ha) and Humenné (14 pcs / 100 ha). Cow breeding was the most intensive in the given period in the districts of Medzilaborce (26 pieces per 100 ha of agricultural land), Stropkov (21 pieces / 100 ha) and Svidník (18 pieces / 100 ha). On the contrary, the least intensive in the districts of Vranov nad Topľou, Kežmarok and Prešov, where it was the same value of 10 cows per 100 ha of agricultural land. Cattle were the most intensively reared in the districts of Medzilaborce (46 per 100 ha of agricultural land), Stropkov (42 per 100 ha) and Poprad (40 per 100 ha). It was least intensive in the districts of Kežmarok (19 pcs / 100 ha), Vranov nad Topľou (21 pcs / 100 ha) and Prešov (24 pcs / 100 ha).
0200400600800
100012001400
Bardejov
Humenné
Kežmaro
k
Levo
ča
Medzilaborce
PopradPrešo
v
Sabinov
Snina
Stará
Ľubovň
a
Stropko
v
Svidník
Vranov n
ad To
pľou PSK
prod
uctio
n / 1
ha
of
agric
ultu
ral l
and
in€ priemer medián 2011 2017
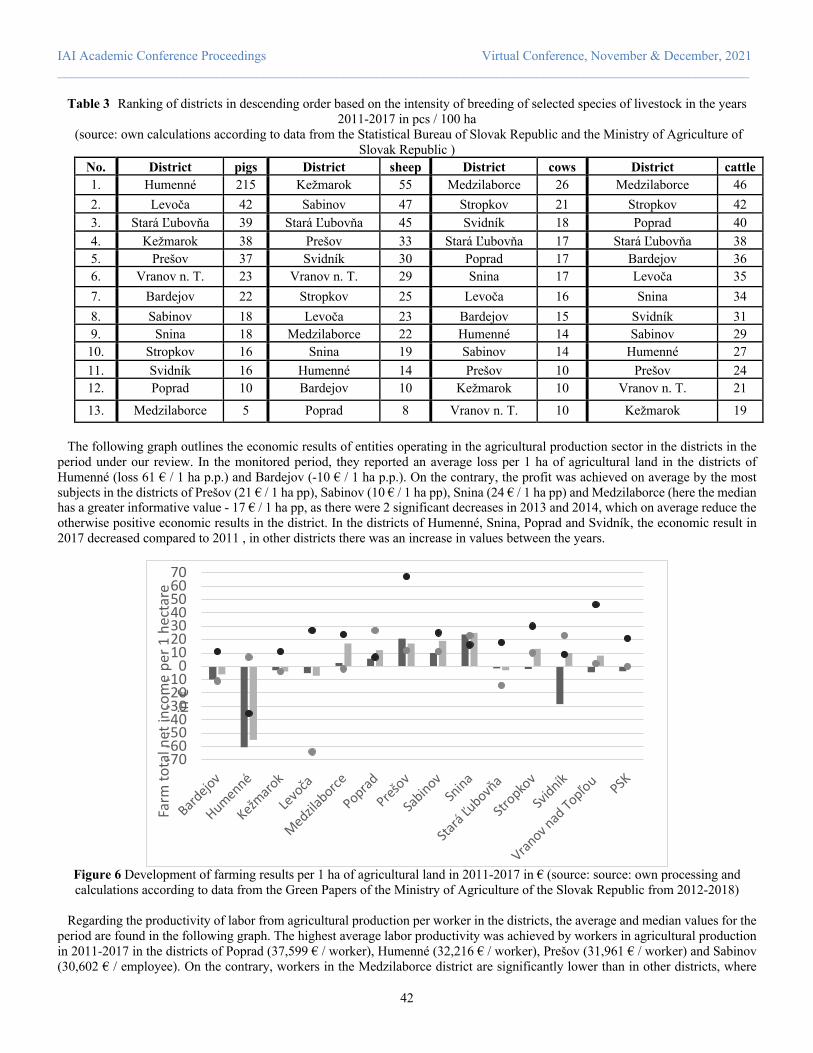
IAI Academic Conference Proceedings Virtual Conference, November & December, 2021 ________________________________________________________________________________________________________
42
Table 3 Ranking of districts in descending order based on the intensity of breeding of selected species of livestock in the years 2011-2017 in pcs / 100 ha
(source: own calculations according to data from the Statistical Bureau of Slovak Republic and the Ministry of Agriculture of Slovak Republic )
No. District pigs District sheep District cows District cattle 1. Humenné 215 Kežmarok 55 Medzilaborce 26 Medzilaborce 46 2. Levoča 42 Sabinov 47 Stropkov 21 Stropkov 42 3. Stará Ľubovňa 39 Stará Ľubovňa 45 Svidník 18 Poprad 40 4. Kežmarok 38 Prešov 33 Stará Ľubovňa 17 Stará Ľubovňa 38 5. Prešov 37 Svidník 30 Poprad 17 Bardejov 36 6. Vranov n. T. 23 Vranov n. T. 29 Snina 17 Levoča 35 7. Bardejov 22 Stropkov 25 Levoča 16 Snina 34 8. Sabinov 18 Levoča 23 Bardejov 15 Svidník 31 9. Snina 18 Medzilaborce 22 Humenné 14 Sabinov 29 10. Stropkov 16 Snina 19 Sabinov 14 Humenné 27 11. Svidník 16 Humenné 14 Prešov 10 Prešov 24 12. Poprad 10 Bardejov 10 Kežmarok 10 Vranov n. T. 21
13. Medzilaborce 5 Poprad 8 Vranov n. T. 10 Kežmarok 19 The following graph outlines the economic results of entities operating in the agricultural production sector in the districts in the period under our review. In the monitored period, they reported an average loss per 1 ha of agricultural land in the districts of Humenné (loss 61 € / 1 ha p.p.) and Bardejov (-10 € / 1 ha p.p.). On the contrary, the profit was achieved on average by the most subjects in the districts of Prešov (21 € / 1 ha pp), Sabinov (10 € / 1 ha pp), Snina (24 € / 1 ha pp) and Medzilaborce (here the median has a greater informative value - 17 € / 1 ha pp, as there were 2 significant decreases in 2013 and 2014, which on average reduce the otherwise positive economic results in the district. In the districts of Humenné, Snina, Poprad and Svidník, the economic result in 2017 decreased compared to 2011 , in other districts there was an increase in values between the years.
Figure 6 Development of farming results per 1 ha of agricultural land in 2011-2017 in € (source: source: own processing and calculations according to data from the Green Papers of the Ministry of Agriculture of the Slovak Republic from 2012-2018)
Regarding the productivity of labor from agricultural production per worker in the districts, the average and median values for the period are found in the following graph. The highest average labor productivity was achieved by workers in agricultural production in 2011-2017 in the districts of Poprad (37,599 € / worker), Humenné (32,216 € / worker), Prešov (31,961 € / worker) and Sabinov (30,602 € / employee). On the contrary, workers in the Medzilaborce district are significantly lower than in other districts, where
-70-60-50-40-30-20-10
010203040506070
Bardejov
Humenné
Kežmaro
k
Levo
ča
Medzilaborce
PopradPreš
ov
Sabinov
Snina
Stará
Ľubovň
a
Stropko
v
Svidník
Vranov n
ad To
pľou PSK
Farm
tota
lnet
inco
me
per 1
hec
tare
in €
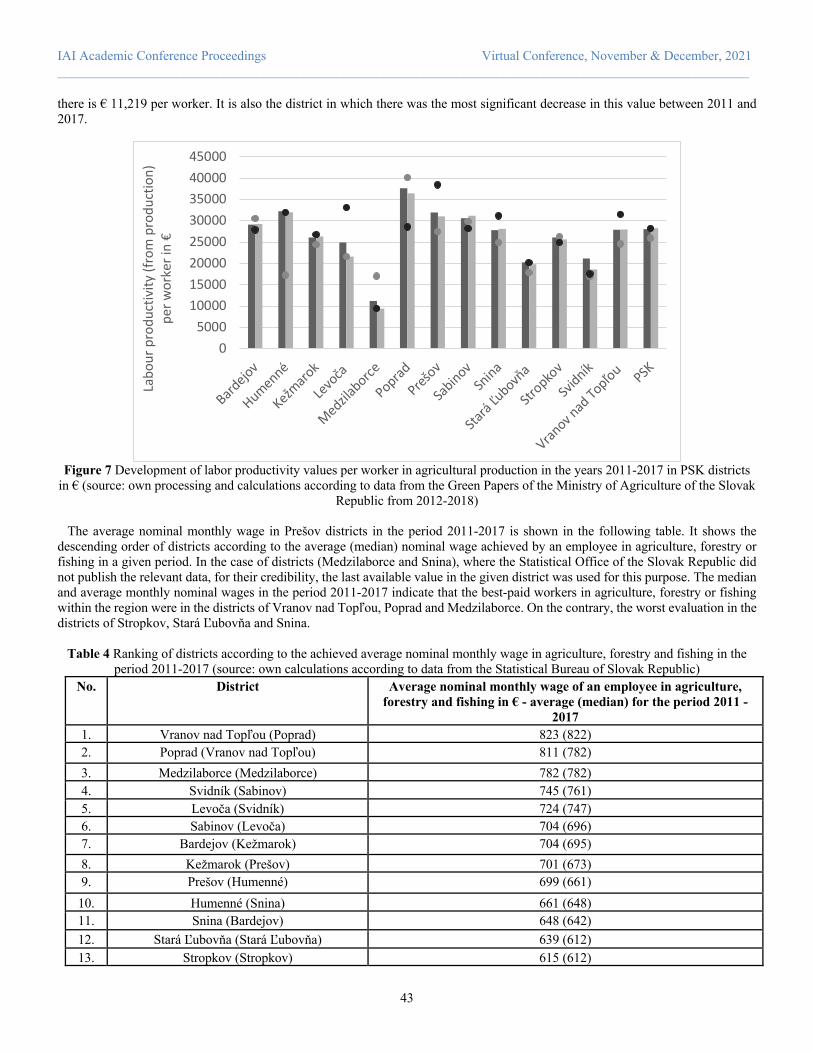
IAI Academic Conference Proceedings Virtual Conference, November & December, 2021 ________________________________________________________________________________________________________
43
there is € 11,219 per worker. It is also the district in which there was the most significant decrease in this value between 2011 and 2017.
Figure 7 Development of labor productivity values per worker in agricultural production in the years 2011-2017 in PSK districts
in € (source: own processing and calculations according to data from the Green Papers of the Ministry of Agriculture of the Slovak Republic from 2012-2018)
The average nominal monthly wage in Prešov districts in the period 2011-2017 is shown in the following table. It shows the descending order of districts according to the average (median) nominal wage achieved by an employee in agriculture, forestry or fishing in a given period. In the case of districts (Medzilaborce and Snina), where the Statistical Office of the Slovak Republic did not publish the relevant data, for their credibility, the last available value in the given district was used for this purpose. The median and average monthly nominal wages in the period 2011-2017 indicate that the best-paid workers in agriculture, forestry or fishing within the region were in the districts of Vranov nad Topľou, Poprad and Medzilaborce. On the contrary, the worst evaluation in the districts of Stropkov, Stará Ľubovňa and Snina.
Table 4 Ranking of districts according to the achieved average nominal monthly wage in agriculture, forestry and fishing in the period 2011-2017 (source: own calculations according to data from the Statistical Bureau of Slovak Republic)
No. District Average nominal monthly wage of an employee in agriculture, forestry and fishing in € - average (median) for the period 2011 -
2017 1. Vranov nad Topľou (Poprad) 823 (822) 2. Poprad (Vranov nad Topľou) 811 (782) 3. Medzilaborce (Medzilaborce) 782 (782) 4. Svidník (Sabinov) 745 (761) 5. Levoča (Svidník) 724 (747) 6. Sabinov (Levoča) 704 (696) 7. Bardejov (Kežmarok) 704 (695) 8. Kežmarok (Prešov) 701 (673) 9. Prešov (Humenné) 699 (661) 10. Humenné (Snina) 661 (648) 11. Snina (Bardejov) 648 (642) 12. Stará Ľubovňa (Stará Ľubovňa) 639 (612) 13. Stropkov (Stropkov) 615 (612)
05000
1000015000200002500030000350004000045000
Bardejov
Humenné
Kežmaro
k
Levo
ča
Medzilaborce
PopradPreš
ov
Sabinov
Snina
Stará
Ľubovň
a
Stropko
v
Svidník
Vranov n
ad To
pľou PSK
Labo
urpr
oduc
tivity
(from
prod
uctio
n)
per w
orke
rin
€

IAI Academic Conference Proceedings Virtual Conference, November & December, 2021 ________________________________________________________________________________________________________
44
Based on everything stated above we could refute our hypothesis that higher support per hectare means higher production value per ha, higher labor productivity per worker in the sector, higher intensity of livestock breeding, or nominal monthly wage of an employee working in this industry. At district level, comparing the average number of enterprises operating in the field of agriculture, forestry and fishing for the period 2011-2017, a descending order of districts can be compiled, as shown in the table below. The table also contains a descending order of districts according to the share of enterprises in the surveyed sector in the total number of enterprises in the district. The districts of Prešov (152), Bardejov (151) and Svidník (117) show the largest number of enterprises in the sector on average for the period 2011-2017. On the contrary, on average, the fewest such enterprises operated in the districts of Medzilaborce (54), Snina (60) and Kežmarok (63). Enterprises operating in the agriculture, forestry and fishing sector in the districts of Medzilaborce (37.0%), Stropkov (19.6%) and Levoča (18.9%) have the proportionally largest representation within all enterprises in the district. On the contrary, the least in the districts of Prešov (2.9%), Poprad (3.3%) and Kežmarok (7.4%).
Table 5 Ranking of districts according to the criteria concerning enterprises in the sector of agriculture, forestry and fishing in the period (according to SK NACE Rev. 2) 2011-2017 (source: own calculations and processing according to the data of the Statistical
Office of the Slovak Republic) District Number of
enterprises operating in the
sector
Share on region average
No. District Share of the number of enterprises operating in the sector in total
enterprises in the district
Prešov 152 12,5% 1. Medzilaborce 37,0% Bardejov 151 12,4% 2. Stropkov 19,6% Svidník 117 9,6% 3. Levoča 18,9%
Humenné 111 9,1% 4. Svidník 15,7% Poprad 105 8,6% 5. Snina 11,6%
Vranov n. T. 101 8,3% 6. Sabinov 10,5% Stará Ľubovňa 89 7,3% 7. Stará Ľubovňa 10,1%
Stropkov 79 6,5% 8. Vranov n. T. 9,3% Levoča 72 5,9% 9. Humenné 9,1% Sabinov 66 5,4% 10. Bardejov 8,0%
Kežmarok 63 5,2% 11. Kežmarok 7,4% Snina 60 4,9% 12. Poprad 3,3%
Medzilaborce 54 4,4% 13. Prešov 2,9% PSK 1220 100% x PSK 7,1%
The following table ranks the districts in descending order according to the average registered number of employees in agriculture, forestry and fishing in enterprises and organizations, taking into account the average for the period 2011 to 2017. In the case of the Medzilaborce district, due to the unavailability of data for the required period, the closest available data was taken into account. On average, most employees in companies and organizations operating in the sector work in the districts of Vranov nad Topľou (800), Stará Ľubovňa (652), Prešov (652) and Poprad (632). On the contrary, the least in Medzilaborce (11) and Svidník (32).
Table 6 Ranking of districts according to the average registered number of employees in agriculture, forestry and fishing (according to SK NACE Rev. 2) for the period 2011-2017 (source: own calculations and processing according to the data of the
Statistical Office of the Slovak Republic) No. District Average registered number of employees in enterprises and
organizations in agriculture, forestry and fishing 1. Vranov n. T. 800 2. Stará Ľubovňa 652 3. Prešov 652 4. Poprad 632 5. Kežmarok 487 6. Bardejov 443

IAI Academic Conference Proceedings Virtual Conference, November & December, 2021 ________________________________________________________________________________________________________
45
No. District Average registered number of employees in enterprises and organizations in agriculture, forestry and fishing
7. Levoča 393 8. Humenné 329 9. Stropkov 324 10. Snina 237 11. Sabinov 159 12. Svidník 32 13. Medzilaborce 11
Comparing the average number of self-employed people operating in the area for the period 2011-2017, it is possible to compile a descending order of districts visible in the following table. The table also contains the descending order of districts according to the share of self-employed persons in the sector in the total number of self-employed persons. The districts of Kežmarok (536), Stará Ľubovňa (439) and Poprad (404) show the largest average number of self-employed persons in the period 2011-2017. Their share in the average number of self-employed persons in the sector in the whole region for the given period together exceeds 46%. On the contrary, on average, the least such self-employed persons were located in the districts of Medzilaborce (68), Stropkov (74) and Levoča (97). The share of these 3 districts in the average whole region number is less than 9%. The districts with the highest share of self-employed persons in the sector in the total number of self-employed persons in the given district are Kežmarok (13.47%), Medzilaborce (12.14%) and Stará Ľubovňa (8.48%). On the contrary, the least such self-employed persons operate in the districts of Prešov (3.10%), Vranov nad Topľou (3.80%) and Bardejov (4.43%).
Table 7 Ranking of districts according to the number of self-employed in the branch of agriculture, forestry and fishing in the period (according to SK NACE Rev. 2) 2011-2017 and according to their share in the number of self-employed in the district in
total (source: own calculations and processing according to the data of the Statistical Office of the Slovak Republic) District Number of self-
employed people in the industry (average 2011 -
2017)
Share of region average (period
2011-2017)
No. District Share of the number of self-employed in the branch in
the number of self-employed in the district in
total (average for 2011 - 2017)
Kežmarok 536 18,0% 1. Kežmarok 13,47% Stará Ľubovňa 439 14,8% 2. Medzilaborce 12,14%
Poprad 404 13,6% 3. Stará Ľubovňa 8,48% Prešov 306 10,3% 4. Snina 7,33%
Bardejov 214 7,2% 5. Poprad 6,30% Sabinov 187 6,3% 6. Svidník 6,23%
Humenné 180 6,0% 7. Stropkov 6,11% Vranov n. T. 173 5,8% 8. Levoča 5,44%
Snina 161 5,4% 9. Humenné 5,29% Svidník 136 4,6% 10. Sabinov 4,78% Levoča 97 3,3% 11. Bardejov 4,43%
Stropkov 74 2,5% 12. Vranov n. T. 3,80% Medzilaborce 68 2,3% 13. Prešov 3,10%
Based on everything stated above we could not refute our hypothesis that higher overall support means a higher number of
companies, sole traders, employees in the agricultural sector.

IAI Academic Conference Proceedings Virtual Conference, November & December, 2021 ________________________________________________________________________________________________________
46
3. Conclusions The vast majority of funds spent in Prešov region come from EU funds, in other words funds under the Common Agricultural Policy (CAP). During the years 2011-2017, only 0.87% were funds within state and national support. The involvement of European policy-makers is therefore important, after all, it was during that period that the EP was negotiating intensively on what the CAP concept would look like after 2020. In these discussions and negotiations, the planned cuts in the CAP budget and especially in rural development were often mentioned. In Prešov region, the drawdown of funds from this pillar, already in the period under review, decreased very significantly, with the exception of 2016 (€ 43.53 million paid out in 2011, while in 2017 only € 3.44 million). From our point of view, the problem of lower utilization of project support can be seen in the excessive bureaucracy and administrative burden for national authorities and applicants. The way to improve the situation should be its effective reduction. The total amount of financial support paid out in individual districts in the monitored period cannot be considered equal, even taking into account different geographical, demographic or other conditions (ranging from € 16.35 million in Medzilaborce to € 83.47 million in Poprad, while only the 4 most supported districts absorbed up to 48.09% of the total volume). The area of agricultural land in the districts seems to have proved to be one of the determining factors when it comes to the amount of aid paid. It is true that higher volumes of support flowed to districts with larger absolute areas of agricultural land (Poprad, Prešov, Bardejov and Stará Ľubovňa were above the average of € 10 million per year). An exception is the district of Poprad, where the reasons why this district is ranked among the most supported can be found in the highest success rate of project support, while this type of support here, unlike other districts, is growing in the long run. In terms of 1 ha of agricultural land, the highest volume of forest land went to the district of Stará Ľubovňa (average € 169.31 / 1 ha), while in the district of Snina it was only € 45.21 per 1 ha. The paradox is that the district of Snina, despite the lowest support per ha, shows the highest average values of agricultural production per ha (1044 €) and even between 2011 and 2017 these values increased by 24.97%. In this case, it can be seen that although the total value of aid and aid per hectare was low compared to other districts, the fact that the vast majority here was direct aid at the expense of project aid, meant a greater impetus in relation to improvements in agricultural production. In relation to the number of enterprises, sole proprietors, or the average registered number of employees in the agricultural, forestry and fishing sectors - on the top ranks in their number in the inter-district comparison, the districts that were the largest recipients of support in the given period can be observed. At the same time, these districts are characterized by the fact that the mentioned sector of agriculture, forestry and fishing is not dominant in them (e.g. it can be noted that the shares of enterprises operating in the sector make up only a small percentage of the total number of enterprises in these districts, i.e. more developed districts). Thus, small districts such as Medzilaborce, Svidník or Levoča generally appear to be a clear problem, in which higher average nominal wages were reported in the agricultural, forestry and fishing sectors during the period under review, but they were nevertheless higher than in other districts. There was a significantly smaller number of companies, sole traders or employees. As part of the improvement in the future, the following can be proposed:
• educe the administrative burden for applicants, but at the same time more effective control of the use of aid, bring greater transparency in the publication of data on aid provided and thus support the possibilities of public control
• densify the network of regional offices so that they are closer to potential and current applicants (e.g. certain trained staff could work directly within the district offices), and / or improve and promote electronic communication and its simplicity
• massive support and simplification of the so-called sale from the yard, expand local and regional product sales, address food self-sufficiency
• subsidize agricultural research and its integration into production practices, e.g. cooperation between companies and universities
• support the processing of explicitly domestic raw materials into domestic products, put emphasis on generating ever-increasing added value
Although this may not seem so at first glance, but much of this does not lie only on the shoulders of the state, although it is its undeniable role, especially in creating an environment that would attract people to do business and using the country's natural potential. It is also us individuals who, through our changed consumer or other behavior, can significantly help to bring our regions and rural areas to life and not become depopulated. To conclude, a short but more comprehensive idea can be added: “Investing in agriculture brings one of the highest returns you can have.” (Paul Polman, Co-Chair of the 2012 World Economic Forum Annual Meeting). Nomenclature ha hectare CAP Common Agricultural Policy PSK Prešov region (abbreviation)
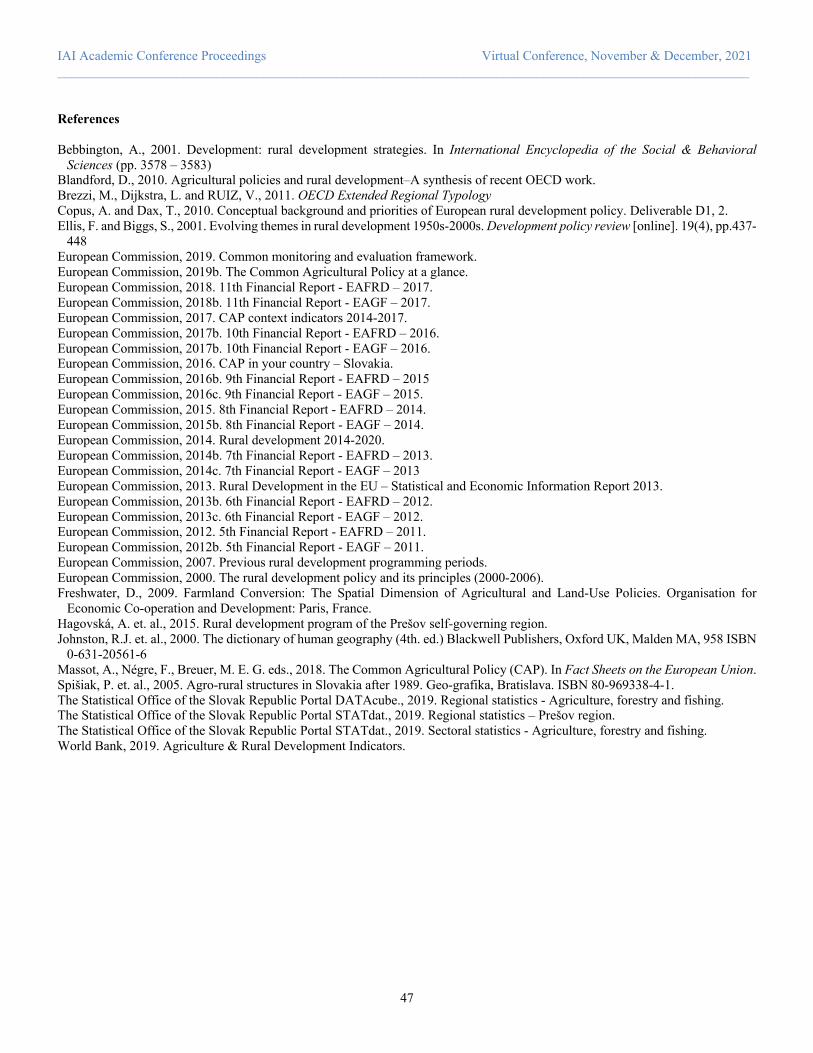
IAI Academic Conference Proceedings Virtual Conference, November & December, 2021 ________________________________________________________________________________________________________
47
References Bebbington, A., 2001. Development: rural development strategies. In International Encyclopedia of the Social & Behavioral
Sciences (pp. 3578 – 3583) Blandford, D., 2010. Agricultural policies and rural development–A synthesis of recent OECD work. Brezzi, M., Dijkstra, L. and RUIZ, V., 2011. OECD Extended Regional Typology Copus, A. and Dax, T., 2010. Conceptual background and priorities of European rural development policy. Deliverable D1, 2. Ellis, F. and Biggs, S., 2001. Evolving themes in rural development 1950s-2000s. Development policy review [online]. 19(4), pp.437-
448 European Commission, 2019. Common monitoring and evaluation framework. European Commission, 2019b. The Common Agricultural Policy at a glance. European Commission, 2018. 11th Financial Report - EAFRD – 2017. European Commission, 2018b. 11th Financial Report - EAGF – 2017. European Commission, 2017. CAP context indicators 2014-2017. European Commission, 2017b. 10th Financial Report - EAFRD – 2016. European Commission, 2017b. 10th Financial Report - EAGF – 2016. European Commission, 2016. CAP in your country – Slovakia. European Commission, 2016b. 9th Financial Report - EAFRD – 2015 European Commission, 2016c. 9th Financial Report - EAGF – 2015. European Commission, 2015. 8th Financial Report - EAFRD – 2014. European Commission, 2015b. 8th Financial Report - EAGF – 2014. European Commission, 2014. Rural development 2014-2020. European Commission, 2014b. 7th Financial Report - EAFRD – 2013. European Commission, 2014c. 7th Financial Report - EAGF – 2013 European Commission, 2013. Rural Development in the EU – Statistical and Economic Information Report 2013. European Commission, 2013b. 6th Financial Report - EAFRD – 2012. European Commission, 2013c. 6th Financial Report - EAGF – 2012. European Commission, 2012. 5th Financial Report - EAFRD – 2011. European Commission, 2012b. 5th Financial Report - EAGF – 2011. European Commission, 2007. Previous rural development programming periods. European Commission, 2000. The rural development policy and its principles (2000-2006). Freshwater, D., 2009. Farmland Conversion: The Spatial Dimension of Agricultural and Land-Use Policies. Organisation for
Economic Co-operation and Development: Paris, France. Hagovská, A. et. al., 2015. Rural development program of the Prešov self-governing region. Johnston, R.J. et. al., 2000. The dictionary of human geography (4th. ed.) Blackwell Publishers, Oxford UK, Malden MA, 958 ISBN
0-631-20561-6 Massot, A., Négre, F., Breuer, M. E. G. eds., 2018. The Common Agricultural Policy (CAP). In Fact Sheets on the European Union. Spišiak, P. et. al., 2005. Agro-rural structures in Slovakia after 1989. Geo-grafika, Bratislava. ISBN 80-969338-4-1. The Statistical Office of the Slovak Republic Portal DATAcube., 2019. Regional statistics - Agriculture, forestry and fishing. The Statistical Office of the Slovak Republic Portal STATdat., 2019. Regional statistics – Prešov region. The Statistical Office of the Slovak Republic Portal STATdat., 2019. Sectoral statistics - Agriculture, forestry and fishing. World Bank, 2019. Agriculture & Rural Development Indicators.

IAI Academic Conference Proceedings Virtual Conference, November & December, 2021 ________________________________________________________________________________________________________
48
Breadth and depth of lexical knowledge of advanced EFL learners: challenges associated with near-synonyms
Alina Yevchuk*
*School of Humanities, Estonia
*Corresponding Author: e-mail: [email protected]
Abstract The current study was focused on researching lexical knowledge of learners of English at the advanced level of proficiency. 45 Estonian senior high school students filled out a questionnaire which required them to choose the most appropriate word from a pair of near-synonyms in 16 different sentences. The pairs of near-synonyms tested in the study included verbs, nouns, adjectives, and adverbs. The main challenge for the students was to determine which one of the two similar yet not identical words would work best in each sentence. The results of the study revealed that even at the advanced level of proficiency a significant number of students were not able to successfully identify the right answer in a variety of contexts. Such inability was attributed to the fact that the students may have lacked the necessary depth of vocabulary knowledge which would allow them to accurately choose the right answer. The study concluded that in addition to increasing students’ breadth of vocabulary (the number of learned words), teachers of English as a foreign language should pay special attention to the depth of their knowledge (how much students know about the learned words). The depth of knowledge can be improved by exposing students to authentic texts in the target language as well as educating them about various tools for researching vocabulary independently, for example corpora. Keywords: near-synonyms, EFL learners, lexical preferences, vocabulary teaching.
1. Introduction and Theoretical Framework Vocabulary development is an integral part of language acquisition. Expanding lexical knowledge is often one of the main priorities for language learners, particularly those who strive to reach an advanced or native-like level of proficiency in a foreign language. The Common European Framework of Reference for Languages (CEFR) defines three main language proficiency levels with two sublevels each, starting from the least proficient to the most advanced. These levels are as follows: basic user (A1 and A2), independent user (B1 and B2), and proficient user (C1 and C2) (Global scale, n.d.). It is estimated that in order to achieve a C1 level of proficiency, learners should know between 3750 and 4500 words (Milton p. 65). Unlike lower proficiency language speakers, proficient users already have a comprehensive understanding of grammar. In practice it means that in order to be able to express more complex ideas, they need to prioritize expanding their vocabulary rather that polishing their grammar. Consequently, vocabulary may be perceived as the most important area for further improvement at advanced levels of proficiency.
Despite the fact that at higher levels of proficiency learners are familiar with various tools and strategies for learning and retaining newly acquired words, they nevertheless face certain challenges associated with vocabulary development. In a study on reading comprehension tasks used in the paper-based test known as TOEFL (Test of English as a Foreign Language), researchers found that for advanced speakers of English vocabulary was the most problematic sub-skill (Elfiondri et. al., 2020). Having an inadequate vocabulary range made it impossible for students to figure out the meaning of unknown words based on context alone and, as a result, lacking vocabulary interfered with their ability to comprehend the texts (Ibid.).
In a study conducted by Laufer and Waldman (2011), researchers compared writing of native speakers of English (L1) to the texts produced by learners of English as a foreign language (EFL) at three levels of proficiency: basic, intermediate, and advanced. Data analysis showed that English L1 participants incorporated significantly more collocations than EFL learners at any level of proficiency. Collocations can be defined as fixed expressions and their mastery is associated with advanced proficiency and fluency (Uchihara et.al. 2021). Examples of collocations include archeological site, judge a competition, serve its purpose, etc. The results of the study showed that the frequency of errors made by EFL students when attempting to incorporate collocations into their writing increased with their proficiency (Laufer & Waldman, 2011). It appeared that the advanced speakers would use collocations incorrectly more often than students at lower levels of proficiency. The researchers attributed it to the fact that advanced learners are more confident about their language skills and thus try to be more creative with their vocabulary which, unfortunately, results in a
IAI Academic Conference Proceedings Virtual Conference, November & December, 2021 ________________________________________________________________________________________________________
49
larger number of errors. They concluded that EFL teachers should employ communicative and task-based teaching methods to raise students’ awareness of the difficult nature of collocations.
The notion of collocations is closely related to near-synonyms—another aspect of vocabulary many EFL learners find challenging. Edmonds and Hirst (2002) define near-synonyms as “almost synonyms, but not quite; very similar, but not identical, in meaning; not fully intersubstitutable, but instead varying in their shades of denotation, connotation, implicature, emphasis, or register” (p. 107). Examples of near-synonymic pairs include judge and evaluate; elevate and lift; acquire and obtain. As a result of analysis of lexical errors produced by EFL students, a study conducted by Saud (2018) established that near-synonyms were particularly problematic for learners of English as they struggled to use them accurately. Another study by Hemchua and Schmitt (2006) demonstrated similar findings: most errors produced by 3rd year university EFL students were due to inaccurate usage of near-synonyms. It is yet to be established what in particular makes near-synonyms so challenging for EFL learners. One of the possible reasons could be students’ lack of depth of vocabulary knowledge.
In the study conducted by Enayat and Amirian (2020) the researchers looked into the relationship between vocabulary size and depth at three different levels of proficiency: lower-intermediate, upper-intermediate, and advanced. The results of the study demonstrated that at the advanced level, unlike the two other levels tested in the study, vocabulary size and depth were not significantly correlated. In other words, when learners become advanced speakers their vocabulary continues to expand in size; however, the depth dimension is lacking. Vocabulary depth, as opposed to vocabulary size or the number of words an EFL learner knows, refers to how much a speaker knows about all the grammatical, lexical, and stylistic nuances of the words they are familiar with.
The current study was performed with the goal of contributing to the existing body of research on the subject of the needs and challenges of advanced learners of English. Specifically, this study was designed to explore the depth of vocabulary of advanced EFL students by means of challenging students to choose between similar yet not identical near-synonymic pairs of words. Focusing on near-synonyms allowed for prompt yet valuable insights into vocabulary knowledge of C1 speakers of English. 2. Description of the Study 2.1 Participants The sample for the current study consisted of 45 students who spoke Estonian as their first language (L1). The median age of the students was 18. Prior to the study all of the participants took the Cambridge English Placement Test (CEPT) which certified that they were at C1 level of proficiency. EFL learners at C1 level are considered “proficient users” which is the highest level of language mastery (Global scale, n.d.). Being a proficient user entails being able to “express him/herself fluently and spontaneously” and “use language flexibly and effectively for social, academic and professional purposes” (Global scale, n.d.). In regard to vocabulary knowledge, according to The Common European Framework of Reference for Languages (CEFR), an C1 level user of English has “a good command of a broad lexical repertoire,” is capable of successfully choosing “from several vocabulary options in almost all situations by exploiting synonyms of even words” and has a good understanding of “common idiomatic expressions and colloquialisms” (p. 131). 2.2 Materials and Procedure
Study participants were asked to fill in a questionnaire consisting of 16 questions. All the sentences used in the questionnaire were taken from the Corpus of Contemporary American English (COCA) and in each sentence one word was removed. For each removed word one near-synonym was found and the task of the participants was to choose the most appropriate word in their opinion from a pair given to them: the original word used in the sentence and a suggested near-synonym. Additionally, the participants had a third option “I don’t know” which they were asked to choose in case they did not know either one or both words in a pair. This option was added to prevent the students from guessing the wright answer. Only the answers given by the student who knew both words in a pair were included in the data analysis. Near-synonyms tested in the questionnaire were chosen so that they would cover all four most important parts of speech: verbs, nouns, adjectives, and adverbs. Out of 16 pairs, 4 of them were verbs, 4 – nouns, 4 – adjectives, and 4 - adverbs.
3. Results and Discussion The results of the study revealed that even though students were familiar with the words tested in the questionnaire, they still struggled with choosing the most appropriate word in nearly half of the sentences, as demonstrated by the fact that in 7 out of 16 instances less than 70% of answers were correct. As can be seen from Figure 1, the most problematic cases were sentences #3, #4, #8, #9, #11, #12, #15. In 6 sentences used in the questionnaire the right answer was a matter of collocational use. In those cases the right answer came down to what words would simply go together and it was less about the differences in meaning between near-synonyms. For example, a pair of near-synonyms judge and evaluate both share the same meaning of forming an opinion about something; however, when talking about a competition one would say to judge a competition and not to evaluate because it is a common collocation: judge and competition simply belong together in the given context. Sentences #4 and #15 where less than 70%
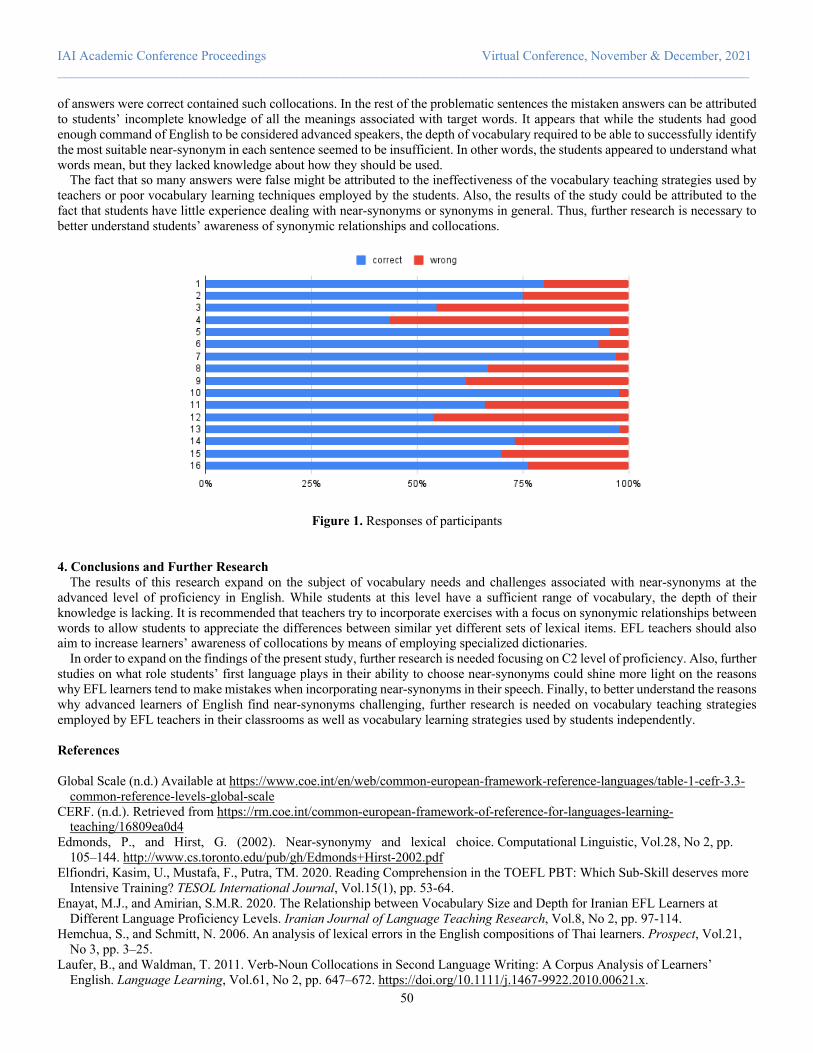
IAI Academic Conference Proceedings Virtual Conference, November & December, 2021 ________________________________________________________________________________________________________
50
of answers were correct contained such collocations. In the rest of the problematic sentences the mistaken answers can be attributed to students’ incomplete knowledge of all the meanings associated with target words. It appears that while the students had good enough command of English to be considered advanced speakers, the depth of vocabulary required to be able to successfully identify the most suitable near-synonym in each sentence seemed to be insufficient. In other words, the students appeared to understand what words mean, but they lacked knowledge about how they should be used.
The fact that so many answers were false might be attributed to the ineffectiveness of the vocabulary teaching strategies used by teachers or poor vocabulary learning techniques employed by the students. Also, the results of the study could be attributed to the fact that students have little experience dealing with near-synonyms or synonyms in general. Thus, further research is necessary to better understand students’ awareness of synonymic relationships and collocations.
Figure 1. Responses of participants
4. Conclusions and Further Research
The results of this research expand on the subject of vocabulary needs and challenges associated with near-synonyms at the advanced level of proficiency in English. While students at this level have a sufficient range of vocabulary, the depth of their knowledge is lacking. It is recommended that teachers try to incorporate exercises with a focus on synonymic relationships between words to allow students to appreciate the differences between similar yet different sets of lexical items. EFL teachers should also aim to increase learners’ awareness of collocations by means of employing specialized dictionaries.
In order to expand on the findings of the present study, further research is needed focusing on C2 level of proficiency. Also, further studies on what role students’ first language plays in their ability to choose near-synonyms could shine more light on the reasons why EFL learners tend to make mistakes when incorporating near-synonyms in their speech. Finally, to better understand the reasons why advanced learners of English find near-synonyms challenging, further research is needed on vocabulary teaching strategies employed by EFL teachers in their classrooms as well as vocabulary learning strategies used by students independently. References Global Scale (n.d.) Available at https://www.coe.int/en/web/common-european-framework-reference-languages/table-1-cefr-3.3-
common-reference-levels-global-scale CERF. (n.d.). Retrieved from https://rm.coe.int/common-european-framework-of-reference-for-languages-learning-
teaching/16809ea0d4 Edmonds, P., and Hirst, G. (2002). Near-synonymy and lexical choice. Computational Linguistic, Vol.28, No 2, pp.
105–144. http://www.cs.toronto.edu/pub/gh/Edmonds+Hirst-2002.pdf Elfiondri, Kasim, U., Mustafa, F., Putra, TM. 2020. Reading Comprehension in the TOEFL PBT: Which Sub-Skill deserves more
Intensive Training? TESOL International Journal, Vol.15(1), pp. 53-64. Enayat, M.J., and Amirian, S.M.R. 2020. The Relationship between Vocabulary Size and Depth for Iranian EFL Learners at
Different Language Proficiency Levels. Iranian Journal of Language Teaching Research, Vol.8, No 2, pp. 97-114. Hemchua, S., and Schmitt, N. 2006. An analysis of lexical errors in the English compositions of Thai learners. Prospect, Vol.21,
No 3, pp. 3–25. Laufer, B., and Waldman, T. 2011. Verb-Noun Collocations in Second Language Writing: A Corpus Analysis of Learners’
English. Language Learning, Vol.61, No 2, pp. 647–672. https://doi.org/10.1111/j.1467-9922.2010.00621.x.

IAI Academic Conference Proceedings Virtual Conference, November & December, 2021 ________________________________________________________________________________________________________
51
Milton J. 2013. Measuring the contribution of vocabulary knowledge to proficiency in the four skills. In L2 vocabulary acquisition, knowledge and use, pp. 57-78.
Saud, W. I. 2018. Lexical Errors of Third Year Undergraduate Students. English Language Teaching, Vol11, No 11, pp. 161–168. Uchihara, T., Eguchi, M., Clenton, J., Kyle, K., and Saito, K. 2021. To What Extent is Collocation Knowledge Associated with
Oral Proficiency? A Corpus-Based Approach to Word Association. Language and Speech. https://doi.org/10.1177/00238309211013865

IAI Academic Conference Proceedings Virtual Conference, November & December, 2021 ________________________________________________________________________________________________________
52
Some aspects of addition and subtraction of fractions in secondary school
Lekë Pepkolaj1, Anjeza Bekolli2*, Valbona Gjini3
1 Department of Information Technology, Higher Vocational College, University College "Qiriazi", Albania.
2* Department of Mathematics and Informatics, Faculty of Economics and Agribusiness, Agricultural University of Tirana. 3United High School "Kosovo", Albania.
*Corresponding Author: [email protected]
Abstract The aim of this study is to highlight the ways of dealing with the addition and subtraction of fractions in secondary school textbooks. Furthermore, on the basis of these results, the most fruitful ways for students to acquire them will be sought. The study focused on grades 6-9, on the texts of some authors and on the basis of the curriculum with competences. In particular, the methods used in their direct practice, the tests with the students on the relevant topics, and the investigations carried out by the teachers were focused on. In conclusion, the study showed that the methods used so far still leave room for other methods to convey this knowledge and concepts to students. Our research shows that these concepts are easily learned by students with lagoons as long as the right way and time is found to explain and teach them. Keywords: Secondary school, fractions, textbooks, learning, methods
1. Introduction
The motivation for this study comes from the difficulties that high school students have understanding fractional operations and the importance that this subject has in practical applications and throughout life. Furthermore, the advice of several experienced math professors has come to the rescue, stating that the issue is not with the difficulty of fractional concepts, but with the manner they are presented. Based on the theoretical framework for this topic, it is clear that the primary issue is the method of delivering the lesson, which is characterized by a lack of practical instruments and mathematical games that do not extend beyond the mathematics textbooks.
Students in high school are frequently asked to acquire mathematical methods, rules, and definitions without knowing why they are being asked to do so. They do different fractional mathematical procedures without realizing that they will be useful in their daily lives. Furthermore, they are not given the opportunity to research with resources appropriate for their age and operate like expert mathematicians. Mathematics is still taught in schools as a pencil-and-paper subject, and students are lost in a world of numbers and mathematical expressions. On the other hand, the school is lacking in practical teaching aids or does not have them. This indicates that youngsters have not received adequate training in dealing with real-life circumstances and challenges. The teacher's role should include more than just teaching the subject and disseminating packaged information, such as creating a conducive learning environment, selecting appropriate objects, stimulating and instructing students to independently discover new concepts and be guided in solving real-world problems. The main issues of the study are:
• The current state of approaches in several textbooks. • Other efficient approaches for comprehending the ideas presented.
2. Theoretical Framework 2.1 Literature from abroad
Definition 2.1.1 A rational number is any equivalence class of the relation R to A that defines the A/R factor community. So the relation R divides the community A into the equivalence class, where A = {(a, b)Î Z2 /b > 0} and R is such that (a, b) R (c, d
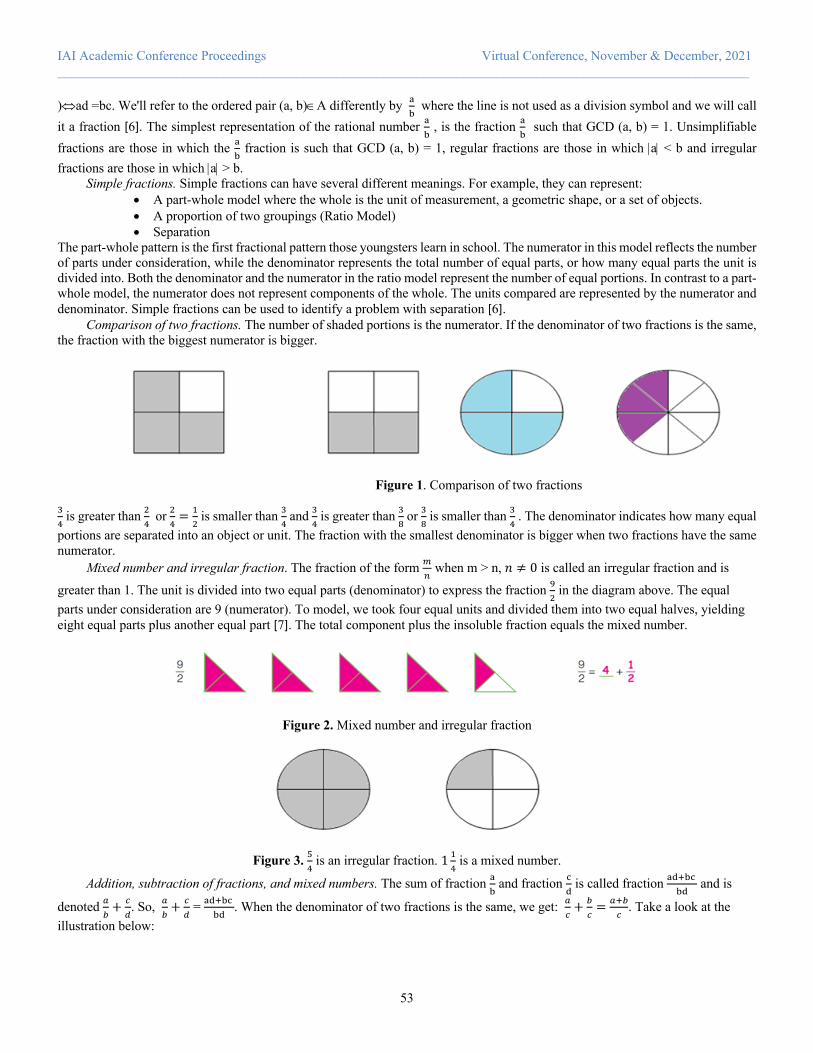
IAI Academic Conference Proceedings Virtual Conference, November & December, 2021 ________________________________________________________________________________________________________
53
)Ûad =bc. We'll refer to the ordered pair (a, b)ÎA differently by )* where the line is not used as a division symbol and we will call
it a fraction [6]. The simplest representation of the rational number )* , is the fraction )
* such that GCD (a, b) = 1. Unsimplifiable
fractions are those in which the )* fraction is such that GCD (a, b) = 1, regular fractions are those in which |a| < b and irregular
fractions are those in which |a| > b. Simple fractions. Simple fractions can have several different meanings. For example, they can represent:
• A part-whole model where the whole is the unit of measurement, a geometric shape, or a set of objects. • A proportion of two groupings (Ratio Model) • Separation
The part-whole pattern is the first fractional pattern those youngsters learn in school. The numerator in this model reflects the number of parts under consideration, while the denominator represents the total number of equal parts, or how many equal parts the unit is divided into. Both the denominator and the numerator in the ratio model represent the number of equal portions. In contrast to a part-whole model, the numerator does not represent components of the whole. The units compared are represented by the numerator and denominator. Simple fractions can be used to identify a problem with separation [6].
Comparison of two fractions. The number of shaded portions is the numerator. If the denominator of two fractions is the same, the fraction with the biggest numerator is bigger.
Figure 1. Comparison of two fractions
'( is greater than &
( or &
(= "
& is smaller than '
( and '
( is greater than '
+ or '
+ is smaller than '
( . The denominator indicates how many equal
portions are separated into an object or unit. The fraction with the smallest denominator is bigger when two fractions have the same numerator.
Mixed number and irregular fraction. The fraction of the form ,-
when m > n, 𝑛 ≠ 0 is called an irregular fraction and is
greater than 1. The unit is divided into two equal parts (denominator) to express the fraction .& in the diagram above. The equal
parts under consideration are 9 (numerator). To model, we took four equal units and divided them into two equal halves, yielding eight equal parts plus another equal part [7]. The total component plus the insoluble fraction equals the mixed number.
Figure 2. Mixed number and irregular fraction
Figure 3. /( is an irregular fraction. 1 "
( is a mixed number.
Addition, subtraction of fractions, and mixed numbers. The sum of fraction )* and fraction 0
1 is called fraction )12*0
*1 and is
denoted 45+ 6
7. So, 4
5+ 6
7 = )12*0
*1. When the denominator of two fractions is the same, we get: 4
6+ 5
6= 425
6. Take a look at the
illustration below:
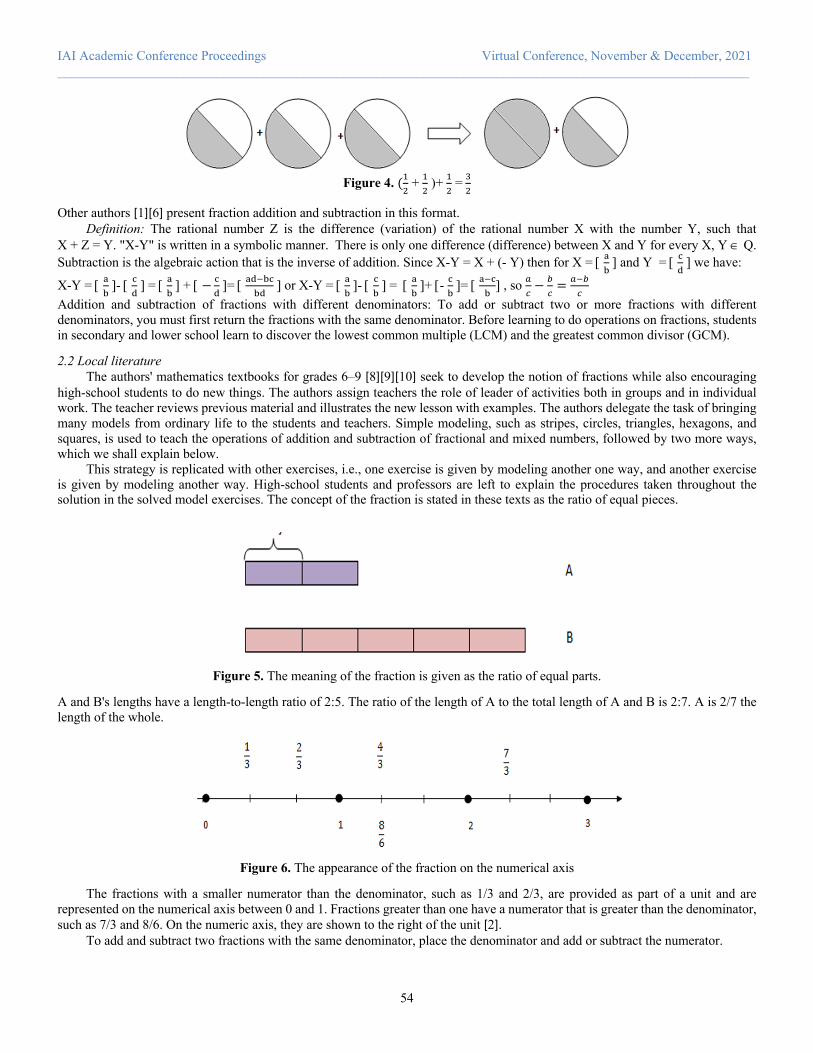
IAI Academic Conference Proceedings Virtual Conference, November & December, 2021 ________________________________________________________________________________________________________
54
Figure 4. ("
& + "
& )+ "
& ='
&
Other authors [1][6] present fraction addition and subtraction in this format. Definition: The rational number Z is the difference (variation) of the rational number X with the number Y, such that
X + Z = Y. "X-Y" is written in a symbolic manner. There is only one difference (difference) between X and Y for every X, Y Î Q. Subtraction is the algebraic action that is the inverse of addition. Since X-Y = X + (- Y) then for X = [ )
*] and Y = [ 0
1] we have:
X-Y = [ )*]- [ 0
1] = [ )
*] + [ − 0
1]= [ )1#*0
*1] or X-Y = [ )
*]- [ 0
*] = [ )
*]+ [- 0
*]= [ )#0
*] , so 4
6− 5
6= 4#5
6
Addition and subtraction of fractions with different denominators: To add or subtract two or more fractions with different denominators, you must first return the fractions with the same denominator. Before learning to do operations on fractions, students in secondary and lower school learn to discover the lowest common multiple (LCM) and the greatest common divisor (GCM).
2.2 Local literature The authors' mathematics textbooks for grades 6–9 [8][9][10] seek to develop the notion of fractions while also encouraging
high-school students to do new things. The authors assign teachers the role of leader of activities both in groups and in individual work. The teacher reviews previous material and illustrates the new lesson with examples. The authors delegate the task of bringing many models from ordinary life to the students and teachers. Simple modeling, such as stripes, circles, triangles, hexagons, and squares, is used to teach the operations of addition and subtraction of fractional and mixed numbers, followed by two more ways, which we shall explain below.
This strategy is replicated with other exercises, i.e., one exercise is given by modeling another one way, and another exercise is given by modeling another way. High-school students and professors are left to explain the procedures taken throughout the solution in the solved model exercises. The concept of the fraction is stated in these texts as the ratio of equal pieces.
Figure 5. The meaning of the fraction is given as the ratio of equal parts.
A and B's lengths have a length-to-length ratio of 2:5. The ratio of the length of A to the total length of A and B is 2:7. A is 2/7 the length of the whole.
Figure 6. The appearance of the fraction on the numerical axis
The fractions with a smaller numerator than the denominator, such as 1/3 and 2/3, are provided as part of a unit and are represented on the numerical axis between 0 and 1. Fractions greater than one have a numerator that is greater than the denominator, such as 7/3 and 8/6. On the numeric axis, they are shown to the right of the unit [2].
To add and subtract two fractions with the same denominator, place the denominator and add or subtract the numerator.

IAI Academic Conference Proceedings Virtual Conference, November & December, 2021 ________________________________________________________________________________________________________
55
8""− &
""= 8#&
""= (
"" 8""+ &
""= 82&
""= +
"" . The conversion of fractions into fractions equal to them is utilized for fraction addition
(subtraction). The fractions with the same denominator are then added (subtracted). Find a multiple of 3 and 7 to find "'+ (
9, one of
them would be 3×7=21. Now find fractions with denominators of 21 that are equivalent to 1/3 and 4/7: "'= "
'× 99= 9
&" and
(9= (
9× ''= "&
&".After that, add the equivalent fractions: "
'+ (
9= 9
&"+ "&
&"= 92"&
&"= ".
&". Although they must work with higher numbers,
the authors [2] do not employ LCM and believe that multiples are easier for high-school students. Addition and subtraction of mixed numbers. To add the numbers 4 9
"& and 1 '
(, uso the first method by adding the whole pieces
first and then the fractions. The second way is by converting mixed numbers into irregular fractions and then into fractions with the same denominator:
4 "( + "
' 4"( = "82"
( = "9
( 4 "( + "
' = "9
(+ "
' The least common multiple of the numbers 3 and 4 is 12. So we have : 4 "
( + "
' = "9
(+ "
' = /"
"&+ (
"& = //
"& = 4 9
"&
Allow the teachers to comment one by one. Other authors [8] concentrate on two aspects of mathematics education: mathematical reasoning and mathematical communication. Concept formulations attempt to improve students' mathematics communication and reasoning skills through solved examples. High-school students complete exercises and problems using descriptions to help them clarify their thinking and build a deeper knowledge of concepts. Problems, as well as a range of ways for overcoming them, are given significant consideration, as well as dressed with data from real life and the environment.
To add and subtract fractions with different denominators, we first convert them to fractions with the same denominator. To find the sum and variance of fractions .
&% and '
"8, return fractions to common denominators. The LCM for 20 and 16 is 80. The
complementary factor for the fraction .&%
is 80: 20 = 4, hence .&%= .×(
&%×(= '8
+%. For the fraction '
"8 complementary factor is 80: 16=5,
hence '"8= '×/
"8×/= "/
+%. So, .
&%+ '
"8= '8
+%+ /
+%= /"
+% and .
&%− '
"8= '8
+%− "/
+%= &"
+%. In 7th grade, the high school student begins to solve
such problem situations with fractions. For example, in solving the equation 𝑥 + '"&= 9
"/.
Let's have a look at how fractional numbers are handled in a competency-based curriculum [8][9]. The clarity of mathematical phrases explaining activities and concepts is noted in these texts. To make fractions more real for children, they are presented in a number of shapes (squares divided in various ways, circles, triangles, rectangles, five and hexagons, stripes). The fraction is given with the part - whole model showing its parts in this way: A mixed number is made up of both whole and fractional parts. There is a fractional portion that is smaller than one. Different modeling and ordering on the numerical axis are used to compare the fractions. It's crucial to have the same denominator when adding and subtracting two fractions.
The authors [10][11][12] wanted to encourage high school students to engage in exploratory learning in order to acquire these mathematical notions. They assign teachers the responsibility of leading activities in both groups and individual work. The authors employ fractional circuits divided into equal pieces, squares divided in the same way, stripes, and numerical axes to compare fractions and decimal numbers to help high school students generate ideas. The authors delegate the task of bringing in other examples from ordinary life to the students and teachers. The ratio model determines the meaning of the fraction. The operations of addition and subtraction of fractional and mixed numbers are taught first through simple modeling, then through two other methods (as shown in the examples above), and this method is reflected in various exercises; that is, one exercise is taught through modeling, another through one method, and yet another through another method. It is up to the students and teachers to explain the steps taken during the solution of the solved model exercises. The concept of the fraction is stated in these books as the ratio of equal pieces.
The authors[8][9]focus on only two aspects of math education: reasoning and mathematical communication. Concept formulations attempt to improve students' mathematics communication and reasoning skills through solved instances. Students utilize descriptions to solve exercises and problems to help them clarify their thinking and build a greater comprehension of the concepts. Problems, a range of ways for overcoming them, and dressing with knowledge from real life and the surroundings are also given considerable emphasis. The meaning of the fraction is given as a unit divided into equal parts that show the denominator and equal parts that show the numerator. For modeling fractions, use squares divided into n equal parts and in different ways such as circles, triangles, strips, etc.
The clarity of mathematical words that express activities and concepts, according to the curriculum text based on new skills [9]. Students are taught fractions using a number of physical models. The fraction is given using the part-whole model, which shows the parts as follows:
The denominator of the fraction is the number of equal pieces into which the whole is divided, while the numerator is the number of parts we choose. The parts of a fractional number are: the numerator, which shows the number of parts we are interested in, the fractional line; and the denominator, which shows how many equal parts the unit is divided into. To find fractions equal to a given fraction, we multiply both the denominator and the numerator by the same number.
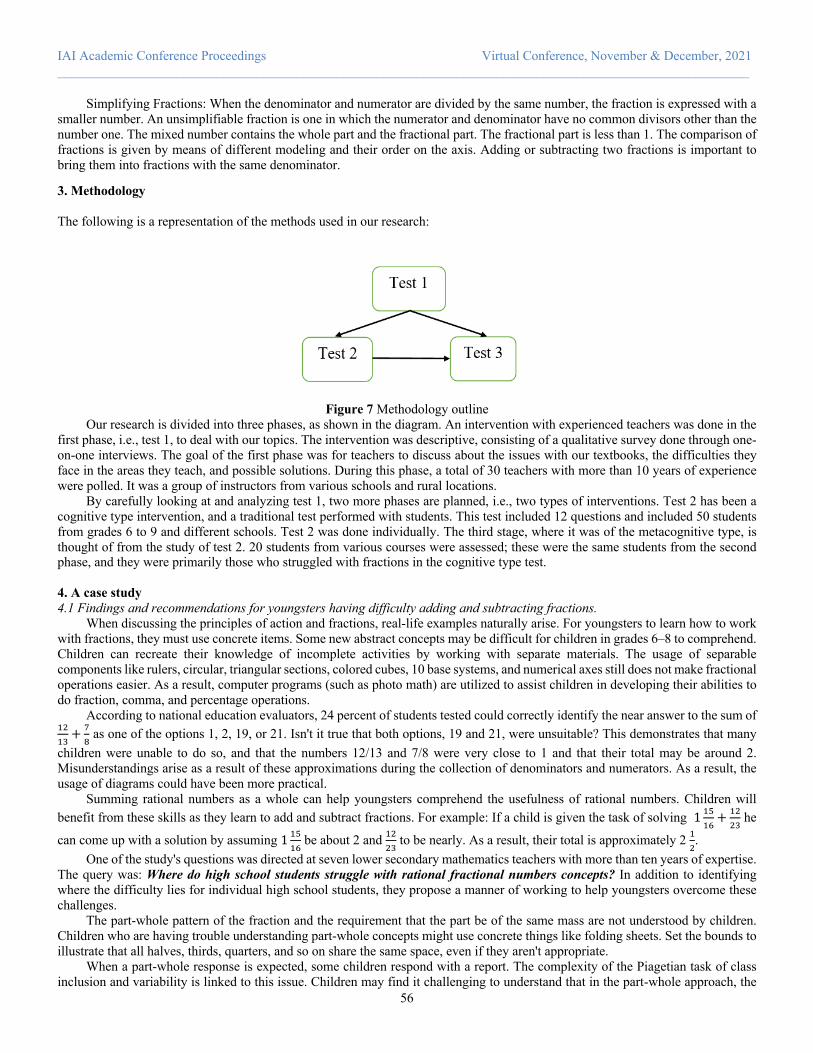
IAI Academic Conference Proceedings Virtual Conference, November & December, 2021 ________________________________________________________________________________________________________
56
Simplifying Fractions: When the denominator and numerator are divided by the same number, the fraction is expressed with a smaller number. An unsimplifiable fraction is one in which the numerator and denominator have no common divisors other than the number one. The mixed number contains the whole part and the fractional part. The fractional part is less than 1. The comparison of fractions is given by means of different modeling and their order on the axis. Adding or subtracting two fractions is important to bring them into fractions with the same denominator.
3. Methodology The following is a representation of the methods used in our research:
Figure 7 Methodology outline
Our research is divided into three phases, as shown in the diagram. An intervention with experienced teachers was done in the first phase, i.e., test 1, to deal with our topics. The intervention was descriptive, consisting of a qualitative survey done through one-on-one interviews. The goal of the first phase was for teachers to discuss about the issues with our textbooks, the difficulties they face in the areas they teach, and possible solutions. During this phase, a total of 30 teachers with more than 10 years of experience were polled. It was a group of instructors from various schools and rural locations.
By carefully looking at and analyzing test 1, two more phases are planned, i.e., two types of interventions. Test 2 has been a cognitive type intervention, and a traditional test performed with students. This test included 12 questions and included 50 students from grades 6 to 9 and different schools. Test 2 was done individually. The third stage, where it was of the metacognitive type, is thought of from the study of test 2. 20 students from various courses were assessed; these were the same students from the second phase, and they were primarily those who struggled with fractions in the cognitive type test. 4. A case study 4.1 Findings and recommendations for youngsters having difficulty adding and subtracting fractions.
When discussing the principles of action and fractions, real-life examples naturally arise. For youngsters to learn how to work with fractions, they must use concrete items. Some new abstract concepts may be difficult for children in grades 6–8 to comprehend. Children can recreate their knowledge of incomplete activities by working with separate materials. The usage of separable components like rulers, circular, triangular sections, colored cubes, 10 base systems, and numerical axes still does not make fractional operations easier. As a result, computer programs (such as photo math) are utilized to assist children in developing their abilities to do fraction, comma, and percentage operations.
According to national education evaluators, 24 percent of students tested could correctly identify the near answer to the sum of "&"'+ 9
+ as one of the options 1, 2, 19, or 21. Isn't it true that both options, 19 and 21, were unsuitable? This demonstrates that many
children were unable to do so, and that the numbers 12/13 and 7/8 were very close to 1 and that their total may be around 2. Misunderstandings arise as a result of these approximations during the collection of denominators and numerators. As a result, the usage of diagrams could have been more practical.
Summing rational numbers as a whole can help youngsters comprehend the usefulness of rational numbers. Children will benefit from these skills as they learn to add and subtract fractions. For example: If a child is given the task of solving 1 "/
"8+ "&
&' he
can come up with a solution by assuming 1 "/"8
be about 2 and "&&'
to be nearly. As a result, their total is approximately 2 "&.
One of the study's questions was directed at seven lower secondary mathematics teachers with more than ten years of expertise. The query was: Where do high school students struggle with rational fractional numbers concepts? In addition to identifying where the difficulty lies for individual high school students, they propose a manner of working to help youngsters overcome these challenges.
The part-whole pattern of the fraction and the requirement that the part be of the same mass are not understood by children. Children who are having trouble understanding part-whole concepts might use concrete things like folding sheets. Set the bounds to illustrate that all halves, thirds, quarters, and so on share the same space, even if they aren't appropriate.
When a part-whole response is expected, some children respond with a report. The complexity of the Piagetian task of class inclusion and variability is linked to this issue. Children may find it challenging to understand that in the part-whole approach, the
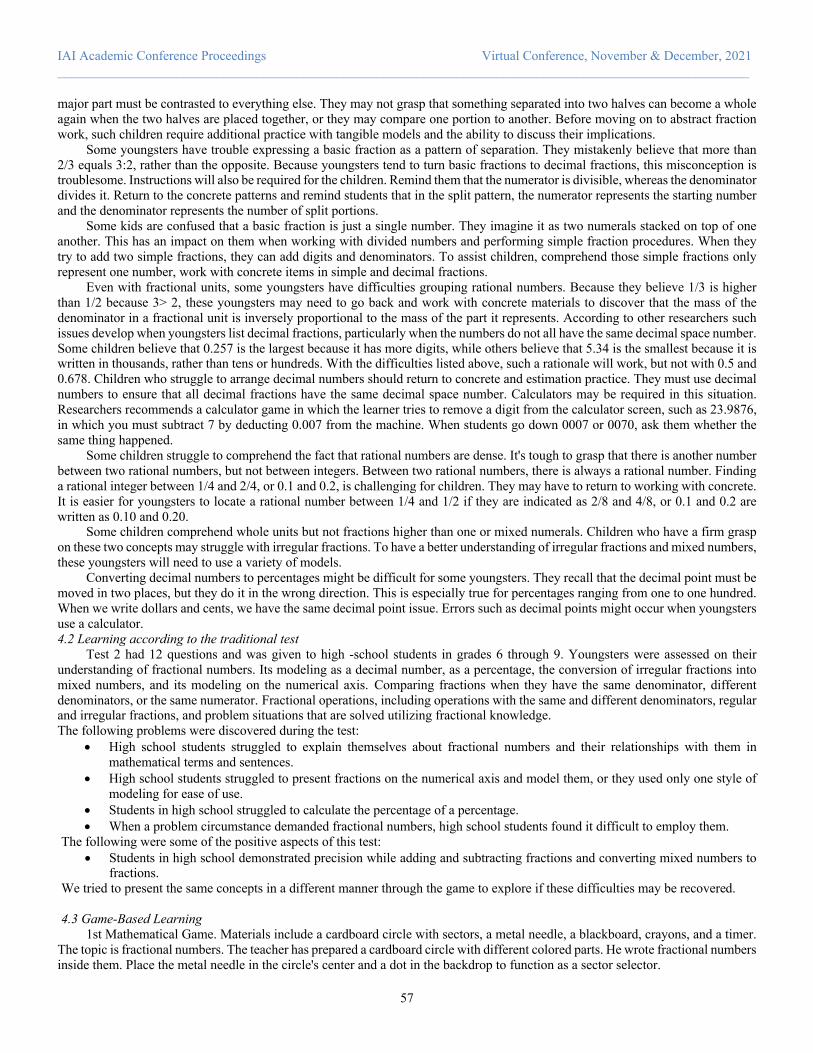
IAI Academic Conference Proceedings Virtual Conference, November & December, 2021 ________________________________________________________________________________________________________
57
major part must be contrasted to everything else. They may not grasp that something separated into two halves can become a whole again when the two halves are placed together, or they may compare one portion to another. Before moving on to abstract fraction work, such children require additional practice with tangible models and the ability to discuss their implications.
Some youngsters have trouble expressing a basic fraction as a pattern of separation. They mistakenly believe that more than 2/3 equals 3:2, rather than the opposite. Because youngsters tend to turn basic fractions to decimal fractions, this misconception is troublesome. Instructions will also be required for the children. Remind them that the numerator is divisible, whereas the denominator divides it. Return to the concrete patterns and remind students that in the split pattern, the numerator represents the starting number and the denominator represents the number of split portions.
Some kids are confused that a basic fraction is just a single number. They imagine it as two numerals stacked on top of one another. This has an impact on them when working with divided numbers and performing simple fraction procedures. When they try to add two simple fractions, they can add digits and denominators. To assist children, comprehend those simple fractions only represent one number, work with concrete items in simple and decimal fractions.
Even with fractional units, some youngsters have difficulties grouping rational numbers. Because they believe 1/3 is higher than 1/2 because 3> 2, these youngsters may need to go back and work with concrete materials to discover that the mass of the denominator in a fractional unit is inversely proportional to the mass of the part it represents. According to other researchers such issues develop when youngsters list decimal fractions, particularly when the numbers do not all have the same decimal space number. Some children believe that 0.257 is the largest because it has more digits, while others believe that 5.34 is the smallest because it is written in thousands, rather than tens or hundreds. With the difficulties listed above, such a rationale will work, but not with 0.5 and 0.678. Children who struggle to arrange decimal numbers should return to concrete and estimation practice. They must use decimal numbers to ensure that all decimal fractions have the same decimal space number. Calculators may be required in this situation. Researchers recommends a calculator game in which the learner tries to remove a digit from the calculator screen, such as 23.9876, in which you must subtract 7 by deducting 0.007 from the machine. When students go down 0007 or 0070, ask them whether the same thing happened.
Some children struggle to comprehend the fact that rational numbers are dense. It's tough to grasp that there is another number between two rational numbers, but not between integers. Between two rational numbers, there is always a rational number. Finding a rational integer between 1/4 and 2/4, or 0.1 and 0.2, is challenging for children. They may have to return to working with concrete. It is easier for youngsters to locate a rational number between 1/4 and 1/2 if they are indicated as 2/8 and 4/8, or 0.1 and 0.2 are written as 0.10 and 0.20.
Some children comprehend whole units but not fractions higher than one or mixed numerals. Children who have a firm grasp on these two concepts may struggle with irregular fractions. To have a better understanding of irregular fractions and mixed numbers, these youngsters will need to use a variety of models.
Converting decimal numbers to percentages might be difficult for some youngsters. They recall that the decimal point must be moved in two places, but they do it in the wrong direction. This is especially true for percentages ranging from one to one hundred. When we write dollars and cents, we have the same decimal point issue. Errors such as decimal points might occur when youngsters use a calculator. 4.2 Learning according to the traditional test
Test 2 had 12 questions and was given to high -school students in grades 6 through 9. Youngsters were assessed on their understanding of fractional numbers. Its modeling as a decimal number, as a percentage, the conversion of irregular fractions into mixed numbers, and its modeling on the numerical axis. Comparing fractions when they have the same denominator, different denominators, or the same numerator. Fractional operations, including operations with the same and different denominators, regular and irregular fractions, and problem situations that are solved utilizing fractional knowledge. The following problems were discovered during the test:
• High school students struggled to explain themselves about fractional numbers and their relationships with them in mathematical terms and sentences.
• High school students struggled to present fractions on the numerical axis and model them, or they used only one style of modeling for ease of use.
• Students in high school struggled to calculate the percentage of a percentage. • When a problem circumstance demanded fractional numbers, high school students found it difficult to employ them.
The following were some of the positive aspects of this test: • Students in high school demonstrated precision while adding and subtracting fractions and converting mixed numbers to
fractions. We tried to present the same concepts in a different manner through the game to explore if these difficulties may be recovered. 4.3 Game-Based Learning
1st Mathematical Game. Materials include a cardboard circle with sectors, a metal needle, a blackboard, crayons, and a timer. The topic is fractional numbers. The teacher has prepared a cardboard circle with different colored parts. He wrote fractional numbers inside them. Place the metal needle in the circle's center and a dot in the backdrop to function as a sector selector.
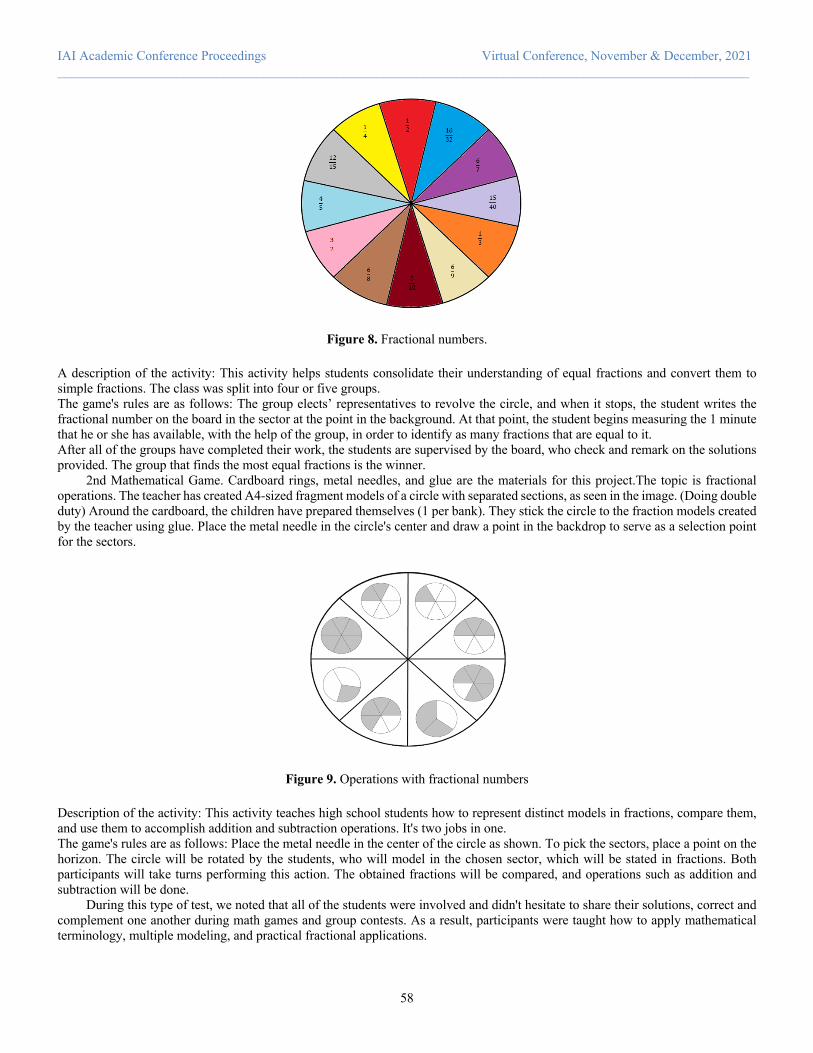
IAI Academic Conference Proceedings Virtual Conference, November & December, 2021 ________________________________________________________________________________________________________
58
Figure 8. Fractional numbers.
A description of the activity: This activity helps students consolidate their understanding of equal fractions and convert them to simple fractions. The class was split into four or five groups. The game's rules are as follows: The group elects’ representatives to revolve the circle, and when it stops, the student writes the fractional number on the board in the sector at the point in the background. At that point, the student begins measuring the 1 minute that he or she has available, with the help of the group, in order to identify as many fractions that are equal to it. After all of the groups have completed their work, the students are supervised by the board, who check and remark on the solutions provided. The group that finds the most equal fractions is the winner.
2nd Mathematical Game. Cardboard rings, metal needles, and glue are the materials for this project.The topic is fractional operations. The teacher has created A4-sized fragment models of a circle with separated sections, as seen in the image. (Doing double duty) Around the cardboard, the children have prepared themselves (1 per bank). They stick the circle to the fraction models created by the teacher using glue. Place the metal needle in the circle's center and draw a point in the backdrop to serve as a selection point for the sectors.
Figure 9. Operations with fractional numbers
Description of the activity: This activity teaches high school students how to represent distinct models in fractions, compare them, and use them to accomplish addition and subtraction operations. It's two jobs in one. The game's rules are as follows: Place the metal needle in the center of the circle as shown. To pick the sectors, place a point on the horizon. The circle will be rotated by the students, who will model in the chosen sector, which will be stated in fractions. Both participants will take turns performing this action. The obtained fractions will be compared, and operations such as addition and subtraction will be done.
During this type of test, we noted that all of the students were involved and didn't hesitate to share their solutions, correct and complement one another during math games and group contests. As a result, participants were taught how to apply mathematical terminology, multiple modeling, and practical fractional applications.

IAI Academic Conference Proceedings Virtual Conference, November & December, 2021 ________________________________________________________________________________________________________
59
5. Conclusions This study's findings suggest that math textbooks can help high school students achieve their goals, objectives, and learning
outcomes. Textbooks have an impact on the teacher's workload and high school students learning. Teachers should not simply rely on textbooks to provide high school students with the knowledge they will require throughout their lives. Teachers can consider having as many activities as possible throughout the teaching-learning process: group work, math games, and without forgetting the notion of exhibiting the concretization that is therapy. Recommendation
• Working with concrete materials can help high school students enhance their learning outcomes in fractions and actions. • Teachers should choose appropriate forms (direct praise for active participation, setting appropriate examples for
discussion, exposing high school students' work, collaborations with peers) to motivate them to learn mathematics. • Teachers should investigate for methods to include concretization tools and the math corner into their lessons. • Teachers must provide as many options as feasible for high school students to reach a decision. • Students in high school should learn to use verbal representations rather than only symbolic and figurative ones. • Explain the relevance of mathematics to high - school students and how it relates to all areas of life. • Interactive strategies such as vocabulary growth, idea debate, collaborative learning, and stimulating discussion should be
used by teachers. • Encourage high-school students to create independently through modeling
References [1] Bertolli. ,Poli, S. ,Lucangeli, D., 2016. Textbook. Le frazioni. Quaderno amico. Dal problema alla regola [2] Lulja, E. ,Babamusta, N. , Bozdo, Sh.,Textbook.Matematika 6 [3] Lulja, E. ,Babamusta, N. , Bozdo, Sh.,Textbook.Matematika 7 [4] Lulja, E. ,Babamusta, N. , Bozdo, Sh., 2014. Textbook.Matematika 8 [5] Lulja, E. ,Babamusta, N. , Bozdo, Sh., Textbook.Matematika 9 [6] Ланков, A.B., "К истории развития передовых идей в русской методике математики" "Учпедгиз", Москва, 1951 г. [7] Romano, S. 2008. Matematica è... Per la Scuola elementare vol.3. Editore CETEM. [8] Starja,D. ,Shkoza, Z.,Competency-based curriculum texts. Matematika 6 [9] Starja,D. ,Shkoza, Z.,Competency-based curriculum texts. Matematika 7 [10] Tato, A. ,Mukli, L. , Musai, B., 2012. Textbook. Matematika 7 [11] Tato, A. ,Mukli, L. , Musai, B., 2012 Textbook. Matematika 8 [12] Tato, A. ,Mukli, L. , Musai, B., 2012 Textbook.Matematika 9

IAI Academic Conference Proceedings Virtual Conference, November & December, 2021 ________________________________________________________________________________________________________
60
Thai SMEs. v. Unfair competition v. IPRs
Mr.Nitibhat Homla-or
Faculty of law, Naresuan University, Thailand e-mail: [email protected] ; [email protected]
Abstract Neither corporation nor natural person denies to acquire profits/incomes. In term of business practice, high profits are of the critical importance to doing almost all business activities. Of all business expenses, how to cut business costs may be technology adoption in support of advanced production. A very classic thereof is technically called the ‘technology transfer’, under which intellectual assets (e.g., copyright, know-how, patents, trademarks, etc.) are often a subject matter in case of negotiation and/or profit shifting. As such, both intellectual property rights (IPRs) and the unfair competition regulations (AKA, Antitrust law) are hotly debated as both legal policies and a social perception surprisingly collide. In fact, both of them aim to promote innovation and, at the same time, competition. For the former purpose, it can be illustrated in a short-term goal. On the contrary, the latter one can be done in a long-term goal. Doing a business by way of forming an SME across Thailand thus calls attention to ‘how well Thai applicable laws are trying to find a potential solution when a couple of legal policies towards IPR management and commercial competition are technically overlapped’. This research’s result is to advise a Thai govern agency (i.e. the Office of Trade Competition Commission (OTCC)) to introduce a subordinate ruling where a pair of benefits resulted from intellectual property development and business competition would be duly maintained from the perspective of Thai SMEs. Keywords: Thai SMEs, IPRS, Unfair Competition, Antitrust, Overlap
1. Introduction After the national research of Thailand had approved this topic with regard to how the Thai laws would find the way out when there is an overlapped area between the IP law and The Unfair Competition Law – alternatively known as the Antitrust – for Thai SMEs. Although this research question might have been resolved in many jurisdictions, most of which are developed countries. On the contrary, Thailand is a developing country. Therefore, how well-developed country’ resolutions can be applied in case of Thailand is relatively challenging in the context of digitalization. The ‘digitalization’ is per se the internet of thing (IOT) era when not only natural persons prefer much more convenience in term of living their lives, but also juristic persons (i.e. companies) enjoy the IOT possibly because IOT can ‘increase its competitiveness’ against its rival (Andrea Sestino,Maria Irene Prete, Luigi Piper, Gianluigi Guido, 2020). In other words, the cost of production may lower and of course its end products/services, which has now been changed from tangible/physical articles into digital ones. (Andrea Sestino, Maria Irene Prete, Luigi Piper, Gianluigi Guido, 2020). It can be clearly seen that the more technologies are employed, the more advantages (profits) of commercial competitiveness augment. Thanks to the globalization, both goods and services are highly expected to transfer more easily than that was done last century. In addition to globalization, the industrialization takes part in most of industrial manufacture through which human-based labour is being gradually superseded by an innovation (e.g. machines, robots, and/or AI) (Patarawan Wangboonkong, and Siripan Thepmak, 2019) Foreseeably, such innovation was stemmed from human’s intellectual capacity by virtue of the classic ‘economy of scale’ principle well recognized by the economic schools across the globe (Izabela Krawczyk-Sokolowska, Agata Pierscieniak and Wieslawa Caputa, 2021) At the invent of technology and innovation, many developed countries viewed that there should be an international mechanism which prevented their pecuniary idea from a free rider, which was represented a group of developing countries. Accordingly, the World Trade Organization (WTO) had proposed an international treaty named the ‘TRIPs’1 Of course, the TRIPs might put the global political pressure on WTO-developing states which was asked to declare its own local laws protect intellectual property rights (of WTO-developed states) (Anna Lanoszka,2003). Since international law enforcement is usually
1 Trade-Related Aspects of Intellectual Property Rights
IAI Academic Conference Proceedings Virtual Conference, November & December, 2021 ________________________________________________________________________________________________________
61
consider the “soft law”2; however, Kholis Roisah regarded it as “hard law” because the TRIPS agreement has the special elements that went beyond an ordinary treaty3. They are (i) “strong obligation”, (ii) delegation and (III) precision ” (Kholis Rosah, 2017) As a developing country and a signatory party to the WTO, Thailand must enact a series of intellectual property laws (eg, the Copyright, the Patent, the Trademark, to name but few) in compliance with the TRIPs Therefore, both substantive provisions of Thai IP laws and the constructive thereof must in light of such international agreement and other related ones (Phongphunpunya, 2020).
Regarding the global IP laws’ theories and academic concepts, they usually vest an IP owner to have an exclusive right to what he/she has created and/or innovated under the law where such innovation is successfully developed. In other words, the IP law cannot be enforced universally. Instead, one country is to promulgate and enforce any innovation by virtue of a respective IP law within its jurisdiction; so, a similar subject matter among different countries must be subject to a legal requirement of each country. For example, the US usually grants the copyright to an artistic work only by way of the registration. Meanwhile, Thailand vests the exclusive right to a copyright holder when his/her artistic work successfully satisfies all legal requirements of the Thai Copyright law without regard to the registration-alternatively called as the “automatic protection” (Sineenat Wannuruk, 2018).
In compliance with the above requirement, Thailand authorizes the IP Department - which is granted a state power to govern the exclusive IPRs (e.g., the copyright, the patent, the trademark, etc.) - across the country.
As the above mentioned, the IP laws was designed to confirm the ‘exclusive right’ of an IP owner who may exercise his/her right as though it be his/her tangible properties such as (enjoying) financial benefits and/or non-financial ones. In order to assure those benefits, both IP laws and their government bodies thus come into play their cooperative roles in doing so. Of course, the IP Department is an official in charge in connection with implementing almost all kind of IPRs in line with the Thai IP law(s).
Another concern may be ‘who can be an IP owner’. This question is answerable thanks to Thailand’s legal development in consistent with many developed countries where both a natural person and a juristic one can hold IPRs As for the former, he/she needs to ask the IP Department about ‘how to acquire IPRs under the IP laws; on the contrary, any juristic person may get confused that ‘too many government agencies would get involved in support of commercializing IPRs. Practically speaking, certain juristic person is required to register itself with another government body – the Department of Business Development, which shall confirm its legal entity for the sake of legal liabilities that are of critical importance to business operation. Meanwhile, does such legal liabilities include tax liability in the context of corporate operation?. This issue might get businessmen/women confused in relation to doing business in a particular a country (i.e. Thailand) where a number of legislations sound complicated and are yet to have an efficient guideline for maximizing business profits. This paper thus confirms that
1) Although too many business laws may get involved in business operation within the country, only 3 groups of them are to optimize the digital economy in which ‘IP laws’ and the ‘competition law’ currently play their roles through an SME and/or a Start-up;
2) Even if some scholar might have argued that tax liabilities could have been a legal liability, almost all multinational corporations must pay very close attention to these liabilities separately possibly because if entrepreneurs are doing so, they will highly likely obtain profits as mas many as they wish down the track;
3) The term of ‘intellectual property’ sounds like any physical asset over which an owner usually claims and/or enjoys his/her sole right – legally called as the ‘exclusive right’. Scholarly, the exclusive right would constitute monopoly. In fact, the said monopoly is merely a very short-term period of economic development; on the contrary, when the exclusive rights are equipped with innovations (AKA intellectual properties) (Arun Gaikwad, 2020) and in turn shift itself to promote free-fair competition (E. Thomas Sullivan, 2000);
4) Should there be an overlapped area between the application of both laws (i.e. IP law and the Competition law), a Thai official in charge, who is statutorily authorized to propose a possible solution for such area is the OTCC - not other agencies;
5) Due to political intervention (Haunss, Sebastian, 2011), the application of both laws may sound divergent, on the one hand. Provided that a government considered its role a referee – not a player, any kind of competition within a market is driven by the market force with reference to very few political interventions, on the other hand (Posathorn Chuthaman, 2019).
2.Literature review 2.1 After the industrializing in the 20th century, most of production overshadowed human-based labors and in turn those
labors were seemingly superseded by machines in flavor of the commercial productivity. Owning to the said machines, they likely have much less limitation than humans (Nattapon Yimyue, Nuntasak Jindapisarn, and Sakraphi Worrawattanapanya, 2017) .Foreseeably, many industries across the world are willing to invest in the R&D projects where its prospective profits would reach their peak (Graham K. Morbey and Robert M. Reithner, 2016). An innovation played its pivotal role in a new production process because the innovation itself has two characters(discussed below), which could be commercialized as a good/service – technically called as the technology transfer.
2.2 As a good /or a service, it might have led to a confusion in the term of commercialization. Hence, the technology transfer was alternatively known as a vital part of the intellectual property management. Its term ‘property’ might
2 Morally legal binding 3 Lack of international enforcement or the ‘soft law’
IAI Academic Conference Proceedings Virtual Conference, November & December, 2021 ________________________________________________________________________________________________________
62
render the said intellectual property similar to a tangible asset or a physical property. Even though the exclusive right over both intellectual property and physical one is a central principle ensuring its owners to exercise its proprietary right in any way as he/she wishes; however, both rights, particular aspects of which should be taken into account. 1) the intellectual property’s values can be diluted easily when its secret information/idea embedded therein is, whether intentionally or unintentionally leaked out. For example, while we determine to plant very rare trees that are identical to those of others. This action is not against the property law; on the contrary, we crave photocopying a book instructing how to plant them. This is definitely repugnant to an intellectual property law (i.e. the copyright) where the expression of idea (almost concrete/touchable) can be protected. For the former case, the tree is a subject matter, whereas the latter is the book (Michael Matteson and Chris Metivier, 2022). When the intellectual property can be commercialized at higher rate of profits than tangible ones’ ones Most traditional law governing the property law cannot thus protect the intellectual properties as IP owners desire possibly because either information or ideas that is of the value to the intellectual property. The said information and/or idea are simply disseminated when innovative devices get involved in the free-rider situation4. Accordingly, ‘how to protect almost all intellectual properties (i.e., the copyright, patent, trademark, to name but a few) became global concern in which developing countries were asked to be a signatory to the TRIPS agreement by which most of intellectual properties of developed nations would be enshrined via domestic laws of those developing countries (Stephen Ezell and Nigel Cory, 2019). 2.3 IP protection in term of capitalization and/or digitalization Upon the well-recognized concept of the IP protection, the ‘negative right’ was successfully introduced and in turn implemented in the sense of international cooperation. Such negative right was vested an IP owner to refrain others from exploding his/her rights without the prior consent given by the owner (the ‘free rider’) or beyond the areas of the legal protection. As such, any violator is not allowed to duplicate; amend; and/or disseminate unless a specific legal requirement either of the prior consent (given by an owner) (Kurt M. Saunders, 2016) or legal exemption is satisfied: In order to maintain their values thereof (Aurora Teixeira and Cátia Ferreira, 2019), so do the IP laws. Unlike tangible properties/assets, the duplication, the amendment, and/or the dissemination relating thereto are themselves not against the (tangible) property law due to the fact that a value of those tangible assets does not critically rely on the information or the ideas (Kurt M. Saunders, 2016) (Chandra Nath Saha and Sanjib Bhattacharya, 2011). Instead, it does upon ‘how hard an ownership or a prosession thereof could be eroded’ Those actions do not degrade both the ownership and the possession, accordingly. The former is considered the ‘positive right’. The latter is the ‘negative right’. For example, either rents or purchase prices is resulted from the ‘positive right’; yet, “preventing others from using the IP” are done by the ‘negative right’ unless royalties or a license must be paid or reached/assigned. In other words, exploding IP plus paying royalties is equal to carrying out such negative right and then turn the said negative right equipped with paying those fees for using it into an allowance of the positive right (John Henshall, 2017). 2.4 Overuse of IP rights Once an exclusive right of IP may have been overused, the said exclusive right foreseeably extend its legal protective arena due to the development of innovation as well as technology. Definitely, the later exclusive right would constitute the monopoly (John Henshall, 2017), towards which unfair competition/antitrust policy could be aggravated (to some extend). For this reason, the overuse of IP’s excusive right may have gone beyond its protection and somehow violated the Unfair competition or the Antitrust law. (Ariel Katz, 2007). 2.5 What about a Thai SME? 2.5.1 Legal Liabilities vs. Tax liabilities Since an SME can be established either by (i) a natural person (ii) a limited company, the resulted SME’ legal liability must be referenced to ‘who has successfully registered him/herself as an SME’. To illustrate, a natural person, who shall be liable for unlimited legal liabilities, will highly likely constitute the similar liability to his/her SME as a registered corporation (the limited liability)– who shall bear limited legal liabilities – will thus made its SME have the limited legal liabilities (like its register) (the Revenue Department of Thailand,.2022) It is noted that registration in case of the SME must be done with the Office of SMEs Promotion (OSMEP) (the OSMEP, 2022). Nonetheless, such registration does not include other company’s establishment registration and/or commercial registration with the DBD (i.e. the company registration) (The Department of Business Development, 2022). In addition to those registrations, the Thai government has authorized the Department of Intellectual Property to monitor/oversee how IPRs are optimized in flavor of public as well as private benefits across the country (DIP,2022). Regarding the tax liability, the SME’s tax liabilities (as discussed earlier) mainly depends on ‘who is a SME register’ (the Revenue Department of Thailand,.2022), that is the natural person -who wishes to register him/herself as an SME- his/her SME must bear unlimited legal liabilities and, of course, the personal incomes tax (PIT)5. On the other hand, any corporation that desires to register itself as an SME. Its SME is liable both for limited legal liabilities and thus under the corporate incomes tax (CIT) (Pattama Waitayawongsakul, 2011)
4 For instance, it is the copyright piracy 5 Progressive rate shall be applied (the more incomes are gained; the more taxes are paid)

IAI Academic Conference Proceedings Virtual Conference, November & December, 2021 ________________________________________________________________________________________________________
63
In this case, many tax experts advise that a corporate SME can save much more taxes than operating the SME through the natural person in case of very complex business operations or having too many personnel (Chaiyasit Trachootham, 2008), ) (Pattama Waitayawongsakul, 2011) 2.6 the Unfair Competition Act B.E. 2542 (1999) and SMEs 2.6.1 This Act is designed not to govern public entities6 (Kanjanasuk Petchanont, 2017) 2.6.2. Any allegation and/or claim on the ground of violating this Act may sound much less effective than actual economic losses a plaintiff has suffered as financial/economic damages relating thereto usually go beyond the actual damages the plaintiff successfully prove before the court (Watinee Khamdee and Rungsang Kritayapong 2019). 2.6.3 While the OTCC may have an exclusive authority to scrutinize any abuse of dominance power of a private entity across the country only on a condition where there must be a pentitioner, who commence a lawsuit. Otherwise, the OTCC shall not have an authority to do so (Watinee Khamdee and Rungsang Kritayapong 2019). Therefore, all costs/expenditure with regard to the litigation must be at the expense of such petitioner ((Watinee Khamdee and Rungsang Kritayapong 2019). 2.6.4 As yet, none of precedent case has been hand downed by the competent court7. It could reflect how effective this Act is enforced, and ,eventually, whether the commercial competition within a market is ‘free’, ‘fair’ without any political intervention as well as illegitimate distortion of the market force caused by a larger firm (a powerful enterprise) must be noted (Posathorn Chuthamani, 2019). 2.6.5 According to the hotly debated legal policies between both the antitrust and the IP law(s), that is monopoly v. anti-monopoly, Thailand has yet to implement any legislative mechanism tacking this issue. Western countries, which developed their own legal mechanism to carry out this matter, has already introduced its guideline in support of the Antitrust/Unfair Competition Law (the US, China, etc.). Notably, such guideline does not automatically assume that all IP exploitations be to constitute a monopolistic behavior in term of business competition (U.S. Department of Justice and the Federal Trade Commission, 2017) (John Days, 2020) 2.6.6. Even if a couple of policies toward competition may look prima facie divergent, one literally supports the other particularly in a developed country where innovation-led economy always develops their quality of people’s lives and social achievement as the U.S department of Justice said “…Antitrust enforcement, however, remains crucial to ensure that IPRs are not abused to limit competition …” (the U.S. Department of Justice, 2012) 2.6.7. In case of SME, there may be 2 scenarios to be discussed more deeply
i) As a licensor8, it is highly suggested that the licensor be supposed to raise awareness whether provisions contained in a technology transfer agreement are repugnant to the spirit of IP laws (e.g.,<1> required written form <2> choice of law <3> choice of forum <4> severity <5> international tax concerns or to the spirit of antitrust/unfair competition law (i.e., <1> dominant position <2> price-fixing <3> cross-licensing <4> Tie-in <5> non-competition <6> unfair commercial practice.) ii) As a licensee, it is highly advised that [1] where the agreement would be effect [2] an effective date [3] the event of default [4] payment terms [5] confidential information [6] official registration
Please note, however, that both laws: the IP and the Antitrust/Unfair competition are juristic matters, which may vary from country to country. Accordingly, a peculiar international aspect of IP and Antitrust’s application must be taken into account. Otherwise, a contractual obligation under a domestic law of a country may be valid to the country, yet, against another country for some reason (AlekseiKellia, AgeVärva TõnisMetsb Vadim Mantrovc, Ramūnas Birštonasd and CarriGintera, 2016).
2.6.7. Even if the OTCC is statutorily vested to examine any business conduct alleged with violating the Unfair Competition Act, it does not mean that its discretion would expand wherever it wishes. In fact, the OTCC ought to remind itself of that it must be a referee in lieu of a player in a market in question. It is relatively impossible for it to comprehend how/why any enterprise’s commercial practice would act based upon the ‘good faith’ and/or ‘proportionality’ principles.(Sirichai Monkolkiatsri, 2001) As long as the said practice is in light of the capitalization, the globalization, or even the digitalization, it may sound legitimate and/or acceptable both by the law and the related legislation and the OTCC. To illustrate, the OTCC, an authorized government body, may not in commercial shoes and, of course, can highly unlikely mull the concerned case/claim over in the practical sense before deciding. This potentially leads to commercial uncertainty down the track as the state (Thailand) may lack of a very concrete reference where business entities had better follow (Thatchanan Issaradet, Vikorn Rakpuangchon and. Ingkarad Doljerm, 2021). 3.Rable Figures and deep analysis
6 The State always raise its excuse of public policy and/or its stability to monopolize some commercial activity. 7 Intellectual Property Court 8 An IP Owner

IAI Academic Conference Proceedings Virtual Conference, November & December, 2021 ________________________________________________________________________________________________________
64
Regardless of legal liabilities, corporate registrations, as well as too many government bodies that usually get involved in SME’s operation, those tax incensives and other financial support provided by the government might sound attractive to new SME, only except for 2020 due to the pandemic. Of course, the national GDP growth sharply dropped (the OSMEP, 2021)
Source: (Office of the National Economics and Social Development Council) on 15 February 2021 Analysis: the OSMEP It demonstrates that the largest volume of trade and services (Blue/Sky color) rendered by private entities had a crucial role in driving the national economy since 2015. Surprisingly, these trade and services skyrocketed SME’s recruitment (creating a number of jobs) (The OSMEP, 2021) Given the above incentives offered to SMEs. They might have been attractive to many new SMEs to the Thai commercial competition. Definitely, SME enterprises now become a pivotal player both in offline and online markets in the country (Krittisak Lokeniyom, 2020). Likewise, since 2014 the Thai GDP growth rates had gradually augmented with the slight drop in 2013 as well as the sharp decrease due to the pandemic -the Covid-19 (the OSMEP, 2020) Foreseeably, whilst the human-based productions are being overshadowed, the technology and/or robotic machines will be of the preference to innovative industries. Developing countries (i.e. Thailand), legal systems and legislative mechanisms of which are inconsistent with technology disruption. Both IP laws and the Antitrust were initially introduced for the purpose of protecting intelligent assets and tangible ones (including commercial competition), respectively. Without no doubt, there must be an overlapped area between both laws. In fact, those laws would advocate industrial innovations and competition in a long term provided that the State duly put the right law on the right job, thereby declaring a guideline where an innovative enterprise desires to engage in the proliferation of digital assets. In particular, an SME that will soon become the new player in business competition is thus seeking for a credible regulation so as to pave the way for economic uncertainty among the robust competition across the world. Of course, the said guildline is to advise “how the SME or anyone would exploit its IP assets within the IP law(s) and not beyond the Competition law’s arena”. Most importantly, only the OTCC must be a competent agency governing the overlapped area between IP law and the (Unfair) Competition law in any case. 4. Conclusion
An overlapped area between IP and (Unfair) Competition law Government agency Authority Detail/Regulation
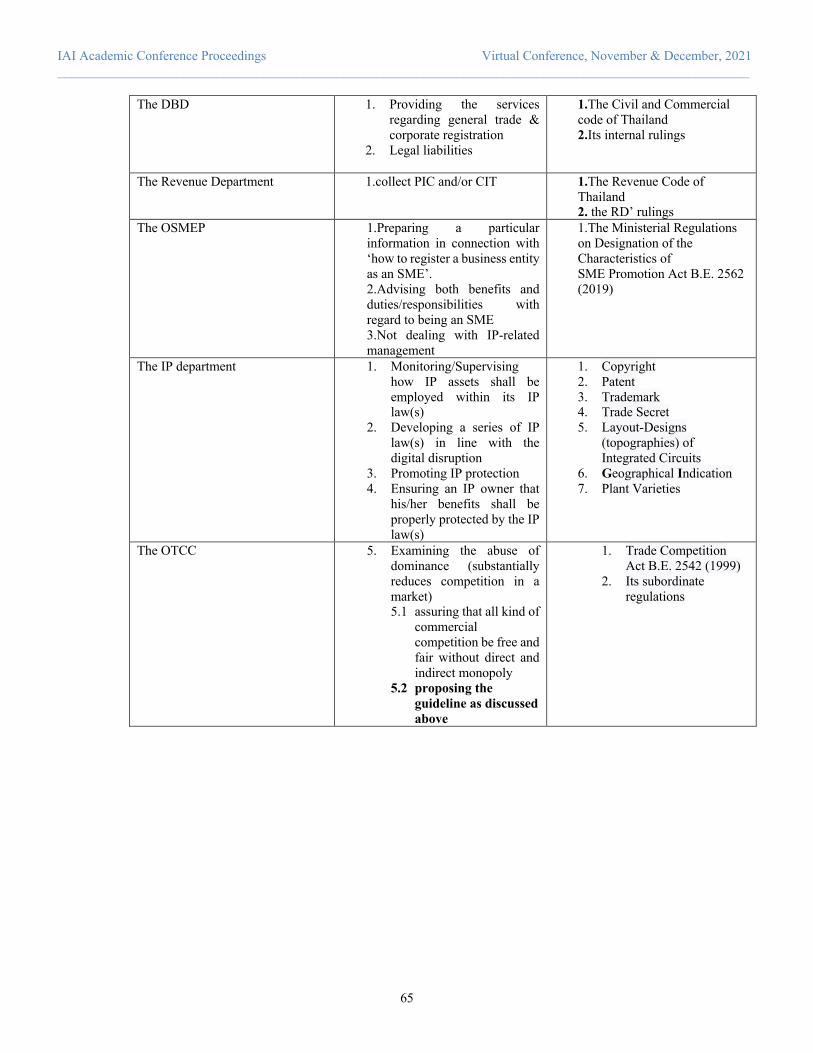
IAI Academic Conference Proceedings Virtual Conference, November & December, 2021 ________________________________________________________________________________________________________
65
The DBD 1. Providing the services regarding general trade & corporate registration
2. Legal liabilities
1.The Civil and Commercial code of Thailand 2.Its internal rulings
The Revenue Department 1.collect PIC and/or CIT 1.The Revenue Code of Thailand 2. the RD’ rulings
The OSMEP 1.Preparing a particular information in connection with ‘how to register a business entity as an SME’. 2.Advising both benefits and duties/responsibilities with regard to being an SME 3.Not dealing with IP-related management
1.The Ministerial Regulations on Designation of the Characteristics of SME Promotion Act B.E. 2562 (2019)
The IP department 1. Monitoring/Supervising how IP assets shall be employed within its IP law(s)
2. Developing a series of IP law(s) in line with the digital disruption
3. Promoting IP protection 4. Ensuring an IP owner that
his/her benefits shall be properly protected by the IP law(s)
1. Copyright 2. Patent 3. Trademark 4. Trade Secret 5. Layout-Designs
(topographies) of Integrated Circuits
6. Geographical Indication 7. Plant Varieties
The OTCC 5. Examining the abuse of dominance (substantially reduces competition in a market) 5.1 assuring that all kind of
commercial competition be free and fair without direct and indirect monopoly
5.2 proposing the guideline as discussed above
1. Trade Competition Act B.E. 2542 (1999)
2. Its subordinate regulations

IAI Academic Conference Proceedings Virtual Conference, November & December, 2021 ________________________________________________________________________________________________________
66
Or the illustration below:
Globalization Digitalization Capitalization/ Industrialization
IP vs. Antitust in case of Thai SMEs
WTO
Profits Incomes
Tech .Disruptio
n
MARKET
corporation
Antitrust
Legal+ Tax
Liabilities
SME
IP
Non-SME
Natural person(s)
Unfair Contrac
t
UNFAIR CONTRACT
OTCC
IP COURT
* Other commercial matters are subject to a civil court’s
jurisdiction

IAI Academic Conference Proceedings Virtual Conference, November & December, 2021 ________________________________________________________________________________________________________
67
5.Acknoledgement Without the following persons’ support & encouragement, this paper would be no way successful: 1. My family; 2. My love; 3. My friends; 4. The executive board of the Naresuan Law School I work 5. My supporting colleagues; 6. My research advisors: Prof. Dr.Sahaton Rattanapijit and Dr.Pawat Satayanuruk 7. My greatest research assistants: Mr. Jakkapan Tantara, Mr. Peeraphat Photha, Mr. Saran Phuengsing, Mr. Saris Limsiriwong (+His mother), and Mr. Jeerawat Chaiphet Last but not least Asso. Professor Jirapama Maklin (former Dean), Asso. Prof. Boonyarat Chokebandanchai(Dean), Asst.Prof.Janyarak Suvapan, Ms.Suttinee Yusawat Asst.Prof.Pongkan Kongsee, Dr.Chatubhoom Bhoomiboonchoo, Asst.Prof. Dr.Yodpol Thepsitthar, Asst.Prof. Dr.Chakri Adunnirat, Asst.Prof. Jukkrit Sathapanasiri, Dr.Methayan Sirichit, Asst.Prof. Kitiwaraya Rattanamanee, Ms. Panithan Thiempetch, , Ms. Peangpanor Boonklum, Dr. Rawin Leelapatana, and Dr. Khemthong Tonsakulrungruang, and Law Chula alumni 8. My inspiration: Prof.Dr. Sakda Thanitcul, Mr. Nandana Indananda, Ms. Wipanan Prasompluem, Asst.Prof.Jintana Panomchaichayawat, Dr.Kedsaraporn Panngam, Asst.Prof. Dr.Chattaporn Harabut 9. Most importantly, the Thailand Science Research and Innovation (TSRI) – the research funder according to the contract no. R2564B025 10. My dearest colleagues: Dr.-to-be Mr.Pannavit Tapaneeyakorn, Asst.Prof.Pongkan Kongsee, Dr-to-be Ms.Ashijya Otwong, Dr-to-be Ms. Suchanun Hunsa-udom, Dr.-to-be Ms. Methinee Suwannakit, Dr-to-be Ms.Phakanadh Sutthent, Dr-to-be Mr.Knaphak Tantasith, and Dr-to-be Ms.Wilasinee Maijaroensri 11. all faculty at the Melbourne Law School & UC Berkley 12. the Thai Government, who trust my intellectual capacity despite my unhealthiness. References
AlekseiKellia, AgeVärva TõnisMetsb, Vadim Mantrovc, Ramūnas Birštonasd ,and CarriGintera, (2016). Different regulatory models of transfer of industrial property rights in the Baltic States: A plea for harmonized approach. International Comparative Jurisprudence, 2(1). 8-17 Andrea Sestino,,Maria Irene Prete, Luigi Piper, Gianluigi Guido. (2020). Internet of Things and Big Data as enablers for business digitalization strategies. Technovation, 98(1), 1
Anna Lanoszka, The Global Politics of Intellectual Property Rights and Pharmaceutical Drug Policies in Developing Countries. (2003). International Political Science Review, Vol 24, No.2, pp 182 Ariel Katz. (2007). Making Sense of Nonsense: Intellectual Property, Antitrust, and Market Power. ARIZONA LAW
REVIEW, 49(4). 837-909 http://dx.doi.org/10.2139/ssrn.702462 The Department of Business Development (2022). Commercial Registration. Business Registration
https://www.dbd.go.th/dbdweb_en/ Arun Gaikwad, 2020 A study of Intellectual property rights and its significant for business, Journal of Information and
Computational Science, 10(2), 553 AuroraA.C.Teixeira and Cátia Ferreira. (2019). Intellectual property rights and the competitiveness of academic
spin-offs. Journal of Innovation & Knowledge, 4(3), 154-161. http://doi.org/10.1016/j.jik.2018.12.002 Chaiyasit Trachootham (2008). Tax planning (3rd ed.) T.Trainig Center. E. Thomas Sullivan, 2000. The Confluence of Antitrust and Intellectual Property at the New Century, The Minnesota
Journal of Law, Science & Technology 1(1), 4 Graham K. Morbey and Robert M. Reithner. (2016). How R&D Affects Sales Growth, Productivity and Profitability.
Research-Technology Managemen Journal, 33(3), 11 Haunss, Sebastian. 2011. the Politici[z]ation of Intellectual Property: IP Conflicts and Social Change. WIPO Journal. 3(.1),
12130-12131.

IAI Academic Conference Proceedings Virtual Conference, November & December, 2021 ________________________________________________________________________________________________________
68
Izabela Krawczyk-Sokolowska, Agata Pierscieniak & Wieslawa Caputa. (2019). The innovation potential of the enterprise in the context of the economy and the business model. Review of Managerial Science, 15(1), 104
John Days (2020). China Publishes Anti-Monopoly Guidelines on Intellectual Property [White Paper]. Insights. https://www.jonesday.com/en/insights/2020/10/china-publishes-antimonopoly-guidelines-on-intellectual-property
1230-12131. John Henshall. (2017). WHAT ARE INTELLECTUAL PROPERTY RIGHTS? Thought Leadership from Our Experts.
https://www.expertguides.com/articles/what-are-intellectual-property-rights/armgzkdl Jumpon Piyyosinnawat & Phumin Budthin, (2017). the History and conceptual Framwork of IP. Bangkok: Deuantula
Press: 12. Kanjanasuk Petchanont (2017). the Analysis of the Unfair Competition Act B.E. 2560: its scope of application and how
this Act oversee the abuse of dominant power. Thammasart Law Journal, 47(3). 619-646 Kholis Rosah. (2017), Understanding Trade-Related Aspects of Intellectual Property Rights Agreement: From Hard and
Soft Law Perspective, Hasanuddin Law Review Vol 3, No.3, pp 288 Krittisak Lokeniyom, (2020). The Digital Connection with SMEs from an Offline Store to an Online Platform.
BangkokBizNews. https://www.bangkokbiznews.com/advertorials/news/1658 Kurt M. Saunders (2016). Intellectual Property Law: Legal Aspects of Innovation and Competition. West Academic
Publishing Michael Matteson and Chris Metivier. (2022). Property and Intellectual Property. Module 6: Privacy, Property, and
Technology. https://philosophia.uncg.edu/phi361-matteson/module-6-privacy-property-and-technology/property-and-intellectual-property/
Nattapon Yimyue, Nuntasak Jindapisarn, and Sakraphi Worrawattanapanya, (2017). Factors in Choosing Industrial Robot Instead of Human Laborof the Automotive Industry in Rayong. Journal of Technical Education Rajamangala University of Technology Thanyaburi 7(1), 68-69
Nutthakarn Phongphunpunya, Distinctive of Human Identity under the Context of Thai Trademark Law,Naresuan Law journal, 13(2), 124
Patarawan Wangboonkong and Siripan Thepmak. (2019). Machine and Empathy in this Era. Narkbhutparitat Journal Nakhon Si Thammarat Rajabhat, 11(1), 47-48
Pattama Waitayawongsakul, (2011). Creative Business and Sustainability Journal, 33(3), 55–75. https://so01.tci-thaijo.org/index.php/CBSReview/article/view/388
Paulius Jurčys, 2012, International Jurisdiction in Intellectual Property Disputes, International Jurisdiction in Intellectual Property Disputes: CLIP, ALI Principles and other Legislative Proposals in a Comparative Perspective, JIPITEC, Vol 3, pp 176
Posathorn Chuthamani (2019). The Remaining Problems after the Amendment of the Thai Competition Law 2017. Thai Justice System Journal, 12(2). 87-104
Saha, C. N., & Bhattacharya, S. (2011). Intellectual property rights: An overview and implications in pharmaceutical industry. Journal of advanced pharmaceutical technology & research, 2(2), 88–93. https://doi.org/10.4103/2231-4040.82952
Sineenat Wannuruk, 2012, Ownership in Social Media Account and Its Content in Light of Thai Laws, Thammasart Business Law Journal 6(1), 407
Sirichai Monkolkiatsri, (2001). A Self-judgement Measure and A Judicial Review by International Tribunals. Naresuan Law Journal, 4(2), 1-16
Stephen Ezell and Nigel Cory (2019). The Way Forward for Intellectual Property Internationally, Information Technology & Innovation foundation, (April 2019), 1-2
Thatchanan Issaradet, Vikorn Rakpuangchon and. Ingkarad Doljerm (2021). Guideline and Probability principles of Authorization rule Command from Goverbnment to Private. International Academic Journal, 2(2). 245-261
The DIP (2022) Mission Vision/Mission/Value http://www.ipthailand.go.th/en/vision-mission-values.html The Revenue Department of Thailand (2022). Concerning SME Business Operation SMEs / infographic.
https://www.rd.go.th/publish/fileadmin/user_upload/SMEs/infographic/360_1.pdf The OSMEP (2020). Report of MSME for the year of 2020 [White Paper]. the OSMPT.
https://www.sme.go.th/upload/mod_download/download-20200824164517.pdf The OSMEP (2021). Report of MSME for the year of 2021 [White Paper]. OSMPT.
https://www.sme.go.th/upload/mod_download/download-20210928132527.pdf The OSMEP (2022), Search/Register an SME. Enjoy SME’s rights and/or privileges.
https://members.sme.go.th/newportal/ The U.S. Department of Justice and the Federal Trade Commission (2017). Antitrust Guidelines for the Licensing of
Intellectual Property. IPguidelines. https://www.justice.gov/atr/IPguidelines/download Watinee Khamdee and Rungsang Kritayapong (2019). Legal Issues Relating to Legal Proceeding for Claiming
Compensation Regarding Joint Action of Monopolistic Competition or Restrict or Reduce Market Competition. Journal of Pacific Institute of Management Science, 5(1), 46-53

IAI Academic Conference Proceedings Virtual Conference, November & December, 2021 ________________________________________________________________________________________________________
69
Current trends and future directions in family business management
Miljan Adamović, MSc1, Stefan Milojević, MSc, CFA2
1 Pharmacy institution “ZDRAVLJE LEK” Kragujevac, Serbia; [email protected]
2 Audit, accounting, financial and consulting services company „Moodys Standards, Ltd., Belgrade, Serbia; [email protected] *Corresponding Author: e-mail: [email protected]
Abstract Family firms play an important role in the economies of many countries around the world. The family business is gaining increasing research attention, but also the attention of practitioners because a large part of companies around the world is organized as family business. The aim of this paper is to point out current trends and identify possible directions for the future development of family businesses. The impact that family firms have on a country's economy is quite relevant, so the family business is of great interest to both researchers and practitioners. The COVID-19 pandemic has affected family businesses as a threat to their business system, further deepening the importance of family business management research.
Keywords: family firms, business management, trends Introduction
The number of surveys related to family firms has increased recently, but it is still a new area of study. A family business can be defined in a variety of ways. However, there is no consensus on the exact definition of a family business, so there is still no generally accepted definition of a family business. The family is one of the most basic institutions of society (Kovjanić & Vukadinović, 2020). The definition of a family firms, goals, performance and financial structure are aspects that have been studied for several years. Researchers focus on the differences and similarities between family and non-family firms (Galupa, 2019).
According to Đurić (2015), "family firms range in size from manufacturers who employ a lot of people and have millions of euros in equipment, to lonely window washers with buckets and sponges." The family unit is, and has always been, the dominant operational group of societies in the entire world environment (Simonović et al., 2019). Traditionally, the definition of family firm includes one or more family members who have significant control over the company, due to their significant percentage of ownership (capital); (Allouche & Amann, 2000). Sharma et al. (1996) after a detailed review of the literature noticed the existence of as many as 34 definitions of family firms). At the most basic level, it can be defined as a company controlled by members of one family (Barry, 1975). This definition may include enterprises that comprised of only one owner (independent owners) and enterprises owned by a couple (often called co-entrepreneurs).
As Benavides-Velasco et al. (2013) point out that more effort is needed to consider the issue of family companies, which is very complex, and in particular, to identify similarities and differences in relation to other types of profit-oriented organizations. The paper identifies fundamental differences between the nature and functioning of family-owned and non-family firms, and some of them are: time horizon of management, implications of business failure, degree of job security, centralization of decision-making, responsibility for decision making and impact of the family system on the business system (Morris et al., 1997). In his paper, Reginald (1995) focused on defining the family business.
There is a great connection between the family and the family business. Hougaz (2015) states that due to the inseparability and synergy between family and business in family firms, family relationships, as well as family resources, are increasingly seen as key elements in the dynamics of a family business, keeping family and business as interdependent domains.
Family firms are widespread all around us: from local “mom-and-pop” stores and a large number of companies legally organized as small and medium, they support many economies to companies like BMW, Samsung and WalMart Stores (Collins, 2012). For many, the term "family business" means a small or medium-sized company with a local focus and a familiar set of problems. However, this description does not reflect the powerful role that family firms play in the world economy (Kachaner et al.).
Family firms can be viewed by size relative to non-family businesses. The larger family business seeks to remain strong and competitive with larger nonfamily companies in the domestic and foreign markets (Chang, 2022). According to Reginald (1995), the unusual problems faced by family firms have long been noticed by management scientists and practitioners. The results of the research showed that family firms located in provinces with better digital infrastructure are more likely to communicate more visions of digitalization and invest more significantly in digitalization. In addition, family firms that have completed the intergenerational succession process are more likely to communicate more visions of digitization (Liu, 2021).
IAI Academic Conference Proceedings Virtual Conference, November & December, 2021 ________________________________________________________________________________________________________
70
The results of the study by Asylum-Gbettor et al. (2021) pointed to heterogeneity in the definition of a family business, a limited study of ownership indicators and dimensions of corporate governance management in unlisted family firms, and excessive concentration on the financial measures of observed family firms. Family property can be seen as an opportunity or a threat, depending on a number of factors that affect it. Certainly, family ownership and commitment to work can be understood as added value, provided that the company and the controlling family can respond adequately to their investors (OECD).
The paper is organized as follows. The first chapter is dedicated to the specifics of the business of family firms. The second chapter presents current trends in the development of the family business and points to future directions. At the end of the paper, concluding remarks are given.
2. Specifics of family firms’ operations
In earlier years, the family business belonged to the category of sociology, and later to the category of small enterprises management, neither of which allowed this area to become recognizable, so it resulted in the less extensive literature on family firms compared to other areas of management. Perhaps somewhere around 80% of the world's firms are family firms, and just under half of Fortune 500 companies are family owned and controlled (Furnham, 2006). Over the last three decades, there has been a growing interest in looking at the contribution of family firms to the local and global economic landscape (Hougaz, 2015).
A family firm behaviour and conflict have also received significant attention spans as the primary research topic. Regardless of the fact that this area of research has a long history in the field of family firm, continuous interest in this topic suggests that the processes leading to the emergence and resolution of conflicts in family firms are still not fully understood (Debicki et al., 2019). The results of the Jones (2007) study reveal that family firms tend to have larger management teams than nonfamily firms. In this context, he further points out that the probability that family firms will do budget forecasting or make formal strategic/business plans is much less than with managers of non-family firms.
The issue of family capital management is one of the most important issues, and it certainly has certain specifics in relation to non-family firms. Together, all three types of family capital, namely social, human and financial, represent a significant part of the family firm's gross income and perceived success, especially in small firms (Danes et al., 2009).
The history of managing a family business captures the attention of many experts. Thus, the Family Firm Institute (FFI) is an international organization founded in Boston in 1988 consisting of the world's leading consultants for family firms, and defines family relationships as one of the aspects to be incorporated into family business management (FBM).
A particularly important factor for a family firm to function properly is that the relations between its members are transparent, clearly defined and based on the principle of efficiency. The intentions of the founders to pass on (or not pass on) their business to the next generation are still insufficiently researched (Brännback & Carsrud, 2012). As Olson et al. (2003) state that the results of their research have shown that the success of a business depends on family processes and the way the family reacted to the disorders, and not simply on how the owner-managed the business himself. Families are ready to make decisions that seem financially inexplicable and unprofessional, and which become logical in light of the family's desire to preserve socio-emotional wealth (Đurić, 2015).
Stoilkovska (2011) highlights two aspects of the specifics of working in family firms: by the advantages it offers and by the problems that arise from this kind of business. Knowing the factors that affect the effectiveness and efficiency of a family business allows for more efficient work, while a good story can turn into an unpleasant conflict and lead to discord in the family and at work. Observing leadership in family businesses should be considered in particular in family firms, leadership is also designed in a special way, relating to two areas to which each leader turns his or her strengths: family and firm (Perruta, 2011).
It is known that if there is good communication between family members, i.e., they build positive and strong relationships, they will share financial resources, give personal loans or gifts to other family members for various reasons (for business development or maintenance). When a family has a good reputation, there is room for additional funding that may be available from institutions and individuals outside the family (Sorenson, 2009).
3. Trends in the development of family business
In today’s competitive environment, the growth and survival of family firms depend significantly on the extent to which they can build, expand, or reconfigure organizational capabilities in response to a changing environment. Family firms are going through an extensive process of change in many countries. Family firms can be viewed as very special organizations because they demonstrate, test, and accumulate values embedded over the years in the policies and behaviours of senior managers and employees. In this context, it is pointed out that they are sometimes explicitly defined, and sometimes implicit, but in both cases, they have a clear impact on operating strategy and business (Simonović et al., 2019). When it comes to the role of women in the family business, some research has shown their good acceptance in their family companies, while they have not been able to reach that position in some other family companies despite being fully competent (Curimbaba, 2002).
Most of the data used to study the issue of compensation of executives in family firms is based on financial data. However, shifting interest toward family dynamics will require researchers to include factors such as emotions, perceptions, and behaviours associated
IAI Academic Conference Proceedings Virtual Conference, November & December, 2021 ________________________________________________________________________________________________________
71
with managerial compensation. One of the issues that have not yet received sufficient attention is the issue of social responsibility of family firms (Gallo, 2004).
The issues of family business and entrepreneurship should be considered together, because, among other things, there are different points in time where family and entrepreneurial dynamics intersect. These include (Dyer & Handler, 1994):
• early experiences in the family of the entrepreneur's origin; • family involvement and support for early initiation activities; • employment of family members in the new venture; and • participation of family members in the succession of ownership and management.
Family business continuity plans usually establish a management structure for the family and the family business. The purpose of these structures is to improve the strategy and mechanisms of family business control and to organize communication and the relationship between family owners and business leaders (Brenes et al., 2011). Establishing a formal board of directors is a key component of improving company performance and bringing peace to the family. Effective management is essential for increasing the capital of family firms. Another issue is gaining in importance, and that is the management of intellectual capital (Kovjanić & Vukadinović, 2021).
Family capital consists of resources within the family that can be made available to the company. If the resources or assets of a family firm exceed the liabilities, then it is a question of that family having family capital. In this context, the growing importance of adequate measurement of both the financial and non-financial performance of these firms is emphasized. To this end, it is important to implement a good system of accounting and other types of information in the firm (Mitrović & Knežević, 2018; Knežević et al., 2012).
The issue of implementing an accounting system that should provide the best possible platform for monitoring and evaluating performance should be considered in the context of the digital environment (Knežević et al., 2021). The accounting information system should be viewed as one of the important factors that can significantly influence the formation of a family business. A family business is a well-developed form of ownership around the world (Erbetta et al., 2013), and therefore it is important to consider all its specifics. In family firms, it is the family that plays a dominant role in a large number of cases in the strategic decision-making process (Michiels et al., 2021).
In his paper, Songini (2013) raises important research questions that link accounting and family business. These questions are as follows:
a) “Why has accounting, as one of the oldest disciplines in business, only recently begun to consider the family business, the predominant form of economic organization in the world, as a relevant research context?
b) What is the role of accounting in the family business? c) What accounting issues are relevant in the family business? d) How are different accounting practices applied in the family firm and how do they affect the different outcomes and
dynamics of the family business?“ Most theoretical and empirical studies of capital structure focus on public enterprises, which is not the case with small and
medium-sized enterprises. More research attention and effort from practitioners is needed to have more relevant theoretical and practical findings related to the factors influencing financing decisions of family firms’ owners (Romano et al., 2001). This would also contribute to the improvement of business through better recommendations related to investing capital in family firms. Research results have shown that family norms and attitudes towards external debt influence the intention of behaviour to use appropriate financial choices, which in turn influences financing behaviour (Koropp et al., 2014).
Today’s family firms face many factors that either facilitate or limit internationalization (Gallo & Sveen, 1991). In addition, it is important to emphasize that, despite the fact that family firms make up a significant part of most economies, their financial decisions (capital structure) have been relatively ignored by mainstream finance (Romano et al., 2001). The issue of family business professionalization is what most, if not all, leaders of growing family firms have to deal with at some point (Dyer, 1989), and the relevance of this issue continues to grow and is gaining in importance. 4. Conclusions
In a business world often plagued by corporate scandals, companies are needed that show how to strike a new balance between economic performance, organizational performance, and social impact. A real example of this is many family firms that are already showing the way to do it.
When looking at financial decisions, it should be pointed out that the behavior of family firms in relation to their financial decisions is unique because of their specific characteristics. Accounting as an information system is crucial for business decision making, and financial statements as a product of this system indicate the financial position, performance and cash flows of the company (Dimitrijević et al., 2018; Mitrović & Milašinović, 2021; Obradović et al., 2021). Managerial accounting is an area in the family business that requires increasing attention from accounting professionals. It is necessary to pay more attention to the possible tools of management accounting in terms of their more intensive application in the business of family firms, taking into account all the specifics of their operation.

IAI Academic Conference Proceedings Virtual Conference, November & December, 2021 ________________________________________________________________________________________________________
72
There is no transparent database in the Republic of Serbia on which companies are classified as family-owned. It is proposed to establish such a base, which would significantly encourage research in the field of family firms’ management. Further, it is necessary to give more importance to understanding the role and position of women in the family business, especially in the national context.
References 1) AL, Kayid, W., Jin, Z., Priporas, C-V., Ramakrishnan, S. Defining family business efficacy: An exploratory study. Journal
of Business Research. In press. https://doi.org/10.1016/j.jbusres.2021.11.081. 2) Allouche, J., & Amann, B. (2000). L’entreprise Familiale: Un état de l’art. Finance, Vol. 3, No 1, pp. 33-79. 3) Azila-Gbettor, E.M., Honyenuga, B.Q., Blomme, R.J. and Kil, A. (2021). Review of differences between listed and unlisted
family business research trends: a corporate governance context. Journal of Family Business Management, Vol. ahead-of-print No. ahead-of-print. https://doi.org/10.1108/JFBM-03-2020-0023.
4) Barry, B. (1975). The Development of Organization Structure in the Family Firm. Journal of General Management, Vol. 3, No 1, pp. 42-60.
5) Benavides-Velasco, C.A., Quintana-García, C., Guzmán-Parra, V.F. (2013). Trends in family business research. Vol. 40, No 1, pp. 41–57. doi:10.1007/s11187-011-9362-3.
6) Bird, B., Welsch, H., Astrachan, J. H., & Pistrui, D. (2002). Family business research: The evolution of an academic field. Family Business Review, Vol. 15, No 4, pp. 337–350.
7) Brännback, M., & Carsrud, A.L. (2012). “Intentions in the Family Business: The Role of Family Norms," International Studies in Entrepreneurship, in: ALAN CARSRUD & Malin Brännback (ed.), Understanding Family Businesses, chapter, pp. 27-38, Springer.
8) Brenes, E.R., Madrigal, K., Requena, B. (2011). Corporate governance and family business performance. Vol. 64, No 3, pp. 280–285. doi: 10.1016/j.jbusres.2009.11.013.
9) Chang, E.P.C., Zare, S., Ramadani, V. (2022). How a larger family business is different from a non-family one? Journal of Business Research, Vol. 139, pp. 292-302. https://doi.org/10.1016/j.jbusres.2021.09.060.
10) Collins, L. (2012). "The Family Business," Palgrave Macmillan Books, in: The Modern Family Business, chapter 1, pp. 3-44, Palgrave Macmillan.
11) Jones, O. (2007). The family businesses and business growth. International Journal of Entrepreneurial Behavior & Research, Vol. 13 No. 5, https://doi.org/10.1108/ijebr.2007.16013eaa.001.
12) Curimbaba, F. (2002). The Dynamics of Women's Roles as Family Business Managers. Vol. 15, No 3, pp. 239–252. doi:10.1111/j.1741-6248.2002. 00239.x
13) Danes, S.M., Stafford, K., Haynes, G., & Amarapurkar, S. S. (2009). Family capital of family firms: Bridging human, social, and financial capital. Family Business Review, No. 22, pp. 199-216.
14) Debicki, B. J.; Matherne, C. F.; Kellermanns, F. W.; Chrisman, J. J. (2009). Family Business Research in the New Millennium: An Overview of the Who, the Where, the What, and the Why. Family Business Review, Vol. 22, No 2, pp. 151–166. doi:10.1177/0894486509333598.
15) Dimitrijević, D., Obradović, V., & Milutinović, S. (2018). Indicators of fraud in financial reporting in the Republic of Serbia. Teme, XLII(4), 1319-1338, http://dx.doi.org/10.22190/TEME1804319D.
16) Đurić, Z. (2015). Menadžment porodičnog biznisa. Beogradska poslovna škola: Visoka škola strukovnih studija 17) Dyer, W.G., Handler, W. (1994). Entrepreneurship and Family Business: Exploring the Connections. Entrepreneurship
Theory and Practice, Vol. 19, No 1, pp. 71–83. doi:10.1177/104225879401900105. 18) Erbetta, F., Menozzi, A., Corbetta, G., Fraquelli, G. (2013). Assessing family firm performance using frontier analysis
techniques: Evidence from Italian manufacturing industries. Journal of Family Business Strategy, Vol 4, No 2, pp. 106–117. doi: 10.1016/j.jfbs.2013.04.001.
19) Furnham, A. (2006). "Family business," Palgrave Macmillan Books, in: Management Mumbo-Jumbo, pp. 58-59, Palgrave Macmillan.
20) Gallo, M.A. (2004). The Family Business and Its Social Responsibilities. Vol. 17, No 2, pp. 135–149. doi:10.1111/j.1741-6248.2004.00009. x.
21) Gallo, M.A., Sveen, J. (1991). Internationalizing the Family Business: Facilitating and Restraining Factors. Family Business Review, Vol. 4, No 2, pp. 181-190. https://doi.org/10.1111/j.1741-6248.1991.00181.x.
22) Galupa, R.M. (). FAMILY BUSINESS IN PORTUGAL: ANALYSIS OF THE FINANCIAL INDICATORS EVOLUTION, dissertation, https://repositorio.iscte-iul.pt/bitstream/10071/19524/1/master_raque_martins_galupa.pdf.
23) Hougaz, L. (2015). "The Role of Values in Family Business," Management for Professionals, in: Entrepreneurs in Family Business Dynasties, edition 127, chapter 3, pp. 27-37, Springer.
24) Hougaz, L. (2015). “Family Business Around the World," Management for Professionals, in: Entrepreneurs in Family Business Dynasties, edition 127, chapter 1, pp. 1-9, Springer.
25) https://www.ffi.org/membership/, pristupljeno 1.1.2022.

IAI Academic Conference Proceedings Virtual Conference, November & December, 2021 ________________________________________________________________________________________________________
73
26) Kachaner, N., Stalk, Jr., G., Bloch, A. What You Can Learn from Family Business. Harvard Business Review https://hbr.org/2012/11/what-you-can-learn-from-family-business.
27) Keasey, K., Martinez, B., Pindado, J. (2015). Young family firms: Financing decisions and the willingness to dilute control. Journal of Corporate Finance, Vol. 34, pp. 47–63. doi: 10.1016/j.jcorpfin.2015.07.014.
28) Knežević, S, Obradović, T., Mitrović, A., Milašinović, M. (2021). Računovodstveni informacioni sistemi u digitalnom okruženju (Accounting information systems in digital environment). SPIN 21 „Industrija 4.0 - mogućnosti, izazovi i rešenja za digitalnu transformaciju privrede“, Beograd, 8 - 9. novembar 2021. godine, Zbornik radova, ISBN: 978-86-7680-396-5, str. 390-398.
29) Knežević, S., Stanković, A., Tepavac, R. (2012). Accounting Information System as a Platform for Business and Financial Decision-Making in the Company. Management - Journal for Theory and Practice Management, 65(17), 63-69.
30) Knežević, S., Stanković, A., Tepavac, R. (2012). Accounting Information System as a Platform for Business and Financial Decision-Making in the Company. Management - Journal for Theory and Practice Management, Vol. 65, No 17, pp. 63-69.
31) Koropp, C., Kellermanns, F.W., Grichnik, D., Stanley, L. (2014). Financial Decision Making in Family Firms: An Adaptation of the Theory of Planned Behavior. Family Business Review, Vol. 27, No 4, pp. 307–327. doi:10.1177/0894486514522483.
32) Kovjanić, M., Vukadinović, P. (2020). „Evaluation of financial performance of small family business for the purpose of efficient financial decision-making of owners”. International Academic Journal, 1(1), pp. 13-23. ISSN 2671-3748, International Academic Institute, Skopje, Republic of N. Macedonia.
33) Kovjanić, M., Vukadinović, P. (2021). Intelektualni kapital kao strateška performansa banke sa osvrtom na banke. Bankarstvo, Vol. 50, No 1, pp. 90-107.
34) Liu, Z. (2021). How Do Family Firms Respond Strategically to the Digital Transformation Trend? Academy of Management Annual Meeting Proceedings, 1, https://doi.org/10.5465/AMBPP.2021.14879abstract.
35) Michiels, A., Botero, I.C., Kidwell, R.E. (2021). Toward a Family Science Perspective on Executive Compensation in Family Firms: A Review and Research Agenda. Family Business Review. https://doi.org/10.1177/08944865211064410.
36) Michiels, A., Botero, I.C., Kidwell, R.E. (2021). Toward a Family Science Perspective on Executive Compensation in Family Firms: A Review and Research Agenda. Family Business Review, pp. 1–23. https://doi.org/10.1177/08944865211064410.
37) Mitrović,A.,&Milašinović,M.(2020).SpecificsoffinancialreportingofhotelcompaniesintheRepublicofSerbia.ScientificConferenceAccountingandauditintheoryandpractice(pp.33-45).BanjaLuka,RepublikaSrpska:BanjaLukaCollege.
38) Mitrović, A., Knežević, S. (2018). Role and importance of accounting information systems in the context оf accounting information, Economics in the digital age, Higher School „Banja Luka College“ (Banja Luka, Bosnia and Herzegovina), Higher business school of vocational studies (Leskovac, Serbia), Faculty of Management, Business and Informatics (Novo mesto, Slovenia) and University „Knight“ (Travnik, Bosnia and Herzegovina), Banja Luka College, Banja Luka., 26th of May 2018, pp. 246-257. DOI: 10.7251/ZBLCO118015M, UDK: 007:657]:004, ISBN 978-99938-1-338-5.
39) Morris, M.H., Williams, R.O., Allen, J.A., Avila, R.A. (1997). Correlates of success in family business transitions, Vol. 12, No 5, pp. 400–401. doi:10.1016/s0883-9026(97)00010-4.
40) Obradović, V., Milašinović, M., & Bogićević, J. (2021). Obelodanjivanja o segmentima u finansijskim izveštajimaakcionarskih društava u Republici Srbiji i Republici Hrvatskoj. Ekonomski horizonti, Vol. 23, No 1, pp. 55-70,https://doi.org/10.5937/ekonhor2101055O.
41) OECD. Chapter 5 Governance Challenges for Family-Owned Businesses. Practical Guide to Corporate Governance. www.oecd.org.
42) Olson, P.D., Zuiker, V.S., Danes, S.M., Stafford, K., Heck, R.K.Z., Duncan, K.A. (2003). The impact of the family and the business on family business sustainability, Vol. 18, No 5, pp. 639-666. doi:10.1016/s0883-9026(03)00014-4.
43) Peruta, M.R.D. (2011). "Family Business: Leadership and Succession," Innovation, Technology, and Knowledge Management, in: Knowledge and the Family Business, pp. 73-107, Springer.
44) Radonić, M., Knežević, S., Mitrović, A., Milojević, S. (2020). How does the intangible asset affect company efficiency? Evidence from the listed companies in Serbia's meat industry, Custos e Agronegócio Online, 16(4), 51-78.
45) Reginald, A. L. (1995). The Family Business: Toward Definitional Clarity. Vol. 8, No 2, pp. 71–81. doi:10.1111/j.1741-6248.1995. 00071.x.
46) Romano, C.A., Tanewski, G.A., Smyrnios, K.X. (2001). Capital structure decision making: A model for family business. Vol. 16, No 3, pp. 285–310. doi:10.1016/s0883-9026(99)00053-1.
47) Sharma, P., Chrisman, J., Chua, J. (1996). A Review and Annotated Bibliography of Family Business Studies, Boston: Kluwer.
48) Simonović, D., Joksić, J., Travica, J. (2019). Menadžment porodičnih preduzeća, Visoka škola strukovnih studija, Aranđelovac.
49) Songini, L., Luca, G., Teemu, M. (2013). The role and impact of accounting in family business. Journal of Family Business Strategy, Vol. 4, No 2, pp. 71–83. doi: 10.1016/j.jfbs.2013.04.002.
IAI Academic Conference Proceedings Virtual Conference, November & December, 2021 ________________________________________________________________________________________________________
74
50) Sorenson, R.L. (2009). Family Capital, Family Business, and Free Enterprise Family Business Review, Vol. 22, No 3, pp. 193-195, doi: 10.1177/0894486509341178 http://fbr.sagepub.com.
51) Stoilkovska, A. (2011). "The Challenges of Family Business," UTMS Journal of Economics, University of Tourism and Management, Skopje, Macedonia, Vol. 2, No 2, pp. 181-188.