
3 Pak-Turk International Conference Proceedings (Local)
179
3 rd Pak-Turk International Conference on Emerging Technologies in the field of Sciences and Engineering 9-10th, June 2020 1 3 rd Pak-Turk International Conference Proceedings (Local) Organized by Ghulam Ishaq Khan Institute of Engineering Sciences & Technology, Topi (GIKI)
-
Upload
khangminh22 -
Category
Documents
-
view
1 -
download
0
Transcript of 3 Pak-Turk International Conference Proceedings (Local)

3rd Pak-Turk International Conference on Emerging Technologies in the field of Sciences and Engineering
9-10th, June 2020
1
3rd Pak-Turk International
Conference Proceedings (Local)
Organized by
Ghulam Ishaq Khan Institute of Engineering
Sciences & Technology, Topi (GIKI)

3rd Pak-Turk International Conference on Emerging Technologies in the field of Sciences and Engineering
9-10th, June 2020
2
An Overview of Stability and Performance
Analysis of Hybrid Vertical Take-off and
Landing Unmanned Aerial Vehicle
Anas Manzoor Khan, Aamer Shahzad,Taimur Ali Shams
Department of Aerospace Engineering, College of Aeronautical Engineering
National University of Sciences and Technology, Pakistan
Abstract—Hybrid vertical takeoff and landing
unmanned air vehicles are nowadays under
consideration because of their longer range, take-off
and landing ability at any desired point and cruise
capabilities. In this paper, different types of such
vehicles and their configurations are explained. The
flight regime of these vehicles is divided into three
categories, that is, vertical take-off, transition and
cruise flight. In addition, aerodynamic analysis of
different hybrid vertical takeoff and landing
unmanned aerial vehicles including tilt-wing, the
tilt-rotor unmanned air vehicles and a separate lift
and thrust unmanned air vehicles (having rotors at
the mid-span of the wing) have been explained. In
most of the cases, essential aerodynamic
characteristics are obtained from the six-degree
freedom of equations derived from Newton's second
law of motion and computational fluid dynamics.
Since the two main parameters in hover mode are
thrust co-efficient and the inflow ratio. Therefore
equations for the calculation of these parameters are
given in the paper. This paper also gives an overall
brief of the methods used for the calculation of
stability and performance parameters in both the
hover and forward flight mode.
Keywords - Vertical take-off and landing; unmanned
aerial vehicle;tilt-wing;tilt-rotor;blendedwing;transition
flight
I. INTRODUCTION
For the past several years, there is a great
development in the field of Unmanned Aerial
Vehicles (UAVs). Recently, UAVs have been used
both for civil and military purposes such as
reconnaissance, surveillance, and security
reinforcement. Basically, UAVs are of two types
these are fixed-wing and rotorcraft UAVs. Fixed-
wing UAVs are more suitable for high cruise speed,
Nomenclature
UAV Unmanned aerial vehicle Cm Coefficient of moment
SLT Separate lift and thrust VT Flight speed (m/sec)
QTW Quad tilt wing Tcoax Coaxial fan thrust (N)
CFD Computational fluid dynamics iT Tilt angle (deg)
VTOL Vertical take-off and landing α Angle of Attack (deg/°)
CD Coefficient ofdrag RPM Revolution per minute
CL Coefficient of lift
η elevator deflection

3rd Pak-Turk International Conference on Emerging Technologies in the field of Sciences and Engineering
9-10th, June 2020
3
effective range, and endurance but actually needs
runways for controlled take-off and landing. On the
other hand the rotorcraft UAVs have a shorter range
and endurance hence they are not suited for long
range missions but are effective for short take-off
and landing. Hybrid UAVs have the advantages of
both fixed-wing and rotorcraft UAVs(i.e., vertical
take-off, transition, and cruise) and they are,
therefore, effective for longer range and endurance.
II. TYPES OF HYBRID VTOL UAVs
As mentioned in [1], there are basically two types of
Hybrid UAVs these are convertiplane and tail-sitter.
A convertiplane UAVs generally has transition
mechanisms for transferring from vertical mode to
cruise mode and from cruise mode to vertical mode
for landing. While tail-sitter UAVs takes off and
lands vertically on its tail, and the whole of the
airframe is tilted in order to complete cruise flight.
A. Convertiplane
Main types of these UAVs are: (a) tilt-rotor UAVs,
(b) tilt-wing UAVs and c) Dual systems
a) Tilt-Rotor
In tilt-rotor UAVs there are a different numbers of
rotors that are installed on tilting shafts. For a
transition from hover to cruise flight, rotors actually
get tilted in a horizontal until the cruise flight is
achieved. Furthermore, these tilt-rotor UAVs are
subdivided into three categories: a) bi-rotor, b) tri-
rotor, and c) quad-rotor.
As mentioned by the name, bi-rotor convertiplane
UAVs generally have two tilting rotors which help
in thrust in the vertical direction and for providing
sufficient lift during a cruise and several control
surfaces for different kind of motions (yaw, pitch,
and roll). An example is the Bell Eagle Eye UAV [2]
having rotors mounted on the wingtips.
In tri-rotor convertiplane UAVs there are three
rotors mounted at different places and are upward in
direction. For the transition one or multiple rotors
get tilted to providing thrust in the vertical direction
and in cruise mode, it works similarly as the bi-
rotors (i.e., lift is provided by the rotor sand control
surfaces are used for roll, pitch and yaw motions).
Examples are TURAC and FireFLY6.Both are the
type of tri-rotor convertiplane UAVs but the
difference comes in flight mode i.e. hover mode
where TURAC [3] uses a co-axial rear rotor while
FireFLY6 [1] uses the Y-6 (i.e., three co-axial
rotors) configuration.
b) Tilt-Wing
In tilt-wing convertiplane UAVs, complete or partial
wing along with the rotors are tilted together during
hover to cruise transition. For different flight
regimes the wings are actually in the upward
direction, which actually makes it susceptible to
crosswind and thus greater work is required for
developing a controlling procedure for attitude
stability. There are two main types of tilt-wing
convertiplane UAVs: single-wing configuration and
tandem-wing configuration.
In the single-wing configuration, the
commonly used UAVs are Harvee, AVIGLE,
GLVTOL Drone and AT-10 Responder. In
Harvee [4], there are two fixed-pitch motors
which are placed below the wings of UAV.
While for a transition from hover to cruise
tilting of the whole wing is required. In hover-
mode, the thrust for Harvee is provided in a
similar manner as in a bi-rotor convertiplane
UAV. In AT-10Responder [7] there are two
parts of the wing. Only the inner part with the
rotors placed on the leading edge of the UAV
can tilt. Whereas in AVIGLE [5, 16] in hover
mode the thrust is actually provided by tilted
propeller engines along with the deflected flaps.
On the other hand, in GL VTOL Drone [6] for
thrust in vertical direction and control
mechanism, there are ten fixed-pitch rotors (out
of which eight are located on the wings and the
rest two are placed on horizontal stabilizers).
c) Dual-System
In this type of convertiplane UAVs [1] there are
two sets of propulsion systems: one set of rotors
for vertical take-off and landing while another set
has tractor or pusher configuration for cruise
flight. No tilting mechanism is needed for these
UAVs. Whereas in cruise flight there is actually
extra drag force on the UAV due to the non-usage
of these fixed rotors in the cruise flight, results in
putting more load on tractor or pusher propeller.
The most commonly used types are multi-rotor
with tractor configuration and multi-rotor with a
pusher configuration. Tractor configuration is the
one in which the propeller is placed in front of the
wing. The flight of this configuration involves
vertical take-off using quad-copter while the
horizontal thrust motor remains powered off. The
transition mode involves the turning off of quad-
copter and starting of horizontal thrust motor
simultaneously. Once the aircraft has attained
horizontal velocity equal to stall velocity the quad-
copter motors are turned off.
B. Tail-Sitter

3rd Pak-Turk International Conference on Emerging Technologies in the field of Sciences and Engineering
9-10th, June 2020
4
In this type of the hybrid UAV tail is the major
contributor for vertical take-off and landing and
the entire airframe is actually tilted to achieve
cruise flight. The flight can be summarized as
follow:
At the start, power is supplied by the motors and the
UAV rise vertically in the air at an appreciable
height where it is slowly tilted through manipulation
of the elevator devices and then proceeds further like
a fixed-wing aircraft, the sustaining force of the
propeller being replaced by the vertical reaction.
During landing, the forward speed of the aircraft is
reduced and the props are vertically tilted again,
causing the UAV to act as a helicopter with the
propeller supporting the complete load of the
aircraft.
III. AERODYNAMIC ANALYSIS
Over the past ten to twenty years, the category of
UAVs which has been under consideration for the
stability and performance analysis are the tilt rotor
and the tilt-wing UAVs in which the tilt angle of the
rotors and the wings starts to decrease during
transition and finally both the wings and rotors are
in horizontal position during the cruise. The flight
regime of the UAV is divided into a hover, transition
and cruise flight [12].
Hover mode: For hover flight there are two factors
that are under consideration: thrust and drag.
Transition mode: In transition phase, the important
parameter is the changing speed of the propellers for
transition and the use of control surfaces is thought
to be secondary.
Forward flight mode: In this mode i.e. the airplane
mode UAV has gained the required velocity (which
is above the stall speed) so that it can generate
enough aerodynamic forces to provide sufficient lift
and is able to control the flight.
In another research done by Daud Filho et
al.[9],multi-body equations of motion for Semi-
tandem wing VTOL UAV are developed which are
used to compute the trim curves(tilt angle vs flight
speed, elevator angle vs velocity and angle of attack
vs velocity) for the transition phase from hovering
to cruise condition. These curves help us to
determine tilt angles of the wing and the horizontal
tail during hovering and cruise.
Fig. 1.Wing and horizontal tail tilt angles vs flight speed [9]
For mathematical modeling of the TURAC, the 3-D
Computational fluid dynamics data [12] for forward
flight at a different angle of attacks which includes
the stall effect as well is obtained. Then at different
forward velocities, same aerodynamic coefficients
are used for calculations of transition phase.
In another research [12], aerodynamic analysis of
tilt-rotor UAV i.e. TR-E2S1 was done by deflecting
the control surfaces and by varying the angle of
attack and sideslip angle the aerodynamic stabilities
were analyzed then comparing these results with the
wind tunnel testing results. The figure 2 [12] below
tells us that as the elevator deflection angle increases
lift increases linearly.
Fig. 2.Variaton of lift coefficient with control surface
deflections [12]
In another research paper by Tomasz Kudala et
al.[13] the Hybrid VTOL UAV is of the tilt rotors
mechanism(only rear motors are tilted).In the
transition phase the motors on the rear wing are
gradually tilted into horizontal position(from
vertical position in vertical take-off)for increasing
forward speed whereas the front rotors are slowly
turned off because they only disturb the airflow(in
standard flight mode), without sufficiently
increasing the lift that is produced on the wing.
During cruise UAV acts like a simple conventional
aircraft with control surfaces which are aileron,
3rd Pak-Turk International Conference on Emerging Technologies in the field of Sciences and Engineering
9-10th, June 2020
5
elevator, and rudder for providing roll, pitch and
yaw motions.
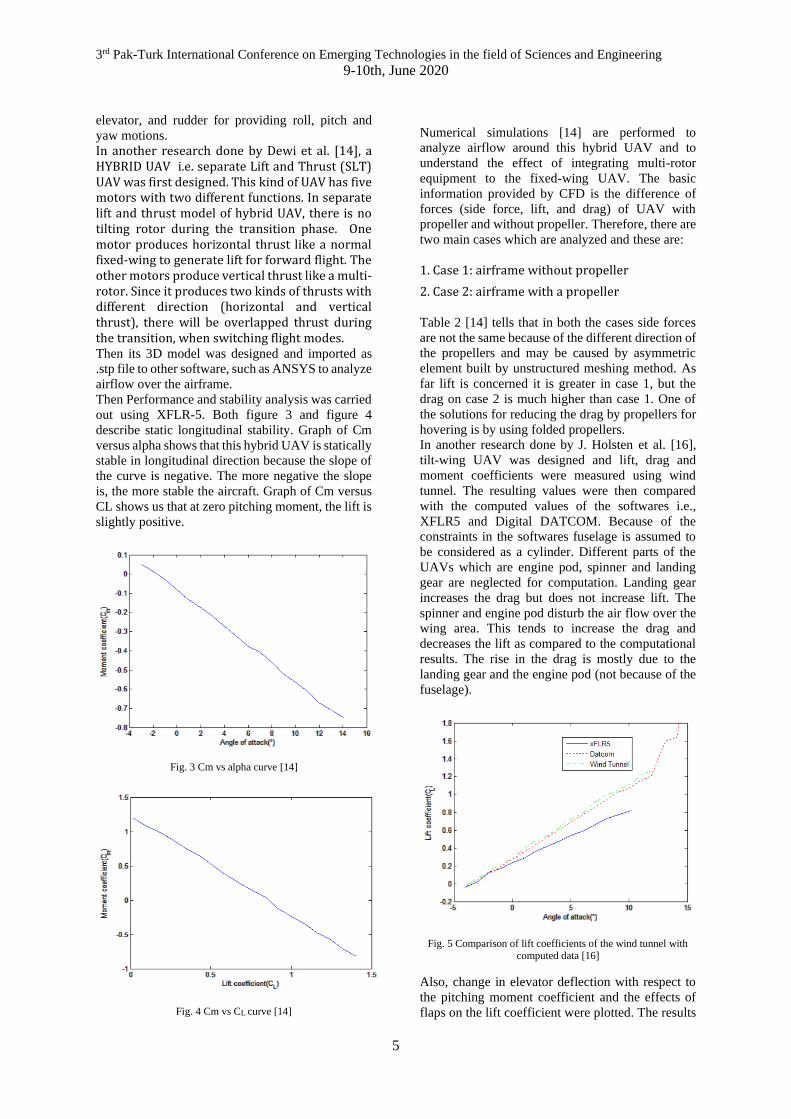
In another research done by Dewi et al. [14], a HYBRID UAV i.e. separate Lift and Thrust (SLT) UAV was first designed. This kind of UAV has five motors with two different functions. In separate lift and thrust model of hybrid UAV, there is no tilting rotor during the transition phase. One motor produces horizontal thrust like a normal fixed-wing to generate lift for forward flight. The other motors produce vertical thrust like a multi-rotor. Since it produces two kinds of thrusts with different direction (horizontal and vertical thrust), there will be overlapped thrust during the transition, when switching flight modes. Then its 3D model was designed and imported as
.stp file to other software, such as ANSYS to analyze
airflow over the airframe.
Then Performance and stability analysis was carried
out using XFLR-5. Both figure 3 and figure 4
describe static longitudinal stability. Graph of Cm
versus alpha shows that this hybrid UAV is statically
stable in longitudinal direction because the slope of
the curve is negative. The more negative the slope
is, the more stable the aircraft. Graph of Cm versus
CL shows us that at zero pitching moment, the lift is
slightly positive.
Fig. 3 Cm vs alpha curve [14]
Fig. 4 Cm vs CL curve [14]
Numerical simulations [14] are performed to
analyze airflow around this hybrid UAV and to
understand the effect of integrating multi-rotor
equipment to the fixed-wing UAV. The basic
information provided by CFD is the difference of
forces (side force, lift, and drag) of UAV with
propeller and without propeller. Therefore, there are
two main cases which are analyzed and these are:
1. Case 1: airframe without propeller
2. Case 2: airframe with a propeller
Table 2 [14] tells that in both the cases side forces
are not the same because of the different direction of
the propellers and may be caused by asymmetric
element built by unstructured meshing method. As
far lift is concerned it is greater in case 1, but the
drag on case 2 is much higher than case 1. One of
the solutions for reducing the drag by propellers for
hovering is by using folded propellers.
In another research done by J. Holsten et al. [16],
tilt-wing UAV was designed and lift, drag and
moment coefficients were measured using wind
tunnel. The resulting values were then compared
with the computed values of the softwares i.e.,
XFLR5 and Digital DATCOM. Because of the
constraints in the softwares fuselage is assumed to
be considered as a cylinder. Different parts of the
UAVs which are engine pod, spinner and landing
gear are neglected for computation. Landing gear
increases the drag but does not increase lift. The
spinner and engine pod disturb the air flow over the
wing area. This tends to increase the drag and
decreases the lift as compared to the computational
results. The rise in the drag is mostly due to the
landing gear and the engine pod (not because of the
fuselage).
Fig. 5 Comparison of lift coefficients of the wind tunnel with computed data [16]
Also, change in elevator deflection with respect to
the pitching moment coefficient and the effects of
flaps on the lift coefficient were plotted. The results

3rd Pak-Turk International Conference on Emerging Technologies in the field of Sciences and Engineering
9-10th, June 2020
6
of flaps deflection are in accordance with the
DATCOM computational data. The trend of the
computational data is not identical because of the
tail-plane airfoil which is a symmetrical and, hence,
the deflections should differ in their effect as seen
from measurements.
Also, the measurements are done for different values
of thrust in order to cater for greater overlap of
propeller area and wing. For cruise flight, in order to
ensure reproducibility, three different thrust levels
were set and all the measurements were repeated
once.
In another Research done by Muraoka et al. on QTW
UAV [7], in which important aerodynamic
parameters are measured from wind tunnel data.
And lift coefficient was measured and its
comparison with the tilt-angle of the front wing was
measured. These lift coefficients include lift
generated by both the wing and propeller thrust.
In another research done by Hong et al.[15],
longitudinal flight characteristics of the single tilt-
wing UAV are calculated. The methodology used is
first aerodynamics forces and moments plus
propulsive forces acting on the UAV are calculated
by equations given in [16] which includes the forces
and moments for the wetted area due to the
slipstream, unwetted area, and free stream area.
When the wing is tilted, then aerodynamic forces
and moments are produced because of the wetted
area in the slipstream and are effected by the change
in induced velocity and not by change in the tilt
angle.
Fig.6 Longitudinal trim condition (RPM vs time) [15]
In another research done by Ozdemir et al. [17],
aerodynamic analyses of the TURAC was carried
out by using Vortex Lattice method in which first all
the parameters were separately defined in the
software and the geometry was created. Then each
component was further separated into number of
panels and the aerodynamic parameters i.e. lift
coefficient, drag coefficient and induce drag
coefficient were calculated across different angle of
attack. Then CFD analysis was done for different
angle of attack and for open and close fan concept
of the TURAC. Now in open fan design lift actually
decreases but drag coefficient increases because of
vortices that are present in the open fan design as
compared to the close fan design.
Similarly momentum theory and blade element
theory is used to calculate the performance in hover
and vertical climb but they are not suitable because
they have lot of assumptions like inflow is uniform,
flow is incompressible as mentioned in [18].Hence
blade element momentum theory which is a hybrid
of both momentum and blade element theory is used
to compute the different performance parameters
like coefficient of thrust , induce power and inflow
ratio. Just like rotor power coefficient in hover flight
can be calculated by using the following equation:
𝐶𝑝 = 𝐾𝐶𝑤
1.5
2½+
σCdo
8
Where Cw is the weight coefficient, 𝐾 is the induced
power factor of the rotor, Cdo is the parasite drag and
σ is the solidity ratio. Similarly coefficient of thrust
for optimum rotor can be calculated by using the
equation given below:
𝐶𝑇 =𝑁𝑏𝑐𝑡𝐶𝑙4 ∗ 𝑝 ∗ 𝑅
Where Nb is the number of blades, ct is the tip
chord which has different value for different rotors
and Cl is the lift coefficient. Since blade element
theory accounts for the losses of non-uniform
inflow therefore its equation for the inflow in hover
mode is:
𝜆 = √(σClα16
)2 +σClαѲr
8𝑅−σClα8
IV. CONCLUSION
The work done on the aerodynamic analysis of
different type of UAVs suggest that methodology
used for the calculation of aerodynamic parameters
is the same i.e. six degrees of freedom equation are
used to calculate the aerodynamic parameters(lift
coefficient, drag coefficient and moment
coefficient) for different flight regimes and the
graphs are plotted to show that these UAVs are
stable in those flight regime but the difference is the
configuration of UAVs which have gone under
consideration over the past years. Mostly tilt-rotor
UAVs and tilt-wing UAVs are being investigated
extensively. The tilt-wing UAVs have some
advantages as compared to tilt-rotor UAVs because
tilting of wing along with the rotor results in an
increase in aerodynamic flow over wing which
actually goes and help in transition flight regime
plus reducing the loss of lift due to downward
slipstream in hover. Similarly, tilt-rotor UAVs are

3rd Pak-Turk International Conference on Emerging Technologies in the field of Sciences and Engineering
9-10th, June 2020
7
preferred over separate lift and thrust (SLT) UAVs
because SLT UAVs produces more drag because of
their rotors which are only helping in vertical take-
off as compared to tilt-rotor UAVs in which these
motors get tilted during the transition(helps in
vertical take-off) and also then helps in the cruise
flight.
V. REFERENCES
[1] Saeed, A.S., Younes, A.B., Cai, C. and Cai,
G. (2018). A survey of hybrid Unmanned Aerial
Vehicles. Progress in Aerospace Sciences, 98,
pp.91–105
[2] UgurOzdemir, YasinDereli, Aktas,
YucelOrkut,AslihanVuruskan, BurakYuksek,
Ahmed Farabi Tarhan, Aykut Cetin "A low-cost
prototyping approach for design analysis and flight
testing of the turac VTOL UAV." Int. Conference on
Unmanned Aircraft Systems (ICUAS), pp. 1029-
1039, 2014.
[3] ValanaL. Wells,Jeffrey J, Dickeson, David
Miles, OguzhanCifdaloz,and Armando A.
Rodriguez. "Robust lpv h gain-scheduled hover-to-
cruise conversion for a tilt-wing rotorcraft in the
presence of CG variations."American Control
Conference, pp. 5266-5271, 2007.
[4] Holsten, J., Ostermann, T. and Moormann,
D. (2011). Design and wind tunnel tests of a tilt-
wing UAV. CEAS Aeronautical Journal, 2(1–4),
pp.69–79.
[5] Ten-engine electric plane completes successful
flight test, [Online], [cited 5 December 2017]
(2015).
URL https://www.nasa.gov/langley/ten-engine-
electric-plane-completes-successful-flight-test
[6] M. Streetly, IHS Jane's all the world aircraft:
Unmanned 2013-2014, IHS,2013.
[7] Muraoka, Koji,Daisuke Kubo, and Noriaki
Okada. "Quad tilt-wing VTOL UAV: Aerodynamic
characteristics and prototype flight."AIAAAerosp.
Conference, pp. 1834, 2009.
[8] B. Coxworth."Quadshot RC aircraft combines
quadricopter hovering with airplane flight", 2017.
URL http://www.gizmag.com/quadshot-hovers-
andflies/19449/
[9] DaudFilho, Antonio Carlos, and Eduardo
Morgado Belo. "Flight Dynamics Modeling and
Trim Curves of a conceptual Semi-Tandem Wing
VTOL UAV."
[10] R.C Nelson. "Flight Stability and Automatic
Control." 2nd ed., Singapore, McGraw-Hill, ch.3-5,
1998.
[11] Burak, Yuksek, UgurOzdemir,
AslihanVuruskan M. A. Yukselen, and
GökhanInalhan. "Transition flight modeling of a
fixed-wing VTOL UAV." J. Intelligent & Robotic
Systems 84, no. 1-4, pp. 83-105,2016.
[12] Kim, C. and Chung, J. (2006). Aerodynamic
analysis of tilt-rotor Unmanned Aerial Vehicle with
computational fluid dynamics. Journal of
Mechanical Science and Technology, 20(4),
pp.561–568.
[13] Czyba, R., Lemanowicz, M., Gorol, Z. and
Kudala, T. (2018). Construction Prototyping, Flight
Dynamics Modeling, and Aerodynamic Analysis of
Hybrid VTOL Unmanned Aircraft. Journal of
Advanced Transportation, 2018, pp.1–15.
[14] Dewi, P.T., Hadi, G.S., Kusnaedi, M.R.,
Budiyarto, A. and Budiyono, A. (2016). Design of
Separate Lift and Thrust Hybrid UAV. The Journal
of Instrumentation, Automation and Systems, 2(2),
pp.45–51
[15] Hong, S., Jeong, J., Kim, S., Suk, J. and Jung,
J.I. (2013). Longitudinal Flight Dynamics of a
Single Tilt-wing Unmanned Aerial Vehicle. IFAC
Proceedings Volumes, 46(19), pp.60–65.
[16] Holsten, J. and Moormann, D. (2014). Flight
control law design criteria for the transition phase
for a tiltwing aircraft using multi-objective
parameter synthesis. CEAS Aeronautical Journal,
6(1), pp.17–30.
[17] Ozdemir, Ugur, Yucel Orkut Aktas,
AslihanVuruskan, YasinDereli, Ahmed
FarabiTarhan, KaracaDemirbag, Ahmet Erdem,
GanimeDuyguKalaycioglu, Ibrahim Ozkol, and
GokhanInalhan. "Design of a commercial hybrid
VTOL UAV system." Journal of Intelligent &
Robotic Systems 74, no. 1-2 (2014): 371-393.
[18] J.G Leishman. "Principles of Helicopter
Aerodynamics." 2nd ed., Cambridge University
press, 200

3rd Pak-Turk International Conference on Emerging Technologies in the field of Sciences and Engineering
14-16, April 2020
8
Critical Study on Design of High-Speed Weapon
Capable Drone and Advancements in
Drone Technology
Hammas Bin Shahab, Nadeem Hussain Shah, Muhammad Jameel
Aerospace Engineering Department, College of Aeronautical Engineering
National University of Science & Technology, Pakistan
Abstract— In the last couple of decades, drone technology has advanced a lot and has become a branch of keen interest for students and research organizations. With these advancements, several new profiles and platforms for drones have been developed ranging from the military application to surveillance, reconnaissance, and agricultural purposes. This paper is an effort to study the multiple drone platforms available with a detailed study on quad-copter or quad-rotor. Quad-rotors are being frequently used by various researchers as this platform has a better tendency of performing tasks because of efficient and stable design configuration. The current utilization of this platform and its potential for Killer Drones is also discussed. The paper also covers multiple concepts approaches for damping or restricting motion due to the impact of fire from weapon mounted on a drone. The paper includes a feasibility study of these initially selected concepts i.e. varying propeller RPM of quad-copter for balancing the impact of weapon, use of damping mechanical structure & damping Fluid to reduce the impact and use of 3-D gimbals to constraint motion and stabilize Drone. The paper investigates the feasibility of all available platforms and mentioned approaches to predict the most appropriate combination for High-Speed Weapon Capable Killer Drone
Keywords – Platform, quad-copter, gimbals, feedback control, navigation, damping fluid
I. INTRODUCTION
In the past few years, an increasing interest is being invested
in the development of small Unmanned Aerial Vehicles
(UAVs). They are being employed by the civil sector for
search and rescue during a disaster, geological surveying and
mapping, agriculture and law enforcement. While the defense
and military are utilizing UAVs for reconnaissance,
intelligence data gathering as well as aerial targeting. Their
main advantage is that they can be remotely piloted from any
location, meaning the pilot is always safe. It also means that
UAVs allow us to explore unchartered territories and perform
missions that were humanly not possible.
II. LITERATURE REVIEW FOR PLATFORM
Based on the physical design and configuration, UAVs are
classified into 3 major categories:
• Fixed-wing Aircraft
• Multi-Rotor Aircraft
• VTOL Hybrid Aircraft
The most commonly known platform is the fixed-wing
aircraft. They are the simplest of all and have advantages of
long endurance and range. However, they require runways
to take-off and land. Some may be hand or catapult-launched
and recovered in the net trap or land via parachute. This
limits their operation in congested areas and requires an
open field for take-off and landing. Rotary wing UAVs on the
other hand, can vertically take-off and land almost anywhere.
III. FIXED-WING AIRCRAFT
Fixed-wing aircraft are conventional aircraft:
Figure 1 – Conventional Fixed Wing RC Aircraft

3rd Pak-Turk International Conference on Emerging Technologies in the field of Sciences and Engineering
14-16, April 2020
9
Table 1 – Classification of Flying Vehicle
These aircraft have multiple advantages and disadvantages
as discussed below:
ADVANTAGES
• Fixed-wing aircraft have longer endurance
• Fixed-wing aircraft can attain higher speeds
• They have a longer range
DISADVANTAGES
• Fixed-wing aircraft cannot hover
• Cannot work well space constraint environment
IV. MULTIROTOR AND ITS TYPES
Multirotor is the RC aircraft that provide thrust in the
vertical direction and are capable of vertical take-offs and
landings.
Figure 2 – Quadcopter Drone [2]
These aircraft have multiple advantages and disadvantages
as discussed below:
ADVANTAGES
• It may Take-off/Land from any surface
• They can hover at a single point
• No landing approach is required
• They can provide security and surveillance in a
time and space constraint environment
DISADVANTAGES
• Multi-rotors have short endurance
V. QUAD COPTERS
Quadcopters are primarily used to incorporate VTOL (Vertical
Take-off and Landing) capabilities in fixed-wing RC aircraft.
Quadcopters are inherently unstable and rely on four
propellers for their control and maneuverability.
Quadcopters are further divided into two categories:
• Fixed rotors
• Tilt rotors
A comparison between them can be made as:
• Fixed rotors are VTOL efficient
• Tilt rotors can have higher speeds.
• Tilt rotors have longer endurance time
• Tilt rotors can provide efficient in air braking
VI. VTOL FEATURE IN FIXED WING
Either tilt rotors configuration or fixed rotors configurations
can be used to incorporate the VTOL mechanism in fixed-
wing RC aircraft. Configurations which involve the use of tilt
rotors in a fixed-wing to make them VTOL capable areas
follow:
1. Quad Tilt wing
2. Bi-Tilt rotors
3. Quadcopter with all tilt rotors
4. Quadcopter with inverse tilt rotors
Fixed-wing RC aircrafts involving fixed rotors are
1. Multi-rotor with tractor configuration
2. Multi-rotor with pusher configuration
3. Tail setter configuration
Each of the tilt-rotor configurations is briefly explained
below:
VII. QUAD TILT WING
In quad tilting wings configuration propellers are mounted at
the mid-span of the wings capable of tilting. This
configuration can provide all six-degree of freedom. The
study involves the tandem wing configuration, which
includes two wings. The forward wing, which is

3rd Pak-Turk International Conference on Emerging Technologies in the field of Sciences and Engineering
14-16, April 2020
10
comparatively larger than the aft wing also called the rear
wing.
Figure 3 - Quad Tilt Wing Configuration for VTOL [3]
The most critical part of the flight is the transition. As the
wings must be first tilt to a smaller angle so that the aircraft
first attain the stall speed i.e. the minimum speed required
to prevent the aircraft from stalling. Once the stall speed is
attained, the wings can transit completely preventing the
aircraft from stalling.
VIII. BI-TILT WING FOR VTOL
A simple bi-tilt rotor configuration involves the use of two
tiltable rotors placed at the mid-way of the wing. This
configuration is practically being applied in Boeing's V22
Osprey as shown below
Two motors are in the vertical position providing thrust for
the vertical take-off. During the transition mode, the motors
change their orientation from vertical mode and once the
stall speed is attained the motors are oriented in the
horizontal position providing thrust for the forward flight.
Similarly, for the vertical landing, the motors change their
orientation and provide thrust for the vertical land.
IX. QUAD ROTOR WITH ALL TILT ROTORS
These configurations involve the integration of tiltable
quadrotors on a fixed-wing aircraft. The quad configuration provides a better VTOL efficiency and stable hovering as
compared to the Bi-rotors configuration.
One important consideration while designing these VTOL
multi-rotors is the clearance of the propellers and their
direction of rotation concerning one another.
Figure 5 - Quad tilt rotor Configuration [5]
X. INVERSE TILT ROTOR
Quadcopters with inverse tilt rots are essentially the same as
simple quadcopters with tilt rotors except that in this
configuration front motors are oriented in the upward
direction while the rear motors are oriented in the
downward direction.
As described above that fixed rotor configurations can also
be used for designing vertical take-off and land RC aerial
vehicles. A fixed-wing, fixed rotor RC aerial vehicle is
equipped with quad-copter motors that are used for vertical
take-off, landing, and a separate horizontal thrust motor for
horizontal flight modes. A brief description of each
configuration that can be involving the use of fixed rotors is
explained below. These configurations differ based on the
design of their forward flight while the mechanism for
vertical take-off and landing remains the same.
XI. MULTIROTOR TRACTOR CONFIGURATION
Tractor configuration is the one in which the propeller is
placed in front of the wing as shown. The characteristics of
this configuration are:
Figure 4 - Boeing V-22 Osprey [4]

3rd Pak-Turk International Conference on Emerging Technologies in the field of Sciences and Engineering
14-16, April 2020
11
• Tractor configuration has a better balancing
• Center of gravity ahead of the center of pressure.
• It is easy to fabricate
• It provides easier cooling of the motor
• Centre-line thrust is maintained
Figure 9: Tractor configuration [14]
The flight of this configuration involves vertical take-off
using quadcopter while the horizontal thrust motor remains
powered off. The transition mode involves the turning off of
the quad-copter and the starting of the horizontal thrust
motor simultaneously. Once the aircraft has attained
horizontal velocity equal to stall velocity the quad-copter
motors are turned off. During landing, the same process
happens but in the opposite sequence. The horizontal thrust
motor is turned off and the quad-copter is turned on
simultaneously providing thrust in the vertical direction.
XII. TAIL SITTER
Tail sitter RC aircraft are the ones that take-off and land on
their tail. This concept was first presented by Nicholas Tesla.
This configuration is usually used in flying wing vertical take-
off and land RC aerial vehicles.
Two motors are used along with three fins, two of them act
as wings and one is used as vertical stabilizers.
Figure 6 - Tail Sitter Configuration [6]
These aircraft falls in the category of bi-quad fixed rotors RC
UAVs. This configuration seems attractive, primarily because
it can carry a greater payload with a relatively small
expenditure of energy.
XIII. DISCUSSION ON PLATFORM
Based on the study [1, 22] different platforms were
considered for the design and development of high-speed
weapon capable killer drone. Keeping into consideration our
design needs and requirements Multi-rotor in general and
quad-copter, in particular, comes out to be the optimum
solution for a reasonable compromise between speed,
endurance, and design simplicity.
XIV. WORKING OF MULTIROTOR
All Multi-rotor primarily work on the fundamental law of
angular momentum conservation. To maintain the angular
momentum the adjacent quadcopter motors rotate in
opposite direction. To fly in steady-state hover case the
thrust of all the motors should be equal to the weight of the
flying vehicle, whereas in case of a climb and accelerated
horizontal or vertical motion the thrust must be unevenly
distributed with lesser thrust from motors in the direction of
motion. Additional thrust for these segments is required, so
therefore statistically the motor chosen should have the
capability to provide twice the thrust than weight at 50%
throttle for best efficiency [7]. The motions are controlled by
varying throttle which reduces RPM of motors by controlling
their current.
Table 2 - Overview of available platform

3rd Pak-Turk International Conference on Emerging Technologies in the field of Sciences and Engineering
14-16, April 2020
12
Another important factor in determining efficiency is the ground
effect. It is observed that when the multi-rotor is operating at
the height of approximately ½ of rotors
the diameter then the rotor tip vortices are avoided thus less
thrust is required to overcome the drag due to them. In
return, the efficiency and consequently multi-rotors
efficiency is increased.
The roll, yaw and pitch motion of quadrotor changes with
variation in RPM of motors. For motion along the roll axis, the
throttle of rotors on one specific side is increased and the
other side is decreased. Similarly, for motion along the pitch
axis, the throttle of front or back motors is varied and for
yaw, in the counter-clockwise direction, the counter-
clockwise rotating rotor throttles are increased.
Quadcopter generally has two prominent configurations. ‘X’
configuration and ‘+’ configuration. Both configurations have
their own merits and demerits. Generally ‘X’ configuration
comes out to be more stable whereas ‘+’ Configuration is less
stable and has more maneuverability.
Figure 8 - 'X' and '+' Configuration [25]
XV. LITERATURE REVIEW FOR STABILIZATION
A weapon capable killer drone has to carry a firing weapon.
This opens a complex domain of engineering issues because
of the stabilization needed to balance the platform in
response to the recoil of the weapon. In this regard, a lack of
research on this specific aspect is a hindrance. The current
problem of weapon capable drone is therefore simplified for
a survey of the design of stabilization systems for quad-
copter. The available stabilization methods widely used are:
• Gimbals
• Controls Systems
• Vibration Absorber
XVI. CONTROL SYSTEMS FOR STABILIZATION
With advancements in drone technology, the flight control
systems and algorithms for stable drone flight have also
increased. Control systems governed by basic PID [9, 10, 11,
14] to more complex systems [12, 13] have been developed
and have proved to be significant.
General Methodology followed for the design of a control
system is the estimation of the air vehicles' dynamic model.
This dynamic model is a set of mathematical equations that
consists of all aerodynamic flight affecting factors and factors
acting on the quad-rotor in case of any disturbance. Research
has been carried out for comparing different control
techniques [15, 16, 17] but due to the underactuated nature of
drones, it came out to be a complex dynamic model with
various challenges.
Quadcopters carry an Inertial Measurement Unit (IMU) and
microcontroller for simulating the control algorithm. IMU
sensor identifies the orientation which is then interpreted by
the control algorithm. In reply to any disturbance, the
microprocessor from the control algorithm will send a
rectifying signal to counter the disturbance and stabilize the
platform. Research has been conducted in this regard but most
of the effort is done lightweight drones [18], with settling time
of almost 10 seconds. A major difficulty faced in designing a
control system is to compensate for the response of nature. For
this wind, parameters are required.
Some prominent Control board systems available are:
• Multi-Rotor Control Board (Atmega328 PA)
• Pixhawk – 4
• Arduino – Pilot Board (ATMega328)
MULTI-ROTOR CONTROL BOARD (ATMEGA328 PA)
Figure 7 - Direction of Motors for Basic Motions [7]

3rd Pak-Turk International Conference on Emerging Technologies in the field of Sciences and Engineering
14-16, April 2020
13
Atmega328 PA – works on the same mentioned principle to
stabilize the aircraft. The board has three gyroscopes
available, which provide data to control board in case of
disturbance for stabilizing the platform. The control board is
programmable and may be modified by our dynamic model
Specifications:
• Dimensions: 50.5mm x 23.5mm
• Weight: 14.5 gram
• IC: Atmega328 PA
• Gyro: Murata Piezo
• Input Voltage: 3.3-5.5V
• Signal via Receiver: 1520 us
• Signal to ESC: 1520 us
PIXHAWK – 4
The Pixhawk 4 is a new version of Pixhawk having
a 32-bit microprocessor along with a flash memory of 2 MB
and also the RAM of 512KB. New Pixhawk P4 is even more
powerful and is with more RAM resources. For stabilization
purposes, low-noise and high-performance IMUs are
designed on the board.
Pixhawk 4 comes with open-source firmware and
also the software as well, for autonomous flying the new
Pixhawk PX4 is undoubtedly one of the best flight controllers.
The new Pixhawk PX4 can be assumed as a successor to the
APM flight controllers but is much more powerful, making it
worthy of being called one of the best flight controllers.
Features:
• Open-source software
• Autonomous flight
• 32-bit microprocessor
• A backup system in case of emergency
ARDUINO COMPATIBLE UAV CONTROLLER
It is an Arduino compatible controller with a feature
of fully programmable autopilot. The input to the controller
is from a GPS Module and infrared sensors in all three
dimensions. It performs both navigation and stabilization
using the stated combination of sensors [19].
Features:
• Built-in hardware for failsafe
• Multiple 3D waypoints
• Altitude controlled with the elevator and throttle
• 6-pin GPS connector for the 4Hz uBlox5
• Six spare analog inputs (with ADC on each)
• Size: 30mm x 47mm
• Four RC-in Channels
XVII. GIMBALS
Gimbal is a stabilization platform that dictates the
movement of the object or payload that the drone is
carrying. It is a pivoted support that allows rotation of the
object in only a unilateral axis.
Figure 9 - Fundamental Principle for Gimbal [26]
Gimbal mounted on a drone is designed to give stability to the
object by absorbing vibrations. It restricts the motion in
specified axes for which it is designed, eliminating the noise
and making the object stable, which is a weapon in our case.
Generally, Gimbals are powered by three brushless motors,
each acting in one specified axis. An Inertial Measurement
Unit is connected with Gimbal which reads the orientation,
conditions the signal by applying calibrations and transmits it
to Gimbal to generate a response to counter the vibration or
disturbance and stabilizes the object and quad-copter. IMU for
Gimbal comprises of three-axis accelerometer and gyroscope
mounted on the object holder. In between the Gimbal and
IMU is also a detailed algorithm in a microprocessor that acts
as the main function and governs the response of Gimbal to
any disturbance.
In Fig 10, a basic control loop for attitude heading and
reference is shown. The attitude heading and reference system
measure the orientation angles. Based on the correct
orientation angles PID (Proportional Integral Derivative)
angles are calculated and transmitted using Pulse Width
Modulator (PMW) to the motor drive, which stabilizes the
object.

3rd Pak-Turk International Conference on Emerging Technologies in the field of Sciences and Engineering
14-16, April 2020
14
The use of gimbal for the design of the stabilization system is
an emerging concept that can be used in Weapon capable
Drone but designing a specific gimbal based stabilization
system demands decent engineering knowledge and skill. The
significant factors in this phase of Gimbal System design are:
• Compatible Control Board for Gimbal
• Algorithm For Gimbal Response
• Mechanical Structure Design For Moderate Loads
• Design of Servo Module
Figure 11 - Gimbal Design for Camera
XVIII. SHOCK ABSORBING MATERIAL
Mechanical energy manifests itself in the form of shock,
impact, noise, and vibration and has the potential of
becoming a source of a problem in aerial vehicles [27].
Shock reciprocates to a large magnitude short duration
force or impact that can damage the platform. An effective
solution to mitigate the damage of a Shock is to absorb the
force magnitude and increase the time of impact as shown
in Figure 12
Figure 12 - Shock Absorbing Material [27]
Shock Absorbing Materials may be used to minimize the
recoil of weapons [18]. One of the widely used Shocks
absorbing material is Sorbothane which has the potential to
absorb 94.7% of impact shock [27]. It is one of the highly
damped, polymeric, visco-elastic material. Similarly, other
materials that combine shock absorption, Vibration
elimination, and damping characteristics may be used for
reducing recoil impact in the quadcopter.
XIX. DISCUSSION
Figure 10 - Control Loop for Gimbal

3rd Pak-Turk International Conference on Emerging Technologies in the field of Sciences and Engineering
14-16, April 2020
15
Design of High-Speed Weapon Capable Killer Drone
includes the design of a quad-copter platform and the
design of a weapon recoil bearing stabilization system. This
effort widens our horizon for designing such a system. For
an efficient model, a system that utilizes all the three
stabilizing mechanisms appears to be a decent concept that
is a Gimbal based system that generates a response from
an algorithm written after a detailed study of dynamic
model imbedded in a control board. Shock-absorbing
materials may be used for refinement of process and
reduction of noise for accurate target detection and firing.
REFERENCES
[1] David Hambling, “Disruptive Developments in Armed
UAV Technology”, United Nations Institute of
Disarmament Research
[2] S. Gupte, P. Teenu Mohandas, and J. M. Conrad, "Survey
of quad-rotor UAVs," 2012 Proceedings of IEEE
Southeastcon, Orlando, FL, 2012, pp. 1-6.doi:
10.1109/SECon.2012.6196930
[3] [Online], “Leaders in Emerging Drone Technologies” Available: https://www.rit.edu/news/leaders-drone-technology-converge-rit
[4] [Online], “Unmanned Aerial Vehicle”
Available: http://www.barnardmicrosystems.com/UAV/ milestones/tilt_wing.html
[5] [Online], “Boeing V 22 Osprey”
Available: https://winair.ca/blog/supreme-guide-bell- boeing-v-22-osprey-infographic /
[6] [Online], “Design and development of RC VTOL unmanned Aerial Vehicle”
Available: https://contest.techbriefs.com/2015/entries/ aerospace-and-defense/6117
[7] Kimberly Hsu, “China’s Military Unmanned Aerial
Vehicle Industry" US-China Economic And Security Review, 2013
[8] [Online], “Drone LiPo Battery calculator”
Available: https://www.translatorscafe.com/unit-converter /en/calculator/multicopter-lipo-battery/
[9] [Online], “Connect ESCS and Motors”
Available: http://ardupilot.org/copter/docs/connect-escs-
and-motors .html
[10] S. Bouabdallah, P. Murrieri, and R. Siegwart, "Design and Control of an Indoor Micro Quad Copter”, New Orleans, Proceedings of IEEE International Conference on Robotics and Automation, April 2004
[11] B. Erginer and E. Altuğ, “Modeling and Proportional-Derivative Control of a Quadrotor Vehicle”, Istanbul, Proceedings of IEEE Intelligent Vehicle Symposium, June 2007
[12] A.Tayebi and S. McGilvary, “Attitude Stabilizer for a Quad rotor Aircraft”, Vol. 14, No.3 Proceedings of IEEE Transactions on Control Systems Technology, May 2006
[13] S. Bouabdallah and R. Siegwart, “Back-stepping and Sliding-mode Techniques Applied to an Indoor Micro Quadrotor”, Barcelona, Proceedings of IEEE International Conference on Robotics and Automation, April 2005
[14] J. Dunfied, M. Tarbouchi and G. Labonte, “Neural Network-Based Control of a Four Rotor Helicopter”, Proceedings of IEEE International Conference on Industrial Technology, December 2004
[15] Hoffinan F., Goddemeier N. and Bertram T. "Attitude Estimation and Control of a Quadcopter", IEEE/RSJ International Conference on Intelligent Robots and Systems, 2010
[16] A. Benallegue, A. Mokhtari and L. Fridman, “Feedback Linearization and High Order Sliding Mode Observer For A Quadrotor”, Alghero, Proceedings of IEEE International Workshop on Variable Structure Systems, June 2006
[17] S. Bouabdallah, A. Noth, R. Siegwart, “LQ VS PID Control Techniques Applied to an Indoor Micro Quadrotor”, Sendal, Proceedings of IEEE International Conference on Intelligent Robots and Systems, October 2004
[18] Willard M. Latime, “Shock Absorbing Pad for Rifle”, Google Patent, US 20110113666A1
[19] T. Madani and A. Benallegue, “Backstepping Control for a Quadrotor”, Proceedings of IEEE International Conference on Intelligent Robotics and Systems, Beijing 2006
[20] Eduardo Ansias and Domantas Brucas “Development of active camera stabilization system for implementation on UAV’s”,: Mechanics, June 2012
[21] [Online], “Drone Gimbal design, parts and top Gimbals” Available: https://www.dronezon.com/learn-about-drones-quadcopters/drone-gimbal-design-components-parts-technology-overview /

3rd Pak-Turk International Conference on Emerging Technologies in the field of Sciences and Engineering
14-16, April 2020
16
[22] Mateo Gašparovi´c and Luka Jurjevi´c, “Influence of Gimbal on the Stability of Exterior Orientation Parameters of Unmanned Aerial Vehicle”, Faculty of Geodesy, University of Zagreb, Croatia
[23] N. J. Brake, “Development of Control System for Small UAV Gimbal” Ph.D. Thesis, California Polytechnic State University, San Luis Obispo, CA, USA, August 2012
[24] Robert Lefebvre, “UAV System Comparison”, NOVA Aerial robotics
[25] Imad Aldieen, Mohamed, “Design of a typical multi-role vehicle using quad-rotor theory” 10.13140/RG.2.1.1631.1924.
[26] [Online], “What is a gimbal, Jonathan Strickland”
Available: https://science.howstuffworks.com/gimbal1.htm
[27] [Online], “Shock Absorbing Material”
Available: https://www.sorbothane.com/shock-absorbing-material.aspx
[28] Vergouw, Bas & Nagel, Huub & Bondt, Geert & Custers, Bart, “Drone Technology: Types, Payloads, Applications, Frequency Spectrum Issues, and Future Developments”.
10.1007/978-94-6265-132-6_2, (2016)
[29] Kardasz, Piotr & Doskocz, Jacek, “Drones and Possibilities of Their Using. Journal of Civil & Environmental Engineering”. 6. 10.4172/2165-784X.1000233, (2016)

3rd Pak-Turk International Conference on Emerging Technologies in the field of Sciences and Engineering
14-16, April 2020
17
Reverse Engineering of a Small Turbojet Engine Abdul Rahim1, Mohtashim Mansoor2, Luqman Ahmed3
1 2 3College of Aeronautical Engineering, National University of Science and Technology, Risalpur, Pakistan
1Contact: [email protected], phone +92-320-9487943
2Contact: [email protected], phone +92-320-8801680
3Contact: [email protected], phone +92-320-5770123
Abstract— This paper is aimed at creating an analytical model of a
turbo jet engine with its parametric and performance analysis at on-
and off-design point to help reverse engineer the actual engine to be
used in a drone. In the absence of the actual engine for testing, the
analytical model was made by going through the design process for a
new engine with certain parameters of the actual engine known and
a few estimated based on historical trends. The performance and
parametric analysis is performed for the better understanding of the
engine’s behaviour in different conditions. Computer simulations of
the engine model are carried out on Gasturb software for the
validation of analytical calculations followed by an attempt for the
optimization of the model through the software to get an improved
version of the actual engine. Lastly the virtual model of the engine is
integrated into an algorithm and programmed into Arduino
microcontroller to make a working engine control unit for the actual
engine that can regulate the amount of fuel injected into the engine
for its optimum functioning. The Engine Control Unit (ECU) thus
designed is compatible with all types of micro jet engines requiring
minor changes to the engine parameters section of the code like the
component efficiencies.
I. INTRODUCTION
A gas turbine engine is a type of internal combustion engine in
which power to drive the compressor is drawn from turbine
which is driven by the flow of hot pressurized air flow. The
engine comprises of a compressor which may be centrifugal
type or axial type followed by the combustion chamber in
which fuel is burnt to heat up and the pressurized air flow
coming from the compressor. That pressurized air than flows
through the turbine rotating it which is mechanically connected
to the compressor wheel through a shaft hence turning it. An
external motor is used to rotate the compressor wheel and fuel
is pumped into the combustion chamber for burning of the
pressurized air. The hot pressurized air than escapes through the
turbine blades which turn the turbine and the turbine rotates the
compressor hence it forms a closed cycle. Once an idle speed
is achieved, the external motor shuts down and the engine keeps
running as long as sufficient fuel is being provided to the
combustion chamber. The speed is controlled by the rate of fuel
being provided. Greater the rate of fuel flow, faster the
rotation and in turn more power is produced resulting in more
thrust.
The reference engine is a micro jet single spool engine with a
centrifugal compressor, annular combustion chamber and a
radial turbine. Maximum thrust produced by this engine at sea
level is 400 N. This paper covers the construction of a
mathematical model of the engine for finding its performance
parameters like specific thrust, specific fuel consumption,
temperatures at different stages, exhaust gas temperature,
engine rpms etc. Although the design parameters like
compressor pressure ratio, compressor efficiency, turbine
efficiency etc. are to be measured off the actual engine on a test
bed, but the engine is not physically available for testing so in
order to reverse engineer the actual engine, we proceeded
through design process for building of new engine by
incorporating the requirements, some measured parameters and
some estimated parameters to get a very close if not the actual
engine. These estimations are based on historical trends which
were compiled by reviewing the works done on similarly
designed engines with comparable characteristics. Parametric
study of the engine is done by altering different design
parameters in the mathematical model of the engine and
observing its effect on the performance parameters. Then the
model is tested at off design conditions and performance
analysis is done. Gasturb simulation in the end approves the
results obtained through analytical calculations.
Using the mathematical model thus made, a working ECU
is developed in which the model is incorporated. As the only
control input to a gas turbine engine is fuel flow rate so the
ECU measures the ambient conditions, speed and the
throttle position and controls the amount and rate of fuel to
be injected into the engine so as to ensure its optimum
functioning.
II. NOMENCLATURE
𝑇𝑡 = Total temperature
𝑃𝑡 = Total pressure πr = Recovery pressure ratio
𝜋𝑑 = Diffuser pressure ratio
𝜋𝑐 = Compressor pressure ratio
𝜋𝑡 = Turbine pressure ratio
𝜋𝑓 = Fan pressure ratio

3rd Pak-Turk International Conference on Emerging Technologies in the field of Sciences and Engineering
14-16, April 2020
18
𝜏𝑟 = Recovery temperature ratio
𝜏𝑑 = Diffuser temperature ratio
𝜏𝑐 = Compressor temperature ratio
𝜏𝑓 = Fan temperature ratio
𝜏𝑎𝑏 =After burner temperature ratio
𝑓𝑎𝑏 = Fuel to air ratio of after burner = Fuel to air ratio of main burner
𝑚 = Air mass flow rate
𝐶𝑝 = Specific heat at constant pressure
𝑅 = Specific air constant
ɣ = Ratio of specific heats
𝐹𝑔𝑟𝑜𝑠𝑠 = Gross thrust
𝐷𝑟𝑎𝑚 = Ram drag
𝑆𝑇 = Specific thrust
𝑇𝑆𝐹𝐶 = Thrust specific fuel consumption
𝜂𝑡ℎ = Thermal efficiency
𝜂𝑝 = Propulsive efficiency
𝜂𝑜 = Overall efficiency U = Rotational speed of rotor
𝐶𝑧 = Absolute axial velocity
𝐶𝜃 = Absolute tangential velocity 𝑊 = Relative velocity
𝑊𝜃 = Relative tangential velocity / Relative swirl
𝑎 = Speed of sound
𝑇 = Static temperature
𝑃 = Static pressure
MFP = Mass flow parameter
𝐴 = Annulus area
𝛼 = Absolute flow angle
𝛽 = Relative flow angle
𝑀𝑤 = Relative Mach Number
𝑇𝑡𝑤 = Relative total temperature
𝑃𝑡𝑤 = Relative total pressure
𝑁𝑏 (𝑠) = Number of blades of stator
𝑁𝑏 (𝑅) =Number of blades of stator
η= Adiabatic efficiency
𝑒 = Polytropic efficiency
𝐷𝑅 = Diffusion factor
𝜎𝑠 = Solidity ratio of stator
𝜎𝑅 = Solidity ratio of rotor 𝜓 = Stage loading factor
𝜑 = Flow coefficient
𝛤 = Circulation
𝑅0 = Degree of reaction
III. LITERATURE REVIEW
1) Radial flow turbomachines: The type of turbomachinery
where the path of the through-flow is mainly in a perpendicular
plane to the axis of rotation, is known as radial flow
turbomachinery. Hence, the radius change between the entry
and the exit of fluid is finite. Depending on the purpose of use,
a radial turbomachinery can be an inward or outward flow type.
Inward flow type decreases the energy level of fluid while
outward flow type increases the energy level of the fluid. As the
direction of fluid is changed, several stages of radial
turbomachinery are not employed. The different components of a
gas turbine engine are given below.
Fig. 1 Radial flow compressor(left) Hybrid flow compressor (right)
A. Compressors
The first component in jet engine’s core is compressor. It
consists of rotor and stator. Rotor works on the fluid by adding
rotational energy into it, where stator acts as a diffuser and
extracts that rotational energy from the fluid in the form of rise
in static pressure. It runs on the power generated by the turbine.
Through the compressor the temperature and pressure of the
flow rises.
B. Turbines
The turbine is such type of turbomachine which extracts the
energy from fluid by expanding fluid to a lower pressure. The
turbine is consisting of nozzle and rotor. Nozzle accelerates the
flow coming from combustor by decreasing its static pressure,
while rotor extracts the energy from the flow. Fluid flow
coming out of the combustor has higher energy, it goes into the
turbine, where it causes the turbine blades to rotate, the turbine
blades are linked by a shaft to turn the rotor in the compressor
as well as other power consuming shafts. Turbine converts the
translational energy of fluid flow into the rotational energy of
turbine shaft. The rotational speed of jet turbine is thousands of
time. The turbines are fixed on shafts having several sets of ball-
bearing in between them.
C. Combustor Design
The simultaneous involvement of evaporation, turbulent
mixing, ignition and chemical reaction in gas turbine
combustion is too complex for complete theoretical treatment.
Instead, large engine manufacturers undertake expensive
engine development programs to modify previously established
designs through trials and error. They also develop their own
design rules based on the experimental results. The design rules
provide a means of specifying the combustor geometry to meet
a set of requirements at the given inlet conditions.

3rd Pak-Turk International Conference on Emerging Technologies in the field of Sciences and Engineering
14-16, April 2020
19
1) Gas Turbine Thermodynamic Cycle
Fig. 2 Gas Turbine Thermodynamic Schematic
The primary advantage of this thermodynamic cycle is the high
power generated to weight (or size) ratio, when compared to
alternatives. Another advantage is the ability for it to quickly
reach full power. A simple cycle combustion turbine has a lower
thermal efficiency than a combined cycle machine. They may
be less expensive to build simple cycle combustion turbines,
due to their low efficiency.
Fig. 3 The Brayton Cycle
The intake is a critical part in the aircraft engine, having a
significant effect on both engine efficiency and aircraft safety.
The prime requirement is to minimize the pressure loss up to
the compressor face while ensuring that the flow enters the
compressor with a uniform pressure and velocity, at all flight
conditions. Non-uniform, or distorted, flow may cause
compressor surge which can result in either engine flame-out
or severe mechanical damage due to blade vibration induced
by unsteady aerodynamic effects. Even with a well-designed
intake, it is difficult to avoid some flow distortion during rapid
manoeuvring.
Methodology
With the given characteristics of the engine we will follow
the techniques for engine analysis given in the book “Gas
Turbine Theory” by Henry Cohen to solve the engine
analytically by calculating the engine parameters at every stage
of the engine such as the compression and temperature ratios
of the compressor and turbine, the temperature in the
combustion chamber, the exhaust gas temperature, the rpms of
the turbine etc. We will also refer to “Elements of Gas Turbine
Propulsion” by Jack D Mattingly to perform the on design and
off design analysis of the engine. We will also work on the
engine control unit design for this engine by integrating the
algorithm for thermodynamic cycle of the engine and
performance parameter calculation into the Arduino
microcontroller. In the end, we will validate all the analytical
solutions through simulations on GASTURB.
A. Approach
First of all, the dimensions of the reference engine were
measured and the basic known parameters were acquired. Then
the compressor configuration was matched to a market
available compressor and its compressor maps were acquired in
order to estimate the compression ratio of the compressor.
Efficiencies of different components were estimated based on
historical trends. Then a thermodynamic cycle of the engine
was made. Afterwards on- and off-design analysis was carried
out followed by simulation on GASTURB. Then an ECU model
was made on Arduino microcontroller.
• Thermodynamic cycle analysis
• On design analysis
• Off design analysis
• Gasturb simulation
• ECU modeling
Fig. 4 Project Schematic
IV. ENGINE PARAMETERS
B. Published Data
Following Published data about the actual engine was
provided by the sponsoring agency. Most of the data has either
been calculated or estimated as the actual data of the engine is
not provided by the maker. The compressor data was estimated
with the help of compressor maps of similarly shaped
compressor of a turbocharger.
Table 1 Engine Data Sheet
S.No. Property Value
1 Engine Diameter (mm) 154
2 Engine Length (mm) 420
3 Jet pipe exit diameter (mm) 70
4 Weight (kg) 7
5 Shaft speed (rpm) 91,000
6 Thrust (daN) 40
7 Pressure ratio 3.75
8 Air mass flow rate (kg/s) 0.75
9 Specific fuel consumption (kg/daN.hr) 1.45
10 Shaft power output (W) 1000
11 Exhaust gas temperature (°C) 600

3rd Pak-Turk International Conference on Emerging Technologies in the field of Sciences and Engineering
14-16, April 2020
20
12 Operating ambient temperatures (°C) -40 to +50
13 Maximum altitude (m) 8,000
14 Maintenance cycle (hr) 20
C. Estimations
As the maker does not provide any data of the engine whatso
ever so some basic parameters are estimated based on the
historical trends. These trends have been modelled based on the
published data of some commercially available similarly sized
and configured engines like Jetcat and Behotec engines. These
estimated parameters are given in the table below.
Table 2 Estimated Parameters
D. Thermodynamic Cycle Analysis
Following the methodology stated in the book “Gas Turbine
Theory” [1] we perform the thermodynamic cycle analysis of
the engine and calculated the performance parameters. The
results of the analysis is given in the table below.
Table 3 Results of thermodynamic cycle analysis
S.No Parameter Value Units
1 Ca 240.75 2 Ca2/2cp 28.8361 k
3 T01 284.8361 k
4 P01/Pa 1.417204
5 P01 0.779462 bar
6 P02 2.922984 bar
7 T02-T01 163.3693 k
8 T02 448.2054 k
9 T03-T04 144.4639 k
10 T04 955.5361 k
11 P03 2.806065 bar
12 T04' 919.4201 k
13 P04 1.362144 bar
14 P04/Pa 2.476625
15 P04/Pc 1.916815 16 T5 = Tc 820.2027 k
17 P5 = Pc 0.710629 bar
18 Rho 5 0.301884
19 C5 559.5351 m/s
20 A5/m 0.00592
21 Fs 413.8798 Ns/kg
22 SFC 0.155325 kg/hN
We performed iterative study of the engine by altering the
different parameters in the algorithm and plotting it in excel to
observe the behaviour of the engine which would mimic in the
real-life scenario. We obtained the following results.
At different flight conditions like altitude, atmospheric
pressure and temperature, air density etc the thrust and specific
fuel consumption will variate, because of the variation in mass
flow with the air density and the variation of momentum drag as
the forward velocity changes.
Temperature to the turbine would alter with intake conditions.
Hence any change in thrust and fuel consumption with change in
altitude and Mach number, for our engine running at maximum
rotational velocity, are shown in Fig. 10 and Fig. 11.
Fig. 5 Variation of thrust with altitude and Mach
Fig. 6 Variation of SFC with altitude and Mach
As we can see that the thrust is decreasing significantly with
the increase in the altitude, because of the decreasing density
and atmospheric pressure, although the specific thrust does
increase with altitude from the favourable effect of the lower
intake temperature. Specific fuel consumption however
improves with the increasing altitude. It is evident from these
graphs that the fuel consumption will be greatly reduced at
higher altitudes. Fig 10 shows that with the increasing mach
number at constant altitude the thrust initially decreases,
because of the increasing momentum drag, and then starts
increasing due to the effect of the ram pressure ratio.
S.No. Property Value
1 Turbine inlet temperature (T03) 1100 k
2 Isentropic compressor efficiency
(𝜂𝐶) 0.8
3 Isentropic turbine efficiency (𝜂𝑇) 0.8
4 Isentropic intake efficiency (𝜂𝑖) 0.93
5 Isentropic nozzle efficiency (𝜂𝑗) 0.95
6 Mechanical transmission efficiency
(𝜂𝑚) 0.99
7 Combustion Efficiency (𝜂𝑏) 0.98
8 Combustion pressure loss (Δ𝑃𝑏) 4 %

3rd Pak-Turk International Conference on Emerging Technologies in the field of Sciences and Engineering
14-16, April 2020
21
Fig. 7 Turbojet cycle performance
It is evident from the above figure that the specific thrust is
mainly dependent upon the turbine inlet temperature (T03) , and
using maximum temperature is in fact desirable so as to keep
the size of the jet engine as small and light for the given amount
of thrust. With constant pressure ratio, however, by increasing
the turbine inlet temperature (T03) will result in the increase in
the specific fuel consumption. The increase in the specific thrust
with the increase in temperature is more desirable that we can
overlook the penalty we get in the form of rise in the specific
fuel consumption, particularly at greater speeds where small jet
engine size is crucial for reduction of both the weight and the
drag. As is evident from the figure above figure by increasing
the pressure ratio of the compressor (𝝅𝒄) we can reduce the SFC. At constant turbine inlet temperature (T03), if we increase
the pressure ratio, the specific thrust initially increases as a
result but for larger engines (not in our case) it eventually starts
to decrease.
Figure 25 represents a particular case subsonic cruise. When we repeat such calculations for greater cruising speeds maintaining constant altitude, we find that generally, for any
given pressure ratio (𝜋𝑐), and TIT (T03), the fuel consumption
increases and the thrust decreases. Such effects are because of the combination of increased inlet momentum drag and
increased compressor work resulting from the rise in the inlet
temperature. The most noteworthy effect of increased design
cruise speed is the reduction in the optimum compressor
pressure ratio for the max specific thrust. It results from the
larger ram compression in the engine intake. The greater
compressor inlet temperature and the need for greater velocity
make the use of a greater inlet temperature to the turbine more
desirable and it is essential for the economy of the drone.
Thermodynamic cycle optimization cannot be isolated from
design considerations, and the choice of cycle parameters is
greatly dependent on the type of aircraft system. Although
greater turbine temperatures are desirable, they require the use
of expensive and difficult to construct alloys and cooled blades
of the turbine resulting in greater cost and complexity. The
thermodynamic benefits of the increase in pressure ratio should
cater for the increase in weight, cost and manufacturability due
to the needs for greater number of stages of the compressor and
turbine.
Fig. 8 Performance and design considerations
Figure 26 represents the relationship between design and
performance considerations. For drones, a simple and reliable
turbojet engine of low cost is needed and there’s no definite need
for a very fuel economical and high power engine for such
UAVs. The fuel consumption is not that critical due to relatively
little amount of flying, and their needs can be satisfied with
engines having low compressor pressure ratios and the turbine
inlet temperatures but what may matter to these drones is the size
and the weight of the engine. The smaller and lighter the engine
for same thrust output, the better it is.
E. EngineSim Simulation
EngineSim is an old java applet that was made by the NASA
Glenn Research Centre in order to make basic calculations
regarding gas turbine engines and rocket engines quickly and
efficiently for research and education purposes. It’s a simulator
that creates a virtual design of the engine model as described by
the designer and tests that model of the engine for different
parameters.
Fig. 9 EngineSim applet interface
Enginesim applet is a basic and outdated propulsion software and
we cannot truly rely on its output. Its use was intended to see
whether our direction for calculation of engine parameters
analytical is right or not.

3rd Pak-Turk International Conference on Emerging Technologies in the field of Sciences and Engineering
14-16, April 2020
22
Table 4 Enginesim output vs analytical output
Parameter Analytical
Calculations
Enginesim
Thrust (Newtons)
402 400
SFC (kg/hN) 0.154 0.129
Fuel/air 0.017 0.016
Air mass flow
rate (kg/s)
1.1 0.88
EGT (Kelvin)
760 737
F. Parametric Cycle Analysis:
Cycle analysis involves the study of the thermodynamic
changes in the air and combustion products as it flows through
the engine. The parametric cycle analysis involves the study of
the performance of aircraft engine by varying the flight
condition and parameters of the design choice for example the
pressure ratios, burner pressure ratio, turbine efficiencies etc.
one can say that the on design analysis depicts a rubber engine
as the geometry for different combinations of an engine will be
different from the one before. On design analysis is also called
the parametric cycle analysis since in this kind of analysis we
alter different parameters of an engine and observe the the effect
on its performance.
Generally, in the On-Design analysis, I’ll be altering the
following parameters one by one and observing their impact
upon the other parameters of the engine model.
• Compressor pressure ratio
• Burner exit temperature
• Aircraft Velocity
• Thrust
• SFC
• Efficiencies
• Fuel/air Ratio
• Altitude
Fig. 10 Turbojet cycle performance
Increasing the pressure ratio of the compressor drastically
decreases the fuel consumption and also increases the net thrust.
And increasing the burner exit temperature very slightly
increases the Fuel consumption but also drastically increases the
thrust of the engine.
Fig. 11 Engine performance vs Mach: SFC
At constant compressor pressure ratio, SFC increases with
increasing Mach numbers.
Fig. 12 Engine performance vs pressure ratios: SFC
Fig. 13 Engine performance vs Mach number: Specific thrust
At a constant pressure ratio, specific thrust decreases when
Mach number increased.
Fig. 14 Engine performance vs pressure ratios: Specific thrust
As we increase the compressor pressure ratio at constant
Mach number the specific thrust also increases.

3rd Pak-Turk International Conference on Emerging Technologies in the field of Sciences and Engineering
14-16, April 2020
23
Fig. 15 Engine performance versus Mach: fuel-air ratio
At a constant pressure ratio, as we increase the velocity, the
fuel to air ratio decreases.
Fig. 16 Engine performance versus pressure ratio: fuel-air ratio
At constant Mach, if you increase the compression ratio of
the compressor the fuel to air ratio decreases.
Fig. 17 Turbojet performance vs Mach: efficiency
Thermal, Propulsive and the Overall efficiencies, at a
constant pressure ratio, increase with Mach number however
the change is very little at higher Mach numbers.
Fig. 18 Turbojet performance vs Compressor pressure ratio: efficiency

3rd Pak-Turk International Conference on Emerging Technologies in the field of Sciences and Engineering
14-16, April 2020
24
At a constant Mach, with increasing compressor pressure ratios,
the propulsive efficiency decreases but thermal and overall
efficiency increases
G. Performance Analysis:
When a turbo jet engine is modeled and constructed, the
amount of variability of the gas turbine engine depends upon
the technology already available, the requirements of the
application for that engine, and the needs of the makers. Many
turbojet engines contain fixed area flow passage and there is
limited room for variation. In a basic fixed flow area engine, the
performance (pressure ratio and the mass flow rate) of the
compressor is dependent upon the power produced by the
turbine and the conditions at the inlet to the compressor. In the
off-design analysis, simple and basic analytical equations may
be utilized to show a relation for the performance of engine
compressor and the independent variable such as the throttle
settings (𝑇𝑡4) and the flight conditions (𝑀0, 𝑃0, 𝑇0) . Using the methodology stated in the book “Elements of Gas
Turbine Propulsion for the off-design analysis of the our gas
turbine engine we get the following plots for different
parameters. The reference altitude was taken at 16000 ft and the
off-design analysis was carried out at sea level, 8000 ft and
12000 ft.
Fig. 19 Maximum Thrust vs Mach
This graph shows that as the speed increases the maximum
thrust decreases down to almost 0.7 Mach than it slowly and
gradually starts to increase. At constant speed the maximum
thrust decreases with increase in altitude.
Fig. 20 Specific fuel consumption vs Mach
From this graph we can deduce that the SFC of our engines
increases with the increase in the Mach number up till 0.65 to
0.7 mach. From there it starts to gradually decrease again. And
at a constant Mach, SFC decreases when altitude is increased.
Fig. 21 Engine Mass Flow rate vs Mach
The curves in the above figure show us that as the Mach
speed of the engine increases the amount of incoming air also
increases hence the engine mass flow rate increases as a result.
And at a constant Mach as we increase altitude, the mass flow
rate of the air lessens because of the low air density at higher
altitudes.
Fig. 22 Compressor pressure ratios vs Mach
From the above figure it is evident that as Mach increases the
effective pressure ratio decreases and at a constant Mach if we
increase the altitude, the compressor pressure ratio increases
drastically.
Fig. 23 Turbojet Efficiencies vs Mach
The trends for propulsive, thermal and overall efficiencies in
the graph given above shows that the propulsive efficiency
decrease with increasing speed and altitude. The thermal
efficiency increases with speed increasing the air velocity and
altitude. And the overall efficiency of the engine very slightly
increase with speed and remains almost constant with the
altitude.

3rd Pak-Turk International Conference on Emerging Technologies in the field of Sciences and Engineering
14-16, April 2020
25
Fig. 24 Turbojet performance at partial throttle (8000ft)
The graph in the above figure represents the turbojet engine
performance at partial throttle settings. It shows that as we
reduce the throttle, our specific fuel consumption increases up
till 0.65 and then starts to drastically decrease. This plot is
commonly referred to as throttle hook plot because of its shape.
The propulsive efficiency minutely increases while the thermal
efficiency decreases by decreasing the throttle. As a result, the
overall efficiency also very slightly decreases by decreasing the
throttle.
V. GASTURB SIMULATION
We perform our cycle analysis and the on-off analysis of the
engine on this software to see if our analytical calculation
results agree with the output of this software.
Fig. 25 Engine type selection page of GasTurb
Fig. 26 Engine modeling in Gasturb
According to general trend of the aerospace industry and
improvements in the technology Mach numbers as shown in
Table 3 were supposed at different locations initially. They may
vary after the analysis if results are not compatible or they can
be evaluated by reverse engineering approach.
Table 5 Station Mach Numbers
Statio n #
2 3 4 5 6 8
Mach #
0.5 0.25 0.2 0.4 0.2 0
Fig. 27 Station numbering of turbojet
A. Output of GasTurb
After gathering all the information, we need, we modeled
the reference engine on Gas Tub 13 and run the design point
analysis. Results obtained were fulfilling the requirements like
required thrust is greater than 270 N. We can also see the drop in
the value of TSFC. Snapshot of the result sheet of GasTurb 13 is
given in Figure 32.
Fig. 28 Reference engine’s summary (At Design Point)
Fig. 29 Temperature vs Entropy Curve
This is the T-S curve made by Gasturb software. It represents
the actual engine model. The temperatures at every station is
given and are same as that calculated analytical. It shows that
our analytical calculations are accurate.

3rd Pak-Turk International Conference on Emerging Technologies in the field of Sciences and Engineering
14-16, April 2020
26
Fig. 30 Pressure vs Volume Curve
Similarly, the P-S curve is given in the above figure and
represents the actual pressure and volume values at every
station of our model engine. This ensures that our model is
accurate and we can proceed forward with the trade studies of
the engine in the next section.
B. Trade Studies
After modelling our baseline engine, we then perform the
trade studies using the Gasturb program. Following engine
trade studies were done to analyse the sensitivity of our engine
corresponding to change in different parameters.
Fig. 31 Turbine Inlet Temperature vs Thrust
In the above figure we can see the variation of burner outlet
temperature with the engine thrust. The trends of both the
software and the analytical calculation agree to each other. The
burner temperature varies exponentially with the thrust.
Fig. 32 Air mass flow rate vs Thrust
In these curves you can see that the output of the software is
linear while that of the analytical calculation is exponential.
That is because the software calculates corrected mass flow
while our analytical algorithm gives the normal mass flow. But
the output is same for both. The mass flow increases as we
increase the thrust but the amount of increase decreases as we
move to greater thrust values.
Fig. 33 Thrust vs Specific fuel consumption
This curve shows the exponential relationship between the
thrust and the specific fuel consumption. As we increase the
thrust our fuel consumption increases exponentially being
greater at greater thrust values.
C. Optimization on Gasturb
Lastly, we perform optimization on Gasturb for our model to
see if there’s a better combination of design parameters of the
engine which fulfil our requirements with greater efficiency.
Our constraints are net thrust, compressor efficiency, specific
fuel consumption (SFC) and exit temperature of the combustion
chamber. The variables are engine RPMs, inlet mass flow,
burner exit temperature, isentropic compressor efficiency,
isentropic turbine efficiency and the compressor pressure ratio.
Following figure shows the optimization process take place and
then the software gives an optimized model.

3rd Pak-Turk International Conference on Emerging Technologies in the field of Sciences and Engineering
14-16, April 2020
27
Fig. 34 Gasturb optimization process
D. Optimized Results
After optimization process carried out by Gasturb following
results are obtained.
Table 6 Gasturb optimization results
S.No. Parameters Values
1 RPM 83,440
2 Mass flow (kg/s) 0.695
3 Turbine Inlet Temperature (K)
1050
4 Compressor pressure Ratio
3.66
5 Compressor Efficiency 0.89 6 Turbine Efficiency 0.85
7 Specific fuel Consumption (kg/hN)
0.156
VI. FINAL SUMMARY OF ENGINE
Summary Data
Design Mach
0.75
Design Altitude
16000
ft
Design Mass Flow
0.668
kg/s
Design Net Thrust
276
N
Design TSFC
0.154
Kg/hN
Compressor Pressure Ratio 3.75
Design T4
1100
K
Design Engine Pressure Ratio
2.47
Design Compressor Efficiency
0.80
Design Turbine Efficiency
0.80
Design Engine Shaft RPM
91000
The table in the above figure represents all the engine
parameters thus calculated through our thermodynamic,
parametric and performance analysis.

3rd Pak-Turk International Conference on Emerging Technologies in the field of Sciences and Engineering
14-16, April 2020
28
VII. ECU MODELLING
An Engine Control Unit is a computer fitted on an aircraft
engine that measures certain parameters of the engine in real
time and controls the amount of fuel being injected into the
engine. Gas turbine engines are controlled by injection of fuel
into the combustion chambers. To increase thrust throttle is
given which means greater amount of jet fuel is injected into
the burner which causes a rise in combustion chamber
temperature. To decrease the thrust throttle is reduced and the
opposite effect takes place. Early jet engines featured a direct
throttle which meant the fuel valve was directly controlled by
the throttle stick which proved dangerous and difficult. If the
fuel valve closes too quickly, it could result in engine die out.
The fuel ratio decreases hence the flame can get distinguished
as the airflow can blow out the flame. Increasing the throttle too
quickly can cause a rich blow out. Meaning excess amount of
fuel can soak the flame and extinguish it. Or can result in a
greater fuel to air ratio meaning temperature rises to a point that
may damage the turbine blades or could increase the burner
pressure that may choke the engine causing stall.
These issues are resolved by the integration of an engine
control unit. What an ECU does is that it acts as an
intermediate between the throttle and and the fuel vale. When
the pilot moves the throttle stick the ecu gets that input and
calculates how much fuel is needed to be ejected to meet the
power needs of the pilot while avoiding all the above given
problems and also get the best range and endurance. An ecu
measures the RPMs and the exhaust gas temperature to
regulate the fuel flow to the burner. In short, ecu is a computer
that is fitted on modern jet engines that regulates the amount
of fuel provided to the engine ensuring its optimum
functioning.
A. Arduino
The microcontroller used for our ECU is Arduino Uno and
the program written is in Arduino ide. The program is based on
the algorithm given in section 3.1. The ECU algorithm is
written in Arduino code that is given in appendix A. A testbed
is made for testing of the Arduino with a motor, an RPM sensor,
some controls using potentiometers, 20 x 4 LCD for displaying
of output, and an Arduino Uno board itself.
The inputs to the Arduino ECU are
• Speed of the drone (Mach)
• Ambient Temperature
• Ambient Pressure
• Throttle Position
For testing, these inputs were emulated with the help of
potentiometers. And the output is in the form of movement by
the servomotor which emulates an actuator for opening and
closing of the fuel valve.
VIII. LIMITATIONS
The analytical solution of the engine is based on the existent
knowledge of the previous jet engines and a few estimations that
are not specific to miniature jet engines. Furthermore, the
parameters that were estimated for the engine are based on
different similarly built engines that might alter our calculation
from the actual value to some extent. Live testing of the engine
is required to sync the virtual model with the actual one.
Furthermore the algorithm for ECU is for any micro jet engine
however basic tweaking is required to make it compatible.
IX. CONCLUSION:
The analysis of this engine will result in
• Reverse Engineering of the Actual Engine
• Improvements in the Engine
• Development of newer and better Engines
• Development of ECUs
X. ACKNOWLEDGEMENTS
We would like to acknowledge the support and guidance
provided by faculty members of Department of Aerospace
Engineering, College of Aeronautical Engineering (NUST),
towards fulfillment of this project.
XI. REFERNCES
[1] Chauhan, Richa & Maity, Arnab & Paluri, Nataraj.
(2018). Modeling, Simulation and Validation of
Mini SR-30 Gas Turbine Engine. IFAC-
[2] S. M. Haris, “Mini Turbojet Engine,” DHA Suffa
University, [Online]. Available:
https://www.researchgate.net/publication/317279288
[3] J. D. Mattingly, Aircraft Engine Design, United States:
AIAA, 2002.
[4] S. Farokhi, Aircraft Propulsion, UK: John Wiley &
Sons Ltd, 2014.
[5] S. Farokhi, Aircraft Propulsion, John Wiley & Sons
Ltd, 2014.
[6] D. J. Raymer, Aircraft Design A conceptual Approach,
Washington: AIAA, 1992.

3rd Pak-Turk International Conference on Emerging Technologies in the field of Sciences and Engineering
14-16, April 2020
29
[7] J. D. Anderson, Aircraft Perfromance and Design,
AIAA..
[8] David T. Pratt, AFTBNR Program User Guide, 2003.
[9] N. Cumptsy, Jet Propulsion, New York: Cambridge
University Press, 2009.
[10] B. Dunbar, "NASA National Aeronautics and Space
Administration," Glenn Research Center, [Online].
Available:https://www.grc.nasa.gov/www/k-
12/airplane/brayton.html. [Accessed 16 03 2018].
[11] P. G. Hill, Mechanics and Thermodynamics of
Propulsion, Menlo Park, California: Addison-
Wesley Publishing Company, 1992.
[12] D. G. Hull, Fundamentals of Airplane Mechanics,
Austin: Springer-Verlag Berlin Heidelberg, 2007.
[13] J. Kurzke, "GasTurb 13.0 : On design and Off design
Performance program for gas Turbine," GasTurb
GmbH, Germany, 2012.
[14] J. D. Matingly, Aircraft Engine Design, AIAA ,
2002Virginia.
[15] J. D. Matingly, OFFX USER GUIDE, 1996.
[16] J. D. Mattingly, AEDsys Program User Guide, 2014.
[17] J. D. Mattingly, COMPR Program User Guide, 2016.
[18] J. D. Mattingly, Elements of Gas Turbine Propulsion,
New Delhi: Tata McGraw Hill Education Private
Limited, 2013.
[19] J. D. Mattingly, Elements of Propulsion: Gas Turbie
and Rockets, Virginia: AIAA,2006.
[20] J. D. Mattingly, NOZZLE Program v4.0 User Guide,
2016.
[21] J. D. Mattingly, ONX USER GUIDE, 1996.
[22] J. D. Mattingly, PARA Program User Guide, 2016.
[23] J. D. Mattingly, PERF Program User Guide, 2016.
[24] J. D. Mattingly, TURBN Program User Guide, 2016.
[25] H. Wordpress, "Machinery Equipment," hvac
machinery, [Online]. Available:
http://machineryequipmentonline.com/hvac
[26] N. Cumptsy, Jet Propulsion, New York: Cambridge
University Press, 2009.
[27] Ujam, A.J., 2013. Parametric analysis of a Turbojet
engine with reduced inlet pressure to compressor.
IOSR Journal of Engineering, 3(8), pp.29.
[28] Saravanamuttoo, H.I., Rogers, G.F.C. and Cohen, H.,
2001. Gas turbine theory. Pearson Education.
[29] Kamps, T., 2005. Model Jet Engines, Traplet
Publications.
[30] Trazzi, P.E., 2004. Design and Development of a 70 N
Thrust Class Turbojet Engine. Revista de
Engenharia Térmica, 3(1), pp.09-14.
[31] Polat, C., 2009. An electronic control unit design for a
miniature jet engine. Master of Science Thesis in
Mechanical Engineering Graduate School of Natural and
Applied Sciences of Middle East Technical University.
[32] Ujam, A.J., Ifeacho, F.C. and Anakudo, G., 2013.
Modeling Performance Characteristics of a
Turbojet Engine. International Journal of
Manufacturing, Material and Mechanical
Engineering Research, 1(1), pp.1-16.

3rd Pak-Turk International Conference on Emerging Technologies in the field of Sciences and
Engineering
14-16, April 2020
30
DESIGN OF ROCKET ASSISTED TAKEOFF
FOR DRONES
Asees Siddiqui1, Mohtashim Mansoor2, Luqman Ahmed3
1 2 3 College of Aeronautical Engineering, National University of Science and Technology, Risalpur,
Pakistan
1Contact: [email protected], phone +92-320-9487943 2Contact: [email protected],phone +92-320-8801680 3Contact:[email protected], phone +92-320-5770123
Abstract—Conventional runway takeoff is not available
in many situations especially for small drones in
inhospitable terrain. In that case one may resort to
catapult launch system or zero length rail launch system
in which rocket motor is used to launch the aircraft in a
very short distance. The aim is to design a small rocket
motor using easily available propellant for launching
drones in a very short distance. The rocket’s motor
sizing, nozzle and structure will be designed and
trajectory and stability will be analyzed
Keywords—Rocket Assisted Takeoff; Propellants; Rail
launch.
I. INTRODUCTION
Rocket engines obtain thrust in accordance
with Newton’s third lay and are mainly
reaction engines. Thrust in rocket engines is
obtained by expulsion of matter through a
nozzle. This matter consists of high-speed fluid
which is mostly gaseous in nature which is
created by high pressure combustion of solid
or liquid propellants, consisting of fuel and
oxidizer components, within a combustion
chamber. The main components of a chemical
rocket are, rocket motor or engine
propellant.consisting.of fuel.and oxidizer, a
frame to hold the components, control
systems and a cargo such as satellites.[2]
There are three types of rocket propulsion
systems, which are chemical, nuclear, and
solar, the basic functions include booster,
sustainer, altitude control. The type of vehicle
rockets carry are aircrafts, space shuttles and
small drone. Type of propellant, type of
construction, or number of rocket propulsion
units used in a given vehicle [6]
II. ROCKET FUELS
The fuels used in rocket motors can either be
liquid or solid. The liquid fuel consists of fuel
and oxygen in liquid state. The fuel and oxygen
are combined in a combustion chamber and
ignited. The fuel flow to the engine can be
controlled, the amount of thrust can be altered
according to the requirement and the engine
can be turned off or on at will. [5] Solid-fuel
rockets consist of a fuel and oxidizer that are
mixed with the help of a binder in the solid
form. Once the solid fuel is ignited, the thrust
cannot be controlled and the propellant burns
to the end. Solid rockets are cheap to
manufacture, simple to operate and safe to
use unlike liquid rockets. Specific impulse
(usually abbreviated Isp) is a measure of how
effectively a rocket uses propellant or a jet
engine uses fuel. By definition, it is the total
impulse (or change in momentum) delivered
per unit of propellant consumed.. [5]

3rd Pak-Turk International Conference on Emerging Technologies in the field of Sciences and
Engineering
14-16, April 2020
31
Table 1. Types of Propellant
III. Assisted Take-off
Assisted take-off is a system for helping aircraft
get into the air when the aircraft loaded with
excessive weight, or has insufficient power or
insufficient runway length.
It has two main types
1. Catapult launch
2. Rocket Assisted Take-off or Jet
Assisted Take-off
In catapult launch, a piston, known as a shuttle,
is pushed forward under the steam pressure in
a cylindrical chamber. the tow bar or launch
bar is attached to the front landing gear of the
aircraft which attaches it to the shuttle which
propels the aircraft at the deck at about 15
knots above minimum flying speed, which is
achieved in approximately four seconds.
Figure 13. F/A 18 attached to steam catapult
In Rocket assisted take-off additional engines
are mounted on the air frame which are only
used during the takeoff. After the takeoff the
engines are usually jettisoned.
Figure 14HESA Karrar
IV. METHODOLOGY
The approach for project is that firstly a suitable
propellant for the requirement of the mission will be
selected. The basic design of the rocket motor would
be carried out which would include the calculation
of total impulse, the weight of the selected
propellant to be used, the volume required by the
propellant in the motor casing and the web thickness
of the propellant grain. Next the case would be
designed for the rocket motor, the material for the
casing would be selected and the wall thickness for
the selected material would be determined by taking
in consideration the stresses being applied on the
casing.Grain configuration would be selected later
depending on the mission requirement. After that the
nozzle would be designed according to the chamber
Solid propellants Liquid propellants
Solid propellants have low specific
impulse [4]
Liquid propellants have high specific
impulse [4]
Storage, handling and transport are
comparatively easy. [4]
storage, handling and transport are comparatively
difficult. [4]
Engines used have simple designs. [4]
Engines used have delicate design and cannot withstand
rough handling. [4]
Economical in use. [4]
Costly to use. [4]
Manipulation of the fuel and
calibration of the engine is difficult.
[4]
Fuel is versatile and engine calibration is
easy [4]
Once ignited solid propellants cannot
be stopped [5]
Liquid propellants can be used in
different proportions and can be controlled
[5]

3rd Pak-Turk International Conference on Emerging Technologies in the field of Sciences and
Engineering
14-16, April 2020
32
pressure, burn rate and the coefficient of specific
heat of the propellant used
V. DESIGN REQUIREMENTS
Table 2. Design Parameters
Known Parameters
SI
Mass Of Drone 120 kg
Stall Velocity (est.)
60 m/sec
Take-off Velocity (est.)
69 m/sec
Stall Velocity(calc.)
53.3 m/sec
Take-off Velocity (est.)=1.15 x Vs
61.3 m/sec
Mass of Rocket 10 kg
Mass of Rocket & UAV
130 kg
Time 2.3 sec
Chamber Pressure
8.50 MPa
Thrust 5200 N
Max. acceleration
60 m/sec2
Burning Rate 0.889 cm/s
Outer Dia 0.115 m
VI. SELECTION OF PROPELLANT
A number of solid propellants are available
which can be used for the mission
requirement. For this mission we would use
HTPB+AP+Al as propellant.it has the following
advantages and disadvantages.
Table 3. Advantages Disadvantages of Propellant
Advantages Disadvantages
Better Performance Moisture sensitive
Widest ambient temperature limits
High flame temperature
Good burn rate control Toxic
Stable combustion Smokey exhaust
Medium relative cost
Good physical properties
Good experiences
Following concentration of the propellant
would be used
Ammonium Perchlorate (oxidizer) 68%
Aluminum (fuel) 20%
Hydroxyl-Terminated Polybutadiene (binder)
12%
VII. BASIC DESIGN
The total Impulse of the rocket motor was
calculated as
𝐼𝑡 = 𝐹𝑡𝑏 = 𝐼𝑠𝑤𝑏 = 7969 N-s
Next the propellant weight required was
determined from the specific impulse value of
the propellant
𝑤𝑏 =𝐼𝑡𝐼𝑠= 33.20 kg-m/s2
The volume required for this weight of
propellant is calculated using the formulation
𝑉𝑏 =𝑤𝑏
𝜌𝑏= 1.86 × 10⁻³ 𝑚3
Lastly, we calculate the web thickness of the
propellant grain using
𝑏 = 𝑟𝑡𝑏 = 2.05 × 10⁻² 𝑚
VIII. CASE DESIGN
A number of materials are available for the
manufacturing of rocket motors, according to our
requirement we would use metal casing for our
rocket motor. The materials are

3rd Pak-Turk International Conference on Emerging Technologies in the field of Sciences and
Engineering
14-16, April 2020
33
Table 4. Case Materials
Material Tensile strength (N/mm2
)
Modulus of
elasticity
(N/mm2
)
Density (gm/cm3
)
Alloy steel
1400-2000
207,000 205
Aluminum 2024
455 72,000 165
Titanium alloy
1240 110,000 270
We would firstly select alloy steel as it has higher
strength and a medium density value.
Also, the graph plotted for the change in yield
strength with temperature tells us that alloy
steel shows much resistance to changes in
temperature
Now we will determine the wall thickness of
the casing using the formulation of hoop
stress
𝑡 =𝑝1𝐷
2𝜎= 3.22 × 10⁻⁴𝑚
IX. GRAIN CONFIGURATION
The propellant grain is the geometric shape a
solid propellant is processed into. It is usually
cylindrical in shape. It determines the burn
rate of the propellant
We will use a cartridge loaded grain as it is
simpler to use and the rocket motor casing can
be reused
For the insulation of the casing from the
propellant grain we will use the ablative
material and the thickness would be
determined using the formulation
𝑎 = 𝑐 [2𝑘𝑡
𝑅𝑟𝑅𝑣𝐶𝑝𝜌𝑙𝑛 (1 +
𝑅𝑟𝑅𝑣𝐶𝑝(𝑇𝑎𝑤 − 𝑇𝑑)
𝐿𝑝)]
0.5
[𝑃𝑐100
]0.4
The grain outside diameter is calculated as
𝐷𝑜 = 𝐷 − (2 × 𝑡) − (2 × 𝑡𝑖) = 0.11m
The grain inside diameter is calculated as
𝐷𝑖 = 𝐷𝑜 − (2 × 𝑏) = 0.07m
The grain length would be calculated using
the total volume of the propellant used which
was calculated earlier
𝑉𝑏 =𝜋
4𝐿(𝐷𝑜
2 −𝐷𝑖2)
Solving the equation for 𝑉𝑏= 1.86 × 10⁻³ 𝑚3
we get L= 0.33m
Next, we find the average burn area of the
propellant grain to meet the requirements of
the burn rate and burn time
𝐴𝑏 =𝐹
𝜌𝑏𝑟𝐼𝑠= 1.31 𝑚2
The mass flow rate of the gasses is given as
m = m/t = 1.4 kg/s
X. NOZZLE DESIGN
As the chamber pressure requirement is given in the
design conditions so from the formulation of
chamber pressure for isentropic flow relations of
nozzles, we find the Mach number at the end of the
C-D nozzle
𝑃𝑜 = 𝑃 [1 +1
2(𝑘 − 1)𝑀2]
𝑘𝑘−1
For Po= 8.5 MPa; P= 101325 Pa; k=1.2 (for selected
propellant)
The mach number comes out to be M= 3.3
Using this mach number and the pressure ratio of
chamber and atmosphere we can find the area ratio
using the following relation
𝐴2𝐴1
=1
𝑀[1 + [
𝑘 − 12
]𝑀2
𝑘 + 12
]
(𝑘+1)2(𝑘−1)
The area ratio comes out to be 𝐴2
𝐴1= 9.9
The thrust coefficient CFis a function of gas property
k, the nozzle area ratio e,
and the pressure ratio across the nozzle Pl/P2, but
independent of chambertemperature. It is calculated
as

3rd Pak-Turk International Conference on Emerging Technologies in the field of Sciences and
Engineering
14-16, April 2020
34
𝐶𝐹 = √2𝑘2
𝑘 − 1(
2
𝑘 + 1)
𝑘+1𝑘−1
[1 − (𝑝2𝑝1)
𝑘−1𝑘]
+𝑝2 + 𝑝3𝑝1
×𝐴2𝐴𝑡
For idea conditions, P2=P3 so the CF value comes
out to be
𝐶𝐹 = 1.67
Now from the above calculated values we can
calculate the throat area as
𝐴𝑡 =𝐹
𝑝1𝐶𝐹
𝐴𝑡 = 3.66 × 10⁻⁴𝑚2
From this throat area the throat diameter is
calculated as
𝐷𝑡 = √4𝐴𝑡𝜋
𝐷𝑡 = 1.94 × 10⁻²𝑚
Using the area ratio, the exit area of the
nozzle is calculated as
𝐴𝑒 =𝐴𝑒𝐴𝑡
𝐴𝑡
𝐴𝑒 = 3.63 × 10⁻³𝑚2
And the exit diameter from this exit are is
calculated as
𝐷𝑒 = √4𝐴𝑒𝜋
𝐷𝑒 = 6.80 × 10⁻²m
XI. PERFORMANCE
The total mass of the case is found by using the total
volume of the metal casing which comes out to be
Mass of case = 3.11 kg
The mass of propellant is calculated before which
came out to be 3.32 kg
Total mass of the rocket motor comes out to be 6.5
kg
The total thrust acting on the rocket motor is given
in design conditions as 5200N
So, the thrust to weight ratio comes out to be
T/W=81.6
XII. COMPARISON WITH OTHER
COMBINATIONS
A number of casing material and propellant
combinations are used in a MATLAB code used for
calculations and a comparison between their cost
and performance is done
Table 5. Comparison of Rocket Motors
Rocket Motor Thrust to
Weight Ratio
Cost Propellant Casing
HTPB+AP+Al Alloy Steel
81.6 66$
HTPB+AP+Al Aluminum 2024
117 105
$
HTPB+AP+Al Titanium 102 92$
AN+Al+Binder
Alloy Steel
76.3 64$
AN+Al+Binder
Aluminum 2024
93.4 103
$
AN+Al+Binder
Titanium 83.6 90$
KN-Sucrose Alloy Steel
56.6 54$
KN-Sucrose Aluminum 2024
71.5 93$
KN-Sucrose Titanium 65.7 80$
KN-Dextrose Alloy Steel
64.7 56$
KN-Dextrose Aluminum 2024
85 95$
KN-Dextrose Titanium 76.8 82$
From the table it is clear that HTPB+AP+Al with
aluminum gives the best thrust to weight ratio but
the cost is highest, but in comparison to titanium
with the same propellant the cost difference is not
that much so it would be better to select aluminum
as the casing and HTPB+AP+Al as the propellant
XIII. CAD MODEL

3rd Pak-Turk International Conference on Emerging Technologies in the field of Sciences and
Engineering
14-16, April 2020
35
The CAD model for the designed rocket motor
was made in CATIA V5
Figure 15. Rocket motor
The casing was designed as follows
Figure 16. Casing
The nozzle was designed as follows
Figure 17. Nozzle
XIV. VALIDATION OF RESULTS
The given design conditions were analyzed in some
rocket propulsion software and the results were
compared with the analytically calculated values
COMPROP:
This is a software which gives results using one of
the ratios either pressure ratio, area ratio or mach
number and using isentropic flow relations gives the
value of the unknown ratios and terms.
The given pressure value was entered into the
software which gave the results for the area ratio,
mach number and density ratio
Figure 618. COMPROP Results
The results are quite close to the calculated
values of area ratio and the Mach number
Rocket Propulsion Analysis
It is a software which gives the ideal results for
the design of a specific rocket motor, and gives
an estimation quite close to the original rocket
to be designed.
The analytical results were compared to the
results obtained from the software

3rd Pak-Turk International Conference on Emerging Technologies in the field of Sciences and
Engineering
14-16, April 2020
36
Figure 19. RPA Results
The results obtained from RPA were close to
the analytical calculations made which
validates the results
XV. CONCLUSION
A rocket motor was designed with the required
specifications given initially using MATLAB and a
comparison was made between certain combination
of rocket motor materials. Then a cost analysis was
done based on the materials chosen, the machining
done and the propellant used. After that a CAD
model was designed using CATIA V5. Using the
CAD model, the fabrication of the rocket motor is in
progress and the development of the propellant has
been completed.
XVI. REFERENCES
[1] Numerical Investigation of Launch Dynamics
for Subscale Aerial Drone with Rocket Assisted
Take-Off (RATO), Timothy A. Eymann and John D.
Martel
[2] Rocket Propulsion Elements by George P.
Sutton and Oscar Biblarz.
[3] https://www.nakka-rocketry.net/
[4] http://www.polytechnichub.com/different-solid-
liquid-propellants/
[5]https://howthingsfly.si.edu/ask-
anexplainer/what-difference-between-liquid-
and-solid-fuel-rockets
[6] Rocket Propulsion Analysis V2.3 Standard
[7] Surface Launch Simulations of an Unmanned
Aerial Vehicle Loaded with Jet Assisted
Takeoff Motors, David R. González Naval
Surface Warfare Center, Indian Head
[8] CATIA V5
[9] Compressible Fluid Flow by Patrick H
Oosthuizen& (2nd Edition) by William E
Carscallen
[10] Introduction to Heat Transfer” by F P
Incropera& D P DeWitt (5th Edition) 2007
A

3rd Pak-Turk International Conference on Emerging Technologies in the field of Sciences and Engineering
14-16, April 2020
37
Effect of Different Grades of Carbon Black on
Compressive Strength of Mortar
Muhammad Saeed Qasim1,a, Faisal Shabbir2,b 1Research Assistant, Department of Civil Engineering, University of Engineering and Technology, Taxila, 47050,
Pakistan 2Associate Professor, Department of Civil Engineering, University of Engineering and Technology, Taxila, 47050,
Pakistan
Email address: a) [email protected], b) [email protected]
Abstract—The progress in the field of additives also
upgraded the construction field. Use of additives plays the key
role in improving the different properties of cement mixes.
They are being used in the fields of strength, structural health
monitoring and durability etc. Carbon Black (CB), one of
additives, attracted the researchers in the field of health
monitoring but very less research has been done on their effect
on the strength of the cement mortar composites. In this
research different grades of CB has been studied to find an
optimum grade for the strength of CB based cement
composites. The compressive strength behavior of three
grades of CB (N330, N550 and N660) has been studied by
replacing cement content by 5%, 7.5%, 10%, 12.5% and 15%
by weight. Compressive strength was investigated at the age
of 14, 28 and 120 days. The result showed that the compressive
strength of CB based cement composites was more than
control mix at the age of 28 and 120 days.
Keywords— Carbon Black, Grade, Compressive strength,
N330, N550, N660
I. Introduction
Cementitious composites exhibit many properties
including physical, mechanical, chemical and
durability etc. Mechanical property like
compressive strength is most important property of
these materials.
Different types of additives and mineral
admixtures were investigated in past to improve
the physical and mechanical properties of
cementitious materials like mortar and concrete.
The most common of them were silica fume, fly
ash, ZnO, nanoSiO2 and nanoFe2O3 [1–5].
Haruehansapong et al.[6] observed that the
optimum particle size of nanosilica (40 mm) when
replaced with 9% of cement gives max increase in
strength. Pathak et al. [7] suggest that
1%replacement of ZnO with cement gives 18%
more strength than normal concrete. Liu et al.[8]
found that strength increase in concrete and mortar
by use of nanoparticles depends on the particle size
and its optimum percentage replacement with
cement. Alyhya et al. [9] studied the behavior of
waste carbon black (CB) in self compacting
concrete as filler and observed that the optimum
percentage is 5% when used as replacement of
cement. Fly ash, silica fume and blast furnace slag
were investigated by Demirboga [10] to find their
effect on compressive strength of cement mortar.
He concluded that 10 percent silica fume increase
compressive strength by 17% at 120 days. Above
that %age, it causes reduction in compressive
strength. Fly ash slightly increases strength at 56
days when replaced by 20 percent of cement. Blast
furnace slag increased the strength by 14 percent
when 30 percent of cement is replaced at 120 days.
The authors also concluded that fly ash, silica fume
and blast furnace slag are less effective in mortar
than in concrete.
CB also affects the compressive strength of mortar
and concrete. Furthermore, it is one of those
additives which are considered to develop some of

3rd Pak-Turk International Conference on Emerging Technologies in the field of Sciences and Engineering
14-16, April 2020
38
the desired properties in cement composites by
different researchers [9, 11–14]. According to
Chitra et al. [15, 16], CB used up to 8% in cement
replacement can increase the compressive strength
of concrete. Nagavkar [17] investigated the effect
of CB on various properties of concrete. Due to its
ability of heat resistance, its composites can be
used to reduce the fire effect [18–20]. CB changes
the resistivity, so it was also investigated by
different authors that it can be used as strain
sensing or pressure sensing in health monitoring
field [21–23].
Due to its cheap cost, being readily available and
highly effective in mortar, it is economical to use
CB to increase compressive strength of cement
mortar.
Few studies have been carried out to investigate
the strength of mortar cubes by using CB as an
additive. Further research efforts are needed on
strength of mortar by comparing the effect of
different grades of CB available in market for
partial replacement of cement in different cement
percentages by weight. This research shows a
comparison between the grades of CB i.e. CB 330,
CB 550 and CB660 used as a partial replacement
in mortar, and depicts their effect on the
compressive strength of mortar cubes. The
optimum percentage of cement replacement by
weight has been recommended for the three grades.
II. Experimental Methodology
A. Sample Preparation
Three grades of CB (i.e. N330, N550 and N660)
having specific gravity of 1.8 were used to prepare
mortar cubes. CB was passed through sieve #100
to get the CB powder. Ordinary Portland cement
was used as binder and fine sand having size <1
mm was used. The ratio of cement-aggregates was
maintained at 1:3 and the water-cement ratio was
maintained at 0.55. Super plasticizer (SP) SP 470
was used as water reducing agent in percentage
varying from 0%-4% depending upon the cement
replacement by CB. The aggregates and cement
were added in water and mixed for 5 minutes in the
auto mortar mixer. SP was added in mixture and
mixed for 3 minutes. CB was then added to it and
mixing was done for another 5 minutes. Moulds of
size 2” x 2” x 2”were oiled and mix was poured
into them. Good compaction was ensured to reduce
voids. The homogenous dispersion of CB was
ensured by proper mixing.
Control samples were prepared without any CB
and is referred as control mix (CM). Table VI shows
the mix proportion for each composition prepared.
Five mixes were prepared for each CB grade. A
total of 15 mixes for three grades have been
prepared. Different nomenclature for CB grades
was adopted: The samples with N330 named as A,
N550 named as B and N660 named as C. The
percentages of each grade in replacement of
cement were 5%, 7.5%, 10%, 12.5% and 15% in
different mixes.
Table VI. Mix Proportion for Each Composition (g)
Mix Cement
(g)
Sand
(g)
Water
(g)
CB
(g)
SP
(g)
CB
grades
CM 1000 3000 550 - - -
A5 950 3000 550 50 20
CB330
A7.5 925 3000 550 75 25
A10 900 3000 550 100 30
A12.5 875 3000 550 125 35
A15 850 3000 550 150 40
B5 950 3000 550 50 20
CB550
B7.5 925 3000 550 75 25
B10 900 3000 550 100 30
B12.5 875 3000 550 125 35
B15 850 3000 550 150 40
C5 950 3000 550 50 20
C7.5 925 3000 550 75 25

3rd Pak-Turk International Conference on Emerging Technologies in the field of Sciences and Engineering
14-16, April 2020
39
C10 900 3000 550 100 30 CB660
C12.5 875 3000 550 125 35
C15 850 3000 550 150 40
A total of nine samples were tested for the
compressive strength at the age of 14, 28 and 120
days for each mix, Curing was done at humidity
level >95% and room temperature. Fig. 1 shows
the sample placed in tank for curing.
Fig. 20. Curing of samples
B. Testing
After the age of 14 days, three samples from each
mix A, B and C were taken out of curing tank and
wiped out to saturated surface dry condition. Same
was done for the samples tested at the age of 28 and
120 days. The samples were placed in compression
testing machine and compressive strength of cubes
was found out. Loading rate of 1 KN/sec was
applied by the compression testing machine. Fig. 2
shows the apparatus for testing compressive
strength of specimen.
Fig. 21. Computer controlled universal testing machine
III. Results And Discussions
Compressive strength of cement composites was found
at the age of 14, 28 and 120 days. Average of
compressive strength of three samples for defined
mixes at a specified age was considered in results for
the comparison.
Strength performance was calculated by taking CM as
a reference as it is made of conventional mortar.
Strength performance was calculated for each mix
strength at age of 120 days as shown in formula in (1).
The value greater than 100% shows better performance
than conventional mix.
Strength performance (%age) = 100 x (Strength of
mix)/(strength of CM) (1).
Table VII shows the results of compressive strength
and performance of all mixes A, B and C at
different ages
Table VII. Compressive Strength of Mixes and Their Strength
Performance
Mix
Compressive Strength (MPa) Strength
Perform
ance
(%age)
14
days 28 days 120 days
CM 9.6 12.8 14.0 100.00
A 5 12.4 14.0 17.2 122.86
A 7.5 15.6 21.2 23.2 165.71
A 10 12.8 16.4 18.0 128.57
A 12.5 9.2 13.6 14.0 100.00
A 15 6.8 9.2 10.0 71.43

3rd Pak-Turk International Conference on Emerging Technologies in the field of Sciences and Engineering
14-16, April 2020
40
Mix
Compressive Strength (MPa) Strength
Perform
ance
(%age)
14
days 28 days 120 days
B 5 8.4 10.0 12.0 85.71
B 7.5 12.8 17.6 18.8 134.29
B 10 12.4 15.2 16.8 120.00
B 12.5 11.2 15.6 16.0 114.29
B 15 7.2 9.6 10.0 71.43
C 5 8.0 9.2 11.2 80.00
C 7.5 11.2 15.2 16.4 117.14
C 10 11.6 14.4 15.6 111.43
C 12.5 8.0 11.2 11.6 82.86
C 15 6.4 8.4 8.8 62.86
The graph between percentage replacement of CB
N330 (A) and compressive strength at different
ages is shown in Fig. 3. It is clear from the results
that A5, A7.5 and A10 shows greater compressive
strength by +22.86%, +65.71% and +28.57%
respectively as compared to CM at age of 120
days. Also, A12.5 shows +6.25% more strength
than CM at age of 28 days whereas A15 is the only
sample which shows-28.57%less strength than
CM. A7.5 shows the maximum strength in all
mixes when N330 used at age of 120 days.
Fig. 22 Percentage replacement of cement vs. compressive strength
for type A (CB N330 mix)
Fig. 4 shows the behaviour of percentage
replacement of CB N550 (B) and compressive
strength at different ages. It can be found that B7.5,
B10 and B12.5 show +34.29%, +20% and
+14.29% greater compressive strength than CM at
age of 120 days. When CB 550 content of less than
7.5 or more than 12.5 percent in cement
replacement is used, the strength of cement
composite is reduced. So it was found that B7.5
shows the maximum compressive strength of all
mixes at age of 120 days when N550 used.
Fig. 23. Percentage replacement of cement vs. compressive strength
for type B (CB N550 mix)
The relation between percentage replacement of
CB N660 (C) used and compressive strength at
different ages is shown in Fig. 5. The results show
that C7.5 and C10 show +17.14% and +11.43%
greater compressive strength than CM at age 120
days. When N660 content of less than 7.5% or
more than 10% in replacement of cement is used
the strength of composite is reduced. It was noted
that C7.5 gives the maximum compressive strength
when N660 was used at the age of 120 days.
Fig. 24. Percentage replacement of cement vs. compressive strength
for type C (CB N660 mix)
Possible reason behind increase in the strength is
0369
1215182124
com
pre
ssiv
e St
ren
gth
(M
Pa)
Percentage replacement of cement
14 days 28 days 120 days
0369
1215182124
com
pre
ssiv
e St
ren
gth
(M
Pa)
Percentage replacement of cement
14 days 28 days 120 days
0369
1215182124
com
pre
ssiv
e St
ren
gth
(M
Pa)
Percentage replacement of cement
14 days 28 days 120 days

3rd Pak-Turk International Conference on Emerging Technologies in the field of Sciences and Engineering
14-16, April 2020
41
the filling of micro pores in the cement mortar. In
the CM, cement and sand is used and their size
differ a lot as the average size of sand is around 0.5
mm and average cement is 15 micron having 95%
particles below 45 micron. So a gap or void is
created when paste is made and their bond can be
improved by adding some material to fill the pores
between cement and sand. Having particle size
between cement and sand CB acts as a filler
resulting in occupying the space between cement
and sand. Due to this, the strength increases and
the porosity of composites decreases. This trend
continues to a certain percentage of CB normally
called threshold content. Above the threshold
value, the fillers are overloaded and proper textural
binding of composites is not achieved hence
reducing the strength. This threshold percentage to
achieve maximum possible strength is known as
optimum percentage of CB. Furthermore, among
the grades of CB used, N330 is hard grade as
compared to N550 and N660. Therefore it shows
good compressive strength as compared to soft
grades i.e. N550 and N660.
IV. Conclusions
From this research, it can be concluded that the CB
can be used to increase the strength of cement
composites. Any CB grade gave better results as
compared to CM. Out of the three grades
investigated in this study, N550 is better than N660
and N330 is better than N550. It has been noted
that all the CB grades show their best compressive
strength results at 7.5% replacement with cement.
Among the grades, N330 is best in terms of
compressive strength when cement is replaced at
7.5% by weight.
REFERENCES
[1] B. Ali, L. A. Qureshi, M. A. Nawaz, and H.
M. U. Aslam, “Combined Influence of Fly
Ash and Recycled Coarse Aggregates on
Strength and Economic Performance of
Concrete,” Civ. Eng. J., vol. 5, no. 4, pp.
832–844, 2019, doi: 10.28991/cej-2019-
03091292.
[2] H. Li, H. gang Xiao, and J. ping Ou, “A
study on mechanical and pressure-sensitive
properties of cement mortar with nanophase
materials,” Cem. Concr. Res., vol. 34, no. 3,
pp. 435–438, 2004, doi:
10.1016/j.cemconres.2003.08.025.
[3] P. Chindaprasirt, S. Homwuttiwong, and V.
Sirivivatnanon, “Influence of fly ash
fineness on strength, drying shrinkage and
sulfate resistance of blended cement
mortar,” Cem. Concr. Res., vol. 34, no. 7,
pp. 1087–1092, 2004, doi:
10.1016/j.cemconres.2003.11.021.
[4] J. Vera-Agullo et al., “Mortar and Concrete
Reinforced with Nanomaterials,”
Nanotechnol. Constr. 3, pp. 383–388, 2009,
doi: 10.1007/978-3-642-00980-8_52.
[5] X. Shi, Z. Yang, Y. Liu, and D. Cross,
“Strength and corrosion properties of
Portland cement mortar and concrete with
mineral admixtures,” Constr. Build. Mater.,
vol. 25, no. 8, pp. 3245–3256, 2011, doi:
10.1016/j.conbuildmat.2011.03.011.
[6] S. Haruehansapong, T. Pulngern, and S.
Chucheepsakul, “Effect of the particle size
of nanosilica on the compressive strength
and the optimum replacement content of
cement mortar containing nano-SiO2,”
Constr. Build. Mater., vol. 50, pp. 471–477,
2014, doi:
10.1016/j.conbuildmat.2013.10.002.
[7] A. Pathak, “Effect of Zinc Oxide
Nanoparticle on Compressive Strength and
Durability of Concrete,” Int. J. Res. Appl.
Sci. Eng. Technol., vol. V, no. VIII, pp. 683–
687, 2017, doi: 10.22214/ijraset.2017.8098.
[8] J. Liu, Q. Li, and S. Xu, “Influence of
nanoparticles on fluidity and mechanical
properties of cement mortar,” Constr. Build.

3rd Pak-Turk International Conference on Emerging Technologies in the field of Sciences and Engineering
14-16, April 2020
42
Mater., vol. 101, pp. 892–901, 2015, doi:
10.1016/j.conbuildmat.2015.10.149.
[9] W. Shober Saheb Alyhya, S. S. A. Alaa
Abed Alameer, L. Mohammed Ridha
Mahmmod, and .., “Experimental
Investigation on Self-Compacting Concrete
with Waste Carbon Black,” Int. J. Eng.
Technol., vol. 7, no. 4.20, p. 414, 2018, doi:
10.14419/ijet.v7i4.20.26233.
[10] R. Demirboǧa, “Influence of mineral
admixtures on thermal conductivity and
compressive strength of mortar,” Energy
Build., vol. 35, no. 2, pp. 189–192, 2003,
doi: 10.1016/S0378-7788(02)00052-X.
[11] A. O. Monteiro, A. Loredo, P. M. F. J. Costa,
M. Oeser, and P. B. Cachim, “A pressure-
sensitive carbon black cement composite for
traffic monitoring,” Constr. Build. Mater.,
vol. 154, pp. 1079–1086, 2017, doi:
10.1016/j.conbuildmat.2017.08.053.
[12] A. O. Monteiro, P. B. Cachim, and P. M. F.
J. Costa, “Electrical Properties of Cement-
based Composites Containing Carbon Black
Particles,” Mater. Today Proc., vol. 2, no. 1,
pp. 193–199, 2015, doi:
10.1016/j.matpr.2015.04.021.
[13] Y. Wang, Y. Zhao, X. Zhao, and R. Hai,
“Mechanical and strain-sensing properties
of cement-matrix composite containing
nano-sized carbon black,” Key Eng. Mater.,
vol. 815 KEM, pp. 203–209, 2019, doi:
10.4028/www.scientific.net/KEM.815.203.
[14] S. Wen and D. D. L. Chung, “Partial
replacement of carbon fiber by carbon black
in multifunctional cement-matrix
composites,” Carbon N. Y., vol. 45, no. 3,
pp. 505–513, 2007, doi:
10.1016/j.carbon.2006.10.024.
[15] G. Chitra, P. V. Selvi, and D. Vijayalakshmi,
“Carbon black as an additive in conventional
concrete,” Int. J. Emerg. Technol. Adv.
Eng., vol. 4, no. 2, pp. 194–201, 2014.
[16] T. M. Jeyashree and G. Chitra,
“Experimental studies on concrete elements
using waste carbon black as filler material,”
Asian J. Civ. Eng., vol. 18, no. 1, pp. 21–30,
2017.
[17] G. N. Nagavkar, “Effect on properties of
concrete with partial replacement of
additives cement,” Int. J. Eng. Sci. Res.
Technol., vol. 6, no. 2, pp. 784–790, 2017.
[18] J. Song, W. Yang, X. Liu, W. Zhang, and Y.
Zhang, “ASA/graphite/carbon black
composites with improved EMI SE,
conductivity and heat resistance properties,”
Iran. Polym. J. (English Ed., vol. 25, no. 2,
pp. 111–118, 2016, doi: 10.1007/s13726-
015-0404-6.
[19] S. Mingqing, M. Xinying, W. Xiaoying, H.
Zuofu, and L. Zhuoqiu, “Experimental
studies on the indoor electrical floor heating
system with carbon black mortar slabs,”
Energy Build., vol. 40, no. 6, pp. 1094–
1100, 2008, doi:
10.1016/j.enbuild.2007.10.009.
[20] M. I. N. Bin Yahya, “The Effect of Mixing
Carbon Black N330 and N660 in Fiber
Reinforcement Plastic Matrix System for
Fire Retardance in Marine Application,” J.
Polym. Sci. Appl., vol. 2017, pp. 2–5, 2017,
doi: 10.4172/JPSA.1000105.
[21] H. Li, H. gang Xiao, and J. ping Ou, “Effect
of compressive strain on electrical resistivity
of carbon black-filled cement-based
composites,” Cem. Concr. Compos., vol. 28,
no. 9, pp. 824–828, 2006, doi:
10.1016/j.cemconcomp.2006.05.004.
[22] T. N. Tallman, S. Gungor, K. W. Wang, and
C. E. Bakis, “Damage detection via
electrical impedance tomography in glass
fiber/epoxy laminates with carbon black
filler,” Struct. Heal. Monit., vol. 14, no. 1,
pp. 100–109, 2015, doi:
10.1177/1475921714554142.

3rd Pak-Turk International Conference on Emerging Technologies in the field of Sciences and Engineering
14-16, April 2020
43
[23] M. G. Pârvan, G. Voicu, and A. I. Bădănoiu,
“Study of hydration and hardening
processes of self-sensing cement-based
materials with carbon black content,” J.
Therm. Anal. Calorim., vol. 8, 2019, doi:
10.1007/s10973-019-08535-8.

3rd Pak-Turk International Conference on Emerging Technologies in the field of Sciences and Engineering
14-16, April 2020
Effect of temperature on behavior of concrete
with e-waste as partial replacement of aggregates
Muhammad Farrukh Javaid1,a, Muhammad Irshad Qureshi1,b and Shahzad Saleem1,c 1Department of Civil Engineering, University of Engineering and Technology Taxila
Email address: a) [email protected], b) [email protected] and c)[email protected]
Abstract—Plastic waste is an environmental hazard
due to its low biodegradability and minimal recycling
(only around 7% globally). With the ever-increasing
advancement of technology, the proportion of
electronic waste (E-waste) is also increasing
significantly. This is specially an important issue for
developing countries where most of E-waste is dumped
now a days. Building and construction industry, on the
other hand, account for almost 40% of energy related
CO2 emissions globally and is also responsible for
depleting natural resources. Recycling of E-waste as an
alternative construction material has the potential to
address these issues. Past studies have explored the
mechanical properties of plastic concrete and found
that a 20% replacement of aggregates is feasible with
some reduction in compressive strength. One
important aspect of plastic concrete is its thermal
properties and resistance to fire. The current study is
focused on the fire resistance of concrete made with E-
waste as partial replacement of aggregates i.e. coarse
and fine aggregates. The concrete specimens were
heated at 150o C and 300o C for 1 hour and the effect of
fire on the mechanical properties of plastic concrete
are explored and recommendations are presented
regarding the decrease of strength properties due to
fire.
Keywords—e-waste aggregate, plastic concrete,
waste management, temperature effects
V. Introduction
The rapidly growing world’s population and
increased rate of urbanization has a huge
impact on construction industry. It has
increased the demand of construction making
concrete the most widely used man-made
construction material. Concrete is often said to
be the second most utilized substance after the
water on earth [1, 2]. The causes of this huge
demand of concrete are its low cast, ease of
application and high compressive strength.
Now a days, construction without the use of
concrete cannot be even imagined [3]. Such
demand of concrete needs the resources from
which its constituents i.e. cement, sand, gravel
etc. are obtained. When the rate of extraction
of resources like cement, sand or crushed
aggregates exceeds the generation of natural
resources, it causes environmental problems.
This enormous consumption of concrete is
resulting in eradication of natural sources of its
constituents [1]. As the population is growing
and the technology is advancing rapidly, the
demand, utilization and waste is also increasing

3rd Pak-Turk International Conference on Emerging Technologies in the field of Sciences and Engineering
14-16, April 2020
2
[2]. Plastic materials had a vital role in progress
of the society for the last 150 years. It is
considered as a necessary part of our today’s
life as it meets a wide variety of public needs
because of its useful properties such as good
strength, ease of design, low density, durability,
process-ability and low cost [4]. Many plastic
materials that were beyond the reach in the
past are now available at affordable prices.
People now a days are changing themselves
with the advancing technology and the old
technology is being trashed. This trash is
exerting pressure on environment creating the
disposal issues [5]. One major plastic waste type
is the waste generated from the trash of
electronic appliances called as electronic plastic
waste (E-waste). E-waste is increasing
exponentially as the markets and industries of
electronic appliances are increasing day by day.
United States Environmental Protection
Agency (US-EPA) report categorized video,
audio and information devices as means of
electronic waste. Video devices include
televisions (TV), flat panel TVs, DVD, Cathode
Ray Tubes (CRT) and videocassettes recorder
decks etc. Similarly, audio devices include
compact audio systems, CD players, home
radios and mp3 players. Information devices
include mobile telephones, facsimile (fax)
machines, laptop computers, printers,
cordless/corded telephones, desktops and
other computer monitors, laptops tablets and
computer accessories like mice and
keyboards. According to US-EPA estimate in
2007, 29.9 million desktops and 12 million
laptops were discarded as a waste. According
to EPA estimate 2008, about 3.16 million tons
of e-waste was generated and the recycled
amount was 13.6% or 430,000 tons of total
waste. In 2013, about 366,000 tons were
reported across 21 states in United States and
in 2014 volume increased by 6% about
390,000 tons [6, 7, and 8].
This waste needs to be dumped and
disposed but due to its very low
biodegradability it creates a serious waste
management issue for the authorities. This
electronic waste needs to be recycled just like
some other recyclable waste materials.
Plastic loses strength with number of
recycling. So, an efficient approach is much
needed in order to utilize this waste in a
proper way and overcome the disposal
issues. This can be helpful in sustainable
growth. To save the natural resources of filler
materials and to deal with the utilization of
plastic waste are the two of the major
concerns at present [9]. In order to meet the
demands of filler material, researchers are
trying to incorporate a variety of alternative
materials in concrete now a days.
Similarly, some researches worked on
the substitution of plastic waste in concrete in
the form of aggregates (coarse or fine) or
fibers. Zainab Z. Ismail has worked on the
mechanical behavior of concrete made with
percentage replacement of natural fine
aggregate with plastic waste aggregate by
0%, 10%, 15% and 20%. As a result,
compressive strength tends to decrease with
increase in waste plastic ratio. The
substitution of plastic waste in fabriform
shape showed crack propagation but this
work is proved to be a good approach to
reuse the waste plastic [10]. Likewise, some
other authors also worked on the mechanical
properties of concrete made with partial
substitution of e-waste aggregate with
natural fine aggregates. They replaced the
natural fine aggregate with e-waste at
different varying percentages up to 25%.
Some researchers incorporated the e-waste
in the form of thin fibers and some in the form
of fine aggregate. A slight decrease in

3rd Pak-Turk International Conference on Emerging Technologies in the field of Sciences and Engineering
14-16, April 2020
3
compressive, tensile and flexural strength
was observed with increase of plastic
content. But they suggested the feasibility of
utilizing the plastic waste as a construction
material [1, 3]. Strength properties of
concrete made with e-waste is also
investigated using silica fume with
replacement of cement and the resulting
strength was higher than reference concrete
mix [2].
Similarly, some researchers studied
the properties of concrete made with e-waste
as coarse aggregate substitution. A wide
range of replacement ratio up to 40% is
utilized in concrete replacing natural coarse
aggregates. Same as fine plastic aggregate
replacement, the decrease in strength is also
observed in case of coarse aggregate
replacement with e-waste aggregate. But the
results are in permissible limits showing the
feasibility to utilize the e-waste as aggregate
in concrete [11, 12, 13and 14]. K. Senthil
Kumar investigated the effects of
temperature and thermal shock on concrete
made with partial replacement of coarse
aggregate. The replacement ratio of High
Impact Polystyrene (HIPS) used were 10%,
20%, 30%, 40% and 50%. Samples were
exposed to 100, 200 and 300oC and then cool
down with water. Concrete was observed
under destructive and non-destructive tests.
This type of concrete is recommended for
non-structural applications and this is also
suggested for thermal insulation and
advantageous from energy point of view [15].
Researchers have recently worked on
strength properties of concrete made with e-
waste aggregate and suggested that 15-20%
substitution of e-waste aggregates is feasible
with slight reduction in strength. However,
thermal behavior/fire resistance is a very
important aspect to be investigated which
has not been yet studied in case of concrete
made with e-waste aggregates. The current
study is focused on thermal behavior/fire
resistance of concrete made with partial
replacement of e-waste aggregates.
VI. Materials and Methods
A. Cement
In this research work, locally and
commercially available ordinary Portland
cement (OPC Type-1 Fauji brand) is used.
The nominal size of cement is 50um with
specific gravity of 3.15 and bulk density
1440 kg/m3. The cement used in this study
is according to international standards
(ASTM C-150) and its properties provided
by the manufacturer are given in the Table I
below [16].
TABLE I. PROPERTIES OF ORDINARY PORTLAND
CEMENT
Properties of Ordinary Portland
Cement (Type I)
Properties
FCC
L
valu
es
Standard
Requireme
nt ASTM
C-150
Initial setting
time (minutes) 110
45 min
(Min.)
Final setting
time (minutes) 180
375 min
(Max.)
3-days
Compressive
strength (Psi)
3259 1740
(Min.)
7-days
Compressive
strength (Psi)
5039 2760
(Min.)
28-
daysCompress
ive strength
(Psi)
5844 ……

3rd Pak-Turk International Conference on Emerging Technologies in the field of Sciences and Engineering
14-16, April 2020
4
B. Natral Fine Aggregate
Locally available Lawrencepur sand is used as
fine aggregate in this research work. Various
standard tests were performed on the sand to
find out the properties which are given in Table
II.
C. Natural Coarse Aggregate
The natural coarse aggregates used in this
study are obtained locally from the Margalla
Quarry. The coarse aggregates having maximum
size of 20 mm are adopted for this work.
Different standard test were carried out
according to ASTM specifications to find
properties which are mentioned in Table II.
D. Plastic Waste Aggregate
Electronic waste is purchased and the plastic
from the whole scrap is separated mostly the
computers, monitor bodies and keyboards. It is
then processed in recycling plants. The plastic is
heated and then crushed to the required size
after cooling down. In the present study we
incorporated the e-waste plastic aggregate both
as a partial replacement of fine and coarse
aggregates. The maximum size of plastic coarse
aggregate is 19mm and that of plastic fine
aggregates is below 4.75mm. Some other
properties of natural fine aggregate, natural
coarse and plastic aggregates are given in table
II.
TABLE II. PROPERTIES OF NATRAL SAND, COARSE
AGGREGATES AND PLASTIC AGGREGATES
Properties of Materials
Properties
Natural
Sand
Coarse Aggrega
te
Plastic Aggregat
es Fineness Modulus
2.2 8.4 ……
Specific Gravity
2.67 2.68 0.97
Water Absorpti
on 4% 1.4% 0%
Bulk
Density 1600
kg/m3 1518
kg/m3 620
kg/m3
Impact Value
…… 10.9% 2.24%
Abrasion Value
…… 13% 8.68%
VII. Experimental program
In this study, concrete of M20 grade is
prepared using mix ratio of 1:1.5:3 and a
water-cement ratio of 0.45. Batching of
concrete constituents is done. Concrete
specimens are prepared by using the partial
replacement percentages of 0%, 10%, 15%
and 20% e-waste fine and coarse aggregates
separately. Concrete mix groups, specimen
IDs, standards size of specimens and
temperatures are mentioned below in Table
III.
The quantities of cement, sand, coarse
aggregates and e-waste aggregates are
calculated with w/c ratio of 0.45. Estimation
of water is done based on w/c ratio which in
this case is kept at 0.45. Also, a super-
plasticizer is also added about 2% of cement
but in addition to cement while mixing the
water.
Mixing is done according to the
standard ASTM C-192 in an electric mixer.
The ingredients of concrete are dry mixed in
the mixer or 2-3 minutes so that a
homogeneous mix is formed then water and
super-plasticizer are added and it is further
left for 3-4 minutes to mix properly and
poured out and checked for slump of every
mix according to standard ASTM C-143.
The slump values are given in above
Table III and slump values are observed to be
increasing as the plastic aggregate content

3rd Pak-Turk International Conference on Emerging Technologies in the field of Sciences and Engineering
14-16, April 2020
5
increases. As the plastic has 0% water
absorption and lighter in weight as compared
to natural aggregate so the workability of
concrete mix made with e-waste increases.
Then concrete is poured into standard
size moulds (150mm X 300mm) for
compressive strength according to ASTM C-
172. Moulds are filled with concrete in three
layers and compacted with tamping rod.
Concrete moulds are left for 24 hours to set
and then specimens are removed from the
moulds and placed in water for curing of 28
days according to ASTM C192. After curing,
samples are removed from the water and
placed in open air and left for a day to dry the
water or moisture. A set of samples is tested
at room temperature against compressive
strength according to ASTM C39. As the
present study is about the thermal
behavior/fire resistance of concrete made
with partially replaced e-waste, the samples
are placed in a muffle furnace. And the target
temperature is set to 150oC with heating rate
of 20oC/min and kept in the furnace for 1hour
after the target temperature is achieved.
Similarly, the samples are also placed in
furnace for the target temperature of 300oC
and kept for 1 hour at elevated temperature.
Concrete specimens after heating are shown
in fig. 1 (a) and (b) below where the plastic
aggregate can be seen bulging out of
specimens.
(a) (b)
Fig 1. Concrete Specimens (a) during
heating (b) after heating
After the exposure to heat, samples
are taken out of furnace and placed in open
air for 24 hours to cool down to the room
temperature. Then compressive strength test
is performed on the heated samples. Results
of compression strength are show in Fig. 2
and Fig. 3.
Fig. 2 Compressive strength of concrete samples at
different temperatures
39
26
21
37
2321
32
23
19
28
21
17
35
25
20
30
23
19
29
22
17
0
5
10
15
20
25
30
35
40
45
Co
mp
ress
ive
Str
ength
(M
Pa) CM
F10%
F15%
F20%
C10%
C15%
C20%
Room Temperature at 150oC at 300
oC

3rd Pak-Turk International Conference on Emerging Technologies in the field of Sciences and Engineering
14-16, April 2020
6
From the results, a decrease in compressive
strength can be observed with increase in
plastic aggregate content and a decrease in
strength with increase in temperature. As the
plastic has low melting temperature so it gets
melted when subject to higher temperatures.
There is a reduction of about 23% to 34% in
compressive strength when samples were
tested after heating at elevated temperature
of 150oC and about 36% to 46% reduction
when the exposure temperature is 300oC.
During the current study, plastic aggregates
seemed to bulge out of concrete specimens
making cavities inside the concrete when we
heat samples about 300oC for 1 hour.
Strength reduction between room
temperature and 150oC is quite significant
while the strength reduction between 150oC
and 300oC is at slower rate. But still the e-
waste concrete specimens possessed more
than 50% residual strength after heating at
elevated temperatures. The reduction in
strength with e-waste substitution is because
of weaker bond strength between plastic
aggregate and the cement paste. The melting
of plastic also causes the decrease in strength.
VIII. Conclusions
The current research work was aimed
at finding the effect of temperature on
strength of concrete made with e-waste
aggregates. Overall 63 samples were tested at
room temperature, at 150oC and at 300oC.
When we simply replace the natural
aggregates with e-waste aggregate, there is a
decrease in compressive strength after 28
days curing but in permissible limit. The
percentage reduction in strength at 150oC lies
in range of 23% to 34%. And the percentage
reduction of strength at 300C is observed
between 36% and 46%. The strength
reduction is because of relatively weaker
bond strength between plastic aggregates
and cement paste. When samples are
subjected to higher temperatures, they
exhibit lessor compressive strength as
compared to that at room temperature same
as conventional concrete. We intended to go
further beyond 300oC but due to low melting
point of plastic aggregates, this is the limiting
temperature. Plastic aggregate melts and
tries to bulge out of concrete making cavities
inside the concrete. Besides this effect, the
concrete specimens showed more than 50%
residual strength. That’s why e-waste
concrete is suggested to be used in non-
structural member. A lot of research is still
needed on every aspect regarding fire
resistance and thermal behavior to introduce
this technique and its frequent usage. The
slight reduction in the compressive strength
of concrete with e-waste can be overcome
using admixtures. Research must be done on
strengthening of e-waste aggregate concrete
for its applications where fire damage may
exist.
REFERENCES
Fig.3 Reduction in Compressive Strength

3rd Pak-Turk International Conference on Emerging Technologies in the field of Sciences and Engineering
14-16, April 2020
7
[24] J. K. S. R. Shamili, C. Natarajan, “An
Overview of Electronic Waste as Aggregate
in Concrete,” World Acad. Sci. Eng.
Technol. Int. J. Struct. Constr. Eng., vol.
Vol:11, no. No:10, pp. 1423–1427, 2017.
[25] B. Harini and K. V Ramana, “Use of
Recycled Plastic Waste as Partial
Replacement for Fine Aggregate in
Concrete,” Int. J. Innov. Res. Sci. Eng.
Technol., vol. 4, no. 9, pp. 8596–8603, 2015,
doi: 10.15680/IJIRSET.2015.0409106.
[26] H. A. Bulut and R. Şahin, “A study on
mechanical properties of polymer concrete
containing electronic plastic waste,”
Compos. Struct., vol. 178, pp. 50–62, 2017,
doi: 10.1016/j.compstruct.2017.06.058.
[27] M. Záleská, M. Pavlíková, J. Pokorný, O.
Jankovský, Z. Pavlík, and R. Černý,
“Structural, mechanical and hygrothermal
properties of lightweight concrete based on
the application of waste plastics,” Constr.
Build. Mater., vol. 180, pp. 1–11, 2018, doi:
10.1016/j.conbuildmat.2018.05.250.
[28] S. M. Ahirwar Pratiksha Malviya Tech
Scholar Professor and V. Patidar Vikash
Kumar Singh Professor Professor, “An
Experimental Study on Concrete by using E-
Waste as Partial Replacement for Course
Aggregate,” IJSTE-International J. Sci.
Technol. Eng. |, vol. 3, no. 04, p. 7, 2016.
[29] S. Pramila, M. H. Fulekar, and P. Bhawana,
“E-Waste- A Challenge for Tomorrow,” vol.
1, no. 3, pp. 86–93, 2012.
[30] United States Environmental Protection
Agency, "fact and figure sheet," United
States Environmental Protection Agency,
2019. [Online]. Available:
https://www.epa.gov/sites/production/files/
2019/11/documents/2017_facts_and_figures
_fact_sheet_final.pdf.
[31] United States Environmental Protection
Agency, "Electronic products generation and
recycling," United States Environmental
Protection Agency, 2016. [Online].
[32] Dr. K. Tajne and Mrs. P. Bhandari,
“WASTE PLASTIC USED AS A COARSE
AGGREGATE IN CONCRETE” vol. 2, no.
01, 2016
[33] Z. Z. Ismail and E. A. AL-Hashmi, “Use of
waste plastic in concrete mixture as
aggregate replacement,” Waste Manag., vol.
28, no. 11, pp. 2041–2047, 2008, doi:
10.1016/j.wasman.2007.08.023.
[34] A. A. C. S. dhar, K. Mehraj Pasha, “E-Waste
Management by Utilization of E-Plastics in
Concrete Mixture as Coarse Aggregate
Replacement,” Int. J. Innov. Res. Sci. Eng.
Technol., vol. 04, no. 07, pp. 5087–5095,
2015, doi: 10.15680/ijirset.2015.0407008.
[35] B. T. A. Manjunath, “Partial Replacement of
E-plastic Waste as Coarse-Aggregate in
Concrete,” Procedia Environ. Sci., vol. 35,
pp. 731–739, 2016, doi:
10.1016/j.proenv.2016.07.079.
[36] B. Mishra and R. S. Mishra, “A Study on Use
of Plastic Waste Aggregate as Partial
Replacement of Natural Coarse Aggregate in
Cement Concrete Mix,” pp. 11232–11238,
2015, doi:
10.15680/IJIRSET.2015.0411068.
[37] R. Lakshmia and S. Nagan, “Investigations
on durability characteristics of E-plastic
waste incorporated concrete,” Asian J. Civ.
Eng., vol. 12, no. 6, pp. 773–787, 2011.
[38] K. S. Kumar and K. Baskar, “Effect of
temperature and thermal shock on concrete
containing hazardous electronic waste,” J.
Hazardous, Toxic, Radioact. Waste, vol. 22,
no. 2, pp. 8–13, 2018, doi:
10.1061/(ASCE)HZ.2153-5515.0000387.
[39] Fauji Cement, "Ordinary portland cement,"
Fauji Cement, 2019. [Online]. Available:
http://fccl.com.pk/products/ordinary-
portland-cement/.

3rd Pak-Turk International Conference on Emerging Technologies in the field of Sciences and Engineering
14-16, April 2020
8
TABLE III. EXPERIMENTAL PROGRAM DETAILS
Group
Slump (mm)
Specimen ID
Cross Section
Dimensions
(mmxmm)
%age E-waste Replacement
No. of Specimens
Temperature Fine Aggregat
e
Coarse Aggregat
e
1 65
CM-TR Circular 150x300 0 0 3 Room Temp.
CM-T-150 Circular 150x300 0 0 3 150oC
CM-T-300 Circular 150x300 0 0 3 300oC
2 65
F10TR Circular 150x300 10 0 3 Room Temp.
F10-T-150 Circular 150x300 10 0 3 150oC
F10-T-300 Circular 150x300 10 0 3 300oC
3 70
F15-TR Circular 150x300 15 0 3 Room Temp.
F15-T-150 Circular 150x300 15 0 3 150oC
F15-T-300 Circular 150x300 15 0 3 300oC
4 75
F20-TR Circular 150x300 20 0 3 Room Temp.
F20-T-150 Circular 150x300 20 0 3 150oC
F20-T-300 Circular 150x300 20 0 3 300oC
5 80
C10-TR Circular 150x300 0 10 3 Room Temp.
C10-T-150 Circular 150x300 0 10 3 150oC
C10-T-300 Circular 150x300 0 10 3 300oC
6 130
C15-TR Circular 150x300 0 15 3 Room Temp.
C15-T-150 Circular 150x300 0 15 3 150oC
C15-T-300 Circular 150x300 0 15 3 300oC
7 180
C20-TR Circular 150x300 0 20 3 Room Temp.
C20-T-150 Circular 150x300 0 20 3 150oC
C20-T-300 Circular 150x300 0 20 3 300oC
CM= Control Mix, TR = room temperature, T= Temperature, F=plastic fine aggregate, C=plastic coarse aggregate

3rd Pak-Turk International Conference on Emerging Technologies in the field of Sciences and
Engineering 14-16, April 2020
9
Techno-Economic Analysis of an Off-Grid
Eco-Friendly Flywheel Based Bicycle
Generator
Arsal Mehmood1, a , Dr. Nayyar Hussain Mirjat2,b , Prof. Dr. Zubair Ahmed Memon3,c , Faraz Baig4,d , Muhammad Ammar
Jatt5,e , Muhammad Saad Khan6,f , Suhail Ahmed Shaikh7,g
1Department of Electrical Engineering, Mehran University of Engineering & Technology, Jamshoro, Pakistan
2Faculty of Electrical Engineering, Mehran University of Engineering & Technology, Jamshoro, Pakistan
3Faculty of Electrical Engineering, Mehran University of Engineering & Technology, Jamshoro, Pakistan
Email Address: a) [email protected] , b) [email protected] ,
ABSTRACT----According to the Global Long-Term
Climate Risk Index (CRI) 2020 by the German Watch, Pakistan
is 5th among 10 countries affected most by climate change.
Global warming and scarcity of Conventional resources are
becoming major problem in the current scenario. Pakistan’s
most of the energy is produced by using conventional sources,
but these sources are responsible for pollution and global
warming which ultimately result in climate change. That’s why
today we need alternative non-conventional sources which are
eco-friendly and sustainable. Solar and other renewable
sources are several forms of energy which are used
alternatively today. Along with those sources, Human Power is
one of lasting source of energy which is wasted during
workout. In this paper, a prototype modelling of an OFF-Grid
Green Energy Harvesting Flywheel Based Bicycle Generator
which could be used as an OFF-Grid Battery Charging System
is developed to minimize the lighting load demand of MUET
Gymnasium fitness facility. In this mechanism, efficient
flywheel energy storage technology is implemented on KERS
(Kinetic Energy Recovery System) static workout bicycle
generator. Additionally, a relative cost analysis of prototype
model, comparative analysis of present with proposed LED
luminosity system in terms of CO2 emission, energy unit
saving, and its cost saving is analyzed. Feasibility analysis for
the implementation of Energy and Climate Change (EC)
indicators of Universitas Indonesia Green Metric World
University Ranking (UIGM) is also undertake.
KEYWORDS--- Global Long-Term, Climate Risk Index,
German Watch, Climate Change, Conventional Sources,
Global Warming, Alternative, Renewable Sources, Human
Power, Off-Grid, Green Energy, Kinetic Energy Recovery
System, Bicycle Generator, Relative Cost Analysis,
Comparative Analysis, LED Luminosity System, CO2
Emission, Energy Unit Saving, Cost Saving, Feasibility
Analysis, Sustainable, Energy and Climate Change (EC)
Indicators, Flywheel, Universitas Indonesia Green Metric
World University Ranking .
I. INTRODUCTION
Pakistan is fifth most populous country in the
world [1]. Electricity is the basic need of human
life. With an on growing population, the needs of
renewable electrical power and their usage is also
increasing day by day. Every year the consumption
rate of electricity is increasing globally, but in
Pakistan the production rate is not growing
sufficiently which consequently resulted in load
shedding and increase in electricity price levels.
Besides, fossil fuel cost is increasing day by day as
well as government is also taking steps to make use
of renewable sources. Today climate change is the
biggest thread we faced. So, now it is time to gives
attentions to generate power through renewable
energy sources, instead of conventional energy
source. According to National Electric Power
Regulatory Authority (NEPRA) annual report
2018-2019 [2].
Figure 25: Represents overall installed capacity of Pakistan
Thermal 22848 MW
63.96%
Hydel 9732 MW
26.70%
Solar 400 MW
1.23%
Wind 1235 MW
3.03%
Biogase 364 MW
0.94%
Nuclear 1345 MW
4.14%

3rd Pak-Turk International Conference on Emerging Technologies in the field of Sciences and
Engineering 14-16, April 2020
10
From Fig.1, this is one of the main element that
Pakistan is listed in Global Long-term Climate Risk
Index (CRI) top 10 countries [3, 4].
In Paris Agreement 2015, United Nations
Framework Convention on Climate change
(UFCCC) presents an idea that developing
countries needed to utilized environment friendly
technologies to contribute in reducing emissions
and prevent the world from global warming [5]. For
that we need to focus on find an alternative
renewable energy power plants, especially
environmentally green and eco-friendly [6]. One
type of an environmentally friendly clean and green
energy power plant is an off-grid eco-friendly
flywheel fitness exercise static KERS bicycle
generator.
Human body can produce a significant amount
of energy and Human muscles activity has the
potential to produce power which can be used for
low power application specially lighting load
application. Use of exercise equipment for green
energy source would be an exciting experience for
participants as well as it provides a mean to generate
power along with cycling exercise [7].
Flywheel-Based KERS Bicycle Generator has
an ability to tap human energy to produce electricity
quickly and efficiently. The primary function of
flywheel is to works as an energy accumulator and
to reduce the fluctuation in speed. It absorbs the
energy when demand is less and releases the same
when it’s required, which is the technical and
engineering aspect of harvesting energy [8, 9]. This
flywheel technology inherits many advantages that
are environmentally friendly and has low
maintenance, long life with no degradation. That’s
why even NASA (National Aeronautics and Space
Administration) Glenn Research center has
employed Flywheel energy storage systems for over
three decades [10].
The objective of this research is to develop a
practical prototype of an OFF-Grid Green
Harvesting Bicycle Generator with highly efficient
flywheel energy storage system, which could act as
well as an OFF-Grid Battery Charging System. This
model will be proposed as a technological solution
to minimize and to overcome the lighting load
demand dependency of MUET Gymnasium on
WAPDA and it will be suggest as a proposal for the
implementation of UI Green Metric (UIGM),
Energy and Climate Change (EC) indicators [11].
Fig 26: Represents Energy and Climate Change Indicator
of Universitas Indonesia Green Metric World University
Ranking
Fig 27: Represents Criteria and Indicators of Universitas
Indonesia Green Metric World University Ranking [12]
According to the Ranking released by Universitas
Indonesia Green Metric in 2019, MUET is 271st
Worldwide, 2nd in all over Pakistan while 1st in Sindh
Province University rankings. Although, in terms of
implementing Energy and Climate Indicators of
UIGM they listed MUET 275th best Globally [13].
Fig 28: Represents Global Ranking of Mehran University of
Engineering & Technology in Green Metric World University
[14]
Fig 29: Represents Global Ranking of Mehran University of
Engineering & Technology in Green Metric World University
for the Implementation of Energy and Climate Change
Indicators [15]

3rd Pak-Turk International Conference on Emerging Technologies in the field of Sciences and
Engineering 14-16, April 2020
11
Our proposed mechanism is beneficial in
maintaining sustainability and improving global
ranking through the implementation of EC
indicators.
Alternatively, this research also gives a
comparative analysis of present less-efficient 60
Watts tube light Lighting System with the highly
efficient 6 Watts LED lighting System in terms of
Electrical Energy Unit Consumption Saving, its
Cost Saving and its related Green House Gases
(GHG) emission saving.
II. LITERATURE REVIEW
Literature review suggests that there is
considerable work done towards the utilization of
bicycle generator as renewable energy source
globally. However, there is limited evidences in the
literatures about any techno-economic study which
undertaken for the designing, development and
implementation of an “Off-Grid Flywheel Based
Bicycle Generator” as renewable green energy
source to meet the Lumosity demand of a
Gymnasium Fitness Facility through an efficient
lighting system as some of the literature are as
follows:
Flywheel based Bicycle Generator can be used as
a mode of transportation as it provides low cost
mobility facility along with some health benefits the
working principle is to convert the rotational energy
of the rare wheel into kinetic energy to recharge the
battery [16].
Bicycle-based human power generation system
can harvest power of 50 W which can be utilized for
the low power off-grid rural electrification to charge
battery for the purpose of lighting the home with
low wattage LED lamp during the periods of
necessity [17].
Gymnasium bicycle is an Electro-Mechanical
system which tap harvest electrical energy by using
alternator by the conversation of pressure energy of
human muscles to kinetic energy [18].
Riding bicycle is a good source of Power as well
as a good exercise. According to a research, humans
are capable to generate around 100 W of power
while riding bicycle. However, this power is wasted
without our knowledge. The dynamo or alternator
can harvest cyclers generated energy while riding
which could be used to charge small devices,
laptops, and mobiles [19].
Human powered gyms are those gyms which uses
equipment’s like treadmills, stationary bikes and
rowing machine to generate green and sustainable
energy which not only benefits environmentally but
also economically [20].
Green Energy Harvesting (EV) by using wastage
energy during activity through Gymnasium bicycle
is an economical generation of electricity since
conventional sources decreasing day by day [21].
Power Generation by pedaling bicycle is a great
resource of clean energy as well as it serves as a
mode of transportation to power the un-electrified
village by using either alternator or dynamo [22].
Pedaling bicycle helps in maintaining a good
physic as well as it serves as a good source of green
energy generation by using dynamo which is then
used to charge mobiles, iPod, Laptops [23].
III. METHODIOLOGY
In human’s life, electricity is the basic
requirement. Every year electricity consumption is
increasing by 10% but when there is no
simultaneous increase in production, then the
consequences resulted in the form of increase
electricity prices and load shedding Alongside the
availableness of fossil fuels are getting reduced. In
this case study we have proposed the general
technique to produce electricity from mechanical
energy. The concept of this study is
to use the wasted kinetic energy in gymnasium
while work out to produce electricity.
Fig 30: Research Methodology Framework

3rd Pak-Turk International Conference on Emerging Technologies in the field of Sciences and
Engineering 14-16, April 2020
12
Table 8: Research Flow Diagram
I. DATA COLLECTION & SURVEYS
In this review, a survey is performed for the data
collection from MUET Gymnasium fitness facility.
Questionnaire method is used for the
determination of GYM operating hours, Operating
sessions, Power ratings present appliances, Overall
load demand, Lighting load demand in the
respective sessions, Quantity of luminosity
appliances, Frequency of peoples in the respective
sessions and their equipment’s of concern.
Table 9: Data collection from Gymnasium fitness facility
DATA SPECIFICATIONS
NO. OF TUBELIGHTS 30
ENERGY CONSUMTION OF 1
TUBELIGHT
60-70 W
TOTAL LIGHTENING
CONNECTED LOAD 1.8 KW
Table 10: Represents operating hours of Gymnasium
GYMNASIUM OPERATING HOURS
1 SESSION 9 AM - 2:30PM
2 SESSION 3:30 PM – 9 PM
TOTAL OPERATION
HOURS 11 HOURS
Table 11: Represents load demand of fitness facility
LOAD CONSUMPTION DURING TOTAL OPERATING
HOURS
1 SESSION 1 hr. (IN BED LIGHT)
8 TUBLIGHT
2 SESSION 6 PM– 9:30 PM
TOTAL LOAD
CONSUMPTION
HOURS
480W + 6.3KW=6780W
II. DATA ANALYSIS
The results of collected data analysis are as follows:
Table 12: Represents classifications of PMDC Generators
with present and proposed lighting capacity
Classification of
DC PMDC
GENERATOR
PRESENT
TUBELIGHT
60W
TUBELIGHT
SYSTEM
1 TUBELIGHT=
60W
PROPOSED 6W
LED LIGHTING
SYSTEM
6 WATTS
1 LED = 6W
50 WATTS NOT A SINGLE
TUBELIGHT
8 LED
100 WATTS 1 TUBELIGHT 16 LED
250 WATTS 4 41 LED
300 WATTS 5 50 LED
500 WATTS 8 83 LED
1000 WATTS 16 166 LED
III. SYSTEM DESIGNING
Design of the proposed system is given by:
Pedaling
• It converts Potential Energy to Variable Mechanical Energy and this V.M.E is converted to Variable Rotational Energy (V.R.E) or Variable Kinetic Energy (V.K.E)
Flywheel
• A flywheel is a heavy rotating body which acts as a reservior of energy.
• It stores V.K.E and convert to constant and fluctuation free K.E or R.E.
Generator
• Converts Constant Rotational Energy(C.R.E) of flywheel to Electrical Energy.
Charge Controller
• A Charge controller limits the rate at which electronic current is added or drawn from electric battery. It prevents overcharging and may protect against overvoltage.
Battery
• Store Electrical Energy in the form of chemical Energy.
6 W LED
• Series connected 6 Watts LED to overcomes the luminosty demends of MUET Gymnasium under operating sessions.

3rd Pak-Turk International Conference on Emerging Technologies in the field of Sciences and
Engineering 14-16, April 2020
13
Fig 31: Represents Proposed System Design with 250W
PMDC, 24 V battery, Charge Controller, Switches and
Series connected 6W 40 LED (1st session 15 LED + 2ND
session 25 LED) fitness facility through Frizing Software
IV. PROTOTYPE INTERNAL
MECHANISM
Fig 32: Represents prototype model internal mechanism
V. HARDWARE MODEL
COMPONENETS
CONFURIGATION
The below figure represents the basic
configuration of “Off-Grid Green Energy
Harvesting (EH) Flywheel Based Bicycle
Generator” with specialized and unique flywheel
energy accumulation technology integration.
Fig 33: Represents Hardware model of an Off-Grid Eco-
friendly Green Energy Harvesting (EH) Flywheel Based
Bicycle Generator.
IV. RESULTS & ANALYSIS
The main objective of this prototype development
research is to initiate a self-sufficient gymnasium
phenomenon which can sustain its all lighting load by
the utilization of waste mechanical energy during
workout and convert it down into electrical energy.
This project presents an economical and
technological solution of load shedding and as well
as it could serves as a backup energy resource or
uninterruptable power supply (UPS) by using battery.
Additionally, power production by the flywheel-
based bicycle generator provides us opportunity to
minimize the atmospheric pollution which is
nowadays a government policy.
Flywheel-based bicycle generator is very cheap.
Since, we know that cost of fossil fuel is increasing
day by day and this project is not depending on those.
It serves dual purposes benefits simultaneously.
Firstly, physical fitness through exercise of muscles,
and legs. Secondly, green, and eco-friendly power
generation through those healthy activities at the same
time.
The initial result of the study for energy saving and its
cost saving is given by the formula as:
I. Calculations for Energy Saving
Energy Saving,
C = A – B (1)
A= (1st session operating hours × Sum of 60 W
connected load operates in 1st session) + (2ND session
operating hours ×Sum of 60 W connected load
operates in 2ND session)
B= (1st session operating hours × Sum of 6 W
connected load operates in 1st session) + (2ND session
operating hours × Sum of 6 W connected load
operates in 2ND session)

3rd Pak-Turk International Conference on Emerging Technologies in the field of Sciences and
Engineering 14-16, April 2020
14
Table 13: Represents initial results of the study for Energy
Saving
Comp
arison
60 W
Tube
light
Lighteni
ng
System
Load
Consum
e
(A)
6 W
LED
Lighteni
ng
System
Load
Consum
e
(B)
Energy
Consumptio
n Saving by
using 6 W
LED System
C = (A-B)
Daily 6.780
KW
250 W 6530 KW
Weekl
y
47.46
KW
1.750
KW
47.21 KW
Month
ly (29
Days)
196.62
KW
7.250
KW
196.370 KW
Annua
lly
(305
Days)
2067.9
KW
76.250
KW
2067.65 KW
II. Calculations for Cost
Saving
Cost Saving D,
𝑫 = 𝑪 × 𝜸 (2)
C = Energy unit saving(daily/weekly/monthly)
𝛾 = Cost Per Price of single unit of Energy
Table 14: Represents initial results of the study for Cost
Saving
Comparison Cost Saving (1 Unit = 18 Rupees in
Pakistan)
Daily 117.54 Rupees
Weekly 849.78 Rupees
Monthly (29 Days) 3534.66 Rupees
Annually (305 Days) 37217.7 Rupees
III. Calculations for Co2 Emission
Saving
Primary electricity production in Pakistan from
thermal (oil, natural gas, etc.) as shown
in fig:1, and
1KWH = 0.001MWH
Since,
Energy produce in this proposed “Off-Grid
Eco-Friendly bicycle generator” is
100% green. So, there is no Co2
emission.
Therefore,
The amount of Co2 Emission saving through
proposed idea as compare to 60 W tube
light system is given by the formula as:
CO2 Emission Saving = Energy consume
while 60W system operates in KWH
×
CO2 Emission factor for solar, wind or
other sources × 0.001 MWH Per
KWH
CO2 Factor for wind and solar is 0.600 ton Co2 per
Megawatt hours .While its value for other source is
0.501 ton Co2 per Megawatt hours according to the
Asian Development Bank [24].
Table 15: Represents initial results of the study for Co2
Emission Saving
V. CONCUSION
Pakistanis are facing electricity crisis whereas higher
electricity tariffs are another burden for the consumers.
Higher Education Commission of Pakistan provides
students’ academic as well as some extra curriculum
opportunities for the grooming of generation. However,
they fetch funding from Government. Mehran
University has a gymnasium fitness facility where
enough electricity is consumed which could be met
through a unique and innovative alternative energy
Comparison
CO2 Emission in
60 W Tube
Light System for
Wind and Solar
Emission
Factor=0.501tco2
Per MWH
(Other Source)
CO2
Emission in 6
W LED
System for
Wind and
Solar
Emission
Factor=0.600
tco2 Per
MWH (Wind
& Solar)
Daily 0.00339 Ton of
CO2
0.004068 Ton
of CO2
Weekly 0.02377 Ton of
CO2
0.0284 Ton of
CO2
Monthly
(29 Days)
0.09850 Ton of
CO2
0.1220 Ton of
CO2
Annually
(305 Days)
1.0360 Ton of
CO2
1.484 Ton of
CO2

3rd Pak-Turk International Conference on Emerging Technologies in the field of Sciences and
Engineering 14-16, April 2020
15
generation prospective to save energy, cost, Green
House Gas (GHG) Emission by an implementations of
UIGM Energy & Climate indicators through a
feasibility analysis approach .
REFERENCE
[1] "Worldometer," [Online]. Available:
https://www.worldometers.info/world-
population/pakistan-population/.
[2] "NEPRA Annual Report 2018-19," National
Electric Power Regulatory Authority of Pakistan,
2018-2019.
[3] "German Watch," [Online]. Available:
https://germanwatch.org/sites/germanwatch.org
/files/publication/20432.pdf.
[4] "Ministry Climate Change Pakistan," 2010.
[Online]. Available: http://mocc.gov.pk/moclc
/userfiles1/file/ECCO/Chapter-07.pdf.
[5] "United Nations Climate Change Conference,
" Paris, 2015.
[6] P. P. a. D. D. F. S. Prabowo, "Eco-electric energy
generator system using human exercise
activities,
" vol. 197, p. 11010, 2018.
[7] "Youtube," [Online]. Available:
https://www.youtube.com/watch?v=OZQz59NpI
S8.
[8] "Clubtechnical," [Online]. Available:
https://clubtechnical.com/flywheel.
[9] "Wikipedia," [Online]. Available:
https://en.wikipedia.org/wiki/Flywheel.
[10] "Wikipedia," [Online]. Available:
https://en.wikipedia.org/wiki/Flywheel_energy_
storage.
[11] "UI GreenMetric," [Online]. Available:
http://greenmetric.ui.ac.id/criteria-indicator/.
[12] "UI Green Metric," [Online].
Available: http://www.ireg-observatory.org/ireg-
8/presentations/V/Riri-Fitri-Sari-UI-
GreenMetric-PPT_IREG8_06052016.pdf.
[13] "Mehran University of Engineering &
Technology," [Online]. Available:
https://www.muet.edu.pk/sustainability.
[14] "UI GreenMetric," 2019. [Online]. Available:
http://greenmetric.ui.ac.id/overall-rankings-
2019/.
[15] "UI GreenMetric," 2019. [Online]. Available:
http://greenmetric.ui.ac.id/rankingindicator
2019/?indicator=2.
[16] P. S. J. P. K. Yadav R, "Flywheel Based
Bicycle Generator," IJARIIE, vol. 2, no. 5, 2017.
[17] T. L. U. S. A. a. J. M. B. B. Shenoy, "Human
Muscles Energy Harvesting : Model and
Application for low power load," in 8th IEEE
India International Conference on Power
Electronics (IICPE), 2018.
[18] K. M. U. M. M. M. A. K.M Ahsan-uz-Zaman,
"Generation of Electrical Power using
Gymnasium Bicycle," in IEEE Region 10
Humanitarian Technology Conference (R10-
HTC), Dhaka, 2017.
[19] B. S. a. D. Reddy, "Generation of Power from
Bicycle Pedal," International Journal of
Advanced Research in Electrical Electronics and
Intrumentation Engineering, vol. 4, no. 10, pp.
8429-8434, 2015.
[20] N. S. O. S. a. B. R. B. Chalermthai, "Recovery of
useful energy from lost human power in
Gymnasium," in IEEE 15th International
Conference on Environment and Electrical
Engineering (EEEIC), Abu Dhabi, 2015.
[21] M. T. K. M. A. B. U. M. H. &. T. G. M. Ullah,
"Harvesting green Energy from wastage energy
of human activities using gymnasium bicycle at
Chittagong City," in 3rd International
Conference on Green Energy and Technology
(ICGET), Chittagong, 2015.
[22] P. S. V. R. M. P. a. R. K. R. K. Megalingam,
"Pedal power generation," International Journal
of Applied Engineering Research, vol. 7, no. 11,
pp. 699-704, 2012.
[23] M. C. K. K. K. S. a. A. S. R. Suhalka, "Generation
of Electrical Power using Bicycle Pedal,"
International Journal of Recent Research and
Review, vol. 7, no. 2, pp. 63-67, 2014.
[24] "Asian Development Bank," 2017. [Online].
Available:
https://www.adb.org/documents/guidelines-
estimating-ghg-energy-projects.

3rd Pak-Turk International Conference on Emerging Technologies in the field of Sciences and Engineering
14-16, April 2020
16
Appraisal of Stone Processing Industry Wastage as an
Admixture for Soil Improvement
Qammar Abbas1,a, Muhammad Usman Arshid1,b, Syed Shujaa Safdar2,c and Raja Abubakar Khalid3,d 1, University of Engineering and Technology Taxila
2 Capital University of Science and Technology Islamabad 3The University of Lahore Islamabad Campus
Email address: a) [email protected], b) [email protected], c) [email protected]
and d) [email protected]
Abstract— Removal and replacement is technique being employed for the projects encountered with A-6 or A-7-5 types of
Soils, but it require extra financial support along with requirements of considerable time for its implementation. The current
research work explore in-situ improvement of such soils using marble stone dust as an admixture. Marble stone dust was
added in variable percentages (0%,5% and 10%) and the resulting effect was assessed by comparing index properties,
Engineering properties and shear strength parameters. The soil properties considerably improved with the addition of
marble stone dust. The outcome of the study established the suitability of proposed admixture for the in-situ improvement of
soil. It may not only reduce the cost of the projects but also shorten the time consumed for the soil improvement.
Keywords—Expansive soil, admixture, marble stone waste, CBR, UCS

3rd Pak-Turk International Conference on Emerging Technologies in the field of Sciences and Engineering
14-16, April 2020
17
I. Introduction
Soils having expansive characteristic are the problematic soils that experience huge volume
changes when they come into contact with water and severely impair the light and heavily
loaded structure. Soil of Expansive nature are found in many parts of world, and these type of
soil caused severe damage to the pavement subgrade layer due to the action of capillary rise or
poor drainage system, which may lead to the failure of pavement[1].
Expansive soil have a concern of research for many investigations especially for road
projects. The pavement may undergo cracking due to the uneven heave because of wetting and
shrinkage of subgrade during drying. To rehabilitate the existing pavement laid on the bed made
up of expansive soils, geosynthetic layer was being placed on existing pavement over which
asphalt layer is laid [2]. [1] studied the volume expansion effect on road pavement system using
Oedometer and CBR mold, CBR tests were performed to predict the swell percentage and
swelling/expansion pressure of subgrade soil with different moisture content. As a result it was
concluded that with the increase in the moisture content, swell percentage and swelling pressure
decreases at a given surcharge load.
Different materials have been explored to stabilize the expansive soil in different parts of the
world. Apart from many techniques addition of admixtures has been widely accepted. [3]
suggested that expansive nature of the soils can be reduced using additives like Fe2O3, CaO, and
some polymers. Many researchers have said that marble stone dust has very high lime content of
calcium oxide up to 55 % by total weight [4]. The amount of marble stone waste discharged as
during block and tiles production at the quarries is equal to 40-60% of the total production out of
that very small portion of the waste stone marble products is used economically[5]. [6] had
practically proved that marble dust powder is effective waste material obtained from stone
processing industry for the stabilization of expansive nature soil. Index properties as well as
engineering properties of weak soil could be improved. [7] made a research effort to evaluate the
recovery and reuse of byproducts obtained from marble processing industries quarries as well as
processing plants produce large amount of waste during excavation, sawing, polishing and water
treatment. It was concluded that calcium carbonate dust particles are very fine particles and have
no impurities can be used as an admixture.
Marble stone waste is a solid waste that is produced by the marble stone processing
industry, which are available in Pakistan abundantly. Studies showed that the marble production
throughout the world was almost 21.7 million tons in 1986; However in 1998, this was
significantly increased up to 51 million tons [8]. Expansive soils are abundantly available in
Pakistan especially in the areas like Dera ghazi khan, Dera Ismail Khan, Lahore and Rawalpindi.
Different techniques are required to stabilize such type of soil such as chemical stabilization and
addition of different admixture.

3rd Pak-Turk International Conference on Emerging Technologies in the field of Sciences and Engineering
14-16, April 2020
18
II. materials & methodology
In order to carry out the research work, Material collection and lab tests were performed
after detailed literature review.
A. Materials
Soil samples was taken from two sources Kangota Syedan, Sihala zone -V, Islamabad and Dandi
Gujran near Rawalpindi Pakistan.
Figure II-1 Collection points of Expansive Soils
B. Marble Stone Waste
Marble stone waste was collected from marble industry located at T-chowk Rawat Pakistan.
Figure II-2 Collection point of Marble stone waste
C. Soil properties
Following soil properties of the proposed soil were examined using marble stone dust as an
admixture.
Index properties
Engineering properties
Shear Strength parameters
III. RESULTS AND DISSCUSION
The collected samples were analyzed in the laboratory. The study results have been discussed in
subsequent section below.
A. Index propertis
Basic index properties (L.L, P.L & P.I) as well as sieve size analysis test ASTM D-6913 was
performed for the classification of collected soil samples. Both soil were found to be of expansive
nature (A-7-5 and A-6). Tests results are given in Table 1.

3rd Pak-Turk International Conference on Emerging Technologies in the field of Sciences and Engineering
14-16, April 2020
19
TABLE 16. SOIL PROPERTIES
Sample
Location
Grain Size Analysis Atterberg’s Limits Soil
Classification Percent Passing % L.L P.L P.I
#10 #40 #200 % % % AASHTO
Classification
Dandi
Gujran 99.36 98.77 96.13 45 28 17 A-7-5
Kangota
Saidan
Sihala
98.72 96.29 92.63 37.8 21.9 15.9 A-6
1) Liquid Limit test results
Figure 1 shows the combine results of A-6 and A-7-5 soil liquid limit test (ASTM D-4318)
result by addition of marble stone waste in varying percentage. Results shows that liquid limit of
A-6 soil and A-7-5 soil was decreased by the addition of marble stone waste up to 15% and 20%
after liquid limit of both soil was decreased.
Figure III-1 Combine result of Liquid limit with varying %age of marble stone waste
2) Plastic Limit
Figure 2 shows the plastic limit test results of A-6 and A-7-5 soil sample prepared after addition
of marble stone waste in different percentages. Results shows that plastic limit of A-6 soil and A-7-
5 soil was decreased by the addition of marble stone dust.
Figure III-2 Combine result of Plastic limit with varying %age of marble stone waste
30
40
50
0 5 10
Liq
uid
lim
it %
Admixture %
A-7 soil
A-6 soil
15
20
25
30
35
0 5 10
Pla
stic
lim
it %
Admixture %
A-
7
s…

3rd Pak-Turk International Conference on Emerging Technologies in the field of Sciences and Engineering
14-16, April 2020
20
3) Plasticity Index
Figure 3 shows the plasticity Index results of A-6 and A-7-5 prepared soil samples after addition
of marble stone waste. Results shows that plasticity index of A-6 soil and A-7-5 soil was decreased
by the addition of marble stone waste.
Figure III-3 Combine result of Plasticity index with varying %age of marble stone waste
B. Engineering properties
1) MDD
Modified AASHTO T-180 compaction test was performed to find out the effect of marble stone
waste on MDD of both A-6 and A-7-5 soil. From results it is observed that the optimum value of
marble stone waste to increase the MDD of A-6 soil is 15% and for A-7-5 soil it is 20%.
Figure III-4 Combine result of MDD with marble stone waste
2) OMC
Decrease in OMC value of both expansive nature soils was observed with the addition of marble
stone waste.
Figure III-5 OMC result with varying %age of marble stone waste
12131415161718
0 5 10
Pla
stic
In
dex
Admixture %
A-7
soil
1.51.61.71.81.9
22.12.22.32.42.5
0 5 10
MD
D
g/c
m3
Admixture %
A-7 Soil
A-6 Soil
15
17
19
21
23
25
0 5 10
OM
C %
Admixture %
A-7 soil
A-6 soil

3rd Pak-Turk International Conference on Emerging Technologies in the field of Sciences and Engineering
14-16, April 2020
21
3) Swell Potential
Swell potential of the tested soil samples were constantly decreased by adding marble stone
waste.
Figure III-6 A-6 soil swell potential result at different dosage of marble stone waste
Figure III-7 A-7-5 soil swell potential result at different dosage of marble stone waste
4) CBR
Combine CBR test AASHTO T-193 result of tested soil samples is shown below. Constant increase
in CBR of tested soil samples was observed. CBR of A-6 soil obtained using marble stone waste is
more than the A-7-5 soil.
Figure III-8 CBR at different dosage of marble stone waste
5) Unconfined Comressive Stregth Test Result
Unconfined compressive strength test ASTM D-2216 was performed on expansive soil samples,
combine result of prepared soil samples with marble stone dust in varying percentage is given
0 % 5 % 1 0 %
SW
EL
L
PE
RC
EN
TA
GE
ADMIXTURE %
A-6 SOIL SWELL POTENTIAL
10 blows sample 30 blows sample 65 blows sample
0 % 5 % 1 0 %
SW
EL
L
PE
RC
EN
TA
GE
ADMIXTURE %
A-7 SOIL SWELL POTENTIAL
10 blows sample 30 blows sample 65 blows sample
1.5
2
2.5
3
0% 5% 10%CB
R %
admixture %
A-6 Soil
A-7 Soil

3rd Pak-Turk International Conference on Emerging Technologies in the field of Sciences and Engineering
14-16, April 2020
22
below. It is clear from the results obtained after UCS test that UCS value of tested soil was
increased by adding marble stone waste.
Figure III-9 UCS result after addition of marble stone waste
C. Shear Box Test Results
Effect of marble stone waste on shear strength parameters C and Ф ASTM D-3080 is shown in
figure 4-69. Results shows that Cohesion of both type of soil was decreased by adding marble
stone waste. Slight increase in the value of angle of internal friction of both soil was observed.
Figure III-10 Cohesion and Ф variation at different percentage of marble stone waste
IV. Conculsion
From the study it has been concluded that,
• With increasing marble stone waste percentage, Liquid limit, plastic limit and Plasticity index
of soil samples reduced.
• OMC as well as MDD reduced by the addition of marble stone waste.
• Strong correlation with increasing marble stone dust percentage has been observed.
• A-6 soil observed significant increase in CBR value with increase in marble stone waste this
depict that expansive soil with lower values of CBR can be used as subgrade soil after
stabilizing through marble stone waste.
• Swell potential of both type of soil constantly decreased by the addition of marble stone
waste.
• Results of direct shear test highlighted that cohesion of both soils was reduced by the increase of
marble stone waste along with increase in cohesion of soil samples was observed.
• Angle of internal friction also observed to be increased.
0
5
10
15
0 5 10
Str
ess
kg
/cm
2
Admixture %
A-7 Soil
A-6 Soil
0
0.5
1
0% 5% 10%
C v
alu
e
Admixture %
A- 6
soil0
10
20
30
0% 5% 10%
Ф v
alu
e
Admixture %
A-7 Soil
A- 6 Soil
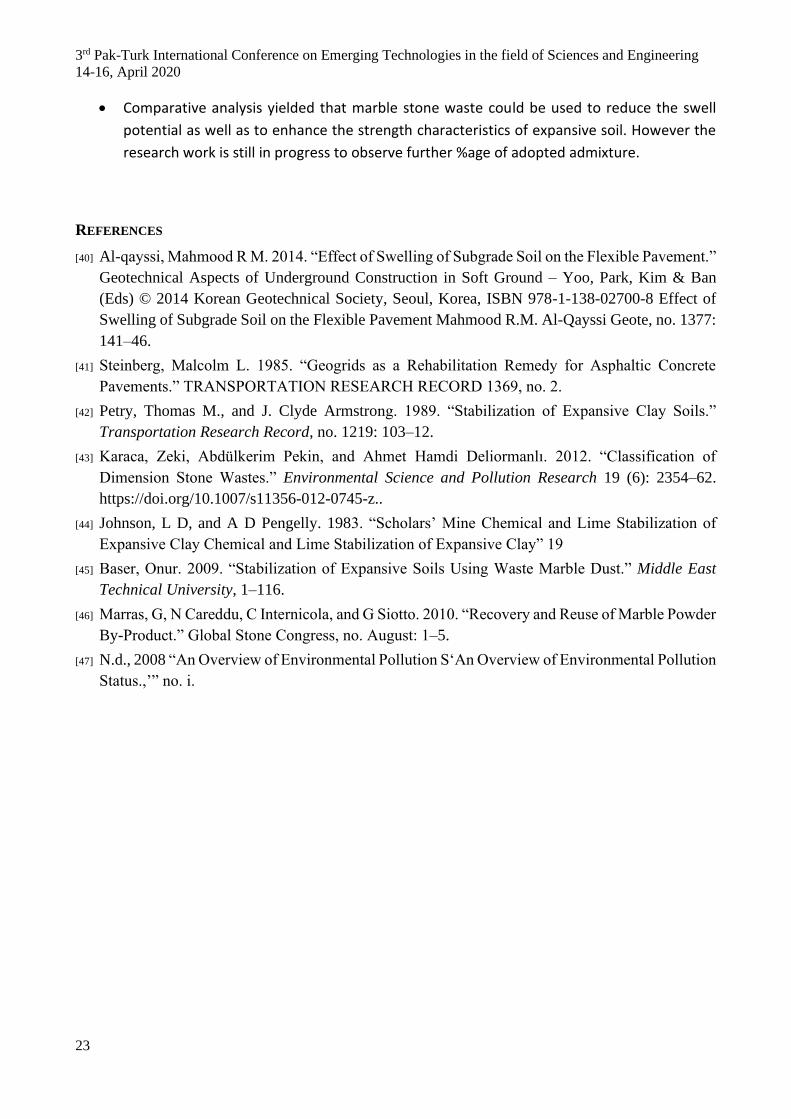
3rd Pak-Turk International Conference on Emerging Technologies in the field of Sciences and Engineering
14-16, April 2020
23
• Comparative analysis yielded that marble stone waste could be used to reduce the swell
potential as well as to enhance the strength characteristics of expansive soil. However the
research work is still in progress to observe further %age of adopted admixture.
REFERENCES
[40] Al-qayssi, Mahmood R M. 2014. “Effect of Swelling of Subgrade Soil on the Flexible Pavement.”
Geotechnical Aspects of Underground Construction in Soft Ground – Yoo, Park, Kim & Ban
(Eds) © 2014 Korean Geotechnical Society, Seoul, Korea, ISBN 978-1-138-02700-8 Effect of
Swelling of Subgrade Soil on the Flexible Pavement Mahmood R.M. Al-Qayssi Geote, no. 1377:
141–46.
[41] Steinberg, Malcolm L. 1985. “Geogrids as a Rehabilitation Remedy for Asphaltic Concrete
Pavements.” TRANSPORTATION RESEARCH RECORD 1369, no. 2.
[42] Petry, Thomas M., and J. Clyde Armstrong. 1989. “Stabilization of Expansive Clay Soils.”
Transportation Research Record, no. 1219: 103–12.
[43] Karaca, Zeki, Abdülkerim Pekin, and Ahmet Hamdi Deliormanlı. 2012. “Classification of
Dimension Stone Wastes.” Environmental Science and Pollution Research 19 (6): 2354–62.
https://doi.org/10.1007/s11356-012-0745-z..
[44] Johnson, L D, and A D Pengelly. 1983. “Scholars’ Mine Chemical and Lime Stabilization of
Expansive Clay Chemical and Lime Stabilization of Expansive Clay” 19
[45] Baser, Onur. 2009. “Stabilization of Expansive Soils Using Waste Marble Dust.” Middle East
Technical University, 1–116.
[46] Marras, G, N Careddu, C Internicola, and G Siotto. 2010. “Recovery and Reuse of Marble Powder
By-Product.” Global Stone Congress, no. August: 1–5.
[47] N.d., 2008 “An Overview of Environmental Pollution S‘An Overview of Environmental Pollution
Status.,’” no. i.

3rd Pak-Turk International Conference on Emerging Technologies in the field of Sciences and Engineering
9-10th June 2020
24
Measurement of Thermal Conductivity of Copper
Metal Foam Saturated with Phase Change
Material
Ijaz Ahmad1, a, Abid Hussain1, Awais Ahmed1, Hanzala Shahid1, Izhan Sajid1 1Department of Mechanical Engineering, University of Engineering and Technology Taxila, Pakistan
Email address: a) [email protected]
Abstract—Heat transfer and storage properties are important characteristics of the phase change material (PCMs)
which perform a major role in the storage system of thermal energy. The minimum thermal conductivity of phase
change materials significantly lowers its performance in terms of energy storage and release rate. Metal foam can be
used to increase the low thermal conductivity of the paraffin. In this research work, the thermal conductivity of the
phase change material was increased by using the metal foam paraffin composite. The heat transfer enhancement of
the paraffin metal foam composite was studied in comparison to pure paraffin. The infiltration technique was used to
infiltrate the paraffin in the metal foam. The result showed that the thermal conductivity of the composite was
enhanced as compared to pure paraffin. Thermal conductivity and porosity of metal foam have an inverse relationship
with each other. The maximum thermal conductivity of 8.6 (W/m.K) has seen at a porosity of 0.90.
Keywords heat storage capacity, thermal conductivity, paraffin/metal foam composite, heat transfer rate, phase
transition process
V. Introduction
During recent years, great attention has
been paid towards renewable energy due to
the gradual depletion of fossil fuels. Solar
energy is a suitable alternative to fossil fuels
as it is easily available and is friendly to the
environment [1]. Therefore, an efficient
storage system is required to store the excess
amount of heat. Passive thermal
management of phase change materials are
attractive for thermal management as they
are efficient, have a long working life,
compact and require less maintenance.
Phase change materials (PCM) can absorb,
retain and release a large quantity of energy
while maintaining the temperature
uniformity during the phase change process
[2]. The phase transition process of PCM
during melting or solidification takes place
nearly at a constant temperature during
latent heat storage. The usage of PCM has
some additional advantages over other
storage materials of being non-corrosive,
non-poisonous and low volume expansion
[3]. However, the less thermal conductivity
of the PCM severely disrupts its efficiency
of energy storage and limits its usage in
engineering applications. For better heat
transfer rates, the higher thermal
conductivity of PCM is required. Different
techniques are reported in the existing
literature to enhance the heat conduction
properties of PCM. Tian et al. [4] formed a
composite PCM by the combination of
eutectic composed of three parts carbonate
salt with the magnesium particles. There was
no comprehensive change in the composite

3rd Pak-Turk International Conference on Emerging Technologies in the field of Sciences and Engineering
14-16, April 2020
25
PCM melting temperature relative pure
carbonate salt. An enhancement of about
145% was seen in thermal conductivity of 2
wt.% of magnesium was added.
Abid et al. They have investigated
practically work to study the heat
management of batteries using
PCMs/graphene-coated nickel (GCN) foam
PCM composite. The thermal conductivity
was increased up to 23 times with the
corresponding decrease to specific thermal
capacity by 34%. Rehman et al. [5] studied
the behavior of heat sink at different heat
fluxes with different PCMs. They observed
the operational time for heat sink without
PCMs and with PCMs composites. Different
PCMs/composites were investigated by
changing heat fluxes from 800 W/m2 to 2400
W/m2. They pointed out that as the power
provided increased, there was a reduction in
maximum temperature across the heat sink.
Copper foam/PCMs composites were least
proficient at 2400 W/m2 based on the
performance of aluminum heat cavity [6].
Furthermore, the study revealed that
increasing the PCMs volume fraction
decreased the base temperature of the
thermal cavity. Since the copper foam is
characterized by high conductive materials,
the presence of copper increased the heat
transfer rate within composites. When the
copper foam is embedded in PCMs, the
melting time of PCM reduced and there was
a 36% increase in heat transfer rate [7]. Heat
storage properties of paraffin mixtures can
be improved when nanoparticles of Al2O3
are encapsulated in paraffin by the direct-
synthesis method [8]. Metal filler and
carbon-based filler materials both added in
PCMs largely improve the thermal
conductivity. However, carbon additives
show excellent stability compared to metal-
based PCMs composites [9]. R. Baby et al.
[10] studied the properties of copper
foam/PCM based submerged heat. They
found that spinning does not effect the heat
transfer rate.
Heat transfer enhancement has a major
influence on the thermal properties of PCM.
Rapid heat transfer effects the heat-storing
and release rate. Hence it is very necessary
to increase the low thermal conductivity of
the phase change material composite.
Different approaches used through
researchers were focused on using graphite,
nanoparticles, and enclosing of PCM.
However, the thermal conductivity of copper
PCM composite utilizing the infiltration
technique was rarely focused. This article
focuses on the increase of thermal
conductivity of copper/PCM composite
along with the heat storage properties.
VI. Materials and methods
In this study Paraffin (Rubitherm-42) was
used as a PCM having temperature range
and thermal conductivity of (38-41) ℃ and
(0.2 W/m.K) respectively, through the Ruhr
Technology China. The thermal properties
of materials are given in the Table below.
Table XVII: Thermal conductivities of
samples
Material Thermal
conductivity
W/m.K
Copper 398
Paraffin (38-
41℃)
0.2
The composite PCM is prepared by the
infiltration of molten paraffin wax into a
copper foam. The paraffin was placed in a
metal container and heated uniformly
through the heater until the wax was melted

3rd Pak-Turk International Conference on Emerging Technologies in the field of Sciences and Engineering
14-16, April 2020
26
completely. The copper foam was lowered
in the metal container through the wire mesh
for the infiltration of molten paraffin wax.
When the paraffin was completely
penetrated, the heat source was removed and
left the wax to solidify. The metal container
was then gently heated to separate the
saturated coated metal foam paraffin
composite from the container.
VII. Infiltration Ratio
To find the infiltration ratio the sample was
weighted using the electronic mass balance
(JM10002) with a precision of 0.01 g
provided by Zhejiang Ltd China. The mass
reading was taken before and after the
infiltration of the paraffin. Metal foam bulk
porosity was found by the following
equation [12].
휀𝑏 = 1 −𝑚𝑓0
𝜌𝑠𝑘𝑉𝑡 (1)
In the above equation, the 휀b is the bulk
porosity of metal foam. Vt represents the
volume of the metal foam, 𝜌sk represent the
density of the metal skeleton and 𝑚𝑓0
represents the mass of metal foam. The
following equation was then utilized to find the
infiltration ratio [12].
α =𝑚𝑎𝑐𝑡𝑢𝑎𝑙
𝑚𝑖𝑑𝑒𝑎𝑙=
𝛥𝑚𝑖
𝜀𝑏 𝜌𝑝𝑐𝑚𝑉𝑡 (2)
Where ρpcm is represent the density of PCM
when it is in solid form. Δmi is the difference
in masses of metal foam before and after the
infiltration. The α is a dimensionless
parameter and show the actual value of
paraffin wax infiltrated into the metal foam
as compared to the ideal mass which could
be infiltrated. If the value is 100% it implies
that all the paraffin has infiltrated into the
metal foam and all the pores are filled with
the paraffin.
Fig. 11: Isometric view of copper foam.[13]
VIII. Experimental setup configuration
Thermal conductivity of copper paraffin
composite wax measured indirectly by
thermal diffusivity, defined as heat move
rate by conduction during changing
specimen temperature with the passage of
time and denoted by (α). Where diffusivity
is measured by using an apparatus designed
based on laser flash technique at 25 ℃. The
apparatus consists of a metal rod with an
inside electric heater for heating purpose and
temperature of the metal rod is constantly
maintained by 35 ℃ throughout the
experiment and infrared radiator (IR
detector) of (FLIR SC660) type is used for
temperature measurement without any
physical contact with apparatus or sample
material. The samples of the composite of
copper foam with paraffin wax is tightly
attached with metal rod along the length
through the thermal tape (thermal interface
material) to overcome interface resistance
between metal rod and test samples. During
the experiment, the sample temperature for
each specimen is recorded by the IR detector
(FLIR SC660) from top to bottom at 5 mm,
25 mm, and 45mm. The working
temperature range of the IR detector was
from -40 °C to 1500 °C. It has a temperature
sensitivity of 0.05 °C and an accuracy of ±1
°C. The thermal diffusivity is measured by
using the following relation [12].
α =1.38 𝑑²
𝜋2 𝑡1/₂ (3)

3rd Pak-Turk International Conference on Emerging Technologies in the field of Sciences and Engineering
14-16, April 2020
27
Where on the left side, there is α in (m²/s)
and on the right side denotes the sample
length in (m) and 𝑡1/₂ as time in (seconds)
for half-maximum temperature on the rare
side of specimens. This value of time for
half-maximum temperature on the rare side
is the main parameter for thermal diffusivity
measurement. By using thermal diffusivity
value from the above equation, thermal
conductivity for each specimen is
determined through the following equation
[14].
𝜅 = αρ𝑐ₚ (4)
Where, on left side 𝜅 denotes thermal
conductivity in (W/ m.k) and on the right
side, 𝑐ₚ denotes specific heat capacity in
(J/kg.K) of the respective specimen
determined through calorimeter (DSC
Q1000) determined in above section with ρ
as density in (kg/mᶟ). The density of the
respective specimen is determined by
mass/volume relation. Where the mass is
determined by using the electronic mass
balance (JM10002) with a precision of 0.01
g provided by Zhejiang Ltd China and
volume by (L × W × H) mm relation for
each specimen.
Fig. 12: Laser flash method
IX. Results and discussions
The graph in Fig. 3 below shows the
relation between the porosity and the
thermal conductivity of copper/paraffin
composite. The outcome tells that the
thermal conductivity of the copper/paraffin
composite is inversely proportion to the
porosity of the foam. Maximum thermal
conductivity was seen at a porosity of 0.90
which was 8.6 W/(m.K) while low thermal
conductivity of 3 W/(m.K) was seen at a
porosity of 0.98. The thermal conductivity
was enhanced by 286.6% as porosity was
varied from 0.98 to 0.90
Fig. 3: The relation between porosity and
thermal conductivity of copper
foam/paraffin composite
Fig. 4: The relation between the pore
density (PPI) and the infiltration ratio
The graph in Fig. 4 above shows the inverse

3rd Pak-Turk International Conference on Emerging Technologies in the field of Sciences and Engineering
14-16, April 2020
28
relation between the pore density (PPI) and
the infiltration ratio. As the pore density
increased, the infiltration ratio of the
paraffin decreased. A maximum infiltration
ratio of 90% was achieved. A 100%
infiltration ratio cannot be achieved due to
the slight difference in the solidification
rates of PCM. The solidification of the
paraffin on the outer side of the metal foam
starts early as compare to the inner side of
the metal foam. There is also a slight
difference in the density of the paraffin
when it in solid form as compare to paraffin
that is in liquid form. When the PCM cools
down this density difference causes the
shrinkage of PCM and the small cavity is
formed on the inner side of PCM which does
not allow complete infiltration of PCM in a
metal foam.
X. Conclusions
The test was performed to find out the
thermal conductivity of copper/paraffin
composite. The composite sample was
prepared by the infiltration of paraffin into
the metal foam. Laser flash phenomena were
used to find out the thermal conductivity of
the composite sample. It is concluded that
copper metal foam is a suitable candidate for
thermal conductivity enhancement due to its
high porous design and high thermal
conductivity. High thermal conductivity
value (8.6 W/m.K ) of the composite sample
was obtained as compared to paraffin (0.2
W/m).
• The thermal conductivity was highest at
the porosity of 0.9 and decreased gradually
as the porosity increases with all the above
cases.
•The infiltration ratio and pore density had
an inverse relation. As the pore density
increased, the infiltration ratio decreased.
•Metal foam efficient thermal conductivity
was enhanced significantly compare to pure
paraffin. The thermal conductivity of the
paraffin was increased to 43 times.
REFERENCES
[48] Z. Khan, Z. Khan, and A. Ghafoor, “A
review of performance enhancement of PCM
based latent heat storage system within the
context of materials , thermal stability and
compatibility,” Energy Convers. Manag.,
vol. 115, pp. 132–158, 2016.
[49] A. Sharma, V. V Tyagi, C. R. Chen, and D.
Buddhi, “Review on thermal energy storage
with phase change materials and
applications,” vol. 13, pp. 318–345, 2009.
[50] L. Liu, D. Su, Y. Tang, and G. Fang,
“Thermal conductivity enhancement of
phase change materials for thermal energy
storage : A review,” vol. 62, pp. 305–317,
2016.
[51] H. Tian, L. Du, X. Wei, S. Deng, W. Wang,
and J. Ding, “Enhanced thermal conductivity
of ternary carbonate salt phase change
material with Mg particles for solar thermal
energy storage,” Appl. Energy, vol. 204, pp.
525–530, 2017.
[52] T.- Rehman, H. Muhammad, A. Saieed, W.
Pao, and M. Ali, “International Journal of
Heat and Mass Transfer Copper foam /
PCMs based heat sinks : An experimental
study for electronic cooling systems,” Int. J.
Heat Mass Transf., vol. 127, pp. 381–393,
2018.
[53] T.- Rehman, “Experimental investigation on
para ffin wax integrated with copper foam
based heat sinks for electronic components
thermal cooling,” vol. 98, pp. 155–162,
2018.
[54] H. T. Cui, “Experimental investigation on
the heat charging process by paraf fi n fi lled
with high porosity copper foam,” Appl.
Therm. Eng., vol. 39, pp. 26–28, 2012.

3rd Pak-Turk International Conference on Emerging Technologies in the field of Sciences and Engineering
14-16, April 2020
29
[55] A. Babapoor and G. Karimi, “Thermal
properties measurement and heat storage
analysis of paraffinnanoparticles composites
phase change material: Comparison and
optimization,” Appl. Therm. Eng., vol. 90,
pp. 945–951, 2015.
[56] Y. Lin, Y. Jia, G. Alva, and G. Fang,
“Review on thermal conductivity
enhancement, thermal properties and
applications of phase change materials in
thermal energy storage,” Renew. Sustain.
Energy Rev., vol. 82, no. May 2017, pp.
2730–2742, 2018.
[57] R. Baby and C. Balaji, “Experimental
investigations on thermal performance
enhancement and effect of orientation on
porous matrix filled PCM based heat sink,”
Int. Commun. Heat Mass Transf., 2013.
[58] H. Zheng and C. Wang, “Numerical and
Experimental Studies on the Heat Transfer
Performance of Copper Foam Filled with
Paraffin,” 2017.
[59] X. Hu, F. Zhu, and X. Gong, “Experimental
and numerical study on the thermal behavior
of phase change material in fi ltrated in low
porosity metal foam,” J. Energy Storage, vol.
26, no. July, p. 101005, 2019.
[60] R. Hafiz and M. Ali, “Thermal performance
analysis of metallic foam ‑ based heat sinks
embedded with RT ‑ 54HC paraffin : an
experimental investigation for electronic
cooling,” 2019.
[61] T. Lian et al., “Rapid thermal conductivity
measurement of porous thermal insulation
material by laser flash method,” Adv.
Powder Technol., vol. 27, no. 3, pp. 882–
885, 2016.

3rd Pak-Turk International Conference on Emerging Technologies in the field of Sciences and Engineering
14-16, April 2020
30
Temperature control of battery using
Phase change material infiltrated in metal
foam
Waqas Ahmed1, a, Abid Hussain1, b 1Department of Mechanical Engineering, University of Engineering & Technology Taxila, Pakistan.
*Email address: a)[email protected] , b)[email protected]
Abstract--- Energy plays a significant aspect in the advancement of nation both socially and financially.
Utilization of energy from renewable source is the main research focus in order to reduce dependency on
conventional fuels. Keeping in view the fact, battery hybrid vehicles are rapidly replacing conventional vehicles.
Lithium ion battery is an integral part of battery electric vehicles due to their high energy and power density.
Their efficiency is affected due to rise in temperature of battery pack. An effort is made to maintain battery
within permissible temperature limits. In current study efficient thermal management (graphene coated nickel
foam paraffin composite) are examined experimentally for highly powered Li-ion batteries. Experimental model
carries six Panasonic 18650B 3400 mAh lithium ion energy cells which were connected in series. Four other
thermal management modes were compared, and their results were evaluated. By utilizing graphene coated
nickel foam paraffin composite, 34% reduction in temperature of battery pack is achieved. While 1% decreases
in temperature of battery enhances the life of battery for two months. So, graphene coated nickel foam paraffin
composite is feasible option to maintained battery temperature within permissible limits.
Keywords---thermal management, hybrid electric vehicle, passive cooling, graphene composite
I. INTRODUCTION
Lithium ion batteries are integral part of electric
vehicles because of their high energy and power
density. Li-ion batteries are light in weight and more
efficient as compared to other type of batteries [1].
However, lithium ion batteries produce extreme heat
during operation. Their efficiency decreases due to rise
in temperature of battery. Also the performance and
life of battery is concerned by rise in temperature [2].
Managing this rise in temperature remains a challenge.
There are the following methods for thermal
management of battery that are used for temperature
control. It includes active cooling system which
consists of pump, fan and heat exchanger whereas
passive cooling system contains PCM. Active cooling
system is expensive, bulky and makes the system
heavy [3]. So passive cooling system which contains
PCMs is compact, light in weight and is more efficient
[4]. PCM enhances thermal energy storing ability of
the system by using latent heat and effectively control
the rise in temperature. Phase change materials
(paraffin wax) that are utilized in thermal management
have latent heat, low cost, environment friendly but
possess poor rate of heat transfer (0.19 W/m K) [5].
Various techniques for improving the heat transfer are
introduced (a) By adjoining additives like nano
materials with PCMs [6]. (b) By employing metal
fins/foam [7]. Researcher focused to work for
enhancing thermal conductivity by various methods.
Goli et al. [8] discovered that rate of thermal
mobilization of pure PCMs can be raised by spending
graphene paraffin composite. He developed PCMs by
using graphene composite and thermal conductivity of
PCM was raised to 45 W/ (m. K) rather than 0.19 W/
(m. K) by pure paraffin.
Sedeh et al. [9] employing graphite foam composite
with phase change material. Pores of foam penetrated
with PCM (cyclohexane) and thermal analysis was
done at experimental setup which contained lithium ion
batteries. Surface temperature of battery pack reduced
to 11.2°C using graphite foam paraffin composite.
Temperature gradient of module is kept in permissible
limits due to sufficient increase in thermal
conductivity. Samimi et al. [10] had done
experimentation using carbon fiber with paraffin wax
composite and showed that thermal conductivity raise
to (81-273%) of paraffin wax. There was 15 °C
decrease in temperature of lithium ion batteries so that
results were effective for battery thermal management
system.
Al-Hallaj et al. [11] investigated a technique for passive cooling of Li-ion batteries using graphite matrix infiltrated with phase change material. Experimentation was performed utilizing a cylindrical shape battery cells at different ambient temperature of 30 ºC and 45 ºC. By this study they concluded that

3rd Pak-Turk International Conference on Emerging Technologies in the field of Sciences and Engineering
14-16, April 2020
31
battery life is improved efficiently by using PCM composite. Sabbah et al. [12] studied temperature
uniformity using natural air at 1.5C rate. They
developed experimental model and reported
that PCM composite with metal foam gives
good dissipation of heat as related to active air-
cooling system at discharge ratio of 6.66C for
18650B Li-ion batteries.
Lithium ion battery thermal control was achieved by the use of metal foam (copper, aluminum) or paraffin wax graphite composite. Graphene heat transfer rate (2000-3000 W / m. K) is very high. In fact, graphene coating on nickel foam improves the transfer of heat from phase-change product infiltrated in a nickel foam [13, 14] . By afore mentioned literature survey, it is concluded that specific heat of nickel foam is more reliable and it extracts more heat from battery pack. But the issue is that nickel foam increases just six times paraffin's thermal conductivity. Graphene thermal conductivity is very high (3000 W / m K) [13]. Nickel foam has ability to extracts more carbons from graphene. Herein, the objective of current research is to evaluate the temperature of battery pack by utilizing graphene coated nickel foam paraffin composite. Benefits of graphene composites include enhanced mechanical strength and reduced thermal expansion with no extra expanses. It is investigated that nickel foam is never used with graphene coating. Novelty is established in recent work by studying and comparing four other modes of thermal management i.e. natural air circulation, pure phase change material, phase change material infiltrated in nickel foam and phase change material infiltrated in graphene coated nickel foam. In this paper temperature uniformity along with battery pack will be analyzed by comparing their results.
II. EXPERIMENTAL SETUP
A Battery Pack Properties
Different types of lithium ion batteries are available with various configurations so after a thorough literature review, we have selected such kind of batteries which satisfy its rating. The experimental setup carries six Panasonic 18650B 3400 mAh lithium ion energy cells which were connected in series. Complete specification of battery pack is shown in Table 1. B Nickel Foam Paraffin Composite
Paraffin wax and nickel foam were evaluated for performance to proper control the temperature battery pack. Paraffin wax RT-42, exhibit large latent heat capacitance as well as must have high thermal conductivity and it should melt consistently and with minimal sub cooling, non-corrosive, and non-toxic and have low cost. A small (0.1%) uncertainty arises in a sample and neglected due to thickness of metal foam. C Testing of battery pack
The temperature of Li-ion battery pack was examined under four modes of thermal management: (a) nickel foam (b) pure PCM (c) nickel foam PCM composite (d) PCM infiltrated in graphene coated nickel foam composite. The experiment was performed under varying load inputs Thermocouples were utilized to observe the temperature of battery pack. One thermocouple was engaged at 1st positive junction of battery pack and two thermocouples were engaged at mid of 3rd and 5th battery, after passing every 30 sec data acquisition system recorded the surface temperature of battery module. The step by step obtained data was evaluated and manipulated when the expected results were justified.

3rd Pak-Turk International Conference on Emerging Technologies in the field of Sciences and Engineering
14-16, April 2020
32
Figure 1: Nickel Foam
Figure 2: Battery Panasonic NCR 18650B
Figure 3: Schematic diagram of Experimental
Setup
Figure 4: Battery Pack Wrapping with Nickel
Foam
Figure 5: Experimental Setup connected with
System
III. RESULTS & DISCUSSION A Discharging at 0.5C using natural air
A complete charge-discharge cycle was
carried using natural air as cooling medium.
Temperature distinction varied linearly with
time under 0.5C discharge rate.
Maximum rise in temperature took place at the mid of battery pack so cell number 3 was selected and connected with T type thermocouple. Temperature response of cell no 3 are shown in Figure 6. The battery pack charged and discharged at constant rate 0.5C and it began to heat and reached at 35°C during (205 min< t <290 min) discharging phase. Sudden rise in temperature was due to convection at the same time rate of heat transfer of air was low.
Figure 6: Discharging at 0.5C using natural air as
cooling mode
B Discharging at 0.5C using PCM

3rd Pak-Turk International Conference on Emerging Technologies in the field of Sciences and Engineering
14-16, April 2020
33
Paraffin wax exhibits conduction mode of heat transfer. Discharging of battery pack was done at 0.5C rate and temperature increased gradually and went to maximum at 33°C during (415 min <t< 480 min). Comparing with natural air circulation mode there was 7% drop in temperature of PCM as cooling medium which clarified that heat transfer rate of paraffin (conduction) is more than natural air (convection). The point to emphasize that increase in temperature of battery pack was lower than melting range of paraffin wax, so in this case only thermal conduction parameter of compact paraffin was used as shown in Figure 7.
Figure 7: Discharging at 0.5C using paraffin wax
as cooling mode
C Discharging at 0.5C using nickel foam PCM Composite
Paraffin wax infiltrated in porous nickel foam. Discharging of battery pack initiated and temperature profile went to maximum at 31°C during time (300 min < t < 380 min). In present study phase change material cannot be melted during charge and discharge process and only conduction phenomenon of heat transfer worked efficiently, that there is immense increase in thermal conductivity due to use of nickel foam composite as shown in Figure 8. Its determined that there was 9% and 13% drop in temperature profile as compared with pure PCMs and air circulation.
Figure 8: Discharging at 0.5C using nickel foam
paraffin composite as cooling mode
D Discharging at 0.5C using graphene coated nickel foam PCM composite
Graphene has immense thermal conductivity Therefore battery pack temperature was further reduced utilizing graphene layers on nickel foam saturated with paraffin wax. At same discharge rate 0.5C battery pack is examined using GCN composite and studied that during charging phase maximum temperature increased to 32°C and 30°C in discharging phase which is lowest as compared to without graphene coating as shown in Figure 9. Passive temperature control of batteries proved more effective and kept battery temperature within limits by using graphene coated nickel foam.
Figure 9: Discharging at 0.5C using paraffin wax
infiltrated in graphene coated nickel foam as
cooling mode
E Discharging at 2C rate using graphene coated nickel foam PCM composite

3rd Pak-Turk International Conference on Emerging Technologies in the field of Sciences and Engineering
14-16, April 2020
34
The experiment was repeated again, and module was discharged at 2C (6.8A) to check the sensible heat effect on all three cooling modes. The figure 10 showed the temperature profile at 2C discharge rate. It can be seen from graph that temperature by natural cooling is 65.45°C that can damage the battery pack. 24.69% temperature drop with paraffin application. At the point when graphene coated nickel foam composite is used temperature goes to 43.19°C which is 34% lower when contrasted with common air cooling. A 34% reduction in surface temperature of battery pack is accomplished by utilizing paraffin wax infiltrated in graphene coated nickel foam than common air convection. This temperature decrease demonstrates that the graphene coated nickel foam paraffin composite is a feasible choice for efficiently temperature control of lithium ion batteries.
Figure 10: Discharging at 2C rate comparing all
cooling modes
F Temperature uniformity using graphene coated nickel foam PCM composite
Keeping discharge rate same as 1.5C for temperature control of battery pack was carried by employing GCN paraffin composite. Identical temperature distribution inside the battery pack is essential for achievement and life of battery pack. Temperature uniformity
between cell no 1 and cell no 3 is shown in Figure 11. This smallest temperature difference 0.5°C ensures that graphene enhanced the dissipation of heat through conduction mode.
Figure 11: Temperature uniformity using
graphene coated nickel foam PCM composite
IV. CONCLUSION
➢ Experimental survey on thermal
management of high-powered lithium
ion batteries was conducted by
employing graphene coated nickel
foam paraffin composite.
➢ The results indicated that nickel foam
enhanced the heat transfer rate of PCM
by 6 times while graphene coated
nickel foam increased heat transfer by
23 times of PCM. By employing GCN
paraffin composite as a cooling
medium, the surface temperature of
battery pack was reduced to 34% as
compared to natural air and PCM under
2C discharge conditions.
➢ The temperature difference along
battery pack was only 0.5°C, while 1%
decreases in temperature enhanced the
life of battery for 2 months. So paraffin
wax infiltrated in graphene coated
nickel foam was viable option for
thermal management of lithium ion
batteries.
REFERENCES
[1] H. Maleki, “Thermal Properties of Lithium-Ion Battery and Components,” J. Electrochem. Soc., vol. 146, no. 3, p.
0 1 2 3 4 5 6 7 8 9 10 11 12
25
30
35
40
45
50
55
60
65
70
Tem
pera
ture (
°C)
Time (min)
Air
Pure PCM
Nickel paraffin composite
Graphene coated nickel foam
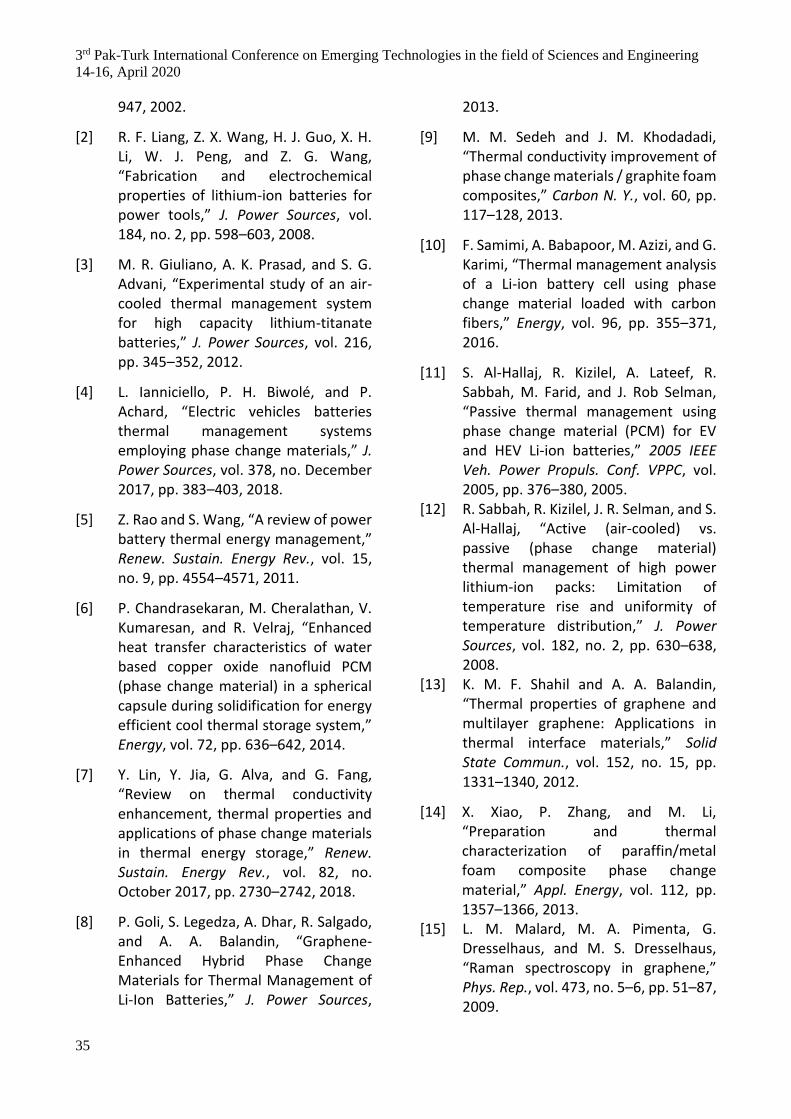
3rd Pak-Turk International Conference on Emerging Technologies in the field of Sciences and Engineering
14-16, April 2020
35
947, 2002.
[2] R. F. Liang, Z. X. Wang, H. J. Guo, X. H. Li, W. J. Peng, and Z. G. Wang, “Fabrication and electrochemical properties of lithium-ion batteries for power tools,” J. Power Sources, vol. 184, no. 2, pp. 598–603, 2008.
[3] M. R. Giuliano, A. K. Prasad, and S. G. Advani, “Experimental study of an air-cooled thermal management system for high capacity lithium-titanate batteries,” J. Power Sources, vol. 216, pp. 345–352, 2012.
[4] L. Ianniciello, P. H. Biwolé, and P. Achard, “Electric vehicles batteries thermal management systems employing phase change materials,” J. Power Sources, vol. 378, no. December 2017, pp. 383–403, 2018.
[5] Z. Rao and S. Wang, “A review of power battery thermal energy management,” Renew. Sustain. Energy Rev., vol. 15, no. 9, pp. 4554–4571, 2011.
[6] P. Chandrasekaran, M. Cheralathan, V. Kumaresan, and R. Velraj, “Enhanced heat transfer characteristics of water based copper oxide nanofluid PCM (phase change material) in a spherical capsule during solidification for energy efficient cool thermal storage system,” Energy, vol. 72, pp. 636–642, 2014.
[7] Y. Lin, Y. Jia, G. Alva, and G. Fang, “Review on thermal conductivity enhancement, thermal properties and applications of phase change materials in thermal energy storage,” Renew. Sustain. Energy Rev., vol. 82, no. October 2017, pp. 2730–2742, 2018.
[8] P. Goli, S. Legedza, A. Dhar, R. Salgado, and A. A. Balandin, “Graphene-Enhanced Hybrid Phase Change Materials for Thermal Management of Li-Ion Batteries,” J. Power Sources,
2013.
[9] M. M. Sedeh and J. M. Khodadadi, “Thermal conductivity improvement of phase change materials / graphite foam composites,” Carbon N. Y., vol. 60, pp. 117–128, 2013.
[10] F. Samimi, A. Babapoor, M. Azizi, and G. Karimi, “Thermal management analysis of a Li-ion battery cell using phase change material loaded with carbon fibers,” Energy, vol. 96, pp. 355–371, 2016.
[11] S. Al-Hallaj, R. Kizilel, A. Lateef, R. Sabbah, M. Farid, and J. Rob Selman, “Passive thermal management using phase change material (PCM) for EV and HEV Li-ion batteries,” 2005 IEEE Veh. Power Propuls. Conf. VPPC, vol. 2005, pp. 376–380, 2005.
[12] R. Sabbah, R. Kizilel, J. R. Selman, and S. Al-Hallaj, “Active (air-cooled) vs. passive (phase change material) thermal management of high power lithium-ion packs: Limitation of temperature rise and uniformity of temperature distribution,” J. Power Sources, vol. 182, no. 2, pp. 630–638, 2008.
[13] K. M. F. Shahil and A. A. Balandin, “Thermal properties of graphene and multilayer graphene: Applications in thermal interface materials,” Solid State Commun., vol. 152, no. 15, pp. 1331–1340, 2012.
[14] X. Xiao, P. Zhang, and M. Li, “Preparation and thermal characterization of paraffin/metal foam composite phase change material,” Appl. Energy, vol. 112, pp. 1357–1366, 2013.
[15] L. M. Malard, M. A. Pimenta, G. Dresselhaus, and M. S. Dresselhaus, “Raman spectroscopy in graphene,” Phys. Rep., vol. 473, no. 5–6, pp. 51–87, 2009.

3rd Pak-Turk International Conference on Emerging Technologies in the field of Sciences and
Engineering 14-16, April 2020
36
Energy Improvement Strategies in Coal Fired
Chain Grate Boiler.
M. Khalil1, a, Abid Hussain1, b
1 Department of Mechanical Engineering, University of Engineering and Technology Taxila, Pakistan
Email address: a) [email protected], b) [email protected]
Abstract---Properties of coal are characteristics which perform an essential role in the boiler energy system. Boiler
efficiency increase when the less calorific values of coal is used for burning. Addition the size of coal has the
significant effect on the combustion process as well as in the performance of the boiler efficiency. In this paper,
the production of steam in chain grate boiler against different gross calorific values of coal were experimentally
examined. The behaviors of coal combustion and steam production at different gross calorific values of coal was
studied. At the lowest gross calorific value of coal, production of steam increases and also attain the highest
efficiency of boiler. A comparative analysis of coal and steam is made. The mass of steam produced and the mass
of coal combustion is experimentally considered. Experimental results show that a minor development in the
productivity of the boiler with the lowest gross calorific value of coal increases the efficiency of the boiler by 10-
15% and also get the highest heating capacity of coal.
Keywords—Energy, Gross calorific value, Coal fired Boiler, Heat Input, Heat Output, Efficiency, Steam Flow
Rate.
I. Introduction
Boiler is a closed vessel in which water is
boiled and converted to steam. Boiler is a
machine to produce the steam. By burning of
petroleum in the boiler is used to production of
steam at defined temperature, pressure and
steam flow rate [1].
The purposes of experimentation assessment
of operation of boiler is to get the real
performance and productivity of the boiler and
associate it with design effectiveness and other
factors. It is fact day to day modification in
boiler design and increasing in energy
demands and also in burning of petroleum,
gross calorific value (GCV) enhancements to
get the highest thermal efficiency [2].
For increasing the boiler efficiency by minor
fraction changes, will be minimize the fuel
consumption in steam generation. Again,
regardless of remnant coal assets in
environment and environmental safety
subjects, the lubricant, natural gas and coal
petition is likely to rise to 47.5%, 91.6% and
94.7% correspondingly amongst 2003 and
2030 [3]. First, examine how efficient the
boiler is at plant. Start by checking the design
efficiency rating of boiler. This is usually
published in product catalogues and/or safety
data sheets. It is keeping in mind, however,

3rd Pak-Turk International Conference on Emerging Technologies in the field of Sciences and Engineering
14-16, April 2020
that this rating describes the efficiency of the
boiler when operating under ideal conditions,
and may not be an accurate reflection of the
efficiency at which the boiler is operating at
your plant. The efficiency rating of your boiler
should be taken as an ideal level, and plants
should work to make their boiler's operational
efficiency as close to this rating as possible
[4].
Amari et al. researched on the energy
economics of the Hamadan steam control plant
were studied and the energy consumption and
energy loss of the mechanisms of the
command plant were estimated. In command
to improvement good vision into the
investigation, the effects of load changes and
ambient temperature were calculated.
Estimation of the energy efficiency of the
boilers, turbines, heaters, condensers at unlike
ambient temperatures. From the energy
analysis it was found that the condenser had a
maximum energy loss (about 70.5%) and an
energy loss of 15.5% was found in the boiler.
On the other hand, in terms of energy, the
main energy loss (about 81%) of the boiler’s
total energy loss is only 5% of the total energy
loss. From an energy economic point of view,
it has been observed that the energy
consumption of boilers and turbines is higher
than the cost of another component [5-7].
The main reason of energy deficient in the
boiler is the temperature loss. The wide range
of heat loss in the boiler take place through the
chimney smoke. The most important
parameters for the loss of heat are the
temperature and volume of chimney fume. So
that decrease in any one of these will reduces
the heat loss. To minimize chimney
temperature loss, temperature of chimney fume
should be cheap to the nearby heat of boiler.
But due to the cost-effective inaccessibility
and limitation in heat transmission standard
these damages are unavoidable [8, 9].
Burning process of coal to transfer the
temperature is the straight forward method to
practice the fuel. For temperateness, culinary
and engineering procedures to get generated
heat from burning of coal. The china is using
the firewood as primary as 1000 BC [10].
From the fourth century expenditure of coal
first time documented by the Greek
philosophers Pliny, Aristotle and Theophrastus
in the western world (Moore, 1922), the coal is
used to burn and the coal is usually recycled
by antediluvian man, meanwhile coal can be
establish at boulders [11].
The understanding of coal ignition in three
methods: as outsized piece in a static bed or on
a grate, for example crushed or tiny parts in a
fluidized bed, or as very sufficient elements in
postponement. Ideally, a few mass of particle
can be burning the coal through any one of the
three techniques, but industrial limitations
found chosen size of constituent part for the
three methods. With respect to leading answer
appliance and other warm air processes (i.e.
ratio of heating system, which can regulator
volatiles produce and structure), particle has
also been found to be the most important
parameter. (Elliot, 1981) [10]. Studies have
also been organized and carry out to evaluate
energy savings and production and discharge
of flue gas degree opportunities and their cost
effectiveness in industrial boilers and
associated steam systems. Einstein, et al
calculated energy usage and energy
competence upgrading capacities in steam
methods in the U.S. by way of calculating the
cost of conserved energy (CCE) to estimate the
cost-effectiveness of relevant retrofit measures
[12]. Best use of fire procedure with regards of
boiler productivity and discharge of air
contaminants is of crucial importance in
reducing effective and repairs expenditures.

3rd Pak-Turk International Conference on Emerging Technologies in the field of Sciences and Engineering
14-16, April 2020
There are countless techniques for such
improvement, in which there are some
varieties from boiler apparatus e.g. new
capacity tools, connected software systems.
Throughout past few centuries’ contactless
heat amount expertise have developed more
standard in the production. There are two
main skills, which are used in firewood
boilers to calculate heat division-acoustic
equipment [13-15] and laser machinery [16,
17]. In [18] writers extant rewards of acoustic
structure in estimation of incineration value
in minced petroleum afire boiler. Going on
the further pointer, in [19] the significance of
laser equipment in fire optimization tasks is
obtainable. Heat splitting up in parallel cross-
section of a boiler is an excessive gauge of
worth of fire procedure. This sign could be
recycled in boiler controller to finest usage
the incineration progression.
II. Experimental Setup
For the current research experiment, an
experimental setup was available to analyze
and compare the steam production and coal
combustion with different gross calorific
values of coal. The special apparatus was
available also used to give measurements of
gross calorific value of coal for analysis of
mass of steam production along the different
GCV of coal and at various mass of coal
combustion with the different temperature’s
series of feed water and pressure of steam.
The experimental set consists of following
components
➢ Boiler in operation
➢ Pressure gauges
➢ Thermocouples
➢ Temperature sensors
➢ Steam flow meter
➢ HMI flow chart display
➢ HMI control parameters common.
Figure.1 Flow Chart of Boiler Process.
Figure.2 Different Controlled Parameters.

3rd Pak-Turk International Conference on Emerging Technologies in the field of Sciences and Engineering
14-16, April 2020
Figure.3 Steam Flow Meter.
III. Results and discussions
Current study will be helpful while carrying out
thermal management of boiler especially developing
steam system.
Figure 4: The relation between mass of
steam and mass of coal
It is the maximum opportunity to be achieved
useful work and able to be used for a practical
purpose or in several ways that could be acquired
from the system at a given state in identified and
cleared surrounding. In the figure.4 the graph
relation between the steam and coal shows that
steam production rate (tones/hr.) changes with the
minimum change in the mass of coal for
combustion.
Figure 5: The relation between the mass of steam
and the gross calorific value of Coal
The work done during an operation determined on
the initial state, the final state, as well as the
working order of the condition. The relation in the
figure 5 shows the curve of mass of steam and the
gross calorific value of coal. This graph shows that
due to the increase in the gross calorific value of
coal, decreases the mass flow rate (Tones/hr.) of
steam. It shows that the steam production rate
decreases at the same rate of mass of coal in the
combustion process with the highest gross calorific
value of coal.
0
2
4
6
8
10
12
14
16
18
20
Ma
ss o
f S
tea
m a
nd
Co
al
(To
nn
es)
Operating Time (Hrs.)
0
2
4
6
8
10
12
14
16
18
20
Mass
of
Ste
am
(T
on
es)
an
d G
CV
of
Coal
(Kca
l/g
m)
Operating Time (Hrs.)

3rd Pak-Turk International Conference on Emerging Technologies in the field of Sciences and Engineering
14-16, April 2020
Figure 6: The relation between the gross
calorific value and the efficiency of the boiler
In figure 6, the graph shows the relation between
the gross calorific value of coal and the efficiency
of the boiler. The increase in the gross calorific
value of coal decreases the efficiency of the boiler.
It means that the gross calorific value of coal
effected the performance of the boiler. At the
lowest gross calorific value of coal, the
performance of the boiler will be better. We
should select the proper coal for steam generation
in the boiler.
IV. Conclusions
The study reveals that energy efficiency measures
are cost effective in saving energy used and thus
emissions from coal-fired industrial boilers. To
develop the wide adoption of energy efficiency
measures in Pakistan, strategies and plans are
required to remove the information, capacity, and
financial barriers and to create better standards
and greater opportunities for capturing system-
wide potentials. The efficiency calculation
procedures are helpful for coal fired boilers in
production of use of steam and in thermal power
plants by straight and unintended technique
commencing the Agency of energy proficiency
[20] are for a short time explained in the paper.
The energy efficiency and the heat losses through
boiler for the production of steam is a wide scope.
The scope work exists in the insulation and
material of structure for calculation the heat losses
in the boiler and steam flow directions. Instead of
the gross calorific value of coal, also the moisture
content, air dried sulfur and ash (%) effect the
combustion heat capacity of the coal.
REFERENCES
[1] http://powerelectrical.blogspot.
Com/2007/03/thermal- power-plant-
Layout-and html.
[2] Power Plant engineering by P K
Nag, third edition.
[3] Renewable and Sustainable Energy
Reviews journal. Homepage:www.
Elsevier.com/locate/rser.
[4] https://www.tlv.com/global/TI/
steam- theory/what-is-steam.html.
[5] Ameri M., Ahmadi P., Hamidi A.
(2009). Energy, energy and energy-
economic analysis of a steam power
plant: A case study. International Journal
of Energy Research, 33:499–512.
[6] Rosen MA, Dincer, I.Energo-Economic
analysis of power plants operating on
various fuels. Applied Thermal
Engineering 2003;23;643-658.
[7] Silvera JL, Tuna CE. Thermo economic
analysis method for optimization of
combined heat and power systems. Part 1.
Progress in Energy and Combustion
Science 2003; 29:479–485.
[8] ERC I. How to save energy and money in
boilers and furnace systems. Energy Res
Cent (ERC) 2004.
[9] Hisatome M. Power generation
system, Google Patents; 1993.
[10] Elliot, M.A (Ed.), 1981. Chemistry
Of coal utilization secondary
Supplementary volume. John Wiley &
Sons, New York.
[11] Moore, E.S., 1922. Coal: its
Properties,Analysis,Classification,
Geology,Extraction, Uses and
Distribution. John Wiley & Sons. p. 124.
0
10
20
30
40
50
60
70
80
90G
CV
(K
cal/
gm
) an
d E
ffic
ien
cy
(%)
Operating Time (Hrs.)

3rd Pak-Turk International Conference on Emerging Technologies in the field of Sciences and Engineering
14-16, April 2020
[12] Einstein D, Worrel E, Khrusch M. Steam
systems in industry: Energy efficiency
improvement potentials[R]. Lawrence
Berkeley National Laboratory,
2001. available at
http://escholarship.org/uc/item/3m1781
[13] D. Husson, S.D. Bennett, G.S. Kino,
Remote temperature measurement using
an acoustic probe, Appl. Phys. Lett. 41
(1982)915,http://dx.doi.org/10.1063/1.93
334
[14] Hua Yan, Zhen Peng, Kexin Cui, Liang
Zhang, Acoustic travel-time
measurement in acoustic temperature
field monitoring, in: 2008 7th
WorldCongress on Intelligent Control
and Automation, Chongqing, China, June
2008,pp. 4947–4951.
[15] Kousuke Kudo, Koichi Mizutani,
Temperature measurement using
acousticreflectors, Jpn. J. Appl. Phys. 43
(5B) (2004) 3095–3098.
[16] Hajime Arimoto, Nobuo Takeuchi,
Sachio Mukaihara, Toru Kimura, Ryuzo
Kano, Takeo Ohira, Shinji Kawashima,
Kazuya Iwakura, Applicability of
TDLAS gas detection technique to
combustion control and emission
monitoring under harsh environment, Int.
J. Technol. 2 (1) (2011) 1–9.
[17] Pei-jin Liu, Bin Huang, Bin Yang, Guo-
qiang He, TDLAS for measurement of
temperature in combustion environment,
in: Proceedings of SPIE – The
International Society for Optical
Engineering, 2013, vol. 8796;
http://dx.doi.org/10.1117/12.2011262.
[18] D. Nabagło, P. Madejski, Combustion
process analysis in boiler OP-650K based
on acoustic gas temperature measuring
system, in: 3rd International Conference
on Contemporary Problems of Thermal
Engineering CPOTE 2012,18–20
September 2012, Gliwice, Poland.
[19] Andrew D. Sappey, Pat Masterson, Eric
Huelson, Jim Howell, Mike Estes, Henrik
Hofvander, Atilio Jobson, Results of
closed-loop coal-fired boiler operation
using a TDLAS sensor and smart process
control software, Combust. Sci. Technol.
183 (11) (2011) 1282–1295.
[20] Energy performance assessment of
boilers. Bureau of Energy. Efficiency
(2005).http://www.beee.com/;
http://www.em-ea.org/.

3rd Pak-Turk International Conference on Emerging Technologies in the field of Sciences and Engineering
14-16, April 2020
42
Passive Thermal Management of Lithium Ion Batteries
using Metal foam Saturated with Phase Change Material
Wajid Ali1,a, Abid Hussain1,b and Ali Hasan1,c 1Department of Mechanical Engineering, University of Engineering and Technology Taxila.
)
Email address: a) [email protected] b) [email protected]
Abstract— Li-ion battery pack utilized in the
Electric vehicles (EVs) and Hybrid electric vehicles
(HEVs) require a very effective thermal
management system (TMS), to keep the working
temperature of the battery pack in the safe
range. In this research, a passive thermal
management system (PTMs) is developed by
utilizing unique composite (Aluminum foam and
paraffin wax) to maintain the operating
temperature of highly powered li-ion batteries.
Comparison has also been made with three other
cooling modes i.e. nickel foam-paraffin, natural
air-circulation and phase change material
(Paraffin wax). The results signify that the safety
requirements of the lithium-ion battery cannot
met through natural air circulation as a cooling
mode. After using aluminum foam/paraffin
composite as medium of cooling, results show a
decrease of 32.6% in the temperature comparing
with natural air cooling, 5.1% by nickel/paraffin
composite as a medium of cooling and 11.8% in
comparison to the pure PCM at 2C discharge
rates.
Keywords— Charge & Discharge rates; TMS; li-ion
batteries; PCM material, Aluminum foam.
XI. Introduction
The Electric vehicles (i.e. EVs & HEVs)
demand is rising on daily basis because of
issues related to the emissions, limited
resources of fossil fuels and price hike of
hydrocarbon. The fuel used to power EVs and
HEVs is the li-ion batteries which have more
energy & power density. The problem which
frequently occurs in using the high-powered
batteries of li-ion in EVs and HEVs is the
temperature rise at the time of charge and
discharge. This temperature rise causes the
production of heat in the battery pack and
there is the possibility of an explosion if the
battery temperature reaches its critical limit.
Different methodologies are used for
efficiency enhancement of PCM for
temperature management of the lithium-ion
battery pack. Wu et al.[1] developed a self-
type heat contained duct enclosed with
battery pack superficial area for the control of
excess temperature throughout the
discharge. They discovered that using the heat
pipe with air strained convection has
decreased the temperature and caused extra
uniform temperature supply.
Pesaran et al. [2] discovered a liquid-based
temperature control system. They computed
the temperature throughout the discharge
procedure. Previously the organic phase
change materials were also given preference

3rd Pak-Turk International Conference on Emerging Technologies in the field of Sciences and Engineering
14-16, April 2020
43
due to their higher latent heat, good chemical
properties and inexpensiveness [3]. Sabah et
al. [4] did comparative research between the
PCM and forced air circulation methodology
at a constant discharge rate for both the
methodologies. They used 1.5 Ah 18650
commercial lithium-ion battery cells. Their
research demonstrated that the phase change
material cooling methodologies and effective
temperature distribution was greater in
comparison to the active cooling
methodology at 1.3 C discharge rate &
ambient temperature of 40 ◦C. PCMs are also
better choice for battery thermal
management, because of its advantages as a
thermal energy storage use. As they have a
drawback of having very less thermal
conductivity, therefore it has limited
utilization in heat storage applications. [5]. To
overcome this drawback different kinds of
methodologies are presented for thermal
conductivity enhancement of PCMs. Fan and
Khodadadi [6] researched to enhance the
PCMs thermal conductivity, they used the
spread fins, mixing the higher thermal
conductivity bits, or using the porous metal
foams. For the electric vehicles. Khateeb et
al.[7] researched the 4 modes of heat transfer
for 18650 (2.20 Ah) battery pack. They found
that the temperature of aluminum foam/
PCM composite decreased an extra 5 ◦C
temperature comparing with PCM material.
Another research conducted by li et al. [8]
methodology for encapsulating of phase
change material with the copper metal foam.
They showed in their research that PCM
material’s thermal conductivity was enhanced
greatly using copper metal foam and heater
surface temperature was also decreased.
The purpose of this research is the
development of a TMS for the harmless
working condition of lithium-ion battery pack
applied in the HEVs & EVs by employing
Aluminum foam saturated with PCM (Paraffin
wax). This research has also been compared
with the three other methodologies, i.e.
natural air, PCM & nickel foam/paraffin
composite.
XII. Experimental setup
A. Setup of Battery Packs
The lithium-ion battery cells utilized for this
research has been tested and those having
above 90% efficiency are utilized. Cells used in
this research are 18650 B NCR type Panasonic
their operating voltage range is 3.0 Volts - 4.2
Volts. Whereas pack capacity is 3.40 Ah. The
diameter of the cell is 18.40 mm, the height of
each cell 65.0 mm and nominal voltages are
3.70 Volts. The connection is made in the
series and the configuration of the cells is 6S
(six cells in series). For battery pack safety, a
safety circuit is also installed. The
specifications are listed in Table No 1.
Table 18 Battery Pack Specification.
Arrangement of
Cells
6 cells in Series
Capacity (Pack) 3.40 Ah
Cells Space 5.740 mm
Rate of Charging 0.50C rate (1.70 A)
galvanostatic mode and 100
mA potentiostatic mode
Rate of Discharge 0.50C rate (1.70 A), 1.50C
rate (5.10 A) & 2.0C rate
(6.80 A)
Voltage limit cut
off
Charing 4.2 Volts per cell &
Discharging 3.0 Volts per
cell.

3rd Pak-Turk International Conference on Emerging Technologies in the field of Sciences and Engineering
14-16, April 2020
44
PCM properties (thermo-physical) utilized in
this research are: specific heat capacity
(2000.0 J/Kg.K), its density in liquid & solid
state is 760 kg/m3 & 880 kg/m3 respectively,
melting temperature 38.0 ◦C to 41.0 ◦C,
Paraffin thermal conductivity is 0.20 W/m.K.
Aluminum foam sample having porosity (ε)
0.950 and pore density (ⱳ) 20.0 PPI (Pore Per
Inch) with a measurement of L=165.0 mm,
W=65.0 mm and H=25.0 mm, (L x W x H).
Aluminum foam thermal conductivity 91.40
[W/ (m.K)]. The drilled cavity diameter is 18.3
mm and space between two cells is 24.04 mm
from their centers. After dividing the foam
into two parts the cells have been placed in
the drilled holes, the sole purpose of this
structure is to decrease the weight of a
battery pack.
B. Aluminum metal foam/PCM
(paraffin) Composite.
Aluminum foam-paraffin was made
through penetrating liquid PCM (paraffin) in
the pores of Aluminum foam using a water
bath (hot). For calculation of thermal
conductivity of composite, equation used is
equation No 1. [9].
𝐾𝑒 = 𝐴[ ( 1 − 휀𝑏) 𝑘𝑓𝑜𝑎𝑚 + 휀𝑏𝑘𝑝𝑐𝑚 ] +
1 − 𝐴
𝜀𝑏𝑘𝑝𝑐𝑚
+ 1 − 𝜀𝑏𝑘𝑓𝑜𝑎𝑚
, (1)
Expressions used in this equation are,
effective thermal conductivity ke. A being the
coefficient of correlation. Ɛb for bulk porosity.
kfoam is thermal conductivity of foam & kpcm is
PCM thermal conductivity. The calculated
quantities of bulk porosity 0.970 and foam
thermal conductivity is 91.40 [W/m.K] [10].
Bhattacharya et al.[9] proposed coefficient of
correlation (A) to be 0.350, he highlighted that
through this Equation (1), the calculating
range of porosities and pore density of the
foam is from 0.905 to 0.978 & 5 to 40 Pore Per
Inch respectively. As the Pore density and
porosities of foam lies within the suggested
range, the operational thermal conductivity of
Aluminum foam composite is also calculated
through the same equation and the value is
1.802 [W/ (m-K)]. The “Fig 1”. of Aluminum
foam before and after permeation is shown
below. Leica microscope (Leica-M205C) was
used to take the pictures.
a) b)
Figure 1 Aluminum metal foam (a) before PCM
infiltration (b) After PCM infiltration.
C. Battery Pack Testing.
These tests are performed on four
methods i.e. Natural air circulation, Pure
phase change material, Nickel foam/paraffin
composite & Aluminum foam/paraffin wax
composite. Three thermocouples having an
accuracy of 0.10 ◦C has been used in this
research to investigate battery surface
temperature. Two thermocouples are in the
mid of fifth & third cells and the other one is
placed on the battery cell +ve side terminal.
Another thermo-couple is also used to check
the environmental air temperature.
Laboratory environment temperature was
thermostatically kept at 25.0 ◦C. The charging
Figure 2 Research arrangement

3rd Pak-Turk International Conference on Emerging Technologies in the field of Sciences and Engineering
14-16, April 2020
45
of the battery was done on the galvanostatic
& potentiostatic modes, constant rate was
0.50 C (1.70 A) and 100 mA respectively and
limit of voltage cut off was 4.20 Volt/cell.
Charge time continued after a break till the
pack reaches the environmental temperature.
Discharge has been done1.50 C (5.10 A) & 2.0
C (6.80 A) rate till it reduces to 3.0 Volts each
battery cell. Lastly, break time was continued
for the complete cycle till the temperature
reaches the environmental temperature. The
temperature has been recorded after passing
every 30 seconds with the help of DAQ
(National Instrument NI USB-9162). These
values are shown in Table. 2.
Table 19 Load Cycles Parameters
Parameters Test 01 Test 02
Charge 0.5 C (1.7 A) rate
0.5 C (1.7 A) rate
Rest up to ambient temp.
up to ambient temp.
Discharge 1.5 C (5.1 A) rate
2 C (6.8 A) rate
Rest up to ambient temp.
up to ambient temp.
Fig.2 Research arrangement.
The battery pack research arrangement and
charging, discharging module can be seen in
“Fig 2”.
XIII. Results and discussion
A. Performance Of Different Cooling
Mediums (Passive TMS).
For classification of natural air flow, the
Rayleigh number used is the equation No. 2.
𝑅𝛼 =𝑔𝛽(𝑇𝑠−𝑇0)𝐿
3
𝓋2 𝑃𝑟, (2)
In equation 𝛽 [1/K] thermal expansion
coefficient, v [m2/s] viscosity (Kinematic), g is
the gravity that is 9.8 m/s2, L is length of
battery cell (6.5 cm), Ts [K] is battery cell
surface temperature and To [K] the ambient
temperature. For this research To is kept
constant, which is equal to 298.150 K,
whereas the Ts surface temperature is
calculated via experiment. The range of
Rayleigh number, 103 < Ra < 109 is considered
as the laminar flow, while for turbulent flow
the range is 109 < Ra < 1014.
The experiment was conducted for the
Aluminum foam/paraffin composite at 0.50 C,
1.50 C & 2.0 C rate. During charge & discharge
process the temperature was increased up to
32.1 ◦C and 30.4 ◦C respectively at 0.5 C. This
0 1 2 3 4 5 6 7 8 9 10 11 12 13 14 15 16 17 18 19
24
26
28
30
32
34
36
38
40
42
44
46
48
50
52
54
MeltingSolidT
em
pera
ture
(0C
)
Time (min)
@ 1.5C Rate
Air
PCM
Nickel Parrafin Composite
Aluminum
Melting
Solid
Liquid
a)
Figure 4. Temperature variations with respect to time
using four cooling modes, i.e. Air, PCM, Nickel/paraffin
composite and aluminum foam paraffin, a) at 1.5 C.

3rd Pak-Turk International Conference on Emerging Technologies in the field of Sciences and Engineering
14-16, April 2020
46
temperature is less than the melting point
range of the paraffin (i.e. 38 ◦C to 41 ◦C). Form
these results the aluminum foam/paraffin
composite thermal conductivity has
increased. The developed composite had
played a vital role for raising the paraffin
thermal conductivity that caused good
quantity of heat exchange of the battery pack.
For the observation of sensible heat influence,
the experiment was repeated at 1.50 C (5.1 A)
& 2.0 C ( 6.80 A) rate. These results are shown
in “Fig 4. a & b”. The natural air-circulation
mode temperature is 52.22 ◦C and 64.544 ◦C,
at the 1.5 C and 2.0 C discharge rates
respectively. While the temperature using the
pure paraffin is, 44.001 ◦C, 49.331 ◦C at 1.5 C
and 2 C discharge rates respectively. For nickel
/paraffin composite the results are 41.392 ◦C,
45.84 ◦C at the same discharge rates. While
using the aluminum foam/paraffin composite
the results are 39.94 ◦C, 43.5 ◦C at 1.5 C and 2
C discharge rates respectively. Figure shows a
decrease in temperature from 45.6 ◦C to 43.5 ◦C after utilizing aluminum foam/paraffin
composite as thermal mode instead of nickel
paraffin composite. If we further analyze
these results for observations, it shows that
there is the reduction of temperature about
32.6% utilizing aluminum foam-PCM (paraffin)
composite in comparison to mode of natural
air cooling. If we compare the results of PCM
cooling medium, there is also temperature
decrease about 12%. Also, the aluminum
foam/paraffin composite has an advantage
over the nickel/paraffin composite. This
comparison shows a decrease in temperature
of about 5% at C/2 discharge rate. From these
results, it is concluded that aluminum
foam/paraffin composite can be used as a
TMS to maintain the lithium-ion batteries
operating temperature utilized in the EVs &
HEVs.
XIV. Conclusion.
Aluminum foam/PCM (paraffin)
composite is used to make thermal
management system (TMS) for highly
powered li-ion battery pack. It is concluded
that by using this composite, lithium-ion
batteries temperature drops of 32.6%, 12% &
5% has been noticed in comparison to other
cooling modes i.e. natural air circulation, PCM
and nickel foam/paraffin composite
respectively. The increase in li-ion battery
surface temperature has been reduced more
in comparison to the other three cooling
modes (i.e. natural air, pure paraffin, & nickel
foam-PCM (paraffin) composite). This
decrease in battery surface temperature
highlights the importance of aluminum metal
foam/PCM (paraffin) composite as a cooling
mode for development of lithium-ion battery
pack TMS (thermal management system).
XV. References:
[1] M. Wu, K. H. Liu, Y. Wang, and C. Wan,
0 1 2 3 4 5 6 7 8 9 10 11 12
25
30
35
40
45
50
55
60
65
Tem
per
atu
re(0
C)
Time (m)
@ 2 C Rate
Air
Parrafin(PCM)
Parrafin & Nickel Composite
Parrafin & Aluminum composite
Solid
Melting
Liquid
b)
Figure 4. Temperature variations with respect to
time using four cooling modes, i.e. Air, PCM,
Nickel/paraffin composite and aluminum foam
paraffin b) 2.0 C discharge rate.

3rd Pak-Turk International Conference on Emerging Technologies in the field of Sciences and Engineering
14-16, April 2020
47
“Heat dissipation design for lithium-ion
batteries,” vol. 109, pp. 160–166, 2002.
[2] A. A. Pesaran, “Battery Thermal
Management in EVs and HEVs : Issues
and Solutions,” 2001.
[3] F. Agyenim, N. Hewitt, P. Eames, and M.
Smyth, “A review of materials , heat
transfer and phase change problem
formulation for latent heat thermal
energy storage systems ( LHTESS ),” vol.
14, pp. 615–628, 2010.
[4] R. Sabbah, R. Kizilel, J. R. Selman, and S.
Al-Hallaj, “Active (air-cooled) vs.
passive (phase change material)
thermal management of high power
lithium-ion packs: Limitation of
temperature rise and uniformity of
temperature distribution,” J. Power
Sources, 2008.
[5] M. M. Farid, A. M. Khudhair, S. Ali, and
K. Razack, “A review on phase change
energy storage : materials and
applications,” vol. 45, pp. 1597–1615,
2004.
[6] L. Fan and J. M. Khodadadi, “Thermal
conductivity enhancement of phase
change materials for thermal energy
storage : A review §,” vol. 15, pp. 24–
46, 2011.
[7] S. A. Khateeb, S. Amiruddin, M. Farid, J.
R. Selman, and S. Al-Hallaj, “Thermal
management of Li-ion battery with
phase change material for electric
scooters: Experimental validation,” J.
Power Sources, 2005.
[8] W. Q. Li, Z. G. Qu, Y. L. He, and W. Q.
Tao, “Experimental and numerical
studies on melting phase change heat
transfer in open-cell metallic foams fi
lled with paraf fi n,” vol. 37, pp. 1–9,
2012.
[9] A. Bhattacharya, V. V Calmidi, and R. L.
Mahajan, “Thermophysical properties
of high porosity metal foams.”
[10] X. Xiao, P. Zhang, and M. Li,
“Preparation and thermal
characterization of paraffin/metal
foam composite phase change
material,” Appl. Energy, 2013.

3rd Pak-Turk International Conference on Emerging Technologies in the field of Sciences and Engineering
14-16, April 2020
48
Mechanical Properties of Concrete with E-Waste
as Partial Replacement of Natural Aggregate
Khawar Ali1, a, 2, b Dr. Irshad Qureshi 1Research Assistant
2Assistant Professor UET Taxila
Email address: a) [email protected], b) [email protected]
Abstract— Concrete is a fundamental constitute of construction industry across the globe. The bulk of concrete is
made up of aggregates, hence structural behavior of concrete significantly relies on the quality and properties of
aggregates. Natural resources are depleting due to continuous production of concrete resulting in stringent
environmental impact. To endeavor this challenging situation, several studies have been conducted to opt the
sustainable and eco-friendly by-products generated by automobiles, packaging industries, electronics goods etc. as
alternative construction material. This paper presents partial replacement of natural aggregates with plastic
aggregates and the effect of plastic aggregates on fresh and hardened properties of concrete. Three replacement
percentages are adopted which are 10%, 15%, 20%. Also, silica fume is used in three percentages to enhance the
properties of concrete with plastic aggregates. Effects of these parameters on the strength properties of concrete
are discussed in detail and the suitability of recycling electronic waste in construction industry is discussed.
Keywords—concrete, natural aggregate electronic waste, slump, mechanical properties
I. Introduction
Amount of concrete produced is constantly increasing, requiring an increasing amount of natural
resources to be used to meet the demand. Major Portion in the concrete is aggregate, it may be
fine or coarse. Source of coarse aggregates are natural stones and mountains. Plastic is a highly
sought-after material due to its excellent properties, resulting in an increase in its production
worldwide. Plastic is used in population-oriented industries such as automobiles, packaging
industries, electronics goods and agriculture. As the population is increasing day by day, the
production of plastic waste is also increasing. This is resulting into a huge problem as the most
of waste plastic is not recycled and is creating an environmental hazard. Electronic waste (E-
waste) on the other hand has even more environmentally hazardous materials and is mostly
dumped in developing countries like Pakistan. One solution to this problem is to reuse the E-
waste in construction industry which will not only save the natural resources but also will help in

3rd Pak-Turk International Conference on Emerging Technologies in the field of Sciences and Engineering
14-16, April 2020
49
recycling E-waste. Total mass of concrete contains 60-70% of the aggregates and replacing the
aggregates partially or fully will help to preserve the natural sources [1]. There have been few
studies where plastic has been used to produce aggregates. Formation of artificial or plastic
aggregate has been done by shredding the plastic. To characterize the fracture energy of concrete
and mortar having plastic aggregate, tensile test is performed [2, 3, 4]. The addition of Plastic
aggregate in concrete reduced the strength of the concrete but enhanced the fracture energy.
Hannawi et al. [3] reported that mortar having plastic aggregate reduce the tensile strength but
increase the fracture energy up to 6% as compared to conventional sand. Addition of plastic
aggregate slow down the crack propagation and thus increase the fracture energy and made the
structure more resilient. Although there are studies which are focused on the use of plastic
aggregates in concrete, the current study is focused on the use of E-waste aggregates as partial
replacement of natural aggregates.
II. Materials
Material testing is the process to determine the engineering properties and the characteristics of
material. Aggregate play important role in the strength of concrete so their properties really
matter a lot. Therefore, it is necessary to test them in the lab for determining their shape, size,
gradation, fineness modulus, specific gravity and the water absorption. This article describes the
procedure as well as the mix proportion of the materials used in the research work. The section
also elaborates the material properties of concrete mix. Ordinary Portland Cement (OPC),
provided from Fauji Cement Company according to the requirements of ASTM C-150 was used.
Natural Coarse aggregate from margalla crush, sand from lawrancepur and tap water was used in
research. Artificial aggregate was manufactured from waste plastic. Size of artificial aggregate
was greater than 4 mm and less than 25mm which was quite like natural aggregate.
III. Sieve Analysis Test
Sieve analysis is widely used test in civil engineering for finding the gradation of aggregates
weather they are capable to be used in concrete or not. The test includes the sieving of
aggregates through the standard designated sieves. The sieve analysis of fine aggregates was
performed according to ASTM C 136, and the fineness modulus of lawrancepur sand is 2.76
which tells its good capability to be used in concrete for better results. Nominal size of natural
coarse aggregate and plastic aggregate was 20mm.
IV. Water absorption Density, and Specific Gravity Test
Water absorption values are helpful in determining the water absorbed by the pores available in
aggregate particles. The Tests were performed as per ASTM C127 – 15 [5]. The values of
specific gravity and water absorption are presented in table 2

3rd Pak-Turk International Conference on Emerging Technologies in the field of Sciences and Engineering
14-16, April 2020
50
V. Preparation of Mixes:
In this study, total seven mixes were considered. One of them was control mix while others had
10%, 15%, 20% replacement of natural coarse aggregate with and without addition of silica
fume. Mix ratio used in this study was 1:1.5:3 and water cement ratio was 0.45. Ultra-Super
Plast was used to improve the workability of concrete which was 1.25 % of the weight of the
cement. PA stands for plastic aggregate and SF stands for silica fume. For example, 10% PA
corresponds ten percent replacement of natural aggregate to Plastic aggregate and 10%PASF
means ten percent replacement of coarse aggregate with natural aggregate and ten percent silica
fume with cement.
VI. Slump Test
Workability ensures the handling of concrete and controls the strength and durability.
Workability of the fresh concrete were examined using slump test according to ASTM [8]. The
effect of replacing coarse aggregates with plastic aggregates on slump is shown in Fig. 1. The
increase in slump of PA mixes ranged from 96mm to 130mm as the replacement level increased
from 10 to 20%. These results also confirmed in a work by Ferreira et al [9], Silva et al [10], de
Brito et al [11] and Hadipramana et al [12] that showed using plastic aggregate increases the
workability with the increase of plastic content. This could be still beneficial in casting and
pumping of such type of
Table VI.1 Specific gravity , Water absorption and Density
Figure 13 Slump Result
concrete over congested reinforcement or long distance. Choe et al also reported that increase in
slump is not only attributed to spherical shape with smooth surface but also due to zero water
absorption capacity. The decline in slump of PASF as compared to PA with the addition of silica
Source Name Specific Gravity Water absorption Density(kg/m3)
Margallah Crush 2.61 0.97 1518
Plastic Aggregate 0.88 0 620

3rd Pak-Turk International Conference on Emerging Technologies in the field of Sciences and Engineering
14-16, April 2020
51
fume from 97mm to 142.5 due small particle size and large surface area of silica fume.
VII. Casting and curing of Concrete Specimens
All the samples were made with standard concrete cylinders of 12” height and 6” diameter. The
mix was placed in the mold in three layers of equal depth and compacted using stand size rod
with 25 blows on each layer. A total of 42 samples were casted with 6 nos. of samples for each
formulation. Fig 2 shows the casted samples.
Figure 14 Casting and Curing of Concrete Sample
The test samples were remolded after 24 hours and then placed in curing tank for 28 days at
room temperature.
VIII. Testing Method
The samples were tested for their compressive and tensile strengths using compression testing
machine and universal testing machine. The compressive strength of 28 days cured hardened
cylinders was measured according to the ASTM specification using standard compressive testing
machine (CTM) having a loading rate of 100 KN/min. For each combination, three samples were
tested for compressive strength and three were tested for split cylinder test[6-7].
A. Compressive Strength
Fig. 3 shows the compressive strength results for the concrete mixes considered in this study.
The CPA0 and CPA10SF10 had a compressive strength of 42.07 and 34.28 MPa, respectively,
whereas the result of CPA10 to CPA20SF20 are ranging from 31.54 to 27.98 MPa. Decrease in
compressive strength of concrete mixes having plastic aggregate and silica fume compared with
control concrete ranged from 18% to 33% as the replacement level was increased from 10 to 20
% with the interval of 5.
The reduction in compressive strength of concrete mixes having plastic aggregate without silica
fume ranged from 25% to 37% and with silica fume from 18% to 33% as the replacement level
increased from 10 to 15%. With the addition of silica fume reduction in compressive strength
reduced due its pozzolanic activity and smaller particle size as compared to cement. Previous
research agreed with the results that compressive strength increased as the replacement level of
silica fume increased. The reduction in compressive strength of concrete mixes is due to weak
interfacial transition zone between the cement paste and plastic. Decrease in compressive
strength is due to more bleeding water in the concrete containing plastic aggregate as compared

3rd Pak-Turk International Conference on Emerging Technologies in the field of Sciences and Engineering
14-16, April 2020
52
to conventional concrete mixes because plastic aggregates are hydrophobic. This water is located
near the plastic aggregate and produced weak bond between plastic and cement matrix. The
results were consistent with the previous research works done on other kinds of plastic
aggregates [13, 14, 15-17]
Figure 15 Compressive Strength Result
B. Tensile Strength
Fig.4 presents the splitting tensile strength results of concrete mixes. The CPA0 and CPA10SF10
had tensile strength 4.45 and 3.41 MPa, respectively. The concrete mixes containing silica fume
showed tensile strength from 3.41 to 3.041 MPa and 3.17 to 2.88 MPa without silica fume as the
replacement level increase from 10 to 20%.
The tensile strength of CPA0 compared with the other formulations containing plastic aggregate
was reduced up to 29 to 35% as the replacement level increase from 10 to 20%. Moreover, the
decline in tensile strength of concrete mixes having silica fume ranged from 23 to 32%. The
downward trend of relative splitting tensile strength of concrete mixes was consistent with
previous studies [18-20]. Decline in compressive and splitting tensile strength of concrete mixes
is due to weak bond of plastic aggregate with concrete. It is also due to the hydrophobic, smooth
spherical shapes and zero water absorption of plastic aggregate.

3rd Pak-Turk International Conference on Emerging Technologies in the field of Sciences and Engineering
14-16, April 2020
53
Figure 16 Tensile Strength Result
CONCLUSION
• The value of slump increase with the replacement of plastic aggregate due to zero water
absorption and hydrophobic nature of the plastic aggregate. Concrete having plastic
aggregate was used in such type of construction where more workable concrete mixes are
required. At 20% replacement of plastic aggregate with natural aggregate, value of slump
increases 84% which is the suitable value for more workable concrete.
• Concrete Samples reduced the value of slump after replacement of silica fume and plastic
aggregate with cement and natural aggregate respectively. Value of slump was 12mm at
maximum replacement of 20% while control have 25mm slump. Such type of concrete is
recommended in pavement and shoulders.
• With the replacement of plastic aggregate, compressive strength of concrete mixes was
reduced up to 31%, 38% and 43% as compared to control mix but it was reasonable and
more than structural strength for construction.
• With the replacement of plastic aggregate and silica fume with conventional aggregate and
cement respectively, decrease in strength was 26%, 28%, and 22% for 6, 12 and 18%.
• Tensile strength of control mix was 652 psi while at 10, 15 and 20% replacement of plastic
aggregate strength was 4.49,3.064 and 3.0008 MPA respectively. Concrete having 10,
15and 20% replacement of cement and natural aggregate with silica fume and plastic
aggregate was 3.413, 3.348 and 3.0468 MPA respectively, increase in strength was due to
replacement of silica fume with cement.
• Use of e-waste in concrete make significant contribution towards reduction in pollution of
the environment. In parallel due to increase in global demand for construction aggregates,
it is an effort to use of electronic waste to contribute more sustainable construction.

3rd Pak-Turk International Conference on Emerging Technologies in the field of Sciences and Engineering
14-16, April 2020
54
• Although decremental effect on mechanical properties of different formulation but at
maximum replacement (20% PA), but results suggest that it can be used for structural and
non-structural applications.
References
[62] M. Gesoğlu, E. Güneyisi, R. Alzeebaree, and K. Mermerdaş, "Effect of silica fume and steel fiber
on the mechanical properties of the concretes produced with cold bonded fly ash aggregates,"
Construction and Building Materials, vol. 40, pp. 982-990, 2013
[63] Fredonia. (2012). “Global demand for construction aggregates in 2015, demand and sales
forecasts.” (http://www.freedoniagroup.com) (May 23,2015).
[64] K. Hannawi, S. Kamali-Bernard, W. Prince, Physical and mechanical properties of mortars
containing PET and PC waste aggregates, Waste Manage. 30 (11) (2010) 2312–2320.
[65] Z.Z. Ismail, E.A. AL-Hashmi, Use of waste plastic in concrete mixture as aggregate replacement,
Waste Manage. 28 (11) (2008) 2041–2047.
[66] A. International, "Standard Test Method for Relative Density (Specific Gravity) and Absorption
of Coarse Aggregate , ASTM C 127-15."
[67] ASTM, C. "39/C39M-03 (2003),“Standard Test Method for Compressive Strength of Cylindrical
Concrete Specimens”.
[68] In American Society for Testing and Materials, pp. 21-25. ASTM, C. (1989). 496-86,“Standard
Test Method for Splitting Tensil of Cylindrical Concrete Specimens”. Annual Book of ASTM
Standards, 4(02), 259-262.
[69] ASTM, C. (2012). Standard test method for slump of hydraulic-cement concrete.
[70] Y. Ghernouti, B. Rabehi, B. Safi, and R. Chaid, "Use of recycled plastic bag waste in the
concrete," Journal of International Scientific Publications: Materials, Methods and Technologies,
vol. 8, 2011.
[71] R. V. Silva, J. de Brito, and N. Saikia, "Influence of curing conditions on the durability-related
performance of concrete made with selected plastic waste aggregates," Cement and Concrete
Composites, vol. 35, no. 1, pp. 23-31, 2013.
[72] R. V. Silva, J. De Brito, and R. Dhir, "Properties and composition of recycled aggregates from
construction and demolition waste suitable for concrete production," Construction and Building
Materials, vol. 65, pp. 201-217, 2014.
[73] J. Hadipramana, S. Mokhatar, A. Samad, and N. Hakim, "An exploratory compressive strength
of concrete containing modified artificial Polyethylene aggregate (MAPEA)," in IOP Conference
Series: Materials Science and Engineering, 2016, vol. 160, no. 1, p. 012065: IOP Publishing.
[74] Lamond, J. F. (1994). Making and Curing Concrete Specimens. In Significance of Tests and
Properties of Concrete and Concrete-Making Materials. ASTM International.

3rd Pak-Turk International Conference on Emerging Technologies in the field of Sciences and Engineering
14-16, April 2020
55
[75] S. Kou, G. Lee, C. Poon, and W. Lai, "Properties of lightweight aggregate concrete prepared with
PVC granules derived from scraped PVC pipes," Waste Management, vol. 29, no. 2, pp. 621-628,
2009.
[76] ASTM, "Standard Test Method for Static Modulus of Elasticity and Poisson’s Ratio of Concrete
in Compression."
[77] J. N. Farahani, P. Shafigh, B. Alsubari, S. Shahnazar, and H. B. Mahmud, "Engineering properties
of lightweight aggregate concrete containing binary and ternary blended cement," Journal of
cleaner production, vol. 149, pp. 976-988, 2017.
[78] A. Al-Manaseer and T. Dalal, "Concrete containing plastic aggregates," Concrete International,
vol. 19, no. 8, pp. 47-52, 1997.
[79] Y.-W. Choi, D.-J. Moon, J.-S. Chung, and S.-K. Cho, "Effects of waste PET bottles aggregate on
the properties of concrete," Cement and concrete research, vol. 35, no. 4, pp. 776-781, 2005.
[80] A. B. Fraj, M. Kismi, and P. Mounanga, "Valorization of coarse rigid polyurethane foam waste
in lightweight aggregate concrete," Construction and Building Materials, vol. 24, no. 6, pp. 1069-
1077, 2010.
[81] M. Frigione, "Recycling of PET bottles as fine aggregate in concrete," Waste management, vol.
30, no. 6, pp. 1101-1106, 2010.

3rd Pak-Turk International Conference on Emerging Technologies in the field of Sciences and Engineering
14-16, April 2020
56
Hybrid Thermal Management of Heating Element using
Forced Air Convection and Phase Change Material Soaked in
Copper Foam
Sohaib Nazar1, a, Abid Hussain1, b and Tanzeel-ur-Rehman1, c
1Department of Mechanical Engineering, University of Engineering & Technology, Taxila
Email address: a)[email protected], b) [email protected] , c) [email protected]
ABSTRACT—The current study includes the comparison of hybrid thermal management system designed for heating
element with active and passive thermal management system. The effectiveness and usefulness of hybrid thermal
management system is evaluated and compared experimentally. All the experiments are performed under constant
ambient temperature of 25oC. It can be concluded from experimental results that alone active and passive thermal
management system is not sufficient to keep the temperature of heating element within the safety limits. Moreover,
combination of active and passive thermal management system gives more Steady temperature distribution and have
the ability to maintain the temperature of heating element for long time interval as compared to active as well as passive
thermal management system.
Key words: Active, Passive, Thermal Management, Hybrid.
I. INTRODUCTION
To keep the temperature of electrical and electronic devices within the safety limits different
techniques are utilized. Plenty of researchers worked on different thermal management system to
evaluate and to suggest the best system for severe ambient conditions. Pesaran reported that the
function of thermal management system is to sustain the temperature at an optimum range with even
temperature variation and to prevent the occurrence of thermal runway [1]. Irregular temperature
distribution and overheating of battery module result in reduction of life span of battery pack [2].
According to US air force premature failure of more than 55%
electronic devices occur due to overheating and non-uniform temperature distribution [3]. Excess
operating temperature of lithium ion battery not only result in reduction the life span of battery but
also result in serious accidents like fire and explosion [4,5]. Samimi et al. experimentally assessed
the thermal function of phase change material saturated with carbon fibers and concluded that
presence of carbon fibers with PCM give more uniform temperature distribution [6]. Rao et al.
experimentally explored the thermal management system comprised of copper foam embedded in
paraffin their results show that the local temperature difference is 2.85oC and maximum temperature
difference is 38.94oC which indicate the suitability of this system for challenging ambient conditions
[7]. Wang et al. experimentally tested the thermal management system comprised on paraffin and
paraffin/aluminum foam composite results show that if heat storage time of PCM is 74.4% and 73.6%
under heat flux of 7000 W/m2 and 12000 W/m2 the use of aluminum foam result in smooth and steady
temperature variation [8]. Hussain et al. experimentally investigated the nickel foam paraffin based
thermal management system and also examined the geometric properties of metal foam it can be
predicted from results that the combination of nickel foam and paraffin reduce the temperature of

3rd Pak-Turk International Conference on Emerging Technologies in the field of Sciences and Engineering
14-16, April 2020
57
battery pack about 24% and 31% compared to pure PCM. Decrease in permeability and pore density
of metal foam also reduce the surface temperature of battery module [9]. Li et al. made the comparison
between the thermal management system based on copper foam /PCM composite combined with
natural air-convection and pure PCM. Results exhibit that natural air cooling is not enough for
maintaining the temperature within safety limits. Due to lower thermal conductivity of pure PCM
metal foam saturated with PCM is more reliable [10].Zhao et al. explored the consequence of inserting
heat pipe into phase change material through experimentation. Their results show that by inserting
heat pipe into PCM have the capability to keep the temperature below 50oC for time period as
compared to natural air-convection and the temperature variance can be achieved more than 33.6%
by injecting heat pipe into PCM [11]. Wang et al. carried out simulation-based study to explore the
thermo physical characteristics of pure paraffin, composite material and copper foam/paraffin results
show that paraffin reduces the heat storage time by more than 40% and dramatically recover the
linearity of paraffin internal heat transfer [12]. Shahabeddin et al. use numerical simulation to predict
the effect of using metal foam in air flow channels. Results show that decrease in porosity result in
reduction of surface temperature and to obtain smallest ratio of standard deviation of temperature it
is recommended that 70% of air flow channel should be occupied with metal foam having porosity
of 0.85 [13]. Javani et al. modeled the PCM embedded foam through simulation and concluded that
temperature drop of 7.3 K is achieved as compared to dry foam [14]. Hemery et al. experimentally
compared PCM, natural and forced air cooling based thermal management system and concluded that
advantage of using PCM is that the weight ratio of about 13.4% and more uniform temperature
distribution is achieved as compared to natural and forced air cooling mode [15]. PCMs are
commonly used material for thermal management because PCMs dissipate and absorb great amount
of heat during phase shifting process [16]. Yang et al. executed the numerical simulation to explore
the function of air for cooling in axial direction for Li ion battery pack and predicted that more even
temperature distribution can be attained by increasing radial interval [17]. Hasan Fathabadi
numerically assessed the performance of thermal management system comprised of combined effect
of natural air cooling and expanded graphite and explored that the temperature remains in safety limits
under ambient temperature of 55oC [18].
II. EXPERIMENTAL SETUP
To perform the experimentation flat plate heating element having capacity of 5 W and dimensions of
100 mm x 100 mm is used. Plexiglass cavity having dimensions of 100 mm x 100 mm is manufactured
and utilized as heat sink. Hole is provided at top of the cavity to permit thermocouples and wires of
heating element to pass through. For purpose of forced air convection, the variable speed fan is used.
Four K type thermocouples are connected at different spots of heating element to carefully measure
the temperature. Phase change material is soaked in copper foam by infiltering paraffin wax in the
holes of metal foam. To record the temperature accurately the DAQ (National Instruments) is used.
To regulate the current and voltage properly digital AC power supply is used.

3rd Pak-Turk International Conference on Emerging Technologies in the field of Sciences and Engineering
14-16, April 2020
58
Figure 1. Schematic of Experimental Setup
III. RESULTS AND DISCUSSION
Passive Thermal Management System
Fig.1 show the temperature profile recorded for passive thermal management system. It can be
observed from temperature profile that temperature reach beyond the permissible range in 1800 S
which is very short time period. Results show that due to lesser thermal conductivity of PCM PTMS
is not sufficient to keep the temperature within acceptable range.
Figure 2. Distribution of temperature with time using Passive thermal management system
Active Thermal Management System
Fig.2 show the temperature variation with time in case of active thermal management system. It can
be predicted from curve that the temperature of heating element can be maintained within allowable
range up to 1400 S. Experimental results depict that the active thermal management system is not
capable to cope with severe environmental conditions.
0 500 1000 1500 2000 2500
25
30
35
40
45
50
55
Time (S)
Tem
p o C

3rd Pak-Turk International Conference on Emerging Technologies in the field of Sciences and Engineering
14-16, April 2020
59
0 200 400 600 800 1000 1200 1400 1600 1800
25
30
35
40
45
50
55
60
Time (S)
Tem
p o
C
Figure 3. Distribution of temperature with time using active thermal management system
Hybrid Thermal Management System
Fig.4 show the function of hybrid thermal management system in terms of temperature variation with
time. The experimental results exhibit that HTMS can maintain the temperature of heating element
within safety limit for long time period of about 6000 s, which show the effectiveness of HTMS. It
can be predicted from experimental results that hybrid thermal management system is best suitable
option for maintaining the temperature of heating element within the permissible range for long time
period as compared to active and passive thermal management system.
0 1000 2000 3000 4000 5000 6000
25
30
35
40
45
50
Time (S)
Tem
p o
C
Figure 4. Distribution of temperature with time using hybrid thermal management system
IV. CONCLUSION
The purpose of this research is to experimentally examine and assess the active, passive and hybrid thermal
3rd Pak-Turk International Conference on Emerging Technologies in the field of Sciences and Engineering
14-16, April 2020
60
management systems. The use of PTMS fail due to lower thermal conductivity of PCM. Uniform
distribution of heat flux can be achieved by using copper foam saturated with PCM but the time period
to maintain the temperature within safety limits is almost same for both PTMS and ATMS. Therefore,
combination of ATMS and PTMS is more effective and suitable. The problem associated with PTMS
is the large solidification time of PCM which can be overcome by using forced air convection and
copper foam can be supportive in recovering the latent heat of PCM. It can be concluded from
experimental results that HTMS is the best suitable option for maintaining the temperature within
permissible range.
V. REFERENCES
[1] A.A Pesaran, “Battery Thermal Models for Hybrid Vehicle Simulations” Journal of Power Sources,
vol-110, pp-377-382,2002.
[2] Sabbah R, Kizilel R, Selman JR, Al-Hallaj, “Active (air-cooled) vs. Passive (phase change material) Thermal Management of High-Power Lithium-Ion Packs: Limitation of Temperature Rise and Uniformity of Temperature Distribution” Journal of Power Sources, vol- 182, pp-630–638, 2008.
[3] Yeh L. “Review of Heat Transfer Technologies in Electronic Equipment,” Journal of Electron
Package, pp-117-333, 1995.
[4] W. Wu, X. Yang, G. Zhang, X. Ke, Z. Wang, W. Situ, X. Li, J. Zhang,“An Experimental Study
of Thermal Management System Using Copper Mesh-Enhanced Composite Phase Change Materials
for Power Battery Pack,” Journal of Energy, vol-113, pp-909-916, 2016.
[5] B. Mortazavi, H. Yang, F. Mohebbi, G. Cuniberti, T. Rabczuk, “Graphene or h-BN Paraffin
Composite Structures for the Thermal Management of Li-ion Batteries: A Multiscale Investigation,”
Journal of Applied Energy, vol-202, pp-323-334, 2017
[6] Fereshet Samimi,Aziz Babapoor,Mohammad Mehdi Azizi,Gholamreza Karimi, “Thermal
Management Analysis of Li Ion Battery Cell Using PCM Loaded with Carbon Fibers,”Journal of
Energy,vol-96,pp-355-371,2016.
[7] Zhonghao Rao,Yutao Huo,Xinjian Liu,Guoging Zhang, “Experimental Investigation of Battery
Thermal Management System for Electric Vehicle Based on Paraffin/Copper Foam,”Journal of
Energy Institute,vol-88,pp-241-246,2014.
[8] Zichen Wang,Zhuqian Zhang,Li Jia,Lixin Yang, “Paraffin and Paraffin /Aluminum foam
composite PCM Heat Storage Experimental Study Based on Thermal Management System of Li ion
Battery,” Journal of Applied Thermal Engineering, vol-78,pp-428-436,2015.
[9] Abid Hussain, C. Y Tso, Christopher Y.H.Chao, “Experimental Investigation of Passive Thermal
Management System for High Powered Li ion batteries Using Nickel Foam Paraffin Composite,”
Journal of Energy,vol-115,pp-209-218, 2016.

3rd Pak-Turk International Conference on Emerging Technologies in the field of Sciences and Engineering
14-16, April 2020
61
[10] W.Q.Li,Z.G.Qu,Y.L.He,Y.B.Tao, “Experimental Study of Passive Thermal
Management System for High Powered Li-ion Batteries Using Porous Metal Foam
Saturated with PCM,”Journal of Power Sources ,vol-255,pp 9-15, 2014.
[11] Jiateng Zhao,Peizhao LV,Zhonghao Rao, “Experimental Study on Thermal Management
Performance of PCM Coupled with Heat Pipe for Cylindrical Power Battery,” Journal of Thermal
and Fluid Sciences,vol-82,pp-182-188, 2016.
[12] Changhong Wang, “Heat transfer Enhancement of PCM Composite Material Copper
Foam/Paraffin,”Journal of Renewable Energy, vol-96,pp-960-965,2016.
[13] Shahbeddin K.Mohammadian, Seyed Moein Rassoulinejad-Mousari,Yuwen Zhang, “Thermal
Management Improvement of an Air-Cooled High Power Li Ion battery by Embedding Metal Foam,”
Journal of Power Sources,vol-296,pp-305-313,2015.
[14]N.Javani,I.Dincer,G.F.Naterer,G.L.Rohrauer, “Modelling of Passive Thermal Management
System for Electric Vehicles Battery Pack with PCM between Cells,”Journal of Applied Thermal
Energy,vol-73,pp-307-316,2014.
[15] Charles-Victor Hemery, Franck Pra, Jean Francois Robin, Philippe Marty, “Experimental
Performances of a Battery Thermal Management System Using a Phase Change Material, “Journal
of Power Sources, vol-270, pp-349-358,2014.
[16] Belen Zalba, Jose M. Marin, Luisa F. Cabeza, Harald Mehling, “Review on Thermal Energy
Storage with Phase Change Materials, Heat Transfer Analysis and Applications,” Journal of Applied
Thermal Engineering, vol-23, pp-251-283,2003.
[17] Tairan Yang, Naixing Yang, Xiongwen Zhang, Guojun Li, “Investigation of the Thermal
Performance of Axial-Flow Air Cooling for the Lithium-Ion Battery Pack,”Journal of Thermal
Sciences,vol-108,pp-132-144,2016.
[18] Hassan Fathabadi, “High Thermal Performance Lithium-Ion Battery Pack Including Hybrid
Active-Passive Thermal Management System for Using in hybrid/Electric Vehicles,” Journal of
Energy,vol-70,pp-529-538,2014

3rd Pak-Turk International Conference on Emerging Technologies in the field of Sciences and Engineering
14-16, April 2020
62
Network Application Classification Using Deep Learning
Algorithm in Software Defined Networks
Muhammad Basit Umair 1,a, Zeshan Iqbal2,b
1Department of computer science, University of Engineering and Technology, Taxila
2Department of computer science, University of Engineering and Technology, Taxila
Email Address: a [email protected], b [email protected]
Abstract--Network application classification is quintessential for a wide range of network operations,
network security monitoring, misconfiguration, and intrusion detection in network. Network application
classification has the ability to solve fundamentals to numerous network management activities. As
the popularity of software-defined network (SDN) is evolving technology and a suitable environment for
easily applying in an efficient monitoring policy. In SDN architecture, the control plane separates from
forwarding devices and making networks programmable. The emergence of deep learning methods and
SDN provides a new way for application classification. In this study, a deep learning-based application
classification method is proposed that can classify network traffic affectively. The experimental
setup confirms that, the proposed model achieves a better classification accuracy of 99.10% using a
convolutional neural network (CNN).
Keywords: Internet application classification, machine learning, traffic management, QoS aware
application classification
I. INTRODUCTION
Accurate application classification is an essential step of analyzing the nature of the traffic.
Internet application classification is useful for intrusion detection, network management
tasks and anomalies in the network traffic. Numerous numbers of internet application
classification approaches has been suggested in the last few years included the port-based
classification approach, payload-based classification approach and flows statistics-based
classification [1].
In the port-based classification approach, registered port numbers in the range (1024-49151)
are used that are identified by internet assigned names and numbers authority (IANA). Port
based method is not useful due to their own limitations as the dynamic ports are used by
different protocols [2]. Payload-based classification algorithms look at the packets’ contents to
identify the type of traffic . When a set of unique payload signatures is collected by an
algorithm this approach results in high performance [3]. Payload-based classification is not
useful when there is a fully encrypted data. In recent years, in this field, learning-based
approaches get new interest. Machine learning approaches can be categorized into supervised
methods, unsupervised methods and semi-supervised classification methods. In unsupervised
learning approaches, output classes are not known, and the clustering method is used.
Software-defined networking (SDN) is an evolving standard, in which the control function is
decoupled from the data plane and makes the network programmable. SDN is a suitable

3rd Pak-Turk International Conference on Emerging Technologies in the field of Sciences and
Engineering 14-16, April 2020
63
environment for applying efficient monitoring policies, traffic classification and network
management functions [4].
The programmability function of the SDN network which enables to make the network
programmable. In a term, SDN aims at simplifying network management, promoting
innovation, improving the use of network resources, and optimizing networking performance.
OpenFlow is uses standardized protocols one of the south bound's most popular API is used
between the control plane and data plane [5]. The emergence of the SDN brought new
opportunities for classification of traffic and selection of features. SDN provides a global view
of the controller is easy to extract network traffic statistical attributes from switches. Because
of the OpenFlow protocol's mechanism design, it can be customized to collect flow features
and indicate forwarding policies for each switch [6]. Our aim is to use deep learning algorithm
to overcome the limitations in traditional classification approaches in SDN.
This research work motivates us in use of machine learning model based on statistical
information. Optimal features are selected though chi-square test. A thorough comparison has
been provided along with CNN in classifying the network application into different classes. A
detailed analysis has been provided regarding the network traffic classification using deep
learning-based approach.
II. LITERATURE REVIEW
There are different classification techniques has been applied by different researchers. Some
researchers focused on port-based methods and payload-based methods. This research focused
on deep learning methods.
Lopez-Martin et al. [7] applied a statistics based supervised learning method. A model based
on deep learning that is a combination of RNN and CNN was proposed. Different features were
Figure 52:Structure of SDN

3rd Pak-Turk International Conference on Emerging Technologies in the field of Sciences and
Engineering 14-16, April 2020
64
extracted from the header of packets and build a feature vector of every flow. More than 25000
flows and more than 100 distinct services were used to train this methodology.
Zhang et al. [8] suggested a novel network application classification model with deep learning
and SDN architecture. A model for was proposed by combining the auto-encoder and softmax
regression. To extract features autoencoder was used and softmax model was used as a
classifier.
Sun et al. [9] introduced a TrAdaBoost method that utilized the labeled traffic data that was
collected from different sources for classification. The maximum entropy model (Maxent) was
used as the base classifier and implements the source of knowledge from the source domain to
the target domain. Ertam et al. [10] proposed an extreme learning-based method for network
traffic classification. Kernel-based extreme machine learning approach is on the extreme
machine learning approach that was applied to the data.
Shi et al. [11] presented a feature optimization approach which was named EFOA for the
optimal feature selection and optimization approach. A series of experiments were performed
on the University of Cambridge Moore dataset [12]. First of all, the correlation of the original
flow statistics was evaluated and removed the irrelevant features. After that relevant features
were passed to feature generation model to get robust features and that model was based on
Figure 53:Overview of Proposed Method

3rd Pak-Turk International Conference on Emerging Technologies in the field of Sciences and
Engineering 14-16, April 2020
65
deep belief network (DBN) and implemented by unsupervised methods and at the last
redundant features were removed.
III. METHODOLOGY
In this paper, a novel architecture is presented to classify the network traffic. In the
proposed methodology the first step is data collection and pre-processing, and the second step
is the classification. The detail of every step is given below steps.
1. DATA COLLECTION AND PRE-PROCESSING
In the present section, a description of the datasets used in the proposed method for testing and
relevant pre-processing steps are described. We have selected publicly available Moore dataset
for research purposes [12]. There are twelve input features server_port, client_port,
min_segm_size, actual _data _pkts a b, mean_data_ip a b, inter-arrival time_pkt, src_mac,
dst_mac, src_ip, dst_ip, initial_window_bytes a b, rtt_ samples_a b and correspondence class.
Six classes WWW, P2P, MAIL, INTERACTIVE, DATABASE, VOIP, ATTACK, SERVICES
and BULK are included in the experiment [13]. After the acquisition of data, pre-processing
is an important step. Data pre-processing is useful to handle the missing values in the dataset
and standardize the data. The first important step in Moore dataset is to convert categorical data
into numeric values using the OneHotEncoder Sikit-learn library. A further step is to make the
values in a range using a standard scalar.
X′ =X − XMIN
XMAX − XMIN
(1)
2. FEATURE SELECTION
A statistical method known as chi-square is used in this proposed method to select most
important features in a dataset. The major objective of the is to reduce dimensions from high
dimension to low dimensions. In this methodology, we used the chi-square feature selection
method to find best features from the dataset. The value of t is calculated by Eq (2)
t(C, E) =(C − E)2
E
(2)
where c represents the count and E represent the Expected. After the selection of features these
features set are passed to deep learning model.
3. CLASSIFICATION
We trained a CNN to classify the network. CNN models are used for image classification. The
traffic data also consists of numeric values and image data also consists of numeric values, so

3rd Pak-Turk International Conference on Emerging Technologies in the field of Sciences and
Engineering 14-16, April 2020
66
it
can
be
used for network traffic classification. There are four Conv1D layers, four Dropout, one
MaxPooling1, one Flatten and two fully connected layers. Convolutional layer creates a
features map after applying filter. The dropout layer provides regularization and preventing
overfitting [14]. We added dense layer with softmax activation function. In softmax output can
be represented as posterior probabilities. In softmax output can be represented as posterior
probabilities. In the proposed method both datasets used belong to multi-class data so that
softmax is used at the output layer of neural network classifier. Mathematically softmax is
represented by Eq (3)
softmax(bm) =ebm
∑ ebnn=1
N for m, n = 1,2,3, …N
(3)
Here bm and bn represents the element and a represents the N-dimensional output vector. The
softmax(b) represents N-dimensional vector after mapping.
CNN has a strong capability of classification, so it obtained better results than the other
traditional machine learning methods. The accuracy is calculated for both training data and test
data. The dataset is divided into a 7:3 ratio which means, that 70% training set, and 30% test
set for the purpose of classification. The structure of CNN is given in Error! Reference source
not found..
IV. EXPERIMENTAL SETUP
All of the simulations are tested in real-time. Python programming language is used in the
experimental evaluation for various numerical libraries. The Sikit-learn is a python library used
for scientific purposes. WEKA tool is also used for the analysis of the dataset [15].
V. EVALUATION METRICS
There are four evaluation metrics in this proposed framework. The detail of each parameter is
given in Table 1.
TABLE 2: PERFORMENCE PARAMETRS
Parameter Definition Mathematical Expression
Figure 54:Structure of CNN

3rd Pak-Turk International Conference on Emerging Technologies in the field of Sciences and
Engineering 14-16, April 2020
67
Accuracy Accuracy is a metric in
which the number of
predictions our model got
right over the total number of
predictions in a dataset.
Acc = TP + TN
TP + FN + FP + FN
Precision
Precision is the measure of
classifier exactness. Percision =
TP
TP + FP
Recall
The recall is the measure of
classifier completeness. Recall =
TP
TP + FN
F1-score
F1-score is defined as the
weighted average of
precision and recall.
F1 − score = 2 ∗Precision ∗ Recall
Precision + Recall
VI. RESULTS
Different experiments are conducted to find out better results in application classification
using CNN. For the data mining perspective, the network application classification is the
multiclass problem. Four evaluation metrics are calculated, to find out the performance
of the proposed method. The accuracy is calculated on the test data.
TABLE 3:AVERAGE RESULTS USING CNN
From
TABLE 3, it is observed that the average accuracy of 99.10% is achieved using the CNN model.
Similarly, other
parameters precision,
recall of and f1-score are
obtained using a CNN.
Classifier Accuracy Precision Recall F1-score
CNN 99.10% 99.07% 99.10% 99.09%
Classifier Accuracy Precision Recall F1-score
CNN 99.10% 99.07% 99.10% 99.09%
Class Accuracy Precision Recall F1-Score
WWW 99.87% 99.24% 99.87% 99.56%
P2P 78.94% 91.84% 78.95% 84.91%
MAIL 81.00% 76.42% 81.00% 78.64%

3rd Pak-Turk International Conference on Emerging Technologies in the field of Sciences and
Engineering 14-16, April 2020
68
TABLE
4:RESULTS OBTAINED FOR EACH CLASS
In
TABLE 4, evaluation metrics for each class is given. From
TABLE 4, it can be
observed that the
accuracy of the
‘WWW’ class is
high due to the
majority of the samples
in the dataset and
the accuracy of
’MULTIMEDIA’ is low due to minority numbers of the samples in the dataset. As a network
application problem is a multi-class problem so there are multiple output classes and four
evaluation metrics are calculated to evaluate the performance of the proposed framework.
INTERACTIVE 100.0% 97.22% 100.0% 98.59%
BULK 100.0% 100.0% 100.0% 100.0%
SERVICES 91.80% 94.92% 91.80% 93.33%
DATABASE 98.12% 98.73% 98.13% 98.43%
VOIP 55.20% 61.63% 55.21% 58.24%
ATTACK 79.91% 86.06% 79.91% 82.87%
Class Accuracy Precision Recall F1-Score
WWW 99.87% 99.24% 99.87% 99.56%
P2P 78.94% 91.84% 78.95% 84.91%
MAIL 81.00% 76.42% 81.00% 78.64%
INTERACTIVE 100.0% 97.22% 100.0% 98.59%
BULK 100.0% 100.0% 100.0% 100.0%
SERVICES 91.80% 94.92% 91.80% 93.33%
DATABASE 98.12% 98.73% 98.13% 98.43%
VOIP 55.20% 61.63% 55.21% 58.24%
ATTACK 79.91% 86.06% 79.91% 82.87%

3rd Pak-Turk International Conference on Emerging Technologies in the field of Sciences and
Engineering 14-16, April 2020
69
In Figure 4, evaluations metrics for different classes are shown. The accuracy class ‘WWW’ is
high due to majority number of samples and class ‘VOIP’ is low due to minority number of
samples.
VII. CONCLUSION AND FUTURE WORK
In this research paper, we introduced a framework for application classification. In this
methodology features are selected through chi-square test. The CNN comprised of multiple
layers and it has better classification accuracy. To check the performance of this proposed
methodology, four evaluation metrics calculated. These experimental results indicate that, our
proposed method achieved better accuracy than the existing technique.
In this research, we discussed the first application of CNN for the network traffic classification
in SDN. Although we designed and validate our algorithm on Moore dataset based on SDN
architecture and in the future, we planned to implement in real-time SDN environment.
REFERENCES
[1] F. Pacheco, E. Exposito, M. Gineste, C. Baudoin, and J. Aguilar, “Towards the deployment of Machine
Learning solutions in network traffic classification: A systematic survey,” IEEE Commun. Surv. Tutorials,
2018.
[2] K. Zeilenga, “Internet Assigned Numbers Authority (IANA) Considerations for the Lightweight Directory
Access Protocol (LDAP),” 2002.
[3] A. W. Moore and K. Papagiannaki, “Toward the accurate identification of network applications,” in
International Workshop on Passive and Active Network Measurement, 2005, pp. 41–54.
[4] B. A. A. Nunes, M. Mendonca, X.-N. Nguyen, K. Obraczka, and T. Turletti, “A survey of software-
defined networking: Past, present, and future of programmable networks,” IEEE Commun. Surv.
Tutorials, vol. 16, no. 3, pp. 1617–1634, 2014.
[5] N. McKeown et al., “OpenFlow: enabling innovation in campus networks,” ACM SIGCOMM Comput.
Commun. Rev., vol. 38, no. 2, pp. 69–74, 2008.
[6] F. Hu, Q. Hao, and K. Bao, “A survey on software-defined network and openflow: From concept to
Figure 55: Evaluation Metrics for Different Classes

3rd Pak-Turk International Conference on Emerging Technologies in the field of Sciences and
Engineering 14-16, April 2020
70
implementation,” IEEE Commun. Surv. Tutorials, vol. 16, no. 4, pp. 2181–2206, 2014.
[7] M. Lopez-Martin, B. Carro, A. Sanchez-Esguevillas, and J. Lloret, “Network traffic classifier with
convolutional and recurrent neural networks for Internet of Things,” IEEE Access, vol. 5, pp. 18042–
18050, 2017.
[8] C. Zhang, X. Wang, F. Li, Q. He, and M. Huang, “Deep learning–based network application classification
for SDN,” Trans. Emerg. Telecommun. Technol., vol. 29, no. 5, p. e3302, 2018.
[9] G. Sun, L. Liang, T. Chen, F. Xiao, and F. Lang, “Network traffic classification based on transfer
learning,” Comput. Electr. Eng., vol. 69, pp. 920–927, 2018.
[10] F. Ertam and E. Avcı, “A new approach for internet traffic classification: GA-WK-ELM,” Measurement,
vol. 95, pp. 135–142, 2017.
[11] H. Shi, H. Li, D. Zhang, C. Cheng, and X. Cao, “An efficient feature generation approach based on deep
learning and feature selection techniques for traffic classification,” Comput. Networks, 2018, doi:
10.1016/j.comnet.2018.01.007.
[12] A. Moore, D. Zuev, and M. Crogan, “Discriminators for use in flow-based classification,” 2013.
[13] W. Li, M. Canini, A. W. Moore, and R. Bolla, “Efficient application identification and the temporal and
spatial stability of classification schema,” Comput. Networks, vol. 53, no. 6, pp. 790–809, 2009.
[14] N. Srivastava, G. Hinton, A. Krizhevsky, I. Sutskever, and R. Salakhutdinov, “Dropout: a simple way to
prevent neural networks from overfitting,” J. Mach. Learn. Res., vol. 15, no. 1, pp. 1929–1958, 2014.
[15] M. Hall, E. Frank, G. Holmes, B. Pfahringer, P. Reutemann, and I. H. Witten, “The weka data mining
software: An update, software available at http://www. cs. waikato. ac. nz/ml/weka,” SIGKDD Explor.,
vol. 11, no. 1, 2009.

3rd Pak-Turk International Conference on Emerging Technologies in the field of Sciences and Engineering
9-10th , June 2020
71
Fabrication and characterization of methylene blue based sensors
Asad Ullah Khan1,a and Muhammad Tahir2,b 1Faculty of Engineering Sciences, Ghulam Ishaq Khan Institute of Engineering Sciences and Technology,
Topi 23640, Pakistan 2Department of Physics, Abdul Wali Khan University, Mardan 23200, Pakistan
Email address: a) [email protected] and b) [email protected]
Abstract— Methylene blue (MB), a small organic molecule, was used as an active layer to fabricate temperature and
humidity sensors. For measuring the sensing properties of the fabricated devices, their capacitance was measured as a
function of temperature and humidity. The response and recover times were measured. The morphology and ultraviolet
(UV-vis) studies of the MB thin film were also carried out.
Keywords—Methylene Blue, humidity sensor, temperature sensor.
I. INTRODUCTION
Today’s research in the fabrication of sensors have wide range of applications for different purposes [1]. Several sensors
have been assembled using organic and inorganic molecules, ceramics or other materials for the measurement of light, pressure,
humidity and temperature [2, 3]. Temperature and humidity sensors have great importance in our daily life which comprises goods,
fresh foods, storage of medicine, environment and safety purposes for industrial and laboratory research. Inorganic material sensors
are complex and expensive, due to which the inorganics are replaced by the organic materials which are low cost, reliable and have
long-term stability [4]. Pure organic semiconductor have been studied for the sensing purpose of humidity and temperature. In order
to increase the sensitivity, the organic semiconductor methylene blue is used for fabrication.
Methylene blue (MB) is a dark green crystalline powder with semiconducting properties. Here methylene blue is selected for the
artifacting of multifunctional sensor due to its conjoined arrangement, reliability, indelible stability, low-priced and is easily soluble in
water. The moderate boiling point ~1100C of methylene blue (MB) makes the sensor useful for different temperatures due to high
sensitivity.
In this work an organic multiuse sensor have been formulated and inspected for the application of humidity and temperature sensing.
The Ag/MB/Ag sensor has been checked for the sensing properties suchlike humidity and temperature to give fast recovery and
response. To study improvement in quality of sensor, another Au/MB/Au sensor was formulated and examined with contrast to the
Ag/MB/Ag. The observation of both sensors proved superior temperature sensitivity of Ag/MB/Ag than Au/MB/Au sensor. The
sensitivity of sensor also depends upon the applied frequency, that’s why sensitivity has been calculated at two particular frequencies
of 120 Hz and 1 KHz.
II. EXPERIMENTAL WORK
The organic small molecule methylene blue (MB) was acquired from the market. Structural formula of MB is displayed in
Fig. 1. Its molecular mass is 319.851 g/mol and molecular formula is C6H18N3CIS, respectively. In this work, the active layer of MB
material have been used for the formulation of Ag/MB/Ag and Au/MB/Au multifunctional sensors. For formulation of device 100nm
thin Ag and Au electrodes have been deposited on the glass substrates in such a way that 50µm inter-electrode gap was maintained by
masking the sample. The Ag and Au electrodes were deposited on the glass substrates through thermal evaporator. The evaporator
model used was EDWARDS AUTO 306. Pressure maintained in vacuum chamber was approximately 10-5 mbar, while rate of
deposition on substrate was ~0.1 nm/s, respectively. The thickness of electrode film was measured through IN SITU FTM5 monitor
connected with vacuum chamber. A 16 wt. % solution of MB has been prepared in de-ionized water at room temperature using magnetic
stirrer for two hours. The solution were then spin-coated at 1000 rpm for 20 sec separately on two Ag and Au electrodes deposited
substrates, in such a way that inter-electrodes gap was concealed by solution. Spin coated thin film were annealed for two hours using
hot plate. Schematic layouts for formulated devices are displayed in Fig. 2 (a) and 2 (b). The UV-Visible spectroscopy of MB solution
were performed using LAMBDA 35 UV/Vis-spectrometer, Perkin Elmer Instruments. Temperature-capacitance (T-C) and relative
humidity-capacitance measurements were made using self-made temperature and humidity setup.

3rd Pak-Turk International Conference on Emerging Technologies in the field of Sciences and Engineering
9-10th , June 2020
72
Fig. 1. Molecular formula of MB.
(a) Ag/MB/Ag (b) Au/MB/Au
Fig. 2. Cross-sectional view of surface-type formulated sensors.
III. RESULT AND DISCUSSION
The morphology of sensitive thin film have great effect on the behavior of sensor [5]. The surface of MB thin film has been
investigated by AFM as shown in Fig. 3. The sensing properties of MB thin film are linked with the topographical parameters such as
grain size, grain boundaries, shape and orientation/distribution of grains throughout the film. The microstructure shown reveal that
surface of MB is dispersed due to which the film can adsorb more water and exhibit high accurate sensitivity.
Fig. 3. AFM image of MB. Fig. 4 (a). UV-Vis graph of MB. Fig. 4 (b).
Band gap of MB.
The measured UV-vis graph of MB solution is shown in Fig. 4 (a). The intensity peaks shows the absorption of light having specific
wavelength. The graph show peaks in ultraviolet region at 298 nm as well as in visible region at 613 nm and 655 nm. The spectrum
also confirms the broad wavelength absorption of MB covering some UV region and large visible region approximately 500-700 nm.
This feature indicates the potential use of MB for photovoltaic applications. Similarly, Fig. 4 (b) shows relation between (αE)2 and Eg
. According to the Tauc’s equation, αE= (Eg-E)m, where m is the number indicating direct or indirect bandgap semiconductor. In this
case, MB is an indirect bandgap material therefore m=1/2. In the figure, different peaks can be observed and the slope of each peak
intersection on horizontal axis (Eg) is actually giving the value of the bandgaps. Here the values of bandgaps are measured to be 1.7
and 4.1 eV.
MB
Ag Ag
Glass substrate
MB
Au Au
Glass substrate
200 300 400 500 600 700 800
0.0
0.2
0.4
0.6
0.8
1.0
Inte
ns
ity
Wavelength (nm)
1 2 3 4 5 6 7
0.00E+000
1.00E+014
2.00E+014
3.00E+014
4.00E+014
5.00E+014
(Alp
ha
*E)^
2
E (ev)

3rd Pak-Turk International Conference on Emerging Technologies in the field of Sciences and Engineering
9-10th , June 2020
73
Figs. 5 (a) and 5 (b) show the change of capacitance with change in temperature (oC). Variation in capacitance with change in
temperature was carried out by placing the sensor over hot iron while the temperature was measured by thermocouple. C-T
characteristics of Ag/MB/Ag at 120 Hz and 1 kHz are shown in Fig. 5 (a). C-T characteristics of Au/MB/Au sensors at 120 Hz and 1
kHz are displayed in Fig. 5 (b). The capacitance at 1 kHz and 120 Hz were measured in pF and nF, respectively, as shown in Fig. 8.
When the temperature was raised from 30 to 70 0C, the capacitance of Ag/MB/Ag increased from 66.3 to 67.6 pF at 1 kHz and at 120
Hz the capacitance raised from 0.069 to 0.075 nF. Furthermore, when the capacitance of Au/MB/Au increased from 67.8 to 71.9 pF at
1 kHz by increasing the temperature from 32 to 71 oC and at 120 Hz the capacitance increased from 0.073 to 0.088 nF. The raise in
capacitance with respect to temperature is by reason of raising charge carriers energy [6].
(a) T-C characteristics of Ag/MB/Ag. (b) T-C characteristics of Au/MB/Au.
Fig. 5. T-C characteristics at 1 kHz and 120 Hz.
(a) RH-C at 1 kHz. (b) RH-C at 120 Hz.
Fig. 6. Humidity-capacitance characteristics of Ag/MB/Ag.
The changing of capacitance (C) as a function of relative humidity (RH %) is shown in Fig. 6 (a) at 1 kHz and in Fig. 6 (b)
at 120 Hz, respectively of the Ag/MB/Ag at room temperature. In figure, raising in capacitance is shown with increase in RH % level,
as well as reducing of capacitance with decrease in RH %. The increase is because of water molecules adsorbed by active thin layer of
MB due to which the dielectric constant of thin layer increases. The capacitance and dielectric constant have direct relation with each
other, the greater the dielectric constant of material, higher will be capacitance and conversely materials having low dielectric constant
have low capacitance [7]. As capacitance depends upon applied frequency, hence capacitance-RH % characteristic of Ag/MB/Ag
sensor has been investigated at two particular frequencies of 1 kHz and 120 Hz. The high sensitivity of sensor occurs at low frequency
i.e. 120 Hz. While for higher frequency, sensitivity is low because of polarization of adsorb water which show little change in dielectric
constant [8]. Molecules of water are polar and by applying electric field its dipole moment increases. The dipole moment is given by:
(Increasing)
(Decreasing)
(Decreasing)
(Increasing)
freq=1 kHz
0 20 40 60 80 100
64
66
68
70
72
74
Ca
pa
cit
an
ce
(p
F)
Humidity (%)
0 20 40 60 80 100
0.07
0.08
0.09
0.10
0.11
Ca
pa
cit
an
ce
(n
F)
Humidity (%)
freq=120 Hz
30 40 50 60 70
66.2
66.4
66.6
66.8
67.0
67.2
67.4
67.6
67.8
freq=1 kHz
freq=120 Hz
Temperature (C)
Ca
pa
cit
an
ce
(p
F)
0.069
0.070
0.071
0.072
0.073
0.074
0.075
Ca
pa
cit
an
ce
(n
F)
30 40 50 60 70
67
68
69
70
71
72
freq=1 kHz
freq=120 Hz
Temperature (C)
Ca
pa
cit
an
ce
(p
F)
0.072
0.074
0.076
0.078
0.080
0.082
0.084
0.086
0.088
0.090
Ca
pa
cit
an
ce
(n
F)

3rd Pak-Turk International Conference on Emerging Technologies in the field of Sciences and Engineering
9-10th , June 2020
74
P=αE (1)
Where E represent electric field applied to electrodes and α is polarizability of the material, its value is 6.1x10⁻³⁰ Cm for water [9]. The
schematic device in Fig. 2 (a) shows Ag electrodes, which act as parallel plates of capacitor and MB act as dielectric constant. Relation
between the capacitance and dielectric constant can be expressed as,
𝐶𝑠
𝐶0= (
𝜀𝑤
𝜀𝑑)𝑛
(2)
Where Cs represent capacitance of semiconductor, Co is initiative capacitance. 휀𝑑 and 휀𝑤 are material permittivities in dry and wet air,
where n indicates morphology of material’s dielectric. The water’s relative permittivity is much greater than organic semiconductor
materials [10]. By increasing humidity level adsorption of water molecules increase on surface of thin film increases which results in
high sensitivity of the sensors.
Figs. 6 (a) and 6 (b) reveal that humidity sensor prepared by Ag electrodes display high sensitivity at 1 kHz as compared to 120 Hz,
but the high accuracy is at 120 Hz as compared to 1 kHz. The capacitance rapidly increases with increase in RH %. At 1 kHz the
capacitance changes from 64 pF to 74.2 pF by increasing the RH from 2 to 81 %, while by decreasing RH from 81 to 2 %, the
capacitance decreases from 74.2 pF to 66.1 pF. At 120 Hz the capacitance changes from 0.07 nF to 0.11 nF by increasing RH from 40
to 81 %, and follow relatively same path at decreasing RH from 81 to 40 %, which show the high accurate sensitivity of the sensor at
120 Hz.
(a) Time-capacitance at 1 kHz (b) Time-capacitance at 120 Hz
Fig. 7. Response and recovery time measurement of Ag/MB/Ag.
The response and recovery of the fabricated sensor is measured at 1 kHz and 120 Hz having silver electrodes at room temperature. The
relationship is shown in Figs. 7 (a) and 7 (b). The sensor give response by increasing capacitance from 66 pF to 71.2 pF in 12 sec by
immediately transfer from low humidity to high humidity chamber, which results in a decrease of the capacitance due to desorption of
water from thin MB deposited film [11]. Similarly, the recovery of sensor is shown by decreasing of capacitance from 71.2 pF to 66
pF in 15 sec by immediately transfer from high humidity to low humidity chamber at 1 kHz, respectively. The same cycle was repeated
again as shown in Fig. 7 (a). As the MB have rough surface, by increasing humidity the surface absorb water due to which the
capacitance increases. Similarly by decreasing the humidity through passing dry nitrogen gas, the gas will absorb water from the surface
of MB, and the surface becomes dry due to which the capacitance decreases.
Similarly, at 120 Hz the sensor gives response by increasing capacitance from 0.073 nF to 0.101 nF in 11 s by immediately transfer
from low humidity to high humidity chamber. The recovery is shown by decreasing of capacitance from 0.099 nF to 0.072 nF in 11 s
by immediately transfer from high humidity to low humidity chamber respectively. At 120 Hz, the response and recovery gives same
time which shows the accurate sensitivity of sensor at 120 Hz. The same cycle is repeated again as shown in Fig. 7 (b).
IV. CONCLUSION
The fabricated sensors based on MB Au/MB/Au and Ag/MB/Ag have been studied for their temperature and humidity
sensing properties. It was established that both of the devices exhibited sensitivity to humidity and temperature within a range of 35-
85 RH% and 30-70 0C, respectively. Due to interfacial states at the junction between MB and metal contacts, the response of the devices
is non-linear to humidity and temperature. The key parameters of the sensor such as response/recovery times and repeatability of the
results have been studied which showed minor deviations. The humidity response and recovery time were measured to 12 s and 15 s,
respectively. The bandgap of MB was 1.7 and 4.1 eV which suggests its potential applications in the field of organic semiconductor
devices.
REFERENCES 1. Tahir, M., et al., Perylene diimide: Synthesis, fabrication and temperature dependent electrical characterization of
heterojunction with p-silicon. Physica B: Condensed Matter, 2013. 426: p. 6-12.
2. Sayyad, M., et al., Fabrication and study of NiPc thin film based surface type photocapacitors. J. Optoelectron. Adv. Mater,
2008. 10: p. 2805-2810.
0 10 20 30 40 50 60
66
67
68
69
70
71
72
Ca
pa
cit
an
ce
(p
F)
Time (s)
freq=1 kHz
0 10 20 30 40 50
0.070
0.075
0.080
0.085
0.090
0.095
0.100
0.105
Ca
pa
cit
an
ce
(n
F)
Time (s)
freq=120 Hz

3rd Pak-Turk International Conference on Emerging Technologies in the field of Sciences and Engineering
9-10th , June 2020
75
3. Su, P.-G. and C.-L. Uen, A resistive-type humidity sensor using composite films prepared from poly (2-acrylamido-2-
methylpropane sulfonate) and dispersed organic silicon sol. Talanta, 2005. 66(5): p. 1247-1253.
4. Su, P.-G. and C.-P. Wang, Flexible humidity sensor based on TiO2 nanoparticles-polypyrrole-poly-[3-(methacrylamino)
propyl] trimethyl ammonium chloride composite materials. Sensors and Actuators B: Chemical, 2008. 129(2): p. 538-543.
5. Tahir, M., et al., Enhancement in the sensing properties of methyl orange thin film by TiO 2 nanoparticles. International
Journal of Modern Physics B, 2014. 28(05): p. 1450032.
6. Janssens, S., et al., Separation of intra-and intergranular magnetotransport properties in nanocrystalline diamond films on
the metallic side of the metal–insulator transition. New Journal of Physics, 2011. 13(8): p. 083008.
7. Ahmad, Z., et al., Humidity-dependent characteristics of methyl-red thin film-based Ag/methyl-red/Ag surface-type cell.
Physica E: Low-dimensional Systems and Nanostructures, 2008. 41(1): p. 18-22.
8. Bondarenka, V., et al., Thin films of poly-vanadium-molybdenum acid as starting materials for humidity sensors. Sensors
and Actuators B: Chemical, 1995. 28(3): p. 227-231.
9. Griffiths, D.J., Introduction to electrodynamics. 2005, American Association of Physics Teachers.
10. Saleem, M., et al., Cu (II) 5, 10, 15, 20-tetrakis (4′-isopropylphenyl) porphyrin based surface-type resistive–capacitive
multifunctional sensor. Sensors and Actuators B: Chemical, 2009. 137(2): p. 442-446.
11. Steele, J., M. Taschuk, and M. Brett, Response time of nanostructured relative humidity sensors. Sensors and Actuators B:
Chemical, 2009. 140(2): p. 610-615.

3rd Pak-Turk International Conference on Emerging Technologies in the field of Sciences and Engineering
9-10th , June 2020
76
Effect of Fines on the Engineering Properties of
Lawrencepur Sand
Hammad Haider1,a and Naveed Ahmad2,b 1MSc Student, Civil Engineering Department, University of Engineering and Technology, Taxila, Pakistan
2Assitant Professor, Civil Engineering Department, University of Engineering and Technology, Taxila,
Pakistan
Email address: a) [email protected] and b) [email protected]
Abstract—A lot of work has been done to study the effect of different parameters on the engineering properties
of clean sand and a clear understanding exists about role of these parameters. Keeping in view the presence of
fines with sands at construction sites, some researchers have studied the effect of fines on engineering properties
of their local sands and have obtained different trends with different optimum percentages. In this study,
Lawrencepur sand is used and effect of fines having same mineral composition is studied. From the results, it is
found that fines increase cohesion, decrease internal friction angle, whereas a transition has been observed in dry
density and optimum moisture content values.
Keywords—Lawrencepur sand, cohesion, angle of internal friction, optimum moisture content
I. Introduction
The response of clean sand has been studied extensively in the past. Researchers have studied
effect of particle shape, size, density, mineralogy etc on behavior of clean sands. With the
particle angularity, there is increase of angle of internal friction, whereas with increasing
effective size, there is reduction in internal friction angle [1]. There is increase in peak friction
and dilatancy angle as the angularity and particle surface roughness increase [2]. With rising
particle regularity the soil appears to be more prone to liquefaction [3]. Data reveals that
increasing irregularity of particle results in fading of stiffness and an uprising trend in the
frictional stage critical angle [4]. As there is decrease in specimen density and increase in mean
stress, peak state friction angle (φp), CS friction angle (φcs), and dilatancy angle (ψ) decrease [5].
As it is quite rare to have clean sand at our construction sites, there was a need to study the
behavior of sand silt mixtures. Researchers studied effect of both silt and clay on friction angle
of sand and observed a decrease in phi in both the cases, whereas cohesion was increased [6].
With the increase of fines, internal friction angle reduced and cohesion increased [7]. With the
decrease of the fine aggregates, the cohesion reduced and internal friction angle raised [8]. The
behavior of a silty sand cannot be predicted accurately, based purely on its silt content, but we
need to compare that content of silt with the limiting silt content of the base sand [9]. The fines

3rd Pak-Turk International Conference on Emerging Technologies in the field of Sciences and Engineering
9-10th , June 2020
77
between sand to sand contacts increase the soil resistance to shearing [10]. At 30% fines, the emin
and emax obtain minimum values in sand fine mixtures [11]. At 18% fines, the emin and emax
obtain minimum values in sand fine mixtures [7]. With the rise of fines, first Maximum Dry
Density (MDD) rises then reduces, whereas Optimum Moisture Content (OMC) reduces then
rises [12].
II. Materials and Method
A. Material used
In this study, locally available sand collected from Lawrencepur, Attock was used. To get a true
representation of the sand available in the region, disturbed samples were obtained from various
locations and were mixed thoroughly. The material has coefficient of uniformity (Cu) 2.89 and
coefficient of curvature (Cc) 1.11. The sieve analysis is shown in Fig. 1.
To avoid the effect of mineral composition, fines were prepared by grinding the same sand in
Los Angeles Abrasion machine. Samples with different percentage of fines content were
prepared and tested in Soil Mechanics and Foundation Engineering laboratory in UET Taxila,
Pakistan.
B. Sample Preparation Method for Direct Shear Test
All experiments were carried out in accordance with the ASTM standards. For direct shear test,
samples were prepared keeping constant density for all the percentages of fines. Sample height
was 20 mm and cross-sectional area was 36 cm2 (each side is 6 cm). Axial strain at 1.5 mm/min
rate was used in all the tests using ELE strain-controlled machine.
III. Test Results and Discussion
Modified compaction tests were performed for all percentages of fines and variation of optimum
moisture content and maximum dry density with fines is shown in Fig. 2 and Fig. 3, respectively.
It has been observed that initially optimum moisture content reduces with rise in fines content,
obtaining minimum value around 20% fines followed by a rise in value with further rise in fine
content. Contrary to this, a rise in the value of maximum dry density was observed initially,
reaching a peak value around 20% fines content and decreasing thereafter.
The effect of fines on minimum (emin) and maximum (emax) void ratio is shown in Fig. 4. It has
been observed that emin and emax initially decrease with fine content, achieving a minimum value
near 20% fines followed by rise in void ratio with further rise in fine content. Literature shows a
similar behavior as reported by previous researchers using their local sands but optimum
percentage of fines was found different by different researchers.
Fig. 5 shows effect of fines content on cohesion of sand-silt matrix and it has been observed that
cohesion keeps increasing with fines content. Although, rate of increase of cohesion was greater
for initial percentage of fines content and was reduced for higher percentages.
Effect of fines content on angle of internal friction is shown in Fig. 6. Initially, an increase in
friction angle value was observed up to 10% as in this range the fines are used to fill up the voids

3rd Pak-Turk International Conference on Emerging Technologies in the field of Sciences and Engineering
9-10th , June 2020
78
between clean sand particles, increasing resistance to sliding. As the percentage of fines
increases further, fines start to reduce particle
to particle contact between sand particles, thus reducing the friction angle values.
0.00
10.00
20.00
30.00
40.00
50.00
60.00
70.00
80.00
90.00
100.00
0.001 0.01 0.1 1 10 100 1000
%a
ge
Pa
ssin
g
Seive Diameter (mm)
7
8
9
10
11
12
13
14
0 10 20 30 40 50
Op
tim
um
Mo
istu
re C
on
ten
t (%
)
Fines (%)
19
19.5
20
20.5
21
0 20 40 60Max
imu
m D
ry D
en
sity
(kN
/m3
)
Fines (%)
0.000
0.400
0.800
1.200
1.600
0 10 20 30 40 50
Vo
id R
atio
s
%age of Fines
e max
Fig. 2 Optimum Moisture Content vs Fines Fig. 1 Particle Size Distribution Curve
Fig. 3 Maximum Dry Density vs Fines Fig. 4 Void vs Fines

3rd Pak-Turk International Conference on Emerging Technologies in the field of Sciences and Engineering
9-10th , June 2020
79
IV. Conclusions
▪ As percentage of fines increase, optimum moisture content (OMC) reduces upto 20% of fines
and then rises.
▪ As percentage of fines increase, maximum dry density (MDD) rises upto 20% of fines and
then reduces.
▪ Maximum and minimum void ratio values reduce upto 20-30% of fines and then increase
again.
▪ As percentage of fines increase, a slight increment in the Cohesion value has been observed
that might be due to apparent cohesion. And rise in the internal friction angle was observed
upto 10-20% fine content, followed by a constant decrease in its value.
V. References
[1] Koerner, Robert M. "The behavior of cohesionless soils formed from various minerals." (1968).
[2] Alshibli, Khalid A., Maha F. Jarrar, Andrew M. Druckrey, and Riyadh I. Al-Raoush. "Influence of
particle morphology on 3D kinematic behavior and strain localization of sheared sand." Journal of
Geotechnical and Geoenvironmental Engineering 143, no. 2 (2017): 04016097.
[3] Yang, J., and X. D. Luo. "Exploring the relationship between critical state and particle shape for
granular materials." Journal of the Mechanics and Physics of Solids 84 (2015): 196-213.
[4] Cho, Gye-Chun, Jake Dodds, and J. Carlos Santamarina. "Particle shape effects on packing
density, stiffness, and strength: natural and crushed sands." Journal of geotechnical and
geoenvironmental engineering 132, no. 5 (2006): 591-602.
0
10
20
30
40
0 10 20 30 40 50 60 70 80 90 100
An
gle
of
inte
rnal
fri
ctio
n
(deg
ree)
%age of Fines
0
10
20
0 50 100
Co
hes
ion
(kP
a)
%age of Fines
Fig. 5 Cohesion vs Fines Fig. 6 Angle of Internal Friction vs Fines

3rd Pak-Turk International Conference on Emerging Technologies in the field of Sciences and Engineering
9-10th , June 2020
80
[5] Alshibli, Khalid A., and Mehmet B. Cil. "Influence of particle morphology on the friction and
dilatancy of sand." Journal of Geotechnical and Geoenvironmental Engineering 144, no. 3 (2018):
04017118.
[6] Thian, S. Y., and C. Y. Lee. "Undrained response of mining sand with fines contents." International
Journal of Civil & Structural Engineering 1, no. 4 (2011): 844-851.
[7] Phan, Vu To-Anh, Darn-Horng Hsiao, and Phuong Thuc-Lan Nguyen. "Effects of fines contents on
engineering properties of sand-fines mixtures." Procedia engineering 142 (2016): 213-220.
[8] Kim, Daehyeon, Myung Sagong, and Yonghee Lee. "Effects of fine aggregate content on the
mechanical properties of the compacted decomposed granitic soils." Construction and Building
Materials 19, no. 3 (2005): 189-196.
[9] Polito, Carmine P., and James R. Martin II. "Effects of nonplastic fines on the liquefaction
resistance of sands." Journal of Geotechnical and Geoenvironmental Engineering 127, no. 5 (2001):
408-415.
[10] Shen, C.K., Vrymoed J.L. and Uyeno C.K. (1977) “The effect of fines on liquefaction of sands,”
Proceedings of the 9th International Conference on Soil Mechanics and Foundation Engineering,
Tokyo, 2, pp. 180 – 189.
[11] Belkhatir, Mostefa, Tom Schanz, and Ahmed Arab. "Effect of fines content and void ratio on
the saturated hydraulic conductivity and undrained shear strength of sand–silt
mixtures." Environmental earth sciences 70, no. 6 (2013): 2469-2479.
[12] Fatima, Zainab & Mukahveena, Sreedhar. (2017). Influence of Plastic Fines on Compaction and
CBR Characteristics of Soil Mixtures. International Journal of Engineering Research and. V6.
10.17577/IJERTV6IS070131.

3rd Pak-Turk International Conference on Emerging Technologies in the field of Sciences and Engineering
9-10th , June 2020
81
Impact of Collar and Roughness on Bridge
Pier Scouring
Sabir Hussain1,a, Usman Ghani2,b and Mujahid Iqbal3,c 1University of Engineering and Technology Taxila,
Civil Engineering Department 2 University of Engineering and Technology Taxila,
Civil Engineering Department 3 University of Engineering and Technology Taxila,
Civil Engineering Department
Email address: a) [email protected], b) [email protected]
and c) [email protected]
Abstract— Local scouring is one of the main causes of bridge failure across the world. Bridge failure causes
interruption of social interaction, economical loss in the form of repairing and in severe case the loss of lives. In this
research work oblong shape collar having width 2.5 times the diameter of pier and gravels roughness with size;
d50=6.32mm are used as a countermeasure on plain circular shape pier. Both the collar and pier roughness were
tested on the circular shape pier at different flow rate and corresponding scouring was measured by using point
gauge. All the experiments were carried out in a laboratory flume having width, length and depth is 0.96m, 20m
and 0.75m respectively. The results exhibited that 55.10% scouring is reduced with the presence of oblong shape
collar on pier and 22.40% scouring is reduced with pier roughness. It is concluded that pier with collar was found to
be effective scouring reducer as compared to pier with roughness.
Keywords—component, bridge pier, local scour, collar, roughness, countermeasure.
I. INTRODUCTION
Local scouring, around the bridge piers, is a significant and crucial process that leads towards bridge
failure. In this regard, it becomes essential to predict the local scouring, around the bridge piers, in an
accurate and precise way. Otherwise, the local scouring will result in collapsing the whole bridge structure
leaving a serious death toll and injuries as its aftermath [1]. The local scouring problem have been studied
by many hydraulic researchers under different flow conditions. Based on the research carried out, several
methods have been introduced and implemented to counter local scouring, around the bridge piers [2].
Countermeasure techniques around the bridge pier for the local scouring are classified into two
categories: armoring and flow altering techniques. There are multiple armoring techniques like riprap
stones around the bridge pier, reno mattresses, cable tied blocks, gabions, tetrapod’s, dolos, and concrete
mats or bags. The flow altering technique includes sills, sacrificial piles, slots, low vanes, ring column [3].
The local scouring around the bridge pier can be reduced by using the collars and geobags. The collars and
geo- bags are efficient for reducing the scouring around the bridge piers when experimentally studied.
When the experimental data of collars and geobags were compared with the data on simple bridge pier,

3rd Pak-Turk International Conference on Emerging Technologies in the field of Sciences and Engineering
9-10th , June 2020
82
the results showed that percentage of scour reduction is more by using the combination of collar and the
geobags then the simple pier. Moreover, the efficiency of collars is better than the geobags when both are
used independently [4]. The experimental work was conducted to achieve different optimum techniques
like slot and both the slot and sill. The experimental work was performed on the circular pier to check the
local scouring. The local scouring was reduced by the using of slot and the combination of sill and slot. It
was concluded from the results that the maximum local scour depth reduced by the slot was up to 30%.
On the other hand, when combined countermeasure technique opted — slot and bed sill — the maximum
scour reduction in front of pier was up to 45%. From the experimental results, it can be stated that the
combination of slot and bed sill is more efficient and effective in order to diminish the local scouring,
around the bridge piers [5]. Several researchers are, currently, working to belittle the local scouring,
around the bridge pairs. Experimental work performed to minimize the local scour on a bridge pier by
countermeasure technique such as sacrificial pile and the sacrificial piles with perforation in this research.
The holes with different orientation in perforated piles were tested, a sacrificial and the sacrificial
perforated pile were positioned at the upstream. The results concluded from the experiments were that
scour depth can be reduced up to 89%, when the combination of the pile with 45°-hole angle and the
sacrificial perforated pile with the 45°- hole angle and the diameter of hole equals to 0.43 times diameter
of pile. This research study may be used for the protection of bridge pier from the effect of scouring [6].
The local scour around the bridge pier was controlled by using the rectangular shape of the collars.
Experimental work conducted on the rectangular shape of the collar to find out the approximate collar
dimensions for the reduction of scouring around the bridge pier. Effects of the Rectangular collars with
different dimension on a circular shape pier were investigated in the flume at the upstream and
downstream side of the pier. The optimum width of the collar was estimated about 2.8 times of the pier
diameter. The scour depth reduced up to 98% at 72 h by using the collar sizes [7]. The main cause of
bridge collapse is the local scour around the bridge pier. There are many countermeasure techniques are
adopted to protect the bridge pier from scouring. Experiments were conducted on the bridge pier with
the anti-scour collar. Three parameters including height of the collar, diameter of the collar and the collar
protection range were investigated. From the results it is concluded that with the increase in collar height
the effect of protection decreases and with the increase in external collar diameter the effect of
protection increases. It is suggested that anti-scour collar is more effective and efficient to protect the
bridge pier from scouring [8]. In this study, the effect of oblong shape collar and pier roughness on the
scouring around the bridge pier is investigated and compare the results of collar and roughness effect on
the local scouring around the pier.
II. EXPERIMENTAL WORK:
A. Channel description and Preparation
Hydraulic laboratory of Civil Engineering Department at University of Engineering and Technology Taxila
was used to carried out experimental work. All experiments were performed on 0.96m wide and 20m long
rectangular channel. The side walls and bed of the channel were made up of transparent glass and concrete
foundation respectively. The bed of the channel was prepared with sand material having size d50=0.57mm
and was levelled horizontally. To avoid the unwavering water level in the test section the sand bed should
be appropriately level. An adjustable tailgate was installed at the extreme downstream of the channel to
control the water level and discharge was controlled by using flow control valve fixed at the start of the
channel. At the periphery of test section, a 15cm thick uniform and cohesion less sand material was used as

3rd Pak-Turk International Conference on Emerging Technologies in the field of Sciences and Engineering
9-10th , June 2020
83
a bed. The unit weight of sand is 26.5kN/m3, when d50 ≥ 0.6mm. The ratio of D
d50 ≥ 50 is satisfied, the impact
of the sediment roughness is avoided by this value [9][10]. The sediment particles with the standard
deviation (σg=d85/d50) was <1.3 [10][11] to reduce the sediment non-uniformity effect on scour hole.
Furthermore, to stop the ripple evolution the bed particles with the diameter was 0.57mm. (Ettema 1980;
Raudkivi and Ettema1977; Lanc ¸a, Simarro, and Fael 2015).
B. Experimental Procedure
After preparing the channel bed, a plain vertical circular shape pier was installed at the centerline of the
channel at a distance of 3.5m downstream from the entrance of channel. An adjustable tailgate was
installed at the extreme downstream of the channel to control the water level and discharge was controlled
by using flow control valve fixed at the start of the channel. After completing all necessary work, flow was
assumed to flow in the channel. The sediments start to scour around the bridge pier when the water was
allowed to flow in the test section. Scouring around bridge piers was investigated at four different flow rate
e.g. Q= 0.02304cumecs, Q= 0.0288cumecs, Q= 0.03456cumecs and Q= 0.04032cumecs and at every
discharge value, 15cm depth of water in the test section was maintained by using tailgate. The running time
of each trial was fixed for 3 hours and after this time flow was assumed to stopped. After drained out
water from channel, the resultant scouring around the bridge pier was measured by using point gauge.
After measuring scouring depth around bridge pier(shown in Fig.1, a), the bed of channel was again leveled
for next trials. Then next two case; oblong shape collar and pier roughness (shown in Fig.1, b & c) were
tested as a countermeasure at same flow conditions. The width of oblong collar was kept 2.5 times the
diameter of pier, while for the case of pier roughness, gravels with size d50=6.32mm was used as a
roughness material. Schematic diagrams of pier with different conditions is shown in figure 1. Figure 1: Schematic diagrams of pier with different conditions; (a) plain circular pier, (b) pier with oblong shape collar,
(c) pier with roughness.
III. RESULT AND DISCUSSION
A. Variation of Scour Depth with velocity:
In all cases, it is observed that by increasing the velocity of flow the depth of scour around the pier also
increases (shown in Fig.2), but this trend decreases afterward. The reason behind this decreasing trend is,
due to submergence of sediments the shear force between particles decreases and ultimately lead to

3rd Pak-Turk International Conference on Emerging Technologies in the field of Sciences and Engineering
9-10th , June 2020
84
decrease critical velocity of sediments. Due to decreasing critical velocity of sediments, the sediment from
the upstream moves towards the scour hole, that causes the reduction of the scour depth.
Figure 2: Variation of scour depth with velocity ratio (V/Vc) for plain circular pier, pier with collar and roughness with
time interval of 3h.
B. Variation of Scour Depth with Discharge:
It is also examined that by increasing the discharge, the scour depth around the pier also increases. The
figure (Fig.3) shows the trend of scouring depth with discharge for all cases: plain circular pier, pier with
oblong shape collar and pier with roughness.
Figure 3: Variation of scour depth with discharge for plain circular pier, pier with collar and roughness with time
interval of 3h.
C. Scouring comparison among plain circular pier, pier with collar and roughness
The scour comparison among plain circular pier, pier with roughness and pier with oblong collar is plotted
at maximum velocity. It is shown in figure 4.
0
1
2
3
4
5
6
0.02 0.025 0.03 0.035 0.04 0.045
Sco
ur
Dep
th (
cm)
Discharge (cumecs)
Circuler Pier Collar Roughness
0
0.1
0.2
0.3
0.4
0.5
0.6
0.7
0.8
0.9
1
0.1 0.3 0.5 0.7 0.9
ds/
D
V/Vc
Ciruler Pier Collar Roughness

3rd Pak-Turk International Conference on Emerging Technologies in the field of Sciences and Engineering
9-10th , June 2020
85
Figure 4: Comparison of scour depth versus variation in velocities for plain circular pier, pier with collar and roughness
D. Percentage Reduction comparison between pier with collar and roughness
The percentage scouring comparison is plotted between pier with oblong shape collar and pier with
roughness at maximum scouring depth. It is shown in figure 5.
Figure 5: Percentage reduction comparison between scouring depth and V/ Vc for the case of pier with collar and pier
with roughness.
IV. CONCLUSION: The current research concluded that:
1. With the increase in discharge the scour depth around the bridge pier also increases and vice versa.
2. The scour depth around the bridge pier decreases by providing the oblong collar or roughness on pier.
3. The percentage of reduction of scour for the case of pier with collar reduced up to 55.10 %, while for
the case of pier with roughness reduced up to 20.40 %.
4. The pier with collar is found to be more efficient technique to reduce the scouring as compared to
providing roughness on pier.
0
0.2
0.4
0.6
0.8
1
0.48 0.61 0.73 0.85
ds/
D
V/Vc
Circuler Pier Roughness Collar
0
10
20
30
40
50
60
0.48 0.61 0.73 0.85
% R
edu
ctio
n i
n S
cou
rin
g
V/Vc
Collar
Roughness

3rd Pak-Turk International Conference on Emerging Technologies in the field of Sciences and Engineering
9-10th , June 2020
86
V. REFERENCE: [1] Al-Shukur A-H K and Hadi Obeid Z 2016 Experimental Study of Bridge Pier Shape To Minimize Local
Scour Int. J. Civ. Eng. Technol. 7 162–71
[2] Of S E, As I, By O, Melville B W and Hadfield A C 1999 OF 1221–4
[3] TANG H W, DING B, CHIEW Y M and FANG S L 2009 Protection of bridge piers against scouring with tetrahedral frames Int. J. Sediment Res. 24 385–99
[4] Akib S, Liana Mamat N, Basser H and Jahangirzadeh A 2014 Reducing local scouring at bridge piles using collars and geobags Sci. World J. 2014
[5] Grimaldi C, Gaudio R, Calomino F and Cardoso A H 2009 Countermeasures against local scouring at bridge piers: Slot and combined system of slot and bed sill J. Hydraul. Eng. 135 425–31
[6] Elnikhely E A 2017 Minimizing scour around bridge pile using holes Ain Shams Eng. J. 8 499–506
[7] Jahangirzadeh A and Akib S 2015 Eksperimentinis tyrimas tilto tauro spraustasienės matmenims nustatyti Balt. J. Road Bridg. Eng. 10 89–96
[8] Wang S, Wei K, Shen Z and Xiang Q 2019 Experimental investigation of local scour protection for cylindrical bridge piers using anti-scour collars Water (Switzerland) 11
[9] Melville B W and Raudkivi A J 1977 Caracteristiques de l’ecoulement dans des conditions d’affouillement localisees au voisinage immediat des piles d’un pont J. Hydraul. Res. 15 373–80
[10] Taylor P, Chiew Y M and Melville B W 2010 Local scour around bridge piers Local scour around bridge piers AfTouillements locaux au pied des piles de pont B ^ 37–41
[11] Raudkivi A J 1986 Functional trends of scour at bridge piers J. Hydraul. Eng. 112 1–13

3rd Pak-Turk International Conference on Emerging Technologies in the field of Sciences and Engineering
9-10th , June 2020
87
Investigating the Permeability of coarse and
fine asphalt mixtures
M Haroon a, Imran Hafeez b,Shafeeq Ahmad c,
a Research Scholar, Civil Engineering department, UET Taxila
b Professor, Civil Engineering department, UET Taxila
c Highway research and training center ,Burhan
email a, [email protected]
Permeability in HMA has traditionally been calculated
using Darcy’s Law. More recently, the Kozeny-Carman
equation has been utilized in conjunction with the use of
X Ray CT imaging. These techniques are coupled with
the many field and lab testing devices available. For
field testing, there are five designs that have been used
in published research. They all calculate the coefficient
of permeability using Darcy’s Law. There are two
methods of calculating permeability in the lab, one using
the device developed by the Florida Department of
Transportation (FDOT), the other uses the Corelok
device. The FDOT device also uses Darcy’s Law, while
the Corelok device uses a volumetric approach to
calculated permeability. There have been recent studies
ABSTRACT-A study has been conducted to investigate the drainability of
four different types of asphalt mixtures that are used for pavement surface
layers. These mixes include SP-A, MS-2B ,NHA-A and NHA-B gradation
. One type of Bitumen are used as ARL and two types of aggregate source
are used as Margalla and Uban Shah. Four types of permeability apparatus
are used as Italian (6inch dia), European (5inch dia ), in situ-permeameter
(4 inch dia) and water pressurized permeameter ese devices work on
falling head principles. The focus is given to determine the effect of
different NMAS on permeability and permeameters cogency and viability.
The study reveals that increase in void size with random formation of
increased structural connections increase the permeability. If size of
permeability apparatus increases its permeability also increases and also if
pressure is applied its permeability increases .While NHA A is more
permeable as compared to other permeable asphalt mixes. While NHA B
mixes offered less permeability while NHA A offered more permeability ,
due to specific gradation. Study reveals that permeability is dependent on
interconnection of air voids, sample size gradation and head pressure.
Keywords
Permeability, asphalt mixes , air voids water pressurized permeameter,
1. Introduction
Permeability of Asphalt mixtures is dependent on different
parameters, Type of mix, effective porosity, direction of flow,
gradation of mix, air voids, packing of aggregates, size & shape of
aggregates. The interconnectivity of air voids affects permeability
of asphalt mixtures. The equipment used for measurement of
permeability also effects to the permeability, method of testing and
accuracy of the observations obtained from the particular
equipment.. The reason described is that as the coarser particle
contribute to large air voids and the chance of connectivity of these
voids enhances, on the other hand the finer gradation have voids of
smaller size, these voids have minimum linkages as interconnected
path become longer and squeezes the channel of movement of
moisture. Sometime moisture get entrapped into these voids and
proposes difficulties for the streamline flow of water or moisture in
the finer mixes. The equipment used in the study of permeability
have a wide range of complexion in terms of size of equipment. The
mechanism of operation and limitations during observations of
measurements.
Abdullah et al. 1998 proposed different factors that affect the
permeability of an asphalt pavement during its service life as:
segregation of the mix during placing; temperature of mix during
cessation rolling; temperature of mix during pneumatic rolling; weight
of breakdown roller; Tire or contact pressure of pneumatic roller;
ambient temperature during placing of mix; Void content of the
compacted mix & amount of traffic before winter rains.
In addition to fine mixes, Chou bane et al. (1998) also studied coarse
mixes and concluded course mixes with air voids greater than 6% are
susceptible to excessive permeability. Early work on permeability
indicated a pavement with air voids greater than 8% was susceptible to
excessive permeability. This threshold of 8% was also confirmed by
Brown et al. (1998).
Chen et al. 2004 ,The mix properties are discussed one by one for better
understanding of permeability of asphalt mixtures. Asphalt pavement are
excessively vulnerable to moisture problems in the early pavement
service life, for example stripping of binder and cracking due to increase
in pore pressure and permeation to succeeding granular base layers as
explained.
Waters, T 2004, In this study, a new term, "normalised air voids", has
been introduced, which accommodates both the voids and the size of the
particles within the mix. The permeability of asphalt has been correlated
with the normalised air voids. Asphalt has been categorised on the basis
of permeability, with categories ranging from very low permeability to
free-draining. Normalised air voids have also been found to have a
correlation with road surface texture. In asphalt design, a balance needs
to be reached between low permeability and good surface texture.
Kanitpong et al. 2005, researched permeability in fine graded mixes and
recommended the minimum density should be set at 93.8% (6.2% air
voids) to control permeability in fine graded Superpave mixes.
The phenomenon of moisture damage effects were examine by Carol et
al. 2008a and Caro et al 2008b. The common factor that determines
permeability is the amount of air voids contained in the specimen. In
asphalt pavements, air void content is reduced using compaction to
increase the density of the pavement. Therefore, the degree of
compaction (density) should be related to the permeability of the
pavement.

3rd Pak-Turk International Conference on Emerging Technologies in the field of Sciences and Engineering
9-10th , June 2020
88
on directional permeability that use X-Ray CT imaging
to develop a computer model of an HMA core sample.
A numerical fluid flow model based on the Kozeny-
Carman equation along with the X-Ray CT imaging
gives the permeability (k) for the cores/asphalt samples
used in the study. Permeability (k) measurement based
on Kozeny- Carman formulation (Kozeny 1927,
Carman 1938, 1956) equation used in different studies
is equation 1. In equation 1 we see that the k value is
linear parameter of the voids/pores present the mix.
K = (ɣ / μ) (1 / CK-C) (1 / S0 2) [e3 /
(1+e)]…...(1)
Where ɣ is the unit weight of the permeant (usually
water), μ is the dynamic viscosity of the permeating
fluid, CK-C is an empirical coefficient, S0 the specific
surface area of the soil/asphalt per unit volume of
particles, and e is the void ratio, hereafter denoted as (e).
The equation 2 developed by Vardanega & Waters
(2011, 2015) based on the equation developed by the
k = 0.46(Rp) 3.70 [R2 = 0.74; n = 467] …………(2)
Where k has units of mm/s and Rp has units of mm and
where Rp is the representative pore size (RPS), Where,
Rp = (2/3) [AV (%)/100] [D75 (mm)].
k = 0.269(Rp) 3.67……….(3)
k = 0.154(Rp) 4.12……….(4)
The different devices used by the researchers have used
Darcy’s equation or Kozeny Carman formulation and
have developed their model based on the previous
studies.
Rohid Rosli Hanin et al, 2013, investigates the effect of
lift thickness on permeability and the time available for
compaction (TAC) of hot-mix asphalt (HMA) mixes
under tropical climate condition. A total of 14 HMA
mixes consisting of various types, gradations, and
nominal maximum aggregate sizes (NMAS) were
selected. The results also suggest that the TAC for a
25 mm lift is 13 min, 23 min for 32 mm, 32 min for
38 mm, and is expected to be more than 50 min for
44 mm and above & effect of lift thickness on
permeability and the time available for compaction of
hot mix asphalt pavement under tropical climate
condition was determined. J. Vardanega et al, 2018,
This research presents two laboratory databases
assembled from data sourced from the literature. Using
a database of permeability tests on fine-grained soils, the
ability of the Kozeny-Carman void ratio function to
interpret the data is examined alongside a simple power-law relationship A second database of permeability measurements on
asphalt concrete specimens is used to re-examine the
‘representative pore size’ concept as a method of
predicting the coefficient of permeability. The influence
of nominal maximum aggregate size (NMAS) on the
coefficient of permeability is also studied.
Er. ankush verma et al 2018, The primary objective of
the present study is to determine general magnitude of
permeability of bitumen mixes at different conditions.
Additionally, the permeability characteristics of field-
prepared field compacted (FPFC) cored specimens are
evaluated and compared with laboratory-prepared
laboratory compacted (LPLC) specimens. Field cores
are extracted from on-going paving projects and
evaluated for
permeability using a fabricated falling head laboratory
permeameter. Marshall Mix prepared in the laboratory
asper the site specification and compacted with impact
compactor at varying compactive efforts, and finally
subjected to permeability testing.
Sheldon A .et al 2019 Numerous theoretical models
were evaluated and the selected model
is based on regression analysis of field data. Initially,
predominant variables influencing layer permeability
were found to be void proportion, binder content as well
as aggregate grading and packing. Subsequently,
regression analyses of data showed that within
reasonable variation of the other variables, layer
permeability is strongly correlated to aggregate grading
and packing, as described by rational Bailey ratios,
hence the focus of refining the model on the latter
parameters.
2. Objective of research study
The main objectives of this Research is
▪ To determine the Permeability of fine
and coarse graded asphalt mixtures.
▪ To compare and develop relationship
permeability measuring devices.
▪ To develop relationship between air
void and permeability.
▪ 3. Research methodology
Methodology
of research
study
Material selection
Preparation of specimen
Aggregate
Margalla , Uban
shah
Asphalt binder
ARL
Asphalt binder
Specimens for
Quantitative
Laboratory test of
specimen
Conclusion
Test results
analysis

3rd Pak-Turk International Conference on Emerging Technologies in the field of Sciences and Engineering
9-10th , June 2020
89
A research study was divided into three phases. In first
phase ,to prepare asphalt mixture,single asphalt binder
,two aggregate quarries. Based on petrography results
aggregate quarries were selected. Margalla and Uban
Shah aggregate quarries contain, calcium carbonate,
dolomite, and granite minerals respectively. Asphalt
binder i.e commonly used in flexible pavements of
Pakistan was taken from Attock Oil Refinery (ARL)
Pakistan. In second phase of research study specimens
were prepared for quantitative test regime. While in last
phase all laboratory tests were performed to asses
moisture sensitivity of asphalt mixture. The flow chart
of Research Methodolgy has been given in Fig.1.
4. Materials & Methods
4.1 Bitumen
The selected asphalt binder is commonly used in
Pakistan road network and basically consists of four
generic fractions based on molecular size and chemical
reactivity. These four groups consist of saturates,
aromatics, resins and asphaltenes. As aromatics are the
40-65% of total asphalt binder volume that is the main
reason of the non polar behavior of asphalt binder.
Bitumen of grade-60/70 was utilized with the source of
Attock Oil Refinery was finalized and arranged
provision of bitumen in the lab. . Material properties of
asphalt binder has been given in Table 1. Master curve
of ARL is given in Fig.2. The basic objective of
construction of master curve was to characterize the
binder over a wide range of temperature and loading
frequencies. This objective was achieved by conducting
frequency sweep test on DSR. Single reference
temperature is generally taken in a construction of
master curve. Time and temperature superposition
principle or principle of reduce variable that essentially
describe the equivalency of time and temperature are the
basis behind the construction of master curve. Master
curve at reference temperature of 30oC has been
constructed to complete the characterization of binders
as shown in Figure2, where values in terms of log of
reduced frequency(fr) are plotted against complex
modulus G*.
4. Materials & Methods
4.1 Bitumen, The selected asphalt binder is commonly
used in Pakistan road network and basically consists of
four generic fractions based on molecular size and
chemical reactivity. These four groups consist of
saturates, aromatics, resins and asphaltenes. As
aromatics are the 40-65% of total asphalt binder volume
that is the main reason of the non polar behavior of
asphalt binder.
Bitumen of grade-60/70 was utilized with the source of
Attock Oil Refinery was finalized and arranged
provision of bitumen in the lab. . Material properties of
asphalt binder has been given in Table 1. Master curve
of ARL is given in Fig.2. The basic objective of
construction of master curve was to characterize the
binder over a wide range of temperature and loading
frequencies. This objective was achieved by conducting
frequency sweep test on DSR. Single reference
temperature is generally taken in a construction of
master curve. Time and temperature superposition
principle or principle of reduce variable that essentially
describe the equivalency of time and temperature are the basis behind the construction of master curve. Master
curve at reference temperature of 30oC has been
constructed to complete the characterization of binders
as shown in Figure2, where values in terms of log of
reduced frequency(fr) are plotted against complex
modulus G*.
Fig.2. Master curve ARL
Basic necessary testing of bitumen was carried out
including penetration grade at 25, Softening Point,
Ductility, Flash and Fire Point and Specific Gravity. All
results are with in the limits.
Table 1 Material properties of asphalt binder
Test Description Asphalt binder ARL 60/70
Penetration
ASTM D6
61.0
Softening point
ASTM D36
48.4
Flash & Fire (*C)
ASTM D92
328-362
Specific Gravity
ASTM D70
1.023
4.2 Aggregate
Asphalt mixture contains about 95% of aggregate by
weight as a constituent . The properties of coarse and
fine aggregates are therefore important and directly
affect the performance of asphalt mixtures. Aggregate
quarries were selected on the petrography of rock
source. Amount of silica (SiO2) is responsible for acidic
or basic behavior of rock. Acidic nature rock commonly

3rd Pak-Turk International Conference on Emerging Technologies in the field of Sciences and Engineering
9-10th , June 2020
90
rich in silica while basic nature aggregate quarries
contain less amount of silica. Two different types of
aggregate quarries are locally available in Pakistan i-e
Margalla and Uban Shah aggregate quarries are basic in
nature. Nominal maximum aggregate size (NMAS)
which is defined as one sieve size larger than the first
sieve to retain more than 10 per cent of the material is
one of the commonly used parameter in the analysis of
aggregate packing characteristics. NMAS of NHA-A
and NHA-B gradation is 19.0 mm, for gradation SP-A
and MS-II it is 12.5 mm. Selected aggregate quarries
location has been shown in Fig.3. Chemical properties
of aggregate is shown in Fig. 4.
Different tests were conducted to measure the physical
and mechanical properties of aggregate in the
laboratory. Aggregate engineering properties have been
summarized in Table 2. It may be noted from Table 2
that fractured particles of all aggregate source are 100%.
While having less than 15% of flakiness and elongation
index. Aggregate engineering properties have been
summarized in Table 2.
Fig.3. Location Map of Aggregate Quarries
(https://geology.com/world/pakistan-satellite-
image.shtml)
As shown in Fig.3. Margalla represent northern part of
country. While Uban Shah represents the southern part
of Sindh, Pakistan.
Table 2 Engineering properties of aggregate
Test title Standard Margalla Uban shah
Limits
Fractured Particles (%) Flakiness Index (%) Elongation Index (%) Water absorption(%)
ASTMD 5821 BS 812.108 BS 812.109 ASTM C127
100 4.84 6.4 0.95
100 10 10 0.97
90 min 10 max 10 max 2 max
Los angeles abrasion(%) ASTM C131 23 26 30 max
Sand equivalent (%) ASTM D 2419 73 70 50 min
Soundness (%) ASTM C88 2.5 3.2 8 max
The complete testing of aggregates like water absorption
test, Los-Angeles Abrasion sand equivalent and
soundness was conducted and found within the limits. .
No aggregate quarry has loss angles abrasion value more
than 30% and sand equivalent value less than 70%.
4.2.1 Aggregate Gradation
Various types of gradation is used e.g average
gradation, bailey gradation etc. But, we are adopting
average technique because of its compatibility with
desired project. We selected 2 different quarry sources
having 3 different sizes of aggregates for their exact
blending. Both Coarse and fine aggregates were sieved
in 13 different sizes of sieves ranging from 0.075mm to
Gray limestone,
44
Dark Grey , 30
Light Grey , 14
Dark Grey to Grey
Veined , 9
Cremish Brown , 2
Quartz Wacke, 1
UBAN SHAH
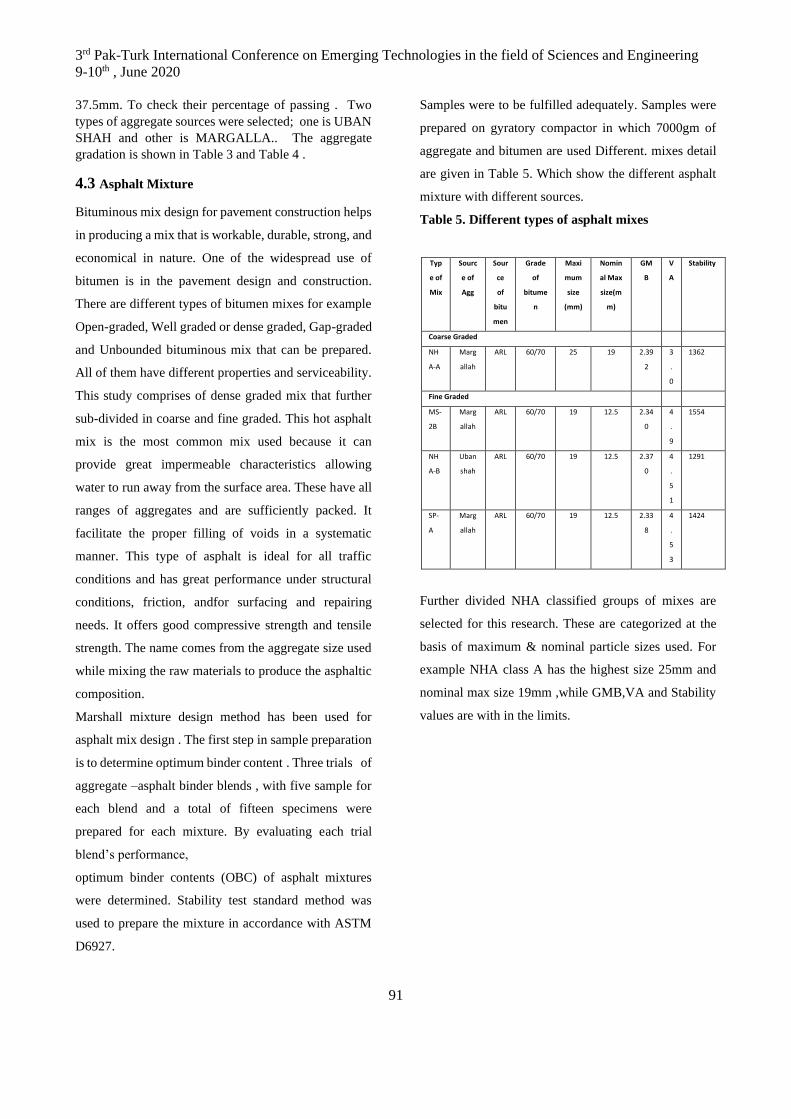
3rd Pak-Turk International Conference on Emerging Technologies in the field of Sciences and Engineering
9-10th , June 2020
91
37.5mm. To check their percentage of passing . Two
types of aggregate sources were selected; one is UBAN
SHAH and other is MARGALLA.. The aggregate
gradation is shown in Table 3 and Table 4 .
4.3 Asphalt Mixture
Bituminous mix design for pavement construction helps
in producing a mix that is workable, durable, strong, and
economical in nature. One of the widespread use of
bitumen is in the pavement design and construction.
There are different types of bitumen mixes for example
Open-graded, Well graded or dense graded, Gap-graded
and Unbounded bituminous mix that can be prepared.
All of them have different properties and serviceability.
This study comprises of dense graded mix that further
sub-divided in coarse and fine graded. This hot asphalt
mix is the most common mix used because it can
provide great impermeable characteristics allowing
water to run away from the surface area. These have all
ranges of aggregates and are sufficiently packed. It
facilitate the proper filling of voids in a systematic
manner. This type of asphalt is ideal for all traffic
conditions and has great performance under structural
conditions, friction, andfor surfacing and repairing
needs. It offers good compressive strength and tensile
strength. The name comes from the aggregate size used
while mixing the raw materials to produce the asphaltic
composition.
Marshall mixture design method has been used for
asphalt mix design . The first step in sample preparation
is to determine optimum binder content . Three trials of
aggregate –asphalt binder blends , with five sample for
each blend and a total of fifteen specimens were
prepared for each mixture. By evaluating each trial
blend’s performance,
optimum binder contents (OBC) of asphalt mixtures
were determined. Stability test standard method was
used to prepare the mixture in accordance with ASTM
D6927.
Samples were to be fulfilled adequately. Samples were
prepared on gyratory compactor in which 7000gm of
aggregate and bitumen are used Different. mixes detail
are given in Table 5. Which show the different asphalt
mixture with different sources.
Table 5. Different types of asphalt mixes
Typ
e of
Mix
Sourc
e of
Agg
Sour
ce
of
bitu
men
Grade
of
bitume
n
Maxi
mum
size
(mm)
Nomin
al Max
size(m
m)
GM
B
V
A
Stability
Coarse Graded
NH
A-A
Marg
allah
ARL 60/70 25 19 2.39
2
3
.
0
1362
Fine Graded
MS-
2B
Marg
allah
ARL 60/70 19 12.5 2.34
0
4
.
9
1554
NH
A-B
Uban
shah
ARL 60/70 19 12.5 2.37
0
4
.
5
1
1291
SP-
A
Marg
allah
ARL 60/70 19 12.5 2.33
8
4
.
5
3
1424
Further divided NHA classified groups of mixes are
selected for this research. These are categorized at the
basis of maximum & nominal particle sizes used. For
example NHA class A has the highest size 25mm and
nominal max size 19mm ,while GMB,VA and Stability
values are with in the limits.

3rd Pak-Turk International Conference on Emerging Technologies in the field of Sciences and Engineering
9-10th , June 2020
92
4.5 Permeability Testing
There are different types of permeameter FDOT permeameter, NCAT field permeameter, WPI modified NCAT
permeameter. These differ from eachother due to, use of epoxy membrane to seal core , sizes & dia of stand pipe dia,
Correction factors, air voids connectivity, density and most important handling of specimen. But, In-situ falling head
permeameter is the most quickest and easiest method to find the permeability accurately and the results obtained from
this test doesnot deviate more than two to three percent of the results obtained from modified NCAT permeameter. The
Falling Head-Permeameters used to study permeability are, Insitu-Permeameter diameter 5” to (EN 12697-40) 80-
B0093/E, in-situ permeameter Italian Highway system compatible 6” Dia, Drainig Pavements 4” (80-B0093) and water
pressurized permeameter as mention in Fig.5.
It has been inferred from Fig.5. that, Insitu-Permeameter has diameter of 5 inch, while in-situ permeameter Italian
Highway system compatible has diameter 6 inch, while Drainig Pavements have 4 inch diameter and water pressurized
permeameter.
Fig.5. Different permeability apparatus
(a) Italian/Autostrade
method ( B0093/A) (Dia
6")
(b)
(B0093)/Permeameter
(Dia 4")
(c) European Standard (
EN12697-40) D1229
(Dia 5")
(d) Water
Pressurized
Permeameter

3rd Pak-Turk International Conference on Emerging Technologies in the field of Sciences and Engineering
9-10th , June 2020
93
Permeability measured using Darcy’s relation of
laminar in following relationship .
𝑘 =𝑎𝑙
𝐴𝑡ln (
ℎ1
ℎ2) 𝑡𝑐
Where:
A=Cross-sectional Area of Sample in mm;
L=Height/Length of Sample in mm; a= Cross-
sectional Areas of Stand Pipe in mm; h1=Initial
Head across test specimen; h2= Final Head across
test specimen; t= Time Elapsed from start to
Reading; tc= Temperature correction for viscosity of
water while recording observations. As all
measurements were taken at room temperature, so tc
is taken equals to one. The permeability values
ranges from 0 to 50 x 10E-5 mm/sec shows the
impermeable pavements as per literature review.
However the criteria for Super-Pave fine aggregate
mixtures up to 8% air voids should not exceed 15 x
10E-3 mm/sec, and not a single value is exceeding
from the design limitation.
5.1 Permeability of asphalt mixes
We can see that 4’’ permeability apparatus , asphalt
mixes have low value of k and its take more time to flow
water so it is a permeable. While 5’’ permeability
apparatus, asphalt mixes have greater k value as
compared to 4 ‘’ so it take less time to water flow so it
is impermeable. While 6’’ permeability apparatus have
k value is more as compared to 4’’ and 5’’ so its take
less time to flow water so it is permeable. While water
pressurized permeameter have less k value as compared
to other apparatus. In Fig 6 ,we can see that 4’’
permeameter results have less value of K is
impermeable while 5’’ and 6’’ permeameter has some
mixes K value is less and those are impermeable and
water pressurized permeameter has 60% of the results
are the permeable and 40% result are impermeable
,NHA B U NRL 60/70 asphalt mix has less value of K
all of these permeability devices so it is impermeable.
Other asphalt mixes result are given in Fig.6 .
0.E+00
5.E-04
1.E-03
2.E-03
2.E-03
3.E-03
3.E-03
NHA A M NHA B U MS2B M SPA M
k
(a)
0.00.E+001.00.E-022.00.E-023.00.E-024.00.E-025.00.E-026.00.E-02
NHA AM
NHA BU MS2B
MSPA M
k

3rd Pak-Turk International Conference on Emerging Technologies in the field of Sciences and Engineering
9-10th , June 2020
94
0
500
1000
1500
2000
NHA A M NHA B U MS2BM
SPAM
tim
e
5.2 comparison between time and permeability
It may be noted from Fig.7 that 4’’ permeameter takes
more time to flow as compared to 5’’ permeameter. In
Fig.8. we see that time is change, as asphalt mix is
changed.so we see that NHA B take more time to flow
while NHA A takes less time to flow. we also see that
size of apparatus changes , permeability value also
changes, time also changes, air void and gradation also
impact on permeability.
Water pressurized permeameter also impact on
permeability as pressure apply permeability also
changes. As compared to other permeability apparatus
,water pressurized permeability less and time also less
as other apparatus.
6. Acknowledgements
The authors thank the Taxila institute of transportation
engineering and HRTC to provide friendly environment
to conduct
7.REFERENCES
Abdullah, W.S., Obaidat, M.T. and Abu-Sa’da, N.M.
1998. “Influence of Aggregate Type and Gradation on
Voids of Asphalt Concrete Pavements”. Journal of
Materials in Civil Engineering, 10(2): 76-85.
Bhattacharjee, S. and Mallick, R.B. 2002. An
Alternative Approach for the Determination of Bulk
Specific Gravity and Permeability of Hot Mix Asphalt
(HMA). International Journal of Pavement Engineering,
3(3): 143-152. Brown, E.R., Hainin, M.R., Cooley, A.
and Hurley, G. 2004a. Relationships of HMA in-place
air voids, lift thickness, and permeability Volume One.
NCHRP web
document,68<http://onlinepubs.trb.org/onlinepubs/nchr
p/nchrp_w68v1. Pdf > (19 Nov. 2016).
Brown, Ray, Hainin M., Cooley Allen, Hurley
Garham. “Relationship of Air Voids, Lift
Thickness, and Permeability in Hot Mix
Asphalt Pavements”, Washington, DC:
Transportation Research Board, 2004.
Chapuis, R.P. and Aubertin, M. 2003. On the use of the
Kozeny-Carman equation to predict the hydraulic
conduc- tivity of soils. Canadian Geotechnical Journal
40(3): 616- 628.
Chapuis, R.P. and Aubertin, M. 2003. On the use of the
Kozeny-Carman equation to predict the hydraulic
conduc- tivity of soils. Canadian Geotechnical Journal
40(3): 616- 628.
Chen, J.-S., Lin, K.-Y. And Young, S.-Y. 2004. Effects
of Crack Width and Permeability on Moisture-Induced
Dam- age of Pavements. Journal of Materials in Civil
Engineer- ing, 16(3): 276-282.
Cooley, Allen, Prowell Brian, Hainin Mohd and
Buchanan M. "Bulk Specific Gravity Round-Robin
Using the Corelok Vacuum Sealing Device", Report No.

3rd Pak-Turk International Conference on Emerging Technologies in the field of Sciences and Engineering
9-10th , June 2020
95
02-11, National Center for Asphalt Technology
(NCAT), 2002.
Gogula, A., Hossain, M., Romanoschi, S. and Fager,
G.A. 2003. “Correlation between Laboratory and Field
Permeability Values for the Super-pave Pavements”. In
Proceedings of the 2003 Mid-Continent Transportation
Research Symposium, Ames, Iowa, August 2003. <
http://www.ctre.iastate.edu/pubs/midcon2003/gogulasu
pe rpave.pdf > (19 Nov. 2016).
Goodbye, Hazen; Hello, Kozeny-Carman. Journal of
Geotechnical and Geo environmental Engineering,
129(11): 1054-1056.
Haddock, J.E. and Prather, M. 2004. Investigation of
permeability on Indiana SR-38. Journal of Performance
of Construction Facilities, 18(3): 136-141
Hainin, M.R., Yusoff, N.I.Md., Satar, M.K.I.M.S. and
Brown, E.R. 2013.The effect of lift thickness on
permeability and the time available for compaction of
hot mix asphalt pave- ment under tropical climate
condition. Construction and Building Materials, 48:
315-324.
Harris, Christopher. “Hot Mix Asphalt Permeability:
Tester Size Effects and Anisotropy”, M.A.Sc. Virginia
Polytechnic Institute and State University, Blacksburg,
Virginia, 2007.
Kanitpong, K., Benson, C.H. and Bahia, H.U. 2001.
Hydraulic conductivity (permeability) of laboratory-
compacted asphalt mixtures. Transportation Research
Record 1767, Pa- per No. 01-2997, Transportation
Research Board, Washing- ton, DC, 25-32.
Li, Hui, Kayhanian Masoud and Harvey John.
"Comparative field permeability measurement of
permeable pavements using ASTM C1701 and NCAT
permeameter methods", Journal of Environmental
Management, Vol. 118, 2013, pp. 144-152.
Mallick, R.E., Cooley, L.A., Jr., Teto, M.R., Bradbury,
R.L. and Peabody, D. 2003. An Evaluation of Factors
Affecting Permeability of Superpave Designed
Pavements. Report no. 03-02, National Centre for
Asphalt Technology, Auburn University, and Auburn,
Ala.
Masad, E., Al-Omari, A. and Lytton, R. 2006. Simple
Method for Predicting Laboratory and Field
Permeability of Hot- Mix Asphalt. Transportation
Research Record 1970, Transportation Research Board,
Washington, DC, pp. 55- 63.
Maupin, G. W. "Asphalt Permeability Testing in
Virginia", Transportation Research Record: Journal of
the Transportation Research Board, Vol. 1723, No. 1,
2000a, pp. 83-91
Maupin, G.W. Jr. 2009. Personal Communication.
McLaughlin, J.F. and Goetz, W.H. 1955. Permeability,
Void Content, and Durability of Bituminous Concrete.
Highway Research Board Proceedings, 34: 274-286.
Masad, E., Birgisson, B. and Al-Omari, A. 2004.
Analytical Derivation of Permeability and Numerical
Simulation of Fluid Flow in Hot Mix Asphalt. Journal
of Materials in Civil Engineering, 16(5): 487-496.
Mogawer, Walaa S., Mallick Rajib B., Teto Matthew R.,
and Crockford W. C. "Evaluation of Permeability of
Superpave Mixes", The New England Transportation
Consortium, 2002.
Mohammad, L.N., Herath, A. and Huang, H. 2003.
Evaluation of Permeability of Super-pave ® Asphalt
Mixtures. Transportation Research Record 1723, Paper
No. 03-4464, Transportation Research Board,
Washington, DC, pp. 50- 58. Mullen, W.G. 1967.

3rd Pak-Turk International Conference on Emerging Technologies in the field of Sciences and Engineering
9-10th , June 2020
96
Impact of aging and moisture damage on bond
strength of asphalt mixtutre
Hafiz Muhammad Abubakar 1, a, Syed Bilal Ahmed Zaidi 2, b and Muhammad Sohail Jameel 3, c
1 Research Scholar, Department of Civil Engineering, University of Engineering and Technology,
Taxila, 47050, Pakistan 2 Assistant professor, Department of Civil Engineering, University of Engineering and Technology,
Taxila, 47050, Pakistan 3 Research Scholar, Department of Civil Engineering, University of Engineering and Technology,
Taxila, 47050, Pakistan,
Email address: a) [email protected], b) [email protected] and c)
Abstract— Bond strength in asphalt mixture should be adequate throughout the service period of a pavement for better
performance. Bitumen due to some external factors, such as temperature and heat changes its capacity to resist moisture
damage and bonding properties due to aging. To analyze the effect of aging on bond strength of asphalt mixture, binder is aged
using the rolling thin film oven test (RTFOT) and pressure aging vessel (PAV). Dynamic Shear Rheometer (DSR) is used to
check the stiffening of the virgin binder compared to aged binder. Bitumen Bond Strength (BBS) and Rolling Bottle Test (RBT)
is performed to check the interaction between binder and aggregate as a result of aging of binder. BBS test on virgin and aged
binder is performed at 24 hours of dry and wet conditioning. BBS test results have shown an improvement in Pull of tensile
strength (POTS) after RTFOT and PAV aging at 24 hours of dry and wet conditioning. In dry conditions virgin and RTFOT
aged binder follows cohesive nature of failure and PAV aged binder follows adhesive failure pattern. In wet conditions cohesive
nature of failure is observed in virgin, RTFOT and PAV aged binder. RBT results have shown increase in percent retained
coating of binder after RFTFOT and PAV aging. It is found that aging increases the resistive property to moisture damage and
bond strength of binder.
Keywords— Asphalt mixture, rolling thin film oven test, pressure aging vessel, Dynamic shear rheometer, Bitumen
bond strength test, rolling bottle test.
Introduction
As bitumen gets aged its chemical properties changes. Its oily components with change in
temperature and pressure gets removed and bitumen loses its ductility due to which its bonding
characteristics gets changed. Cracking phenomena in the pavement mostly occurs due to aging of
binder which makes mixture brittle and as the pavement loaded it becomes more prone to cracking.
So, impact of bond strength and aging of binder play an important role in pavement performance.

3rd Pak-Turk International Conference on Emerging Technologies in the field of Sciences and Engineering
9-10th, June 2020
97
Aging of bitumen is a phenomenon in asphalt pavement structures that contributes to deterioration
due to stiffening of binder. Over the bitumen losses its ductility due to removal oily components
and other saturates bitumen becomes hard and stiff. Moisture damage occurs due to stripping
phenomena in asphalt mixtures and it contributes to further deterioration of pavement. So, it is
very important to analyze the effect of aging on bond strength and resistance to moisture damage.
As the cracks appears on surface of pavement moisture enters in cracks and may severely damage
the underneath structure of pavement.
Problem statement
Usually it is not possible to characterize the bonding behavior of bitumen after aging. Very little-
known effort is made on this aspect in the past. It is a known fact that aging enhances the stiffness
of the binder. As binder in asphalt mixture is aged, pavement may be subjected to surface cracks
and moisture get enters into it. But stiffness weather improves the bonding property and causes a
greater resistance against moisture or causes a decrease in bonding strength. In this study the effect
of aging of binder on bonding properties of bitumen were checked.
Aims and objectives
• To check the stiffness of binder after RTFOT and PAV aging • To depict the impact of aging on moisture damage of asphalt mixture
• To analyze the bond strength and mechanism involved in bonding behavior of bitumen before and
after aging.
Literature review
Aging of bitumen is a phenomenon in asphalt pavement structures that contributes to deterioration.
Over the time bitumen changes its chemical characteristics that may cease the pavement
performance [1, 2]. Asphalt mixture as the most important materials for pavement and their
physical and chemical properties have a direct influence on performance of mixture. The lack of
bonding between them can cause a major damage to pavement structure. Asphalt adhesion is
directly affected by the chemical changes in the bitumen [3, 4]. Bitumen aging can be divided in two
phases, short and long-term aging. Short term aging occurs during mixing and transporting and
compaction of mixture while long term aging occurs during service period due to loading, pressure
and environmental effects and is limited to few millimeters of pavement surface. Aging promote
the chances of cracking in the pavement. Aging make bitumen brittle and stiff, this stiffness may
cause the fatigue cracking decreasing the life span of pavement[5-7].

3rd Pak-Turk International Conference on Emerging Technologies in the field of Sciences and Engineering
9-10th, June 2020
98
A force that link the two unlike materials is called adhesion. In case of asphalt mixture adhesion is
the required energy that is needed to get rid of the link between the bitumen and aggregate.
Adhesion is also a most important phenomena in asphalt mixtures which also contribute to
serviceability of pavement structure[8, 9]. Four basic theories have been theorized to justify the
bonding of asphalt mixture which are mechanical adhesion theory, molecular orientation theory,
surface energy theory and chemical reaction theory. Chemical reaction theory explains the adhesion
in context of viscosity of bitumen, more viscous bitumen has greater concentration of polar
molecules(asphaltenes) create greater adhesion with aggregates due to greater adhesion tension
[10-12]. A study has shown an improvement in moisture damage resistance after oxidative aging
[13]. Another work study evaluated the combined effect of aging and water damage to asphalt
mixture indicating the poor performance of asphalt mixture in unaged condition [14]. A work have
shown decrease in moisture damage resistance after RTFOT and PAV treatment of binder and
bonding strength[15]. Another study has shown that aging promotes generation of surfactants and
acids which damage the moisture resistive performance of mixture [16]. A work on adhesion of
binder and aggregates has shown under the moisture conditions a virgin binder usually follow the
cohesive nature of failure and a severely aged binder follows an adhesive nature of failure in bond
strength test[17].
Research Methodology
Materials
Properties of bitumen are shown in Table 5.
Table 1: Properties of Virgin Binder
Property
Reading
(Penetration Grade 60/70)
Mean penetration value (1/10 mm) (ASTM D5) 62
Ductility (ASTM D113) Above 100 cm
Flash point (ASTM D3143/3143M-13) 269℃
Softening point (ASTM D36) 52℃
Bitumen of Attock refinery penetration grade 60/70 is used as binder for each of Limestone
(Margala crush) and sandstone (Sargodha crush) which is used as a substrate. Properties of
aggregates used are listed in Error! Reference source not found. and Error! Reference source not
found..
Table2: Aggregate type, Composition and Nature

3rd Pak-Turk International Conference on Emerging Technologies in the field of Sciences and Engineering
9-10th, June 2020
99
Aggregate
Type
Components Rock Type Nature
Sandstone 40.848 SiO2 Sedimentary
Rock
Acidic
Limestone Calcite 65%, Silica 30% Fossiliferous
Limestone
Basic
Table3: Physical properties of aggregates
Property Limestone Sandstone
Water absorption (%) 1.32 1.00
Specific gravity 2.83 2.72
Bulk density(kg/m3) 1508 1533
Voids (%) 45.56 42.80
Impact value (%) 16.50 11.60
Crushing value (%) 29.80 17.90
Compressive strength (MPA) 26.30 21.10
Splitting tensile strength (MPA) 2.25 2.00
Flexural strength (MPA) 4.90 4.78
Testing Plan
• Dynamic shear rheometer (DSR) according to standard AASHTO T315 [18]
• Rolling Bottle Test (RBT) according to standard EN 12697-11:2012 [19].
• Bitumen Bond Strength test (BBS) according to standard ASTM D 4541[20]

3rd Pak-Turk International Conference on Emerging Technologies in the field of Sciences and Engineering
9-10th, June 2020
100
The workflow diagram for this research study is shown in
Figure 21.
Tests Descriptions
Dynamic shear rheometer
Rheology of virgin and aged bitumen are determined using the frequency sweep. Test is taken at
the various intermediate and high temperatures which ranges from (22, 34, 46, 58, 70, 82°C) and at
frequency range (0.1 to 10Hz) and at a constant strain level oscillatory shear is applied. Rheological
parameters are obtained using excel and master curves are plotted at the temperature of 58°C using
the sigmoidal function
𝑳𝒐𝒈|𝐆∗| = 𝜹 +𝜶
𝟏+𝒆𝜷+𝜸(𝑳𝒐𝒈𝒇𝒓) (3)
Where 𝛿 is the minimum complex shear modulus, α is the difference between maximum and
minimum complex shear modulus value, G* is the complex shear modulus, γ, β are the shaped
functions parameters of sigmoidal function and 𝑓𝑟 is the reduced frequency.
Rolling Bottle Test
Rolling bottle test is proved to be most suitable method as for adhesion[21]. In rolling bottle test
two type of mixtures are prepared using sandstone and limestone aggregates with each of 60/70
and 80/100 penetration grade bitumen. The is conducted using the standard procedure of EN
12679-11. 162g of aggregate passing 9.6mm and retained on 6.3mm is cleaned with deionized water
Figure 21: Workflow diagram
Virgin binder
BBS test
Aged binder
Results and
conclusion
Rolling bottle
test

3rd Pak-Turk International Conference on Emerging Technologies in the field of Sciences and Engineering
9-10th, June 2020
101
to remove any material present on the surface of aggregates and placed in oven for 60 minutes at
60οC and is mixed with 8g of bitumen and mixture is prepared heated to a limit that bitumen is
properly coated on aggregates. The mixture then is placed in rolling bottle by separating single
aggregate one by one poured into the rolling bottle and placed on rolling machine for 72h. The test
is performed at 20οC and machine is rolled at 60rpm. Reading is taken after 6h,24h,48h,72h.
Pictures of sample are taken by a camera of 13 megapixel and pictures are taken at fixed distance
of 18cm. Two reading for each mixture is taken by two observers to get the appropriate results. At
the end mean is taken for each time of rolling to get the final percentage of coating of bitumen.
BBS test
BBS test consists of an adhesion tester, pressure pipe, piston, plate, and stubs made of metal that
are used to pull off from reaction plate over the bitumen and the pressure is noted to calculate the
pull of tensile strength (POTS) by the following formula.
POTS=((BP×Ag)-C)/Aps (4)
BP is representative of burst pressure(psi), Ag is the contact area between gasket and plate having
value 4.06 in2, C is a constant having value 0.286 in2, Aps is the area of pull of stub having value
0.1963 in2. Aggregate plates having thickness of 2” are cut by a saw cutter having some specific
dimension are cleaned by deionized water to remove the dust or any raw material on surface of
plate. These plates are placed in an oven with temperature of 60οC for a period of 60 minutes to
remove the absorbed water. Stubs are placed in oven for 20 minutes at 60οC to remove of the oils
present on it. Binder is heated in oven for 5 minutes at 160οC and immediately placed on the stub
which is pressed on the plate vertically. Pressure on adhesion device is provided not more than
120psi. circular spacer is placed on the stub and piston tightened on the stub and a pressure is given
at a rate of 2-6psi/s. The pressure at which the stub is pulled out of the plate is used to calculate the
POTS value. Penetration grade 60/70 is tested with limestone and sandstone.
Aging of Bitumen
RTFOT aging
Binder short term aging is done by using the rolling thin film oven test using the procedure of
standard AASHTO T240. There are eight glass bottles and one bottle are filled with 35g of bitumen
and cooled in the cooling rack for a period of 60-180 minutes. After cooling bottles are taken in
RTFOT oven and is rotated at 15 rpm for 85 minutes. during at 325ºF(163ºC) and air flow in is kept
bottles at 244 in3/min (4000 ml/min)[22].
PAV aging

3rd Pak-Turk International Conference on Emerging Technologies in the field of Sciences and Engineering
9-10th, June 2020
102
Binder is aged for long term aging is by pressure aging vessel of pressure 300psi(2.07MPa) and at a
temperature of 110℃(230°F). Pans of each is 50-gram capacity are kept in a pan holder and then
moved in the pressure aging vessel for 20 hours. After 20 hours of treatment samples are taken
from the vessel and degassed to perform the tests [23].
Table 4: Properties of binder after Long- term and Short-term aging
Results and Discussion
DSR test Results
Figure 22 is shown for complex shear modulus and reduced frequency. As the binder is aged the
curve shifts upward indicating an increase in stiffness of binder. For RTFOT aged binder the curve is
higher than virgin binder and PAV aged it goes further up indicating a more increase in stiffness after
PAV aging. Higher value of G* means elastic response is slowed and loss of ductility. The upward
movement of curve with aging is an indication that stiffness of binder in increasing with aging of
binder. RTFOT treated binder is more stiff than virgin binder and PAV aged binder is stiffer than
RTFOT aged and virgin binder.
Type of Aging Short Term Aging Long Term Aging
Mean Penetration Value (1/10 mm) (T49-03) 57 53
Ductility (T51-00) 62 cm 56 cm
Flash Point (T48-99) Above 300℃ Above 300℃
Softening Point (T53-96) 39℃ 31℃

3rd Pak-Turk International Conference on Emerging Technologies in the field of Sciences and Engineering
9-10th, June 2020
103
Figure 22 : Relationship between G* and reduced frequency for 60/70 pen grade
Rolling bottle test results
Rolling bottle test results are shown as percentage of bitumen coating. Error! Reference source not
found. and Error! Reference source not found. shows decreasing value for limestone and sandstone
in which aged binder coating is increased for 6h of rolling. For 24hours, 48hours and 72hours the
value of bitumen coating is following the same trend of lower coating of binder for virgin binder is
less than for aged binder. For both limestone and sandstone virgin percent retained coating is less
than RTFOT aged and PAV aged binder. So, aging decreases the moisture damage in terms of
stronger adhesive bond between aggregates and bitumen.
1
10
100
1000
10000
100000
1000000
0.001 0.01 0.1 1 10 100 1000 10000 100000
Co
mp
lex s
hea
r m
od
ulu
s (G
*)
Reduced frequency
Virgin
RTFOT
PAV

3rd Pak-Turk International Conference on Emerging Technologies in the field of Sciences and Engineering
9-10th, June 2020
104
BBS test results
From Error! Reference source not found. and Error! Reference source not found. it’s clear that
POTS value for unaged binder penetration grade 60/70 with limestone and sandstone at 24 hours
of dry conditions is less and for aged binder its improved. In case of virgin binder its lower than both
RTFOT aged and PAV aged binder. In case of short term aging it is higher than virgin and for long
term or PAV aged its higher than both virgin and RTFOT aged binder. For virgin and RTFOT failure
pattern is cohesive and for PAV treated binder it follows only adhesive nature of pattern.
Figure 23: Percent retained coating of 60/70 pen
grade for limestone
Figure 24: Percent retained coating of 60/70 pen
grade for sandstone
0
10
20
30
40
50
60
70
80
90
100
6hours 24hours 48hours 72hours
Per
cen
t re
tain
ed c
oa
tin
g
Time
PAV aged RTFOT aged Neat biner
0
10
20
30
40
50
60
70
80
90
100
6hours 24hours 48hours 72hours
Per
cen
t re
tain
ed c
oa
tin
g
Time
PAV aged RTFOT aged Neat biner

3rd Pak-Turk International Conference on Emerging Technologies in the field of Sciences and Engineering
9-10th, June 2020
105
At 24 hours of dry conditions at 25°C
Figure 25: POTS (psi) values for 60/70 pen grade
for limestone
Figure 26: POTS (psi) values for 60/70 pen
grade for sandstone
Figure 27 and Figure 28 shows the POTS values for 24 hours of wet conditions in which virgin POTS
are lower than RTFOT aged binder and PAV aged binder. Virgin, RTFOT and PAV treated binder all
follows only cohesive nature of failure pattern.
0
200
400
600
800
1000
1200
1400
Virgin RTFOT PAV
PO
TS
(Psi
)
0
200
400
600
800
1000
1200
1400
Virgin RTFOT PAV
PO
TS
(psi
)

3rd Pak-Turk International Conference on Emerging Technologies in the field of Sciences and Engineering
9-10th, June 2020
106
CONCLUSION
From above results it is clear that as
• As bitumen gets aged its complex shear modulus increases. As a result of improvement in complex shear modulus stiffness increases. Bitumen lost most of its oily components responsible for ductile behavior.
• Stiffness improves the POTS and Adhesion of bitumen and aggregates increases as it gets aged. As a result of aging pull of tensile strength of bitumen improves and on the other other hand it causes in loss of ductility of bitumen. Due to loss in ductility, aging results in embrittlement mode of failure. Pull of tensile strength increases due to brittle behavior of binder. Virgin and short-term aged binder follows cohesive nature of failure and long-term aged binder follows adhesive nature in dry conditions and in wet conditions cohesive only failure is observed.
• Rolling bottle test results shows that as bitumen gets aged its adhesion with individual particles increases but stripping phenomena in bitumen aggregate system may increase due to loss of ductile nature. Resistance to moisture damage increases due to aging of binder.
A 24 hours of wet conditions at 25°C
Figure 27: POTS (psi) values for 60/70 pen grade
for limestone
Figure 28: POTS (psi) values for 60/70 pen grade
for sandstone
0
200
400
600
800
1000
1200
1400
Virgin RTFOT PAV
PO
TS
(P
SI)
0
200
400
600
800
1000
1200
1400
Virgin RTFOT PAV
PP
OT
S (
PS
i)

3rd Pak-Turk International Conference on Emerging Technologies in the field of Sciences and Engineering
9-10th, June 2020
107
Rolling bottle test is a visual observations of percentage coating and coating is observed on individual particles and stripping is caused due to cohesive failure within the bitumen binder.
References
1. Petersen, J.C., A review of the fundamentals of asphalt oxidation: chemical,
physicochemical, physical property, and durability relationships. Transportation Research
Circular, 2009(E-C140).
2. Yang, Z., et al., Effect of aging on chemical and rheological properties of bitumen.
Polymers, 2018. 10(12): p. 1345.
3. Yao, H., et al., Performance of asphalt binder blended with non-modified and polymer-
modified nanoclay. Construction and Building Materials, 2012. 35: p. 159-170.
4. Zhao, S., et al., Characterizing rheological properties of binder and blending efficiency of
asphalt paving mixtures containing RAS through GPC. Journal of Materials in Civil
Engineering, 2014. 26(5): p. 941-946.
5. Hofko, B., et al., Alternative approach toward the aging of asphalt binder. Transportation
Research Record, 2015. 2505(1): p. 24-31.
6. Huang, S.-C., et al., Ageing characteristics of RAP binder blends–what types of RAP binders
are suitable for multiple recycling? Road materials and pavement design, 2014. 15(sup1): p.
113-145.
7. Ongel, A. and M. Hugener, Aging of bituminous mixes for rap simulation. Construction and
Building Materials, 2014. 68: p. 49-54.
8. Copeland, A.R., Influence of moisture on bond strength of asphalt-aggregate systems. 2007.
9. Mohd Jakami, F., Adhesion of asphalt mixtures. 2012.
10. Curtis, C.W., Investigation of asphalt-aggregate interactions in asphalt pavements.
American Chemical Society, Fuel, 1992. 37: p. 1292-1297.
11. Hicks, R.G., Moisture damage in asphalt concrete. Vol. 175. 1991: Transportation Research
Board.
12. Santagata, F., et al. Modified PATTI test for the characterization of adhesion and cohesion
properties of asphalt binders. in Sixth International Conference on Maintenance and
Rehabilitation of Pavements and Technological Control (MAIREPAV6) International
Society for Maintenance and Rehabilitation of Transportation InfrastructureTransportation
Research Board. 2009.
13. Li, B., et al., Effect of short-term aging process on the moisture susceptibility of asphalt
mixtures and binders containing sasobit warm mix additive. 2015. 2015.
14. Das, P.K., et al., Coupling of oxidative ageing and moisture damage in asphalt mixtures.
2015. 16(sup1): p. 265-279.
15. Al Masri, Z.A.B., et al., Evaluating the Effect of Binder Aging and Mineral Fillers on
Moisture Susceptibility of Asphalt Concrete Using Surface Free Energy.
16. Thomas, K.P., et al., Surfactants in aged asphalt and impact μ on moisture susceptibility of
laboratory-prepared mixes. 2006. 7(4): p. 477-490.
17. Asif, S.A., et al., Study of adhesion characteristics of different bitumen–aggregate
combinations using bitumen bond strength test. 2018. 41(5): p. 430-440.
18. Holsinger, R., A. Fisher, and P. Spellerberg, Precision Estimates for AASHTO Test Method
T308 and the Test Methods for Performance-Graded Asphalt Binder in AASHTO
Specification M320. 2005.
19. Dickinson, L.L., A.T. Blachly, and A.J. George, Evaluation of Asphalt Stripping Tests.
1990: Federal Highway Administration.

3rd Pak-Turk International Conference on Emerging Technologies in the field of Sciences and Engineering
9-10th, June 2020
108
20. Astm, D., 4541, Standard Test Method for Pull-Off Strength of Coatings Using Portable
Adhesion Testers. Annual Book of ASTM Standards, 2002: p. 1-13.
21. Paliukaitė, M., et al., Evaluation of different test methods for bitumen adhesion properties.
2016. 14: p. 724-731.
22. AASHTO, Standard method of test for effect of heat and air on a moving film of asphalt
binder (rolling thin-film oven test). 2009.
23. Behera, P.K., A. Singh, and M. Amaranatha Reddy, An alternative method for short-and
long-term ageing for bitumen binders. Road materials and pavement design, 2013. 14(2): p.
445-457.

3rd Pak-Turk International Conference on Emerging Technologies in the field of Sciences and Engineering
9-10th, June 2020
109

3rd Pak-Turk International Conference on Emerging Technologies in the field of Sciences and Engineering
9-10th, June 2020
110

3rd Pak-Turk International Conference on Emerging Technologies in the field of Sciences and Engineering
9-10th, June 2020
111

3rd Pak-Turk International Conference on Emerging Technologies in the field of Sciences and Engineering
9-10th, June 2020
112

3rd Pak-Turk International Conference on Emerging Technologies in the field of Sciences and Engineering
9-10th, June 2020
113

3rd Pak-Turk International Conference on Emerging Technologies in the field of Sciences and Engineering
9-10th, June 2020
114
Investigating the wet-chemical growth of CdS
quantum-dots on metal-sulfide interfacial layers
deposited by ALD
Ijaz Ali1,a, and Muhammad Abdul Basit2,b
1Department of Materials Science and Chemical Engineering, Hanyang University, Ansan 15588, Republic of
Korea
2Department of Materials Science and Engineering, Institute of Space Technology, Islamabad 44000,
Pakistan
Email address: a)[email protected], b) [email protected]
Abstract—Owing to their unique and tunable optoelectronic characteristics, Quantum-dots (QDs) are
considered as the most efficient nanoscale materials for various advanced applications including solar cells.
Expansive and technologically complicated photovoltaic devices such as thin film solar cells and/or dye-sensitized
solar cells are under-replacement solely due to the evolution of QDs, introducing newer family of solar cells
including perovskite and QDs-sensitized solar cells (QDSCs). The technological progress of these devices is so far
slow and a lot of optimization is required regarding the optimal deposition and energy harvesting of QDs without
detrimental electronic issues of back-transfer of charge carriers and electron-hole recombination. In this work, we
have focused the issue of lower energy harvesting in thin films deposited by wet-chemical methods such as
successive ionic layer adsorption and reaction (SILAR) by introducing atomic layer deposited (ALD) ZnS, SnS
and MoS2 IL on TiO2-deposited Si-wafer. The aim was to in-depth analyze the nucleation and growth trend in
QDs, considering CdS as a reference material owing to its stability for atomic force microscopic (AFM)
examination. It was deduced that all metal-sulfide layers deposited by ALD enhance the deposition of CdS QDs
and can prove beneficial for optoelectronic devices incorporating QDs, however their increased deposition is
importantly classified in terms of coverage and size of QDs, differently. Considering the results of our study it will
be beneficial for optimizing the QDs based devices in general and CdS QDSCs, in particular.
Keywords—Quantum-dots, SILAR, ALD, nucleation, atomic force microscopy

3rd Pak-Turk International Conference on Emerging Technologies in the field of Sciences and Engineering
9-10th June 2020
115
Comparative Analysis of Temperature Excursion
Hybrid Techniques for Electronic Devices
Tanzeel Ur Rehman1,a, Abid Hussain1,b and Muhammad Mehboob1,c 1Department of Mechanical Engineering, University of Engineering and Technology, Taxila
Email address: a) [email protected] , b) [email protected] and c) [email protected]
Abstract—Phase Change Materials (PCMs) are
becoming popular in thermal management of
electronic devices for their safe operation and to
prevent premature failure. PCMs have high latent
heat of fusion but low thermal conductivity. High
latent heat enables them to absorb a large amount of
heat from the hot surfaces during their phase
transition. In this experimental study, a hybrid
thermal management system using copper foam with
PCM and forced air convection is designed and
tested experimentally. Copper foam and forced air
convection is aimed to enhance the thermal
conductivity and to improve the temperature
uniformity within the PCM. The results are then
compared with two other modes of cooling, pure
PCM and composite PCM (copper foam along with
PCM). Results indicate that addition of air as cooling
medium reduces the temperature of the electronic
device compared with the other two patterns. They
hybrid system appeared to be 25.6% more effective
than pure PCM and 15.6% more effective than the
composite PCM.
Keywords—Phase Change Materials, hybrid,
copper foam, air, temperature
Introduction
A large amount of heat generates in
electronic devices during their operation.
According to Hetsroni et al. 50-60 °C is
the safe temperature limit for electronic
devices [1]. Hosseineizadeh et al. showed
that chances of failure become 100% in
electronic devices when their temperature
goes beyond 10-20 °C [2]. So to dissipate
this heat, various active and passive
thermal management systems (TMS) are
used for their safe operation. The heat
transfer medium plays a very important
role in the performance of the TMS [3].
Active thermal management systems
generally involve forced convection of air
or a fluid. Forced air convection is the
widely used method because of its
reliability, low cost and safe operation [4].
Air, however requires extremely high
velocity [5], because of their low thermal
conductivity [6].
Passive systems do not involve any
supplemental cooling source. An example
of passive system is the PCM. PCMs are
those materials that absorb and retain a
large amount of heat during their phase
transition and keep the temperature within
the melting range of the PCMs [7][8] and
release this heat when their temperature
falls below phase change temperature.
Pure paraffin, is one of the most effective
PCM because of its large latent heat

3rd Pak-Turk International Conference on Emerging Technologies in the field of Sciences and Engineering
9-10th June 2020
116
capacity and low cost. Sharma et al. [9]
experimentally proved that paraffin wax is
the most stable PCM. However, PCMs
have very low thermal conductivity [10].
Due to low thermal conductivity, the
thermal management system may fail
under extreme conditions when the
ambient temperature is high [11]. So
highly thermal conductive materials are
added into PCM to increase and enhance
their thermal conductivity [12][13]. Recent
development shows that metallic foams are
very efficient in enhancing the thermal
conductivity of the PCMs [14][15] due to
their large surface area and high porosity.
So composites PCMs are prepared using
metal foams as their skeleton in which
PCM such as paraffin is filled [16][17].
This kind of composite PCM has high
thermal conductivity compared with pure
paraffin [18].
From the literature review, it appears that
under stressful conditions, neither passive
nor active thermal management is
sufficient to remove the heat from the
device [19][20][21]. Ling et al. [21]
suggested a mixed TMS that combined
PCM with forced air convection. However,
studies investigating the combined effect
of passive and active cooling have been
inadequate.
The current research involves experimental
study of a hybrid thermal management
system consisting of a composite PCM
combined with force air convection. The
effectiveness of the system was proved
experimentally with other modes of
cooling.
Experimental setup
Experimental setup consists of a cavity, an
electric heater, copper metal foam, PCM, a
variable speed electric fan, k-type
thermocouples, data acquisition system
(DAQ) and a laptop with necessary
software installed.
The cavity used in this experiment has
inner dimensions of 102 x 102 x 30 mm
and was made from a 3 mm thick
plexiglass sheet to only allow one
dimensional heat transfer. To allow natural
and forced air convection, the cavity was
open from the top. The cavity was made
slightly larger (2 mm) from inside than the
size of the electric heater. This allows easy
installation and removal of electric heater
and metal foam and also makes space for
electric wires.
A flexible square-type silicone rubber
fiberglass insulated heater was used to
represents an electronic device and is a
source of heat for the experiment. The
heater has dimensions of 100 x 100 x 1.5
mm. The heater was placed inside the
bottom of the cavity during the
experiment.
PCM (paraffin wax), having meting
temperature between 39 to 41 °C and
thermal conductivity of 0.2 W/m.K was
used to absorb the heat from the electric
heater. Copper foam having dimensions of
100 x 100 x 20 mm and thermal
conductivity of 398 W/m.K was used to
enhance the thermal conductivity of the
paraffin. The composite PCM was
prepared by pouring the molten paraffin
into the copper foam.
Electric fan made by Foxconn having size
100 x 100 mm was used for the forced air-
convection to enhance the rate of heat
transfer from the composite PCM.
Maximum input voltages for the fan are 12
volts and it was operated at the same
voltage. The fan was suspended one inches
above the plexiglass to allow easy passage
for the air.

3rd Pak-Turk International Conference on Emerging Technologies in the field of Sciences and Engineering
9-10th June 2020
117
A k-type thermocouple having temperature
sensitivity between -50 °C to 1350 °C was
placed at the center and at a depth of 10
mm inside the Copper foam and
Composite PCM to measure the
temperature.
A variable voltage power supply was used
to power both, the electric heater and the
fan.
The data acquisition system made by
“National Instruments” was used to record
the temperature inside the composite PCM
at equal intervals of time.
A laptop with installed necessary softwares
for the DAQ system was attached to the
DAQ via a USB cable.
The experimental setup is shown in the
figure.
Fig. 1. Experimental setup
Results and Discussion
0 500 1000 1500 2000 2500 3000 3500 4000
30
40
50
60
70
Tem
pe
ratu
re (
°C)
Time (s)
Temperature
Fig. 2. Temperature, without any thermal
management system
The above graph is for electric heater
without any thermal management system.
The graph shows that the temperate
increases rapidly and in a very short time
interval of approximately 3200 seconds
(53.3 min.) reaches 72 °C which is not a
very safe temperature for operating
electronic devices. We also see that it took
approximately 480 seconds (8 minutes) for
the electric heater to reach a temperature of
41 °C which is temperature where the
phase transition of the pure PCM ends.
0 1000 2000 3000 4000 5000 6000 7000 8000
30
32
34
36
38
40
42
44
Tem
pe
ratu
re (
°C)
Time (s)
Temperature
Fig. 3. Temperature variation of pure paraffin
The above temperature graph which is for
pure paraffin, reveals that it took
approximately 3400 seconds (56.6 min.)
for pure paraffin to reach a temperature of
39 °C where melting of PCM starts and
took 3200 seconds (53.3 min.) to complete
the melting phase and to reach 41 °C
where the melting or transition phase
completes. The total time to reach 41 °C
was 6645 seconds (110.75 min). Compared
with no thermal management system, pure
paraffin absorbed a large amount of heat
and appeared 1280% more efficient.

3rd Pak-Turk International Conference on Emerging Technologies in the field of Sciences and Engineering
9-10th June 2020
118
0 1000 2000 3000 4000 5000 6000 7000 8000
30
32
34
36
38
40
42
44T
em
pera
ture
(°C
)
Time (s)
Temperature
Fig. 4. Temperature variation of composite
PCM
The above temperature profile is for
composite PCM consisting of Copper foam
and pure paraffin. From the graph we
conclude that it took approximately 5500
seconds (91.6 min.) for the composite
PCM to reach the saturation temperature of
39 °C and 7223 seconds ( 120.38 min) to
reach a temperature of 41 °C. The
composite PCM performed 9% better than
the pure PCM in reaching a temperature of
41 °C. This increase in efficiency was due
to the increase in the thermal conductivity
of the PCM with the addition of copper
foam.
0 1500 3000 4500 6000 7500 9000
30
32
34
36
38
40
42
44
Tem
pera
ture
(°C
)
Time (s)
Temperature
Fig. 5. Temperature variation of hybrid thermal
management system
The above graph is for the hybrid thermal
management system consisting of a fan
and a composite PCM. From the graph we
conclude that it took approximately 6900
seconds (115 min.) for the proposed
thermal management system to reach the
saturation temperature of 39 °C and 8350
seconds (139.16 min) to reach 41 °C. By
drawing a comparison between the three
thermal management systems to reach a
temperature of 41 °C, the hybrid system
appears to be 25.6% more efficient than
pure paraffin and 15.6% more efficient
than composite PCM.
Conclusion
➢ The purpose of this experimental study
was to compare the effectiveness of
active and passive thermal management
systems.
➢ From the graphs and discussion above,
we conclude that without any thermal
management system, the temperature of
electronic device will rise beyond
acceptable limits which will ultimately
result in the failure of the device.On the
other hand pure paraffin, due to its low
thermal conductivity, loses its
effectiveness earlier than composite
PCM.
➢ With the addition of copper foam in pure
paraffin, the thermal conductivity of
paraffin increases and composite PCM
appears 9% better than pure paraffin.
While comparing the hybrid thermal
management system with air as cooling
medium, we see a 25.6% and 15.6%
increase in efficiency respectively,
compared with pure paraffin and
composite PCM. So we conclude with
the addition of air, the hybrid thermal
management system performed better
compared with the other passive systems
mentioned here.

3rd Pak-Turk International Conference on Emerging Technologies in the field of Sciences and Engineering
9-10th June 2020
119
REFERENCES
[1] G. Hetsroni, A. Mosyak, Z. Segal, and G.
Ziskind, “A uniform temperature heat
sink for cooling of electronic devices,”
Int. J. Heat Mass Transf., vol. 45, no. 16,
pp. 3275–3286, 2002, doi:
10.1016/S0017-9310(02)00048-0.
[2] S. F. Hosseinizadeh, F. L. Tan, and S. M.
Moosania, “Experimental and
numerical studies on performance of
PCM-based heat sink with different
configurations of internal fins,” Appl.
Therm. Eng., vol. 31, no. 17–18, pp.
3827–3838, 2011, doi:
10.1016/j.applthermaleng.2011.07.03
1.
[3] A. Pesaran, “Battery Thermal
Management in EVs and HEVs : Issues
and Solutions,” Adv. Automot. Batter.
Conf., p. 10, 2001.
[4] T. Wang, K. J. Tseng, and J. Zhao,
“Development of efficient air-cooling
strategies for lithium-ion battery
module based on empirical heat source
model,” Appl. Therm. Eng., vol. 90, pp.
521–529, 2015, doi:
10.1016/j.applthermaleng.2015.07.03
3.
[5] H. Park, “A design of air flow
configuration for cooling lithium ion
battery in hybrid electric vehicles,” J.
Power Sources, vol. 239, pp. 30–36,
2013, doi:
10.1016/j.jpowsour.2013.03.102.
[6] R. T. Jacobsen and E. W. Lemmon,
“Viscosity and Thermal Conductivity
Equations for Nitrogen, Oxygen, Argon,
and Air,” Int. J. Thermophys., vol. 25,
no. 1, pp. 21–69, 2004.
[7] S. A. Khateeb, M. M. Farid, J. R. Selman,
and S. Al-Hallaj, “Design and simulation
of a lithium-ion battery with a phase
change material thermal management
system for an electric scooter,” J. Power
Sources, vol. 128, no. 2, pp. 292–307,
2004, doi:
10.1016/j.jpowsour.2003.09.070.
[8] S. Al-Hallaj and J. R. Selman, “Thermal
modeling of secondary lithium
batteries for electric vehicle/hybrid
electric vehicle applications,” J. Power
Sources, vol. 110, no. 2, pp. 341–348,
2002, doi: 10.1016/S0378-
7753(02)00196-9.
[9] A. Sharma, S. D. Sharma, and D. Buddhi,
“Accelerated thermal cycle test of
acetamide, stearic acid and paraffin
wax for solar thermal latent heat
storage applications,” Energy Convers.
Manag., vol. 43, no. 14, pp. 1923–1930,
2002, doi: 10.1016/S0196-
8904(01)00131-5.
[10] Z. Rao and S. Wang, “A review of power
battery thermal energy management,”
Renew. Sustain. Energy Rev., vol. 15,
no. 9, pp. 4554–4571, 2011, doi:
10.1016/j.rser.2011.07.096.
[11] R. Kizilel, A. Lateef, R. Sabbah, M. M.
Farid, J. R. Selman, and S. Al-Hallaj,
“Passive control of temperature
excursion and uniformity in high-
energy Li-ion battery packs at high
current and ambient temperature,” J.
Power Sources, vol. 183, no. 1, pp. 370–
375, 2008, doi:
10.1016/j.jpowsour.2008.04.050.
[12] H. T. Cui, “Experimental investigation
on the heat charging process by
paraffin filled with high porosity copper

3rd Pak-Turk International Conference on Emerging Technologies in the field of Sciences and Engineering
9-10th June 2020
120
foam,” Appl. Therm. Eng., vol. 39, pp.
26–28, 2012, doi:
10.1016/j.applthermaleng.2012.01.03
7.
[13] A. Sari and A. Karaipekli, “Thermal
conductivity and latent heat thermal
energy storage characteristics of
paraffin/expanded graphite composite
as phase change material,” Appl.
Therm. Eng., vol. 27, no. 8–9, pp. 1271–
1277, 2007, doi:
10.1016/j.applthermaleng.2006.11.00
4.
[14] S. A. Khateeb, S. Amiruddin, M. Farid, J.
R. Selman, and S. Al-Hallaj, “Thermal
management of Li-ion battery with
phase change material for electric
scooters: Experimental validation,” J.
Power Sources, vol. 142, no. 1–2, pp.
345–353, 2005, doi:
10.1016/j.jpowsour.2004.09.033.
[15] W. Q. Li, Z. G. Qu, Y. L. He, and Y. B. Tao,
“Experimental study of a passive
thermal management system for high-
powered lithium ion batteries using
porous metal foam saturated with
phase change materials,” J. Power
Sources, vol. 255, pp. 9–15, 2014, doi:
10.1016/j.jpowsour.2014.01.006.
[16] A. Bhattacharya, V. V. Calmidi, and R. L.
Mahajan, “Thermophysical properties
of high porosity metal foams,” Int. J.
Heat Mass Transf., vol. 45, no. 5, pp.
1017–1031, 2002, doi: 10.1016/S0017-
9310(01)00220-4.
[17] R. Baby and C. Balaji, “Experimental
investigations on thermal performance
enhancement and effect of orientation
on porous matrix filled PCM based heat
sink,” Int. Commun. Heat Mass Transf.,
vol. 46, pp. 27–30, 2013, doi:
10.1016/j.icheatmasstransfer.2013.05.
018.
[18] Z. Chen, D. Gao, and J. Shi,
“Experimental and numerical study on
melting of phase change materials in
metal foams at pore scale,” Int. J. Heat
Mass Transf., vol. 72, pp. 646–655,
2014, doi:
10.1016/j.ijheatmasstransfer.2014.01.
003.
[19] Z. Rao, S. Wang, and G. Zhang,
“Simulation and experiment of thermal
energy management with phase
change material for ageing LiFePO4
power battery,” Energy Convers.
Manag., vol. 52, no. 12, pp. 3408–3414,
2011, doi:
10.1016/j.enconman.2011.07.009.
[20] R. Sabbah, R. Kizilel, and J. R. Selman,
“Active ( air-cooled ) vs . passive ( phase
change material ) thermal
management of high power lithium-ion
packs : Limitation of temperature rise
and uniformity of temperature
distribution,” vol. 182, pp. 630–638,
2008, doi:
10.1016/j.jpowsour.2008.03.082.
[21] Z. Ling, F. Wang, X. Fang, X. Gao, and Z.
Zhang, “A hybrid thermal management
system for lithium ion batteries
combining phase change materials with
forced-air cooling,” Appl. Energy, vol.
148, pp. 403–409, 2015, doi:
10.1016/j.apenergy.2015.03.080.
[82]

3rd Pak-Turk International Conference on Emerging Technologies in the field of Sciences and Engineering
9-10th June, April 2020
121
Effects of Combined Use of Metakaolin, Silica fume and Coconut Fibers on Different Properties
of Cement Composite
Mian Syed Nawab1,a and Muhammad Yaqub2,b
1M.Sc Scholar, Civil Engineering Department, University of Engineering and Technology, Taxila
(47050) Pakistan
2Professor, Civil Engineering Department, University of Engineering and Technology, Taxila
(47050) Pakistan
Email address: a) [email protected] b) [email protected]
Abstract—This research work presents the effects of combined use of metakaolin, silica fume and
coconut fibers on different properties of cement mortar composites. The proportion of 0.8:0.2:1
(Cement: Pozzolans: Sand) was kept fixed with water to binding materials ratio varies from 0.35 to 0.60
depending on the coconut fibers content to fulfil the need of workability requirements. In this study
total 180 specimens of various sizes were casted in two different phases, in phase-I, 54 specimens each
nine specimens of the same percentage of 20% cement replaced with silica fume and metakaolin were
casted for maximum compressive strength to get optimum value for metakaolin and silica fume
combination. In phase-II, further 126 fibers reinforced mortars specimens were casted with optimum
value of metakaolin and silica fume obtained in phase-I with varying content of coconut fibers 0%,
3%,6%,9%,12% and 15% by weight of binder and replacing the composition of sand. The samples
were then investigated for compressive strength, modulus of rupture (MOR), water absorbing capacity
and moisture content at 7day, 14day and 28day curing age.
Keywords— metakaolin, silica fume, coconut fibers, compressive strength, flexural strength, water
absorption and moisture content.
I. INTRODUCTION
Cement mortar composite is one of the most versatile construction material and has wide
application in plastering, masonry work, repairing of damaged concrete structures, filling or patching,
floor leveling, rendering and also in the development of precast structures and products. It is much
important to achieve high performance cement composite for utilization in many applications, like
for concrete repair instantly, pavements, flooring, roof treatment, high compressive strength precast
structures and rehabilitation applications. Metakolin has been proved to be effective in improving

3rd Pak-Turk International Conference on Emerging Technologies in the field of Sciences and Engineering
9-10th June, April 2020
122
both early and also long term mechanical and physical properties of the composite cement paste and
concrete, a replacement range of 10 to 15% metakaolin has showed very effective results in this regard
[1]. The value of compressive strength of composite increases varying in the range between 20 to
30% with 5-15% cement replacement by silica-fume [2].Artificial and natural fibers were used for
reinforcing the matrix to improve the toughness, ductility, flexural strength, resistance to fatigue and
impact resisting nature. Natural fibers are cheaper, renewable, abundantly available and show very
little health concern during processing and handling [3]. Among all natural fibers because of highest
toughness, low water absorption and abundantly availability as an agricultural waste, the use of
coconut fiber as a reinforcement in low cost structure is of great interest from last few decades.
Metakaolin has positive impacts while silica fume has negative impacts on the workability but their
co-addition of metakaolin and silica fume can reduce the negative impact of silica fume, secondly
concerning strength, metakaolin and silica fume both have positive impacts, but the combination of
silica fume and metakaolin has the significant impacts which improves the strength more than the rise
in strength due to sole incorporation of metakaolin or silica fume [4]. This research was aimed to
investigate the impacts of combined addition of metakaolin and silica fume as a replacement of some
proportion of cement and natural coconut coir fibers as reinforcement for the composite cement.
II. EXPERIMENTAL PROGRAME
A. Materials and preparation of samples
Ordinary Portland Cement (Dewan brand), local coarse river sand, local natural coconut fibers,
metakaolin, silica fume and water reducing agent were used in casting of samples. The proportion
0.8:0.2:1 (cement: pozzolans: sand) was kept fixed with water to binder ratio varies from 0.35 to 0.60
depending on the coconut fibers content and to fulfil the need of workability requirements. Admixture
Ultra 235 is used at the rate of 0.7% by weight of the cementitious materials. Samples were prepared
in two phases, In phase-I plain cement mortar samples each nine samples of the same percentage of
cement replacement with silica fume (SF) and metakaolin (MK) were casted for each of the six
combination 0% SF-0% MK, 20% SF-0% MK, 0% SF-20% MK, 10% SF 10%MK, 5% SF 15% MK,
15% SF-5% MK to obtain optimum combination in term of compressive strength. In phase two, fibers
reinforced cement mortar samples were casted with optimum value of silica fume and metakaolin
combination obtained in phase-I and with varying content of coconut fibers 0%, 3%, 6%, 9%, 12%
and 15%.to test for physical and mechanical properties, proportions of cement mortar composites are
presented in Table 1. All the ingredients are measured by mass. The increase in water to cementitious
materials ratio in fibers reinforced mortar mix is done to cover the additional water required by the
coconut fibers in the mortar mix.. For preparation of coconut fibers reinforced mix, all the ingredients
of the composite were placed in the mixer pan in three layers. In first layer, fine aggregates were
placed in the mixer pan, then fiber were dispersed above them manually, followed by cement and

3rd Pak-Turk International Conference on Emerging Technologies in the field of Sciences and Engineering
9-10th June, April 2020
123
finally pozzolans were added. This same procedure of laying was repeated for second and third layer.
The mixer was run for three and half minutes. Then about one 3rd portion of the total water required
for the mixture was added to the mixture, and the concrete mixer machine was run for three and half
minutes again. The mixing process was observed carefully to avoid balling of coconut fibers and
segregation of mortar ingredients. All the samples were poured into molds in three properly
compacted layers. After a period of 24 hours take the specimens from molds and put them for curing
in water tank immediately.
TABLE I. SAMPLE PROPORTIONS
B. Testing Procedures
The casted specimens were carefully handled to be safe from any damage which could affect the
results. Compression test on the samples was performed by Universal testing machine (UTM) with
the rate of loading 1.8KN/s. The size of sample used for compressive strength test is 160 mm x 40
mm x 40 mm. MOR (Modulus of rupture) tests were conducted on the sample size of 400 mm x 100
mm x 16 mm strip beam. The strip was supported on both ends and load is applied on its one over
third of its span length (3rd point loading flexural test) up to the failure loading. The flexural strength
or MOR is then calculated. The size of specimen used for water absorption test and moisture content
test is same which is100 mm x 100 mm x 40 mm. To calculate the moisture content of composite,
composites were placed in an oven at 100C temperature for 24 hours and then the change samples
weight before and after samples were placed in an oven was measured. For determination of water
absorption, composite were placed in water for 24 hours and then the change in weight of samples
before and after watering was noted. All tests mechanisms have complied according to BS 5669 Part
1: 1989.
Sample No. Water to binder ratio Fiber content (%)
1 0.35 0
2 0.40 3
3 0.45 6
4 0.50 9
5 0.55 12
6 0.60 15

3rd Pak-Turk International Conference on Emerging Technologies in the field of Sciences and Engineering
9-10th June, April 2020
124
III. RESULTS AND DISCUSSION
A. Compressive strength of plain cement composite
The compressive strengths of plain cemnet composites were determined at 7day, 14day and 28day
and the results are presented in Fig.1. It was observed that among all the mortar composites, the
composite cement with 10% silica fume and 10% metakaolin gives the highest values of compressive
strength at 7day, 14day and 28day, the value of compressive strength at 7 days is 59.2Mpa at 14 days
is 67.8Mpa and at 28 days is 75.3Mpa. It was indicated from the results that 10% silica fume and
10% metakaolin combination give better results than pure use of either 20% silica fume or 20%
metakaoline. From the comparision with controlled samples we found that this optimum combination
increase the 7 days compressive strength by 13.6 %, 14 day strength by 20.4% and 28 days strength
by 28.3%.
Fig.1. Compressive strength for different Silica fume (SF) and Metakaolin (MK) combination
B. Compressive strength of coconut fiber reinforced composite
The behaviors of the composite having optimum value of metakaolin and silica fume combination
obtained in phase-I reinforced with different proportion of coconut fibers is determined by
compression test at 7day,14day and 28day, all the results are presented here in Fig.2.
0
10
20
30
40
50
60
70
80
SF0-MK0 SF20-MK0 SF15-MK5 SF10-MK10 SF5-MK15 SF0-MK20
Com
pre
ssiv
e st
ren
gth
(Mpa)
Silica fume and Metakaolin content (%)
7 days
14 days
21 days

3rd Pak-Turk International Conference on Emerging Technologies in the field of Sciences and Engineering
9-10th June, April 2020
125
Fig.2 Comparison of compressive strength for different percentage of coconut fiber content
It was observed from the results that among all the coir reinforced cement composites, the mortar
fibers reinforced specimens having 6% fibers content shows the highest value of compressive strength
at all the three ages 7day, 14day and 28day which are 62.3Mpa, 73Mpa and 78.6Mpa respectively.
After 6% content of coconut fibers the results obtained at 9% , 12% and 15% decreases significantly
and the lowest values of compressive strength results at all the three ages are obtained at 15% coconut
fiber content which are 25.1Mpa, 27.1Mpa and 28.4Mpa at 7, 14 and 28day respectively. The values
of compressive strength obtained here are showing similar trend to the work of Alida [5].
C. Modulus of rupture (MOR)
Modulus of rupture (MOR) results are obtained at 7day, 14day and 28day which are presented
here in Fig.3. The highest value of 16.7MPa obtained from the mortar specimens having 6% fibers
content and at 28 day curing age. From all results obtained after 7, 14 and 28 days curing duration, it
is found that modulus of rupture of composite increased with rise in percentage of fibers content.
However after 6% content further addition of fibers decreased the flexural strength of the specimens.
The reason is that at low content of fibers with uniform distribution has ability to bridge the micro
structure of cracks significantly and also produced fibers balling effects so leads to good cracks arrest
in the cement mortar specimen [6-8]. However, the use of natural coir fibers above 6 % leads to coir
fibers agglomeration so result in strength reduction.
0
10
20
30
40
50
60
70
80
90
0 3 6 9 12 15
Co
mp
ress
ive
stre
ngth
(Mp
a)
Coconut fiber content (wt%)
7 days
14 days
21 days

3rd Pak-Turk International Conference on Emerging Technologies in the field of Sciences and Engineering
9-10th June, April 2020
126
Fig.3. Comparison of modulus of rupture for different percentage of coconut fiber content
D. Moisture content of mortar composites
Moisture content values for all mortar specimens at 7day, 14day and 28day curing durations are
determined and are presented in Fig.4
Fig.4. Comparison of moisture content for different percentage of coconut fiber content
From graphical representation, it was noted that the cement mortar specimens with 15% fibers content after
curing age of 28 days gives 7.7% moisture content value which is the highest among all specimens
and the lowest value is 3.3 % which is corresponding to control composites at 7 day of curing age.
0
2
4
6
8
10
12
14
16
18
0 3 6 9 12 15
Mo
du
lus
of
rup
ture
(Mp
a)
Coconut fiber content (wt%)
7 days
14 days
21 days
0
1
2
3
4
5
6
7
8
0 3 6 9 12 15
Mois
ture
conte
nt
(%)
Coconut fiber content (wt%)
7 days
14 days
21 days

3rd Pak-Turk International Conference on Emerging Technologies in the field of Sciences and Engineering
9-10th June, April 2020
127
It was noted from the graph that for less percentage of fiber content from 0 to 6% the moisture content
increases gradually at a slower rate but after 6% there is a sudden rise in the moisture content of the
composites.
E. Water absorption of mortar composites
The 7day, 14day and 28day water absorption results are determined and presented in Fig.5, It
was noted that the water absorption capacity of composites increases with increases in coconut fibers
content and also noted that the capacity of absorbing decreases with curing age. The cement mortar
specimens reinforced with 15% fiber content have the highest value which is 4.5% whereas the
reference sample having no coconut fiber indicated the lowest value which is 0.76%. Cement
composites produced by using high fibers content showed the high value of water absorption which
attributed to fall in the composites density and so resulted in higher rate of porosity of the mortar [9].
Fig.5. Comparison of water absorption for different percentage of coconut fiber content
IV. CONCLUSION
This experimental study is carried out to analyze the behaviors of the cement composite having 20%
cement replaced by silica fume and metakaolin reinforced with a range of different proportion of
natural coconut fibers. 54 specimens were casted and tested in phase 1 to get optimum value of silica
fume and metakaolin combination in term of compressive strength of cement mortar, Then in phase
2 comparative study was undertaken considering various parameters of the cement mortar reinforced
with a range of coconut fibers to get the optimum value of fibers content. Based on test results presented in
this research work, the following important conclusions may be drawn:
0
1
2
3
4
5
0 3 6 9 12 15
Wat
er a
bso
rpti
on(%
)
Coconut fiber content (wt%)
7 days
14 days
21 days

3rd Pak-Turk International Conference on Emerging Technologies in the field of Sciences and Engineering
9-10th June, April 2020
128
• The optimum value for silica fume and metakaolin combination for compressive strength of the
plain mortar composites is 10%SF and 10MK which give highest compressive strength (75.3Mpa)
among all the six combinations (0SF-0MK, 20SF-0MK, 15SF-5MK, 10SF-10MK, 5SF-15MK
and 0SF-20MK) of metakaolin and silica fume for 20% cement replacement.
• In case of natural coconut fiber reinforcement cement composite, It was found that 6% coconut
fiber content give better results among all the six combinations (0%, 3%, 6%, 9%,12% and 15%)
in term of compressive strength(78.6Mpa) and Modulus of rupture(16.7Mpa).
• Reference sample shows lowest moisture content value which is 3.3% addition of fiber increases
the moisture content gradually for low content 51 up to 6% and after that the rise in moisture
content is rapid and give highest value at 15% fiber content.
• .Reference sample show lowest water absorption of 0.76 % compared to coconut fibers
reinforced composites and increase with increase in fibers content, it was observed that water
absorption capacity of composites decreases with curing age of the specimens.
REFERENCES
[1] K.Z. Farhan and W.A. Gul, “Impact of Metakaolin on Cement Mortar and Concrete”: A
Review. International Journal of Civil Engineering and Technology, 8(4), 2017, pp. 2157–2172
[2] Harjinder Singh, Shikha, Bansal,” Effect of Silica fume on the strength of cement mortar” :
International Journal of Research in Engineering and Technology 2015
[3] Zulkifli, R., M.J. Mohd Nor, A.R. Ismail, M.Z. Nuawi, S. Abdullah, M.F. Mat Tahir and M.N.
Ab. Rahman, 2009. Comparison of Acoustic Properties between Coir Fiber and Oil Palm Fiber,
European Journal of Scientific Research, 33(1): 144-152
[4] S.H. Chu, A.K.H. Kwan, “Co-addition of metakaolin and silica fume in mortar: effects
and advantages”: Construction and Building Materials 197 (2019) 716-724 1228.
[5] A .Alida, J. B. Shamsul, M. N. Mazlee, H. Kamarudin ”Composite Cement Reinforced
Coconut Fiber: Physical and Mechanical Properties and Fracture Behavior”: Australian Journal
of
Basic and Applied Sciences (2011), p. 1228.
[6] J. L. Pehanich, P. R. Blankenhorn, and M. R. Silsbee: Cement Concrete Research (2004), p. 59.
[7] G. Ramakrishna & T. Sundarajan: Cement and Concrete Composites Vol. 27 (2005), p. 547.
[8] W. H. Zhu, B. C. Tobias, R. S. P. Coutts, & G. Langfors: Cement and Concrete Composites

3rd Pak-Turk International Conference on Emerging Technologies in the field of Sciences and Engineering
9-10th June, April 2020
129
Vol.16 (1994), p.3
[9] A. Ashori,T.Tabarsa & S.Sepahvand: Construction and Building Materials, Vol.26 (2012), p.131.

3rd Pak-Turk International Conference on Emerging Technologies in the field of Sciences and Engineering
9-10th June, April 2020
130
Paper Title Investigating the wet-chemical growth
of CdS quantum-dots on metal-sulfide interfacial
layers deposited by ALD
Ijaz Ali1,a, Tae Joo Park2,b and Muhammad Abdul Basit3,c
1 Department of Materials Science and Chemical Engineering, Hanyang University, Ansan 15588, Republic
of Korea
2 Department of Materials Science and Engineering, Institute of Space Technology, Islamabad 44000,
Pakistan
Email address: a) [email protected] , b) [email protected] and c) [email protected]
Abstract—Owing to their unique and tunable optoelectronic characteristics, Quantum-dots (QDs) are
considered as the most efficient nanoscale materials for various advanced applications including solar cells.
Expansive and technologically complicated photovoltaic devices such as thin film solar cells and/or dye-sensitized
solar cells are under-replacement solely due to the evolution of QDs, introducing newer family of solar cells
including perovskite and QDs-sensitized solar cells (QDSCs). The technological progress of these devices is so far
slow and a lot of optimization is required regarding the optimal deposition and energy harvesting of QDs without
detrimental electronic issues of back-transfer of charge carriers and electron-hole recombination. In this work, we
have focused the issue of lower energy harvesting in thin films deposited by wet-chemical methods such as
successive ionic layer adsorption and reaction (SILAR) by introducing atomic layer deposited (ALD) ZnS, SnS
and MoS2 IL on TiO2-deposited Si-wafer. The aim was to in-depth analyze the nucleation and growth trend in
QDs, considering CdS as a reference material owing to its stability for atomic force microscopic (AFM)
examination. It was deduced that all metal-sulfide layers deposited by ALD enhance the deposition of CdS QDs
and can prove beneficial for optoelectronic devices incorporating QDs, however their increased deposition is
importantly classified in terms of coverage and size of QDs, differently. Considering the results of our will be
beneficial for optimizing the QDs based devices in general and CdS QDSCs, in particular.
Keywords—Quantum-dots, SILAR, ALD, nucleation, atomic force microscopy
Introduction
ALD is an outstanding thin film deposition techniques owing to its unique set of characteristics
comprising of sub-nanoscale thickness control [1]. Conventionally, oxide based materials such
as Al2O3, SiO2, HfO2, TiO2 and ZnO etc. were deposited using ALD [2]–[4]. Later on, metal
sulfides were also tested for development and application of ALD films in various technological
fields [5]. Importantly, Dasgupta et al. [6] extended the applications of ALD by depositing PbS
based QDs directly. It is to highlight here that it had been very challenging to replace the oxygen
based anionic precursors (i.e., O2, H2O or ozone) with sulphur-based precursors H2S. ALD
deposition of metal-sulfides of any compositional kind is associated with deterioration of
precursor channels and contamination of gas lines inside the ALD equipment. Overcoming these

3rd Pak-Turk International Conference on Emerging Technologies in the field of Sciences and Engineering
9-10th June, April 2020
131
challenges, researchers soon managed to deposit CuInS2 [7] absorbing layer for solar cells by
ALD, which avowed the potential of ALD for deposition of metal-sulfide based films as well.
With the evolution of metal-sulfides deposition, ALD became more influential in the
technological application of solar cells, particularly QDSCs [6], [8], [9]. Since QDSCs have
great potential to meet the modern day energy crisis by offering low-cost and facile development
of solar cells, there is a need to uplift its performance in terms of power conversion efficiency
(PCE) which is still lower than commercialized Si-based and thin film based solar cells [10].
One of the way to enhance the performance of solar cells (particularly QDSCs) is to enhance the
deposition of absorbing materials so that maximum energy is absorbed from incident light and
there is no waste of energy in the form of reflected and/or transmitted light.
To realize such kind of higher deposition of QDs is still under investigation for QDSCs, as
QDSCs mainly have mesoporous TiO2 network [8], [11], [12]. Therefore, the deposition of QDs
inside and/or over a substrate need to be explored so that the enhancements strategies are
revealed in more effectual way. In this work, we have attempted the deposition of CdS over ZnS,
SnS and MoS2 ALD films and exposed their role for the nucleation and growth of CdS QDs. It
was deduced that increase in the deposition of QDs is not always useful as it may have
detrimental increase in their size instead of covering more and more surface of the substrate.
Energy dispersive spectroscopy (EDS) couples with atomic force microscope (AFM) was used to
outline the dynamics of QDs growth over ZnS, SnS and MoS2.
Materials and Methods
Atomic layer deposition of ZnS, SnS and MoS2
Atomic layer deposition of all films was carried out on a TiO2-coated Si-substrate [13]. The idea
behind the substrate selection was to provide a similar surface (though planar) for secondary
deposition of QDs as in QDSCs. The development of such analogous surface was carried out in
accordance with previous reports [10]. Diethyl zinc (DEZ) and H2S; Tetrakis(dimethylamino)
Tin (TDMASn, Sn[N(CH3)2]4) and H2S, and Mo(NMe2)4 and H2S were respectively used for the
deposition of ZnS, SnS and MoS2 by using ALD of traveling-wave type (CN-1 Co.). Further
details of ALD process can be obtained from references [13].
Wet-chemical deposition of CdS QDs
CdS QDs were deposited on TiO2-deposited Si-substrates without (considered as reference
sample in this study) and with (either ZnS or SnS or MoS2) ALD film via SILAR process [10],
[12]. Briefly, all substrates were first immersed in 0.05 M solution of Cd(NO3)2 in water for 1
min (for the adsorption of Cd-ions on the surface of substrates). Then the poorly attached Cd-
ions were washed away using water, leaving behind strongly attached Cd-ions. During the
second main step of SILAR, each substrate film was separately introduced to an aqueous
solution of 0.05 M Na2S so that S-ions react with pre-adsorbed Cd-ions, forming individual CdS
QDs. The substrates were washed again. The same process was repeated for five times and
resultant samples were analyzed further. MIRA 3-TESCAN modelled scanning electron
microscope (FESEM) available at Institute of Space Technology (IST) Islamabad, Pakistan was
used for high-magnification imaging and statistical estimation of composition using energy
dispersive spectrometry (EDS, Horbia). Flex-AFM of IST was utilized to record the deposition
characteristics of CdS QDs for each sample.

3rd Pak-Turk International Conference on Emerging Technologies in the field of Sciences and Engineering
9-10th June, April 2020
132
Results and Discussion
Fig. 1 shows the 3-dimensional atomic force microscopic outlook of TiO2-deposited Si-
substrates after the deposition of CdS QDs via SILAR. It can be seen in Fig. 1a that the reference
sample without any interfacial layer (w/o IL) produced larger grains of QDs as compared to ZnS
IL (Fig. 1b). While
Figure 29. Atomic force microscopic analysis of CdS-quantum dots deposition on TiO2 deposited Si-substrate (a) without and
with (b) ZnS, (c) SnS and (d) MoS2 interfacial layers. (e) Corresponding peak to valley roughness (Rpv) values
SnS IL produced the even thicker CdS layer (Fig. 1c), which is evident from its scale bar along
Y-axis that is extended to 40 nm from 20 nm for reference sample. It means that much higher
deposition of CdS occurred due to the presence of the SnS on TiO2-deposited Si-substrate, even
higher than that for ZnS IL. Contrarily, MoS2 showed a number of small QDs over its surface
which again means higher deposition of CdS, however the scale bar at Y-axis this time remained
lower (Fig. 1d). This was why the AFM based roughness value associated with MoS2 IL
remained even lower than w/o IL sample. It is important to clear at this point that there are two
possible routes for the increase in the deposition of CdS over surface. i.e., (1) In the horizontal
direction, which is termed as coverage from here onwards [12]-[14]. (2) In the vertical
directions, which is termed as growth from here onward. It is easy to understand that the
coverage of the CdS QDs on any IL is associated with its nucleation directly, while growth is the
secondary phenomena which preferably occurs on pre-existing nuclei. Assuming that ILs
provide nucleation sites or preferred surface for CdS to grow, we can easily see that there was a
contrasting behavior between all the ILs. CdS QDs with high coverage but low growth were
produced in case of ZnS and MoS2 IL, while SnS IL offered high growth with least nucleation
which is evident from roughness values of ZnS (7.8 nm), SnS (29.77) and MoS2 (17.62).

3rd Pak-Turk International Conference on Emerging Technologies in the field of Sciences and Engineering
9-10th June, April 2020
133
Figure 30 2D-scanning electron microscopic imaging of CdS-quantum dots deposited over TiO2 deposited Si-substrate (a)
without and with (b) ZnS, (c) SnS and (d) MoS2 interfacial layers (inset shows 2D-images taken by Nanosurf Flex-AFM).
Energy dispersive spectroscopy of standard TiO2 deposited Si-substrate having CdS QDs. CdS QDs were deposited via
successive ionic layer adsorption and reaction (SILAR) process.
The same trend in deposition of CdS QDs was reflected from FE-SEM images (Fig. 2a-d) where
higher CdS QDs was observed in case of all ILs and optimal in case of MoS2. Insets are showing
the 2D-AFM imaging of each sample and affirm the effectuality of ALD ILs for enhanced
deposition of CdS QDs. But as mentioned earlier, higher deposition may lead to detrimental
charge carrier recombination inside QDs, we remained focused to separate between CdS QDs
having more coverage, which are always expected to produce more light harvesting with lesser
internal defects [10], [14]. Therefore, we further performed EDS-analysis for determination of
the composition of all samples. In a typical EDS scan, we recorded the spectroscopic signals
originating from TiO2 (i.e., Ti and O), Si-substrate (Si mainly), and CdS (Cd and S). However, a
peak existing at about 2 was neglected as it belonged to Pt which is an auxiliary component
EDS-tested surfaces and introduced during the sample preparation for SEM.
Due to the limitation, all EDS maps are not presented here, however corresponding analysis is
summarized in Fig. 4. We can directly see that amongst all three ILs, SnS sample reflected the
maximum atomic percentage of Cd in it. Which is replication of the AFM trend where it had
maximum roughness value of 29.77 nm. While ZnS resulted in lowest peak for Cd, as well as S
showing lowest increase in the deposition of CdS QDs relative to TiO2-deposited Si-substrate
sample w/o IL (Fig. 3a). In case of MoS2 IL, TiO2-deposited Si-substrate additionally
contrastingly showed highest peak for S, even higher than that of SnS having optimal Cd peak. It
reflects that the signal of S is belonging to both ILs and CdS in all cases. This was why MoS2
having two times higher presence of S in its stoichiometric film resulted highest peak, i.e. two
sulfur atoms are bonded with each Mo in MoS2, unlike ZnS and SnS. In literature [12], [14], a
concomitant comparison of Cd and Ti in the form of Cd/Ti is often included to get rid of this
confusion. Cd/Ti ratio direct defines the quantitative trend in the deposition of CdS QDs. It is
evident that SnS IL avowed optimal value of ~3 for Cd/Ti, which roughly means that roughly 3
atoms were stacked over each Ti atom as a consequence of 5 cycles of SILAR deposition. Same

3rd Pak-Turk International Conference on Emerging Technologies in the field of Sciences and Engineering
9-10th June, April 2020
134
fact was evident from AFM where the Y-axis reached to a level of ~40 nm showing higher
growth. However, in this comparison the most interesting fact existed between ZnS and MoS2.
Both ILs showed almost similar Cd/Ti values while AFM roughness value was higher for MoS2
17.62 > 7.8 nm) than ZnS. Even the surface roughness value for reference sample w/o IL
remained higher than that for ZnS IL, while it had lower Cd/Ti ratio. These results depicted that
the deposition of CdS over ZnS was superior in terms of coverage (i.e. nucleation) than all other
samples.
Figure 31 EDS-based (a) atomic percentage values of Cd, S and Ti over various ALD interfacial layers and the (b) consequent
Cd/Ti ratio comparison showing the enhanced deposition of CdS QDs via SILAR
Figure 32 Various areas where ALD ILs can play influential role in devising the devices
As discussed earlier, the aim of the study was to analyze the deposition dynamics in-depth and to
evaluate that which type of IL favors higher QDs deposition with more coverage; we deduced
that ALD ZnS IL possesses beneficial role for deposition of CdS QDs and can prove valuable for
various optoelectronic applications [15], [16] summarized in Fig. 5. However, we have applied
ZnS IL for QDSCs successfully and the results will be reported elsewhere.
ACKNOWLEDGMENT
The authors are thankful to the Nanodevice Engineering Laboratory (NEL), Hanyang University
South Korea for the provision of TiO2-deposited Si-substrates and atomic layer deposition of
ZnS, SnS and MoS2.
REFERENCES

3rd Pak-Turk International Conference on Emerging Technologies in the field of Sciences and Engineering
9-10th June, April 2020
135
[1] R. W. Johnson, A. Hultqvist, and S. F. Bent, “A brief review of atomic layer deposition: from
fundamentals to applications,” Mater. Today, vol. 17, no. 5, pp. 236–246, Jun. 2014, doi:
10.1016/j.mattod.2014.04.026.
[2] K. E. Roelofs et al., “Effect of Al2O3 Recombination Barrier Layers Deposited by Atomic Layer
Deposition in Solid-State CdS Quantum Dot-Sensitized Solar Cells,” J. Phys. Chem. C, vol. 117, no. 11, pp.
5584–5592, Mar. 2013, doi: 10.1021/jp311846r.
[3] T. C. Li et al., “Surface Passivation of Nanoporous TiO2 via Atomic Layer Deposition of ZrO2 for
Solid-State Dye-Sensitized Solar Cell Applications,” J. Phys. Chem. C, vol. 113, no. 42, pp. 18385–18390,
Oct. 2009, doi: 10.1021/jp906573w.
[4] K. Sridharan, E. Jang, Y. M. Park, and T. J. Park, “Superior Photostability and Photocatalytic Activity
of ZnO Nanoparticles Coated with Ultrathin TiO2 Layers through Atomic-Layer Deposition,” Chem. – Eur. J.,
vol. 21, no. 52, pp. 19136–19141, 2015, doi: 10.1002/chem.201502876.
[5] N. P. Dasgupta, X. Meng, J. W. Elam, and A. B. F. Martinson, “Atomic Layer Deposition of Metal
Sulfide Materials,” Acc. Chem. Res., vol. 48, no. 2, pp. 341–348, Feb. 2015, doi: 10.1021/ar500360d.
[6] N. P. Dasgupta et al., “Atomic Layer Deposition of Lead Sulfide Quantum Dots on Nanowire
Surfaces,” Nano Lett., vol. 11, no. 3, pp. 934–940, Mar. 2011, doi: 10.1021/nl103001h.
[7] N. Schneider, M. Bouttemy, P. Genevée, D. Lincot, and F. Donsanti, “Deposition of ultra thin CuInS2
absorber layers by ALD for thin film solar cells at low temperature (down to 150 °C),” Nanotechnology, vol.
26, no. 5, p. 054001, Jan. 2015, doi: 10.1088/0957-4484/26/5/054001.
[8] M. A. Basit, M. A. Abbas, E. S. Jung, J. H. Bang, and T. J. Park, “Improved light absorbance and
quantum-dot loading by macroporous TiO2 photoanode for PbS quantum-dot-sensitized solar cells,” Mater.
Chem. Phys., vol. 196, pp. 170–176, Aug. 2017, doi: 10.1016/j.matchemphys.2017.03.057.
[9] C. Ding et al., “Understanding charge transfer and recombination by interface engineering for
improving the efficiency of PbS quantum dot solar cells,” Nanoscale Horiz., vol. 3, no. 4, pp. 417–429, Jun.
2018, doi: 10.1039/C8NH00030A.
[10] M. A. Abbas, M. A. Basit, T. J. Park, and J. H. Bang, “Enhanced performance of PbS-sensitized solar
cells via controlled successive ionic-layer adsorption and reaction,” Phys. Chem. Chem. Phys., vol. 17, no. 15,
pp. 9752–9760, Apr. 2015, doi: 10.1039/C5CP00941C.
[11] M. A. Basit, M. A. Abbas, J. H. Bang, and T. J. Park, “Efficacy of In2S3 interfacial recombination
barrier layer in PbS quantum-dot-sensitized solar cells,” J. Alloys Compd., vol. 653, pp. 228–233, Dec. 2015,
doi: 10.1016/j.jallcom.2015.08.237.
[12] M. A. Basit, M. A. Abbas, E. S. Jung, Y. M. Park, J. H. Bang, and T. J. Park, “Strategic PbS quantum
dot-based multilayered photoanodes for high efficiency quantum dot-sensitized solar cells,” Electrochimica
Acta, vol. 211, pp. 644–651, Sep. 2016, doi: 10.1016/j.electacta.2016.06.075.
[13] M. A. Basit et al., “Enhanced PbS quantum dot loading on TiO2 photoanode using atomic-layer-
deposited ZnS interfacial layer for quantum dot-sensitized solar cells,” Mater. Chem. Phys., vol. 220, pp. 293–
298, Dec. 2018, doi: 10.1016/j.matchemphys.2018.09.006.
[14] F. U. Hassan, U. Ahmed, M. Muhyuddin, M. Yasir, M. N. Ashiq, and M. A. Basit, “Tactical
modification of pseudo-SILAR process for enhanced quantum-dot deposition on TiO2 and ZnO nanoparticles
for solar energy applications,” Mater. Res. Bull., vol. 120, p. 110588, Dec. 2019, doi:
10.1016/j.materresbull.2019.110588.

3rd Pak-Turk International Conference on Emerging Technologies in the field of Sciences and Engineering
9-10th June, April 2020
136
[15] M. I. Aziz, F. Mughal, H. M. Naeem, A. Zeb, M. A. Tahir, and M. A. Basit, “Evolution of photovoltaic
and photocatalytic activity in anatase-TiO2 under visible light via simplistic deposition of CdS and PbS
quantum-dots,” Mater. Chem. Phys., vol. 229, pp. 508–513, May 2019, doi:
10.1016/j.matchemphys.2019.03.042.
[16] E. Jang et al., “Atomic layer deposition with rotary reactor for uniform hetero-junction photocatalyst,
g-C3N4@TiO2 core–shell structures,” RSC Adv., vol. 9, no. 57, pp. 33180–33186, Oct. 2019, doi:
10.1039/C9RA05958J.