KORESPONDENSI JURNAL - Undip PAK Repository
94
KORESPONDENSI JURNAL Energies 2022, volume 15, issue 5, March-1 2022, Article number 1782. Micro-Grid Oil Palm Plantation Waste Gasification Power Plant in Indonesia: Techno-Economic and Socio-Environmental Analysis Jaka Isgiyarta 1, *, Bambang Sudarmanta 2 , Jalu Aji Prakoso 3 , Eka Nur Jannah 4 and Arif Rahman Saleh 5, * 1. Tanggal 7 Desember 2021, Submission Received 2. Tanggal 14 Desember 2021, Assistant Editor Assigned 3. Tanggal 29 Desember 2021, Major Revisions 4. Tanggal 10 Januari 2022, English Editing 5. Tanggal 17 Januari 2022, Manuscript Resubmitted 6. Tanggal 17 Januari 2022, Revised Version Received 7. Tanggal 19 Januari 2022, Accepted for Publication 8. Tanggal 20 Januari 2022, Final Proofreading Before Publication 9. Tanggal 23 Januari 2022, 2nd Proof_ [Energies] Manuscript ID_ energies-1520840 - Final Proofreading Before Publication 10. Tanggal 30 Januari 2022, Need Your Confirmation_ [Energies] Manuscript ID_ energies- 1520840 11. Tanggal 28 Februari 2022, doi_ 10.3390_en15051782. – Promotion Tips 12. Tanggal 28 Februari 2022, doi_ 10.3390_en15051782. Paper has been published
-
Upload
khangminh22 -
Category
Documents
-
view
7 -
download
0
Transcript of KORESPONDENSI JURNAL - Undip PAK Repository

KORESPONDENSI JURNAL
Energies 2022, volume 15, issue 5, March-1 2022,
Article number 1782.
Micro-Grid Oil Palm Plantation Waste Gasification
Power Plant in Indonesia: Techno-Economic and
Socio-Environmental Analysis
Jaka Isgiyarta 1,*, Bambang Sudarmanta 2, Jalu Aji Prakoso 3, Eka Nur Jannah 4 and Arif Rahman
Saleh 5,*
1. Tanggal 7 Desember 2021, Submission Received
2. Tanggal 14 Desember 2021, Assistant Editor Assigned
3. Tanggal 29 Desember 2021, Major Revisions
4. Tanggal 10 Januari 2022, English Editing
5. Tanggal 17 Januari 2022, Manuscript Resubmitted
6. Tanggal 17 Januari 2022, Revised Version Received
7. Tanggal 19 Januari 2022, Accepted for Publication
8. Tanggal 20 Januari 2022, Final Proofreading Before Publication
9. Tanggal 23 Januari 2022, 2nd Proof_ [Energies] Manuscript ID_ energies-1520840 - Final
Proofreading Before Publication
10. Tanggal 30 Januari 2022, Need Your Confirmation_ [Energies] Manuscript ID_ energies-
1520840
11. Tanggal 28 Februari 2022, doi_ 10.3390_en15051782. – Promotion Tips
12. Tanggal 28 Februari 2022, doi_ 10.3390_en15051782. Paper has been published

5/13/22, 2:49 PM Email Universitas Tidar - [Energies] Manuscript ID: energies-1520840 - Submission Received
https://mail.google.com/mail/u/0/?ik=2b096d038c&view=pt&search=all&permthid=thread-f%3A1718450806067777801&simpl=msg-f%3A1718450806… 1/2
arif rahman saleh <[email protected]>
[Energies] Manuscript ID: energies-1520840 - Submission Received 1 pesan
Editorial Office <[email protected]> 7 Desember 2021 08.59Balas Ke: [email protected]: arif rahman saleh <[email protected]>Cc: jaka isgiyarta <[email protected]>, bambang sudarmanta <[email protected]>, jalu aji prakoso<[email protected]>, eka nur jannah <[email protected]>
Dear Dr. rahman saleh,
Thank you very much for uploading the following manuscript to the MDPI submission system. One of our editors will be in touch with you soon.
Journal name: Energies Manuscript ID: energies-1520840 Type of manuscript: Article Title: Micro-grid Oil Palm Plantation Waste Gasification Power Plant in Indonesia: Techno-Economic and Socio-Environment Analysis Authors: jaka isgiyarta *, bambang sudarmanta, jalu aji prakoso, eka nur jannah, arif rahman saleh * Received: 7 December 2021 E-mails: [email protected], [email protected], [email protected], [email protected], [email protected]
You can follow progress of your manuscript at the following link (login required): https://susy.mdpi.com/user/manuscripts/review_info/7a41453be7c4d6da9937655248c2f5ca
The following points were confirmed during submission:
1. Energies is an open access journal with publishing fees of 2000 CHF for an accepted paper (see https://www.mdpi.com/about/apc/ for details). This manuscript, if accepted, will be published under an open access Creative Commons CC BY license (https://creativecommons.org/licenses/by/4.0/), and I agree to pay the Article Processing Charges as described on the journal webpage (https://www.mdpi.com/journal/energies/apc). See https://www.mdpi.com/about/openaccess for more information about open access publishing.
Please note that you may be entitled to a discount if you have previously received a discount code or if your institute is participating in the MDPI Institutional Open Access Program (IOAP), for more information see https://www.mdpi.com/about/ioap. If you have been granted any other special discounts for your submission, please contact the Energies editorial office.
2. I understand that:
a. If previously published material is reproduced in my manuscript, I will provide proof that I have obtained the necessary copyright permission. (Please refer to the Rights & Permissions website: https://www.mdpi.com/authors/rights).
b. My manuscript is submitted on the understanding that it has not been published in or submitted to another peer-reviewed journal. Exceptions to this rule are papers containing material disclosed at conferences. I confirm that I will inform the journal editorial office if this is the case for my manuscript. I confirm that all authors are familiar with and agree with

5/13/22, 2:49 PM Email Universitas Tidar - [Energies] Manuscript ID: energies-1520840 - Submission Received
https://mail.google.com/mail/u/0/?ik=2b096d038c&view=pt&search=all&permthid=thread-f%3A1718450806067777801&simpl=msg-f%3A1718450806… 2/2
submission of the contents of the manuscript. The journal editorial office reserves the right to contact all authors to confirm this in case of doubt. I will provide email addresses for all authors and an institutional e-mail address for at least one of the co-authors, and specify the name, address and e-mail for invoicing purposes.
If you have any questions, please do not hesitate to contact the Energies editorial office at [email protected]
Kind regards, Energies Editorial Office St. Alban-Anlage 66, 4052 Basel, Switzerland E-Mail: [email protected] Tel. +41 61 683 77 34 Fax: +41 61 302 89 18
*** This is an automatically generated email ***

5/13/22, 2:50 PM Email Universitas Tidar - [Energies] Manuscript ID: energies-1520840 - Assistant Editor Assigned
https://mail.google.com/mail/u/0/?ik=2b096d038c&view=pt&search=all&permthid=thread-f%3A1719100917054599240&simpl=msg-f%3A1719100917… 1/1
arif rahman saleh <[email protected]>
[Energies] Manuscript ID: energies-1520840 - Assistant Editor Assigned 1 pesan
Adelina Simon <[email protected]> 14 Desember 2021 13.13Balas Ke: [email protected]: arif rahman saleh <[email protected]>Cc: Adelina Simon <[email protected]>, jaka isgiyarta <[email protected]>, bambang sudarmanta<[email protected]>, jalu aji prakoso <[email protected]>, eka nur jannah <[email protected]>,Energies Editorial Office <[email protected]>
Dear Dr. rahman saleh,
Your manuscript has been assigned to Adelina Simon for further processing who will act as a point of contact for any questions related to your paper.
Journal: Energies Manuscript ID: energies-1520840 Title: Micro-grid Oil Palm Plantation Waste Gasification Power Plant in Indonesia: Techno-Economic and Socio-Environment Analysis Authors: jaka isgiyarta *, bambang sudarmanta, jalu aji prakoso, eka nur jannah, arif rahman saleh *
Received: 07 December 2021 E-mails: [email protected], [email protected], [email protected], [email protected], [email protected]
You can find it here: https://susy.mdpi.com/user/manuscripts/review_info/7a41453be7c4d6da9937655248c2f5ca
Best regards, Ms. Adelina Simon Special Issue Editor, MDPI Avram Iancu str. 454, Cluj-Napoca, Romania Email: [email protected] Energies (IF: 3.004; http://www.mdpi.com/journal/energies) Linkedin: https://ch.linkedin.com/in/energies Twitter: @energies_MDPI Editor's Choice: https://www.mdpi.com/journal/energies/editors_choice
You are welcome to download your annual contribution report at https://susy.mdpi.com/user/manage_accounts
Disclaimer: MDPI recognizes the importance of data privacy and protection. We treat personal data in line with the General Data Protection Regulation (GDPR) and with what the community expects of us. The information contained in this message is confidential and intended solely for the use of the individual or entity to whom they are addressed. If you have received this message in error, please notify me and delete this message from your system. You may not copy this message in its entirety or in part, or disclose its contents to anyone.

5/13/22, 2:51 PM Email Universitas Tidar - [Energies] Manuscript ID: energies-1520840 - Major Revisions
https://mail.google.com/mail/u/0/?ik=2b096d038c&view=pt&search=all&permthid=thread-f%3A1720470140217155345&simpl=msg-f%3A1720470140… 1/4
arif rahman saleh <[email protected]>
[Energies] Manuscript ID: energies-1520840 - Major Revisions 4 pesan
Energies Editorial Office <[email protected]> 29 Desember 2021 15.56Balas Ke: [email protected]: arif rahman saleh <[email protected]>Cc: jaka isgiyarta <[email protected]>, bambang sudarmanta <[email protected]>, jalu aji prakoso<[email protected]>, eka nur jannah <[email protected]>, Energies Editorial Office <[email protected]>
Dear Dr. rahman saleh,
Thank you again for your manuscript submission:
Manuscript ID: energies-1520840 Type of manuscript: Article Title: Micro-grid Oil Palm Plantation Waste Gasification Power Plant in Indonesia: Techno-Economic and Socio-Environment Analysis Authors: jaka isgiyarta *, bambang sudarmanta, jalu aji prakoso, eka nur jannah, arif rahman saleh * Received: 7 December 2021 E-mails: [email protected], [email protected], [email protected], [email protected], [email protected]
Your manuscript has now been reviewed by experts in the field. Please find your manuscript with the referee reports at this link:
https://susy.mdpi.com/user/manuscripts/resubmit/7a41453be7c4d6da9937655248c2f5ca
Please revise the manuscript according to the referees' comments and upload the revised file within 10 days.
Please use the version of your manuscript found at the above link for your revisions.
(I) Any revisions to the manuscript should be marked up using the “Track Changes” function if you are using MS Word/LaTeX, such that any changes can be easily viewed by the editors and reviewers. (II) Please provide a cover letter to explain, point by point, the details of the revisions to the manuscript and your responses to the referees’ comments. (III) If you found it impossible to address certain comments in the review reports, please include an explanation in your rebuttal. (IV) The revised version will be sent to the editors and reviewers. Please confirm if Table 6 needs copyright permission. You can find in the system you paper with our Journals template, please make your revision on that version of your paper.
If one of the referees has suggested that your manuscript should undergo extensive English revisions, please address this issue during revision. We propose that you use one of the editing services listed at https://www.mdpi.com/authors/english or have your manuscript checked by a native English-speaking colleague.
Do not hesitate to contact us if you have any questions regarding the revision of your manuscript. We look forward to hearing from you soon.
Kind regards, Ms. Adelina Simon

5/13/22, 2:51 PM Email Universitas Tidar - [Energies] Manuscript ID: energies-1520840 - Major Revisions
https://mail.google.com/mail/u/0/?ik=2b096d038c&view=pt&search=all&permthid=thread-f%3A1720470140217155345&simpl=msg-f%3A1720470140… 2/4
Special Issue Editor, MDPI Avram Iancu str. 454, Cluj-Napoca, Romania Email: [email protected] Energies (IF: 3.004; http://www.mdpi.com/journal/energies) Linkedin: https://ch.linkedin.com/in/energies Twitter: @energies_MDPI Editor's Choice: https://www.mdpi.com/journal/energies/editors_choice
You are welcome to download your annual contribution report at https://susy.mdpi.com/user/manage_accounts
Disclaimer: MDPI recognizes the importance of data privacy and protection. We treat personal data in line with the General Data Protection Regulation (GDPR) and with what the community expects of us. The information contained in this message is confidential and intended solely for the use of the individual or entity to whom they are addressed. If you have received this message in error, please notify me and delete this message from your system. You may not copy this message in its entirety or in part, or disclose its contents to anyone.
arif rahman saleh <[email protected]> 7 Januari 2022 06.46Kepada: [email protected]
Dear Ms. Adelina Simon
First of all, I would like to thank you for the opportunity you have been given. Currently, I have made revisions accordingto the suggestion from the reviewer, but when I was going to submit the revision version, the submission status wasEnglish Pre Editing so I couldn't upload the revised version of the article. For this condition, I ask for more information.Thank you Manuscript detail:Manuscript ID: energies-1520840 Type of manuscript: Article Title: Micro-grid Oil Palm Plantation Waste Gasification Power Plant in Indonesia: Techno-Economic and Socio-Environment Analysis Authors: jaka isgiyarta *, bambang sudarmanta, jalu aji prakoso, eka nur jannah, arif rahman saleh *
best regard Arif Rahman Saleh, ST., MTProgram Studi Teknik MesinFakultas TeknikUniversitas Tidar email: [email protected], [email protected]: 082386085001
[Kutipan teks disembunyikan]
Adelina Simon <[email protected]> 7 Januari 2022 13.06Kepada: arif rahman saleh <[email protected]>Cc: [email protected], [email protected], [email protected], [email protected],[email protected]
Dear Dr. Rahman,
Thank you very much for your email. You paper current status is "English Pre Editing", can you please confirm if you or one co-authors have applied for editing services?
I'm looking forward to hearing from you.

5/13/22, 2:51 PM Email Universitas Tidar - [Energies] Manuscript ID: energies-1520840 - Major Revisions
https://mail.google.com/mail/u/0/?ik=2b096d038c&view=pt&search=all&permthid=thread-f%3A1720470140217155345&simpl=msg-f%3A1720470140… 3/4
Kind regards,
Ms. Adelina Simon Special Issue Editor, MDPI Romania Avram Iancu str. 454, Cluj-Napoca, Romania Email: [email protected] Energies (IF: 3.004; http://www.mdpi.com/journal/energies) Linkedin: https://www.linkedin.com/company/energies-mdpi/ Twitter: @energies_MDPI Editor's Choice: https://www.mdpi.com/journal/energies/editors_choice
Geological and Thermodynamic Analysis of Low Enthalpy Geothermal Resources to Electricity Generation Using ORC and Kalina Cycle Technology http://www.mdpi.com/1996-1073/13/6/1335
Prediction of Performance Variation Caused by Manufacturing Tolerances and Defects in Gas Diffusion Electrodes of Phosphoric Acid (PA)–Doped Polybenzimidazole (PBI)-Based High-Temperature Proton Exchange Membrane Fuel Cells http://www.mdpi.com/1996-1073/13/6/1345
Disclaimer: MDPI recognizes the importance of data privacy and protection. We treat personal data in line with the General Data Protection Regulation (GDPR) and with what the community expects of us. The information contained in this message is confidential and intended solely for the use of the individual or entity to whom they are addressed. If you have received this message in error, please notify me and delete this message from your system. You may not copy this message in its entirety or in part, or disclose its contents to anyone.
On 1/7/2022 1:46 AM, arif rahman saleh wrote: > Dear Ms. Adelina Simon > > First of all, I would like to thank you for the opportunity you have > been given. Currently, I have made revisions according to the suggestion > from the reviewer, but when I was going to submit the revision version, > the submission status was English Pre Editing so I couldn't upload the > revised version of the article. For this condition, I ask for more > information. Thank you > Manuscript detail: > Manuscript ID: energies-1520840 > Type of manuscript: Article > Title: Micro-grid Oil Palm Plantation Waste Gasification Power Plant in > Indonesia: Techno-Economic and Socio-Environment Analysis > Authors: jaka isgiyarta *, bambang sudarmanta, jalu aji prakoso, eka nur > jannah, arif rahman saleh * > > > best regard > *Arif Rahman Saleh, ST., MT* > /*Program Studi Teknik Mesin*/ > /Fakultas Teknik/ > /*Universitas Tidar */ > /email: [email protected] > <mailto:[email protected]>, [email protected] > <mailto:[email protected]>/ > /mobile: 082386085001/ > > > Pada tanggal Rab, 29 Des 2021 pukul 15.56 Energies Editorial Office > <[email protected] <mailto:[email protected]>> menulis: > > Dear Dr. rahman saleh,

5/13/22, 2:51 PM Email Universitas Tidar - [Energies] Manuscript ID: energies-1520840 - Major Revisions
https://mail.google.com/mail/u/0/?ik=2b096d038c&view=pt&search=all&permthid=thread-f%3A1720470140217155345&simpl=msg-f%3A1720470140… 4/4
> > Thank you again for your manuscript submission: > > Manuscript ID: energies-1520840 > Type of manuscript: Article > Title: Micro-grid Oil Palm Plantation Waste Gasification Power Plant in > Indonesia: Techno-Economic and Socio-Environment Analysis > Authors: jaka isgiyarta *, bambang sudarmanta, jalu aji prakoso, eka > nur > jannah, arif rahman saleh * > Received: 7 December 2021 > E-mails: [email protected] > <mailto:[email protected]>, [email protected] > <mailto:[email protected]>, > [email protected] <mailto:[email protected]>, > [email protected] <mailto:[email protected]>, > [email protected] <mailto:[email protected]> [Kutipan teks disembunyikan]> Email: [email protected] <mailto:[email protected]> > Energies (IF: 3.004; http://www.mdpi.com/journal/energies > <http://www.mdpi.com/journal/energies>) > Linkedin: https://ch.linkedin.com/in/energies [Kutipan teks disembunyikan]
arif rahman saleh <[email protected]> 9 Januari 2022 14.56Kepada: Adelina Simon <[email protected]>Cc: [email protected], "[email protected]" <[email protected]>, Jalu Aji Prakoso<[email protected]>, [email protected], [email protected]
Yes, I confirm. I have confirmed with the co-author and he is trying to submit English editing. However, the process has not beencompleted because what was submitted is not the result of our final revision. Is it possible if the revision upload processcan be reopened and the files that are included in the english editing process are the files we just revised? thank you
Arif Rahman Saleh, ST., MTProgram Studi Teknik MesinFakultas TeknikUniversitas Tidar email: [email protected], [email protected]: 082386085001
[Kutipan teks disembunyikan]

5/13/22, 2:57 PM Email Universitas Tidar - [Energies] Manuscript ID: energies-1520840 - English Editing
https://mail.google.com/mail/u/0/?ik=2b096d038c&view=pt&search=all&permthid=thread-f%3A1721559950359716975&simpl=msg-f%3A1721559950… 1/5
arif rahman saleh <[email protected]>
[Energies] Manuscript ID: energies-1520840 - English Editing 1 pesan
Adelina Simon <[email protected]> 10 Januari 2022 16.38Kepada: arif rahman saleh <[email protected]>Cc: [email protected], "[email protected]" <[email protected]>, Jalu Aji Prakoso<[email protected]>, [email protected], [email protected]
Dear Dr. Rahman,
Thank you for your email. When the English editing will be done, you will received an email with a link where you can download you paper.
Feel free to contact me, should you require any further informations!
Kind regards,
Ms. Adelina Simon Special Issue Editor, MDPI Romania Avram Iancu str. 454, Cluj-Napoca, Romania Email: [email protected] Energies (IF: 3.004; http://www.mdpi.com/journal/energies) Linkedin: https://www.linkedin.com/company/energies-mdpi/ Twitter: @energies_MDPI Editor's Choice: https://www.mdpi.com/journal/energies/editors_choice
Geological and Thermodynamic Analysis of Low Enthalpy Geothermal Resources to Electricity Generation Using ORC and Kalina Cycle Technology http://www.mdpi.com/1996-1073/13/6/1335
Prediction of Performance Variation Caused by Manufacturing Tolerances and Defects in Gas Diffusion Electrodes of Phosphoric Acid (PA)–Doped Polybenzimidazole (PBI)-Based High-Temperature Proton Exchange Membrane Fuel Cells http://www.mdpi.com/1996-1073/13/6/1345
Disclaimer: MDPI recognizes the importance of data privacy and protection. We treat personal data in line with the General Data Protection Regulation (GDPR) and with what the community expects of us. The information contained in this message is confidential and intended solely for the use of the individual or entity to whom they are addressed. If you have received this message in error, please notify me and delete this message from your system. You may not copy this message in its entirety or in part, or disclose its contents to anyone.
On 1/9/2022 9:56 AM, arif rahman saleh wrote: > Yes, I confirm. > I have confirmed with the co-author and he is trying to submit English > editing. However, the process has not been completed because what was > submitted is not the result of our final revision. Is it possible if the > revision upload process can be reopened and the files that are included > in the english editing process are the files we just revised? thank you > > *Arif Rahman Saleh, ST., MT* > /*Program Studi Teknik Mesin*/ > /Fakultas Teknik/

5/13/22, 2:57 PM Email Universitas Tidar - [Energies] Manuscript ID: energies-1520840 - English Editing
https://mail.google.com/mail/u/0/?ik=2b096d038c&view=pt&search=all&permthid=thread-f%3A1721559950359716975&simpl=msg-f%3A1721559950… 2/5
> /*Universitas Tidar */ > /email: [email protected] > <mailto:[email protected]>, [email protected] > <mailto:[email protected]>/ > /mobile: 082386085001/ > > > Pada tanggal Jum, 7 Jan 2022 pukul 13.06 Adelina Simon > <[email protected] <mailto:[email protected]>> menulis: > > Dear Dr. Rahman, > > Thank you very much for your email. > You paper current status is "English Pre Editing", can you please > confirm if you or one co-authors have applied for editing services? > > I'm looking forward to hearing from you. > > Kind regards, > > Ms. Adelina Simon > Special Issue Editor, MDPI Romania > Avram Iancu str. 454, Cluj-Napoca, Romania > Email: [email protected] <mailto:[email protected]> > Energies (IF: 3.004; http://www.mdpi.com/journal/energies > <http://www.mdpi.com/journal/energies>) > Linkedin: https://www.linkedin.com/company/energies-mdpi/ > <https://www.linkedin.com/company/energies-mdpi/> > Twitter: @energies_MDPI > Editor's Choice: > https://www.mdpi.com/journal/energies/editors_choice > <https://www.mdpi.com/journal/energies/editors_choice> > > Geological and Thermodynamic Analysis of Low Enthalpy Geothermal > Resources to Electricity Generation Using ORC and Kalina Cycle > Technology > http://www.mdpi.com/1996-1073/13/6/1335 > <http://www.mdpi.com/1996-1073/13/6/1335> > > Prediction of Performance Variation Caused by Manufacturing Tolerances > and Defects in Gas Diffusion Electrodes of Phosphoric Acid (PA)–Doped > Polybenzimidazole (PBI)-Based High-Temperature Proton Exchange Membrane > Fuel Cells > http://www.mdpi.com/1996-1073/13/6/1345 > <http://www.mdpi.com/1996-1073/13/6/1345> > > Disclaimer: MDPI recognizes the importance of data privacy > and protection. We treat personal data in line with the > General Data Protection Regulation (GDPR) and with what the > community expects of us. The information contained in this > message is confidential and intended solely for the use of > the individual or entity to whom they are addressed. If you > have received this message in error, please notify me and > delete this message from your system. You may not copy this > message in its entirety or in part, or disclose its contents > to anyone. > > On 1/7/2022 1:46 AM, arif rahman saleh wrote: > > Dear Ms. Adelina Simon > > > > First of all, I would like to thank you for the opportunity you have > > been given. Currently, I have made revisions according to the > suggestion > > from the reviewer, but when I was going to submit the revision > version,

5/13/22, 2:57 PM Email Universitas Tidar - [Energies] Manuscript ID: energies-1520840 - English Editing
https://mail.google.com/mail/u/0/?ik=2b096d038c&view=pt&search=all&permthid=thread-f%3A1721559950359716975&simpl=msg-f%3A1721559950… 3/5
> > the submission status was English Pre Editing so I couldn't upload the > > revised version of the article. For this condition, I ask for more > > information. Thank you > > Manuscript detail: > > Manuscript ID: energies-1520840 > > Type of manuscript: Article > > Title: Micro-grid Oil Palm Plantation Waste Gasification Power > Plant in> > Indonesia: Techno-Economic and Socio-Environment Analysis > > Authors: jaka isgiyarta *, bambang sudarmanta, jalu aji prakoso, > eka nur> > jannah, arif rahman saleh * > > > > > > best regard > > *Arif Rahman Saleh, ST., MT* > > /*Program Studi Teknik Mesin*/ > > /Fakultas Teknik/ > > /*Universitas Tidar */ > > /email: [email protected] > <mailto:[email protected]> > > <mailto:[email protected] > <mailto:[email protected]>>, [email protected] > <mailto:[email protected]> > > <mailto:[email protected] > <mailto:[email protected]>>/ > > /mobile: 082386085001/ > > > > > > Pada tanggal Rab, 29 Des 2021 pukul 15.56 Energies Editorial Office > > <[email protected] <mailto:[email protected]> > <mailto:[email protected] <mailto:[email protected]>>> menulis: > > > > Dear Dr. rahman saleh, > > > > Thank you again for your manuscript submission: > > > > Manuscript ID: energies-1520840 > > Type of manuscript: Article > > Title: Micro-grid Oil Palm Plantation Waste Gasification Power > Plant in> > Indonesia: Techno-Economic and Socio-Environment Analysis > > Authors: jaka isgiyarta *, bambang sudarmanta, jalu aji > prakoso, eka > > nur > > jannah, arif rahman saleh * > > Received: 7 December 2021 > > E-mails: [email protected] > <mailto:[email protected]> > > <mailto:[email protected] > <mailto:[email protected]>>, [email protected] > <mailto:[email protected]> > > <mailto:[email protected] <mailto:[email protected]>>, > > [email protected] <mailto:[email protected]> > <mailto:[email protected] <mailto:[email protected]>>, > > [email protected] <mailto:[email protected]> > <mailto:[email protected] <mailto:[email protected]>>, > > [email protected] > <mailto:[email protected]> > <mailto:[email protected] > <mailto:[email protected]>> > > > > Your manuscript has now been reviewed by experts in the field. > > Please find > > your manuscript with the referee reports at this link:

5/13/22, 2:57 PM Email Universitas Tidar - [Energies] Manuscript ID: energies-1520840 - English Editing
https://mail.google.com/mail/u/0/?ik=2b096d038c&view=pt&search=all&permthid=thread-f%3A1721559950359716975&simpl=msg-f%3A1721559950… 4/5
> > > > > https://susy.mdpi.com/user/manuscripts/resubmit/7a41453be7c4d6da9937655248c2f5ca > <https://susy.mdpi.com/user/manuscripts/resubmit/7a41453be7c4d6da9937655248c2f5ca> > > > <https://susy.mdpi.com/user/manuscripts/resubmit/7a41453be7c4d6da9937655248c2f5ca > <https://susy.mdpi.com/user/manuscripts/resubmit/7a41453be7c4d6da9937655248c2f5ca>> > > > > Please revise the manuscript according to the referees' > comments and > > upload > > the revised file within 10 days. > > > > Please use the version of your manuscript found at the above link > > for your > > revisions. > > > > (I) Any revisions to the manuscript should be marked up using the > > “Track > > Changes” function if you are using MS Word/LaTeX, such that any > > changes can > > be easily viewed by the editors and reviewers. > > (II) Please provide a cover letter to explain, point by point, the > > details of > > the revisions to the manuscript and your responses to the > referees’ > > comments. > > (III) If you found it impossible to address certain comments> in the > > review > > reports, please include an explanation in your rebuttal. > > (IV) The revised version will be sent to the editors and > reviewers. > > Please confirm if Table 6 needs copyright permission. > > You can find in the system you paper with our Journals template, > > please make> > your revision on that version of your paper. > > > > If one of the referees has suggested that your manuscript should > > undergo> > extensive English revisions, please address this issue during > > revision. We > > propose that you use one of the editing services listed at > > https://www.mdpi.com/authors/english > <https://www.mdpi.com/authors/english>> > <https://www.mdpi.com/authors/english > <https://www.mdpi.com/authors/english>> or have your manuscript > > checked by a > > native English-speaking colleague. > > > > Do not hesitate to contact us if you have any questions > regarding the > > revision of your manuscript. We look forward to hearing from > you soon. > > > > Kind regards, > > Ms. Adelina Simon > > Special Issue Editor, MDPI > > Avram Iancu str. 454, Cluj-Napoca, Romania > > Email: [email protected] <mailto:[email protected]> > <mailto:[email protected] <mailto:[email protected]>> > > Energies (IF: 3.004; http://www.mdpi.com/journal/energies > <http://www.mdpi.com/journal/energies> > > <http://www.mdpi.com/journal/energies > <http://www.mdpi.com/journal/energies>>)

5/13/22, 2:57 PM Email Universitas Tidar - [Energies] Manuscript ID: energies-1520840 - English Editing
https://mail.google.com/mail/u/0/?ik=2b096d038c&view=pt&search=all&permthid=thread-f%3A1721559950359716975&simpl=msg-f%3A1721559950… 5/5
> > Linkedin: https://ch.linkedin.com/in/energies > <https://ch.linkedin.com/in/energies> > > <https://ch.linkedin.com/in/energies > <https://ch.linkedin.com/in/energies>> > > Twitter: @energies_MDPI > > Editor's Choice: > > https://www.mdpi.com/journal/energies/editors_choice > <https://www.mdpi.com/journal/energies/editors_choice> > > <https://www.mdpi.com/journal/energies/editors_choice > <https://www.mdpi.com/journal/energies/editors_choice>> > > > > You are welcome to download your annual contribution report at > > https://susy.mdpi.com/user/manage_accounts > <https://susy.mdpi.com/user/manage_accounts> > > <https://susy.mdpi.com/user/manage_accounts > <https://susy.mdpi.com/user/manage_accounts>> > > > > Disclaimer: MDPI recognizes the importance of data privacy > > and protection. We treat personal data in line with the > > General Data Protection Regulation (GDPR) and with what the > > community expects of us. The information contained in this > > message is confidential and intended solely for the use of > > the individual or entity to whom they are addressed. If you > > have received this message in error, please notify me and > > delete this message from your system. You may not copy this > > message in its entirety or in part, or disclose its contents > > to anyone. > > >

5/13/22, 2:57 PM Email Universitas Tidar - [Energies] Manuscript ID: energies-1520840 - Manuscript Resubmitted
https://mail.google.com/mail/u/0/?ik=2b096d038c&view=pt&search=all&permthid=thread-f%3A1722194854392520776&simpl=msg-f%3A1722194854… 1/1
arif rahman saleh <[email protected]>
[Energies] Manuscript ID: energies-1520840 - Manuscript Resubmitted 1 pesan
Energies Editorial Office <[email protected]> 17 Januari 2022 16.49Balas Ke: Adelina Simon <[email protected]>, Energies Editorial Office <[email protected]>Kepada: arif rahman saleh <[email protected]>Cc: jaka isgiyarta <[email protected]>, bambang sudarmanta <[email protected]>, jalu aji prakoso<[email protected]>, eka nur jannah <[email protected]>
Dear Dr. rahman saleh,
Thank you very much for resubmitting the modified version of the following manuscript:
Manuscript ID: energies-1520840 Type of manuscript: Article Title: Micro-grid Oil Palm Plantation Waste Gasification Power Plant in Indonesia: Techno-Economic and Socio-Environment Analysis Authors: jaka isgiyarta *, bambang sudarmanta, jalu aji prakoso, eka nur jannah, arif rahman saleh * Received: 7 December 2021 E-mails: [email protected], [email protected], [email protected], [email protected], [email protected]
https://susy.mdpi.com/user/manuscripts/review_info/7a41453be7c4d6da9937655248c2f5ca
A member of the editorial office will be in touch with you soon regarding progress of the manuscript.
Kind regards, Energies Editorial Office Postfach, CH-4020 Basel, Switzerland Office: St. Alban-Anlage 66, CH-4052 Basel Tel. +41 61 683 77 34 (office) Fax +41 61 302 89 18 (office) E-mail: [email protected] https://www.mdpi.com/journal/energies/
*** This is an automatically generated email ***

5/13/22, 2:58 PM Email Universitas Tidar - [Energies] Manuscript ID: energies-1520840 - Revised Version Received
https://mail.google.com/mail/u/0/?ik=2b096d038c&view=pt&search=all&permthid=thread-f%3A1722202268028968596&simpl=msg-f%3A1722202268… 1/1
arif rahman saleh <[email protected]>
[Energies] Manuscript ID: energies-1520840 - Revised Version Received 1 pesan
Energies Editorial Office <[email protected]> 17 Januari 2022 18.47Balas Ke: [email protected]: arif rahman saleh <[email protected]>Cc: jaka isgiyarta <[email protected]>, bambang sudarmanta <[email protected]>, jalu aji prakoso<[email protected]>, eka nur jannah <[email protected]>, Energies Editorial Office <[email protected]>
Dear Dr. rahman saleh,
Thank you very much for providing the revised version of your paper:
Manuscript ID: energies-1520840 Type of manuscript: Article Title: Micro-grid Oil Palm Plantation Waste Gasification Power Plant in Indonesia: Techno-Economic and Socio-Environment Analysis Authors: jaka isgiyarta *, bambang sudarmanta, jalu aji prakoso, eka nur jannah, arif rahman saleh * Received: 7 December 2021 E-mails: [email protected], [email protected], [email protected], [email protected], [email protected]
https://susy.mdpi.com/user/manuscripts/review_info/7a41453be7c4d6da9937655248c2f5ca
We will continue processing your paper and will keep you informed about the status of your submission.
Kind regards, Ms. Adelina Simon Special Issue Editor, MDPI Avram Iancu str. 454, Cluj-Napoca, Romania Email: [email protected] Energies (IF: 3.004; http://www.mdpi.com/journal/energies) Linkedin: https://ch.linkedin.com/in/energies Twitter: @energies_MDPI Editor's Choice: https://www.mdpi.com/journal/energies/editors_choice
You are welcome to download your annual contribution report at https://susy.mdpi.com/user/manage_accounts
Disclaimer: MDPI recognizes the importance of data privacy and protection. We treat personal data in line with the General Data Protection Regulation (GDPR) and with what the community expects of us. The information contained in this message is confidential and intended solely for the use of the individual or entity to whom they are addressed. If you have received this message in error, please notify me and delete this message from your system. You may not copy this message in its entirety or in part, or disclose its contents to anyone.

5/13/22, 2:58 PM Email Universitas Tidar - [Energies] Manuscript ID: energies-1520840 - Accepted for Publication
https://mail.google.com/mail/u/0/?ik=2b096d038c&view=pt&search=all&permthid=thread-f%3A1722363499629447573&simpl=msg-f%3A1722363499… 1/1
arif rahman saleh <[email protected]>
[Energies] Manuscript ID: energies-1520840 - Accepted for Publication 1 pesan
Energies Editorial Office <[email protected]> 19 Januari 2022 13.30Balas Ke: Adelina Simon <[email protected]>, Energies Editorial Office <[email protected]>Kepada: arif rahman saleh <[email protected]>Cc: jaka isgiyarta <[email protected]>, bambang sudarmanta <[email protected]>, jalu aji prakoso<[email protected]>, eka nur jannah <[email protected]>, Energies Editorial Office <[email protected]>,Adelina Simon <[email protected]>
Dear Dr. rahman saleh,
Congratulations on the acceptance of your manuscript, and thank you for your interest in submitting your work to Energies:
Manuscript ID: energies-1520840 Type of manuscript: Article Title: Micro-grid Oil Palm Plantation Waste Gasification Power Plant in Indonesia: Techno-Economic and Socio-Environment Analysis Authors: jaka isgiyarta *, bambang sudarmanta, jalu aji prakoso, eka nur jannah, arif rahman saleh * Received: 7 December 2021 E-mails: [email protected], [email protected], [email protected], [email protected], [email protected]
https://susy.mdpi.com/user/manuscripts/review_info/7a41453be7c4d6da9937655248c2f5ca
We will now edit and finalize your paper, which will then be returned to you for your approval. Within the next couple of days, an invoice concerning the article processing charge (APC) for publication in this open access journal will be sent by email from the Editorial Office in Basel, Switzerland.
If, however, extensive English edits are required to your manuscript, we will need to return the paper requesting improvements throughout.
We encourage you to set up your profile at SciProfiles.com, MDPI’s researcher network platform. Articles you publish with MDPI will be linked to your SciProfiles page, where colleagues and peers will be able to see all of your publications, citations, as well as other academic contributions.
We also invite you to contribute to Encyclopedia (https://encyclopedia.pub), a scholarly platform providing accurate information about the latest research results. You can adapt parts of your paper to provide valuable reference information, via Encyclopedia, for others both within the field and beyond.
Kind regards, Enrico Sciubba Editor-in-Chief

5/13/22, 2:59 PM Email Universitas Tidar - [Energies] Manuscript ID: energies-1520840 - Final Proofreading Before Publication
https://mail.google.com/mail/u/0/?ik=2b096d038c&view=pt&search=all&permthid=thread-f%3A1722473561372730454&simpl=msg-f%3A1722473561… 1/2
arif rahman saleh <[email protected]>
[Energies] Manuscript ID: energies-1520840 - Final Proofreading Before Publication 1 pesan
Energies Editorial Office <[email protected]> 20 Januari 2022 18.39Balas Ke: [email protected]: arif rahman saleh <[email protected]>Cc: jaka isgiyarta <[email protected]>, bambang sudarmanta <[email protected]>, jalu aji prakoso<[email protected]>, eka nur jannah <[email protected]>, Energies Editorial Office <[email protected]>,[email protected]
Dear Dr. saleh,
We invite you to proofread your manuscript to ensure that this is the final version that can be published and confirm that you will require no further changes from hereon:
Manuscript ID: energies-1520840 Type of manuscript: Article Title: Micro-grid Oil Palm Plantation Waste Gasification Power Plant in Indonesia: Techno-Economic and Socio-Environment Analysis Authors: jaka isgiyarta *, bambang sudarmanta, jalu aji prakoso, eka nur jannah, arif rahman saleh * Received: 7 December 2021 E-mails: [email protected], [email protected], [email protected], [email protected], [email protected]
Please read the following instructions carefully before proofreading:
1) Download the manuscript from the link provided at the end of this message and upload the final proofed version at the same link within 48 hours (2 working days). If you experience any difficulties, please contact the Energies Editorial Office.
2) Please use Microsoft Word's built-in track changes function to highlight any changes you make, or send a comprehensive list of changes in a separate document. Note that this is the *last chance* to make textual changes to the manuscript. Some style and formatting changes may have been made by the production team, please do not revert these changes.
3) All authors must agree to the final version. Check carefully that authors' names and affiliations are correct, and that funding sources are correctly acknowledged. Incorrect author names or affiliations are picked up by indexing databases, such as the Web of Science or PubMed, and can be difficult to correct.
After proofreading, final production will be carried out. Note that changes to the position of figures and tables may occur during the final steps. Changes can be made to a paper published online only at the discretion of the Editorial Office.
Please download the final version of your paper for proofreading here:
https://susy.mdpi.com/user/manuscripts/proof/file/7a41453be7c4d6da9937655248c2f5ca
and upload here:
https://susy.mdpi.com/user/manuscripts/resubmit/7a41453be7c4d6da9937655248c2f5ca

5/13/22, 2:59 PM Email Universitas Tidar - [Energies] Manuscript ID: energies-1520840 - Final Proofreading Before Publication
https://mail.google.com/mail/u/0/?ik=2b096d038c&view=pt&search=all&permthid=thread-f%3A1722473561372730454&simpl=msg-f%3A1722473561… 2/2
Supplementary and other additional files can be found at the second link. We look forward to hearing from you soon.
Kind regards, Ms. Adelina Simon Special Issue Editor, MDPI Avram Iancu str. 454, Cluj-Napoca, Romania Email: [email protected] Energies (IF: 3.004; http://www.mdpi.com/journal/energies) Linkedin: https://ch.linkedin.com/in/energies Twitter: @energies_MDPI Editor's Choice: https://www.mdpi.com/journal/energies/editors_choice
You are welcome to download your annual contribution report at https://susy.mdpi.com/user/manage_accounts
Disclaimer: MDPI recognizes the importance of data privacy and protection. We treat personal data in line with the General Data Protection Regulation (GDPR) and with what the community expects of us. The information contained in this message is confidential and intended solely for the use of the individual or entity to whom they are addressed. If you have received this message in error, please notify me and delete this message from your system. You may not copy this message in its entirety or in part, or disclose its contents to anyone.

5/13/22, 3:00 PM Email Universitas Tidar - 2nd Proof: [Energies] Manuscript ID: energies-1520840 - Final Proofreading Before Publication
https://mail.google.com/mail/u/0/?ik=2b096d038c&view=pt&search=all&permthid=thread-a%3Ar4889204232562706713&simpl=msg-a%3Ar48974666… 1/1
arif rahman saleh <[email protected]>
2nd Proof: [Energies] Manuscript ID: energies-1520840 - Final Proofreading BeforePublication1 pesan
arif rahman saleh <[email protected]> 23 Januari 2022 10.28Kepada: Adelina Simon <[email protected]>Cc: [email protected]
Dear ms Adelina Simon,
Thank you very much for your correction. I have been doing some citation revision based on the assistant editor'scomments.
Please check the attachment
Kind regards, Arif Rahman Saleh, ST., MTProgram Studi Teknik MesinFakultas TeknikUniversitas Tidar email: [email protected], [email protected]: 082386085001
energies-1520840 -edit rev.docx 904K
hp
Oval

Energies 2022, 15, x. https://doi.org/10.3390/xxxxx www.mdpi.com/journal/energies
Article
Micro-Grid Oil Palm Plantation Waste Gasification Power Plant
in Indonesia: Techno-Economic and
Socio-Environmental Analysis
Jaka Isgiyarta 1,*, Bambang Sudarmanta 2, Jalu Aji Prakoso 3, Eka Nur Jannah 4 and Arif Rahman Saleh 5,*
1 Department of Accounting, Faculty of Economics and Business, Diponegoro University,
Semarang, Indonesia 2 Department of Mechanical Engineering, Faculty of Engineering, Institut Teknologi Sepuluh Nopember,
60111 Surabaya, Indonesia; [email protected] 3 Department of Economic Development, Faculty of Economics, Universitas Tidar, 56116 Magelang, Indone-
sia; [email protected] 4 Department of Agrotechnology, Faculty of Agriculture, Universitas Tidar, 56116 Magelang, Indonesia;
[email protected] 5 Department of Mechanical Engineering, Faculty of Engineering, Universitas Tidar, 56116 Magelang, Indo-
nesia
* Correspondence: [email protected] (J.I.); [email protected] (A.R.S.)
Abstract: The utilization of new and renewable energy sources explicitly based on biomass needs
to be increased to reduce dependence on fossil fuels. One of the potential biomasses of plantation
waste in Indonesia that can be utilized is oil palm plantation waste in the form of fronds and trunks
that are converted with multi-stage downdraft gasification technology. This study aimed to con-
duct a technical analysis, economic analysis, investment risk analysis, social analysis, and an en-
vironmental impact assessment of power plants fueled by oil palm plantation waste. The method
used was the upscaling of a prototype of a 10 kW power plant to 100 kW. The results showed that it
was technically and economically feasible to apply. The economic indicators were a positive NPV
of USD 48.846 with an IRR of 9.72% and a B/C ratio of 1.16. The risk analysis predicted a probability
of an NPV 49.94% above the base case. The study of the social aspects suggested that the construc-
tion of power plants has a positive impact in the form of increased community income and the
growth of new economic sectors that utilize electricity as a primary source. An analysis of the en-
vironmental effects is critical so that the impacts can be minimized. Overall, the construction of
small-scale power plants in oil palm plantations is worth considering as long as it is carried out
following the applicable regulations.
Keywords: gasification; multi-stage; techno-economic; power plant; oil palm waste
1. Introduction
The availability of clean energy is necessary to meet national energy needs to effi-
ciently support the goal of the sustainable development of new and renewable energy in
Indonesia. By 2025, it is expected that the renewable energy mix can grow to 23% with an
installed capacity of 5500 MWe as shown in Figure 1. Until 2018, the percentage of re-
newable energy utilization reached 6.2%. The bioenergy sector is expected to contribute
8.2% to national energy, one way of which is through the development of bioenergy
power plants [1]. The utilization of new and renewable energy has become a topic of
interest and is on the agenda in the world as one of the solutions to overcome the prob-
lems of the current energy crisis. The cause of this energy crisis is the decreasing availa-
bility of fossil fuels. Biomass, because of its abundant availability, can substitute for the
Citation: Isgiyarta, J.; Sudarmanta,
B.; Prakoso, J.A.; Jannah, E.N.; Saleh,
A.R. Micro-Grid Oil Palm Plantation
Waste Gasification Power Plant in
Indonesia: Techno-Economic and
Socio-Environmental Analysis.
sEnergies 2022, 15, x.
https://doi.org/10.3390/xxxxx
Academic Editor(s):
Received: 7 December 2021
Accepted: 19 January 2022
Published: date
Publisher’s Note: MDPI stays neu-
tral with regard to jurisdictional
claims in published maps and insti-
tutional affiliations.
Copyright: © 2022 by the authors.
Submitted for possible open access
publication under the terms and
conditions of the Creative Commons
Attribution (CC BY) license
(https://creativecommons.org/license
s/by/4.0/).

Energies 2022, 15, x FOR PEER REVIEW 2 of 23
use of fossil fuels. Compared to other renewable energy sources (wind, solar, etc.), energy
production from biomass requires lower capital investment costs [2]. To encourage the
acceleration of the use of renewable energy in Indonesia, the government has established
various policies. The government has the target of an additional installed capacity from
renewable energy power plants of 905.73 megawatts (MW), consisting of 196 MW from
geothermal powerplants, 557.93 MW from hydro power plants, 138.8 MW from solar
power plants, and 13 MW from bio power plants. Meanwhile, the renewable energy in-
vestment target in 2021 will increase to USD 2.05 billion or approximately IDR 28.9 tril-
lion (assuming an exchange rate of IDR 14,100 per dollar) from the investment achieve-
ment in 2020, which amounted to USD 1.36 billion or approximately IDR 19.2 trillion.
Some of the government’s policies on new energy are as follows [3]:
a. Implementation of the mandatory B30 program for all sectors, followed by the de-
velopment of biodiesel trials as a substitute for fossil diesel with B100 (biodiesel
100%) development technology;
b. Mixing of research octane number 92 Oil Fuel in East Java in the context of efforts to
procure bioethanol-type biofuel, in accordance with the Regulation of the Minister
of Energy and Mineral Resources Number 12 of 2015;
c. Acceleration of waste power plant development in 12 selected cities, as mandated by
Presidential Regulation Number 35 of 2018 concerning the acceleration of waste
power plant development programs;
d. Encouraging the use of rooftop solar power plants in accordance with the mandate
of the Minister of Energy and Mineral Resources Regulation Number 49 of 2018
concerning the Use of Rooftop Solar Power Generation Systems by state power plant
consumers;
e. Simplifying the bureaucratic process through the of Energy and Mineral Resources
Online Licensing Application, which is integrated with data on natural resources,
operations, production, and marketing/sales of each type of energy;
f. Increasing the use of renewable energy to reduce dependence on fossil fuels, which
will have an impact on increasing Indonesia’s economic stability.
Figure 1. Primary energy supply by 2025.
The utilization of biomass waste into energy can be a solution to reduce dependency
on fossil fuel. The potential energy from biomass is currently at 32,654 MW and 1716.5
MW has been developed [4]. Development of bioenergy-based power plants (on-grid)
until 2013 reached 90.5 MW, while for those off-grid it reached 1626 MW [5]. One of the
most significant biomass potentials in Indonesia is from solid waste from oil palm plan-
tations. Oil palm plantations in Indonesia are the largest source of biomass with a total
electricity energy that can be generated of 5495 MWe [6]. The sources come from planta-
28%
23% 28%
21%
Renewable Energy Oil Coal Gas

Energies 2022, 15, x FOR PEER REVIEW 3 of 23
tion wastes (oil palm fronds and oil palm trunks) or waste from oil palm mill production
(meso scrap fiber, palm kernel shell, and oil palm mill effluent). However, not all these
wastes are utilized as energy, so they have the potential to become sources of greenhouse
gas emissions when they decompose. In addition, in terms of the environment in recent
years, the oil palm plantation industry in Indonesia has been in the European Union’s
and the United States’ spotlight because it is considered an industry that is not environ-
mentally friendly due to the impact it causes [7]. If the renewable energy target policy is
implemented by 2030, it is expected to reduce greenhouse gas emissions by 29% com-
pared to 2010.
Indonesia has five provinces with the most extensive oil palm plantations, namely,
South Sumatra, Central Kalimantan, West Kalimantan, North Sumatra, and Riau. In 2019,
the Indonesian State Electricity Company reported that Indonesia’s electrification ratio
had reached 99%. However, the electrification ratio is still calculated from the number of
people who obtain electricity for access to lighting and not for the productive sector. The
Ministry of Energy reported the data on villages that did not have access to electricity to
be as many as 2281 villages out of a total of 232,128 villages in Indonesia [1]. Meanwhile,
for the five provinces with the most extensive oil palm plantations, there are 785 villages,
2510 villages, 13,595 villages, 634 villages, and 5209 villages, respectively, as shown in
Figure 2. The condition is ironic, since these five provinces produce much of the oil palm
plantation waste. At present, access to electricity only benefits people in urban areas
where there is an installed electricity network. In contrast, construction of the network
constrains those plantations because the cable must pass through the plantations. Thus,
the issue of land acquisition is a significant factor in the lack of access to electricity in
rural communities located in oil palm plantations.
Figure 2. Villages that have no access to electricity in Indonesia.
Oil palm plantation wastes are oil palm fronds and oil palm trunks. Oil palm fronds
during pruning and replantation activities are always stacked and collected at an average
production rate of 9.8 t-dry/ha-estate/year and 14.9 t-dry/ha-replantation/year. A study
reported that oil palm fronds contain 25.5% (dry basis) hemicellulose material, which has
excellent potential to be used as a raw material for biofuels and bio-based material pro-
duction [8–11]. Oil palm trunks are the second type of biomass residue produced during
replanting. Oil palm trunk production is estimated at 62.8 t-dry/ha-replantation/year. At
present, oil palm fronds are usually burned as fuel in processing plants, and the re-
mainder is disposed of in plantations, while oil palm trunks after the replanting process
are not utilized [10]. Utilization of oil palm waste as a raw material for renewable energy
that can generate electricity is a solution to the residue of oil palm industry activities in

Energies 2022, 15, x FOR PEER REVIEW 4 of 23
Indonesia. According to the Ministry of Energy and Mineral Resources of the Republic of
Indonesia, the renewable energy market in Indonesia is not yet optimal because it relies
on solar panels which have components that are imported. Thus, the government is
pushing a draft Indonesian Presidential Regulation that will regulate the price of new
renewable electricity. Through this policy, it is hoped that the production of renewable
energy that utilizes oil palm waste as a raw material can grow in oil palm industrial areas
in Indonesia. In addition, the push for the use of renewable energy is in line with the
global commitment to the 7th point of the Sustainable Development Goals that are to be
achieved by 2030 regarding clean and affordable energy.
One technology that can be used to convert biomass into alternative energy without
producing emissions is gasification [12]. Gasification is the process of converting solid or
liquid raw materials into thermochemical gases [13]. Different to combustion, gasification
produces higher efficiency, and the pollutants are still below emissions standards. The
gasification process consists of several sequential stages, namely, the drying, pyrolysis,
partial oxidation, and reduction stages. Gasification requires media such as air, oxygen,
or water vapor. The gas produced from the gasification process, commonly called syn-
thetic gas (syngas), consists of combustible syngas (i.e., CO, H2, and CH4) and
non-combustible gas (i.e., CO2, N2, and the remaining O2) [14]. Gasification reactions oc-
cur in a reactor called a gasifier. There are various types of gasifiers such as updraft,
downdraft, cross draft, bubbling fluidized bed gasifiers, and circulating fluidized beds
(CFBs) [15]. One type of gasifier that is widely used is the downdraft [16–18]. A
downdraft gasifier has the advantage of a high carbon conversion rate, low tar produc-
tion, and simple construction compared to other types [19].
The aim of this study was to analyze the utilization of oil palm plantation waste as
fuel in gasification power plants. The analyses simultaneously carried out were technical,
economic, investment risk, social, and environmental impact analyses. Oil palm planta-
tion wastes used were oil palm fronds and oil palm trunks. Both of these plantation
wastes have been reported by several previous studies and are suitable as feedstock for
gasification. The power plant analyzed was upscaled from a laboratory-scale prototype
with a capacity of 10 kW, which has been reported in previous studies, to a small-scale
power plant with a capacity of 100 kW. The gasification technology used the multi-stage
downdraft gasifier [20]. This technology has the advantage of being able to produce
syngas with a high–low heating value and a low tar content of 2.6 times compared to the
single-stage downdraft gasifier that has been reported in other studies. Moreover, this
multi-stage gasification technology was also equipped with an air heating system that
was also capable of producing low tar content up to 27.8 mg/Nm3 and temperature in-
creases at the partial oxidation zone with a constant equivalent ratio [18].
Several previous studies using gasification technology for power generation have
been carried out. Romaniuk [21]conducted research by utilizing agricultural waste as fuel
in gas generators. Modification of the gas generator was conducted by adjusting the
supply of oxidizer (air supply) into the reaction zone. A downdraft-type gasification
power plant with a capacity of 25 kW was also developed by ENTRAGE Energies System
AG, using a 4.3 L six-cylinder petrol engine coupled to an electric generator. A
downdraft-type gasification power plant was also developed by ALL POWER LABS with
a power output of 15 kW [21,22]. The gasifier was coupled to a four-cylinder diesel en-
gine and an electric generator. Currently, one of the largest biomass power plants is lo-
cated in the UK, near Cheshire, and it produces 21.5 MW of electrical energy. A gasifica-
tion power plant with a capacity of 100 kW in current market conditions is more profita-
ble than a larger capacity provided that the fuel used is not difficult to supply [23]. Si-
tumorang [24] reports that gasification power plants can be used to utilize locally avail-
able biomass as fuel with a generating capacity of less than 200 kW.
Before the power plant was implemented, it was necessary to evaluate the feasibility
and sustainability of the project in terms of economic, social, and environmental as well
as the risk variables that could hinder the success of the project. Some analyses that

Energies 2022, 15, x FOR PEER REVIEW 5 of 23
needed to be conducted were techno-economic, risk, and social–environmental. Tech-
no-economic analyses of gasification power plants have been carried out in several pre-
vious studies. Porcu [25] conducted a techno-economic analysis of a gasification power
plant being upscaled from 500 to 200 kW using a bubbling fluidized bed gasifier. Singh
conducted a techno-economic analysis of hybrid power plants between gasification, solar
PV, and fuel cells, but the gasification technology used was not mentioned. Economic
and environmental impact analyses of an 11 MW capacity gasification power plant were
carried out by Cardoso [23], and the results of the study reported that the NPV was in-
fluenced by revenue from electric sales. Sobamowo [26]conducted a techno-economic
analysis of a gasification power plant using downdraft gasification technology with a
capacity of 60 MW; the results of the study reported that the distance between the power
plant and the source of raw materials affected the raw material costs. Moreover, local
materials for capital investment, maintenance, and fuel costs provided higher profit
margins.
Emiliano [27,28] conducted a techno-economic assessment of power plants with
gasification technology. The results of the study reported that the price of gaseous fuel
(i.e., natural gas) dramatically affects the economics of the power plant project. In addi-
tion, power efficiency and the selling price of electricity can produce a higher NPV. Cali
[29] conducted a techno-economic analysis of the FOAK industrial gasification plant. The
results of the study reported that the cost of fuel dramatically affects the cost of electricity
(COE), and the economic results can be increased by technical development to reduce
operating costs. Kivumbi [30] conducted a techno-economic analysis of a gasification
power plant with a capacity of 425 kW using municipal solid waste as fuel. The results of
the study reported that for small-scale power plants, a high interest rate causes the return
on investment to be longer, so it is not appropriate. In addition, the distance between the
source of raw materials and power plants affects the total cost of transportation to in-
crease the cost of electricity production. Gokalp [31] conducted a techno-economic anal-
ysis of a gas tire scrap power plant capacity of 5 MWe. The gasification technology used
was a circulating fluidized bed. The results of the study reported that the price of raw
materials dramatically influences the financial result, but if it cannot be reduced, the ef-
ficiency of the gasification system needs to be increased. Based on the results of the pub-
lished techno-economic analyses, various variables affect the financial results of a gasi-
fication power plant and are different for each region, the type of raw material used, and
the planned generating capacity. Moreover, most publications only discuss the economic
analysis, and only a few discuss investment, social, and environmental risk analyses
simultaneously, while these are interrelated. The generating capacity analyzed was also
medium- to large-scale, while for the microscale, the literature is still limited.
This research is critical because of the limitations in the literature on technical and
economic analyses; specifically, it was a small-scale 100 kW gasification power plant that
utilized oil palm plantation waste as the primary fuel. In this study, the technical analysis
carried out to calculate the capacity of the gasification system was based on the type of
solid fuel and internal combustion engine. Meanwhile, the economic analysis conducted
was calculated as the net present value (NPV), internal rate of return (IRR), bene-
fit-to-cost ratio (B/C), and payback period (PBP). The investment risk was also analyzed
using the Monte Carlo method. Furthermore, the final analysis carried out was an anal-
ysis of the social and environmental impacts due to the gasification power plant.
2. Materials and Methods
Multi-stage gasification power plant experiments have been carried out previously
at the pilot scale with a capacity of 10 kW [18,20,32]. To estimate the economic value of a
power plant on a micro-grid scale, in the analysis, the capacity was upscaled to 100 kW.
The aim was to obtain the difference between the non-profit models on the prototype
scale and a profitable model on a commercial scale. The results of the pilot-scale experi-
ment were used as a reference for modeling the performance of microscale gasification
Comment [ARS1]: I have been
remove the citation number 31,
please revise

Energies 2022, 15, x FOR PEER REVIEW 6 of 23
power plants. The technical aspects discussed in this study are feedstock characteriza-
tions using ultimate and proximate analyses, explanations of experimental activities, and
analysis of economic models. Techno-economic analyses were carried out including in-
vestment costs and operating costs. Meanwhile, for the technical analysis, the size of the
biomass power plant was upscaled. Furthermore, an income analysis was carried out
based on financial assumptions. After the technical aspects were defined, the next step
was to perform an economic analysis and socio-environmental analysis. The Monte Carlo
method was used for the risk analysis with Crystal Ball software Version 11.1.2.4®.
2.1. Multi-Stage Downdraft Gasification Power Plant
The experiments of pilot-scale gasification were conducted using a single-throat
downdraft gasifier that was modified from a single-stage to a multi-stage [18]. The ad-
vantage of this multi-stage gasifier is that it produces syngas with a lower tar content and
a higher heating value. The multi-stage gasification technology was developed in the
combustion laboratory and an energy system from the Institut Teknologi Sepuluh
Nopember. The scheme of the gasification system is shown in Figure 3.
Figure 3. Prototype of a multi-stage downdraft gasifier.
The solid fuel consumption of this reactor was 8 kg/h. Before entering the reactor,
the fuel was placed inside a hopper equipped with a screw conveyor. The amount of fuel
entering was regulated through the screw rotation of the screw conveyor. The air used
was ambient air, and before entering the gasifier, it was preheated until 200 °C. In addi-
tion to obtaining external heating, the air was also internally heated inside the gasifier by
placing an air ring in the form of a pipe that circled the inner wall of the reactor. In the
first stage, the air was injected into the pyrolysis zone using six nozzles. The air in this
pyrolysis zone initiated the oxidation reaction between the air and carbon, called oxida-
tive pyrolysis [20,33–36]. The oxidation reaction released heat so that the pyrolysis
properties changed from endothermal to exothermal. This was advantageous because the
released heat from the partial oxidation zone was reduced. The temperature increased in
the pyrolysis zone cracking the tar components from primary to secondary tar [18].
Furthermore, at the second stage, the air was injected in the partial oxidation, pre-
cisely above the throat. In this position, the air was not distributed using the air ring be-

Energies 2022, 15, x FOR PEER REVIEW 7 of 23
cause it was heated from the oxidation region. Finally, in the third stage, the air entered
the reduction zone using an air ring divided by six nozzles. Air entering the reduction
zone also reacted with residual charcoal in that zone; as a result, the temperature in the
reduction zone also increased, which was beneficial for the thermal cracking reaction of
the tar component. In addition, air also activates the residual charcoal so that the number
of pores becomes more numerous and can capture some of the tar components [20,37,38].
Gasifier walls are built using stainless-steel plates with a thickness of 3 mm. The to-
tal height of the reactor was 1.3 m with a diameter of 0.5 m. The ash sweeping mechanism
was placed above the grate to prevent blockage of the grate hole. The sweeper was
moved every 15 min after syngas under flammable conditions. The ash that fell from the
grate was moved to the box using a screw conveyor with a 45° slope. After that, periodic
ash disposal was carried out every 3 h of operation. Syngas was emitted from the gasifier
before being used in the internal combustion engine and first passed through the cyclone
to separate heavy particles, such as ash and fine grains, that were carried out by the
syngas. Heavy particles were separated due to the fact of gravity, and the syngas was
cleaned using a dry filter. Inside the dry filter there were two layers of filter media: the
lowest layer was activated carbon, and the top layer was wood dust. The tar component
carried in the syngas was captured by the activated carbon. The syngas temperature
coming out of the gasifier was 150 °C and 27 °C after it passed the dry filter. The tar and
heavy oil components contained in the syngas were condensed and absorbed by acti-
vated carbon. The layer of sawdust served as an additional layer to capture the unfiltered
tar and heavy oil in the activated carbon layer. To ensure the filtering efficiency and the
final tar content, the syngas was tested by taking a sampling gas every 30 min of opera-
tion. Syngas was condensed using a condenser with ice water as cooling media. The
condensed tar stuck to the wall of the condenser and moved down and was accommo-
dated with a measuring cup [40]. The gas that was separated from the tar was later stored
in a gas sampling bag and tested separately using gas chromatography.
Furthermore, syngas was channeled to a diesel engine that was connected to a 10
kW electric generator with dual fuel operating condition (i.e., syngas and diesel fuel).
Syngas entered the diesel engine via the air intake channel through the mixer, and the
amount was regulated using a valve.
2.2. Feedstock Characterization
The raw materials used were oil palm fronds and oil palm trunks that were shred-
ded into fibers with lengths of 3–5 cm as shown in Figure 4. Characterization was con-
ducted by testing the raw material using ultimate and proximate analyses. The test was
carried out at the Energy Institute Laboratory of the Institut Teknologi Sepuluh
Nopember. Proximate analysis refers to the ASTM D 5142-04 standard for the parameters
of moisture, volatiles, and ash. Meanwhile, fixed carbon was tested based on the differ-
ence between the total mass reduced by moisture, volatiles, and ash. The ultimate analy-
sis was carried out according to the ASTM D 5373-02 standard for carbon, hydrogen,
oxygen, nitrogen, and sulfur components. The oxygen was the difference between the
total mass minus the previous component. Analysis of the calorific value was carried out
using a bomb calorimeter (AC-350 Bomb Calorimeter) according to the ASTM D4809-18
for analysis of gross calorific value. Ultimate analysis uses sample sizes between 100 and
300 g to obtain accurate results. Carbon, nitrogen, and sulfur testing in this study used a
sample size of 2–3 mg, which had an error tolerance of 0.05 w. (500 ppm) with an uncer-
tainty below 0.02 w.%. Based on the manufacturer’s specification data from the equip-
ment used, the uncertainty of the instrument was in the moderate concentration range of
0.3 w.%. If the sample had a carbon content higher than 90 w.%, then the tolerance was
extended to 0.5 w.%. The results of the analysis of the feedstock are presented in Table 1.
Comment [M2]: incorrect ref
order, 40 detected after 38. You
jumped the numbers in
between.
Comment [ARS3]: This citation
number is in the order in the
reference list

Energies 2022, 15, x FOR PEER REVIEW 8 of 23
Figure 4. Results of the shredded midrib and oil palm stems.
Table 1. Ultimate and proximate analyses of solid fuel.
Analysis Contents (% Mass) Oil Palm Frond Oil Palm Trunk
Proximate
Volatile 85.1 86.7
Moisture 70.6 75.6
Ash 3.37 3.35
Calorific Value (MJ/kg) 17.48 17.41
Ultimate
Carbon 48.43 51.41
Hydrogen 10.46 11.82
Oxygen 46.75 51.16
Nitrogen 12.40 0.17
2.3. Experimental Activity
Gasification experiments were carried out using a multi-stage downdraft gasifier.
The used equivalent ratio (ER) was the optimum ratio from previous studies [20,31]
which was 0.4 while the air ratio (AR) for the pyrolysis zone, partial oxidation, and re-
duction were selected at the optimum ratio of 10%, 80%, and 10%. The AR percentage
shows the amount of air entering for each zone, meaning that from the total air based on
ER 0.4 divided into three locations, 10% into the pyrolysis zone, 80% into partial oxida-
tion, and 10% into the reduction zone. Syngas was cleaned using a cyclone and dry filter
to further flow into a diesel engine. The experimental data generated from the gasifica-
tion experiment are shown in Table 2.
Table 2. Prototype of the gasification power plant specification of a 10 kW capacity.
Parameter Value
Equivalent ratio 0.4
Air ratio (pyrolysis, oxidation, and reduction zone) 10%, 80%, 10%
Feedstock flow rate 8 kg/h
Air inlet temperature 200 °C
Syngas temperature after cleaning 80 °C
Syngas flow rate 0.0028 m3/s
Syngas heating value (LHV) 6.642 MJ/Nm3
Syngas Composition Volumetric Percentage
CO 18%
H2 25%
CH4 4%

Energies 2022, 15, x FOR PEER REVIEW 9 of 23
2.4. Economic Model
The economic analysis in this study was carried out using a 10 kW capacity gasifi-
cation experimental data reference that was upscaled to 100 kW. Some operating condi-
tions were equated according to the experimental reference data, and the resulting data
were used as input data for the economic analysis. A techno-economic analysis was car-
ried out for every year of the estimated service life of the gasification system of 20 years.
The reference cost component started from the capital cost to the estimated revenue for
each year.
3. Result
3.1. Techno-Economic Analysis
In this study, the analysis was conducted for the utilization of oil palm plantation
waste converted into electrical energy using gasification technology in Indonesia. The
analysis was conducted close to the actual condition, and the analysis was carried out
based on a literature study that was conducted for potential bioenergy investment, espe-
cially biomass in Indonesia.
The oil palm plantation waste was grouped into two types, namely, waste from
plantations in the form of oil palm fronds and trunks and waste from the processing of oil
palm into crude oil palm such as fiber, shells, empty fruit bunches, and liquid waste or oil
palm mill effluent (POME) [8]. From all types of plantation waste, the most significant
potential was oil palm fronds with a total production of 49.41 million tons/year which
were derived from the Sumatra region; 23.50 million tons/year in Kalimantan; 218 thou-
sand tons/year in Java, Bali, and Madura; 2.17 million tons/year in Sulawesi; and 202.64
thousand tons/year in Papua. The total energy that can be generated from all the poten-
tial reaches 5495 Mwe [6]. Palm fronds were chosen because they are always available on
plantations and do not require a significant supply cost compared to other wastes. The
waste from palm processing was owned by the company, so that if the community or
other parties needed it, they must buy it first, while oil palm fronds can be taken for free
and only require costs for transportation, chopping, and drying. Besides the oil palm
fronds, oil palm trunk is also used as additional raw materials. However, due to the fact
that it is only available during the replanting process, the amount was less if it was di-
vided within one year. The total potential energy from oil palm trunk reaches 815 MW
[6].
The first step for the raw material for oil palm fronds before use was to strip the
leaves, then transport them to the power plant storage facility. The next step was to shred
and dry them under the sun and then finally store them in a warehouse. The oil palm
fronds were used as the primary fuel, and the oil palm trunks were use as the secondary
fuel. When both were available, they were mixed with a percentage of 70% fronds and
30% trunk. The power plant was ideally placed close to the location of the plantation so
that the cost of the transportation of the raw materials could be reduced [23]. Based on
the planned installed capacity, 1189 tons/day of raw materials were needed. Thus, at least
100 hectares of oil palm plantation were required. When compared with the areas of
lands in Sumatra, Kalimantan, Sulawesi, and Papua, this plant can be placed anywhere
because the existing land area was greater than the required minimum land area. The
maximum moisture content of the solid fuel was 40%.
Actually, the oil palm fronds are not purely waste. So far, they have been left piling
up beside the palm trees until they rot and become soil fertility. However, to reach this
stage requires a long time. Thus, to maintain balance, not all the fronds produced were
used entirely. As much as 70% of the waste was utilized, and the remaining 30% was left
as soil fertilizers. Although the availability of the land area was quite extensive, most of
the landowners were companies, while a limited amount was owned by the community.
Cooperation between the power plant manager and the company was needed to ensure
the availability of raw materials and the sustainability of the power plant in the future.
Comment [M4]: incorrect ref
order, 40 detected after 38. You
jumped the numbers in
between.
Comment [ARS5]: I have been
removed citation number 40

Energies 2022, 15, x FOR PEER REVIEW 10 of 23
The biomass power plant with gasification technology was expected to operate for 20
years with a construction period of one year. The plant works 355 days a year and has a
ten-day shutdown schedule for maintenance.
Following its capacity, the number of employees needed to operate the power plant
was estimated at six people, consisting of one manager, two operators, two technicians,
and one administrator. Economic analysis was conducted by predicting the cost compo-
nents associated with power plant construction, starting from the planning stage to the
implementation stage.
3.1.1. Investment Cost
The investment costs were calculated based on an investment analysis for power
plants of the same scale used as a reference in this study. The power plant with a capacity
of 10 kW was built in 2017. All costs were converted from IDR to USD. The exchange rate
in 2019 for USD 1 was IDR 14,012.73, while the IDR to USD currency exchange rate in the
year the reference power plant project was IDR 13,693. The breakdown of capital costs
refers to the IRENA [42] and are presented in Table 3.
Table 3. Investment costs (USD).
Investment Item Cost
Civil work 664.31
Building 763.96
Foundation and supporting material 4417.68
Piping system 2524.39
Electric component 2989.40
Instrumentation 1660.78
Insulation and painting 664.31
Total Construction Cost 13,684.83
Gasifier with cleaning and cooling system 30,000.00
Diesel engine (100 kVA) 12,458.25
Total Investment Cost 56,143.08
3.1.2. Operating Cost
The operating cost component was the costs incurred each year for power plants,
which consisted of raw material costs (consisting of costs for providing raw materials and
transportation), operating and maintenance costs (O&M), tax burden, and annual depre-
ciation costs. Operating and maintenance costs included the costs of providing electricity,
clean water, ash disposal, engine component replacement, and the gasifier component.
This also included costs for labor, consisting of basic salaries, benefits, and health insur-
ance. Office operational costs consisted of administrative costs, office stationery, official
travel, and transportation costs. Electricity needs for plant operations were calculated
based on the number of operating hours for one year. Details of the cost of electricity
needs for the plant are presented in Table 4.
Table 4. Yearly production costs (USD).
Item Cost
Operation and maintenance of the gasifier 2245.72
Operation and maintenance of the gasifier variable cost 139.86
Depreciation cost 2930.39
Total Yearly Production Cost 5315.97
Comment [M6]: incorrect ref
order, 42 detected after 38. You
jumped the numbers in
between.
Comment [ARS7]: This citation
number is in the order in the
reference list

Energies 2022, 15, x FOR PEER REVIEW 11 of 23
The cost component of the solid fuel is the cost of collecting, cutting, and transpor-
tation from the source of the solid fuel to the location of the power plant. Oil palm fronds
are not purchased but rather harvested from trees, collected, and transported. The cost
component was harvesting, transportation, and labor costs, while for oil palm trunk, the
costs incurred were logging costs. Costs incurred to produce electricity were calculated
based on the standard O&M cost for diesel engines from IRENA 2018 of $0.008/kWh [42].
The O&M cost component for diesel engines was obtained by multiplying yearly electric
production by the standard O&M cost from IRENA. Fuel costs consisted of biomass and
diesel because they were operated in dual fuel. The percentage of syngas substitution
against diesel was a maximum of 60%. Details of the electricity production costs are
presented in Table 5.
Table 5. Electric production cost (USD).
Item Cost
O&M cost of diesel engine (electric production) 2401.75
Yearly production cost 5315.97
Depreciation cost (20 year operation) 265.80
Biomass fuel cost 6574.44
Diesel fuel cost 10,313.23
Total Electric Production Cost 24,871.19
3.2. Gasifier Upscaling
The capacity of the power plant that was analyzed economically was 100 kW. Based
on the technical aspects, the diesel engine and gasifier were upgraded. The selected diesel
engine was Cummins 6BT5,962, which was coupled with a 100 kVA generator. The
technical specifications can be seen in Table 6.
Table 6. Diesel engine specifications [43].
Engine Cummins 6BT5.9G2
Generator Stamford UCI274C
KVA 100
KW 80
Number of cylinders 6
Bore x stroke 102 × 120 mm
Piston disp. 5900 L
Fuel consumption 17 L/h (75% load) and 22 L/h (100% Load)
Oil capacity 16.4 L
Dimension 2910 × 1110 × 1450 mm
Based on the engine specifications, the output capacity was calculated using the
method by Kivumbi [30] with the results shown in Table 7.
Table 7. Diesel engine parameters.
Parameter Value Unit
Maximum air producer gas 0.0738 m3
Maximum real producer gas intake 0.0351 m3/s
Real producer gas intake 0.0281 m3/s
The normal volume rate of the producer gas 0.0287 m3/s
Thermal power 190.4284 kW
Maximum mechanical output 82.0746 kW
Maximum electrical output 34.9638 kW
Comment [M8]: incorrect ref
order, 42 detected after 38. You
jumped the numbers in
between.
Comment [ARS9]: This citation
number is in the order in the
reference list
Comment [M10]: incorrect ref
order, 42 detected after 38. You
jumped the numbers in
between.
Comment [ARS11]: I have been
changed citation number from
42 to 43, please revised

Energies 2022, 15, x FOR PEER REVIEW 12 of 23
Furthermore, after the capacity of the diesel engine was known, the specifications of
the gasifier could be calculated using the method used by Kivumbi [23] with the results
presented in Table 8.
Table 8. Gasifier sizing parameters.
Parameter Value Unit
Thermal power consumption (full load) 272.0406 kW
High heating value 24,132.7205 kJ/kg
Low heating value 19,766.0645 kJ/kg
Biomass consumption 0.0138 kg/s
Specific fuel consumption 1.4171 kg/kWh
Gas production from the gasifier 0.1106 m3/s
Cross-sectional area 0.0442 m2
The diameter of the air inlet 0.2374 m
Height from nozzle plane 0.1139 m
Diameter of firebox 0.4985 m
Nozzle diameter 0.0094 m
Specific gasification rate 1120.0607 kg/h·m2
Height of gasifier 3.5002 m
Gasifier diameter 0.2374 m
Based on the parameters of the diesel engine and gasifier that were calculated, the
electrical energy output capacity was calculated, and the results obtained are presented
in Table 9. The number of operating days for one year was assumed to be 355 days, with
42.6% electricity production efficiency. Total electricity production per day was 839.13
kWh/day, so that the total electricity production for one year is 297,891.57 kWh/year.
Table 9. Electric production parameters.
Parameter Value Unit
Electric output 34.96 kW
Electrical efficiency 42.60 %
Frequency 50 Hz
Number of gas engine 1 Unit
Daily electric production 839.13 kWh/day
Day operation in one year 355 Day
Yearly electric production 297,891.57 kWh/year
3.3. Revenues
Revenue was obtained by multiplying the total electricity production for one year
with the price of electricity following the state power plant standard for renewable en-
ergy, which was $0.121/kWh. Electricity consumption costs for the plant reduced gross
revenue. Detailed calculations for the power plant are presented in Table 10.
Table 10. Revenue list.
Revenue Item Revenue Unit
Electric price 0.121 USD/Kwh
Estimated revenue 36,004.56 USD/year
Plant usage in electricity 686.511 USD/year
Net revenue 35,318.05 USD/year

Energies 2022, 15, x FOR PEER REVIEW 13 of 23
3.4. Financial Assumption
The financial assumptions used in this study included the operating life of the plant
and the interest rate presented in Table 11. Each year, it was estimated that all costs and
selling prices would experience inflation of 2% [26]. The net present value was calculated
using an interest rate of 8%.
Table 11. Financial assumption.
Assumption Item Value Unit
Power plant lifetime 20 year
Interest rate 8 %
Inflation rate 2 %
3.5. Economic Feasibility Analysis
An economic feasibility study was carried out to decide whether the investment in
the power plant that is to be carried out was profitable and feasible for investment. The
conducted economic analysis was the NPV, PBP, and the IRR. The NPV calculation was
conducted by calculating the present value of cash flows for a certain period. The calcu-
lated cash flow was the difference between the benefits and costs for each year the NPV
was determined. The equation to calculate the NPV is shown below [23]:
∑ (( ) )
( ) ( )
where i is the interest rate, N is the number of periods (years), Cy are number of cash in-
flows in year y, and Cy = 0 is the total investment of the first year plus cash outflows. In-
terest rates were used to calculate the discount factor and present values for costs and
benefits. The operating period was assumed to be 20 years [25] with an interest rate of
8%. After calculating, if the NPV was positive, the investment was profitable and vice
versa. Thus, if t was profitable, capital costs could be returned during the operating pe-
riod.
The internal rate of return was analyzed based on the accumulation of NPV values.
IRR is the present value of costs and benefits. Investment can be made if the IRR value is
higher than the interest rate and vice versa. The equation used to calculate IRR was as
follows [23]:
( )
The initial investment cost is the total investment cost in the first year, i is the interest
rate, and y is the current year. The payback period was analyzed to determine the cost for
each year so that the initial investment costs could be returned. The equation used to
calculate the payback period is as follows [23]:
Risk analysis on the choice of inputs was used to generate electricity per kWh using
a standard deviation approach. The approach tries to categorize the different input types
of fuel from oil palm waste for mechanization of energy generation. The equation used
for calculating the standard deviation was as follows:
√
∑ ̅

Energies 2022, 15, x FOR PEER REVIEW 14 of 23
3.6. Techno-Economic Analysis
The economic analysis was carried out on a power plant that was scaled up from 10
kW to 100 kW. A sensitivity analysis was carried out by looking at the effect of the per-
centage increase in construction costs, the price of biomass fuel, and the price of diesel
fuel on the economic value of the project. The sensitivity analysis of the investment costs
to produce each kWh of electricity was also varied to determine the investment costs that
could produce an internal rate of return higher than the interest rate. In addition, a risk
analysis was also carried out to see the effect of investment costs and operating costs on
NPV [25].
3.6.1. Economic and Sensitivity Analysis
Based on the results of economic analysis, power plant investment can reach a break
event point in the 6th year as shown in Figure 5. With an interest rate base of 8%, the net
present value was positive after accumulating for 20 years of operation at USD 48,846 as
shown in Table 12, which means this power plant project provides benefits. The ratio
between cost and benefit was greater than 1, at 1.16. Meanwhile, the internal rate of re-
turn was also above the interest rate of 9.72%, so the investment was still profitable. The
cost of electricity was still below the selling price from the state power plant of USD
0.083/kWh, where the selling price from the government was USD 0.121/kWh, so there
was a difference of USD 0.037/Kwh as profit.
The sensitivity analysis was performed using the Crystal Ball software Version
11.1.2.4® with 100,000 trials. The feature used was the decision table tool [45,46]. With this
feature, we could simulate several different values or two decision variables. Interest
rates varied from 7% to 12%. The results of this analysis are presented in Table 12. The
NPV continued to decrease along with the increase in the interest rate, but the value re-
mained positive. The same trend also occurred in the IRR and B/C ratio. Even though the
NPV was always positive, and the B/C ratio was above 1, the results showed that when
the interest rate was at 10–12%, the IRR was already below the interest rate. Thus, in-
vestment had a percentage return that was greater than the interest rate if the interest rate
was lower or equal to 9%. However, the value of the interest rate was a fluctuating value
depending on the economic conditions of the Indonesian state.
Table 12. NPV, IRR, and B/C ratio forecast with interest rate variation.
Interest Rate 7% 8% 9% 10% 11% 12%
NPV (USD) 57,096 48,846 41,514 34,975 29,124 23,873
IRR (%) 10.75 9.72 8.71 7.73 6.76 5.80
B/C ratio 1.18 1.16 1.15 1.13 1.12 1.10
LCOE ($0.083/kWh)
Comment [M12]: incorrect ref
order, 43 detected after 38. You
jumped the numbers in
between.
Comment [ARS13]: I have been
removed citation number 43
Comment [M14]: incorrect ref
order, 45 detected after 38. You
jumped the numbers in
between.
Comment [ARS15]: I have been
changed this citation number
from 44,45 to 45,46,please
revised
Comment [M16]: incorrect ref
order, 44 detected after 38. You
jumped the numbers in
between.
Comment [ARS17]: I have been
corrected the citation number

Energies 2022, 15, x FOR PEER REVIEW 15 of 23
Figure 5. Return on investment based on the operating life of the power plant.
Investment costs were also varied to determine the range of investment costs that
still provided benefits. The range of investment costs, according to IRENA was from USD
950 to 1650/kW [42]. If one looks at the comparison of the investment costs in Table 13, in
the range from USD 950 to 1100/kW, it was still profitable because the IRR was above the
interest rate. Meanwhile, above USD 1100/kW, it was no longer profitable because the
IRR was under the base interest rate. In this study, the investment cost, which was the
base case, was USD 950/kWh.
Table 13. NPV, B/C ratio, and IRR with investment cost variation.
Investment Cost
(USD/kWh) 950 1100 1250 1400 1550 1650
NPV (USD) 48,846 44,681 40,515 36,350 32,184 29,407
B/C ratio 1.16 1.15 1.13 1.12 1.10 1.09
IRR (%) 9.72 8.64 7.62 6.67 5.76 5.18
The solid fuel that used for gasification was oil palm frond and oil palm trunk.
When compared for the two fuels, as shown in Table 14, oil palm trunk resulted in a
higher NPV and IRR, which means that it was profitable to use oil palm trunk as fuel. The
cost for oil palm trunk was $0.025/kg, while oil palm frond was $0.026/kg. The difference
was because the oil palm frond requires additional harvesting costs for each period while
the palm trunk does not. However, the use of oil palm frond and oil palm trunk is still
profitable. The difference is only in the profit margin. However, the price for diesel fuel
was a maximum at $0.47/L or the price of subsidies from the government, so that IRR was
above 8%.
Table 14. IRR with Variation of Diesel Fuel and Solid Fuel Price.
Diesel Fuel Price (USD/L) (0.40) (0.47) (0.55) (0.62) (0.69)
Oil palm trunk (USD/kg) 0.025 12.77 9.95 7.04 4.00 0.74
Oil palm Frond (USD/kg) 0.026 12.55 9.72 6.80 3.75 0.47
The effect of diesel fuel price and the interest rate on IRR was also analyzed, and the
results are presented in Table 15. The diesel fuel price used as the base case was the price
of a subsidy. If there was an increase in the price of subsidies, the investment remains
-9
-4
1
6
11
16
21
1 2 3 4 5 6 7 8 9 10 11 12 13 14 15 16 17 18 19 20 21
Cas
hfl
ow
(K
US
D)
Plant Life time (year)
Comment [M18]: incorrect ref
order, 42 detected after 38. You
jumped the numbers in
between.
Comment [ARS19]: This
citation number is in the order
in the reference list

Energies 2022, 15, x FOR PEER REVIEW 16 of 23
profitable, as long as the maximum price of diesel fuel is $0.47/L, with a maximum in-
terest rate of 9%. This power plant was calculated to implement small villages with low
to medium economic levels, and electricity was not used for extensive commercial activ-
ities. Thus, it was possible to use diesel fuel at a subsidized price as long as the price was
no more than the maximum price above. If the price and interest rate were to exceed, the
IRR value was under the base case of interest rate. The existence of subsidies from the
government is very influential on the benefits to be obtained from a power plant project.
In addition, the subsidy policy can also attract investors to make investments [8,42,44].
Table 15. IRR with variations in the diesel fuel price and interest rate.
Diesel Fuel Price (USD/L) 0.40 0.47 0.55 0.62 0.69
Interest rate
7% 13.60 10.75 7.80 4.72 1.41
8% 12.55 9.72 6.80 3.75 0.47
9% 11.52 8.71 5.82 2.80 (0.45)
10% 10.50 7.73 4.86 1.86 (1.36)
11% 9.51 6.76 3.92 0.94 (2.25)
12% 8.53 5.80 2.99 0.04 (3.12)
The effect of feed-in tariffs on the NPV, B/C Ratio, and IRR was analyzed, and the
results are presented in Table 16. The simulation results of the feed-in tariff was below
the base case of USD 0.12/kWh, the IRR was under the base case of interest rate. Thus, if
there was a decrease in feed-in tariffs from the government under the base case, invest-
ment in power plants does not provide optimal benefits. Based on the pattern of in-
creasing feed tariffs in Indonesia to date, it always increases over a specified period.
Thus, the feed-in tariff can be assumed not to reduce return of investment period because
the value continues to increase. However, decreases were still possible depending on
changes in subsidies and political decisions.
Table 16. NPV, B/C Ratio, and IRR with variations of the feed in tariff.
Feed in Tariff
(USD/kWh) 0.102 1.110 0.117 0.124 0.131
NPV (USD) (4581) 16,371 37,323 58,275 79,227
B/C Ratio 0.98 1.05 1.13 1.20 1.27
IRR (%) (1.04) 3.48 7.57 11.44 15.18
3.6.2. Financial Risk Analysis
Financial risk assessment was carried out to evaluate the effect of economic param-
eters on investment risk. The risk analysis of the power plant project was carried out
using Crystal Ball software®. This software was chosen because of the ease of operation,
and it is compatible with MS Excel® [45]. Another advantage, was that various types of
data distribution can be chosen according to needs. The simulation was conducted with
1,000,000 iterations. The Monte Carlo method was used for the risk analysis as it calcu-
lates with the technique of statistical sampling, operates with random input components,
and has uncertainty [25]. The input variable was simulated with several iterations and
produced several data in the form of probabilities. The normal probability distribution
was used. The selection of a probability distribution model in the Monte Carlo analysis
was essential because it affects the accuracy of the simulation results [44,47]. In addition,
the number of iterations must also be adjusted to obtain convergence. With a greater
number of iterations, the mean and standard deviation will be evenly distributed.
The risk analysis was carried out to look at the effect of capital cost, O & M cost, and
revenue on NPV, IRR, and the B/C Ratio. They were assumed with a probability of 90%
using a normal distribution and a standard deviation of 1% from the base case. Figures 6–
Comment [M20]: incorrect ref
order, 46 detected after 38. You
jumped the numbers in
between.
Comment [M21]: incorrect ref
order, 43 detected after 38. You
jumped the numbers in
between.
Comment [ARS22]: I have been
changed this citatiton number,
please revised
Comment [M23]: incorrect ref
order, 44 detected after 38. You
jumped the numbers in
between.
Comment [ARS24]: I have been
changed this citation number to
45
Comment [M25]: incorrect ref
order, 43 detected after 38. You
jumped the numbers in
between.
Comment [ARS26]: I have been
removed citation number 43
Comment [M27]: incorrect ref
order, 47 detected after 38. You
jumped the numbers in
between.
Comment [ARS28]: I have been
changed citation number to 44
Comment [M29]: incorrect ref
order, 43 detected after 38. You
jumped the numbers in
between.
Comment [ARS30]: I have been
revised and the number was
correct

Energies 2022, 15, x FOR PEER REVIEW 17 of 23
8 show the forecast capital cost, O&M cost, and revenue. The results of the risk analysis
are shown with a 90% confidence level and a 10% failure rate [25] that over the past 20
years, the NPV range obtained was from USD 41,833 to 55,861. NPV was estimated to
have an increase of 49.94% from the base case during the operating period of the plant,
which means the power plant project can provide benefits to investors.
Meanwhile, the IRR with a 90% probability obtained between 8.40% and 11.04%,
which means it was still higher than the interest rate. The percentage of IRR higher than
the base case was 50.02%, and the percentage of IRR higher than the interest rate was
98.42%. B/C ratio forecast with 90% probability was obtained from 1.14% to 1.19% and
had a percentage greater than the base case of 60.28%. Based on the results of the risk
analysis, the probability of investment risk was relatively small because the NPV was
always positive, and the IRR had the higher base case interest rate. Besides, with a 50%
chance of NPV above the base case, results were very promising for investors because the
estimated profits obtained during the operating life of the power plant were higher.
Figure 6. Effect of capital costs, O&M costs, and revenue on IRR.
Figure 7. Effect of capital costs, O&M cost, and revenue on the B/C ratio.
Comment [M31]: incorrect ref
order, 43 detected after 38. You
jumped the numbers in
between.
Comment [ARS32]: I have been
removed citation number 43

Energies 2022, 15, x FOR PEER REVIEW 18 of 23
Figure 8. Effect of capital costs, O&M cost, and revenue on net present value.
Based on the risk analysis of components that affect NPV, 68% of the most signifi-
cant influence was investment cost, while capital cost and revenue were the remainders.
Thus, if the investor can control and reduce investment costs, then it was possible to ob-
tain higher profits. The investment component that was possible to be reduced was the
capital cost of the gasification system. The investment cost was 74.4%, as shown in Figure
9. The gasification system used was foreign-made or made with imported products.
Considering the pilot-scale development experience that has been done, it was possible
to produce gasification systems independently so that investment costs can be reduced.
Figure 9. Sensitivity analysis of the investment cost components.
Furthermore, to determine the type of fuel that was able to produce the largest kWh
with low risk, standard deviation analysis was used. The analysis can provide infor-

Energies 2022, 15, x FOR PEER REVIEW 19 of 23
mation in the form of the types of raw materials used to produce electricity with the
smallest deviation. The mechanism for calculating investment risk from the standard
deviation was carried out by comparing the three fuels used to produce electrical energy,
namely, palm fronds, empty fruit bunch, and oil palm trunks.
Table 17 shows a comparison of the three types of fuel used to generate electricity.
Fuel derived from oil palm waste was categorized based on the type of waste tested
through mechanization so that it was able to generate electricity from renewable energy
fuel. The results of the analysis show that the type of fuel from the palm fronds had the
lowest standard deviation value and the rupiah value of the frond waste was cheaper
than other types of oil palm waste. The results of these calculations show that the small-
est risk for producing electricity comes from EBT fuel, which comes from the type of
palm frond waste at a price of 0.0259 USD/Kg and was able to generate electricity worth
0.0259 USD/kWh.
Table 17. Standard deviation analysis.
No Production Cost Oil Palm
Frond
Empty Fruit
Bunch
Oil Palm
Trunk
1 Biomass feedstock (USD/kg) 0.0259 0.0275 0.0254
2 Biodiesel (USD/L) 0.3107 0.3107 0.3107
3 System utility (USD/kWh) 0.0558 0.0558 0.0558
4 Staff and operator salary (USD/kWh) 0.0456 0.0456 0.0456
5 Maintenance (USD/kWh) 0.0003 0.0003 0.0003
6 Yearly capital cost (USD/kWh) 0.0099 0.0099 0.0099
7 Total 0.4483 0.4498 0.4478
8 Electric production (KW/day) 839 865 784
9 Feedstock consumption (kg/h) 49.55 51.06 46.33
10 Standard deviation (SD) 2.758 2.773 2.763
11 Electric price (Rp/kWh) 0.0259 0.0275 0.0254
3.7. Socio-Environment Impact Analysis
Inside the Industrial Revolutions 4.0 era, access to electricity is one of the primary
needs of everyday life both in urban and rural areas. The implementation of power
plants, especially in rural areas, has the aim of improving the socio-economic life of the
community. Social influence is expected to be felt in the long term, such as the ability to
read, study, and obtain information, and the addition of skills so that it can open oppor-
tunities for people to be more creative and innovative in developing their ability to face
the vicious cycle of poverty.
Positive influences from an economic perspective can increase people’s income and
create many new businesses. Socio-cultural changes are marked by changes in lifestyle
that are widely adopted from television shows, including in terms of daily lifestyle. Other
changes include an increase in school performance and better health and awareness in
protecting the environment and safety. The negative influence that must be watched is
the fading of local cultural values, such as cooperation, and consumer culture, seen from
the adoption of television shows and other media.
Before the gasification power plant was implemented, the majority of the village
community’s work was as farmers and farm laborers, whereas after the power plant,
many residents left their jobs in the agricultural sector. They turned to the productive
sector that uses electricity as an energy source to produce products. The economy, which
had previously relied on agriculture, then relied on services and industry. The presence
of power plants was proven to recruit labor so that unemployment was reduced. One
factor was the new employment opportunities presented for residents. The employment

Energies 2022, 15, x FOR PEER REVIEW 20 of 23
opportunities included food and beverage, document services, boarding, and rented
houses, lodging, and other service sectors.
The community around the power plant area was directed to obtain additional in-
come apart from agricultural products. The electricity provided by gasification power
plants has a positive impact on the community’s economy. The community has new
business opportunities including in the fisheries and trade sectors. If this gasification
power plant was built in a coastal area that has biomass potential, the community was
also facilitated by making boreholes so that sufficient water was available, and the es-
tablishment of a fish auction place.
Viewed from an environmental aspect, the implementation of power plants will
have an impact on the environment, starting from the construction process to the opera-
tion. Impacts that occur are possibly both temporary and permanent. The construction of
power plants involves the use of land or space inside or on the surface of the land, the use
of water resources, and the most influential environment was the presence of pollution to
the air and water. The indicators and parameters of the environmental quality index can
be seen in Table 18.
Table 18. Indicators and Parameters of the Environmental Quality Index in 2019 [49].
No. Indicators Parameters Weight
1. River water
quality
TSS
30%
DO
BOD
COD
Total Phosphate
Fecal Coliform
Total Coliform
2. Air quality SO2
30% NO2
3. Quality of
land
cover area of forest cover, shrubs and swamp shrubs lo-
cates in forest areas and protected function areas (river
borders, lakes and beaches, slopes > 25%) green open
spaces, botanical gardens and biodiversity parks
40%
The construction of a power plant that utilizes green land will disrupt vegetation
and also affect the wildlife that exists in the environment. Flue gas produced from the
combustion of diesel engines will cause an increase in air temperature around the power
plant, in addition to the combustion product in the form of CO2 , which causes pollution
or contributes to the emission of greenhouse gases. Water used as a syngas cooler before
it is used on a diesel engine will reduce the water supply around the plant, both for sur-
face and underground water. After the water is used, it becomes wastewater and needs to
be disposed of in the environment. With wastewater disposal, the temperature of the
waste will be higher than the average temperature, and the most dangerous impact is the
pollutants contained in the water, which can cause environmental damage. Therefore,
before wastewater is discharged, it is necessary to treat it first. In addition to liquid waste,
solid waste in the form of ash from gasification is also produced from power plants. The
handling of solid waste must be managed so that it does not have a negative impact.
Furthermore, the level of noise and vibration around the project site will increase; during
plant operations this condition also continues to occur.
4. Conclusions
The Prototype of Gasification with multi-stage downdraft gasifier technology with a
capacity of 10 kW has been developed on a laboratory scale. Furthermore, the result was
Comment [M33]: incorrect ref
order, 48 detected after 38. You
jumped the numbers in
between.
Comment [ARS34]: I have been
changed to citation number 49

Energies 2022, 15, x FOR PEER REVIEW 21 of 23
technically and economically feasible as a commercial alternative power plant on a small
scale of 100 kW. The economic analysis indicated that the power plant will have an NPV
of USD 48,846 with an IRR of 9.72%. The payback period was achieved at six years for the
required investment costs of USD 56,143. The availability of fuel i.e., oil palm plantation
waste in the form of oil palm frond and oil palm trunk was sufficient throughout the year
so that it can continue to be used as long as the price was no more than USD 0.026/kg, as
well as diesel fuel with a maximum price of USD 0.47/L. All investment costs can be re-
turned following the payback period if the plant can operate at least 355 days/year. Risk
analysis was also carried out by considering the uncertainty of economic conditions that
can affect changes in capital cost, operation and maintenance costs, and increases or de-
creases in revenue. The result, with a probability of 90%, NPV obtained USD 41.833–5.861
with a percentage of 49.94% above the base case was achieved. Meanwhile, IRR was ob-
tained between 8.40% and 11.04%.
In terms of social aspects, the existence of power plant in rural areas was considered
to increase people’s income and create many new businesses. The existence of a power
plant employs the surrounding community. The continuous supply of electrical energy
opens up business opportunities, both micro and medium, that utilize electrical energy as
the primary energy sources. However, adverse environmental impacts must not be ig-
nored from the construction stage to the operation of the power plant. The construction
of power plants must refer to rules that have been issued by the government in order to
maintain an environmental balance.
Author Contributions: Conceptualization, A.R.S. and J.A.P.; methodology, J.I.; software, A.R.S.;
validation, J.I., B.S. and J.A.P.; data curation, E.N.J.; writing—original draft preparation, A.R.S.;
writing—review and editing, J.A.P.; visualization, A.R.S.; supervision, B.S.; funding acquisition, J.I.
All authors have read and agreed to the published version of the manuscript.
Funding: This research received no external funding.
Institutional Review Board Statement: Not applicable
Informed Consent Statement: Not applicable
Data Availability Statement: The data used in this paper were provided by the experimental data
from The Combustion and Energy System Laboratory, Institut Teknologi Sepuluh Nopember
Acknowledgments: Publishing fees were supported by Tidar University from Publication Incen-
tive Program. Thanks to Tidar University for supporting the publication.
Conflicts of Interest: The authors declare no conflict of interest.
Abbreviations
ASTM American Society for Testing and Material
B/C Benefit to Cost Ratio
ER Equivalent Ratio
AR Air Ratio
IDR Indonesian Rupiah
IRR Internal Rate of Return
IRENA International Renewable Energy Agency
LHV Low Heating Value
LCOE Leverage Cost of Electricity
NPV Net Present Value
POME Palm Oil Milk Effluent
O&M Operation and Maintenance
PBP Payback Period
Nomenclature
N Number of period (year)

Energies 2022, 15, x FOR PEER REVIEW 22 of 23
y Year
Cy Cash inflow in year (USD)
i Interest rate (%)
S Standard Deviation
Reference
1. Kementrian Energi dan Sumber Daya Mineral (ESDM). Rasio Elektrifikasi Indonesia Status Juni-2017. 2017. Available online:
https://www.esdm.go.id/assets/media/content/content-rasio-elektrifikasi-indonesia-status-juni-2017.pdf (accessed on 7 De-
cember 2021). 2. Kamperidou, V.; Terzopoulou, P. Anaerobic digestion of lignocellulosic waste materials. Sustainability (Switz.) 2021, 13, 12810.
https://doi.org/10.3390/su132212810.
3. Public Relation Minister of Energy and Mineral Resources. Strategic Policy for the Utilization of EBT, Based on Productivity
and Innovation. December 2019. Available online:
https://ebtke.esdm.go.id/post/2019/12/18/2432/kebijakan.strategis.pemanfaatan.ebt.berbasis.produktivitas.dan.inovasi (ac-
cessed on 13 January 2022).
4. Wicaksono, P.E. Pembangkit Listrik Bertenaga Limbah Sawit Ada di Desa Ini. 2014. Available online:
http://bisnis.liputan6.com/read/2105888/pembangkit-listrik-bertenaga-limbah-sawit-ada-di-desa-ini (accessed on 10 December
2021).
5. Rachmad, S. Pemerintah Tetapkan Harga Baru Listrik Biomassa dan Biogas. 2014. Available online:
http://industri.bisnis.com/read/20141022/44/266967/pemerintah-tetapkan-harga-baru-listrik-biomassa-dan-biogas (accessed on
7 December 2021). 6. Direktorat, J.; Energi, E. B. T. dan Konservasi, E. Kementerian, and dan S. D. Energi, Mineral, Investment Guidelines Bioenergy In
Indonesia. 2016. (accessed on 7 December 2021).
7. Wijono, A. Environmental Mapping and Assessment the Potential of Palm Oil as a Renewable Energy Source in Indonesia. In National Symposium RAPI XII-2013 FT UMS; 2013; pp. 1–67.
8. Shuit, S.H.; Tan, K.T.; Lee, K.T.; Kamaruddin, A.H. Oil palm biomass as a sustainable energy source: A Malaysian case study. Energy 2009, 34, 1225–1235. https://doi.org/10.1016/j.energy.2009.05.008.
9. Mekbib, S.; Anwar, S.; Yusup, S. Syngas production from downdraft gasi fi cation of oil palm fronds. Energy 2013, 61, 491–501.
https://doi.org/10.1016/j.energy.2013.09.039.
10. Nudri, N.A.; Bachmann, R.T.; Ghani, W.A.W.A.K.; Sum, D.N.K.; Azni, A.A. Characterization of oil palm trunk biocoal and its
suitability for solid fuel applications. Biomass Convers. Biorefinery 2020, 10, 45–55. https://doi.org/10.1007/s13399-019-00419-z.
11. Douglas, S.; Anne, C.; Erik, M.; Meine, v.N.; Joanne, G.; Jacqui, Su.; Karah, W.; Markku, K. The Impacts and Opportunities of Oil
Palm in Southeast Asia: What Do We Know and What Do We Need to Know?; Center for International Forestry Research 2009.
https://doi.org/10.17528/cifor/002792. 12. Arena, U. Process and technological aspects of municipal solid waste gasification. A review. Waste Manag. 2012, 32, 625–639.
https://doi.org/10.1016/j.wasman.2011.09.025. 13. Basu, P. Biomass Gasification and Pyrolysis Handbook; Academic Press 2010. https://doi.org/10.1016/B978-0-12-374988-8.00001-5.
14. Molino, A.; Chianese, S.; Musmarra, D. Biomass gasification technology: The state of the art overview. J. Energy Chem. 2016, 25,
10–25. https://doi.org/10.1016/j.jechem.2015.11.005.
15. Krzywanski, J.; Fan, H.; Feng, Y.; Shaikh, A.R.; Fang, M.; Wang, Q. Genetic algorithms and neural networks in optimization of sorbent enhanced H2 production in FB and CFB gasifiers. Energy Convers. Manag. 2018, 171, 1651–1661.
https://doi.org/10.1016/j.enconman.2018.06.098.
16. Erlich, C.; Fransson, T.H. Downdraft gasification of pellets made of wood, palm-oil residues respective bagasse: Experimental study. Appl. Energy 2011, 88, 899–908. https://doi.org/10.1016/j.apenergy.2010.08.028.
17. Jaojaruek, K.; Jarungthammachote, S.; Gratuito, M.K.B.; Wongsuwan, H.; Homhual, S. Experimental study of wood downdraft
gasification for an improved producer gas quality through an innovative two-stage air and premixed air/gas supply approach.
Bioresour. Technol. 2011, 102, 4834–4840. https://doi.org/10.1016/j.biortech.2010.12.024.
18. Saleh, A.R.; Sudarmanta, B.; Fansuri, H.; Muraza, O. Improved Municipal Solid Waste Gasification Efficiency Using a Modified Downdraft Gasifier with Variations of Air Input and Preheated Air Temperature. Energy Fuels 2019, 33, 11049–11056.
https://doi.org/10.1021/acs.energyfuels.9b02486. 19. Susastriawan, A.A.P.; Saptoadi, H.; Purnom. Small-scale downdraft gasifiers for biomass gasification: A review. Renew. Sustain.
Energy Rev. 2017, 76, 989–1003. https://doi.org/10.1016/j.rser.2017.03.112.
20. Saleh, A.R.; Sudarmanta, B.; Fansuri, H.; Muraza, O. Syngas production from municipal solid waste with a reduced tar yield by three-stages of air inlet to a downdraft gasifier. Fuel 2020, 263, 116509. https://doi.org/10.1016/j.fuel.2019.116509.
21. Romaniuk, W.; Savinykh, P.A.; Borek, K.; Plotnikowa, Y.A.; Palitsyn, A.V.; Korotkov, A.N.; Roman, K.; Roman, M. Improve-ment of gas generator technology for energy processing of agricultural waste. Energies 2021, 14, 3642.
https://doi.org/10.3390/en14123642.
22. All Power Lab. Affordable • Portable • On-Demand Carbon-Negative EnergY From Biomass-Powered Gensets. 2016. Availa-
ble online: www.allpowerlabs.com (accessed on 9 December 2021).

Energies 2022, 15, x FOR PEER REVIEW 23 of 23
23. Cardoso, J.; Silva, V.; Eusébio, D. Techno-economic analysis of a biomass gasification power plant dealing with forestry resi-dues blends for electricity production in Portugal. J. Clean. Prod. 2019, 212, 741–753. https://doi.org/10.1016/j.jclepro.2018.12.054.
24. Situmorang, Y.A.; Zhao, Z.; Yoshida, A.; Abudula, A.; Guan, G. Small-scale biomass gasification systems for power generation (<200 kW class): A review. Renew. Sustain. Energy Rev. 2020, 117, 109486. Elsevier Ltd, Jan. 01.
https://doi.org/10.1016/j.rser.2019.109486.
25. Porcu, A.; Sollai, S.; Marotto, D.; Mureddu, M.; Ferrara, F.; Pettinau, A. Techno-economic analysis of a small-scale bio-mass-to-energy BFB gasification-based system. Energies 2019, 12, 494. https://doi.org/10.3390/en12030494.
26. Sobamowo, G.M.; Ojolo, S.J. Techno-Economic Analysis of Biomass Energy Utilization through Gasification Technology for Sustainable Energy Production and Economic Development in Nigeria. J. Energy 2018, 2018, 1–16.
https://doi.org/10.1155/2018/4860252.
27. Jozami, E.; Porstmann, J.C.; Shocron, A.; Feldman, S. Techno-economic Assessment of Biomass Gasification of Spartina argen-tinensis. Agrociencia Urug. 2017, 21, 78–88. https://doi.org/10.2477/vol21iss1pp78-88.
28. Deiana, P.; Maggio, E.; Bassano, C.; Meloni, S. Techno-Economic Analysis of Syngas and Electric Power Production in FOAK
Industrial Gasification Plant Fed by Biomass and Agro-Industrial Residues In Proceedings of the 9th International Freiberg
Conference. no. 9, Berlin 3 -8 June, 2018.
29. G. Calì, P. Deiana, E. Maggio, C. Bassano, S. Meloni, and S. SpA, “2018 9th International Freiberg Conference 9th International
Freiberg Conference Techno-Economic Analysis of Syngas and Electric Power Production in FOAK Industrial Gasification
Plant fed by Biomass and Agro-industrial Residues,” 2018. Accessed: Dec. 30, 2021. [Online]. Available:
https://tu-freiberg.de/en/fakult4/iec/evt/techno-economic-analysis-of-syngas-and-electric-power-production-in-foak-industrial
-
30. Kivumbi, B.; Olwa, J.; Martin, A.; Menya, E. Techno-economic assessment of municipal solid waste gasification for electricity generation: A case study of Kampala City, Uganda. Agric. Eng. Int. CIGR J. 2015, 17, 141–155.
31. Gökalp, I.; Kaya, O.; Keçecioglu, S.; Boden, D. A Techno-Economic Feasibility Analysis of the Gasification of Used Tires for Energy Generation in Turkey. Detritus 2019, 7, 68–75. https://doi.org/10.31025/2611-4135/2019.13843.
32. Saleh, A.R.; Sudarmanta, B. Experimental investigation on multi-stage downdraft gasification: Influence of air ratio and
equivalent ratio to the gasifier performance. In Proceedings of the AIP Conference Proceedings, 2018; Volume 1983. Surabaya,
Indonesia, 5–6 October 2017. https://doi.org/10.1063/1.5046222.
33. Sudarmanta, B.; Gafur, A.; Saleh, A.R.; Dwiyantoro, B.A.; Sampurn. The effect of two stage gasifying agent on biomass
downdraft gasification to the gasifier performance. In Proceedings of the AIP Conference Proceedings, 2018; Volume 1983.
Surabaya, Indonesia, 5–6 October 2017. https://doi.org/10.1063/1.5046233.
34. Daouk, E.; van de Steene, L.; Paviet, F.; Martin, E.; Valette, J.; Salvador, S. Oxidative pyrolysis of wood chips and of wood pel-lets in a downdraft continuous fixed bed reactor. Fuel 2017, 196, 408–418. https://doi.org/10.1016/j.fuel.2017.02.012.
35. Li, D.; Briens, C.; Berruti, F. Oxidative pyrolysis of kraft lignin in a bubbling fluidized bed reactor with air. Biomass Bioenergy
2015, 76, 96–107. https://doi.org/10.1016/j.biombioe.2015.03.007.
36. Milhé, M.; van de Steene, L.; Haube, M.; Commandré, J.M.; Fassinou, W.F.; Flamant, G. Autothermal and allothermal pyrolysis in a continuous fixed bed reactor. J. Anal. Appl. Pyrolysis 2013, 103, 102–111. https://doi.org/10.1016/j.jaap.2013.03.011.
37. Shi, H.; Si, W.; Li, X. The concept, design and performance of a novel rotary kiln type air-staged biomass gasifier. Energies 2016,
9, 67. https://doi.org/10.3390/en9020067.
38. El-Hendawy, A.N.A. Variation in the FTIR spectra of a biomass under impregnation, carbonization and oxidation conditions. J.
Anal. Appl. Pyrolysis 2006, 75, 159–166. https://doi.org/10.1016/j.jaap.2005.05.004.
39. El-Hendawy, A.N.A. Surface and adsorptive properties of carbons prepared from biomass. Appl. Surf. Sci. 2005, 252, 287–295.
https://doi.org/10.1016/j.apsusc.2004.11.092. 40. Brandt, P.; Larsen, E.; Henriksen, U. High Tar Reduction in a Two Stage Gasifier Brant. Energy Fuels 2000, 14, 816–819.
41. Harahap, F.; Leduc, S.; Mesfun, S.; Khatiwada, D.; Kraxner, F.; Silveira, S. Opportunities to optimize the palm oil supply chain
in Sumatra, Indonesia. Energies 2019, 12, 420. https://doi.org/10.3390/en12030420.
42. IRENA International Renewable Energy Agency. Renewable Power Generation Costs in 2017; International Renewable Energy
Agency (IRENA) 2018. Abu Dabi United Arab Emirates. https://doi.org/10.1007/SpringerReference_7300.
43. Ltd. DONGFENG CUMMINS ENGINE Co. Cummins engine datasheet. 2007.
44. Pereira, E.J.d.; Pinho, J.T.; Galhardo, M.A.B.; Macêdo, W.N. Methodology of risk analysis by Monte Carlo Method applied to power generation with renewable energy. Renew. Energy 2014, 69, 347–355. https://doi.org/10.1016/j.renene.2014.03.054.
45. Oracle Corporation. The Decision Table T. 2017.
46. Oracle Corporation. The Crystal Ball Charts: Sensitivity. 2017.
47. Owens, G. Best Practices Guide : Economic & Financial Evaluation of Renewable Energy Projects. US Agency Int. Dev. 2002, 1,
1–50. 48. Khindanova, I. A Monte Carlo Model of a Wind Power Generation Investment. J. Appl. Bus. Econ. 2013, 15, 94–106.
49. Kementrian Lingkungan Hidup dan Kehutanan. Indeks Kualitas Lingkungan Hidup. Jakarta, Indonesia, 2020.
Comment [ARS35]: I has been
added this catition based on
previous revision, I think the
problem starting from this
point

5/13/22, 3:01 PM Email Universitas Tidar - Need Your Confirmation: [Energies] Manuscript ID: energies-1520840
https://mail.google.com/mail/u/0/?ik=2b096d038c&view=pt&search=all&permthid=thread-f%3A1723370273349799575&simpl=msg-f%3A1723370273… 1/2
arif rahman saleh <[email protected]>
Need Your Confirmation: [Energies] Manuscript ID: energies-1520840 3 pesan
Energies Editorial Office <[email protected]> 30 Januari 2022 16.12Balas Ke: Adelina Simon <[email protected]>, Energies Editorial Office <[email protected]>Kepada: arif rahman saleh <[email protected]>Cc: jaka isgiyarta <[email protected]>, Energies Editorial Office <[email protected]>,[email protected], [email protected], [email protected], Adelina Simon <[email protected]>,Anna Xiao <[email protected]>
Dear Dr. Saleh,
There are still some issues for you to confirm. You can find the details in the attachment. Please send us the revised version within 24 hours.
Kind regards,
Mr. Allen Liu Assistant Editor E-mail: [email protected]
-- MDPI Branch Office, Beijing Energies Editorial Office E-mail: [email protected] http://www.mdpi.com/journal/energies/
MDPI Postfach, CH-4020 Basel, Switzerland Office: St. Alban-Anlage 66, 4052 Basel
Energies Editorial Office <[email protected]> 30 Januari 2022 16.15Balas Ke: Adelina Simon <[email protected]>, Energies Editorial Office <[email protected]>Kepada: arif rahman saleh <[email protected]>Cc: jaka isgiyarta <[email protected]>, Energies Editorial Office <[email protected]>,[email protected], [email protected], [email protected], Adelina Simon <[email protected]>,[email protected]
[Kutipan teks disembunyikan]
2 lampiran
energies-1520840 (2).pdf 962K
energies-1520840 (2).docx 893K
arif rahman saleh <[email protected]> 31 Januari 2022 18.13Kepada: Adelina Simon <[email protected]>, Energies Editorial Office <[email protected]>Cc: jaka isgiyarta <[email protected]>, Energies Editorial Office <[email protected]>, bambang sudarmanta<[email protected]>, Jalu Aji Prakoso <[email protected]>, "[email protected]"<[email protected]>, Adelina Simon <[email protected]>, [email protected]
Dear Mr. Alle Liu
Yes, I confirm. and I send the revised version with this email.

5/13/22, 3:01 PM Email Universitas Tidar - Need Your Confirmation: [Energies] Manuscript ID: energies-1520840
https://mail.google.com/mail/u/0/?ik=2b096d038c&view=pt&search=all&permthid=thread-f%3A1723370273349799575&simpl=msg-f%3A1723370273… 2/2
Best Regard, Arif Rahman Saleh, ST., MTProgram Studi Teknik MesinFakultas TeknikUniversitas Tidar email: [email protected], [email protected]: 082386085001
[Kutipan teks disembunyikan]
energies-1520840 -rev01.docx 899K

Energies 2022, 15, x. https://doi.org/10.3390/xxxxx www.mdpi.com/journal/energies
Article
Micro-Grid Oil Palm Plantation Waste Gasification Power
Plant in Indonesia: Techno-Economic and
Socio-Environmental Analysis
Jaka Isgiyarta 1,*, Bambang Sudarmanta 2, Jalu Aji Prakoso 3, Eka Nur Jannah 4 and Arif Rahman Saleh 5,*
1 Department of Accounting, Faculty of Economics and Business, Diponegoro University,
50275 Semarang, Indonesia 2 Department of Mechanical Engineering, Faculty of Engineering, Institut Teknologi Sepuluh Nopember,
60111 Surabaya, Indonesia; [email protected] 3 Department of Economic Development, Faculty of Economics, Universitas Tidar, 56116 Magelang, Indone-
sia; [email protected] 4 Department of Agrotechnology, Faculty of Agriculture, Universitas Tidar, 56116 Magelang, Indonesia;
[email protected] 5 Department of Mechanical Engineering, Faculty of Engineering, Universitas Tidar, 56116 Magelang, Indone-
sia
* Correspondence: [email protected] (J.I.); [email protected] (A.R.S.)
Abstract: The utilization of new and renewable energy sources explicitly based on biomass needs
to be increased to reduce dependence on fossil fuels. One of the potential biomasses of plantation
waste in Indonesia that can be utilized is oil palm plantation waste in the form of fronds and trunks
that are converted with multi-stage downdraft gasification technology. This study aimed to conduct
a technical analysis, economic analysis, investment risk analysis, social analysis, and an environ-
mental impact assessment of power plants fueled by oil palm plantation waste. The method used
was the upscaling of a prototype of a 10 kW power plant to 100 kW. The results showed that it was
technically and economically feasible to apply. The economic indicators were a positive NPV of
USD 48.846 with an IRR of 9.72% and a B/C ratio of 1.16. The risk analysis predicted a probability
of an NPV 49.94% above the base case. The study of the social aspects suggested that the construc-
tion of power plants has a positive impact in the form of increased community income and the
growth of new economic sectors that utilize electricity as a primary source. An analysis of the envi-
ronmental effects is critical so that the impacts can be minimized. Overall, the construction of small-
scale power plants in oil palm plantations is worth considering as long as it is carried out following
the applicable regulations.
Keywords: gasification; multi-stage; techno-economic; power plant; oil palm waste
1. Introduction
The availability of clean energy is necessary to meet national energy needs to effi-
ciently support the goal of the sustainable development of new and renewable energy in
Indonesia. By 2025, it is expected that the renewable energy mix can grow to 23% with an
installed capacity of 5500 MWe as shown in Figure 1. Until 2018, the percentage of renew-
able energy utilization reached 6.2%. The bioenergy sector is expected to contribute 8.2%
to national energy, one way of which is through the development of bioenergy power
plants [1]. The utilization of new and renewable energy has become a topic of interest and
is on the agenda in the world as one of the solutions to overcome the problems of the
current energy crisis. The cause of this energy crisis is the decreasing availability of fossil
fuels. Biomass, because of its abundant availability, can substitute for the use of fossil
fuels. Compared to other renewable energy sources (wind, solar, etc.), energy production
Citation: Isgiyarta, J.; Sudarmanta,
B.; Prakoso, J.A.; Jannah, E.N.; Saleh,
A.R. Micro-Grid Oil Palm Plantation
Waste Gasification Power Plant in
Indonesia: Techno-Economic and
Socio-Environmental Analysis.
sEnergies 2022, 15, x.
https://doi.org/10.3390/xxxxx
Academic Editor(s):
Received: 7 December 2021
Accepted: 19 January 2022
Published: date
Publisher’s Note: MDPI stays neu-
tral with regard to jurisdictional
claims in published maps and institu-
tional affiliations.
Copyright: © 2022 by the authors.
Submitted for possible open access
publication under the terms and con-
ditions of the Creative Commons At-
tribution (CC BY) license (https://cre-
ativecommons.org/licenses/by/4.0/).

Energies 2022, 15, x FOR PEER REVIEW 2 of 23
from biomass requires lower capital investment costs [2]. To encourage the acceleration
of the use of renewable energy in Indonesia, the government has established various pol-
icies. The government has the target of an additional installed capacity from renewable
energy power plants of 905.73 megawatts (MW), consisting of 196 MW from geothermal
powerplants, 557.93 MW from hydro power plants, 138.8 MW from solar power plants,
and 13 MW from bio power plants. Meanwhile, the renewable energy investment target
in 2021 will increase to USD 2.05 billion or approximately IDR 28.9 trillion (assuming an
exchange rate of IDR 14,100 per dollar) from the investment achievement in 2020, which
amounted to USD 1.36 billion or approximately IDR 19.2 trillion. Some of the govern-
ment’s policies on new energy are as follows [3]:
a. Implementation of the mandatory B30 program for all sectors, followed by the devel-
opment of biodiesel trials as a substitute for fossil diesel with B100 (biodiesel 100%)
development technology;
b. Mixing of research octane number 92 Oil Fuel in East Java in the context of efforts to
procure bioethanol-type biofuel, in accordance with the Regulation of the Minister of
Energy and Mineral Resources Number 12 of 2015;
c. Acceleration of waste power plant development in 12 selected cities, as mandated by
Presidential Regulation Number 35 of 2018 concerning the acceleration of waste
power plant development programs;
d. Encouraging the use of rooftop solar power plants in accordance with the mandate
of the Minister of Energy and Mineral Resources Regulation Number 49 of 2018 con-
cerning the Use of Rooftop Solar Power Generation Systems by state power plant
consumers;
e. Simplifying the bureaucratic process through the of Energy and Mineral Resources
Online Licensing Application, which is integrated with data on natural resources,
operations, production, and marketing/sales of each type of energy;
f. Increasing the use of renewable energy to reduce dependence on fossil fuels, which
will have an impact on increasing Indonesia’s economic stability.
Figure 1. Primary energy supply by 2025.
The utilization of biomass waste into energy can be a solution to reduce dependency
on fossil fuel. The potential energy from biomass is currently at 32,654 MW and 1716.5
MW has been developed [4]. Development of bioenergy-based power plants (on-grid) un-
til 2013 reached 90.5 MW, while for those off-grid it reached 1626 MW [5]. One of the most
significant biomass potentials in Indonesia is from solid waste from oil palm plantations.
Oil palm plantations in Indonesia are the largest source of biomass with a total electricity
energy that can be generated of 5495 MWe [6]. The sources come from plantation wastes
(oil palm fronds and oil palm trunks) or waste from oil palm mill production (meso scrap
28%
23%28%
21%
Renewable Energy Oil Coal Gas

Energies 2022, 15, x FOR PEER REVIEW 3 of 23
fiber, palm kernel shell, and oil palm mill effluent). However, not all these wastes are
utilized as energy, so they have the potential to become sources of greenhouse gas emis-
sions when they decompose. In addition, in terms of the environment in recent years, the
oil palm plantation industry in Indonesia has been in the European Union’s and the
United States’ spotlight because it is considered an industry that is not environmentally
friendly due to the impact it causes [7]. If the renewable energy target policy is imple-
mented by 2030, it is expected to reduce greenhouse gas emissions by 29% compared to
2010.
Indonesia has five provinces with the most extensive oil palm plantations, namely,
South Sumatra, Central Kalimantan, West Kalimantan, North Sumatra, and Riau. In 2019,
the Indonesian State Electricity Company reported that Indonesia’s electrification ratio
had reached 99%. However, the electrification ratio is still calculated from the number of
people who obtain electricity for access to lighting and not for the productive sector. The
Ministry of Energy reported the data on villages that did not have access to electricity to
be as many as 2281 villages out of a total of 232,128 villages in Indonesia [1]. Meanwhile,
for the five provinces with the most extensive oil palm plantations, there are 785 villages,
2510 villages, 13,595 villages, 634 villages, and 5209 villages, respectively, as shown in
Figure 2. The condition is ironic, since these five provinces produce much of the oil palm
plantation waste. At present, access to electricity only benefits people in urban areas
where there is an installed electricity network. In contrast, construction of the network
constrains those plantations because the cable must pass through the plantations. Thus,
the issue of land acquisition is a significant factor in the lack of access to electricity in rural
communities located in oil palm plantations.
Figure 2. Villages that have no access to electricity in Indonesia.
Oil palm plantation wastes are oil palm fronds and oil palm trunks. Oil palm fronds
during pruning and replantation activities are always stacked and collected at an average
production rate of 9.8 t-dry/ha-estate/year and 14.9 t-dry/ha-replantation/year. A study
reported that oil palm fronds contain 25.5% (dry basis) hemicellulose material, which has
excellent potential to be used as a raw material for biofuels and bio-based material pro-
duction [8–11]. Oil palm trunks are the second type of biomass residue produced during
replanting. Oil palm trunk production is estimated at 62.8 t-dry/ha-replantation/year. At
present, oil palm fronds are usually burned as fuel in processing plants, and the remainder
is disposed of in plantations, while oil palm trunks after the replanting process are not
utilized [10]. Utilization of oil palm waste as a raw material for renewable energy that can
generate electricity is a solution to the residue of oil palm industry activities in Indonesia.
According to the Ministry of Energy and Mineral Resources of the Republic of Indonesia,

Energies 2022, 15, x FOR PEER REVIEW 4 of 23
the renewable energy market in Indonesia is not yet optimal because it relies on solar
panels which have components that are imported. Thus, the government is pushing a
draft Indonesian Presidential Regulation that will regulate the price of new renewable
electricity. Through this policy, it is hoped that the production of renewable energy that
utilizes oil palm waste as a raw material can grow in oil palm industrial areas in Indonesia.
In addition, the push for the use of renewable energy is in line with the global commitment
to the 7th point of the Sustainable Development Goals that are to be achieved by 2030
regarding clean and affordable energy.
One technology that can be used to convert biomass into alternative energy without
producing emissions is gasification [12]. Gasification is the process of converting solid or
liquid raw materials into thermochemical gases [13]. Different to combustion, gasification
produces higher efficiency, and the pollutants are still below emissions standards. The
gasification process consists of several sequential stages, namely, the drying, pyrolysis,
partial oxidation, and reduction stages. Gasification requires media such as air, oxygen,
or water vapor. The gas produced from the gasification process, commonly called syn-
thetic gas (syngas), consists of combustible syngas (i.e., CO, H2, and CH4) and non-com-
bustible gas (i.e., CO2, N2, and the remaining O2) [14]. Gasification reactions occur in a
reactor called a gasifier. There are various types of gasifiers such as updraft, downdraft,
cross draft, bubbling fluidized bed gasifiers, and circulating fluidized beds (CFBs) [15].
One type of gasifier that is widely used is the downdraft [16–18]. A downdraft gasifier has
the advantage of a high carbon conversion rate, low tar production, and simple construc-
tion compared to other types [19].
The aim of this study was to analyze the utilization of oil palm plantation waste as
fuel in gasification power plants. The analyses simultaneously carried out were technical,
economic, investment risk, social, and environmental impact analyses. Oil palm planta-
tion wastes used were oil palm fronds and oil palm trunks. Both of these plantation wastes
have been reported by several previous studies and are suitable as feedstock for gasifica-
tion. The power plant analyzed was upscaled from a laboratory-scale prototype with a
capacity of 10 kW, which has been reported in previous studies, to a small-scale power
plant with a capacity of 100 kW. The gasification technology used the multi-stage
downdraft gasifier [20]. This technology has the advantage of being able to produce syn-
gas with a high–low heating value and a low tar content of 2.6 times compared to the
single-stage downdraft gasifier that has been reported in other studies. Moreover, this
multi-stage gasification technology was also equipped with an air heating system that was
also capable of producing low tar content up to 27.8 mg/Nm3 and temperature increases
at the partial oxidation zone with a constant equivalent ratio [18].
Several previous studies using gasification technology for power generation have
been carried out. Romaniuk [21]conducted research by utilizing agricultural waste as fuel
in gas generators. Modification of the gas generator was conducted by adjusting the sup-
ply of oxidizer (air supply) into the reaction zone. A downdraft-type gasification power
plant with a capacity of 25 kW was also developed by ENTRAGE Energies System AG,
using a 4.3 L six-cylinder petrol engine coupled to an electric generator. A downdraft-type
gasification power plant was also developed by ALL POWER LABS with a power output
of 15 kW [21,22]. The gasifier was coupled to a four-cylinder diesel engine and an electric
generator. Currently, one of the largest biomass power plants is located in the UK, near
Cheshire, and it produces 21.5 MW of electrical energy. A gasification power plant with a
capacity of 100 kW in current market conditions is more profitable than a larger capacity
provided that the fuel used is not difficult to supply [23]. Situmorang [24] reports that
gasification power plants can be used to utilize locally available biomass as fuel with a
generating capacity of less than 200 kW.
Before the power plant was implemented, it was necessary to evaluate the feasibility
and sustainability of the project in terms of economic, social, and environmental as well
as the risk variables that could hinder the success of the project. Some analyses that needed
to be conducted were techno-economic, risk, and social–environmental. Techno-economic

Energies 2022, 15, x FOR PEER REVIEW 5 of 23
analyses of gasification power plants have been carried out in several previous studies.
Porcu [25] conducted a techno-economic analysis of a gasification power plant being up-
scaled from 500 to 200 kW using a bubbling fluidized bed gasifier. Singh conducted a
techno-economic analysis of hybrid power plants between gasification, solar PV, and fuel
cells, but the gasification technology used was not mentioned. Economic and environmen-
tal impact analyses of an 11 MW capacity gasification power plant were carried out by
Cardoso [23], and the results of the study reported that the NPV was influenced by reve-
nue from electric sales. Sobamowo [26]conducted a techno-economic analysis of a gasifi-
cation power plant using downdraft gasification technology with a capacity of 60 MW;
the results of the study reported that the distance between the power plant and the source
of raw materials affected the raw material costs. Moreover, local materials for capital in-
vestment, maintenance, and fuel costs provided higher profit margins.
Emiliano [27,28] conducted a techno-economic assessment of power plants with gas-
ification technology. The results of the study reported that the price of gaseous fuel (i.e.,
natural gas) dramatically affects the economics of the power plant project. In addition,
power efficiency and the selling price of electricity can produce a higher NPV. Cali [29]
conducted a techno-economic analysis of the FOAK industrial gasification plant. The re-
sults of the study reported that the cost of fuel dramatically affects the cost of electricity
(COE), and the economic results can be increased by technical development to reduce op-
erating costs. Kivumbi [30] conducted a techno-economic analysis of a gasification power
plant with a capacity of 425 kW using municipal solid waste as fuel. The results of the
study reported that for small-scale power plants, a high interest rate causes the return on
investment to be longer, so it is not appropriate. In addition, the distance between the
source of raw materials and power plants affects the total cost of transportation to increase
the cost of electricity production. Gokalp [31] conducted a techno-economic analysis of a
gas tire scrap power plant capacity of 5 MWe. The gasification technology used was a
circulating fluidized bed. The results of the study reported that the price of raw materials
dramatically influences the financial result, but if it cannot be reduced, the efficiency of
the gasification system needs to be increased. Based on the results of the published techno-
economic analyses, various variables affect the financial results of a gasification power
plant and are different for each region, the type of raw material used, and the planned
generating capacity. Moreover, most publications only discuss the economic analysis, and
only a few discuss investment, social, and environmental risk analyses simultaneously,
while these are interrelated. The generating capacity analyzed was also medium- to large-
scale, while for the microscale, the literature is still limited.
This research is critical because of the limitations in the literature on technical and
economic analyses; specifically, it was a small-scale 100 kW gasification power plant that
utilized oil palm plantation waste as the primary fuel. In this study, the technical analysis
carried out to calculate the capacity of the gasification system was based on the type of
solid fuel and internal combustion engine. Meanwhile, the economic analysis conducted
was calculated as the net present value (NPV), internal rate of return (IRR), benefit-to-cost
ratio (B/C), and payback period (PBP). The investment risk was also analyzed using the
Monte Carlo method. Furthermore, the final analysis carried out was an analysis of the
social and environmental impacts due to the gasification power plant.
2. Materials and Methods
Multi-stage gasification power plant experiments have been carried out previously
at the pilot scale with a capacity of 10 kW [18,20,32]. To estimate the economic value of a
power plant on a micro-grid scale, in the analysis, the capacity was upscaled to 100 kW.
The aim was to obtain the difference between the non-profit models on the prototype scale
and a profitable model on a commercial scale. The results of the pilot-scale experiment
were used as a reference for modeling the performance of microscale gasification power
plants. The technical aspects discussed in this study are feedstock characterizations using
ultimate and proximate analyses, explanations of experimental activities, and analysis of

Energies 2022, 15, x FOR PEER REVIEW 6 of 23
economic models. Techno-economic analyses were carried out including investment costs
and operating costs. Meanwhile, for the technical analysis, the size of the biomass power
plant was upscaled. Furthermore, an income analysis was carried out based on financial
assumptions. After the technical aspects were defined, the next step was to perform an
economic analysis and socio-environmental analysis. The Monte Carlo method was used
for the risk analysis with Crystal Ball software Version 11.1.2.4® .
2.1. Multi-Stage Downdraft Gasification Power Plant
The experiments of pilot-scale gasification were conducted using a single-throat
downdraft gasifier that was modified from a single-stage to a multi-stage [18]. The ad-
vantage of this multi-stage gasifier is that it produces syngas with a lower tar content and
a higher heating value. The multi-stage gasification technology was developed in the com-
bustion laboratory and an energy system from the Sepuluh Nopember Institute of Tech-
nology. The scheme of the gasification system is shown in Figure 3.
Figure 3. Prototype of a multi-stage downdraft gasifier.
The solid fuel consumption of this reactor was 8 kg/h. Before entering the reactor, the
fuel was placed inside a hopper equipped with a screw conveyor. The amount of fuel
entering was regulated through the screw rotation of the screw conveyor. The air used
was ambient air, and before entering the gasifier, it was preheated until 200 °C. In addition
to obtaining external heating, the air was also internally heated inside the gasifier by plac-
ing an air ring in the form of a pipe that circled the inner wall of the reactor. In the first
stage, the air was injected into the pyrolysis zone using six nozzles. The air in this pyrol-
ysis zone initiated the oxidation reaction between the air and carbon, called oxidative py-
rolysis [20,33–36]. The oxidation reaction released heat so that the pyrolysis properties
changed from endothermal to exothermal. This was advantageous because the released
heat from the partial oxidation zone was reduced. The temperature increased in the py-
rolysis zone cracking the tar components from primary to secondary tar [18].
Furthermore, at the second stage, the air was injected in the partial oxidation, pre-
cisely above the throat. In this position, the air was not distributed using the air ring be-
cause it was heated from the oxidation region. Finally, in the third stage, the air entered
the reduction zone using an air ring divided by six nozzles. Air entering the reduction
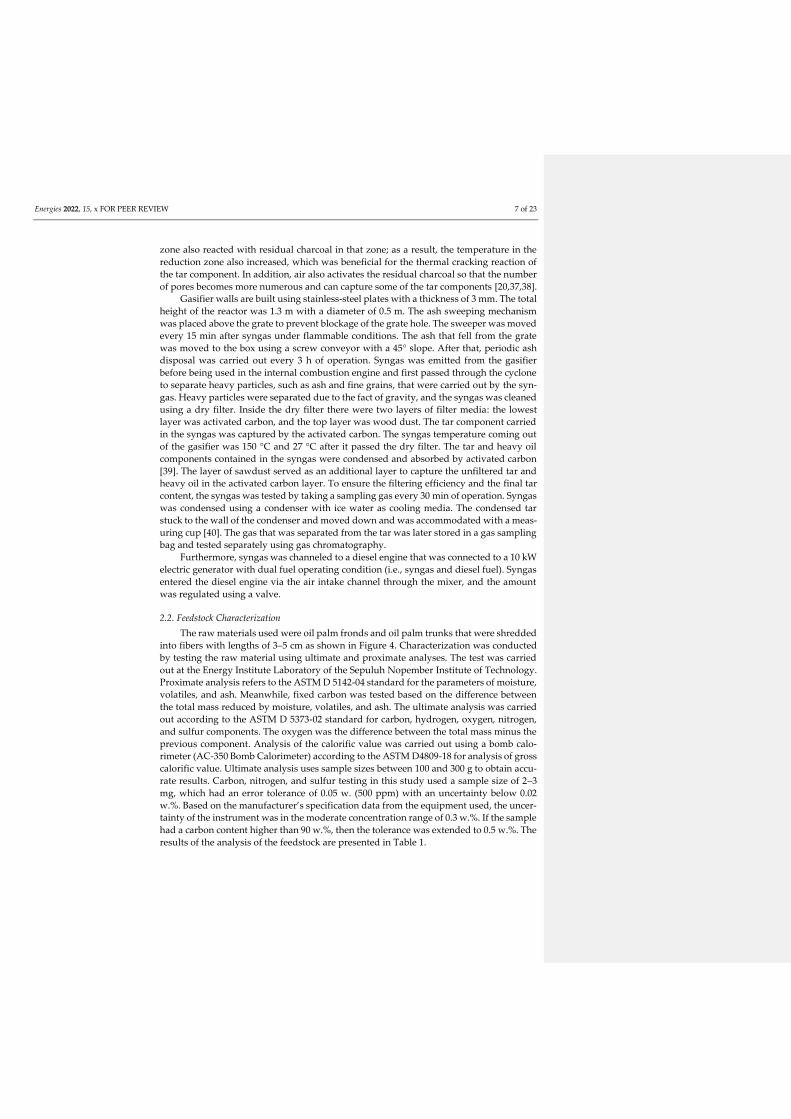
Energies 2022, 15, x FOR PEER REVIEW 7 of 23
zone also reacted with residual charcoal in that zone; as a result, the temperature in the
reduction zone also increased, which was beneficial for the thermal cracking reaction of
the tar component. In addition, air also activates the residual charcoal so that the number
of pores becomes more numerous and can capture some of the tar components [20,37,38].
Gasifier walls are built using stainless-steel plates with a thickness of 3 mm. The total
height of the reactor was 1.3 m with a diameter of 0.5 m. The ash sweeping mechanism
was placed above the grate to prevent blockage of the grate hole. The sweeper was moved
every 15 min after syngas under flammable conditions. The ash that fell from the grate
was moved to the box using a screw conveyor with a 45° slope. After that, periodic ash
disposal was carried out every 3 h of operation. Syngas was emitted from the gasifier
before being used in the internal combustion engine and first passed through the cyclone
to separate heavy particles, such as ash and fine grains, that were carried out by the syn-
gas. Heavy particles were separated due to the fact of gravity, and the syngas was cleaned
using a dry filter. Inside the dry filter there were two layers of filter media: the lowest
layer was activated carbon, and the top layer was wood dust. The tar component carried
in the syngas was captured by the activated carbon. The syngas temperature coming out
of the gasifier was 150 °C and 27 °C after it passed the dry filter. The tar and heavy oil
components contained in the syngas were condensed and absorbed by activated carbon
[39]. The layer of sawdust served as an additional layer to capture the unfiltered tar and
heavy oil in the activated carbon layer. To ensure the filtering efficiency and the final tar
content, the syngas was tested by taking a sampling gas every 30 min of operation. Syngas
was condensed using a condenser with ice water as cooling media. The condensed tar
stuck to the wall of the condenser and moved down and was accommodated with a meas-
uring cup [40]. The gas that was separated from the tar was later stored in a gas sampling
bag and tested separately using gas chromatography.
Furthermore, syngas was channeled to a diesel engine that was connected to a 10 kW
electric generator with dual fuel operating condition (i.e., syngas and diesel fuel). Syngas
entered the diesel engine via the air intake channel through the mixer, and the amount
was regulated using a valve.
2.2. Feedstock Characterization
The raw materials used were oil palm fronds and oil palm trunks that were shredded
into fibers with lengths of 3–5 cm as shown in Figure 4. Characterization was conducted
by testing the raw material using ultimate and proximate analyses. The test was carried
out at the Energy Institute Laboratory of the Sepuluh Nopember Institute of Technology.
Proximate analysis refers to the ASTM D 5142-04 standard for the parameters of moisture,
volatiles, and ash. Meanwhile, fixed carbon was tested based on the difference between
the total mass reduced by moisture, volatiles, and ash. The ultimate analysis was carried
out according to the ASTM D 5373-02 standard for carbon, hydrogen, oxygen, nitrogen,
and sulfur components. The oxygen was the difference between the total mass minus the
previous component. Analysis of the calorific value was carried out using a bomb calo-
rimeter (AC-350 Bomb Calorimeter) according to the ASTM D4809-18 for analysis of gross
calorific value. Ultimate analysis uses sample sizes between 100 and 300 g to obtain accu-
rate results. Carbon, nitrogen, and sulfur testing in this study used a sample size of 2–3
mg, which had an error tolerance of 0.05 w. (500 ppm) with an uncertainty below 0.02
w.%. Based on the manufacturer’s specification data from the equipment used, the uncer-
tainty of the instrument was in the moderate concentration range of 0.3 w.%. If the sample
had a carbon content higher than 90 w.%, then the tolerance was extended to 0.5 w.%. The
results of the analysis of the feedstock are presented in Table 1.

Energies 2022, 15, x FOR PEER REVIEW 8 of 23
Figure 4. Results of the shredded midrib and oil palm stems.
Table 1. Ultimate and proximate analyses of solid fuel.
Analysis Contents (% Mass) Oil Palm Frond Oil Palm Trunk
Proximate
Volatile 85.1 86.7
Moisture 70.6 75.6
Ash 3.37 3.35
Calorific Value (MJ/kg) 17.48 17.41
Ultimate
Carbon 48.43 51.41
Hydrogen 10.46 11.82
Oxygen 46.75 51.16
Nitrogen 12.40 0.17
2.3. Experimental Activity
Gasification experiments were carried out using a multi-stage downdraft gasifier.
The used equivalent ratio (ER) was the optimum ratio from previous studies [20,31] which
was 0.4 while the air ratio (AR) for the pyrolysis zone, partial oxidation, and reduction
were selected at the optimum ratio of 10%, 80%, and 10%. The AR percentage shows the
amount of air entering for each zone, meaning that from the total air based on ER 0.4
divided into three locations, 10% into the pyrolysis zone, 80% into partial oxidation, and
10% into the reduction zone. Syngas was cleaned using a cyclone and dry filter to further
flow into a diesel engine. The experimental data generated from the gasification experi-
ment are shown in Table 2.
Table 2. Prototype of the gasification power plant specification of a 10 kW capacity.
Parameter Value
Equivalent ratio 0.4
Air ratio (pyrolysis, oxidation, and reduction zone) 10%, 80%, 10%
Feedstock flow rate 8 kg/h
Air inlet temperature 200 °C
Syngas temperature after cleaning 80 °C
Syngas flow rate 0.0028 m3/s
Syngas heating value (LHV) 6.642 MJ/Nm3
Syngas Composition Volumetric Percentage
CO 18%
H2 25%
CH4 4%

Energies 2022, 15, x FOR PEER REVIEW 9 of 23
2.4. Economic Model
The economic analysis in this study was carried out using a 10 kW capacity gasifica-
tion experimental data reference that was upscaled to 100 kW. Some operating conditions
were equated according to the experimental reference data, and the resulting data were
used as input data for the economic analysis. A techno-economic analysis was carried out
for every year of the estimated service life of the gasification system of 20 years. The ref-
erence cost component started from the capital cost to the estimated revenue for each year.
3. Result
3.1. Techno-Economic Analysis
In this study, the analysis was conducted for the utilization of oil palm plantation
waste converted into electrical energy using gasification technology in Indonesia. The
analysis was conducted close to the actual condition, and the analysis was carried out
based on a literature study that was conducted for potential bioenergy investment, espe-
cially biomass in Indonesia.
The oil palm plantation waste was grouped into two types, namely, waste from plan-
tations in the form of oil palm fronds and trunks and waste from the processing of oil
palm into crude oil palm such as fiber, shells, empty fruit bunches, and liquid waste or oil
palm mill effluent (POME) [8]. From all types of plantation waste, the most significant
potential was oil palm fronds with a total production of 49.41 million tons/year which
were derived from the Sumatra region; 23.50 million tons/year in Kalimantan; 218 thou-
sand tons/year in Java, Bali, and Madura; 2.17 million tons/year in Sulawesi; and 202.64
thousand tons/year in Papua. The total energy that can be generated from all the potential
reaches 5495 Mwe [6]. Palm fronds were chosen because they are always available on
plantations and do not require a significant supply cost compared to other wastes. The
waste from palm processing was owned by the company, so that if the community or
other parties needed it, they must buy it first, while oil palm fronds can be taken for free
and only require costs for transportation, chopping, and drying. Besides the oil palm
fronds, oil palm trunk is also used as additional raw materials. However, due to the fact
that it is only available during the replanting process, the amount was less if it was divided
within one year. The total potential energy from oil palm trunk reaches 815 MW [6].
The first step for the raw material for oil palm fronds before use was to strip the
leaves, then transport them to the power plant storage facility. The next step was to shred
and dry them under the sun and then finally store them in a warehouse. The oil palm
fronds were used as the primary fuel, and the oil palm trunks were use as the secondary
fuel. When both were available, they were mixed with a percentage of 70% fronds and
30% trunk. The power plant was ideally placed close to the location of the plantation so
that the cost of the transportation of the raw materials could be reduced [23]. Based on the
planned installed capacity, 1189 tons/day of raw materials were needed. Thus, at least 100
hectares of oil palm plantation were required. When compared with the areas of lands in
Sumatra, Kalimantan, Sulawesi, and Papua, this plant can be placed anywhere because
the existing land area was greater than the required minimum land area [41]. The maxi-
mum moisture content of the solid fuel was 40%.
Actually, the oil palm fronds are not purely waste. So far, they have been left piling
up beside the palm trees until they rot and become soil fertility. However, to reach this
stage requires a long time. Thus, to maintain balance, not all the fronds produced were
used entirely. As much as 70% of the waste was utilized, and the remaining 30% was left
as soil fertilizers. Although the availability of the land area was quite extensive, most of
the landowners were companies, while a limited amount was owned by the community.
Cooperation between the power plant manager and the company was needed to ensure
the availability of raw materials and the sustainability of the power plant in the future.
The biomass power plant with gasification technology was expected to operate for 20

Energies 2022, 15, x FOR PEER REVIEW 10 of 23
years with a construction period of one year. The plant works 355 days a year and has a
ten-day shutdown schedule for maintenance.
Following its capacity, the number of employees needed to operate the power plant
was estimated at six people, consisting of one manager, two operators, two technicians,
and one administrator. Economic analysis was conducted by predicting the cost compo-
nents associated with power plant construction, starting from the planning stage to the
implementation stage.
3.1.1. Investment Cost
The investment costs were calculated based on an investment analysis for power
plants of the same scale used as a reference in this study. The power plant with a capacity
of 10 kW was built in 2017. All costs were converted from IDR to USD. The exchange rate
in 2019 for USD 1 was IDR 14,012.73, while the IDR to USD currency exchange rate in the
year the reference power plant project was IDR 13,693. The breakdown of capital costs
refers to the IRENA [42] and are presented in Table 3.
Table 3. Investment costs (USD).
Investment Item Cost
Civil work 664.31
Building 763.96
Foundation and supporting material 4417.68
Piping system 2524.39
Electric component 2989.40
Instrumentation 1660.78
Insulation and painting 664.31
Total Construction Cost 13,684.83
Gasifier with cleaning and cooling system 30,000.00
Diesel engine (100 kVA) 12,458.25
Total Investment Cost 56,143.08
3.1.2. Operating Cost
The operating cost component was the costs incurred each year for power plants,
which consisted of raw material costs (consisting of costs for providing raw materials and
transportation), operating and maintenance costs (O&M), tax burden, and annual depre-
ciation costs. Operating and maintenance costs included the costs of providing electricity,
clean water, ash disposal, engine component replacement, and the gasifier component.
This also included costs for labor, consisting of basic salaries, benefits, and health insur-
ance. Office operational costs consisted of administrative costs, office stationery, official
travel, and transportation costs. Electricity needs for plant operations were calculated
based on the number of operating hours for one year. Details of the cost of electricity needs
for the plant are presented in Table 4.
Table 4. Yearly production costs (USD).
Item Cost
Operation and maintenance of the gasifier 2245.72
Operation and maintenance of the gasifier variable cost 139.86
Depreciation cost 2930.39
Total Yearly Production Cost 5315.97
The cost component of the solid fuel is the cost of collecting, cutting, and transporta-
tion from the source of the solid fuel to the location of the power plant. Oil palm fronds

Energies 2022, 15, x FOR PEER REVIEW 11 of 23
are not purchased but rather harvested from trees, collected, and transported. The cost
component was harvesting, transportation, and labor costs, while for oil palm trunk, the
costs incurred were logging costs. Costs incurred to produce electricity were calculated
based on the standard O&M cost for diesel engines from IRENA 2018 of $0.008/kWh [42].
The O&M cost component for diesel engines was obtained by multiplying yearly electric
production by the standard O&M cost from IRENA. Fuel costs consisted of biomass and
diesel because they were operated in dual fuel. The percentage of syngas substitution
against diesel was a maximum of 60%. Details of the electricity production costs are pre-
sented in Table 5.
Table 5. Electric production cost (USD).
Item Cost
O&M cost of diesel engine (electric production) 2401.75
Yearly production cost 5315.97
Depreciation cost (20 year operation) 265.80
Biomass fuel cost 6574.44
Diesel fuel cost 10,313.23
Total Electric Production Cost 24,871.19
3.2. Gasifier Upscaling
The capacity of the power plant that was analyzed economically was 100 kW. Based
on the technical aspects, the diesel engine and gasifier were upgraded. The selected diesel
engine was Cummins 6BT5,962, which was coupled with a 100 kVA generator. The tech-
nical specifications can be seen in Table 6.
Table 6. Diesel engine specifications [43].
Engine Cummins 6BT5.9G2
Generator Stamford UCI274C
KVA 100
KW 80
Number of cylinders 6
Bore x stroke 102 × 120 mm
Piston disp. 5900 L
Fuel consumption 17 L/h (75% load) and 22 L/h (100% Load)
Oil capacity 16.4 L
Dimension 2910 × 1110 × 1450 mm
Based on the engine specifications, the output capacity was calculated using the
method by Kivumbi [30] with the results shown in Table 7.
Table 7. Diesel engine parameters.
Parameter Value Unit
Maximum air producer gas 0.0738 m3
Maximum real producer gas intake 0.0351 m3/s
Real producer gas intake 0.0281 m3/s
The normal volume rate of the producer gas 0.0287 m3/s
Thermal power 190.4284 kW
Maximum mechanical output 82.0746 kW
Maximum electrical output 34.9638 kW
Commented [M1]: Should it be 6BT5.9G2
Commented [M2]: Please confirm if you have got
the copyright to use the table.

Energies 2022, 15, x FOR PEER REVIEW 12 of 23
Furthermore, after the capacity of the diesel engine was known, the specifications of
the gasifier could be calculated using the method used by Kivumbi [23] with the results
presented in Table 8.
Table 8. Gasifier sizing parameters.
Parameter Value Unit
Thermal power consumption (full load) 272.0406 kW
High heating value 24,132.7205 kJ/kg
Low heating value 19,766.0645 kJ/kg
Biomass consumption 0.0138 kg/s
Specific fuel consumption 1.4171 kg/kWh
Gas production from the gasifier 0.1106 m3/s
Cross-sectional area 0.0442 m2
The diameter of the air inlet 0.2374 m
Height from nozzle plane 0.1139 m
Diameter of firebox 0.4985 m
Nozzle diameter 0.0094 m
Specific gasification rate 1120.0607 kg/h·m2
Height of gasifier 3.5002 m
Gasifier diameter 0.2374 m
Based on the parameters of the diesel engine and gasifier that were calculated, the
electrical energy output capacity was calculated, and the results obtained are presented in
Table 9. The number of operating days for one year was assumed to be 355 days, with
42.6% electricity production efficiency. Total electricity production per day was 839.13
kWh/day, so that the total electricity production for one year is 297,891.57 kWh/year.
Table 9. Electric production parameters.
Parameter Value Unit
Electric output 34.96 kW
Electrical efficiency 42.60 %
Frequency 50 Hz
Number of gas engine 1 Unit
Daily electric production 839.13 kWh/day
Day operation in one year 355 Day
Yearly electric production 297,891.57 kWh/year
3.3. Revenues
Revenue was obtained by multiplying the total electricity production for one year
with the price of electricity following the state power plant standard for renewable energy,
which was $0.121/kWh. Electricity consumption costs for the plant reduced gross revenue.
Detailed calculations for the power plant are presented in Table 10.
Table 10. Revenue list.
Revenue Item Revenue Unit
Electric price 0.121 USD/Kwh
Estimated revenue 36,004.56 USD/year
Plant usage in electricity 686.511 USD/year
Net revenue 35,318.05 USD/year

Energies 2022, 15, x FOR PEER REVIEW 13 of 23
3.4. Financial Assumption
The financial assumptions used in this study included the operating life of the plant
and the interest rate presented in Table 11. Each year, it was estimated that all costs and
selling prices would experience inflation of 2% [26]. The net present value was calculated
using an interest rate of 8%.
Table 11. Financial assumption.
Assumption Item Value Unit
Power plant lifetime 20 year
Interest rate 8 %
Inflation rate 2 %
3.5. Economic Feasibility Analysis
An economic feasibility study was carried out to decide whether the investment in
the power plant that is to be carried out was profitable and feasible for investment. The
conducted economic analysis was the NPV, PBP, and the IRR [44]. The NPV calculation
was conducted by calculating the present value of cash flows for a certain period. The
calculated cash flow was the difference between the benefits and costs for each year the
NPV was determined. The equation to calculate the NPV is shown below [23]:
NPV = ∑ Cy x ((1 + i)y − 1)
i x (1 + i)y− Cy=0 x (1 + i)y
N
y=0
where i is the interest rate, N is the number of periods (years), Cy are number of cash
inflows in year y, and Cy = 0 is the total investment of the first year plus cash outflows.
Interest rates were used to calculate the discount factor and present values for costs and
benefits. The operating period was assumed to be 20 years [25] with an interest rate of 8%.
After calculating, if the NPV was positive, the investment was profitable and vice versa.
Thus, if t was profitable, capital costs could be returned during the operating period.
The internal rate of return was analyzed based on the accumulation of NPV values.
IRR is the present value of costs and benefits. Investment can be made if the IRR value is
higher than the interest rate and vice versa. The equation used to calculate IRR was as
follows [23]:
IRR = cash flows
(1 + i)y− initial investment cost
The initial investment cost is the total investment cost in the first year, i is the interest
rate, and y is the current year. The payback period was analyzed to determine the cost for
each year so that the initial investment costs could be returned. The equation used to cal-
culate the payback period is as follows [23]:
PBP = total investment cost
yearly cash flow
Risk analysis on the choice of inputs was used to generate electricity per kWh using
a standard deviation approach. The approach tries to categorize the different input types
of fuel from oil palm waste for mechanization of energy generation. The equation used
for calculating the standard deviation was as follows:
S = √1
N − 1∑ xi − x̅

Energies 2022, 15, x FOR PEER REVIEW 14 of 23
3.6. Techno-Economic Analysis
The economic analysis was carried out on a power plant that was scaled up from 10
kW to 100 kW. A sensitivity analysis was carried out by looking at the effect of the per-
centage increase in construction costs, the price of biomass fuel, and the price of diesel
fuel on the economic value of the project. The sensitivity analysis of the investment costs
to produce each kWh of electricity was also varied to determine the investment costs that
could produce an internal rate of return higher than the interest rate. In addition, a risk
analysis was also carried out to see the effect of investment costs and operating costs on
NPV [25].
3.6.1. Economic and Sensitivity Analysis
Based on the results of economic analysis, power plant investment can reach a break
event point in the 6th year as shown in Figure 5. With an interest rate base of 8%, the net
present value was positive after accumulating for 20 years of operation at USD 48,846 as
shown in Table 12, which means this power plant project provides benefits. The ratio be-
tween cost and benefit was greater than 1, at 1.16. Meanwhile, the internal rate of return
was also above the interest rate of 9.72%, so the investment was still profitable. The cost
of electricity was still below the selling price from the state power plant of USD 0.083/kWh,
where the selling price from the government was USD 0.121/kWh, so there was a differ-
ence of USD 0.037/Kwh as profit.
The sensitivity analysis was performed using the Crystal Ball software Version
11.1.2.4® with 100,000 trials. The feature used was the decision table tool [45,46]. With this
feature, we could simulate several different values or two decision variables. Interest rates
varied from 7% to 12%. The results of this analysis are presented in Table 12. The NPV
continued to decrease along with the increase in the interest rate, but the value remained
positive. The same trend also occurred in the IRR and B/C ratio. Even though the NPV
was always positive, and the B/C ratio was above 1, the results showed that when the
interest rate was at 10–12%, the IRR was already below the interest rate. Thus, investment
had a percentage return that was greater than the interest rate if the interest rate was lower
or equal to 9%. However, the value of the interest rate was a fluctuating value depending
on the economic conditions of the Indonesian state.
Table 12. NPV, IRR, and B/C ratio forecast with interest rate variation.
Interest Rate 7% 8% 9% 10% 11% 12%
NPV (USD) 57,096 48,846 41,514 34,975 29,124 23,873
IRR (%) 10.75 9.72 8.71 7.73 6.76 5.80
B/C ratio 1.18 1.16 1.15 1.13 1.12 1.10
LCOE ($0.083/kWh)

Energies 2022, 15, x FOR PEER REVIEW 15 of 23
Figure 5. Return on investment based on the operating life of the power plant.
Investment costs were also varied to determine the range of investment costs that still
provided benefits. The range of investment costs, according to IRENA was from USD 950
to 1650/kW [42]. If one looks at the comparison of the investment costs in Table 13, in the
range from USD 950 to 1100/kW, it was still profitable because the IRR was above the
interest rate. Meanwhile, above USD 1100/kW, it was no longer profitable because the IRR
was under the base interest rate. In this study, the investment cost, which was the base
case, was USD 950/kWh.
Table 13. NPV, B/C ratio, and IRR with investment cost variation.
Investment Cost
(USD/kWh) 950 1100 1250 1400 1550 1650
NPV (USD) 48,846 44,681 40,515 36,350 32,184 29,407
B/C ratio 1.16 1.15 1.13 1.12 1.10 1.09
IRR (%) 9.72 8.64 7.62 6.67 5.76 5.18
The solid fuel that used for gasification was oil palm frond and oil palm trunk. When
compared for the two fuels, as shown in Table 14, oil palm trunk resulted in a higher NPV
and IRR, which means that it was profitable to use oil palm trunk as fuel. The cost for oil
palm trunk was $0.025/kg, while oil palm frond was $0.026/kg. The difference was because
the oil palm frond requires additional harvesting costs for each period while the palm
trunk does not. However, the use of oil palm frond and oil palm trunk is still profitable.
The difference is only in the profit margin. However, the price for diesel fuel was a maxi-
mum at $0.47/L or the price of subsidies from the government, so that IRR was above 8%.
Table 14. IRR with Variation of Diesel Fuel and Solid Fuel Price.
Diesel Fuel Price (USD/L) (0.40) (0.47) (0.55) (0.62) (0.69)
Oil palm trunk (USD/kg) 0.025 12.77 9.95 7.04 4.00 0.74
Oil palm Frond (USD/kg) 0.026 12.55 9.72 6.80 3.75 0.47
The effect of diesel fuel price and the interest rate on IRR was also analyzed, and the
results are presented in Table 15. The diesel fuel price used as the base case was the price
of a subsidy. If there was an increase in the price of subsidies, the investment remains
profitable, as long as the maximum price of diesel fuel is $0.47/L, with a maximum interest
-9
-4
1
6
11
16
21
1 2 3 4 5 6 7 8 9 10 11 12 13 14 15 16 17 18 19 20 21
Cas
hfl
ow
(K
US
D)
Plant Life time (year)

Energies 2022, 15, x FOR PEER REVIEW 16 of 23
rate of 9%. This power plant was calculated to implement small villages with low to me-
dium economic levels, and electricity was not used for extensive commercial activities.
Thus, it was possible to use diesel fuel at a subsidized price as long as the price was no
more than the maximum price above. If the price and interest rate were to exceed, the IRR
value was under the base case of interest rate. The existence of subsidies from the govern-
ment is very influential on the benefits to be obtained from a power plant project. In ad-
dition, the subsidy policy can also attract investors to make investments [8,42,44].
Table 15. IRR with variations in the diesel fuel price and interest rate.
Diesel Fuel Price (USD/L) 0.40 0.47 0.55 0.62 0.69
Interest rate
7% 13.60 10.75 7.80 4.72 1.41
8% 12.55 9.72 6.80 3.75 0.47
9% 11.52 8.71 5.82 2.80 (0.45)
10% 10.50 7.73 4.86 1.86 (1.36)
11% 9.51 6.76 3.92 0.94 (2.25)
12% 8.53 5.80 2.99 0.04 (3.12)
The effect of feed-in tariffs on the NPV, B/C Ratio, and IRR was analyzed, and the
results are presented in Table 16. The simulation results of the feed-in tariff was below the
base case of USD 0.12/kWh, the IRR was under the base case of interest rate. Thus, if there
was a decrease in feed-in tariffs from the government under the base case, investment in
power plants does not provide optimal benefits. Based on the pattern of increasing feed
tariffs in Indonesia to date, it always increases over a specified period. Thus, the feed-in
tariff can be assumed not to reduce return of investment period because the value contin-
ues to increase. However, decreases were still possible depending on changes in subsidies
and political decisions.
Table 16. NPV, B/C Ratio, and IRR with variations of the feed in tariff.
Feed in Tariff
(USD/kWh) 0.102 1.110 0.117 0.124 0.131
NPV (USD) (4581) 16,371 37,323 58,275 79,227
B/C Ratio 0.98 1.05 1.13 1.20 1.27
IRR (%) (1.04) 3.48 7.57 11.44 15.18
3.6.2. Financial Risk Analysis
Financial risk assessment was carried out to evaluate the effect of economic parame-
ters on investment risk. The risk analysis of the power plant project was carried out using
Crystal Ball software® . This software was chosen because of the ease of operation, and it
is compatible with MS Excel® [45]. Another advantage, was that various types of data dis-
tribution can be chosen according to needs. The simulation was conducted with 1,000,000
iterations. The Monte Carlo method was used for the risk analysis as it calculates with the
technique of statistical sampling, operates with random input components, and has un-
certainty [25]. The input variable was simulated with several iterations and produced sev-
eral data in the form of probabilities. The normal probability distribution was used. The
selection of a probability distribution model in the Monte Carlo analysis was essential
because it affects the accuracy of the simulation results [44,47,48]. In addition, the number
of iterations must also be adjusted to obtain convergence. With a greater number of itera-
tions, the mean and standard deviation will be evenly distributed.
The risk analysis was carried out to look at the effect of capital cost, O & M cost, and
revenue on NPV, IRR, and the B/C Ratio. They were assumed with a probability of 90%
using a normal distribution and a standard deviation of 1% from the base case. Figures 6–
8 show the forecast capital cost, O&M cost, and revenue. The results of the risk analysis

Energies 2022, 15, x FOR PEER REVIEW 17 of 23
are shown with a 90% confidence level and a 10% failure rate [25] that over the past 20
years, the NPV range obtained was from USD 41,833 to 55,861. NPV was estimated to
have an increase of 49.94% from the base case during the operating period of the plant,
which means the power plant project can provide benefits to investors.
Meanwhile, the IRR with a 90% probability obtained between 8.40% and 11.04%,
which means it was still higher than the interest rate. The percentage of IRR higher than
the base case was 50.02%, and the percentage of IRR higher than the interest rate was
98.42%. B/C ratio forecast with 90% probability was obtained from 1.14% to 1.19% and
had a percentage greater than the base case of 60.28%. Based on the results of the risk
analysis, the probability of investment risk was relatively small because the NPV was al-
ways positive, and the IRR had the higher base case interest rate. Besides, with a 50%
chance of NPV above the base case, results were very promising for investors because the
estimated profits obtained during the operating life of the power plant were higher.
Figure 6. Effect of capital costs, O&M costs, and revenue on IRR.
Figure 7. Effect of capital costs, O&M cost, and revenue on the B/C ratio.

Energies 2022, 15, x FOR PEER REVIEW 18 of 23
Figure 8. Effect of capital costs, O&M cost, and revenue on net present value.
Based on the risk analysis of components that affect NPV, 68% of the most significant
influence was investment cost, while capital cost and revenue were the remainders. Thus,
if the investor can control and reduce investment costs, then it was possible to obtain
higher profits. The investment component that was possible to be reduced was the capital
cost of the gasification system. The investment cost was 74.4%, as shown in Figure 9. The
gasification system used was foreign-made or made with imported products. Considering
the pilot-scale development experience that has been done, it was possible to produce
gasification systems independently so that investment costs can be reduced.
Figure 9. Sensitivity analysis of the investment cost components.
Furthermore, to determine the type of fuel that was able to produce the largest kWh
with low risk, standard deviation analysis was used. The analysis can provide information

Energies 2022, 15, x FOR PEER REVIEW 19 of 23
in the form of the types of raw materials used to produce electricity with the smallest
deviation. The mechanism for calculating investment risk from the standard deviation
was carried out by comparing the three fuels used to produce electrical energy, namely,
palm fronds, empty fruit bunch, and oil palm trunks.
Table 17 shows a comparison of the three types of fuel used to generate electricity.
Fuel derived from oil palm waste was categorized based on the type of waste tested
through mechanization so that it was able to generate electricity from renewable energy
fuel. The results of the analysis show that the type of fuel from the palm fronds had the
lowest standard deviation value and the rupiah value of the frond waste was cheaper than
other types of oil palm waste. The results of these calculations show that the smallest risk
for producing electricity comes from EBT fuel, which comes from the type of palm frond
waste at a price of 0.0259 USD/Kg and was able to generate electricity worth 0.0259
USD/kWh.
Table 17. Standard deviation analysis.
No Production Cost Oil Palm
Frond
Empty Fruit
Bunch
Oil Palm
Trunk
1 Biomass feedstock (USD/kg) 0.0259 0.0275 0.0254
2 Biodiesel (USD/L) 0.3107 0.3107 0.3107
3 System utility (USD/kWh) 0.0558 0.0558 0.0558
4 Staff and operator salary (USD/kWh) 0.0456 0.0456 0.0456
5 Maintenance (USD/kWh) 0.0003 0.0003 0.0003
6 Yearly capital cost (USD/kWh) 0.0099 0.0099 0.0099
7 Total 0.4483 0.4498 0.4478
8 Electric production (KW/day) 839 865 784
9 Feedstock consumption (kg/h) 49.55 51.06 46.33
10 Standard deviation (SD) 2.758 2.773 2.763
11 Electric price (Rp/kWh) 0.0259 0.0275 0.0254
3.7. Socio-Environment Impact Analysis
Inside the Industrial Revolutions 4.0 era, access to electricity is one of the primary
needs of everyday life both in urban and rural areas. The implementation of power plants,
especially in rural areas, has the aim of improving the socio-economic life of the commu-
nity. Social influence is expected to be felt in the long term, such as the ability to read,
study, and obtain information, and the addition of skills so that it can open opportunities
for people to be more creative and innovative in developing their ability to face the vicious
cycle of poverty.
Positive influences from an economic perspective can increase people’s income and
create many new businesses. Socio-cultural changes are marked by changes in lifestyle
that are widely adopted from television shows, including in terms of daily lifestyle. Other
changes include an increase in school performance and better health and awareness in
protecting the environment and safety. The negative influence that must be watched is
the fading of local cultural values, such as cooperation, and consumer culture, seen from
the adoption of television shows and other media.
Before the gasification power plant was implemented, the majority of the village
community’s work was as farmers and farm laborers, whereas after the power plant,
many residents left their jobs in the agricultural sector. They turned to the productive
sector that uses electricity as an energy source to produce products. The economy, which
had previously relied on agriculture, then relied on services and industry. The presence
of power plants was proven to recruit labor so that unemployment was reduced. One
factor was the new employment opportunities presented for residents. The employment

Energies 2022, 15, x FOR PEER REVIEW 20 of 23
opportunities included food and beverage, document services, boarding, and rented
houses, lodging, and other service sectors.
The community around the power plant area was directed to obtain additional in-
come apart from agricultural products. The electricity provided by gasification power
plants has a positive impact on the community’s economy. The community has new busi-
ness opportunities including in the fisheries and trade sectors. If this gasification power
plant was built in a coastal area that has biomass potential, the community was also facil-
itated by making boreholes so that sufficient water was available, and the establishment
of a fish auction place.
Viewed from an environmental aspect, the implementation of power plants will have
an impact on the environment, starting from the construction process to the operation.
Impacts that occur are possibly both temporary and permanent. The construction of
power plants involves the use of land or space inside or on the surface of the land, the use
of water resources, and the most influential environment was the presence of pollution to
the air and water. The indicators and parameters of the environmental quality index can
be seen in Table 18.
Table 18. Indicators and Parameters of the Environmental Quality Index in 2019 [49].
No. Indicators Parameters Weight
1. River water
quality
TSS
30%
DO
BOD
COD
Total Phosphate
Fecal Coliform
Total Coliform
2. Air quality SO2
30% NO2
3. Quality of
land
cover area of forest cover, shrubs and swamp shrubs lo-
cates in forest areas and protected function areas (river
borders, lakes and beaches, slopes > 25%) green open
spaces, botanical gardens and biodiversity parks
40%
The construction of a power plant that utilizes green land will disrupt vegetation and
also affect the wildlife that exists in the environment. Flue gas produced from the com-
bustion of diesel engines will cause an increase in air temperature around the power plant,
in addition to the combustion product in the form of CO2 , which causes pollution or con-
tributes to the emission of greenhouse gases. Water used as a syngas cooler before it is
used on a diesel engine will reduce the water supply around the plant, both for surface
and underground water. After the water is used, it becomes wastewater and needs to be
disposed of in the environment. With wastewater disposal, the temperature of the waste
will be higher than the average temperature, and the most dangerous impact is the pollu-
tants contained in the water, which can cause environmental damage. Therefore, before
wastewater is discharged, it is necessary to treat it first. In addition to liquid waste, solid
waste in the form of ash from gasification is also produced from power plants. The han-
dling of solid waste must be managed so that it does not have a negative impact. Further-
more, the level of noise and vibration around the project site will increase; during plant
operations this condition also continues to occur.
4. Conclusions
The Prototype of Gasification with multi-stage downdraft gasifier technology with a
capacity of 10 kW has been developed on a laboratory scale. Furthermore, the result was
Commented [M3]: Please confirm if you have got
the copyright to use the table.

Energies 2022, 15, x FOR PEER REVIEW 21 of 23
technically and economically feasible as a commercial alternative power plant on a small
scale of 100 kW. The economic analysis indicated that the power plant will have an NPV
of USD 48,846 with an IRR of 9.72%. The payback period was achieved at six years for the
required investment costs of USD 56,143. The availability of fuel i.e., oil palm plantation
waste in the form of oil palm frond and oil palm trunk was sufficient throughout the year
so that it can continue to be used as long as the price was no more than USD 0.026/kg, as
well as diesel fuel with a maximum price of USD 0.47/L. All investment costs can be re-
turned following the payback period if the plant can operate at least 355 days/year. Risk
analysis was also carried out by considering the uncertainty of economic conditions that
can affect changes in capital cost, operation and maintenance costs, and increases or de-
creases in revenue. The result, with a probability of 90%, NPV obtained USD 41.833–5.861
with a percentage of 49.94% above the base case was achieved. Meanwhile, IRR was ob-
tained between 8.40% and 11.04%.
In terms of social aspects, the existence of power plant in rural areas was considered
to increase people’s income and create many new businesses. The existence of a power
plant employs the surrounding community. The continuous supply of electrical energy
opens up business opportunities, both micro and medium, that utilize electrical energy as
the primary energy sources. However, adverse environmental impacts must not be ig-
nored from the construction stage to the operation of the power plant. The construction
of power plants must refer to rules that have been issued by the government in order to
maintain an environmental balance.
Author Contributions: Conceptualization, A.R.S. and J.A.P.; methodology, J.I.; software, A.R.S.;
validation, J.I., B.S. and J.A.P.; data curation, E.N.J.; writing—original draft preparation, A.R.S.; writ-
ing—review and editing, J.A.P.; visualization, A.R.S.; supervision, B.S.; funding acquisition, J.I. All
authors have read and agreed to the published version of the manuscript.
Funding: This research received no external funding.
Institutional Review Board Statement: Not applicable
Informed Consent Statement: Not applicable
Data Availability Statement: The data used in this paper were provided by the experimental data
from The Combustion and Energy System Laboratory, Institut Teknologi Sepuluh Nopember
Conflicts of Interest: The authors declare no conflict of interest.
Abbreviations
ASTM American Society for Testing and Material
B/C Benefit to Cost Ratio
ER Equivalent Ratio
AR Air Ratio
IDR Indonesian Rupiah
IRR Internal Rate of Return
IRENA International Renewable Energy Agency
LHV Low Heating Value
LCOE Leverage Cost of Electricity
NPV Net Present Value
POME Palm Oil Milk Effluent
O&M Operation and Maintenance
PBP Payback Period
Nomenclature
N Number of period (year)
y Year
Cy Cash inflow in year (USD)

Energies 2022, 15, x FOR PEER REVIEW 22 of 23
i Interest rate (%)
S Standard Deviation
Reference
1. Kementrian Energi dan Sumber Daya Mineral (ESDM). Rasio Elektrifikasi Indonesia Status Juni-2017. 2017. Available online:
https://www.esdm.go.id/assets/media/content/content-rasio-elektrifikasi-indonesia-status-juni-2017.pdf (accessed on 7 Decem-
ber 2021). 2. Kamperidou, V.; Terzopoulou, P. Anaerobic digestion of lignocellulosic waste materials. Sustainability (Switz.) 2021, 13, 12810.
https://doi.org/10.3390/su132212810.
3. Public Relation Minister of Energy and Mineral Resources. Strategic Policy for the Utilization of EBT, Based on Productivity
and Innovation. December 2019. Available online: https://ebtke.esdm.go.id/post/2019/12/18/2432/kebijakan.strategis.pemanfaa-
tan.ebt.berbasis.produktivitas.dan.inovasi (accessed on 13 January 2022).
4. Wicaksono, P.E. Pembangkit Listrik Bertenaga Limbah Sawit Ada di Desa Ini. 2014. Available online: http://bisnis.lipu-
tan6.com/read/2105888/pembangkit-listrik-bertenaga-limbah-sawit-ada-di-desa-ini (accessed on 10 December 2021).
5. Rachmad, S. Pemerintah Tetapkan Harga Baru Listrik Biomassa dan Biogas. 2014. Available online: http://indus-
tri.bisnis.com/read/20141022/44/266967/pemerintah-tetapkan-harga-baru-listrik-biomassa-dan-biogas (accessed on 7 December
2021).
6. Direktorat, J.; Energi, E. B. T. dan Konservasi, E. Kementerian, and S. D. Energi, Mineral, Investment Guidelines Bioenergy In Indonesia. 2016.
Accessed: Dec. 28, 2021. [Online]. Available: https://drive.esdm.go.id/wl/?id=6JLd3yXfSsPqRp2xExLrQe3TUzdIahpS&mode=list&download=1
7. Wijono, A. Environmental Mapping and Assessment the Potential of Palm Oil as a Renewable Energy Source in Indonesia. In
National Symposium RAPI XII-2013 FT UMS; 2013; pp. 1–67.
8. Shuit, S.H.; Tan, K.T.; Lee, K.T.; Kamaruddin, A.H. Oil palm biomass as a sustainable energy source: A Malaysian case study. Energy 2009, 34, 1225–1235. https://doi.org/10.1016/j.energy.2009.05.008.
9. Mekbib, S.; Anwar, S.; Yusup, S. Syngas production from downdraft gasi fi cation of oil palm fronds. Energy 2013, 61, 491–501.
https://doi.org/10.1016/j.energy.2013.09.039.
10. Nudri, N.A.; Bachmann, R.T.; Ghani, W.A.W.A.K.; Sum, D.N.K.; Azni, A.A. Characterization of oil palm trunk biocoal and its
suitability for solid fuel applications. Biomass Convers. Biorefinery 2020, 10, 45–55. https://doi.org/10.1007/s13399-019-00419-z.
11. Douglas, S.; Anne, C.; Erik, M.; Meine, v.N.; Joanne, G.; Jacqui, Su.; Karah, W.; Markku, K. The Impacts and Opportunities of Oil
Palm in Southeast Asia: What Do We Know and What Do We Need to Know?; Center for International Forestry Research 2009.
https://doi.org/10.17528/cifor/002792. 12. Arena, U. Process and technological aspects of municipal solid waste gasification. A review. Waste Manag. 2012, 32, 625–639.
https://doi.org/10.1016/j.wasman.2011.09.025. 13. Basu, P. Biomass Gasification and Pyrolysis Handbook; Academic Press 2010. https://doi.org/10.1016/B978-0-12-374988-8.00001-5.
14. Molino, A.; Chianese, S.; Musmarra, D. Biomass gasification technology: The state of the art overview. J. Energy Chem. 2016, 25,
10–25. https://doi.org/10.1016/j.jechem.2015.11.005.
15. Krzywanski, J.; Fan, H.; Feng, Y.; Shaikh, A.R.; Fang, M.; Wang, Q. Genetic algorithms and neural networks in optimization of
sorbent enhanced H2 production in FB and CFB gasifiers. Energy Convers. Manag. 2018, 171, 1651–1661.
https://doi.org/10.1016/j.enconman.2018.06.098.
16. Erlich, C.; Fransson, T.H. Downdraft gasification of pellets made of wood, palm-oil residues respective bagasse: Experimental study. Appl. Energy 2011, 88, 899–908. https://doi.org/10.1016/j.apenergy.2010.08.028.
17. Jaojaruek, K.; Jarungthammachote, S.; Gratuito, M.K.B.; Wongsuwan, H.; Homhual, S. Experimental study of wood downdraft
gasification for an improved producer gas quality through an innovative two-stage air and premixed air/gas supply approach. Bioresour. Technol. 2011, 102, 4834–4840. https://doi.org/10.1016/j.biortech.2010.12.024.
18. Saleh, A.R.; Sudarmanta, B.; Fansuri, H.; Muraza, O. Improved Municipal Solid Waste Gasification Efficiency Using a Modified Downdraft Gasifier with Variations of Air Input and Preheated Air Temperature. Energy Fuels 2019, 33, 11049–11056.
https://doi.org/10.1021/acs.energyfuels.9b02486. 19. Susastriawan, A.A.P.; Saptoadi, H.; Purnom. Small-scale downdraft gasifiers for biomass gasification: A review. Renew. Sustain.
Energy Rev. 2017, 76, 989–1003. https://doi.org/10.1016/j.rser.2017.03.112.
20. Saleh, A.R.; Sudarmanta, B.; Fansuri, H.; Muraza, O. Syngas production from municipal solid waste with a reduced tar yield by
three-stages of air inlet to a downdraft gasifier. Fuel 2020, 263, 116509. https://doi.org/10.1016/j.fuel.2019.116509.
21. Romaniuk, W.; Savinykh, P.A.; Borek, K.; Plotnikowa, Y.A.; Palitsyn, A.V.; Korotkov, A.N.; Roman, K.; Roman, M. Improvement
of gas generator technology for energy processing of agricultural waste. Energies 2021, 14, 3642.
https://doi.org/10.3390/en14123642.
22. All Power Lab. Affordable • Portable • On-Demand Carbon-Negative EnergY From Biomass-Powered Gensets. 2016. Available
online: www.allpowerlabs.com (accessed on 9 December 2021).
23. Cardoso, J.; Silva, V.; Eusébio, D. Techno-economic analysis of a biomass gasification power plant dealing with forestry residues
blends for electricity production in Portugal. J. Clean. Prod. 2019, 212, 741–753. https://doi.org/10.1016/j.jclepro.2018.12.054.

Energies 2022, 15, x FOR PEER REVIEW 23 of 23
24. Situmorang, Y.A.; Zhao, Z.; Yoshida, A.; Abudula, A.; Guan, G. Small-scale biomass gasification systems for power generation (<200 kW class): A review. Renew. Sustain. Energy Rev. 2020, 117, 109486. Elsevier Ltd, Jan. 01.
https://doi.org/10.1016/j.rser.2019.109486.
25. Porcu, A.; Sollai, S.; Marotto, D.; Mureddu, M.; Ferrara, F.; Pettinau, A. Techno-economic analysis of a small-scale biomass-to-
energy BFB gasification-based system. Energies 2019, 12, 494. https://doi.org/10.3390/en12030494.
26. Sobamowo, G.M.; Ojolo, S.J. Techno-Economic Analysis of Biomass Energy Utilization through Gasification Technology for Sustainable Energy Production and Economic Development in Nigeria. J. Energy 2018, 2018, 1–16.
https://doi.org/10.1155/2018/4860252.
27. Jozami, E.; Porstmann, J.C.; Shocron, A.; Feldman, S. Techno-economic Assessment of Biomass Gasification of Spartina argen-
tinensis. Agrociencia Urug. 2017, 21, 78–88. https://doi.org/10.2477/vol21iss1pp78-88.
28. Deiana, P.; Maggio, E.; Bassano, C.; Meloni, S. Techno-Economic Analysis of Syngas and Electric Power Production in FOAK
Industrial Gasification Plant Fed by Biomass and Agro-Industrial Residues In Proceedings of the 9th International Freiberg
Conference. no. 9, Berlin 3 -8 June, 2018.
29. G. Calì, P. Deiana, E. Maggio, C. Bassano, S. Meloni, and S. SpA, “2018 9th International Freiberg Conference 9th International
Freiberg Conference Techno-Economic Analysis of Syngas and Electric Power Production in FOAK Industrial Gasification Plant
fed by Biomass and Agro-industrial Residues,” 2018. Accessed: Dec. 30, 2021. [Online]. Available: https://tu-
freiberg.de/en/fakult4/iec/evt/techno-economic-analysis-of-syngas-and-electric-power-production-in-foak-industrial-
30. Kivumbi, B.; Olwa, J.; Martin, A.; Menya, E. Techno-economic assessment of municipal solid waste gasification for electricity
generation: A case study of Kampala City, Uganda. Agric. Eng. Int. CIGR J. 2015, 17, 141–155.
31. Gökalp, I.; Kaya, O.; Keçecioglu, S.; Boden, D. A Techno-Economic Feasibility Analysis of the Gasification of Used Tires for
Energy Generation in Turkey. Detritus 2019, 7, 68–75. https://doi.org/10.31025/2611-4135/2019.13843.
32. Saleh, A.R.; Sudarmanta, B. Experimental investigation on multi-stage downdraft gasification: Influence of air ratio and equiv-
alent ratio to the gasifier performance. In Proceedings of the AIP Conference Proceedings, 2018; Volume 1983. Surabaya, Indo-
nesia, 5–6 October 2017. https://doi.org/10.1063/1.5046222.
33. Sudarmanta, B.; Gafur, A.; Saleh, A.R.; Dwiyantoro, B.A.; Sampurn. The effect of two stage gasifying agent on biomass
downdraft gasification to the gasifier performance. In Proceedings of the AIP Conference Proceedings, 2018; Volume 1983.
Surabaya, Indonesia, 5–6 October 2017. https://doi.org/10.1063/1.5046233.
34. Daouk, E.; van de Steene, L.; Paviet, F.; Martin, E.; Valette, J.; Salvador, S. Oxidative pyrolysis of wood chips and of wood pellets
in a downdraft continuous fixed bed reactor. Fuel 2017, 196, 408–418. https://doi.org/10.1016/j.fuel.2017.02.012.
35. Li, D.; Briens, C.; Berruti, F. Oxidative pyrolysis of kraft lignin in a bubbling fluidized bed reactor with air. Biomass Bioenergy
2015, 76, 96–107. https://doi.org/10.1016/j.biombioe.2015.03.007.
36. Milhé, M.; van de Steene, L.; Haube, M.; Commandré, J.M.; Fassinou, W.F.; Flamant, G. Autothermal and allothermal pyrolysis
in a continuous fixed bed reactor. J. Anal. Appl. Pyrolysis 2013, 103, 102–111. https://doi.org/10.1016/j.jaap.2013.03.011.
37. Shi, H.; Si, W.; Li, X. The concept, design and performance of a novel rotary kiln type air-staged biomass gasifier. Energies 2016,
9, 67. https://doi.org/10.3390/en9020067.
38. El-Hendawy, A.N.A. Variation in the FTIR spectra of a biomass under impregnation, carbonization and oxidation conditions.
J. Anal. Appl. Pyrolysis 2006, 75, 159–166. https://doi.org/10.1016/j.jaap.2005.05.004.
39. El-Hendawy, A.N.A. Surface and adsorptive properties of carbons prepared from biomass. Appl. Surf. Sci. 2005, 252, 287–295.
https://doi.org/10.1016/j.apsusc.2004.11.092. 40. Brandt, P.; Larsen, E.; Henriksen, U. High Tar Reduction in a Two Stage Gasifier Brant. Energy Fuels 2000, 14, 816–819.
41. Harahap, F.; Leduc, S.; Mesfun, S.; Khatiwada, D.; Kraxner, F.; Silveira, S. Opportunities to optimize the palm oil supply chain in Sumatra, Indonesia. Energies 2019, 12, 420. https://doi.org/10.3390/en12030420.
42. IRENA International Renewable Energy Agency. Renewable Power Generation Costs in 2017; International Renewable Energy Agency
(IRENA) 2018. Abu Dabi United Arab Emirates. https://doi.org/10.1007/SpringerReference_7300.
43. Ltd. DONGFENG CUMMINS ENGINE Co. Cummins engine datasheet. 2007. Accessed: Dec. 28, 2021. [Online]. Available:
http://file.anugrahdiesel.co.id/6bt5_9_3000_rpm-dde81-3035_649.pdf
44. Pereira, E.J.d.; Pinho, J.T.; Galhardo, M.A.B.; Macêdo, W.N. Methodology of risk analysis by Monte Carlo Method applied to power generation with renewable energy. Renew. Energy 2014, 69, 347–355. https://doi.org/10.1016/j.renene.2014.03.054.
45. Oracle Corporation. The Decision Table. 2017. Accessed: Dec. 28, 2021. [Online]. Available:
https://www.oracle.com/technetwork/middleware/crystalball/overview/decision-table-tool-130028.pdf
46. Oracle Corporation. The Crystal Ball Charts: Sensitivity. 2017. Accessed: Dec. 28, 2021. [Online]. Available:
https://www.oracle.com/technetwork/middleware/crystalball/overview/sensitivity-chart-128074.pdf
47. Owens, G. Best Practices Guide : Economic & Financial Evaluation of Renewable Energy Projects. US Agency Int. Dev. 2002, 1,
1–50. 48. Khindanova, I. A Monte Carlo Model of a Wind Power Generation Investment. J. Appl. Bus. Econ. 2013, 15, 94–106.
49. Kementrian Lingkungan Hidup dan Kehutanan, Indeks Kualitas Lingkungan Hidup, 1st ed., vol. 1. Jakarta: Kementrian
Lingkungan Hidup dan kehutanan, 2020; p. 1-112
Commented [M4]: Please note that ref 28 and ref
29 are the same, please revise. If you have to
delete one of them, please also revise the refs
order in the main text.

Energies 2022, 15, x. https://doi.org/10.3390/xxxxx www.mdpi.com/journal/energies
Article
Micro-Grid Oil Palm Plantation Waste Gasification Power Plant
in Indonesia: Techno-Economic and
Socio-Environmental Analysis
Jaka Isgiyarta 1,*, Bambang Sudarmanta 2, Jalu Aji Prakoso 3, Eka Nur Jannah 4 and Arif Rahman Saleh 5,*
1 Department of Accounting, Faculty of Economics and Business, Diponegoro University,
50275 Semarang, Indonesia 2 Department of Mechanical Engineering, Faculty of Engineering, Institut Teknologi Sepuluh Nopember,
60111 Surabaya, Indonesia; [email protected] 3 Department of Economic Development, Faculty of Economics, Universitas Tidar, 56116 Magelang, Indone-
sia; [email protected] 4 Department of Agrotechnology, Faculty of Agriculture, Universitas Tidar, 56116 Magelang, Indonesia;
[email protected] 5 Department of Mechanical Engineering, Faculty of Engineering, Universitas Tidar, 56116 Magelang, Indo-
nesia
* Correspondence: [email protected] (J.I.); [email protected] (A.R.S.)
Abstract: The utilization of new and renewable energy sources explicitly based on biomass needs
to be increased to reduce dependence on fossil fuels. One of the potential biomasses of plantation
waste in Indonesia that can be utilized is oil palm plantation waste in the form of fronds and trunks
that are converted with multi-stage downdraft gasification technology. This study aimed to con-
duct a technical analysis, economic analysis, investment risk analysis, social analysis, and an en-
vironmental impact assessment of power plants fueled by oil palm plantation waste. The method
used was the upscaling of a prototype of a 10 kW power plant to 100 kW. The results showed that it
was technically and economically feasible to apply. The economic indicators were a positive NPV
of USD 48.846 with an IRR of 9.72% and a B/C ratio of 1.16. The risk analysis predicted a probability
of an NPV 49.94% above the base case. The study of the social aspects suggested that the construc-
tion of power plants has a positive impact in the form of increased community income and the
growth of new economic sectors that utilize electricity as a primary source. An analysis of the en-
vironmental effects is critical so that the impacts can be minimized. Overall, the construction of
small-scale power plants in oil palm plantations is worth considering as long as it is carried out
following the applicable regulations.
Keywords: gasification; multi-stage; techno-economic; power plant; oil palm waste
1. Introduction
The availability of clean energy is necessary to meet national energy needs to effi-
ciently support the goal of the sustainable development of new and renewable energy in
Indonesia. By 2025, it is expected that the renewable energy mix can grow to 23% with an
installed capacity of 5500 MWe as shown in Figure 1. Until 2018, the percentage of re-
newable energy utilization reached 6.2%. The bioenergy sector is expected to contribute
8.2% to national energy, one way of which is through the development of bioenergy
power plants [1]. The utilization of new and renewable energy has become a topic of
interest and is on the agenda in the world as one of the solutions to overcome the prob-
lems of the current energy crisis. The cause of this energy crisis is the decreasing availa-
bility of fossil fuels. Biomass, because of its abundant availability, can substitute for the
use of fossil fuels. Compared to other renewable energy sources (wind, solar, etc.), en-
Citation: Isgiyarta, J.; Sudarmanta,
B.; Prakoso, J.A.; Jannah, E.N.; Saleh,
A.R. Micro-Grid Oil Palm Plantation
Waste Gasification Power Plant in
Indonesia: Techno-Economic and
Socio-Environmental Analysis.
sEnergies 2022, 15, x.
https://doi.org/10.3390/xxxxx
Academic Editor(s):
Received: 7 December 2021
Accepted: 19 January 2022
Published: date
Publisher’s Note: MDPI stays neu-
tral with regard to jurisdictional
claims in published maps and insti-
tutional affiliations.
Copyright: © 2022 by the authors.
Submitted for possible open access
publication under the terms and
conditions of the Creative Commons
Attribution (CC BY) license
(https://creativecommons.org/license
s/by/4.0/).

Energies 2022, 15, x FOR PEER REVIEW 2 of 23
ergy production from biomass requires lower capital investment costs [2]. To encourage
the acceleration of the use of renewable energy in Indonesia, the government has estab-
lished various policies. The government has the target of an additional installed capacity
from renewable energy power plants of 905.73 megawatts (MW), consisting of 196 MW
from geothermal powerplants, 557.93 MW from hydro power plants, 138.8 MW from
solar power plants, and 13 MW from bio power plants. Meanwhile, the renewable energy
investment target in 2021 will increase to USD 2.05 billion or approximately IDR 28.9
trillion (assuming an exchange rate of IDR 14,100 per dollar) from the investment
achievement in 2020, which amounted to USD 1.36 billion or approximately IDR 19.2
trillion. Some of the government’s policies on new energy are as follows [3]:
a. Implementation of the mandatory B30 program for all sectors, followed by the de-
velopment of biodiesel trials as a substitute for fossil diesel with B100 (biodiesel
100%) development technology;
b. Mixing of research octane number 92 Oil Fuel in East Java in the context of efforts to
procure bioethanol-type biofuel, in accordance with the Regulation of the Minister
of Energy and Mineral Resources Number 12 of 2015;
c. Acceleration of waste power plant development in 12 selected cities, as mandated by
Presidential Regulation Number 35 of 2018 concerning the acceleration of waste
power plant development programs;
d. Encouraging the use of rooftop solar power plants in accordance with the mandate
of the Minister of Energy and Mineral Resources Regulation Number 49 of 2018
concerning the Use of Rooftop Solar Power Generation Systems by state power plant
consumers;
e. Simplifying the bureaucratic process through the of Energy and Mineral Resources
Online Licensing Application, which is integrated with data on natural resources,
operations, production, and marketing/sales of each type of energy;
f. Increasing the use of renewable energy to reduce dependence on fossil fuels, which
will have an impact on increasing Indonesia’s economic stability.
Figure 1. Primary energy supply by 2025.
The utilization of biomass waste into energy can be a solution to reduce dependency
on fossil fuel. The potential energy from biomass is currently at 32,654 MW and 1716.5
MW has been developed [4]. Development of bioenergy-based power plants (on-grid)
until 2013 reached 90.5 MW, while for those off-grid it reached 1626 MW [5]. One of the
most significant biomass potentials in Indonesia is from solid waste from oil palm plan-
tations. Oil palm plantations in Indonesia are the largest source of biomass with a total
electricity energy that can be generated of 5495 MWe [6]. The sources come from planta-
tion wastes (oil palm fronds and oil palm trunks) or waste from oil palm mill production
28%
23% 28%
21%
Renewable Energy Oil Coal Gas

Energies 2022, 15, x FOR PEER REVIEW 3 of 23
(meso scrap fiber, palm kernel shell, and oil palm mill effluent). However, not all these
wastes are utilized as energy, so they have the potential to become sources of greenhouse
gas emissions when they decompose. In addition, in terms of the environment in recent
years, the oil palm plantation industry in Indonesia has been in the European Union’s
and the United States’ spotlight because it is considered an industry that is not environ-
mentally friendly due to the impact it causes [7]. If the renewable energy target policy is
implemented by 2030, it is expected to reduce greenhouse gas emissions by 29% com-
pared to 2010.
Indonesia has five provinces with the most extensive oil palm plantations, namely,
South Sumatra, Central Kalimantan, West Kalimantan, North Sumatra, and Riau. In 2019,
the Indonesian State Electricity Company reported that Indonesia’s electrification ratio
had reached 99%. However, the electrification ratio is still calculated from the number of
people who obtain electricity for access to lighting and not for the productive sector. The
Ministry of Energy reported the data on villages that did not have access to electricity to
be as many as 2281 villages out of a total of 232,128 villages in Indonesia [1]. Meanwhile,
for the five provinces with the most extensive oil palm plantations, there are 785 villages,
2510 villages, 13,595 villages, 634 villages, and 5209 villages, respectively, as shown in
Figure 2. The condition is ironic, since these five provinces produce much of the oil palm
plantation waste. At present, access to electricity only benefits people in urban areas
where there is an installed electricity network. In contrast, construction of the network
constrains those plantations because the cable must pass through the plantations. Thus,
the issue of land acquisition is a significant factor in the lack of access to electricity in
rural communities located in oil palm plantations.
Figure 2. Villages that have no access to electricity in Indonesia.
Oil palm plantation wastes are oil palm fronds and oil palm trunks. Oil palm fronds
during pruning and replantation activities are always stacked and collected at an average
production rate of 9.8 t-dry/ha-estate/year and 14.9 t-dry/ha-replantation/year. A study
reported that oil palm fronds contain 25.5% (dry basis) hemicellulose material, which has
excellent potential to be used as a raw material for biofuels and bio-based material pro-
duction [8–11]. Oil palm trunks are the second type of biomass residue produced during
replanting. Oil palm trunk production is estimated at 62.8 t-dry/ha-replantation/year. At
present, oil palm fronds are usually burned as fuel in processing plants, and the re-
mainder is disposed of in plantations, while oil palm trunks after the replanting process
are not utilized [10]. Utilization of oil palm waste as a raw material for renewable energy
that can generate electricity is a solution to the residue of oil palm industry activities in
Indonesia. According to the Ministry of Energy and Mineral Resources of the Republic of

Energies 2022, 15, x FOR PEER REVIEW 4 of 23
Indonesia, the renewable energy market in Indonesia is not yet optimal because it relies
on solar panels which have components that are imported. Thus, the government is
pushing a draft Indonesian Presidential Regulation that will regulate the price of new
renewable electricity. Through this policy, it is hoped that the production of renewable
energy that utilizes oil palm waste as a raw material can grow in oil palm industrial areas
in Indonesia. In addition, the push for the use of renewable energy is in line with the
global commitment to the 7th point of the Sustainable Development Goals that are to be
achieved by 2030 regarding clean and affordable energy.
One technology that can be used to convert biomass into alternative energy without
producing emissions is gasification [12]. Gasification is the process of converting solid or
liquid raw materials into thermochemical gases [13]. Different to combustion, gasification
produces higher efficiency, and the pollutants are still below emissions standards. The
gasification process consists of several sequential stages, namely, the drying, pyrolysis,
partial oxidation, and reduction stages. Gasification requires media such as air, oxygen,
or water vapor. The gas produced from the gasification process, commonly called syn-
thetic gas (syngas), consists of combustible syngas (i.e., CO, H2, and CH4) and
non-combustible gas (i.e., CO2, N2, and the remaining O2) [14]. Gasification reactions oc-
cur in a reactor called a gasifier. There are various types of gasifiers such as updraft,
downdraft, cross draft, bubbling fluidized bed gasifiers, and circulating fluidized beds
(CFBs) [15]. One type of gasifier that is widely used is the downdraft [16–18]. A
downdraft gasifier has the advantage of a high carbon conversion rate, low tar produc-
tion, and simple construction compared to other types [19].
The aim of this study was to analyze the utilization of oil palm plantation waste as
fuel in gasification power plants. The analyses simultaneously carried out were technical,
economic, investment risk, social, and environmental impact analyses. Oil palm planta-
tion wastes used were oil palm fronds and oil palm trunks. Both of these plantation
wastes have been reported by several previous studies and are suitable as feedstock for
gasification. The power plant analyzed was upscaled from a laboratory-scale prototype
with a capacity of 10 kW, which has been reported in previous studies, to a small-scale
power plant with a capacity of 100 kW. The gasification technology used the multi-stage
downdraft gasifier [20]. This technology has the advantage of being able to produce
syngas with a high–low heating value and a low tar content of 2.6 times compared to the
single-stage downdraft gasifier that has been reported in other studies. Moreover, this
multi-stage gasification technology was also equipped with an air heating system that
was also capable of producing low tar content up to 27.8 mg/Nm3 and temperature in-
creases at the partial oxidation zone with a constant equivalent ratio [18].
Several previous studies using gasification technology for power generation have
been carried out. Romaniuk [21]conducted research by utilizing agricultural waste as fuel
in gas generators. Modification of the gas generator was conducted by adjusting the
supply of oxidizer (air supply) into the reaction zone. A downdraft-type gasification
power plant with a capacity of 25 kW was also developed by ENTRAGE Energies System
AG, using a 4.3 L six-cylinder petrol engine coupled to an electric generator. A
downdraft-type gasification power plant was also developed by ALL POWER LABS with
a power output of 15 kW [21,22]. The gasifier was coupled to a four-cylinder diesel en-
gine and an electric generator. Currently, one of the largest biomass power plants is lo-
cated in the UK, near Cheshire, and it produces 21.5 MW of electrical energy. A gasifica-
tion power plant with a capacity of 100 kW in current market conditions is more profita-
ble than a larger capacity provided that the fuel used is not difficult to supply [23]. Si-
tumorang [24] reports that gasification power plants can be used to utilize locally avail-
able biomass as fuel with a generating capacity of less than 200 kW.
Before the power plant was implemented, it was necessary to evaluate the feasibility
and sustainability of the project in terms of economic, social, and environmental as well
as the risk variables that could hinder the success of the project. Some analyses that
needed to be conducted were techno-economic, risk, and social–environmental. Tech-

Energies 2022, 15, x FOR PEER REVIEW 5 of 23
no-economic analyses of gasification power plants have been carried out in several pre-
vious studies. Porcu [25] conducted a techno-economic analysis of a gasification power
plant being upscaled from 500 to 200 kW using a bubbling fluidized bed gasifier. Singh
conducted a techno-economic analysis of hybrid power plants between gasification, solar
PV, and fuel cells, but the gasification technology used was not mentioned. Economic
and environmental impact analyses of an 11 MW capacity gasification power plant were
carried out by Cardoso [23], and the results of the study reported that the NPV was in-
fluenced by revenue from electric sales. Sobamowo [26]conducted a techno-economic
analysis of a gasification power plant using downdraft gasification technology with a
capacity of 60 MW; the results of the study reported that the distance between the power
plant and the source of raw materials affected the raw material costs. Moreover, local
materials for capital investment, maintenance, and fuel costs provided higher profit
margins.
Emiliano [27] conducted a techno-economic assessment of power plants with gasi-
fication technology. The results of the study reported that the price of gaseous fuel (i.e.,
natural gas) dramatically affects the economics of the power plant project. In addition,
power efficiency and the selling price of electricity can produce a higher NPV. Cali [28]
conducted a techno-economic analysis of the FOAK industrial gasification plant. The
results of the study reported that the cost of fuel dramatically affects the cost of electricity
(COE), and the economic results can be increased by technical development to reduce
operating costs. Kivumbi [29] conducted a techno-economic analysis of a gasification
power plant with a capacity of 425 kW using municipal solid waste as fuel. The results of
the study reported that for small-scale power plants, a high interest rate causes the return
on investment to be longer, so it is not appropriate. In addition, the distance between the
source of raw materials and power plants affects the total cost of transportation to in-
crease the cost of electricity production. Gokalp [30] conducted a techno-economic anal-
ysis of a gas tire scrap power plant capacity of 5 MWe. The gasification technology used
was a circulating fluidized bed. The results of the study reported that the price of raw
materials dramatically influences the financial result, but if it cannot be reduced, the ef-
ficiency of the gasification system needs to be increased. Based on the results of the pub-
lished techno-economic analyses, various variables affect the financial results of a gasi-
fication power plant and are different for each region, the type of raw material used, and
the planned generating capacity. Moreover, most publications only discuss the economic
analysis, and only a few discuss investment, social, and environmental risk analyses
simultaneously, while these are interrelated. The generating capacity analyzed was also
medium- to large-scale, while for the microscale, the literature is still limited.
This research is critical because of the limitations in the literature on technical and
economic analyses; specifically, it was a small-scale 100 kW gasification power plant that
utilized oil palm plantation waste as the primary fuel. In this study, the technical analysis
carried out to calculate the capacity of the gasification system was based on the type of
solid fuel and internal combustion engine. Meanwhile, the economic analysis conducted
was calculated as the net present value (NPV), internal rate of return (IRR), bene-
fit-to-cost ratio (B/C), and payback period (PBP). The investment risk was also analyzed
using the Monte Carlo method. Furthermore, the final analysis carried out was an anal-
ysis of the social and environmental impacts due to the gasification power plant.
2. Materials and Methods
Multi-stage gasification power plant experiments have been carried out previously
at the pilot scale with a capacity of 10 kW [18,20,31]. To estimate the economic value of a
power plant on a micro-grid scale, in the analysis, the capacity was upscaled to 100 kW.
The aim was to obtain the difference between the non-profit models on the prototype
scale and a profitable model on a commercial scale. The results of the pilot-scale experi-
ment were used as a reference for modeling the performance of microscale gasification
power plants. The technical aspects discussed in this study are feedstock characteriza-

Energies 2022, 15, x FOR PEER REVIEW 6 of 23
tions using ultimate and proximate analyses, explanations of experimental activities, and
analysis of economic models. Techno-economic analyses were carried out including in-
vestment costs and operating costs. Meanwhile, for the technical analysis, the size of the
biomass power plant was upscaled. Furthermore, an income analysis was carried out
based on financial assumptions. After the technical aspects were defined, the next step
was to perform an economic analysis and socio-environmental analysis. The Monte Carlo
method was used for the risk analysis with Crystal Ball software Version 11.1.2.4®.
2.1. Multi-Stage Downdraft Gasification Power Plant
The experiments of pilot-scale gasification were conducted using a single-throat
downdraft gasifier that was modified from a single-stage to a multi-stage [18]. The ad-
vantage of this multi-stage gasifier is that it produces syngas with a lower tar content and
a higher heating value. The multi-stage gasification technology was developed in the
combustion laboratory and an energy system from the Sepuluh Nopember Institute of
Technology. The scheme of the gasification system is shown in Figure 3.
Figure 3. Prototype of a multi-stage downdraft gasifier.
The solid fuel consumption of this reactor was 8 kg/h. Before entering the reactor,
the fuel was placed inside a hopper equipped with a screw conveyor. The amount of fuel
entering was regulated through the screw rotation of the screw conveyor. The air used
was ambient air, and before entering the gasifier, it was preheated until 200 °C. In addi-
tion to obtaining external heating, the air was also internally heated inside the gasifier by
placing an air ring in the form of a pipe that circled the inner wall of the reactor. In the
first stage, the air was injected into the pyrolysis zone using six nozzles. The air in this
pyrolysis zone initiated the oxidation reaction between the air and carbon, called oxida-
tive pyrolysis [20,32–36]. The oxidation reaction released heat so that the pyrolysis
properties changed from endothermal to exothermal. This was advantageous because the
released heat from the partial oxidation zone was reduced. The temperature increased in
the pyrolysis zone cracking the tar components from primary to secondary tar [18].
Furthermore, at the second stage, the air was injected in the partial oxidation, pre-
cisely above the throat. In this position, the air was not distributed using the air ring be-
cause it was heated from the oxidation region. Finally, in the third stage, the air entered

Energies 2022, 15, x FOR PEER REVIEW 7 of 23
the reduction zone using an air ring divided by six nozzles. Air entering the reduction
zone also reacted with residual charcoal in that zone; as a result, the temperature in the
reduction zone also increased, which was beneficial for the thermal cracking reaction of
the tar component. In addition, air also activates the residual charcoal so that the number
of pores becomes more numerous and can capture some of the tar components [20,37,38].
Gasifier walls are built using stainless-steel plates with a thickness of 3 mm. The to-
tal height of the reactor was 1.3 m with a diameter of 0.5 m. The ash sweeping mechanism
was placed above the grate to prevent blockage of the grate hole. The sweeper was
moved every 15 min after syngas under flammable conditions. The ash that fell from the
grate was moved to the box using a screw conveyor with a 45° slope. After that, periodic
ash disposal was carried out every 3 h of operation. Syngas was emitted from the gasifier
before being used in the internal combustion engine and first passed through the cyclone
to separate heavy particles, such as ash and fine grains, that were carried out by the
syngas. Heavy particles were separated due to the fact of gravity, and the syngas was
cleaned using a dry filter. Inside the dry filter there were two layers of filter media: the
lowest layer was activated carbon, and the top layer was wood dust. The tar component
carried in the syngas was captured by the activated carbon. The syngas temperature
coming out of the gasifier was 150 °C and 27 °C after it passed the dry filter. The tar and
heavy oil components contained in the syngas were condensed and absorbed by acti-
vated carbon [39]. The layer of sawdust served as an additional layer to capture the un-
filtered tar and heavy oil in the activated carbon layer. To ensure the filtering efficiency
and the final tar content, the syngas was tested by taking a sampling gas every 30 min of
operation. Syngas was condensed using a condenser with ice water as cooling media. The
condensed tar stuck to the wall of the condenser and moved down and was accommo-
dated with a measuring cup [39]. The gas that was separated from the tar was later stored
in a gas sampling bag and tested separately using gas chromatography.
Furthermore, syngas was channeled to a diesel engine that was connected to a 10
kW electric generator with dual fuel operating condition (i.e., syngas and diesel fuel).
Syngas entered the diesel engine via the air intake channel through the mixer, and the
amount was regulated using a valve.
2.2. Feedstock Characterization
The raw materials used were oil palm fronds and oil palm trunks that were shred-
ded into fibers with lengths of 3–5 cm as shown in Figure 4. Characterization was con-
ducted by testing the raw material using ultimate and proximate analyses. The test was
carried out at the Energy Institute Laboratory of the Sepuluh Nopember Institute of
Technology. Proximate analysis refers to the ASTM D 5142-04 standard for the parame-
ters of moisture, volatiles, and ash. Meanwhile, fixed carbon was tested based on the
difference between the total mass reduced by moisture, volatiles, and ash. The ultimate
analysis was carried out according to the ASTM D 5373-02 standard for carbon, hydro-
gen, oxygen, nitrogen, and sulfur components. The oxygen was the difference between
the total mass minus the previous component. Analysis of the calorific value was carried
out using a bomb calorimeter (AC-350 Bomb Calorimeter) according to the ASTM
D4809-18 for analysis of gross calorific value. Ultimate analysis uses sample sizes be-
tween 100 and 300 g to obtain accurate results. Carbon, nitrogen, and sulfur testing in this
study used a sample size of 2–3 mg, which had an error tolerance of 0.05 w. (500 ppm)
with an uncertainty below 0.02 w.%. Based on the manufacturer’s specification data from
the equipment used, the uncertainty of the instrument was in the moderate concentration
range of 0.3 w.%. If the sample had a carbon content higher than 90 w.%, then the toler-
ance was extended to 0.5 w.%. The results of the analysis of the feedstock are presented in
Table 1.

Energies 2022, 15, x FOR PEER REVIEW 8 of 23
Figure 4. Results of the shredded midrib and oil palm stems.
Table 1. Ultimate and proximate analyses of solid fuel.
Analysis Contents (% Mass) Oil Palm Frond Oil Palm Trunk
Proximate
Volatile 85.1 86.7
Moisture 70.6 75.6
Ash 3.37 3.35
Calorific Value (MJ/kg) 17.48 17.41
Ultimate
Carbon 48.43 51.41
Hydrogen 10.46 11.82
Oxygen 46.75 51.16
Nitrogen 12.40 0.17
2.3. Experimental Activity
Gasification experiments were carried out using a multi-stage downdraft gasifier.
The used equivalent ratio (ER) was the optimum ratio from previous studies [20,31]
which was 0.4 while the air ratio (AR) for the pyrolysis zone, partial oxidation, and re-
duction were selected at the optimum ratio of 10%, 80%, and 10%. The AR percentage
shows the amount of air entering for each zone, meaning that from the total air based on
ER 0.4 divided into three locations, 10% into the pyrolysis zone, 80% into partial oxida-
tion, and 10% into the reduction zone. Syngas was cleaned using a cyclone and dry filter
to further flow into a diesel engine. The experimental data generated from the gasifica-
tion experiment are shown in Table 2.
Table 2. Prototype of the gasification power plant specification of a 10 kW capacity.
Parameter Value
Equivalent ratio 0.4
Air ratio (pyrolysis, oxidation, and reduction zone) 10%, 80%, 10%
Feedstock flow rate 8 kg/h
Air inlet temperature 200 °C
Syngas temperature after cleaning 80 °C
Syngas flow rate 0.0028 m3/s
Syngas heating value (LHV) 6.642 MJ/Nm3
Syngas Composition Volumetric Percentage
CO 18%
H2 25%
CH4 4%

Energies 2022, 15, x FOR PEER REVIEW 9 of 23
2.4. Economic Model
The economic analysis in this study was carried out using a 10 kW capacity gasifi-
cation experimental data reference that was upscaled to 100 kW. Some operating condi-
tions were equated according to the experimental reference data, and the resulting data
were used as input data for the economic analysis. A techno-economic analysis was car-
ried out for every year of the estimated service life of the gasification system of 20 years.
The reference cost component started from the capital cost to the estimated revenue for
each year.
3. Result
3.1. Techno-Economic Analysis
In this study, the analysis was conducted for the utilization of oil palm plantation
waste converted into electrical energy using gasification technology in Indonesia. The
analysis was conducted close to the actual condition, and the analysis was carried out
based on a literature study that was conducted for potential bioenergy investment, espe-
cially biomass in Indonesia.
The oil palm plantation waste was grouped into two types, namely, waste from
plantations in the form of oil palm fronds and trunks and waste from the processing of oil
palm into crude oil palm such as fiber, shells, empty fruit bunches, and liquid waste or oil
palm mill effluent (POME) [8]. From all types of plantation waste, the most significant
potential was oil palm fronds with a total production of 49.41 million tons/year which
were derived from the Sumatra region; 23.50 million tons/year in Kalimantan; 218 thou-
sand tons/year in Java, Bali, and Madura; 2.17 million tons/year in Sulawesi; and 202.64
thousand tons/year in Papua. The total energy that can be generated from all the poten-
tial reaches 5495 Mwe [6]. Palm fronds were chosen because they are always available on
plantations and do not require a significant supply cost compared to other wastes. The
waste from palm processing was owned by the company, so that if the community or
other parties needed it, they must buy it first, while oil palm fronds can be taken for free
and only require costs for transportation, chopping, and drying. Besides the oil palm
fronds, oil palm trunk is also used as additional raw materials. However, due to the fact
that it is only available during the replanting process, the amount was less if it was di-
vided within one year. The total potential energy from oil palm trunk reaches 815 MW
[6].
The first step for the raw material for oil palm fronds before use was to strip the
leaves, then transport them to the power plant storage facility. The next step was to shred
and dry them under the sun and then finally store them in a warehouse. The oil palm
fronds were used as the primary fuel, and the oil palm trunks were use as the secondary
fuel. When both were available, they were mixed with a percentage of 70% fronds and
30% trunk. The power plant was ideally placed close to the location of the plantation so
that the cost of the transportation of the raw materials could be reduced [23]. Based on
the planned installed capacity, 1189 tons/day of raw materials were needed. Thus, at least
100 hectares of oil palm plantation were required. When compared with the areas of
lands in Sumatra, Kalimantan, Sulawesi, and Papua, this plant can be placed anywhere
because the existing land area was greater than the required minimum land area [40]. The
maximum moisture content of the solid fuel was 40%.
Actually, the oil palm fronds are not purely waste. So far, they have been left piling
up beside the palm trees until they rot and become soil fertility. However, to reach this
stage requires a long time. Thus, to maintain balance, not all the fronds produced were
used entirely. As much as 70% of the waste was utilized, and the remaining 30% was left
as soil fertilizers. Although the availability of the land area was quite extensive, most of
the landowners were companies, while a limited amount was owned by the community.
Cooperation between the power plant manager and the company was needed to ensure
the availability of raw materials and the sustainability of the power plant in the future.

Energies 2022, 15, x FOR PEER REVIEW 10 of 23
The biomass power plant with gasification technology was expected to operate for 20
years with a construction period of one year. The plant works 355 days a year and has a
ten-day shutdown schedule for maintenance.
Following its capacity, the number of employees needed to operate the power plant
was estimated at six people, consisting of one manager, two operators, two technicians,
and one administrator. Economic analysis was conducted by predicting the cost compo-
nents associated with power plant construction, starting from the planning stage to the
implementation stage.
3.1.1. Investment Cost
The investment costs were calculated based on an investment analysis for power
plants of the same scale used as a reference in this study. The power plant with a capacity
of 10 kW was built in 2017. All costs were converted from IDR to USD. The exchange rate
in 2019 for USD 1 was IDR 14,012.73, while the IDR to USD currency exchange rate in the
year the reference power plant project was IDR 13,693. The breakdown of capital costs
refers to the IRENA [41] and are presented in Table 3.
Table 3. Investment costs (USD).
Investment Item Cost
Civil work 664.31
Building 763.96
Foundation and supporting material 4417.68
Piping system 2524.39
Electric component 2989.40
Instrumentation 1660.78
Insulation and painting 664.31
Total Construction Cost 13,684.83
Gasifier with cleaning and cooling system 30,000.00
Diesel engine (100 kVA) 12,458.25
Total Investment Cost 56,143.08
3.1.2. Operating Cost
The operating cost component was the costs incurred each year for power plants,
which consisted of raw material costs (consisting of costs for providing raw materials and
transportation), operating and maintenance costs (O&M), tax burden, and annual depre-
ciation costs. Operating and maintenance costs included the costs of providing electricity,
clean water, ash disposal, engine component replacement, and the gasifier component.
This also included costs for labor, consisting of basic salaries, benefits, and health insur-
ance. Office operational costs consisted of administrative costs, office stationery, official
travel, and transportation costs. Electricity needs for plant operations were calculated
based on the number of operating hours for one year. Details of the cost of electricity
needs for the plant are presented in Table 4.
Table 4. Yearly production costs (USD).
Item Cost
Operation and maintenance of the gasifier 2245.72
Operation and maintenance of the gasifier variable cost 139.86
Depreciation cost 2930.39
Total Yearly Production Cost 5315.97

Energies 2022, 15, x FOR PEER REVIEW 11 of 23
The cost component of the solid fuel is the cost of collecting, cutting, and transpor-
tation from the source of the solid fuel to the location of the power plant. Oil palm fronds
are not purchased but rather harvested from trees, collected, and transported. The cost
component was harvesting, transportation, and labor costs, while for oil palm trunk, the
costs incurred were logging costs. Costs incurred to produce electricity were calculated
based on the standard O&M cost for diesel engines from IRENA 2018 of $0.008/kWh [41].
The O&M cost component for diesel engines was obtained by multiplying yearly electric
production by the standard O&M cost from IRENA. Fuel costs consisted of biomass and
diesel because they were operated in dual fuel. The percentage of syngas substitution
against diesel was a maximum of 60%. Details of the electricity production costs are
presented in Table 5.
Table 5. Electric production cost (USD).
Item Cost
O&M cost of diesel engine (electric production) 2401.75
Yearly production cost 5315.97
Depreciation cost (20 year operation) 265.80
Biomass fuel cost 6574.44
Diesel fuel cost 10,313.23
Total Electric Production Cost 24,871.19
3.2. Gasifier Upscaling
The capacity of the power plant that was analyzed economically was 100 kW. Based
on the technical aspects, the diesel engine and gasifier were upgraded. The selected diesel
engine was Cummins 6BT5.9-G2, which was coupled with a 100 kVA generator. The
technical specifications can be seen in Table 6.
Table 6. Diesel engine specifications [42].
Engine Cummins 6BT5.9-G2
Generator Stamford UCI274C
KVA 100
KW 80
Number of cylinders 6
Bore x stroke 102 × 120 mm
Piston disp. 5900 L
Fuel consumption 17 L/h (75% load) and 22 L/h (100% Load)
Oil capacity 16.4 L
Dimension 2910 × 1110 × 1450 mm
Based on the engine specifications, the output capacity was calculated using the
method by Kivumbi [29] with the results shown in Table 7.
Table 7. Diesel engine parameters.
Parameter Value Unit
Maximum air producer gas 0.0738 m3
Maximum real producer gas intake 0.0351 m3/s
Real producer gas intake 0.0281 m3/s
The normal volume rate of the producer gas 0.0287 m3/s
Thermal power 190.4284 kW
Maximum mechanical output 82.0746 kW
Maximum electrical output 34.9638 kW
Comment [M1]: Should it be
6BT5.9G2
Comment [ARS2]: The code
have been corrected
Comment [M3]: Please confirm
if you have got the copyright to
use the table.
Comment [ARS4]: I confirmed

Energies 2022, 15, x FOR PEER REVIEW 12 of 23
Furthermore, after the capacity of the diesel engine was known, the specifications of
the gasifier could be calculated using the method used by Kivumbi [29] with the results
presented in Table 8.
Table 8. Gasifier sizing parameters.
Parameter Value Unit
Thermal power consumption (full load) 272.0406 kW
High heating value 24,132.7205 kJ/kg
Low heating value 19,766.0645 kJ/kg
Biomass consumption 0.0138 kg/s
Specific fuel consumption 1.4171 kg/kWh
Gas production from the gasifier 0.1106 m3/s
Cross-sectional area 0.0442 m2
The diameter of the air inlet 0.2374 m
Height from nozzle plane 0.1139 m
Diameter of firebox 0.4985 m
Nozzle diameter 0.0094 m
Specific gasification rate 1120.0607 kg/h·m2
Height of gasifier 3.5002 m
Gasifier diameter 0.2374 m
Based on the parameters of the diesel engine and gasifier that were calculated, the
electrical energy output capacity was calculated, and the results obtained are presented
in Table 9. The number of operating days for one year was assumed to be 355 days, with
42.6% electricity production efficiency. Total electricity production per day was 839.13
kWh/day, so that the total electricity production for one year is 297,891.57 kWh/year.
Table 9. Electric production parameters.
Parameter Value Unit
Electric output 34.96 kW
Electrical efficiency 42.60 %
Frequency 50 Hz
Number of gas engine 1 Unit
Daily electric production 839.13 kWh/day
Day operation in one year 355 Day
Yearly electric production 297,891.57 kWh/year
3.3. Revenues
Revenue was obtained by multiplying the total electricity production for one year
with the price of electricity following the state power plant standard for renewable en-
ergy, which was $0.121/kWh. Electricity consumption costs for the plant reduced gross
revenue. Detailed calculations for the power plant are presented in Table 10.
Table 10. Revenue list.
Revenue Item Revenue Unit
Electric price 0.121 USD/Kwh
Estimated revenue 36,004.56 USD/year
Plant usage in electricity 686.511 USD/year
Net revenue 35,318.05 USD/year

Energies 2022, 15, x FOR PEER REVIEW 13 of 23
3.4. Financial Assumption
The financial assumptions used in this study included the operating life of the plant
and the interest rate presented in Table 11. Each year, it was estimated that all costs and
selling prices would experience inflation of 2% [26]. The net present value was calculated
using an interest rate of 8%.
Table 11. Financial assumption.
Assumption Item Value Unit
Power plant lifetime 20 year
Interest rate 8 %
Inflation rate 2 %
3.5. Economic Feasibility Analysis
An economic feasibility study was carried out to decide whether the investment in
the power plant that is to be carried out was profitable and feasible for investment. The
conducted economic analysis was the NPV, PBP, and the IRR [43]. The NPV calculation
was conducted by calculating the present value of cash flows for a certain period. The
calculated cash flow was the difference between the benefits and costs for each year the
NPV was determined. The equation to calculate the NPV is shown below [23]:
∑ (( ) )
( ) ( )
where i is the interest rate, N is the number of periods (years), Cy are number of cash in-
flows in year y, and Cy = 0 is the total investment of the first year plus cash outflows. In-
terest rates were used to calculate the discount factor and present values for costs and
benefits. The operating period was assumed to be 20 years [25] with an interest rate of
8%. After calculating, if the NPV was positive, the investment was profitable and vice
versa. Thus, if t was profitable, capital costs could be returned during the operating pe-
riod.
The internal rate of return was analyzed based on the accumulation of NPV values.
IRR is the present value of costs and benefits. Investment can be made if the IRR value is
higher than the interest rate and vice versa. The equation used to calculate IRR was as
follows [23]:
( )
The initial investment cost is the total investment cost in the first year, i is the interest
rate, and y is the current year. The payback period was analyzed to determine the cost for
each year so that the initial investment costs could be returned. The equation used to
calculate the payback period is as follows [23]:
Risk analysis on the choice of inputs was used to generate electricity per kWh using
a standard deviation approach. The approach tries to categorize the different input types
of fuel from oil palm waste for mechanization of energy generation. The equation used
for calculating the standard deviation was as follows:
√
∑ ̅

Energies 2022, 15, x FOR PEER REVIEW 14 of 23
3.6. Techno-Economic Analysis
The economic analysis was carried out on a power plant that was scaled up from 10
kW to 100 kW. A sensitivity analysis was carried out by looking at the effect of the per-
centage increase in construction costs, the price of biomass fuel, and the price of diesel
fuel on the economic value of the project. The sensitivity analysis of the investment costs
to produce each kWh of electricity was also varied to determine the investment costs that
could produce an internal rate of return higher than the interest rate. In addition, a risk
analysis was also carried out to see the effect of investment costs and operating costs on
NPV [25].
3.6.1. Economic and Sensitivity Analysis
Based on the results of economic analysis, power plant investment can reach a break
event point in the 6th year as shown in Figure 5. With an interest rate base of 8%, the net
present value was positive after accumulating for 20 years of operation at USD 48,846 as
shown in Table 12, which means this power plant project provides benefits. The ratio
between cost and benefit was greater than 1, at 1.16. Meanwhile, the internal rate of re-
turn was also above the interest rate of 9.72%, so the investment was still profitable. The
cost of electricity was still below the selling price from the state power plant of USD
0.083/kWh, where the selling price from the government was USD 0.121/kWh, so there
was a difference of USD 0.037/Kwh as profit.
The sensitivity analysis was performed using the Crystal Ball software Version
11.1.2.4® with 100,000 trials. The feature used was the decision table tool [44,45]. With this
feature, we could simulate several different values or two decision variables. Interest
rates varied from 7% to 12%. The results of this analysis are presented in Table 12. The
NPV continued to decrease along with the increase in the interest rate, but the value re-
mained positive. The same trend also occurred in the IRR and B/C ratio. Even though the
NPV was always positive, and the B/C ratio was above 1, the results showed that when
the interest rate was at 10–12%, the IRR was already below the interest rate. Thus, in-
vestment had a percentage return that was greater than the interest rate if the interest rate
was lower or equal to 9%. However, the value of the interest rate was a fluctuating value
depending on the economic conditions of the Indonesian state.
Table 12. NPV, IRR, and B/C ratio forecast with interest rate variation.
Interest Rate 7% 8% 9% 10% 11% 12%
NPV (USD) 57,096 48,846 41,514 34,975 29,124 23,873
IRR (%) 10.75 9.72 8.71 7.73 6.76 5.80
B/C ratio 1.18 1.16 1.15 1.13 1.12 1.10
LCOE ($0.083/kWh)

Energies 2022, 15, x FOR PEER REVIEW 15 of 23
Figure 5. Return on investment based on the operating life of the power plant.
Investment costs were also varied to determine the range of investment costs that
still provided benefits. The range of investment costs, according to IRENA was from USD
950 to 1650/kW [41]. If one looks at the comparison of the investment costs in Table 13, in
the range from USD 950 to 1100/kW, it was still profitable because the IRR was above the
interest rate. Meanwhile, above USD 1100/kW, it was no longer profitable because the
IRR was under the base interest rate. In this study, the investment cost, which was the
base case, was USD 950/kWh.
Table 13. NPV, B/C ratio, and IRR with investment cost variation.
Investment Cost
(USD/kWh) 950 1100 1250 1400 1550 1650
NPV (USD) 48,846 44,681 40,515 36,350 32,184 29,407
B/C ratio 1.16 1.15 1.13 1.12 1.10 1.09
IRR (%) 9.72 8.64 7.62 6.67 5.76 5.18
The solid fuel that used for gasification was oil palm frond and oil palm trunk.
When compared for the two fuels, as shown in Table 14, oil palm trunk resulted in a
higher NPV and IRR, which means that it was profitable to use oil palm trunk as fuel. The
cost for oil palm trunk was $0.025/kg, while oil palm frond was $0.026/kg. The difference
was because the oil palm frond requires additional harvesting costs for each period while
the palm trunk does not. However, the use of oil palm frond and oil palm trunk is still
profitable. The difference is only in the profit margin. However, the price for diesel fuel
was a maximum at $0.47/L or the price of subsidies from the government, so that IRR was
above 8%.
Table 14. IRR with Variation of Diesel Fuel and Solid Fuel Price.
Diesel Fuel Price (USD/L) (0.40) (0.47) (0.55) (0.62) (0.69)
Oil palm trunk (USD/kg) 0.025 12.77 9.95 7.04 4.00 0.74
Oil palm Frond (USD/kg) 0.026 12.55 9.72 6.80 3.75 0.47
The effect of diesel fuel price and the interest rate on IRR was also analyzed, and the
results are presented in Table 15. The diesel fuel price used as the base case was the price
of a subsidy. If there was an increase in the price of subsidies, the investment remains
-9
-4
1
6
11
16
21
1 2 3 4 5 6 7 8 9 10 11 12 13 14 15 16 17 18 19 20 21
Cas
hfl
ow
(K
US
D)
Plant Life time (year)

Energies 2022, 15, x FOR PEER REVIEW 16 of 23
profitable, as long as the maximum price of diesel fuel is $0.47/L, with a maximum in-
terest rate of 9%. This power plant was calculated to implement small villages with low
to medium economic levels, and electricity was not used for extensive commercial activ-
ities. Thus, it was possible to use diesel fuel at a subsidized price as long as the price was
no more than the maximum price above. If the price and interest rate were to exceed, the
IRR value was under the base case of interest rate. The existence of subsidies from the
government is very influential on the benefits to be obtained from a power plant project.
In addition, the subsidy policy can also attract investors to make investments [8,41,43].
Table 15. IRR with variations in the diesel fuel price and interest rate.
Diesel Fuel Price (USD/L) 0.40 0.47 0.55 0.62 0.69
Interest rate
7% 13.60 10.75 7.80 4.72 1.41
8% 12.55 9.72 6.80 3.75 0.47
9% 11.52 8.71 5.82 2.80 (0.45)
10% 10.50 7.73 4.86 1.86 (1.36)
11% 9.51 6.76 3.92 0.94 (2.25)
12% 8.53 5.80 2.99 0.04 (3.12)
The effect of feed-in tariffs on the NPV, B/C Ratio, and IRR was analyzed, and the
results are presented in Table 16. The simulation results of the feed-in tariff was below
the base case of USD 0.12/kWh, the IRR was under the base case of interest rate. Thus, if
there was a decrease in feed-in tariffs from the government under the base case, invest-
ment in power plants does not provide optimal benefits. Based on the pattern of in-
creasing feed tariffs in Indonesia to date, it always increases over a specified period.
Thus, the feed-in tariff can be assumed not to reduce return of investment period because
the value continues to increase. However, decreases were still possible depending on
changes in subsidies and political decisions.
Table 16. NPV, B/C Ratio, and IRR with variations of the feed in tariff.
Feed in Tariff
(USD/kWh) 0.102 1.110 0.117 0.124 0.131
NPV (USD) (4581) 16,371 37,323 58,275 79,227
B/C Ratio 0.98 1.05 1.13 1.20 1.27
IRR (%) (1.04) 3.48 7.57 11.44 15.18
3.6.2. Financial Risk Analysis
Financial risk assessment was carried out to evaluate the effect of economic param-
eters on investment risk. The risk analysis of the power plant project was carried out
using Crystal Ball software®. This software was chosen because of the ease of operation,
and it is compatible with MS Excel® [45]. Another advantage, was that various types of
data distribution can be chosen according to needs. The simulation was conducted with
1,000,000 iterations. The Monte Carlo method was used for the risk analysis as it calcu-
lates with the technique of statistical sampling, operates with random input components,
and has uncertainty [25]. The input variable was simulated with several iterations and
produced several data in the form of probabilities. The normal probability distribution
was used. The selection of a probability distribution model in the Monte Carlo analysis
was essential because it affects the accuracy of the simulation results [43,46,47]. In addi-
tion, the number of iterations must also be adjusted to obtain convergence. With a greater
number of iterations, the mean and standard deviation will be evenly distributed.
The risk analysis was carried out to look at the effect of capital cost, O & M cost, and
revenue on NPV, IRR, and the B/C Ratio. They were assumed with a probability of 90%
using a normal distribution and a standard deviation of 1% from the base case. Figures 6–

Energies 2022, 15, x FOR PEER REVIEW 17 of 23
8 show the forecast capital cost, O&M cost, and revenue. The results of the risk analysis
are shown with a 90% confidence level and a 10% failure rate [25] that over the past 20
years, the NPV range obtained was from USD 41,833 to 55,861. NPV was estimated to
have an increase of 49.94% from the base case during the operating period of the plant,
which means the power plant project can provide benefits to investors.
Meanwhile, the IRR with a 90% probability obtained between 8.40% and 11.04%,
which means it was still higher than the interest rate. The percentage of IRR higher than
the base case was 50.02%, and the percentage of IRR higher than the interest rate was
98.42%. B/C ratio forecast with 90% probability was obtained from 1.14% to 1.19% and
had a percentage greater than the base case of 60.28%. Based on the results of the risk
analysis, the probability of investment risk was relatively small because the NPV was
always positive, and the IRR had the higher base case interest rate. Besides, with a 50%
chance of NPV above the base case, results were very promising for investors because the
estimated profits obtained during the operating life of the power plant were higher.
Figure 6. Effect of capital costs, O&M costs, and revenue on IRR.
Figure 7. Effect of capital costs, O&M cost, and revenue on the B/C ratio.

Energies 2022, 15, x FOR PEER REVIEW 18 of 23
Figure 8. Effect of capital costs, O&M cost, and revenue on net present value.
Based on the risk analysis of components that affect NPV, 68% of the most signifi-
cant influence was investment cost, while capital cost and revenue were the remainders.
Thus, if the investor can control and reduce investment costs, then it was possible to ob-
tain higher profits. The investment component that was possible to be reduced was the
capital cost of the gasification system. The investment cost was 74.4%, as shown in Figure
9. The gasification system used was foreign-made or made with imported products.
Considering the pilot-scale development experience that has been done, it was possible
to produce gasification systems independently so that investment costs can be reduced.
Figure 9. Sensitivity analysis of the investment cost components.
Furthermore, to determine the type of fuel that was able to produce the largest kWh
with low risk, standard deviation analysis was used. The analysis can provide infor-

Energies 2022, 15, x FOR PEER REVIEW 19 of 23
mation in the form of the types of raw materials used to produce electricity with the
smallest deviation. The mechanism for calculating investment risk from the standard
deviation was carried out by comparing the three fuels used to produce electrical energy,
namely, palm fronds, empty fruit bunch, and oil palm trunks.
Table 17 shows a comparison of the three types of fuel used to generate electricity.
Fuel derived from oil palm waste was categorized based on the type of waste tested
through mechanization so that it was able to generate electricity from renewable energy
fuel. The results of the analysis show that the type of fuel from the palm fronds had the
lowest standard deviation value and the rupiah value of the frond waste was cheaper
than other types of oil palm waste. The results of these calculations show that the small-
est risk for producing electricity comes from EBT fuel, which comes from the type of
palm frond waste at a price of 0.0259 USD/Kg and was able to generate electricity worth
0.0259 USD/kWh.
Table 17. Standard deviation analysis.
No Production Cost Oil Palm
Frond
Empty Fruit
Bunch
Oil Palm
Trunk
1 Biomass feedstock (USD/kg) 0.0259 0.0275 0.0254
2 Biodiesel (USD/L) 0.3107 0.3107 0.3107
3 System utility (USD/kWh) 0.0558 0.0558 0.0558
4 Staff and operator salary (USD/kWh) 0.0456 0.0456 0.0456
5 Maintenance (USD/kWh) 0.0003 0.0003 0.0003
6 Yearly capital cost (USD/kWh) 0.0099 0.0099 0.0099
7 Total 0.4483 0.4498 0.4478
8 Electric production (KW/day) 839 865 784
9 Feedstock consumption (kg/h) 49.55 51.06 46.33
10 Standard deviation (SD) 2.758 2.773 2.763
11 Electric price (Rp/kWh) 0.0259 0.0275 0.0254
3.7. Socio-Environment Impact Analysis
Inside the Industrial Revolutions 4.0 era, access to electricity is one of the primary
needs of everyday life both in urban and rural areas. The implementation of power
plants, especially in rural areas, has the aim of improving the socio-economic life of the
community. Social influence is expected to be felt in the long term, such as the ability to
read, study, and obtain information, and the addition of skills so that it can open oppor-
tunities for people to be more creative and innovative in developing their ability to face
the vicious cycle of poverty.
Positive influences from an economic perspective can increase people’s income and
create many new businesses. Socio-cultural changes are marked by changes in lifestyle
that are widely adopted from television shows, including in terms of daily lifestyle. Other
changes include an increase in school performance and better health and awareness in
protecting the environment and safety. The negative influence that must be watched is
the fading of local cultural values, such as cooperation, and consumer culture, seen from
the adoption of television shows and other media.
Before the gasification power plant was implemented, the majority of the village
community’s work was as farmers and farm laborers, whereas after the power plant,
many residents left their jobs in the agricultural sector. They turned to the productive
sector that uses electricity as an energy source to produce products. The economy, which
had previously relied on agriculture, then relied on services and industry. The presence
of power plants was proven to recruit labor so that unemployment was reduced. One
factor was the new employment opportunities presented for residents. The employment

Energies 2022, 15, x FOR PEER REVIEW 20 of 23
opportunities included food and beverage, document services, boarding, and rented
houses, lodging, and other service sectors.
The community around the power plant area was directed to obtain additional in-
come apart from agricultural products. The electricity provided by gasification power
plants has a positive impact on the community’s economy. The community has new
business opportunities including in the fisheries and trade sectors. If this gasification
power plant was built in a coastal area that has biomass potential, the community was
also facilitated by making boreholes so that sufficient water was available, and the es-
tablishment of a fish auction place.
Viewed from an environmental aspect, the implementation of power plants will
have an impact on the environment, starting from the construction process to the opera-
tion. Impacts that occur are possibly both temporary and permanent. The construction of
power plants involves the use of land or space inside or on the surface of the land, the use
of water resources, and the most influential environment was the presence of pollution to
the air and water. The indicators and parameters of the environmental quality index can
be seen in Table 18.
Table 18. Indicators and Parameters of the Environmental Quality Index in 2019 [48].
No. Indicators Parameters Weight
1. River water
quality
TSS
30%
DO
BOD
COD
Total Phosphate
Fecal Coliform
Total Coliform
2. Air quality SO2
30% NO2
3. Quality of
land
cover area of forest cover, shrubs and swamp shrubs lo-
cates in forest areas and protected function areas (river
borders, lakes and beaches, slopes > 25%) green open
spaces, botanical gardens and biodiversity parks
40%
The construction of a power plant that utilizes green land will disrupt vegetation
and also affect the wildlife that exists in the environment. Flue gas produced from the
combustion of diesel engines will cause an increase in air temperature around the power
plant, in addition to the combustion product in the form of CO2 , which causes pollution
or contributes to the emission of greenhouse gases. Water used as a syngas cooler before
it is used on a diesel engine will reduce the water supply around the plant, both for sur-
face and underground water. After the water is used, it becomes wastewater and needs to
be disposed of in the environment. With wastewater disposal, the temperature of the
waste will be higher than the average temperature, and the most dangerous impact is the
pollutants contained in the water, which can cause environmental damage. Therefore,
before wastewater is discharged, it is necessary to treat it first. In addition to liquid waste,
solid waste in the form of ash from gasification is also produced from power plants. The
handling of solid waste must be managed so that it does not have a negative impact.
Furthermore, the level of noise and vibration around the project site will increase; during
plant operations this condition also continues to occur.
4. Conclusions
The Prototype of Gasification with multi-stage downdraft gasifier technology with a
capacity of 10 kW has been developed on a laboratory scale. Furthermore, the result was
Comment [M5]: Please confirm
if you have got the copyright to
use the table.
Comment [ARS6]: I confirmed

Energies 2022, 15, x FOR PEER REVIEW 21 of 23
technically and economically feasible as a commercial alternative power plant on a small
scale of 100 kW. The economic analysis indicated that the power plant will have an NPV
of USD 48,846 with an IRR of 9.72%. The payback period was achieved at six years for the
required investment costs of USD 56,143. The availability of fuel i.e., oil palm plantation
waste in the form of oil palm frond and oil palm trunk was sufficient throughout the year
so that it can continue to be used as long as the price was no more than USD 0.026/kg, as
well as diesel fuel with a maximum price of USD 0.47/L. All investment costs can be re-
turned following the payback period if the plant can operate at least 355 days/year. Risk
analysis was also carried out by considering the uncertainty of economic conditions that
can affect changes in capital cost, operation and maintenance costs, and increases or de-
creases in revenue. The result, with a probability of 90%, NPV obtained USD 41.833–5.861
with a percentage of 49.94% above the base case was achieved. Meanwhile, IRR was ob-
tained between 8.40% and 11.04%.
In terms of social aspects, the existence of power plant in rural areas was considered
to increase people’s income and create many new businesses. The existence of a power
plant employs the surrounding community. The continuous supply of electrical energy
opens up business opportunities, both micro and medium, that utilize electrical energy as
the primary energy sources. However, adverse environmental impacts must not be ig-
nored from the construction stage to the operation of the power plant. The construction
of power plants must refer to rules that have been issued by the government in order to
maintain an environmental balance.
Author Contributions: Conceptualization, A.R.S. and J.A.P.; methodology, J.I.; software, A.R.S.;
validation, J.I., B.S. and J.A.P.; data curation, E.N.J.; writing—original draft preparation, A.R.S.;
writing—review and editing, J.A.P.; visualization, A.R.S.; supervision, B.S.; funding acquisition, J.I.
All authors have read and agreed to the published version of the manuscript.
Funding: This research received no external funding.
Institutional Review Board Statement: Not applicable
Informed Consent Statement: Not applicable
Data Availability Statement: The data used in this paper were provided by the experimental data
from The Combustion and Energy System Laboratory, Sepuluh Nopember Institute of Technology
Conflicts of Interest: The authors declare no conflict of interest.
Abbreviations
ASTM American Society for Testing and Material
B/C Benefit to Cost Ratio
ER Equivalent Ratio
AR Air Ratio
IDR Indonesian Rupiah
IRR Internal Rate of Return
IRENA International Renewable Energy Agency
LHV Low Heating Value
LCOE Leverage Cost of Electricity
NPV Net Present Value
POME Palm Oil Milk Effluent
O&M Operation and Maintenance
PBP Payback Period
Nomenclature
N Number of period (year)
y Year
Cy Cash inflow in year (USD)

Energies 2022, 15, x FOR PEER REVIEW 22 of 23
i Interest rate (%)
S Standard Deviation
Reference
1. Kementrian Energi dan Sumber Daya Mineral (ESDM). Rasio Elektrifikasi Indonesia Status Juni-2017. 2017. Available online:
https://www.esdm.go.id/assets/media/content/content-rasio-elektrifikasi-indonesia-status-juni-2017.pdf (accessed on 7 De-
cember 2021). 2. Kamperidou, V.; Terzopoulou, P. Anaerobic digestion of lignocellulosic waste materials. Sustainability (Switz.) 2021, 13, 12810.
https://doi.org/10.3390/su132212810.
3. Public Relation Minister of Energy and Mineral Resources. Strategic Policy for the Utilization of EBT, Based on Productivity
and Innovation. December 2019. Available online:
https://ebtke.esdm.go.id/post/2019/12/18/2432/kebijakan.strategis.pemanfaatan.ebt.berbasis.produktivitas.dan.inovasi (ac-
cessed on 13 January 2022).
4. Wicaksono, P.E. Pembangkit Listrik Bertenaga Limbah Sawit Ada di Desa Ini. 2014. Available online:
http://bisnis.liputan6.com/read/2105888/pembangkit-listrik-bertenaga-limbah-sawit-ada-di-desa-ini (accessed on 10 December
2021).
5. Rachmad, S. Pemerintah Tetapkan Harga Baru Listrik Biomassa dan Biogas. 2014. Available online:
http://industri.bisnis.com/read/20141022/44/266967/pemerintah-tetapkan-harga-baru-listrik-biomassa-dan-biogas (accessed on
7 December 2021).
6. Direktorat, J.; Energi, E. B. T. dan Konservasi, E. Kementerian, and S. D. Energi, Mineral, Investment Guidelines Bioenergy In Indonesia. 2016.
Accessed: Dec. 28, 2021. [Online]. Available: https://drive.esdm.go.id/wl/?id=6JLd3yXfSsPqRp2xExLrQe3TUzdIahpS&mode=list&download=1
7. Wijono, A. Environmental Mapping and Assessment the Potential of Palm Oil as a Renewable Energy Source in Indonesia. In National Symposium RAPI XII-2013 FT UMS; 2013; pp. 1–67.
8. Shuit, S.H.; Tan, K.T.; Lee, K.T.; Kamaruddin, A.H. Oil palm biomass as a sustainable energy source: A Malaysian case study. Energy 2009, 34, 1225–1235. https://doi.org/10.1016/j.energy.2009.05.008.
9. Mekbib, S.; Anwar, S.; Yusup, S. Syngas production from downdraft gasi fi cation of oil palm fronds. Energy 2013, 61, 491–501.
https://doi.org/10.1016/j.energy.2013.09.039.
10. Nudri, N.A.; Bachmann, R.T.; Ghani, W.A.W.A.K.; Sum, D.N.K.; Azni, A.A. Characterization of oil palm trunk biocoal and its suitability for solid fuel applications. Biomass Convers. Biorefinery 2020, 10, 45–55. https://doi.org/10.1007/s13399-019-00419-z.
11. Douglas, S.; Anne, C.; Erik, M.; Meine, v.N.; Joanne, G.; Jacqui, Su.; Karah, W.; Markku, K. The Impacts and Opportunities of Oil
Palm in Southeast Asia: What Do We Know and What Do We Need to Know?; Center for International Forestry Research 2009.
https://doi.org/10.17528/cifor/002792. 12. Arena, U. Process and technological aspects of municipal solid waste gasification. A review. Waste Manag. 2012, 32, 625–639.
https://doi.org/10.1016/j.wasman.2011.09.025. 13. Basu, P. Biomass Gasification and Pyrolysis Handbook; Academic Press 2010. https://doi.org/10.1016/B978-0-12-374988-8.00001-5.
14. Molino, A.; Chianese, S.; Musmarra, D. Biomass gasification technology: The state of the art overview. J. Energy Chem. 2016, 25,
10–25. https://doi.org/10.1016/j.jechem.2015.11.005.
15. Krzywanski, J.; Fan, H.; Feng, Y.; Shaikh, A.R.; Fang, M.; Wang, Q. Genetic algorithms and neural networks in optimization of sorbent enhanced H2 production in FB and CFB gasifiers. Energy Convers. Manag. 2018, 171, 1651–1661.
https://doi.org/10.1016/j.enconman.2018.06.098.
16. Erlich, C.; Fransson, T.H. Downdraft gasification of pellets made of wood, palm-oil residues respective bagasse: Experimental study. Appl. Energy 2011, 88, 899–908. https://doi.org/10.1016/j.apenergy.2010.08.028.
17. Jaojaruek, K.; Jarungthammachote, S.; Gratuito, M.K.B.; Wongsuwan, H.; Homhual, S. Experimental study of wood downdraft
gasification for an improved producer gas quality through an innovative two-stage air and premixed air/gas supply approach. Bioresour. Technol. 2011, 102, 4834–4840. https://doi.org/10.1016/j.biortech.2010.12.024.
18. Saleh, A.R.; Sudarmanta, B.; Fansuri, H.; Muraza, O. Improved Municipal Solid Waste Gasification Efficiency Using a Modified Downdraft Gasifier with Variations of Air Input and Preheated Air Temperature. Energy Fuels 2019, 33, 11049–11056.
https://doi.org/10.1021/acs.energyfuels.9b02486.
19. Susastriawan, A.A.P.; Saptoadi, H.; Purnom. Small-scale downdraft gasifiers for biomass gasification: A review. Renew. Sustain.
Energy Rev. 2017, 76, 989–1003. https://doi.org/10.1016/j.rser.2017.03.112.
20. Saleh, A.R.; Sudarmanta, B.; Fansuri, H.; Muraza, O. Syngas production from municipal solid waste with a reduced tar yield by
three-stages of air inlet to a downdraft gasifier. Fuel 2020, 263, 116509. https://doi.org/10.1016/j.fuel.2019.116509.
21. Romaniuk, W.; Savinykh, P.A.; Borek, K.; Plotnikowa, Y.A.; Palitsyn, A.V.; Korotkov, A.N.; Roman, K.; Roman, M. Improve-ment of gas generator technology for energy processing of agricultural waste. Energies 2021, 14, 3642.
https://doi.org/10.3390/en14123642.
22. All Power Lab. Affordable • Portable • On-Demand Carbon-Negative EnergY From Biomass-Powered Gensets. 2016. Availa-
ble online: www.allpowerlabs.com (accessed on 9 December 2021).
23. Cardoso, J.; Silva, V.; Eusébio, D. Techno-economic analysis of a biomass gasification power plant dealing with forestry resi-dues blends for electricity production in Portugal. J. Clean. Prod. 2019, 212, 741–753. https://doi.org/10.1016/j.jclepro.2018.12.054.

Energies 2022, 15, x FOR PEER REVIEW 23 of 23
24. Situmorang, Y.A.; Zhao, Z.; Yoshida, A.; Abudula, A.; Guan, G. Small-scale biomass gasification systems for power generation (<200 kW class): A review. Renew. Sustain. Energy Rev. 2020, 117, 109486. Elsevier Ltd, Jan. 01.
https://doi.org/10.1016/j.rser.2019.109486.
25. Porcu, A.; Sollai, S.; Marotto, D.; Mureddu, M.; Ferrara, F.; Pettinau, A. Techno-economic analysis of a small-scale bio-
mass-to-energy BFB gasification-based system. Energies 2019, 12, 494. https://doi.org/10.3390/en12030494.
26. Sobamowo, G.M.; Ojolo, S.J. Techno-Economic Analysis of Biomass Energy Utilization through Gasification Technology for Sustainable Energy Production and Economic Development in Nigeria. J. Energy 2018, 2018, 1–16.
https://doi.org/10.1155/2018/4860252.
27. Jozami, E.; Porstmann, J.C.; Shocron, A.; Feldman, S. Techno-economic Assessment of Biomass Gasification of Spartina argen-tinensis. Agrociencia Urug. 2017, 21, 78–88. https://doi.org/10.2477/vol21iss1pp78-88.
28. G. Calì, P. Deiana, E. Maggio, C. Bassano, S. Meloni, and S. SpA, “2018 9th International Freiberg Conference 9th International
Freiberg Conference. Techno-Economic Analysis of Syngas and Electric Power Production in FOAK Industrial Gasification
Plant fed by Biomass and Agro-industrial Residues,” Berlin 3-8 June, 2018. Accessed: Dec. 30, 2021. [Online]. Available:
https://tu-freiberg.de/en/fakult4/iec/evt/techno-economic-analysis-of-syngas-and-electric-power-production-in-foak-industrial
-
29. Kivumbi, B.; Olwa, J.; Martin, A.; Menya, E. Techno-economic assessment of municipal solid waste gasification for electricity generation: A case study of Kampala City, Uganda. Agric. Eng. Int. CIGR J. 2015, 17, 141–155.
30. Gökalp, I.; Kaya, O.; Keçecioglu, S.; Boden, D. A Techno-Economic Feasibility Analysis of the Gasification of Used Tires for Energy Generation in Turkey. Detritus 2019, 7, 68–75. https://doi.org/10.31025/2611-4135/2019.13843.
31. Saleh, A.R.; Sudarmanta, B. Experimental investigation on multi-stage downdraft gasification: Influence of air ratio and
equivalent ratio to the gasifier performance. In Proceedings of the AIP Conference Proceedings, 2018; Volume 1983. Surabaya,
Indonesia, 5–6 October 2017. https://doi.org/10.1063/1.5046222.
32. Sudarmanta, B.; Gafur, A.; Saleh, A.R.; Dwiyantoro, B.A.; Sampurn. The effect of two stage gasifying agent on biomass
downdraft gasification to the gasifier performance. In Proceedings of the AIP Conference Proceedings, 2018; Volume 1983.
Surabaya, Indonesia, 5–6 October 2017. https://doi.org/10.1063/1.5046233.
33. Daouk, E.; van de Steene, L.; Paviet, F.; Martin, E.; Valette, J.; Salvador, S. Oxidative pyrolysis of wood chips and of wood pel-lets in a downdraft continuous fixed bed reactor. Fuel 2017, 196, 408–418. https://doi.org/10.1016/j.fuel.2017.02.012.
34. Li, D.; Briens, C.; Berruti, F. Oxidative pyrolysis of kraft lignin in a bubbling fluidized bed reactor with air. Biomass Bioenergy
2015, 76, 96–107. https://doi.org/10.1016/j.biombioe.2015.03.007.
35. Milhé, M.; van de Steene, L.; Haube, M.; Commandré, J.M.; Fassinou, W.F.; Flamant, G. Autothermal and allothermal pyrolysis in a continuous fixed bed reactor. J. Anal. Appl. Pyrolysis 2013, 103, 102–111. https://doi.org/10.1016/j.jaap.2013.03.011.
36. Shi, H.; Si, W.; Li, X. The concept, design and performance of a novel rotary kiln type air-staged biomass gasifier. Energies 2016,
9, 67. https://doi.org/10.3390/en9020067.
37. El-Hendawy, A.N.A. Variation in the FTIR spectra of a biomass under impregnation, carbonization and oxidation conditions. J.
Anal. Appl. Pyrolysis 2006, 75, 159–166. https://doi.org/10.1016/j.jaap.2005.05.004.
38. El-Hendawy, A.N.A. Surface and adsorptive properties of carbons prepared from biomass. Appl. Surf. Sci. 2005, 252, 287–295.
https://doi.org/10.1016/j.apsusc.2004.11.092. 39. Brandt, P.; Larsen, E.; Henriksen, U. High Tar Reduction in a Two Stage Gasifier Brant. Energy Fuels 2000, 14, 816–819.
40. Harahap, F.; Leduc, S.; Mesfun, S.; Khatiwada, D.; Kraxner, F.; Silveira, S. Opportunities to optimize the palm oil supply chain in Sumatra, Indonesia. Energies 2019, 12, 420. https://doi.org/10.3390/en12030420.
41. IRENA International Renewable Energy Agency. Renewable Power Generation Costs in 2017; International Renewable Energy
Agency (IRENA) 2018. Abu Dabi United Arab Emirates. https://doi.org/10.1007/SpringerReference_7300.
42. Ltd. DONGFENG CUMMINS ENGINE Co. Cummins engine datasheet. 2007. Accessed: Dec. 28, 2021. [Online]. Available:
http://file.anugrahdiesel.co.id/6bt5_9_3000_rpm-dde81-3035_649.pdf
43. Pereira, E.J.d.; Pinho, J.T.; Galhardo, M.A.B.; Macêdo, W.N. Methodology of risk analysis by Monte Carlo Method applied to power generation with renewable energy. Renew. Energy 2014, 69, 347–355. https://doi.org/10.1016/j.renene.2014.03.054.
44. Oracle Corporation. The Decision Table. 2017. Accessed: Dec. 28, 2021. [Online]. Available:
https://www.oracle.com/technetwork/middleware/crystalball/overview/decision-table-tool-130028.pdf 45. Oracle Corporation. The Crystal Ball Charts: Sensitivity. 2017. Accessed: Dec. 28, 2021. [Online]. Available:
https://www.oracle.com/technetwork/middleware/crystalball/overview/sensitivity-chart-128074.pdf 46. Owens, G. Best Practices Guide : Economic & Financial Evaluation of Renewable Energy Projects. US Agency Int. Dev. 2002, 1,
1–50.
47. Khindanova, I. A Monte Carlo Model of a Wind Power Generation Investment. J. Appl. Bus. Econ. 2013, 15, 94–106.
48. Kementrian Lingkungan Hidup dan Kehutanan, Indeks Kualitas Lingkungan Hidup, 1st ed., vol. 1. Jakarta: Kementrian
Lingkungan Hidup dan kehutanan, 2020; p. 1-112
Comment [ARS7]: I confirmed
to use this reference and
deleted once. All of the
reference number in the text
have been updated.

5/13/22, 3:02 PM Email Universitas Tidar - [Energies] Manuscript ID: energies-1520840; doi: 10.3390/en15051782. – Promotion Tips
https://mail.google.com/mail/u/0/?ik=2b096d038c&view=pt&search=all&permthid=thread-f%3A1726001462151855132&simpl=msg-f%3A1726001462… 1/2
arif rahman saleh <[email protected]>
[Energies] Manuscript ID: energies-1520840; doi: 10.3390/en15051782. – PromotionTips 1 pesan
[email protected] <[email protected]> 28 Februari 2022 17.14Balas Ke: [email protected]: [email protected], [email protected], [email protected], [email protected],[email protected]: [email protected], [email protected]
Dear Authors,
Congratulations! Your manuscript has been published in Energies.
Thank you for choosing our journal. Your article is already available, open access, to everyone free of charge via the journal website. Promoting your work is an important part of the post-publication process which will increase the visibility, impact and citation of your work. We encourage you to promote and share your article widely.
We have some tips about what you can do to promote your article here: https://www.mdpi.com/authors/promoting
To promote discoverability, views and downloads, you can:
(1) Social Media - Share your article on various social networks, such as Facebook, LinkedIn, Mendeley and Twitter by clicking the link on the webpage of your article. Tagging @MDPIOpenAccess as well as key people in your field might lead to retweets: Your publication may become viral on social media! - Send a short text (up to 200 characters) to the MDPI assistant editor who was your contact for the publication of your manuscript, who will then post it on the journal Twitter account. - Write a blog post to explain the meaning and possible outcomes of your research. This will lead to higher engagement of your research community. Ask your institution or society to post your paper on their social media accounts and to include a story about your paper in their newsletters.
(2) Link Share - Share the article link directly with colleagues and peers in your field. - Add a link to your article in your email signature. - Update your personal and institutional websites by adding the title of your article and a link to it.
(3) Academic Research-sharing Platforms - Set up your profile on academic research-sharing platforms, such as SciProfiles, ResearchGate, Academia.edu or Google Scholar, and add a short summary of your article. - Register an ORCID author identifier and add the article information to your profile. - Deposit your article in repositories (such as those run by your university) to make your research more discoverable.
(4) Conferences - Present your publication at conferences in the form of a presentation or a poster. You may participate in conferences relevant for your field organized by MDPI on Sciforum.net.

5/13/22, 3:02 PM Email Universitas Tidar - [Energies] Manuscript ID: energies-1520840; doi: 10.3390/en15051782. – Promotion Tips
https://mail.google.com/mail/u/0/?ik=2b096d038c&view=pt&search=all&permthid=thread-f%3A1726001462151855132&simpl=msg-f%3A1726001462… 2/2
Please keep up with any journal updates and news via our twitter account (https://twitter.com/energies_mdpi)or LinkedIn page (https://www.linkedin.com/company/energies-mdpi/). Find out more about MDPI on our website: https://www.mdpi.com/about.
Keep in touch!
Kind regards, Energies Editorial Office St. Alban-Anlage 66, 4052 Basel, Postfach, CH-4020 Basel, Switzerland Tel.: +41 61 683 77 34; Fax: +41 61 302 89 18 E-Mail: [email protected] https://www.mdpi.com/journal/energies/
------------------------------------------------------------------------ Disclaimer: MDPI recognizes the importance of data privacy and protection. We treat personal data in line with the General Data Protection Regulation (GDPR) and with what the community expects of us. The information contained in this message is confidential and intended solely for the use of the individual or entity to whom they are addressed. If you have received this message in error, please notify me and delete this message from your system. You may not copy this message in its entirety or in part, or disclose its contents to anyone.

5/13/22, 3:01 PM Email Universitas Tidar - [Energies] Manuscript ID: energies-1520840; doi: 10.3390/en15051782. Paper has been published.
https://mail.google.com/mail/u/0/?ik=2b096d038c&view=pt&search=all&permthid=thread-f%3A1726001469962617217&simpl=msg-f%3A1726001469… 1/2
arif rahman saleh <[email protected]>
[Energies] Manuscript ID: energies-1520840; doi: 10.3390/en15051782. Paper hasbeen published.1 pesan
[email protected] <[email protected]> 28 Februari 2022 17.14Balas Ke: [email protected], [email protected]: [email protected], [email protected], [email protected], [email protected],[email protected]: [email protected], [email protected], [email protected], [email protected], [email protected]
Dear Authors,
We are pleased to inform you that your article "Micro-Grid Oil Palm Plantation Waste Gasification Power Plant in Indonesia: Techno-Economic and Socio-Environmental Analysis" has been published in Energies and is available online:
Abstract: https://www.mdpi.com/1996-1073/15/5/1782 PDF Version: https://www.mdpi.com/1996-1073/15/5/1782/pdf The meta data of your article, the manuscript files and a publication certificate are available here (only available to corresponding authors after login): https://susy.mdpi.com/user/manuscripts/review_info/7a41453be7c4d6da9937655248c2f5ca
Please take a moment to check that everything is correct. You can reply to this email if there is a problem. If any errors are noticed, please note that all authors must follow MDPI's policy on updating published papers, found here: https://www.mdpi.com/ethics#16.
To encourage open scientific discussions and increase the visibility of published articles, MDPI recently implemented interactive commenting and recommendation functionalities on all article webpages (side bar on the right). We encourage you to forward the article link to your colleagues and peers.
We encourage you to set up your profile at www.SciProfiles.com, MDPI’s researcher network platform. Articles you publish with MDPI will be linked to your SciProfiles page, where colleagues and peers will be able to see all of your publications, citations, as well as your other academic contributions. Please also feel free to send us feedback on the platform that we can improve it quickly and make it useful for scientific communities.
You can also share the paper on various social networks by clicking the links on the article webpage. Alternatively, our Editorial Office can post an announcement of your article on our Twitter channel, please send us a text of up to 200 characters with spaces. Please note that our service Scitations.net will automatically notify authors cited in your article. For further paper promotion guidelines, please refer to the following link: https://www.mdpi.com/authors/promoting.
We would be happy to keep you updated about new issue releases of energies. Please enter your e-mail address in the box at https://www.mdpi.com/journal/energies/toc-alert/ to receive notifications. After issue release, a version of your paper including the issue cover will be available to download from the article abstract page.
To order high quality reprints of your article in quantities of 25-1000, visit: https://www.mdpi.com/1996-1073/15/5/1782/reprints

5/13/22, 3:01 PM Email Universitas Tidar - [Energies] Manuscript ID: energies-1520840; doi: 10.3390/en15051782. Paper has been published.
https://mail.google.com/mail/u/0/?ik=2b096d038c&view=pt&search=all&permthid=thread-f%3A1726001469962617217&simpl=msg-f%3A1726001469… 2/2
We support the multidisciplinary preprint platform /Preprints/, which permanently archives full text documents and datasets of working papers in all subject areas. Posting on the platform is entirely free of charge, and full details can be viewed at http://www.preprints.org.
We are dedicated to providing an outstanding publishing service, and we invite you to complete our author satisfaction survey https://www.surveymonkey.com/r/authorfeedbackmdpi. The survey contains 20 short questions and will only take a couple of minutes to complete.
To help us improve our English editing service, provided as part of MDPI’s editorial process, please take a few minutes to participate in the following survey: https://www.surveymonkey.com/r/DCNXBW7 (for English editing service).
Thank you for choosing Energies to publish your work, we look forward to receiving further contributions from your research group in the future.
Kind regards,
-- MDPI Postfach, CH - 4020 Basel, Switzerland Office: St. Alban-Anlage 66, 4052 Basel, Switzerland Tel. +41 61 683 77 34 Fax: +41 61 302 89 18 E-mail: [email protected] https://www.mdpi.com/