
Kaleidoscope Academic Conference Proceedings 2020 - ITU
240
ITUPublications Kaleidoscope Academic Conference Proceedings 2020 International Telecommunication Union
-
Upload
khangminh22 -
Category
Documents
-
view
1 -
download
0
Transcript of Kaleidoscope Academic Conference Proceedings 2020 - ITU

ITUPublications
Kaleidoscope Academic ConferenceProceedings2020
International Telecommunication Union


Organized bySupported byTechnically co-sponsored by
Proceedings
ITUKALEIDOSCOPEONLINE 2020
12TH ITU ACADEMIC CONFERENCE
Industry-driven digital transformation
7-11 DecemberONLINE

ISBN:
978-92-61-31391-3 (electronic version)
Disclaimer
The opinions expressed in these Proceedings are those of the paper authors and do not necessarily reflect the views
of the International telecommunication Union or of its membership.
ITU 2020
All rights reserved. No part of this publication may be reproduced, by any means whatsoever, without the prior
written permission of ITU.

– i –
Foreword
Chaesub Lee Director ITU Telecommunication Standardization Bureau
The ITU Kaleidoscope academic conference has gained a reputation for providing an in-depth discussion on matters relevant to the ITU membership. This year, Kaleidoscope 2020: Industry-driven digital transformation provided a forward-looking perspective on the future developments of digital transformation in the manufacturing sector. Kaleidoscope is ITU’s flagship academic event. Now in its twelfth edition, the conference supports productive dialogue between academics and standardization experts. This year, for the first time, Kaleidoscope was held as a fully online conference welcoming participants from around the world from 7 to 11 December 2020. The research presented at this conference highlighted innovations in fields such as cyber-physical systems, digital twins, virtual simulation, augmented reality, immersive technologies, artificial intelligence and machine learning, and 5G/6G telecommunication, uncovering how these innovations all contribute to digital transformation of industrial processes, and also analysing their social and economic impacts. The adoption of new technologies in the manufacturing industry ushers in endless possibilities for the automotive, retail, agriculture, tourism, energy and healthcare sectors. With the reality of COVID-19 and its global impact, the special panel on The role of ICT for future pandemics highlighted how we can harness future technologies and interoperability to strengthen healthcare systems and provide people-centred care going forward. The engaging discussions during the conference also aided in the understanding of how ITU’s work on standardization can advance the digitization of industry. I would like to express my great appreciation to the Kaleidoscope community and the larger ITU Academia membership for their enduring support to this series of conferences. With over 160 academic and research institutes now members of ITU, the Kaleidoscope series is certain to continue growing in strength. My sincerest thanks go to our technical co-sponsors, the Institute of Electrical and Electronics Engineers (IEEE), the IEEE Communications Society (IEEE ComSoc) and to our supporter, the IEEE Technology and Engineering Management Society (IEEE TEMS). I would also like to thank our academic partners and longstanding ITU members, Waseda University, the Institute of Image Electronics Engineers of Japan (I.I.E.E.J.), the Institute of Electronics, Information and Communication Engineers (IEICE) of Japan, the Chair of Communication and Distributed Systems at RWTH Aachen University, the European Academy for Standardization (EURAS), as well as the University of the Basque Country and the Liverpool John Moores University.

– ii –
I would especially like to thank the members of the Kaleidoscope 2020 Technical Programme Committee (TPC) and the members of our Steering Committee: Andy Chen, IEEE TEMS; Christoph Dosch, IRT GmbH; Kai Jacobs, RWTH Aachen University; Mitsuji Matsumoto, Professor Emeritus Waseda University; Roberto Minerva, Télécom SudParis; Gyu Myuong Lee, John Moores Liverpool University; Eva Ibarrola, University of the Basque Country and Mostafa Hashem Sherif, USA who also serves as the TPC Chair.
Chaesub Lee Director
ITU Telecommunication Standardization Bureau

– iii –
Technical Programme Committee Chair's message
Mostafa Hashem Sherif, Ph.D
Technical Programme Committee Chair
The focus of the ITU Kaleidoscope 2020 academic conference is the Industry-driven digital
transformation.
The Fourth Industrial Revolution – also known as Industry 4.0 – is the digital transformation of
industrial processes using smart technologies. Accordingly, machine-to-machine communication
(M2M) and the internet of things (IoT) are integrated into manufacturing and industrial practices to
design smart machines that can collaborate to organize production processes, diagnose problems and
take corrective actions with minimum human intervention. Many assorted engineering disciplines are
needed. While communication technologies and protocols are fundamental in this aspect, many
emerging engineering disciplines have important roles as well. Some of these emerging disciplines
are data analytics, robotics, cyber-physical systems, digital twins, virtual simulation and augmented
reality.
Kaleidoscope 2020 was originally scheduled for 7-9 September 2020 in Hanoi, Viet Nam, in
conjunction with the ITU Digital World 2020. However, due to the Covid-19 pandemic, it was
switched to an online conference from 7 to 11 December 2020 running around 3 1/2 hours per day to
accommodate the various time zones. The organizing committee took advantage of drastic change
both in venue and in the schedule to experiment with new ideas. For example, a video demonstration
track was added to offer a means to share ongoing projects with an on-line audience. Also, virtual
coffee breaks were included in the programme to encourage socialization among the participants.
As Chair of the Technical Programme Committee, I would therefore like to acknowledge the work
of those involved in preparing this conference over the last few months. In particular, I would like to
thank the members of the Steering Committee and the various reviewers for their effort in selecting
the papers in the programme and in identifying those that can be considered for awards. As seen from
the programme, twenty original, high-quality research papers were retained from a total of 42
submissions, which all underwent a double-blind peer-review process supported by 68 international
experts.
The Steering Committee was very successful in selecting outstanding keynote speakers and inviting
authors to cover additional aspects of the digital transformation and their relation to standards. Also,
to learn from the Covid-19 experience, one special panel was organized on the role of ICT and the
digital transformation in health care.
Per agreement with the IEEE, selected papers from this year’s Kaleidoscope conference will be
considered for publication in a special-feature section of IEEE Communications Standards Magazine.
In addition, special issues of the International Journal of Technology Marketing (IJTMKT), the
International Journal of IT Standards and Standardization Research (IJITSR) and the Journal of ICT
Standardization may publish extended versions of selected Kaleidoscope papers.

– iv –
All papers accepted and presented at the conference will be submitted for inclusion in the IEEE
Xplore Digital Library. The Conference Proceedings from 2009 onwards can be downloaded free of
charge from http://itu-kaleidoscope.org.
I would like to thank our technical co-sponsors, supportive partners and the ITU team lead by Alessia
Magliarditi and including Emer Windsor, Erica Campilongo and Simiso Dlodlo, as well as Gent
Bajrami from the ITU-T Operations and Planning Department, for their role in organizing this
conference under vary challenging circumstances as well as proposing fresh ideas to ensure the
continued success of the Kaleidoscope series of academic conferences.
Mostafa Hashem Sherif
Chair, TPC

– v –
TABLE OF CONTENTS
Page
Foreword ............................................................................................................................................. i
Technical Programme Committee Chair's message ............................................................................. iii
Committees ........................................................................................................................................... ix
Keynote Summaries
An accelerated digital transformation, courtesy of the recent pandemic
Roberto Saracco, Future Directions Committee - IEEE, Italy ................................................. xv
Beyond 5G/6G telecommunications ensuring continuity in business, research and education
Akihiro Nakao, Special Advisor to the President and Vice Dean of the Interfaculty Initiative
in Information Studies, Graduate School of Interdisciplinary Information Studies,
University of Tokyo, Japan ...................................................................................................... xix
Keynote Papers
Service-based architectures in production systems
Thomas Kuhn; Frank Schnicke and Pablo Oliveira Antonino, Fraunhofer Institute IESE,
Germany ................................................................................................................................... xxiii
Industrial transformation and the digital revolution: A focus on artificial intelligence, data
science and data engineering
Adam T. Drobot, Chairman, OpenTechWorks, Inc. and Past Chairman of the IEEE IoT
Initiative, USA .......................................................................................................................... xxxi
Invited Paper
A case study for modeling machine tool systems using standard representations
Maja Bärring; Guodong Shao; Moneer Helu; Björn Johansson ............................................. xlv
Session 1: The path towards digital transformation
S1.1 Toward a typology of "going digital"
Cheng Gong; Vincent Ribiere ................................................................................... 1
S1.2 Analysis on the social and economic impacts of Internet platforms
Anqi Zheng ................................................................................................................ 9
S1.3 5G Healthcare applications in Covid-19 prevention and control
Haiying Ren; Jianfeng Shen; Xiaoyong Tang; Tianyi Feng ..................................... 15
– vi –
Session 2: Design principles, architecture and protocols for the digital transformation
S2.1 Lightweight and instant access technologies and protocols to boost digital
transformations
Yihua Ma; Zhifeng Yuan; Weimin Li; Zhigang Li .................................................... 21
S2.2 Automation of computational resource control of cyber-physical systems with
machine learning*
Ved P. Kafle; Abu Hena Al Muktadir ....................................................................... 27
Session 3: Wireless infrastructure and digital transformation
S3.1 Digital transformation via 5G: Deployment plans*
Abolfazl Zakeri; Narges Gholipoor; Mohsen Tajallifar; Sina Ebrahimi;
Mohammad Reza Javan; Nader Mokari; Ahmad R. Sharafat .................................. 37
S3.2 Flexible multiplexing mechanism for coexistence of URLLC and eMBB services
in 5G networks*
Kai Xiao; Xing Liu; Xianghui Han; Peng Hao; Junfeng Zhang; Dong Zhou;
Xingguang Wei .......................................................................................................... 45
S3.3 Wireless technology and protocol for IIoT and digital twins
Jie Tan; Xiubin Sha; Bo Dai; Ting Lu ...................................................................... 55
Session 4: Digital transformation in daily life
S4.1 A technique for extracting the intention of messengers in social media
Mohamed Fazil Mohamed Firdhous; Balakrishnan Nalin Prashanth ..................... 65
S4.2 Towards a digital process platform for future construction sites
Hans Aoyang Zhou; Aymen Gannouni; Thomas Otte; Jonas Odenthal;
Anas Abdelrazeq; Frank Hees .................................................................................. 73
Session 5: Augmented reality and tourism
S5.1 An immersive mobile application for improved learning and virtual tour
experience: A nature reserve perspective
Carmenita Oersen; Ruchen Wyngaard; Lebogang Nkabinde .................................. 83
S5.2 Self-guided virtual tour using augmented reality
Aphile Kondlo; Andre Henney; Antoine Bagula; Olasupo Ajayi;
Laurenda Van Breda ................................................................................................. 91
Session 6: Immersive technologies in farming
S6.1 Immersive technologies for development: An analysis of agriculture
Omowunmi Isafiade; Ofentse Mabiletsa ................................................................... 99
S6.2 Immersive interactive technology: A case study of a wine farm
Ofentse Mabiletsa; Omowunmi Isafiade; Sarel J. Viljoen; Jason Farrell;
Lwando Ngqwemla ................................................................................................... 107
– vii –
Session 7: AI, machine learning and digital transformation
S7.1 AI-based W-band suspicious object detection system for moving persons using
GAN: Solutions, performance evaluation and standardization activities*
Yutaka Katsuyama; Keping Yu; San Hlaing Myint; Toshio Sato; Zheng Wen;
Xin Qi ........................................................................................................................ 117
S7.2 An AI-based optimization of handover strategy in non-terrestrial networks*
Chenchen Zhang; Nan Zhang; Wei Cao; Kaibo Tian; Zhen Yang ........................... 125
S7.3 BSR: A balanced framework for single image super resolution
Dehui Kong; Fang Zhu; Yang Wei; Song Jianjun; Zhu Tongtong; Bengang Lou;
Ke Xu ........................................................................................................................ 131
Session 8: Security in industrial applications
S8.1 PERT: Payload encoding representation from transformer for encrypted traffic
classification
Hong Ye He; Zhi Guo Yang; Xiang Ning Chen ........................................................ 143
S8.2 Visual action recognition using deep learning in video surveillance systems
Dhananjay Kumar; Priyanka T; Aishwarya Murugesh; Ved P. Kafle ..................... 151
S8.3 STCCS: Segmented time controlled count-min sketch
Ismail Khram; Maha Shamseddine; Wassim Itani ................................................... 159
Abstracts ............................................................................................................................................. 167
Index of Authors ................................................................................................................................... 177


COMMITTEES

– x –
Steering Committee
• Andy Chen, Catronic Enterprise & REDDS Capital, Canada and IEEE TEMS, Canada • Christoph Dosch, ITU-R Study Group 6 Vice-Chairman; IRT GmbH, Germany • Eva Ibarrola, University of the Basque Country, Spain • Kai Jakobs, RWTH Aachen University, Germany • Gyu Myoung Lee, Liverpool John Moores University, UK • Mitsuji Matsumoto, Waseda University Emeritus Professor, Japan • Roberto Minerva, Télécom SudParis, France • Mostafa Hashem Sherif, Consultant, USA
Secretariat
• Alessia Magliarditi, ITU Kaleidoscope Coordinator • Emer Windsor, Executive Assistant • Erica Campilongo, Collaborator • Nolwandle Simiso Dlodlo, Collaborator • Pascal Borde, Promotional support

– xi –
Technical Programme Committee
• Mostafa Hashem Sherif, Consultant, USA
• Marco Ajmone Marsan, Politecnico di Torino & IMDEA Networks, Italy • Abdelkader Aljerme, Oregon State University, USA • Eyhab Al-Masri, University of Washington, USA • Mohamed-Slim Alouini, King Abdullah University of Science and Technology, Saudi Arabia • Shahzad Ashraf, Hohai University Changzhou Jiangsu, China • Antoine Bagula, University of the Western Cape, South Africa • Fangxun Bao, Shandong University, China • Paolo Bellavista, University of Bologna, Italy • Zakaria Benomar, University of Messina, Italy • Agathe Blaise, UPMC Sorbonne Université, France • Rodrigo C. Bortoletto, São Paulo Federal Institute of Education, Science and Technology, Brasil • V. Michael Bove, Consultant, USA • Dario Bruneo, University of Messina, Italy • Marcelo Carvalho, University of Brasília, Brazil • Hongki Cha, Electronics and Telecommunications Research Institute, Korea • Kejia Chen, Nanjing University of Posts and Telecommunications, China • Giovanni Cicceri, University of Messina, Italy • Antonio Corradi, University of Bologna & CIRI ICT, Italy • Fabrizio De Vita, University of Messina, Italy • Mike DiFrancisco, Virginia Tech Applied Research Corp. & Virginia Tech, USA • Christoph Dosch, ITU-R Study Group 6 Vice-Chairman; IRT GmbH, Germany • Xu Du, Rice University, USA • Vladislav Fomin, Vytautas Magnus University, Lithuania • Ivan Ganchev, University of Limerick, Ireland and University of Plovdiv "Paisii Hilendarski",
Bulgaria • Joan Garcia-Haro, Technical University of Cartagena, Spain • Katja Gilly, Miguel Hernandez University, Spain • Ian Graham, University of Edinburgh, UK • Maria de los Milagros Gutierrez, Universidad Tecnológica Nacional Facultad Regional Santa Fe,
Argentina • Marianne Hörlesberger, AIT Austrian Institute of Technology GmbH, Austria • Eva Ibarrola, University of the Basque Country, Spain • Kai Jakobs, RWTH Aachen University, Germany • Pita Jarupunphol, Phuket Rajabhat University, Thailand • Oliver Jung, AIT Austrian Institute of Technology GmbH, Austria • Ved P. Kafle, National Institute of Information and Communications Technology, Japan • Tim Kelly, World Bank, USA • Dimitar Radkov Kolev, National Institute of Information and Communications Technology, Japan

– xii –
• Katarzyna Kosek-Szott, AGH University of Science and Technology, Poland • Dhananjay Kumar, Anna University, India • Andreas Kunz, Lenovo, Germany • Tsung-Ting Kuo, University of California San Diego, USA • Gyu Myoung Lee, Liverpool John Moores University, UK • Luigi Logrippo, Université du Québec en Outaouais, Canada • Mitsuji Matsumoto, Waseda University Emeritus Professor, Japan • Arturas Medeisis, Spectrum Jazz UAB, Saudi Arabia • Ahmed Mikaeil, Shanghai Jiao Tong University, China • Yoshitoshi Murata, Iwate Prefectural University, Japan • Kazuhide Nakajima, NTT Corporation, Japan • James Nyarko, Northwestern Polytechnical University, China • Tien Dat Pham, National Institute of Information and Communications Technology, Japan • Antonio Puliafito, University of Messina, Italy • Anna Riccioni, Municipality of Reggio Emilia, Italy • Ignacio Rodriguez, University of Murcia, Spain • Domenico Rotondi, FINCONS SpA, Italy • Mihoko Sakurai, International University of Japan, Japan • Jesus Sanchez-Gomez, University of Murcia, Spain • Stefano Secci, CNAM, France • Minrui Shi, China Telecom Technology Research Institute & Chain Telecom, China • Antonio Fernando Skarmeta Gomez, University of Murcia, Spain • Jian Song, Tsinghua University & Beijing National Research Center for Information Science and
Technology, China • Vijay N. Sontakke, Intel Corp, USA • Duncan Sparrell, sFractal Consulting, USA • Christian Timmerer, Alpen-Adria-Universität Klagenfurt, Austria • Valerio Torti, LUISS University of Rome, Italy • Elias Tragos, NUI Galway and FORTH, Ireland • Nguyen Truong, Imperial College London, UK • Taavi Valdlo, Estonian IT Standardization Technical Committee, Estonia • Yunfeng Zhang, Shandong University of Finance and Economics, China

KEYNOTE SUMMARIES


– xv –
AN ACCELERATED DIGITAL TRANSFORMATION, COURTESY OF THE RECENT PANDEMIC
Roberto Saracco
Future Directions Committee - IEEE, Italy
The recent pandemic has forced many industries to shift a significant portion of their business to cyberspace. Of course it has been much more than this, with people getting acquainted with using cyberspace and their new everyday reality. This, in a way, has been even more significant, because it has contributed to a change of habits and culture. In Italy, as an example, the government has tried for almost a decade to convince people to acquire a digital identity known as the Sistema Pubblico di Identità Digitale, SPID, which is certified by the state and which allows them to access a variety of e-government services. The results have been discouraging. Over several years just 4 million people (out of 60 million) obtained their SPID and a small number of these used it so rarely that in many cases it expired. Because of the lockdown and the need to be authenticated online to access services (and, most crucially, to get subsidies covering the loss of income) there has been a large adoption of SPID, with a 100% increase in just two weeks. It was not just about people being forced to do so, it was also about people choosing the online options over the world of atoms. e-Commerce has increased many folds with people choosing to provision everything from groceries to masks online. Hence, overall we saw an "unexpected" success in terms of people and activities that moved to cyberspace in a matter of days. Another important aspect was the fact that industries and people could shift to cyberspace. To me this was thanks to two main factors:
• the pervasiveness and capacity of the telecommunication infrastructure • the availability of terminals (smartphones, crucial for the layperson, and laptops which were
indispensable for workers) and the fact that they were already part of people’s habits. The telecommunication infrastructure proved to be extremely resilient and capable of accommodating the sharp increase in traffic. In Italy, the traffic grew in just a few days by 80% and then stabilized (actually we are seeing now a slight decrease, mostly due to the fact that people are using the infrastructure for work and less for Netflix). Looking at the Italian traffic, mobile communications grew by 30% (peak 44%), instant messaging doubled, video communications increased by 8 times, streaming 50% (peak 89%). At the same time the network operators were able to double their backbone capacity and increase their PoP and content servers in a matter of a few days. TIM, one of the Italian Operators added 4Tbps of capacity. It was clear from the traffic usage and content access that the last mile didn’t have a problem (where it was available!) At the same time it became clear the importance of having VDSL/FTTH and the disadvantage for people living in areas not yet covered). The problems were on the backbones (but they were promptly upgraded) and on the servers (here the problems took a longer time to be addressed). Also, there was an increased usage of the big cloud providers, Amazon, Google, IBM, and Microsoft, that saw not just additional demand but also were asked to take over the storage and

– xvi –
processing that before was managed by private, small clouds. It was clear that in the data center area "size" matters. At the same time, we have experienced shortcomings with many industries and workers longing for a prompt return to the "old times". The problem is that whilst many activities can be moved to cyberspace and people can work almost as efficiently (some more, some less) in cyberspace, industry processes are defined and optimized for the physical world. Hence, they were not adequate/fitting for cyberspace. From the workers’ side the loss of direct human contact proved, in some cases, a source of frustration. What also became clear was that digital transformation is not a godsend for everybody. People working from home are saving on transportation costs; they have more time, and prepare lunch at home. The implication is that transportation providers have seen their services plummeting as they have an infrastructure that was optimized for a given amount of traffic that and so immediately they start losing (lots of) money. There is no need to point out that airlines would have gone bankrupt without state support (and a few went bankrupt anyway, and probably more will follow). Urban transportation immediately went in the red and stayed there even when the lockdown was lifted since social distancing does not match well with public transportation and people turned to their own means. The fear of contracting the virus that was instilled by health institutions lingers and it will take time before people feel safe to mingle with one another. In several urban areas, day restaurants whose core business is in feeding people at lunch breaks saw their customers disappear. In Milan, the mayor decided that on 1 September 2020 all public servants that so far have been working from home had to resume working at the office as that would bring them back to the old lunch habits of eating on the road. The above refers to the events of the last six months (slightly different time windows applying to different countries), so we can now take a step back and reflect on what happened and try to guess what will happen over the next few years. A lesson learnt is that industry can use cyberspace as a patch in dire situations. In spite of several issues, business continued thanks to cyberspace. However, it also became clear that this was not a digital transformation. Most companies did not embark in a rethinking of their processes to take advantage of cyberspace. It became clear that managing people at the office is different from managing people at home. In what might seem as a paradox, people felt much more controlled when working from home than at the office. Their every "click" could be monitored, something that was not done at the office where a "macro" monitoring approach (clock in - clock out) was usually adopted. As mentioned before, quite a few workers miss the "working place", the contact with other workers, the organization supporting them in case of any problems, the relative quietness of their work place when compared to a home full of noise and disturbances. Speaking to a number of CEOs I got the same point over and over: "We are in cyberspace but we keep operating as if we were at the bricks and mortar office". This, in some cases turned out to be less efficient (no surprise since processes have been designed for bricks and mortar) and far away from reaping the benefits of cyberspace. Also notable, in some cases where security processes that were designed to operate in a controlled environment these did not meet the need of an open environment. It is well known that physical security is a must (you can have all security in place with network and software but if you cannot control people, your security measures are moot).

– xvii –
This remains today a major issue and we can expect to see many companies roll back to the old ways of doing business. On the other hand, a few will embrace the new way. In the long term, the latter will gain, likely, a competitive advantage but, of course, it remains to be seen if the transition period can be sustained. Technologies, particularly network infrastructures and (big) clouds have demonstrated they can scale gracefully. Other technologies, like AR and VR have shown their potential, as well as their immaturity. Videoconferencing has grown exponentially and a few businesses have tried out virtual spaces (like iFrame) but they still look more like gadgets than the real thing. What has been seen is that in many cases videoconferencing has shifted to audio conferencing since many people did not the video stream additionally beneficial. At the same time, people in sales have suffered from the lack of face-to-face contact, clearly indicating that current videoconferencing is not as effective (quite far off as a matter of fact) from a face-to-face interaction with the client. This is a space where, potentially, VR can play a role. It is not going to be easy, nor fast. We are still suffering from a lack of devices that could support seamless interaction. The Digital Reality Initiative run by the Future Direction Committee of the IEEE is trying to walk the talk and experimenting with VR for their meetings, events and conferences. Some sectors, like healthcare have adopted (at least partially) the Digital Transformation and in these areas it is likely to be irreversible. Remote diagnostics and prescriptions are growing and both patients and doctors are becoming familiar with them. Not every consultation is moving to cyberspace but triage and 90% of consultations can. Companies offering telemedicine have seen their customer base increasing by 400% in just three months and the value of their shares have grown accordingly. This is stimulating further investment so we may expect the strong uptake to continue in the coming years. Education is also another sector that has moved to cyberspace during lockdown and that is now continuing, particularly in the case of college and university education. Here we are getting mixed signals. Educators are not overjoyed by the new normal; students are showing a preference for the human touch that can only be felt by face-to-face education. At the same time both are recognizing that a mix of online and in-class education can be better than just in-class education so we can expect that part of the changes experienced will stay. Finally, the pandemic clearly demonstrates that living our lives and having business in cyberspace is feasible. Now, it is a matter of finding the right mix of the two, which results in economic and social rewards. The shift to cyberspace clearly impacts many aspects of today’s world. Take the case of Milan, Italy, where teleworking and tele-education has resulted in vacancies in hotels and rental houses/rooms. As of September 2020, vacancies are 270% greater than occupancy, i.e. for any room occupied you have some three empty rooms. This results in a fall of rental prices, and is obviously strongly hitting the economy. Unfortunately, the money saved by people who are teleworking from home is also money not earned, as jobs have shrunk and wages decreased. Clearly this is a transient situation but it shows some aspects of DX and its impact on market value. In normal conditions this would result in a shift from impacted market to new markets, now it just looks like a recession. We have seen that DX, even in the best possible cases, brings up issues by displacing jobs and obsoleting skills. It renders some atom-based resources, like some workplaces, as no longer needed, or valuable. This, in the medium term, can impact urban infrastructures, such as transportation. The conclusion, at least to me, is that DX is no longer a theory, it is something that can be done. The big question is how to do it.


– xix –
BEYOND 5G/6G TELECOMMUNICATIONS ENSURING CONTINUITY IN
BUSINESS, RESEARCH AND EDUCATION
Akihiro Nakao
Special Advisor to the President and Vice Dean of the Interfaculty Initiative in Information Studies,
Graduate School of Interdisciplinary Information Studies, University of Tokyo, Japan
Teleworking such as teleconferencing and remote education has been recognized as a new normal
activity in response to the COVID-19 pandemic that has occurred simultaneously around the world
and has instantaneously suspended our social activities. The misfortune of this has made us re-
recognize the need for enhancing and upgrading information communication infrastructure into a
more robust one. The activity accounts for one of the SDGs, SDG 9, that is to build resilient
infrastructure, promote inclusive and sustainable industrialization and foster innovation.
With the spread of COVID-19, the biggest challenge is how to ensure continuity in our social
activities, especially business, research and education.
We posit that revolutionary progress in research and development and standardization in
communication infrastructure be a necessity for the next decade, as it should play a significant role
in ensuring the continuity of our social activities.
On the one hand, commercial 5G services have been globally deployed and utilized all over the world.
On the other hand, research and development strategies aiming at 6G are already in progress. In Japan,
5G services started in the spring of 2020 and the discussions on 6G were initiated in January 2020.
In June 2020, the strategic proposal for 6G R&D has been summarized by the "Beyond 5G Strategic
Board" held by the Ministry of Internal Affairs and Communications. Also, several counties have
allocated white space to private 5G usage, and which is open to non-telecommunication companies
so that they can operate their own customized 5G networks. We believe that this “democratization”
(making something accessible to anyone) will open a door to the innovations towards 6G.
We observe that besides the regular migration path from 5G to 6G promoted by telecommunication
operators and vendors, there is another evolution path possible, from private 5G to private 6G and
then to public 6G. This is because a lot more stakeholders may participate in the game of developing
customized solutions tailored for their real use cases that may be eventually adopted as viable 6G
technologies to be standardized.
For instance, not only industries but also academia should be able to define new communication
technologies for 6G in their development and operations of private networks.
We believe that in the course of developing 6G by “democratization of telecommunications” we may
further develop new ways of utilizing telecommunications to ensure social life continuity, e.g. to live
with COVID-19.
This keynote presentation introduces perspectives towards 6G especially focusing on the
democratization of telecommunications, and discusses how to cope with planetary scale issues, such
as the COVID-19 pandemic, from the stand point of the role that future telecommunications should
play.


KEYNOTE PAPERS


SERVICE-BASED ARCHITECTURES IN PRODUCTION SYSTEMS: CHALLENGES, SOLUTIONS & EXPERIENCES
Thomas Kuhn, Frank Schnicke, Pablo Oliveira Antonino
Fraunhofer Institute IESE, Kaiserslautern, Germany
ABSTRACT
The automation industry is undergoing many changes. The fourth industrial revolution (Industrie 4.0) is the answer to changing markets and increasing quality requirements. Customers demand individualized products and smaller lot sizes. This requires the end-to-end digitalization of manufacturing processes and raises the need for system architectures for next-generation automation systems. Within the context of the national reference project BaSys 4, we researched a service-based architecture for the automation domain and integrated it with ongoing standardization activities. Service-oriented Architecture (SoA) is a proven architecture pattern from the domain of IT systems. It propagates reusable services that are orchestrated to create scalable applications. Our SoA is based on the concept of asset administration shells that realize digital twins, which are digital representations of production assets with unified interfaces that enable access to asset services and data. We explain and discuss realization concepts for digital twins, and illustrate our experiences with the transfer of the service-based architecture principle to the automation industry within the context of selected Industrie 4.0 use cases. We highlight solution approaches for the efficient realization of lot size 1 production as well as for creating digital twins of production assets, and discuss levels of Industrie 4.0 maturity.
Keywords – Automation, digitalization, Industrie 4.0, SoA
1. INTRODUCTION
Past industrial revolutions were triggered by the availability of a technology. They yielded significant changes in production, which resulted in cheaper, mass-produced products and an overall increase in living standards. After industrialization, electrification, and computerization/IT, the current industrial revolution, Industrie 4.0 (I4.0), is the upcoming fourth major change in manufacturing. It has been triggered by the ongoing digitalization and addresses the needs of changeable production in an ever faster changing world.
Industrie 4.0 enables both more efficient and more flexible production. Automation of current production systems is often realized with programmable logic controllers (PLC). PLCs automate repetitive tasks that are executed in cyclic programs. They execute a series of manufacturing steps for each workpiece, like a sequence of milling or drilling operations. PLC controllers were introduced in the 1970s in the third industrial revolution to automate repetitive tasks. Later, additional systems, e.g., robots with their own proprietary operating systems, but also enterprise resource planning (ERP) systems and manufacturing execution systems (MES) were added to improve resource management and enable more flexible production of product variants.
Figure 1 – Automation pyramid
This yielded the automation pyramid (see Figure 1), which resembles the structure of today’s complex production systems. ERP systems at the top manage orders, stock, and production plans. MES systems execute production plans and provide parameters to PLC controllers that connect to sensors and control actuators. SCADA (supervisory control and data acquisition) systems enable process supervision across production cells. These systems use different protocols and proprietary data models. Inter-system
– xxiii –
communication, e.g., for interfacing an ERP system directly with sensors, is challenging and requires significant changes. Changes in production processes, e.g., to introduce a new product variant, require similar changes. Even if a change is local and affects only one production cell, it may cause side effects. Production cycle times may change and might therefore no longer match the cycle time of the process. Furthermore, modern PLCs are networked and provide data to other PLCs. Changes in their programs may cause data to arrive late, which also disturbs the process. The grown and proven system architectures of production processes are therefore not able to fully support the requirements on a changeable production system that can adapt to today’s quickly changing markets.
The fourth industrial revolution is the end-to-end digitalization of production. It is not about the substitution of PLCs or the introduction of new devices, but about new system architectures that enable peer-to-peer communication to support, for example, predictive maintenance, AI-based anomaly analysis in production, and efficient production of small lot sizes. Industrie 4.0 is therefore not about the integration of a single new technology. It is much rather the introduction of new architecture paradigms to enable a more flexible, and a more changeable, production that will yield future competitive advantages.
In the domain of IT systems, Service-oriented Architectures (SoA) decouple systems into independent components and yield both scalable and changeable software systems. In this paper, we describe the application of SoA to production systems. We discuss requirements and Industrie 4.0 challenges, and provide an overview of Industrie 4.0 technology and solutions that support the implementation of SoA principles. We furthermore document our experiences in digitalizing production environments with our open-source Industrie 4.0 Service-oriented Architecture Eclipse BaSyx.
2. I4.0 CHALLENGES AND CONCEPTS
Numerous Industrie 4.0 challenges are currently arising in industry. The Acatech Industrie 4.0 maturity index [1] organizes solutions to these challenges based on the maturity of an organization and outlines the steps required to reach a higher degree. It is based on the degree of digitalization a company has achieved.
2.1 Industrie 4.0 challenges and maturity
The first two steps of the Acatech Industrie 4.0 maturity index are computerization and connectivity. Both are prerequisites for Industrie 4.0 transformation, but not yet part of Industrie 4.0. Computerization covers the automation of repetitive tasks. This is well developed in most manufacturing companies. Connectivity is about the substitution of proprietary field bus systems with standardized networking technologies.
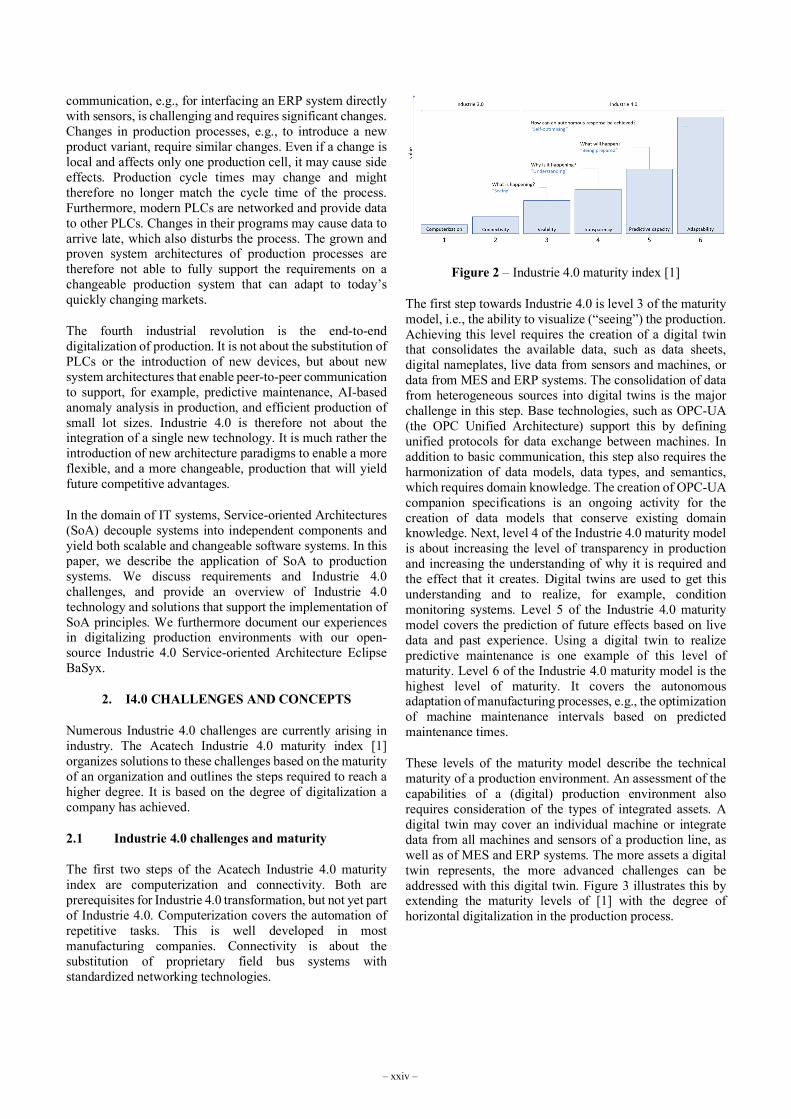
Figure 2 – Industrie 4.0 maturity index [1]
The first step towards Industrie 4.0 is level 3 of the maturity model, i.e., the ability to visualize (“seeing”) the production. Achieving this level requires the creation of a digital twin that consolidates the available data, such as data sheets, digital nameplates, live data from sensors and machines, or data from MES and ERP systems. The consolidation of data from heterogeneous sources into digital twins is the major challenge in this step. Base technologies, such as OPC-UA (the OPC Unified Architecture) support this by defining unified protocols for data exchange between machines. In addition to basic communication, this step also requires the harmonization of data models, data types, and semantics, which requires domain knowledge. The creation of OPC-UA companion specifications is an ongoing activity for the creation of data models that conserve existing domain knowledge. Next, level 4 of the Industrie 4.0 maturity model is about increasing the level of transparency in production and increasing the understanding of why it is required and the effect that it creates. Digital twins are used to get this understanding and to realize, for example, condition monitoring systems. Level 5 of the Industrie 4.0 maturity model covers the prediction of future effects based on live data and past experience. Using a digital twin to realize predictive maintenance is one example of this level of maturity. Level 6 of the Industrie 4.0 maturity model is the highest level of maturity. It covers the autonomous adaptation of manufacturing processes, e.g., the optimization of machine maintenance intervals based on predicted maintenance times.
These levels of the maturity model describe the technical maturity of a production environment. An assessment of the capabilities of a (digital) production environment also requires consideration of the types of integrated assets. A digital twin may cover an individual machine or integrate data from all machines and sensors of a production line, as well as of MES and ERP systems. The more assets a digital twin represents, the more advanced challenges can be addressed with this digital twin. Figure 3 illustrates this by extending the maturity levels of [1] with the degree of horizontal digitalization in the production process.
– xxiv –
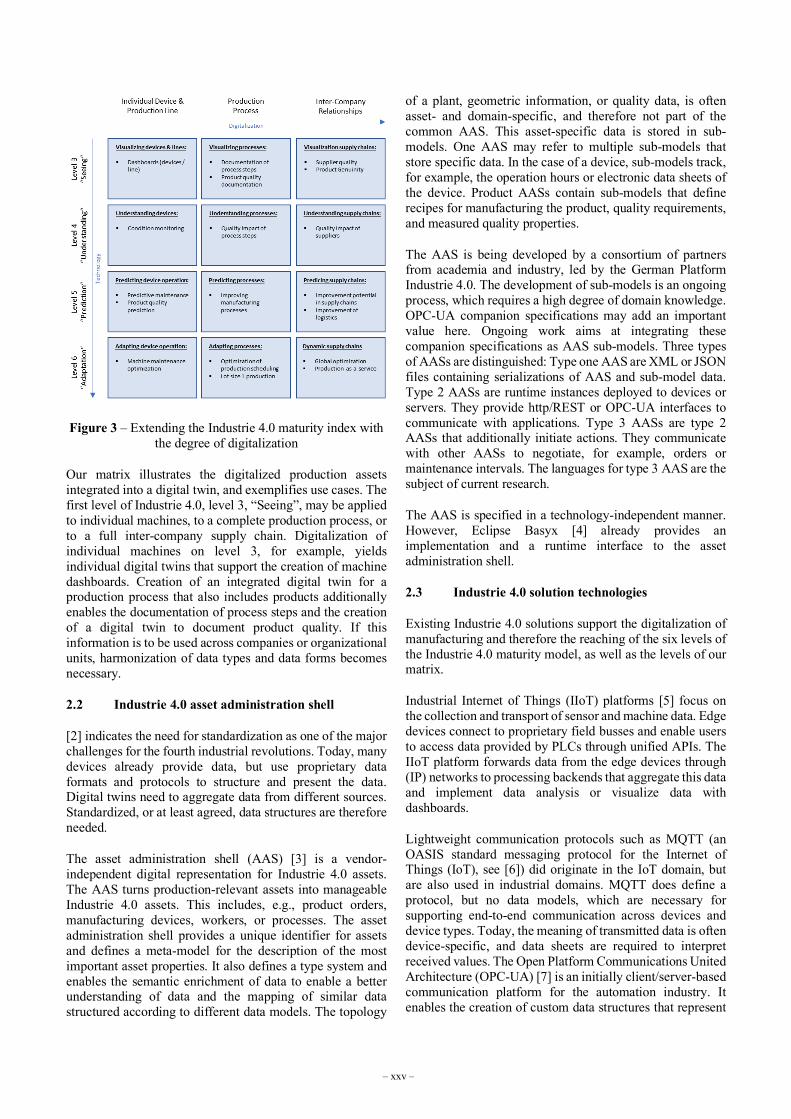
Figure 3 – Extending the Industrie 4.0 maturity index with the degree of digitalization
Our matrix illustrates the digitalized production assets integrated into a digital twin, and exemplifies use cases. The first level of Industrie 4.0, level 3, “Seeing”, may be applied to individual machines, to a complete production process, or to a full inter-company supply chain. Digitalization of individual machines on level 3, for example, yields individual digital twins that support the creation of machine dashboards. Creation of an integrated digital twin for a production process that also includes products additionally enables the documentation of process steps and the creation of a digital twin to document product quality. If this information is to be used across companies or organizational units, harmonization of data types and data forms becomes necessary.
2.2 Industrie 4.0 asset administration shell
[2] indicates the need for standardization as one of the major challenges for the fourth industrial revolutions. Today, many devices already provide data, but use proprietary data formats and protocols to structure and present the data. Digital twins need to aggregate data from different sources. Standardized, or at least agreed, data structures are therefore needed.
The asset administration shell (AAS) [3] is a vendor-independent digital representation for Industrie 4.0 assets. The AAS turns production-relevant assets into manageable Industrie 4.0 assets. This includes, e.g., product orders, manufacturing devices, workers, or processes. The asset administration shell provides a unique identifier for assets and defines a meta-model for the description of the most important asset properties. It also defines a type system and enables the semantic enrichment of data to enable a better understanding of data and the mapping of similar data structured according to different data models. The topology
of a plant, geometric information, or quality data, is often asset- and domain-specific, and therefore not part of the common AAS. This asset-specific data is stored in sub-models. One AAS may refer to multiple sub-models that store specific data. In the case of a device, sub-models track, for example, the operation hours or electronic data sheets of the device. Product AASs contain sub-models that define recipes for manufacturing the product, quality requirements, and measured quality properties.
The AAS is being developed by a consortium of partners from academia and industry, led by the German Platform Industrie 4.0. The development of sub-models is an ongoing process, which requires a high degree of domain knowledge. OPC-UA companion specifications may add an important value here. Ongoing work aims at integrating these companion specifications as AAS sub-models. Three types of AASs are distinguished: Type one AAS are XML or JSON files containing serializations of AAS and sub-model data. Type 2 AASs are runtime instances deployed to devices or servers. They provide http/REST or OPC-UA interfaces to communicate with applications. Type 3 AASs are type 2 AASs that additionally initiate actions. They communicate with other AASs to negotiate, for example, orders or maintenance intervals. The languages for type 3 AAS are the subject of current research.
The AAS is specified in a technology-independent manner. However, Eclipse Basyx [4] already provides an implementation and a runtime interface to the asset administration shell.
2.3 Industrie 4.0 solution technologies
Existing Industrie 4.0 solutions support the digitalization of manufacturing and therefore the reaching of the six levels of the Industrie 4.0 maturity model, as well as the levels of our matrix.
Industrial Internet of Things (IIoT) platforms [5] focus on the collection and transport of sensor and machine data. Edge devices connect to proprietary field busses and enable users to access data provided by PLCs through unified APIs. The IIoT platform forwards data from the edge devices through (IP) networks to processing backends that aggregate this data and implement data analysis or visualize data with dashboards.
Lightweight communication protocols such as MQTT (an OASIS standard messaging protocol for the Internet of Things (IoT), see [6]) did originate in the IoT domain, but are also used in industrial domains. MQTT does define a protocol, but no data models, which are necessary for supporting end-to-end communication across devices and device types. Today, the meaning of transmitted data is often device-specific, and data sheets are required to interpret received values. The Open Platform Communications United Architecture (OPC-UA) [7] is an initially client/server-based communication platform for the automation industry. It enables the creation of custom data structures that represent
– xxv –

complex states, e.g., of manufacturing devices. It furthermore enables the definition and invocation of services. Data and services are provided by servers and are requested by clients. A server organizes all provided data and services data into namespaces. With the OPC-UA pub/sub extension, it became possible to subscribe to individual values within the namespace of a server. Subscribed values are delivered with a lightweight protocol, such as MQTT, which only has low protocol overheads. OPC-UA furthermore develops companion specifications, which provide unified data models for a variety of devices and applications. Together with the Industrie 4.0 asset administration shell, it enables the realization of complex digital twins covering level 3 of the Industrie 4.0 maturity model.
Reaching higher levels of the Industrie 4.0 maturity index requires additional effort. Analysis-centric advancements, such as predictive maintenance, the identification of process and supply chain improvement potential, and condition monitoring, require the inclusion of analysis backends. In this paper, however, we will focus on the ability to adapt production processes, which are also required to reach higher maturity levels.
3. SERVICE-ORIENTED I4.0 ARCHITECTURE
Nowadays, process automation is realized with PLCs. These implement cyclic programs that automate part of a production process, e.g., an individual production cell. The physical connection of production cells yields the overall manufacturing process. The resulting software architecture is a heavily distributed system. Changing the manufacturing process consequently requires manual changing of all PLC programs that are related to that process change, as well as all dependencies. Often these dependencies are not fully known, and also not documented. Process steps may have side effects, e.g., by communicating data to other cells, or by adhering to a specific time frame. Changes in PLC programs may break these dependencies, causing the overall process to malfunction. Complex, grown processes containing a large number of these dependencies are difficult to change because each change requires all dependencies to be fixed. The automation software is therefore a limiting factor for process changes.
SoA is a pattern in software engineering that improves maintainability and changeability for large-scale applications by removing (implicit) dependencies between software components. SoA defines service providers and service users. Service providers offer reusable services. These must not have any dependencies to other services or service providers. Instead, all the information that is necessary to run a service must be provided with the service call. Consequently, all return information is passed back to the caller. Service providers do not maintain an internal state. Therefore, provided services may be used by any number of service users in different contexts, which improves the reusability of services. Service users combine and use services from service providers to create application logic. They are called service orchestrators, and the process of
calling services in a sequence to achieve a behavior is called service orchestration. Only service orchestrators are aware of the application behavior that service calls will create; service providers must not have knowledge of application behavior, and therefore do not depend on a specific application behavior. The explicit interface between service providers and service users is the service interface that defines the information that is provided to services by the orchestrator, and the information that is provided back to the orchestrator from the service provider.
Figure 4 – SoA concept for manufacturing
When transferring the SoA principle to production systems, production devices or complete production cells become service providers. In contrast to current automation architectures, a service provider in an SoA-based production environment has no process knowledge and no knowledge regarding the product that is being manufactured. It provides a set of manufacturing services with optional constraints that define, for example, the required time for a manufacturing step. Service orchestrators implement production processes and orchestrate production services according to a product recipe. Changing a production process involves changing only the orchestration. Therefore, orchestrators may use different recipes for different products, e.g., to create different sets of drilling holes in products to enable them to be mounted to specific product lines. Simple production processes only contain one orchestrator. Complex processes contain several process orchestrators that are hierarchically structured and offer services on different levels of abstraction.
Figure 4 illustrates the architecture of a service-oriented production process created with Eclipse Basyx. Control components control physical devices and implement a unified interface (API) for invoking services. As this is usually a time-critical process, control components are generally implemented on PLCs. Asset administration shells (AAS) implement the digital twins of production assets including devices. An AAS describes the services of a device
– xxvi –
and defines optional additional constraints. Products also have an AAS, which contains, for example, quality metrics. Orders are also represented by an AAS, which contains, for example, information regarding deadlines and the recipe to be used for creating the product. Actual data is contained in AAS sub-models, which define data models for specific kinds of information. The orchestrator accesses the product recipe from the order AAS and orchestrates the services of devices through their control components. Every AAS registers itself in an AAS registry to ensure that it can be found by orchestrators and applications. Applications use AAS and AAS sub-models to access information and services with a unified interface, regardless of the type of information provider.
4. EXPERIENCES WITH SOA
The service-oriented architecture approach is already being used in the context of different production systems. Areas of application include the integration of production with product lifecycle management systems, process visualizations using different types of dashboards, or retrofitting of existing devices and production lines to SOA concepts.
4.1 Changeable production process
We applied SoA in a production line that manufactures gear boxes for heavy cars. The production line consisted of new devices communicating via Ethernet link, but also included older devices with field bus connections or proprietary communication. The goal of this activity was to integrate a new workplace with a smart cordless electronic screwdriver for an additional worker. A new workplace had to be integrated with the existing automation because it needs to receive tasks and deliver quality assurance data. The integration usually takes at least a full day for the necessary software modifications and testing. With a service-oriented architecture, it was possible to integrate the new workplace through its asset administration shells in less than 30 minutes.
In this environment, the SoA approach proved its ability to change an existing production process. As expected, the SOA enabled quick exchange and extension of service providers. However, the basic SoA principle typically only provides syntax interoperability [8], while semantic interoperability is also of immense importance for the domain of manufacturing [9]. Only semantic interoperability ensures that data and orders are properly understood by production assets. This gap is closed with the AAS and its sub-models through its defined structure with explicit support for clear semantics, which allows, e.g., referencing arbitrary standards. However, the service definition might not be trivial. An exposed service should be as complete and simple to use as possible. On the other hand, in the interest of process optimization, exposition of service details may be necessary. In a project for an industry customer, a transport mechanism realized by a robot arm was migrated to SOA. First, a straightforward service definition was used by exposing a transport service. However, this definition was
not time-efficient due to set-up and reset times for the transport robot. Thus, separating the transport service into the steps transportprepare, transportperform, and transportreset allowed the time needed for the execution of the manufacturing to be greatly decreased. Prepare moves the robot arm to the source location, perform performs the transport step, and reset moves the robot arm to a waiting position.
Furthermore, SoA is typically not used in the context of hard real-time constraints. However, direct control of manufacturing devices imposes this requirement. Thus, in the SoA, services need to be defined in such a way that they are independent of real-time constraints. For example, a transport service typically has no hard real-time constraints. In contrast, a direct control service of a motor (e.g., start/stop) will most likely have these constraints.
4.2 Migrating legacy devices
Another topic of interest is the migration of existing manufacturing systems to SoA. In the authors’ experiences, especially small and medium.sized enterprises (SME) need additional support for performing this migration. Typically, an SME does not have the necessary expertise for performing this transformation. A successful implementation of SoA requires strong IT knowledge, which often does not exist. Surprisingly, experience has also shown that some SMEs are also not completely aware of their plant set-up, e.g., of the communication protocols used. The reason for this is that small enterprises, in particular, focus on their core business and contract third parties for plant set-up and device configuration.
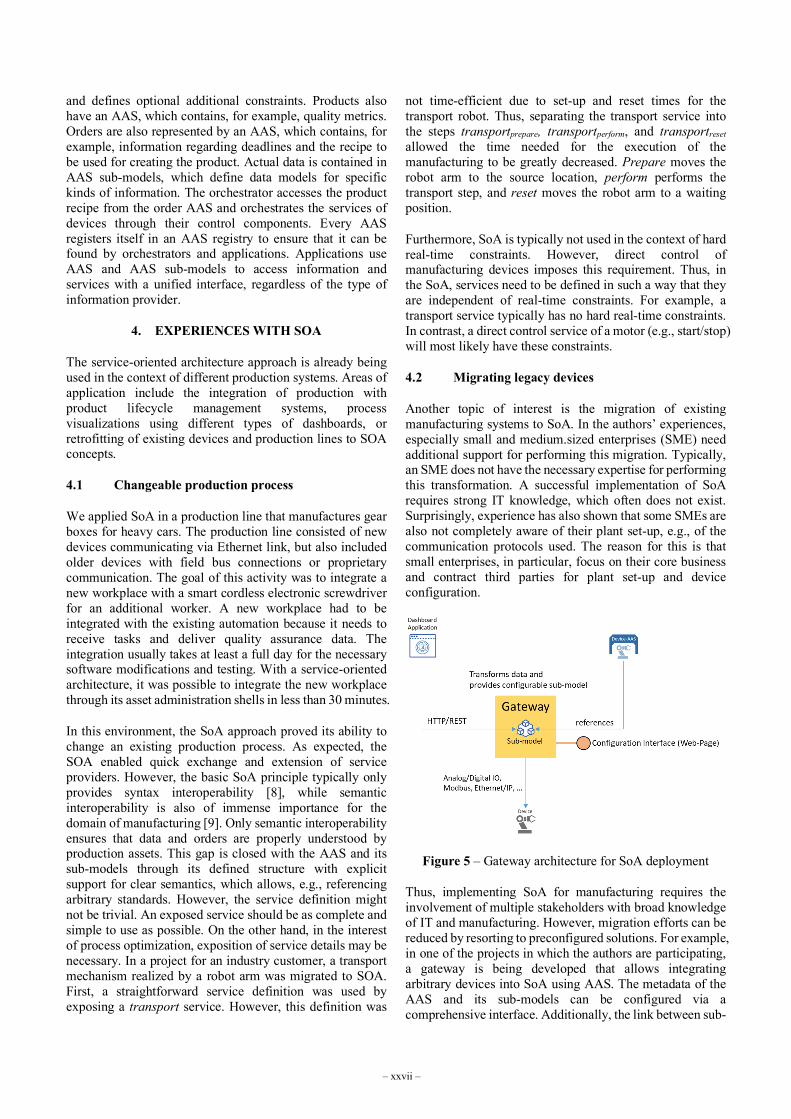
Figure 5 – Gateway architecture for SoA deployment
Thus, implementing SoA for manufacturing requires the involvement of multiple stakeholders with broad knowledge of IT and manufacturing. However, migration efforts can be reduced by resorting to preconfigured solutions. For example, in one of the projects in which the authors are participating, a gateway is being developed that allows integrating arbitrary devices into SoA using AAS. The metadata of the AAS and its sub-models can be configured via a comprehensive interface. Additionally, the link between sub-
– xxvii –

model properties (i.e., data entries) and data sources (e.g., analog inputs, bus telegrams) can be configured as well, as illustrated in Figure 5. In consequence, the integration of legacy devices into Industrie 4.0 environments is significantly sped up. In general, providing off-the-shelf solutions that can be commissioned quickly – ideally with no programming knowledge needed – has proven beneficial for enabling a quick transition to SoA in manufacturing.
4.3 Levels of SOA
Our experiences in different projects have shown that for different partners, different degrees of the implementation of SoA for manufacturing are needed. For some partners, the primary goal was to get an overview of the overall manufacturing process, to collect data, and to display data in a comprehensible way. Here, implementing SoA only for data acquisition has already provided a great benefit. New data sources can be easily integrated into the plant and the dashboard. By utilizing AAS and sub-models, quick integration of devices from the same class (e.g., mills) was made possible. AAS sub-models were defined once and instantiated multiple times, once per device of this class. This common abstraction enabled quick integration into the dashboard. Beyond that, using SoA for the control of manufacturing processes is not desired by all partners. However, by instantiating the concept of SoA and the AAS, the foundation for a fully implemented service-based production has already been laid. Thus, companies can iteratively implement SoA in their plants without the need for a big-bang migration to a service-based production. Instead, small iterations can be carried out, each resulting in a usable SoA system. This illustrates that SoA is an architecture pattern rather than a fixed end-to-end solution. It also illustrates the flexibility that even modern production systems can obtain by implementing SoA principles gradually into production processes.
4.4 SoA issues
The introduction of SoA into automation environments has clear benefits, but also leads to new challenges. SoA is an architecture paradigm that is fundamentally different from the cycle-based software architecture concepts being used today in automation technology. Changing these systems to SoA requires fundamental changes in the software structure as well as additional software components (for example, a service registry) that need to be deployed. Another challenge are the timing requirements in the automation domain. Classic SoA systems have only soft real-time requirements or no real-time requirements at all. Production systems commonly have hard real-time requirements. Transporting heavy workpieces over a multi-segment conveyor belt requires timely interaction of adjacent segments when the workpiece passes the segment border in order to prevent physical damage in engines. Fulfilling these requirements calls for new design approaches and real-time communication to address these aspects. These issues are usually solved by applying the existing cycle-based field bus communication for a few isolated, critical control functions.
Due to their advantages with respect to flexibility and scalability, Service-oriented Architectures have major potential in the production industry. They will become an important architecture pattern for the realization of large-scale, flexible next-generation production systems. Today however, experiences and guidelines regarding SoA in industry are limited. It will take more experiences to incorporate the SoA principle into the automation industry.
5. RELATED WORK
This section provides a brief overview of existing architecture concepts and SoA approaches for Industrie 4.0. Many existing approaches are not tailored to the production domain. Instead, they target the Internet of Things (IoT), with production systems being one application domain. A comprehensive survey of IoT middleware and the challenges it needs to address was conducted by Razaaque et al. in [10]. Research about middleware addressing Industry 4.0 is presented in a broad survey by Lu in [11]. A multitude of IoT middleware platforms are offered by many different vendors.
Choosing the right platform for an individual business application is difficult and requires effort. Nevertheless, the potential of using a modern communication platform is very high in comparison to conventional plant automation. IoT platforms can be differentiated in terms of their focus on ambient data collection and analytics, while real-time reactive applications provide features for changeability and mass customization [12]. However, there is a lack of open IoT middleware that does not try to enforce the business model of its vendor [13], which limits the flexibility and freedom of the users of these platforms. The high upfront cost of adopting an IoT middleware platform quenches the motivation in small and medium-sized manufacturing companies (SME). Open-source implementations like Kaa (https://www.kaaproject.org/) or Eclipse BaSyx (https://www.eclipse.org/basyx/) are readily accepted by SMEs due to their low upfront and operational cost.
6. CONCLUSION AND FUTURE WORK
In this paper, we provided an overview of the application of the Service-oriented Architecture (SoA) principle to production systems. SoA is not a single solution but a pattern for the system architecture of production systems that improves flexibility in production processes. The integration with additional Industrie 4.0 techniques, such as digital twins, enables further benefits, such as end-to-end communication and unified interfaces for applications and dashboards. The SoA principle, however, needs to be implemented through a software framework. We gave a survey of our experiences implementing SoA in the automation domain. These implementations were performed in real production environments and yielded immediate benefits for the users. During our activities, we noticed that the major challenge of existing production environments are grown structures with proprietary interfaces that often prevent the users from implementing novel approaches and ideas. The SoA principle gives them the opportunity to implement modern
– xxviii –
Industrie 4.0 solutions and provides a foundation for future, more advanced applications, even if users start with basic applications only.
This scalability aspect was well recognized by most of the users who used our SoA Industrie 4.0 middleware Eclipse BaSyx. While many users were interested in being able to understand their processes and obtain data for analysis, the operators were still reluctant to apply SoA in mission-critical domains, such as the controlling of manufacturing processes. Our evaluation, however, clearly showed that applying this architecture principle yields significant benefits. It also indicates that a full transition of the manufacturing industry towards Industrie 4.0 will take time.
ACKNOWLEDGMENTS
This work has been supported by the German Ministry of Education and Research (BMBF) as part of the BaSys 4.2 project under grant no. 01 IS 190 022.
REFERENCES
[1] Schuh, G.; Anderl, R.; Gausemeier, J.; ten Hompel, M.; Wahlster, W. (eds.): “Industrie 4.0 Maturity Index – Managing the Digital Transformation of Companies”. Acatech STUDY, 2017.
[2] Weyer, S.; Schmitt, M.; Ohmer, M.; Gorecky, M.: “Towards Industry 4.0 - Standardization as the crucial challenge for highly modular, multi-vendor production systems.” IFAC-PapersOnLine. 48. 579-584, 2015.
[3] Barnstedt, E. et. al: “Details of the Asset Administration Shell. Part 1 – The exchange of information between partners in the value chain of Industrie 4.0 (Version 1.0).” Platform Industrie 4.0. 2018.
[4] Kuhn, T.; Schnicke, F.; Antonino, P.: “Towards the Factory of the Future with Digital Twins and SOA”. 2020 IEEE International Conference on Software Architecture Companion (ICSA-C), Salvador, Brazil, 2020
[5] Gilchrist, A.: “Middleware Industrial Internet of Things Platforms”. Industry 4.0. Apress, Berkeley, CA, 2016
[6] “ISO/IEC 20922:2016 Information technology -- MQ Telemetry Transport (MQTT) v3.1.1” - International Organization for Standardization. 2016.
[7] Leitner, S.; Mahnke, W.: “OPC UA–service-oriented architecture for industrial applications.”. ABB Corporate Research Center 48 (2006): 61-66.
[8] Nappey, P.; Kaed, C. El; Colombo, A. W.; Eliasson, J.; Kruglyak, A.; Kyusakov, R. et al.: “Migration of a legacy plant lubrication system to SOA.” IECON 2013 - 39th Annual Conference of the IEEE Industrial Electronics Society. 2013.
[9] K. Kayabay; M. O. Gökalp; P. E. Eren; A. Koçyiğit: “A Workflow and Cloud Based Service-Oriented Architecture for Distributed Manufacturing in Industry 4.0 Context” 2018 IEEE 11th Conference on Service-Oriented Computing and Applications (SOCA). 2018.
[10] Razzaque, M.A., Milojevic-Jevric, M., Palade, A., Clarke, S.: “Middleware for internet of things: a survey” IEEE Internet of things journal 3(1), 70-95. 2015
[11] Lu, Y.: Industry 4.0: A survey on technologies, applications and open research issues. Journal of industrial information integration 6, 1-10. 2017
[12] Ngu, A.H., Gutierrez, M., Metsis, V., Nepal, S., Sheng, Q.Z.: “Iot middleware: A survey on issues and enabling technologies.” IEEE Internet of Things Journal 4(1), 1-20. 2016
[13] Ch, G.D.S., Venegas, C., Baca, M., Rodriguez, I., Marrone, L.: “Open middleware proposal for iot focused on industry 4.0” 2018 IEEE 2nd Colombian Conference on Robotics and Automation (CCRA). 2018
– xxix –


INDUSTRIAL TRANSFORMATION AND THE DIGITAL REVOLUTION: A FOCUS ON ARTIFICIAL INTELLIGENCE, DATA SCIENCE AND DATA ENGINEERING
Adam T. Drobot
Chairman, OpenTechWorks, Inc. and Past Chairman of the IEEE IoT Initiative, USA
ABSTRACT
Deep digitization drives value because it enables the exploitation of computational techniques to solve hard problems inherent to industrial enterprises. This includes product design, processes and procedures used in industrial settings tools and methods for manufacturing, and product maintenance, repair and overhaul. This paper will cover what is meant by deep digitization, review the thinking that has brought us to where we are today and look at the challenges and options that lay ahead. It will also describe what is meant by industrial transformation and identify the stakeholders and markets involved.
The successful adoption of digitization is complex, multi-disciplinary, requires systems thinking, and the mastery of a large number of technologies and disciplines. Success is also highly dependent on access to powerful tools, as well as management, organizational, and collaborative structures. Part of this paper will be focused on technology areas that stand out and pose challenges deserving special attention: computational analytics (CA), consisting of optimization methods, modeling, and simulation; artificial intelligence including machine learning; and lastly, data science and data engineering. Standards and common practices are also crucial and no more so than in the collection and dissemination of data within an enterprise and how that data is shared within a larger ecosystem. This paper will additionally describe past attempts at solving this problem and examine possible avenues for creating long-lived data protocols and building blocks for managing and extracting utility from the vast pools of data that can be found in industrial enterprises and the ecosystems they operate in.
Keywords – Artificial intelligence, best practices, data engineering, data science, digital transformation,
digitization, open source, standards
1. INTRODUCTION AND OVERVIEW
I would like to start with a foreshortened tale of how we got to where we are today, and why we are talking about deep digitization and industrial transformation. The tale is not built around technology itself but around the patterns of adaption by significant sectors of the world economy. Sometime in the late 1950s and early 1960s commercial
enterprises discovered the value in using computers and storing data in digital form – they have not stopped since then! The book written by Paul Strassman [1] captures the essence of why this was important and a prescient vision of the benefits. The computers of that age were large centralized machines that only a few organizations could afford, and data storage was at best cumbersome and based on either tape drives or large disc drives with limited capacity, yet they delivered a significant edge to early adopters. By the 1970s we saw the proliferation of “super computers”, large main frames that despite limited memories and infinitesimal speeds compared to today, were powerful enough to make a profound impact. Early examples of applications included: engineering design and commercial operations, management and administration in the public sector, advances in the research and development community, and on content in the entertainment industry. In engineering it was the entry of CAD/CAM tools and the use of finite element analysis in mechanical design, computational fluid dynamics (CFD) in aerospace and defense, and circuit analysis for electronics. In commercial operations it was electronic switching automation in telecommunications and uses in corporate and government processes focused on business functions, that eventually emerged as information and communications technology (ICT).
The advances led to significantly shorter product cycles and significantly better design for manufacturing tools, building structures, aircraft, white goods and both industrial and consumer electronics. In R&D organizations, a significant outcome was the wide-scale adoption of modeling and simulation for insights into phenomena too difficult and complex to attack with analytics or to deduce from experimental data. The entertainment industry discovered computer graphics for special effects, the transcoding of movies and videos for viewing on any screen, the rendering of animation, and early computer games. Just as important was the introduction of remote terminals with modems that allowed engineers, IT personnel, and other end users, to log on to computer systems remotely changing the pattern of how we work and structure our organizations, even though it was only at 110-300 baud.
Eugene Brooks gave a talk at Supercomputing 1990 titled “The Attack of the Killer Micros” that recognized the era where PC’s and engineering workstations would dominate
– xxxi –
[2]. It was accompanied by the emergence and proliferation of new technologies for data communications and new software paradigms. A key factor was the exponential growth of basic performance for computing, storage, and communications. Not only did that lead to greater adoption of computers within the business world but it also hastened the proliferation of computers in the hands of consumers. One consequence was the great broadening of the pool of digitally literate individuals and the demand for digital connectivity and access to content. Seizing on the technological advances, Hammer and Champy [3] wrote one of the bestselling business books of the 1990s that drove an almost two decades long transformation of the corporate landscape. Enterprises concentrated on digitizing routine processes in the business world and exhibiting an endless appetite for new computing, storage, communications, and software technologies. The results included profound changes in business models, and relentless reorganization of corporations.
In the background, on top of the changes that the commercial and industrial world has seen through the 1990s, there were earthshaking changes that have happened in the last two decades, led by the consumer sector. One was the emergence and dominance of the Internet through explosive growth now accounting for ~ 4 billion personal connections. Another was the buildout and adoption of mobile and broadband communication services globally. The average penetration rates have exceeded 100% in many countries and are accompanied by computing power and storage in the user’s hand on smart devices. These were delivered on miniaturized terminals (books, pads and cell phones - with more than one device per person). A fundamental shift has been even more powerful computing and storage in the cloud, and democratization of access to resources that were previously available only to the largest enterprises. Lastly, the changes also saw the reinvention of consumer goods retailing with rapid and efficient residential delivery in the form of ecommerce. That’s four global infrastructures built out from scratch in less than two decades – all fundamentally exploiting digital technologies.
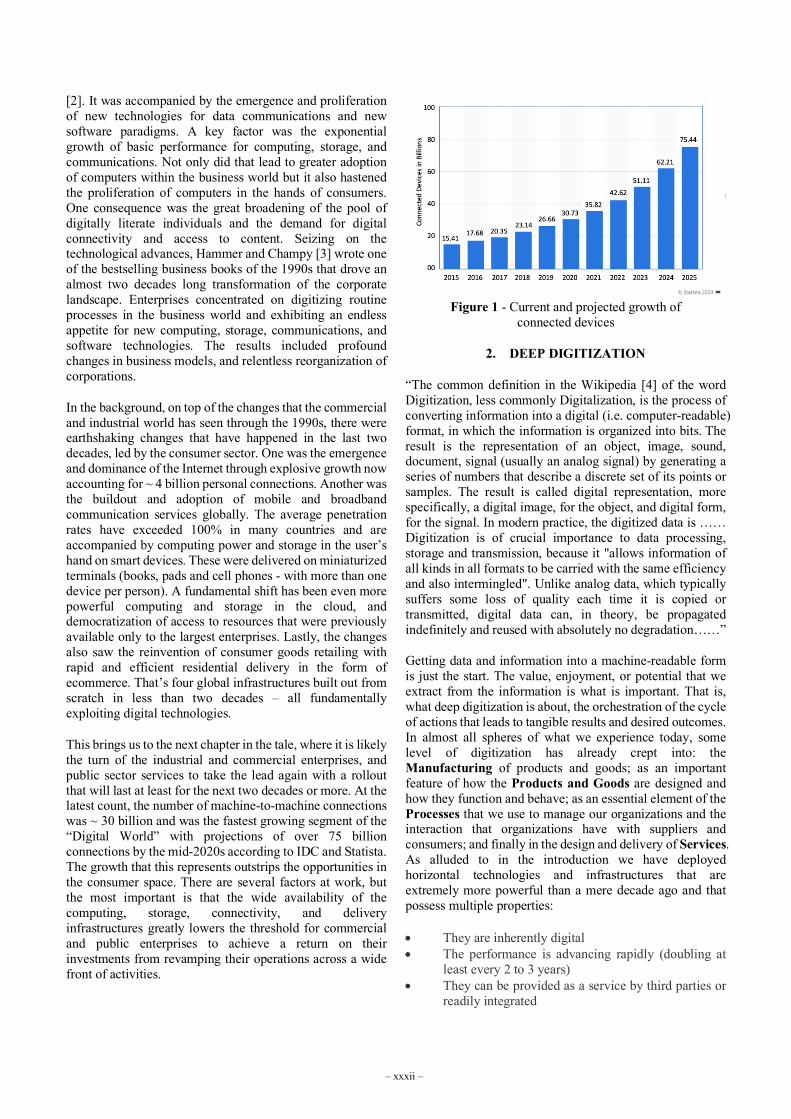
This brings us to the next chapter in the tale, where it is likely the turn of the industrial and commercial enterprises, and public sector services to take the lead again with a rollout that will last at least for the next two decades or more. At the latest count, the number of machine-to-machine connections was ~ 30 billion and was the fastest growing segment of the “Digital World” with projections of over 75 billion connections by the mid-2020s according to IDC and Statista. The growth that this represents outstrips the opportunities in the consumer space. There are several factors at work, but the most important is that the wide availability of the computing, storage, connectivity, and delivery infrastructures greatly lowers the threshold for commercial and public enterprises to achieve a return on their investments from revamping their operations across a wide front of activities.
Figure 1 - Current and projected growth of connected devices
2. DEEP DIGITIZATION
“The common definition in the Wikipedia [4] of the word Digitization, less commonly Digitalization, is the process of converting information into a digital (i.e. computer-readable) format, in which the information is organized into bits. The result is the representation of an object, image, sound, document, signal (usually an analog signal) by generating a series of numbers that describe a discrete set of its points or samples. The result is called digital representation, more specifically, a digital image, for the object, and digital form, for the signal. In modern practice, the digitized data is …… Digitization is of crucial importance to data processing, storage and transmission, because it "allows information of all kinds in all formats to be carried with the same efficiency and also intermingled". Unlike analog data, which typically suffers some loss of quality each time it is copied or transmitted, digital data can, in theory, be propagated indefinitely and reused with absolutely no degradation……”
Getting data and information into a machine-readable form is just the start. The value, enjoyment, or potential that we extract from the information is what is important. That is, what deep digitization is about, the orchestration of the cycle of actions that leads to tangible results and desired outcomes. In almost all spheres of what we experience today, some level of digitization has already crept into: the Manufacturing of products and goods; as an important feature of how the Products and Goods are designed and how they function and behave; as an essential element of the Processes that we use to manage our organizations and the interaction that organizations have with suppliers and consumers; and finally in the design and delivery of Services. As alluded to in the introduction we have deployed horizontal technologies and infrastructures that are extremely more powerful than a mere decade ago and that possess multiple properties:
• They are inherently digital• The performance is advancing rapidly (doubling at
least every 2 to 3 years)• They can be provided as a service by third parties or
readily integrated
– xxxii –
• Access is widely available, with a high degree ofinteroperability
The consequence is that, for any enterprise or use case, the existence and availability of that common infrastructure and horizontal technologies greatly lowers the resource threshold. The availability of reliable and scalable infrastructure available as a service makes it easier to develop, deploy, and operate a solution. This spurs experimentation and innovation. At the same time, the organization requires the skills and mindset to partner and cooperate with other suppliers and vendors in the ecosystem that have unique advantages and specialized resources. The suppliers in turn can deliver their specific services more efficiently and reliably because they do it for large pools of enterprises and use case projects, capitalizing on efficiency of scale.
Central to all of this is the emergence of new utility-like infrastructure and of adoption of use patterns first seen in the consumer realm. They are forcing industrial and public organizations to confront the feedback from workers, operators, and end users, closing a loop that gives a much stronger voice to “customers” and “stakeholders” alike. This is feedback about how well the products, processes, and services actually work, how they are actually used, and the level of satisfaction expressed by the end users. Acting on the feedback, in a systematic way with powerful new tools to conquer the complexity involved, is what distinguishes what is now possible compared to what we could do even in the near-term past.
Broadly speaking there are seven technology areas involved and they include: Computing, Storage, Connectivity, Sensors, Actuators, Interfaces (for human interaction), and Software (the glue that mediates between the technologies and orchestrates the functionality and attributes of applications and solutions). Each of these technology areas has considerable heterogeneity and a hierarchical structure that is important for efficiency and scalability. Accompanying these is the specific Domain Knowledge for the market or vertical where the solutions will be applied.
There is a host of additional technologies that are important, and without doing a complete list I would include: power and energy, system analysis and design, integration, and operations. The ultimate value is also impacted by specialized but important enabling areas such as: artificial intelligence (including machine learning), modeling and simulation, digital twin, data science and data engineering, augmented and virtual reality, additive manufacturing (3D printing), software virtualization, modern control methods and techniques, photogrammetry, robotics, the Internet of things, and many more. The picture I hope I am conveying is that there is a very rich set of ingredients in the digital world and if worked right they allow us to do complex things. To be repetitive for emphasis, the many complex problems that industry faces were impossible to address previously but with the advances in technology and business models they are addressable today. Accompanying this is a much faster path to value than what was possible in vertically integrated
or stove-piped organizations. One not so subtle point is that the possibilities create tremendous pressure on the way enterprises, both public and commercial, are organized and the way they perform their functions and do business. Change does not happen without disruption.
The characteristics of deep digitization that an organization needs to consider go far beyond the technical underpinnings. The single most important aspect is to understand that it is a means to better results, improved performance, and greater satisfaction for customers and for employees. That in turn means buying into the technologies that have been enumerated above and following acceptable principles for operating ethically and responsibly in the context of societal needs. A non-exhaustive list of the issues for an organization can be summed up in the following points:
• People: Mindset, organization, training, talent andskills, incentives and rewards, involvement,investment in employee and customer digital literacy,active engagement and dialog with regulators, policymakers, and community.
• Management: Commitment, persistence,empowerment, partnering, contributing to theecosystem, experimenting, investing, allocatingresources, providing vision, goals, and metrics, focuson value and the customer, alignment with societalneeds and responsibilities.
• Integration: Enterprise, supply-chain, serviceproviders, enterprise and user data, as well ascomputation, storage, connectivity, sensor, actuator,and human interface, and software integration.Organizational integration across functions. Lastingfor the life cycle of the product or service.
• Data: Across the enterprise - Data strategy,governance, data collection, storage and analysis,curation, data-driven decision-making, data-drivenoperations, compliance with policy and regulation.(Volume, Velocity, Variability, Variety, Veracity,Value, Visibility).
• Connectivity: Everything on the network, planningacross the enterprise (no silos), built into goods andproducts, embedded in services, supportingfunctionality and attributes across the life cycle,orchestrating processes and procedures, use of sensorand computing embedded in production and outputequipment and plants. Sharing data and processeswith partners, suppliers and vendors. Closing thefeedback loop with products in service and with endusers.
• Adaptability and resilience: Customizationcapability; Design tools to model outcomes robustly,a high degree of automation. Has the hooks forevolution and future upgrades as is aligned withpartners’ roadmaps. Includes features to deal withfailures and outages.
• Security, privacy, and assurance: Built in by design,at a system level. Compliant with laws andregulations, thoroughly tested for functionality,quality, and customer experience. Safety of use in
– xxxiii –

deployment and operation. Meets requirements for reliability and availability.
3. INDUSTRIAL TRANSFORMATION
Many recent books, white papers, and articles talk about what digital transformation means and how it can be accomplished. I have included a number of references that address different aspects – why it is an imperative [5], why it is not just about technology but about people [6], and why many attempts at transformation fail [7]. From one point of view digital transformation is about how organizations stay competitive, outsmart their peers by making better decisions, attract loyal customers, and have satisfied employees and shareholders. This is an edge that allows them to stay in business and be profitable, achieving tangible outcome-based results. For public entities the incentive is almost the same, where without the profit motive, they deliver services that the citizens appreciate, workers show pride in the results, and both show their support at the ballot box. Enterprises in almost all sectors are deep in the throes of figuring out how to get ahead of the disruptions they face and how to achieve that edge; the same is true in national, regional, and local government organizations. Perhaps the single most visible adoption trend in the public sector is “Smart Cities”, where the dependencies and tensions between technology and human-centric considerations are clearly visible.
From another viewpoint, one can consider digital transformation as an opportunity to better align enterprises and public organizations with societal needs, changing the way they do business in fundamental ways. Examples would be switching out carbon-based energy sources for renewables, recycling materials to avoid the high cost and deleterious effects of waste dumps, promotion of electric vehicles to lower both pollution and carbon emissions, changing production processes to eliminate dangerous chemicals, provide protection against natural disaster, and so on.
There are four main changes that digital transformation addresses: business processes, business models, organizational culture and behavior, and lastly, domain-specific implementations. The last of these are paced by the emergence of new technologies and the creation of new products or services. The heart of any of these changes is institutionalizing fact-based data-driven decision making at every level of the organizations. That requires trust, cooperation, and engagement across business or organizational units and is hard to accomplish without dealing with all four aspects simultaneously; it is inherently complex. A point to make is that none of this is possible without data. It is not any data, it has to be the right data, and it has to cover the issues at hand as comprehensively as possible. That data should also provide insight, over long stretches of time, about performance and the feedback from customers and end users.
Another factor that is essential is the return on business cases that attract capital. It is estimated that in 2019 enterprises
worldwide spent $1.25 trillion on digital transformation and IDC projects that number to exceed $2 trillion by 2023 [8]. In industrial settings that investment was dominated and justified by spend on:
• Improving customer experience• Better customer engagement, outcomes, and value• Transitioning to new business models• Improving operational efficiency• Agility and flexibility, effectiveness, asset uptime,
supply chain optimization, recovery from disruptions,and asset yield.
• Differentiating product and service offerings• Unique products and services with new highly
desirable features• Reducing risk across the enterprise• Safety, regulatory compliance, quality, avoiding
product malfunction
A more granular examination of what digital transformation is about, is to look at the progression of value that it may provide. Do the myriads of decisions that are made in an enterprise work effectively and pull in the same direction? On a daily basis, and in the long term, do the decisions result in actions, for both routine and exceptional situations, that are highly productive? What is the yield from the investment in going digital? How high is the risk of using promising but not fully vetted technologies and processes that are very much in flux? While one should in some measure ask these questions of individual decisions, the intent here is to deal with the tangle of how they may interact with each other and affect outcomes. In answering these questions in the positive, we hope that powerful new tools will allow us to conquer the inherent complexity they represent. In an industrial setting a good reference to look at is the book by Langer [9] that illustrates what the new technologies and tools can do in product design and manufacturing. The scale below is one way we can imagine the progression of capability and value delivered but appreciate that the path is likely to be a lengthy journey and that most industrial enterprises are still at the lower levels, hence the previous statement that the roll out for digitization will last at least a two decades or more. Success is unpredictable and requires that we make significant progress in technology, business models, satisfying roles for industrial workers, and positive and desirable outcomes for consumers.
Level 1: Providing awareness and pointing to important aspects of situational status, supporting actual analysis and decisions to be made by people. (Situational)
Level 2: Identifying the cause of the situation or issue reliably, reducing the time to resolution, but leaving the nature of the response to people. (Diagnostic)
– xxxiv –

Level 3: Anticipation and identifying situations before they occur, providing the organizations with time to exercise remedial options. (Prognostic)
Level 4: Discovering problems and at the same time identifying solutions or courses of action and remedies, with people in the loop to authorize. (Prescriptive)
Level 5: Improving and optimizing on a continuous basis, and discovering through learning alternate, and sometimes unexpected paths to better outcomes (Autonomic)
A recurring question I hear is: Which industrial vertical markets will be affected by digital transformation? The simple answer is that almost all will be, maybe in different ways, but eventually the impact will be felt in almost every sector. The thing to watch is how various industries progress along the ‘Level’ scale in their performance in adopting digitization. The precursors are already there, and the evidence has slowly crept up on us, so we are not always conscious of how deep the toehold already is. It’s worthwhile illustrating with several examples that are indicative of the diversity involved.
The first is financial services: how we are paid, how we purchase things, manage our assets, and decide on our investments. Today in many organizations, we report our time and effort electronically, and can perform such tasks from anywhere on an app. The funds we are owed are transferred to our accounts electronically too. For gig-work, we bill electronically and expect to be paid electronically no matter where we work and no matter where we are delivering the results. To pay for goods and everyday staples, we increasingly use credit cards or other electronic payment systems and often allow for recurring payments to be made automatically from our accounts. The same trend is true for how we budget and do accounting and how we elect to deploy our savings. What we feel as consumers has also been deeply felt across the financial industry, from digitization of financial and asset records to the way business is conducted at both the consumer level and in serving industrial businesses all digitally. Not to say that it works well, but the evaluation of assets, determination of creditworthiness, granting of loans, risk analysis, and issuance of insurance is increasingly conducted digitally. The same is true of the trading of assets of almost any kind – artwork, real estate, stocks and bonds, commodities, or other forms of equity. Underlying these services is mountains of data and an incredible range of AI and analytics tools.
4. TECHNOLOGIES IN FOCUS
I have enumerated the plethora of important technologies that are important in the context of digital transformation. There are two that are “Super” important on their own and at the same time inextricably intertwined; these are the technologies around artificial intelligence (AI) and data science and engineering (DS&E) The first of these, AI, is broadly speaking about the exploitation of computers to perform tasks better than we can as human beings. It is not,
as commonly imagined, about thinking like a human being. For the time being we are not close to having “General AI” that will outthink us or come close to having the qualities that we cherish in our own capabilities and imperfection. It is hard to predict when we will perfect the technologies that will achieve such a level of capability. However, we have long ago passed the point where AI will outperform us in specific ways and hence is central to delivering the value from digitization.
Within AI there is a class of techniques built around machine learning (ML), where there is something profoundly new and that is what I will focus on. There are three aspects to this: (1) the underlying algorithms, which while essential havebeen around for some time; (2) the discovery that largevolumes of data can profoundly improve the quality ofresults for a large classes of applications; and (3) advancesin computer performance that have made some of theseapplications practical. The second area is all about data andhow we go about using it, and why it is probably the biggestimpediment and challenge for digital transformation. Theproblem with data is both technical and organizational, so Iwould like to explore how both aspects can be fixed.
Gartner reports have captured the dynamic evolution of technologies in both AI/ML and in data and their state of maturity as illustrated from the Hype-Curves for 2019 and 2020 in Figure 2.
– xxxv –
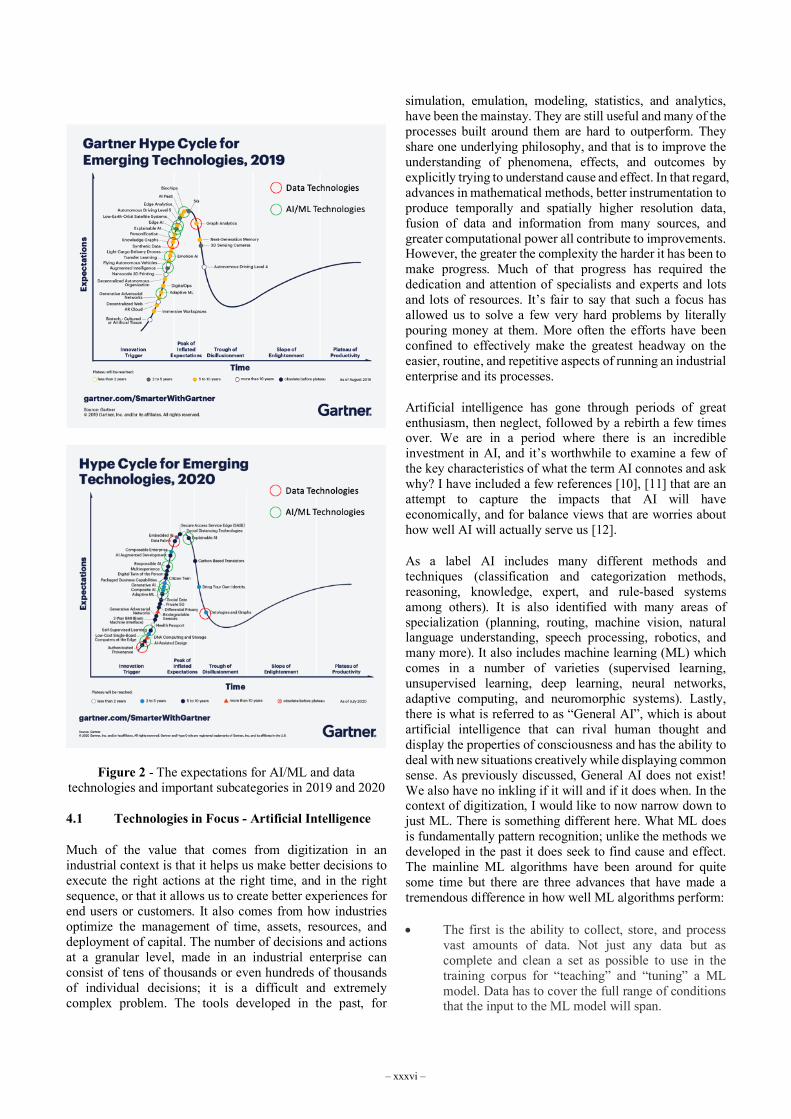
Figure 2 - The expectations for AI/ML and data technologies and important subcategories in 2019 and 2020
4.1 Technologies in Focus - Artificial Intelligence
Much of the value that comes from digitization in an industrial context is that it helps us make better decisions to execute the right actions at the right time, and in the right sequence, or that it allows us to create better experiences for end users or customers. It also comes from how industries optimize the management of time, assets, resources, and deployment of capital. The number of decisions and actions at a granular level, made in an industrial enterprise can consist of tens of thousands or even hundreds of thousands of individual decisions; it is a difficult and extremely complex problem. The tools developed in the past, for
simulation, emulation, modeling, statistics, and analytics, have been the mainstay. They are still useful and many of the processes built around them are hard to outperform. They share one underlying philosophy, and that is to improve the understanding of phenomena, effects, and outcomes by explicitly trying to understand cause and effect. In that regard, advances in mathematical methods, better instrumentation to produce temporally and spatially higher resolution data, fusion of data and information from many sources, and greater computational power all contribute to improvements. However, the greater the complexity the harder it has been to make progress. Much of that progress has required the dedication and attention of specialists and experts and lots and lots of resources. It’s fair to say that such a focus has allowed us to solve a few very hard problems by literally pouring money at them. More often the efforts have been confined to effectively make the greatest headway on the easier, routine, and repetitive aspects of running an industrial enterprise and its processes.
Artificial intelligence has gone through periods of great enthusiasm, then neglect, followed by a rebirth a few times over. We are in a period where there is an incredible investment in AI, and it’s worthwhile to examine a few of the key characteristics of what the term AI connotes and ask why? I have included a few references [10], [11] that are an attempt to capture the impacts that AI will have economically, and for balance views that are worries about how well AI will actually serve us [12].
As a label AI includes many different methods and techniques (classification and categorization methods, reasoning, knowledge, expert, and rule-based systems among others). It is also identified with many areas of specialization (planning, routing, machine vision, natural language understanding, speech processing, robotics, and many more). It also includes machine learning (ML) which comes in a number of varieties (supervised learning, unsupervised learning, deep learning, neural networks, adaptive computing, and neuromorphic systems). Lastly, there is what is referred to as “General AI”, which is about artificial intelligence that can rival human thought and display the properties of consciousness and has the ability to deal with new situations creatively while displaying common sense. As previously discussed, General AI does not exist! We also have no inkling if it will and if it does when. In the context of digitization, I would like to now narrow down to just ML. There is something different here. What ML does is fundamentally pattern recognition; unlike the methods we developed in the past it does seek to find cause and effect. The mainline ML algorithms have been around for quite some time but there are three advances that have made a tremendous difference in how well ML algorithms perform:
• The first is the ability to collect, store, and processvast amounts of data. Not just any data but ascomplete and clean a set as possible to use in thetraining corpus for “teaching” and “tuning” a MLmodel. Data has to cover the full range of conditionsthat the input to the ML model will span.
– xxxvi –

• The second is the sheer improvement in computingpower available for the ML training process (which Iwon’t discuss here but for which there is plenty ofliterature, an example being [13]). This step isextremely compute-intensive, and computing in thecloud has greatly democratized access to the requiredresources. The “weights” determined by the trainingprocess are subsequently used by an inference engineto relate the pattern in an input to a specific identity,result, or action.
• The third is the inference engines (IE) that takeadvantage of the asymmetry between the training ofan ML model and its execution. Such an inferenceengine can run 4-6 orders of magnitude faster than thetime required for training. The IE can be purpose-built hardware or software running on a general-purpose computer. An IE can run many differentmodels and be used for many applications. This is thedevice that uses the “weights”
What goes along with the algorithmic aspect of ML are the necessary resources for computing, data storage, processes used, operational aspects, and the time scales associated with the resources. These are illustrated in Figure 3.
Figure 3 - Flows and processes for AI/ML applications
The allure of ML is that it does not require the hard work needed by traditional methods and the specialized knowledge that went into developing models or simulations that are based on the basic laws of physics, chemistry, or mechanics. As shown in Figure 4, what ML algorithms learn is whether the input pattern is correctly identified with an output. The training consists of input patterns used to set weights within the network so that the outputs are clustered under a correct label. The best success has been with images. An example would be images of highway signs – so the input could be pictures of “Stop Signs”, or “Yield Signs”, or “Pedestrians Crossing Signs” taken under as many conditions as possible. Success would be correctly assigning the right label to each sign. There are, however, occasional surprises and inexplicably an ML model will produce an unexpected and incorrect result, even though this happens rarely. The root causes for such errors are in general not well understood. This poses a natural question about setting metrics and somehow determining error bounds to anticipate what level of incorrect results is likely and under what
circumstances? It also begs the question of what is acceptable and what is not? If we were to perform a similar task as human beings as the ML model is being asked to do we might not do any better, so where do we set the bar?
The last point I would like to bring up is that the main effort in using ML is not what goes into the ML model algorithms or into the computing. The overwhelming effort goes into the data
Figure 4 - A ML learning network with hidden layers
and its life cycle. Typically, the fraction is 50% - 80% as shown in Figure 5. The approach in dealing with training is to keep the model as simple as possible. As an example, if we want the model to recognize a good weld pool from images in a welding process the training data may have a simple annotation without explicit description of the weld features; we leave that to the model to figure out. While I suspect that adding such features as part of the training would improve the results, such annotation is expensive to do and just raises the data costs even further. If it were possible to do such annotation automatically it might well be worth it; this is an area where there is a lot of experimentation yet to be done.
Figure 5 - Typical allocation of effort from “Towards Data Science” - https://towardsdatascience.com/
– xxxvii –
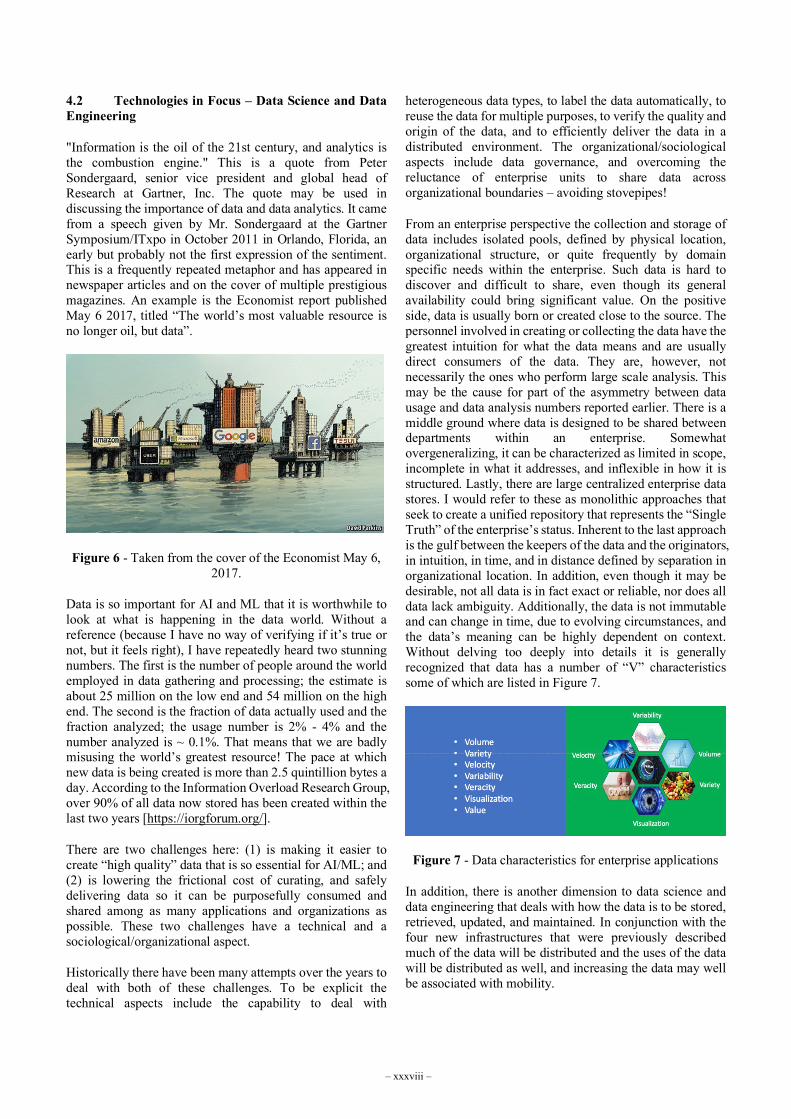
4.2 Technologies in Focus – Data Science and Data Engineering
"Information is the oil of the 21st century, and analytics is the combustion engine." This is a quote from Peter Sondergaard, senior vice president and global head of Research at Gartner, Inc. The quote may be used in discussing the importance of data and data analytics. It came from a speech given by Mr. Sondergaard at the Gartner Symposium/ITxpo in October 2011 in Orlando, Florida, an early but probably not the first expression of the sentiment. This is a frequently repeated metaphor and has appeared in newspaper articles and on the cover of multiple prestigious magazines. An example is the Economist report published May 6 2017, titled “The world’s most valuable resource is no longer oil, but data”.
Figure 6 - Taken from the cover of the Economist May 6, 2017.
Data is so important for AI and ML that it is worthwhile to look at what is happening in the data world. Without a reference (because I have no way of verifying if it’s true or not, but it feels right), I have repeatedly heard two stunning numbers. The first is the number of people around the world employed in data gathering and processing; the estimate is about 25 million on the low end and 54 million on the high end. The second is the fraction of data actually used and the fraction analyzed; the usage number is 2% - 4% and the number analyzed is ~ 0.1%. That means that we are badly misusing the world’s greatest resource! The pace at which new data is being created is more than 2.5 quintillion bytes a day. According to the Information Overload Research Group, over 90% of all data now stored has been created within the last two years [https://iorgforum.org/].
There are two challenges here: (1) is making it easier to create “high quality” data that is so essential for AI/ML; and (2) is lowering the frictional cost of curating, and safelydelivering data so it can be purposefully consumed andshared among as many applications and organizations aspossible. These two challenges have a technical and asociological/organizational aspect.
Historically there have been many attempts over the years to deal with both of these challenges. To be explicit the technical aspects include the capability to deal with
heterogeneous data types, to label the data automatically, to reuse the data for multiple purposes, to verify the quality and origin of the data, and to efficiently deliver the data in a distributed environment. The organizational/sociological aspects include data governance, and overcoming the reluctance of enterprise units to share data across organizational boundaries – avoiding stovepipes!
From an enterprise perspective the collection and storage of data includes isolated pools, defined by physical location, organizational structure, or quite frequently by domain specific needs within the enterprise. Such data is hard to discover and difficult to share, even though its general availability could bring significant value. On the positive side, data is usually born or created close to the source. The personnel involved in creating or collecting the data have the greatest intuition for what the data means and are usually direct consumers of the data. They are, however, not necessarily the ones who perform large scale analysis. This may be the cause for part of the asymmetry between data usage and data analysis numbers reported earlier. There is a middle ground where data is designed to be shared between departments within an enterprise. Somewhat overgeneralizing, it can be characterized as limited in scope, incomplete in what it addresses, and inflexible in how it is structured. Lastly, there are large centralized enterprise data stores. I would refer to these as monolithic approaches that seek to create a unified repository that represents the “Single Truth” of the enterprise’s status. Inherent to the last approach is the gulf between the keepers of the data and the originators, in intuition, in time, and in distance defined by separation in organizational location. In addition, even though it may be desirable, not all data is in fact exact or reliable, nor does all data lack ambiguity. Additionally, the data is not immutable and can change in time, due to evolving circumstances, and the data’s meaning can be highly dependent on context. Without delving too deeply into details it is generally recognized that data has a number of “V” characteristics some of which are listed in Figure 7.
Figure 7 - Data characteristics for enterprise applications
In addition, there is another dimension to data science and data engineering that deals with how the data is to be stored, retrieved, updated, and maintained. In conjunction with the four new infrastructures that were previously described much of the data will be distributed and the uses of the data will be distributed as well, and increasing the data may well be associated with mobility.
– xxxviii –
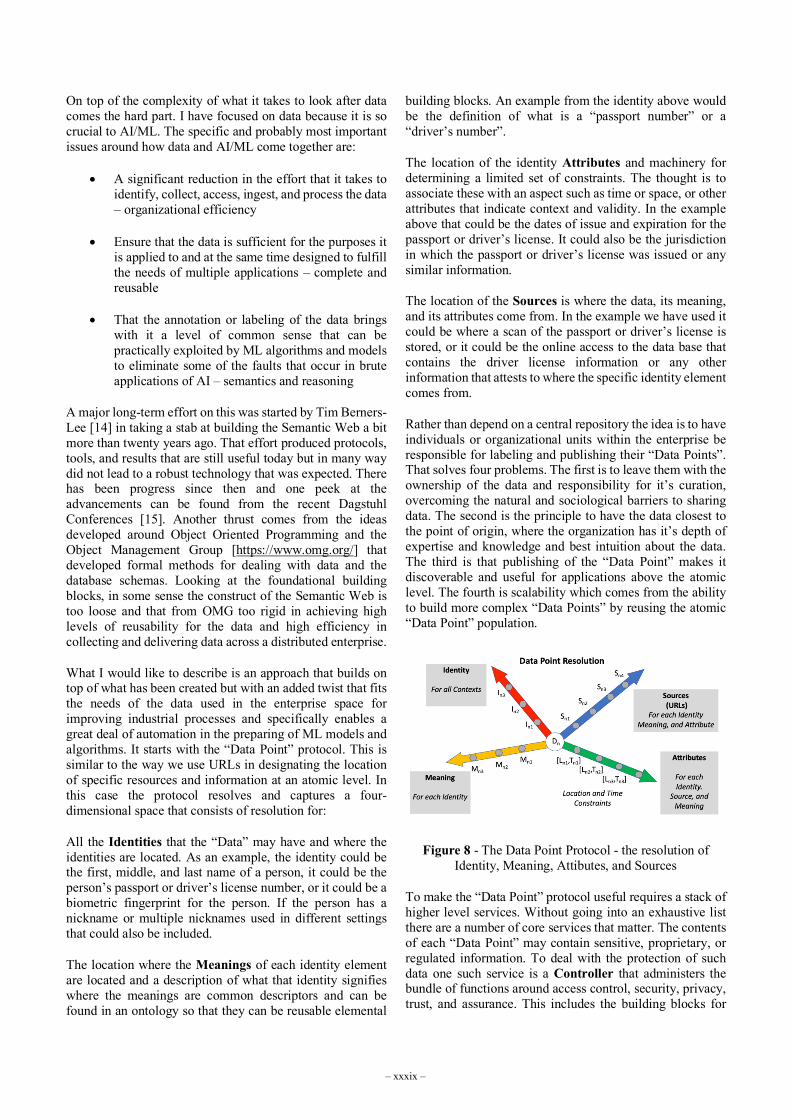
On top of the complexity of what it takes to look after data comes the hard part. I have focused on data because it is so crucial to AI/ML. The specific and probably most important issues around how data and AI/ML come together are:
• A significant reduction in the effort that it takes toidentify, collect, access, ingest, and process the data– organizational efficiency
• Ensure that the data is sufficient for the purposes itis applied to and at the same time designed to fulfillthe needs of multiple applications – complete andreusable
• That the annotation or labeling of the data bringswith it a level of common sense that can bepractically exploited by ML algorithms and modelsto eliminate some of the faults that occur in bruteapplications of AI – semantics and reasoning
A major long-term effort on this was started by Tim Berners-Lee [14] in taking a stab at building the Semantic Web a bit more than twenty years ago. That effort produced protocols, tools, and results that are still useful today but in many way did not lead to a robust technology that was expected. There has been progress since then and one peek at the advancements can be found from the recent Dagstuhl Conferences [15]. Another thrust comes from the ideas developed around Object Oriented Programming and the Object Management Group [https://www.omg.org/] that developed formal methods for dealing with data and the database schemas. Looking at the foundational building blocks, in some sense the construct of the Semantic Web is too loose and that from OMG too rigid in achieving high levels of reusability for the data and high efficiency in collecting and delivering data across a distributed enterprise.
What I would like to describe is an approach that builds on top of what has been created but with an added twist that fits the needs of the data used in the enterprise space for improving industrial processes and specifically enables a great deal of automation in the preparing of ML models and algorithms. It starts with the “Data Point” protocol. This is similar to the way we use URLs in designating the location of specific resources and information at an atomic level. In this case the protocol resolves and captures a four-dimensional space that consists of resolution for:
All the Identities that the “Data” may have and where the identities are located. As an example, the identity could be the first, middle, and last name of a person, it could be the person’s passport or driver’s license number, or it could be a biometric fingerprint for the person. If the person has a nickname or multiple nicknames used in different settings that could also be included.
The location where the Meanings of each identity element are located and a description of what that identity signifies where the meanings are common descriptors and can be found in an ontology so that they can be reusable elemental
building blocks. An example from the identity above would be the definition of what is a “passport number” or a “driver’s number”.
The location of the identity Attributes and machinery for determining a limited set of constraints. The thought is to associate these with an aspect such as time or space, or other attributes that indicate context and validity. In the example above that could be the dates of issue and expiration for the passport or driver’s license. It could also be the jurisdiction in which the passport or driver’s license was issued or any similar information.
The location of the Sources is where the data, its meaning, and its attributes come from. In the example we have used it could be where a scan of the passport or driver’s license is stored, or it could be the online access to the data base that contains the driver license information or any other information that attests to where the specific identity element comes from.
Rather than depend on a central repository the idea is to have individuals or organizational units within the enterprise be responsible for labeling and publishing their “Data Points”. That solves four problems. The first is to leave them with the ownership of the data and responsibility for it’s curation, overcoming the natural and sociological barriers to sharing data. The second is the principle to have the data closest to the point of origin, where the organization has it’s depth of expertise and knowledge and best intuition about the data. The third is that publishing of the “Data Point” makes it discoverable and useful for applications above the atomic level. The fourth is scalability which comes from the ability to build more complex “Data Points” by reusing the atomic “Data Point” population.
Figure 8 - The Data Point Protocol - the resolution of Identity, Meaning, Attibutes, and Sources
To make the “Data Point” protocol useful requires a stack of higher level services. Without going into an exhaustive list there are a number of core services that matter. The contents of each “Data Point” may contain sensitive, proprietary, or regulated information. To deal with the protection of such data one such service is a Controller that administers the bundle of functions around access control, security, privacy, trust, and assurance. This includes the building blocks for
– xxxix –

encryption and decryption services and homomorphyic computing methods. A Rater is important to quantify the accuracy or veracity of the information stored by the “Data Point”, and serves as a feedback loop that can confirm the validity of information, identify errors, and serve to systematically deal with ambiguities and variability. An Editor is essential to maintain the quality and consistency of the “Data Points” and to enforce rules or guidelines for style, support a common dictionary of terms, and similar items. It serves the role of providing feedback to the originators of data, and is a primary mechanism for making sure that the information is reusable and interoperable with that from other originators. The Publisher is a system that then oversees the release of data content within the enterprise and where applicable a larger ecosystem. The content can then be discovered, where needed and authorised, and delivered through either pull or push mechanisms.
The “Data Points” form the underlayer that allows the set of tools, already matured and tested over the last decade, to extract value from information and to orchestrate and execute the complex processes that better align decisions and actions across an enterprise. The tools are part of the suite produced by W3C and their derivatives (RDF, TripleStore, OWL, etc). A key function of the tools is the ability to form Knowledge Graphs (KGs), that is to explicitly reveal the linkages and dependencies among the “Data Points”. This is where the touch point with AI and ML happens and makes a tremendous difference. There are several aspects to this. The first is that data distributed across an enterprise and its ecosystem can be collected in a triple store and made available for analysis, with the proper authorization and with the proper protection. Included here is the ability to perform computations through shared secret or homomprphic computing methods without revealing the underlying protected data. The second is that the linkages found from the KGs that in turn expose the common features found in the data explicitly. This then automates both the labeling of data sets and incorporation of features in AI/ML algorithms.
While what has been described does not lead to “General AI”, the hypothesis is that it nevertheless reduces the number of misfires that sometimes occur with ML algorithms returning surprisingly incorrect results.
I would like to conclude with an example of how this may work. A common example cited by researchers is the behavior of ML algorithms used to identify a “Stop” sign in a scene for controlling an autonomous vehicle. The ML algorithm is fed labeled pictures of “Stop” signs under various conditions and eventually does a very very good job of correctly identifying the presence of a stop sign. What researchers have noticed is that a small overlay or smear on the stop sign can throw the algorithm off completely, so it no longer acknowledges the presence of a stop sign. They have also noticed that introducing a more or less random pattern in a pixilated image can produce a similar effect. As human observers there is an element of common sense that would not have thrown us off the same way. When we see a stop sign and the context that it is associated with we see other
features that prevent us from being fooled. These include the fact that the stop sign is octagonal, that it is red, that it has the letters STOP on it, that it is proximate to an intersection or a crosswalk, and so on. These are all features that are also revealed by a KG. The performance of an ML model that explicitly uses these features is also much harder to fool. This is an example of why the combination of how we treat our data, the tools that are available to analyze it and how ML models are formulated are much more powerful together. This is an area of research that deserves considerably more attention.
An early version of the scheme described above was successfully implemented at a number of large financial institutions. This included the first full “Data Point” approach across an enterprise. It also included the creation of enterprise Knowledge Graphs (KG) in two organizations. The work was led by Jacobus Geluk, who is currently the
Figure 9 - Data Point Protocol and its ecosystem
CTO of Agnos.Ai. The “Data Point” implementation was built out at BNY Mellon and has been in place since 2017. Jacobus also led the architecture teams that created the KGs at BNY Mellon and at Bloomberg.
4.3 Technologies in Focus – The Importance of Standards
For wide acceptance of AI methods and data approaches standards are crucial if they are to be the building blocks of
– xl –

digital transformation solutions. Standards are also fundamental for technologies such as communications, computing, and storage. What is even more important is that the standards are long-lived. An exemplary example are the Internet Protocols, without which we would not have one of the infrastructures that we count on so much. Uncertainty and churn in standards creates a setting where fear of stranded investments and future migration costs drives away investments. For communications the organizations such as ITU, 3GPP, the IETF, W3C, IEEE SA, and national SDOs play an important role. The AI and data protocols are also important for the automation of network functions especially with the explosive growth of connected devices and there are active working groups within SDOs considering the adoption of AI algorithms and data interfaces. Many of the low-level methods and tools that have been mentioned above such as RDF, SPARQL, OWL, and Triple Store have been codified and are supported by standards.
There are also a number of organizations such as the Knowledge Graph Foundation that have been formed to standardize approaches, provide benchmarks, and codify best practices. The Linux Foundation is experimenting with methods and the legal machinery for encouraging the sharing of AI/ML models by providing standard licensing agreements akin to open source. All of this is in the early stages but necessary for success.
ACKNOWLEDGEMENT
I would like to thank Jacobus Geluk who is the CTO of Agnos.Ai and Dennis Roberson from Illinois Institute of Technology for many useful discussions about the use of AI and the underlying data in developing strong solutions for creating value for digital transformation, and for some of the ideas that are the basis of the talk accompanying this paper. In addition, I would also like to recognize the US FCC Technological Advisory Council Working Group (WG) on AI, where I benefited from the WG deliberations and from the privilege of listening to many in-depth presentations by experts on AI and the data sciences.
REFERENCES
[1] Paul A. Strassmann: "The Business Value ofComputers - An Executive Guide", Free Press,December 1st, 1990. 522 pages (ISBN-13: 978-00962041327)
[2] John Markoff: “The Attack of the ‘Killer Micros’”,The New York Times, Section D, Page1, May 6,1991.
[3] Michael Hammer, and James A. Champy: “Re-engineering the Corporation: A Manifesto forBusiness Revolution”, Harper Business, 1st Edition,May 1, 1993. 240 pages (ISBN-13: 978-0887306402)
[4] Wikipedia: https://en.wikipedia.org/wiki/Digitization
[5] Thomas M. Siebel: “Digital Transformation: Surviveand Thrive in the Era of Mass Extinction”, RosettaBooks, July 9, 2019. 256 pages (ISBN-13: 978-1948122481)
[6] Gerald C. Kane, Anh Nguyen Phillips, Jonathan R.Copulsky, and Garth R. Andreus: “The TechnologyFallacy: How People are the Real Key to DigitalTransformation”, MIT Press, April 16, 2019. 280pages (ISBN-13: 978-0262039680)
[7] Tony Saldanha: “Why Digital Transformations Fail:The Surprising Disciplines of How to Take Off andStay Ahead”, Barrett-Koehler Publishers, July 23,2019. 240 pages (ISBN-13: 978-1523085347)
[8] IDC Projection:https://www.idc.com/getdoc.jsp?containerId=prUS46377220
[9] Thomas Lager: “Contemporary Quality FunctionDeployment for Product and Process Innovation:Towards Digital Transformation of CustomerProduct Information in a New Knowledge-BasedApproach”, World Scientific Publishing Company,August 14, 2019. 354 pages (ISBN-13: 978-9813279872)
[10] Roger Bootle: “The AI Economy: Work, Wealth andWelfare in the Age of the Robot”, Nicholas Brealey,November 26, 2019. 224 pages (ISBN-13: 978-1473696167)
[11] Marco Iansiti, and Karim R. Lakhani: “Competing inthe Age of AI: Strategy and Leadership WhenAlgorithms and Networks Run the World”, HarvardBusiness Review Press, January 7, 2020. 288 pages(ISBN-13: 978-1633697621)
[12] Stuart Russell: “Human Compatible: ArtificialIntelligence and the Problem of Control”, Viking,October 8, 2019. 352 pages (ISBN-13: 978-0525558613)
[13] Ian Goodfellow, Yoshua Bengio, and AaronCourville: “Deep Learning”, The MIT Press,November 18, 2016. 755 pages (ISBN-13: 978-0262035613)
[14] Tim Berners-Lee, “Semantic Web Roadmap”, 14October 1998.https://www.w3.org/DesignIssues/Semantic.html
[15] Piero Andrea Bonatti, Stefan Decker, Axel Pollers,and Valentina Presutti; Editors: “Knowledge Graphs:New Directions for Knowledge Representation on theSemantic Web”, Report of Dagstuhl ConferenceReport Volume 8, Issue 9, 25 March 2019. DOI: 10.4230/DagRep.8.9.29
– xli –


INVITED PAPER


A CASE STUDY FOR MODELING MACHINE TOOL SYSTEMS
USING STANDARD REPRESENTATIONS
Maja Bärring1; Guodong Shao2; Moneer Helu2; Björn Johansson1
1Chalmers University of Technology, Industrial and Materials Science, Hörsalsvägen 7A, Gothenburg, 41296, Sweden
2National Institute of Standards and Technology (NIST), 100 Bureau Dr., Gaithersburg, MD 20899, USA
ABSTRACT
Machine models play an important role to support decision
making for purchasing, scheduling, and routing in
manufacturing. However, it is challenging to share a
machine model that is developed using proprietary formats.
A model of a fully assembled machining system in a neutral
format can help overcome this challenge. Standard-based
machine tool models will not only facilitate information
reuse but also enable model exchange between systems. In
this paper a case study is discussed to demonstrate the initial
effort of a standard representation for a machining system
including both component geometric and kinematics
information. This standard-based machine model will be
easily imported to another tool.
Keywords –CAx tools, kinematics,
interoperability, machine model, standards, smart
manufacturing systems, STEP
1. INTRODUCTION
Smart manufacturing systems (SMS) are fully integrated,
collaborative manufacturing systems that will respond in real
time to meet changing demands and conditions in factories,
in their supply network, and in customer needs [1] [2] [3] [4].
SMS requires the digitalization and integration of
components of a manufacturing enterprise including
manufacturing resources such as computer numerical control
(CNC) machining systems [5].
A CNC machining system is a fundamental element in
production systems and typically consists of a machine tool,
cutting tools, auxiliary devices, material-handling devices,
and fixtures. A CNC machine model is a conceptual
representation of the machine tool and has a logical
framework that enables the representation of the machine’s
functionalities. The information built into a machine model
can be used throughout the life cycle of a machining system
and by various users in the decision-making processes.
Examples of model use include manufacturing capability
evaluation, process validation, and production planning [6]
[7]. It consists of modules for describing the configuration of
the overall structure, geometric shapes of the mechanical
units, as well as the kinematic relationships between the
mechanical units of the machine. The kinematics model of
a machine tool defines the motion constraints for machine
components that are related to each other [8]. For example, a
five-axis machine is generally defined by two rotational axes
to rotate and tilt either the tool or the workpiece and three
orthogonal linear axes x, y, and z. The machining functional
properties, i.e., mechanical and kinematical properties in the
machine model, will define and constrain the movements and
speeds of axes [7]. Simulation of kinematics helps identify
manufacturing issues at an early stage and correct them
before production. Those issues could be errors in the tool
path, collisions between machine components and machined
parts, and poor quality of the final product. Simulation is the
safest and most cost-effective way for verification of a multi-
axis program, and it supports the concept of virtual
machining [6] [9].
Computer-aided (CAx) tools normally provide a virtual
environment that enables the simulation of machining
processes with a realistic representation of the kinematics,
static, and dynamic behavior of the real machine tool [6]. The
x in CAx is an abbreviation for the family of computer-aided
tools that are used to create virtual environments, for
example, Computer Aided Design (CAD), Computer Aided
Manufacturing (CAM), or Computer Aided Engineering
(CAE). A variety of commercial CAx tools from different
vendors are available and have been used by manufacturers
to represent their products and resources to support design,
operation, and maintenance activities. These activities
involve process planning, tool path verification, cost
estimation, process simulation, and CNC programming [6]
[7].
With the multiple CAx tools provided by different vendors
serving the same purpose, barriers for sharing and
exchanging machine models with kinematic and geometric
information between different systems exist [10]. Because
each vendor has its own CAx environment, which is non-
homogenous, users are stuck with the specific format of the
CAx software they use. Redundant efforts have to be made
for recreating the same machine model using different CAx
tools within a company; machine models with complex
kinematics may be difficult or very time-consuming to
remodel or convert. In addition, all these issues also make it
difficult to efficiently define and analyze manufacturing
capabilities for production planning and equipment
– xlv –

procurement. For example, when purchasing a CNC machine
tool, it is normally hard for final users to determine whether
their workpiece(s) will fit on that machine, or even if they do
fit, is there an accurate, efficient location for the parts?
Having machine models beforehand will allow users to
better understand the machines’ capability and easily
compare candidate machines through “try before they buy.”
However, it is impossible for users to gain access to all the
vendor-specific tools and machine models before the
procurement. A neutral format, which is a non-proprietary
format that can be used to represent machine models and
recognized by all vendors, of the machine models will
provide the final users a convenient way to evaluate the
capabilities of candidate machine tools.
Efforts for international standards, to govern the
representation of geometrical and functional information,
have been made in parallel as the machine tool
manufacturers developed their proprietary techniques [7].
Attempts have been made to provide a standardized solution
for model and data exchange between CAx systems, but so
far it is mainly the product geometric data and definition that
have been widely exchanged by the support of ISO 10303,
which is also called Standard Exchange of Product Data
(STEP). Many CAx tools can export geometric models to the
STEP format and vice versa. Standard solutions for the
exchange of kinematics information have not been used in
practice and industry does need a standard way to exchange
complete machine model information including the product
geometry, kinematics, tolerances, and classification [10].
The increasing use of software to represent a machining
system in a virtual representation, from a manufacturing
perspective, implies an increased need to be able to reuse the
information. Manufacturing companies are investing more to
digitizing their enterprises and as more information is
digitally available, the interest and urgency of information
reuse will increase. Interoperability for systems and models
will be more crucial and will motivate manufacturers to seek
solutions that support standard representations of their
resource, product, and production data. The stakeholders to
this approach are manufacturing companies that need to
exchange these kinds of data, both internally and externally.
For example, internally, the same machine model may be
developed multiple times using different software, models
have issues with different version of the software, or
different units used by the different component models that
need to work together; externally, model exchanges and
communications among supply chain partners, CAx
developers, and machine vendors may be required.
This paper introduces a case study that demonstrates the
feasibility of representing a complete machining model,
including both geometric and kinematics information, using
the STEP standard. This case study reports the initial effort
of converting a vendor-specific (PTC Creo) machine model
to the STEP AP 242 representation. PTC Creo was selected
because (1) it is a commonly used CAx tools and (2) we have
a machine model available in Creo format for this case study.
The research contributions of this paper include (1) a general
approach for converting a vendor-specific machine model in
proprietary format to a standard format (STEP) and (2)
lessons learned through the implementation of the case study.
The rest of the paper is organized as follows: Section 2
discusses the existing relevant standards and related efforts
for solving the problem of non-homogenous CAx
environments. Section 3 presents the general approach of
how to address this problem so that a specific approach can
be derived depending on the CAx tools used and interfaces
required. Section 4 introduces the context and settings for
this specific case, and presents the development of the STEP
generator. Section 5 discusses the challenges encountered in
this study and finally Section 6 concludes the paper.
2. RELEVANT STANDARDS AND RELATED
EFFORTS
This section discusses relevant standards that support the
work, interfaces that enable the conversion of data from
proprietary formats to the standard formats, and related
efforts in the field.
2.1 Standards: ISO 10303 – STEP and ASME B5.59
Two standards for representing machine models are briefly
introduced in this subsection: ISO 10303 and ASME B5.59.
The standard ISO 10303, or STEP, was developed to
unambiguously represent and exchange computer-
interpretable information for a product [11]. STEP consists
of a set of standards to facilitate data modeling throughout
the entire lifecycle of a product, and has become widely
accepted and applied internationally for exchanging product
data in the manufacturing field. Information models and
nearly all parts of STEP are defined using the EXPRESS
modeling language, the standard ISO 10303-11 [12] [13].
The EXPRESS modeling language defines entities and the
relationships between entities. Files that are created based on
this standard are also referred to as physical files or
part21/p21 files. The instances of an entity can be exchanged
by the support of p21 files or shared within applications
through the Standard Data Access Interface (SDAI) [14].
The information models can be categorized into application
protocols (AP) or integrated resources (IR). APs are
developed for specific application domains, such as
aerospace in AP 203 and automotive in AP 214 and they are
designed for fulfilling the industrial requirements [12]. AP
242, managed model-based 3D engineering, presents a data
model schema to integrate the kinematics, geometry, and
assembly models [15]. However, AP 242 is still a work in
progress and has not been widely implemented in industry
[10]. Figure 1 provides an example of the EXPRESS schema
for AP 242, which defines a kinematic joint. [16] lists a
complete documentation of the AP242 EXPRESS schema.
IRs are context-independent, and an example of IR is ISO
10303-105 that defines an IR for kinematics data. IR for
kinematics for 10303-105 specifies the structure, motion,
– xlvi –

and analysis for kinematics mechanism and is possible to use
in any industrial domain [17] [18].
Figure 1 – An example from of the AP242 EXPRESS
schema for defining kinematic joints [16]
ISO is not the only standardization organization involved in
standardizing how machine models can be represented on a
neutral format. Another standard that defines information
models and formats for machine tool data is B5.59 from the
American standardization organization, American Society of
Mechanical Engineers (ASME) [9]. The eXtensible Markup
Language (XML) is used for representing the specification
of machine tools (milling and turning machines). The focus
of the standard is on properties that describe capabilities and
performance of a machine tool at a specific instance of its
life cycle, e.g., in the specification or operation stage of the
machine tool. The standardization efforts made from
multiple standardization bodies indicate the importance of
this topic and a standardized solution is needed for sharing
and exchanging manufacturing resource and product models.
2.2 JSDAI
There are several available interfaces to support the
translation of machine models in a vendor-specific format to
the STEP format, e.g., STEP Tools [19], OpenCascade [20],
PythonOCC [21], and Java-based SDAI (JSDAI) [22].
JSDAI was selected for the case study reported in this paper
because it supports most of the APs in ISO 10303 and is a
Java-based open source Application Programming Interface
(API). JSDAI also supports the development of EXPRESS
data models and their implementation in Java. It enables the
reading, writing, and runtime manipulation of object-
oriented data defined according to an EXPRESS data model.
JSDAI provides a library that contains EXPRESS schemas
for most APs in ISO 10303. JSDAI uses the EXPRESS
schema defined for AP 242 to represent the kinematics
information.
JSDAI facilitates the linking of CAD, CAM, CAE, CNC,
Product Data Management (PDM), and Product Lifecycle
Management (PLM) systems [22] [23].
2.3 Related efforts
Since the introduction of STEP in 1994, examples of how it
can be used to share data on a standard format have been
reported in scientific publications. Among the contributors,
Li et al. [10] [24] have made efforts for converting
kinematics modeling using Siemens’ NX CAD software to
the STEP format. The case study in this paper uses a similar
approach, but a new STEP generator was developed for a
different CAD tool and applied to a different machine model.
3. THE GENERAL APPROACH FOR
CONVERTING MACHINE MODELS
To extract kinematics data from a machine model defined in
a vendor-specific CAD system and integrate it with a STEP
model that contains the geometric data of the same machine
model, an application needs to be developed. Figure 2 shows
the general approach of how this could be done as a guideline
for readers with various CAx tool to follow. Section 4 will
explain the case specific settings for the case study in this
paper and Figure 3 depicts the specific procedure for the case
study.
Figure 2 – The general approach for creating a complete
machine model in STEP format with both geometric and
kinematics information
A machine model may be developed in a vendor-specific
format with a complete description including geometric and
kinematics information; this is a foundation for us to be able
to translate the complete virtual machine model to a standard
format. Most CAx software today provides the functionality
to automatically export geometric information in the STEP
format. However, a vendor-specific application (i.e., an
interface or adapter) is required to extract the kinematics data.
Examples of interfaces that support the development of such
applications include J-Link for PTC Creo and NX Open for
Siemens. These interfaces of vendor-specific tools enable the
development of the STEP generator.
After both geometric and kinematics data sets have been
extracted from the machine model in a CAx tool, the “STEP
Generator” integrates them into a complete machine model
– xlvii –
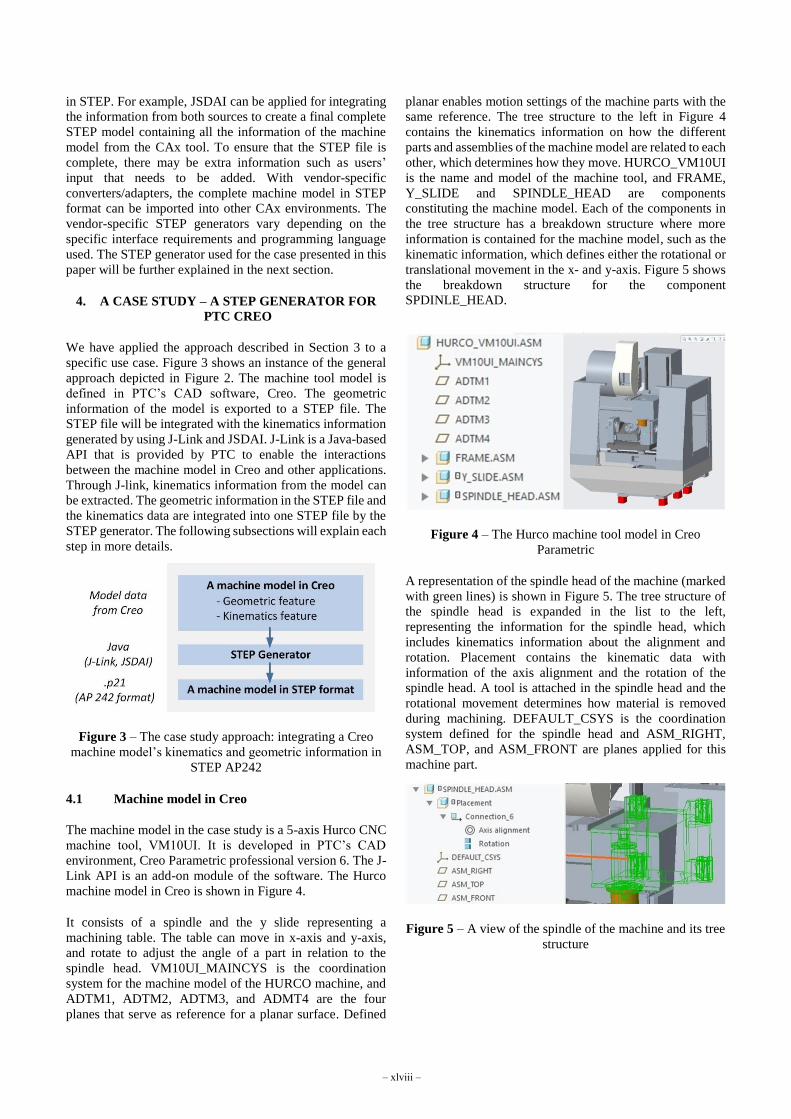
in STEP. For example, JSDAI can be applied for integrating
the information from both sources to create a final complete
STEP model containing all the information of the machine
model from the CAx tool. To ensure that the STEP file is
complete, there may be extra information such as users’
input that needs to be added. With vendor-specific
converters/adapters, the complete machine model in STEP
format can be imported into other CAx environments. The
vendor-specific STEP generators vary depending on the
specific interface requirements and programming language
used. The STEP generator used for the case presented in this
paper will be further explained in the next section.
4. A CASE STUDY – A STEP GENERATOR FOR
PTC CREO
We have applied the approach described in Section 3 to a
specific use case. Figure 3 shows an instance of the general
approach depicted in Figure 2. The machine tool model is
defined in PTC’s CAD software, Creo. The geometric
information of the model is exported to a STEP file. The
STEP file will be integrated with the kinematics information
generated by using J-Link and JSDAI. J-Link is a Java-based
API that is provided by PTC to enable the interactions
between the machine model in Creo and other applications.
Through J-link, kinematics information from the model can
be extracted. The geometric information in the STEP file and
the kinematics data are integrated into one STEP file by the
STEP generator. The following subsections will explain each
step in more details.
Figure 3 – The case study approach: integrating a Creo
machine model’s kinematics and geometric information in
STEP AP242
4.1 Machine model in Creo
The machine model in the case study is a 5-axis Hurco CNC
machine tool, VM10UI. It is developed in PTC’s CAD
environment, Creo Parametric professional version 6. The J-
Link API is an add-on module of the software. The Hurco
machine model in Creo is shown in Figure 4.
It consists of a spindle and the y slide representing a
machining table. The table can move in x-axis and y-axis,
and rotate to adjust the angle of a part in relation to the
spindle head. VM10UI_MAINCYS is the coordination
system for the machine model of the HURCO machine, and
ADTM1, ADTM2, ADTM3, and ADMT4 are the four
planes that serve as reference for a planar surface. Defined
planar enables motion settings of the machine parts with the
same reference. The tree structure to the left in Figure 4
contains the kinematics information on how the different
parts and assemblies of the machine model are related to each
other, which determines how they move. HURCO_VM10UI
is the name and model of the machine tool, and FRAME,
Y_SLIDE and SPINDLE_HEAD are components
constituting the machine model. Each of the components in
the tree structure has a breakdown structure where more
information is contained for the machine model, such as the
kinematic information, which defines either the rotational or
translational movement in the x- and y-axis. Figure 5 shows
the breakdown structure for the component
SPDINLE_HEAD.
Figure 4 – The Hurco machine tool model in Creo
Parametric
A representation of the spindle head of the machine (marked
with green lines) is shown in Figure 5. The tree structure of
the spindle head is expanded in the list to the left,
representing the information for the spindle head, which
includes kinematics information about the alignment and
rotation. Placement contains the kinematic data with
information of the axis alignment and the rotation of the
spindle head. A tool is attached in the spindle head and the
rotational movement determines how material is removed
during machining. DEFAULT_CSYS is the coordination
system defined for the spindle head and ASM_RIGHT,
ASM_TOP, and ASM_FRONT are planes applied for this
machine part.
Figure 5 – A view of the spindle of the machine and its tree
structure
– xlviii –

4.2 Geometric data in a STEP file
The geometric information of the machine model is exported
into a STEP file using the standard interface provided by
Creo. The export functionality automatically generates a .stp
file; a portion of the exported STEP file is shown in Figure
6. The STEP file (.stp) contains all the geometric data
starting from the line defining DATA. The schema used for
defining the model is CONFIG_CONTROL_DESIGN from
AP203.
Figure 6 – A snap view of the STEP file that is exported
from Creo and contains all the geometric information of the
machine tool model
4.3 The STEP Generator using JSDAI and J-Link
The Java development environment used in this study is
Eclipse. JSDAI provides plug-ins that are compatible with
Eclipse. JSDAI also provides an EXPRESS compiler for
compiling the EXPRESS files and creating .jar files for use
in Java programs to represent the data model.
The STEP Generator uses an iterative process to evaluate the
characteristics of the kinematics information and add it
accordingly to the STEP file. To allow JSDAI to manipulate
the model data, the read-and-write access is used for
accessing the data in the generated STEP file with geometric
data and for writing kinematics data to the STEP file to create
a complete STEP model according to the AP 242 EXPRESS
model. A repository is created for JSDAI to store the
temporary kinematics data.
The kinematics information in the Hurco machine model is
defined as constraints. For each constraint, an array will be
created to store the data. This data is written to the STEP
model according to the EXPRESS schema used, i.e., AP 242,
and an example is shown in Figure 7.
Figure 7 – An example of code where the kinematic data of
model feature is extracted for conversion to the STEP format
After going through all the kinematics constraints, a STEP
model representing both geometrical and kinematics data is
generated from JSDAI as a .stp-file and a section of such a
model is shown in Figure 8.
Figure 8 – An example of a complete STEP file (.stp file)
generated by the STEP generator
5. DISCUSSION
This work contributes to the field of system interoperability
and information reuse for machine modeling. During this
study, challenges and issues have been identified, and more
research and development efforts are required to address
them. The challenges are elaborated in the following
subsections from different perspectives: (1) challenges with
the applications of STEP, JSDAI, and J-link, (2) challenges
with converting the machine models and kinematics
information including aspects of verification and validation
of the developed approach, and (3) challenges with the
commercial software and data reuse for end users.
5.1 Challenges with the applications of STEP,
JSDAI, and J-Link
The STEP standard has been a work in progress since its
introduction in 1994 and there are continuous improvements
and new additions to it. One of the latest developments is the
AP 242 edition 2 that integrates the definitions from both AP
203 and AP 214, which are originally developed for different
manufacturing industries. The new AP becomes more
complex and is harder for users to understand and use.
Because the STEP definitions are cumbersome, it requires a
specific software for editing and manipulating a STEP file.
JSDAI covers most definitions that are needed for writing,
reading, and modifying STEP models. This makes JSDAI
applicable to the development of the kind of STEP
generators we described in this paper. However, the
complication of the STEP definitions has also added more
complexity to the JSDAI applications. Since JSDAI is an
open source API, there are few examples demonstrating real
use cases of where JSDAI has been used. The technical
support from the developer of JSDAI is hard to get and the
documentation of JSDAI is not up to date. With better
documentation, more examples, and further developments,
JSDAI can facilitate the implementation of the STEP
standard more efficiently. The effort required for this
implementation was about 4 months for a person with basic
programming skills. By referring the approach proposed and
the lessons learned in this paper, an industry application
could be implemented in a shorter time. More JSDAI
implementations would also motivate the enhancement and
the support of technology.
– xlix –

J-Link enables the interaction between a Creo model and
JSDAI. J-Link provides documentation, guidelines, and
program examples to support developers and users of Creo.
Since the interface and programming environment are
vendor-specific, developers of STEP generators will need to
have knowledge and programming skills for multiple tools.
How the machine model is defined in a CAx specific
software will impact how the data that represents the feature,
part, and object of the machine can be manipulated.
5.2 Challenges with the converting of machine
models and kinematics information
In this study, a couple of constraints (kinematic
properties/pairs) have been converted to the STEP format.
However, automatically identifying and converting all
constraints of the machine model is still challenging. More
effort is needed to ensure the correct usage of the EXPRESS
schema when generating the STEP representations
automatically, i.e., the machine model data exported from
the CAD software is converted correctly to the STEP format.
This involve the STEP generator including the integration of
J-Link and JSDAI applications for exporting the complete
machine model on a neutral format. This leads to an
important topic, the verification and validation (V&V) of the
converted machine model. Is there anything missing during
the model conversion? Does the newly generated STEP
machine model exactly represent the original vendor-
specific machine model? Although V&V has not been a
focus of this study, techniques for V&V of the machine
models have been investigated.
Kinematics information is crucial for the behavior of a
machining system and the accuracy of the kinematics model
determines the precision of the overall machining.
Kinematics modeling is one of the most common sources of
errors for a machine model. Therefore, when remodeling of
kinematics information of a machine tool, it is important to
ensure the kinematics information is converted completely
and correctly between various systems and formats using the
STEP generators. In order to do that, a fundamental
requirement is that the coordinate systems in ISO 10303-105
(STEP part21 file) and in the CAD software need to be the
same. In ISO 10303-105, a link frame is used to define the
local coordinate system of a kinematic pair and all relevant
geometric definitions are defined relative to this link frame.
On the other hand, commercial CAD software has its own
way of defining coordinate systems. Many of them use a
world coordinate system (or a global coordinate system). So
before converting the machine model to the STEP format,
the coordinate system needs to be converted; this includes
the location and orientation information of each pair, in Creo,
and it is for each constraint. The terminology usage in
different CAD environments for the same concept also
causes a lot of confusion which was encountered in the case
presented here; what is referred to as a part in one software
may be called a feature in another software. What is called
constraints in Creo will be called pair or link in STEP. This
poses implications for the extraction of kinematics data and
needs to be adjusted for each vendor-specific CAD software.
Since the terminology for each vendor-specific software
already exists and is being used, this needs to be considered
during the model conversion. It could also be argued that the
terminology should be standardized but it will be a long way
to go not only for the development of the standard, but also
for all vendors to comply with the standard. Note that also
the complexity of the conversion will increase with the
number of axes, e.g., a five-axis machine is more complex
than a three-axis machine.
There are also remaining challenges for the definition of
kinematics in AP 242. It was first introduced in 2014 but is
still not widely used or implemented in industry. Is AP 242
a perfect solution for representing all machine models? In
other words, are the definitions in AP 242 complete for all
the needs of the kinematics definitions? This needs to be
further investigated.
The current situation is that kinematics information is
managed manually in some companies by using a text-based
description or a spreadsheet-like tool. Manual steps
involving humans always has the risk of creating errors.
Most other smaller companies are not even capable of
dealing with kinematics settings at all because of the lack of
knowledge and access to the information. This may cause
production delay, product quality issues, more vendor
dependency, and cost increase.
5.3 Challenges with commercial software and data
reuse for end users
Even though STEP is now an integrated interface in most
CAD software, there is still an unwillingness from the CAx
developers for further implementation of STEP
representations of kinematics modeling. This is because of
the complexity of the implementation, but also because the
vendors and solution providers would like to take advantage
of the situation with customer retentions and lock-in effects
[7]. Most CAx software developers provide vendor-specific
solutions so that customers need to depend on their software.
This situation causes information silos and makes it difficult
for interoperability. It also causes more issues for model and
data reuse for manufacturers because of the diverse
landscape of software and systems they use. It used to be the
same situations for post-processing and Geometric
Dimensioning and Tolerancing (GD&T), which have
currently been implemented using a standard format by most
CAx vendors. So, we hope kinematics modeling is the next
one that people will turn to standardized solutions since there
is a clear need for it from the manufacturing community that
could motivate the CAx software to provide a standardized
solution in the same way as it is for GD&T now.
6. CONCLUSIONS AND FUTURE WORK
The case study presented in this paper demonstrates the
feasibility of generating a complete STEP model that
includes both geometric and kinematics information of a
machine model. This is done by developing a STEP
generator to extract geometric and kinematics data and
– l –
integrate it into the STEP model according to the EXPRESS
schema. The results of the paper include:
A general approach has been developed for how
kinematic and geometrical data can be extracted to
a neutral format. The general approach is meant to
be applicable to all CAx tools.
Explaining how the general approach was used for
a case specific setting, including a description of the
interfaces and software that were used. This is
specific for the tools selected and interfaces
determined for the case study.
The translation of a machine model to the STEP
standard format was explained for a real machine
model developed in the CAD software, PTC Creo.
The case study with the PTC Creo machine model
serves as a feasibility study and demonstrates step-
by-step how this can be done.
The work has real industrial impact and the standards-based
digital representations of a complete machine tool model
enables better information reuse, better interoperability, and
more consistent management. It will help support decision
making throughout the different phases of a production
system including machine tool procurement, efficient
machining capability definition and analysis, dynamic
planning and scheduling by facilitating last-minute
adjustments to adapt current conditions, and configuration
validation. Furthermore, it will save both time and money for
the manufacturing companies.
This is a preliminary study. More real-world industrial cases
will be implemented. Also, more CAx software specific
adapters need to be developed. One scenario could be a real-
world study with supply chains involving several companies
using different systems and those companies representing
both large enterprises and small and medium-sized
enterprises. Supply chains in both process and discrete
manufacturing may be used to demonstrate how existing
challenges in information sharing and model exchange could
be addressed.
Acknowledgements
The work presented in this paper has been supported by the
NIST Model-Based Enterprise (MBE) program and Area of
Advance Production at Chalmers University of Technology
as well as the research projects Digitala Stambanan and 4S
that are funded by the Swedish Agency for Innovation
Systems (VINNOVA).
The authors also would like to thank Dr. Parag Vichare from
University of the West of Scotland for providing the machine
model, Steven Mallia from Purdue University and Yujiang
Li from Siemens for their support, and colleagues from ISO
TC 184 SC4 WG 15 Digital Manufacturing Implementation
Forum for valuable discussions and support.
Disclaimer
No approval or endorsement of any commercial product by
NIST is intended or implied. Certain commercial software
systems are identified in this paper to facilitate
understanding. Such identification does not imply that these
software systems are necessarily the best available for the
purpose.
REFERENCES
[1] NIST, “Product Definitions for Smart
Manufacturing,” www.nist.gov.
https://www.nist.gov/programs-projects/product-
definitions-smart-manufacturing (accessed July 7,
2020).
[2] S.S. Shipp, N. Gupta, B. Lal, J.A. Scott, C.L. Weber,
M.S. Finnin, M. Blake, S. Newsome, and S.
Thomas, “Emerging global trends in advanced
manufacturing,” Institute for Defense Analyses,
Alexandria VA, March 2012.
[3] J. Davis, T. Edgar, J. Porter, J. Bernaden, and M.
Sarli, “Smart manufacturing, manufacturing
intelligence and demand-dynamic performance,”
Computers & Chemical Engineering, vol 47, pp.145-
56, 2012.
[4] SMLC, “Implementing 21st century smart
manufacturing,” In Workshop summary report
SMLC, June 2011.
[5] Y. Lu, K.C. Morris, and S. Frechette, “Current
standards landscape for smart manufacturing
systems,” National Institute of Standards and
Technology, NISTIR 8107, 2016.
[6] P. Vichare, X. Zhang, V. Dhokia, W.M. Cheung,
W. Xiao, and L. Zheng, “Computer numerical
control machine tool information reusability within
virtual machining systems,” Proceedings of the
Institution of Mechanical Engineers, Part B: Journal
of Engineering Manufacture, vol. 232 no. 4, pp. 593-
604, 2018.
[7] P. Vichare, A. Nassehi, and S. Newman, “A unified
manufacturing resource model for representation of
computerized numerically controlled machine
tools,” Proceedings of the Institution of Mechanical
Engineers, Part B: Journal of Engineering
Manufacture, vol. 223 no.5, pp. 463-83, 2009.
[8] T. Kjellberg, A. von Euler-Chelpin, M. Hedlind, M.
Lundgren, G. Sivard, and D. Chen D, “The machine
tool model – A core part of the digital factory,”
CIRP Annals, vol. 58 no. 1, pp. 425-428, 2009.
– li –

[9] S. Zivanovic, N. Slavkovic, B. Kokotovic, and D.
Milutinovic, “Machining Simulations of Virtual
Reconfigurable 5-axis Machine Tool,” Annals of the
Faculty of Engineering Hunedoara, vol. 15 no. 2, pp.
189-94, 2017.
[10] Y. Li, M. Hedlind, T. Kjellberg, and G. Sivard,
”System integration for kinematic data exchange,”
International Journal of Computer Integrated
Manufacturing, vol. 28 no. 1, pp. 87-97, 2015.
[11] ISO 10303-1, Industrial Automation Systems and
Integration–Product Data Representation and
Exchange–Part 1: Overview and Fundamental
Principles, 1994.
[12] T. Kramer and X. Xu, “STEP in a nutshell,” In
Advanced design and manufacturing based on
STEP, Springer, London, pp. 1-22, 2009.
[13] D. Loffredo, “Fundamentals of STEP
implementation,” STEP Tools Inc., pp. 1-12, 1999.
[14] ISO 10303-22: Industrial automation systems and
integration-Product data representation and
exchange-Part 22: Implementation methods:
Standard data access interface specification, 1998.
[15] STEP AP242 Project, http://www.ap242.org/other-
related-standards (accessed July 7, 2020).
[16] STEP Tools, STEP AIM,
https://www.steptools.com/stds/stp_aim/html/
(accessed July 7, 2020).
[17] S.J. Kemmerer, “STEP: the grand experience,”
Washington D.C., US, G.P.O., October 1999.
[18] ISO 10303-105: Industrial Automation Systems and
Integration-Product Data Representation and
Exchange—Part 105: Integrated Application
Resource: Kinematics. International Organization
for Standardization, 1996.
[19] STEP Tools, STEP ARM,
http://www.steptools.com/stds/stp_expg/arm.html
(accessed July 7, 2020).
[20] OpenCascade,
https://www.opencascade.com/doc/occt-
7.0.0/overview/html/occt_user_guides__step.html
(accessed July 7, 2020).
[21] PythonOCC,
http://www.pythonocc.org/category/features_overvie
w/ (accessed July 7, 2020).
[22] JSDAI. Homepage for JSDAI by LKSoft.
http://www.jsdai.net/ (accessed on January 15,
2020).
[23] C. Pan, S.S. Smith, and G.C. Smith, “Automatic
assembly sequence planning from STEP CAD files,”
International Journal of Computer Integrated
Manufacturing, vol. 19 no. 8, pp. 775-83, 2006.
[24] Y. Li, “Implementation and evaluation of kinematics
mechanism modeling based on ISO 10303 STEP,”
Master Thesis, Royal Institute of Technology,
Stockholm, Sweden, 2011.
– lii –
SESSION 1
THE PATH TOWARDS DIGITAL TRANSFORMATION
S1.1 Toward a typology of "going digital"
S1.2 Analysis on the social and economic impacts of Internet platforms
S1.3 5G Healthcare applications in Covid-19 prevention and control

TOWARD A TYPOLOGY OF “GOING DIGITAL”
Cheng Gong1; Vincent Ribiere1
1Institute for Knowledge and Innovation Southeast Asia, Bangkok University
ABSTRACT
With the development of digital technologies, the lines defining traditional industries are blurring. However, there is still a lack of a standard or shared common understanding of digital transformation in terms of its nature and content, change process, underlying mechanisms, and desired outcomes as they are still under-specified. To build a common ground for choosing and using appropriate approaches to manage the “going digital” journey, this paper attempts to illustrate how digital transformation occurs with a proposed typology from a change management perspective based on the cross-case analysis of 103 organizational case studies, and to clarify the essential attributes of an (organizational) digital transformation and how they can be classified into four different types: digitalization, digital mutation, digital metamorphosis, and digital transformation.
Keywords – Change, digitalization, digital transformation, organization, strategy, typology
1. INTRODUCTION
With the fast expansion of digital technologies (e.g., IoT, AI, robotics, cloud computing, mobile and social media, 3D printing, advanced data analytics, blockchain, AR/VR, etc.), the lines defining traditional industries are blurring. The rate of change is increasing, and the time between periods of discontinuity is decreasing [1]. Digital transformation (DT) is a complex undertaking due to its nature of fundamental change. In recent years, it has been one of the buzzwords attracting substantial attention from both academia and practitioner communities. However, unlike well-established fields (e.g., organizational change, information management), there is still a lack of a standard or shared common understanding of DT in terms of its content and process as it is still under-specified. This research builds on our prior research [2] where we developed a unified definition of DT based on the analysis of 134 DT definitions to provide insights into the core defining primitives of DT and linguistic clarity to differentiate it from other related terms. Our unified DT definition is: “A fundamental change process, enabled by the innovative use of digital technologies accompanied by the strategic leverage of key resources and capabilities, aiming to radically improve an entity [e.g., an organization, a business network, an industry, or society] and redefine its value proposition for its stakeholders”. This
paper attempts to illustrate how digital transformation occurs with a proposed typology from a change management perspective.
Typologies identify and classify multiple types of a particular phenomenon of interest. Each type represents a unique combination of attributes that are believed to determine the relevant outcomes [3]. Establishing a DT typology is useful in classifying similar terms with different transformation outcomes. It allows organizations to choose appropriate approaches to successfully embarking and managing their “going digital” journey. On the contrary, a vague classification and inconsistent use of similar terms may lead to various strategizing and organizing activities [4] subconsciously, triggering different disciplines in research and influencing practice [5]. As a result, in recent years, organizations have spent more time and money, but the success rate for DT remains consistently low: estimated less than 30% [6]. A staggering 60 to 80% of DT efforts [7] hit roadblocks and fail since people talk at cross purposes. It is imperative for an organization to have a clear and shared understanding of the change process in terms of DT’s underlying mechanisms, and its desired outcomes. Thus, this paper focuses more on the “how” of digital transformation (i.e., the way DT occurs) and attempts to explain how changes are initiated and how organizations respond to them. The main research question for this study is as follows: What are the main triggering factors of an (organizational) digital transformation, and how can they be classified into types?
2. THEORETICAL BACKGROUND
Digital technologies have opened up game-changing opportunities for significantly improving core business activities and processes, efficiency gains, and customer intimacy while enabling direct exchanges among participants of a value network [8]. They can equally potentially provide existential threats to ensure security and privacy. According to Kurt Lewin’s force field theory [9], changes only come by upsetting the balance of opposing forces in an organization. However, with the diffusion of digital technologies that accumulates competitive milieus, it is hard for most organizations, operating within a dynamic environment, to stay still and to ignore the emerging opportunities and threats driven by digital technologies. DT widens organizations’ attention to broader networks of actors in the business landscape on knowledge flows, co-evolution, network dynamics, and interaction. It differs from the
978-92-61-31391-3/CFP2068P @ ITU 2020 Kaleidoscope– 1 –

traditional forms of strategic change on the basis that digital technologies have accelerated the speed of change, resulting in much more environmental volatility, complexity, and uncertainty [10, 11]. Meanwhile, the emerging new digital technologies are continuing to impact these interactions. A change in the interaction between dynamics at the business landscape and enterprises may transform the structure of social relationships and create pressure (arrival of new technologies, market change, competitive threats) on the organization, leading to the emergence of potential problems and opening a window of opportunities for innovations. Opportunities and threats have been mentioned several times because the awareness of discrete problems is often critical to start a DT process. Associating with the concept of “interpretative flexibility” [12], when changes emerge, different actors in the business landscape have different problem definitions and interpretations that can lead them to explore different solutions and pathways.
3. TYPOLOGIES OF CHANGE
Any suggestion to expand the number of variables in explaining social phenomena raises the concern of the trade-off between accuracy and parsimony. Including more factors might allow for a better description of reality, but it will come at the cost of giving up useful and generalizable simplifications that help us understand common societal processes [13]. We think this logic also applies when developing a typology. There are many ways to classify different types of change. We will briefly discuss the main typologies of change found in the literature, and choose the most appropriate and precise terms to develop our typology, avoiding any potential misunderstanding and ambiguity associated with these terms.
3.1 Changes in general
From a theoretical perspective, we can look at different changes from three perspectives: the timing of the change, the scope of change, and the result of the change.
3.1.1 The timing of the change
Acknowledging the punctuated equilibrium paradigm that explains fundamental changes in patterns of organizational activity [14-16], organizations experience two types of change: incremental change and transformational change. Incremental change occurs during relatively long periods of equilibrium and is associated with the extrapolation of past trends, doing things better, and securing efficiencies from the path dependency perspective. Transformational change occurs during periods of disequilibrium when the organization becomes so misaligned with its external environment that it cannot continue to operate as before.
A slightly different way to look at the timing is to add the organization's intention [17]. Proactive change, is any systematically planned change intended to take advantage of expected situations. It is made early in the disequilibrium cycle, and often before a period of industry upheaval has
even begun. Reactive change generally arises in response to unexpected environmental events or pressures (e.g., strategic initiatives by a competitor). Typically, it comes toward the tail end of periods of industry upheaval.
3.1.2 The scope of the change
Regarding the scope of change, there is incremental change and radical change [17]. Incremental (or continuous) change involves adjustments needed to keep an organization on its chosen path. The change may not necessarily be small, even significant commitments of time, people, and money can be involved, but it has not fundamentally altered the organization’s structures and operating environment. It is part of an orderly flow with a step-by-step continuous improvement. Radical (or discontinuous) change refers to complex, wide-ranging changes brought on by fundamental shifts in the environment. Typically, it requires dramatic changes in strategy and abrupt departures from traditional work, structures, job requirements, and cultures, which in turn necessitate a complete overhaul of the organization [18].
3.1.3 The result of the change
From a change implementation perspective, the nature of change is how change is implemented, either in an all-at-once, big-bang fashion over a relatively short period of time, or in a more step-by-step incremental fashion [19]. It was argued that assessing whether the change should be implemented rapidly or slowly is simple: either the organization is in a crisis (big-bang change) or has time on its side (incremental change). Besides, two types of change results are suggested. Realignment is a change to the way of doing things that do not involve a fundamental reappraisal of the central assumptions and beliefs within the organization. Transformation is a redefinition of mission and purpose to reflect a new direction. Therefore, it encompasses a fundamental shift in the organization’s business model, touching all cultural, structural, and processual aspects.
3.2 Organizational changes while “going digital”
DT has come into wide use in contemporary business media to signify the transformational or disruptive implications of digital technologies for businesses (e.g., new business models, new types of offerings or customer experiences) [6, 19]. Customer experience, operational processes, and business models are three pillars that should be the focal points of DT initiatives [20]. Therefore, thinking about how to redesign operations, so that digital technologies add value by making offerings and processes more effective and efficient, more convenient and agile may be the most common reason for going digital. We will briefly discuss two frequently mentioned types of change in organizations in the context of “going digital.”
3.2.1 Change in the business model
A business model describes the value a company offers to one or several customer segments and the architecture of the
– 2 –
2020 ITU Kaleidoscope Academic Conference

firm and its partners for creating, marketing, and delivering this value and relationship capital to generate profitable and sustainable revenue streams [21]. It is a systemic and holistic description of three key activities: how an organization creates, delivers, and captures value. The depth of a change in how the organization uses digital technologies to create and deliver value and captures profits from managing a system of networked activities [22] will have different results. Either an incremental modification of its business model that added value, or new and expected business model innovations [23-26] that may disrupt an existing market. This means leaders face the “strategic paradox” of finding new ways to balance the contradictory demands of managing complex business models that are likely to change over time [27, 28]. Many start-ups and tech companies are disrupting the market by continuously finding a fundamentally new way of doing business and a good business model that is repeatable and scalable [29]. Its primary focus is on understanding new business logic to fill in digital technology gaps and integrate “digital” into the DNA of the business models [29], engaging in an intensive interaction with the environment (i.e., users, suppliers, stakeholders) to understand needs/pains and how to serve them sustainably. The involved change in business model can be the exploration of digital innovation and radical replacements for manufacturing processes and distribution channels that can potentially transform the business model, or more often incremental steps to deliver the core value proposition better.
3.2.2 Change in organizational structure and processes
The change in organizational structure is defined as “variations in a firm’s organizational setup” [30] to support a digital culture to leverage digital technologies for the benefit of the organization. The term “culture” is defined as “a pattern of shared basic assumptions learned by a group as it solved its problems of external adaptation and internal integration, which has worked well enough to be considered valid and, therefore, to be taught to new members as the correct way to perceive, think, and feel in relation to those problems” [30]. It may include the hierarchy of authority, goals, structural characteristics, the organization’s social structure, administrative procedures, management systems, etc. A digital culture refers to the deeper level of underlying assumptions and beliefs shared by members of an organization in primary “taken for granted” fashion to solve problems through the use of digital technologies. It can be found in incremental change (scope) that enhances the organizational culture and the working conditions for the existing organizational structure [31], and transformative change leads to a new structure. Structural changes may include the creation of a separate unit that maintains a degree of independence from the rest of the organization [32], or create cross-functional teams that remain within the current organization [33, 34], or redesigning internal structures through the decentralization of business units and establishment of independent subsidiaries.
The change in processes refers to the exploitation of digital technologies to improve processes, how processes are altered
to enable flexibility undeterred by change and how change occurs concerning the sequence of activities, production and manufacturing processes (i.e., how the organization assembles products or delivers services), operational processes (i.e., steps and procedures in operating activities), decision-making processes, and communication processes.
4. “GOING DIGITAL” TYPOLOGY
4.1 Dimensions of “going digital” typology
The 103 DT case studies (i.e., journal articles and conference proceedings that apply qualitative or quantitative methods to investigate specific organizations) used as a source of analysis for this paper were identified based on a systematic literature review conducted in the SCOPUS and EBSCO databases. Following the PRISMA (Preferred Reporting Items for Systematic Reviews and Meta-analyses) process, we narrowed down the number of papers from 1744 to 305 with predefined criteria (e.g., limit to peer-reviewed journal articles and conference proceedings, English, from the year 2000 to 2019, etc.). The search query was extended in Google Scholar through a “Snowball” backward and forward reference search up to 354 articles, including highly cited professional papers (e.g., industrial reports) and government reports. In total, 103 case studies were selected after full-text reading. These cases are further analyzed based on their drivers, enablers, scope, and focus of change, stages, barriers, critical success factors, end results, and applied strategies. We found the most appropriate and precise dimensions to depict the “going digital” journey are as follows.
4.1.1 Source of change initiating “going digital” efforts
Change occurs from the perceived current state of reality in the direction determined by intention with the intended result taking control, leading from the problem to the solution. Path-breaking mechanisms, such as exogenous and endogenous shocks, are often needed to trigger changes [35]. Based on the cross-cases analysis, we found that both endogenous and exogenous sources exist while going digital. Organizations may treat DT as an endogenous phenomenon where initiatives are purposefully created to respond to opportunities afforded by digital technologies [36, 37], or as an exogenous threat for the focal organization [38-40]. To depict a clear and precise picture of the organizational change differences in the context of DT, we chose to use the terms “endogenous and exogenous” instead of “proactive and reactive” to better explain the source of change.
From an endogenous viewpoint, the dynamic processes occur due to the interaction with the actors embedded within the organization, rather than outside of it. This process is mostly driven by chasing the digital technologies’ opportunities and triggered without assuming the influence of external context to frame the process. Usually, endogenous renewal results from conscious and planned efforts to develop new offerings, digital innovation, erode the organization’s profit margins and shrink markets, or make up the value deficiencies experienced and/or
– 3 –
Industry-driven digital transformation

anticipated by organizations to ensure their future viability. Influential visionary leaders and open-minded employees proactively embrace the arrival of new technologies and advancement in technologies (invented inside or outside the organization) to initiate changes, aiming to positively impact organization identity and operational routines, or take the first mover or early adopter advantage. Conversely, from an exogenous viewpoint, organizations initiate changes by integrating digital technologies to interact with the outside world. External factors such as competitive market pressures, customers’ growing expectations and fast-changing behaviors empowered by digitalized offerings with various choices, disruptive and/or strong competitors, market velocity, the emergence of new, hybrid or improved digital technologies, new emergent markets are invoked as the ultimate driving forces of change to push organizations to respond to perceived pressures and problems. We think the difference between these two views of change is critical here. Understanding the origin of change is vital to deduce whether the change is mainly driven internally or externally, urgent or not, planned or emergent, and whether it will lead to pivots (fundamental alteration) or iterations (adjustments). In the absence of exogenous pressures, what gets “put in,” in the first place, depends more on the organization itself and its resources and choices to proactively react to digital technologies. The shift of focus from exogenous to endogenous drivers and mechanisms, in this case, may help to avoid making detours or taking wrong paths in the “going digital” process and increase the success rate.
4.1.2 The end result of “going digital”
The use of digital technologies may generate various outcomes (i.e., the consequence of change that relates to processes and offerings, the quality of entities’ relationship with others such as competitiveness, advantages, efficiency), and have a different impact (i.e., the non-quantifiable long-term effects that the change may have: value creation) on the organizations in divergent context. We explained how going digital can differ according to the patterns by which the nature of change relates to the expected outcome produced while developing the unified definition of DT. In essence, the improvement can either be radical (DT) or incremental (digitalization), implying either the emergence of redefining value proposition (DT) by capability-driven outcome (e.g., business model innovation, new revenue streams, radical changes in offerings, and game-changing restructure), or reinforcing an existing value proposition (digitalization) by economic-driven outcome (e.g., efficiency, cost reduction, errors elimination, and productivity). Aligning with the end result of change (e.g., realignment and transformation), we think what marks digitalization out as a realignment rather than DT is the extent to which the changes do not really extend beyond concerns for efficiency, productivity and profitability, the fundamental influence of the organization’s identity and the way employees think about their work.
4.2 A typology of “going digital”
The typology illustrated in Figure 1 is defined in terms of two dimensions – the source of change and the end result of the change. Change is characterized as exogenous or endogenous on the vertical axis of the matrix. The horizontal axis deals with the end result of a particular change, either realignment or transformation. In a nutshell, four types of change are identified: digitalization, digital mutation, digital metamorphosis, and digital transformation, and explained with typical examples.
Figure 1 – A typology of “Going digital”
4.2.1 Digitalization
Digitalization is a non-fundamental exogenous change undertaken to realign the way the organization operates and reinvent the existing value proposition. When there is external pressure due to a successful new strategy adopted by a competitor or changes in the availability of a key resource, organizations will respond by a non-fundamental change implemented gradually through staged initiatives to adapt and exploit digital technologies (if the external pressure doesn’t have a threatening effect); or respond by realigning organizational operation in a much faster and dramatic fashion (if an immediate change is required). This kind of change is not about doing things in fundamentally different ways, nor about fundamentally different things, but about keeping pace with the emergent digital technologies. Digitalization may involve incremental changes in reaction to external problems, events, or pressures; or significant changes through large-scale and simultaneous project implementation to address the decline in organizational performance, resulting from the increasing misalignment with the operating environment. However, these initiatives are still rooted in the organization’s existing paradigm, and they do not change the organization's identity. It usually requires digitizing problematic processes in operations or automation of inefficient processes to optimize workflow efficiency, cost reduction, and productivity. To fill this gap of insufficient knowledge base within the organization, and fully integrate digital technologies to achieve corrective maintenance and problem-solving, organizations may involve a merger or acquisition of a high-tech start-up, or running accelerator projects and hackathons, or organizing
– 4 –
2020 ITU Kaleidoscope Academic Conference

innovation labs in collaboration with a start-up community and existing accelerator [41], or incremental efforts of network building or extension. For example, global trade barriers and the lack of transparency have affected the cost of shipping for many players in the shipping industry and increased the inefficiency level in international supply chains. Maersk, a shipping container company, partnered with IBM and government authorities to deploy blockchain technology for fast and secure access to end-to-end supply chain information to solve these problems and reinforced its value proposition to provide a fast, reliable, cost-efficient shipping service to its core customers [42]. ThyssenKrupp, a German industrial group with different divisions, developed a data-driven system under the external pressure from competitors and the demand of high-performance elevators with superior reliability. ThyssenKrupp outfitted its elevator components with sensors to collect and evaluate relevant technical and mechanical information through predictive analytics so that employees can receive warning alerts and maintenance recommendations. It not only allows ThyssenKrupp to increase profitability by offering a premium maintenance add-on service, but also enhances transparency regarding maintenance requirements to benefit customers, employees, partners, and other stakeholders, in turn, generating new revenue streams for the company [43].
4.2.2 Digital mutation
Digital mutation is a non-fundamental endogenous change, where proactive initiatives are undertaken to participate in internal motivation. A gene mutation is a change in the genetic sequence or an induced misspelling of the DNA sequence, resulting from DNA copying mistakes made during cell division inside the body. When a mutation in DNA happens, a change in one or more DNA bases or a single base pair is changed into another base pair, then different proteins can be produced, affecting an organism's traits. Similarly, organizational reproduction processes may lead to inconsistencies that manifest as conflicting demands on those working in the organization. In the case of digital mutation, organizational practices and routines will frame processes to integrate digital technologies at hand to adjust the inconsistencies. In other words, when there is internal motivation and no immediate requirement to change, organizations will take a gradualist paradigm to adapt to opportunities and engage in continuous incremental change (step-by-step) by using digital technologies. Digital mutation is to alter operational activities in the organization while maintaining alignment between its original identity, such as redesigning the operational process or digitize the inefficient manual processes, internal communication channels to improve work efficiency; training employees with required skills and competencies to take full advantage of its knowledge base. Under the premise of endogenous motivation without immediate pressure to change, this is the most common, least intense, and less risky pathway to go digital. In some cases, digital mutation is deemed to be internally visible only. For example, to address the organizational structural and operational requirements of deploying big data analytics, Audi created a subsidiary (Audi
Business Innovation GmbH) to extend the capabilities of its existing departments, which enabled the formation of multidisciplinary teams and networks and changed Audi’s traditional organizational structure to enjoy IT-driven initiatives for the benefit of business units in 5 years [33]. Similarly, Volvo established its innovation hub to bring different parts of the firm from its executive team, R&D, global offers, global marketing, accessories, IT, design, product strategy, and customer services to the same table to enable effective knowledge sharing and gain enough momentum to be self-sustaining by digital innovation [34].
4.2.3 Digital metamorphosis
Digital metamorphosis is a fundamental endogenous change, where proactive initiatives are undertaken in the participation of internal motivation. Thinking about the process by which a caterpillar morphs into a butterfly, a caterpillar digests itself using enzymes triggered by hormones and disintegrates all of its tissues except for the imaginal discs, which are certain highly organized groups of cells that put themselves back together into a new shape and grow each body parts of the butterfly. When there is internal motivation driven by the development of new offerings to new markets or caused by anticipation of future opportunities and the need for change to integrate digital technologies, organizations need to take effective actions to initiate transformation as soon as possible (if an urgent need to take action to enjoy the first-mover or early adopter advantages), or redefine the strategic vision (if it involves a relatively gradual process of continuous frame bending). This type of transformation is proactive and radical in scope. It can be related to disruption or transformation in a step-by-step fashion. Digital metamorphosis can refer to newcomers to the industry or start-ups that find a fundamentally new way of doing business in the industry. It can change the logic of an entire industry, and push organizations to become the standard for the next generation of products and companies [41] by using a get-out-of-the-building approach [29] and by getting a good understanding of users, suppliers, and stakeholders. The process of such transformation is inherently uncertain: changes need to be made provisionally and then adjusted; decisions need to be made quickly, and groups from all over the organization need to get involved [44]. For example, Uber’s impact on taxis in the personal transportation sector [45] and Airbnb’s impact on hospitality in the accommodation sector [46] are frequently cited examples of digital disruption. They affect their respective industries by introducing business model innovation and a platform logic by instilling competitive processes in the digital economy, especially the sharing economy. Netflix pivoted from DVD delivery to a streaming service, where having access is more important than ownership. The key to embarking on a transformational change is to actively sense and seize the opportunities associated with digital technologies and avoid problems rather than passively waiting for things to go wrong or decline before taking action. Be alert that the need for change may not be obvious to all. For example, without any external pressure, the CEO with a visionary and cooperative leadership style in AssetCo’s (a
– 5 –
Industry-driven digital transformation

pseudonym), a mid-sized European financial services provider, drives the transformation to be the “first digital asset manager” in the industry in 2 years with its digital metamorphosis guidelines. A top-down building block for the digitization of existing offerings (its main lines of business) and a bottom-up building block for realizing new and digital offerings (by actively pulling digital innovation from the organization and collaborating with PropTech start-ups) were implemented together step-by-step [47].
4.2.4 Digital transformation
Digital transformation is a fundamental exogenous change undertaken to redefine the value proposition to the organization's stakeholders. When there is external pressure in terms of a changing competitive context that require a fast and simultaneous change of all the basics, organizations will reactively respond by using digital technologies to embark on a process of revolutionary change, which includes organizational frame-breaking and the destruction of some elements of the system via simultaneous initiatives on many fronts, and often in a relatively short space of time. It usually requires to develop new digital services or customer relationship management solutions to radically change internal communication or service processes by using digital technologies to align silos in the direction of the customer, employee, and other stakeholders. It can produce dramatic changes in product and service offerings, competitiveness, and performance through new business models and revenue streams. The organization sees the need to preempt fast competitor response and realizes that rapid change is necessary to meet changing customer needs. Therefore, the critical success factor is to implement the planned transformation rapidly. The primary objective of this transformation efforts is the exploration of new opportunities: finding and connecting new and enriching existing resources (i.e., products, people, platforms) and creating new schemes, especially when they lead to creating entirely new products and opportunities to become a platform or a valuable platform add-on. Compared to digital metamorphosis, the main difference is that digital metamorphosis is initiated before the improved performance is needed, whereas the DT is initiated after the improved performance is needed. Digital technologies provide bandwidth connectivity, which makes data, information, and knowledge more widespread and available. This type of transformation requires fast reaction to market changes and continually pursues long-term impact and win-win situations with its stakeholders by building ecosystems and platforms. Understanding how to harness business model innovation, empower employees, resolve inertia, communicate new vision, and develop digital transformation strategies in a complex system with many forces at work to reach the connectedness of choices, rapidly test and scale new business models, mitigate and take advantage of changing day-to-day external threats and opportunities to ensure the survival of organizations in the overall business landscape, and maximize their effectiveness in creating sustainable collaborative advantage. For example, Alibaba looks like a portfolio of businesses. Its strategic imperative is to ensure that its platform provided all the
resources, or access to the resources, to support its ecosystem to accommodate innovations in advanced technologies and create new types of businesses, which completely reinvented and transformed China’s retail sector. Alibaba’s platform made it easy to outsource functions like selecting suppliers, negotiating prices, enforcing contracts, managing payments, and more. Another example is Foxconn, the electronic manufacturer that supplies products for well-known brands such as Apple, moves from being an assembly line manufacturer to a high-tech service company that invents its own technology and provides data services for mobile telecom providers across China.
5. CONCLUSION
“Going digital” might remain the top management tick-box item, especially after being struck by a global pandemic. Organizations may be aware of the need for change and the desire of embracing digital technologies, but they may not always have sufficient knowledge on what are the “best practices” out there they can imitate, what are the possible pathways they can choose concerning different end results, what are the critical success factors and capabilities they need to put knowledge into action in support of DT. The proposed typology generates 4 patterns of how “going digital” can be differentiated and clarifies and illustrates the underlying mechanism of change and its desired outcome. By borrowing the biological terms “mutation” and “metamorphosis” to further elaborate the source of change in the context of “going digital,” the typology allows us to capture the essential differences of how organizations may initiate strategic change to embark on the journey. Depicting a clearer and standardized understanding of how organizations, with different sizes in different industries, can strategically position themselves in the typology to maximize the success rate also contributes to the conceptual standardization of digital-related change and transformation in guiding empirical studies and organizational practices. This study set out to respond to the need for developing a practical typology that emphasizes the pattern of how to “go digital” and provides a base for developing scenarios of various pathways that organizations may take to embark on a change or transformation journey. Concerning the source of change (endogenous and exogenous), an organization can be involved in more than one type of change or transformation simultaneously. The most popular change path may be the digitalization followed by digital metamorphosis because many senior executives delay the change until the performance has declined to such an extent that it forces them into a reactive change, as predicted by punctuated equilibrium change models. It may also be necessary to follow a transformational change moving to incremental change, ensuring the changes are embedded throughout the organization. Future research can further investigate the subcategories of this typology, elaborating the pathways and their possible sequence (how organizations can switch from one typology to another). The proposed typology is limited to review 103 studies in the literature by a cross-cases analysis. Future research can further validate this typology and empirically test it with preliminary data.
– 6 –
2020 ITU Kaleidoscope Academic Conference

REFERENCES
[1] D. A. Nadler and M. L. Tushman, "Types of organizational change: From incremental improvement to discontinuous transformation," Discontinuous Change, pp. 15-34, 1995.
[2] C. Gong and V. Ribiere, "Developing a unified definition of digital transformation.(under review)," n.d.
[3] D. H. Doty and W. H. Glick, "Typologies as a unique form of theory building: Toward improved understanding and modeling," Academy of management review, vol. 19, no. 2, pp. 230-251, 1994.
[4] K. S. Warner and M. Wäger, "Building dynamic capabilities for digital transformation: An ongoing process of strategic renewal," Long Range Planning, vol. 52, no. 3, pp. 326-349, 2019.
[5] J. P. Hausberg, K. Liere-Netheler, S. Packmohr, S. Pakura, and K. Vogelsang, "Research streams on digital transformation from a holistic business perspective: a systematic literature review and citation network analysis," Journal of Business Economics, vol. 89, no. 8-9, pp. 931-963, 2019.
[6] H. De la Boutetière, A. Montagner, and A. Reich, "Unlocking success in digital transformations," 2018, Available: https://www.mckinsey.com/business-functions/organization/our-insights/unlocking-success-in-digital-transformations.
[7] J. Macaulay. (2019). Most Digital Transformations Fail, Here’s How to Change That. Available: https://ceoworld.biz/2019/03/30/most-digital-transformations-fail-heres-how-to-change-that/
[8] R. Hansen and S. K. Sia, "Hummel's Digital Transformation Toward Omnichannel Retailing: Key Lessons Learned," MIS Quarterly Executive, vol. 14, no. 2, 2015.
[9] K. Lewin, "Field theory in social science: selected theoretical papers (Edited by Dorwin Cartwright.)," 1951.
[10] J. Loonam, S. Eaves, V. Kumar, and G. Parry, "Towards digital transformation: Lessons learned from traditional organizations," Strategic Change, vol. 27, no. 2, pp. 101-109, 2018.
[11] C. Matt, T. Hess, and A. Benlian, "Digital transformation strategies," Business Information Systems Engineering, vol. 57, no. 5, pp. 339-343, 2015.
[12] W. Bijker, "Sociohistorical technology studies," Handbook of science technology studies, pp. 229-256, 1995.
[13] E. A. Koning, "The three institutionalisms and institutional dynamics: understanding endogenous and exogenous change," Journal of Public Policy, vol. 36, no. 4, pp. 639-664, 2016.
[14] C. J. Gersick, "Revolutionary change theories: A multilevel exploration of the punctuated equilibrium paradigm," Academy of Management Review, vol. 16, no. 1, pp. 10-36, 1991.
[15] D. Miller and P. H. Friesen, "Momentum and revolution in organizational adaptation," Academy of Management Journal, vol. 23, no. 4, pp. 591-614, 1980.
[16] M. L. Tushman and E. Romanelli, "Organizational evolution: A metamorphosis model of convergence and reorientation," Research in Organizational Behavior, 1985.
[17] H. W. Oden, Transforming the organization: A social-technical approach. Greenwood Publishing Group, 1999.
[18] J. Coleman, Henry J, "What enables self-organizing behavior in businesses," Emergence, vol. 1, no. 1, pp. 33-48, 1999.
[19] J. Balogun and V. H. Hailey, Exploring strategic change, 4 ed. Pearson Education, 2015.
[20] M. Fitzgerald, N. Kruschwitz, D. Bonnet, and M. Welch, "Embracing digital technology: A new strategic imperative," MIT Sloan Management Review, vol. 55, no. 2, p. 1, 2014.
[21] A. Osterwalder, "The business model ontology a proposition in a design science approach," Université de Lausanne, Faculté des hautes études commerciales, 2004.
[22] R. Amit and C. Zott, "Creating value through business model innovation," MIT Sloan Management Review, pp. 36-44, 2012.
[23] R. Amit and C. Zott, "Value creation in e-business," Strategic Management Journal, vol. 22, no. 6‐7, pp. 493-520, 2001.
[24] J. Aspara, J.-A. Lamberg, A. Laukia, and H. Tikkanen, "Corporate business model transformation and inter-organizational cognition: The case of Nokia," Long Range Planning, vol. 46, no. 6, pp. 459-474, 2013.
– 7 –
Industry-driven digital transformation
[25] H. Chesbrough, "Business model innovation: opportunities and barriers," Long Range Planning, vol. 43, no. 2-3, pp. 354-363, 2010.
[26] B. W. Wirtz, O. Schilke, and S. Ullrich, "Strategic development of business models: implications of the Web 2.0 for creating value on the internet," Long Range Planning, vol. 43, no. 2-3, pp. 272-290, 2010.
[27] W. K. Smith, A. Binns, and M. L. Tushman, "Complex business models: Managing strategic paradoxes simultaneously," Long Range Planning, vol. 43, no. 2-3, pp. 448-461, 2010.
[28] C. Velu and P. Stiles, "Managing decision-making and cannibalization for parallel business models," Long Range Planning, vol. 46, no. 6, pp. 443-458, 2013.
[29] S. Blank, "Why the lean start-up changes everything," Harvard Business Review, vol. 91, no. 5, pp. 63-72, 2013.
[30] E. H. Schein, Organizational culture and leadership. John Wiley & Sons, 2010.
[31] N. Safrudin, M. Rosemann, J. C. Recker, and M. Genrich, "A typology of business transformations," The 360º Business Transformation Journal, vol. 2014, no. 10, pp. 24-41, 2014.
[32] A. Maedche, "Interview with Michael Nilles on “What Makes Leaders Successful in the Age of the Digital Transformation?”," Business Information Systems Engineering, vol. 58, no. 4, pp. 287-289, 2016.
[33] C. Dremel, J. Wulf, M. M. Herterich, J.-C. Waizmann, and W. Brenner, "How AUDI AG Established Big Data Analytics in Its Digital Transformation," MIS Quarterly Executive, vol. 16, no. 2, 2017.
[34] F. Svahn, L. Mathiassen, and R. Lindgren, "Embracing Digital Innovation in Incumbent Firms: How Volvo Cars Managed Competing Concerns," MIS Quarterly, vol. 41, no. 1, 2017.
[35] S. M. Laudien and B. Daxböck, "Path dependence as a barrier to business model change in manufacturing firms: insights from a multiple-case study," Journal of Business Economics, vol. 86, no. 6, pp. 611-645, 2016.
[36] G. Vial, "Understanding digital transformation: A review and a research agenda," The Journal of Strategic Information Systems, vol. 28, no. 2, pp. 118-144, 2019.
[37] B. Tan, S. L. Pan, X. Lu, and L. Huang, "The role of IS capabilities in the development of multi-sided platforms: the digital ecosystem strategy of Alibaba. com," Journal of the Association for Information Systems, vol. 16, no. 4, p. 2, 2015.
[38] W. Li, K. Liu, M. Belitski, A. Ghobadian, and N. O'Regan, "e-Leadership through strategic alignment: An empirical study of small-and medium-sized enterprises in the digital age," Journal of Information Technology, vol. 31, no. 2, pp. 185-206, 2016.
[39] S. K. Sia, C. Soh, and P. Weill, "How DBS Bank Pursued a Digital Business Strategy," MIS Quarterly Executive, vol. 15, no. 2, 2016.
[40] H. C. Lucas Jr and J. M. Goh, "Disruptive technology: How Kodak missed the digital photography revolution," The Journal of Strategic Information Systems, vol. 18, no. 1, pp. 46-55, 2009.
[41] Z. Tekic and D. Koroteev, "From disruptively digital to proudly analog: A holistic typology of digital transformation strategies," Business Horizons, vol. 62, no. 6, pp. 683-693, 2019.
[42] N. Furr and A. Shipilov, "Digital doesn't have to be disruptive: the best results can come from adaptation rather than reinvention," Harvard Business Review, vol. 97, no. 4, pp. 94-104, 2019.
[43] D. Schallmo, C. A. Williams, and L. Boardman, "Digital transformation of business models—best practice, enablers, and roadmap," International Journal of Innovation Management, vol. 21, no. 08, p. 1740014, 2017.
[44] B. Tabrizi, E. Lam, K. Girard, and V. Irvin, "Digital transformation is not about technology," Harvard Business Review, vol. 13, 2019.
[45] T. Berger, C. Chen, and C. B. Frey, "Drivers of disruption? Estimating the Uber effect," European Economic Review, vol. 110, pp. 197-210, 2018.
[46] D. Guttentag, "Airbnb: disruptive innovation and the rise of an informal tourism accommodation sector," Current issues in Tourism, vol. 18, no. 12, pp. 1192-1217, 2015.
[47] S. Chanias, M. D. Myers, and T. Hess, "Digital transformation strategy making in pre-digital organizations: The case of a financial services provider," The Journal of Strategic Information Systems, vol. 28, no. 1, pp. 17-33, 2019.
– 8 –
2020 ITU Kaleidoscope Academic Conference

ANALYSIS ON THE SOCIAL AND ECONOMIC IMPACTS OF INTERNET PLATFORMS
(Based on Survey Data from WeChat (China) during 2019-2020)
Anqi Zheng
China Academy of Information and Communications Technology (CAICT), China
ABSTRACT
In recent years, the global economy has been going through a critical period of economic growth driver transformation, with further economic slowdown. At the same time, the outbreak of COVID-19 has brought a severe blow to the world’s economy. Against these backdrops, the digital economy has presented extraordinary resilience of development, bringing unprecedented opportunities to various industries and injecting new momentum to social and economic development. How large is the impact of the Internet platform economy on economic and social development? Will it increase the overall employment or influence the employment structure? Has the Internet platform truly stabilized the economy and society during the outbreak? Through case studies on the survey data from WeChat during 2019-2020, this paper employs questionnaire-based statistical approach and the expenditure approach applied in measuring national economic accounting to unveil the impacts of Internet platforms on economic and social development, hoping to provide reference to future studies in the field.
Keywords – COVID-19, employment, Internet platform, social & economic impacts
1. INTRODUCTION
Against the backdrop of the global economic downturn and the pneumonia epidemic in COVID-19, the digital economy has presented extraordinary resilience of development, bringing unprecedented opportunities to various industries and injecting new momentum to social and economic development.
This paper studies WeChat as a typical case of an Internet platform due to the fact that WeChat has become an icon of China’s digital economy. As of the end of 2019, the combined number of monthly active users of WeChat has reached 1.164 billion, gaining widespread recognition from Chinese and foreign users. Various Internet platforms, represented by WeChat, have formed new means of production relying on functions like official account, applet, e-payment and corporate services, which have become a necessary component in various industries, joining hands with partners to form a new ecology, build new infrastructure, and facilitate the deep integration of data elements with
traditional industries, bringing about great changes to the economy, society, the way of production, and lifestyles.
2. LITERATURE REVIEW
As a typical component of the digital economy, Internet platforms bring new drivers for employment.
First, as an important channel for boosting employment, Internet platforms have brought digital dividends. The research on the new economy conducted by Hu Angang in 2016 found that the number of jobs directly related to digital technologies, such as information transmission, computer service and software, have experienced tremendous growth, indirectly driving the increase of digital-technology-related jobs in other fields, including such emerging businesses as delivery service and online car-hailing services [1]. In the empirical research on the impacts of the digital economy on individuals’ job-seeking decisions, which is based on the survey data obtained through family tracking, it suggests that the dividends of the digital economy have more significant impacts in facilitating the employment decision-making of people with better educational backgrounds [2].
Second, the substitution effects of the platform economy on traditional economy, and the platform’s two-sided market mode, stimulate the ultrafast development of Internet platforms and thus contribute to the job market. Li Xiaohua pointed out in his study of 2019 that Internet platforms have liberated enterprises from the restriction of resources and capacities on their growth, making Internet platform companies grow faster than traditional companies and creating more jobs [3]. At the same time, the digital economy would also provide more resources and interactions for small and medium-sized enterprises (SMEs), facilitate them grow and further boost job markets.
In addition, the Internet platform economy fosters three new industrial drivers and plays an active role in the adjustment of employment structures. The research based on the panel data of 30 provinces from 2009 to 2019 by Wang Wen (2020) showed that the improvement of industrial intelligence has significantly reduced the employment share of the manufacturing industry, while it has increased the employment share of the service industry, especially the knowledge and technology-intensive modern service industry, promoted the upgrading of the employment
978-92-61-31391-3/CFP2068P @ ITU 2020 Kaleidoscope– 9 –

structure of the industry, and contributed to the realization of high-quality employment [4]. In the study on the digital economy’s employment effects, which is based on a non-competitive employment input-occupancy-output model, it indicates that industrial convergence between ICT and traditional industries can spur on the economic expansion, leading to a gradual extension of consumption-driven employment effects.
Meanwhile, the digital economy has a greater influence on the employment of technology-intensive manufacturing and that of labor-intensive and capital-intensive sectors, and presents strong employment effects in the producer service sector, driving the industrial economy of China to transform from being labor-intensive to technology-intensive [5].
In addition, the increasing convergence of Internet platforms with other industries fosters new technologies, new industries and new business formats, and the application of new technologies also helps reshape the operation modes of traditional industries and traditional economy, thus contributing to social employment. David Autor’s study assumed that existing research on the impacts of new technologies on the labor market have overplayed the substitution effects, arguing that the new technologies haven't reduced the overall employment, but rather complemented labor forces while replacing them, boosting output and labor demands and thus contributing to employment [6].
Zhan Xiaoning and Ouyang Yongfu pointed out in their study (2018) that the FDI of digital economy, including investment and technologies in digital, intelligent and automated fields, is crucial to the upgrading and transformation of traditional industries and the improvement of global competitiveness, thus exerting an indispensable role in boosting the employment of traditional industries [7].
With the task-based theoretical models, Acemoglu and Restropo explained that apart from the substitution effects on the labor market, automation, artificial intelligence and robotics will also create new work tasks that require the laborers’ competitive advantages, and the capital accumulation and the improvement of automated productive efficiency coming along will also produce new tasks, increasing labor demands and thus creating more jobs [8].
Wang Mengfei and Zhang Xiwei (2020) proposed that the technological changes brought about by the digital economy will reshape the conventional production mode, and that intelligent production enhances the replacement of materialized labor and cuts employment. Parallel to this, knowledge-intensive industries, such as technological R&D and algorithm studies, is gradually becoming a new labor-intensive industry, providing more job opportunities [9].
3. METHODOLOGY
This paper adopts the statistical method for measuring direct employment and stimulation effects on economy, and the data is obtained from questionnaires on the WeChat platform. The calculation of indirect employment is conducted through the expenditure method of the national economic accounting methods, with the data coming from statistics related to consumption in personal questionnaires. To investigate the social and economic influences of the WeChat platform during the outbreak, we chose to distribute and take back the questionnaires between March and April, targeting business operators and service providers of the platform. Finally, we managed to collect 1189 effective answers from corporate service providers, 470 from payment service providers, 103 from applet service providers, 2,186 from official account operators and 946 from applet developers.
Figure 1 – Employment estimation model
3.1 Calculation of the economic impact of WeChat
The economic impact of WeChat mainly refers to the driving of consumption (in the same caliber as GDP), including information consumption and the driving of traditional consumption. Information consumption refers to the information products and services purchased and used by residents or governments in the accounting period to meet personal or public needs, which can be divided into information product consumption and information service consumption. At the same time, through the Internet platform, mobile payment and other means, information consumption can greatly drive consumption in other fields, and promote the vigorous development of emerging consumption such as online shopping, online take-outs, online travel, ride-sharing, online education and telemedicine, and create a new ecology of digital economy.
– 10 –
2020 ITU Kaleidoscope Academic Conference
Table 1 – Consumption models driven by WeChat
Type Contents
Net flow traffic consumption
Net flow
Information service consumption
Online games, online reading, giving a like to articles, etc.
Catering Conducted food and beverage consumption such as ordering and taking out through WeChat
Shopping Shopped through WeChat Life services
Experienced residential and living services such as cleaning, maintenance, nanny employment, water and electricity payment, etc. through WeChat
Transportation
Conducted transportation consumption such as taking a taxi, buying a train ticket, booking a hotel etc. through WeChat
Education
Made a payment for education and learning such as course study and training through WeChat
Entertainment
Consumed on cultural and entertainment such as watching movies, watching TV series, listening to music, and booking concert tickets, etc. through WeChat
Medical treatment
Made a payment for medical treatment and health services, such as health and fitness, physical examination and medical treatment, etc. through WeChat
3.2 Calculation of the employment directly driven by WeChat
Employment directly driven by WeChat refers to the number of jobs directly provided by WeChat, including related jobs brought by WeChat, such as Enterprise WeChat service providers, WeChat payment service providers, applet service providers, WeChat public platform, WeChat payment merchants and applet development.
The employment directly driven by WeChat consists of two parts: the employment driven by service providers and the employment driven by operators. Among them, service providers include Enterprise WeChat service providers, WeChat payment service providers and applet service providers, and operators include WeChat public platforms and applet developers. Therefore, we can get the quantity of employment directly driven by WeChat by summing up the employment of the above departments. The specific formula is:
𝐿𝐿𝐿𝐿𝑙𝑙 = 𝐿𝐿𝐿𝐿𝑆𝑆𝑆𝑆𝑆𝑆𝑆𝑆𝑆𝑆𝑆𝑆𝑆𝑆 𝑃𝑃𝑆𝑆𝑃𝑃𝑆𝑆𝑆𝑆𝑃𝑃𝑆𝑆𝑆𝑆 + 𝐿𝐿𝐿𝐿𝑂𝑂𝑂𝑂𝑆𝑆𝑆𝑆𝑂𝑂𝑂𝑂𝑃𝑃𝑆𝑆 (1)
𝐿𝐿𝐿𝐿𝑆𝑆𝑆𝑆𝑆𝑆𝑆𝑆𝑆𝑆𝑆𝑆𝑆𝑆 𝑃𝑃𝑆𝑆𝑃𝑃𝑆𝑆𝑆𝑆𝑃𝑃𝑆𝑆𝑆𝑆 = ∑ ∑ 𝜆𝜆𝑖𝑖𝑂𝑂𝑖𝑖𝑚𝑚𝑖𝑖=1𝑥𝑥
3𝑗𝑗=1 × 𝑛𝑛 (2)
𝐿𝐿𝐿𝐿𝑂𝑂𝑂𝑂𝑆𝑆𝑆𝑆𝑂𝑂𝑂𝑂𝑃𝑃𝑆𝑆 = ∑ 𝑞𝑞𝑥𝑥’
2𝑗𝑗=1 × 𝑛𝑛’ (3)
Within this, 𝐿𝐿𝐿𝐿𝑙𝑙 represents the total employment directly driven by WeChat; 𝐿𝐿𝐿𝐿𝑆𝑆𝑆𝑆𝑆𝑆𝑆𝑆𝑆𝑆𝑆𝑆𝑆𝑆 𝑃𝑃𝑆𝑆𝑃𝑃𝑆𝑆𝑆𝑆𝑃𝑃𝑆𝑆𝑆𝑆 represents employment driven by service providers; 𝐿𝐿𝐿𝐿𝑂𝑂𝑂𝑂𝑆𝑆𝑆𝑆𝑂𝑂𝑂𝑂𝑃𝑃𝑆𝑆 represents employment driven by operators. In the calculation formula of employment driven by service providers, 𝜆𝜆𝑆𝑆 represents the proportion of employees in WeChat-related businesses in each enterprise, and 𝑝𝑝𝑆𝑆 represents the number of employees in each enterprise; 𝑛𝑛 represents the number of such service providers, while 𝑥𝑥 represents the number of valid questionnaires of such service providers, that is, 𝑥𝑥/𝑛𝑛 represents the proportion of service providers participating in the survey. Similarly, in the calculation formula of operators, 𝑞𝑞 represents the total number of development and operation personnel in the operators surveyed, 𝑛𝑛’ represents the number of such operators, and 𝑥𝑥’ represents the number of effective questionnaires of such operators, that is, 𝑥𝑥’/𝑛𝑛’ represents the proportion of operators participating in the survey.
Since direct employment includes full-time and part-time employment, the calculation method of part-time employment is to remove the number of full-time employment from the total number of employment opportunities. The specific formula is:
𝐿𝐿𝐿𝐿 = (𝐿𝐿𝐿𝐿𝑆𝑆𝑆𝑆𝑆𝑆𝑆𝑆𝑆𝑆𝑆𝑆𝑆𝑆 𝑃𝑃𝑆𝑆𝑃𝑃𝑆𝑆𝑆𝑆𝑃𝑃𝑆𝑆𝑆𝑆 +𝐿𝐿𝐿𝐿𝑂𝑂𝑂𝑂𝑆𝑆𝑆𝑆𝑂𝑂𝑂𝑂𝑃𝑃𝑆𝑆 ) × (1 − 𝐿𝐿𝑓𝑓𝑓𝑓𝑙𝑙𝑙𝑙−𝑂𝑂𝑆𝑆𝑡𝑡𝑆𝑆) (4)
Among them, 𝐿𝐿𝑓𝑓𝑓𝑓𝑙𝑙𝑙𝑙−𝑂𝑂𝑆𝑆𝑡𝑡𝑆𝑆 represents the proportion of full-time employees.
3.3 Calculation of the employment indirectly driven by WeChat
Employment indirectly driven by WeChat means that WeChat not only directly provides WeChat-related jobs, but also drives the growth of information consumption and consumption in traditional industries, and its economic growth also drives the growth of employment, which is the employment indirectly driven by WeChat, such as take-away riders and retailers.
For the employment indirectly driven by WeChat, this paper shall adopt the expenditure method in the national economic accounting method for calculation. This is because, from the perspective of a national economic accounting method, the economic contribution of WeChat is more suitable to adopt the expenditure method, that is, the consumption driven by WeChat is taken as its contribution to GDP.
An input-output model for the WeChat ecology is established in this paper, and the improvements in two aspects are made on the basis of the traditional input-output model. First, all industrial departments are collectively responded to eight departments related to WeChat; second, a sub-structured employment matrix has been added, in which the employed people are grouped according to gender, age, education level, full-time and part-time jobs, etc., which is convenient to reflect the different types of employed people.
– 11 –
Industry-driven digital transformation

Table 2 – The input-occupation-output partially closed model reflecting WeChat
Intermediate use Final demand Total output/Total input
Department 1
Department 2
……
Department 8
Department 1
Department 2
……
Department 8
Intermediate input
Y1 Y2 …… Y8 F1 F2 …
… F8 Yl
Import M1 M2 …
… M8 F1’ F2’ …… F8’ Ml
Added value
V1’ V2’ …… V8’
Total input
Y1’ Y2’ …… Y8’
Total employment
L
As shown in Table 2, it reflects the input-occupancy-output partially closed model of WeChat. There are 8 departments corresponding to WeChat, and Y𝑠𝑠,M𝑠𝑠,V𝑙𝑙 ’and Y𝑙𝑙 ’ respectively represent the intermediate input, import, added value and total input of the sth department, while the final demand output is F𝑠𝑠,Y𝑙𝑙 and M𝑙𝑙 , which respectively represent the total output and total input. L is a matrix of r × n, which indicates different types of employment, for example, r=1 by gender, r=2 by age, and r=3 by educational qualifications.
According to the input-output table of WeChat, we can deduce the direct consumption coefficient 𝑎𝑎𝑠𝑠𝑠𝑠’ = 𝑌𝑌𝑠𝑠𝑠𝑠’
𝑌𝑌𝑠𝑠’ of the
output of the s'th department to the input of the sth department. Then, the direct consumption coefficient matrix A of this model can be expressed as:
𝐴𝐴 =
𝑎𝑎11 𝑎𝑎12 … 𝑎𝑎1𝑠𝑠’𝑎𝑎21 𝑎𝑎22 … 𝑎𝑎2𝑠𝑠’… … … …𝑎𝑎𝑠𝑠1 𝑎𝑎𝑠𝑠2 … 𝑎𝑎𝑠𝑠𝑠𝑠’
(5)
Then, the Lconticf matrix (I − A) is obtained, and the complete consumption coefficient matrix B of this model is deduced, which shows the indirect influence of the sth department's participation in the s'th department's output activities through its input to the output of other departments, which can be expressed as:
𝐵𝐵 =
𝑏𝑏11 𝑏𝑏12 … 𝑏𝑏1𝑠𝑠’𝑏𝑏21 𝑏𝑏22 … 𝑏𝑏2𝑠𝑠’… … … …𝑏𝑏𝑠𝑠1 𝑏𝑏𝑠𝑠2 … 𝑏𝑏𝑠𝑠𝑠𝑠’
(6)
The complete consumption coefficient is particularly important in analyzing the production service industries related to Internet platforms such as WeChat, which indirectly serve the production activities of other industries through the input of intermediate products.
In this paper, WeChat's output employment coefficient is introduced to reflect the relationship between WeChat's contribution to GDP and its quantity of employment, that is, to increase the quantity of labor force employed by WeChat per unit of GDP.
At present, there is a lack of output data and output employment coefficient of WeChat in relevant statistical data, so it needs to be measured by relevant data. First of all, find out 8 related departments corresponding to WeChat in nine categories by adjusting the input-output table of 149 departments in 2017: Internet and related services, catering, retail, residential services, multimodal transport and transportation agency, education, business services and health. Then, the WeChat output value of the department is obtained by multiplying the WeChat adjustment coefficient of the department by the output value of the department, and divided by the urban adjustment coefficient. Finally, the direct output of WeChat is obtained by summing the output values of WeChat of various departments, that is, the direct contribution of WeChat to GDP. The specific formula is:
𝐿𝐿𝐿𝐿𝑙𝑙 = 𝜆𝜆𝑆𝑆𝐿𝐿𝑆𝑆/𝑡𝑡
𝑆𝑆=1
𝜂𝜂 (7)
𝐿𝐿𝐿𝐿𝑙𝑙 represents the direct output value of WeChat; 𝑚𝑚 represents the number of departments collected and corresponding to WeChat output according to the input-output table; 𝐿𝐿𝑆𝑆 represents the direct output value corresponding to each department; 𝜆𝜆𝑆𝑆 represents the WeChat adjustment coefficient of each department, which is equal to the proportion of the added value of WeChat output in the product department to that of all production activities in the department; 𝜂𝜂 represents the urban adjustment coefficient.
The output employment coefficient of WeChat shall be further calculated, which can be obtained by dividing the direct employment number driven by WeChat calculated above by the direct output value of WeChat. The specific formula is:
𝑅𝑅𝑙𝑙 =𝐿𝐿𝐿𝐿𝑙𝑙
𝐿𝐿𝐿𝐿𝑙𝑙 (8)
𝑅𝑅𝑙𝑙 represents the output employment coefficient of WeChat; 𝐿𝐿𝐿𝐿𝑙𝑙represents the number of direct employment of WeChat; 𝐿𝐿𝐿𝐿𝑙𝑙 represents the direct output value of WeChat.
– 12 –
2020 ITU Kaleidoscope Academic Conference

By multiplying the indirect output of WeChat by its output employment coefficient, we can calculate the indirect employment driven by WeChat. Within this, the indirect output of WeChat is the GDP indirectly driven, which can be obtained by multiplying the direct output of WeChat in various sectors of the national economy by the complete consumption coefficient calculated from the input-output table in 2017.
𝑁𝑁𝐿𝐿𝑙𝑙 = 𝑅𝑅𝑙𝑙𝑋𝑋𝑙𝑙𝑆𝑆
𝑡𝑡
𝑆𝑆=1
(9)
𝑋𝑋𝑙𝑙𝑆𝑆 = 𝐿𝐿𝐿𝐿𝑙𝑙𝑆𝑆 × 𝑏𝑏𝑗𝑗 (10)
𝑁𝑁𝐿𝐿𝑙𝑙 indicates the employment number indirectly driven by WeChat; 𝑋𝑋𝑙𝑙𝑆𝑆 indicates the indirect output value of WeChat of each department, and its calculation method is shown in Formula (8), which is equal to the direct output value of WeChat multiplied by the complete consumption coefficient of each department, among which 𝐿𝐿𝐿𝐿𝑙𝑙𝑆𝑆 indicates the direct output value of WeChat of each department calculated above and 𝑏𝑏𝑗𝑗 represents the complete consumption coefficient of each WeChat corresponding department calculated by the input-output table in 2017.
Taking the information consumption driven by WeChat and the traditional consumption driven by WeChat as the same caliber as GDP as the direct economic drive of WeChat, that is, it is directly contributing to GDP. Classify the economic fields directly driven by WeChat according to the national economic accounting classification, multiply it by the corresponding complete consumption coefficient, and get the indirect GDP contribution, and then calculate the person-time of indirect employment.
4. ANALYSIS AND CONCLUSION
4.1 Functions of Internet Platform on Economy Growth
Estimation shows that the total information consumption brought by WeChat was about CNY323.8 billion in 2019, accounting for 6% of the total information consumption in China, and the year-on-year growth was 34.8%; this also caused a traditional consumption of CNY596.6 billion. The direct economic revenue caused by WeChat reached CNY920.4 billion, i.e. the direct contribution to GDP was CNY920.4 billion, and indirect contribution to GDP was CNY1130.1 billion.
The interconnection and supply capacity, and the contact-free, cross-border, and remote accessibility of Internet platforms facilitated the communication of millions of large, medium and small enterprises, vendors and users during the pandemic period, and stimulated the information consumption, night-time economy and cross-border trade. WeChat stimulates the prompt resumption of markets, facilitates the digital transformation of enterprises, assures the smooth reopening of the economy via electronic coupons,
online sales, working from home etc., after the outbreak of the COVID pandemic, so as to mitigate the economic loss for enterprises and provide optimal services to users.
4.2 Functions of Internet Platform on Employment
Estimates indicate that WeChat brought 26 010 000 direct job positions in 2019. Full-time job positions reached 10 820 000, and part-time job positions reached 15 190 000. WeChat also brought about 3 616 000 indirect job positions.
An Internet platform provides various fair employment opportunities, which becomes a major supplement of offline employment. The Internet platform provides an open community to entrepreneurs, provides intelligence support to developers, firms and service facilitators via sharing knowledge and information, and provides solid support to the labor force for obtaining digital skills. Ordinary people may master digital skills and begin in new economic sectors quickly via an Internet platform. An Internet platform provides more job opportunities to people requiring special assistance, such as peasant-workers, housewives, the disabled, ex-servicemen, etc. Internet platform work based on intellectual work provides equal employment opportunities to men and women. This report indicates that the female employment ratio via WeChat reached 47.5% in total. A group of outstanding female entrepreneurs appeared on the Internet platform.
Internet platforms provide more flexible employment options. We can see the flexible employment relationship, detailed work scope division, flexible work manner, decentralized work arrangements, etc. on the Internet platform. The Internet platform creates many part-time and flexible job positions, brings new chances and new trends for employment and career selection. This report indicates that WeChat brought 15 190 000 part-time job positions in 2019, accounting for about 60% of total direct job positions brought about by WeChat. The WeChat-based part-time job positions mainly include education services, freelance writing, We media, e-commerce, financing, emoji designing etc., which mainly focus on skill output. At the same time, certain part-time employees are working for operations, development, design and maintenance of WeChat official accounts, mini apps, payments, etc.
The online employment also stimulates the offline employment. In this digital economy era, the network information technology, Internet platforms, etc. break through the border of traditional organizations, provides market, development and production resources to individuals, and reduces the tariff for individuals to begin economic activities, so that the individuals may perform economic activities without entering traditional enterprises. The smart retail of WeChat merges the online and offline operation, and increases the employment ratio for offline transactions.
It creates good employment opportunities for populations in under-development regions. The benefits from mobile Internet spread faster and faster from first and second-tier
– 13 –
Industry-driven digital transformation

cities at the center of circle. The employment status based on Internet platforms breaks the limitation of time and region, and accelerates the propagation of digital employment in third and fourth- tier cities. A large quantity of job positions may distribute around the country via online working without the necessity to crowd in developed regions, and effectively promote local employment. This report indicates that the job positions for the WeChat public platform in central and western region and northeast provinces reached 43.6% in 2019. The entrepreneurs connected the virtual world and real world via the Internet, brought Internet technology to countries, and became the “Illiteracy Eliminator for Internet”. The entrepreneurs around the country seized the opportunity of low thresholds, created their “Individual Brand” with their own efforts and enthusiasm, and formed many challenging legends.
In the new wave of a scientific and technological revolution and industrial transformation, the development of the digital economy has become an irreversible trend of the times. In the future, the integration of all things and integrated innovation will move toward a higher stage. Further exchanges and cooperation have become common sense, and development based on mutual benefit is the general trend of the times. Although all countries in the world have their own national conditions, develop the Internet at different levels and face different challenges, they share the same vision to develop the digital economy. As the proverb goes, “A single man may go fast, but more men may go far away”. All countries should work more closely with each other to develop the digital economy based on the principle of mutual benefit.
REFERENCES
[1] Hu Angang, Wang Wei, Zhou Shaojie, Lu Yufeng. China Initiates “New Economy” -- From Reducing “Digital Gap” to Gaining “Digital Benefit” [J]. Journal of Chinese Academy of Governance, 2016, (3): 4-13.
[2] He Zongyue, Song Xuguang. Mechanism and Enlightenment of Digital Economy Promoting Employment --Thinking after Pandemic [J]. Economist, 2020 (05): 58-68.
[3] Li Xiaohua. New Characteristics of Digital Economy and Formation Mechanism of New Kinetic Energy of Digital Economy [J]. Reform, 2019, (11): 40-51.
[4] Wang Wen. Has the Industrial Intellectualization in Digital Economy Era Promoted High Quality Employment [J]. Economist, 2020(04): 89-98.
[5] Xia Yan, Wang Huijun, Zhang Feng, Guo Jianfeng. Study of Impact of Digital Economy on Economy Growth and Non-agricultural Employment of China -- Based on Input-Occupancy-Output Model [J]. Bulletin of Chinese Academy of Science, 2018, 33 (07): 707-716.
[6] Autor, David. Why Are There Still So Many Jobs? The History and Future of Workplace Automation [J]. Journal of Economic Perspectives.2015, 29(3): 3-30.
[7] Zhan Xiaoning, Ouyang Yongfu. New Trend of Global Investment under Digital Economy and New Strategy of China Utilizing Foreign Investment [J]. Management World, 2018, (3): 78-86.
[8] Acemoglu, Daron and Pascual Restrepo. The Race Between Man and Machine: Implications of Technology for Growth, Factor Shares and Employment [J]. American Economic Review. 2018, 108(6): 1488-1542.
[9] Wang Mengfei, Zhang Xinfei. Study of Impact of Technical Reform on Production Progress in Digital Economy Era [J]. Economist, 2020, (1): 52-58.
– 14 –
2020 ITU Kaleidoscope Academic Conference

5G HEALTHCARE APPLICATIONS IN COVID-19 PREVENTION AND CONTROL
Haiying Ren1; Jianfeng Shen2; Xiaoyong Tang3; Tianyi Feng1
1China Academy of Information and Communications Technology (CAICT), China 2National Health Commission of the PRC, China
3China Mobile (Chengdu) Industrial Research Institute, China
ABSTRACT
This paper mainly focuses on the application of 5G mobile communication systems in COVID-19 prevention and control. Firstly, for the different stages of epidemic prevention and control, we give a detailed introduction for the application cases. Secondly, the application of the epidemic is summarized, and the results obtained by each application are analyzed. Then, the problems and challenge faced by 5G healthcare applications during the epidemic are analyzed. In response to these problems and challenges, we put forward suggestions for the next step. The summary, analysis and work suggestions made in this article, provide an experience for the world to fight against the COVID-19 epidemic. In addition, the research in this paper helps to promote the construction of 5G medical and health standards systems, and provides a reference for the integrated development of 5G networks and medical health.
Keywords 5G, COVID-19, healthcare, standards
1. INTRODUCTION
Since the outbreak of the COVID-19 pandemic, it has been faced with many outstanding problems, such as the shortage of medical and health resources, the increase in work intensity of first-line medical staff and the difficulty of isolation and prevention. It is urgent to expand the online services space and build an integrated online and offline service model. A 5G network has high speed, high reliability, low latency and other positive aspects of performance [1]. These advantages make 5G networks an important grasp and technical means for the prevention and control of the COVID-19 pandemic [2]. In the critical period of pandemic prevention and control, many companies of China worked together to quickly deploy a 5G network covering pandemic treatment hospitals across the country, and quickly implementing a variety of 5G medical applications. The successful application of 5G networks in this epidemic and the accumulated experience have important implications for the future response to major public health events.
2. APPLICATIONS OF 5G IN COVID-19PANDEMIC PREVENTION AND CONTROL
Compared with 4G, 5G has a high transmission rate, low latency, wide connection of multiple terminals and high adaptability to mobile environments. These advantages of 5G can effectively respond to the challenges of real-time big data in diagnosis and treatment, and provide new ideas and new methods for various stages in epidemic prevention [3].
2.1 Patient transfer stage
Due to the concentrated outbreak of the epidemic, the ambulance network of patients across the country is facing a major test. The suspected patient’s ambulance using a 5G network has effectively realized the visualization of mobile work scenes, the data of physiological signs, and the instant communication of instructions. This has changed the traditional transfer mode and improved the efficiency of admission treatment [4].
Under normal circumstances, the number of vehicles delivered by the Wuhan Emergency Center is about 400 trips/day. However, in the case of the COVID-19 pandemic, the number has been close to 600 trips/day for a long time, and more than 800 trips during the peak period. Intelligent ambulances need extremely high requirements on the communication stability, communication delay and transmission rate of the communication network.
With 5G network uplink data transmission rates exceeding 100Mbps, 5G patient ambulances are equipped with 4K high-definition video surveillance equipment. 5G+4K ambulances can transmit high-definition video, audio, and patient health indicator data to the headquarters in real time. The monitoring personnel and the on-board staff can communicate fully and timely on the transfer details and the patient's situation. When necessary, the headquarters can also initiate a tripartite 5G remote video consultation with ambulances and hospital experts. In this way, the seamless connection between pre-hospital emergency treatment and hospital treatment is realized.
978-92-61-31391-3/CFP2068P @ ITU 2020 Kaleidoscope– 15 –
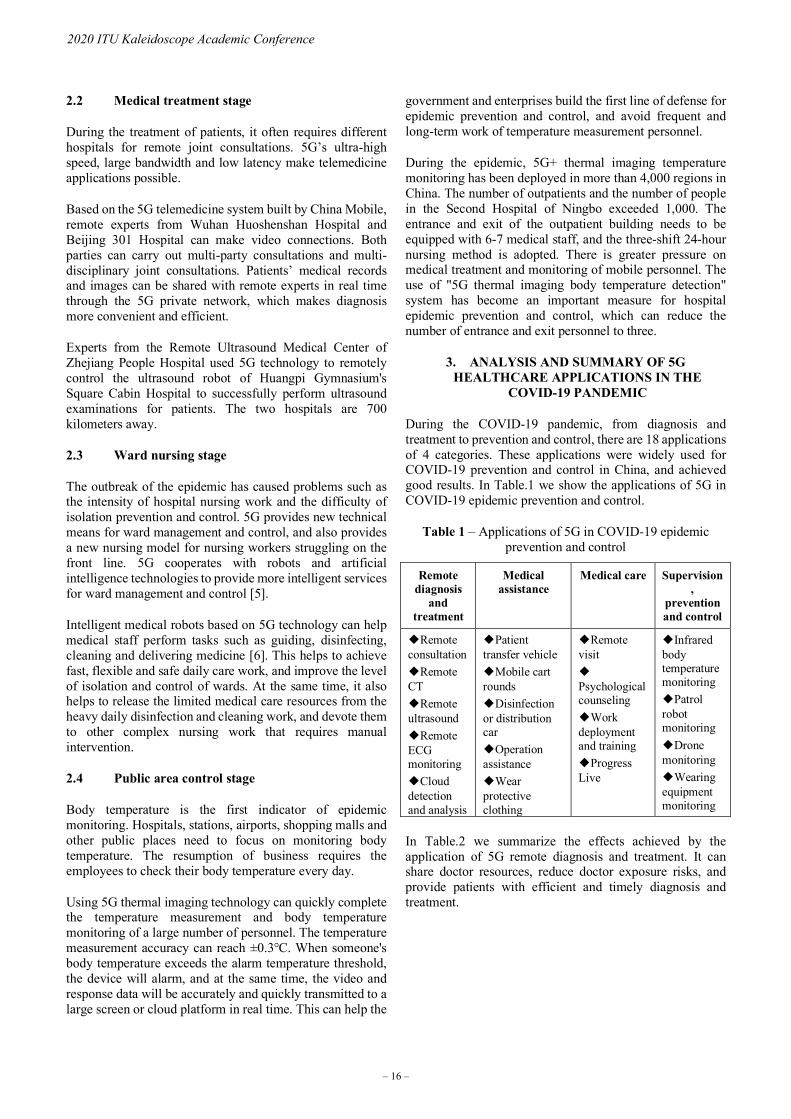
2.2 Medical treatment stage
During the treatment of patients, it often requires different hospitals for remote joint consultations. 5G’s ultra-high speed, large bandwidth and low latency make telemedicine applications possible.
Based on the 5G telemedicine system built by China Mobile, remote experts from Wuhan Huoshenshan Hospital and Beijing 301 Hospital can make video connections. Both parties can carry out multi-party consultations and multi-disciplinary joint consultations. Patients’ medical records and images can be shared with remote experts in real time through the 5G private network, which makes diagnosis more convenient and efficient.
Experts from the Remote Ultrasound Medical Center of Zhejiang People Hospital used 5G technology to remotely control the ultrasound robot of Huangpi Gymnasium's Square Cabin Hospital to successfully perform ultrasound examinations for patients. The two hospitals are 700 kilometers away.
2.3 Ward nursing stage
The outbreak of the epidemic has caused problems such as the intensity of hospital nursing work and the difficulty of isolation prevention and control. 5G provides new technical means for ward management and control, and also provides a new nursing model for nursing workers struggling on the front line. 5G cooperates with robots and artificial intelligence technologies to provide more intelligent services for ward management and control [5].
Intelligent medical robots based on 5G technology can help medical staff perform tasks such as guiding, disinfecting, cleaning and delivering medicine [6]. This helps to achieve fast, flexible and safe daily care work, and improve the level of isolation and control of wards. At the same time, it also helps to release the limited medical care resources from the heavy daily disinfection and cleaning work, and devote them to other complex nursing work that requires manual intervention.
2.4 Public area control stage
Body temperature is the first indicator of epidemic monitoring. Hospitals, stations, airports, shopping malls and other public places need to focus on monitoring body temperature. The resumption of business requires the employees to check their body temperature every day.
Using 5G thermal imaging technology can quickly complete the temperature measurement and body temperature monitoring of a large number of personnel. The temperature measurement accuracy can reach ±0.3. When someone's body temperature exceeds the alarm temperature threshold, the device will alarm, and at the same time, the video and response data will be accurately and quickly transmitted to a large screen or cloud platform in real time. This can help the
government and enterprises build the first line of defense for epidemic prevention and control, and avoid frequent and long-term work of temperature measurement personnel.
During the epidemic, 5G+ thermal imaging temperature monitoring has been deployed in more than 4,000 regions in China. The number of outpatients and the number of people in the Second Hospital of Ningbo exceeded 1,000. The entrance and exit of the outpatient building needs to be equipped with 6-7 medical staff, and the three-shift 24-hour nursing method is adopted. There is greater pressure on medical treatment and monitoring of mobile personnel. The use of "5G thermal imaging body temperature detection" system has become an important measure for hospital epidemic prevention and control, which can reduce the number of entrance and exit personnel to three.
3. ANALYSIS AND SUMMARY OF 5GHEALTHCARE APPLICATIONS IN THE
COVID-19 PANDEMIC
During the COVID-19 pandemic, from diagnosis and treatment to prevention and control, there are 18 applications of 4 categories. These applications were widely used for COVID-19 prevention and control in China, and achieved good results. In Table.1 we show the applications of 5G in COVID-19 epidemic prevention and control.
Table 1 – Applications of 5G in COVID-19 epidemic prevention and control
Remote diagnosis
and treatment
Medical assistance
Medical care Supervision,
prevention and control
Remote consultation Remote CT Remote ultrasound Remote ECG monitoring Cloud detection and analysis
Patient transfer vehicle Mobile cart rounds Disinfection or distribution car Operation assistance Wear protective clothing
Remote visit Psychological counseling Work deployment and training Progress Live
Infrared body temperature monitoring Patrol robot monitoring Drone monitoring Wearing equipment monitoring
In Table.2 we summarize the effects achieved by the application of 5G remote diagnosis and treatment. It can share doctor resources, reduce doctor exposure risks, and provide patients with efficient and timely diagnosis and treatment.
– 16 –
2020 ITU Kaleidoscope Academic Conference

Table 2 – 5G remote diagnosis and treatment
Remote consultation
100+ hospitals help each other; 3000+ patients receive timely treatment.
Remote CT 20 hospitals help each other; 2000+patients received timely consultation.
Remote ultrasound
Zhejiang People's Hospital performs B-ultrasound examination for patients in Wuhan Fangcang Hospital, 700km apart.
Remote ECG monitoring
Reduction of 30,000 examination beds/day per system in medium-sized hospitals.
Cloud detection and analysis
Real-time 5G transmission back to the cloud for detection; Mobile laboratory completes 1800+ nucleic acid tests.
In Table.3 we summarize the effects achieved by the application of 5G medical assistance. It can reduce the labor intensity of hospital workers, reduce the risk of contact infection, and fulfill the needs of hospital patients in a timely manner. The disinfection car is used to eliminate viruses in the environment, thereby reducing the virus in the environment. The delivery car is suitable for transporting medical goods, which can reduce personnel cross-infection. Mobile car rounds are used to help doctors go to rounds, which can reduce the burden on medical staff.
Table 3 – 5G medical assistance
Patient transfer vehicle
5G+4K patient transfer vehicle, 15 hospitals, 400+ suspected or confirmed case transfer
Disinfection car
5G+disinfection truck/medicine delivery/transportation truck: reduce personnel infection risk and labor intensity, 180+ hospitals, 7% reduction in caregiver workload.
Delivery car
Mobile car rounds
5G high bandwidth & mobility supports intelligent rounds, 1100+ ward rounds, 9% reduction in risk exposures.
Wear protective clothing
5G protective clothing wear self-test/equipment operation guidance,1000+ medical workers; 20,000+ secondary protection checks
In Table.4 we summarize the effects achieved by the application of 5G medical care. It can relieve patients' panic about the epidemic, and relieve the psychological pressure of hospital workers.
Table 4 – 5G medical care
Remote visit 5G remote video Visiting/Psychological nursing. For patients and relatives: used for remote visits to patients in isolation wards. For the hospital: used for medical care to check the patient's situation; Doctors can also conduct remote video psychological consultation. Has landed in many hospitals.
Psychological counseling
Work deployment and training
5G response to epidemic situation deployment and new skills transfer. 700+ National Work Deployment Conference; 600+ hospital training; 100 + national training.
Progress Live 5G high-bandwidth supports multiple forms of live footage. In just 16 days, the construction progress of "Cloud Supervisor" was broadcast live, with a total of 115 million views.
In Table.5 we summarize the effects achieved by the application of 5G supervision, prevention and control. It can real-time monitor the temperature of urban mobile personnel and manage the concentration of personnel.
Table 5 – 5G supervision, prevention and control
Infrared body temperature monitoring
Fixed entrance prevention and control in public places. 4000+ hospitals, enterprises, and public transportation hubs has deployed.
Patrol robot monitoring
5G mobile temperature measurement equipment, mainly used for mobile epidemic prevention and control in public places. 5000+ areas have been deployed, including many hospitals and public places.
Headset monitoring
Wearing equipment monitoring
4. CURRENT PROBLEMS AND CHALLENGES
In COVID-19 pandemic prevention and control, 5G technology is used to improve efficiency, improve hospital competitiveness and diagnosis and treatment capabilities, and effectively reduce human resource costs. However, the application of 5G in epidemic prevention and control is a new thing, and it has encountered some new challenges and new problems in the development process.
On one hand, there is currently no unified standard and evaluation system. There are many wireless medical application scenarios, but the network requirements of different application scenarios vary greatly. There are still
– 17 –
Industry-driven digital transformation

many standardization issues in 5G medical health in terms of terminal device access methods, data format unification, and application data transmission. This needs to be combined with the application characteristics of the medical and health industry to establish a complete 5G smart medical and health standard system. Eventually promote the formulation, implementation and application of the 5G standard system for the healthcare industry.
On the other hand, the implementation of large-scale industrialization remains to be studied. At present, 5G medical applications are mainly based on pilot exploration, and are mostly pilot attempts in application scenarios. It is necessary to strengthen the research on industrialization promotion of the scheme. The innovation system combining government, industry, education and research should also be accelerated. In addition, the informatization of medical institutions at all levels is uneven. This requires further innovation in management methods to speed up the flow of data for 5G medical applications.
5. RECOMMENDATIONS FOR FUTURE WORK
In response to the problems and challenges faced by 5G in COVID-19 prevention and control, it is recommended to start work in the following areas.
Firstly, establish a comprehensive set of 5G medical standards. Promote standards for the system of medical ICT applications, including terminal standards, network standards, and security standards. On this basis, the technology service requirements for 5G or indeed other mobile/fixed communications networks are made. The 5G medical and health application services include pre-hospital emergency medical treatment, remote diagnosis and treatment, remote surgery, etc.
Secondly, construction of 5G medical application project demonstration. Promote the construction of 5G medical application demonstration projects in qualifying hospitals, and carry out the selection of 5G medical demonstration projects. Key areas include emergency treatment, remote diagnosis, remote treatment, intensive care (ICU), Chinese medicine, hospital management, infectious disease prevention and control, health management, etc. Through the construction of demonstration projects, new 5G smart healthcare products and new formats that can be replicated and promoted will be cultivated.
Lastly, promote the integration of new technologies and medical and health innovation. Adhere to the medical needs as the guide, and play the role of 5G, blockchain, artificial intelligence, robots, etc. for medical health. Focus on promoting the development of medical imaging-assisted diagnosis, pathological-assisted diagnosis, medical robots and other technologies and applications. Increase support for scientific research funds and talent security. And strengthen basic guarantees such as big data centers, network environments, and information security that support medical health.
6. CONCLUSIONS
Compared with 4G, 5G has a high transmission rate, low latency, large bandwidth and high adaptability to mobile environments. These advantages of 5G can effectively respond to the challenges of real-time big data in the diagnosis and treatment of patients. In this article, we have made a comprehensive summary of the applications of 5G healthcare during COVID-19 in China. We hope that our summary of 5G healthcare applications will provide experience for the world to fight against the epidemic. For the 5G healthcare applications, we analyzed the current problems and challenges, and put forward corresponding work suggestions. We hope the work can help to promote the construction of a 5G medical and health standards system, and to provide a reference for the integrated development of 5G and medical health.
REFERENCES
[1] A. Alsaeedy , E. Chong. "Detecting Regions At Risk for Spreading COVID-19 Using Existing Cellular Wireless Network Functionalities," IEEE Open Journal of Engineering in Medicine and Biology, vol. 1, pp. 187- 189, 2020.
[2] E.C. Liou, S.C. Cheng. "A QoS Benchmark System for Telemedicine Communication Over 5G uRLLC and mMTC Scenarios," 2020 IEEE 2nd Eurasia Conference on Biomedical Engineering, Healthcare and Sustainability (ECBIOS), May 2020.
[3] A. Angelucci, D. Kuller, A. Aliverti. "A home telemedicine system for continuous respiratory monitoring," IEEE Journal of Biomedical and Health Informatics , July 2020.
[4] J. Kim, D. Kim , S. M. Jung , C. Lee , D. Lim , S.H. Hong , S. K. Yoo. "Development of Mobile Ad Hoc Network for Emergency Telemedicine Service in Disaster Areas," 2009 International Conference on New Trends in Information and Service Science, July 2009.
[5] W. D. Mattos, P. R. Gondim. "M-Health Solutions Using 5G Networks and M2M Communications," IT Professional, vol. 18,no. 3, pp. 24-29, 2016.
[6] A. Markhasin. "Fundamentals of the extremely green, flexible, and profitable 5G M2M ubiquitous communications for remote e-healthcare and other social e-Applications," 2017 International Multi-Conference on Engineering, Computer and Information Sciences (SIBIRCON), Sept. 2017.
– 18 –
2020 ITU Kaleidoscope Academic Conference

SESSION 2
DESIGN PRINCIPLES, ARCHITECTURE AND PROTOCOLS FOR THE DIGITAL TRANSFORMATION
S2.1 Lightweight and instant access technologies and protocols to boost digital transformations
S2.2 Automation of computational resource control of cyber-physical systems with machine learning*


LIGHTWEIGHT AND INSTANT ACCESS TECHNOLOGIES AND PROTOCOLS TO BOOST DIGITAL TRANSFORMATIONS
Yihua Ma1, 2, Zhifeng Yuan1, 2, Weimin Li1, 2, Zhigang Li1, 2 1ZTE Corporation, Shenzhen, China
2State Key Laboratory of Mobile Network and Mobile Multimedia, Shenzhen, China
ABSTRACT
The further integration of telecommunications and industry has been considerable and is expected to bring significant benefits to society and economics. It also leads to some evolution trends for next-generation communication systems, including further rises in machine-type communications (MTC), uplink-dominated systems, and decentralized structures. However, the existing access protocols are not friendly to these trends. This paper analyzes the problems of existing access protocols and provides novel access technologies to solve them. These technologies include contention-based NOMA, data features, enhanced pilot design and successive interference cancellation (SIC) of diversity. With these key enablers, lightweight and instant access can be realized, and some potential modifications of protocols are analyzed. Finally, this paper uses massive and critical scenarios in digital transformations to show the great necessity of introducing novel access technologies into future communication protocols.
Keywords – Decentralization, digital transformations, future access protocols, MTC, uplink
1. INTRODUCTION
The target of communications varies from connecting humans to connecting everything, and digital transformations are expected to penetrate many scenarios [1]-[3]. Digital transformations are expected to bring significant benefits to society. Meanwhile, digital transformations raise many requirements, as well as point out the directions for future communication protocols.
To support seamless and handy digital services, there are some trends in future communications, including: (1) further evolution from human-oriented communications to machine-type communications (MTC), (2) from downlink-dominated to uplink-dominated, and (3) from centralization to decentralization. The existing access protocols have not been changed for decades and become great burdens under these trends. This paper focuses on the lightweight and instant access technologies and protocols as they are crucial to fulfilling ultra-low latency and ubiquitous connectivity.
Novel access technologies are required to realize these trends, and this paper introduces 4 key enablers: (1) contention-based non-orthogonal multiple access (NOMA), (2) the prior knowledge of data, (3) enhanced pilot design and (4) joint use of diversity and successive interference cancellation (SIC). NOMA is first proposed in [4], and it usually requires accurate power control and resource allocation. As a comparison, contention-based NOMA gets rid of them and achieves a higher flexibility. The prior knowledge of data can be used to improve performance. Data-only transmission is proposed in [5], which is able to remove the pilot overheads. Apart from the data-only scheme, a pilot is still crucial to fully utilize a large receiving antenna array where the spatial combining search space is huge. Therefore, the pilot should be well designed to gain a good detection and estimation performance [6] [7]. Moreover, the joint use of diversity and SIC [8] can deal with the fluctuation of loading as it is random in contention-based transmissions. This strategy is able to average the loading in different slots via iterative detection and cancellation.
With these key enablers, users are able to transmit packets without building radio resource control (RRC) connections. That is to say, a connection-free transmission can be achieved, and the transmission no longer relies on RRC connections. This great enhancement simplifies the transmission procedures a lot, as well as reduces the overheads and latency of building RRC connections. It also leads to some possible modifications to future protocols, which are also analyzed in this paper.
The rest of this paper is organized as follows. Section 2 introduces the main trends of future radio access networks and analyzes the problems of existing access protocols. In section 3, some novel access technologies are provided to solve the problems. Section 4 briefly introduces the impact of these technologies on future protocols. In section 5, two important scenarios are discussed to show the advantages of the proposed schemes. Section 6 concludes this paper and provides some future research directions.
978-92-61-31391-3/CFP2068P @ ITU 2020 Kaleidoscope– 21 –

2. THREE MAIN TRENDS
In this section, three main trends of future networks are introduced. The problems of existing protocol are analyzed under these trends.
2.1 Further Rises in MTC
The first trend is that the main participants of communications vary from human to machines. Although massive machine-type communications (mMTC) is included in 5G, the developments of more massive and critical MTC will still be in demand towards 2030 and beyond [1]. Unlike human communications, the potential users can be massive, and the reliability requirement can be very high. However, the classical random access protocol requires a handshaking procedure, which is not suitable for the high-efficiency transmissions of massive potential users or low-latency transmissions of high-mobility networks.
2.2 Uplink-dominated System
The second trend is that the overall performance is becoming dominated by uplink instead of downlink transmissions. For many MTC applications, uplink is the main bottleneck [9]. Moreover, in massive multiple input multiple output (MIMO) systems, time division duplex (TDD) is much easier to realize; it uses uplink-downlink reciprocity to obtain downlink channel information. Direct downlink channel estimation is very inefficient as the overheads of downlink pilots increase with the antenna number of the base station (BS) [10]. Therefore, the pilot in the uplink becomes very important to obtaining the channel information and effectively using the capability of massive antennas of the BS. In the current protocol, the uplink pilot, or demodulation reference signal (DMRS), is orthogonal among users. It limits the number of pilots and is not suitable for contention-based transmission.
2.3 Decentralized Structure
The last trend is from centralization to decentralization. This trend has many aspects, including: (1) The distributed antenna or cell-free design for ubiquitous connectivity, (2) device-to-device transmission not relying on the central controller, and (3) decentralized information management and control, e.g. blockchain [11]. Although network centralization brought us many good aspects like easy management and global control, the costs should not be neglected, including coverage, latency and privacy risk. These costs greatly limit the performance and credibility of the networks.
3. NOVEL ACCESS TECHNOLOGIES
This section analyzes four novel access technologies shown in Figure 1. The basic idea and advantages of them are discussed.
Figure 1 – Key enablers of future access protocols
3.1 Contention-based NOMA
NOMA is a very effective technology to increase spectrum efficiency when there is a near-far effect. Due to the complexity limitation, a non-orthogonal power domain has not been fully utilized especially for the uplink in current protocols. NOMA still acts as an important role in the future, as the complexity limitation is expected to be solved by advanced algorithms and powerful hardware in the future.
It is complex and inefficient to implement accurate power control and resource allocation when there are massive users or the latency requirement is high. Therefore, a scheme allowing users to transmit freely is in high demand. To acquire this convenience for end devices, the transmission itself is inevitably to be non-orthogonal. In this case, extra sensing and local power control can be required to utilize the power domain [12], but it is not suitable for low-cost and low-power devices. To support a more flexible transmission not relying on any sensing and power control, a joint use of power domain, code domain and spatial domain should be considered as in Figure 1(a).
3.2 Data Features
To get rid of pilots or reduce the pilot overheads, data features should be used. There are two mainstream ways to realize this. One is to utilize the prior knowledge and statistical information of data [5] [13], e.g. the constellation shape, correlation matrix, constant modulus, etc. This method is compatible with existing protocols, and the modification to existing standards is relatively small. The other is a data-driven method which uses deep learning (DL). The end-to-end auto-encoder is one important application of DL in the physical (PHY) layer, and [14] shows that pilot-free transmission can also be realized by an auto-encoder.
During the exploitation of data features, novel waveform potentially arises, [15], [16]. Discrete Fourier transform spreading orthogonal frequency division multiplexing (DFT-s-OFDM) plays an important role in 5G for its low peak to average power ratio (PAPR). However, it makes the data feature become hard to use. One solution is real Fourier related transform spreading OFDM (RFRT-s-OFDM) [15]. As shown in Figure 1 (b), this novel waveform maintain the data feature. Channel equalization and time/frequency offset correction can be done using the data features in RFRT-s-
– 22 –
2020 ITU Kaleidoscope Academic Conference
OFDM as shown in Figure 1(b), while the low PAPR advantage is kept.
3.3 Enhanced Pilot Design
To support mMTC and massive MIMO, novel pilot designs are proposed to support more users and reduce allocation overheads as shown in Figure 1(c). One mainstream research area is non-orthogonal pilots based on compressed sensing (CS) [6]. The sparsity of user activity, multiple paths and angles of arrival can be used to increase the performance of user detection and channel estimation. However, a CS-based non-orthogonal pilot scheme leads to large computational complexity when the pilot pool is large or the receiving antenna array is large. Also, the inter-cell interference and time/frequency offset problems are hard to solve.
The other research direction is special non-orthogonal pilot design with partial orthogonality. To be specific, multi-pilot [7] is proposed which consists of multiple pilots. Multiple orthogonal pilots are usually employed, although multiple non-orthogonal pilots can also be used. The detection of every orthogonal pilot is very simple, and the detection complexity is reduced a lot compared with general non-orthogonal pilot design. Moreover, an orthogonal pilot has been used and verified during a long period, and many existing engineering methods can be used to ensure the performance of multi-pilot use.
3.4 SIC of diversity
The joint use of diversity and SIC is first proposed in [17], and some novel schemes improve the performance optimizing a bipartite graph of Figure 1(d). It allows the users to transmit multiple replica packets at any time slot, and SIC of packets is used after demodulating any packet in each round. This strategy was designed for satellite communications where the round-trip time is very long. The achievable loading of these strategies is approaching 1 with the cost of replicas. This method greatly reduces the transmission delay and increases transmission efficiency. It is also named as modern random access, which is seen as one potential next-generation random access protocol [10].
Unlike satellite communications, the channel gain of different users varies a lot in widely-used terrestrial communications. Therefore, the near-far effect becomes a practical factor that requires consideration. NOMA is able to utilize the near-far effect to separate different users. The combination of NOMA and SIC of diversity requires a joint design of the medium access control (MAC) and PHY layer. An example is shown in [18] which jointly uses the code domain NOMA and SIC of diversity.
4. IMPACTS ON PROTOCOLS
With the novel access technologies, the transmission procedure can be simplified a lot, which deeply affects the future protocol.
4.1 RRC Idle/Inactive
With the key enablers in section 3, connection-free transmission becomes possible which enables high-efficiency and instant MTC without any connection establishment. That is to say, the transmission can be realized in a radio resource control (RRC) idle or inactive state. These enablers can also revolve the random access protocols with a much higher successful rate and lower latency especially in dense environment, i.e., they are beneficial for RRC connection establishment. A related standardization work is 2-step random access channel (RACH) [19]. However, it only acts as a substitution of 4-step RACH, and the collision problem has not been studied as orthogonal multiple access and orthogonal pilots are still in use. In regard to the collisions, the protocols relating to multiple access and pilot sequences are expected to evolve.
4.2 Uplink and Sidelink NOMA
As mentioned before, the non-orthogonal domain has not been well utilized in 5G. Actually, the discussion of uplink NOMA didn’t reach a consensus in 5G standards [20]. One reason is that the performance and complexity comparison is not enough to decide a winner among different uplink NOMA schemes. The demands of mMTC should be further analyzed, and some crucial key performance indicators should be especially emphasized. The contention-based grant-free feature [21] is a potential one in the future discussion as it is exceedingly friendly to low-cost and low-power MTC devices. Moreover, contention-based NOMA is also a potential standardization direction for sidelink (SL) without central control, e.g., LTE-V SL mode 4 [22].
4.3 Comprehensive Synchronization
The connection-free transmission brings some synchronization (SYNC) challenges, and a comprehensive SYNC process is required. In the current protocols, synchronization is realized by the SYNC signal and measured time advance (TA) from BS [23]. TA is hard to be obtained in connection-free transmissions, and a comprehensive SYNC is required. Some possible modifications can be based on the information of the UE status (e.g., position, speed), BSs’ positions, SYNC signals of multiple BSs, etc. Moreover, an overall framework is required to jointly use all the prior knowledge relating to SYNC which can be obtained by the end device.
5. CASE STUDIES
Two representative cases of both massive and critical MTC are shown in this section. The advantage of novel access technologies are shown, which verifies the necessity of them in future standards.
5.1 Case Study of mMTC
This case study is for mMTC, and a Poisson arrival model is used with an average arrival rate of λ. NOMA provides a
– 23 –
Industry-driven digital transformation

large gain when there is a near-far effect, e.g., a near and strong user can reuse the channel used by a far and weak user, which greatly improves the spectrum efficiency. Therefore, the near-far effect is included in comparison. As shown in Figure 2, the outage performances of two different contention-based grant-free NOMA schemes [12] [18] are compared. As mentioned before, power domain NOMA with a contention-based feature requires extra sensing of channel gain and power control according to estimated channel gain. The aim is to make the receive power belong to some predetermined power levels. It results in an extremely high transmission power, and [12] provides sub-channel selection and distance-based methods to solve it. As a comparison, code domain NOMA [18] is just required to randomly select the spread code and can work without power control.
The simulation results show that code domain NOMA performs better than power domain. For a target outage rate of 0.1, the achievable arrival rate of power domain NOMA is less than 1 while that of code domain NOMA is greater than 2. Also, when combined with the SIC of the diversity strategy, the achievable arrival rates at the outage of 10-2 are 2.4 and 3.4 for power domain and code domain NOMA. In this comparison, power domain NOMA plus SIC of diversity achieves a lower error floor because perfect sensing and power control are assumed. The outage performance of code domain NOMA is bounded by a corresponding orthogonal multiple access (OMA) transmission of perfect scheduling. As the near-far effect is utilized, code domain NOMA plus SIC of diversity achieves an arrival rate greater than 3 with the outage performance very close to the OMA bound.
Figure 2 – The outage comparison of contention-based NOMA and their combination with SIC of diversity. PD
and CD denote power domain and code domain
5.2 Case Study of V2V
This case study is for vehicle-to-vehicle (V2V) communication without central control. V2V communication should be extremely reliable for safety, and V2V without central control is especially important due to the robustness in a non-cellular domain and ultra-low latency requirement. In LTE-V, sensing-based semi-persistent
scheduling (SPS) [22] is employed, and every user sensing the spectrum resources randomly selects idle resources in a given period. A sensing-based method is also studied and a potential candidate in 5G V2V [24]. The problem of a sensing-based method is that it is not friendly to multiple antennas, and the reliability is relatively low in ultra-dense environments. To solve these problems, [24] proposes a novel distributed antenna deployment and full-duplex contention-based NOMA transceiver scheme which jointly use power, code and spatial domain to achieve an ultra-low latency and high reliability V2V communication in ultra-dense scenarios. The block error rate (BLER) comparison is shown in Figure 3. The channel model is based on LTE-V standards [22], and 1500 and 700 vehicles are dropped in the urban and freeway scenarios defined in [10], respectively.
In Figure 3, three protocol-defined scenarios are all considered, including urban non-line-of-sight (UN), urban line-of-sight (UL) and freeway line-of-sight (FL). In this comparison, the full-duplex NOMA scheme achieves a much higher reliability than the method in the current protocol. Also, the overheads of the full-duplex NOMA scheme are reduced only 1/5, which means a much more frequent transmission of 250 packets per second (pps) can be supposed, which helps to reduce the end-to-end latency once the information is generated. In this case, NOMA turns the near-far effect into advantages, and achieves a high spectrum efficiency and ultra-high reliability of near vehicles.
Figure 3 – The BLER comparison of sensing-based SPS in current protocols and full-duplex contention-based NOMA
using novel access technologies
6. CONCLUSIONS
To fulfill digital transformations, it is necessary to make some great modifications in current protocols. One crucial aspect is to enhance the access protocols as it is a bottleneck of seamless and instant digital services. This paper provides several novel access technologies, and potential impacts on protocols are also briefly analyzed. Moreover, some typical use cases are shown to verify the necessity of these modifications of future protocols. The standardization process of novel access technologies to boost digital
– 24 –
2020 ITU Kaleidoscope Academic Conference

transformations requires: (1) a much wider application to make it more urgent, (2) more careful considerations given to privacy and security and (3) a joint work of industry and academics to refine technologies.
REFERENCES
[1] N. H. Mahmood, et.al., "White Paper on Critical and Massive Machine Type Communication Towards 6G", arXiv:2004.14146, 2020.
[2] ITU-T Technical Report, "FG-NET2030 – Focus Group on Technologies for Network 2030", January 2020.
[3] K. David and H. Berndt, "6G Vision and Requirements: Is There Any Need for Beyond 5G?," in IEEE Veh. Tech. Mag., vol. 13, no. 3, pp. 72-80, Sept. 2018.
[4] Y. Saito, Y. Kishiyama, A. Benjebbour, T. Nakamura, A. Li and K. Higuchi, "Non-Orthogonal Multiple Access (NOMA) for Cellular Future Radio Access," in Proc. IEEE VTC Spring, Dresden, 2013
[5] Z. Yuan, et.al., "Blind Multi-user Detection Based on Receive Beamforming for Autonomous Grant-Free High-Overloading Multiple Access," in Proc. 5GWF, Dresden, Germany, 2019, pp. 520-523.
[6] M. Ke, Z. Gao, Y. Wu, X. Gao and R. Schober, "Compressive Sensing-Based Adaptive Active User Detection and Channel Estimation: Massive Access Meets Massive MIMO," in IEEE Trans. Signal Proc., vol. 68, pp. 764-779, 2020.
[7] Z. Yuan, W. Li, Z.Li, Y. Hu, and Y. Ma, "Contention-based grant-free transmission with independent multi-pilot scheme," arXiv:2004.03225, 2020.
[8] F. Clazzer, A. Munari, G. Liva, F. Lazaro, C. Stefanovic, and P. Popovski, "From 5G to 6G: Has the Time for Modern Random Access Come?" in Proc. 6G Wireless Summit, Levi, Finland, Mar. 2019.
[9] Z. Dawy, W. Saad, A. Ghosh, J. G. Andrews and E. Yaacoub, "Toward Massive Machine Type Cellular Communications," in IEEE Wireless Communications, vol. 24, no. 1, pp. 120-128, February 2017
[10] W. Zhang et al., "Field trial and future enhancements for TDD massive MIMO networks," in Proc. IEEE PIMRC, Hong Kong, 2015, pp. 2339-2343.
[11] Macdonald M, Liu-Thorrold L, Julien R. The blockchain: A comparison of platforms and their uses beyond bitcoin. Work. Pap. 2017:1-8.
[12] J. Choi, "NOMA-Based Random Access With Multichannel ALOHA," IEEE J. Sel. Areas Commun., vol. 35, no. 12, pp. 2736-2743, Dec. 2017.
[13] Y. Ma, Z. Yuan, Y. Hu, W. Li, Z. Li, "A Data-assisted Algorithm for Truly Grant-free Transmissions of Future mMTC", will be published in Proc. IEEE Globecom, Virtual, 2020.
[14] H. Ye, G. Li and F. Juang, "Bilinear Convolutional Auto-encoder based Pilot-free End-to-end Communication Systems", in Proc. IEEE ICC, Virtual, 2020.
[15] Y. Ma, Z. Yuan, Y. Hu and W. Li, "A Real Fourier-Related Transform Spreading OFDM Multi-User Shared Access System," in Proc. VTC-Fall, Honolulu, HI, USA, 2019, pp. 1-5.
[16] Z. Yuan, Y. Hu, Y. Ma, W.Li and Z. Li, "Autonomous Grant-free High Overloading Multiple Access based on Conjugated Data Symbols" Accepted in IEEE ICC 2020 Workshop of NOMA 5G, virtual, 2020.
[17] E. Casini, R. De Gaudenzi and O. Del Rio Herrero, "Contention Resolution Diversity Slotted ALOHA (CRDSA): An Enhanced Random Access Scheme for Satellite Access Packet Networks," IEEE Trans. Wireless Commun.., vol. 6, no. 4, pp. 1408-1419, April 2007.
[18] Y. Ma, Z. Yuan, W. Li and Z. Li, "NOMA based Modern Random Access not Relying on Sensing or Power Control". Submitted to IoT-J. The current statue is under review.
[19] 3GPP R1-1903879, "consideration on 2-step RACH procedures", 2019.
[20] 3GPP TR 38.812, "Study on non-orthogonal multiple access (NOMA) for NR", Release 16, 2018.
[21] Y. Yuan, Z. Yuan and L. Tian, "5G Non-orthogonal Multiple Access (NOMA) Study in 3GPP" in IEEE Commun. Mag. In publish.
[22] 3GPP TS 36.785, "Vehicle to Vehicle (V2V) services based on LTE sidelink; User Equipment (UE) radio transmission and reception", Release 14, 2016.
[23] 3GPP TS 38.213, "NR; Physical layer procedures for control", Release 16, 2020.
[24] 3GPP TR 38.885, "Study on NR Vehicle-to-Everything (V2X)", Release 16, 2020.
[25] Z. Yuan, Y. Ma, Y. Hu, and W. Li, "High-efficiency full-duplex V2V communication," in Proc. 2nd 6G Wireless Summit, Levi, Finland, Mar. 2020.
– 25 –
Industry-driven digital transformation


AUTOMATION OF COMPUTATIONAL RESOURCE CONTROL OF CYBER-PHYSICAL SYSTEMS WITH MACHINE LEARNING
Ved P. Kafle; Abu Hena Al Muktadir
National Institute of Information and Communications Technology, Tokyo, Japan
ABSTRACT
Cyber-physical systems require the quality of service (QoS) guaranteed performance of service functions and processes executed in cyberspace. Because of low-latency requirements, most of such functions must be executed in edge computing infrastructure, where computational resources are limited. For efficient management of limited available resources in edge cloud to meet very low-latency requirements of services, this paper proposes a dynamic resource control scheme to adjust computational resources allocated to virtual network functions (VNFs). The scheme employs machine learning (ML) techniques composed of multiple regression models, which are continuously retrained online by using performance data collected from the running system. We demonstrate its effectiveness through experimental evaluation results obtained from an implementation of an IoT-directory service function in a resource virtualization platform provided by Docker containers in cyberspace. The IoT-directory service, whose architecture is based on Recommendation ITU-T Y.3074, is a scalable system that can store a huge amount of control information of a billion IoT devices in the form of name records and provides a very fast lookup service with the latency of a few milliseconds. The proposed scheme is related to ML-based network control and management methods currently being standardized in the ITU-T Study Group 13.
Keywords— Artificial intelligence, cyber-physical system, edge computing, machine learning, network infrastructure,
resource control, standardization
1. INTRODUCTION
Japan’s Society 5.0 [1] and Europe’s Industry 4.0 [2] visions have considered exploiting the potential of digital technology for the unprecedented transformation of society and industry. They envision exploiting technological innovations in the field of Internet of Things (IoT), cyber-physical systems, 5G networks, big data, edge computing, artificial intelligence (AI) and robotics. These technologies help in realizing a forward-looking society that overcomes the existing limitations of humans, society, industry, and systems.
Cyber-physical systems integrate the objects of physical space with the digital objects or entities in cyberspace. IoT
extends Internet connectivity to physical objects such as machines, people, animals and environments equipped with devices capable of sensing, controlling, computing and communication. 5G networks are used to connect physical objects with the corresponding digital objects in cyberspace. 5G networks will be capable to upload a huge volume of sensing data from physical space to cyberspace and transfer knowledge or control commands in the reverse direction. For time-critical services, the cyber-physical interaction should be completed in a very small-time latency, usually within a few milliseconds [3]. Namely, communication and computing tasks to be completed in cyberspace should finish within a very strict time limit.
Computing, storage and communication resources in cyberspace are virtualized so that they can be controlled and utilized more efficiently. These resources can be allocated to cyber functional entities in a fine granularity and adjusted dynamically. Functional entities in cyberspace exist in the form of software programs, which are placed as nodes of a network and known as virtual network functions (VNFs). To satisfy the performance requirements of latency-sensitive services, such as augmented reality, telemedicine, online multiparty video games, and self-driving vehicles, the VNFs are placed in cloud computing infrastructure available at the end-user’s proximity, known as the edge cloud [4], so that communication latency incurred for exchanging information between the users and cyberspace can be reduced to a very small value. Since edge cloud has limited computing resources, the dynamic and fine tuning of resources allocated to VNFs is necessary to optimally utilize resources while satisfying the service’s performance requirements. To address this issue, in this work we investigate a dynamic resource control scheme to optimally adjust the computational resource allocated to VNFs.
The proposed scheme employs machine learning (ML) techniques for the fine control of computational resources. Multiple regression models of gradient boosting regression and extremely randomized trees are used as ML techniques. These models are trained offline before their deployment and retrained regularly online by using telemetry data collected from the running system. We demonstrate the effectiveness of the proposed scheme through experimental results obtained from an implementation of an IoT-directory service (IoT-DS) system as a VNF in the resource virtualization platform created with Docker containers [12]. IoT-DS, whose architecture is based on Recommendation ITU-T
978-92-61-31391-3/CFP2068P @ ITU 2020 Kaleidoscope– 27 –

Y.3074 [5], is a scalable directory service system, which can store control information of a billion IoT devices in the form of name records and provide a very fast lookup service with the latency of a few milliseconds. The proposed resource control scheme dynamically adjusts the amount of allocated computational resource to the IoT-DS module according to the fluctuating workload. It assures that enough computational resource is provided so that the record lookup latency does not exceed the maximum tolerable limit, while the allocated resource is utilized at a maximum possible level. This scheme is related to the ITU-T Study Group 13’s standardization work on ML-based network control and management methods.
The remainder of this paper is organized as follows. Section 2 provides an overview of cyber-physical systems and related works. Section 3 presents the proposed multiple regression-based resource adjustment scheme. Section 4 discusses the performance evaluation results obtained from a preliminary implementation in a small-scale experimental system. The last section concludes the paper with some remarks on related ITU-T standardization work.
2. CYBER-PHYSICAL SYSTEM OVERVIEW ANDRELATED WORK
This section presents an overview of cyber-physical systems and outlines related works on machine learning-based resource control mechanisms.
2.1 Cyber-physical systems
Figure 1 illustrates a cyber-physical system, whose cyberspace contains big data, and AI and 5G network and physical space contains IoT devices and robots.
IoT is a generic concept of extending Internet connectivity to any physical object by embedding devices capable of sensing, controlling, computing and communication in the object. Various types of sensors attached to IoT devices monitor the environment they lie in and generate a huge volume of data in the form of video, image, sound, weather conditions, and system operation logs to name a few. 5G mobile communication networks, whose deployment has started recently in many countries, are indispensable infrastructures
to provide ubiquitous connectivity and realize the fusion of physical space and cyberspace. Thanks to its capabilities of transmitting a huge volume of data, about 20 Gigabits in every second, connecting one million devices in the area of every square kilometer, and reducing transmission latency to around one millisecond, 5G networks can upload a huge volume of sensing raw data from the physical space to cyberspace and transfer knowledge and control or actuation commands from cyberspace to the physical space.
AI and ML enable cyberspace to learn, infer, and make an intelligent decision like humans. Additionally, AI/ML techniques have the capability of processing a huge amount of data (known as big data) in a short time, exceeding the capability of humans. AI/ML techniques are now being used to solve numerous problems in various service domains such as healthcare, manufacturing, transport mobility, energy management, weather forecast and safety. The advancement of IoT and the reduction of sensor electronics’ price have made it feasible to collect a huge volume of data of different granularity. Similarly, the availability of sophisticated computation and data storage facility in cyberspace has made it possible to store, share and process big data by AI/ML techniques in a short time. The more the volume and diversity of big data are, the better the AI systems can be trained so that they can produce highly accurate results. Robots are the agents in the physical space that work on behalf of humans. A robotic agent can exist separately, or be attached to other machines. Humanoid robots helping with housework can exist separately. In Society 5.0, with the support of robots, humans can live more comfortably and devote more time to create innovative products and services, optimizing the entire social and organizational system.
2.2 Related work
This subsection outlines related work on the computing resource control of cyberspace. The computing resource is allocated in the form of CPU cores and CPU time in a fine granularity of microseconds. ML and threshold rule-based techniques have been utilized for virtual resource management. ML-based techniques use various models such as Gaussian process, auto-regression, and supervised learning. A Gaussian process-based online workload and latency prediction model is presented in [6] to adjust the number of CPU cores allocated to Docker containers for executing tasks of latency-sensitive applications. An auto-regressive model is used in [7] to predict CPU resource requirements and allocate CPUs to virtualized servers running in enterprise data centers. A supervised learning approach is described in [8], where regression models are trained offline and then employed for the dynamic resource adjustment decisions. The authors of [9] employed a rule-based vertical scaling of Docker containers running Graylog server applications to adjust the allocated CPU cycles every 4 seconds.
Prior work [8] proposed a scheme employing prediction models based on multiple regressions to adjust resources allocated to latency sensitive VNFs dynamically. The
Figure 1 - Cyber-physical system illustration
P h ys ica l s p a ce
Cyb e r s p a ceAn a lys is De cis io nVis u a liz a t io n
P r e d ic t io n Op t im iza t io nI d e n t ifica t io n
Sen
sing
Actu
ation
IoT
5G
Robot
Big Data
Artificial Intelligence (AI)
– 28 –
2020 ITU Kaleidoscope Academic Conference

objective was to optimize resource allocation and simultaneously satisfy the target performance requirements in terms of latency and resource utilization. The scheme can complete three related tasks (i.e., monitoring data collection and processing, resource adjustment decision making, and completion of decision execution) within a second interval. As a use case of latency-sensitive VNF, we have selected the Internet-of-Things directory service (IoT-DS) function [10] to evaluate the effectiveness of the proposed resource control scheme.
Both supervised [6-8] and unsupervised [11] ML-based approaches can be employed for the purposes of dynamic resource adjustment. Supervised learning approaches provide the advantages of offline training of the system with a large data set and achieving high prediction accuracy from the beginning of the system operation. However, they may suffer from less accurate prediction of unknown input patterns and require tedious jobs for the preparation of a training data set. Unsupervised ML techniques, on the other hand, are desirable to reduce the necessity of human involvement in the preparation of a training data set and improve the prediction accuracy of unseen input data patterns. For example, an unsupervised reinforcement-learning model presented in [11] can dynamically adjust multipath TCP window sizes to avoid network congestion. This paper extends the supervised approach presented in [8] with an unsupervised one, where multiple regression-based ML models of gradient boosting regression and extremely randomized trees are retrained online at regular intervals from monitoring data collected from the running system. The ML models are updated by the newly trained models so that they can make more accurate resource adjustment decisions.
3. DYNAMIC RESOURCE ADJUSTMENT SCHEME WITH RE-TRAINING
In this section, we discuss the system model and present the proposed scheme employing multiple regression models for virtual resource adjustment of latency sensitive VNFs.
3.1. System model
The resource adjustment system model is shown in Figure 2. An edge cloud hosts N containerized VNFs in a server machine. The VNFs can be categorized into two classes: one supporting high priority, latency-sensitive, and mission-critical services and the other supporting low priority,
latency tolerant batch processing applications (e.g., scientific computation tasks not having strict deadline for completion). The VNFs for batch-processing applications use the remaining resources available after allocating to the high priority, latency-sensitive VNFs. The resource controller (RC) continuously monitors and records a VNF’s resource allocation and utilization status as well as performance metrics (e.g., service latency). The RC executes resource adjustment algorithms (e.g., our proposed regression models as well as conventional algorithm [10]) to adjust the computational resource by using Docker update commands [12]. The round-trip time or latency of the service provided by a latency sensitive VNF measured at an end-user (EU) device is the time elapsed from the instance the EU sends a service request to the edge cloud to the instance it receives the response from the VNF. This latency consists of two components: the round-trip communication latency between the EU and VNF and the computational latency of the VNF. With the dynamic and accurate adjustment of computational resource allocated to the VNF, we can control the value of the latter part of latency.
3.2. Data set preparation and offline training
The data set preparation process includes system monitoring data collection and processing. The data is collected from the system running the real VNF offline with simulated patterns of possible input workloads. Various parameters are recorded such as workload (e.g., number of service requests fed to the system per unit time), amount of resource allocated
Figure 2 - Resource adjustment system model
RC
EU 1
Resource controller
EU 2 EU K
VNF 1 VNF 2 VNF N
…...
…
Virtual network functions
End users
Edge cloud
Figure 3 - Flowchart of offline training procedure
Start
Stop
Training data
Regression model(s)
Selection of single or combined prediction
method
Training execution
Model evaluation
Training data
available?
Yes
No
Selected model
– 29 –
Industry-driven digital transformation

(e.g., CPU cycles), resource utilization (i.e., amount of allocated resource utilized or kept busy), and performance latency (i.e., amount of time taken by the VNF to process a service request and provide the response). The data is collected at the highest frequency supported by the system, i.e. without hampering the system performance. Data is cleaned and processed to extract the most relevant features and their values (e.g., mean, median, maximum or minimum values) according to the correlation coefficient of the target variables. The data set is split into the training and test data sets.
The offline training procedure is shown in Figure 3. To train the model, we fit regression model(s) with the training data by tuning hyper-parameters. During the training execution, each model is ranked based on their prediction errors and training times. This training procedure is repeated until all test data sets have been used. After that the best model that gives the least prediction error is selected.
3.3. Online retraining
With the adoption of online retraining of the model, we can dynamically update the model to make it capable of dealing with changing workload patterns and system status. The flowchart of dynamic resource adjustment with online retraining of regression models is shown in Figure 4. At the interval of every second, the current workload is observed from the system and fed to the best-trained model that determines the amount of required resources to maintain the target values of latency and utilization metrics. Accordingly, the decision of either to increase or decrease the amount of allocated resource is executed by using control commands of the container platform. In parallel, we append the currently observed workloads, performance metrics, resource allocation and utilization data to the training data set (as the latest entry). Since a fixed training data set size ensures the deterministic value of model training time with hyper-parameter tuning, when we add a new entry to the training data set, we drop the oldest entry to keep the training data set size unchanged. When some fixed number (say Z) of
observation data are added to the training data set, the models are retrained online by using a copy of the most recent training data set. The retrained models replace the old ones at the beginning of the next time slot. If workload variation is significant, a small value of Z is preferred, and vice versa. This approach of model retraining at regular intervals is useful for tackling with the unknown nature of future workload variations. Note that multiple trained models can be used to predict the proper values of resource allocation. We can select only one model or create an ensemble of various models for improving the prediction accuracy.
4. PERFORMANCE EVALUATION RESULTS
In this section, we describe the parameter settings of the IoT-DS experimental system, its setup, input workload patterns, evaluation criteria, and evaluation results.
4.1. Experimental setup and considerations
As shown in Figure 5 the IoT-DS test bed system consisted of three virtual machines (VMs), of which two VMs served as a resource controller (RC) and an EU sending lookup queries for records, respectively, and the third VM contained the Docker containerized IoT-DS module with 100K records in its registry database (DB). The VMs were created by using the VirtualBox software on a Windows 8.1 PC with Intel Core i7-5930K 12 cores CPU (3.5 GHz) and a 64 GB memory. The front end of IoT-DS received and processed lookup queries from the EU and sent back the requested IoT device records in response messages after the queries were processed from the back-end database. We exclusively allocated a CPU core to the Docker container that implemented the front end. This CPU was at target to monitor the computational resource (i.e., number of CPU cycles or time) allocated to the container and the performance in terms of record lookup response time (measured as the difference between the time instance (i.e., t1) a lookup query is issued from the EU and the time instance (i.e., t2) a corresponding response is received. We applied regression models to predict the number of CPU cycles to be allocated to the container based on different patterns of input workloads and current resource utilizations. We aimed at Figure 4 - Flowchart of model deployment and online retraining
Start
Stop
Current workload
Best trained model(s)
Select single or combined prediction
Execution
Model evaluation
Workload available?
Append to dataset
Z observations
added?
Copy w% of most recent observations
Re-train model(s)
Replace old model(s)Yes
No
Yes
No
Dynamic resource adjustment decision
Online re-training of regression models
Figure 5 - Experimental setup for performance evaluation
EU
RC Records DB
Front-end
Resource monitoring tool
VM Docker container Server daemon
Query (t1)
Response (t2)
Resource adjustment
– 30 –
2020 ITU Kaleidoscope Academic Conference

improving the accuracy of resource requirement prediction through the online retraining of the models.
We sent record lookup queries workload to the front end in two patterns: Poisson distribution and sine curve. As shown in Figure 6, the Poisson workload arrival pattern lasted for 300 seconds, with an average of about 1000 queries per second (QPS). The sine curve input pattern also lasted for 300 seconds, and it reached the maximum value of 930 QPS three times in between, as illustrated in Figure 7. In the case of the sine workload input, we discarded the first 25 seconds measurement to wait until the system’s stable operation.
We evaluated the prediction performance of online retrained models in terms of the mean absolute error (MAE) and the amount of actual and predicted CPU utilizations. Note that the predicted resource utilization with 100% of CPU cycles allocation is a decision value of resource allocation when
performing resource adjustment. The MAE is defined as follows.
MAE =1𝑋𝑋𝑎𝑎𝑎𝑎𝑎𝑎(𝑎𝑎𝑖𝑖 − 𝑝𝑝𝑖𝑖) × 100 %𝑋𝑋
𝑖𝑖=1
where 𝑎𝑎𝑖𝑖 and 𝑝𝑝𝑖𝑖 are the actual utilization and predicted utilization values, respectively, and 𝑋𝑋 is the total number of observations.
We also define the parameter 𝛥𝛥 = ∑ (𝑎𝑎𝑖𝑖−𝑝𝑝𝑖𝑖)𝑋𝑋𝑖𝑖=1∑ 𝑎𝑎𝑖𝑖𝑋𝑋𝑖𝑖=1
× 100%,
whose value can be positive or negative.
We selected the gradient boosting regression (GBR) and extremely randomized trees regression (ETR) algorithms for online retraining in an interval of every 10 seconds. Training data was collected and updated every second. For GBR we
Table 1 - Prediction errors and 𝛥𝛥 for ETR and GBR online retrained models for two workload patterns.
Sine workload Poisson workload
MAE (%) 𝛥𝛥(%) MAE (%) 𝛥𝛥(%)
ETR 0.89% 0.96% 2.66% - 1.16%
GBR 1.02% 0.59% 2.85% - 0.47%
Figure 6 - Comparison of actual and predicted resource utilization with Poisson workload pattern
Figure 7 - Comparison of actual and predicted resource utilization with sine workload pattern
– 31 –
Industry-driven digital transformation
used four hyper-parameters (criterion for split = MAE, learning rate = 0.3, number of estimators = 50, and subsample size = 0.8) and for ETR two hyper-parameters (criterion for split = MAE and number of estimators = 28).
4.2 Resource utilization prediction with online retraining
The comparisons of actual and predicted resource utilization values with Poisson and sine input workload patterns (i.e., QPS) are illustrated in figures 6 and 7, respectively. The findings from these figures are summarized in Table 1.
Figure 6 shows that the prediction performances of both GBR and ETR improved with retraining (between 100-200 seconds). However, applying more training data might degrade the prediction performance by overfitting the predictions (between 200-300 seconds). Initially, the predicted utilization for the sine wave workload was far behind the actual utilization. However, it converged quickly after four retraining iterations (around 60 seconds in Figure 7). Due to this reason, 𝛥𝛥 is positive for both ETR and GBR in Table 1. For the Poisson workload, since the variation in workload was less, the predictions were almost similar to or marginally higher than the actual ones after the first round of retraining (around 10 seconds in Figure 6), resulting in a negative value of 𝛥𝛥 for both models. The ETR model scored the MAE values of 0.89% and 2.66% for sine and Poisson workload patterns, respectively, while the GBR model scored 1.02% and 2.85%, respectively.
There were sporadic actual high resource utilization values, specifically for the Poisson workload, which might be due to the fluctuations in the state of an experimental system’s virtualization platform. To cope with this situation, we ran the experiment several times to keep the occurrences of sporadic high utilization values at a minimum number of times and presented the best-case results for sine and Poisson workloads here.
The capability of accurately predicting resource utilization enables us to dynamically adjust the allocated resources and maintain the desired performance. Based on the accurate estimation of resource utilization, we can calculate the required amount of computational resource to keep the resource utilization value less than a threshold value (say 80%) and achieve the desired performance (i.e., lookup latency kept lower than a maximum tolerable value). We can use a Docker update command to adjust the computational resource as described in [10].
5. CONCLUSION
We have proposed and evaluated a computational resource control scheme employing multiple regression models as ML techniques. It can support in dynamic resource adjustment decision making. Its accuracy is increased by online retraining of the models training data set collected from the running system. Our experimental results obtained from a test bed implementation of the IoT directory service function
in the Docker container virtualization platform demonstrated the efficacy of the proposed resource control scheme. We observed that the ETR model can predict the resource utilization of sine and Poisson workload patterns with good accuracies, namely, mean absolute errors of 0.89% and 2.66%, respectively.
In future work, we will extend this work to applying the prediction of resource utilization to perform the actual resource adjustment with the online retraining models. We will study more about the optimal size of a training data set and hyper-parameters tuning of ETR and GBR. The proposed scheme is related to ML-based network control and management methods that are currently being standardized in the ITU-T Study Group 13.We will also bring this research outcome gradually to ITU for standardization. The IoT-directory service, which has been used in the performance evaluation of the proposed resource adjustment scheme, is based on Recommendation ITU-T Y.3074. It is a scalable directory system that can store control information of a billion IoT devices in the form of name records and provide a very fast lookup service with the latency of a few milliseconds.
REFERENCES
[1] M. Fukuyama, “Society 5.0: Aiming for a New Human-Centered Society,” Japan SPOTLIGHT, July/August 2018, pp. 47-50.
[2] G. Aceto, V. Persico, and A. Pescapé, “A Survey on Information and Communication Technologies for Industry 4.0: State-of-the-Art, Taxonomies, Perspectives, and Challenges,” IEEE Commun. Surveys & Tutorials, Vol. 21, Issue 4, 2019, pp. 3467 - 3501.
[3] “The Tactile Internet,” ITU-T Technical Watch Report, Aug. 2014.
[4] M. Chiang, S. Ha, C. I, F. Risso, and T. Zhang, “Clarifying Fog Computing and Networking: 10 Questions and Answers,” IEEE Commun. Mag., vol. 55, no. 4, pp. 18-20, Apr 2017.
[5] ITU-T Recommendation Y.3074, “Framework for directory service for management of huge number of heterogeneously named objects in IMT-2020,” 2019.
[6] S. Shekhar, H. Abdel-Aziz, A. Bhattacharjee, A. Gokhale, and X. Koutsoukos, “Performance Interference-Aware Vertical Elasticity for Cloud-Hosted Latency-Sensitive Applications,” in Proc. 11th IEEE Cloud, San Francisco, CA, 2018, pp. 82-89.
– 32 –
2020 ITU Kaleidoscope Academic Conference

[7] W. Xu, X. Zhu, S. Singhal, and Z. Wang, “Predictive Control for Dynamic Resource Allocation in Enterprise Data Centers,” in Proc. IEEE/IFIP NOMS, Vancouver, BC, 2006, pp. 115-126.
[8] A.H.A. Muktadir and V.P. Kafle, “Prediction and Dynamic Adjustment of Resources for Latency-Sensitive Virtual Network Functions,” in Proc. 23rd ICIN Conf., Paris, France, Feb. 2020.
[9] Y. Al-Dhuraibi, F. Paraiso, N. Djarallah, and P. Merle, “Autonomic Vertical Elasticity of Docker Containers with ElasticDocker,” in Proc. 10th IEEE Cloud, Honolulu, CA, 2017, pp. 472-479.
[10] V.P. Kafle, Y. Fukushima, P. Martinez-Julia, and H. Harai, “Scalable Directory Service for IoT Applications,” IEEE Commun. Standards Mag., vol. 1, no. 3, pp. 58-65, Sept. 2017.
[11] W. Li, H. Zhang, S. Gao, C. Xue, X. Wang, and S. Lu, “SmartCC: A Reinforcement Learning Approach for Multipath TCP Congestion Control in Heterogeneous Networks,” IEEE JSAC, vol. 37, no. 11, pp. 2621-2633, Nov. 2019.
[12] Docker update command documentation, https://docs.docker.com/engine/reference/commandline/update/ , visited June 20, 2020.
– 33 –
Industry-driven digital transformation


SESSION 3
WIRELESS INFRASTRUCTURE AND DIGITAL TRANSFORMATION
S3.1 Digital transformation via 5G: Deployment plans*
S3.2 Flexible multiplexing mechanism for coexistence of URLLC and eMBB services in 5G networks*
S3.3 Wireless technology and protocol for IIoT and digital twins

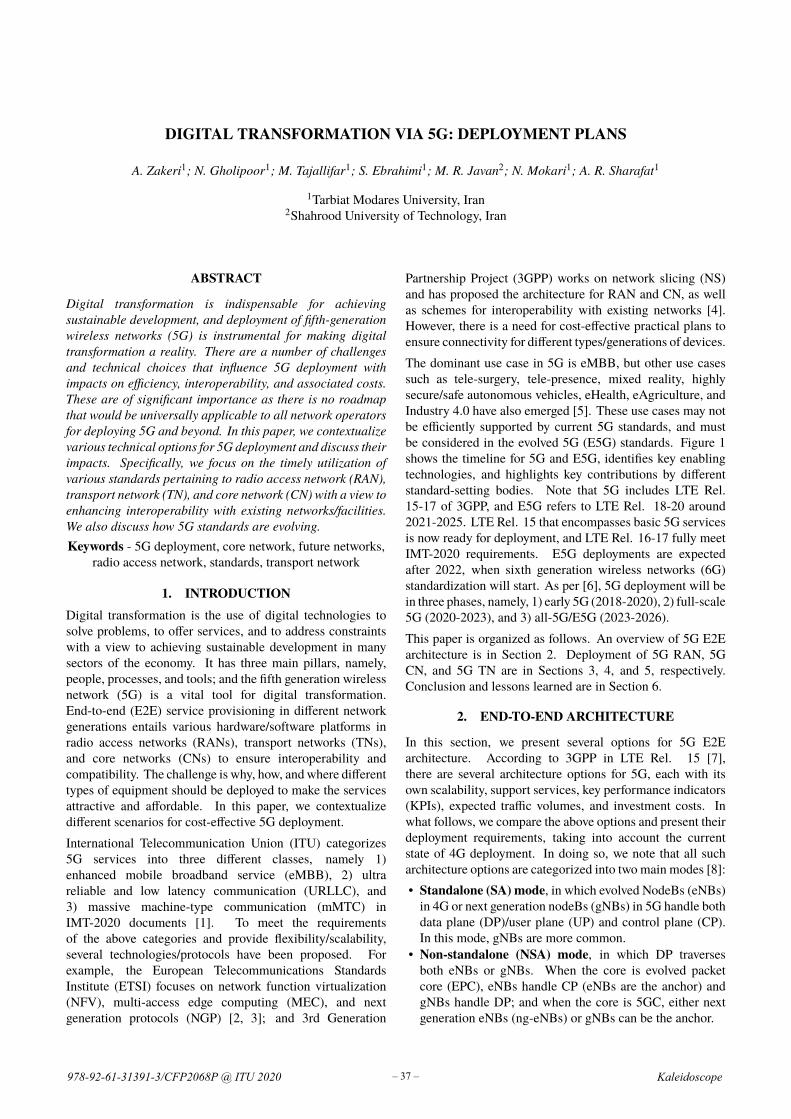
DIGITAL TRANSFORMATION VIA 5G: DEPLOYMENT PLANS
A. Zakeri1; N. Gholipoor1; M. Tajallifar1; S. Ebrahimi1; M. R. Javan2; N. Mokari1; A. R. Sharafat1
1Tarbiat Modares University, Iran2Shahrood University of Technology, Iran
ABSTRACT
Digital transformation is indispensable for achievingsustainable development, and deployment of fifth-generationwireless networks (5G) is instrumental for making digitaltransformation a reality. There are a number of challengesand technical choices that influence 5G deployment withimpacts on efficiency, interoperability, and associated costs.These are of significant importance as there is no roadmapthat would be universally applicable to all network operatorsfor deploying 5G and beyond. In this paper, we contextualizevarious technical options for 5G deployment and discuss theirimpacts. Specifically, we focus on the timely utilization ofvarious standards pertaining to radio access network (RAN),transport network (TN), and core network (CN) with a view toenhancing interoperability with existing networks/facilities.We also discuss how 5G standards are evolving.Keywords - 5G deployment, core network, future networks,
radio access network, standards, transport network
1. INTRODUCTIONDigital transformation is the use of digital technologies tosolve problems, to offer services, and to address constraintswith a view to achieving sustainable development in manysectors of the economy. It has three main pillars, namely,people, processes, and tools; and the fifth generation wirelessnetwork (5G) is a vital tool for digital transformation.End-to-end (E2E) service provisioning in different networkgenerations entails various hardware/software platforms inradio access networks (RANs), transport networks (TNs),and core networks (CNs) to ensure interoperability andcompatibility. The challenge is why, how, andwhere differenttypes of equipment should be deployed to make the servicesattractive and affordable. In this paper, we contextualizedifferent scenarios for cost-effective 5G deployment.International Telecommunication Union (ITU) categorizes5G services into three different classes, namely 1)enhanced mobile broadband service (eMBB), 2) ultrareliable and low latency communication (URLLC), and3) massive machine-type communication (mMTC) inIMT-2020 documents [1]. To meet the requirementsof the above categories and provide flexibility/scalability,several technologies/protocols have been proposed. Forexample, the European Telecommunications StandardsInstitute (ETSI) focuses on network function virtualization(NFV), multi-access edge computing (MEC), and nextgeneration protocols (NGP) [2, 3]; and 3rd Generation
Partnership Project (3GPP) works on network slicing (NS)and has proposed the architecture for RAN and CN, as wellas schemes for interoperability with existing networks [4].However, there is a need for cost-effective practical plans toensure connectivity for different types/generations of devices.The dominant use case in 5G is eMBB, but other use casessuch as tele-surgery, tele-presence, mixed reality, highlysecure/safe autonomous vehicles, eHealth, eAgriculture, andIndustry 4.0 have also emerged [5]. These use cases may notbe efficiently supported by current 5G standards, and mustbe considered in the evolved 5G (E5G) standards. Figure 1shows the timeline for 5G and E5G, identifies key enablingtechnologies, and highlights key contributions by differentstandard-setting bodies. Note that 5G includes LTE Rel.15-17 of 3GPP, and E5G refers to LTE Rel. 18-20 around2021-2025. LTE Rel. 15 that encompasses basic 5G servicesis now ready for deployment, and LTE Rel. 16-17 fully meetIMT-2020 requirements. E5G deployments are expectedafter 2022, when sixth generation wireless networks (6G)standardization will start. As per [6], 5G deployment will bein three phases, namely, 1) early 5G (2018-2020), 2) full-scale5G (2020-2023), and 3) all-5G/E5G (2023-2026).This paper is organized as follows. An overview of 5G E2Earchitecture is in Section 2. Deployment of 5G RAN, 5GCN, and 5G TN are in Sections 3, 4, and 5, respectively.Conclusion and lessons learned are in Section 6.
2. END-TO-END ARCHITECTURE
In this section, we present several options for 5G E2Earchitecture. According to 3GPP in LTE Rel. 15 [7],there are several architecture options for 5G, each with itsown scalability, support services, key performance indicators(KPIs), expected traffic volumes, and investment costs. Inwhat follows, we compare the above options and present theirdeployment requirements, taking into account the currentstate of 4G deployment. In doing so, we note that all sucharchitecture options are categorized into two main modes [8]:• Standalone (SA) mode, in which evolved NodeBs (eNBs)in 4G or next generation nodeBs (gNBs) in 5G handle bothdata plane (DP)/user plane (UP) and control plane (CP).In this mode, gNBs are more common.
• Non-standalone (NSA) mode, in which DP traversesboth eNBs or gNBs. When the core is evolved packetcore (EPC), eNBs handle CP (eNBs are the anchor) andgNBs handle DP; and when the core is 5GC, either nextgeneration eNBs (ng-eNBs) or gNBs can be the anchor.
978-92-61-31391-3/CFP2068P @ ITU 2020 Kaleidoscope– 37 –

2015-2019 2020 2021 2022 2023 2024 2025 2026 2027 2028 2029 2030 Beyond 2030
Manufacturing
Public transport
Retail
Public safetyHealthcare
5G services / use cases
Development Timeline Deployment Timeline
5G deployment
mMTC & URLLC
eMBB
mRMTC service
FeMBB & (URLLC+eMBB) service
ReMBB service
E5G deployment
6G initial deployment
2015-2019Year 2020 2021 2022 2023 2024 2025 2026 2027 2028 2029 2030 Beyond 2030
Releases 18-20Release 17
5G Evaluation & test
5G standardization5G commercial launch
E5G standardizationE5G commercial launch
eMBB services Some URLLC & mMTC services Multi SIM operation AR and VR applications Provision of wide range of 3rd
party and vertical services Highly accurate positioning
Enhancement of releases
Use
Cas
es
Technical specifications (NSA & SA)
Releases 14-16IMT 2020 to 2030 requirements
Next generation SDN Applying AI in 5GC Starting NGP Full-duplex communications NR for > 90 GHz Integration of non-cellular
technologies
NFV, SDN, and MEC Network slicing 5GC service-based architecture Dynamic FS and subcarrier spacing Zero touch network & Service
Management (ZSM) Integration of satellite
communications in 5G MIMO enhancement
Services & use cases
Technologies
6G
Key
Ena
bler
s
eURLLC services mMTC power
consumption improvement Extension of vertical use
cases Holographic
communication Energy efficiency eHealth services
Figure 1 – Left: 5G and E5G development timeline. Right: 5G and E5G deployment timeline. SDN: software definednetwork; NGP: next-generation protocols; AI: artificial intelligence; MEC: multi-access edge computing; eURLLC:
enhanced URLLC; FeMBB: further eMBB; ReMBB: reliable eMBB; RmMTC: reliable mMTC.
Architecture options for 5G deployment are as follows [7]:• Option 1: This option is the starting point for migrationfrom today’s 4G networks, and refers to the standaloneLTE radio network under EPC control.
• Options 3/3A/3X: In these options (NSA mode), CN isEPC, but eNBs and EPC must be upgraded to supporteNB-gNB dual connectivity (DC) and high capacity [8, 9].Also, eNBs are the anchor, eMBB services and 5G earlydevices are supported, RAN-level interworking betweeneNBs and gNBs is needed, and both deployment time andcosts are low. These options are chosen by some networkoperators, e.g., China Mobile and Verizon, as their initialstep towards 5G using mmWave and mid-band (3.5 GHz).Option 3X is suitable for backhaul-limited 4G networks,as traffic can be splitted in the gateway between eNBs andgNBs [8], and is recommended for initial 5G deployment inthe NSA mode, as its features are supported by eMBB 5Gdevices [9]. It has the shortest inter radio access technology(RAT) mobility interruption time and can provide VoLTEservice without RAT fallback [8, 9].
• Options 7/7A/7X: In these options, gNBs operate in theNSAmodewith eNBs, CN is 5GC, and eMBB services andsome URLLC use-cases are supported depending on 5GCcapabilities. Also, network slicing is supported, but eNBsand interfaces must be upgraded to ng-eNBs to support5GC signaling (i.e., 5G non-access stratum (5G NAS)).Service-based 5GC is provided via restful APIs and newcore functions. Although it takes longer to deploy theseoptions and costs more than Options 3/3A/3X, they aresuitable for hotspots or dense areas (mmWave gNBs).
• Options 4/4A: In these options, gNBs are the anchor andoperate in the NSAmode with ng-eNBs, CN is 5G, flexiblenetwork slicing is supported, and deployment time andcost are both high. Moreover, eNBs must be upgraded tosupport 5GC signaling and interfaces, and operators canutilize dynamic spectrum sharing (DSS) [10] or refarmsome 4G bands to deploy 5G in bands below 6 GHz.
• Option 2: This option is for the last stage of E2E 5Gdeployment, in which gNBs operate in the SA mode andCN is 5GC. It supports E2E network slicing [11], needsCN-level interworking with/without an N26 interface [4],and its deployment costs are high. Network operators canprovide independent networks to vertical customers in anefficient and flexible manner. It is completely future-prooffor E5Gwith low evolution costs. Option 2 is adopted afterOption 3 is implemented, where gNBs have already beenupgraded to provide interworking between 4G and 5G forsession continuity, and URLLC and mMTC services canbe deployed [11].
• Option 5: In this option, eNB operates in the SA mode,and CN is 5GC. It does not support mmWave bands andE2E network slicing, and can be used to deploy 5G inrural/urban areas to offer low latency services and 5GCcoverage. Its deployment costs are low, but eNBs shouldbe upgraded to ng-eNBs to support 5GC NAS and itsinterfaces. It is not future-proof with E5G RAN, butnetwork operators can choose this option to provide flexibleCN to support high-volume 4G traffic.
A network operator may choose different options for differentlocations depending on traffic volumes and future forecasts,e.g., Option 5 for rural areas, and Options 3/3A/3X inmmWaves for hotspots [8]. Selection of options dependson some key factors such as TTM, CapEx/OpEx limits,utilization of future-proof technologies, business trends, andexisting facilities. Table 1 shows some suitable sequencesof options for different network sizes, e.g., the sequence1→3→4/2 for tier-one operators, and 1→3→7→4/2 fortier-2/3 operators. In each sequence, a number of factors areconsidered, including geographical locations and coverage,availability of 5G enabled devices, and expected demand for5G services in different deployment stages. For highly denseareas that supportNFVandSDN, andwith sizable 5G enableddevices, the sequence 1→4/2 is suitable.
– 38 –
2020 ITU Kaleidoscope Academic Conference

Table 1 – Different Paths for Nationwide 5G/E5G DeploymentPath Main Factors and Features Considerations for Network Operators
1→ 3→7→4/2
• 5G early deployment with minimum CapEx• 5G eMBB services can be provisioned• 5G devices are available to support Options 3/3A/3X• 4G is utilized for longer periods
• There is a need to estimate 5G early customers• Ideal when 4G is widely available and the aim is to smoothly reach SA 5G before E5G/6G• Not recommended when the aim is fast provisioning of 5G services to vertical customers• Suitable when the aim is to smoothly prepare for 5GC, NFV, and SDN• Suitable for Tier 2/3 operators
1→3→4/2
• 5G early deployment with minimum CapEx• 4G spectrum can be re-farmed after Phase 1• 4G facilities can be leveragedto start and gradually expand 5G
• Switching from NSA to SA is costly• Recommended for rapid growth of 5G traffic and customers (after 2022)• Recommended for Tier 1 operators and rapid expansion of 5G
1→4/2
• 5G full-scale deployment• Long TTM• Provisioning all 5G services by enabling NS• NR works in SA mode and CN is 5GC (all modifiedfrom 4G)
• High CapEx• Need mature SDN, NFV, and E2E orchestrator in short time• Initial revenue may not be satisfactory• Forward compatibility with Rel. 16-17 should be considered• Recommended for special use cases (e.g., delay-sensitive applications) and hotspots
1→7→4/2• Supports both 5GC/EPC NAS in initial deployment• Offers 5GC and NR capabilities• Utilizes 4G RAN and its spectrum in initial phase
• High CapEx• Suitable when 4G coverage is extensive with high traffic• Suitable when NFV and SDN are implemented• Not recommended when the aim is quick 5G deployment
Choices Carrier Frequency BW Carrier
Frequency BW Carrier Frequency BW Characteristics
Choice 1 3.5 (3.3-4.2) GHz 100 MHz Low band (e.g., 800 MHz) 20 MHz
mmWave 1 GHz Phase 1: Provisioning 5G data rates to end-usersPhase 2: Provisioning 5G services in deep areasPhase 3: Provisioning all 5G services reliably (including data rate hungry services and in deep areas)
3.5 (3.3-4.2) GHz 100 MHz
Choice 2 3.5 (3.3-4.2) GHz 100 MHz
mmWave 1 GHz
3.5 (3.3-4.2) GHz 100 MHz
Phase 1: Provisioning 5G data rates to end-usersPhase 2: Provisioning all 5G services reliably (including data rate hungry services and in deep areas)Phase 3: Increasing 5G capacity and coverage
Low band (e.g., 800 MHz) 20 MHz
Choice 3 2.6 (2.496-2.69) GHZ 100 MHz 3.5 (3.3-4.2) GHz 100 MHz
mmWave 1 GHz Phase 1: Provisioning 5G data rates to end-usersPhase 2: Provisioning 5G services in deep areas (e.g., for IoT devices/sensors in blind spots)Phase 3: Provisioning all 5G services reliably (including data rate hungry services and in deep areas)Although 2.6 GHz is an important band in 4G, it can be used for 5G when 3.5 GHz band is not available.
Low band (e.g., 800 MHz) 20 MHz
Choice 4 2.6 (2.496-2.69) GHZ 100 MHz
mmWave 1 GHz
3.5 (3.3-4.2) GHz 100 MHz
Phase 1: Provisioning 5G data rates to end-usersPhase 2: Provisioning all 5G services reliably (including data rate hungry services and in deep areas)Phase 3: Increasing 5G capacity and coverageAlthough 2.6 GHz is an important band in 4G, it can be used for 5G when 3.5 GHz band is not available
Low band (e.g., 800 MHz) 20 MHz
Choice 5
mmWave 1 GHz
3.5 (3.3-4.2) GHz 100 MHz 3.5 (3.3-4.2) GHz 100 MHzPhase 1: Provisioning 5G services in hotspots and deep areasPhase 2: Provisioning 5G broadband services to end-usersPhase 3: Increasing 5G capacity and coverage
Low band (e.g., 800 MHz) 20 MHz
Phase 1 Phase 2 Phase 3
Figure 2 – Different choices for 5G spectrum
3. RADIO ACCESS NETWORK DEPLOYMENT
As stated in Section 2, the initial deployment of 5G RAN isin the NSA mode, followed by the SA mode. For 5G RANdeployment, one needs to consider the spectrum available for5G, the geographical coverage of 5G, as well as 5G RANarchitecture and technologies. In what follows, we discussdifferent choices/aspects pertaining to the above points.
3.1 5G and E5G Spectrum
Some important points pertaining to 5G spectrum are themarket size, service affordability, carrier aggregation (CA),end-user device availability, and regulatory and licensingrequirements. Spectrum for 5G and E5G includes: 1) below1 GHz for services that require long range or deep coverage,e.g., IoT services, 2) 1 − 6 GHz for services that require highdata rates ormedium coverage, and 3) above 6GHz (includingmmWaves) for very high data rates. The frequency spectrumbelow 6 GHz is denoted by FR1, and above 6 GHz is referred
to as FR2 [12]. Although in mmWave bands, path loss isconsiderable and propagation is not omnidirectional, but highbandwidth in excess of 400MHz is available [12].In order to deploy eMBB, as per GSMA and 3GPP, 80-100MHz in mid-band (3.5 GHz) and 1 GHz in mmWave bandsare needed. Continuous bandwidth is preferred as less poweris consumed and less guard band is wasted. When mid-bandis not available, 80 MHz can be freed via refarming or DSSor by acquiring more spectrum in the lower 2.6 GHz band.Depending on the traffic in 2G, 3G, and 4G networks,operators can use DSS between different generations toprovide spectrum for 5G in low-band and mid-band. DSSimplementation is simple and requires only a softwareupgrade in LTE network [10, 13]. The bands for frequencydivisionmultiplexing (FDD) in legacy networks (e.g., 800 and900 MHz) can be shared with 5G via DSS for fast roll-out of5G. In 5G, as in previous generations, higher bands are usedin small cells and lower bands in macro cells. DSS betweengNBs and eNBs is discussed in [10], and Figure 2 showsdifferent choices for 5G/E5G spectrum.
– 39 –
Industry-driven digital transformation
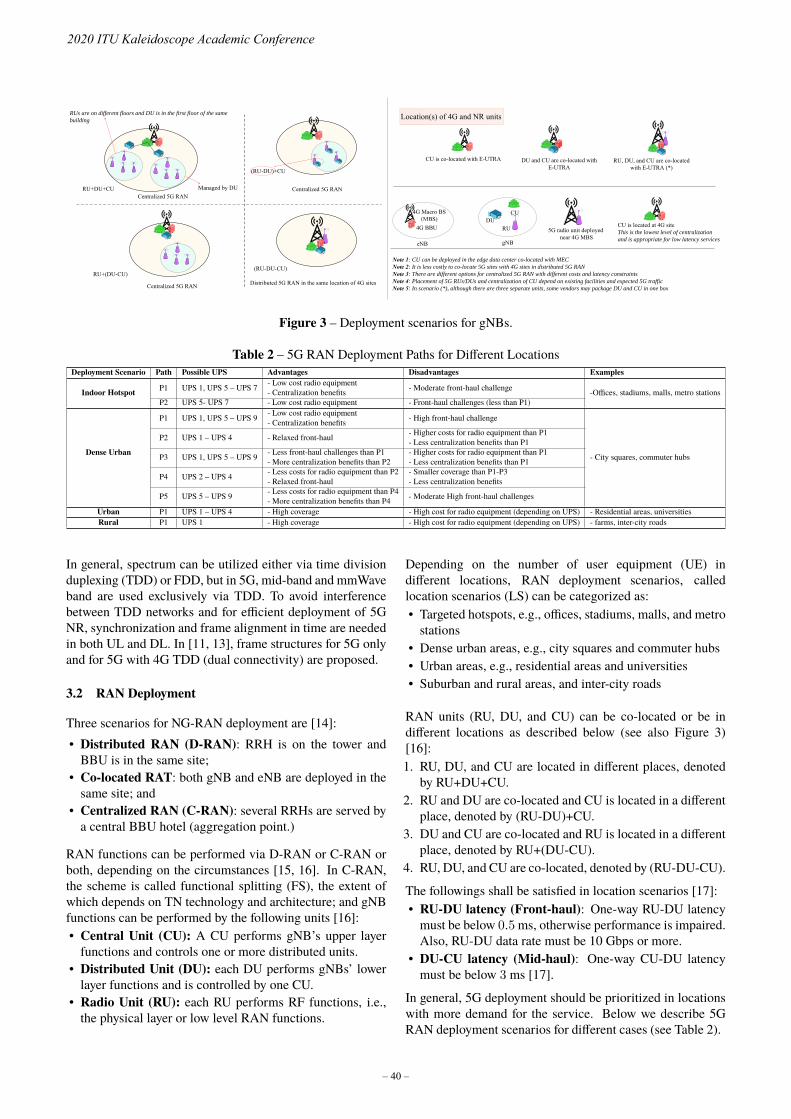
4G Macro BS (MBS)
RU DU
CU
RU+DU+CU
(RU-DU)+CU
RU+(DU-CU)(RU-DU-CU)
4G BBU
5G s gNB Units
gNB
RUs are on different floors and DU is in the first floor of the same
building
Centralized 5G RANCentralized 5G RAN
Centralized 5G RAN Distributed 5G RAN in the same location of 4G sites
5G s gNB Units
eNB
5G radio unit deployed near 4G MBS
Note 1: CU can be deployed in the edge data center co-located with MEC
Note 2: It is less costly to co-locate 5G sites with 4G sites in distributed 5G RAN
Note 3: There are different options for centralized 5G RAN with different costs and latency constraints
Note 4: Placement of 5G RUs/DUs and centralization of CU depend on existing facilities and expected 5G traffic
Note 5: In scenario (*), although there are three separate units, some vendors may package DU and CU in one box
CU is located at 4G siteThis is the lowest level of centralization
and is appropriate for low latency services
Managed by DU
RU, DU, and CU are co-located with E-UTRA (*)
DU and CU are co-located with E-UTRA
CU is co-located with E-UTRA
Location(s) of 4G and NR units
Figure 3 – Deployment scenarios for gNBs.
Table 2 – 5G RAN Deployment Paths for Different LocationsDeployment Scenario Path Possible UPS Advantages Disadvantages Examples
P1 UPS 1, UPS 5 – UPS 7 - Low cost radio equipment- Centralization benefits - Moderate front-haul challengeIndoor Hotspot
P2 UPS 5- UPS 7 - Low cost radio equipment - Front-haul challenges (less than P1)-Offices, stadiums, malls, metro stations
P1 UPS 1, UPS 5 – UPS 9 - Low cost radio equipment- Centralization benefits - High front-haul challenge
P2 UPS 1 – UPS 4 - Relaxed front-haul - Higher costs for radio equipment than P1- Less centralization benefits than P1
P3 UPS 1, UPS 5 – UPS 9 - Less front-haul challenges than P1- More centralization benefits than P2
- Higher costs for radio equipment than P1- Less centralization benefits than P1
P4 UPS 2 – UPS 4 - Less costs for radio equipment than P2- Relaxed front-haul
- Smaller coverage than P1-P3- Less centralization benefits
Dense Urban
P5 UPS 5 – UPS 9 - Less costs for radio equipment than P4- More centralization benefits than P4 - Moderate High front-haul challenges
- City squares, commuter hubs
Urban P1 UPS 1 – UPS 4 - High coverage - High cost for radio equipment (depending on UPS) - Residential areas, universitiesRural P1 UPS 1 - High coverage - High cost for radio equipment (depending on UPS) - farms, inter-city roads
In general, spectrum can be utilized either via time divisionduplexing (TDD) or FDD, but in 5G, mid-band and mmWaveband are used exclusively via TDD. To avoid interferencebetween TDD networks and for efficient deployment of 5GNR, synchronization and frame alignment in time are neededin both UL and DL. In [11, 13], frame structures for 5G onlyand for 5G with 4G TDD (dual connectivity) are proposed.
3.2 RAN Deployment
Three scenarios for NG-RAN deployment are [14]:• Distributed RAN (D-RAN): RRH is on the tower andBBU is in the same site;
• Co-located RAT: both gNB and eNB are deployed in thesame site; and
• Centralized RAN (C-RAN): several RRHs are served bya central BBU hotel (aggregation point.)
RAN functions can be performed via D-RAN or C-RAN orboth, depending on the circumstances [15, 16]. In C-RAN,the scheme is called functional splitting (FS), the extent ofwhich depends on TN technology and architecture; and gNBfunctions can be performed by the following units [16]:• Central Unit (CU): A CU performs gNB’s upper layerfunctions and controls one or more distributed units.
• Distributed Unit (DU): each DU performs gNBs’ lowerlayer functions and is controlled by one CU.
• Radio Unit (RU): each RU performs RF functions, i.e.,the physical layer or low level RAN functions.
Depending on the number of user equipment (UE) indifferent locations, RAN deployment scenarios, calledlocation scenarios (LS) can be categorized as:• Targeted hotspots, e.g., offices, stadiums, malls, and metrostations
• Dense urban areas, e.g., city squares and commuter hubs• Urban areas, e.g., residential areas and universities• Suburban and rural areas, and inter-city roads
RAN units (RU, DU, and CU) can be co-located or be indifferent locations as described below (see also Figure 3)[16]:1. RU, DU, and CU are located in different places, denoted
by RU+DU+CU.2. RU and DU are co-located and CU is located in a different
place, denoted by (RU-DU)+CU.3. DU and CU are co-located and RU is located in a different
place, denoted by RU+(DU-CU).4. RU, DU, and CU are co-located, denoted by (RU-DU-CU).
The followings shall be satisfied in location scenarios [17]:• RU-DU latency (Front-haul): One-way RU-DU latencymust be below 0.5ms, otherwise performance is impaired.Also, RU-DU data rate must be 10 Gbps or more.
• DU-CU latency (Mid-haul): One-way CU-DU latencymust be below 3 ms [17].
In general, 5G deployment should be prioritized in locationswith more demand for the service. Below we describe 5GRAN deployment scenarios for different cases (see Table 2).
– 40 –
2020 ITU Kaleidoscope Academic Conference
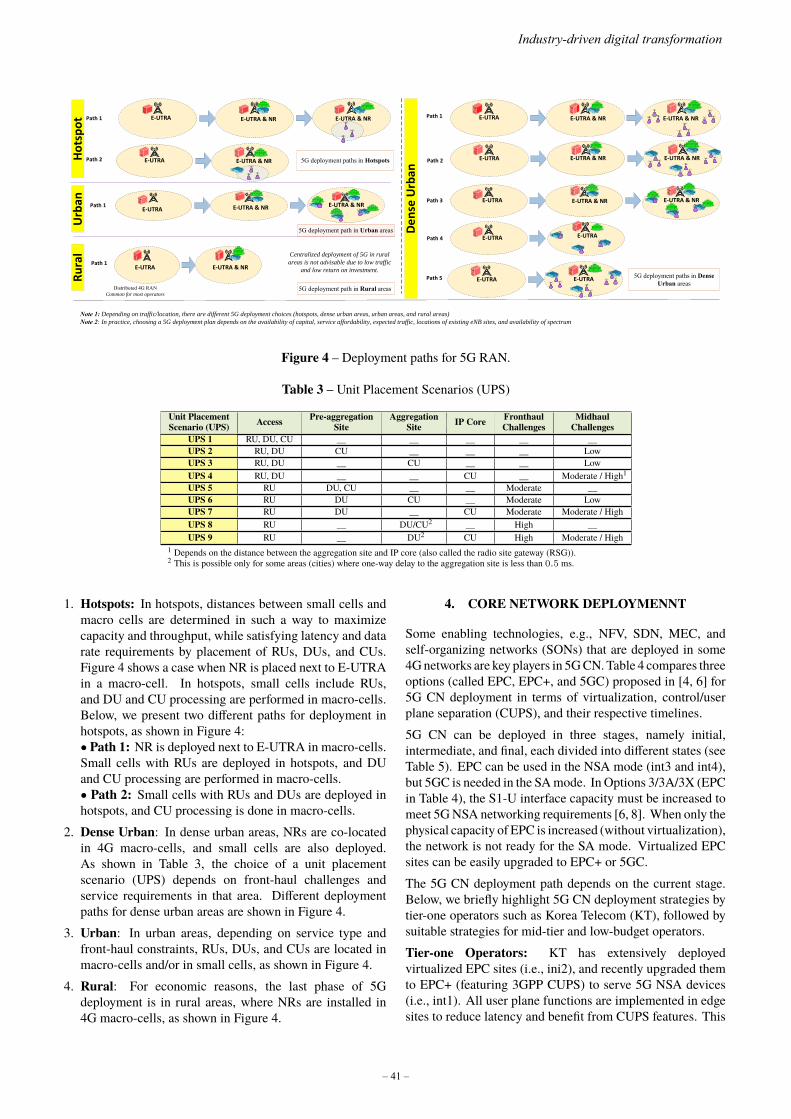
Distributed 4G RANCommon for most operators
Centralized deployment of 5G in rural
areas is not advisable due to low traffic
and low return on investment.
5G deployment paths in Hotspots
5G deployment path in Rural areas
5G deployment path in Urban areas
5G deployment paths in Dense Urban areas
Note 1: Depending on traffic/location, there are different 5G deployment choices (hotspots, dense urban areas, urban areas, and rural areas)
Note 2: In practice, choosing a 5G deployment plan depends on the availability of capital, service affordability, expected traffic, locations of existing eNB sites, and availability of spectrum
Path 1 E-UTRA E-UTRA & NR E-UTRA & NR
E-UTRA E-UTRA & NRPath 2
Path 1 E-UTRA E-UTRA & NR E-UTRA & NR
E-UTRA E-UTRA & NR E-UTRA & NR
E-UTRA E-UTRA & NR E-UTRA & NR
E-UTRA E-UTRA
E-UTRA E-UTRA
Path 2
Path 3
Path 4
Path 5
E-UTRA & NRE-UTRA & NRE-UTRAPath 1
Path 1E-UTRA & NRE-UTRA
Ho
tsp
ot
Urb
anR
ura
l
De
nse
Urb
an
Figure 4 – Deployment paths for 5G RAN.
Table 3 – Unit Placement Scenarios (UPS)
Unit PlacementScenario (UPS) Access Pre-aggregation
SiteAggregation
Site IP Core FronthaulChallenges
MidhaulChallenges
UPS 1 RU, DU, CU __ __ __ __ __UPS 2 RU, DU CU __ __ __ LowUPS 3 RU, DU __ CU __ __ LowUPS 4 RU, DU __ __ CU __ Moderate / High1UPS 5 RU DU, CU __ __ Moderate __UPS 6 RU DU CU __ Moderate LowUPS 7 RU DU __ CU Moderate Moderate / HighUPS 8 RU __ DU/CU2 __ High __UPS 9 RU __ DU2 CU High Moderate / High
1 Depends on the distance between the aggregation site and IP core (also called the radio site gateway (RSG)).2 This is possible only for some areas (cities) where one-way delay to the aggregation site is less than 0.5 ms.
1. Hotspots: In hotspots, distances between small cells andmacro cells are determined in such a way to maximizecapacity and throughput, while satisfying latency and datarate requirements by placement of RUs, DUs, and CUs.Figure 4 shows a case when NR is placed next to E-UTRAin a macro-cell. In hotspots, small cells include RUs,and DU and CU processing are performed in macro-cells.Below, we present two different paths for deployment inhotspots, as shown in Figure 4:• Path 1: NR is deployed next to E-UTRA in macro-cells.Small cells with RUs are deployed in hotspots, and DUand CU processing are performed in macro-cells.• Path 2: Small cells with RUs and DUs are deployed inhotspots, and CU processing is done in macro-cells.
2. Dense Urban: In dense urban areas, NRs are co-locatedin 4G macro-cells, and small cells are also deployed.As shown in Table 3, the choice of a unit placementscenario (UPS) depends on front-haul challenges andservice requirements in that area. Different deploymentpaths for dense urban areas are shown in Figure 4.
3. Urban: In urban areas, depending on service type andfront-haul constraints, RUs, DUs, and CUs are located inmacro-cells and/or in small cells, as shown in Figure 4.
4. Rural: For economic reasons, the last phase of 5Gdeployment is in rural areas, where NRs are installed in4G macro-cells, as shown in Figure 4.
4. CORE NETWORK DEPLOYMENNT
Some enabling technologies, e.g., NFV, SDN, MEC, andself-organizing networks (SONs) that are deployed in some4Gnetworks are key players in 5GCN.Table 4 compares threeoptions (called EPC, EPC+, and 5GC) proposed in [4, 6] for5G CN deployment in terms of virtualization, control/userplane separation (CUPS), and their respective timelines.5G CN can be deployed in three stages, namely initial,intermediate, and final, each divided into different states (seeTable 5). EPC can be used in the NSA mode (int3 and int4),but 5GC is needed in the SAmode. In Options 3/3A/3X (EPCin Table 4), the S1-U interface capacity must be increased tomeet 5GNSA networking requirements [6, 8]. When only thephysical capacity of EPC is increased (without virtualization),the network is not ready for the SA mode. Virtualized EPCsites can be easily upgraded to EPC+ or 5GC.The 5G CN deployment path depends on the current stage.Below, we briefly highlight 5G CN deployment strategies bytier-one operators such as Korea Telecom (KT), followed bysuitable strategies for mid-tier and low-budget operators.Tier-one Operators: KT has extensively deployedvirtualized EPC sites (i.e., ini2), and recently upgraded themto EPC+ (featuring 3GPP CUPS) to serve 5G NSA devices(i.e., int1). All user plane functions are implemented in edgesites to reduce latency and benefit from CUPS features. This
– 41 –
Industry-driven digital transformation
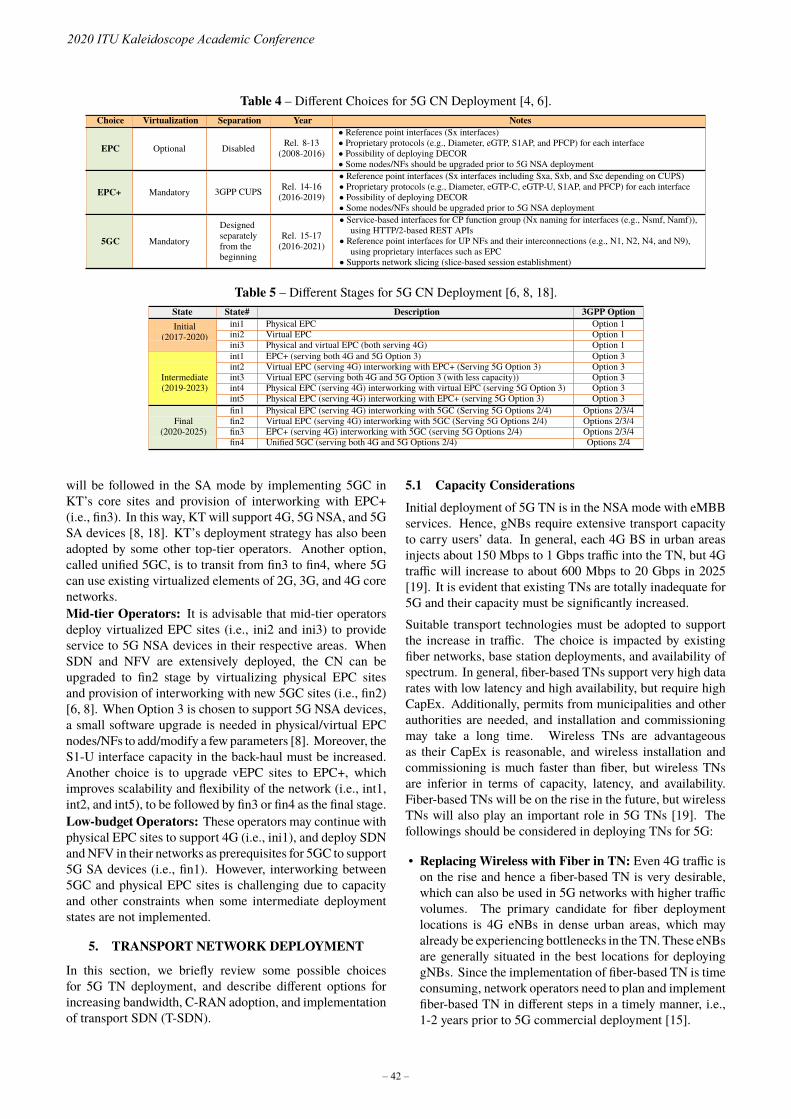
Table 4 – Different Choices for 5G CN Deployment [4, 6].Choice Virtualization Separation Year Notes
EPC Optional Disabled Rel. 8-13(2008-2016)
• Reference point interfaces (Sx interfaces)• Proprietary protocols (e.g., Diameter, eGTP, S1AP, and PFCP) for each interface• Possibility of deploying DECOR• Some nodes/NFs should be upgraded prior to 5G NSA deployment
EPC+ Mandatory 3GPP CUPS Rel. 14-16(2016-2019)
• Reference point interfaces (Sx interfaces including Sxa, Sxb, and Sxc depending on CUPS)• Proprietary protocols (e.g., Diameter, eGTP-C, eGTP-U, S1AP, and PFCP) for each interface• Possibility of deploying DECOR• Some nodes/NFs should be upgraded prior to 5G NSA deployment
5GC Mandatory
Designedseparatelyfrom thebeginning
Rel. 15-17(2016-2021)
• Service-based interfaces for CP function group (Nx naming for interfaces (e.g., Nsmf, Namf)),using HTTP/2-based REST APIs
• Reference point interfaces for UP NFs and their interconnections (e.g., N1, N2, N4, and N9),using proprietary interfaces such as EPC
• Supports network slicing (slice-based session establishment)
Table 5 – Different Stages for 5G CN Deployment [6, 8, 18].State State# Description 3GPP Option
ini1 Physical EPC Option 1Initial(2017-2020) ini2 Virtual EPC Option 1
ini3 Physical and virtual EPC (both serving 4G) Option 1int1 EPC+ (serving both 4G and 5G Option 3) Option 3int2 Virtual EPC (serving 4G) interworking with EPC+ (Serving 5G Option 3) Option 3int3 Virtual EPC (serving both 4G and 5G Option 3 (with less capacity)) Option 3int4 Physical EPC (serving 4G) interworking with virtual EPC (serving 5G Option 3) Option 3
Intermediate(2019-2023)
int5 Physical EPC (serving 4G) interworking with EPC+ (serving 5G Option 3) Option 3fin1 Physical EPC (serving 4G) interworking with 5GC (Serving 5G Options 2/4) Options 2/3/4fin2 Virtual EPC (serving 4G) interworking with 5GC (Serving 5G Options 2/4) Options 2/3/4fin3 EPC+ (serving 4G) interworking with 5GC (serving 5G Options 2/4) Options 2/3/4
Final(2020-2025)
fin4 Unified 5GC (serving both 4G and 5G Options 2/4) Options 2/4
will be followed in the SA mode by implementing 5GC inKT’s core sites and provision of interworking with EPC+(i.e., fin3). In this way, KT will support 4G, 5G NSA, and 5GSA devices [8, 18]. KT’s deployment strategy has also beenadopted by some other top-tier operators. Another option,called unified 5GC, is to transit from fin3 to fin4, where 5Gcan use existing virtualized elements of 2G, 3G, and 4G corenetworks.Mid-tier Operators: It is advisable that mid-tier operatorsdeploy virtualized EPC sites (i.e., ini2 and ini3) to provideservice to 5G NSA devices in their respective areas. WhenSDN and NFV are extensively deployed, the CN can beupgraded to fin2 stage by virtualizing physical EPC sitesand provision of interworking with new 5GC sites (i.e., fin2)[6, 8]. When Option 3 is chosen to support 5G NSA devices,a small software upgrade is needed in physical/virtual EPCnodes/NFs to add/modify a few parameters [8]. Moreover, theS1-U interface capacity in the back-haul must be increased.Another choice is to upgrade vEPC sites to EPC+, whichimproves scalability and flexibility of the network (i.e., int1,int2, and int5), to be followed by fin3 or fin4 as the final stage.Low-budget Operators: These operators may continue withphysical EPC sites to support 4G (i.e., ini1), and deploy SDNandNFV in their networks as prerequisites for 5GC to support5G SA devices (i.e., fin1). However, interworking between5GC and physical EPC sites is challenging due to capacityand other constraints when some intermediate deploymentstates are not implemented.
5. TRANSPORT NETWORK DEPLOYMENT
In this section, we briefly review some possible choicesfor 5G TN deployment, and describe different options forincreasing bandwidth, C-RAN adoption, and implementationof transport SDN (T-SDN).
5.1 Capacity ConsiderationsInitial deployment of 5G TN is in the NSA mode with eMBBservices. Hence, gNBs require extensive transport capacityto carry users’ data. In general, each 4G BS in urban areasinjects about 150 Mbps to 1 Gbps traffic into the TN, but 4Gtraffic will increase to about 600 Mbps to 20 Gbps in 2025[19]. It is evident that existing TNs are totally inadequate for5G and their capacity must be significantly increased.Suitable transport technologies must be adopted to supportthe increase in traffic. The choice is impacted by existingfiber networks, base station deployments, and availability ofspectrum. In general, fiber-based TNs support very high datarates with low latency and high availability, but require highCapEx. Additionally, permits from municipalities and otherauthorities are needed, and installation and commissioningmay take a long time. Wireless TNs are advantageousas their CapEx is reasonable, and wireless installation andcommissioning is much faster than fiber, but wireless TNsare inferior in terms of capacity, latency, and availability.Fiber-based TNs will be on the rise in the future, but wirelessTNs will also play an important role in 5G TNs [19]. Thefollowings should be considered in deploying TNs for 5G:
• Replacing Wireless with Fiber in TN: Even 4G traffic ison the rise and hence a fiber-based TN is very desirable,which can also be used in 5G networks with higher trafficvolumes. The primary candidate for fiber deploymentlocations is 4G eNBs in dense urban areas, which mayalready be experiencing bottlenecks in the TN. These eNBsare generally situated in the best locations for deployinggNBs. Since the implementation of fiber-based TN is timeconsuming, network operators need to plan and implementfiber-based TN in different steps in a timely manner, i.e.,1-2 years prior to 5G commercial deployment [15].
– 42 –
2020 ITU Kaleidoscope Academic Conference

• Upgrading Wireless TN: In addition, network operatorsalso need to upgrade their wireless TN. In doing so,frequency spectrum, bandwidth, and the correspondingwireless technologies affect link capacity, range (distance)and other practical considerations.A 10 Gbps wireless link may be adequate for somenetworks [15], but cannot be provided in sub 40 GHzbands. In order to provide sufficient capacity, ETSI hasproposed to use mmWave bands, including V-band andE-band which can provide up to 10 GHz bandwidth forwireless links [20]. Studies are also underway to proposehigher bands, including W-band and D-band.Another challenge is the provision of quality of service(QoS) in 5G for different services and a range of QoSrequirements. However, wireless links are time-varyingand have diverse propagation characteristics that impacttheir QoS. Hence, different frequency bands are usedfor different services, depending on QoS requirements.ETSI has introduced band and carrier aggregation (BCA)technology to collect information from the media and mapeach service to a proper band. BCA can extend the rangeof wireless links by sacrificing availability [21].
• Expanding fiber-based TN: Gigabit passive opticalnetworks (GPONs) are already deployed by many networkoperators, but in some cases, cannot fulfill both capacityand latency requirements of 5G. NG-PON2 is a promisingcandidate for replacing GPONs, but may not be availablesoon. As an alternative, standardization of 50 Gbps/100Gbps PON is underway. Ethernet interfaces should alsobe upgraded to increase capacity. Although GbE may besufficient for eNBs, they are inadequate for gNBs. Hence,GbE interfaces must be upgraded to 10 GE/25 GE forfronthaul interfaces. In brief, to increase TN capacity,existing links should be upgraded first, to be followed bythe deployment of new links.
5.2 C-RAN Deployment and Transport Networks
C-RAN is an efficient concept for optimal allocation ofresources in cellular networks, but TN is very challenging inC-RANs. In 4G, the common public radio interface (CPRI)is used, whose data rate linearly increases with bandwidthand number of antennas. CPRI is not suitable for 5G withmore bandwidth and massive MIMO technology. Hence,enhanced CPRI (eCPRI) is introduced for TN in 5G, whichexploits functional splitting to reduce latency and data raterequirements compared to CPRI. Moreover, eCPRI utilizescost-effective packet-based technologies such as Ethernet andIP,where F1 interface, also calledmid-haul, is used to connectDUs to CUs, and NG interface connects CUs to 5G CN.The data rate and latency of interfaces are impacted by3GPP functional splitting options. Option 2 (between radiolink control and packet data convergence protocol layers)covers DU-CU functional splitting [17] (also called higherlayer splitting), with latency in the order of ms [22, 23],while data rate is reduced to near the end-user data rate.Latency for DU-RU functional splitting (called lower layer
splitting) options range from tens to hundreds of µs. Whenmore functions reside in DUs than RUs, C-RAN is morebeneficial, but heavy centralization creates more burden forthe front-haul network (FN), and there is a need to balancefunctional splitting between RAN and FN. Upgrading FN istime consuming, and it is vital to decide early on C-RANscenarios with priority given to dense urban areas [24].As stated above, it is beneficial to deploy C-RAN in 4Gnetworks, which also facilitates deployment of centralized5G NR. However, CPRI interface in 4G networks isTDM-based, which is inconsistent with packet-based 5Gfronthaul interfaces. To resolve this, the IEEE 1914 WorkingGroup has developed radio over Ethernet (RoE) standard forencapsulation of digitized radio over Ethernet frames. RoEincludes a CPRI mapper that maps/de-maps CPRI framesinto/from Ethernet frames. By utilizing RoE CPRI mapper,an Ethernet-based 4G C-RAN can be deployed and used for5G C-RAN. In brief, centralization can begin from hotspotsin 4G, and then 5G NR base stations can be added when thecapacity and latency requirements of fronthaul interfaces aresatisfactory.
5.3 Software-Defined Transport Networks
Software-defined networking brings many benefits such asflexibility, scalability, and agility for TNs as specified inthe transport SDN (T-SDN), and can also be used fordeploying efficient TN slicing. Network slices are realizedby coordinating the TN management system and E2Emanagement system. A TN management system can beimplemented via the SDN controller [17]. To evolve a legacyTN to T-SDN, TN devices and TN architecture should bothbe upgraded. In what follows, we describe the upgradingof TN devices (i.e., forwarding/routing devices) and TNarchitecture.
5.3.1 Upgrading Transport Network Devices
Migration Working Group of Open Networking Foundation(ONF) has categorized three types of devices for 5G TNdeployment:• Legacy devices: devices with integrated CP and DP;• SDN-enabled devices: devices in which CP is decoupledfrom DP, and CP is external to the device; and
• Hybrid devices: devices with both legacy DP and CPwithSDN capabilities. Many legacy devices are upgradable tobe SDN-enabled via software/hardware upgrades.
There are three approaches for migrating from legacy TNs toSDN-enabled TNs:• Greenfield deployment [25]: upgrading existing TNdevices to the SDN-enabled version.
• Mixeddeployment: co-existence of SDN-enabled deviceswith legacy devices, where the SDN controller and legacydevices need to exchange routing information via legacyCP agents; and
• Hybrid deployment: co-existence of legacy, hybrid andSDN-enabled devices, where hybrid devices are upgradedto become SDN-enabled, and legacy devices are graduallyreplaced by SDN-enabled devices.
– 43 –
Industry-driven digital transformation
5.3.2 Evolution of TN Architecture
TNs are likely to be multi-administrative, multi-layer andwidely dispersed. A TN has multiple domains, e.g., thedomain of different infrastructure providers, the domainof optical and packet layers, and the domain of differentgeographical regions. To evolve legacy TNs to T-SDNenabled TNs, the requirements of different domains shouldbe met, which can be achieved by adopting a hierarchicalarchitecture for the TN [26, 27], where some domainSDN-controllers (also called child controllers) managedevices in their own domains, and a parent SDN-controllermanages E2E TN. It is advisable to adopt a domain-basedTN evolution, which simplifies deployment. In this way, thefirst step is to develop a national domain for multiple CNfunctions and/or multiple data centers. Next, lower layerdomains (i.e., regional and local domains) can be graduallyevolved to be SDN-enabled. For intra-domain evolution, asuitable deployment approach (greenfield, mixed, or hybrid)can be adopted, taking into account existing TN facilities.
6. CONCLUSION AND LESSONS LEARNED
We presented a practical and comprehensive approach for thedeployment of future networks (5G and beyond) by explainingthe end-to-end 5G architecture. Our emphasis was oncost-effective scenarios to expand existing facilities that canalso be used in 5G networks via simple software upgrades. Indoing so, we presented different deployment choices forRAN,TN, and CN that take into account implementation time,costs, existing infrastructure and other technical issues. As animportant lesson, ensuring 5G compatibility in expanding theexisting facilities via simple software upgrades is emphasized.Acknowledgment: This work was supported in part byMobile Communications Company of Iran (MCI).
REFERENCES
[1] M. Series, “IMT vision–framework and overallobjectives of the future development of IMT for 2020and beyond,” ITU Recommendation, pp. 2083–0, 2015.
[2] ETSI, GRMEC 017, “Mobile Edge Computing (MEC):Deployment of mobile edge computing in an NFVenvironment,” ETSI Group Reports, 2018.
[3] ETSI, “Next generation protocols (NGP):An example ofa non-IP network protocol architecture based on RINAdesign principles,” ETSI Group Reports, Feb. 2019.
[4] 3GPP, TS 23.501, “System architecture for the 5Gsystem (5GS): Concepts and requirements, Release 16,”Mar. 2020.
[5] R. Li, “Network 2030: Market drivers and prospects,”in Proc. 1st ITU Workshop on Network 2030, 2018.
[6] GSM Association, “Road to 5G: Introduction andMigration,” Apr. 2018.
[7] 3GPP, “3GPP TR 21.915 V15.0.0 Technical
Specification Group Services and System Aspects,Release 15 Description,” Sep. 2019.
[8] GSM Association, “5G implementation guidelines:NSA Option 3,” Feb. 2020.
[9] NGMN Alliance, “5G devices categorization,” Mar.2020.
[10] GSMA, “5G Spectrum,” Mar. 2020, GSMA PublicPolicy Position.
[11] GSM Association, “5G implementation guidelines: SAOption 2,” Feb. 2020.
[12] 3GPP, TS 38.101, “NR; user equipment (UE) radiotransmission and reception. Part 1: Range 1 standalone(Release 16),” Mar. 2020.
[13] Huawei, “5G Spectrum,” Feb. 2020, Public PolicyPosition.
[14] 3GPP, TS 38.300, “5G NR overall description: Stage-2,Release 16,” Mar. 2020.
[15] S. Perrin, “5G Transport Networks: Heavy ReadingOperator Survey & Analysis,” Heavy Reading, Nov.2018.
[16] NGMN, “NGMN Overview on 5G RAN FunctionalDecomposition,” NGMN Alliance, Final Deliverable,2 2018, version 1.0.
[17] ITU-T, GSTR-TN5G, “Transport network support ofIMT-2020/5G,” 2018.
[18] H. Son, “Comparison of commercial 5G networkarchitecture: KT vs. SK Telecom,” Netmanias, Mar.2019.
[19] Ericsson, “Ericsson microwave outlook,” Dec. 2018.
[20] ETSI GS mWT 002, “millimetre Wave Transmission(mWT): Applications and use cases of millimetre wavetransmission,” Aug. 2015.
[21] ETSI GR mWT 015, “Frequency Bands and CarrierAggregation Systems: Band and carrier aggregation,”Nov. 2017.
[22] GSMA, “Mobile backhaul options: Spectrum analysisand recommendations,” Sep. 2018.
[23] 3GPPTR38.801, “Technical SpecificationGroupRadioAccess Network. Study on new radio access technology:Radio access architecture and interfaces,” Mar. 2017.
[24] G. Brown, “Cloud RAN& the Next-Generation MobileNetwork Architecture,” Heavy Reading, Apr. 2017.
[25] ONF, “Migration Use Cases and Methods,” Feb. 2014.
[26] ONF, TR-522, “SDN Architecture for TransportNetworks,” Mar. 2016.
[27] ITU-T, G.7702, “Architecture for SDN Control ofTransport Networks,” Mar. 2018.
– 44 –
2020 ITU Kaleidoscope Academic Conference

FLEXIBLE MULTIPLEXING MECHANISM FOR COEXISTENCE OF URLLC AND eMBB SERVICES IN 5G NETWORKS
Kai Xiao1,2, Xing Liu1,2, Xianghui Han1, Peng Hao1, Junfeng Zhang1, Dong Zhou1, Xingguang Wei1
1ZTE Corporation, China 2State Key Laboratory of Mobile Network and Mobile Multimedia, China
ABSTRACT
5G mobile networks are envisioned to support both evolved mobile broadband (eMBB) and ultra-reliable and low latency communications (URLLC), which may coexist and interfere with each other in the same service cell in many scenarios. In this paper, we propose a dynamic 2-dimension bitmap resource indication to cancel eMBB services with a finer uplink cancellation granularity and a lower probability of false cancellation. Meanwhile, a resource indication based power control method is introduced to dynamically indicate different power control parameters to the user equipment (UE) based on different time-frequency resource groups and the proportion of overlapping resources, by which the reliability of URLLC transmission is guaranteed while the impact on performance of the eMBB service is minimized. Furthermore, a dynamic selection mechanism is proposed to accommodate the varying cases in different scenarios. Extensive system level simulations are conducted and the simulation results show that about 10.54% more URLLC UEs satisfy the requirements, and the user perceived throughput of eMBB UEs is increased by 23.26%.
Keywords - 5G, eMBB, power control, resource indication, uplink cancellation, URLLC
1. INTRODUCTION
Wireless communication services cover more and more application scenarios, with the increasing degree of social digitization. Among them, enhanced mobile broadband (eMBB), ultra-reliable and low latency communication (URLLC) and massive machine type of communication (mMTC) have become three major scenarios supported by fifth generation (5G) systems [1], [2]. Large flow mobile broadband services such as ultra-high definition and 3D video are mainly included with eMBB, providing the ultimate communication experience for people. Driverless, industrial automation and so on are mainly covered by URLLC, requiring low-latency data and an extremely reliable connection, i.e., one-way latency up to 1 ms with 10-
5 outage probability. The scene of large-scale machine class communication in the Internet of things is mainly supported
by mMTC [3], [4]. From the current development trend, 5G mainly focuses on eMBB for basic daily needs and URLLC for emerging industries. Generally, the priority of a URLLC service is higher than that of an eMBB service [5] to [7]. In practical application, eMBB services and URLLC services will appear in the same network, and the scheduling of a URLLC service by gNB will inevitably conflict with the eMBB service as the triggering of the URLLC service is sporadic [8]. Once the URLLC service arrives, the gNB shall allocate appropriate uplink (UL) resources for it as soon as possible to meet the stringent latency requirements. However, the resources may have been allocated to uplink data transmission for eMBB in advance. The latency and reliability requirement of URLLC transmission can hardly be guaranteed due to no resource being used within a certain time interval [9], [10]. Therefore, it is valuable to study how to multiplex the transmission resources between a URLLC service and eMBB service.
Currently, power control and UL cancellation indication (CI) mechanisms are introduced into the Third Generation Partnership Project (3GPP) protocol as two independent and basic solutions to URLLC and eMBB service multiplexing [11]. However, these baseline methods have some inherent disadvantages. More specifically, the baseline cancellation indication (BCI) method is based on the semi-static 2-dimension (2-D) bitmap implementation. However, the URLLC service is dynamic and mutative, and the semi-static pattern indication is difficult to meet the changing service requirements [12]. For the baseline power control (BPC) method, the power boosting is based on a relatively fixed value. For some cases where the proportion of overlapping resources over all scheduled resources is very small, the fixed setting of power boosting value will cause power waste and degrade the eMBB performance [13]. On the other hand, the BPC cannot further boost power to protect URLLC transmission in the case of poor channel quality [14]. This paper is mainly to solve these existing technical problems above.
In this work, a dynamic pattern cancellation indication (DPCI) is proposed for making up the shortcomings of BCI. The proposed DPCI method enhances the current 2-D bitmap
978-92-61-31391-3/CFP2068P @ ITU 2020 Kaleidoscope– 45 –

pattern from semi-static to dynamic, so that the indication pattern can be adjusted flexibly according to the service arrival to obtain a more accurate indication. This can reduce the false indication and protect the eMBB service. Then, a resource occupancy based power control (ROPC) is proposed to enhance the current BPC method. Based on ROPC, it becomes possible for gNB to dynamically indicate different power control parameters to user equipment (UE) on different sets of time-frequency resource, which will further ensure URLLC transmission performance and protect the normal eMBB transmission. Furthermore, a dynamic selection of DPCI and ROPC is proposed. Because the scene is complex in real deployment, each multiplexing mechanism has its own advantages and disadvantages, and a combination of them will get more robust and better performance.
The paper is organized as follows. Section 2 introduces the service multiplexing system model. In section 3, the proposed design of DPCI, ROPC and the dynamic selection mechanism is described in detail. Extensive system level simulation results are introduced in section 4, and the conclusion of this paper is given in section 5.
2. SERVICE MULTIPLEXING SYSTEM MODEL
A 5G new radio (NR) uplink system is considered for this work, where there are N cells, each equipped with Kr receiving antennas, and randomly distributed M UEs, each equipped with Kt transmitting antennas. Each cell includes two types of uplink transmission UEs: URLLC UE and eMBB UE. The number of URLLC UEs and eMBB UEs in each cell is MURLLC and MeMBB respectively, and MURLLC + MeMBB = M. The packets arrival for each eMBB UE is FTP Model 3 with Poisson arrival and the packet size is Bmin~Bmax bytes with Pareto distribution [17]. The packets arrival for each URLLC UE is sporadic with an average arrival rate of 1 packet per T ms and the packet size is B bytes. In the system model, users are distributed indoors and outdoors in a random proportion, and o% of users are outdoors and i% of users are indoors, and o + i = 100.
A flexible frame structure is adopted for the service multiplexing system model, where URLLC and eMBB UEs are scheduled with different transmission time intervals (TTIs). As an example in Figure 1, the scheduling granularity is set to 14 orthogonal frequency division multiplex (OFDM) symbols for eMBB and 4 OFDM symbols for URLLC in order to achieve a latency reduction. The monitoring periodicity of UL cancellation signaling should be equal to the URLLC physical downlink control channel (PDCCH) monitoring interval, i.e. mini-slot level [15]. In frequency domain, the smallest scheduling unit is the resource block (RB), which is composed of 12 resource elements (RE).
For a UL CI based solution, the remaining part of eMBB transmission is dropped by assuming phase continuity of UL eMBB transmission cannot be guaranteed. For a UL power control based solution, P dB power boosting of URLLC transmission is assumed in case of overlapping with grant-based eMBB transmission respectively. In our simulation, each PDCCH monitoring occasion occupies one symbol with 32 CCEs. When considering reserving some candidates for eMBB scheduling, the PDCCH search space set configuration for UL cancellation signaling is assumed as the aggregation level (AL)=1,2,4,8,16 with corresponding candidate numbers 4,4,2,1,1 respectively. The AL of the UL cancellation signaling is selected according to a PDCCH channel condition with a target BLER requirement. For a UL cancellation based solution, a group common PDCCH is adopted. In addition, the additional signaling caused by method improvement is carried by the PDCCH.
slot n slot n+1 slot n+2
12 137 8 9 10 114 5 631 20
eMBB TTI
slot n slot n+1 slot n+2
mini-slot m mini-slot m+1 mini-slot m+2 mini-slot m+3
7 96eMBB UE arrival
URLLC UE arrival URLLC TTI
8
Figure 1 – TTI for scheduling URLLC and eMBB UEs
In this system model, the algorithm of the gNB receiver is MMSE-IRC, which adopts MMSE criterion [16]. The objective function is to minimize the mean square error between the transmitted signal vector s1 and the received signal vector linear combination WH
y, as follows:
min𝑊𝑊
𝐸𝐸 𝑾𝑾𝒚𝒚𝑯𝑯 − 𝒔𝒔𝟏𝟏
𝑯𝑯𝑾𝑾𝒚𝒚𝑯𝑯 − 𝒔𝒔𝟏𝟏 (1)
Where, s1 is the signal source symbol of a service cell, and y is the signal received by the receiver, and W is the Kt×Kr weighted matrix of dimension. When the gradient is used to find the optimal solution, the information of the known interference channel matrix is fully used, and the MMSE-IRC weighting matrix can be obtained as follows:
𝑾𝑾𝑯𝑯 = 𝑯𝑯𝟏𝟏𝑯𝑯 𝑯𝑯𝟏𝟏𝑯𝑯𝟏𝟏
𝑯𝑯 + 𝐼𝐼𝑜𝑜𝑜𝑜𝐸𝐸𝑠𝑠𝑯𝑯𝟐𝟐𝑯𝑯𝟐𝟐
𝑯𝑯 + 𝑁𝑁0𝐸𝐸𝑆𝑆𝑰𝑰𝑲𝑲𝒕𝒕
−1 (2)
Where, H1 represents the channel matrix from the service cell to the receiver, H2 represents the channel matrix from the interference cell to the receiver. Es is the average power of the transmitting source symbol, and the noise power and interference power are Ioc and N0 respectively. When there
– 46 –
2020 ITU Kaleidoscope Academic Conference

are multiple interference cells, the MMSE-IRC weighting matrix formula can be extended as follows:
𝑾𝑾𝑯𝑯 = 𝑯𝑯𝟏𝟏𝑯𝑯 𝑯𝑯𝟏𝟏𝑯𝑯𝟏𝟏
𝑯𝑯 +∑ 𝐼𝐼𝑜𝑜𝑜𝑜𝐸𝐸𝑠𝑠𝑯𝑯𝒏𝒏𝑯𝑯𝒏𝒏
𝑯𝑯 + 𝑁𝑁0𝐸𝐸𝑆𝑆𝑰𝑰𝑲𝑲𝒕𝒕
𝑁𝑁𝑛𝑛
−1(3)
3. MULTIPLEXING METHODS
In Figure 2, an example of BCI for UL multiplexing transmission is shown. The resource for grant-based eMBB and URLLC is scheduled by UL grant #1 and UL grant #2 respectively. Meanwhile, a URLLC resource indication can be transmitted to an eMBB UE by the UL CI. The eMBB UE should cancel its uplink transmission when the UL CI is detected. In this case, the resource region in which the URLLC cancellation resource indicated by the UL resource indication is named as reference uplink resource (RUR).
A BPC for UL multiplexing transmission is another alternative, i.e. boosting the URLLC transmission power on the colliding resources. When one UE already is transmitting an eMBB physical uplink shared channel (PUSCH) and then another UE has urgent URLLC data to be sent on the same resource, a relatively higher power can be applied than for the case without overlapping eMBB transmission. For the power control scheme, the gNB can still receive the eMBB transmissions. The URLLC transmission may have interference on the eMBB transmission, but it can still be possible for the gNB to decode the eMBB transmission block correctly without a retransmission.
gNB
URLLC UE
UL grant #1
eMBB UE
UL grant #2 Resource indicated by UL CIUL CI
Resource scheduled for URLLC UE
Resource scheduled for eMBB UE
Figure 2 – An example of BCI multiplexing method
3.1 Design for DPCI
URLLC UEs are randomly distributed at both the center and edge in a cell. For cell center UEs, it is reasonable to allocate a ‘thin-tall’ type of time-frequency resource for latency reduction. While for URLLC UEs located at the edge of the cell which are subject to greater inter-cell interference and larger path loss, higher power is expected to meet the reliability requirement. It tends to allocate less frequency resource to such UEs due to a power limitation issue, instead more symbols have to be scheduled to them. Then, a ‘fat-
short’ type of time-frequency resource is more suitable for cell edge UEs. As a result, dynamic scheduled resources are different between cell center UEs and cell edge UEs. Figure 3 shows an example of the gNB allocating resources to cell center UEs and cell edge UEs for the BCI method. In Figure 3, the RUR is divided into 7×4 resource sub-blocks by 2-D bitmap with a size of 28 bits. The first green resource in RUR is allocated to a cell edge UE by gNB, which occupies two resource sub-blocks in the time domain and only one in the frequency domain. The second green resource block in the RUR is allocated to a cell center UE by gNB, which occupies only one resource sub-block in the time domain and three resource sub-blocks in the frequency domain. Furthermore, different use cases are identified for URLLC services, such as power distribution, factory automation and transport industry, etc. In accordance with different traffic characteristics, different resource allocations are required for different use cases. For example, a service with a larger packet size and higher reliability requirement expects more resource allocation compared with a smaller packet size or lower reliability requirement. In the actual network deployment, various URLLC services could coexist in one cell.
Downlink
Uplink
RUR
Resource scheduled for UL URLLCUL grant #1 UL grant #2
Resource cancelled by UL CI falsely
Figure 3 – Allocated resources to cell center UEs and cell edge UEs for BCI method
The resource indication pattern under BCI is configured semi-statically, i.e., 4×7 resource sub-blocks as shown in Figure 3. A semi-static 2-D bitmap pattern cannot provide flexible frequency domain granularity indication, which causes a large number of eMBB transmissions to be cancelled falsely. From the overall performance, the loss outweighs the gain. In order to make better use of spectrum resources in different scenarios for URLLC and reduce the probability of eMBB being canceled by error, dynamic configuration of the resource indication pattern should be supported. Instead of using the indication bits to indicate the frequency resource occupation uniformly for all time domain occasions, only the time domain occasions occupied by URLLC PUSCH are valid for further frequency indication in DPCI. Thus, the occupied time domain occasions are indicated firstly, and the time-frequency resource corresponding to the occupied time domain
– 47 –
Industry-driven digital transformation

occasions is indicated by a dynamic 2-D bitmap in DPCI. More specifically, the bit construction of DPCI is illustrated as follows.
Q bits are used for indicating which time domainoccasion is occupied, where ‘Q’ equals the number ofoccasions in the time domain per RUR.
Cm×n is 2-D bitmap for frequency domain indication,i.e., the occupied time domain occasions are dividedinto ‘a×b’ portions, each portion is indicated by a bit inthe 2-D bitmap, wherein a represents number ofoccupied time domain occasions and b representsfrequency domain granularity. Both of them aredetermined according to the indication of Q bitsdynamically.
Under the example shown in Figure 4, Q=7, a = 2 and b=10, then the total bit-number is 27. Compared with BCI, which requires 28bits, this method can make the frequency domain indication granularity (FDIG) finer with the same number of bits. This could reduce the false cancellation probability for a better protection of eMBB PUSCH. As shown in Table 1, as long as the number of occupied time domain occasions (OTDOs) is less than 5, the minimum frequency domain indication granularity for each time domain occasion of DPCI is finer than that of BCI.
F
T
O1 O2 O3 O4 O5 O6 O7 O2 O5
Resource scheduled for UL URLLC
Cancelation resource indicated by DPCI
Resource cancelled by UL CI falsely
Figure 4 – Resource indicated by dynamic 2-D bitmap
Table 1 – Minimum indication granularity with different number of the occupied time domain occasions
BCI
OTDOs number
1~7
FDIG 14
DPCI
OTDOs number
1 2 3 4 5 6 7
FDIG 1
21 ≤
110
17
≤15 ≤
14 ≤
13
13
3.2 Design for ROPC
In order to ensure the flexibility of URLLC transmission, it’s better for gNB to schedule the most appropriate time-frequency resources for the URLLC UE without caring
whether it overlaps with eMBB transmission. For BPC, once the resource of URLLC overlaps with that of eMBB, the URLLC UE will perform P-dB power boosting, i.e., 6 dB. However, the eMBB transmission will cause quite different interference on URLLC time-frequency resources under some situations. For example, as shown in Figure 5, the transmission power of different eMBB UEs is different in the same RUR, and the proportion of overlapping resources to the total resources of URLLC services is different in different RURs. A fixed value of power boosting will not only lead to insufficient or serious power waste for URLLC transmission, but also affect the transmission performance of normal eMBB services.
Compared with fixed power adjustment according to resource multiplexing, the following two points are enhanced in ROPC: 1) defining different power control parameters for different resource groups; 2) boosting power according to the proportion of overlapping resources to the total resources of URLLC services. More details are provided on the above two enhancements in the following subsections.
3.2.1 Different power control parameters for different resource groups
In an RUR, multiple groups of a time-frequency resource can be indicated by gNB to the URLLC UE. Different groups of time-frequency resource correspond to different power control parameter sets. The URLLC transmission power is determined according to the power control parameter set corresponding to the group of time-frequency resource it overlaps with eMBB.
As shown in Figure 6, the control information of ROPC includes at least one time-frequency resource indication field. Each time-frequency resource indication field can indicate a group of time-frequency resources. The power control parameters for each group of time-frequency resources will be configured via radio resource control signaling. If the resource scheduled for URLLC transmission overlaps with more than one group of time-frequency resources, transmission power will be calculated based on each power control parameter respectively, and a higher one or an average value will be selected.
RUR #1 RUR #2 RUR #3
Resource scheduled for UL URLLC
Resource scheduled for UL eMBB with PC parameter set A
Resource scheduled for UL eMBB with PC parameter set B
Figure 5 – Various situations of overlapping between the URLLC PUSCH and the eMBB PUSCH
– 48 –
2020 ITU Kaleidoscope Academic Conference
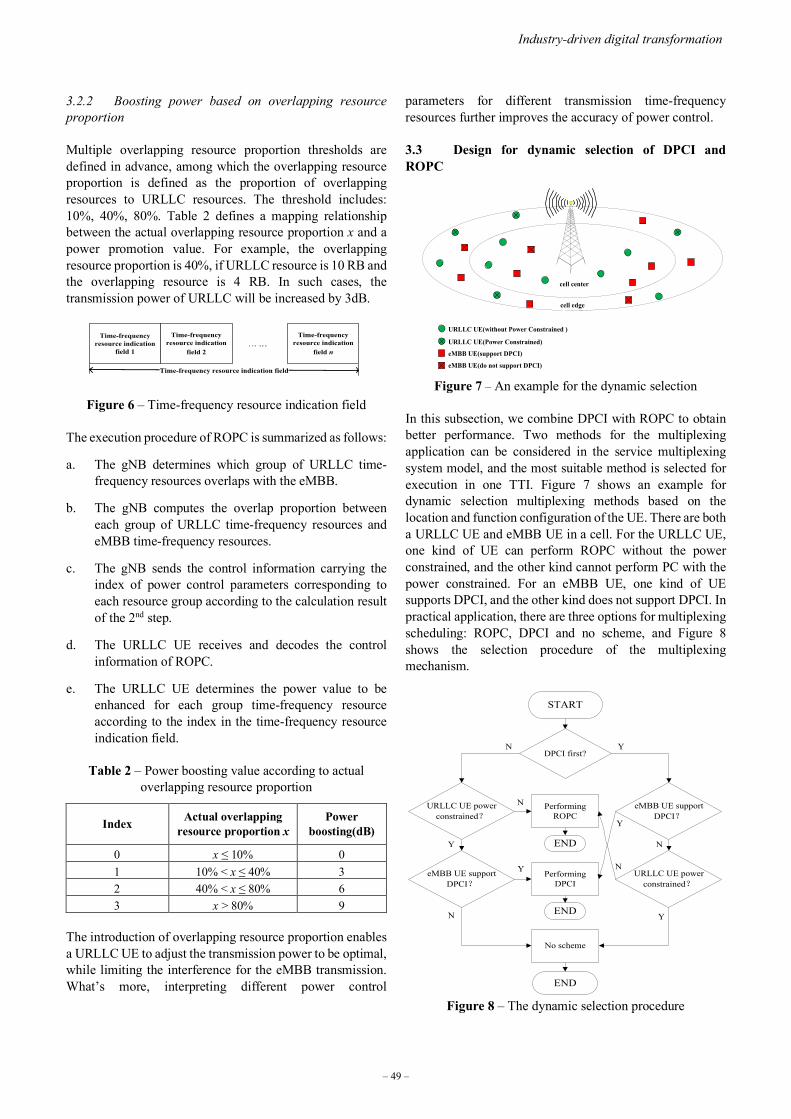
3.2.2 Boosting power based on overlapping resource proportion
Multiple overlapping resource proportion thresholds are defined in advance, among which the overlapping resource proportion is defined as the proportion of overlapping resources to URLLC resources. The threshold includes: 10%, 40%, 80%. Table 2 defines a mapping relationship between the actual overlapping resource proportion x and a power promotion value. For example, the overlapping resource proportion is 40%, if URLLC resource is 10 RB and the overlapping resource is 4 RB. In such cases, the transmission power of URLLC will be increased by 3dB.
Time-frequency resource indication
field 1
Time-frequency resource indication
field 2
Time-frequency resource indication
field n
Time-frequency resource indication field
Figure 6 – Time-frequency resource indication field
The execution procedure of ROPC is summarized as follows:
a. The gNB determines which group of URLLC time-frequency resources overlaps with the eMBB.
b. The gNB computes the overlap proportion between each group of URLLC time-frequency resources and eMBB time-frequency resources.
c. The gNB sends the control information carrying the index of power control parameters corresponding to each resource group according to the calculation result of the 2nd step.
d. The URLLC UE receives and decodes the control information of ROPC.
e. The URLLC UE determines the power value to be enhanced for each group time-frequency resource according to the index in the time-frequency resource indication field.
Table 2 – Power boosting value according to actual overlapping resource proportion
Index Actual overlapping resource proportion x
Power boosting(dB)
0 x ≤ 10% 0 1 10% < x ≤ 40% 3 2 40% < x ≤ 80% 6 3 x > 80% 9
The introduction of overlapping resource proportion enables a URLLC UE to adjust the transmission power to be optimal, while limiting the interference for the eMBB transmission. What’s more, interpreting different power control
parameters for different transmission time-frequency resources further improves the accuracy of power control.
3.3 Design for dynamic selection of DPCI and ROPC
cell center
cell edge
URLLC UE(without Power Constrained )
URLLC UE(Power Constrained)
eMBB UE(support DPCI)
eMBB UE(do not support DPCI)
Figure 7 – An example for the dynamic selection
In this subsection, we combine DPCI with ROPC to obtain better performance. Two methods for the multiplexing application can be considered in the service multiplexing system model, and the most suitable method is selected for execution in one TTI. Figure 7 shows an example for dynamic selection multiplexing methods based on the location and function configuration of the UE. There are both a URLLC UE and eMBB UE in a cell. For the URLLC UE, one kind of UE can perform ROPC without the power constrained, and the other kind cannot perform PC with the power constrained. For an eMBB UE, one kind of UE supports DPCI, and the other kind does not support DPCI. In practical application, there are three options for multiplexing scheduling: ROPC, DPCI and no scheme, and Figure 8 shows the selection procedure of the multiplexing mechanism.
START
DPCI first?
URLLC UE power constrained?
Performing ROPC
eMBB UE support DPCI?
eMBB UE support DPCI?
URLLC UE power constrained?
END
Performing DPCI
END
No scheme
END
N Y
N
Y
N
Y
Y
Y
N
N
Figure 8 – The dynamic selection procedure
– 49 –
Industry-driven digital transformation

4. SIMULATION RESULTS
In this section, system level simulation results based on different multiplexing methods are provided. The simulation mainly includes the following four aspects:
• Percentage of time domain occasions occupied byURLLC per RUR
• Minimum boosted power value that the URLLC canmeet the reliability requirement
• System performance comparison for differentmultiplexing methods
• System performance comparison for the dynamicselection mechanism and baseline methods
The above four simulation aspects are based on a service multiplexing system model proposed in section 2. The details of simulation assumptions are listed in Table 3.
Table 3 – System-level simulation assumptions
Parameters Value
Carrier frequency 4 GHz
Simulation bandwidth 40 MHz
SCS 30 kHz
Channel model UMa in TR 38.901
Antenna configuration 4 receiving antenna ports
2 transmitting antenna ports
BS receiver MMSE-IRC
Cell load setup KeMBB : 5, 10, 20, KURLLC : 5, 10, 20
( )eMBBURLLC KK ,=Ω
TTI configuration URLLC: 2, 3, 4 OFDM symbols
eMBB: 14 OFDM symbols
HARQ Max number of transmissions = 4
with target BLER = 0.01%(URLLC) or 10%(eMBB)
Traffic model
eMBB:
- Packet arrival per UE: FTP Model 3
- Packet size: 50~ 600 bytes
URLLC:
- Packet arrival per UE: Periodic with arrival rate of 1 packet per 2ms
- Packet size: 32bytes
UE distribution 80% of users are outdoors
20% of users are indoors
eMBB UE function configuration
90% of users supports DPCI
10% of users do not support DPCI
4.1 Percentage of time domain occasions occupied by URLLC per RUR
Figure 9 – Statistics of time domain occasions occupied by URLLC
To compare the BCI and DPCI method, the percentage of the number of time domain occasions occupied by the URLLC per RUR is evaluated via system-level simulation. The duration of RUR is set as 1 slot. Within each RUR, there are 7 time domain occasions, and each of them has 2 OFDM symbols. As shown in Figure 9, the number of occasions actually scheduled for URLLC transmission is relatively small. In each cell load setup scenario, the ratio of cases that the occupied RURs contain less than 3 time domain occasions occupied by URLLC is more than 94%. Together with the analysis in Table 1, we can infer that a finer frequency domain indication granularity can be expected by DPCI in most cases. In other words, DPCI has more accurate indication granularity.
4.2 Minimum boosted power value that URLLC can meet the reliability requirement
In order to prove that it is reasonable to grade multiple values for power boosting, we intercept 100 times of conflict between a URLLC and eMBB in a system simulation. We repeated 10 times for each conflict with different power values, and selected a minimum power value that the URLLC UE can meet the reliability requirement. If the URLLC UE cannot meet the reliability requirement, the maximum boosted power value will be selected. For the system simulation, the cell load setup is set Ω = (10,10), and the minimum and maximum boosted power are 0 dB and 9 dB, respectively. The duration of RUR is assumed as 1 slot,
84.78 84.78
62.32 62.32 62.32
39.14 39.14
11.23 11.23
26.09 26.09 26.09
37.17 37.17
3.17 3.178.74 8.74 8.74
18.17 18.17
0.82 0.82 2.85 2.85 2.85 5.52 5.52
( 5 , 5 ) ( 5 , 1 0 ) ( 1 0 , 5 ) ( 1 0 , 1 0 ) ( 1 0 , 2 0 ) ( 2 0 , 5 ) ( 2 0 , 1 0 )PE
RC
ENTA
GE(
%)
CELL LOAD SETUP Ω Number of occasions occupied by URLLC in a RUR: 1 2 3 Above 3
– 50 –
2020 ITU Kaleidoscope Academic Conference
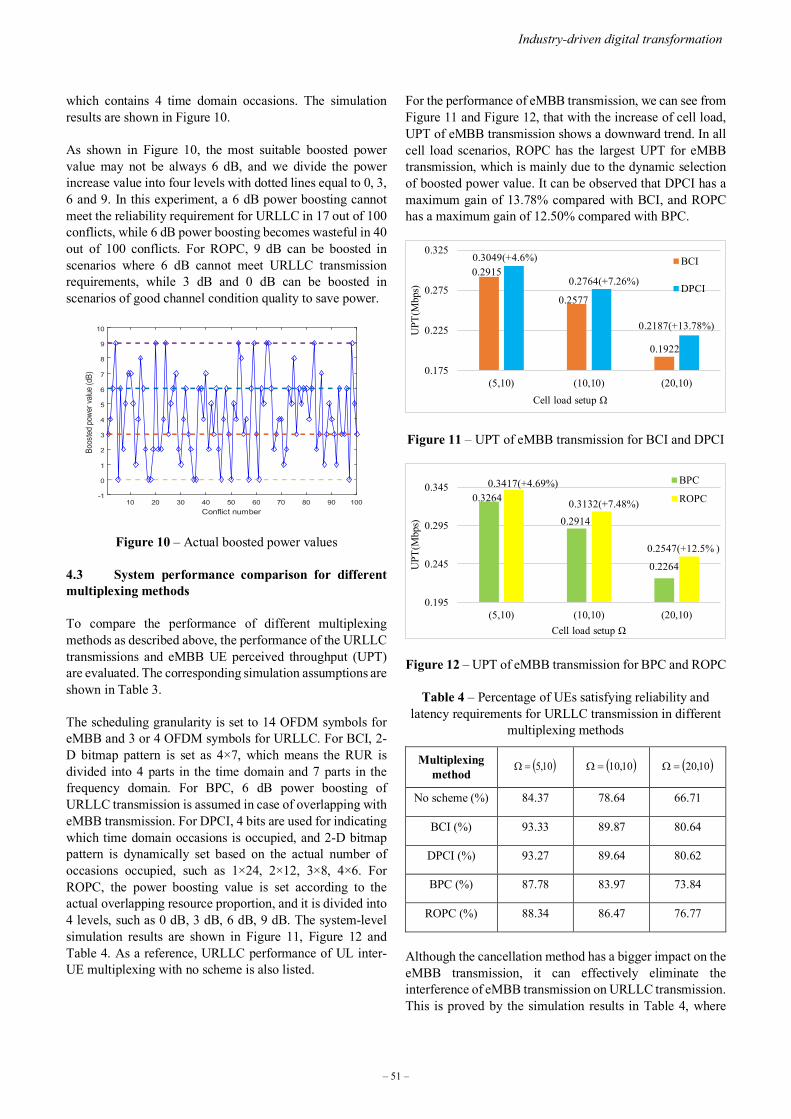
which contains 4 time domain occasions. The simulation results are shown in Figure 10.
As shown in Figure 10, the most suitable boosted power value may not be always 6 dB, and we divide the power increase value into four levels with dotted lines equal to 0, 3, 6 and 9. In this experiment, a 6 dB power boosting cannot meet the reliability requirement for URLLC in 17 out of 100 conflicts, while 6 dB power boosting becomes wasteful in 40 out of 100 conflicts. For ROPC, 9 dB can be boosted in scenarios where 6 dB cannot meet URLLC transmission requirements, while 3 dB and 0 dB can be boosted in scenarios of good channel condition quality to save power.
Figure 10 – Actual boosted power values
4.3 System performance comparison for different multiplexing methods
To compare the performance of different multiplexing methods as described above, the performance of the URLLC transmissions and eMBB UE perceived throughput (UPT) are evaluated. The corresponding simulation assumptions are shown in Table 3.
The scheduling granularity is set to 14 OFDM symbols for eMBB and 3 or 4 OFDM symbols for URLLC. For BCI, 2-D bitmap pattern is set as 4×7, which means the RUR is divided into 4 parts in the time domain and 7 parts in the frequency domain. For BPC, 6 dB power boosting of URLLC transmission is assumed in case of overlapping with eMBB transmission. For DPCI, 4 bits are used for indicating which time domain occasions is occupied, and 2-D bitmap pattern is dynamically set based on the actual number of occasions occupied, such as 1×24, 2×12, 3×8, 4×6. For ROPC, the power boosting value is set according to the actual overlapping resource proportion, and it is divided into 4 levels, such as 0 dB, 3 dB, 6 dB, 9 dB. The system-level simulation results are shown in Figure 11, Figure 12 and Table 4. As a reference, URLLC performance of UL inter-UE multiplexing with no scheme is also listed.
For the performance of eMBB transmission, we can see from Figure 11 and Figure 12, that with the increase of cell load, UPT of eMBB transmission shows a downward trend. In all cell load scenarios, ROPC has the largest UPT for eMBB transmission, which is mainly due to the dynamic selection of boosted power value. It can be observed that DPCI has a maximum gain of 13.78% compared with BCI, and ROPC has a maximum gain of 12.50% compared with BPC.
Figure 11 – UPT of eMBB transmission for BCI and DPCI
Figure 12 – UPT of eMBB transmission for BPC and ROPC
Table 4 – Percentage of UEs satisfying reliability and latency requirements for URLLC transmission in different
multiplexing methods
Multiplexing method
( )10,5=Ω ( )10,10=Ω ( )10,20=Ω
No scheme (%) 84.37 78.64 66.71
BCI (%) 93.33 89.87 80.64
DPCI (%) 93.27 89.64 80.62
BPC (%) 87.78 83.97 73.84
ROPC (%) 88.34 86.47 76.77
Although the cancellation method has a bigger impact on the eMBB transmission, it can effectively eliminate the interference of eMBB transmission on URLLC transmission. This is proved by the simulation results in Table 4, where
Conflict number10 20 30 40 50 60 70 80 90 100
Boos
ted po
wer v
alue (
dB)
-1
0
1
2
3
4
5
6
7
8
9
10
0.2915
0.2577
0.1922
0.3049(+4.6%)
0.2764(+7.26%)
0.2187(+13.78%)
0.175
0.225
0.275
0.325
(5,10) (10,10) (20,10)
UPT
(Mbp
s)Cell load setup Ω
BCI
DPCI
0.3264
0.2914
0.2264
0.3417(+4.69%)
0.3132(+7.48%)
0.2547(+12.5% )
0.195
0.245
0.295
0.345
(5,10) (10,10) (20,10)
UPT
(Mbp
s)
Cell load setup Ω
BPC
ROPC
– 51 –
Industry-driven digital transformation

DPCI and BCI shows a better performance compared to power control based methods for the performance of URLLC transmission. From Table 4, we can also see that the performance of the URLLC using DPCI is almost the same as that of BCI. This is because both DPCI and BCI can cancel the eMBB transmission, which means no interference on URLLC transmission. From Table 4, the URLLC UEs’ satisfaction rate of ROPC is increased by 2.93% compared with BPC, which is mainly due to the fact that ROPC can dynamically boost the power by 9 dB under the condition that 6 dB cannot ensure the normal URLLC transmission.
4.4 System performance comparison for the dynamic selection mechanism and baseline methods
Figure 13 – UPT of eMBB transmission for BCI and the dynamic selection mechanism
Figure 14 – UPT of eMBB transmission for BPC and the dynamic selection mechanism
In this subsection, we provide the simulation results for the dynamic selection of DPCI and ROPC method. The simulation assumption is the same as that described in subsection 4.3. The system-level simulation results about UPT of eMBB transmission and the performance of the URLLC transmissions are shown in Figure 13, Figure 14 and Table 5.
As shown in Figure 13 and Figure 14, the dynamic selection method shows the best performance of eMBB transmission in all scenarios. For eMBB transmission performance, it can be observed that the dynamic selection mechanism has a maximum gain of 23.26% compared with BCI and a
maximum gain of 4.64% compared with BPC. In Table 5, the percentage of URLLC UEs satisfying the requirements of the dynamic selection mechanism is increased by 3.75% and 10.54% compared with BCI and BPC, respectively. It is mainly due to the two methods that can complement each other, which means another method can be used when one method is not supported.
Table 5 – Percentage of UEs satisfying reliability and latency requirements for URLLC transmission in different baseline methods and the dynamic selection mechanism
Combination case ( )10,5=Ω ( )10,10=Ω ( )10,20=Ω
BCI (%) 93.33 89.87 80.64
BPC (%) 87.78 83.97 73.84
DPCI&&ROPC (%) 96.14 92.99 84.38
5. CONCLUSION
To solve the coexistence of eMBB and URLLC UEs in one service cell, the service multiplexing system model is provided. Based on the model, DPCI with a 2-D bitmap resource indication and ROPC with dynamically indicating multiple levels of power control parameters are proposed for making up the shortcomings of the existing multiplexing methods. In addition, a dynamic selection mechanism based on DPCI and ROPC is proposed to accommodate the varying cases in different scenarios. Extensive system level simulations and analysis are conducted and results show that about 10.54% more URLLC UEs satisfy the requirements, and the user perceived throughput of eMBB UEs is increased by 23.26%.
REFERENCES
[1] ITU-R, “IMT Vision: Framework and overall objectives of the future development of IMT for 2020 and beyond,” Report ITU-R M.2083-0, Sep. 2015.
[2] Qi R, Chi X, Zhao L, et al. “Martingales-Based ALOHA-Type Grant-Free Access Algorithms for Multi-Channel Networks with mMTC/URLLC Terminals Co-Existence,” IEEE Access, pp (99). 1-1, 2020.
[3] Alsenwi M, Tran N H, Bennis M, et al. “eMBB-URLLC Resource Slicing: A Risk-Sensitive Approach,” IEEE communications letters, vol. 23, no. 4, pp. 740-743, 2019.
[4] M. Gidlund, T. Lennvall, and J. Akerberg, “Will 5G become yet another wireless technology for industrial automation?” 2017 IEEE International Conference on
0.2915
0.2577
0.1922
0.3284(+12.66%)
0.2971(+15.29%)
0.2369(+23.26%)
0.18
0.23
0.28
0.33
(5,10) (10,10) (20,10)
UPT
(Mbp
s)
Cell load setup Ω
BCI
DPCI&&ROPC
0.3264
0.2914
0.2264
0.3284(+0.61%)
0.2971(+1.96%)
0.2369(+4.64%)
0.2
0.25
0.3
0.35
(5,10) (10,10) (20,10)
UPT
(Mbp
s)
Cell load setup Ω
BPC
DPCI&&ROPC
– 52 –
2020 ITU Kaleidoscope Academic Conference

Industrial Technology (ICIT), pp. 1319-1324, Mar. 2017.
[5] ITU-R, “ITU-R M. - Minimum requirements related to technical performance for IMT- 2020 radio interface(s),” Report ITU-R M.2410-0, Nov. 2017.
[6] 3GPP, “Study on new radio (NR) access technology physical layer aspects,” TR 38.802, Mar. 2017.
[7] Popovski P, Nielsen J J, Stefanovic C, et al. “Ultra-Reliable Low-Latency Communication (URLLC): Principles and building blocks,” IEEE Network, vol. 32, no. 2, pp. 16-23, Mar. 2018.
[8] H. Nikbakht, M. Wigger, and S. Shamai, “Mixed delay constraints in Wyner’s soft-handoff network,” ArXiv e-prints, Jan. 2018.
[9] Anand A, De Veciana G, Shakkottai S, “Joint Scheduling of URLLC and eMBB Traffic in 5G Wireless Networks,” 2017.
[10] Kassab, Rahif, O. Simeone, and P. Popovski, “Coexistence of URLLC and eMBB services in the C-RAN Uplink: An Information-Theoretic Study,” 2018.
[11] Khan H, Butt M M, Samarakoon S, et al. “Deep Learning Assisted CSI Estimation for Joint URLLC and eMBB Resource Allocation,” 2020.
[12] Yang W, Li C P, Fakoorian A, et al. “Dynamic URLLC and eMBB Multiplexing Design in 5G New Radio,” 2020 IEEE 17th Annual Consumer Communications & Networking Conference (CCNC) IEEE, 2020.
[13] Ma T, Zhang Y, Wang F, et al. “Slicing Resource Allocation for eMBB and URLLC in 5G RAN,” Wireless Communications and Mobile Computing 2020, pp. 1-11, 2020.
[14] Esswie, Ali A., and K. I. Pedersen. “Null Space Based Preemptive Scheduling for Joint URLLC and eMBB Traffic in 5G Networks,” 2018 IEEE Globecom Workshops (GC Wkshps) IEEE, 2018.
[15] K. I. Pedersen, G. Berardinelli, F. Frederiksen, et al. “A flexible 5G frame structure design for FDD cases,” IEEE Commun. Mag., vol. 54, no. 3, pp. 53-59, Mar. 2016.
[16] Tavares F M L, Berardinelli G , Mahmood N H, et al. “On the Impact of Receiver Imperfections on the MMSE-IRC Receiver Performance in 5G Networks,” IEEE Vehicular Technology Conference IEEE, 2014.
[17] Esswie, Ali A., and K. I. Pedersen. “Capacity Optimization of Spatial Preemptive Scheduling for Joint URLLC-eMBB Traffic in 5G New Radio,” 2018 IEEE Globecom Workshops (GC Wkshps) IEEE, 2018.
– 53 –
Industry-driven digital transformation

WIRELESS TECHNOLOGY AND PROTOCOL FOR IIOT AND DIGITAL TWINS
Jie Tan, Xiubin Sha, Bo Dai, Ting Lu
ZTE Corporation and State Key Laboratory of Mobile Network and Mobile Multimedia Technology, China
ABSTRACT
The industrial Internet of things (IIoT) is an important engine for manufacturing enterprises to provide intelligent products and services. The data analysis model represented by digital twins is the core of IIoT development in the manufacturing industry. With the development of IIoT, more and more attention has been paid to the application of ultra-reliable and low latency communications (URLLC) in the field of IIoT. This paper mainly introduces the development of 3GPP for URLLC in reducing delay and enhancing reliability, as well as the research on little jitter and high transmission efficiency, and further analyzes the enhanced key technologies required in the IIoT. Finally, the application of IIoT in digital twins is analyzed according to the actual situation.
Keywords – Digital twins, industrial Internet of things (IIoT), standards
1. INTRODUCTION
In recent years, the fourth industrial revolution accelerated by the industrial Internet of things (IIoT) has raised a global upsurge [1], [2]. The network technology of a cognitive IIoT system helps to establish the information relationship between the real world and the virtual space, which includes the perceptual layer (perceptual control technology), transmission layer (network communication technology), and application layer (information processing technology) [3]. The boom in IIoT cannot be achieved without technical support, including digital twins, edge computing, time sensitive networks (TSN), and passive optical networks (PON).
With the promotion of IIoT applications, digital twins are endowed with new vitality. The IIoT extends the value and life cycle of digital twins, highlighting the advantages and capabilities of digital twins in terms of models, data, and services. Digital twins applications and iterative optimization are the real path that is becoming the incubator of digital twins [4].
Based on the basic state of the physical entity, digital twins make a highly realistic analysis of the established model and collected data in a dynamic and real-time way, which is used for the monitoring, prediction and optimization of the
physical entity. It creates a high realism virtual model for physical object in digital mode, and simulates, analyzes and forecasts its behavior, which paves the way for the integration of information technology and manufacturing. In addition, as an edge-side technology, digital twins can effectively connect the perceptual layer and the transmission layer. Therefore, the industrial Internet platform is the incubator of the digital twins, and the digital twins are important scenarios for industrial Internet platforms.
Specifically, all kinds of data collection and exchange of physical entities should be realized by means of the IIoT. The advantages of the platform, such as resource aggregation, dynamic configuration, supply and demand docking, should be used to integrate and utilize all kinds of resources. For example, the industrial Internet platform is used to associate the edge infrastructure with the digital twin in the downward direction, and transfer and store the data in the cloud in the upward direction. Other users can also set up digital twins through platform services according to their own needs. It can be said that the industrial Internet platform has activated the life of digital twins. As shown in Figure 1, the physical entity of the physical space and the digital twins of the virtual space are connected through the network. Among them, the miniaturization of IIoT technology makes the creation of digital twins possible and uses sensor systems to realize data sharing between virtual and physical objects. Furthermore, 5G networks can provide a faster connection speed between virtual and real objects, and improve operation efficiency and reliability by reducing response times.
The transmission layer in a framework of the cognitive IIoT mainly includes short distance wireless communication technology, a low-power wide-area network, and the industrial Ethernet. As we all know, the Cellular 5G, LTE CAT M1/M2, LoRaWAN, and NB-IoT are representative technologies in the IoT, while IIoT relies heavily on the availability of wireless connections [5], [6]. Considering that classical field buses cannot be directly included in the IIoT system, their features are incompatible with Internet features, and their performance is not sufficient to transmit Internet packets. In particular, these networks do not support IIoT-based IPv6, but they can be interconnected through gateway devices [7], [8]. It is quite challenging to introduce industrial networks into an IIoT system. Because applications often have stringent quality of service (QoS) requirements, which may be difficult to meet, e.g. configuration, robustness, reliability, latency, determinism, energy efficiency, battery
978-92-61-31391-3/CFP2068P @ ITU 2020 Kaleidoscope – 55 –

lifetimes, and security [9]-[11]. In this new application scenario, [12] and [13] report the suitability and achievable performance figures of industrial networks. As mentioned in [14], LPWAN (low-power wide area network) is a new type of wireless network of IoT, which is applied to indoor industrial monitoring [15], intrusion detection [16], remote monitoring and smart cities [17] with the help of robust communication, wide coverage ranges and low power consumption.
Figure 1 - The relationship between digital twins and Internet
IIoT will completely change the manufacturing industry by acquiring and accessing higher data rates and be more efficient than before; examples are smart manufacturing, smart agriculture, smart cities, smart home, smart health care, smart transportation, etc. IIoT promotes the strong demand for more data acquisition, communication, real-time analysis and data-driven decision-making in various industrial vertical fields. Automation in different vertical domains have been developing rapidly. But limited to the radio technologies, CAPEX (capital expenses) and OPEX (operating expenses), the communication technology of the vertical domain development is mainly confined to the local Area Network, or even a wire connection network. Although the cellular radio communication technology such as NB-IoT, eMTC, or LoRa, etc. can serve some IoT use cases, it cannot satisfy the requirements for all the IoT use cases, e.g. use cases [18][ and 19] cannot be served perfectly by the legacy cellular IoT system in Table 1.
Generally, the use cases that cannot be satisfied by the legacy cellular IoT system will have rigorous requirements for low latency, high reliability, little jitter and/or frequent small data transmission. IIoT is mainly focused on providing wireless communication for these use cases.
2. DEVELOPMENT AND RESEARCH ACTUALITYFOR IIOT TECHNOLOGY
With the rise of IIoT and the advent of Industry 4.0, the application of ultra-reliable and low latency communications (URLLC) in the IIoT field has attracted more and more attention [20]. In terms of delay and reliability, 5G URLLC
has been greatly improved compared with the previous cellular mobile communication technology. URLLC has two basic features: high reliability and low latency, such as 10-5 or 10-6 BLER (block error rate) performance, 0.5 ms or 1 ms air interface transmission delay. As one of the three application scenarios of 5G system, URLLC is widely used in various industries, such as AR/VR in the entertainment industry, industrial control system, transportation, management of smart grid and smart home, and interactive telemedicine diagnosis [21]. This document will introduce the development of 3GPP in Rel-15 and Rel-16 for URLLC in reducing delay and enhancing reliability, as well as the research on little jitter and high transmission efficiency.
Table 1 – Communication service performance requirements
Communica-tion service availability: target value
Transfer interval:
target value
Jitter Remarks
99.999 % to 99.99999 %
500 μs <50% of E-to-E latency
Motion control
99.9999 % to 99.999999 %
≤ 1 ms Wired-2-wireless 100 Mbit/s link replacement
> 99.9999 % 1 ms to 50 ms
< transfer interval
Mobile robots
99.9999 % to 99.999999 %
4 ms to 8 ms
< 50% of interval
Mobile control panels – remote control of e.g. assembly robots, milling machines
99.999999 % 1 ms Mobile Operation Panel: Motion control
> 99.999999%
1 ms Robotic Aided Surgery
> 99.999% 1 ms Robotic Aided Diagnosis
2.1 Low latency
The 5G URLLC technology achieves a user plane delay of 0.5 ms in both the uplink and downlink between the gNB and the terminal. The delay refers to the time it takes to successfully transmit application layer IP packets/messages, specifically from the sender's 5G wireless protocol layer entry point, via 5G wireless transmission to the receiver's 5G wireless protocol layer exit point. Among them, the delay comes from both the uplink and downlink directions. The main technologies used by the 5G URLLC to implement low latency include: 1) Introducing a smaller time resource unit,
– 56 –
2020 ITU Kaleidoscope Academic Conference
such as mini-slot. 2) Uplink access uses the no-scheduling permission mechanism, and the terminal can directly access the channel. 3) Supporting an asynchronous process to save uplink time synchronization overhead. 4) Adopting fast hybrid automatic repeat request (HARQ) and fast dynamic scheduling, etc.
Based on the above discussion, this section will introduce the progress of URLLC delay research in Rel-15 in Section 2.1.1. In order to fully support URLLC services, 3GPP further enhanced [22] on URLLC in the Rel-16 phase, and proposed the delay reduction scheme described in Section 2.1.2.
2.1.1 URLLC delay research in Rel-15
Support for a more flexible frame structure: The 5G NR (new radio) supports the carrier spacing of 15 KHz in the LTE system. It also supports more spacing schemes, including 30 KHz, 60 KHz, 120 KHz, and 240 KHz. The higher the carrier spacing, the lower the delay performance. In addition, 5G NR supports frame structure adjustment. Compared with the LTE, a fixed subframe includes 2 slots. The NR can flexibly switch between 1, 2 and 4 slots and flexibly configure the uplink/downlink ratio, thus reducing the air interface transmission time of each slot.
Support for more flexible scheduling units: The slot is the unit of the minimum scheduling period. The LTE includes a slot consisting of 14 symbols. However, the NR supports mini-slot. Mini-slots support the length of 2 symbol, 3 symbol, and 4 symbol, and a shorter slot can reduce the feedback delay.
Support for flexible PDCCH configuration: The search space consists of a group of candidate PDCCH (physical downlink control channel), and the search space can be configured with parameters such as search type, period, slot offset, number of slot, CORESET, downlink control information (DCI) format and so on. By configuring a reasonable monitoring period and offset of the PDCCH and the monitoring of the PDCCH in a slot, the PDCCH monitoring opportunity can be achieved densely. The slot has multiple PDCCH monitoring moments, which can meet the requirements for the burst service scenarios of the URLLC and meet the requirements for low latency.
Support for URLLC high-priority transmission: To meet the URLLC service requirement of high priority, 5G/NR proposes that a URLLC service can preempt enhanced mobile broadband (eMBB) service resources to reduce the delay.
Introduction of mobile edge computing (MEC): In a 5G network, the user-plane function (UPF) can be deployed on the user side. The edge computing server and the UPF are co-located. The UPF recognizes that the destination address of the service flow is local, so it distributes the service to the local edge computing server for service processing, which reduces the redundant transmission path of the service and reduces the delay.
2.1.2 URLLC delay research in Rel-16
Support for grant free configuration: In the scheduling based on grant configuration, the UE needs to obtain resources through the scheduling request. In order to reduce the delay, the resource [23] can be pre-allocated to some UEs according to the service characteristics.
Support for intra-UE priority and multiplex mechanism: In Rel-15, eMBB DG (dynamic grant) takes precedence over URLLC CG (configured grant). In order to ensure the delay of a URLLC service, Rel-16 proposes a selection scheme based on LCP (logical channel prioritization), so as to transmit URLLC services with a higher priority.
Support for TSN and 5G convergence: The following mechanisms are adopted to realize TSN: 1) Support SPS (semi-persistent scheduling) with a shorter period. 2) Support configuring multiple SPS and CG for a bandwidth part (BWP) of the UE. 3) Support TSN services that do not match the CG/SPS period.
2.2 High reliability
At present, the reliability index of 5G URLLC is 99.999% for a 32-byte packet in the user plane delay 1ms. In addition, if the delay allows, 5G URLLC can also use the retransmission mechanism to further improve the success rate. In terms of improving system reliability, 5G URLLC adopts the following technologies: 1) Adopting a more robust multi-antenna transmit diversity mechanism. 2) Adopting robust coding and modulation order to reduce the bit error rate. 3) Adopting super robust channel state estimation. Sections 2.2.1 and 2.2.2 show that the reliability of URLLC has been enhanced in Rel-15 and Rel-16 of 3GPP, respectively.
2.2.1 URLLC reliability research in Rel-15
Support for PDCP duplication mechanism: The sender replicates the data at the PDCP layer, and then sends the two duplications to two independent logical channels for transmission, so as to achieve the frequency diversity gain and improve reliability.
Support for optimizing MCS\CQI tables: The MCS (modulation and coding scheme)\CQI (channel quality indication) of the LTE cannot meet the requirements of NR for system reliability and transmission rate. Therefore, NR adds two lower bit rates in the CQI table, and the corresponding gNB adds two MCS low frequency options. A lower bit rate can be chosen between the UE and the gNB to ensure reliability.
Support for less load DCI design: By reducing the DCI overhead and improving the aggregation level (AL), the PDCCH encoding rate is reduced. The decoding error rate is reduced, and the reliability is improved.
– 57 –
Industry-driven digital transformation

2.2.2 URLLC reliability research in Rel-16
Support for multi-TRP transmission mode: Rel-16 proposes that transmission blocks can be transmitted repeatedly based on space division, frequency division, intra-slot division and inter-slot division on the basis of Rel-15. In order to improve the diversity gain, it also supports the combination of the above modes and the dynamic handover between different modes (including combined modes).
Support for PDCP duplication enhancement mechanism: Rel-15 supports two-branch PDCP duplication, in order to achieve higher reliability. Rel-16 supports up to four-branch PDCP duplication. This mechanism can be implemented through CA (carrier aggregation) duplication, DC (dual connectivity) duplication and the combination of CA duplication and DC duplication.
Support for redundant transmission scheme: NG-RAN duplicates uplink packets and sends them to the UPF via two redundant link (N3 interface) channels, where each N3 channel is associated with a PDU session, and two independent N3 channels are established to transmit data. The gNB, SMF and UPF will provide different routes for the two links [24].
2.3 Little jitter
Time requirements are typically specified with two values: characteristic time and jitter. Characteristic time is the target value of the time parameter in question, e.g. end-to-end latency. The jitter is the variation of a (characteristic) time parameter, and the maximum deviation of a time parameter relative to a reference or target value.
As depicted in [19], power distribution poses the jitter requirements and the traffic pattern is deterministic as well. In such a case, the maximum value of the characteristic time parameter needs to be known. Sometimes, a minimum value may also be given, and should not be undershot. A minimum value is only used in particular use cases; for instance, when putting labels at a specific location on moving objects. In R15, a common understanding in RAN is that a delay-sensitive URLLC service with periodic traffic can be accommodated by the semi-persistent CG. That means the periodicity of the traffic should be a prerequisite in RAN to meet the data size and jitter requirements. An example is the variation of the end-to-end latency. If not stated otherwise, jitter specifies the symmetric value range around the target value (target value ± jitter/2). If the actual time value is outside this interval, the transmission was not successful. [19] shows an example of transmissions with jitter. Note that the end-to-end latency may scatter even for successful transmissions.
As an important feature of TSN, jitter requirement is to provide a deterministic service with bounded delay. Typical characteristic parameters to which jitter values are ascribed are transfer interval, end-to-end latency, and update time. Further, the buffering mechanism is held and forwarded to
eliminate jitter in the TSN. DS-TT and NW-TT support a hold and forward mechanism to schedule traffic as defined in IEEE 802.1Qbv [25], if 5GS is to participate transparently as a bridge in a TSN network. The hold and forward buffering mechanism allows PDB (packet delay budget) based 5GS QoS to be used for TSC traffic since packets need only arrive at NW-TT or DS-TT egress prior to their scheduled transmission time. How hold and forward buffer is supported by the TSN translator is up to implementation.
In addition, time synchronization precision is defined between a sync master and a sync device. The detailed objectives for NR TSC-related enhancements include: Specify accurate reference timing delivery from gNB to the UE using broadcast and unicast RRC signaling for synchronization requirements defined in [26]. To meet the high-precision time synchronization requirements of the TSN, a high-precision reference time transmission mechanism is introduced to NR. Broadcast messages (SIB9) or dedicated RRC messages (DLInformationTransfer messages) with the high-precision time can be sent. The time granularity is enhanced from 10 ms to 10 ns. According to the simulation result of RAN1, RAN2 assumes that delay compensation is required in the scenario where the service range is greater than 200m for the user with the subcarrier interval of 15 kHz. However, in Rel-16, RAN1 only provides transmission delay compensation for the base station and UE in the TDD and FDD scenarios according to half of the timing advance, that is, NTA×Tc/2. In addition, although RAN1 discussed a lot about when and how to implement the transmission delay supplement, it did not make a conclusion in the Rel-16 phase.
2.4 High transmission efficiency
In the field of IIoT, the small packets of TSN are transmitted frequently in the ordinary communication network. TSN is also introduced into the 5G system, which has the characteristics of small packets with frequent transmission, low latency and high reliability. In which case, reducing the packet overhead can effectively improve the effective utilization of system bandwidth. Therefore, for TSN packets, header compression can be used to further reduce the size of data packets, thus saving the wireless resources used by a single packet and improve the utilization of wireless resources. The data stream transmitted by TSN is mainly an Ethernet data packet, so the Ethernet header compression (EHC) is introduced to reduce the overhead caused by Ethernet header transmission.
EHC may be particularly beneficial when the payload size of an Ethernet frame is small relative to the overall size of the frame, which is typical in Ethernet-based IIoT network. The EHC protocol compresses Ethernet header as shown in Figure 2. The fields that are compressed by the EHC protocol are: DESTINATION ADDRESS, SOURCE ADDRESS, 802.1Q TAG, and LENGTH/TYPE. The fields PREAMBLE, SFD, and FCS are not transmitted in a 3GPP system, and thus not considered in an EHC protocol. There may be more than one 802.1Q TAG fields in the Ethernet header, and all are
– 58 –
2020 ITU Kaleidoscope Academic Conference

compressed by the EHC protocol. The padding (PAD) is not compressed by the EHC protocol. The EHC compressor and the EHC decompressor store original header field information as an "EHC context". Each EHC context is identified by a unique identifier, called Context ID (CID). For an Ethernet packet stream, the EHC compressor establishes the EHC context and associates it with the CID. Then, the EHC compressor transmits the "Full Header (FH)" packet to the EHC decompressor including the associated CID. The EHC compressor keeps transmitting the FH packets until the EHC feedback is received from the EHC decompressor.
EXTENSION
PREAMBLE
START OF FRAME DELIMITER (SFD)
DESTINATION ADDRESS
SOURCE ADDRESS
802.1Q TAG (optional)
LENGTH/TYPE
PAYLOAD (+PAD)
FRAME CHECK SEQUENCE (FCS)
Figure 2 - Ethernet packet format
The source MAC address, destination MAC address and type fields of the Ethernet header frame are all static and can be compressed, which is also the conclusion of the 3GPP RAN2. Header compression is essentially the use of CID instead of Ethernet headers for transmission in the communication network.
The compression process includes: 1) The configuration of the CID is completed by the PDCP data PDU. 2) The compressor sends a full packet containing the full header and the CID. 3) The decompressor establishes the relationship between the header and the CID according to the received FH packet. 4) After the decompressor successfully establishes the context relationship, it sends the feedback message with the CID, informing the compressor that it can send the compression package. 5) After receiving the feedback information carrying CID, the compressor starts to send the compression packet corresponding to the CID. The header field in the compression packet is replaced by the CID, where the feedback information is sent by PDU control PDCP.
3. FUTURE RESEARCH IIOT TECHNOLOGY
As a breakthrough in the integration of mobile communications and vertical industries, 5G is expected to
bring about great changes to the whole society through URLLC services such as automatic driving, factory automation and smart grid. Based on the present, the research in the 3GPP R16 is about to end. At this stage, the research in related high-level technologies has laid a solid foundation for the integration of 5G and IIoT. With the development of IIoT, its services require more strict delay and is more deterministic, for example, up to 99.999 999%. To this end, 3GPP Rel-17 has launched a research on standard technology to further enhance the delay and reliability, so that 5G can meet the various needs of the development of IIoT.
Considering the directions of the reliable private network of local service optimization, extensible wireless connections of future platforms, and multiple functions of new cases, a shorter frame structure is selected in accordance with service development requirements to reduce the air interface delay of services. In addition, deep integration with the TSN proposed by the industry is also considered to guarantee low transmission delay of services. On the road of the integration of 5G and industrial Internet TSN, related enhancements will be carried out in the following aspects: 1) On the basis of multi-carrier deployment, the reliability is further improved by introducing a PDCP layer and higher-level data replication transmission technology. 2) The feedback scheme for the physical layer will be further enhanced. 3) The UE service priority and uplink UCI will be enhanced. 4) Licensed, shared and license-free spectrum: With the NR-U, the 5G NR will support the licensed frequency, shared frequency domain and license-free spectrum. 5) URLLC: low latency, high reliability, and multi-TRP cooperation. 6) Enhanced mobility. 7) Wireless replacement of wired bus. 8) Positioning: based on network and equipment requirements, IIoT requirements, and intelligent factory/V2X (Vehicle to everything) centimeter positioning requirements. 9) With the penetration of artificial intelligence (AI) technology, exploring the new deterministic requirements and key standard technology of AI in IIoT applications. These will be the key direction in the future.
4. IIOT APPLICATION IN DIGITAL TWINS
With the continuous development of the manufacturing industry, digital twins have become the focus of every digital enterprise, although they have not yet become the mainstream technology. The core of digital twins is model and data, but the creation of virtual models and data analysis require professional knowledge. For those who do not have relevant knowledge, it is a long way to go to build and use digital twins. IIoT can just solve the above problems, through the platform to achieve data analysis outsourcing, model sharing and other services. For example, using the IIoT to associate the edge-side infrastructure downward with the digital twin, and to transfer and store data upward in the cloud. Other users can also establish digital twins through the services of the platform according to their own needs. It can be said that the industrial Internet platform activates the life of digital twins.
Compressed by EHC
– 59 –
Industry-driven digital transformation

IIoT is a key link in the process of enterprise digital transformation, which accelerates the integration of various elements of information technology (IT) and operation technology (OT). Data is the most important binder in the integration process. In order to make the IT and OT integrate better, the hidden asset of data should be handled first. In addition, the IIoT is trying to break the boundaries of enterprises, trying to fill the gaps between IT and OT, and creating a new ecology of software definition, data-driven and mode innovation. The digital twin just provides the interface of data and technology for the development of integration.
Figure 3 - An example use case of industrial IoT via digital twins
As we know, when each object (such as cars, airplanes, factories, and people) in the real world has a digital twin, the space-time relationship between the digital twins becomes more valuable than a digital twin. When the interactions between objects are optimized at the same level of a system, compared with the partial or independent optimization of the system, the efficiency is greatly improved. But in order to realize the optimization of the whole system, communication becomes a crucial factor. As described in [19], most of the communication technologies currently used in industry are still wired. However, with the advent of Industry 4.0 and 5G, this may change fundamentally, since only wireless connectivity can provide the degree of flexibility, mobility, versatility, and ergonomics that is required for the factories of the future. Therefore, with the support of IIoT, digital twins technology has been further promoted in different application fields of a "future factory", such as factory automation, process automation, HMIS (hazardous material information system) and production, logistics and warehouse, monitoring and maintenance. Figure 3 contains enterprise
resource planning (ERP), manufacturing execution system(MES), computer aided quality (CAQ), computer aided manufacturing (CAM), Internet process connection (IPC), symbolic programming system (SPS) and computerized numerical control (CNC), and so on. Figure 3 shows the objects in the real production process, such as robots, cameras, mechanical arms, workbenches, mechanical tools, etc., which upload the information status of objects to the Internet/cloud using wired and wireless networks through sensors. After high real-time data exchange, the state of the real object is simulated by digital twins, and the corresponding fault diagnosis results, evaluation and prediction results, behavior control of machinery and other information are obtained. Then the high real-time network communication and the corresponding result information are used to control the production process. The high-real-time data exchange between them is the basis and prerequisite for the application of the digital twins technology. In addition, as an effective way to solve the interaction theory and implementation method of the physical world and the information world in the future, digital twins are gradually deepening in practice. This also means that the demand for network performance in its development is constantly improving, and it also promotes the improvement of IIoT related project research and standards. Thus, it is necessary to further study the low latency and high reliability of IIoT in Section 3.
Based on the above case, digital twins can display, predict, and analyze the interaction between a digital model and the physical world. The design based on digital twins is based on virtual mapping of existing physical products. A large amount of data is studied to obtain valuable knowledge for product innovation. Designers only need to publish the requirements to the industrial Internet platform, so that platform managers can precisely match the data services needed by designers, as well as the model and algorithm services for data processing. Digital twins are effectively applied to product design through services to reduce the modification caused by the inconsistency between expected behavior and design behavior. It greatly shortens the design cycle and reduces the design cost.
5. CONCLUSIONS
The development of IIoT technology makes the application scenarios of digital twins technology more extensive, fully demonstrating the advantages and capabilities of digital twins in terms of models, data, and services. As a new digital technology solution and human-computer interaction interface, it will effectively promote and deepen the further development of business models. The development of digital twins technology is closely related to the continuous evolution of URLLC technology in IIoT. In other words, the development requirement of digital twins also promotes the improvement of IIoT standards and technologies. Compared with the previous cellular mobile communication technology, 5G URLLC has greatly improved in terms of delay, reliability, little jitter and high transmission efficiency. However, with the development of IIoT, the research of
– 60 –
2020 ITU Kaleidoscope Academic Conference

delay and reliability technology needs to be further enhanced to meet the needs of various services.
REFERENCES
[1] E. Sisinni, A. Saifullah, S. Han, U. Jennehag, and M. Gidlund, “Industrial Internet of Things: Challenges, opportunities, and directions,” IEEE Trans. Ind. Informat., vol. 14, no. 11, pp. 4724-4734, Nov. 2018.
[2] S. Tayeb, S. Latifi, and Y. Kim, “A survey on IoT communication and computation frameworks: An industrial perspective,” in Proc. IEEE 7th Annu. Comput. Commun. Workshop Conf., pp. 1-6, Jan. 2017.
[3] B. Chen, J. Wan, Y. Lan, M. Imran, D. Li and N. Guizani. “Improving Cognitive Ability of Edge Intelligent IIoT through Machine Learning,” IEEE Network, vol. 33, no. 5, pp. 61-67, 2019.
[4] S. Savazzi, V. Rampa, and U. Spagnolini, “Wireless cloud networks for the factory of things: Connectivity modeling and layout design,” IEEE Internet Things J., vol. 1, no. 2, pp. 180-195, Apr. 2014.
[5] S. Mumtaz, A. Alsohaily, Z. Pang, A. Rayes, K. F. Tsang, and J. Rodriguez, “Massive Internet of Things for industrial applications: Addressing wireless IIoT connectivity challenges and ecosystem fragmentation,” IEEE Ind. Electron. Mag., vol. 11, no. 1, pp. 28-33, Mar. 2017
[6] C. Perera, C. H. Liu, and S. Jayawardena, “The emerging Internet of Things marketplace from an industrial perspective: A survey,” IEEE Trans. Emerg. Topics Comput., vol. 3, no. 4, pp. 585-598, Dec. 2015.
[7] P. Bellagente, P. Ferrari, A. Flammini, S. Rinaldi, and E. Sisinni, “Enabling PROFINET devices to work in IoT: Characterization and requirements,”in Proc. Conf. Rec.-IEEE Instrum. Meas. Technol., pp. 1-6, May 2016.
[8] T. Sauter and M. Lobashov, “How to access factory floor information using Internet technologies and gateways,” IEEE Trans. Ind. Informat., vol. 7, no. 4, pp. 699-712, Nov. 2011
[9] P. Bartolomeu, M. Alam, J. Ferreira, and J. A. Fonseca, “Supporting deterministic wireless communications in industrial IoT,” IEEE Trans. Ind. Informat., vol. 14, no. 9, pp. 4045-4054, Sep. 2018.
[10] T. Qiu, Y. Zhang, D. Qiao, X. Zhang, M. L. Wymore, and A. K. Sangaiah, “A robust time synchronization scheme for industrial Internet of Things,” IEEE Trans. Ind. Informat., vol. 14, no. 8, pp. 3570-3580, Aug. 2018.
[11] R. Koutsiamanis, G. Z. Papadopoulos, X. Fafoutis, J. M. D. Fiore, P. Thubert, and N. Montavont, “From best effort to deterministic packet delivery for wireless industrial IoT networks,” IEEE Trans Ind. Informat., vol. 14, no. 10, pp. 4468-4480, Oct. 2018.
[12] M. Saez, F. P. Maturana, K. Barton, and D. M. Tilbury, “Real-time manufacturing machine and system performance monitoring using Internet of Things,” IEEE Trans. Autom. Sci. Eng., vol. 15, no. 4, pp. 1735-1748, Oct. 2018.
[13] S. Fuchs, H. Schmidt, and S. Witte, “Test and on-line monitoring of real-time Ethernet with mixed physical layer for industry 4.0,” in Proc. IEEE 21st Int. Conf. Emerg. Technol. Factory Autom. (ETFA), pp. 1-4, Sep. 2016.
[14] U. Raza, P. Kulkarni, and M. Sooriyabandara, “Low power wide area networks: An overview,” IEEE Commun. Surveys Tuts., vol. 19, no. 2, pp. 855-873, 2nd Quart., 2017.
[15] Z. Iqbal, K. Kim, and H. N. Lee, “A cooperative wireless sensor network for indoor industrial monitoring,” IEEE Trans. Ind. Informat., vol. 13, no. 2, pp. 482-491, Apr. 2017.
[16] S. Shin, T. Kwon, G. Y. Jo, Y. Park, and H. Rhy, “An experimental study of hierarchical intrusion detection for wireless industrial sensor networks,”IEEE Trans. Ind. Informat., vol. 6, no. 4, pp. 744-757, Nov. 2010.
[17] D. Magrin, M. Centenaro, and L. Vangelista, “Performance evaluation of LoRa networks in a smart city scenario,” in Proc. IEEE Int. Conf. Commun., pp. 1-7, May 2017.
[18] 3GPP TS 22.104: “Service requirements for cyber-physical control applications in vertical domains”.
[19] 3GPP TS 22.804: "Study on Communication for Automation in Vertical Domains”.
[20] S. Yang, Y. Gao, X. Zhang, M. Li, “Research on multiplexing technology of eMBB and URLLC services under 5g new air port,” Telecom Engineering Technics and Standardization, Aug. 2018.
– 61 –
Industry-driven digital transformation

[21] S. Xu, J. Xin, “Study on 5G uRLLC Enhancement Technology for Ultra-reliableand Low Latency Communications,” Mobile Communications, vol. 43, no. 9, pp. 62-67, Nov. 2019.
[22] 3GPP TSG RAN WG1 Meeting#96 R1-1903448, “Evaluation of URLLC Factory Automation Scenario at 30 GHz,” 2019.
[23] 3GPP TS 38.211: “Physical channels and modulation (Release 16)”.
[24] 3GPP TSG-RAN Meeting#81 RP-182090, “Revised SID:Study on NR Industrial Internet of Things (IoT),” 2018.
[25] IEEE 802.1Qbv-2015: “IEEE Standard for Local and metropolitan area networks - Bridges and Bridged Networks - Amendment 25: Enhancements for Scheduled Traffic”.
[26] 3GPP TS 38.331: “Radio Resource Control (RRC) protocol specification (Release 16)”.
– 62 –
2020 ITU Kaleidoscope Academic Conference

SESSION 4
DIGITAL TRANSFORMATION IN DAILY LIFE
S4.1 A technique for extracting the intention of messengers in social media
S4.2 Towards a digital process platform for future construction sites


A TECHNIQUE FOR EXTRACTING THE INTENTION OF MESSENGERS IN SOCIAL MEDIA
Mohamed Fazil Mohamed Firdhous1; Balakrishnan Nalin Prashanth2
1Depertment of Information Technology, University of Moratuwa, Moratuwa 10400, Sri Lanka 2Faculty of Information Technology, University of Moratuwa, Moratuwa 10400, Sri Lanka
ABSTRACT
Today social media has become an integral part of human life. Though there are many advantages social media has some shortcomings, especially when it comes to young users. Parents generally do not want their young children to have social media accounts. Even if some parents allow their young children to have their own accounts, they want them to use it under their active supervision. This is mainly due to the reason that parents fear that children may be exposed to inappropriate content, or may become victims of abuse by cyber-criminals. In this paper, the authors propose a technique that can extract the intention of users of online chatting by converting the non-text information along with misspelled and abbreviated text into meaningful text and analyzing it to understand the true motive of the messenger. The tests conducted on the technique show that it performs better than a cosine similarity test within the domain of online chatting. The other main advantage of this technique is that it can be integrated with any social media platform with relative ease making it secure even for young children.
Keywords – child safe, intention identification, secure messaging, social media messaging
1. INTRODUCTION
At present with the development of technology, instant messaging (IM) has become one of the vital forms of communication. People of all age groups use IM to communicate with and to keep in touch with their acquaintances. Hence, almost all the online social media platforms support the IM feature. Though IM helps people immensely to keep in touch compared to traditional communication technologies, they have certain shortcomings as well [1]. One of the major shortcomings of IM in social media is the anonymity of the involved parties. This anonymity enables the users of IM with malicious intent to use it for fraudulent purposes. Children are especially vulnerable and have the greater chance of falling into trouble, as they are unable to understand the real motive of the other party. Some of the ways people with malicious intent abuse IM include using it for the solicitation of sex from innocent users, promoting violence/terrorism, theft of sensitive information, and bullying [2]. Hence, it is very important to protect children from these kinds of predators trying to abuse the technology to satisfy their reprehensible desires.
Therefore, it is very important to analyze the chat messages to understand the intention of the parties involved in chatting to protect young users from getting caught up in probable fraudulent activities. Several researchers have proposed techniques for understating the topic of IM discussions in the past. Unlike topic detection in other text based communications, topic detection in IM is difficult due to many reasons including unique features included in chat messages, short length of messages, non-standard abbreviations used and different meaning bearing components in messages such as emojis, smileys, emoticons and hyperlinks. Hence, it is important to understand these different characteristics and components of instant messages to process them effectively.
In this paper, the authors propose a technique that can be used to decipher the motive of messengers by interpreting all the different components contained in a message. As a first step towards achieving this objective, the study was focused on understanding the characteristics of chat messages in online social media. Then the authors propose a semantics-based technique to identify the intention of the parties involved in messaging by grouping the related messages to increase the length of the text and to make them semantically richer. The scope of the study was limited to English chat messages in Facebook for practical reasons. Several preprocessing techniques were employed to extract the meaning of non-text components in messages along with a novel method of disambiguating nouns, verbs and adjectives used in messages. The paper also presents a novel algorithm to group related messages in a conversation. Finally, the proposed algorithm was tested for its effectiveness by comparing the results with that of cosine similarity.
The rest of the paper is organized as follows; Section 2 discusses related work where similar techniques proposed in the literature were critically analyzed with respect to their advantages and disadvantages. Section 3presents a detailed discussion on the characteristics of chat messages emphasizing the importance of handling them differently when compared to normal text. Section 4 describes the technique developed in this research and how it is used to implement the solution for the problem addressed highlighting the novelty of the technique. Section 5reports the experiments carried out to test the performance and effectiveness of the proposed technique together with a detailed discussion on the results. Finally, Section 6concludes
978-92-61-31391-3/CFP2068P @ ITU 2020 Kaleidoscope – 65 –
the paper with a brief discussion on the overall contributions and suggestions for future work.
2. RELATED WORK
Several researchers have worked in this area of topic and intent identification in chat messages. Through in-depth studies and evaluations, they have proposed several techniques for analyzing the text exchanged between two users and extracted the intention of the users involved. This section presents a critical analysis of some of the most prominent work published in the literature.
Dong et al have studied the characteristics of chat messages using 33,121 sample messages collected from 1700 conversational sessions with the objective of understanding the properties of chat messages and extracting the topic of conversation [3]. Based on the studies carried out, they have proposed an indicative term based chat topic detection technique that incorporates multiple techniques such as sessionalization of chat messages and the extraction of features from icon text and URLs for preprocessing along with naive Bayes, associative classification and support vector machines (SVM) as classifiers to group conversations into different categories using a set of topic indicative terms identified by an experimental study on the sample data and words predefined for each topic. Though this technique outperforms the document frequency based approach, it is capable of handling only text with complete words and sentences. Hence, the inability to handle different meaning bearing components in messages such as emojis, smileys and emoticons present in a message and abbreviated text are the main shortcomings of this technique.
The technique used by Zhang et al., in [4] is that each message is treated as a data item in a stream of messages and then probabilistic latent sentiment analysis (PLSA) is applied on the collected messages to discover the structure of the topic of message streams by modeling the message-word co-occurrence matrix information. The main objective of this proposal is to handle three main issues in instant messaging as handling useless terms, very short messages and the use of multiple languages. This technique is also capable of handling text only and cannot handle messages mixed with other meaning bearing components.
Iqbal et al., have in [5] suggested a framework for analyzing online messages for criminal investigations. The proposed technique uses the whole chat log from a confiscated computer as input and carries out topic extraction on identified social networks by summarizing the messages to aid the criminal investigation. This method is also restricted to handling complete text only and cannot handle messages mixed with different components.
The technique used by Song and Diederich in [6] first segments messages into sentences and then the sentences are converted into tuples of the form: (performative, proposition) using a dialog act classifier. Following this, the intention of the sender is formulated using the tuples and well-chosen
constraints of human communication. This technique is also capable of handling messages composed using text only.
Inches and Crestani have in [7] proposed a framework for both author and topic identifications. In this framework, Latent Dirichlet Analysis (LDA) is used for topic identification and its hierarchical version is applied on segmented conversation data for topic detection. This method is also restricted to handling only text messages using complete sentences.
Chen et al., have in [8] used semantic dependency distance (SDD) along with PLSA to avoid the lack of semantic information that generally happens when PLSA alone is used for this purpose. Though this method performs better than techniques that use only PLSA for topic detection, it is also unable to handle messages with abbreviations and other image-based components.
The technique proposed by the authors in this paper differs in many ways from existing techniques including the incorporation of a novel algorithm for grouping similar messages while minimizing the drawbacks encountered in cosine similarity in the online chatting domain. Also, the proposed technique can handle abbreviations commonly used in chat messages along with other meaning bearing components such as emojis and smileys.
3. CHARACTERISTICS OF CHAT MESSAGES
It is important to understand the characteristics of online chat messages for processing them effectively for identifying the intention of the users or topic being discussed. Online chat messages are generally different from other texts having their own unique features. This makes the processing of these messages more difficult compared to other text processing tasks. The general features of online text messages are discussed below.
3.1 Message length is generally very short
The short nature of messages poses great challenges for understanding the topic or the context being discussed even for a human user. Hence, understanding the messages becomes one of the main challenges when it is to be automated to be carried out by a machine. Lack of details in a message is a major issue associated with short messages. In order to address this issue, the authors suggest identifying the semantically rich words and grouping them together to enrich the content forming a larger set of semantically rich words.
3.2 Dynamic nature of the conversations
Unlike other text documents such as articles, posts, comments, or reviews, chat messages generally do not follow a single topic. Also, most of the time, each and every message may not contribute to the topic. Hence, it is first necessary to identify different groups of messages contributing towards different topics discussed within a single thread. This issue is to be handled by identifying different groups of messages
– 66 –
2020 ITU Kaleidoscope Academic Conference

within a single conversation and extracting their intentions independently.
3.3 Usage of non-text components
Non-text components such as hyperlinks, stickers, emoticons, files and graphic content (images, videos, GIFs) included in chat messages also contribute towards conveying the intention of the sender adding meaning to the conversation. Therefore, it is necessary to identify the meanings conveyed by these non-text components in order to understand the intention as a whole. The authors propose multiple preprocessing steps to identify non-text components and extract and incorporate the textual meaning of them into the messages. Methods used for preprocessing some of the non-text components are:
- Hyperlinks – Extract the metadata description of the hyperlink and replace it with the hyperlink.
- Emoticons – An emoticon dictionary is used to obtain the textual meaning of emoticons. The Unicode of the emoticon is identified to extract the meaning of the emoticon and then to replace it with the meaning found in the dictionary.
3.4 Complexity of language used
Language complexity is a part of almost all types of text. But, only a few unique usages contribute towards the language complexity in chat messages. In order to perform the intended task effectively, it is important to identify these issues and neutralize or minimize their effect. Some such complexities associated with chat message processing include:
- Use of multiple languages: When communicating via messages, people tend to use many languages they are conversant with. Hence, it is necessary to identify the different languages used in the message and translate them into one common language for further processing. In this research, messages created using only the English language is considered. Thus, handling complexities arising from the use and multiple languages is to be considered under future research.
- Use of abbreviations or short form for phrases: Chat messages are generally limited by character count and intended to be very short. One way people overcome this limitation is to shorten commonly used words and use abbreviations. In order to handle this complexity, the long forms of shortened phrases are extracted with the aid of a dictionary and used to replace the shortened phrases within text messages.
- Misspelled words and words with numbers: Sometimes numbers are used along with characters to shorten words. For example, forever is commonly spelt as 4ever. Using this kind of spelling creates a great challenge to identifying the actual word being transmitted. For handling these kinds of words, it is suggested to use a spell
checker that is capable of checking spelling phonetically as well as semantically.
3.5 Other ambiguities found in the usage of languages
Generally people commonly use synonyms, acronyms, polysemes, idioms, etc. when preparing their short messages. These terms are briefly explained below:
- Synonyms: Terms with similar meaning that can be used interchangeably.
- Acronyms: Terms made up of using the first letter of a set of words, similar to abbreviations.
- Polysemes: Terms that have more than one interpretations or meanings.
- Idiom: A group of words established by usage as having a meaning not deducible from those of the individual words.
In order to handle the above issue, the best word (synset) will be used. The synonyms were disambiguated and replaced by the disambiguated synset [3].
4. PROPOSED TECHNIQUE
In order to provide a feasible solution for the issue discussed above, an efficient technique that takes in text messages in conversations as inputs and outputs the intention or the appropriateness of intentions of the sender’s conversation is developed and implemented. In this work, only the sexual oriented intentions incorporated within messages was considered. That is, whether the intention of the communicator is sexually appropriate (good intention) or sexually fraudulent (inappropriate or bad intention). The messages transmitted by the sender of each conversation are analyzed to see whether any sender is having a sexually fraudulent intention. For the classification purpose, a method is proposed based on machine learning by training a support vector machine (SVM) classifier to check the appropriateness of the intention. A major portion of the work is related to enriching the content given as input to the classification model. That is, chat messages are grouped based on semantic similarity to form longer messages containing enhanced content. Figure 1 shows the high-level logical flow of the proposed technique.
From Figure 1, it can be seen that as soon as the text messages are supplied to the technique as input, it extracts chat features and converts them into text with the aid of the appropriate dictionary and then incorporates them into the messages. At the next stage, the messages are preprocessed by tokenizing the messages and replacing the abbreviations using an abbreviation dictionary. Then the message grouper assigns the messages to different groups based on semantic similarity. Finally, the classifier extracts the intention of the sender and
– 67 –
Industry-driven digital transformation
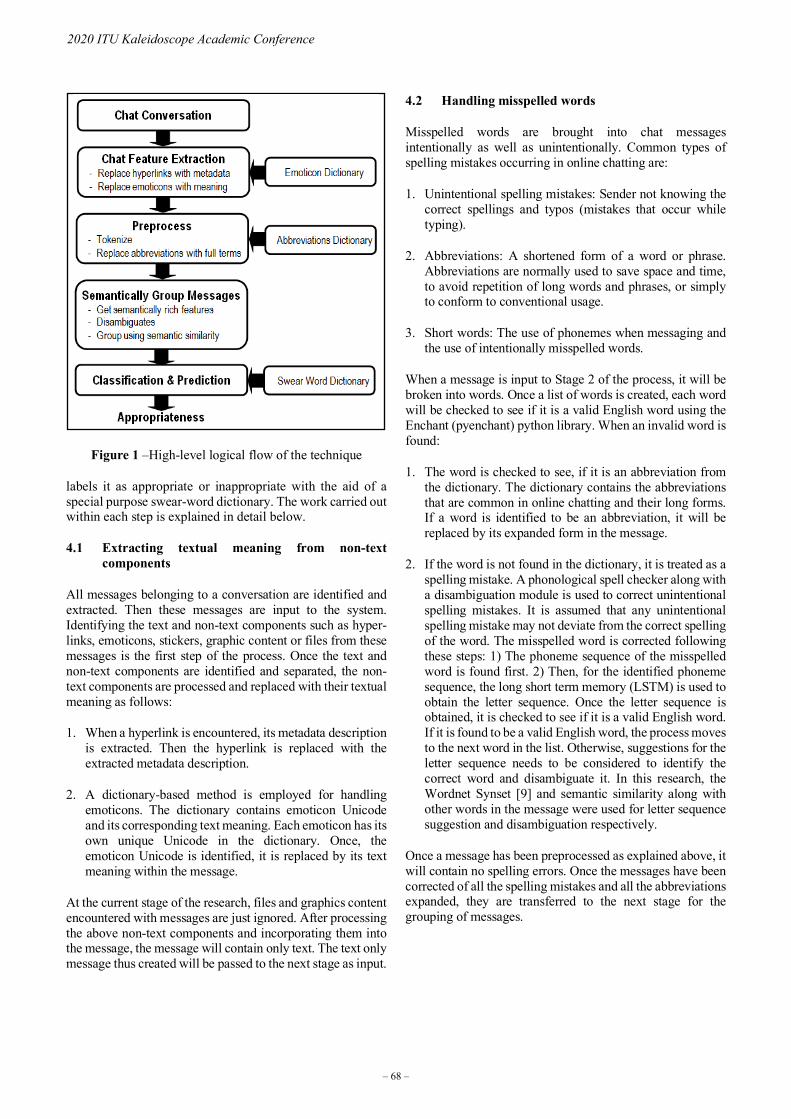
Figure 1 –High-level logical flow of the technique
labels it as appropriate or inappropriate with the aid of a special purpose swear-word dictionary. The work carried out within each step is explained in detail below.
4.1 Extracting textual meaning from non-text components
All messages belonging to a conversation are identified and extracted. Then these messages are input to the system. Identifying the text and non-text components such as hyper-links, emoticons, stickers, graphic content or files from these messages is the first step of the process. Once the text and non-text components are identified and separated, the non-text components are processed and replaced with their textual meaning as follows:
1. When a hyperlink is encountered, its metadata description is extracted. Then the hyperlink is replaced with the extracted metadata description.
2. A dictionary-based method is employed for handling emoticons. The dictionary contains emoticon Unicode and its corresponding text meaning. Each emoticon has its own unique Unicode in the dictionary. Once, the emoticon Unicode is identified, it is replaced by its text meaning within the message.
At the current stage of the research, files and graphics content encountered with messages are just ignored. After processing the above non-text components and incorporating them into the message, the message will contain only text. The text only message thus created will be passed to the next stage as input.
4.2 Handling misspelled words
Misspelled words are brought into chat messages intentionally as well as unintentionally. Common types of spelling mistakes occurring in online chatting are:
1. Unintentional spelling mistakes: Sender not knowing the correct spellings and typos (mistakes that occur while typing).
2. Abbreviations: A shortened form of a word or phrase. Abbreviations are normally used to save space and time, to avoid repetition of long words and phrases, or simply to conform to conventional usage.
3. Short words: The use of phonemes when messaging and the use of intentionally misspelled words.
When a message is input to Stage 2 of the process, it will be broken into words. Once a list of words is created, each word will be checked to see if it is a valid English word using the Enchant (pyenchant) python library. When an invalid word is found:
1. The word is checked to see, if it is an abbreviation from the dictionary. The dictionary contains the abbreviations that are common in online chatting and their long forms. If a word is identified to be an abbreviation, it will be replaced by its expanded form in the message.
2. If the word is not found in the dictionary, it is treated as a spelling mistake. A phonological spell checker along with a disambiguation module is used to correct unintentional spelling mistakes. It is assumed that any unintentional spelling mistake may not deviate from the correct spelling of the word. The misspelled word is corrected following these steps: 1) The phoneme sequence of the misspelled word is found first. 2) Then, for the identified phoneme sequence, the long short term memory (LSTM) is used to obtain the letter sequence. Once the letter sequence is obtained, it is checked to see if it is a valid English word. If it is found to be a valid English word, the process moves to the next word in the list. Otherwise, suggestions for the letter sequence needs to be considered to identify the correct word and disambiguate it. In this research, the Wordnet Synset [9] and semantic similarity along with other words in the message were used for letter sequence suggestion and disambiguation respectively.
Once a message has been preprocessed as explained above, it will contain no spelling errors. Once the messages have been corrected of all the spelling mistakes and all the abbreviations expanded, they are transferred to the next stage for the grouping of messages.
– 68 –
2020 ITU Kaleidoscope Academic Conference
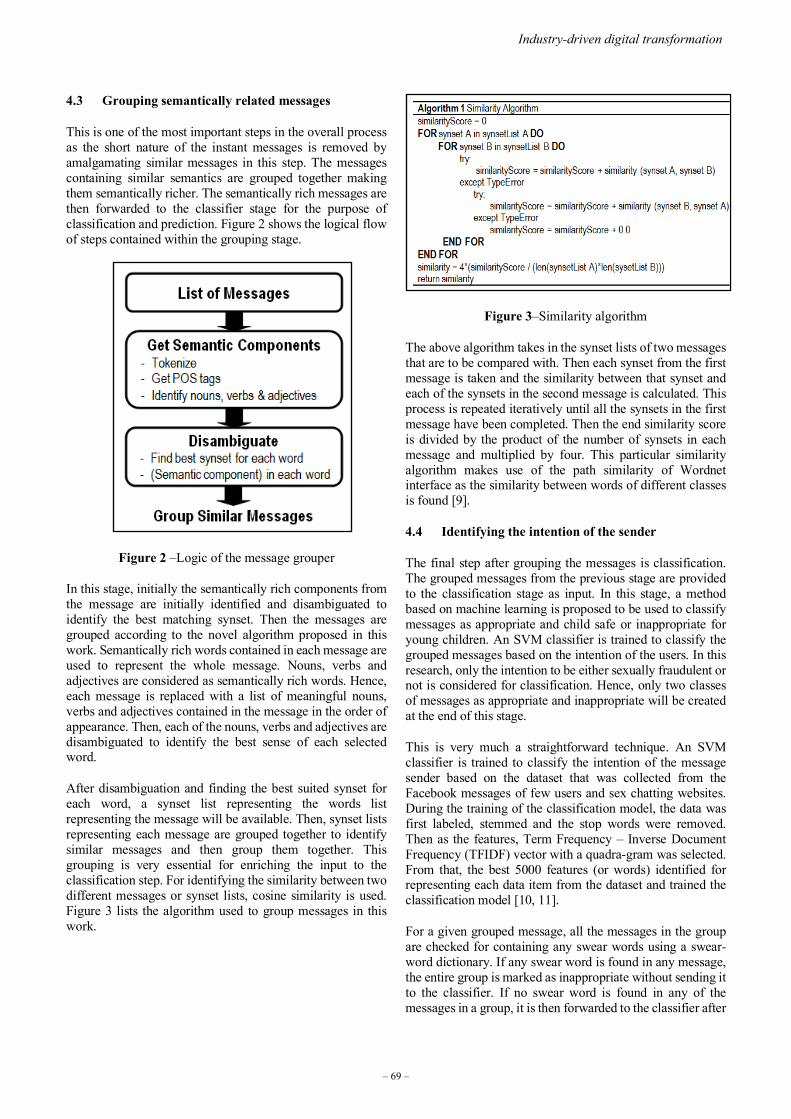
4.3 Grouping semantically related messages
This is one of the most important steps in the overall process as the short nature of the instant messages is removed by amalgamating similar messages in this step. The messages containing similar semantics are grouped together making them semantically richer. The semantically rich messages are then forwarded to the classifier stage for the purpose of classification and prediction. Figure 2 shows the logical flow of steps contained within the grouping stage.
Figure 2 –Logic of the message grouper
In this stage, initially the semantically rich components from the message are initially identified and disambiguated to identify the best matching synset. Then the messages are grouped according to the novel algorithm proposed in this work. Semantically rich words contained in each message are used to represent the whole message. Nouns, verbs and adjectives are considered as semantically rich words. Hence, each message is replaced with a list of meaningful nouns, verbs and adjectives contained in the message in the order of appearance. Then, each of the nouns, verbs and adjectives are disambiguated to identify the best sense of each selected word.
After disambiguation and finding the best suited synset for each word, a synset list representing the words list representing the message will be available. Then, synset lists representing each message are grouped together to identify similar messages and then group them together. This grouping is very essential for enriching the input to the classification step. For identifying the similarity between two different messages or synset lists, cosine similarity is used. Figure 3 lists the algorithm used to group messages in this work.
Figure 3–Similarity algorithm
The above algorithm takes in the synset lists of two messages that are to be compared with. Then each synset from the first message is taken and the similarity between that synset and each of the synsets in the second message is calculated. This process is repeated iteratively until all the synsets in the first message have been completed. Then the end similarity score is divided by the product of the number of synsets in each message and multiplied by four. This particular similarity algorithm makes use of the path similarity of Wordnet interface as the similarity between words of different classes is found [9].
4.4 Identifying the intention of the sender
The final step after grouping the messages is classification. The grouped messages from the previous stage are provided to the classification stage as input. In this stage, a method based on machine learning is proposed to be used to classify messages as appropriate and child safe or inappropriate for young children. An SVM classifier is trained to classify the grouped messages based on the intention of the users. In this research, only the intention to be either sexually fraudulent or not is considered for classification. Hence, only two classes of messages as appropriate and inappropriate will be created at the end of this stage.
This is very much a straightforward technique. An SVM classifier is trained to classify the intention of the message sender based on the dataset that was collected from the Facebook messages of few users and sex chatting websites. During the training of the classification model, the data was first labeled, stemmed and the stop words were removed. Then as the features, Term Frequency – Inverse Document Frequency (TFIDF) vector with a quadra-gram was selected. From that, the best 5000 features (or words) identified for representing each data item from the dataset and trained the classification model [10, 11].
For a given grouped message, all the messages in the group are checked for containing any swear words using a swear-word dictionary. If any swear word is found in any message, the entire group is marked as inappropriate without sending it to the classifier. If no swear word is found in any of the messages in a group, it is then forwarded to the classifier after
– 69 –
Industry-driven digital transformation
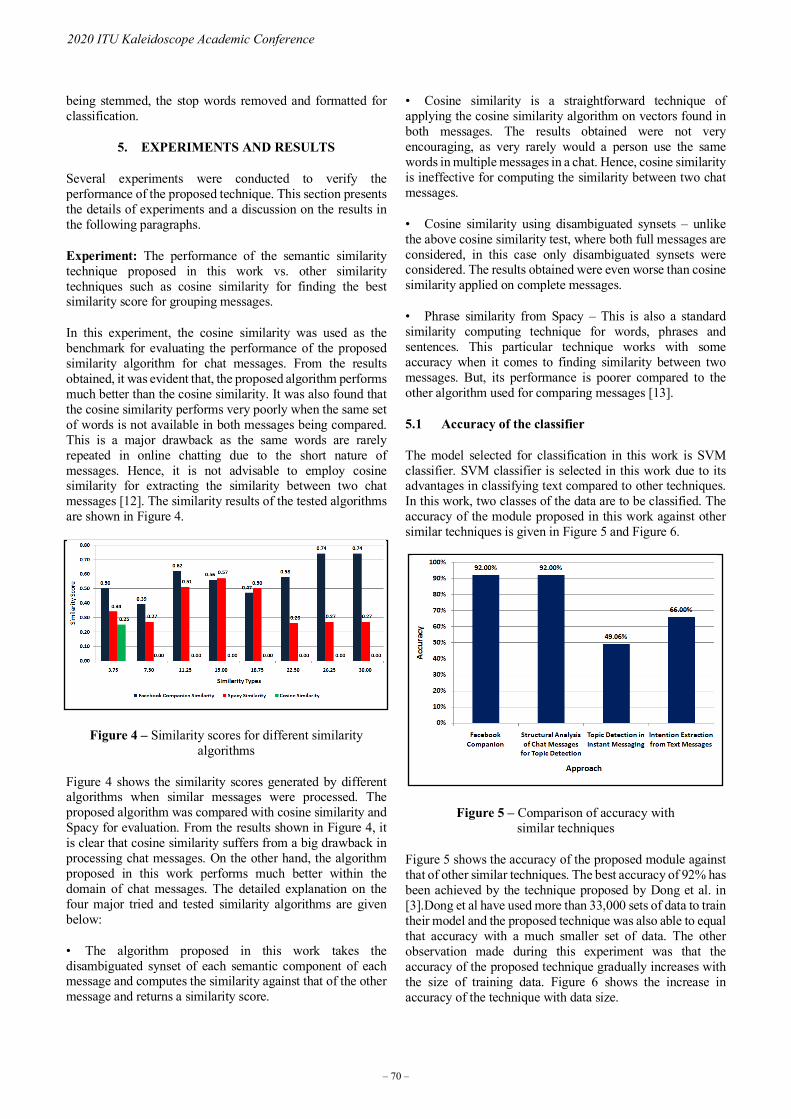
being stemmed, the stop words removed and formatted for classification.
5. EXPERIMENTS AND RESULTS
Several experiments were conducted to verify the performance of the proposed technique. This section presents the details of experiments and a discussion on the results in the following paragraphs.
Experiment: The performance of the semantic similarity technique proposed in this work vs. other similarity techniques such as cosine similarity for finding the best similarity score for grouping messages.
In this experiment, the cosine similarity was used as the benchmark for evaluating the performance of the proposed similarity algorithm for chat messages. From the results obtained, it was evident that, the proposed algorithm performs much better than the cosine similarity. It was also found that the cosine similarity performs very poorly when the same set of words is not available in both messages being compared. This is a major drawback as the same words are rarely repeated in online chatting due to the short nature of messages. Hence, it is not advisable to employ cosine similarity for extracting the similarity between two chat messages [12]. The similarity results of the tested algorithms are shown in Figure 4.
.
Figure 4 – Similarity scores for different similarity algorithms
Figure 4 shows the similarity scores generated by different algorithms when similar messages were processed. The proposed algorithm was compared with cosine similarity and Spacy for evaluation. From the results shown in Figure 4, it is clear that cosine similarity suffers from a big drawback in processing chat messages. On the other hand, the algorithm proposed in this work performs much better within the domain of chat messages. The detailed explanation on the four major tried and tested similarity algorithms are given below:
• The algorithm proposed in this work takes the disambiguated synset of each semantic component of each message and computes the similarity against that of the other message and returns a similarity score.
• Cosine similarity is a straightforward technique of applying the cosine similarity algorithm on vectors found in both messages. The results obtained were not very encouraging, as very rarely would a person use the same words in multiple messages in a chat. Hence, cosine similarity is ineffective for computing the similarity between two chat messages.
• Cosine similarity using disambiguated synsets – unlike the above cosine similarity test, where both full messages are considered, in this case only disambiguated synsets were considered. The results obtained were even worse than cosine similarity applied on complete messages.
• Phrase similarity from Spacy – This is also a standard similarity computing technique for words, phrases and sentences. This particular technique works with some accuracy when it comes to finding similarity between two messages. But, its performance is poorer compared to the other algorithm used for comparing messages [13].
5.1 Accuracy of the classifier
The model selected for classification in this work is SVM classifier. SVM classifier is selected in this work due to its advantages in classifying text compared to other techniques. In this work, two classes of the data are to be classified. The accuracy of the module proposed in this work against other similar techniques is given in Figure 5 and Figure 6.
Figure 5 – Comparison of accuracy with similar techniques
Figure 5 shows the accuracy of the proposed module against that of other similar techniques. The best accuracy of 92% has been achieved by the technique proposed by Dong et al. in [3].Dong et al have used more than 33,000 sets of data to train their model and the proposed technique was also able to equal that accuracy with a much smaller set of data. The other observation made during this experiment was that the accuracy of the proposed technique gradually increases with the size of training data. Figure 6 shows the increase in accuracy of the technique with data size.
– 70 –
2020 ITU Kaleidoscope Academic Conference
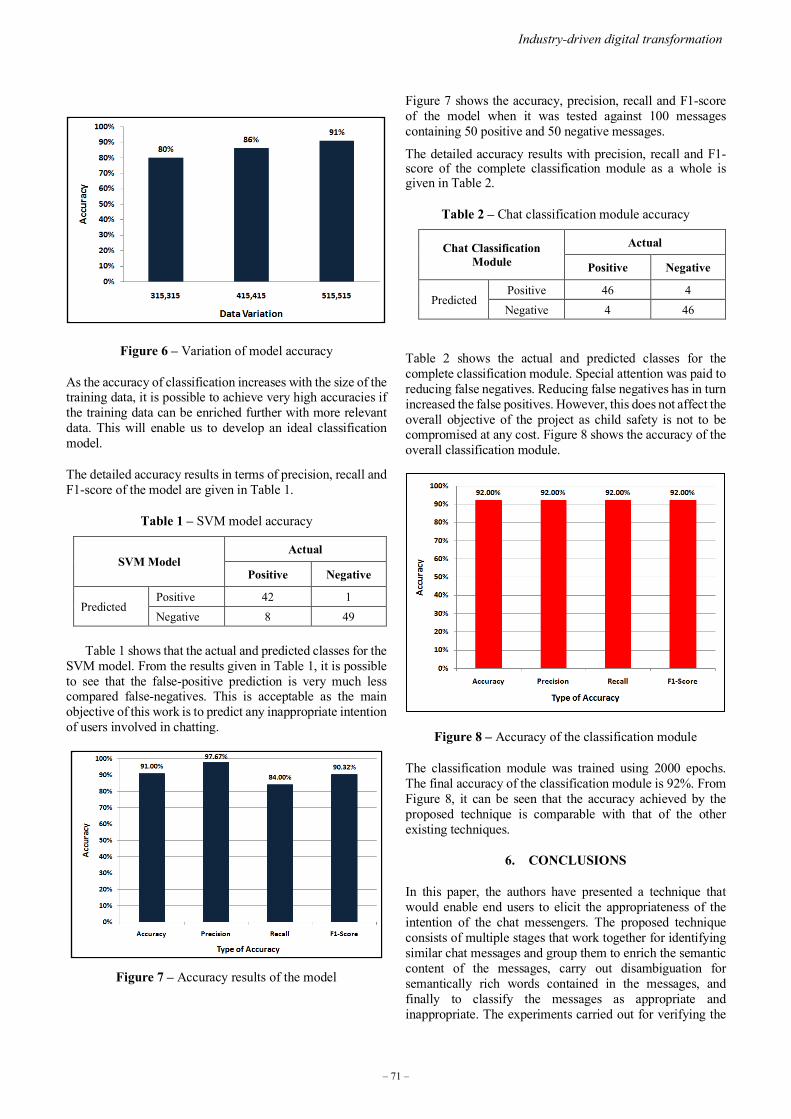
Figure 6 – Variation of model accuracy
As the accuracy of classification increases with the size of the training data, it is possible to achieve very high accuracies if the training data can be enriched further with more relevant data. This will enable us to develop an ideal classification model.
The detailed accuracy results in terms of precision, recall and F1-score of the model are given in Table 1.
Table 1 – SVM model accuracy
SVM Model Actual
Positive Negative
Predicted Positive 42 1 Negative 8 49
Table 1 shows that the actual and predicted classes for the SVM model. From the results given in Table 1, it is possible to see that the false-positive prediction is very much less compared false-negatives. This is acceptable as the main objective of this work is to predict any inappropriate intention of users involved in chatting.
Figure 7 – Accuracy results of the model
Figure 7 shows the accuracy, precision, recall and F1-score of the model when it was tested against 100 messages containing 50 positive and 50 negative messages.
The detailed accuracy results with precision, recall and F1-score of the complete classification module as a whole is given in Table 2.
Table 2 – Chat classification module accuracy
Chat Classification Module
Actual
Positive Negative
Predicted Positive 46 4 Negative 4 46
Table 2 shows the actual and predicted classes for the complete classification module. Special attention was paid to reducing false negatives. Reducing false negatives has in turn increased the false positives. However, this does not affect the overall objective of the project as child safety is not to be compromised at any cost. Figure 8 shows the accuracy of the overall classification module.
Figure 8 – Accuracy of the classification module
The classification module was trained using 2000 epochs. The final accuracy of the classification module is 92%. From Figure 8, it can be seen that the accuracy achieved by the proposed technique is comparable with that of the other existing techniques.
6. CONCLUSIONS
In this paper, the authors have presented a technique that would enable end users to elicit the appropriateness of the intention of the chat messengers. The proposed technique consists of multiple stages that work together for identifying similar chat messages and group them to enrich the semantic content of the messages, carry out disambiguation for semantically rich words contained in the messages, and finally to classify the messages as appropriate and inappropriate. The experiments carried out for verifying the
– 71 –
Industry-driven digital transformation

performance of the proposed techniques show that the proposed technique works better than the existing techniques in terms of efficiency as well as effectiveness in terms of accuracy.
It is suggested that the work presented in this paper can be further developed in the following directions.
• A better spell checker to be incorporated: A better anddedicated spelling mistake-handling component using an LSTM that is capable of capturing the phonetics, as well as the context, when understanding the words for translating them into English text.
• Multi-language support: A dedicated module can beimplemented that is capable of translating different languages into English and the normal procedure can continue to classify the messages as appropriate and inappropriate.
• Handling multiple coded texts: Sometimes users mixwords from multiple languages within the same message. A special module can be created that can detect the words from other languages but written using English script and translating them.
• Supporting graphics: A special module to handle imagesand videos to be developed.
• Detecting other fraudulent intentions: Improving thesystem to detect other types of fraudulent intentions including hate speech, promoting terrorism and financial and non-financial frauds.
REFERENCES
[1] T. Dodds, “Reporting with WhatsApp: Mobile chat applications’ impact on journalistic practices,” Digital Journalism, vol. 7, no. 6, pp. 725-745, 2019. doi: 10.1080/21670811.2019.1592693
[2] L. Cilliers and W. Chinyamurindi, “Perceptions of cyber bullying in primary and secondary schools among student teachers in the Eastern Cape Province of South Africa,” Electronic Journal of Information Systems in Developing Countries, vol. 86, no. 4, pp. 1-10, 2020. doi: 10.1002/isd2.12131
[3] H. Dong, S.C. Hui, and Y. He, “Structural analysis of chat messages for topic detection,” Online Information Review, vol.30 no.5, pp. 496-516, 2006. doi: 10.1108/14684520610706398.
[4] H. Zhang, C.D. Wang, and J.H. Lai, “Topic detection in instant messages,” 13th International Conference on Machine Learning and Applications, Detroit, MI, pp. 219-224, 2014. doi:10.1109/ICMLA.2014.41.
[5] F. Iqbal, B.C.M. Fung, M. Debbabi, R. Batool, and A. Marrington, “Wordnet-based criminal networks mining for cybercrime investigation,” IEEE Access, vol. 7, pp. 22740-22755, 2019. doi:10.1109/ACCESS.2019.2891694.
[6] I. Song, and J. Diederich, “Intention extraction from text messages,” International Conference on Neural Information Processing, Sydney, Australia, pp.330-337, 2010. doi:10.1007/978-3-642-17537-4-41.
[7] G. Inches, and F. Crestani, “Online conversation mining for author characterization and topic identification,” 4th Workshop on Information and knowledge Management for Ph.D. Students, Glasgow, UK, pp.19–26, 2011. doi:10.1145/2065003.2065009
[8] Y. Chen, Y. Yang, H. Zhang, H. Zhu and F. Tian, “A topic detection method based on semantic dependency distance and PLSA,” IEEE 16th International Conference on Computer Supported Cooperative Work in Design (CSCWD), Wuhan, China, pp. 703-708, 2012. doi:10.1109/CSCWD.2012.6221895.
[9] Nltk.org, “WordNet interface,” [online] Available at: http://www.nltk.org/howto/wordnet.html, Accessed on Jan 15, 2020.
[10] F. Pedregosa et al., “Scikit-learn: Machine learning in Python,” Journal of Machine Learning Research, vol.12, pp.2825-2830, 2011.
[11] L. Buitinck et al., “API design for machine learning software: Experiences from the scikit-learn project,” European Conference on Machine Learning and Principles and Practices of Knowledge Discovery in Databases, Prague, Czech Republic, pp.2825-2830, 2013.
[12] P.H. Adams, and C.H. Martell, “Topic detection and extraction in chat,” IEEE International Conference on Semantic Computing, Santa Clara, CA, USA, pp. 581-588, 2008. doi:10.1109/ICSC.2008.61.
[13] Anon, “Word vectors and semantic similarity,” [online] Available at: https://spacy.io/usage/vectors-similarity, Accessed on Jan 15, 2020.
– 72 –
2020 ITU Kaleidoscope Academic Conference

TOWARDS A DIGITAL PROCESS PLATFORMFOR FUTURE CONSTRUCTION SITES
Hans Aoyang Zhou1; Aymen Gannouni1; Thomas Otte1; Jonas Odenthal2; Anas Abdelrazeq1; Frank Hees1
1Institute of Information Management in Mechanical Engineering, RWTH Aachen University, Germany2Institute for Machine Elements and Systems Engineering, RWTH Aachen University, Germany
ABSTRACT
When it comes to digitalization, construction sites are stillat the beginning of an ongoing transformation process.Two major causes are the complexity of construction siteenvironments and the lack of interoperability between thedifferent actors, such as machines and site suppliers thatare involved in the construction project. This has directimplications on the efficiency, quality, and production timeof construction projects. Thus, there is a strong need to fillthis digitalization gap by considering the latest advancementsin the Internet of Things (IoT), as well as edge and cloudcomputing. In this paper, we suggest a data-driven approachfor construction sites, inwhichwe extract data frommachines,send it to a central data storage with scalable computationalresources and analyze it to improve the existing constructionprocesses. For that, we studied requirements of selectedconstruction site processes and designed a communicationarchitecture that scales with the complex characteristics ofreal-world applications. Additionally, we propose a digitalprocess platform that supports a wide range of users with theirdifferent roles on construction sites and builds the foundationfor further research, implementation, and evaluation ofaccording construction site innovations. With the proposedplatform framework, we extend the construction site towardsan integrated Cyber-Physical System (CPS) and contribute tothe standardization of communication infrastructures withinthe construction sector by merging different solutions fromthe area of information and communication technologies.
Keywords - construction site,data integration, digitalplatform, digitalization, scalable communication
infrastructure
1. INTRODUCTION
Current construction projects are often characterized bysegmented process chains with mosaiced contributions ofvarious disciplines participating on the construction site. Forexample, in a road construction project, different processsteps, such as material transportation, cement mixing, androad compaction are dependent from each other, but are oftenconducted by different companies, construction workers, ormachines with multiple resources. For these interconnectedprocesses, interfaces for information exchange and integrationare not yet standardized. This leads to an increase in projectcomplexity and thus complicates a precise estimation and
planning of the project scope. This results in delays, as wellas additional production costs and thus leads to limitationswith regard to the productivity and efficiency of the overallconstruction process.Widening the view towards the overall productivity ofconstruction processes in Germany, it can be observed thatthe labor productivity in the national construction sector hasincreased by less than five percent between 1991 and 2015,while the average increase over all economic sectors can beamounted to approx. 40 percent in the same period [1]. Westate the hypothesis, that this deficit can be partly assignedto a lack of digitalization in the construction sector, morespecifically regarding the involved production processes,compared to other industrial sectors such as manufacturing.Our point of view is supported by two studies that alsoconclude a digitalization deficit within the constructionindustry (cf. [2], [3]). The mentioned studies underline theindustrial relevance, as well as future economic developmentpotentials, with regard to the digitalization of constructionsites.On current construction sites, machines from differentmanufacturers and dynamically changing constraints, aswell as environment states form a complex CPS involvingcharacteristic features, such as, heterogeneous data (e.g.,sources, types) and interfaces (e.g., communicationstandards).In our researchwork, we develop amanufacturer-independentandmodular communication infrastructure in order to addressthe existing data and interface heterogeneity on constructionsites by making use of a technology mix consisting of edgecomputing, cloud computing, mobile communication, as wellas big data technologies in one common communicationinfrastructure for future construction sites. Furthermore,we develop a digital process platform in which the entiretyof working processes related to the construction site canbe depicted as digitalized construction processes includingmodules, such as, the site monitoring (e.g., progress,efficiency) or the process data analysis along with selectedreal-world use-cases.In this way, we integrate an entire data analysis processconsisting of the steps acquisition (on-site), collection(off-site), semantic integration (off-site), processing(off-site), as well as online visualization and analysis(off-site). The joint constellation of communicationinfrastructure and digital process platform serves as afoundation for the decision support of responsible actors on
978-92-61-31391-3/CFP2068P @ ITU 2020 Kaleidoscope – 73 –
site (e.g., machine operators), as well as off site (e.g., sitemanagement).In this paper, we contribute to these long-term research aimsby answering the following research questions:
1. What are initial and representative use cases for a digitalprocess platform in the context of future constructionsites? (see Section 3.1)
2. What kind of development approach facilitates the usecase based platform development? (see Section 3.2)
3. What are necessary components of a digital processplatform for future construction sites and how do theyinteract with each other? (see Section 3.3)
2. RELATED WORK
2.1 Digitalization of Construction Sites
The trend of an increase in digitalization by applyinginformation communication technologies (ICT) in theconstruction field is also reflected in the literature. Oneindicator is the increase of the scientific publication countwhere ideas of the paradigm of the fourth industrial revolution(Industry 4.0) are applied in the construction sector [4]. Inthis context, Ding et al. propose the concept of smart steelbridge construction, which envisions the usage of data-drivenmethods and model-based analytics to increase flexibility andefficiency over the whole construction life-cycle processes[5].Another idea, which originated in the context of Industry 4.0is the concept of a digital twin, which tries to mirror thebehavior of physical devices through sensor data. Boje etal. argue by reviewing the state-of-the-art application of theprocess of building information modeling (BIM) during theconstruction stage that a digital twin for construction sites isneeded. They propose that the first generation of a digital twinfor construction sites should consist of monitoring platformsthat could sense the physical world and executeminor analysisfunctionalities. [6]Within another review paper about the digital transformationin the construction sector, Woodhead et al. argue that IoTsolutions would not be generic and could only be appliedto certain use cases of research projects. The authorspropose that the integration of ICT into the environmentof construction sites needs to be accompanied with adefinition of communication and connection standards forall data-generating devices. In their work, they state that theprocess of identifying, accessing and exchanging data needsto be defined within norms and regulations. [7]Gadeke et al. propose an exemplary implementation ofa wireless sensor network for monitoring environmentalparameters like dust, noise, and vibration. They proposea solution, where emission data is respectively acquiredand transmitted via sensor units and nodes and afterwardintegrated into a central data storage for real-time evaluation.[8]The literature review shows that digitalization concepts ofthe construction site are usually bound to the use case in
their respective research project. This indicates that there isa lack of generic solutions with communication standards fordata exchange and integration. In this regard, we contributewith a communication architecture that can transfer, process,and integrate different data types and frequencies fromheterogeneous data sources.
2.2 Digital Platforms for Construction Sites
Within the literature, different concepts and prototypes ofdigital platforms for the usage within the construction fieldare described. One approach consists of a cloud-baseddata management framework, which integrates data fromconstruction site edge devices, government open weatherdata, and 3D BIM data. Within the proposed framework, thecollected data is visualized through a graphical user interface(GUI) accessible through desktop computers and hand-helddevices. [9]Another comparable approach uses radio frequencyidentification (RFID) technology to capture data from thecurrent construction site and visualizes the constructionprogress using 3D BIM data. Both platforms are developedin order to monitor the construction progress and support thedecision making process of construction site managers. [10]In comparison, other platform solutions in the literature focuson the support of construction workers. One example isa digital platform proposed by Zhao et al., which tracksconstruction workers and construction resources in real-time,in order to enhance the control of the construction process.The authors tested their platform in two construction projectsand identified bottlenecks, in which a share of working timewas wasted. They also propose to use their platform for safetycontrol, which warns construction site managers or workersin case a restricted area is entered. [11], [12]The research project AR4Construction aims to develop amobile-based digital platform for supporting constructionworkers by using augmented reality (AR) to overlay theconstruction site with process relevant information. In theproject, Schweigkofler et al. propose a framework that usesthe mobile device to capture the construction site througha camera and enhances it by the 3D model of the plannedbuilding. [13]Further digital platforms focus on the integration of machinedata. Within the research project SmartSite, the authorsdevelop a path planning system for compactors by using amulti-agent system approach in order to support operatorsto control their machinery [14]. Within the project scope,Kuenzel et al. envisioned a cloud-based platform, whichintegrates the data from the entire supply chain of asphaltroad construction [15].In another work, Skalecki et al. propose a cloud-based dataacquisition and process control system for concrete pavementconstruction. The authors developed a process data model,which captures the relationships within the entities of theconcrete pavement process. In their experimental setup, thedata model was verified by gathering, synchronizing, andprocessing the data from a real construction site. [16]Based on our review, we conclude that the majority of
– 74 –
2020 ITU Kaleidoscope Academic Conference
digital platforms focus on one particular user group (e.g., sitemanager or construction worker). Especially, the processingand analysis of machine data within a platform is coveredsporadically within the related work and often realized ona conceptual level. With our digital process platform, wesupport multiple user groups and implement the integrationof machine data.
2.3 Hardware and Communication InfrastructureComponents
Within our communication infrastructure, varioustechnological concepts and components are used. Oneimportant aspect with regard to our proposed communicationinfrastructure are the paradigms edge and cloud computing.A state-of-the-art review about edge and cloud computingcan be found in references [17–21]. Furthermore, differentcommunication infrastructure designs and architectures forCPS outside of the construction sector are reviewed in [22]and [23]. Another aspect of our proposed communicationinfrastructure deals with the topic of data integration. Kadadiet al. [24] discuss the importance and challenges of dataintegration in the context of big data, which results fromits heterogeneous nature. In a similar context, the reviewpaper from Zheng [25] summarizes different methods of datafusion, which try to semantically align different data typesfrom heterogeneous data sources and domains in order toextract knowledge from the gathered data.Our proposed communication architecture also aims toprovide the basis for an efficient machine-to-machinecommunication. In this regard, state-of-the-artcommunication architectures, future challenges andopportunities for machine-to-machine communication arepresented in [26–28]. Within the context of machinecommunication, the controller area network (CAN) standardis the primary machine data source and further reading canbe found in [29]. In addition, the topic of CAN-Bus securityis discussed in [30] and [31].Our proposed communication infrastructure applies differentstate-of-the-art information communication technologies inthe construction sector.
3. DIGITAL PROCESS PLATFORM
3.1 Infrastructure Requirements & Use Cases
For the development of the digital process platform, we splitthe requirements into two main parts. The first part consistsof on-site requirements that originate from constructionsite processes and result in requirements regarding thecommunication infrastructure. For this part, we examinedthe complete road construction site process for relevantmachine data. We concluded, on the one hand, that therelevant data (e.g., machine velocity, fuel tank level) varyin type, frequency, and quality. On the other hand, weidentified that various process relevant data is not availablefrom the machine and conclude that external data sourcesare necessary. Therefore, the communication infrastructureneeds to enable a machine-independent and scalable data
transmission between machines, external sensors, and acentral digital process platform. The communicationinfrastructure needs to be able to process, transmit, and saveheterogeneous data types at different frequencies and ideallywith low latencies. Also, the security and robustness ofthe communication infrastructure need to be ensured. Thecommunication infrastructure is dependent on the availablecommunication technology and the provided machinery andedge devices.The second part consists of off-site requirements for designingthe digital process platform. This set of requirements is basedon use cases, which specify the intended use of our platformand support the needs of the target users. For the definitionof these use cases, we identified the three following users:
1. The construction worker, who needs to receivethe necessary information about the tasks assignedin combination with additional information abouttask-specific machines and equipment.
2. The site manager, who monitors the quality of allconstruction site processes, assigns the personnel to therespective tasks and is furthermore responsible for thesafety of the construction workers, as well as the securityof the construction site.
3. The site administrator, who provides the necessaryIT knowledge and support. In addition, he ensures thefunctionality and security of the data collection, transfer,and integration process.
Based on the users and their respective roles within aconstruction project, we developed three initial use cases asa starting point for further development of the digital processplatform. The first use case, static geofencing, focuses onthe aspects of safety and security within the construction site.The goal of the use case is to increase the secure utilization ofconstruction machines and to reduce the number of accidentson the construction site. The core functionality of the usecase is to locate the machines within the construction site andto compare them with restricted areas (geofences).The second use case, temperature monitoring, aims toimprove the quality control of construction processes. Bymonitoring and visualizing engine temperature profiles, wegive the site manager the decision basis to adapt machineworking processes according to the operating temperature.This results in higher operating efficiency and preventsoverheating.The third use case, process planning, focuses on the aspectof project management. The goal of the use case is tosupport the site manager with the planning process of theconstruction project and the monitoring of the constructionprogress. The use case allows the site manager to defineprocesses, milestones, and tasks. By defining a task, ourdigital process platform automatically notifies the responsibleconstruction worker about the task and necessary machines,as well as additional equipment.For each use case, we developed a use case diagram. Asan example, Figure 1 shows the use case diagram forstatic geofencing. The main users in this use case are the
– 75 –
Industry-driven digital transformation

Digital Process PlatformStatic Geofencing
definerestricted
area
send warningsignal to user
detectmachineposition
compare machineposition with
restricted area
<<extend>>machine position iswithin restricted area
<<include>>
<<extend>>No restricted area defined
Site Manager
Construction Worker
Figure 1 – Use case diagram for static geofencing.
site manager and the construction worker. With the helpof the proposed digital process platform, the constructionworker can define a restriction area where specific machinesare not allowed to enter. In case a construction machineenters a restricted area, the site manager and the responsibleconstruction worker, receive a warning from the system.
3.2 Software Development Process
The use case based development process of our proposeddigital process platform consists of five development steps.In the first step, we developed use cases as described beforein Section 3.1. With the definition of the use cases, the mainstakeholders, goals, and functionalities of the platform andintended user interactions are specified. This user-centeredapproach ensures that the development of the platform focuseson the needs of the user and supports him in his role withinthe construction project.In the second step, we analyzed the use cases andderived typical functionalities and sequences of the digitalprocess platform, which leads to a collection of functionalrequirements. These requirements are implemented in thethird step. The implementation process is done in anagile manner in the form of development sprints. At the
beginning of a sprint, we exactly specifywhich functionalitieswe want to implement during the sprint. At the end ofthe sprint, the implemented results are reviewed and theprogress is discussed and documented. The benefits ofthis agile approach lie in the control and flexibility of theimplementation process. On the one hand, we can focus theimplementation process on use case relevant functionalities.On the other hand, the required changes that resulted fromfalse assumptions or changing constraints can be conducted.After the implementation phase, the functionalities arevalidated based on the requirements defined in the secondstep. If all requirements of a use case are fulfilled, theimplemented functionalities are tested by applying the usecase. If the implemented system behaves as expected in theuse case, the status of implementation is released. Otherwise,a new cycle from steps 2 to 4 is executed.
3.3 Platform Components and Modules
In this section, we take a closer look at the communicationinfrastructure, which consists of six system components. Onthe one hand, there is on site, where machines send their datausing mounted edge devices. On the other hand, there isoff site, which consists of multiple modules to semanticallyprocess the machine data. Figure 2 gives an overview aboutthe proposed communication infrastructure.The edge devices consist of industrial computers that areconnected to the CAN-Bus of the machines. It is alsopossible to integrate other external sensors on the edgedevice. The CAN-Bus sends data in raw byte codeand needs to be converted into a human-readable form.Interpretation files such as DataBase CAN (DBC) files,which are ASCII-based and used for identifying, scaling,and offsetting the CAN-frames are one possible solution totranslate the raw CAN-Data into an understandable format.The read and interpreted data are then sent to the off-siteside using mobile communication technology to the ingestioncomponent (e.g., via 4G). This component has differentmessage brokers that ensure the forwarding of the incomingmessages to their corresponding destinations. The proposed
Figure 2 – Communication infrastructure
– 76 –
2020 ITU Kaleidoscope Academic Conference

Figure 3 – Digital platform user interface
platform uses different types of message brokers, i.e.RabbitMQ [32] and Kafka [33].Afterwards, the data is forwarded to the data lake, whichconsists of hot and cold storage for short-term, as well aslong-term, savings of the data respectively, i.e. Cassandra[34] and mongoDB [35]. Some data, i.e. machine positionscan be directly sent to web clients using WebSockets.Additionally, there is the data analysis component, whichconsists of a set of services for analyzing the data supportedby machine learning approaches. This component aims atproviding different utilities from historical data analysis tolive monitoring. Moreover, it allows a behavior analysis ofmachines in comparison to simulation models and digitaltwins.The job controller is at the core of the communicationinfrastructure. This module aims to manage different queriesand application programming interface (API) calls betweenall the other components of the infrastructure.Finally, the digital process platform represents the maininterface between the user and the system. The platformenables the user to interact with real-world use cases ofconstruction sites. The whole off-site side is hosted onKubernetes, an open-source container-orchestration tool fordeploying, managing, and scaling of containers and services.A container is a software package that encapsulates all itsdependencies and can be deployed in different environments.Here, the suggested platform relies on Docker containers.Figure 3 shows a mock-up of the user interface in the digitalprocess platform. In the top navigation bar, represented ingreen (1), the user can check messages from other users, andnotifications from the system. The user can also access hisprofile, set his preferences, and log out when needed. Inthe left menu bar, represented in blue (2), the user has anoverview of the supported use cases, as well as the individualcomponent in the system.The main user interaction interface is represented in yellow(3). Here, each use case has a predefined view that providesthe user with the corresponding functionalities. For instance,
in the case of the geofencing use case, the machine positionsare visualized in the main view component on a map, wherethe user can define geofences and assign machines to these.In case a non-allowed machine enters a geofence, the userreceives a warning notification and the incident is saved in ageofence incident report.
4. CONCLUSION AND OUTLOOK
4.1 Conclusion
In this paper, we presented a data-driven approach for thedigitalization of construction sites. For this, the requirementsof today’s settings have been analyzed and considered inorder to address the existing gap of interoperability betweendifferent actors on current construction sites. Moreover, ourapproach helps to increase the productivity and efficiencyin construction processes thanks to various functionalities,such as live monitoring or process analysis. Certainly,data privacy, data governance, and the security of machinenetworking constitute an important topic for both machinemanufacturers and platform users.We agree with the examined literature that building digitalinfrastructures are essential for many industry sectors tothrive. Here, our current approach can be extended toother industrial applications, such as farming machines inagriculture. Our proposed digital process platform shows afirst approach towards a digital construction site by providingthe necessary data processing pipeline from data acquisitionover data transfer to data integration and visualization.
4.2 Outlook
For the future, onemajor goal is the integration of digital twinsfor construction machines into the digital process platform.In this regard, we plan to develop simulation models thatmake it possible to generate additional data on productivity,efficiency, and machine condition adding to the sensor dataof the real machines, which cannot be measured on the
– 77 –
Industry-driven digital transformation

machines. This additional data can then also be visualizedand analyzed in the process platform and used to derivefurther insights for improving construction processes, as wellas machines.In addition, we plan to integrate the digital process platforminto a reference construction site that will mainly be used totest innovative road construction technologies and automationsolutions in a realistic construction environment. Through theapplication and testing of real-world construction scenarioswith different construction machines, we plan to furtherevaluate our proposed digital process platform. Depending onfuture construction scenarios, newuse caseswill be integratedand realized within our platform, e.g. the usage of 5G mobilecommunication technology for an automated constructionmachine control.
ACKNOWLEDGEMENTS
The authors would like to thank the European RegionalDevelopment Fund (ERDF) and the federal state ofNorth-Rhine Westphalia (NRW) in Germany for thefunding of the project FutureSite under the project codeEFRE-0500050.
REFERENCES
[1] Bundesministerium für Wirtschaft undEnergie. Schlaglichter der wirtschaftspolitik– monatsbericht oktober 2017, 2017.Available : https://www.bmwi.de/Redaktion/DE/Downloads/Monatsbericht/Monatsbericht-Themen/2017-10-4-produktivitaet-in-deutschland.pdf?__blob=publicationFile&v=6, Last access: 18.06.2020.
[2] Rajat Agarwal, Mukund Sridhar, and ShankarChandrasekaran. Imagining construction’s digital future| mckinsey, 2016. Available : https://www.mckinsey.com/industries/capital-projects-and-infrastructure/our-insights/imagining-constructions-digital-future,Last access: 21.06.2020.
[3] Kai-Stefan Schober, Philipp Hoff, and KonstantinSold. Digitization in the construction industry,2016. Available : https://www.rolandberger.com/publications/publication_pdf/tab_digitization_construction_industry_e_final.pdf, Last access:21.06.2020.
[4] Raihan Maskuriy, Ali Selamat, Kherun Nita Ali, PetraMaresova, and Ondrej Krejcar. Industry 4.0 forthe construction industry—how ready is the industry?Applied Sciences, 9(14):2819, 2019.
[5] Kai Ding, He Shi, Jizhuang Hui, Yongjian Liu, BinZhu, Fuqiang Zhang, and Wei Cao. Smart steel bridgeconstruction enabled by bim and internet of things inindustry 4.0: A framework. In ICNSC 2018, pages 1–5,Piscataway, NJ, 2018. IEEE.
[6] Calin Boje, Annie Guerriero, Sylvain Kubicki, andYacine Rezgui. Towards a semantic construction digital
twin: Directions for future research. Automation inConstruction, 114:103179, 2020.
[7] Roy Woodhead, Paul Stephenson, and Denise Morrey.Digital construction: From point solutions to iotecosystem. Automation in Construction, 93:35–46,2018.
[8] Tobias Gädeke, Frank Hartmann, Lukasz Niestoruk,Markus Reinhardt, and Wilhelm Stork. Real-timeenvironmental emission monitoring on constructionsites. In J. J. Soraghan, editor, 2014 6thEuropean Embedded Design in Education and ResearchConference (EDERC), pages 292–296, Piscataway, NJ,2014. IEEE.
[9] Chiu-Ming Lee, Wei-Liang Kuo, Tzu-Jan Tung, Bo-KaiHuang, Shu-Hsiang Hsu, and Shang-Hsien Hsieh.Government open data and sensing data integrationframework for smart construction site management.In Mohamed Al-Hussein, editor, Proceedings of the36th International Symposium on Automation andRobotics in Construction (ISARC), Proceedings of theInternational Symposium on Automation and Roboticsin Construction (IAARC). International Association forAutomation and Robotics in Construction (IAARC),2019.
[10] Clyde Zhengdao Li, Fan Xue, Xiao Li, JingkeHong, and Geoffrey Qiping Shen. An internetof things-enabled bim platform for on-site assemblyservices in prefabricated construction. Automation inConstruction, 89:146–161, 2018.
[11] Ming Zhao, Arun Kumar, Tapani Ristaniemi, and PeterHan Joo Chong. Machine-to-machine communicationand research challenges: A survey. Wireless PersonalCommunications, 97(3):3569–3585, 2017.
[12] Jianyu Zhao, Jinyue Zhang, and Olli Seppänen.Real-time tracking for intelligent construction siteplatform in finland and china: Implementation, dataanalysis and use cases. ISARC Proceedings, pages62–68, 2019.
[13] Alice Schweigkofler, Gabriele Pasetti Monizza,Erdal Domi, Andrei Popescu, Julia Ratajczak,Carmen Marcher, Michael Riedl, and Dominik Matt.Development of a digital platform based on theintegration of augmented reality and bim for themanagement of information in construction processes.In Paolo Chiabert, Abdelaziz Bouras, Frédéric Noël,and José Ríos, editors, Product Lifecycle Managementto Support Industry 4.0, volume 540 of IFIP Advancesin Information and Communication Technology, pages46–55. Springer International Publishing, Cham, 2018.
[14] Robin Kuenzel, Marcus Mueller, Jochen Teizer,and Alexander Blickle. Smartsite: Intelligent andautonomous environments, machinery, and processesto realize smart road construction projects. ISARCProceedings, pages 1–9, 2015.
– 78 –
2020 ITU Kaleidoscope Academic Conference

[15] Robin Kuenzel, Jochen Teizer, Marcus Mueller,and Alexander Blickle. Smartsite: Intelligent andautonomous environments, machinery, and processesto realize smart road construction projects. Automationin Construction, 71:21–33, 2016.
[16] Patric Skalecki, Sabrina Rechkemmer, and OliverSawodny. Process and data modeling for systemintegration – towards smart concrete pavementconstruction. In 2020 IEEE/SICE InternationalSymposium on System Integration (SII), pages1248–1253, 2020.
[17] Nasir Abbas, Yan Zhang, Amir Taherkordi, and TorSkeie. Mobile edge computing: A survey. IEEE Internetof Things Journal, 5(1):450–465, 2018.
[18] Arif Ahmed and Ejaz Ahmed. A survey on mobileedge computing. In S. Smys, editor, Proceedings of the10th International Conference on Intelligent Systemsand Control (ISCO’16), pages 1–8, Piscataway, NJ,2016. IEEE.
[19] Yuyi Mao, Changsheng You, Jun Zhang, KaibinHuang, and Khaled B. Letaief. A surveyon mobile edge computing: The communicationperspective. IEEE Communications Surveys &Tutorials, 19(4):2322–2358, 2017.
[20] Weisong Shi, Jie Cao, Quan Zhang, Youhuizi Li, andLanyu Xu. Edge computing: Vision and challenges.IEEE Internet of Things Journal, 3(5):637–646, 2016.
[21] Chaowei Yang, Qunying Huang, Zhenlong Li, Kai Liu,and Fei Hu. Big data and cloud computing: innovationopportunities and challenges. International Journal ofDigital Earth, 10(1):13–53, 2017.
[22] Husheng Li, Aleksandar Dimitrovski, Ju Bin Song,Zhu Han, and Lijun Qian. Communicationinfrastructure design in cyber physical systems withapplications in smart grids: A hybrid systemframework. IEEE Communications Surveys & Tutorials,16(3):1689–1708, 2014.
[23] Md Masud Rana and Rui Bo. Iot-based cyber-physicalcommunication architecture: challenges and researchdirections. IET Cyber-Physical Systems: Theory &Applications, 5(1):25–30, 2020.
[24] Anirudh Kadadi, Rajeev Agrawal, ChristopherNyamful, and Rahman Atiq. Challenges of dataintegration and interoperability in big data. In JimmyLin, editor, IEEE International Conference on Big Data(Big Data), 2014, pages 38–40, Piscataway, NJ, 2014.IEEE.
[25] Yu Zheng. Methodologies for cross-domain datafusion: An overview. IEEE Transactions on Big Data,1(1):16–34, 2015.
[26] Yang Cao, Tao Jiang, and Zhu Han. A survey ofemerging m2m systems: Context, task, and objective.IEEE Internet of Things Journal, 3(6):1246–1258,2016.
[27] Jianyu Zhao, Hylton Olivieri, Olli Seppanen, AnttiPeltokorpi, Behnam Badihi, and Pontus Lundstrom.Data analysis on applying real time tracking inproduction control of construction. In 2017 IEEEInternational Conference on Industrial Engineering &Engineering Management, pages 573–577, Piscataway,NJ, 2017. IEEE.
[28] Oluwatosin Ahmed Amodu and Mohamed Othman.Machine-to-machine communication: An overview ofopportunities. Computer Networks, 145:255–276, 2018.
[29] Marco Di Natale, Haibo Zeng, Paolo Giusto, andArkadeb Ghosal. Understanding and Using theController Area Network Communication Protocol:Theory and Practice. Springer, New York, 2012.
[30] Mehmet Bozdal, Mohammad Samie, Sohaib Aslam,and Ian Jennions. Evaluation of can bus securitychallenges. Sensors (Basel, Switzerland), 20(8), 2020.
[31] Siti-Farhana Lokman, Abu Talib Othman, andMuhammad-Husaini Abu-Bakar. Intrusion detectionsystem for automotive controller area network (can)bus system: a review. EURASIP Journal on WirelessCommunications and Networking, 2019(1), 2019.
[32] RabbitMQ. https://www.rabbitmq.com/, Last access:08.10.2020.
[33] Apache Kafka. https://kafka.apache.org/, Last access:08.10.2020.
[34] Apache Cassandra. https://cassandra.apache.org/, Lastaccess: 08.10.2020.
[35] MongoDB. https://www.mongodb.com/, Last access:08.10.2020.
– 79 –
Industry-driven digital transformation


SESSION 5
AUGMENTED REALITY AND TOURISM
S5.1 An immersive mobile application for improved learning and virtual tour experience: A nature reserve perspective
S5.2 Self-guided virtual tour using augmented reality


AN IMMERSIVE MOBILE APPLICATION FOR IMPROVED LEARNING AND VIRTUAL TOUR EXPERIENCE: A NATURE RESERVE PERSPECTIVE
Carmenita Oersen; Ruchen Wyngaard; Lebogang Nkabinde
University of Western Cape
ABSTRACT
The purpose of this study was to develop an immersive
virtual reality application for the University of Western
Cape’s nature reserve in South Africa. For this focus on a
nature reserve project, the project team was requested to
build a self-guided tour capable of achieving knowledge
transfer, and which has aesthetic pleasure. The study was
informed by the peculiar challenge of the nature reserve and
existing literature to identify gaps that may occur in the body
of knowledge. The scrum project methodology was used to
manage the life cycle of the project. The application was
successfully built within the given time frame and the
client’s feedback was overwhelmingly positive.
Keywords – 4IR, immersive technology, nature reserve, self-guided tour
1. INTRODUCTION
The university’s Department of Computer Science in conjunction with the nature reserve has embarked on developing a project. The aim of this project is to develop immersive mobile applications to enable users to remotely access educational content that would otherwise be rather costly to experience, and engage in knowledge transfer that is equivalent, or if possible better, than in-field trips.
1.1 Rationale for Nature Reserve Project
The nature reserve is currently under-resourced and unable to offer nature reserve tours to a large number of students and visitors. Moreover, the reserve is only able to offer tours once weekly, due to manpower constraints. The nature reserve has a need to showcase appropriate content and carry over necessary skills, while simultaneously ensuring that learning remains a meaningful and enjoyable experience to visitors. The reason for this is to encourage mindfulness of the entire reserve environment and, establish a positive attitude towards the natural biodiversity, inspire formal education especially of conservation, and ultimately conserve the natural lowland systems. The adoption of immersive technologies for self-guided field tours is particularly useful when developing applications of this nature since it enhances visualization and encourages ecological protection while investing in biodiversity [1]. Virtual reality (VR) field tours
are envisioned to produce a realistic and immersive environment developed to encourage exploration among users [2]. Moreover, the reality of the challenges from the COVID-19 pandemic has also created a further need to adopt technological and self-guided solutions that can help the nature reserve stay relevant and ahead of the COVID-19 constraints. Hence, the motivation for this project.
1.2 Objectives for the Nature Reserve Project
The university's nature reserve aim was to build a virtual self-tour application. The virtual tour was anticipated to function as a base for ecological training, environmental education, research and aesthetic activities. One of the greatest projected aims was to preserve the integrity and physical characteristics of the nature reserve while also affording visitors the opportunity to experience the original nature reserve’s endangered vegetation.
This project has documented several requirements listed by the client while developing a VR tour experience. The virtual tour offered users the ability to traverse an immersive experience in which users are able to explore a 3D rendered environment of the nature reserve. While traversing the reserve, users were able to interact with points of interest and gain insight into several plant and animal specimens often found throughout the nature reserve. The goal was to develop a VR simulation to replicate the experience of the actual tour. Other objectives for this project included: a virtual presence to give specimens and nature reserve specific information, and the ability to move back and forth between various points of interest as the user desires.
The remaining part of the paper is organized as follows: Section 2 presents the literature review, while Section 3 documents the research design and methodology. The results are in Section 4, with the discussion held in Section 5. The paper finishes off with the Conclusion in Section 6, followed by a list of references.
2. LITERATURE REVIEW
2.1 Overview
Virtual reality as a teaching aid has been praised for enhancing higher education in several ways [3]. Being a
978-92-61-31391-3/CFP2068P @ ITU 2020 Kaleidoscope – 83 –
developing country, South Africa is faced with challenges such as infrastructural and human resource shortages, particularly within the science, technology, engineering and mathematics (STEM) disciplines. This can be owed to several reasons which include resource constraints encountered by higher education [4]. Technology driven education enables distant learning to be adopted while simultaneously allowing educational institutions to alleviate resources.
STEM disciplines frequently entail an abstract understanding of intricate structures. For example, in geology, geologists must be able to convey an understanding of the numerous characteristics of structural materials. Domains such as these call for an immersive experience, which is imperative for experiential learning to occur. Currently this may be hard to facilitate when using traditional means of instruction, even with the adoption of existing e-learning tools [5]. However, the adoption of immersive technologies shows promise in helping to mitigate some of the existing challenges, such as the ability to allow users to experience real-life scenarios and exercise problem solving techniques in high-fidelity environments where learning occurs through making errors in a safe space. Fabris et al. states that this is active learning, a teaching style which clearly has a significant impact on student learning [6].
Human resources are also alleviated as a result of using immersive technologies for instruction. Dede [7] notes a number of benefits when using immersive interfaces, including enhanced situated learning in an immersive environment. Dalgarno and Lee [8] identified increased engagement as an additional benefit. Coulter et al., [9] posits that enhanced knowledge acquisition is yet another core benefit of teaching in immersive environments. To add to this, the learning benefits are greater when the interface of an immersive virtual environment allows the user to investigate, assemble and manipulate 3D virtual objects and structures using a natural interface [8].
The educational affordance of immersive virtual technologies play an imperative role in providing effective learning benefits. The use of immersive virtual reality technologies as an instruction aid provides students with authentic real world scenarios that may be hard and expensive to replicate in the real world. For example, students could traverse 3D replicated environments without having to be concerned about the harmful implications [10]. It is not the immersive technology itself, but rather the affordance of these technologies that have a direct impact on the learning benefits [8]. Simply put, it is the learning activities within the virtual environment that may result in enhanced learning outcomes to occur.
In this section we covered the literature related to immersive technologies as a teaching and learning aid. In the next section, we relate the literature to justify the rationale of the individual project.
2.2 Virtual Reality in Nature Reserve
Virtual tours offer many benefits for self-guided tours in nature reserves. A study undertaken by Dolphin et al. [11] revealed that students found virtual field trips advantageous in that they were more versatile and convenient than actual field trips. The aim of the study was to determine whether or not there was a notable increase in engagement and knowledge transfer when compared to traditional means of instruction, such as actual field trips. And with new advancements in technologies such as 3D modeling software, there are now many opportunities for developers to design interactive content and simulations [12]. The following section describes existing work related to the use of VR to enable users to perform self-guided tours remotely.
2.2.1 Venture to the Peruvian Amazon
The Queensland University of Technology (QUT) deployed researchers to the Peruvian Amazon to assist in the conservation of the jaguar population [13]. The aim of the research was to use VR technology, which included 360° cameras and 3D modeling tools, to recreate the jaguar habitat and their surrounding ecosystem. The application includes interactive content to create awareness of the jaguar species.
2.2.2 Virtual Human Interaction Lab (VHIL)
VHIL developed a short documentary and interactive virtual reality content pertaining to the problem surrounding ocean acidification and the excess of CO2 in the atmosphere and its impact on ocean waters and marine life [14]. In conjunction with the development of the content, researchers from Stanford were responsible for developing a virtual imitation of the coral reef surrounding the Italian coast. Using a virtual reality head-mounted display users are able to interact with and explore the coral reef to learn more about the habitat.
2.3 Review Remark
The aim of this literature review was to investigate similar applications like those proposed by this study in order to identify any gaps in the body of knowledge that this study aims to fill. With virtual reality being in its infancy, it is rather evident that literature pertaining to studies and related work done with virtual reality is quite limited.
3. RESEARCH DESIGN AND METHODOLOGY
3.1 Methodology
This project subscribes to a single methodology, namely the Scrum methodology. Schwalbe [15] describes this methodology as the most commonly adopted agile methodologies for completing complex information technology projects with innovative scopes. To successfully adopt the Scrum methodology, there are processes that must be adhered to. First a product backlog is created outlining the desired features that must be included in the end product or software. These features or deliverables are then assigned to
– 84 –
2020 ITU Kaleidoscope Academic Conference
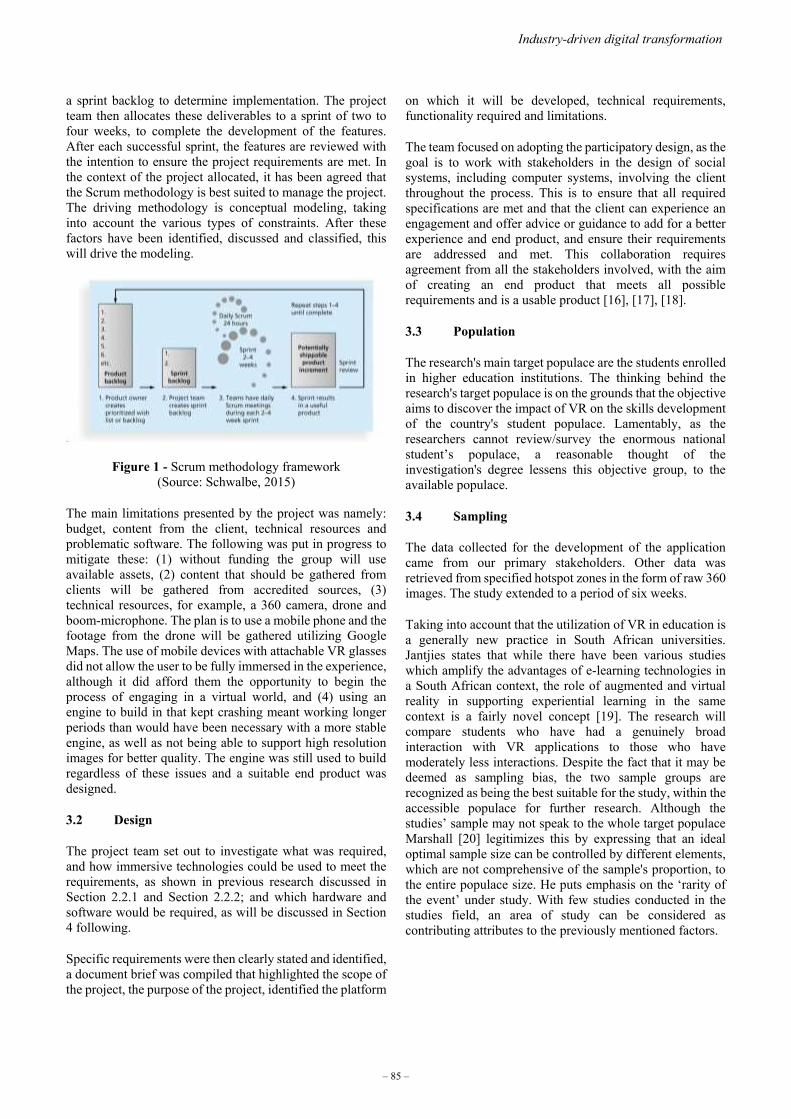
a sprint backlog to determine implementation. The project team then allocates these deliverables to a sprint of two to four weeks, to complete the development of the features. After each successful sprint, the features are reviewed with the intention to ensure the project requirements are met. In the context of the project allocated, it has been agreed that the Scrum methodology is best suited to manage the project. The driving methodology is conceptual modeling, taking into account the various types of constraints. After these factors have been identified, discussed and classified, this will drive the modeling.
Figure 1 - Scrum methodology framework (Source: Schwalbe, 2015)
The main limitations presented by the project was namely: budget, content from the client, technical resources and problematic software. The following was put in progress to mitigate these: (1) without funding the group will use available assets, (2) content that should be gathered from clients will be gathered from accredited sources, (3) technical resources, for example, a 360 camera, drone and boom-microphone. The plan is to use a mobile phone and the footage from the drone will be gathered utilizing Google Maps. The use of mobile devices with attachable VR glasses did not allow the user to be fully immersed in the experience, although it did afford them the opportunity to begin the process of engaging in a virtual world, and (4) using an engine to build in that kept crashing meant working longer periods than would have been necessary with a more stable engine, as well as not being able to support high resolution images for better quality. The engine was still used to build regardless of these issues and a suitable end product was designed.
3.2 Design
The project team set out to investigate what was required, and how immersive technologies could be used to meet the requirements, as shown in previous research discussed in Section 2.2.1 and Section 2.2.2; and which hardware and software would be required, as will be discussed in Section 4 following.
Specific requirements were then clearly stated and identified, a document brief was compiled that highlighted the scope of the project, the purpose of the project, identified the platform
on which it will be developed, technical requirements, functionality required and limitations.
The team focused on adopting the participatory design, as the goal is to work with stakeholders in the design of social systems, including computer systems, involving the client throughout the process. This is to ensure that all required specifications are met and that the client can experience an engagement and offer advice or guidance to add for a better experience and end product, and ensure their requirements are addressed and met. This collaboration requires agreement from all the stakeholders involved, with the aim of creating an end product that meets all possible requirements and is a usable product [16], [17], [18].
3.3 Population
The research's main target populace are the students enrolled in higher education institutions. The thinking behind the research's target populace is on the grounds that the objective aims to discover the impact of VR on the skills development of the country's student populace. Lamentably, as the researchers cannot review/survey the enormous national student’s populace, a reasonable thought of the investigation's degree lessens this objective group, to the available populace.
3.4 Sampling
The data collected for the development of the application came from our primary stakeholders. Other data was retrieved from specified hotspot zones in the form of raw 360 images. The study extended to a period of six weeks.
Taking into account that the utilization of VR in education is a generally new practice in South African universities. Jantjies states that while there have been various studies which amplify the advantages of e-learning technologies in a South African context, the role of augmented and virtual reality in supporting experiential learning in the same context is a fairly novel concept [19]. The research will compare students who have had a genuinely broad interaction with VR applications to those who have moderately less interactions. Despite the fact that it may be deemed as sampling bias, the two sample groups are recognized as being the best suitable for the study, within the accessible populace for further research. Although the studies’ sample may not speak to the whole target populace Marshall [20] legitimizes this by expressing that an ideal optimal sample size can be controlled by different elements, which are not comprehensive of the sample's proportion, to the entire populace size. He puts emphasis on the ‘rarity of the event’ under study. With few studies conducted in the studies field, an area of study can be considered as contributing attributes to the previously mentioned factors.
– 85 –
Industry-driven digital transformation
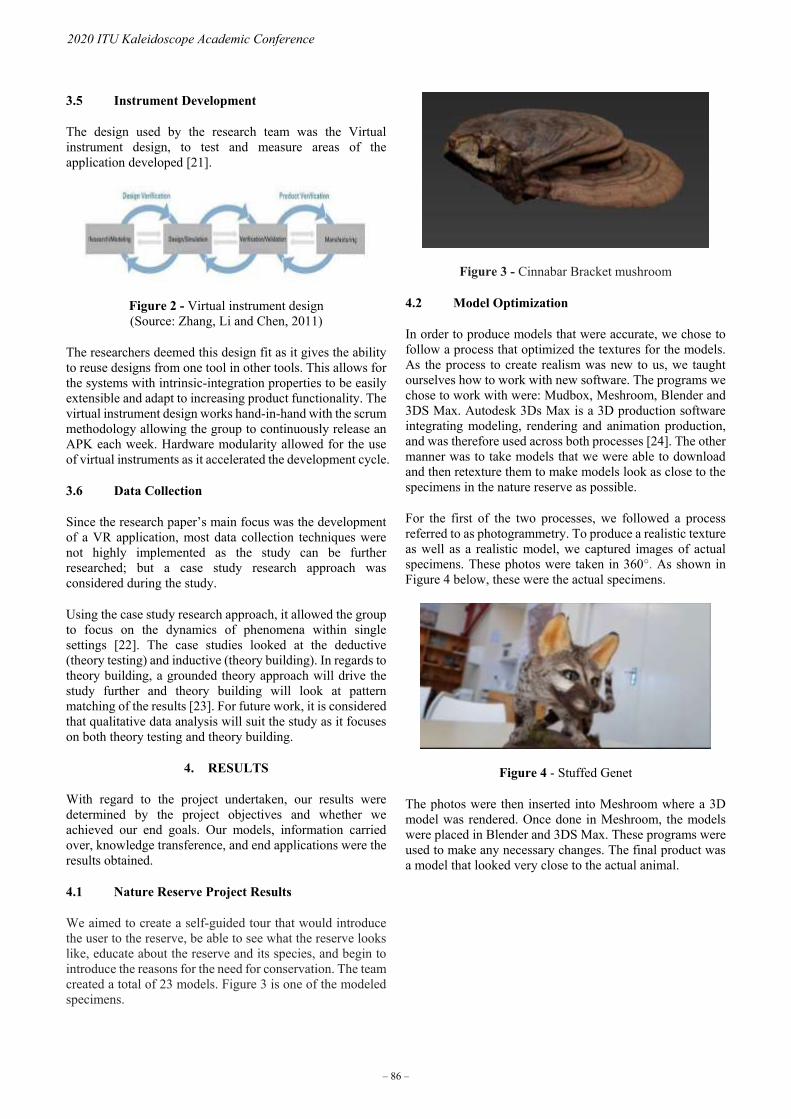
3.5 Instrument Development
The design used by the research team was the Virtual instrument design, to test and measure areas of the application developed [21].
Figure 2 - Virtual instrument design (Source: Zhang, Li and Chen, 2011)
The researchers deemed this design fit as it gives the ability to reuse designs from one tool in other tools. This allows for the systems with intrinsic-integration properties to be easily extensible and adapt to increasing product functionality. The virtual instrument design works hand-in-hand with the scrum methodology allowing the group to continuously release an APK each week. Hardware modularity allowed for the use of virtual instruments as it accelerated the development cycle.
3.6 Data Collection
Since the research paper’s main focus was the development of a VR application, most data collection techniques were not highly implemented as the study can be further researched; but a case study research approach was considered during the study.
Using the case study research approach, it allowed the group to focus on the dynamics of phenomena within single settings [22]. The case studies looked at the deductive (theory testing) and inductive (theory building). In regards to theory building, a grounded theory approach will drive the study further and theory building will look at pattern matching of the results [23]. For future work, it is considered that qualitative data analysis will suit the study as it focuses on both theory testing and theory building.
4. RESULTS
With regard to the project undertaken, our results were determined by the project objectives and whether we achieved our end goals. Our models, information carried over, knowledge transference, and end applications were the results obtained.
4.1 Nature Reserve Project Results
We aimed to create a self-guided tour that would introduce the user to the reserve, be able to see what the reserve looks like, educate about the reserve and its species, and begin to introduce the reasons for the need for conservation. The team created a total of 23 models. Figure 3 is one of the modeled specimens.
Figure 3 - Cinnabar Bracket mushroom
4.2 Model Optimization
In order to produce models that were accurate, we chose to follow a process that optimized the textures for the models. As the process to create realism was new to us, we taught ourselves how to work with new software. The programs we chose to work with were: Mudbox, Meshroom, Blender and 3DS Max. Autodesk 3Ds Max is a 3D production software integrating modeling, rendering and animation production, and was therefore used across both processes [24]. The other manner was to take models that we were able to download and then retexture them to make models look as close to the specimens in the nature reserve as possible.
For the first of the two processes, we followed a process referred to as photogrammetry. To produce a realistic texture as well as a realistic model, we captured images of actual specimens. These photos were taken in 360°. As shown in Figure 4 below, these were the actual specimens.
Figure 4 - Stuffed Genet
The photos were then inserted into Meshroom where a 3D model was rendered. Once done in Meshroom, the models were placed in Blender and 3DS Max. These programs were used to make any necessary changes. The final product was a model that looked very close to the actual animal.
– 86 –
2020 ITU Kaleidoscope Academic Conference

Figure 5 - Blender optimized Genet
The second process downloaded models and then retextured them. This approach involved focusing on working with Photoshop and 3DS Max. Many of the specimens are similar in shape but with different textures. This meant using models, but making the required alterations.
We would download the models, then alter as required for the necessary shape, or any additional features. Once completed we moved to Photoshop to ensure the accuracy of textures.
4.3 User Interaction
The application was deployed on Android mobile devices for the users to interact with. To view the virtual environment, attachable VR glasses were supplied. This allowed the user to be immersed within the created environment. To navigate around this environment, the practice of teleportation was used, in conjunction with head-tracking capabilities, in order for the application to follow the head movements of the user and know in which direction they are looking. The transportation was used in conjunction with crosshairs. Users were required to target green spheres using the crosshairs to be transported to various points of interest within the simulation. By holding the intersection between the crosshairs and spheres for a period of three seconds, the user was transported to the next point along the tour. These crosshairs were also used to trigger the viewing of the various models of the specimens and information associated with those specimens. The use of crosshairs meant the user remained immersed in the virtual experience as they did then not have to use the mobile device’s touch screen to interact with the virtual environment. Figure 6 illustrates the user’s view of the nature reserve and the points of interest in VR mode. Figure 7, on the other hand, illustrates an example of a specimen and the information associated with it once the user has been transported to that specific point of interest.
Figure 6 - User interface in VR mode
Figure 7 - Caracal as point of interest within the virtual environment
4.4 Client Feedback
The client provided overall positive feedback regarding the final outcome of the project, as discussed in Table 1. There was an immense appreciation of the capabilities and future possibilities of the application. The client can already envision how conservation would be assisted with an application of this nature. They appreciated that people who had no access to the nature reserve would now be able to ‘visit’ the reserve in a virtual space, thereby also being able to pass knowledge of the fauna and flora within that environment to a greater audience. Their main request was to include animation as the project grew.
Table 1 discusses the overall feedback received from the client once the project was completed. The table signifies what the client was satisfied with from the objectives achieved, what future work the client can envision for the project, as well as where features that were not able to be added could make the final application a success.
– 87 –
Industry-driven digital transformation
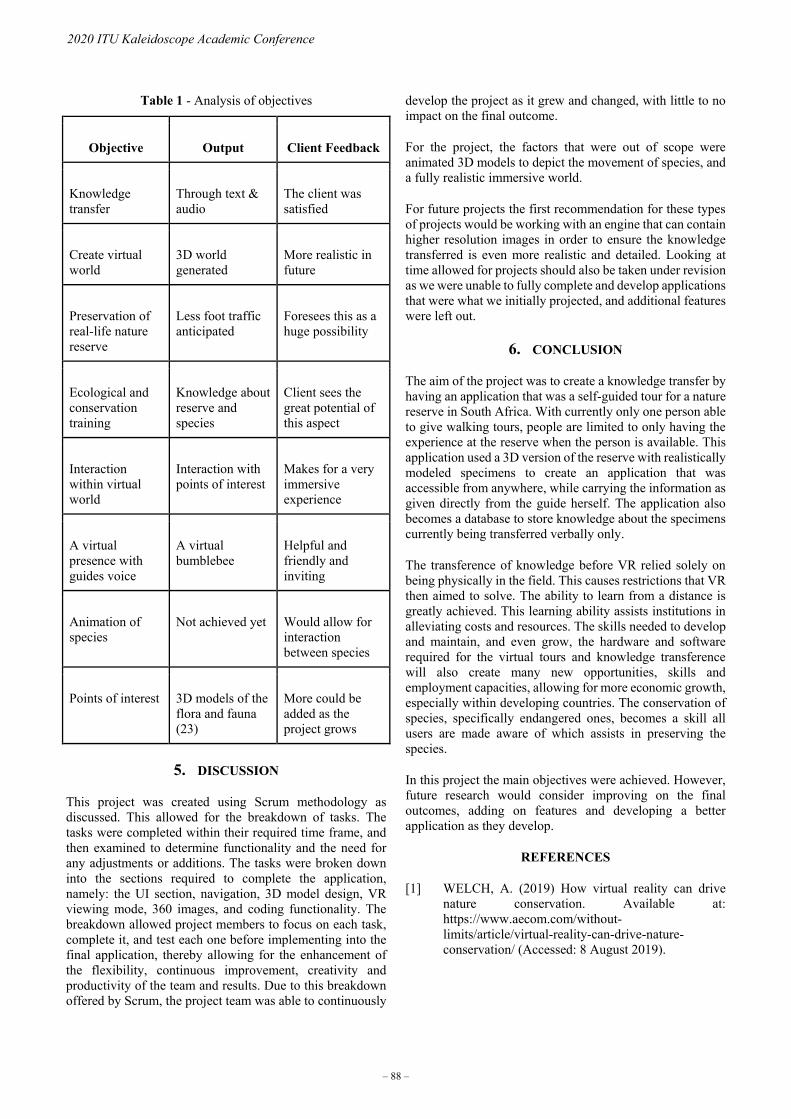
Table 1 - Analysis of objectives
Objective Output Client Feedback
Knowledge transfer
Through text & audio
The client was satisfied
Create virtual world
3D world generated
More realistic in future
Preservation of real-life nature reserve
Less foot traffic anticipated
Foresees this as a huge possibility
Ecological and conservation training
Knowledge about reserve and species
Client sees the great potential of this aspect
Interaction within virtual world
Interaction with points of interest
Makes for a very immersive experience
A virtual presence with guides voice
A virtual bumblebee
Helpful and friendly and inviting
Animation of species
Not achieved yet Would allow for interaction between species
Points of interest 3D models of the flora and fauna (23)
More could be added as the project grows
5. DISCUSSION
This project was created using Scrum methodology as discussed. This allowed for the breakdown of tasks. The tasks were completed within their required time frame, and then examined to determine functionality and the need for any adjustments or additions. The tasks were broken down into the sections required to complete the application, namely: the UI section, navigation, 3D model design, VR viewing mode, 360 images, and coding functionality. The breakdown allowed project members to focus on each task, complete it, and test each one before implementing into the final application, thereby allowing for the enhancement of the flexibility, continuous improvement, creativity and productivity of the team and results. Due to this breakdown offered by Scrum, the project team was able to continuously
develop the project as it grew and changed, with little to no impact on the final outcome.
For the project, the factors that were out of scope were animated 3D models to depict the movement of species, and a fully realistic immersive world.
For future projects the first recommendation for these types of projects would be working with an engine that can contain higher resolution images in order to ensure the knowledge transferred is even more realistic and detailed. Looking at time allowed for projects should also be taken under revision as we were unable to fully complete and develop applications that were what we initially projected, and additional features were left out.
6. CONCLUSION
The aim of the project was to create a knowledge transfer by having an application that was a self-guided tour for a nature reserve in South Africa. With currently only one person able to give walking tours, people are limited to only having the experience at the reserve when the person is available. This application used a 3D version of the reserve with realistically modeled specimens to create an application that was accessible from anywhere, while carrying the information as given directly from the guide herself. The application also becomes a database to store knowledge about the specimens currently being transferred verbally only.
The transference of knowledge before VR relied solely on being physically in the field. This causes restrictions that VR then aimed to solve. The ability to learn from a distance is greatly achieved. This learning ability assists institutions in alleviating costs and resources. The skills needed to develop and maintain, and even grow, the hardware and software required for the virtual tours and knowledge transference will also create many new opportunities, skills and employment capacities, allowing for more economic growth, especially within developing countries. The conservation of species, specifically endangered ones, becomes a skill all users are made aware of which assists in preserving the species.
In this project the main objectives were achieved. However, future research would consider improving on the final outcomes, adding on features and developing a better application as they develop.
REFERENCES
[1] WELCH, A. (2019) How virtual reality can drive nature conservation. Available at: https://www.aecom.com/without-limits/article/virtual-reality-can-drive-nature-conservation/ (Accessed: 8 August 2019).
– 88 –
2020 ITU Kaleidoscope Academic Conference
[2] Hopkins, C. (2019) GEO ExPro - Virtual Reality Geology Field Trips. Available at: https://www.geoexpro.com/articles/2019/03/virtual-reality-geology-field-trips (Accessed: 8 August 2019).
[3] Dede, C. (2005) ‘Planning for “neomillennial” learning styles: Implications for investments in technology and faculty’, Educating the net generation, pp. 226–247. Available at: http://scholar.google.com/scholar?hl=en&btnG=Search&q=intitle:Planning+for+?Neomillennial?+Learning+Styles:+Implications+for+Investments+in+Technology+and+Faculty#0.
[4] Biljon, J. Van and Dembskey, E. (2011) ‘Learning tools in resource constrained environments : Learning from e-learning in the time of m-learning’, ICT for development: people, policy and practice. IDIA2011 Conference Proceedings, pp. 26–28.
[5] Abdelaziz, M. A. et al. (2014) ‘Challenges and Issues in Building Virtual Reality-Based e-Learning System’, 4(4), pp. 320–328. doi: 10.7763/IJEEEE.2014.V4.347.
[6] Fabris, C. et al. (2019) ‘Virtual Reality in Higher Education’, International Journal of Innovation in Science and Mathematics Education, 27(8), 69-80, 2019
[7] Dede, C. (2009) ‘Immersive interfaces for engagement and learning.’, Science (New York, N.Y.), 323(5910), pp. 66–69. doi: 10.1126/science.1167311.
[8] Dalgarno, B. and Lee, M. J. W. (2010) ‘What are the learning affordances of 3-D virtual environments?’, British Journal of Educational Technology, 41(1), pp. 10–32. doi: 10.1111/j.1467-8535.2009.01038.x.
[9] Coulter, R. et al. (2007) ‘The effect of degree of immersion upon learning performance in virtual reality simulations for medical education’, Medicine Meets Virtual Reality 15: In Vivo, in Vitro, in Silico: Designing the Next in Medicine, p. 155.
[10] Dawley, L. and Dede, C. (2014) Situated learning in virtual worlds and immersive simulations, The Handbook of research on educational communications and technology. Available at: http://link.springer.com/chapter/10.1007/978-1-4614-3185-5_58 (Accessed: 26 April 2015).
[11] Dolphin, G. et al. (2019) ‘Virtual field experiences in introductory geology : Addressing a capacity problem, but finding a pedagogical one Virtual field experiences in introductory geology : Addressing a capacity’, Journal of Geoscience Education.
Routledge, 67(2), pp. 114–130. doi: 10.1080/10899995.2018.1547034.
[12] Derouin, S. (2018) Fieldwork among the pixels: Virtual and augmented reality diversify geoscience education | EARTH Magazine. Available at: https://www.earthmagazine.org/article/fieldwork-among-pixels-virtual-and-augmented-reality-diversify-geoscience-education (Accessed: 22 August 2019).
[13] Bednarz, T. et al. (2016) ‘Virtual reality for conservation’, Proceedings of the 21st International Conference on Web3D Technology, Web3D 2016, (December 2017), pp. 177–178. doi: 10.1145/2945292.2945319
[14] Mileva, G. (2018) Immersive Tech for Environmental Issues: How VR Can Drive Conservation Initiatives | ARPost. Available at: https://arpost.co/2018/12/12/immersive-tech-for-environmental-issues-how-vr-can-drive-conservation-initiatives/ (Accessed: 15 November 2019).
[15] Schwalbe, K. (2015) Information Technology Project Management. Cengage Learning. Available at: https://books.google.co.za/books?id=mPeoBAAAQBAJ.
[16] Muller M.J et al. (1993) ‘Participatory Design’, Communications of the ACM, (June 1993), Vol.36, No.4, pp 24-28 re reserve, Immersive Technology,
[17] Dell'Era C and Landoni P. (2014). Living Lab: A Methodology between User‐Centred Design and Participatory Design. Creativity and Innovation Management. Volume 23, Issue 2. doi: https://doi.org/10.1111/caim.12061
[18] Carthey J. (2020). Participatory Design, Project Clients, and Healthcare User Groups. HERD: Health Environments Research & Design Journal. doi: https://doi.org/10.1177/1937586720948462
[19] Jantjies M et al. (2018) ‘Experiential learning through Virtual and Augmented Reality in Higher Education’, (December 2018), pp 42-45, doi: 10.1145/3300942.3300956
[20] Marshall, M. N. (1996) ‘Sampling for qualitative research’, Family Practice, 13(6), pp. 522–525. doi: 10.1093/fampra/13.6.522.
[21] Zhang, L., Li, T. and Chen, Z. (2011) ‘Design and research of virtual instrument development board’, Communications in Computer and Information Science, 214 CCIS (PART 1), pp. 231–238. doi: 10.1007/978-3-642-23321-0_36.
– 89 –
Industry-driven digital transformation

[22] Ravenswood, K. (2011) ‘Eisenhardt’s impact on
theory in case study research’, Journal of Business
Research. Elsevier Inc., 64(7), pp. 680–686. doi: 10.1016/j.jbusres.2010.08.014.
[23] Yin, R. K. (2004) The case study anthology. Sage.
[24] Duan Z. (2019) ‘The Practice and Exploration of
Virtual Roaming based on 3Ds Max’, Advances in
Computer Science Research, volume 87 (April 2019), pp 432-438, doi:https://doi.org/10.2991/icmeit-19.2019.70
[25] 3D Gaia (2019) 3D Gaia - Virtual Reality app for geological exploration. Available at: https://www.imagedreality.com/3d-gaia-vr-app (Accessed: 15 November 2019).
[26] Kortz, K. M. and Murray, D. P. (2009) ‘Barriers to
college students learning how rocks form’, Journal of
Geoscience Education. Taylor & Francis, 57(4), pp. 300–315.
[27] Mogutcheva, N. K. and Krugovykh, V. V. (2009) ‘New data on the stratigraphic chart for Triassic
deposits in the Tunguska syneclise and Kuznetsk basin’, Stratigraphy and Geological Correlation,
17(5), pp. 510–518. doi: 10.1134/S0869593809050049.
[28] Paor, D. G. De, Sciences, A. and Dominion, O. (2016) ‘Virtual Rocks’, (8), pp. 4–11. doi: 10.1130/GSATG257A.1.1.
[29] VRGeoscience (2019) Home. Available at: https://www.vrgeoscience.com/ (Accessed: 15 November 2019).
– 90 –
2020 ITU Kaleidoscope Academic Conference

SELF-GUIDED VIRTUAL TOUR USING AUGMENTED REALITY
Aphile Kondlo1; Andre Henney1; Antoine Bagula1; Olasupo Ajayi1; Laurenda Van Breda2
1Department of Computer Science, University of the Western Cape, South Africa2Nature Reserve, University of the Western Cape, South Africa
ABSTRACT
The Cape Flats Nature Reserve, situated in the WesternCape, South Africa provides refuge to over 200 plant species,many endemic to the Western Cape. As part of the reserve’srecreational activities, scheduled guided tours are offered tothe public. The tours focus on the ecological importanceand educational aspect of the reserve. A complete tourusually takes more than an hour. Due to the lack of trainedtour guides and its strenuous nature, tours are only offeredonce daily. This has been identified as a challenge by themanagement of the nature reserve. In this paper a solution tothe challenge using an augmented reality mobile applicationis proposed. The application allows visitors to experience thenature reserve in their own time without a guide. Augmentedreality markers are placed at points of interest around thereserve. These in conjunction with the mobile applicationprovide information about plants thereby mimicking actualtour guides. Outlines for the design and development ofthis self-guided tour application and the results of useracceptance and unit tests are provided in this paper.
Keywords - Augmented reality, IoT, mobile application,nature reserve, virtual tour
1. INTRODUCTION
The Cape Flat Nature reserve situated in the Western Capeprovince of South Africa is home to a diverse variety ofindigenous plant and animal species. The reserve is veryactive in academic research and offers recreational activitiesto the general public. Guided tours are offered by trained tourguides, with tours lasting for more than an hour. A challengebeing experienced by the management of the reserve is itsinability to meet tour demands, as only one guided tour canbe offered daily. This is due to a shortage of trained tourguides and the strenuous nature of a tour.This project investigates the design and development of amobile application with augmented reality (AR) to assistthe reserve with self-guided tours and thus improving accessto recreational activities. The mobile application will allowanyone with a smart mobile phone to go on self-guided toursaround the reserve.
1.1 Augmented Reality
Augmented Reality (AR) can be defined as an improvedversion of reality where live views of the physical
Figure 1 – A simple AR marker
real-world environments are augmented with superimposedcomputer-generated images. This enhances one’s perceptionof reality [1]. Using AR, a pseudo-physical world is createdby enhancing the physical world using graphics, sounds, andtouch sensations. AR application areas range from socialmedia filters to simulation of surgical procedures, from publicsafety to gas and oil, healthcare, tourism and marketing. Italso finds applications in digital maps and navigation apps insmartphones, where it is used alongside GPS to superimposethe user’s location on a map [1].
On mobile phones -an AR application utilizes the camera-to identify an AR marker. These markers are often barcodeencoded black and white images. The AR application thenanalyses the marker and creates a virtual image, which isdisplayed on the screen of the mobile phone. Similarly,the GPS sensors within the phone are also used to identifylocations of the phone. In this paper, both the camera andGPS are primary requirements to identify points of interestwithin the nature reserve.
AR is available in three forms, which are discussed in thenext subsections.
1.2 Marker Based Augmented Reality
Marker-basedAR is one inwhich distinctive images or shapesare printed on paper or similar material, as shown in Figure1. Cameras are used to scan the marker, once recognizedcorresponding actions are performed by the AR application.Actionsmight include: opening aweb link, displaying objectsor playing video animations [3],[4].
Though black and white colors are the most used for ARmarkers, other colors can also be used as long as there is adistinct contrast making them easily recognizable by cameras[4],[6].
978-92-61-31391-3/CFP2068P @ ITU 2020 Kaleidoscope – 91 –

1.3 Marker-less Based Augmented Reality
Unlike marker-based AR, marker-less AR does not dependon AR markers to function, instead they use natural featuresthat already exist in the environment [7]. Determination ofthe camera position by natural features is more intricate thanthe marker-based AR and involves using adding algorithms todiscover and match the natural features amongst the cameraframes.The marker-less AR can also utilize other sensors such asGPS (location-based AR), digital compass, accelerometer,or velocity meter which are often built into the device todeliver data based on your position. The use cases arevast and include the following: position detection, findingnearby places or businesses, mapping directions, and otherposition-centric mobile applications [7].
1.4 Projection Based Augmented Reality
Projection-based AR can be defined as a video prognosistechnique, which can extend and support visual data byhurling images on the surface of 3D items or space. It isoften referred to as Spatial AR [8]. Projection-based AR isable to project high-definition pictures or videos and alter theshapes of objects visually using the flow of time.The audience in this case is allowed to identify a visuallyextended space with the combination of images and realtime. The way -it works is by- projecting artificial lightinto real-world surfaces. The user’s interaction is thendetected by differentiating between the known projection andthe changed projection. Laser technology is also amongstthe interesting projection-based AR where we project a 3Dinteractive hologram into mid-air.Despite the numerous benefits of AR (especially in educationknowledge sharing), its major disadvantage is cost. AR isstill a relatively new technology and not readily (affordably)available to small businesses and end users. Marker-basedAR are however, comparatively cheaper to deploy. In thispaper, marker-based AR is used and our proposed solutionfor the nature reserve is discussed in the next section.
2. PROPOSED SOLUTION
The primary objective of this project is to promote self-guidedtours of the Cape Flat Nature reserve. The applicationwould be able to enlighten its users about the history andecological importance of the reserve. It should also enableits users to identify various plant species as they walk throughthe reserve. By using marker-based augmented reality, theapplication will identify different plant species across thenature reserve.
2.1 High Level Overview
AR markers are placed at pre-identified points of interestalong the nature reserve. Visitors to the reserve simplyneed to install the application on their mobile phones andproceed with the self-tour. On reaching an AR marker, thevisitor, simply points the phone camera towards the marker.
Figure 2 – Marker based AR layout
Figure 3 – System Architecture
Upon recognition of the AR marker by the mobile’s camera,a 3D image of the plant will be displayed alongside relatedinformation. Figure 2 illustrates a conceptual demonstrationof the application.
2.2 System Design
Figure 3 shows a high-level view of the self-guidedaugmented reality system. Being a project under thedomain of the Internet of Things (IoT), it features a layeredarchitecture synonymous to the ITU’s IoT architecture [15].The layers are described as follows:
• Sensing Layer: This is a vital aspect of the entiresystem, comprising of system input (sensors) and output(actuation). The camera and GPS on the mobile phoneserve as input sensors for the system, while the screenserve as the output on which the overlaid images aredisplayed. The camera is used to scan the AR markers,while the GPS is used to identify the current locationof the user with respect to points of interest. As theuser walks along, when within proximity of a point ofinterest, the application pops up information about thepoint.
• Middleware Layer: This layer focuses on datamanagement, including data ingestion, storage andprocessing. Live data from the sensing layer areprocessed at this layer. Information about the variousplants and points of interest are also stored on databasesat this layer. For this paper, the Vuforia AR server[10] located in the Cloud, functions as a processing unit
– 92 –
2020 ITU Kaleidoscope Academic Conference

through which information about plants in the naturereserve are accessed.
• Output: The output part is retrieved from the databaseafter image processing has been completed or whenpoints of interest are identified. The overlaid informationwill be displayed on the user’s mobile phone screen asoutput.
3. SYSTEM IMPLEMENTATION
An agilemethodologywas used in developing the application.Pictures of various plants in the Cape Flats Nature reservewere taken and uploaded to an online database. OurAR markers were designed using AR.js an open sourceplatform for designing AR-markers [9]. Vuforia SDK, Unityand Adobe Stack [10],[11] were used to develop the ARmobile application. The scope of this project only focusedon Android-enabled mobile phones and developed usingAndroid Studio.The Samsung Galaxy S8 mobile phone [16] was used fortesting purposes. The S8 was chosen because of its highscreen resolution (2960x1440), 12MPmain camerawith focallength of 35mm and an aperture of f/1.7. With its Snapdragon835 processor coupled with 4 GB of RAM, it was sufficientlycapable of running the AR app smoothly with minimal delaysor processing bottlenecks.
4. SYSTEM TESTS AND RESULTS DISCUSSIONS
A number of tests were carried out, including a unit test,[12],[13], user acceptance test and device performance tests.For the unit test the focus was on the code and was carriedout using Microsoft Visual Studio. For user acceptance, thefocus was on user experience of the mobile app and to ensurethat the app met usability and accessibility expectations [14].Users were allowed to use the application and qualitativedata was subsequently collected in a bid to improve theusers’ experience. The final test was geared towards devicecompatibility and performance. For this test, the applicationwas installed on a number of phones to running Android 4.1(or higher) to verify compatibility. The various test cases arediscussed in the following subsection.
4.1 Test Cases
4.1.1 Unit Testing
This testwas performedby the developer using amethodologycalled code first whereby a thorough testing of thefunctionality of the code was made to make sure the codeperforms as it is required to. All the methods and classes thatare used in the application were tested here to make sure theypass this test before deployment.
4.1.2 User Acceptance Test
Two tests were carried out, in the first test users were given themobile phone and allowed to search through the phone, findthe application, open and then close it. While the user was
doing the task, the moderator was observing without assistingthe user. The second test required the user to re-launchthe application, scan the marker, use other functions of theapplication, and close it afterward. The performance resultsof the user were noted down by the moderator.
4.1.3 Device Performance Test
Two categories of tests were carried out. The first was adevice compatibility test, which was used to validate thatthe application behaves as expected across different mobiledevices running the Android operating system. Applicationfunctions and features were also tested as components mightbehave differently on different devices. The last test case wasto check device compatibility with regard to installation inorder to check whether the application could be installed onother devices..The second category of tests was performance testing. Herewe tested the speed of the application by checking howquickly the application is launched, how long scans took,the length of time it took to move across pages and to exitthe application. We also tested the application’s scalability,to determine the maximum number of users the system couldsupport concurrently.
4.2 Test Reports
4.2.1 Unit Testing
While the test was running, the status bar at the top of the TestExplorer window in Microsoft Visual Studio was animated.At the end of the run, the bar turned green if all the testmethods pass, or red if any of the test failed. In the event of thetest failing, we would select test explorer to view the detail atthe bottom of the window. All detected errors were correctedfor all four classes. This process involved repeated debugging,recompiling and reruns until all required expectations are metand pass the test.
Table 1 – Unit testing
Iteration Test Results Bug fixesFirst Compilation error Modified the
method "CreateSingle Pixeltexture"
Second Long compilationtime
Replaced ifstatements withnested loops
Third Inconsistent results modified"OnRenderObject"
Fourth Success No change required
4.2.2 User Acceptance Test
The results for tests carried out are summarized in tables 1 to3. In terms of user experience, the users were happy with theapplication as it was user-friendly and easy to navigate.
– 93 –
Industry-driven digital transformation
Table 2 – User experience testing
User questions User responses Required/SuggestedChanges
Did the userstruggle tolaunch theapplication?
The user launchedthe applicationwithout assistance.
Suggestions on logodesign.
Did the usersfind theapplicationusable?
yes but it wasnoted that theincorporatedGoogle maps wasredundant.
The application wasusable accordingto the users.The proximitybased notificationswere consideredunnecessary andnot used by users.Users seem tohave preferred thesimple process ofscanning markersonly.
Did the usersmanage to exitthe application?
Yes and had tobe assisted by themoderator.
The inclusion ofan exit buttonwas suggested.However, exitingthe application wassimilar to exitingthe camera appon any phone anddid not require adedicated button.
4.2.3 Device Performance Test
During device compatibility a major issue encountered whiletesting was the layout not being consistent across differentscreen sizes. As expected the load time varied across devices,as phones with higher processor clock speeds loaded theapplication faster than those with lower speed. Scalabilitywas also a challenge, as stutters and longer response timeswere observedwhenmore users connected to the system. Thismight have been caused by a number of reasons, including i.)the Cloud computer server on which the database was hosted,ii.) the network bandwidth of the individual users, and iii.)the fact that we deployed our system on the free version ofVuforia.
4.2.4 Outdoor Testing
This test was performed outdoors at a nature reserve withtwo users and a moderator to test reliability of the applicationand satisfaction of users. Both users were happy with theinformation that was provided at the entrance of the naturereserve as it stated and showed how the application can beused when there are markers next to a plant. One user wassatisfied with reliability of the application but stated what canbe improved. The other user was satisfied with the overallapplication but had comments about reliability.Figure 4 to- 6 show the images that were captured whileperforming outdoor evaluation. During the evaluation,markers were placed at interest points (next to certain plants)around the nature reserve. These were scanned with the tour
Table 3 – Device compatibility and performance testing
Device compatibilitytesting
Performance testing
1 The application had issueswith screen layout onother devices but a fixwas provided to havethe application open inlandscape whenever it isopened.
The load time of theapplication took long tolaunch on other devicesbecause they had less spaceand not enough memory.A fix was to create spacefor the application on suchdevices.
2 The application failed to runon devices that had outdatedAndroid OS. A fix was doneby updating the softwareand run latest version ofAndroid OS.
The application wasunstable at times when itwas loaded on multipledevices at the same time.A potential fix might be tocompress the images storedon the database or improvenetwork bandwidth ofusers.
3 The application had noissues running on otherAndroid devices that hadthe latest version ofAndroidOS.
Scalability was manageableby the as it was ableto allow multiple usersto load the applicationwithout fault. However,occasionally slow downswere noticed when multipleusers were scanning /requesting objects from thedatabase.
app to get useful information about plants.Table 2 shows the results of user acceptance tests whileTable 3 shows the results of both device compatibility andperformance testing results gathered during the testing of theapplication. The tables provide errors/bugs and associatedsolutions.
5. CONCLUSION
The objective of this study was to develop a virtual tourguide based on Augmented Reality (AR). This would enableself-tours of the Cape Flats Nature reserve in the WesternCape province of South Africa. AR markers were placed atinterest points around the nature reserve and tourists havinginstalled the accompanying application on their capablemobile phones can simply scan the markers with their phone
Figure 4 – AR marker next to a plant
– 94 –
2020 ITU Kaleidoscope Academic Conference

Figure 5 – App trying to identify a plant
Figure 6 – Plant identified by App
camera to get information about plants and places of interest.The applicationwas developed in Android andwas rigorouslytested to ensure robustness. The solution was developedusing Agile methodology as there were frequent changes inrequirements and scope. Working closely with the naturereserve personnel ensured that the final solution was fit forpurpose. The application currently only works on Androiddevices, future works would include support for iOS devices.Incorporation of features such as navigation and text to speechcould be potential future additions.
REFERENCES
[1] V. McKalin, "Augmented Reality vs. Virtual Reality:What are the differences and similarities?," Tech. Times,5(6), pp. 1–6 (2015).
[2] E. Ortman and K. Swedlund, “MAR 9. Guidelines forUser Interactions in MAR DAFT,” 2012.
[3] S. Fleck, M. Hachet, and J.C. Bastien, "Marker-basedaugmented reality: Instructional-design to improvechildren interactions with astronomical concepts," InProceedings of the 14th International Conference onInteraction Design and Children pp. 21-28, 2015.
[4] R. M. Shetty and V. Lasrado, “marker based apps in ARusing android,” pp. 146–151, 2015.
[5] H. Yoon, N. Park, W. Lee, Y. Jang Y and W. Woo, "QRcode data representation for mobile augmented reality,"
In The International AR Standards Meeting, pp. 17-19,2011.
[6] T.W. Kan, C.H. Teng and W.S. Chou, "Applying QRcode in augmented reality applications," In Proc. ofthe 8th International Conference on Virtual RealityContinuum and its Applications in Industry, pp.253-257, 2009.
[7] T. Fukuda and N. Yabuki, “A Marker-less AugmentedReality System Using Image Processing Techniques forArchitecture and Urban Environment,” 2016.
[8] J. Lee, Y. Kim, M. H. Heo, D. Kim, and B. S. Shin,“Real-time projection-based augmented reality systemfor dynamic objects in the performing arts,” Symmetry,7(1), pp. 182–192, 2015.
[9] R. Sun, Y. Sui, R. Li, and F. Shao, “The Design of aNew Marker in Augmented Reality,” Int. Proc. Econ.Dev. Res., 4, pp. 129–132, 2011.
[10] I. Grahn, "The vuforia sdk and unity3d game engine",Bachelor thesis, Linköping University, 2017.
[11] V. Basterra, “Vuforia v1.5 SDK: Analysis andevaluation of capabilities,” Med. Clin. (Barc), 147(9),pp. 393–396, 2016.
[12] R. Parkin and I.V. Australia, "Software unit testing,"The Independent Software Testing Specialists, IV VAustralia. pp. 1-4, 1997.
[13] M. Olan, “Unit testing: test early, test often,” J.Computer Science. Coll., 19(2), pp. 319–328, 2003.
[14] J. Gao, X. Bai, W. T. Tsai, and T. Uehara, “Mobileapplication testing: A tutorial,” Computer (Long.Beach. Calif)., 47(2), pp. 46–55, 2014.
[15] ITU Reference architecture for IoT device capabilityexposure, ITU-TY-Series Recommendations, April2017
[16] SamsungS8, www.samsung.com/smartphones/galaxy-s8/
– 95 –
Industry-driven digital transformation


SESSION 6
IMMERSIVE TECHNOLOGIES IN FARMING
S6.1 Immersive technologies for development: An analysis of agriculture
S6.2 Immersive interactive technology: A case study of a wine farm


IMMERSIVE TECHNOLOGIES FOR DEVELOPMENT: AN ANALYSIS OF AGRICULTURE
Omowunmi Isafiade¹; Ofentse Mabiletsa¹
¹Department of Computer Science, University of the Western Cape, South Africa
ABSTRACT
Agricultural development is key to any economic development. Immersive technology plays a catalytic role and offers smart and sustainable choices to farmers who want to improve on agricultural productivity, and to agricultural training institutes that seek to use modern technology to advance pedagogy and reduce fatalities and operating costs in the learning space, among others. Currently, there are limited descriptive literature reviews in the area of immersive technology in agriculture, hereafter referred to as AVR-Agric. This paper presents a systematic literature review (SLR), which offers a structured, methodical, and rigorous approach to the understanding of the trend of research in AVR-Agric, and the least and most researched issues. This study explores and examines the current trends in the immersive technology-based agriculture areas, and provides a credible intellectual guide for future research direction. The SLR was limited to existing applications and peer-reviewed conference and journal articles published from 2006 to 2020. The results showed that virtual reality was implemented in 41% of the papers reviewed, augmented reality was found in 53%, while only 6% considered mixed-reality applications. The study also showed that developments that incorporate IoT, blockchain, and machine-learning technologies are still at their stage of exploration and advancement.
Keywords – 4IR, Agric 4.0, AVR-Agric, immersive technology
1. INTRODUCTION
The agriculture sector is a key player in every economy through job creation and food production [1], [2], amongst others. Immersive technologies play a key role in the development and support of agricultural practices and farm offerings [4]. These technologies have become mission critical to several farm operations and have been key to the development of modern online learning platforms and agricultural developments [5], [6]. However, little scholarly and systematic work currently exists on how researchers have applied the technologies for agricultural purposes that considers the usage of both high-end and budget head-mounted displays (HMDs), among others. Currently, what exists are limited descriptive literature reviews in the area of
immersive technologies in agriculture [7]. Researchers and developers’ efforts should be informed by the current trend of development in the agriculture sector and an ever-increasing need to support and expand the sector. Hence, we consider using systematic mapping to identify elements of existing research that are dedicated to the application of immersive technologies in agriculture to highlight potential gaps for future research direction. The identified gaps point toward unexplored regions of immersive technologies design for agriculture, which could motivate future work in this domain of interest. In what follows, this work presents an overview of immersive technology, and evaluates the following:
a. How are immersive technologies embedded inagriculture? What design elements, learningcontents, and immersive technologies have beenlaid out to support agricultural practices?
b. What integrative technologies and agriculturaltheories or principles have been applied to guideVR application design and development foragricultural advancement?
c. What evaluation methods have been employed toassess the development of immersive technology-based agriculture content?
The remaining part of the paper is organized as follows: Section 2 presents an overview of immersive technologies and a systematic literature review. Section 3 looks in depth into AR and VR research in agriculture, analyzing existing solutions on offer by other providers. Section 4 highlights current trends in the core areas of immersive technology. Section 5 concludes the paper and makes future recommendations.
2. LITERATURE REVIEW
2.1 Overview of Immersive Technologies
Immersive technologies are technologies that extend reality or create a new reality by leveraging 360 environments and offer the ability to naturally interact with the outside world The technologies span: (i) augmented reality (AR) [8]; (ii) virtual reality (VR) [9]; (iii) mixed reality (MR) [10]; and (iv) extended reality (XR). These technologies are at the forefront of the fourth industrial revolution (4IR), changing
978-92-61-31391-3/CFP2068P @ ITU 2020 Kaleidoscope – 99 –
the way we interact with digital content and driving innovation in the 21st century. These technologies can support a conducive agricultural environment within the existing constraints and realities [4].sound method for administering operator studies outside of a real combine.
2.2 Trend of Immersive Technologies in Agriculture
Researchers have explored the benefits and applications of immersive technologies in different domains, such as healthcare [11] and agriculture [4], among others. Immersive technologies in agriculture (AVR-Agric) span several aspects of the sector such as soil analysis [12], precision farming [13], and tourism [14], among others. The following section highlights some of the research conducted on AVR-Agric. We grouped the studies according to relevant themes. This is, however, not exhaustive due to space constraints.
2.2.1 Agricultural Education and Training
Small and large scale farmers can use AVR-Agric for training, to address the labor shortage and improve workers’ skills. This can eliminate fatalities for inexperienced workers or learners and reduce the cost of expensive farm equipment. The research conducted in [15] and [16] considered the application of the technologies for training users on designing and maintaining farm equipment, where a user can be taken through a stepwise procedure to determine a fault and guided on how to fix the problem. Eichhorst et al. [17] confirm that more research can also be done on training processes in various industries. Haroon et al. [18] explored how to use VR to improve pedagogy by training students with limited or no access to farmland to grow maize. They used multimedia learning theory to develop a system that embeds text, sound, images, and animations to deliver relevant content to learners. An evaluation was conducted using a survey to understand and reflect on learners’ experiences while using the system. Authors in [19] developed a tractor-based VR mobile application for learners at an agricultural training institution, to be used as a distance learning tool. The tractor application helps with breaking apart a tractor model and engine, to explore it and learn about component names and their functions.
2.2.2 Health and Safety on Farm Machinery
Operating heavy and complex machinery such as tractors and combines requires an increased degree of awareness when utilizing these machines as incorrect usage could result in injury [20], [21]. With AVR-Agric, inexperienced workers can get in-depth step-by-step instructions on more complex tasks used to operate complex machinery [19], [20]. A study by Wallmyr et al. shows that using mixed reality displays in industrial vehicles made the users more reactive
This is important because accidents involving tractors overturning are a major cause of deaths in agriculture. Gonzalez et al. [21] developed a tractor driving simulation using immersive VR to train drivers on using foldable roll-over protective structures to decrease the risk of overturning.
Simulations used to train operators can decrease training costs associated with new staff. A study by Meusel et al. [22] reinforces the argument for a VR combine simulator as a
2.2.3 Agritourism and Virtual Tours
Virtual tours make it possible for people to visit faraway locations without having to leave their homes. With the current challenges posed by the pandemic [3] and increasing interest in agritourism, virtual tours have become a new avenue that enables people to visit places of interest without endangering their lives and saving on travel costs. ARtour is an application by Garzón et al. [14], which merges an AR experience with two learning scenarios to teach agritourism and promote environmental responsibility to tourists. The education and popularization of Chinese traditional farming culture have also been virtualized in an interactive VR simulation [23]. Whereas, Yang et al. [24] proved that when their VR museum was compared to the China Agricultural Digital Museum, their system had an improved effect on practicability, instructiveness, authenticity, and amusement. Kim et al. [25] conducted a survey where the team investigated the use of AVR with drone technologies. The focus was on the creation of aerial immersive content that would allow clients to virtually visit locations. We see more evidence of adoption of VR in an analysis by Martins et al. [26], which argues that with the rising acceptance and usage of virtual reality, there is a gap in the market and academic research needs to explore virtual ecotourism concepts.
2.2.4 Diseases and Pest Management
Immersive technology could help train farmers on disease outbreak and harmful insect identification. Nigam et al. [4] developed a prototype that uses AR to educate farmers on pest management and insect identification. AVR-Agric can inform farmers on necessary measures [6] to take regarding potential pests and diseases, amongst others. AR can further reduce costs by informing (unskilled) farmers about specific requirements such as water needs, soil [12], fertilizer needs, safe harvesting periods, to mention a few, for a specific crop.
2.2.5 Livestock and Crop Tracking
Tracking the state and health of plants and livestock to assist in crop cultivation and disease identification is a vital part of farm management. The ability to visualize real-time information on crops and livestock on a mobile device allows farmers and farm managers to proactively react to changes in information [27]. Creating AR applications to visualize crops [5] from a mobile device, and using smart glasses to track plants and animals on the farm is important for farmers. To give fundamental soil condition visualization and comparing planting proposals to help farmers to settle on better choices for crop planting, authors in [6] also developed an AR application that works together with glasses. Rudowicz et al. [28] created an AR application to monitor cattle, similar to an AR-GPS system-based mobile application in [29], which allows users to view details about specific cows on their mobile devices. The results of an
– 100 –
2020 ITU Kaleidoscope Academic Conference
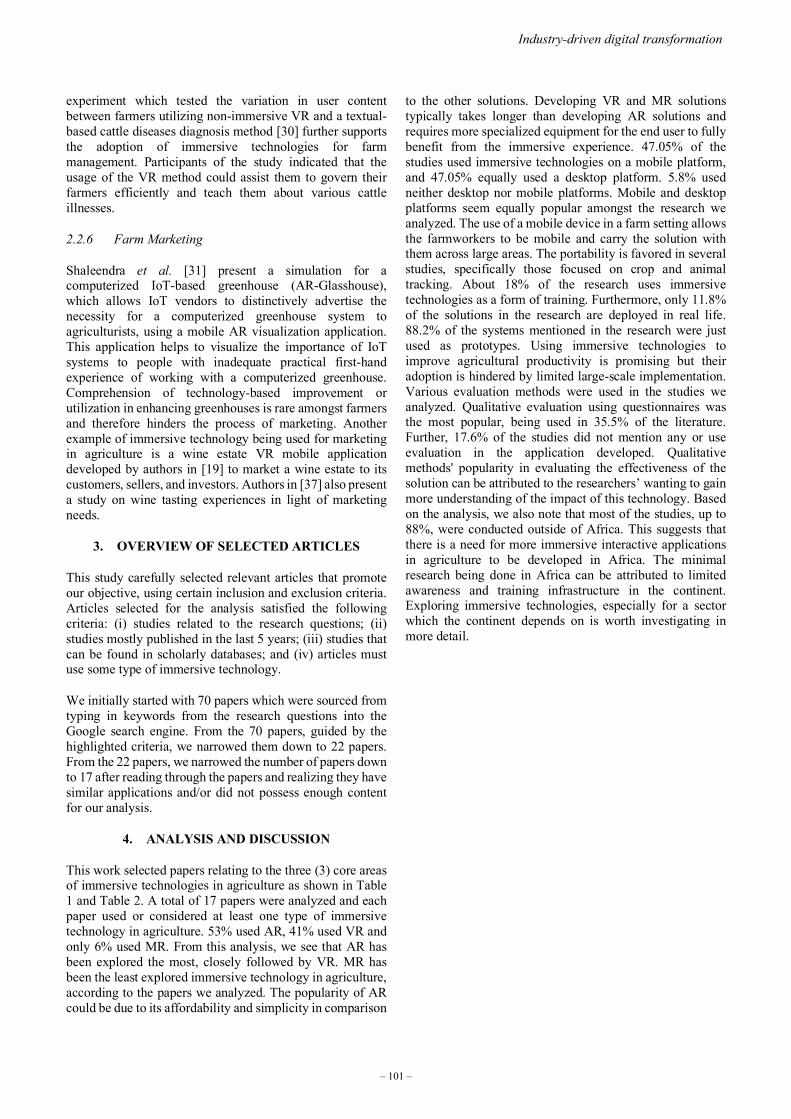
experiment which tested the variation in user content between farmers utilizing non-immersive VR and a textual-based cattle diseases diagnosis method [30] further supports the adoption of immersive technologies for farm management. Participants of the study indicated that the usage of the VR method could assist them to govern their farmers efficiently and teach them about various cattle illnesses.
2.2.6 Farm Marketing
Shaleendra et al. [31] present a simulation for a computerized IoT-based greenhouse (AR-Glasshouse), which allows IoT vendors to distinctively advertise the necessity for a computerized greenhouse system to agriculturists, using a mobile AR visualization application. This application helps to visualize the importance of IoT systems to people with inadequate practical first-hand experience of working with a computerized greenhouse. Comprehension of technology-based improvement or utilization in enhancing greenhouses is rare amongst farmers and therefore hinders the process of marketing. Another example of immersive technology being used for marketing in agriculture is a wine estate VR mobile application developed by authors in [19] to market a wine estate to its customers, sellers, and investors. Authors in [37] also present a study on wine tasting experiences in light of marketing needs.
3. OVERVIEW OF SELECTED ARTICLES
This study carefully selected relevant articles that promote our objective, using certain inclusion and exclusion criteria. Articles selected for the analysis satisfied the following criteria: (i) studies related to the research questions; (ii) studies mostly published in the last 5 years; (iii) studies that can be found in scholarly databases; and (iv) articles must use some type of immersive technology.
We initially started with 70 papers which were sourced from typing in keywords from the research questions into the Google search engine. From the 70 papers, guided by the highlighted criteria, we narrowed them down to 22 papers. From the 22 papers, we narrowed the number of papers down to 17 after reading through the papers and realizing they have similar applications and/or did not possess enough content for our analysis.
4. ANALYSIS AND DISCUSSION
This work selected papers relating to the three (3) core areas of immersive technologies in agriculture as shown in Table 1 and Table 2. A total of 17 papers were analyzed and each paper used or considered at least one type of immersive technology in agriculture. 53% used AR, 41% used VR and only 6% used MR. From this analysis, we see that AR has been explored the most, closely followed by VR. MR has been the least explored immersive technology in agriculture, according to the papers we analyzed. The popularity of AR could be due to its affordability and simplicity in comparison
to the other solutions. Developing VR and MR solutions typically takes longer than developing AR solutions and requires more specialized equipment for the end user to fully benefit from the immersive experience. 47.05% of the studies used immersive technologies on a mobile platform, and 47.05% equally used a desktop platform. 5.8% used neither desktop nor mobile platforms. Mobile and desktop platforms seem equally popular amongst the research we analyzed. The use of a mobile device in a farm setting allows the farmworkers to be mobile and carry the solution with them across large areas. The portability is favored in several studies, specifically those focused on crop and animal tracking. About 18% of the research uses immersive technologies as a form of training. Furthermore, only 11.8% of the solutions in the research are deployed in real life. 88.2% of the systems mentioned in the research were just used as prototypes. Using immersive technologies to improve agricultural productivity is promising but their adoption is hindered by limited large-scale implementation. Various evaluation methods were used in the studies we analyzed. Qualitative evaluation using questionnaires was the most popular, being used in 35.5% of the literature. Further, 17.6% of the studies did not mention any or use evaluation in the application developed. Qualitative methods' popularity in evaluating the effectiveness of the solution can be attributed to the researchers’ wanting to gain more understanding of the impact of this technology. Based on the analysis, we also note that most of the studies, up to 88%, were conducted outside of Africa. This suggests that there is a need for more immersive interactive applications in agriculture to be developed in Africa. The minimal research being done in Africa can be attributed to limited awareness and training infrastructure in the continent. Exploring immersive technologies, especially for a sector which the continent depends on is worth investigating in more detail.
– 101 –
Industry-driven digital transformation

Tab
le 1
- A
naly
sis o
f tre
nd in
AV
R-A
gric
Pape
r 1
[5]
Pape
r 2
[13]
Pa
per
3 Pa
per
4 Pa
per
5 Pa
per
6 Pa
per
7 Pa
per
8 Pa
per
9
Feat
ures
[1
4]
[12]
[6
] [2
8]
[30]
[3
2]
[20]
Foca
l Are
a 1)
Plan
t ont
olog
y 1)
Prec
ision
1)
Agr
itour
ism
1)Pr
ecisi
on
1)Pr
ecisi
on
1)Ca
ttle
farm
ing
1)Ca
ttle
farm
ing
1)Fi
sh fa
rmin
g 1)
Ope
rato
r saf
ety
2)
Crop
Li
vesto
ck
2)A
quap
onic
s ag
ricul
ture
ag
ricul
ture
2)
Dai
ry c
attle
2)
Cattl
e di
seas
e
culti
vatio
n fa
rmin
g 3)
Subs
isten
ce
2)so
il sa
mpl
ing
2)So
il an
alys
is tra
ckin
g id
entif
icat
ion
fa
rmin
g
3)So
il sa
mpl
ing
pr
actic
es
Mot
ivat
ion
Impr
ovin
g pl
ant
Ass
ist fa
rmer
s Fa
cilit
ate
an o
n-
Ass
ist fa
rmer
s to
Incr
ease
farm
able
A
ssist
farm
ers t
o H
elp
farm
ers
Educ
ate
and
train
To
faci
litat
e
grow
th
with
han
ds-fr
ee
site
lear
ning
vi
sual
ize
and
land
use
m
onito
r the
ir di
agno
se c
attle
po
tent
ial f
ish
disp
lay
of
acce
ss to
ex
perie
nce
to
track
thei
r fie
lds
effe
ctiv
enes
s and
da
iry c
attle
di
seas
es
farm
ing
busin
ess
impo
rtant
det
ails
info
rmat
ion
educ
ate
tour
ists
as
sist f
arm
ers’
ow
ners
to
driv
er
on
eco
tour
ism
w
ith d
aily
field
wor
k
Imm
ersiv
e A
R on
mob
ile
AR
smar
t gla
sses
A
R m
obile
gam
e A
R m
obile
A
R m
obile
A
R m
obile
V
R de
skto
p V
R de
skto
p M
R sim
ulat
ion
tech
nolo
gy &
ph
one
appl
icat
ion
appl
icat
ion
appl
icat
ion
prog
ram
pr
ogra
m
pl
atfo
rm
Inte
grat
ive
1)Pl
ant o
ntol
ogy
N/A
N
/A
1)D
rone
1)
Sate
llite
1)
SQL
Dat
abas
e N
/A
1)M
achi
ne
N/A
te
chno
logy
2) se
nsor
N
avig
atio
n
le
arni
ng
3)
Sate
llite
Sy
stem
2)
Hum
an
N
avig
atio
n 2)
Sens
ors
Mac
hine
Syste
m
3)M
achi
ne
Inte
ract
ion
4)
Mac
hine
le
arni
ng
Lear
ning
Har
dwar
e an
d 1)
Smar
tpho
ne
1)F4
Sm
art
1)Sm
artp
hone
1)
Sm
art G
lass
es
1)A
R H
ead-
Up
1)sm
artp
hone
1)
Des
ktop
1)
Des
ktop
1)
Uni
ty
Soft
war
e 2)
Vuf
oria
SD
K
Gla
sses
2)A
ndro
id
Dis
play
s 2)
Tabl
et
2)3d
s max
201
6 2)
Uni
ty
2)Sm
artp
hone
3)A
pach
e Je
na
2)Jo
ypad
3)W
ikitu
de A
R 2)
HTC
Viv
e 3)
And
roid
3)
Uni
ty
3)
Joys
tick
4)
And
roid
Stu
dio
3)In
tern
et
SD
K
Focu
s
4)M
orae
co
nnec
tion
4)
smar
tpho
ne
3)Sa
msu
ng T
ab
Te
chSm
ith
Se
5
Rea
l-life
Y
es
No
No
No
No
No
No
No
No
depl
oym
ent
Eval
uatio
n N
/A
Lab
and
farm
Q
uesti
onna
ire
Soil
sam
ple
Poin
t of i
nter
est
Farm
er
Que
stion
naire
M
ultip
le c
ase
Que
stion
naire
pe
rform
ance
tests
navi
gatio
n na
viga
tion
eval
uatio
n
stud
ies
ex
erci
se
– 102 –
2020 ITU Kaleidoscope Academic Conference
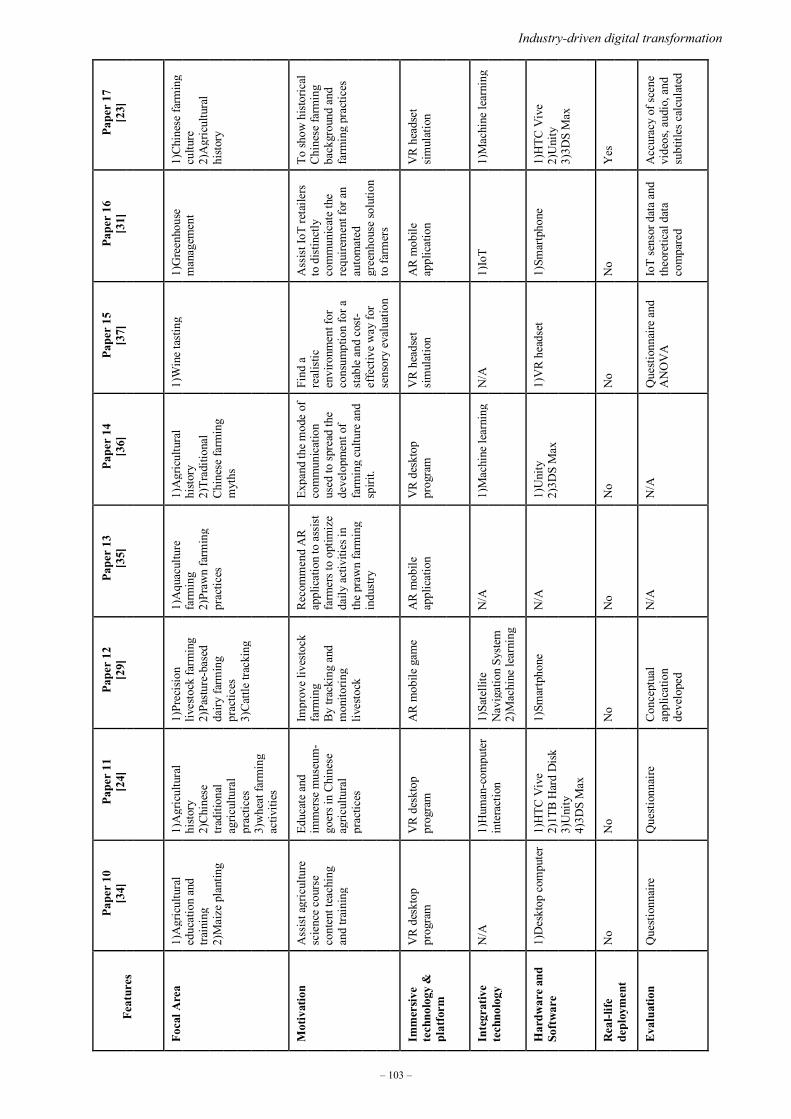
Pa
per
10
Pape
r 11
Pa
per
12
Pape
r 13
Pa
per
14
Pape
r 15
Pa
per
16
Pape
r 17
Feat
ures
[3
4]
[24]
[2
9]
[35]
[3
6]
[37]
[3
1]
[23]
Fo
cal A
rea
1)A
gric
ultu
ral
1)A
gric
ultu
ral
1)Pr
ecisi
on
1)A
quac
ultu
re
1)A
gric
ultu
ral
1)W
ine
tasti
ng
1)G
reen
hous
e 1)
Chin
ese
farm
ing
ed
ucat
ion
and
histo
ry
lives
tock
farm
ing
farm
ing
histo
ry
m
anag
emen
t cu
lture
train
ing
2)Ch
ines
e 2)
Pastu
re-b
ased
2)
Praw
n fa
rmin
g 2)
Trad
ition
al
2)A
gric
ultu
ral
2)
Mai
ze p
lant
ing
tradi
tiona
l da
iry fa
rmin
g pr
actic
es
Chin
ese
farm
ing
histo
ry
agric
ultu
ral
prac
tices
myt
hs
pr
actic
es
3)Ca
ttle
track
ing
3)
whe
at fa
rmin
g
ac
tiviti
es
Mot
ivat
ion
Ass
ist a
gric
ultu
re
Educ
ate
and
Impr
ove
lives
tock
Re
com
men
d A
R Ex
pand
the m
ode
of
Find
a
Ass
ist Io
T re
taile
rs
To sh
ow h
istor
ical
scie
nce
cour
se
imm
erse
mus
eum
- fa
rmin
g ap
plic
atio
n to
ass
ist
com
mun
icat
ion
real
istic
to
dist
inct
ly
Chin
ese
farm
ing
co
nten
t tea
chin
g go
ers i
n Ch
ines
e By
trac
king
and
fa
rmer
s to
optim
ize
used
to sp
read
the
envi
ronm
ent f
or
com
mun
icat
e th
e ba
ckgr
ound
and
and
train
ing
agric
ultu
ral
mon
itorin
g da
ily a
ctiv
ities
in
deve
lopm
ent o
f co
nsum
ptio
n fo
r a
requ
irem
ent f
or a
n fa
rmin
g pr
actic
es
prac
tices
liv
esto
ck
the
praw
n fa
rmin
g fa
rmin
g cu
lture
and
st
able
and
cos
t- au
tom
ated
indu
stry
spiri
t. ef
fect
ive
way
for
gree
nhou
se so
lutio
n
sens
ory
eval
uatio
n to
farm
ers
Imm
ersiv
e V
R de
skto
p V
R de
skto
p A
R m
obile
gam
e A
R m
obile
V
R de
skto
p V
R he
adse
t A
R m
obile
V
R he
adse
t te
chno
logy
&
prog
ram
pr
ogra
m
ap
plic
atio
n pr
ogra
m
simul
atio
n ap
plic
atio
n sim
ulat
ion
plat
form
In
tegr
ativ
e N
/A
1)H
uman
-com
pute
r 1)
Sate
llite
N
/A
1)M
achi
ne le
arni
ng
N/A
1)
IoT
1)M
achi
ne le
arni
ng
tech
nolo
gy
in
tera
ctio
n N
avig
atio
n Sy
stem
2)
Mac
hine
lear
ning
Har
dwar
e an
d 1)
Des
ktop
com
pute
r 1)
HTC
Viv
e 1)
Smar
tpho
ne
N/A
1)
Uni
ty
1)V
R he
adse
t 1)
Smar
tpho
ne
1)H
TC V
ive
Soft
war
e
2)1T
B H
ard
Disk
2)
3DS
Max
2)
Uni
ty
3)U
nity
3)3D
S M
ax
4)3D
S M
ax
Rea
l-life
N
o N
o N
o N
o N
o N
o N
o Y
es
depl
oym
ent
Eval
uatio
n Q
uesti
onna
ire
Que
stion
naire
Co
ncep
tual
N
/A
N/A
Q
uesti
onna
ire a
nd
IoT
sens
or d
ata
and
Acc
urac
y of
scen
e
appl
icat
ion
AN
OV
A
theo
retic
al d
ata
vide
os, a
udio
, and
deve
lope
d
com
pare
d su
btitl
es c
alcu
late
d
– 103 –
Industry-driven digital transformation

Table 2 - Comparative analysis of agricultural developments and core areas of immersive technologies
360-
360-
Immersive
Hardware
3D
Training/
Software solutions
Features degree degree content required modeling simulator photo video
VR AR MR Desktop Mobile Paper 1 [5] X X X
Paper 2 [13] X X X X
Paper 3 [14] X X X
Paper 4 [12] X X X X
Paper 5 [6] X X X X
Paper 6 [28] X X
Paper 7 [30] X X X
Paper 8 [32] X X X X
Paper 9 [20] X X X X X
Paper 10 [34] X X X X
Paper 11 [24] X X X X X
Paper 12 [29] X X
Paper13 [35] X X X
Paper 14 [36] X X X
Paper 15 [37] X X X X X
Paper 16 [31] X X X
Paper 17 [23] X X X X
In Table 2, we categorize the literature according to these features: (i) the presence of 360-degree photos or videos in the presented study or solution; (ii) whether the immersive technologies used present the content in a completely immersive nature (full immersion); and (iii) hardware required to be used with the immersive solution, e.g. smart glasses. We also note whether 3D models were used to create the simulation and also categorized whether the study’s solution used a simulator to imitate real-life conditions or if the solution was used for training purposes.
5. SUMMARY AND CONCLUSION
Agriculture remains a key sector for development in every economy. Immersive technologies have the potential to support smart agriculture for increased productivity. This research has confirmed the potential of the technology is revolutionizing the agriculture sector by systematically exploring, reviewing, and analyzing various applications and scholarly work in this domain of interest. Immersive technologies in agriculture are still at a stage of exploration and development, particularly in developing nations. The reality is that there is little achievement in terms of application and deployment of the technology in the agriculture sector in Africa. Furthermore, there are limited agricultural theories or principles that have been applied toguide immersive application design and development for agricultural advancement. More research should be
conducted in this key area to promote food security, alleviate poverty in local communities, and the overall sustainability of food and agricultural produce and systems. The analysis points to a gap in the literature, reporting specifically on the limited advancements made in applying immersive technology to agricultural processes. It also points out the lack of real-life deployment of solutions in this domain of interest. While we have not presented immersive technology as a panacea, as there are other concerns in agriculture around the security of land tenure and good governance, we believe that the analysis presented in this research will inform and guide future research in the applications of immersive technology to agriculture. This will make a significant difference in promoting relevant applications and platform development for inclusive and sustainable agriculture that can withstand the demands of Agric 4.0 and urbanization.
ACKNOWLEDGMENTS
The authors formally thank the Department of Agriculture, Western Cape, South Africa, for their support.
REFERENCES
[1] Feed Africa Strategy for Agricultural Transformation in Africa 2016-2025. Pp 1-79. https://www.afdb.org/fileadmin/uploads/afdb/Documents/Generic-Documents/Feed_Africa-
– 104 –
2020 ITU Kaleidoscope Academic Conference

_Strategy_for_Agricultural_Transformation_in_Africa_2016-2025.pdf (Accessed: June 2020).
[2] Technology Quarterly: The Future of Agriculture: https://www.economist.com/node/21698612/help/ac cessibilitypolicy. (Accessed: June 2020).
[3] D. P. Troskie: Impact of Covid-19 on Agriculture and Food in the Western Cape: Available at: https://www.hortgro.co.za/wp-content/uploads/docs/2020/03/agricultural-scenariosc.pdf. pp. 1-26, 2020.
[4] Nigam, P. Kabra, and P. Doke. ‘Augmented Reality in Agriculture’, International Conference on Wireless and Mobile Computing, Networking and Communications, pp. 445-448. DOI: 10.1109/WiMOB.2011.6085361. 2020.
[5] Katsaro, E. Keramopoulos, and M. Salampasis: “A Prototype Application for Cultivation Optimization Using Augmented Reality”. In International Conference on Information and Communication Technology in Agriculture, Food and Environment (HAICTA). pp. 805-811, 2017.
[6] M. Zheng, and A. G. Campbell: Location-based augmented reality in-situ visualization applied for agricultural fieldwork navigation, Adjunct Proceedings of the IEEE International Symposium on Mixed and Augmented Reality, pp. 93-97. DOI: 10.1109/ISMAR-Adjunct.2019.00039. ISMAR-Adjunct 2019.
[7] H. Li.: Analysis of Virtual Reality Technology Applications in Agriculture. In Computer and Computing Technologies in Agriculture, Volume I. CCTA. The International Federation for Information Processing, vol 258. Springer, Boston, MA. pp. 133-139, 2007.
[8] F. Zhou, H.B.-L. Duh, M. Billinghurst: Trends in augmented reality tracking, interaction, and display: a review of ten years of ISMAR. Proceedings of the 7th IEEE/ACM International Symposium on Mixed and Augmented Reality, IEEE Computer Society. pp. 193-202, 2008.
[9] D. A. Bowman, R. P. McMahan: Virtual reality: how much immersion is enough? Computer 40, 10.1109/MC.2007.257. pp. 36-43, 2007.
[10] P. Milgram F. Kishino: A Taxonomy of Mixed Reality Visual Displays. IEICE TRANSACTIONS on Information and Systems Vol. E77-D No.12 pp.1321-1329, 1994.
[11] S. Ayoung and J. Prophet. The State of Immersive Technology Research: A Literature Analysis. Computers in Human Behavior. 86. 10.1016/j.chb.2018.04.019. 2018.
[12] J. Huuskonen, T. Oksanen: Soil sampling with drones and augmented reality in precision agriculture, Computers and electronics in Agriculture. Elsevier, 154(February), DOI: 10.1016/j.compag.2018.08.039. pp. 25-35. 2018.
[13] Caria, M. et al. ‘Exploring smart glasses for augmented reality: A valuable and integrative tool in precision livestock farming’, Animals, 9(11), DOI: 10.3390/ani9110903. pp. 1–16, 2019.
[14] Garzón, J. et al. (2018) ‘ARtour: Augmented Reality-Based Game to Promote Agritourism’, in De Paolis, L. T. and Bourdot, P. (eds) Augmented Reality, Virtual Reality, and Computer Graphics. Cham: Springer International Publishing, pp. 413-422, 2018.
[15] K. Wang, R. Ma: Virtual Reality Technology and Its Application in Agricultural Machinery Design. Journal of System Simulation 18(2), pp. 500-503, 2006.
[16] W. Moczulski, W. Panfil, M. Januszka, and G. Mikulski: Applications of augmented reality in machinery design, maintenance and diagnostics. In: Jabłoński R., Turkowski M., Szewczyk R. (eds) Recent Advances in Mechatronics. Springer, Berlin, Heidelberg. pp 52-56, 2007.
[17] W. Eichhorst, N. Rodriquez-planas, R. Schmidl, and K. F. Zimmerman: A roadmap to vocational education and training in industrialised countries. Industrial and Labour Relations Review. 68(2), pp. 314-337, 2015.
[18] Haroon S.O and Abdulrauf T.: A Virtual Reality Prototype for Learning Maize Planting. Journal Communications on Applied Electronics 2(1): pp. 10-14, 2015.
[19] O. Mabiletsa, S. J. Viljoen, J. A. Farrell, L. Ngqwemla, and O. E. Isafiade, “An Immersive Tractor Application for Sustainability,” Int. J. Virtual Augment. Real., vol. 4, no. 1, pp. 35–54, IGI Global, USA, 2020.
[20] M. Wallmyr, T. A. Sitompul, T. Holstein and R. Lindell: Evaluating Mixed Reality Notifications to Support Excavator Operator Awareness’, Lecture Notes in Computer Science (including subseries Lecture Notes in Artificial Intelligence and Lecture Notes in Bioinformatics), 11746 LNCS, DOI: 10.1007/978-3-030-29381-9_44. pp. 743-762, 2019.
[21] O. Gonzalez, B. Martin-Gorriz, I. Ibarra, A. Macian, G. Adolfo and B. Miguel: Development and assessment of a tractor driving simulator with immersive virtual reality for training to avoid occupational hazards’, Computers and Electronics in Agriculture. Elsevier, 143(September), doi: 10.1016/j.compag.2017.10.008. pp. 111–118, 2017.
[22] C. Meusel, C. Grimm, J. Starkey, S. B. Gilbert, B. Gilmore, G. Luecke, D. Kieu, T. Hunt: The importance
– 105 –
Industry-driven digital transformation

of operator knowledge in evaluating virtual reality cue fidelity, Computers and Electronics in Agriculture. Elsevier, 160(March), doi:10.1016/j.compag.2019.03.026.pp. 179–187, 2019.
[23] C. Cheng, L. Kang, S. Cai, J. Li, and R. Sun, “Virtual Display and Interactive Experience Platform of Farming Culture Based on Unity3D,” IFAC-PapersOnLine, vol. 51, no. 17, pp. 637–642, 2018.
[24] Y. Yang, Y. Fan, and R. Sun ‘A Human-Computer Interaction System for Agricultural Tools Museum Based on Virtual Reality Technology’, Advances in Multimedia. doi: 10.1155/2019/2659313. pp. 1-15, 2019.
[25] S. J. Kim, Y. Jeong, S. Park, K. Ryu, and G. Oh, “A Survey of Drone use for Entertainment and AVR (Augmented and Virtual Reality),” pp. 119–132, 2018.
[26] J. Martins, R. Gonçalves, F. Branco, L. Barbosa, M. Miguel and M. Bessa: A multisensory virtual experience model for thematic tourism: A Port wine tourism application proposal’, Journal of Destination Marketing and Management. Elsevier Ltd, 6(2), doi: 10.1016/j.jdmm.2017.02.002. pp. 103–109, 2017.
[27] Xi, M., Adcock, M. and McCulloch, J.: ‘Future agriculture farm management using augmented reality’, 2018 IEEE Workshop on Augmented and Virtual Realities for Good, VAR4Good. IEEE, (March), doi: 10.1109/VAR4GOOD.2018.8576887. pp. 1–3. 2018.
[28] J. Rudowicz-Nawrocka, k. Kudlińska, G. Niedbała and M. Piekutowska: Application of augmented reality in dairy cattle monitoring, Applied Researches in Technics, Technologies and Education, 6(1), doi: 10.15547/artte.2018.01.001. pp. 1–9, 2018.
[29] Z. Zhao, W. Yang, W. Chinthammit, R. Rawnsley, P. Neumeyer and S. Cahoon: A new approach to utilize augmented reality on precision livestock farming. International Conference on Artificial Reality and Telexistence Eurographics Symposium on Virtual Environments, doi: 10.2312/egve.20171357.pp. 185– 188, 2017.
[30] K. Nkabiti, M. Galani, and A. M. Zungeru: Comparison of User Satisfaction between Text and Virtual Reality Based Expert Systems for Diagnosing Cattle Diseases. International Journal of Information andElectronicsEngineering,7(5), doi:18178/ijiee.2017.7.5.678. pp. 141–146, 2017.
[31] T. Shaleendra, B. Wishvamali, N. Gunarathne, S. Hareendran, and P. Abeygunawardhana: Simulation T. Shaleendra, B. Wishvamali, N. Gunarathne, S. Hareendran, and P. Abeygunawardhana: Simulation of the Influence of environmental factors related to Greenhouses using Augmented Reality’, 2019 2nd International Seminar on Research of Information Technology and Intelligent Systems, ISRITI 2019, (December2019),doi: 1109/ISRITI48646.2019.9034572. pp. 462–467. 2019.
[32] B. Kawan, and S. Alaliyat: 3D Virtual Fish Population World for Learning and Training Purposes. Proceedings of The 9th EUROSIM Congress on Modelling and Simulation, EUROSIM 2016, The 57th SIMS Conference on Simulation and ModellingSIMS2016,142,DOI: 3384/ecp17142487. pp. 487–494, 2018.
[33] P. Phupattanasilp. and S. R. Tong: Augmented reality in the integrative internet of things (AR-IoT): Application for precision farming’, Sustainability, 11(9). doi: 10.3390/su11092658, Switzerland. 2019
[34] S. O. Sulyman-Haroon: A Design of Computer Generated Environment for Learning Among Agriculture Students at the University of Ilorin, Ilorin, Nigeria: Advances in Multidisciplinary & Scientific Research Journal Publication, 4(3), DOI: 22624/aims/v4n3p1-1.pp. 1–18, 2018.
[35] M. Xi, M. Adcock, and J. McCollouch: An end-to-end augmented reality solution to support aquaculture farmers with data collection, storage, and analysis’, Proceedings - VRCAI 2019: 17th ACM SIGGRAPH International Conference on Virtual-Reality Continuum and its Applications in Industry. doi: 1145/3359997.3365721. 2019.
[36] Z. Ye, W. JianQin, and L. ZhiHong: An Intelligent Display Platform of Traditional Farming Myth’s Virtual Scene Based on Unity3D. IFAC-PapersOnLine. Elsevier B.V., 51(17), doi: 1016/j.ifacol.2018.08.118.pp. 678-682, 2018.Ele
[37] D. Torrico, Y. Han, C, Sharma, S. Fuentes, C. Gonzalez, and F. Dunshea: Effects of Context and Virtual Reality Environments on the Wine Tasting Experience, Acceptability, and Emotional Responses of Consumers. In MDPI Foods (Basel, Switzerland). 10.3390/foods9020191, pp. 1-17, 2020.
– 106 –
2020 ITU Kaleidoscope Academic Conference
IMMERSIVE INTERACTIVE TECHNOLOGY: A CASE STUDY OF A WINE FARM
Ofentse Mabiletsa1; Isafiade Omowunmi¹; Sarel Viljoen¹; Jason Farrell¹; Lwando Ngqwemla¹
¹University of the Western Cape, South Africa
ABSTRACT
Immersive technologies have paved a unique way of performing agricultural activities as well as learning and interacting with 3D content, among others. Moreover, the current situation from the COVID-19 pandemic has further created the need to develop solutions that can help the agriculture industry to stay relevant and ahead of potential post-COVID-19 challenges. This paper presents an immersive virtual reality application using a wine farm as a case study. The developed farm marketing application used participatory design and SCRUM methodology to showcase a wine farm and the wine production process. The application provides a virtual walk-through of the vineyards (lookout point), the lodge, the community garden, the conference facilities, as well as the cellar in 3D 360-degree rendering. Current basic 360-degree exploration applications exist but none have incorporated 3D 360-degree exploration as presented in the current research. The immersive experience provides a more realistic experience and feel of what is available on the farm. Results and feedback confirm that the farm marketing application shows promise in promoting wine farm marketing and other farm offerings.
Keywords – 4IR, COVID-19, farm marketing, immersive technology
1. INTRODUCTION
The South African wine industry contributes more than 36 billion Rands to South Africa’s gross domestic product and hires more than 290 000 staff yearly [1]. This is a significant contribution to South Africa's economy, making the activity or business of advertising and marketing their end products and services important. The wine industry has encountered challenges such as drought, evolving customer tastes [2], and recently the coronavirus (COVID-19) outbreak. The present-day pandemic [3] has increased the need to establish novel ways of promoting wine farm offerings and services. With the aforementioned in mind, we have identified the following problem: New and many existing farmers in the agricultural sector do not know the potential benefits of using immersive technologies as a marketing tool. Moreover, as online purchases and related services are prevalent across different sectors of the economy, particularly during the pandemic, it
is time to rethink agricultural practices, branding, and delivery.
This paper presents the utilization of immersive technologies as a marketing tool for showcasing wine farms. We put forward a case study on using immersive technologies to promote a wine farm and its products to clients, wine sellers, and partners. Many farms have a basic website detailing what they offer, but more can be offered in the form of an immersive experience to promote visibility and an exciting ride around the farm. The farm marketing mobile application aims to assist farms to showcase their farm environment and offerings to partners, financiers, and clients by providing an extensive and immersive virtual tour of the farm. The app also showcases the winemaker explaining the winemaking process for their top three wines and essentially giving a virtual wine tasting experience.
This paper has the following objectives:
To present immersive technologies as a successfulmarketing tool to market a wine farm estate, itsproducts, and amenities to existing and prospectiveclients, partners, and wine sellers.
To report on the benefits of using immersivetechnologies such as augmented reality and virtualreality as a marketing tool for wine farms.
1.1 Significance and economic benefits
The aim is to have an immersive application that farm management can use to promote their farm to partners abroad, wine sellers, as well as clients that want to view the surrounding areas in an immersive environment. The application incorporates a virtual walk-through of the vineyards (lookout point), the lodge, the community garden, the conference facilities as well as the cellar. Immersion will give a more realistic experience and feel of what is available on the farm. Current basic 360-degree exploration applications exist but none have incorporated 3D 360-degree exploration. The immersive application developed in this research offers a unique selling point to wine farms. This is because it can be used as a tool for virtual tours, virtual wine tasting, and marketing the wine farm without having to physically come into contact with other people.
978-92-61-31391-3/CFP2068P @ ITU 2020 Kaleidoscope – 107 –
1.1.1 Potential benefits for winemakers and wine farms
(a) Continued business: The wine farms and winemakers will still be able to market their offerings to consumers and showcase their estates to potential investors even during exigent circumstances such as the COVID-19 pandemic.
(b) Decreased hosting costs: The wine farm will not have to spend money on flying out their winemakers and marketers to meet potential investors and conduct a wine tasting with them to convince potential investors to buy into the company.
(c) Always open for business: The virtual tour can be taken at any time by the customers, the wine farm can attract customers to see its products and offerings in any kind of weather. Due to the customers not having to physically be at the wine farm, the wine farm can have consumer traffic in any kind of weather. The farm will not be disadvantaged by bad weather, operating hours, and social distancing protocols.
1.1.2 Potential benefits for end users (clients, wine sellers, partners)
(a) Self-navigation: With the virtual wine farm tour, the end user is in control of the order of sites they see and time they spend in those points of interest, unlike traditional tours where a tour guide leads the tour and determines the route and time allocated to each section of the farm, according to what they deem important and interesting.
(b) Decreased travel costs: The costs incurred accessing the application will be far less than those that would be incurred if the clients or partners were to physically travel there themselves.
(c) The safest form of tourism during the COVID-19 pandemic: The end users of the application will not come into contact with anyone from using this virtual tour. This tour is better during the current pandemic as they can observe social distancing protocols at home, using the application. The end users can also choose which wine they want to buy beforehand by listening to the winemaker's description of their offerings. This will, in turn, make shop visits shorter and decrease the end users probability of interacting with people outside their homes.
The rest of the paper is organized in the following manner: Section 2 is a literature review analyzing academic research and current applications of immersive technologies in wine farm marketing. Section 3 discusses the design and methodology that was followed to conduct the case study.
Section 4 shows the results obtained from the case study and we conclude the study and offer future direction in Section 5.
2. LITERATURE REVIEW
This chapter gives a general understanding of immersive technology terminology, looks into AR and VR research conducted in marketing, and finally looks into AR and VR research in viticulture.
2.1 Brief overview of immersive technologies
Immersive technology provides an opportunity to revolutionize the way we go about our daily lives, by blending virtual and real environments or creating a completely immersive experience. The technology includes: augmented reality (AR), virtual reality (VR), and mixed reality (MR)
(i) AR: Enhances reality by layering information or virtual aspects over a direct view of actual reality. In other words, AR overlays virtual objects in the real world. Hence, users are not isolated from the real world and can still interact with their immediate environment. Google glasses are a good example of an AR device [4].
(ii) VR: VR affords a user to experience complete immersion in a simulated stand-alone (digital) environment. This offers the ability to naturally interact with the digital world using a head-mounted display (HMD) or VR headset to get a 360-degree view of a digital world. This technology completely isolates the user from their immediate surroundings. Oculus Rift and Samsung VR are good examples of VR devices [5].
(iii) MR: Overlay of synthetic content on the real world that is anchored to and interacts with the real world in real time. This is often known as hybrid reality since it combines the two previous technologies (AR and VR). Microsoft's HoloLens is a good example of a device that promotes MR, which can allow you to interact with digital content in a dynamic way [6].
(iv) XR: This is an emerging overall term that describes the merging of all the other technologies; that is AR, VR, and MR. Hence, this technology merges the physical and virtual worlds in unique ways.
In this paper, we will be using the terms AVR and immersive technologies interchangeably.
– 108 –
2020 ITU Kaleidoscope Academic Conference

2.2 AVR research in agriculture (wine industry)
Immersive technologies have gone through practical refinement during the past several years, involving enhancements in the degree of fidelity and the sensation of virtual presence [7]. These advancements have culminated in the rise of immersive technology applications in agriculture. We will be exploring immersive technology research which has been conducted in the wine industry.
The use of immersive technologies as a rice wine brewing training tool was explored by Dong and Yang, 2020 [8] in a study done on using virtual simulations to teach rice wine brewing. Subject matters of every step in the brewing process were put together and used in the gamified virtual system and for learners who had no access to the actual equipment used in the process.
2.3 AVR research in wine tourism
Wine tourism is an expanding specialized market that is steadily growing larger in significance all over the world [9]. A study which was conducted in Germany reported findings that point out that wine tourism is extremely pertinent for wine distilleries as well as owners of small companies. The study revealed escalated requests for wine tourism exercises, especially near populous cities [10].
Booyens (2020) [11] points out that hardly any wine tourism research studies focus on modifications in this tourism specialized market. This shows that there is a gap in knowledge in this area of literature. The case study which we conducted can add to the small body of knowledge that exists.
2.4 AVR research in marketing
Several elements provoke enthusiasm over the potential for immersive technologies to be utilized for marketing. The first being that major corporations keep making large investments in AVR solutions for commercial applications, therefore AVR is probably going to grow to be an essential element of the marketing environment. The second being that education and research establishments are progressively getting fitted with AVR technologies [12]. A study by Loureiro et al., 2019 [13], on comprehending the use of VR in marketing, provides some perception for managers on the effect of immersive technologies on marketing. The authors point out that virtual reality technologies add to increasing motivation to enrich the customer shopping experience from the assessment and decision-making stage to the buying stage.
Observing current trends, authors Lavoie and King, 2020 [14] put forward that VR will supply marketing professionals with an unparalleled degree of insight about customers and clientele, granting them the ability to evaluate and cultivate marketing tools more efficiently.
Observing the literature that has been mentioned, we have established that our case study can add insight to the
advantages of using immersive technologies in wine farming as a marketing tool.
3. DESIGN AND METHODOLOGY
3.1 SCRUM methodology
The SCRUM project management methodology was followed in this project [15]. SCRUM adopts agile methodologies for managing complex information technology projects with innovative approaches. User stories were identified for the project and tasks were assigned to complete and answer each user story. The project was broken into 6 different sprints. A product backlog was then created and all tasks required to complete the application were determined. These tasks were then grouped into different sprints, assigned time frames, and prioritized according to importance (sprint planning meeting). The tasks for each sprint then became part of that sprint’s backlog. Sprints took one week to complete respectively. At the end of each sprint, an APK (Android installation file of the finished sprint) was built and a sprint review and retrospective meeting were held to grasp whether tasks would be improved or whether moved to the next sprint.
3.2 Design Approach: Participatory design
The team focused on participatory design, [18],[19], whereby the client is involved throughout the development process to ensure that all specifications are met and that the client can experience, interact and give advice or guidance on sections that the team might have misinterpreted or could add for a better experience and end product.
A. Project initiation: The team met with the client to indicate the possibilities of immersive applications and brainstormed how such applications could be used for their requirements. The following explains the three major stages (Analysis, Synthesis, and Evaluation) before the project ends as shown in Figure 1.
Stage 1: Analysis. Phase one was conducted over three weeks and involved the analysis of the project.
Stage 2: Synthesis. For the synthesis phase (based on participatory design), the project was broken into 6 sprints (which involves creating user stories and identifying subsequent tasks flowing out of each user story). The following sprints and main user stories were determined: Sprint 1 (one week) – User interface and interaction design, Navigation Hub, and birds-eye view used for point of interest navigation. Sprint 2 (one week) – Points of interest (360 still, video, and VR mode). Sprint 3 (one week) – Points of interest (content – record official footage). Sprint 4 (one week) – Augmented reality. Sprint 5 (one week) – Additional screens (Help, credits, etc.) and sounds. Sprint 6 (one week) – Optimize the code, application, and overall user interaction.
Stage 3: Evaluation. Testing was done constantly and after each sprint, a prototype application was built and tested on
– 109 –
Industry-driven digital transformation
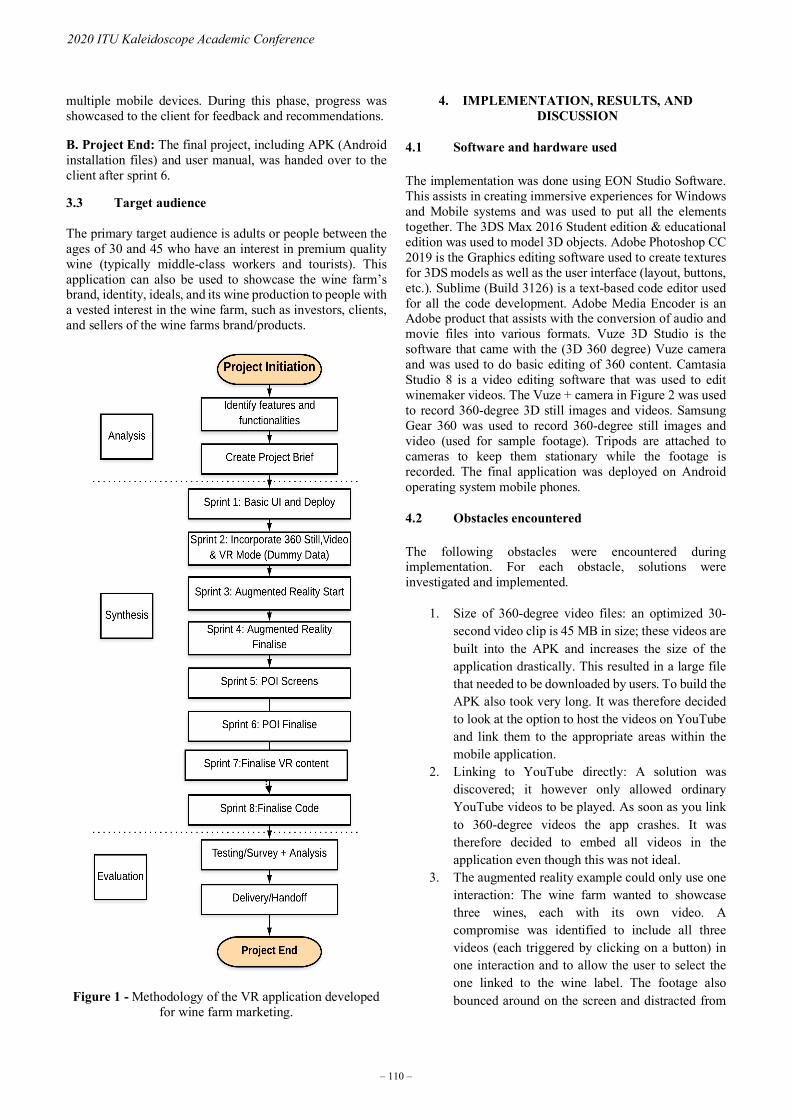
multiple mobile devices. During this phase, progress was showcased to the client for feedback and recommendations.
B. Project End: The final project, including APK (Android installation files) and user manual, was handed over to the client after sprint 6.
3.3 Target audience
The primary target audience is adults or people between the ages of 30 and 45 who have an interest in premium quality wine (typically middle-class workers and tourists). This application can also be used to showcase the wine farm’s brand, identity, ideals, and its wine production to people with a vested interest in the wine farm, such as investors, clients, and sellers of the wine farms brand/products.
Figure 1 - Methodology of the VR application developed for wine farm marketing.
4. IMPLEMENTATION, RESULTS, AND DISCUSSION
4.1 Software and hardware used
The implementation was done using EON Studio Software. This assists in creating immersive experiences for Windows and Mobile systems and was used to put all the elements together. The 3DS Max 2016 Student edition & educational edition was used to model 3D objects. Adobe Photoshop CC 2019 is the Graphics editing software used to create textures for 3DS models as well as the user interface (layout, buttons, etc.). Sublime (Build 3126) is a text-based code editor used for all the code development. Adobe Media Encoder is an Adobe product that assists with the conversion of audio and movie files into various formats. Vuze 3D Studio is the software that came with the (3D 360 degree) Vuze camera and was used to do basic editing of 360 content. Camtasia Studio 8 is a video editing software that was used to edit winemaker videos. The Vuze + camera in Figure 2 was used to record 360-degree 3D still images and videos. Samsung Gear 360 was used to record 360-degree still images and video (used for sample footage). Tripods are attached to cameras to keep them stationary while the footage is recorded. The final application was deployed on Android operating system mobile phones.
4.2 Obstacles encountered
The following obstacles were encountered during implementation. For each obstacle, solutions were investigated and implemented.
1. Size of 360-degree video files: an optimized 30-second video clip is 45 MB in size; these videos are built into the APK and increases the size of the application drastically. This resulted in a large file that needed to be downloaded by users. To build the APK also took very long. It was therefore decided to look at the option to host the videos on YouTube and link them to the appropriate areas within the mobile application.
2. Linking to YouTube directly: A solution was discovered; it however only allowed ordinary YouTube videos to be played. As soon as you link to 360-degree videos the app crashes. It was therefore decided to embed all videos in the application even though this was not ideal.
3. The augmented reality example could only use one interaction: The wine farm wanted to showcase three wines, each with its own video. A compromise was identified to include all three videos (each triggered by clicking on a button) in one interaction and to allow the user to select the one linked to the wine label. The footage also bounced around on the screen and distracted from
– 110 –
2020 ITU Kaleidoscope Academic Conference
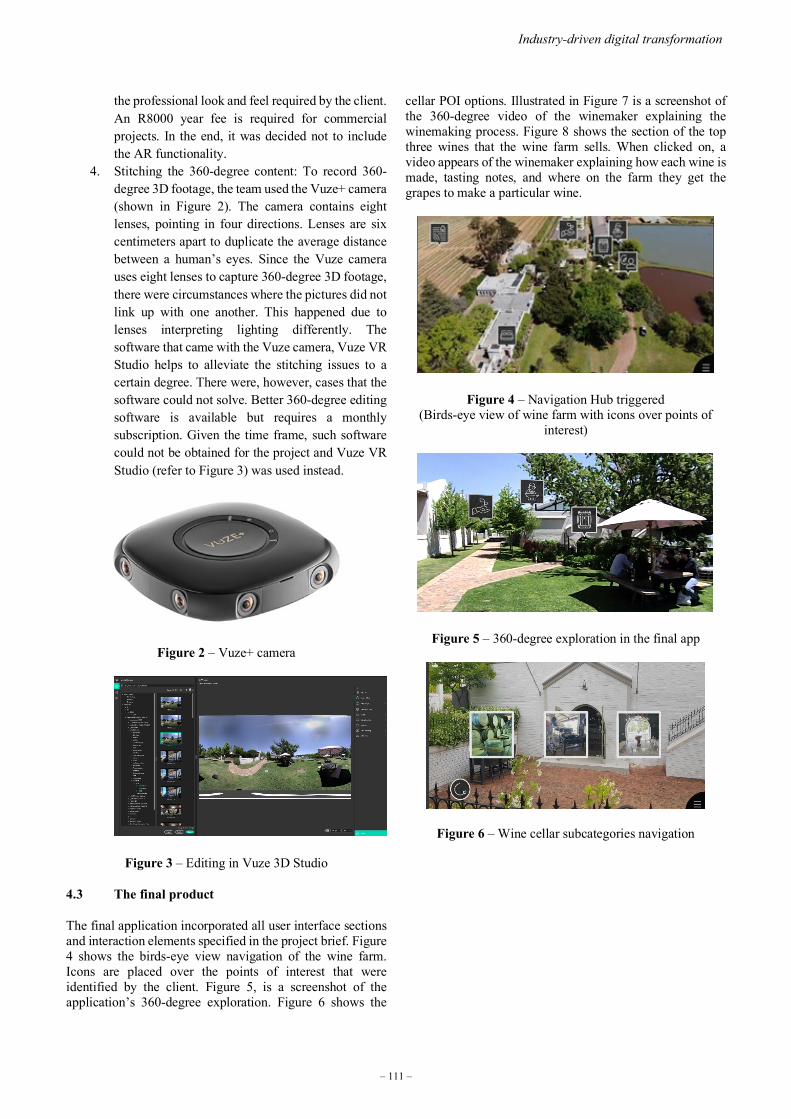
the professional look and feel required by the client. An R8000 year fee is required for commercial projects. In the end, it was decided not to include the AR functionality.
4. Stitching the 360-degree content: To record 360-degree 3D footage, the team used the Vuze+ camera (shown in Figure 2). The camera contains eight lenses, pointing in four directions. Lenses are six centimeters apart to duplicate the average distance between a human’s eyes. Since the Vuze camera uses eight lenses to capture 360-degree 3D footage, there were circumstances where the pictures did not link up with one another. This happened due to lenses interpreting lighting differently. The software that came with the Vuze camera, Vuze VR Studio helps to alleviate the stitching issues to a certain degree. There were, however, cases that the software could not solve. Better 360-degree editing software is available but requires a monthly subscription. Given the time frame, such software could not be obtained for the project and Vuze VR Studio (refer to Figure 3) was used instead.
Figure 2 – Vuze+ camera
Figure 3 – Editing in Vuze 3D Studio
4.3 The final product
The final application incorporated all user interface sections and interaction elements specified in the project brief. Figure 4 shows the birds-eye view navigation of the wine farm. Icons are placed over the points of interest that were identified by the client. Figure 5, is a screenshot of the application’s 360-degree exploration. Figure 6 shows the
cellar POI options. Illustrated in Figure 7 is a screenshot of the 360-degree video of the winemaker explaining the winemaking process. Figure 8 shows the section of the top three wines that the wine farm sells. When clicked on, a video appears of the winemaker explaining how each wine is made, tasting notes, and where on the farm they get the grapes to make a particular wine.
Figure 4 – Navigation Hub triggered (Birds-eye view of wine farm with icons over points of
interest)
Figure 5 – 360-degree exploration in the final app
Figure 6 – Wine cellar subcategories navigation
– 111 –
Industry-driven digital transformation
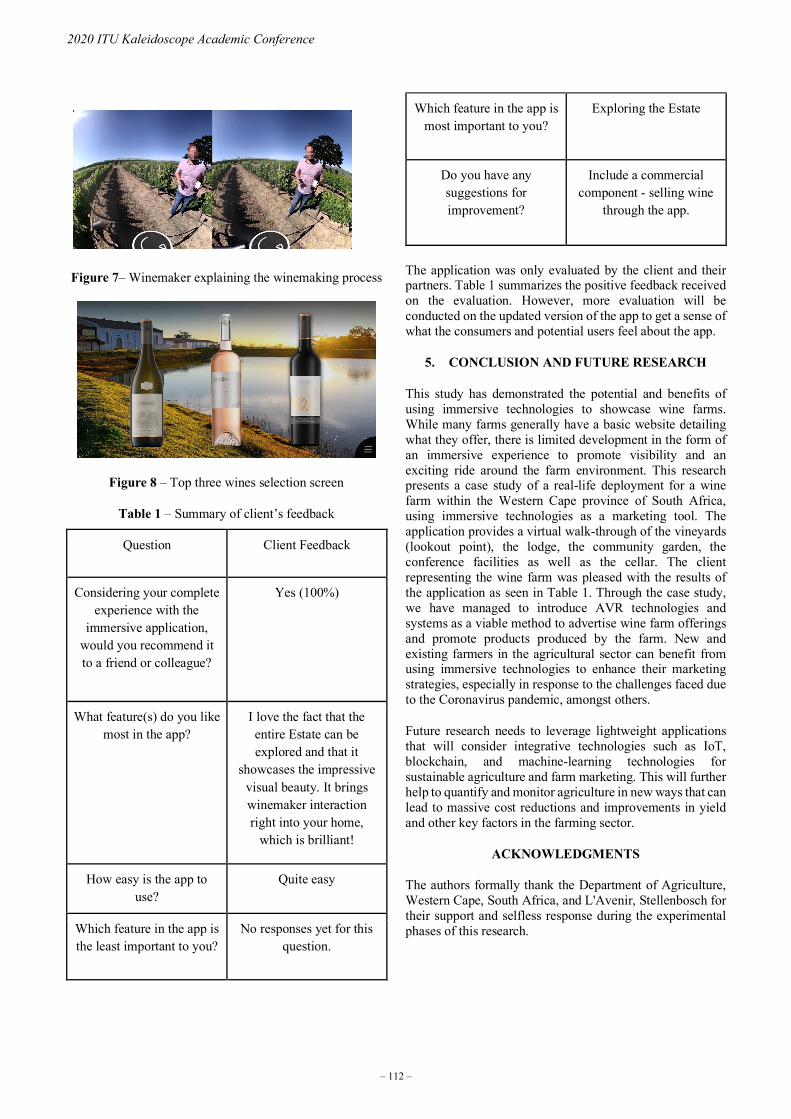
Figure 7– Winemaker explaining the winemaking process
Figure 8 – Top three wines selection screen
Table 1 – Summary of client’s feedback
Question Client Feedback
Considering your complete experience with the
immersive application, would you recommend it to a friend or colleague?
Yes (100%)
What feature(s) do you like most in the app?
I love the fact that the entire Estate can be explored and that it
showcases the impressive visual beauty. It brings winemaker interaction right into your home,
which is brilliant!
How easy is the app to use?
Quite easy
Which feature in the app is the least important to you?
No responses yet for this question.
Which feature in the app is most important to you?
Exploring the Estate
Do you have any suggestions for improvement?
Include a commercial component - selling wine
through the app.
The application was only evaluated by the client and their partners. Table 1 summarizes the positive feedback received on the evaluation. However, more evaluation will be conducted on the updated version of the app to get a sense of what the consumers and potential users feel about the app.
5. CONCLUSION AND FUTURE RESEARCH
This study has demonstrated the potential and benefits of using immersive technologies to showcase wine farms. While many farms generally have a basic website detailing what they offer, there is limited development in the form of an immersive experience to promote visibility and an exciting ride around the farm environment. This research presents a case study of a real-life deployment for a wine farm within the Western Cape province of South Africa, using immersive technologies as a marketing tool. The application provides a virtual walk-through of the vineyards (lookout point), the lodge, the community garden, the conference facilities as well as the cellar. The client representing the wine farm was pleased with the results of the application as seen in Table 1. Through the case study, we have managed to introduce AVR technologies and systems as a viable method to advertise wine farm offerings and promote products produced by the farm. New and existing farmers in the agricultural sector can benefit from using immersive technologies to enhance their marketing strategies, especially in response to the challenges faced due to the Coronavirus pandemic, amongst others.
Future research needs to leverage lightweight applications that will consider integrative technologies such as IoT, blockchain, and machine-learning technologies for sustainable agriculture and farm marketing. This will further help to quantify and monitor agriculture in new ways that can lead to massive cost reductions and improvements in yield and other key factors in the farming sector.
ACKNOWLEDGMENTS
The authors formally thank the Department of Agriculture, Western Cape, South Africa, and L'Avenir, Stellenbosch for their support and selfless response during the experimental phases of this research.
– 112 –
2020 ITU Kaleidoscope Academic Conference

REFERENCES
[1] “World statistics.” [Online]. Available: https://www.wosa.co.za/The-Industry/Statistics/World-Statistics/ [Accessed: 29-Jun-2020].
[2] E. Botha, “An Industry Under Pressure: The Influence of Economic, Technological and Environmental Pressures on the Social Sustainability of the South African Wine Industry,” in Social Sustainability in the Global Wine Industry, Springer International Publishing, 2020, pp. 15–25.
[3] M. Nicola et al., “The socio-economic implications of the coronavirus pandemic (COVID-19): A review,” 2020.
[4] F. Zhou, H. Been-Lirn Duh, and M. Billinghurst, Trends in Augmented Reality Tracking, Interaction and Display: A Review of Ten Years of ISMAR.
[5] D. A. Bowman and R. P. McMahan, “Virtual reality: How much immersion is enough?,” Computer (Long. Beach. Calif)., vol. 40, no. 7, pp. 36–43, Jul. 2007.
[6] P. Milgram and F. Kishino, “A Taxonomy of mixed reality displays, IEICE Transactions on Information Systems, Vol E77-D, No.12,” IEICE Trans. Inf. Syst., vol. E77-D, no. 12, pp. 1–15, 1994.
[7] S. M. C. Loureiro, J. Guerreiro, and F. Ali, “20 years of research on virtual reality and augmented reality in tourism context: A text-mining approach,” Tour. Manag., vol. 77, no. September 2018, 2020.
[8] Y. Dong and W. Yang, “Application of Virtual Simulation Technology in Course Reform of Rice Wine Brewing Process*,” vol. 416, no. Iccese, pp. 944–948, 2020.
[9] M. Gómez, M. A. Pratt, and A. Molina, “Wine tourism research: a systematic review of 20 vintages from 1995 to 2014,” Curr. Issues Tour., vol. 22, no. 18, pp. 2211–2249, 2019.
[10] M. C. Tafel and G. Szolnoki, “Relevance and challenges of wine tourism in Germany: a winery operators’ perspective,” Int. J. Wine Bus. Res., 2020.
[11] I. Booyens, “Tourism Innovation in the Western Cape, South Africa: Evidence from Wine Tourism,” Springer, Cham, 2020, pp. 183–202.
[12] M. Wedel, E. Bigné, and J. Zhang, “Virtual and augmented reality: Advancing research in consumer marketing,” Int. J. Res. Mark., 2020.
[13] S. M. C. Loureiro, J. Guerreiro, S. Eloy, D. Langaro, and P. Panchapakesan, “Understanding the use of Virtual Reality in Marketing: A text mining-based review,” J. Bus. Res., vol. 100, no. December 2017, pp. 514–530, 2019.
[14] R. Lavoie and C. King, “The virtual takeover: The influence of virtual reality on consumption,” Can. J. Adm. Sci., vol. 37, no. 1, pp. 9–12, 2020.
[15] N. Ionel, “Critical Analysis of the scrum project management methodology,” Ann. Univ. Oradea, Econ. Sci. Ser., vol. 17, no. 4, pp. 435–441, 2008.
[16] J. Zimmerman and J. Forlizzi, “Research through Design: Method for Interaction Design Research in HCI,” Chi 2011, pp. 167–189, 2011.[17] Ž. Obrenović, “Design-based research: What we learn when we engage in design of interactive systems,” Interactions, vol. 18, no. 5, pp. 56–59, 2011.
[18] L. Sanders and P. J. Stappers, “From designing to co-designing to collective dreaming: Three slices in time,” Interactions, vol. 21, no. 6, pp. 24–33, 2014.
[19] J. Lowgren, “Applying design methodology to software development,” Proc. Conf. Des. Interact. Syst. Process. Pract. Methods, Tech. DIS, vol. 23-25-Augu, pp. 87–95, 1995.
– 113 –
Industry-driven digital transformation


SESSION 7
AI, MACHINE LEARNING AND DIGITAL TRANSFORMATION
S7.1 AI-based W-band suspicious object detection system for moving persons using GAN:
Solutions, performance evaluation and standardization activities*
S7.2 An AI-based optimization of handover strategy in non-terrestrial networks*
S7.3 BSR: A balanced framework for single image super resolution

AI-BASED W-BAND SUSPICIOUS OBJECT DETECTION SYSTEM FOR MOVINGPERSONS USING GAN: SOLUTIONS, PERFORMANCE EVALUATION AND
STANDARDIZATION ACTIVITIES
Yutaka Katsuyama1; Keping Yu1; San Hlaing Myint1; Toshio Sato1; Zheng Wen2; Xin Qi1
1Global Information and Telecommunication Institute, Waseda University, Japan2School of Fundamental Science and Engineering, Waseda University, Japan
ABSTRACT
With the intensification of conflicts in different regions, theW-band suspicious object detection system is an essentialsecurity means to prevent terrorist attacks and is widely usedin many crucial places such as airports. Because artificialintelligence can performhighly reliable and accurate servicesin the field of image recognition, it is used in suspiciousobject detection systems to increase the recognition rate forsuspicious objects. However, it is challenging to establisha complete suspicious object database, and obtainingsufficient millimeter-wave images of suspicious objects fromexperiments for AI training is not realistic. To addressthis issue, this paper verifies the feasibility to generate alarge number of millimeter-wave images for AI training bygenerative adversarial networks. Moreover, we also evaluatethe factors that affect the AI recognition rate when theoriginal images used for CNN training are insufficient andhow to increase the service quality of AI-based W-bandsuspicious object detection systems for moving persons. Inparallel, all the international standardization organizationshave been collectively advancing the novel technologies ofAI. We update the reader with information about AI researchand standardization related activities in this paper.
Keywords - Artificial intelligence, generative adversarialnetwork, millimeter-wave imaging, suspicious object
detection system
1. INTRODUCTION
With the intensification of conflicts in various regions,terrorist attacks occur now and then. Many innocent peoplehave lost their lives due to terrorist attacks and it hasthreatened our daily lives and property. How to preventterrorist attacks has become a hot topic that gets a greatconcern worldwide. The suspicious object detection system[1] is an effective way to prevent the occurrence of terroristattackswhich have already largely taken place in public placessuch as airports, railway stations, etc [2], [3]. However, itis not wise to perform security checks one by one at theentrance of each gate since this will result in bottlenecks andcrowding. It is therefore necessary to perform automatedsuspicious object detection on moving people. In addition,artificial intelligence (AI) [4] and millimeter-wave (MMW)imaging [5], as emerging technologies, have been applied to
various suspicious object detection systems to increase theprobability of suspicious object recognition. Therefore, it isvery necessary to study AI-based W-band suspicious objectdetection systems for moving persons [6].With the expansive development of AI technologies, we willusher in the fourth industrial revolution led by AI. It makesour lives faster, easier, and safer. Cooperating with imagerecognition technologies [7], [8], AI can help suspiciousobject systems increase the recognition probability. To thisend, it is necessary to build a suspicious object databaseby means of simulation and the collection of images fromactive/passive imagers to assist in AI-based recognitiontechnologies. Comparedwith variousmatureAI technologiesfor image recognition, it is difficult to establish a suspiciousobject database. However, the suspicious object database isvery important because it directly affects the recognition rateof suspicious objects by AI technologies.Image generation via a generative adversarial network (GAN)[9] is a new idea to build a suspicious object database.GAN is a deep-learning model, which is regarded as oneof the most promising methods for unsupervised learningon complex distributions in recent years. In this suspiciousobject detection system, we try to supplement the suspiciousobject database by generating some images through the GAN.The images in the suspicious object database are generatedin three ways: simulation, collection of images fromactive/passive imagers, and GAN. For this suspicious objectdetection system, different types and number of images areused for training with a fixed AI model, the recognition ratesfor different suspicious objects are different. This paperwill evaluate the suspicious object database for an AI-basedW-band suspicious object detection system to get a higherrecognition rate for suspicious objects.AI technologies have recently attracted much attention fromthe research and standardization communities. Nationaland multi-national funded research projects have progressedworldwide. International Telecommunication Union -Telecommunication Standardization Sector (ITU-T) startedAI standardization activities in 2016. In March 2017,ITU-T Q5/SG20 initiated a new draft supplement ITU-TY.Sup.AI4IoT (ex TR.AI4ToT; Y. AI4SC) to examine howAI could step in as the saviour and bolster the intent ofurban stakeholders to deploy IoT technologies and eventuallytransition to smart cities. Moreover, many AI-related ITU-TFocus Groups are now widely used to address industry
978-92-61-31391-3/CFP2068P @ ITU 2020 Kaleidoscope – 117 –
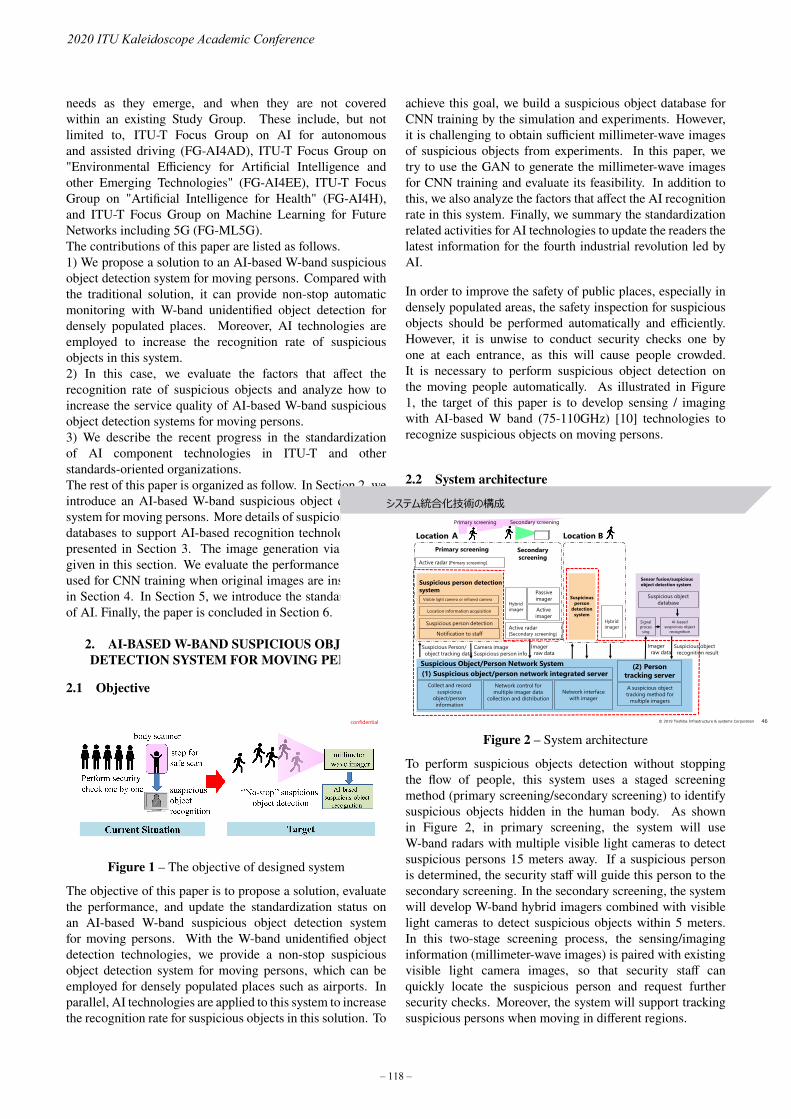
needs as they emerge, and when they are not coveredwithin an existing Study Group. These include, but notlimited to, ITU-T Focus Group on AI for autonomousand assisted driving (FG-AI4AD), ITU-T Focus Group on"Environmental Efficiency for Artificial Intelligence andother Emerging Technologies" (FG-AI4EE), ITU-T FocusGroup on "Artificial Intelligence for Health" (FG-AI4H),and ITU-T Focus Group on Machine Learning for FutureNetworks including 5G (FG-ML5G).The contributions of this paper are listed as follows.1) We propose a solution to an AI-based W-band suspiciousobject detection system for moving persons. Compared withthe traditional solution, it can provide non-stop automaticmonitoring with W-band unidentified object detection fordensely populated places. Moreover, AI technologies areemployed to increase the recognition rate of suspiciousobjects in this system.2) In this case, we evaluate the factors that affect therecognition rate of suspicious objects and analyze how toincrease the service quality of AI-based W-band suspiciousobject detection systems for moving persons.3) We describe the recent progress in the standardizationof AI component technologies in ITU-T and otherstandards-oriented organizations.The rest of this paper is organized as follow. In Section 2, weintroduce an AI-based W-band suspicious object detectionsystem for moving persons. More details of suspicious objectdatabases to support AI-based recognition technologies arepresented in Section 3. The image generation via GAN isgiven in this section. We evaluate the performance of GANused for CNN training when original images are insufficientin Section 4. In Section 5, we introduce the standardizationof AI. Finally, the paper is concluded in Section 6.
2. AI-BASED W-BAND SUSPICIOUS OBJECTDETECTION SYSTEM FOR MOVING PERSONS
2.1 Objective
Figure 1 – The objective of designed system
The objective of this paper is to propose a solution, evaluatethe performance, and update the standardization status onan AI-based W-band suspicious object detection systemfor moving persons. With the W-band unidentified objectdetection technologies, we provide a non-stop suspiciousobject detection system for moving persons, which can beemployed for densely populated places such as airports. Inparallel, AI technologies are applied to this system to increasethe recognition rate for suspicious objects in this solution. To
achieve this goal, we build a suspicious object database forCNN training by the simulation and experiments. However,it is challenging to obtain sufficient millimeter-wave imagesof suspicious objects from experiments. In this paper, wetry to use the GAN to generate the millimeter-wave imagesfor CNN training and evaluate its feasibility. In addition tothis, we also analyze the factors that affect the AI recognitionrate in this system. Finally, we summary the standardizationrelated activities for AI technologies to update the readers thelatest information for the fourth industrial revolution led byAI.
In order to improve the safety of public places, especially indensely populated areas, the safety inspection for suspiciousobjects should be performed automatically and efficiently.However, it is unwise to conduct security checks one byone at each entrance, as this will cause people crowded.It is necessary to perform suspicious object detection onthe moving people automatically. As illustrated in Figure1, the target of this paper is to develop sensing / imagingwith AI-based W band (75-110GHz) [10] technologies torecognize suspicious objects on moving persons.
2.2 System architecture
46confidential © 2019 Toshiba Infrastructure & systems Corporation
Primary screening
Primary screening
Visible light camera or infrared camera
Active radar [Primary screening]
Location information acquisition
Secondary
screening
Hybrid
imager
Signal
proces
sing
AI-based
suspicious object
recognition
Suspicious object
database
Suspicious person detection
system
Suspicious person detection
Passive
imager
Active
imager
Active radar[Secondary screening]
Collect and record
suspicious
object/person
information
Network control for
multiple imager data
collection and distribution
A suspicious object
tracking method for
multiple imagers
Network interface
with imager
Location A Location B
Sensor fusion/suspicious
object detection system
Notification to staff
Suspicious object
recognition resultCamera image
Suspicious person info
Imager
raw data
Suspicious Object/Person Network System
Secondary screening
Suspicious Person/
object tracking data
Imager
raw data
Hybrid
imager
Suspicious
person
detection
system
(1) Suspicious object/person network integrated server(2) Person
tracking server
システム統合化技術の構成
Figure 2 – System architecture
To perform suspicious objects detection without stoppingthe flow of people, this system uses a staged screeningmethod (primary screening/secondary screening) to identifysuspicious objects hidden in the human body. As shownin Figure 2, in primary screening, the system will useW-band radars with multiple visible light cameras to detectsuspicious persons 15 meters away. If a suspicious personis determined, the security staff will guide this person to thesecondary screening. In the secondary screening, the systemwill develop W-band hybrid imagers combined with visiblelight cameras to detect suspicious objects within 5 meters.In this two-stage screening process, the sensing/imaginginformation (millimeter-wave images) is paired with existingvisible light camera images, so that security staff canquickly locate the suspicious person and request furthersecurity checks. Moreover, the system will support trackingsuspicious persons when moving in different regions.
– 118 –
2020 ITU Kaleidoscope Academic Conference

2.2.1 Primary screening
In the preliminary screening, the visible light camera canmonitor each person in the surveillance area and recordtheir facial images and related information. At the sametime, the W-band radars can identify whether any personcarries a suspicious object (metal, etc.) 15 meters away.During this process, the suspicious object detection systemwill automatically pair the millimeter-wave image and visiblelight image for the detected same person. If a suspiciousperson is detected, the system will automatically track it andsend the security staff the relevant information to conduct asecondary screening.
2.2.2 Secondary screening
In the secondary screening, a hybrid imager composed ofactive and passive imagers will be employed to identify thedetailed suspicious objects (knife, gun, scissors, etc.) thesuspicious person is holding. In this process, visible lightcameras will also be used to help security staff identifysuspicious persons, and the generated visible light imageswill be associated with millimeter-wave images. Moreover,AI technology is used in this stage to increase the recognitionprobability for suspicious objects.
2.3 AI-based suspicious object recognition technologies
In order to increase the probability of identifying suspiciousobjects in this system, we used AI technology to assistthis process, which is based on the developed suspiciousobject database. Between different AI technologies, theconvolutional neural network (CNN) [4] is a representativedeep-learning technology for image recognition and imageclassification. Two critical features of CNN, whichmake it special with other neural networks, are reducingthe computational complexity and ensuring translationalinvariance. It mainly comprises two sections. The firstsection is used to extract the features and includes theconvolutional layer, pooling layer, batch normalization layer.The second section is in the same way as a neural networkworks and used to make the classification, which includesflatten layer, fully connected layer. In this paper, we directlyuse CNN technology so the performance of the AI partis determined by the CNN. Because the emphasis of thispaper is to verify the feasibility of generatingmillimeter-waveimages of suspicious objects for AI training throughGAN andevaluate the factors that will affect the AI recognition rate,rather than the CNN itself, the technical details of CNN willnot be described here.
3. SUSPICIOUS OBJECT DATABASE TO SUPPORTAI-BASED RECOGNITION TECHNOLOGIES
The AI-based suspicious object detection technology can beemployed to increase the recognition probability of suspiciousobjects in this system. To this end, there are three ways tobuild a suspicious object database: simulation, active/passiveimager, and GAN, which will be used for AI training.
3.1 Generation of a suspicious object database viasimulation
To establish a suspicious object database composed of variouspassive sensor images by simulation, two parameters shouldbe considered. First, we should consider the simulationenvironment of the entire system, including temperature,reflection, blur, variation, and noise. Then, the parameters ofsuspicious objects should be considered, including the type,size, rotation, transformation, etc. To this end, we generated44 kinds of bottles, 41 kinds of forks, 37 kinds of knives and45 kinds of scissors through simulation, with a total of 10516,9799, 8843, and 10755 samples, respectively.
3.2 Generation of a suspicious object database by meansof active/passive imagers
In addition to simulation, we also generate real experimentalimages for a suspicious object database through active orpassive millimeter-wave imaging. In this system, we builta simple anechoic chamber using active/passive imagersto generate real image data. Active or passive imagersgenerate millimeter-wave experimental images by letting theexperimenter carry different numbers and types of suspiciousobjects (knives, simulated bombs, guns, liquids, phones, etc.).During the experiment, the position of the experimenter andthe direction of suspicious object changes all the time, whichis kept as consistent as possiblewith the actual scene. Usually,suspicious objects are hidden in clothes or bags. In additionto this, we will also try to wrap suspicious objects withdifferent kinds of items (clothes, cotton, etc.). Throughout theexperiment, 52 samples were generated by the active imager,and 1009 samples were generated by the passive imager.
3.3 Generation of a suspicious object database via GAN
3.3.1 Fundamental of GAN
According to the description of [11], GANwas first proposedin [12]. It studies a two-player minimax game betweena generative network and a discriminative network .Taking noisy sample I ∼ ?(I) (sampled from a normal oruniform distribution) as the input, the generative network outputs new data (I), whose distribution ?6 should beclose to that of the data distribution ?30C0. At the sametime, the discriminative network is used to distinguish thegenerated sample (I) ∼ ?6 ( (I)). and the true data sampleG ∼ ?30C0 (G). In the original GAN, this adversarial trainingprocess was expressed as
<8=
<0G G∼?30C0 [;>6 (G)]+G∼?I [;>6(1− ( (I)))] (1)
3.3.2 Image generation via GAN
GAN consists of two neural networks. In Figure 3, one ofthe components is Generator, which as the name implies,generates data. The Generator inputs random noise (I)that corresponds to the characteristic seed of the generated
– 119 –
Industry-driven digital transformation

Z(noise) Generator
DataDataFake data
DataDataReal data
DiscriminatorReal or
Fake
Figure 3 – GAN architecture
data and maps this noise so that it approaches the desireddata. The other is Discriminator, which gives the fake datagenerated by the Generator and the real data, then judges theauthenticity. By competing these two networks alternatelyand advancing learning, theGenerator will be able to generatefake data that is close to real data, and the Discriminatorsees it as a fake. Generator then evolves the technologyto create more sophisticated counterfeits. These “playinggames” are repeated, and eventually a counterfeit that isclose to the real thing will be generated. In this paper,it is challenging to establish a complete suspicious objectdatabase only by active/passive imagers’ experiments andsimulations. To address this issue, we generate a large numberof millimeter-wave images by GAN based on the originalimages, which will be used for CNN training. Figure 4 showsan example of GAN images which include gun, knife, otherand scissor.
gun knife other scissor
Original images (experiments)
GAN images
gun knife other scissor
Figure 4 – Image generation via GAN
4. PERFORMANCE EVALUATION
Figure 5 – Prototype of CNN
This section describes the performance evaluation of asuspicious object database for AI-based W-band suspiciousobject detection system using GAN. The evaluation
processing is under the CNN environment. Figure 5 showsthe configuration of the CNN used to evaluate the proposedsuspicious object detection system. In addition to the inputand output layers, it includes five main types of layers:convolution, pooling, batch normalization, flatten, and fullyconnected. The network parameters for each layer are given inTable 1. In this experiment, we used four types of suspiciousobjects for the training and evaluation of the CNN: gun, knife,scissor and others.
4.1 CASE 1
Figure 6 – System architecture
Objective: A suspicious object database is the keycomponent of the AI-based W-band suspicious objectdetection system. It needs a large number of real experimentalimages generated by active/passive imagers, which will beemployed to CNN training for improving the recognition rateof suspicious objects. However, it’s impractical that all thetraining images are produced by the experiment. In this part,we try to generate more images via GAN for CNN trainingand verify its accuracy rate.
Method: In order to generate 4 categories of images viaGAN, we compose 4 different GANS, including gun, knife,other, and scissor. The real experimental images (118 guns(13%), 572 knives (66%), 139 other objects (16%), 43scissors(5%); total 872 images) by active/passive imagersare used to GAN training. Here we choose the epoch as 1000and batch_size as 32. After that, the GAN generates 1000guns, 1000 knives, 1000 other objects, and 1000 scissors forCNN training. To evaluate the accuracy rate of suspiciousobject detection system, we use the same proportion of realexperimental images with GAN training (58 guns (13%),285 knives (66%), 69 other objects (16%), and 21 scissors(5%)) in the CNN evaluation. In this processing, thereal experimental images used in GAN training and CNNevaluation are totally different.
Result: The blue line in Figure 6 shows the accuracy rateof CNN evaluation. It is approximately 87% without being
– 120 –
2020 ITU Kaleidoscope Academic Conference
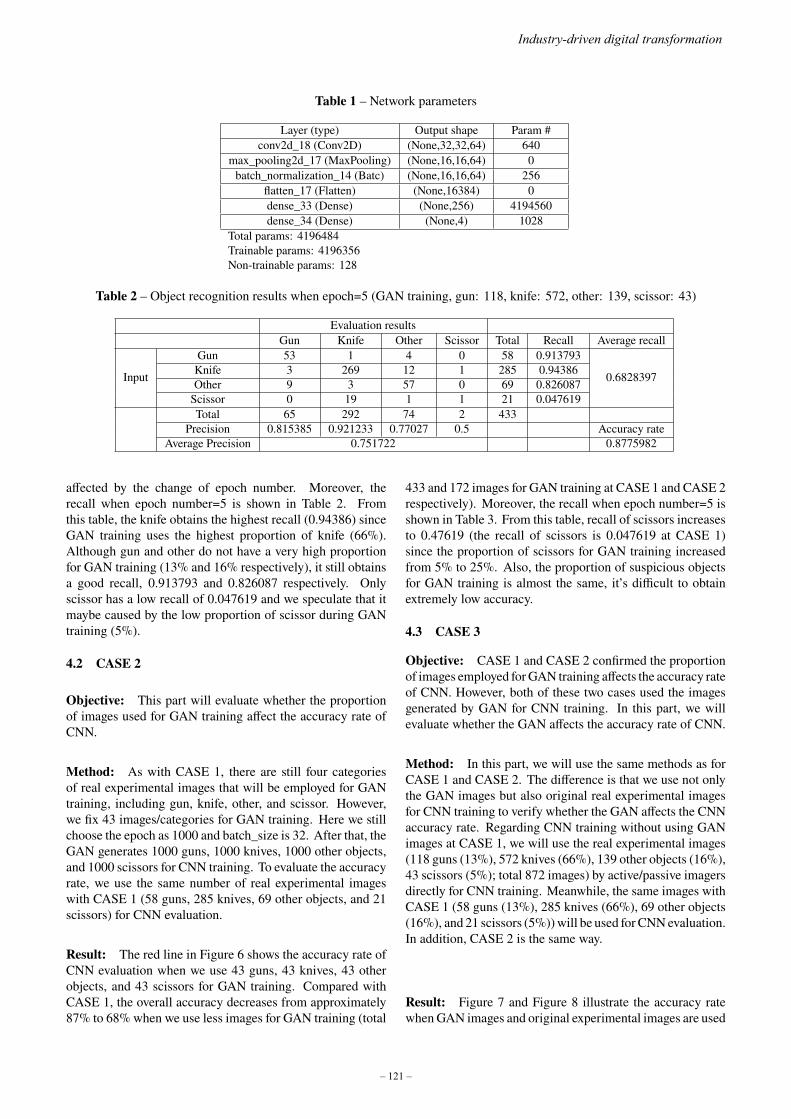
Table 1 – Network parameters
Layer (type) Output shape Param #conv2d_18 (Conv2D) (None,32,32,64) 640
max_pooling2d_17 (MaxPooling) (None,16,16,64) 0batch_normalization_14 (Batc) (None,16,16,64) 256
flatten_17 (Flatten) (None,16384) 0dense_33 (Dense) (None,256) 4194560dense_34 (Dense) (None,4) 1028
Total params: 4196484Trainable params: 4196356Non-trainable params: 128
Table 2 – Object recognition results when epoch=5 (GAN training, gun: 118, knife: 572, other: 139, scissor: 43)
Evaluation resultsGun Knife Other Scissor Total Recall Average recall
Input
Gun 53 1 4 0 58 0.913793
0.6828397Knife 3 269 12 1 285 0.94386Other 9 3 57 0 69 0.826087Scissor 0 19 1 1 21 0.047619Total 65 292 74 2 433
Precision 0.815385 0.921233 0.77027 0.5 Accuracy rateAverage Precision 0.751722 0.8775982
affected by the change of epoch number. Moreover, therecall when epoch number=5 is shown in Table 2. Fromthis table, the knife obtains the highest recall (0.94386) sinceGAN training uses the highest proportion of knife (66%).Although gun and other do not have a very high proportionfor GAN training (13% and 16% respectively), it still obtainsa good recall, 0.913793 and 0.826087 respectively. Onlyscissor has a low recall of 0.047619 and we speculate that itmaybe caused by the low proportion of scissor during GANtraining (5%).
4.2 CASE 2
Objective: This part will evaluate whether the proportionof images used for GAN training affect the accuracy rate ofCNN.
Method: As with CASE 1, there are still four categoriesof real experimental images that will be employed for GANtraining, including gun, knife, other, and scissor. However,we fix 43 images/categories for GAN training. Here we stillchoose the epoch as 1000 and batch_size is 32. After that, theGAN generates 1000 guns, 1000 knives, 1000 other objects,and 1000 scissors for CNN training. To evaluate the accuracyrate, we use the same number of real experimental imageswith CASE 1 (58 guns, 285 knives, 69 other objects, and 21scissors) for CNN evaluation.
Result: The red line in Figure 6 shows the accuracy rate ofCNN evaluation when we use 43 guns, 43 knives, 43 otherobjects, and 43 scissors for GAN training. Compared withCASE 1, the overall accuracy decreases from approximately87% to 68% when we use less images for GAN training (total
433 and 172 images for GAN training at CASE 1 and CASE 2respectively). Moreover, the recall when epoch number=5 isshown in Table 3. From this table, recall of scissors increasesto 0.47619 (the recall of scissors is 0.047619 at CASE 1)since the proportion of scissors for GAN training increasedfrom 5% to 25%. Also, the proportion of suspicious objectsfor GAN training is almost the same, it’s difficult to obtainextremely low accuracy.
4.3 CASE 3
Objective: CASE 1 and CASE 2 confirmed the proportionof images employed forGAN training affects the accuracy rateof CNN. However, both of these two cases used the imagesgenerated by GAN for CNN training. In this part, we willevaluate whether the GAN affects the accuracy rate of CNN.
Method: In this part, we will use the same methods as forCASE 1 and CASE 2. The difference is that we use not onlythe GAN images but also original real experimental imagesfor CNN training to verify whether the GAN affects the CNNaccuracy rate. Regarding CNN training without using GANimages at CASE 1, we will use the real experimental images(118 guns (13%), 572 knives (66%), 139 other objects (16%),43 scissors (5%); total 872 images) by active/passive imagersdirectly for CNN training. Meanwhile, the same images withCASE 1 (58 guns (13%), 285 knives (66%), 69 other objects(16%), and 21 scissors (5%))will be used forCNNevaluation.In addition, CASE 2 is the same way.
Result: Figure 7 and Figure 8 illustrate the accuracy ratewhenGAN images and original experimental images are used
– 121 –
Industry-driven digital transformation

Table 3 – Object recognition results when epoch=5 (GAN training, gun: 43, knife: 43, other: 43, scissor: 43)
Evaluation resultsGun Knife Other Scissor Total Recall Average recall
Input
Gun 42 1 14 1 58 0.724138
0.6867717Knife 5 193 33 54 285 0.677193Other 5 4 60 0 69 0.869565Scissor 1 5 5 10 21 0.47619Total 53 203 112 65 433
Precision 0.792453 0.950739 0.535714 0.153846 Accuracy rateAverage Precision 0.608188 0.704388
Figure 7 – Extend for CASE 1
Figure 8 – Extend for CASE 2
for CNN training respectively. From the figures, we canconclude that the accuracy rate of GAN images is higherwhen the real experimental images used for CNN trainingas well as the CNN epoch number are small. It is moreaccurate to use original images for CNN training with theCNN epoch number increasing. Compared with these twofigures, with more original images for CNN training (Figure7), the above mentioned tendency becomes more remarkableand the accuracy of original images will faster exceed theGAN images (e.g. less CNN epoch number). Moreover,the ROC curve calculated based on Figure 8 was used toevaluate the system. From this figure, we can get the sameconclusion with Figure 8 when epoch is 50. Both GANimages and original images, which are used for CNN training,will achieve an excellent recognition rate. In general, theGAN images are better than original images when epochnumber is 50.
Figure 9 – ROC curve
5. STANDARDIZATION
Currently, AI technologies have been successfully appliedin fields such as finance, security, customer service,and other industries. Standardization has a primary,supporting, and leading role in the development of AIand its industry. In recent years, different standardizationorganization has been studying AI issues and standardizingrelated technologies.In the early stage, ISO/IEC JTC 1 hascarried out relevant standardization in key areas of AIsuch as artificial intelligence vocabulary, human-computerinteraction, biometric features recognition, computerimage processing, and corresponding areas supported byAI technologies such as cloud computing, big data,and sensor networks. ISO has mainly carried outAI standardization research in industrial robots (ISO11593:1996, ISO 9946:1999, ISO 14539:2000, ISO9787:1999, ISO 8373:2012), smart finance (ISO 19092:2008,ISO 14742:2010, ISO 19038:2005), and smart driving(ISO/TC 22 is responsible for formulating basic standardsrelated to road vehicles, and is conducting research onstandardization of intelligent connected vehicles). IEC hasmainly carried out artificial intelligence standardization in thefield of wearable devices (IEC TC100 and IEC TC124). ITUhas worked on the development of AI standards since 2016.ITU-T has proposed draft proposals for AI, including ITU-TY.AI4SC (Artificial Intelligence and IoT) and ITU-TY.qos-ml(Requirements of machine-learning-based QoS assurance),etc.
6. CONCLUSION
In this work, an AI-basedW-band suspicious object detectionsystem for moving persons are introduced. By employing
– 122 –
2020 ITU Kaleidoscope Academic Conference

AI-based suspicious object recognition technologies for thissystem, it can greatly improve the recognition rate forsuspicious objects. To achieve this goal, we built a suspiciousobject database for CNN training by GAN and active/passiveimagers. In the evaluation section, we prove how to getan optimal recognition rate when the original images usedfor CNN training are not enough. This work is significant forimproving the service quality of AI-basedW-band suspiciousobject detection systems for moving persons. Moreover, weintroduce the corresponding standardization activities.
ACKNOWLEGEMENT
This work was supported by the Research Grant forExpanding RadioWave Resources in FY2020 of the Ministryof Internal Affairs and Communications through a Contractfor Research and Development of Radar FundamentalTechnology for Advanced Recognition of Moving Objectsfor Security Enhancement under Grant JPJ000254.
REFERENCES
[1] T. Joshi, H. Aarya, and P. Kumar, “Suspicious objectdetection,” in 2016 2nd International Conference onAdvances in Computing, Communication, Automation(ICACCA) (Fall), 2016, pp. 1–6.
[2] H. Li, M. Zhang, K. Yu, X. Qi, Q. Hua, and Y. Zhu,“R3mr: Region growing based 3d mesh reconstructionfor big data platform,” IEEE Access, vol. 8, pp.91 740–91 750, 2020.
[3] Q. Liu, B. Kang, K. Yu, X. Qi, J. Li, S. Wang, and H. Li,“Contour-maintaining-based image adaption for anefficient ambulance service in intelligent transportationsystems,” IEEEAccess, vol. 8, pp. 12 644–12 654, 2020.
[4] S. Ren, K. He, R. Girshick, and J. Sun, “Faster r-cnn:Towards real-time object detection with region proposalnetworks,” IEEE Transactions on Pattern Analysis andMachine Intelligence, vol. 39, no. 6, pp. 1137–1149,2017.
[5] L. Yujiri, M. Shoucri, and P. Moffa, “Passive millimeterwave imaging,” IEEE Microwave Magazine, vol. 4,no. 3, pp. 39–50, 2003.
[6] K. Yu, X. Qi, T. Sato, S. H. Myint, Z. Wen,Y. Katsuyama, K. Tokuda, W. Kameyama, and T. Sato,“Design and performance evaluation of an ai-basedw-band suspicious object detection system for movingpersons in the iot paradigm,” IEEE Access, vol. 8, pp.81 378–81 393, 2020.
[7] H. Li, M. Zhang, K. Yu, J. Zhang, Q. Hua,B. Wu, and Z. Yu, “Combined forecasting model ofcloud computing resource load for energy-efficient iotsystem,” IEEE Access, vol. 7, pp. 149 542–149 553,2019.
[8] H. Li, J. Fan, K. Yu, X. Qi, Z. Wen, Q. Hua, M. Zhang,and Q. Zheng, “Medical image coloring based on gabor
filtering for internet of medical things,” IEEE Access,vol. 8, pp. 104 016–104 025, 2020.
[9] C. Ledig, L. Theis, F. Huszár, J. Caballero,A. Cunningham, A. Acosta, A. Aitken, A. Tejani,J. Totz, Z. Wang, and W. Shi, “Photo-realistic singleimage super-resolution using a generative adversarialnetwork,” in 2017 IEEEConference onComputer Visionand Pattern Recognition (CVPR), 2017, pp. 105–114.
[10] A. Tessmann, S. Kudszus, T. Feltgen, M. Riessle,C. Sklarczyk, and W. H. Haydl, “Compactsingle-chip w-band fmcw radar modules forcommercial high-resolution sensor applications,”IEEE Transactions on Microwave Theory andTechniques, vol. 50, no. 12, pp. 2995–3001, 2002.
[11] C. Wang, C. Xu, X. Yao, and D. Tao, “Evolutionarygenerative adversarial networks,” IEEE Transactions onEvolutionary Computation, vol. 23, no. 6, pp. 921–934,2019.
[12] I. Goodfellow, J. Pouget-Abadie, M. Mirza, B. Xu,D. Warde-Farley, S. Ozair, A. Courville, and Y. Bengio,“Generative adversarial nets,” in Advances in neuralinformation processing systems, 2014, pp. 2672–2680.
– 123 –
Industry-driven digital transformation


AN AI-BASED OPTIMIZATION OF HANDOVER STRATEGY IN NON-TERRESTRIALNETWORKS
Chenchen Zhang; Nan Zhang; Wei Cao; Kaibo Tian; Zhen Yang
State Key Laboratory of Mobile Network and Mobile Multimedia Technology, ZTE Corporation, China
ABSTRACT
A complicated radio resource management, e.g., handovercondition, will be suffered by the user in non-terrestrialnetworks due to the impact of high mobility and hierarchicallayouts which co-exist with terrestrial networks or variousplatforms at different altitudes. It is necessary to optimizethe handover strategy to reduce the signaling overheadand improve the service continuity. In this paper, a newhandover strategy is proposed based on the convolutionalneural network. Firstly, the handover process is modeledas a directed graph. Suppose a user knows its future signalstrength, then it can search for the best handover strategybased on the graph. Secondly, a convolutional neuralnetwork is used to extract the underlying regularity of thebest handover strategies of different users, based on whichany user canmake near-optimal handover decision accordingto its historical signal strength. Numerical simulation showsthat the proposed handover strategy can efficiently reduce thehandover number while ensuring the signal strength.
Keywords - Convolutional neural network, directed graph,handover, low earth orbit, non-terrestrial network
1. INTRODUCTION
The non-terrestrial network (NTN) has been regarded as asupplement to the fifth generation (5G) terrestrial mobilenetwork for providing global coverage and service continuity[1]. Compared with terrestrial networks, the handover inNTN is more frequent and complex. In this paper, a handoveroptimization method is proposed and applied to a typicalNTN scenario, i.e., low earth orbit (LEO) satellite network.A LEO is an orbit around the earth with an altitude between500 km and 2000 km [1]. Compared with geostationary earthorbit satellites, the LEO satellites have much lower path-lossand propagation delay. Therefore, the third generationpartnership project (3GPP) NTN study item has regardedthe LEO satellites as the key component to provide globalbroadband Internet access. Suppose the orbit is circular, thesatellite will move around the earth in a constant velocitywhich is inversely proportional to the square root of the orbitaltitude. Because of the low altitude, the LEO satellites havehigh speed with respect to the earth, and a terrestrial userequipment (UE) needs to frequently switch to new beamsto keep connectivity. In order to ensure the quality of theInternet service, the optimization for handover strategy needsto be carefully investigated.
Previous studies generally make handover decisions based onone or more predefined criteria. The most commonly usedcriteria include elevation angle [2], remaining service time[3]and number of free channels [4], which correspond to signalstrength, handover number and satellite burden, respectively.But these methods cannot get an overall optimization. In[5], an overall optimization method is proposed by modellingthe handover process by a directed graph. Each satellite isdenoted by a node, then the best handover strategy is obtainedby searching the shortest path. However, in [5] each satellitenode is invariable during the handover process. AUEneeds toperform handover as soon as entering the coverage of anotherbeam and cannot choose an appropriate time. Besides, theUE needs to predict its coverage condition in a future time toconstruct the graph, which may bring unexpected error andis beyond the capability of a standard 5G UE.
In recent years, some artificial intelligence (AI) techniqueshave been applied to search overall optimization on handover.The most often used technique is the Q-learning [6], [7], [8],which is typical model-free reinforcement learning (RL). InQ-learning, some properties of a UE are defined as its state,and the handover operation is defined as action. Numericalsimulation is used to iteratively train the Q-table (the rewardof each action for each state) until its convergence. Then theUE is able to decide whether to perform handover accordingto its state. Furthermore, the Q-table can be replaced by aneural network for an infinite number of states. In paper [8],the handover in an LEO scenario is optimized by Q-learning.The state of a UE is composed by its position, accessiblesatellites and whether handover is processed in this timeslot. In each time slot, the UE is required to know its ownstate and will choose a satellite for handover, which is areally strong requirement for an ordinary UE. Besides RL, arecursive neural network (RNN) also can be used for handoveroptimization. Papers [9] and [10] apply RNN for handoveroptimization in terrestrial millimeter wave mobile systemsand vehicular networks, respectively. However, in an LEOscenario the beam switch is fast, and the signal series of onebeam may be too short for the RNN to make decisions.
In practical terms, a handover strategy with a low requirementfor UE capability is desired to reduce the handover numberwhile ensuring the reference signal received power (RSRP).In this paper, a convolutional neural network (CNN) basedhandover strategy optimization is proposed. Firstly, a numberof UEs are randomly generated within the coverage of a
978-92-61-31391-3/CFP2068P @ ITU 2020 Kaleidoscope – 125 –
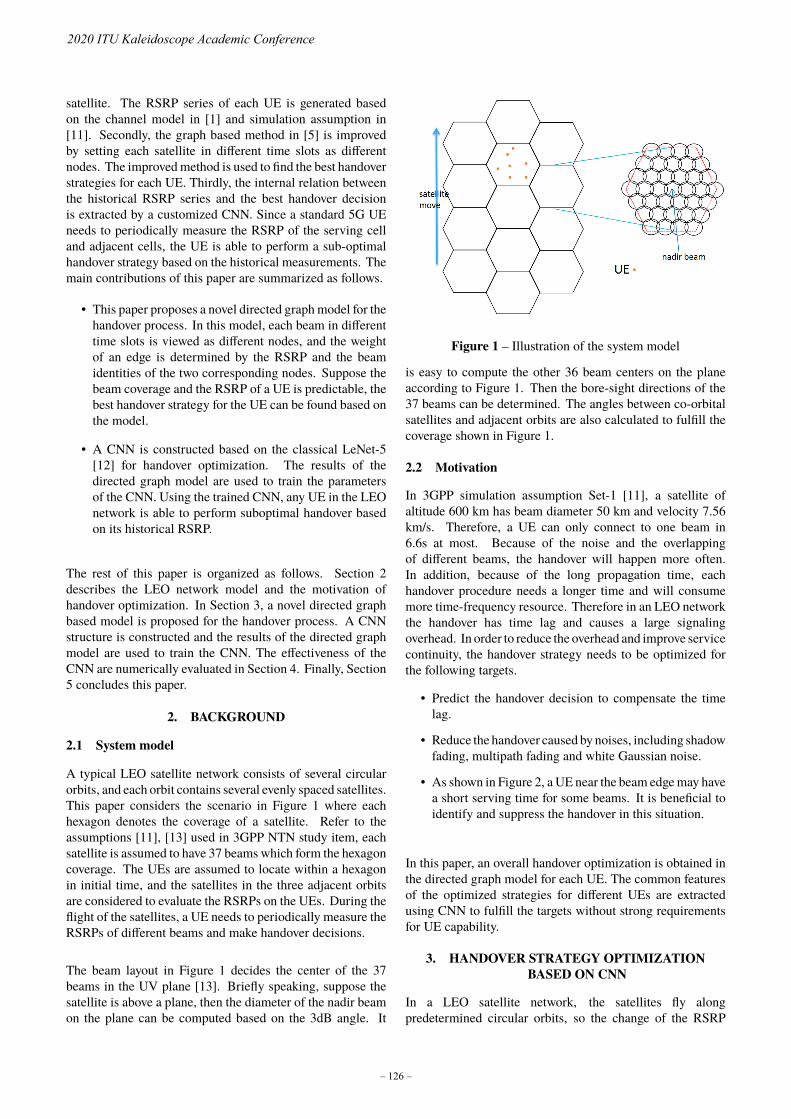
satellite. The RSRP series of each UE is generated basedon the channel model in [1] and simulation assumption in[11]. Secondly, the graph based method in [5] is improvedby setting each satellite in different time slots as differentnodes. The improvedmethod is used to find the best handoverstrategies for each UE. Thirdly, the internal relation betweenthe historical RSRP series and the best handover decisionis extracted by a customized CNN. Since a standard 5G UEneeds to periodically measure the RSRP of the serving celland adjacent cells, the UE is able to perform a sub-optimalhandover strategy based on the historical measurements. Themain contributions of this paper are summarized as follows.
• This paper proposes a novel directed graphmodel for thehandover process. In this model, each beam in differenttime slots is viewed as different nodes, and the weightof an edge is determined by the RSRP and the beamidentities of the two corresponding nodes. Suppose thebeam coverage and the RSRP of a UE is predictable, thebest handover strategy for the UE can be found based onthe model.
• A CNN is constructed based on the classical LeNet-5[12] for handover optimization. The results of thedirected graph model are used to train the parametersof the CNN. Using the trained CNN, any UE in the LEOnetwork is able to perform suboptimal handover basedon its historical RSRP.
The rest of this paper is organized as follows. Section 2describes the LEO network model and the motivation ofhandover optimization. In Section 3, a novel directed graphbased model is proposed for the handover process. A CNNstructure is constructed and the results of the directed graphmodel are used to train the CNN. The effectiveness of theCNN are numerically evaluated in Section 4. Finally, Section5 concludes this paper.
2. BACKGROUND
2.1 System model
A typical LEO satellite network consists of several circularorbits, and each orbit contains several evenly spaced satellites.This paper considers the scenario in Figure 1 where eachhexagon denotes the coverage of a satellite. Refer to theassumptions [11], [13] used in 3GPP NTN study item, eachsatellite is assumed to have 37 beams which form the hexagoncoverage. The UEs are assumed to locate within a hexagonin initial time, and the satellites in the three adjacent orbitsare considered to evaluate the RSRPs on the UEs. During theflight of the satellites, a UE needs to periodically measure theRSRPs of different beams and make handover decisions.
The beam layout in Figure 1 decides the center of the 37beams in the UV plane [13]. Briefly speaking, suppose thesatellite is above a plane, then the diameter of the nadir beamon the plane can be computed based on the 3dB angle. It
Figure 1 – Illustration of the system model
is easy to compute the other 36 beam centers on the planeaccording to Figure 1. Then the bore-sight directions of the37 beams can be determined. The angles between co-orbitalsatellites and adjacent orbits are also calculated to fulfill thecoverage shown in Figure 1.
2.2 Motivation
In 3GPP simulation assumption Set-1 [11], a satellite ofaltitude 600 km has beam diameter 50 km and velocity 7.56km/s. Therefore, a UE can only connect to one beam in6.6s at most. Because of the noise and the overlappingof different beams, the handover will happen more often.In addition, because of the long propagation time, eachhandover procedure needs a longer time and will consumemore time-frequency resource. Therefore in an LEO networkthe handover has time lag and causes a large signalingoverhead. In order to reduce the overhead and improve servicecontinuity, the handover strategy needs to be optimized forthe following targets.
• Predict the handover decision to compensate the timelag.
• Reduce the handover caused by noises, including shadowfading, multipath fading and white Gaussian noise.
• As shown in Figure 2, a UE near the beam edgemay havea short serving time for some beams. It is beneficial toidentify and suppress the handover in this situation.
In this paper, an overall handover optimization is obtained inthe directed graph model for each UE. The common featuresof the optimized strategies for different UEs are extractedusing CNN to fulfill the targets without strong requirementsfor UE capability.
3. HANDOVER STRATEGY OPTIMIZATIONBASED ON CNN
In a LEO satellite network, the satellites fly alongpredetermined circular orbits, so the change of the RSRP
– 126 –
2020 ITU Kaleidoscope Academic Conference

Figure 2 – An example of UE near beam edge
has strong regularity. The regularity can be used to improvethe handover decision. Specifically, in each time slot theprevious N RSRP values of a UE form a series, and somekinds of RSRP series imply that the UE should start handover.In this section, those kinds of RSRP series are found in twosteps. First the RSRP of each UE during a long period ismeasured and recorded. A directed graph model is proposedto search the best handover decision in every time slot. Thenthe handover decision is regarded as the label for the previousN RSRP values of that time slot to be trained by the CNN. Theproposed CNN can efficiently extract the common regularityof handover decisions for different UEs.
3.1 A novel directed graph based model
The directed graph based model in [5] is designed to searchthe optimal handover strategy. However, the UE needs to starthandover as soon as entering the coverage of next satellite,which means it cannot choose a more appropriate handovertime. This subsection proposes an improved directed graphbased model to solve the problem.
3.1.1 The referenced model in [5]
In paper [5], every satellite is modeled as a node. If thebeginning or ending of the coverage of one satellite is betweenanother satellite’s coverage period, then there exists a directededge between the two satellites, whichmeans that a UE is ableto perform handover between the two satellites. The weightof the edge is determined by the chosen criteria in the twosatellites. For example, suppose only the criterion “handovernumber” is considered, then the weight of every edge shouldbe set to be 1. If the other criteria such as “number of freechannel” or “elevation angle” are considered, the weight canbe set according to the two criteria of the target satellite.The Dijkstra’s shortest path algorithm can be used to searchthe path with the smallest or largest weight. By choosingappropriate criteria, the resulting path becomes the overalloptimal handover strategy.
An example of satellite coverage time and the correspondingdirected graph in the referenced model are shown in Figure3. The node 0 denotes the initial time and other nodes denotefour satellites. In this model, the node and the edge weightare invariable during the handover process. The weights of
Figure 3 – The directed graph in the referenced model
the edges cannot reflect the change process of the elevationangles or other criteria of the satellites. The UE can onlyassume that the handover happens as soon as it is entering thecoverage of another satellite.
3.1.2 The proposed model
By considering the variation of satellites during the handoverprocess, a novel model can be constructed to generate morereasonable optimization for handover. The basic idea is toregard a beam in different time slots as different nodes. Asshown in Figure 4, we assume that in each time slot the servingbeam of a UE is one of the K strongest beams. The beamtk
denotes the k−th strongest beam in the t-th time slot. Everytwo nodes in adjacent time slots are connected by an edge,which means that the handover between them is possible.
Figure 4 – The directed graph in the proposed model
Similar to [5], the weights of the edges can be set according todifferent criteria for an overall optimization. For the sake ofsimplicity, this paper only considers the RSRP strength andhandover number. Then the weight of the edge from beamt1k1to beamt2k2 can be defined as
w1 ∗ RSRPt1k1 − w2 ∗ handoverFlag, (1)
where RSRPt1k1 denote the RSRP value of beamt1k1 andhandoverFlag = 1 if beamt1k1 and beamt2k2 are twodifferent beams. When the signal-to-noise ratio is small,the channel capacity is proportional to the signal strength.Therefore w1 ∗ RSRPt1k1 in Equation (1) denotes the benefitof connecting beamt1k1 in t1-th time slot, where w1 is a
– 127 –
Industry-driven digital transformation

predetermined parameter. Similarly, the parameters w2 ischosen according to the degree of negative impact of onehandover. By using the Dijkstra’s shortest path algorithm, wecan find the longest path from the first time slot to the lasttime slot, which is actually the optimal handover strategy forthis UE.
3.2 A CNN based optimization for handover
RSRP is defined as the linear average over the power ofthe resource elements that carry some predefined referencesignals. Assume a UE can predict the RSRP of differentbeams for a long period, then the method in Subsection3.1.2 can be used to find the optimal handover strategy.However, in most cases a UE only knows its historical RSRP.A standard 5G UE needs to measure the RSRPs of detectablecells, and handover to the strongest cell if its RSRP minusa predetermined threshold is larger than the serving RSRP.In this way the information hidden in the historical RSRP isignored. Actually, at least in the LEO scenario, the historicalRSRP is able to help UEs to make suboptimal handoverdecisions. The series of historical RSRPs of the strongestK beams in each time slot forms a two-dimensional matrix.A customized CNN is used to optimize the handover decisionbased on the matrix in this subsection.
CNN is an effective tool to elicit information fromtwo-dimensional data. It has been widely used to extractfeatures from images. A classical CNN consists ofone or more convolutional layers, pooling layers, andfully-connected layers. The features of the input data areextracted layer by layer, and are summarized in the lastfully-connected layer to generate the final output. Comparedto the fully-connected layer, the convolutional layer takesadvantage of the strong local spatial correlation in naturalimages and only has a few parameters to be trained. Itis worth mentioning that the matrix of RSRP also has the“local spatial correlation”, i.e., the cooperation of the RSRPvalues in adjacent time slots and the RSRP values of thenearest 3 or 4 beams are more likely to contain informationfor handover decisions. Therefore it is suitable to apply CNN
to the problem of handover.
Intuitively, the RSRP series in the LEO network has strongregularity, so a relatively simple neural network structureshould be chosen to reduce the training time and preventoverfitting. The LeNet-5 [12] was firstly designed forcharacter recognition and is a relatively simple modern CNNstructure. The default size of the input of LeNet-5 is 32× 32.However, in the LEO network model presented in Subsection2.1, the number of detectable beams for one UE is generallysmaller than 32. Therefore the size of the input data needsto be reduced. Actually, in the simulation the number ofconsidered beams in each time slot is set to be 10. The lengthof a time slot is set to be 0.5s and the RSRP values in theprevious 10 time slots are used to form the input. Then theinput of the CNN is a matrix of size 10× 10. In LeNet-5, twoconvolutional layers are used. The two convolution kernelsboth have size 5 × 5. Besides, two pooling layers are usedto reduce the number of trained parameters. Because ofthe reduced input size, some layers in LeNet-5 need to becustomized. First, one convolution kernel is reduced to havesize 3 × 3. Then the pooling layers are deleted since thenumber of parameters is not large. The structure of theresulting CNN is presented in Figure 5. The output of size 10is corresponding to the 10 kinds of handover decisions, i.e.,which one of the 10 strongest beams the UE will connect inthe next time slot.
The data preprocessing and the training procedure consist offour steps as follows.
1. For every UE, generate the RSRP values of differentsatellites in every time slot. If one satellite is invisibleor its signal is too weak to detect, then the RSRP valuesare regarded as 0.
2. Compute the best handover strategy for every UEbased on the proposed directed graph based method inSubsection 3.1.2.
3. For every UE in every time slot, the previous 10 RSRPvalues of the 10 strongest beams are used to form a
Figure 5 – The CNN structure for handover optimization
– 128 –
2020 ITU Kaleidoscope Academic Conference
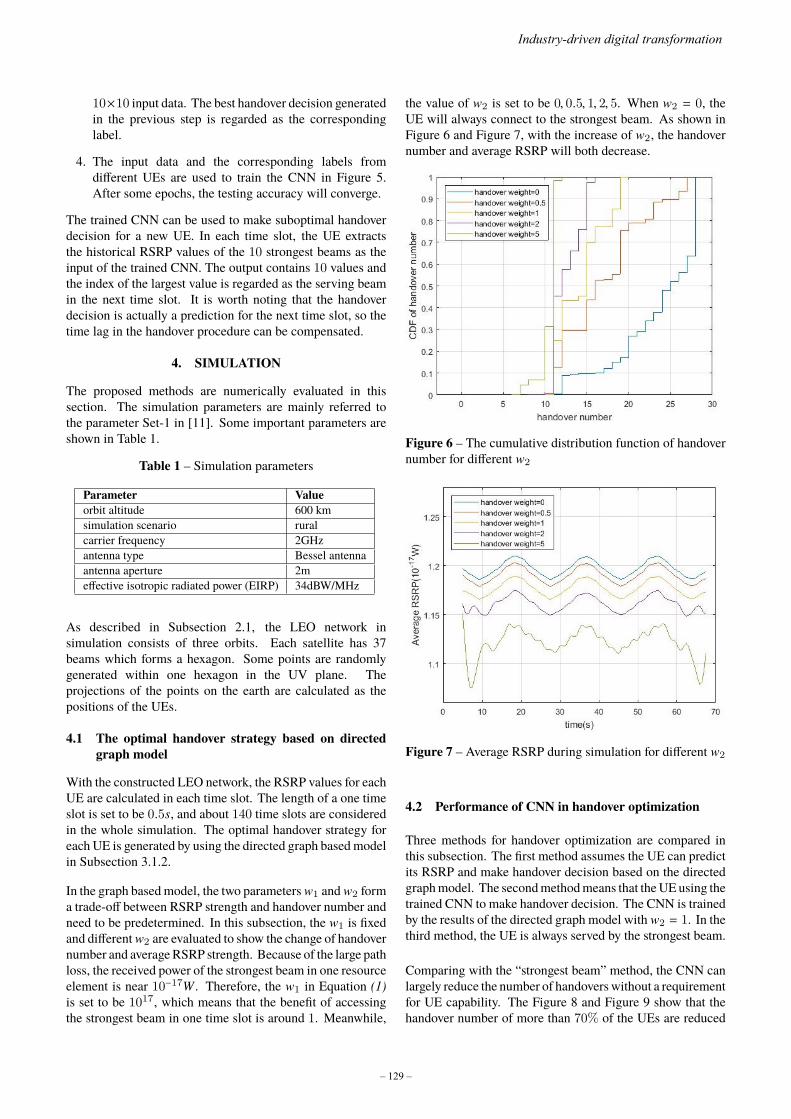
10×10 input data. The best handover decision generatedin the previous step is regarded as the correspondinglabel.
4. The input data and the corresponding labels fromdifferent UEs are used to train the CNN in Figure 5.After some epochs, the testing accuracy will converge.
The trained CNN can be used to make suboptimal handoverdecision for a new UE. In each time slot, the UE extractsthe historical RSRP values of the 10 strongest beams as theinput of the trained CNN. The output contains 10 values andthe index of the largest value is regarded as the serving beamin the next time slot. It is worth noting that the handoverdecision is actually a prediction for the next time slot, so thetime lag in the handover procedure can be compensated.
4. SIMULATION
The proposed methods are numerically evaluated in thissection. The simulation parameters are mainly referred tothe parameter Set-1 in [11]. Some important parameters areshown in Table 1.
Table 1 – Simulation parameters
Parameter Valueorbit altitude 600 kmsimulation scenario ruralcarrier frequency 2GHzantenna type Bessel antennaantenna aperture 2meffective isotropic radiated power (EIRP) 34dBW/MHz
As described in Subsection 2.1, the LEO network insimulation consists of three orbits. Each satellite has 37beams which forms a hexagon. Some points are randomlygenerated within one hexagon in the UV plane. Theprojections of the points on the earth are calculated as thepositions of the UEs.
4.1 The optimal handover strategy based on directedgraph model
With the constructed LEO network, the RSRP values for eachUE are calculated in each time slot. The length of a one timeslot is set to be 0.5s, and about 140 time slots are consideredin the whole simulation. The optimal handover strategy foreach UE is generated by using the directed graph basedmodelin Subsection 3.1.2.
In the graph based model, the two parametersw1 andw2 forma trade-off between RSRP strength and handover number andneed to be predetermined. In this subsection, the w1 is fixedand differentw2 are evaluated to show the change of handovernumber and average RSRP strength. Because of the large pathloss, the received power of the strongest beam in one resourceelement is near 10−17W . Therefore, the w1 in Equation (1)is set to be 1017, which means that the benefit of accessingthe strongest beam in one time slot is around 1. Meanwhile,
the value of w2 is set to be 0, 0.5, 1, 2, 5. When w2 = 0, theUE will always connect to the strongest beam. As shown inFigure 6 and Figure 7, with the increase of w2, the handovernumber and average RSRP will both decrease.
Figure 6 – The cumulative distribution function of handovernumber for different w2
Figure 7 – Average RSRP during simulation for different w2
4.2 Performance of CNN in handover optimization
Three methods for handover optimization are compared inthis subsection. The first method assumes the UE can predictits RSRP and make handover decision based on the directedgraphmodel. The secondmethodmeans that theUEusing thetrained CNN to make handover decision. The CNN is trainedby the results of the directed graph model with w2 = 1. In thethird method, the UE is always served by the strongest beam.
Comparing with the “strongest beam” method, the CNN canlargely reduce the number of handoverswithout a requirementfor UE capability. The Figure 8 and Figure 9 show that thehandover number of more than 70% of the UEs are reduced
– 129 –
Industry-driven digital transformation
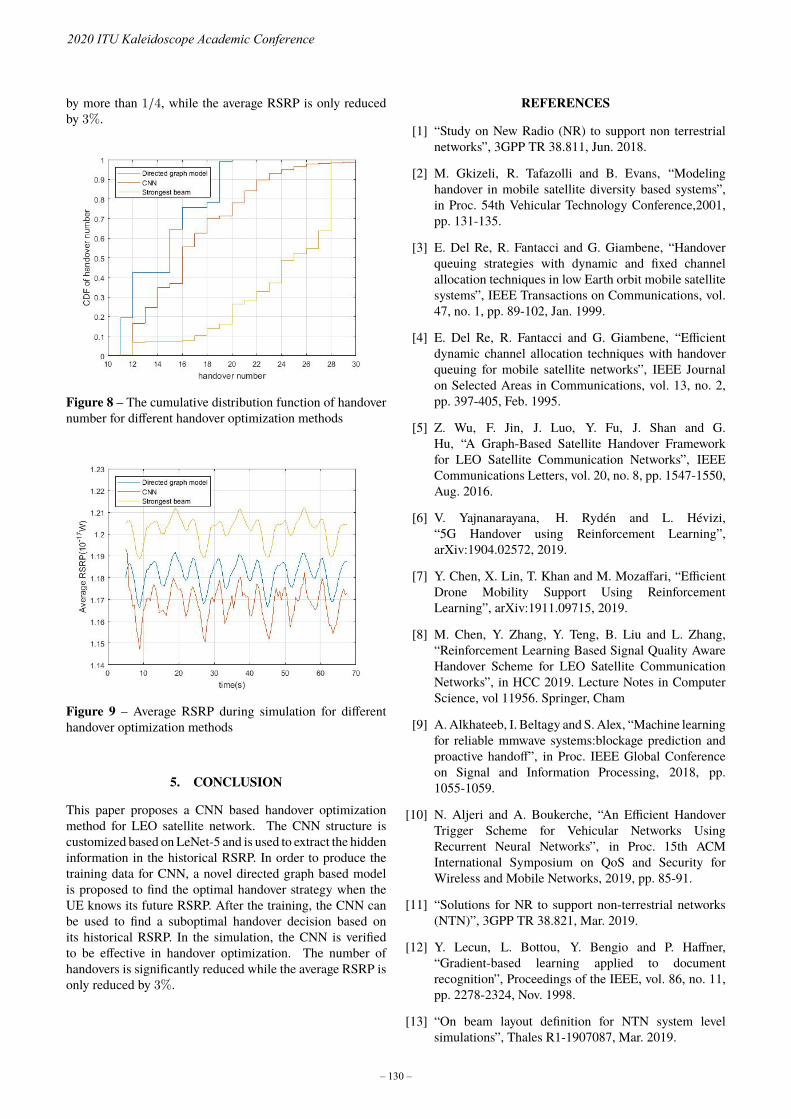
by more than 1/4, while the average RSRP is only reducedby 3%.
Figure 8 – The cumulative distribution function of handovernumber for different handover optimization methods
Figure 9 – Average RSRP during simulation for differenthandover optimization methods
5. CONCLUSION
This paper proposes a CNN based handover optimizationmethod for LEO satellite network. The CNN structure iscustomized based on LeNet-5 and is used to extract the hiddeninformation in the historical RSRP. In order to produce thetraining data for CNN, a novel directed graph based modelis proposed to find the optimal handover strategy when theUE knows its future RSRP. After the training, the CNN canbe used to find a suboptimal handover decision based onits historical RSRP. In the simulation, the CNN is verifiedto be effective in handover optimization. The number ofhandovers is significantly reduced while the average RSRP isonly reduced by 3%.
REFERENCES
[1] “Study on New Radio (NR) to support non terrestrialnetworks”, 3GPP TR 38.811, Jun. 2018.
[2] M. Gkizeli, R. Tafazolli and B. Evans, “Modelinghandover in mobile satellite diversity based systems”,in Proc. 54th Vehicular Technology Conference,2001,pp. 131-135.
[3] E. Del Re, R. Fantacci and G. Giambene, “Handoverqueuing strategies with dynamic and fixed channelallocation techniques in low Earth orbit mobile satellitesystems”, IEEE Transactions on Communications, vol.47, no. 1, pp. 89-102, Jan. 1999.
[4] E. Del Re, R. Fantacci and G. Giambene, “Efficientdynamic channel allocation techniques with handoverqueuing for mobile satellite networks”, IEEE Journalon Selected Areas in Communications, vol. 13, no. 2,pp. 397-405, Feb. 1995.
[5] Z. Wu, F. Jin, J. Luo, Y. Fu, J. Shan and G.Hu, “A Graph-Based Satellite Handover Frameworkfor LEO Satellite Communication Networks”, IEEECommunications Letters, vol. 20, no. 8, pp. 1547-1550,Aug. 2016.
[6] V. Yajnanarayana, H. Rydén and L. Hévizi,“5G Handover using Reinforcement Learning”,arXiv:1904.02572, 2019.
[7] Y. Chen, X. Lin, T. Khan and M. Mozaffari, “EfficientDrone Mobility Support Using ReinforcementLearning”, arXiv:1911.09715, 2019.
[8] M. Chen, Y. Zhang, Y. Teng, B. Liu and L. Zhang,“Reinforcement Learning Based Signal Quality AwareHandover Scheme for LEO Satellite CommunicationNetworks”, in HCC 2019. Lecture Notes in ComputerScience, vol 11956. Springer, Cham
[9] A.Alkhateeb, I. Beltagy and S.Alex, “Machine learningfor reliable mmwave systems:blockage prediction andproactive handoff”, in Proc. IEEE Global Conferenceon Signal and Information Processing, 2018, pp.1055-1059.
[10] N. Aljeri and A. Boukerche, “An Efficient HandoverTrigger Scheme for Vehicular Networks UsingRecurrent Neural Networks”, in Proc. 15th ACMInternational Symposium on QoS and Security forWireless and Mobile Networks, 2019, pp. 85-91.
[11] “Solutions for NR to support non-terrestrial networks(NTN)”, 3GPP TR 38.821, Mar. 2019.
[12] Y. Lecun, L. Bottou, Y. Bengio and P. Haffner,“Gradient-based learning applied to documentrecognition”, Proceedings of the IEEE, vol. 86, no. 11,pp. 2278-2324, Nov. 1998.
[13] “On beam layout definition for NTN system levelsimulations”, Thales R1-1907087, Mar. 2019.
– 130 –
2020 ITU Kaleidoscope Academic Conference

BSR: A BALANCED FRAMEWORK FOR SINGLE IMAGE SUPER RESOLUTION
Dehui Kong1,2, Fang Zhu3, Yang Wei4, Song Jianjun4, Zhu Tongtong4, Bengang Lou4, Ke Xu1,2
1State Key Laboratory of Mobile Network and Mobile Multimedia Technology, China 2ZTE Microelectronics Research Institute, China
3ZTE Corporation, China 4Sanechips, China
ABSTRACT
The reconstruction effect of single image super resolution (SISR) has been greatly improved over the traditional statistic and feature-based methods since the wide application of deep convolutional neural networks (DCNNs). Most recent studies mainly focused on the complexity of the neural network models and the stability of the training process without paying much attention to imbalance problems in the fields of super resolution. In this paper, we study three imbalance effects: sample imbalance, feature imbalance, and object function imbalance. A novel framework, which is called Balanced Super Resolution (BSR), is thus proposed to tackle these issues. Specifically, we propose a random filter sampling algorithm to form balanced training sets during batch training. Meanwhile, a feature mapping group, which is a kind of residual structure, is introduced to forward various groups of low-level information to high-level. A light spatial attention mechanism is also proposed to improve the effectiveness of residual features. Furthermore, we study the object functions in traditional SISR networks and deploy a hybrid L1/L2/Lp structure that favors visually-stable SR output. The proposed design achieves persistently better image quality than state-of-the-art DCNN methods in both subjective and objective measurements.
Keywords –Balance, deep convolutional neural network, framework, super-resolution
1. INTRODUCTION
Super resolution is a traditional signal processing algorithm which obtains one or more high-resolution (HR) images from one or more low-resolution (LR) versions of the same scene by increasing the number of pixels per unit area in an image [1]. Single image SR is a challenging problem as a specific LR input can correspond to numerous HR images with different visual quality.
With the rapid development of signal processing techniques, a substantial amount of statistical methods is deployed to solve this one-to-many mapping issue. Nowadays, these methods can be classified into three main categories: interpolation-based [2], reconstruction-based [3], and
learning-based [4]. The former two mainly include bilinear or Lanczos interpolation and wavelet-based schemes. Learning-based methods, especially those deep convolutional neural networks, gain much attention for SR applications since the introduction of pioneer work SRCNN in [5] due to their extraordinary performance in both peak signal-to-noise ratio (PSNR) and perceptual quality as compared with non-deep-learning based methods.
A typical DCNN for SR usually has three function blocks, feature extraction, feature mapping, and HR reconstruction, respectively. Most state-of-the-art methods focus on the feature mapping stage which should maximize the DCNN performance on non-linear mapping, and thus deeper networks are more preferable in literature [6], [7], [8], [9]. In addition, skip connection, [10] and [11], has become a useful network structure in DCNN for SR which helps to improve training stability and attention on the underlying lower level characteristics [12].
Figure 1 – Gradient distribution in DIV2K data set
(e) Samples with gradients interval value of 1, 4, 8, and 12
(a) ×2 with 48×48 patch
(c) ×4 with 48×48 patch (d) ×4 with 60×60 patch
(b) ×2 with 60×60 patch
978-92-61-31391-3/CFP2068P @ ITU 2020 Kaleidoscope – 131 –

Most recent works, [8], [13] and [14] of DCNN tend to maximize objective or subjective image quality by various network architecture designs or different training strategies. However, they tend to ignore the inherent features of each input image without considering the texture variance. The trained model would be biased if the input samples have imbalanced statistical characteristics [15], [16], [17].
As illustrated in Figure 1 (a) – (d), the gradient distribution from random samples of a DIV2K [19] data set is calculated, where we partition the entire distribution into 16 evenly distributed intervals. Although the exact distributions of ×2 and ×4 scaling with 48×48 and 60×60 patch sizes are different, the following observation holds: the gradient of DIV2K is not evenly distributed and the patches featuring smaller gradients account for the majority. In the training process, the size of input patch is mainly selected as 48 and 60. This is partially because DIV2K mainly contains 2K (resolution of 1920×1080 and above) images which feature content of plain textures such as sky, cloud, and monochromatic objects. From Figure 1 (e), we can see that typical patches with different gradients interval values of 1, 4, 8, and 12, where 8 and 12 represent complex and repeatedly artificial patterns. Therefore, if we train a neural network with too many samples from this “biased” data set, it would inevitably tend to demonstrate more fuzzy HR images than the network trained with samples full of texture details.
Another disadvantage of traditional DCNN of SR is the missing of multiple feature scales. As the neural networks get deeper, higher level of abstraction features become dominant which lead to blur or even unpleasant textures in the final reconstructed images. This is because in essence, low-level vision tasks such as SR are different from high-level tasks such as classification or object detection, where higher abstraction features are preferable for a final decision. Therefore, LR images which contain most low-frequency information should be forwarded and leveraged to generate the final HR outputs.
Finally, in most DCNNs, the optimization target is typically the minimization of the mean squared error (MSE) between the recovered and ground truth HR images, which helps to maximize PSNR, as the goal of SR is to output a scaled-up image as close to HR as possible. However, commonly used object functions pay more attention to pixels with larger absolute values as they introduce larger variance in final loss calculation. It is a consensus that L1 norm leads to sharper edges than L2 norm as L1 has a bigger loss than L2 when the difference is small [20], [21], [22].
In this work, we propose a balanced super-resolution framework (BSR), and according to our knowledge, this is the first work in the literature to study imbalance problem in SR DCNNs. The main contributions are three-fold: (1) we propose an efficient random filter sampling method to form a balanced training batch; (2) we propose a multi-scale feature map with spatial attention mechanism network architecture, which consists of around 240 convolution
layers; (3) we adopt a hybrid L1/L2/Lp object function and study its effectiveness. As shown in Figure 2, from a test image of the Urban100 [23] data set, our BSR achieves better visual results compared with state-of-the-art methods.
The rest of the paper is organized as follows. In Section 2, relevant background and literature on SR are depicted. We describe the proposed BSR in Section 3. Experimental results are presented and analyzed in Section 4, and we conclude the paper in Section 5.
2. RELATED WORK
The sole purpose of SISR is to find an accurate mapping between LR and HR images. Numerous SR methods have been studied in the computer vision community, and can be classified into three categories [24]: interpolation-based, reconstruction-based, and learning-based.
As pioneering work in the deep-learning-based method, SRCNN [5] learns the mapping from LR to HR images in an end-to-end manner, and achieves superior performance against previous interpolation and reconstruction based works.
EDSR [25] won the 2018 New Trends in Image Restoration and Enhancement (NTIRE) [26] competition mainly due to the removal of batch normalization (BN) layers, where BN restrains the scale of feature space via a trainable scale factor and translation factor which needs to be avoided in SR mapping.
Figure 2 – Visual results comparison with bi-cubic degradation
SRGAN [27], which is a pioneering piece of work of applying a generative adversarial network (GAN) and perceptual loss in SR, targets recovering photo-realistic
HR Bi-cubic EDSR -/- 21.50/.3123 21.87/.4291
SRMDNF RCAN BSR 21.84/.3738 23.23/.5723 23.42/.6072
Img_074
– 132 –
2020 ITU Kaleidoscope Academic Conference

textures from heavily down-sampled images. Although it can alleviate the blurring and over-smoothing artifacts to some degree, its predicted results may not be faithfully reconstructed and produce unpleasing artifacts [6].
RCAN [6] proposed a residual in residual structure to form a very deep network of as many as 400 layers which achieves excellent results. SAN [8] utilizes a novel trainable second-order channel attention module as a substitute for a channel attention layer in RCAN to adaptively rescale the channel-wise features.
Unfortunately, all the works above focus on network structure to achieve better subjective/objective results, and none of them pay attention to the various imbalance issues presented in this paper. Here, we propose a balanced SR framework, which we will detail in the next section.
3. BALANCED SR
3.1 Architecture
The entire framework of the proposed BSR is illustrated in Figure 3, and the working process of batch acquisition is depicted as below:
Step 0: Down-sample. The original HR images are down-sampled using either a bi-cubic or blur-down method to generate corresponding LR images.
Step 1: Select images. In LR image data sets, we randomly pick up images to form a batch.
Step 2: Select patch. From the selected images in Step 1, we randomly select patches to form a batch.
Step 3: Calculate patch information capacity (PIC). For each batch, the corresponding PIC is computed. The detailed calculation process is depicted in Section 3.2 below.
Step 4: Qualify patch. Based on the current batch’s statistical distribution (determined by previously qualified batches) and the current patch’s PIC, we either qualify or disqualify the current patch. The current patch will be qualified if its corresponding batch is not full. If the current patch is disqualified, we’ll move forward to qualify the next patch until the total number of qualified patches specified in batch training is satisfied.
Step 5: Form balanced batch. The selected patches with qualified PIC distribution form a balanced batch to train the proposed BSR. The computation of PIC and BSR network structure is revealed later.
Figure 3 – Balanced SR framework
After one iteration of batch training, if the BSR is not converged, the current model gets updated and a new balanced batch is generated using Step 1 to Step 5. The computation of PIC and BSR network structure is revealed later.
3.2 Random Filter Sampling (RFS)
A traditional neural network training process usually involves selecting several LR images randomly from a specific data set and crop to a fixed size which is called a patch in order to form a batch input. The output is the corresponding high-resolution SR patch. A patch pair can be described as:
𝑃𝑃𝑖𝑖𝑖𝑖: [𝑥𝑥 ,𝑦𝑦,𝑤𝑤,ℎ] → 𝑃𝑃𝑜𝑜𝑜𝑜𝑜𝑜: [𝑥𝑥 × 𝑠𝑠𝑠𝑠𝑠𝑠𝑠𝑠𝑠𝑠,𝑦𝑦 × 𝑠𝑠𝑠𝑠𝑠𝑠𝑠𝑠𝑠𝑠,𝑤𝑤 × 𝑠𝑠𝑠𝑠𝑠𝑠𝑠𝑠𝑠𝑠,ℎ × 𝑠𝑠𝑠𝑠𝑠𝑠𝑠𝑠𝑠𝑠]
where x and y are the selected patch’s left upper corner coordinates, and w and h are the patch’s width and height, accordingly.
For each patch, we propose a metric for its information measurement, which is called patch information capacity and defined as the following:
𝑃𝑃𝑃𝑃𝑃𝑃 = 𝐺𝐺𝑠𝑠𝑜𝑜𝑠𝑠𝑠𝑠𝑠𝑠[𝑃𝑃𝑖𝑖𝑖𝑖(𝑥𝑥, 𝑦𝑦,𝑤𝑤, ℎ)]𝑤𝑤−1
𝑥𝑥=0
ℎ−1
𝑦𝑦=0
2
𝑐𝑐ℎ=0
(1)
It represents how much texture information is contained in the patch. The gradient magnitude is calculated by Sobel operations as follows:
𝐺𝐺𝑥𝑥 = −1 0 +1−2 0 +2−1 0 +1
,𝐺𝐺𝑦𝑦 = +1 +2 +1 0 0 0−1 −2 −1
(2)
𝐺𝐺𝑠𝑠𝑜𝑜𝑠𝑠𝑠𝑠𝑠𝑠 = |𝐺𝐺𝑥𝑥| + |𝐺𝐺𝑦𝑦| (3)
BSR training model Loss (Lp + L1 + L2)
Update model & generate a new balanced batch
Step1Select image
Step2Select patch
Step3Calculate PIC
Step4Qualify patch
Step5Form balanced batch
converge?
Step0Down-sample Bicubic/blur-down down-sample
LR dataset HR dataset
BSR trained model
Yes
No
– 133 –
Industry-driven digital transformation
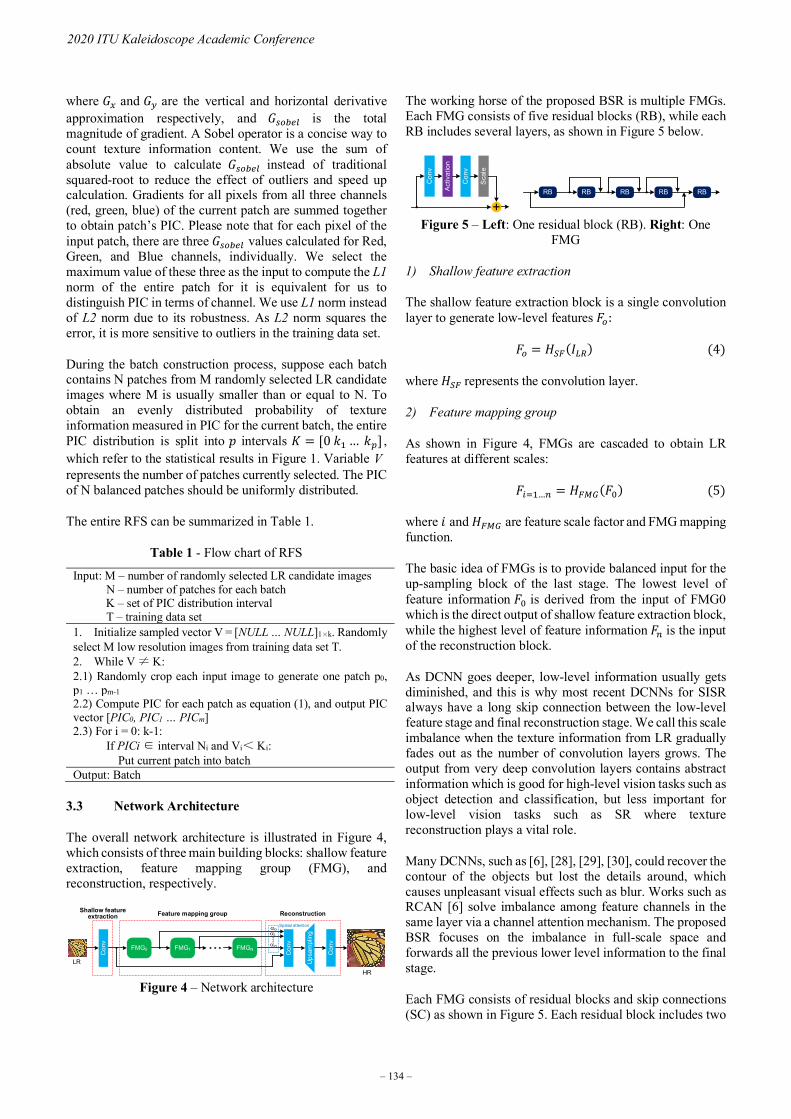
where 𝐺𝐺𝑥𝑥 and 𝐺𝐺𝑦𝑦 are the vertical and horizontal derivative approximation respectively, and 𝐺𝐺𝑠𝑠𝑜𝑜𝑠𝑠𝑠𝑠𝑠𝑠 is the total magnitude of gradient. A Sobel operator is a concise way to count texture information content. We use the sum of absolute value to calculate 𝐺𝐺𝑠𝑠𝑜𝑜𝑠𝑠𝑠𝑠𝑠𝑠 instead of traditional squared-root to reduce the effect of outliers and speed up calculation. Gradients for all pixels from all three channels (red, green, blue) of the current patch are summed together to obtain patch’s PIC. Please note that for each pixel of the input patch, there are three 𝐺𝐺𝑠𝑠𝑜𝑜𝑠𝑠𝑠𝑠𝑠𝑠 values calculated for Red, Green, and Blue channels, individually. We select the maximum value of these three as the input to compute the L1 norm of the entire patch for it is equivalent for us to distinguish PIC in terms of channel. We use L1 norm instead of L2 norm due to its robustness. As L2 norm squares the error, it is more sensitive to outliers in the training data set.
During the batch construction process, suppose each batch contains N patches from M randomly selected LR candidate images where M is usually smaller than or equal to N. To obtain an evenly distributed probability of texture information measured in PIC for the current batch, the entire PIC distribution is split into 𝑝𝑝 intervals 𝐾𝐾 = [0 𝑘𝑘1 … 𝑘𝑘𝑝𝑝] , which refer to the statistical results in Figure 1. Variable V represents the number of patches currently selected. The PIC of N balanced patches should be uniformly distributed.
The entire RFS can be summarized in Table 1.
Table 1 - Flow chart of RFS
Input: M – number of randomly selected LR candidate images N – number of patches for each batch K – set of PIC distribution interval T – training data set 1. Initialize sampled vector V = [NULL … NULL]1×k. Randomly select M low resolution images from training data set T. 2. While V ≠ K: 2.1) Randomly crop each input image to generate one patch p0, p1 … pm-1 2.2) Compute PIC for each patch as equation (1), and output PIC vector [PIC0, PIC1 … PICm] 2.3) For i = 0: k-1: If PICi ∈ interval Ni and Vi< Ki: Put current patch into batch Output: Batch
3.3 Network Architecture
The overall network architecture is illustrated in Figure 4, which consists of three main building blocks: shallow feature extraction, feature mapping group (FMG), and reconstruction, respectively.
Con
v
FMG0 FMG1 FMGN
Con
v
Ups
ampl
ing
Con
v
LRHR
α0 α1
αn
Shallow feature extraction Feature mapping group Reconstruction
Spatial attention
Figure 4 – Network architecture
The working horse of the proposed BSR is multiple FMGs. Each FMG consists of five residual blocks (RB), while each RB includes several layers, as shown in Figure 5 below.
Con
v
Activ
atio
n
Con
v
Scal
e
+RB RB RB RB RB
Figure 5 – Left: One residual block (RB). Right: One FMG
1) Shallow feature extraction
The shallow feature extraction block is a single convolution layer to generate low-level features 𝐹𝐹𝑜𝑜:
𝐹𝐹𝑜𝑜 = 𝐻𝐻𝑆𝑆𝑆𝑆(𝑃𝑃𝐿𝐿𝐿𝐿) (4)
where 𝐻𝐻𝑆𝑆𝑆𝑆 represents the convolution layer.
2) Feature mapping group
As shown in Figure 4, FMGs are cascaded to obtain LR features at different scales:
𝐹𝐹𝑖𝑖=1…𝑖𝑖 = 𝐻𝐻𝑆𝑆𝐹𝐹𝐹𝐹(𝐹𝐹0) (5)
where 𝑖𝑖 and 𝐻𝐻𝑆𝑆𝐹𝐹𝐹𝐹 are feature scale factor and FMG mapping function.
The basic idea of FMGs is to provide balanced input for the up-sampling block of the last stage. The lowest level of feature information 𝐹𝐹0 is derived from the input of FMG0 which is the direct output of shallow feature extraction block, while the highest level of feature information 𝐹𝐹𝑖𝑖 is the input of the reconstruction block.
As DCNN goes deeper, low-level information usually gets diminished, and this is why most recent DCNNs for SISR always have a long skip connection between the low-level feature stage and final reconstruction stage. We call this scale imbalance when the texture information from LR gradually fades out as the number of convolution layers grows. The output from very deep convolution layers contains abstract information which is good for high-level vision tasks such as object detection and classification, but less important for low-level vision tasks such as SR where texture reconstruction plays a vital role.
Many DCNNs, such as [6], [28], [29], [30], could recover the contour of the objects but lost the details around, which causes unpleasant visual effects such as blur. Works such as RCAN [6] solve imbalance among feature channels in the same layer via a channel attention mechanism. The proposed BSR focuses on the imbalance in full-scale space and forwards all the previous lower level information to the final stage.
Each FMG consists of residual blocks and skip connections (SC) as shown in Figure 5. Each residual block includes two
– 134 –
2020 ITU Kaleidoscope Academic Conference
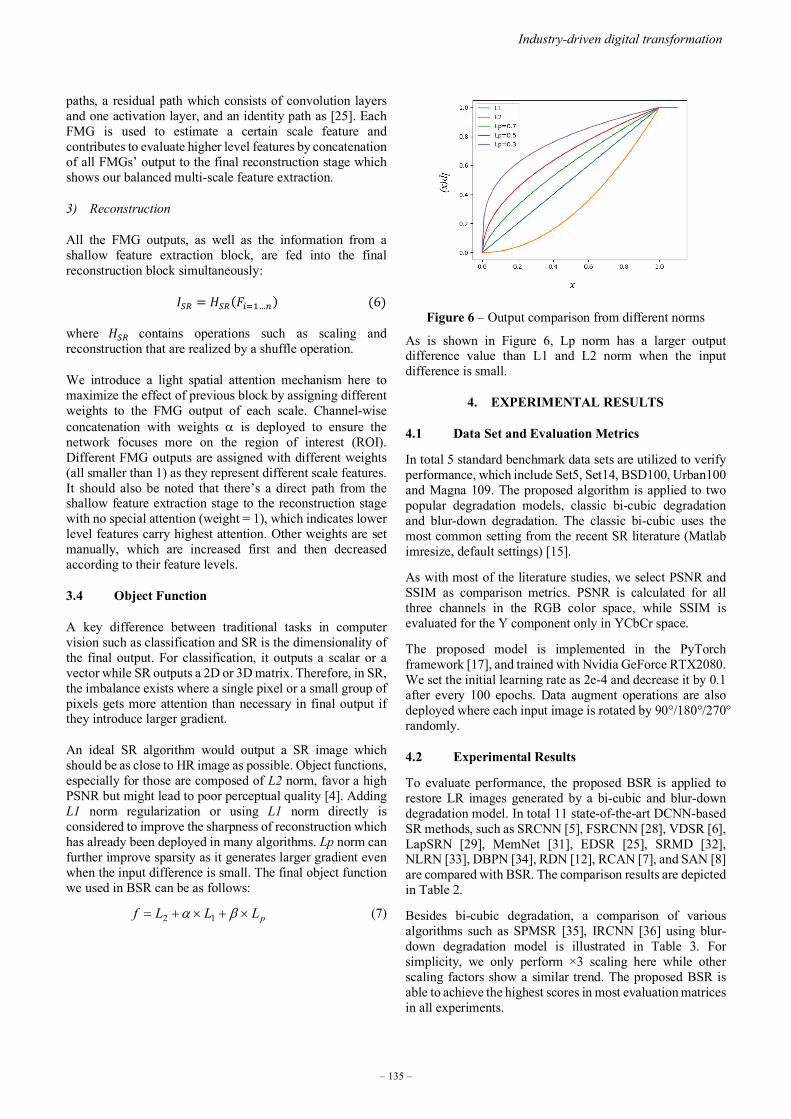
paths, a residual path which consists of convolution layers and one activation layer, and an identity path as [25]. Each FMG is used to estimate a certain scale feature and contributes to evaluate higher level features by concatenation of all FMGs’ output to the final reconstruction stage which shows our balanced multi-scale feature extraction.
3) Reconstruction
All the FMG outputs, as well as the information from a shallow feature extraction block, are fed into the final reconstruction block simultaneously:
𝑃𝑃𝑆𝑆𝐿𝐿 = 𝐻𝐻𝑆𝑆𝐿𝐿(𝐹𝐹𝑖𝑖=1…𝑖𝑖) (6)
where 𝐻𝐻𝑆𝑆𝐿𝐿 contains operations such as scaling and reconstruction that are realized by a shuffle operation.
We introduce a light spatial attention mechanism here to maximize the effect of previous block by assigning different weights to the FMG output of each scale. Channel-wise concatenation with weights α is deployed to ensure the network focuses more on the region of interest (ROI). Different FMG outputs are assigned with different weights (all smaller than 1) as they represent different scale features. It should also be noted that there’s a direct path from the shallow feature extraction stage to the reconstruction stage with no special attention (weight = 1), which indicates lower level features carry highest attention. Other weights are set manually, which are increased first and then decreased according to their feature levels.
3.4 Object Function
A key difference between traditional tasks in computer vision such as classification and SR is the dimensionality of the final output. For classification, it outputs a scalar or a vector while SR outputs a 2D or 3D matrix. Therefore, in SR, the imbalance exists where a single pixel or a small group of pixels gets more attention than necessary in final output if they introduce larger gradient.
An ideal SR algorithm would output a SR image which should be as close to HR image as possible. Object functions, especially for those are composed of L2 norm, favor a high PSNR but might lead to poor perceptual quality [4]. Adding L1 norm regularization or using L1 norm directly is considered to improve the sharpness of reconstruction which has already been deployed in many algorithms. Lp norm can further improve sparsity as it generates larger gradient even when the input difference is small. The final object function we used in BSR can be as follows:
pLLLf ×+×+= βα 12 (7)
Figure 6 – Output comparison from different norms
As is shown in Figure 6, Lp norm has a larger output difference value than L1 and L2 norm when the input difference is small.
4. EXPERIMENTAL RESULTS
4.1 Data Set and Evaluation Metrics
In total 5 standard benchmark data sets are utilized to verify performance, which include Set5, Set14, BSD100, Urban100 and Magna 109. The proposed algorithm is applied to two popular degradation models, classic bi-cubic degradation and blur-down degradation. The classic bi-cubic uses the most common setting from the recent SR literature (Matlab imresize, default settings) [15].
As with most of the literature studies, we select PSNR and SSIM as comparison metrics. PSNR is calculated for all three channels in the RGB color space, while SSIM is evaluated for the Y component only in YCbCr space.
The proposed model is implemented in the PyTorch framework [17], and trained with Nvidia GeForce RTX2080. We set the initial learning rate as 2e-4 and decrease it by 0.1 after every 100 epochs. Data augment operations are also deployed where each input image is rotated by 90°/180°/270° randomly.
4.2 Experimental Results
To evaluate performance, the proposed BSR is applied to restore LR images generated by a bi-cubic and blur-down degradation model. In total 11 state-of-the-art DCNN-based SR methods, such as SRCNN [5], FSRCNN [28], VDSR [6], LapSRN [29], MemNet [31], EDSR [25], SRMD [32], NLRN [33], DBPN [34], RDN [12], RCAN [7], and SAN [8] are compared with BSR. The comparison results are depicted in Table 2.
Besides bi-cubic degradation, a comparison of various algorithms such as SPMSR [35], IRCNN [36] using blur- down degradation model is illustrated in Table 3. For simplicity, we only perform ×3 scaling here while other scaling factors show a similar trend. The proposed BSR is able to achieve the highest scores in most evaluation matrices in all experiments.
– 135 –
Industry-driven digital transformation

Table 2 – Comparison results of PSNR (dB) and SSIM on various data sets with bi-cubic degradation model
Method Scale Set5 Set14 BSD100 Urban100 Manga109
PSNR SSIM PSNR SSIM PSNR SSIM PSNR SSIM PSNR SSIM
Bi-cubic ×2 33.66 0.9299 30.24 0.8688 29.56 0.8431 26.88 0.8403 30.80 0.9339 ×3 30.39 0.8682 27.55 0.7742 27.21 0.7385 24.46 0.7349 26.95 0.8556 ×4 28.42 0.8104 26.00 0.7027 25.96 0.6675 23.14 0.6577 24.89 0.7866
SRCNN ×2 36.66 0.9542 32.45 0.9067 31.36 0.8879 29.50 0.8946 35.60 0.9663 ×3 32.75 0.9090 29.30 0.8215 28.41 0.7863 26.24 0.7989 30.48 0.9117 ×4 30.48 0.8628 27.50 0.7513 26.90 0.7101 24.52 0.7221 27.58 0.8555
FSRCNN ×2 37.05 0.9560 32.66 0.9090 31.53 0.8920 29.88 0.9020 36.67 0.9710 ×3 33.18 0.9140 29.37 0.8240 28.53 0.7910 26.43 0.8080 31.10 0.9210 ×4 30.72 0.8660 27.61 0.7550 26.98 0.7150 24.62 0.7280 27.90 0.8610
VDSR ×2 37.53 0.9590 33.05 0.9130 31.90 0.8960 30.77 0.9140 37.22 0.9750 ×3 33.67 0.9210 29.78 0.8320 28.83 0.7990 27.14 0.8290 32.01 0.9340 ×4 31.35 0.8830 28.02 0.7680 27.29 0.0726 25.18 0.7540 28.83 0.8870
LapSRN ×2 37.52 0.9591 33.08 0.9130 31.08 0.8950 30.41 0.9101 37.27 0.9740 ×3 33.82 0.9227 29.87 0.8320 28.82 0.7980 27.07 0.8280 32.21 0.9350 ×4 31.54 0.8850 28.19 0.7720 27.32 0.7270 25.21 0.7560 29.09 0.8900
MemNet ×2 37.78 0.9597 33.28 0.9142 32.08 0.8978 31.31 0.9195 37.72 0.9740 ×3 34.09 0.9248 30.00 0.8350 28.96 0.8001 27.56 0.8376 32.51 0.9369 ×4 31.74 0.8893 28.26 0.7723 27.40 0.7281 25.50 0.7630 29.42 0.8942
EDSR ×2 38.11 0.9602 33.92 0.9195 32.32 0.9013 32.93 0.9351 39.10 0.9773 ×3 34.65 0.9280 30.52 0.8462 29.25 0.8093 28.80 0.8653 34.17 0.9476 ×4 32.46 0.8968 28.80 0.7876 27.71 0.7420 26.64 0.8033 31.02 0.9148
SRMDNF ×2 37.79 0.9601 33.32 0.9159 32.05 0.8985 31.33 0.9204 38.07 0.9761 ×3 34.12 0.9254 30.04 0.8382 28.97 0.8025 27.57 0.8398 33.00 0.9403 ×4 31.96 0.8925 28.35 0.7787 27.49 0.7337 25.68 0.7731 30.09 0.9024
RDN ×2 38.24 0.9614 34.01 0.9212 32.34 0.9017 32.89 0.9353 39.18 0.9780 ×3 34.71 0.9296 30.57 0.8468 29.26 0.8093 28.80 0.8653 34.13 0.9484 ×4 32.47 0.8990 28.81 0.7871 27.72 0.7419 26.61 0.8028 31.00 0.9151
RCAN ×2 38.27 0.9614 34.12 0.9216 32.41 0.9027 33.34 0.9384 39.44 0.9786 ×3 34.74 0.9299 30.65 0.8482 29.32 0.8111 29.09 0.8702 34.44 0.9499 ×4 32.63 0.9002 28.87 0.7889 27.77 0.7436 26.82 0.8087 31.22 0.9173
SAN ×2 38.31 0.9620 34.07 0.9213 32.42 0.9028 33.10 0.9370 39.32 0.9792 ×3 34.75 0.9300 30.59 0.8476 29.33 0.8112 28.93 0.8671 34.30 0.9494 ×4 32.64 0.9003 28.92 0.7888 27.78 0.7436 26.79 0.8068 31.18 0.9169
BSR ×2 38.30 0.9616 34.15 0.9220 32.42 0.9027 33.64 0.9404 39.54 0.9790 ×3 34.74 0.9301 30.66 0.8501 29.31 0.8113 29.19 0.8710 34.43 0.9550 ×4 32.64 0.9002 28.90 0.7890 27.79 0.7436 26.79 0.8088 31.23 0.9174
Table 3 – Comparison results of PSNR (dB) and SSIM on various data sets with blur-down degradation model
Method Scale Set5 Set14 BSD100 Urban100 Manga109
PSNR SSIM PSNR SSIM PSNR SSIM PSNR SSIM PSNR SSIM
Bi-cubic ×3 28.78 0.8308 26.38 0.7271 26.33 0.6918 23.52 0.6862 25.46 0.8149 SPMSR ×3 32.21 0.9001 28.89 0.8105 28.13 0.7740 25.84 0.7856 29.64 0.9003 SRCNN ×3 32.05 0.8944 28.80 0.8074 28.13 0.7736 25.70 0.7770 29.47 0.8924
FSRCNN ×3 26.23 0.8124 24.44 0.7106 24.86 0.6832 22.04 0.6745 23.04 0.7927 VDSR ×3 33.25 0.9150 29.46 0.8244 28.57 0.7893 26.61 0.8136 31.06 0.9234 IRCNN ×3 33.38 0.9182 29.63 0.8281 28.65 0.7922 26.77 0.8154 31.15 0.9245
SRMDNF ×3 34.01 0.9242 30.11 0.8364 28.98 0.8009 27.50 0.8370 32.97 0.9391 RDN ×3 34.58 0.9280 30.53 0.8447 29.23 0.8079 28.46 0.8582 33.97 0.9465
RCAN ×3 34.70 0.9288 30.63 0.8462 29.32 0.8093 28.81 0.8647 34.38 0.9483 SAN ×3 34.75 0.9290 30.68 0.8466 29.33 0.8101 28.83 0.8646 34.46 0.9487 BSR ×3 34.76 0.9292 30.64 0.8464 29.34 0.8100 28.83 0.8648 34.46 0.9488
– 136 –
2020 ITU Kaleidoscope Academic Conference

More qualitative results are illustrated in Figure 7 below.
Figure 7 – Qualitative results
4.3 Ablation Study
As shown in Figure 8, (a) is the ground truth from Set14. (b) is the reconstructed HR image trained with 25 epochs and the object function is (L1 + L2) norm. The differences between ground truth and the reconstructed HR image can be measured either by L2 norm that is illustrated in (c), or Lp (p=0.5) norm that is shown in (d). We can see that Lp norm presents a more significant difference as Lp norm is more sensitive to image texture detail differences.
Figure 8 – Reconstructed image vs. ground truth, calculated norms
To further illustrate the effectiveness of Lp norm, we continue to train with 25 epochs based on the results of Figure 8(b). As depicted in Figure 9, two object function combinations are evaluated, L1 + L2 (left) and L1 + Lp (right). As can be seen, L1 + Lp norm presents slightly better results (0.01dB in PSNR and 0.0027 in SSIM) as compared with L1 + L2 norm, which proves that Lp norm is better in discovering texture details.
Figure 9 – Training with two object function combinations
In order to investigate the effect of each block in the proposed BSR, we perform five experiments and compare their difference as illustrated in Table 4. The results are obtained on the Set5 data set (×4 scale).
The baseline is our full-fledged model, which contains 10 FMGs and 12 RBs for each FMG as described in Figure 5. It’s trained with RFS and L2/L1/Lp joint object function.
HR Bi-cubic EDSR -/- 13.38/.1687 14.09/.3563
SRMDNF RCAN BSR 14.01/.3361 15.34/.5345 19.63/.8027
SRMDNF RCAN BSR 12.75/.4439 12.79/.4482 16.43/.7702 Img_011
Img_092
HR Bi-cubic EDSR -/- 11.91/.2758 13.34/.5100
(b) Reconstructed HR image (PSNR/SSIM = 22.65/0.4868)
(a) Ground truth
(c) Difference by L2 norm (d) Difference by Lp norm
Right: L1 + Lp norm (PSNR/SSIM = 22.74/0.5015)
Left: L1 + L2 norm (PSNR/SSIM = 22.73/0.4988)
– 137 –
Industry-driven digital transformation

Table 4 – Effects of each block in SR Baseline w/o RFS w/o SC L2 L2 + L1
PNSR 32.20 32.15 32.10 32.17 32.19
Without RFS and only using shuffle and data augment via rotation and flip for sampling, there’s a 0.05dB quality degradation (32.15dB vs. 32.20dB), which proves that RFS can significantly improve the HR quality.
If we remove SC between the inner FMG output and scaling part, the degradation is worse which shows the importance of SC.
The last two columns show the effectiveness of hybrid L1+L2+Lp norm. As can be seen, L1 + L2 is better than L1 alone but less superior than all three norms combined.
Table 4 effectively illustrates the three imbalances mentioned in this paper, and the improvement of PSNR also shows that the proposed method can alleviate these defects.
5. CONCLUSION
In this paper, we show the imbalance issues in SISR which includes sample imbalance, feature imbalance, and object function imbalance. To tackle these imbalance problems, a balanced SR framework is proposed which features a novel random sampling algorithm during training, feature extraction group structure, as well as an Lp object function. The proposed BSR significantly improves the SR performance. However, not all the imbalance issues in SR have been studied thoroughly and there’s still lots of space for further improvements, such as how to improve efficiency of multi-scale features, which would be our future research.
REFERENCES
[1] K. Nasrollashi, T. B. Moeslund, “Super-resolution: A Comprehensive Survey”, Machine Vision and Applications, 2014, pp. 1423 - 1468.
[2] L. Wang and G. Jeon, "Bayer Pattern CFA Demosaicking Based on Multi-Directional Weighted Interpolation and Guided Filter," in IEEE Signal Processing Letters, vol. 22, no. 11, pp. 2083-2087, Nov. 2015, doi: 10.1109/LSP.2015.2458934.
[3] J. Tarquino, A. Rueda and E. Romero, "Shearlet-based sparse representation for super-resolution in diffusion weighted imaging (DWI)," 2014 IEEE International Conference on Image Processing (ICIP), Paris, 2014, pp. 3897-3900, doi: 10.1109/ICIP.2014.7025791.
[4] W. Yang et. al., “Deep learning for single image super-resolution: a brief review”, IEEE Transactions on Multimedia, Issue 12, pp. 3106 – 3121, Dec. 2019.
[5] C. Dong, C. C. Loy, K. He and X. Tang, “Image Super-Resolution Using Deep Convolutional Networks,” in IEEE Transactions on Pattern Analysis and Machine Intelligence, vol. 38, no. 2, pp. 295-307, 1 Feb. 2016, doi: 10.1109/TPAMI.2015.2439281.
[6] J. Kim, J. K. Lee and K. M. Lee, “Accurate Image Super-Resolution Using Very Deep Convolutional Networks,” 2016 IEEE Conference on Computer Vision and Pattern Recognition (CVPR), Las Vegas, NV, 2016, pp. 1646-1654, doi: 10.1109/CVPR.2016.182.
[7] Y. L. Zhang et al., “Image Super-Resolution Using Very Deep Residual Channel Attention Networks,” Proceedings of the European Conference on Computer Vision (ECCV). 2018: 286-301. 1, 3, 5, 7
[8] T. Dai, J. Cai, Y. Zhang, S. Xia and L. Zhang, "Second-Order Attention Network for Single Image Super-Resolution," 2019 IEEE/CVF Conference on Computer Vision and Pattern Recognition (CVPR), Long Beach, CA, USA, 2019, pp. 11057-11066, doi: 10.1109/CVPR.2019.01132.
[9] Q. Huang, D. Yang, P. Wu, H. Qu, J. Yi and D. Metaxas, "MRI Reconstruction Via Cascaded Channel-Wise Attention Network," 2019 IEEE 16th International Symposium on Biomedical Imaging (ISBI 2019), Venice, Italy, 2019, pp. 1622-1626, doi: 10.1109/ISBI.2019.8759423.
[10] K. He, X. Zhang, S. Ren and J. Sun, “Deep Residual Learning for Image Recognition,” 2016 IEEE Conference on Computer Vision and Pattern Recognition (CVPR), Las Vegas, NV, 2016, pp. 770-778, doi: 10.1109/CVPR.2016.90.
[11] Zhou F, Li X, Li Z. High-frequency details enhancing DenseNet for super-resolution [J]. Neurocomputing, 2018, 290: 34-42. 1, 5
[12] Y. Zhang, Y. Tian, Y. Kong, B. Zhong and Y. Fu, “Residual Dense Network for Image Super-Resolution,” 2018 IEEE/CVF Conference on Computer Vision and Pattern Recognition, Salt Lake City, UT, 2018, pp. 2472-2481, doi: 10.1109/CVPR.2018.00262.
[13] X. T. Wang et al., “ESRGAN: Enhanced Super-Resolution Generative Adversarial Networks”, The European Conference on Computer Vision (ECCV) Workshops, 2018.
[14] J. Cai, H. Zeng, H. Yong, Z. Cao and L. Zhang, "Toward Real-World Single Image Super-Resolution: A New Benchmark and a New Model," 2019 IEEE/CVF International Conference on Computer Vision (ICCV), Seoul, Korea (South), 2019, pp. 3086-3095, doi: 10.1109/ICCV.2019.00318.
[15] J. Pang, K. Chen, J. Shi, H. Feng, W. Ouyang and D. Lin, "Libra R-CNN: Towards Balanced Learning for Object Detection," 2019 IEEE/CVF Conference on Computer Vision and Pattern Recognition (CVPR), Long Beach, CA, USA, 2019, pp. 821-830, doi: 10.1109/CVPR.2019.00091.
[16] Y. Cui, M. Jia, T. Lin, Y. Song and S. Belongie, "Class-Balanced Loss Based on Effective Number of Samples," 2019 IEEE/CVF Conference on Computer Vision and Pattern Recognition (CVPR), Long Beach, CA, USA, 2019, pp. 9260-9269, doi: 10.1109/CVPR.2019.00949.
[17] K. Oksuz, B. C. Cam, S. Kalkan and E. Akbas, "Imbalance Problems in Object Detection: A Review," in IEEE Transactions on Pattern Analysis and Machine Intelligence, doi: 10.1109/TPAMI.2020.2981890.
[18] P. Adam, G. Sam, C. Soumith, C. Gregory, Y. Edward, D. Zachary, L. Zeming, D. Alban, A. Luca , and L. Adam. Automatic differentiation in pytorch. 2017.
[19] E. Agustsson and R. Timofte, "NTIRE 2017 Challenge on Single Image Super-Resolution: Dataset and Study," 2017 IEEE Conference on Computer Vision and Pattern Recognition Workshops (CVPRW), Honolulu, HI, 2017, pp. 1122-1131, doi: 10.1109/CVPRW.2017.150.
[20] J. K. Pant, W. Lu and A. Antoniou, "New Improved Algorithms for Compressive Sensing Based on lp Norm," in IEEE Transactions on Circuits and Systems II: Express Briefs, vol. 61, no. 3, pp. 198-202, March 2014, doi: 10.1109/TCSII.2013.2296133.
[21] M. Kloft, U. Brefeld, S. Sonnenburg, Lp-norm multiple kernel learning[J]. Journal of Machine Learning Research, 2011, 12(Mar): 953-997. 4
– 138 –
2020 ITU Kaleidoscope Academic Conference

[22] M. Wang, "High resolution radar imaging based on compressed sensing and adaptive Lp norm algorithm," Proceedings of 2011 IEEE CIE International Conference on Radar, Chengdu, 2011, pp. 206-209, doi: 10.1109/CIE-Radar.2011.6159512.
[23] J. Huang, A. Singh and N. Ahuja, "Single image super-resolution from transformed self-exemplars," 2015 IEEE Conference on Computer Vision and Pattern Recognition (CVPR), Boston, MA, 2015, pp. 5197-5206, doi: 10.1109/CVPR.2015.7299156.
[24] W. Yang, X. Zhang, Y. Tian, W. Wang, J. Xue and Q. Liao, "Deep Learning for Single Image Super-Resolution: A Brief Review," in IEEE Transactions on Multimedia, vol. 21, no. 12, pp. 3106-3121, Dec. 2019, doi: 10.1109/TMM.2019.2919431.
[25] B. Lim, S. Son, H. Kim, S. Nah and K. M. Lee, "Enhanced Deep Residual Networks for Single Image Super-Resolution," 2017 IEEE Conference on Computer Vision and Pattern Recognition Workshops (CVPRW), Honolulu, HI, 2017, pp. 1132-1140, doi: 10.1109/CVPRW.2017.151.
[26] R. Timofte et al., "NTIRE 2018 Challenge on Single Image Super-Resolution: Methods and Results," 2018 IEEE/CVF Conference on Computer Vision and Pattern Recognition Workshops (CVPRW), Salt Lake City, UT, 2018, pp. 965-96511, doi: 10.1109/CVPRW.2018.00130.
[27] C. Ledig et al., "Photo-Realistic Single Image Super-Resolution Using a Generative Adversarial Network," 2017 IEEE Conference on Computer Vision and Pattern Recognition (CVPR), Honolulu, HI, 2017, pp. 105-114, doi: 10.1109/CVPR.2017.19.
[28] C. Dong, C. Loy, and X. Tang. Accelerating the super-resolution convolutional neural network[C]. European conference on computer vision. Springer(ECCV), Cham, 2016: 391-407. 3, 7
[29] W. Lai, J. Huang, N. Ahuja and M. Yang, "Fast and Accurate Image Super-Resolution with Deep Laplacian Pyramid Networks," in IEEE Transactions on Pattern Analysis and Machine Intelligence, vol. 41, no. 11, pp. 2599-2613, 1 Nov. 2019, doi: 10.1109/TPAMI.2018.2865304.
[30] X. Hu, H. Mu, X. Zhang, Z. Wang, T. Tan and J. Sun, "Meta-SR: A Magnification-Arbitrary Network for Super-Resolution," 2019 IEEE/CVF Conference on Computer Vision and Pattern Recognition (CVPR), Long Beach, CA, USA, 2019, pp. 1575-1584, doi: 10.1109/CVPR.2019.00167.
[31] Y. Tai, J. Yang, X. Liu and C. Xu, "MemNet: A Persistent Memory Network for Image Restoration," 2017 IEEE International Conference on Computer Vision (ICCV), Venice, 2017, pp. 4549-4557, doi: 10.1109/ICCV.2017.486.
[32] K. Zhang, W. Zuo and L. Zhang, "Learning a Single Convolutional Super-Resolution Network for Multiple Degradations," 2018 IEEE/CVF Conference on Computer Vision and Pattern Recognition, Salt Lake City, UT, 2018, pp. 3262-3271, doi: 10.1109/CVPR.2018.00344.
[33] D. Liu, B. Wen, Y. Fan, et al., Non-local recurrent network for image restoration[C]. Advances in Neural Information Processing Systems. 2018: 1673-1682. 7
[34] M. Haris, G. Shakhnarovich and N. Ukita, "Deep Back-Projection Networks for Single Image Super-resolution," in IEEE Transactions on Pattern Analysis and Machine Intelligence, doi: 10.1109/TPAMI.2020.3002836.
[35] T. Peleg and M. Elad, "A Statistical Prediction Model Based on Sparse Representations for Single Image Super-Resolution," in IEEE Transactions on Image Processing, vol. 23, no. 6, pp. 2569-2582, June 2014, doi: 10.1109/TIP.2014.2305844.
[36] K. Zhang, W. Zuo, S. Gu and L. Zhang, "Learning Deep CNN Denoiser Prior for Image Restoration," 2017 IEEE Conference on Computer Vision and Pattern Recognition (CVPR), Honolulu, HI, 2017, pp. 2808-2817, doi: 10.1109/CVPR.2017.300.
– 139 –
Industry-driven digital transformation


SESSION 8
SECURITY IN INDUSTRIAL APPLICATIONS
S8.1 PERT: Payload encoding representation from transformer for encrypted traffic classification
S8.2 Visual action recognition using deep learning in video surveillance systems
S8.3 STCCS: Segmented time controlled count-min sketch

PERT: PAYLOAD ENCODING REPRESENTATION FROM TRANSFORMER FOR ENCRYPTED TRAFFIC CLASSIFICATION
Hong Ye He1; Zhi Guo Yang1; Xiang Ning Chen1
1Zhongxing Telecommunication Equipment (ZTE) Corporation
ABSTRACT
Traffic identification becomes more important yet more challenging as related encryption techniques are rapidly developing nowadays. In difference to recent deep learning methods that apply image processing to solve such encrypted traffic problems, in this paper, we propose a method named Payload Encoding Representation from Transformer (PERT) to perform automatic traffic feature extraction using a state-of-the-art dynamic word embedding technique. Based on this, we further provide a traffic classification framework in which unlabeled traffic is utilized to pre-train an encoding network that learns the contextual distribution of traffic payload bytes. Then, the downward classification reuses the pre-trained network to obtain an enhanced classification result. By implementing experiments on a public encrypted traffic data set and our captured Android HTTPS traffic, we prove the proposed method can achieve an obvious better effectiveness than other compared baselines. To the best of our knowledge, this is the first time the encrypted traffic classification with the dynamic word embedding alone with its pre-training strategy has been addressed.
Keywords – Deep learning, dynamic word embedding, encrypted traffic classification, natural language
processing, traffic identification
1. INTRODUCTION
Traffic classification, a task to identify certain categories of network traffic, is crucial for Internet services providers (ISP) to track the source of network traffic, and to further ensure their quality of service (QoS). Also, traffic classification is widely applied in some specific missions, like malware traffic identification and network attack detection. However, this is a challenge since network traffic nowadays is more likely to be hidden with several encryption techniques, making detection hard with a traditional approach.
Typically, there are the following widely applied traffic classification methods: 1) The port-based method which simply identifies traffic data using specific port numbers. It is susceptible to the port number changing and port disguise. 2) Deep packet inspection (DPI), a method which aims tolocate patterns and keywords from traffic packets, is not suitable for identifying encrypted traffic because it heavily relies on unencrypted information. 3) The machine learning
(ML) based method focuses on using manually designed traffic statistical features to fit a machine learning model for categorization [1]. 4) The deep learning (DL) based method is an extension of the ML-based approach where neural networks are applied for automatic traffic feature extraction.
Although encrypted traffic packets are hard to identify, an encrypted traffic flow (a flow is a consecutive sequence of packets with the same source IP, source port, destination IP, destination port and protocol) is still analyzable because the first few packets of a flow may contain visible information like handshake details [2]. In this way, the ML-based and DL-based methods are considered ideal for encrypted traffic classification since they both extract common features from the traffic data. In fact, the ML-based and DL-based methods share the same concept that traffic flows could be vectorized for supervised training according to their feature extraction strategy.
Rather than extracting hand-designed features from the traffic as the ML-based method does, the DL-based method uses a neural network to perform representation learning (RL) for the traffic bytes which allow it to avoid complex feature engineering. It provides an end-to-end solution for encrypted traffic classification where the direct relationship between raw traffic data and its categories is learned. The classification effect of a DL-based method is highly related to its capacity of representation learning.
In this paper, we propose a new DL-based solution named Payload Encoding Representations from Transformers (PERT) in which a dynamic word embedding technique called the Bidirectional Encoder Representations from Transformers (BERT) [3] is applied during the traffic representation learning phrase. Our work is inspired from the great improvements in the natural language processing (NLP) domain that dynamic word embedding brings. We believe that computer communication protocols and natural language have some common characteristics. According to this point, we shall prove that such a strong embedding technique can also be applied to encode traffic payload bytes and provide substantial enhancement while addressing the encrypted traffic classification task.
978-92-61-31391-3/CFP2068P @ ITU 2020 Kaleidoscope – 143 –

2. RELATED WORKS
We shall introduce some related traffic identification works that involve the DL domain, and further categorize them as two major groups.
For feature-engineering: Basically, these methods still use hand-designed features but utilize the DL as a measure of feature processing. For example, Niyaz et al. proposed an approach using the deep belief network (DBN) to make a feature selection before the ML classification [4]. Hochst et al. introduced the auto-encoder network to perform dimension reduction for the manually extracted flow features [5]. Rezaei et al. applied a similar pre-training strategy as we do [6]. What is different is that this work introduced neural networks to reconstruct time series features. Its pre-training plays a role of re-processing the hand-designed features. Ours instead, is to perform a representation learning for the raw traffic.
For representation learning: Works similar to ours that apply the DL to learn the encoding representation from raw traffic bytes without manual feature-engineering. These works are also considered as end-to-end implements of traffic classification. Wang et al. proposed this encrypted traffic classification framework for the first time [7]. They transformed payload data to grayscale images and applied convolutional neural networks (CNN) to perform image processing. Afterward, the emergence of a series of CNN-based works like [8] proved the validity of such an end-to-end classification. Lopez-Martin et al. further discussed a possible combination for traffic identification where the CNN is still used for representation learning, but a long short-term memory (LSTM) network is introduced to learn the flow behaviors [9]. It inspired the hierarchical spatial-temporal features-based (HAST) models which obtained a state-of-the-art result in the intrusion detection domain [10].
Nevertheless, for end-to-end encrypted traffic classification nowadays, CNN is still the mainstream whereas the NLP-related network only works as an assistance to do jobs such as capturing flow information. We can hardly find a full-NLP scheme similar to ours, let alone one which applies current dynamic word embedding techniques.
3. MODEL ARCHITECTURE
3.1 Payload Tokenization
According to [2], the payload bytes of a packet are likely to expose some visible information, especially for the first few packets of a traffic flow. Thus, most DL-based methods use this byte data to construct traffic images as the inputs of a CNN model. This is because the byte data is ideal for generating pixel images as its value ranges from 0 to 255, which is just fit for a grayscale image. Rather than applying such an image processing strategy, we treat the payload bytes of a packet as a language-like string for introducing NLP processing.
Figure 1 – Comparison of raw payload processing between CNN-based methods and PERT
However, the range of byte value is rather small considering the size of a common NLP vocabulary. To extend the vocab size of traffic bytes, we introduce a tokenization which takes pairs of bytes (value range from 0 to 65535) as basic character units to generate the bigram strings, as illustrated in Figure 1. Afterward, the NLP related encoding methods can be directly applied to the tokenized traffic bytes. Thus, the encrypted traffic identification is transformed to a NLP classification task.
3.2 Representation Learning
While performing representation learning in an NLP task, the word embedding is widely utilized. Recently, a breakthrough was made in this research area as the dynamic word embedding technique overcame the drawback that traditional word embedding methods like the Word2Vec [11] are only capable of mapping words to unchangeable vectors. By contrast, vectors trained by dynamic word embedding can be adjusted according to its context inputs, making it more powerful to learn detailed contextual information. This is just what we need for extracting complex contextual features from the encrypted traffic data.
Current popular dynamic word embedding like BERT could be considered as a stack of a certain type of encoding layers. Each encoder takes the outputs of its former layer as inputs and further learns a more abstract representation. In another word, word embedding will be dynamically adjusted while passing through its next encoding layer.
In our work, we take the tokenized payload string [w1, w2, ..., wk] as our original inputs. The first group of word embedding vectors [x1, x2, ..., xk] at the bottom of the network are randomly initialized. After N times of dynamic encoding, we obtain the final word embedding outputs [hN1, hN2, ..., hNk] that imply extremely abstract contextual information of the original payload.
– 144 –
2020 ITU Kaleidoscope Academic Conference

Figure 2 – Representation learning network for payload data using the dynamic word embedding architecture
The illustration of our representation learning is shown in Figure 2.
Figure 3 – Detail of the encoding layer
Earlier dynamic word embedding called the Embeddings from Language Models (Elmo) [12] uses the bidirectional LSTM as its encoder unit, which is not suitable for large-scale training since the LSTM has a bad support for parallel calculations. To solve this problem, [3] replaced the LSTM with a self-attention encoder that is firstly applied in the transformer model [13], and named their embedding model as BERT. This is what we also use for encoding the encrypted payload as shown in Figure 3. Taking our first embedding vectors [x1, x2, ..., xk] as examples, there are several steps of the transformer encoding as follows:
Linear projections: Each embedding vector xi will be projected to three vectors using linear transformations:
𝑲𝑲𝒊𝒊 = 𝑾𝑾𝑲𝑲𝒙𝒙𝒊𝒊𝑸𝑸𝒊𝒊 = 𝑾𝑾𝑸𝑸𝒙𝒙𝒊𝒊𝑽𝑽𝒊𝒊 = 𝑾𝑾𝑽𝑽𝒙𝒙𝒊𝒊
(1)
Where WK, WQ and WV are the three groups of linear parameters.
Self-attention and optional masking: The purpose of linear projections is to generate the inputs for the self-attention mechanism. Generally speaking, self-attention is to figure the compatibility between each input xi and all the other inputs x1~xk via a similarity function, and further to calculate a weighted sum for xi which implies its overall contextual information. In detail, our self-attention is calculated as follows:
𝒂𝒂𝒂𝒂𝒂𝒂𝒊𝒊 = ∑𝑸𝑸𝒊𝒊𝑲𝑲𝒋𝒋
𝑻𝑻
𝑑𝑑𝑘𝑘𝒁𝒁
× 𝑽𝑽𝒋𝒋𝑘𝑘𝑗𝑗=1 (2)
The similarity between xi and xj is figured by a scaled dot-product operator, where dk is the dimension of Kj, and Z is the normalization factor. It should be noticed that not every input vector is needed for self-attention calculation. An optional masking strategy that randomly ignores a few inputs while generating attention vectors is allowed to avoid the over-fitting.
Multi-head attention: In order to grant encoders the ability of reaching more contextual information, the transformer encoding applies a multi-head attention mechanism. Specifically, linear projections will be done for M times for each xi to generate multiple attention vectors [atti,1, atti,2, ..., atti,M]. Afterward, a concatenation operator is utilized to obtain the final attention vector:
𝒂𝒂𝒂𝒂𝒂𝒂𝒊𝒊 = 𝒂𝒂𝒂𝒂𝒂𝒂𝒊𝒊,𝟏𝟏 ⊕ 𝒂𝒂𝒂𝒂𝒂𝒂𝒊𝒊,𝟐𝟐 ⊕ …⊕𝒂𝒂𝒂𝒂𝒂𝒂𝒊𝒊 ,𝑴𝑴 (3)
Feed-forward network (FFN): A full-connected network to provide the output of current encoder. For xi, it is as follows:
𝒉𝒉𝒊𝒊 = 𝑚𝑚𝑚𝑚𝑚𝑚(0,𝑾𝑾𝟏𝟏𝒂𝒂𝒂𝒂𝒂𝒂𝒊𝒊 + 𝒃𝒃𝟏𝟏) + 𝒃𝒃𝟐𝟐 (4)
W1, b1, W2 and b2 are the full-connection parameters and max(0, x) is a ReLU activation.
Finally, we get the dynamic embedding hi which is encoded from xi. It can be further encoded by the next encoding layer or be directly used in downward tasks. Similar to the naming of BERT, we name our encoding network as the Payload Encoding Representation from Transformer (PERT) considering the application of a transformer encoder.
3.3 Packet-level Pre-training
A key factor that makes BERT and its extensive models continuously achieve state-of-the-art results among a wide
– 145 –
Industry-driven digital transformation

range of NLP tasks is their “pre-training + fine-tuning” strategy. To the best of our knowledge, our work is the first to introduce such a strategy to an end-to-end encrypted traffic classification architecture. To perform pre-training is to initialize the encoding network and to give it the ability of contextual information extraction before it is applied to downward tasks. The unsupervised language model (LM) is widely used for word embedding pre-training [14]. BERT, specifically, proposed a masked LM which hides several words from the original string with a unique symbol ‘unk’, and uses the rest of the words to predict those hidden ones.
To demonstrate the procedure of the masked LM, we give a masked traffic bigram string as w = [w1, ..., ‘unk’, ..., ‘unk’, ..., wk] and a list msk = [i1, i2, ..., im] which indicates the position of bigram units that are masked. After the encoding, for each embedding vector hi that are encoded from the i-th position of the original input, a full connection is followed:
𝒐𝒐𝒊𝒊 = 𝑾𝑾′ 𝑡𝑡𝑚𝑚𝑛𝑛ℎ(𝑾𝑾𝒉𝒉𝒊𝒊 + 𝒃𝒃) + 𝒃𝒃′ (5)
Where tanh is an activation function like the Relu. The size of the output vector oi = [oi,1, ..., oi,|V|] is the vocab size |V|. It stores all the likelihoods about what the corresponding traffic bigram is at the i-th position.
In the end, the masked LM uses partial outputs oi, iϵmsk to perform a large softmax classification with the class number of vocab size. The objective is to maximize the predicted probabilities of all the masked bigrams, which can be simply written as (θ represents the parameters of the entire network):
𝑚𝑚𝑎𝑎𝑎𝑎𝑚𝑚𝑚𝑚𝑚𝑚𝜃𝜃 ∑ 𝑃𝑃(𝑤𝑤𝑖𝑖|𝒐𝒐𝒊𝒊 ,𝜃𝜃)𝑖𝑖∈𝒎𝒎𝒎𝒎𝒎𝒎𝑖𝑖 (6)
The LM is considered as a powerful initialization approach for the encoding network using large-scale unlabeled data, yet it is very time-consuming. Even if we want to perform a flow-level classification for encrypted traffic, we argue that the pre-training should be packet-level considering the possible calculation costs. Particularly, we collect raw traffic packets from the Internet despite their sources and extract their payload bytes to generate an unsupervised data set. Then, the extracted payload bytes are tokenized as bigram strings and are utilized to perform a PERT pre-training. After the training converges, we save the adjusted encoding network.
3.4 Flow-level Classification
While implementing a certain task like classification, the pre-trained encoding network will be totally reused and be further adjusted to learn the real relationship between the inputs and a specific task objective. This is the concept of “fine-tuning”, where a network is trained based on a proper initialization to achieve a boosted effect in downward tasks.
Figure 4 – Illustration of the flow-level encrypted traffic classification initialized with a packet-level pre-training
Figure 4 shows our encrypted traffic classification framework. Below are the detailed descriptions:
Packets extraction: While classifying an encrypted traffic flow, only the first M packets (3 for example in Figure 4) need to be used. The bigram tokenization is performed to payload bytes in each packet to generate a list of tokenized payload strings [str1, str2, ..., strM].
Encoding for packets: Before classification, initialize the encoding network of the classifier with the pre-trained counterpart. As the encoding network is packet-level, each tokenized string will be individually transported to the encoders. According to [3], while carrying out a classification with BERT, a unique token ‘cls’ should be added at the beginning of the input as the classification mark. For i-th packet, its tokenized string will be modified as stri’ = [cls, wi,1, wi,2, ..., wi,k]. After encoding, a series of embedding vectors [hNi,CLS, hNi,1, ..., hNi,k] is outputted, yet only the hNi,CLS will be picked as the further classification input. We simply represent hNi,CLS as embi. In order to make use of all of the information extracted from the first M packets, we apply a concatenation to merge the encoded packets:
𝒆𝒆𝒎𝒎𝒃𝒃 = 𝒆𝒆𝒎𝒎𝒃𝒃𝟏𝟏 ⊕ 𝒆𝒆𝒎𝒎𝒃𝒃𝟐𝟐 ⊕ … ⊕𝒆𝒆𝒎𝒎𝒃𝒃𝑴𝑴 (7)
Final classification: In the end, a softmax classification layer is used to learn the probability distribution of the input flows among possible traffic classes. The objective of the flow-level classification can be written as below:
𝑚𝑚𝑎𝑎𝑎𝑎𝑚𝑚𝑚𝑚𝑚𝑚𝜃𝜃 ∑ 𝑃𝑃(𝑦𝑦𝑓𝑓|𝒆𝒆𝒎𝒎𝒃𝒃(𝑓𝑓),𝜃𝜃)𝑓𝑓∈𝑹𝑹𝒇𝒇𝒇𝒇𝒐𝒐𝒇𝒇𝑓𝑓 (8)
Where Rflow represents the flow-level training set. Given a flow sample f, yf represents its true label (class) and emb(f)
– 146 –
2020 ITU Kaleidoscope Academic Conference

indicates its concatenated embedding. P is the conditional probability which the softmax layer provides. In a matter of speaking, the objective is to maximize the probability that each encoded flow sample is predicted as its corresponding category. The flow-level information is involved in the final softmax classifier, and thus will be used to fine-tune the packet-level encoding network during the back propagation. The main point of such a fine-tuning strategy is to separate the learning of the packets relationship from the time-consuming pre-training procedures.
4. EXPERIMENTS
4.1 Experiment Settings
4.1.1 Data sets
Unlabeled Traffic Data: The data set that is utilized for the pre-training of our PERT encoding network. To generate this data set, we capture a large amount of raw traffic data from different sources using different devices through a network sniffer. Typically, there is no special requirement for the unlabeled traffic data except you should make sure your collected samples can cover the mainstream protocols, as many as possible.
ISCX Data Set: We chose a popular encrypted traffic data set "ISCX2016 VPN-nonVPN"1 [15] to make our classification evaluations more persuasive. However, this data set only marks where its encrypted traffic data is captured from and whether the capturing is through a VPN session or not, which means a further labeling should be performed. The ISCX data set is utilized in several works yet the results are rather different even when the same model is applied [7],[8]. This is mainly due to how the raw data is processed and labeled. We only found [7] provided their pre-processing and labeling procedures in their github2. In this way, we follow this open source project to process the raw ISCX data set and label it with 12 classes.
Android Application Data Set: We find the ISCX data set is not entirely encrypted as it also contains data of some unencrypted protocols like the DNS. To make a better evaluation, in this work, we manually capture traffic samples from 100 Android applications via the Android devices and network sniffer tool-kit. All the captured data belongs to the top activated applications of the Chinese Android app markets. Afterward, we exclusively pick the HTTPS flows to ensure only the encrypted data remains.
4.1.2 Parameters
Pre-training: First of all, to perform the packet-level PERT pre-training for our unlabeled traffic data, we introduce public Python library transfomers3 which provide
1 https://www.unb.ca/cic/datasets/vpn.htm 2 https://github.com/echowei/DeepTraffic
implements of the original BERT model and several recently published modified models. In practice, we chose the optimized BERT implement named A Lite BERT (ALBERT) [16] which is more efficient and less resource-consuming. However, even to be properly optimized, current BERT pre-training is very costly that we use 4 Nvidia Tesla P100 GPU cards.
Table 1 – Pre-training parameter settings
Parameter Value Description
hidden_size 768 Vector size of the encoding outputs (embedding vectors).
num_hidden_layers 12 Number of encoders used in the encoding network.
num_attention_heads 12 Number of attention heads used in the multi-head attention mechanism.
intermediate_size 3072 Size of the hidden vectors in the FNN networks.
input_length 128 Amount of tokenized bigrams used in a single packet.
Table 1 shows the settings of our pre-training and corresponding description of each parameter. Such settings refer to what common NLP works with BERT encoding use. After sufficient training, we save the encoding network as a Pytorch4 format which can be reused in our classification networks. Also, all of our other networks are implemented using the Pytorch.
Table 2 – Classification parameter settings
Parameter Value Description
packet_num alternative (5 by default)
Amount of the first packets in a flow that are chosen.
softmax_hidden 768 Size of the hidden vectors in the softmax layer.
dropout 0.5 The dropout rate of the softmax layer.
Classification: The encoding network used at the classification stage shares strictly the same structure as the pre-trained one. Other settings of the classification layers are shown in Table 2. As fine-tuning the encoding network in a classification task is relatively inexpensive [3], a single GPU card will be just enough.
4.1.3 Baselines
Below are the baseline classification methods we use for comparison:
3 https://huggingface.co/transformers/ 4 https://pytorch.org
– 147 –
Industry-driven digital transformation

ML-based: We refer to [15] to implement our ML-based methods using the decision tree classifier (we named it ML-1). However, it only contains basic flow-statistical features that we consider as not the most optimized ML-based method. Thus, based on ML-1, we further add some time series features as the source ports, destination ports, directions, packet lengths and arrival time intervals of the first 10 packets in a flow to generate the ML-2 model.
CNN: The two types of CNN models that are provided by [7], the 1D-CNN and the 2D-CNN. They both use the first 784 bytes of a traffic flow to perform the classification.
HAST: The two HAST models proposed by [10] are the state-of-art end-to-end methods for intrusion detection. HAST-I uses the first 784 bytes of a flow for direct representation learning. HAST-II, however, only performs packet-level encoding. It further introduces an LSTM to merge the encoded packets.
During the evaluation, we randomly chose 90% of samples from the data set as the the training set, and the remaining 10% for validation. Then, three widely used classification metrics are applied:
𝑃𝑃𝑎𝑎𝑃𝑃𝑃𝑃𝑖𝑖𝑠𝑠𝑖𝑖𝑠𝑠𝑛𝑛(𝑃𝑃) = 𝑇𝑇𝑇𝑇𝑇𝑇𝑇𝑇+𝐹𝐹𝑇𝑇
𝑅𝑅𝑃𝑃𝑃𝑃𝑚𝑚𝑅𝑅𝑅𝑅(𝑅𝑅) = 𝑇𝑇𝑇𝑇𝑇𝑇𝑇𝑇+𝐹𝐹𝐹𝐹
𝐹𝐹1 − 𝑠𝑠𝑃𝑃𝑠𝑠𝑎𝑎𝑃𝑃(𝐹𝐹1) = 2×𝑇𝑇×𝑅𝑅𝑇𝑇+𝑅𝑅
(9)
Take a class yi as an example, the TPi is the amount of samples correctly classified as yi, FPi is the amount of samples mistakenly classified as yi, FNi is the amount of samples mistakenly classified as nor-yi. As for the overall evaluation for all classes, we use the average values of those metrics.
4.2 Overall Analysis
Table 3 – Classification results (ISCX data set)
Model Precision Recall F1
ML-1 [15] 0.8194 0.8136 0.8164 ML-2 0.8901 0.8896 0.8898 CNN-1D [7] 0.8616 0.8605 0.8610 CNN-2D [7] 0.8425 0.8420 0.8422 HAST-I [10] 0.8757 0.8729 0.8742 HAST-II [10] 0.8502 0.8427 0.8409 PERT(Ours) 0.9327 0.9322 0.9323
Results on the ISCX data set: This group of experiments are used to discuss the classification based on the consistent data settings of [7]. As we can see in Table 3, our flow-level PERT classification achieves the best classification results where the precision reaches 93.27% and the recall reaches 93.22%. It proves the PERT is a power representation learning method for encrypted traffic classification.
As for other models, using the same manner of data preprocessing, the CNN classification results are pretty close to what is provided by [7]. The CNN methods obviously obtain higher precision and recall than the ML-1 which are implemented based on [15]. However, the ML-1 can still be improved. When the time series features are added, the precision of the ML-2 classification can exceed 89% which is much better than what the basic CNN methods get. In other words, the basic CNN methods actually have no absolute advantage while classifying the ISCX data set.
HAST-I achieves better results than typical CNN models yet HAST-II with an LSTM works relatively worse. In fact, we think using the first few bytes of a flow to perform a direct deep learning (like HAST-I and CNN-1D) is considered better than merging the packet-level encoded vectors, since the representation learning can directly capture flow-level information. However, the encoding costs on a long string are not affordable for complex dynamic word embedding. At the current stage, the “packet-level encoding + flow-level merging” is the best option for our PERT classification.
Table 4 – Classification results (Android data set)
Model Precision Recall F1
ML-1 [15] / / / ML-2 0.7351 0.7335 0.7321 CNN-1D [7] 0.7709 0.7683 0.7668 CNN-2D [7] 0.7684 0.7659 0.7643 HAST-I [10] 0.8201 0.8185 0.8167 HAST-II [10] 0.7924 0.7813 0.7826 PERT(Ours) 0.9042 0.9003 0.9007
Results on the Android data set: Experiments based on full HTTPS traffic to evaluate the actual encrypted traffic classification ability of each method. As all the data here are HTTPS flows, in comparison with the ISCX data set whose data covers several traffic protocols, it is harder to locate distinctly different flow behaviors among the chosen applications. Consequently, the ML-based methods that strongly rely on flow statistics features work extremely weakly. Even when enhanced by time series features, the ML-2 still obtains a worse result than basic DL methods. As for the original ML-1, we find it is entirely not capable of addressing this 100-class HTTPS classification that we ignore its result in Table 4.
Results on the Android data set demonstrate that the DL-based methods are more suitable for processing full encrypted traffic data. More importantly, our PERT classification again shows its superiority as it introduces a more powerful representation learning strategy. Its F1-score on the 100-class encrypted traffic classification exceeds 90% whereas the HAST can only achieves a result of 81.67%.
4.3 Discussion: Selection of the Packet Number
In a flow-level classification model, the increase in the use of packets will cause significant costs. This is particularly
– 148 –
2020 ITU Kaleidoscope Academic Conference

true when the representation learning is applied to traffic packets.
Figure 5 – Illustration of the packet number selection for PERT classification
We performed PERT classifications multiple times on the two data sets with different settings of the “packet_num” and the results are shown in Figure 5. As we can see, at the beginning, the classification result on each data set is greatly improved with more packets used. However its increase is slight after the continuous adding of packets. For example, the F1-score is shown to reach 91.35% while classifying the Android data set with 20 packets. But this result is merely boosted by 1.28% in comparison with using 5 packets. It is not recommended considering the costs of PERT encoding for so many packets and such minor further improvements.
We point out that using 5-10 packets for our PERT classification will be sufficient. Similar conclusions can be also found in other flow-level classification research like [9],[10].
4.4 Discussion: Merging of the Encoded Packets
A major difference between our PERT classification and most flow-level DL-based methods like the HAST-II is how the encoded packets are merged. HAST-II constructs a 2-layer LSTM after encoding the packet data whereas we simply apply a concatenation. To make a comparison between these two approaches, we modify our PERT model and the HAST-II model.
Firstly, we refer to HAST-II and construct the PERT_lstm model by using a 2-layer LSTM to follow our PERT encoded packets. Then, we remove the LSTM layer from HAST-II and further generate the HAST_con by concatenating the HAST encoded packets to fit an ordinary softmax classifier, just as our original PERT model does. For all the compared methods, we consistently select 5 packets for classification based on our former discussion.
Figure 6 – F1-score converging speed comparison
We perform validation every training epoch for each classification experiment and record corresponding F1-scores for evaluation. As illustrated in Figure 6, we cannot actually tell which merging approach is better for classification accuracy. Whether using the concatenation or the LSTM approach for merging, it does not have a major influence in the final classification results.
However, using different merging approaches will have an obvious impact on the converging speed of the classification training. In Figure 6, it always takes less training rounds before the model converges while introducing the concatenation merging. We believe the LSTM is not a satisfactory option for merging the encoded packets as applying a simple concatenation can reach a very close classification result, yet it is much faster.
– 149 –
Industry-driven digital transformation

5. CONCLUSION
After a thorough analysis of the possibility of applying the full-NLP scheme for encrypted traffic classification, we point out that the byte data of raw traffic packets can be transformed to character strings by proper tokenization. Based on this, we propose a new method named PERT to encode the encrypted traffic data and to serve as an automatic traffic feature extractor. In addition, we discuss the pre-training strategy of dynamic word embedding in a condition of the flow-level encrypted traffic classification. In accordance with a series of experiments on the public ISCX data set and Android HTTPS traffic, our proposed classification framework can provide significantly better results than current DL-based methods and traditional ML-based methods.
REFERENCES
[1] P. Velan, M. Cermak, P. Celeda, et al., “A Survey of Methods for Encrypted Traffic Classification and Analysis,” International Journal of Network Management, 2015.
[2] S. Rezaei and X. Liu, “Deep Learning for Encrypted Traffic Classification: An Overview,” IEEE Communications Magazine, vol. 57, no. 5, pp. 76-81, 2019.
[3] J. Devlin, M.W. Chang, K. Lee, et al., "BERT: Pre-training of deep bidirectional transformers for language understanding," Proceedings of the 2019 Conference of the North American Chapter of the Association for Computational Linguistics: Human Language Technologies, 2019.
[4] A.Y. Javaid, Q. Niyaz, W. Sun , et al., "A Deep Learning Approach for Network Intrusion Detection System," 9th EAI International Conference on Bio-inspired Information and Communications Technologies. ICST., 2015.
[5] J. Hochst, L. Baumgartner, M. Hollick, et al., "Unsupervised Traffic Flow Classification Using a Neural Autoencoder," IEEE 42nd Conference on Local Computer Networks (LCN), Singapore, pp. 523-526, 2017.
[6] S. Rezaei, X. Liu, “How to Achieve High Classification Accuracy with Just a Few Labels: A Semi-supervised Approach Using Sampled Packets,” 2018.
[7] W. Wang, M. Zhu, J. Wang, et al., "End-to-end encrypted traffic classification with one-dimensional convolution neural networks," IEEE International Conference on Intelligence and Security Informatics (ISI), Beijing, pp. 43-48, 2017.
[8] M.Lotfollahi, R.S.H. Zade, M.J. Siavoshani, et al., “Deep Packet: A Novel Approach For Encrypted Traffic Classification Using Deep Learning,” Soft Computing, 2017.
[9] M. Lopez-Martin, B. Carro, A. Sanchez-Esguevillas, et al., “Network Traffic Classifier With Convolutional and Recurrent Neural Networks for Internet of Things,” IEEE Access, vol. 5, pp. 18042-18050, 2017
[10] W. Wang, Y. Sheng , J. Wang , et al., “HAST-IDS: Learning Hierarchical Spatial-Temporal Features Using Deep Neural Networks to Improve Intrusion Detection,” IEEE Access, vol. 6, pp. 1792-1806, 2018.
[11] T. Mikolov, K. Chen, G. Corrado, et al., "Efficient Estimation of Word Representations in Vector Space," Proceedings of Workshop at ICLR, 2013.
[12] M.E. Peters, M. Neumann, M. Iyyer, et al., “Deep contextualized word representations,” 2018.
[13] A. Vaswani, N. Shazeer, N. Parmar, et al., “Attention Is All You Need,” 2017.
[14] Y. Bengio, R. Ducharme, P. Vincent, “A Neural Probabilistic Language Model,” Journal of Machine Learning Research, 2000.
[15] G. Draper-Gil, A.H. Lashkari, M.S.I. Mamun, et al., "Characterization of Encrypted and VPN Traffic using Time-related Features," The International Conference on Information Systems Security and Privacy (ICISSP), 2016.
[16] Z. Lan, M. Chen, S. Goodman, et al., “ALBERT: A Lite BERT for Self-supervised Learning of Language Representations,” 2019.
– 150 –
2020 ITU Kaleidoscope Academic Conference

VISUAL ACTION RECOGNITION USING DEEP LEARNING IN VIDEO SURVEILLANCE SYSTEMS
Dhananjay Kumar1; Priyanka T1; Aishwarya Murugesh1, Ved P. Kafle2
1Department of Information Technology, Anna University, MIT Campus, Chennai, India 2National Institute of Information and Communications Technology, Tokyo, Japan
ABSTRACT
The skeleton tracking technique allows the usage of the skeleton information of human-like objects for action recognition. The major challenge in action recognition in a video surveillance system is the large variability across and within subjects. In this paper, we propose a deep-learning-based novel framework to recognize human actions using skeleton estimation. The main component of the framework consists of pose estimation using a stacked hourglass network (HGN). The pose estimation module provides the skeleton joint points of humans. Since the position of skeleton varies according to the point of view, we apply transformations on the skeleton points to make it invariable to rotation and position. The skeleton joint positions are identified using HGN-based deep neural networks (HGN-DNN), and the feature extraction and classification is carried out to obtain the action class. The skeleton action sequence is encoded using Fisher Vector before classification. The proposed system complies with Recommendation ITU-T H.626.5 “Architecture for intelligent visual surveillance systems”, and has been evaluated over benchmarked human action recognition data sets. The evaluation results show that the system performance achieves a precision of 85% and the accuracy of 95.6% in recognizing actions like wave, punch, kick, etc. The HGN-DNN model meets the requirements and service description specified in Recommendation ITU-T F.743.
Keywords – Action recognition, CNN, deep learning, feature extraction, skeleton processing, video stream
1. INTRODUCTION
A video stream carries a large amount of media data with multiple modality (e.g., frame, motion, audio) making action recognition very complex and challenging. In a machine-learning approach, the spatio-temporal attention network for action recognition works on video segments represented by multiple modalities, where each modality could be modeled as a single stream [1]. The representations of each video segment on different modalities are concatenated and sequentially fed into a neural (e.g., long short-term memory) network to learn the temporal attention. The temporal
attention needs to be exploited further using a higher order of learning in predicting the action in the video.
The spatio-temporal approach considering different distribution of interest points can provide an efficient method for action classification [2]. However, the appearance of the spatio-temporal points can influence the performance. A hierarchical spatio-temporal model [3] for action recognition for a single person, as well as identification of activities with interactions need to consider spatial constraints along with temporal constraints. The technique requires the computation of both the spatial similarity and the temporal similarity of activities to be monitored together to provide the superior classification result. The human activities of a single person in a well-defined scenario can be classified with higher accuracy. However, a suitable learning algorithm to train all parameters efficiently and effectively, can improve the classification ability by jointly estimating a spatio-temporal similarity of activities. Furthermore, it can offer a unified framework in modeling both one-person actions and multi-person activities.
A commonly used framework for human detection and action recognition in a video stream encompasses uniform segmentation and combination of Euclidean distance and joint entropy features [4]. Feature selection by Euclidean distance and the joint entropy-PCA (principal component analysis) based method, and further classification using a multi-class support vector machine requires a higher level of learning. The method needs to initially intensify the frames to extract the moving objects and later classify the region frames based on feature vectors.
The salient features using convolutional neural networks (CNN) [5] for each frame can be extracted and then mapped onto codes. In order to minimize the computational requirements, key frames are selected based on changes in code. The video snippets consisting of consecutive key frames are applied to a hierarchical decomposition. Furthermore, the PCA is applied on every hierarchy level to reduce the dimensions. Although an overlapping window can be used in selecting video, in order to improve efficiency key frame selection and its binary code is used provided the snippet has sufficient information on motion representing an action.
978-92-61-31391-3/CFP2068P @ ITU 2020 Kaleidoscope– 151 –

The methods based on dense trajectories [6] employing the Gaussian mixture model (GMM) for codebook generation and Fisher vector encoding for action recognition have shown better performance. Although the motion trajectory describing delicate motion represents both the dynamics and appearance of an action in a scene, because of a low-level descriptor will not be enough for action recognition. This happens due to the absence of action semantics at the global level.
The proposed system utilizes deep machine-learning techniques to improve its performance accuracy in action recognition (e.g., wave, punch, kick, jump, etc.) over existing approaches. The major contribution of this work is twofold: a skeleton generator that generates the skeleton joint points for the human object, and an action detector that considers the sequence of a feature vector. Our models are designed to leverage deep-learning techniques while complying with the criteria set by Recommendation ITU-T H.626.5. The system models have been developed to meet the requirements listed in ITU-T H.626.5 – “Architecture for intelligent visual surveillance systems” [7] and ITU-T F.743 “Requirements and service description for video surveillance” [8]. In our system, the target recognition and association are achieved with the combination of DNN and HGN to recognize the action performed by the human.
The remainder of the paper is organized as follows. Section 2 provides the architectural details of the proposed system
and Section 3 describes the theory behind system development. The implementation detail for performance evaluation and experimental results are presented in Section 4, while Section 5 concludes the paper.
2. PROPOSED SYSTEM
The outline of the proposed action recognition system is shown in Figure 1. In this system model, different frames of the video stream are used to generate the skeleton of a human subject. The estimated skeleton is transformed using hip and theta transformation to remove the occlusion effect on the frames due to difference in viewpoints and camera angle. From the skeleton sequence the features of the joints are extracted, encoded using Fisher vector and reduced using PCA. This optimal feature code sequence is used to train the classifier model which is further used to identify the action classes. Skeleton tracking is used to obtain the estimated skeleton of the human subject. This is performed by the pose estimation method which provides a set of points which represents the joint coordinates of the human skeleton. It consists of a two-dimensional (2D) pose estimation module and a depth regression module, which predicts the 2D joint locations and the depth values, and it is implemented using hourglass network architecture. The network output is a set of low-resolution heat maps. Each map represents a 2D probability distribution of one joint.
Figure 1 – The architecture of the proposed model
Video stream
Joint Prediction
Heat Map
Hip Transformation
Theta Transformation
Estimated skeleton
Joint Vector
Body height
Normalized JV
Body Disp
Joint Disp
Dimensionality Reduction-PCA
Classification Action Class
Pose Estimation Preprocessing
Feature Extraction
Fisher Vector
Update the action of the
person
Add new person label
– 152 –
2020 ITU Kaleidoscope Academic Conference
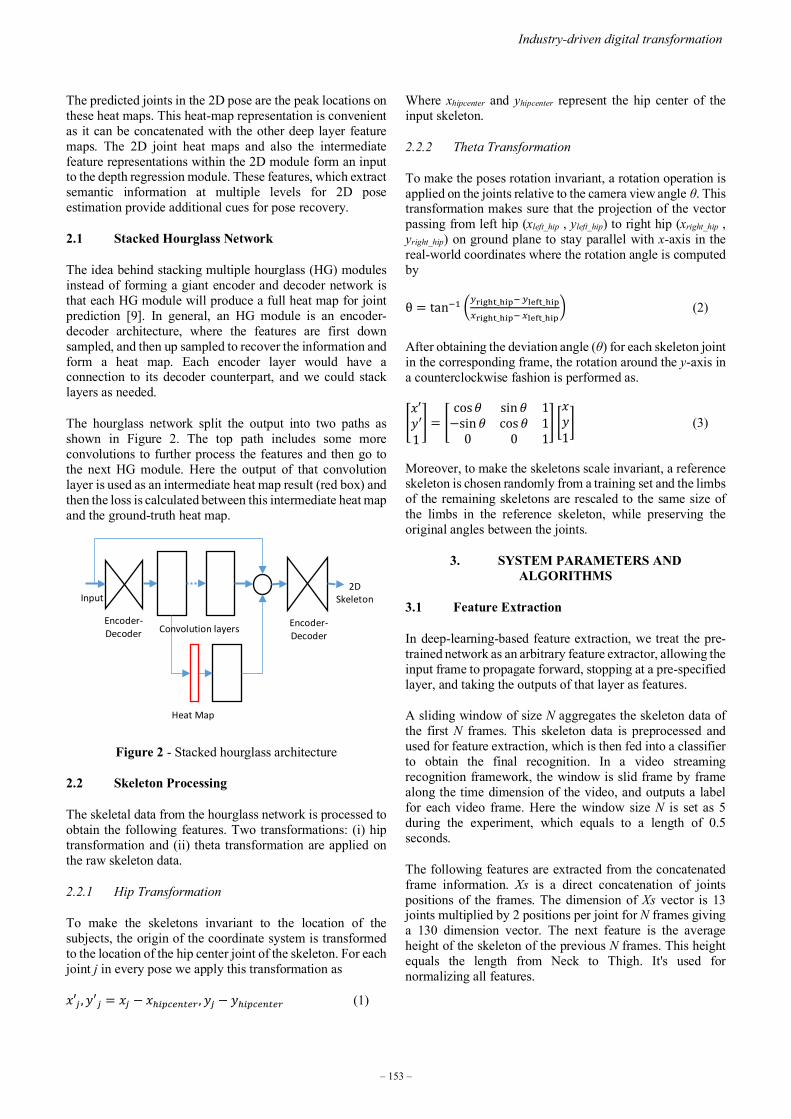
The predicted joints in the 2D pose are the peak locations on these heat maps. This heat-map representation is convenient as it can be concatenated with the other deep layer feature maps. The 2D joint heat maps and also the intermediate feature representations within the 2D module form an input to the depth regression module. These features, which extract semantic information at multiple levels for 2D pose estimation provide additional cues for pose recovery.
2.1 Stacked Hourglass Network
The idea behind stacking multiple hourglass (HG) modules instead of forming a giant encoder and decoder network is that each HG module will produce a full heat map for joint prediction [9]. In general, an HG module is an encoder-decoder architecture, where the features are first down sampled, and then up sampled to recover the information and form a heat map. Each encoder layer would have a connection to its decoder counterpart, and we could stack layers as needed.
The hourglass network split the output into two paths as shown in Figure 2. The top path includes some more convolutions to further process the features and then go to the next HG module. Here the output of that convolution layer is used as an intermediate heat map result (red box) and then the loss is calculated between this intermediate heat map and the ground-truth heat map.
Figure 2 - Stacked hourglass architecture
2.2 Skeleton Processing
The skeletal data from the hourglass network is processed to obtain the following features. Two transformations: (i) hip transformation and (ii) theta transformation are applied on the raw skeleton data.
2.2.1 Hip Transformation
To make the skeletons invariant to the location of the subjects, the origin of the coordinate system is transformed to the location of the hip center joint of the skeleton. For each joint j in every pose we apply this transformation as
𝑥𝑥′𝑗𝑗 ,𝑦𝑦′𝑗𝑗 = 𝑥𝑥𝑗𝑗 − 𝑥𝑥ℎ𝑖𝑖𝑖𝑖𝑖𝑖𝑖𝑖𝑖𝑖𝑖𝑖𝑖𝑖𝑖𝑖 , 𝑦𝑦𝑗𝑗 − 𝑦𝑦ℎ𝑖𝑖𝑖𝑖𝑖𝑖𝑖𝑖𝑖𝑖𝑖𝑖𝑖𝑖𝑖𝑖 (1)
Where xhipcenter and yhipcenter represent the hip center of the input skeleton.
2.2.2 Theta Transformation
To make the poses rotation invariant, a rotation operation is applied on the joints relative to the camera view angle θ. This transformation makes sure that the projection of the vector passing from left hip (xleft_hip , yleft_hip) to right hip (xright_hip , yright_hip) on ground plane to stay parallel with x-axis in the real-world coordinates where the rotation angle is computed by
θ = tan−1 𝑦𝑦right_hip− 𝑦𝑦left_hip
𝑥𝑥right_hip− 𝑥𝑥left_hip (2)
After obtaining the deviation angle (θ) for each skeleton joint in the corresponding frame, the rotation around the y-axis in a counterclockwise fashion is performed as.
𝑥𝑥′𝑦𝑦′1 =
cos𝜃𝜃 sin𝜃𝜃 1−sin𝜃𝜃 cos𝜃𝜃 1
0 0 1 𝑥𝑥𝑦𝑦1 (3)
Moreover, to make the skeletons scale invariant, a reference skeleton is chosen randomly from a training set and the limbs of the remaining skeletons are rescaled to the same size of the limbs in the reference skeleton, while preserving the original angles between the joints.
3. SYSTEM PARAMETERS AND ALGORITHMS
3.1 Feature Extraction
In deep-learning-based feature extraction, we treat the pre-trained network as an arbitrary feature extractor, allowing the input frame to propagate forward, stopping at a pre-specified layer, and taking the outputs of that layer as features.
A sliding window of size N aggregates the skeleton data of the first N frames. This skeleton data is preprocessed and used for feature extraction, which is then fed into a classifier to obtain the final recognition. In a video streaming recognition framework, the window is slid frame by frame along the time dimension of the video, and outputs a label for each video frame. Here the window size N is set as 5 during the experiment, which equals to a length of 0.5 seconds.
The following features are extracted from the concatenated frame information. Xs is a direct concatenation of joints positions of the frames. The dimension of Xs vector is 13 joints multiplied by 2 positions per joint for N frames giving a 130 dimension vector. The next feature is the average height of the skeleton of the previous N frames. This height equals the length from Neck to Thigh. It's used for normalizing all features.
2D Skeleton
Encoder- Decoder Convolution layers
Heat Map
Encoder- Decoder
Input
– 153 –
Industry-driven digital transformation

The displacement of the body is computed by dividing the displacement of the neck by height H. The normalized joint positions are obtained by normalization using the body height H. The displacement of the joints is computed using the normalized coordinate and it has 13 joints multiplied by 2 displacements per joint to give a 104 dimension for N=5 frames.
3.2 Feature Vector Optimization
There are in total 10874 extracted feature samples with 314 dimensions. These features are mainly from normalized joint points such as Xs, height, displacement of the body, displacement of the joints, velocity of body, and joints. The Fisher vector and dimensionality reduction are applied for the optimization of the features, and reduce it into 50 dimensions before classification. This is shown in Figure 3.
Figure 3 - Feature vector optimization
3.2.1 Fisher Vector
The Fisher vector (FV) encodes the gradients of the log-likelihood of the features under the Gaussian-Mixture-Model (GMM), with respect to the GMM parameters [10]. The reason behind using Fisher vector is: it is efficient to compute, and provides excellent results even with efficient linear classifiers, where it is often compressed with a minimal loss of accuracy using product quantization. The FV encoding stores the mean and the covariance deviation vectors per component k of the GMM and each element of the local feature descriptors together.
3.2.2 PCA Dimensionality Reduction
The input to the PCA [11] algorithm is the final concatenated feature vector from the previous step and the output is the vector with reduced dimensionality. During the evaluations, a range of values for parameters of the PCA is examined and the best value of the parameters is stored for testing. It is used to preserve the essential parts that have more variation of the data and remove the non-essential parts with fewer variations. The resultant feature vector has a dimension of 50. The number of samples are 10874, which is smaller than the original 11202 frames due to the setting of sliding window and missing data. These features are ready for classification.
3.3 Skeleton Generation and Processing
The human skeleton is generated by using a stacked hourglass network. This neural network is used to detect human skeleton (joint positions) from each video frame, and then the skeleton is utilized as raw data to extract features and make classification by using machine-learning algorithms [12].
For each frame in the input video stream, the human subject is detected and the skeleton for frame is generated. Hence for a video stream, continuous sequence of skeleton information is generated. The skeleton vectors are processed by various techniques such as transformations and concatenation of a window of frame vectors as detailed in Algorithm 1.
The classification of the action performed by the human subject is carried out on the skeleton information generated by the HG model. The skeleton vectors are concatenated and features are extracted to generate the feature vector using Algorithm 2. Before generating the feature vector, the raw skeleton data is preprocessed. After vector generation, the dimensions are reduced to make the data more focused and to improve the performance of the classifier.
X: Normalized joint position
V_body
V_Joints
PCA Classifier
50 Dimensions 10874 Samples 314 Dimensions
Features of prev. 5 frames Algorithm 1: Skeleton_Generation: Load the images images_loader = ReadValidImagesAndActionTypesByTxt() num_total_images = images_loader.num_images for ith_img in range(num_total_images):
img, str_action_label, img_info = images_loader.read_image() humans = detect_human(img) img_disp = img.copy() draw_skeleton(img_disp, humans) img_displayer.display(img_disp, wait_key_ms=1) skeletons, scale_h = humans_to_skels_list(humans)
Save skeleton data for training skeletons, scale_h = humans_to_skels_list(humans) dict_id_to_skeleton =track(skeletons) skels_to_save = [img_info + skeleton]
Read all the skeleton files of the training data into skeletons Initialize all_skeletons as empty structure for i in range(num_skeletons):
skeletons = read_skeletons_from_ith_txt(i) If empty, discard this image skeleton = skeletons[idx_person] label = skeleton[idx_action_label] all_skeletons.append(skeleton) Create a dump file of the skeleton
simplejson.dump(all_skeletons, f)
– 154 –
2020 ITU Kaleidoscope Academic Conference
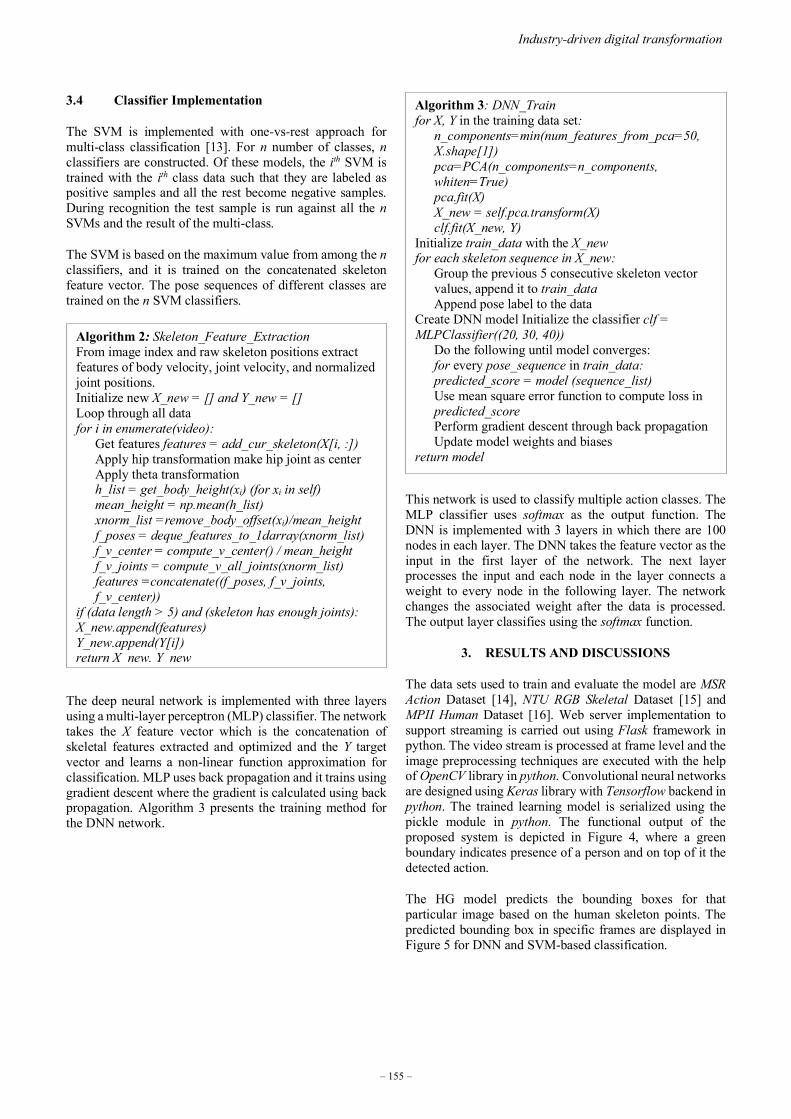
3.4 Classifier Implementation
The SVM is implemented with one-vs-rest approach for multi-class classification [13]. For n number of classes, n classifiers are constructed. Of these models, the ith SVM is trained with the ith class data such that they are labeled as positive samples and all the rest become negative samples. During recognition the test sample is run against all the n SVMs and the result of the multi-class.
The SVM is based on the maximum value from among the n classifiers, and it is trained on the concatenated skeleton feature vector. The pose sequences of different classes are trained on the n SVM classifiers.
The deep neural network is implemented with three layers using a multi-layer perceptron (MLP) classifier. The network takes the X feature vector which is the concatenation of skeletal features extracted and optimized and the Y target vector and learns a non-linear function approximation for classification. MLP uses back propagation and it trains using gradient descent where the gradient is calculated using back propagation. Algorithm 3 presents the training method for the DNN network.
This network is used to classify multiple action classes. The MLP classifier uses softmax as the output function. The DNN is implemented with 3 layers in which there are 100 nodes in each layer. The DNN takes the feature vector as the input in the first layer of the network. The next layer processes the input and each node in the layer connects a weight to every node in the following layer. The network changes the associated weight after the data is processed. The output layer classifies using the softmax function.
3. RESULTS AND DISCUSSIONS
The data sets used to train and evaluate the model are MSR Action Dataset [14], NTU RGB Skeletal Dataset [15] and MPII Human Dataset [16]. Web server implementation to support streaming is carried out using Flask framework in python. The video stream is processed at frame level and the image preprocessing techniques are executed with the help of OpenCV library in python. Convolutional neural networks are designed using Keras library with Tensorflow backend in python. The trained learning model is serialized using the pickle module in python. The functional output of the proposed system is depicted in Figure 4, where a green boundary indicates presence of a person and on top of it the detected action.
The HG model predicts the bounding boxes for that particular image based on the human skeleton points. The predicted bounding box in specific frames are displayed in Figure 5 for DNN and SVM-based classification.
Algorithm 2: Skeleton_Feature_Extraction From image index and raw skeleton positions extract features of body velocity, joint velocity, and normalized joint positions. Initialize new X_new = [] and Y_new = [] Loop through all data for i in enumerate(video):
Get features features = add_cur_skeleton(X[i, :]) Apply hip transformation make hip joint as center Apply theta transformation h_list = get_body_height(xi) (for xi in self) mean_height = np.mean(h_list) xnorm_list =remove_body_offset(xi)/mean_height f_poses = deque_features_to_1darray(xnorm_list) f_v_center = compute_v_center() / mean_height f_v_joints = compute_v_all_joints(xnorm_list) features =concatenate((f_poses, f_v_joints, f_v_center))
if (data length > 5) and (skeleton has enough joints): X_new.append(features) Y_new.append(Y[i]) return X new, Y new
Algorithm 3: DNN_Train for X, Y in the training data set:
n_components=min(num_features_from_pca=50, X.shape[1]) pca=PCA(n_components=n_components, whiten=True) pca.fit(X) X_new = self.pca.transform(X) clf.fit(X_new, Y)
Initialize train_data with the X_new for each skeleton sequence in X_new:
Group the previous 5 consecutive skeleton vector values, append it to train_data Append pose label to the data
Create DNN model Initialize the classifier clf = MLPClassifier((20, 30, 40))
Do the following until model converges: for every pose_sequence in train_data: predicted_score = model (sequence_list) Use mean square error function to compute loss in predicted_score Perform gradient descent through back propagation Update model weights and biases
return model
– 155 –
Industry-driven digital transformation

Figure 4 – System display of the recognized action
(a) DNN (b) SVM
Figure 5 - Bounding boxes in two MSR action data sets
4.1 Action Classification Results
The SVM is trained with the help of a feature vector generated from the MSR Action Data Set. The Confusion matrix of the data set with the one-vs.-all SVM is listed in Table 1. The SVM is trained on nine classes of action namely wave, punch, kick, squat, sit, jump, run, walk, and stand. This confusion matrix provides a summary of prediction results on a classification problem. The number of correct and incorrect predictions on the data set are summarized with count values and broken down by each class.
The performance of the classifier is measured by using metrics: precision, recall, F1, and support. Precision metric is used as an important measure to identify how the classifier performs action recognition, irrespective of the human subject present in each frame. Precision measures the ability of a classifier to identify only the correct instances for each action class and it can be calculated using equation (4).
𝑃𝑃𝑃𝑃𝑃𝑃𝑃𝑃𝑃𝑃𝑃𝑃𝑃𝑃𝑃𝑃𝑃𝑃 = 𝑇𝑇𝑖𝑖𝑇𝑇𝑖𝑖𝑇𝑇𝑇𝑇𝑇𝑇𝑖𝑖𝑖𝑖𝑖𝑖𝑇𝑇𝑖𝑖𝑇𝑇 (𝑇𝑇𝑖𝑖𝑇𝑇𝑖𝑖𝑇𝑇𝑇𝑇𝑇𝑇𝑖𝑖𝑖𝑖𝑖𝑖𝑇𝑇𝑖𝑖𝑇𝑇+𝐹𝐹𝐹𝐹𝐹𝐹𝑇𝑇𝑖𝑖𝑇𝑇𝑇𝑇𝑇𝑇𝑖𝑖𝑖𝑖𝑖𝑖𝑇𝑇𝑖𝑖𝑇𝑇 )
(4)
Recall measures the ability of a classifier to find all correct instances per class which is calculated using the equation (5).
𝑅𝑅𝑃𝑃𝑃𝑃𝑅𝑅𝑅𝑅𝑅𝑅 = 𝑇𝑇𝑖𝑖𝑇𝑇𝑖𝑖𝑇𝑇𝑇𝑇𝑇𝑇𝑖𝑖𝑖𝑖𝑖𝑖𝑇𝑇𝑖𝑖𝑇𝑇 (𝑇𝑇𝑖𝑖𝑇𝑇𝑖𝑖𝑇𝑇𝑇𝑇𝑇𝑇𝑖𝑖𝑖𝑖𝑖𝑖𝑇𝑇𝑖𝑖𝑇𝑇+𝐹𝐹𝐹𝐹𝐹𝐹𝑇𝑇𝑖𝑖𝐹𝐹𝑖𝑖𝐹𝐹𝐹𝐹𝑖𝑖𝑖𝑖𝑇𝑇𝑖𝑖𝑇𝑇 )
(5)
Table 1 - Confusion matrix of the one-vs.-all SVM
Action label Wave Punch Kick Squat Sit Jump Run Walk Stand
Wave 6 0 1 1 0 0 1 0 343 Punch 0 0 0 1 0 0 0 237 5 Kick 15 4 6 3 0 0 296 0 2 Squat 0 0 0 0 0 279 0 0 0
Sit 0 0 0 0 562 0 1 0 0 Jump 39 5 23 246 0 0 3 0 6 Run 6 6 274 11 0 0 9 0 0 Walk 26 327 5 1 0 0 2 0 0 Stand 460 33 7 15 0 0 0 1 3
The F1 score is the measurement of a weighted harmonic mean of precision and recall normalized between 0 and 1 for action of the action class on which the classifier is trained. The F score of 1 indicates an ideal balance as precision and therefore the recall are inversely related. A high F1 score is beneficial where both high recall and precision is vital. The Support is the number of actual occurrences of the class in the test data set. Imbalanced support within the training data may indicate the necessity for representative sampling or rebalancing. The performance metrics for the action classifier is shown in Table 2.
The precision-recall curves are a metric used to evaluate a classifier’s quality, particularly when classes are very imbalanced. It shows the trade-off between precision, a measure of result relevancy, and recall, a measure of how many relevant results are returned. A large area under the curve indicates high recall and corresponding precision values. Figure 6 shows the precision-recall plot of the proposed DNN-based classifier. The average precision score, micro-averaged over all the action classes is 0.85.
Table 2 - Performance metrics of the action classifier
Class Precision Recall F1-score Support Stand 0.83 0.89 0.86 519 Walk 0.87 0.91 0.89 361 Run 0.87 0.9 0.88 306 Jump 0.88 0.76 0.82 322 Sit 1 1 1 563 Squat 1 1 1 279 Kick 0.95 0.93 0.93 326 Punch 1 0.99 0.99 243 Wave 0.96 0.96 0.96 352
Figure 6 - Precision-recall plot
– 156 –
2020 ITU Kaleidoscope Academic Conference
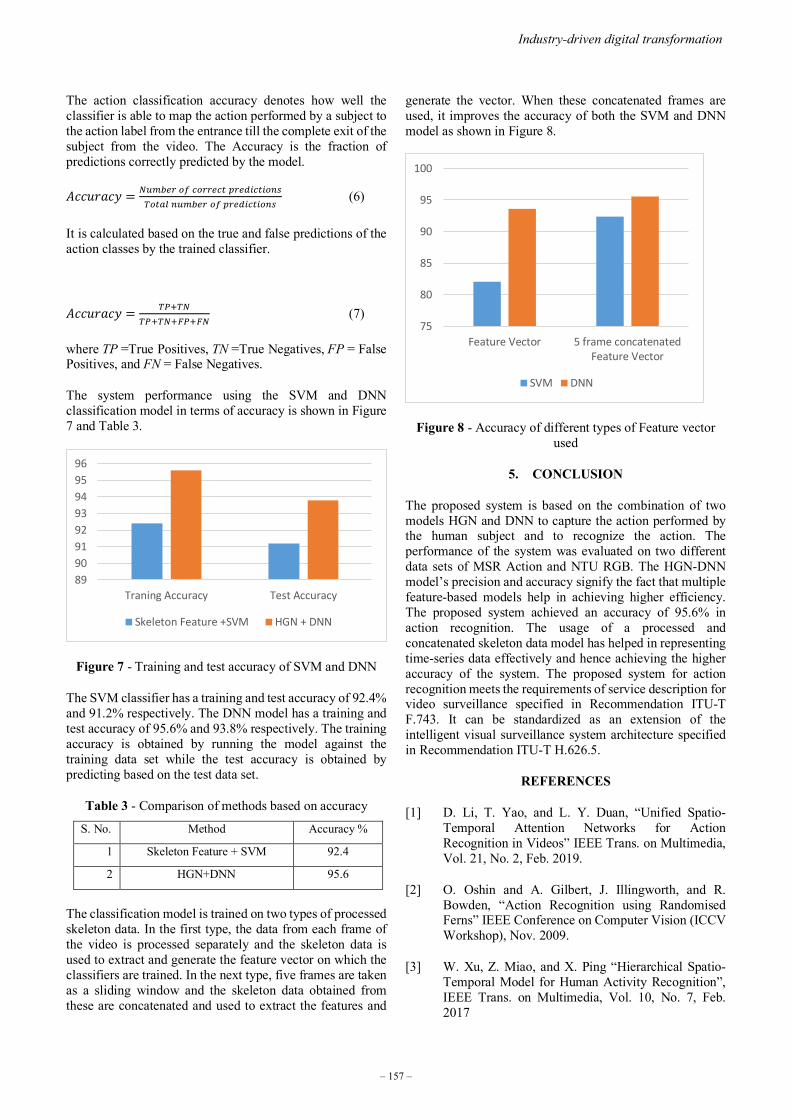
The action classification accuracy denotes how well the classifier is able to map the action performed by a subject to the action label from the entrance till the complete exit of the subject from the video. The Accuracy is the fraction of predictions correctly predicted by the model.
𝐴𝐴𝑃𝑃𝑃𝑃𝑐𝑐𝑃𝑃𝑅𝑅𝑃𝑃𝑦𝑦 = 𝐹𝐹𝑇𝑇𝑁𝑁𝑁𝑁𝑖𝑖𝑖𝑖 𝑇𝑇𝑜𝑜 𝑖𝑖𝑇𝑇𝑖𝑖𝑖𝑖𝑖𝑖𝑖𝑖𝑖𝑖 𝑖𝑖𝑖𝑖𝑖𝑖𝑝𝑝𝑖𝑖𝑖𝑖𝑖𝑖𝑖𝑖𝑇𝑇𝑖𝑖𝑇𝑇𝑇𝑇𝑇𝑇𝑖𝑖𝐹𝐹𝐹𝐹 𝑖𝑖𝑇𝑇𝑁𝑁𝑁𝑁𝑖𝑖𝑖𝑖 𝑇𝑇𝑜𝑜 𝑖𝑖𝑖𝑖𝑖𝑖𝑝𝑝𝑖𝑖𝑖𝑖𝑖𝑖𝑖𝑖𝑇𝑇𝑖𝑖𝑇𝑇
(6)
It is calculated based on the true and false predictions of the action classes by the trained classifier.
𝐴𝐴𝑃𝑃𝑃𝑃𝑐𝑐𝑃𝑃𝑅𝑅𝑃𝑃𝑦𝑦 = 𝑇𝑇𝑇𝑇+𝑇𝑇𝐹𝐹
𝑇𝑇𝑇𝑇+𝑇𝑇𝐹𝐹+𝐹𝐹𝑇𝑇+𝐹𝐹𝐹𝐹 (7)
where TP =True Positives, TN =True Negatives, FP = False Positives, and FN = False Negatives.
The system performance using the SVM and DNN classification model in terms of accuracy is shown in Figure 7 and Table 3.
Figure 7 - Training and test accuracy of SVM and DNN
The SVM classifier has a training and test accuracy of 92.4% and 91.2% respectively. The DNN model has a training and test accuracy of 95.6% and 93.8% respectively. The training accuracy is obtained by running the model against the training data set while the test accuracy is obtained by predicting based on the test data set.
Table 3 - Comparison of methods based on accuracy
S. No. Method Accuracy %
1 Skeleton Feature + SVM 92.4
2 HGN+DNN 95.6
The classification model is trained on two types of processed skeleton data. In the first type, the data from each frame of the video is processed separately and the skeleton data is used to extract and generate the feature vector on which the classifiers are trained. In the next type, five frames are taken as a sliding window and the skeleton data obtained from these are concatenated and used to extract the features and
generate the vector. When these concatenated frames are used, it improves the accuracy of both the SVM and DNN model as shown in Figure 8.
Figure 8 - Accuracy of different types of Feature vector used
5. CONCLUSION
The proposed system is based on the combination of two models HGN and DNN to capture the action performed by the human subject and to recognize the action. The performance of the system was evaluated on two different data sets of MSR Action and NTU RGB. The HGN-DNN model’s precision and accuracy signify the fact that multiple feature-based models help in achieving higher efficiency. The proposed system achieved an accuracy of 95.6% in action recognition. The usage of a processed and concatenated skeleton data model has helped in representing time-series data effectively and hence achieving the higher accuracy of the system. The proposed system for action recognition meets the requirements of service description for video surveillance specified in Recommendation ITU-T F.743. It can be standardized as an extension of the intelligent visual surveillance system architecture specified in Recommendation ITU-T H.626.5.
REFERENCES
[1] D. Li, T. Yao, and L. Y. Duan, “Unified Spatio-Temporal Attention Networks for Action Recognition in Videos” IEEE Trans. on Multimedia, Vol. 21, No. 2, Feb. 2019.
[2] O. Oshin and A. Gilbert, J. Illingworth, and R. Bowden, “Action Recognition using Randomised Ferns” IEEE Conference on Computer Vision (ICCV Workshop), Nov. 2009.
[3] W. Xu, Z. Miao, and X. Ping “Hierarchical Spatio-Temporal Model for Human Activity Recognition”, IEEE Trans. on Multimedia, Vol. 10, No. 7, Feb. 2017
8990919293949596
Traning Accuracy Test Accuracy
Skeleton Feature +SVM HGN + DNN
75
80
85
90
95
100
Feature Vector 5 frame concatenatedFeature Vector
SVM DNN
– 157 –
Industry-driven digital transformation

[4] M. Sharif et. al., “A Framework of Human Detection and Action Recognition based on Uniform Segmentation and Combination of Euclidean Distance and Joint Entropy Features Selection” EURASIP Journal on Image and Video Processing, Article number: 89, 2017.
[5] M. Ravanbaksh and H. Mousavi “Action Recognition with Image Based CNN Features” arXiv: 1512.03980, Dec. 2015.
[6] J. Cai and M. Merler “Heterogeneous Semantic Level Features Fusion for Action Recognition” 2014.
[7] Recommendation ITU-T H.626.5 - “Architecture for intelligent visual surveillance systems,” May 2019.
[8] Recommendation ITU-T F.743 - “Requirements and service description for video surveillance Recommendation,” November 2019.
[9] A. Newell, K. Yang, J. Deng, “Stacked Hourglass Networks for Human Pose Estimation”, Computer Vision – ECCV 2016, Lecture Notes in Computer Science, Vol. 9912, 2016.
[10] M. Aslan, A. Sengur, Y. Xiao, H. Wang, M. Cevdet Ince, and X. Ma, “Shape feature encoding via Fisher Vector for efficient fall detection in depth-videos,” Applied Soft Computing, Vol. 37, 2015.
[11] L. –Q. Xu and Y. Li, "Video classification using spatial-temporal features and PCA," International Conference on Multimedia and Expo. (ICME ‘03), 2003.
[12] X. Zhou and Q. Huang, and X. Sun, and X. Xue, and Y. Wei, “Towards 3D Human Pose Estimation in the Wild: A Weakly-Supervised Approach,” IEEE International Conference on Computer Vision (ICCV), Oct. 2017
[13] M. D. Bengalur, "Human activity recognition using body pose features and support vector machine," International Conference on Advances in Computing, Communications and Informatics (ICACCI), Mysore, 2013.
[14] MSR Action Data Set https://www.microsoft.com/en-us/download/details.aspx?id=52315
[15] NTU RGB+D Dataset http://rose1.ntu.edu.sg/datasets/actionrecognition.asp
[16] MPII Human Pose Dataset http://human-pose.mpi-inf.mpg.de/
– 158 –
2020 ITU Kaleidoscope Academic Conference

STCCS: SEGMENTED TIME CONTROLLED COUNT-MIN SKETCH
Ismail Khram1; Maha Shamseddine1; Wassim Itani2
1Beirut Arab University, Beirut, Lebanon 2University of Houston-Victoria, Texas, USA
ABSTRACT
IoT is a concept consisting of many components powered by different techniques and technologies. However, due to computation restrictions, encryption algorithms had to be adapted, often at the expense of lower data security levels and strength. To maintain data privacy between source and sink we present in this paper a data sketching algorithm that utilizes bandwidth by providing a summary of the data to the cloud. The input data stream goes through a hashing algorithm which produces a hexadecimal representation of the data before going through the sketching algorithm. At the algorithm the data is categorized and the corresponding hash cell value updated. Note is also taken of the arrival time of the data considered anomalous to allow the manager to take corrective action if it is deduced that the periodic appearance of the information is successive in nature.
Keywords – compact, control, count-min sketch, IoT, time
1. INTRODUCTION
IoT has found its way into almost every facet of our lives. Industrial applications, for example, where in places like manufacturing facilities sensors are placed around key areas of the production process to provide valuable insight into the production level peak times and number of defective products coming off the production line. Another important area that has gained interest is in agriculture where sensors are placed around the field to monitor plant growth, soil pH, water intake etc. The data can be used to better care for the crops and keep mineral waste to a minimum. An additional crucial use for IoT is in medical application. The devices are placed on the body referred to as wearables, or inside the body referred to as implanted devices or in the surrounding area referred to as environment monitoring. The devices provide round the clock monitoring with data analysis and feedback being done at any point in the day with the physician taking a more informed decision on treatment and tests being performed as needed. There are a lot more use cases for IoT devices but these areas stand out the most by looking at the current research and the industry as a whole.
The IoT system is comprised of a group of sensors that are application specific connected in a certain topology mostly
in a star or mesh depending on the need for redundancy and feasibility. The sensors would then send the sensed data to a controller or a master that is arranged in a hieratical structure to prevent network congestion due to multiple simultaneous connection establishment. The master node usually performs the data processing and then the data is sent to the cloud for storage and analysis. This multi-tier architecture put a lot of security risk on the system in the form of denial of services attacks, malware, data manipulation and man in the middle attacks, to name a few.
To prevent security threats and computations to a minimum researchers today are designing algorithms that are optimized for memory allocation and bandwidth utilization which make it a suitable application for IoT ecosystems. Of the methods considered data sketching is by far the most popular. Data sketching is a way of looking at a selected sample of the overall data stream in a random or pseudorandom fashion to determine patterns in the data and formulate solutions while allowing for a margin of error. Count-min sketch and the hyper log log sketch are two of the most well-known sketching algorithms used to detect anomalies in use today. Count-min sketch [1] which is used for counting event occurrences, works by passing the said event through multiple hash functions and mapping them to a table representative of each hash function. As more events get hashed the values inside the table get incremented. To find an event count list the values of all hash values corresponding to this event and choose their minimum. What is special is that even if the data size were to increase exponentially with the passage of time the sketch size remains constant. Hyper log log sketch [2] works by counting the number of unique elements in a set. This is done by defining a number of buckets, hash the event, take the prefix of the hash which identifies with one of the buckets, the number of bits that are left you count the number of leading zeros. Hyper log log only counts the maximum number of leading zeros of a given bucket and computes their average.
In this paper we introduce a variation on the traditional count-min sketch which takes into account the time variable. The added hash functions add depth to the sketch by reducing the number of collisions. Time was not considered in the reviewed literature as a way of adding more dimensionality
978-92-61-31391-3/CFP2068P @ ITU 2020 Kaleidoscope – 159 –

by gaining more information on the frequency of anomalous data arrivals which would aid in situation assessment.
The rest of the paper is organized as follows: Section 2 gives a review of the literature so far. Section 3 introduces the proposed system design. Section 4 describes the system design implementation and presents our results with a discussion. Finally, conclusions are presented in Section 5.
2. RELATED WORK
The authors in [3] propose the elastic sketch as a way of controlling the bandwidth, packet rate and packet size. For the bandwidth, rather than monitoring the flow of data packets through the network as a whole randomized data selection called sketching is performed on the data which then goes through compression to free up the link for other data. Next comes packet rate which can be impossible to quantify due to packet arrival randomness so data is measured per unit time which the authors take as one hour. To optimize memory usage the authors decided to discard packet headers from the overall analysis of packet size which falls into one of two categories: mouse data and elephant data. The data is segregated by way of a voting system to data in a predefined bucket.
The authors of [4] opted for relative entropy, used to detect gradual changes in data, and Pearson correlation which is used to detect sudden changes in incoming data. Relative entropy processes data in sliding window fashion by comparing its data at the present time to that of the previous iteration. Person correlation works by measuring data statistically as being positively, negatively correlated or having no correlation to the data stream. Data is manipulated in either stream or batch format using the anomaly detection algorithm which is then sent to a dashboard for analysis, activating an alarm in the presence of an anomaly.
Unlike the authors in [3] and [4] which considered the data stream from end devices like mobile phones or desktop personal computers [5] created an anomaly detection algorithm, robust random cut forest data structure, for data streams arriving from IoT devices such as wearable devices and wireless medical gadgets. The algorithm works by randomly selecting data to build out a tree with the anomaly being a part of it. The anomaly which the authors call a point is discovered by the distance it incurs on other data in the tree as it increases in complexity and size.
Going back to anomaly detection of data streams in traditional networks [6] proposes to use volume anomalies to build out a database for faster identification. The sketches are constructed out of data it selects in a quasi-random manner which then goes through some hash functions.
The use of sketches has become a common theme among researchers because of its ability to substantially reduce dimensionality with some margin of acceptable error. The use of randomness reduces false positives when an acceptable data set is selected from the overall data. Like [6]
the authors of [7] decided to use data sketching but propose creating data sketches from existing data sketches. The authors create sketches from the aggregate data stream which it then shuffles. Then their algorithm uses a voting mechanism to increase data truthfulness when pinpointing an anomaly and reduce mistakenly identifying the data as a threat.
The authors in [8] introduce an unsupervised anomaly detection method which can detect anomalies by making one iteration over the data which can save a lot of time and memory which make it ideal for IoT applications. The authors utilize matrix sketching to create orthogonal vectors of the data stream which can then be used to spot anomalies, by performing a reconstruction error test.
Thus far data sketching has been used to detect data that is out of place once it arrives at the destination however the authors in [9] used sketching to authenticate data at the source and sink in a software-defined networking scenario because it can scale easily with minimal cost of infrastructure and time setting up the network. The authors used sketching coupled with some probing mechanisms to correctly identify the switches responsible for the malicious activity on the network. At the destination the sketches are compared; if they are different this means that data was compromised during transmission so it is discarded.
As in [4], the authors in [10] use entropy to capture dirty data which in this case are anomalies. Instead of separating anomalies into data sets, data is mined to detect similar data occurrences in data across the whole network. Entropy, used as a method for summarization, is used to detect unusual traffic patterns across multiple traffic variables spanning different time instances.
The authors in [11] created an encryption algorithm for low power systems using data sketching which could be used for encrypting data rather than the advanced encryption standard typically used in IoT application due to its low energy consumption. The algorithm uses one time linear projection to protect against known text attacks by encrypting the data using data sketching to select random data from the stream. The stream is then reconstructed at the slave node before data sketching algorithms are applied again and passed through the one time linear projection once to prevent the constructed matrix from being discovered by performing a man in the middle attack on the network.
The authors in [12] created a framework for ubiquitous healthcare or u-health of IoT devices used in the medical setting. The traditional uhealth system architecture consists of the body area network which is in charge of monitoring the patient vitals and sending it to the intelligent medical server which is in charge of receiving the patient data and detecting patterns in the data as well as data discrepancies which it will then send to the hospital system. At the hospital system data is augmented by authorized personnel. The idea suggested by the authors is to unify all body area network devices regardless of communication protocols, whether that
– 160 –
2020 ITU Kaleidoscope Academic Conference
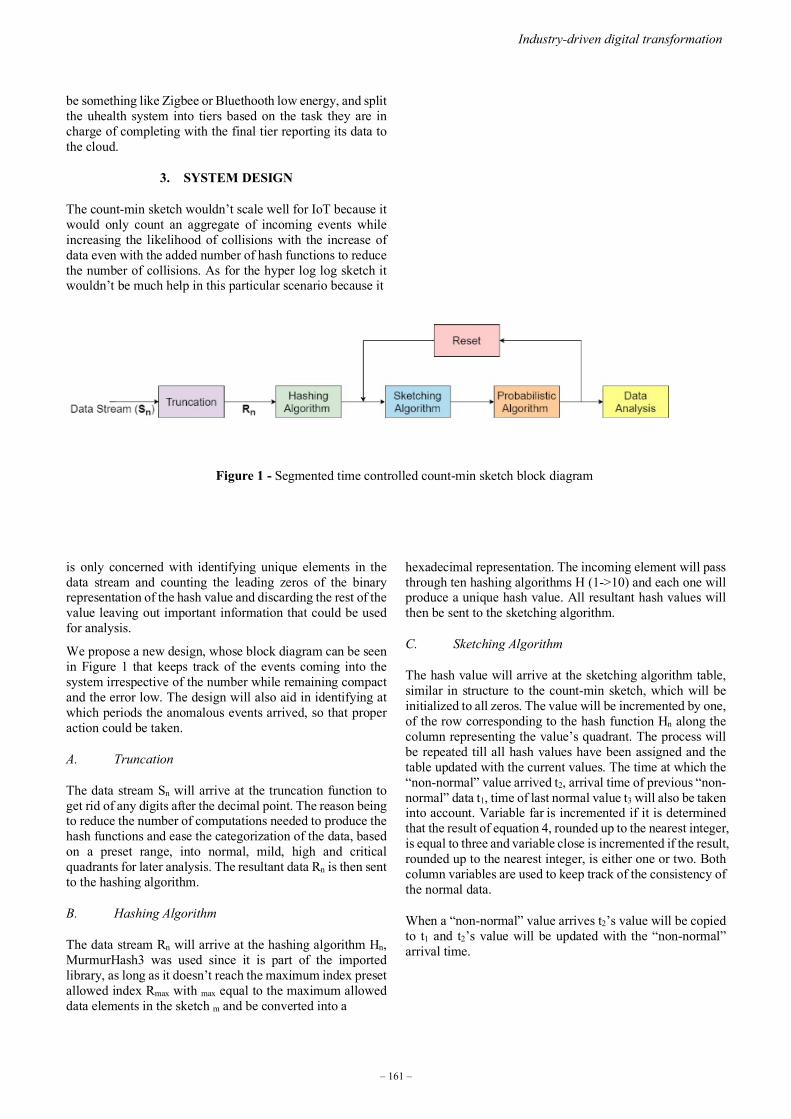
be something like Zigbee or Bluethooth low energy, and split the uhealth system into tiers based on the task they are in charge of completing with the final tier reporting its data to the cloud.
3. SYSTEM DESIGN
The count-min sketch wouldn’t scale well for IoT because it would only count an aggregate of incoming events while increasing the likelihood of collisions with the increase of data even with the added number of hash functions to reduce the number of collisions. As for the hyper log log sketch it wouldn’t be much help in this particular scenario because it
is only concerned with identifying unique elements in the data stream and counting the leading zeros of the binary representation of the hash value and discarding the rest of the value leaving out important information that could be used for analysis.
We propose a new design, whose block diagram can be seen in Figure 1 that keeps track of the events coming into the system irrespective of the number while remaining compact and the error low. The design will also aid in identifying at which periods the anomalous events arrived, so that proper action could be taken.
A. Truncation
The data stream Sn will arrive at the truncation function to get rid of any digits after the decimal point. The reason being to reduce the number of computations needed to produce the hash functions and ease the categorization of the data, based on a preset range, into normal, mild, high and critical quadrants for later analysis. The resultant data Rn is then sent to the hashing algorithm.
B. Hashing Algorithm
The data stream Rn will arrive at the hashing algorithm Hn, MurmurHash3 was used since it is part of the imported library, as long as it doesn’t reach the maximum index preset allowed index Rmax with max equal to the maximum allowed data elements in the sketch m and be converted into a
hexadecimal representation. The incoming element will pass through ten hashing algorithms H (1->10) and each one will produce a unique hash value. All resultant hash values will then be sent to the sketching algorithm.
C. Sketching Algorithm
The hash value will arrive at the sketching algorithm table, similar in structure to the count-min sketch, which will be initialized to all zeros. The value will be incremented by one, of the row corresponding to the hash function Hn along the column representing the value’s quadrant. The process will be repeated till all hash values have been assigned and the table updated with the current values. The time at which the “non-normal” value arrived t2, arrival time of previous “non-normal” data t1, time of last normal value t3 will also be taken into account. Variable far is incremented if it is determined that the result of equation 4, rounded up to the nearest integer, is equal to three and variable close is incremented if the result, rounded up to the nearest integer, is either one or two. Both column variables are used to keep track of the consistency of the normal data.
When a “non-normal” value arrives t2’s value will be copied to t1 and t2’s value will be updated with the “non-normal” arrival time.
Figure 1 - Segmented time controlled count-min sketch block diagram
– 161 –
Industry-driven digital transformation
D. Computation Algorithm
Before the value of t1 is overwritten with the value of t2, computation on the data has to be performed. Assign the value of t1 to a temporary variable ttemp1, the value of t2 to temporary variable ttemp2 and the value of t3 to temporary variable ttemp3. Compute the average tavg using (2). Whenever a new tavg is computed it is added to the last tavg and once Smax is reached tavg is divided by the number n of tavg computed to give Zcompute which is a percentage of all the “non-normal” data to the total data in the sketch, see (1).
The total of the anomalous data to the total number of all data inside the sketch can be calculated using (3) to give an indication of how much of the data is non-normal, if the computed data is greater than a preset threshold an alarm is set at.
Zcompute = (∑tavg) / n (1)
tavg = (t temp1 + t temp2) / 2 (2)
% anomalous data = (mild +high +critical) / (normal +mild + high+ critical) (3)
The values of ttemp1 and ttemp2 ttemp3 can also be used to deduce how close the “non-normal” values are to each other. Using (4) we substitute the values of ttemp1, ttemp2 to compute a temporary value for the close column and subtract one from the temporary value at the end of data insertion to calculate its true value. Using (5) we substitute the values of ttemp3, ttemp2 to compute a temporary value for the far column and divide the temporary value at the end of data insertion by three to calculate its integer value. Once Smax is reached we check using (6) if the percentage of close values is greater than a preset allowed maximum FCthreshold if it is than an alarm is raised.
(t temp2 – t temp1) -1 (4)
(t temp3 – t temp2) / 3 (5)
close / (far+ close) > FCthreshold (6)
E. Reset
The main concern of the count-min sketch is that as the data volume increases the probability of collisions increases proportionally, which could lead to misleading information. To prevent that from happening the reset function will overwrite all the table cells to zero if the data sketch reaches Rmax values or the time elapsed from the system start reaches reset timer set by the user. To understand how the algorithm works we illustrate the pseudocode in Figure 2.
AN EXAMPLE
Suppose that the maximum allowed values into the sketching function is set to 10, as in Table 1.
Each of the above data elements will pass through the truncation function to remove the decimal points before being passed on to ten hash functions to produce ten unique hash values, but for the sake of brevity let’s assume that we are working with five hash functions each producing a one digit hexadecimal representation of the data element; we use Table 2 to clarify our point. The algorithm can be extended to ten hash functions each giving a true hexadecimal value.
The data will then enter the sketching algorithm which will map each hash value to the appropriate row and the column will reflect its place in the table. Go through the data stream from S1 taking care to only increment the cell values t1,t2,t3,far,close only when they are considered “non-normal” using the rules that were mentioned earlier. If we want to map the hash values of the data element 38 that arrived at time 0.5, the first thing we should do is determine what quadrant the hash value falls under. Since it is considered a value in the mild quadrant as we stated earlier in the text we increment all cell values corresponding to the H rows that fall under the mild column. According to the first table the “non-normal” value 38 arrived at time 0.5 then t2’s value will be assigned to t1 to denote the time of the last “non-normal” value and t2’s value will be updated to 0.5 to reflect the current “non-normal” arrival time.
To decide whether to update the close or far column we are going to assign the value of t3 to ttemp3 which in this case is 0.4, the value of t2 to ttemp2 which is 0.5 and the value of t1 to ttemp1 which is 0.1 and find that ttemp2 - ttemp1 is equal to 0.4 and ttemp3 - ttemp2 equal to -0.1, so we increment the temporary close variable.
Once all the data element’s hash values have found their way into the table along with any supporting variables the table will look like Table 3.
To prevent t1 and t2 from losing their values assign t1 to ttemp1 and t2 to ttemp2.
Ttemp1 = 0.1 and ttemp2 = 0.5
Using (2) we calculate tavg to be equal to 0.2. We then add all computed averages so far together. Once Smax is
– 162 –
2020 ITU Kaleidoscope Academic Conference

Algorithm1: segmented time controlled count-min
sketch Input: Data stream (Sn) arriving in integer form
Truncation Function truncate(Sn)
Trim any digits after the decimal point and assign the integer to Rn
return Rn
Sketching function
Rn -> Hn Function sketchingalgo(hashing function , current time )
While Sn is less than Smax Increment the hash row & column related to hashing function
If hash value is non-normal Update value of t2 with value of current time
Update value of t1 with the value of t2 else Update value of t3
If hashing function is equal to “normal” then Increment row Hn column normal
If hashing function is equal to “mild”
then Increment row Hn column mild
If hashing function is equal to “high” then Increment row Hn column high
If hashing function is equal to “critical” then Increment row Hn column critical
Update column close Update column far
// end of while loop return rows H1 through H10 , column values normal, mild, high, critical,t1 and t2 ,t3 column values far and close in tabular form
Compute function
Function compute (n, t1, t2t3, Hn) Assign t1 to ttemp1 Assign t2 to ttemp2 Assign t3 to ttemp3
Calculate tavg by dividing the sum of ttemp1 to ttemp2 by two Calculate Zcompute by dividing the sum of tavg by n of computed averages
Subtract ttemp1 from ttemp2 If data insertion is finished
Subtract one from the temp value and update column close
Subtract ttemp2 from ttemp3 If data insertion is finished
Divide the temp value by three and update column far to the nearest integer
If the final value of close divided by the addition of far and close is
greater than FCthreshold Send alarm
Calculate % anomalous data by dividing the sum of mild, high, critical
values by sum of normal, mild, high, critical values If computed result greater than threshold result
Send alarm
Output: processing time used for data analysis Reset function
Function reset (Sn, time) If Sn value equal to Smax or time equal 5 minutes
Reset table
Figure 2 - Segmented time controlled count-min sketch pseudocode
Table 1 - Ten element data stream with their arrival times
M 1 2 3 4 5 6 7 8 9 10
SN 38 37 37.5
37 38 37 39 40 40 40
TIME(S)
0.1
0.2
0.3 0.4
0.5
0.6
0.7
0.8
0.9
1.0
Table 2 - Hashing algorithm results of four values across five hashing functions
H1 H2 H3 H4 H5
37 1 3 4 4 2
38 1 2 3 5 2
39 2 4 3 5 3
40 2 4 5 4 3
– 163 –
Industry-driven digital transformation

Table 3 - Resultant table of example data stream
reached the resulting Zcompute will be calculated using (1).
∑tavg = (0.1+0.52
) + (0.5+0.72
) + (0.7+0.82
) + (0.8+0.92
) + (0.9+1.02
)
∑𝑡𝑡 𝑎𝑎𝑎𝑎𝑎𝑎 = 0.3 + 0.6 + 0.75 + 0.85 +0.95
Zcompute = 3.455
= 0.69 which gives us an indication that all the “non-normal” data exists in 60% of the m which in this case is 10.
Using (3) we can calculate % anomalous data assuming an allowed threshold of 30%
= (2+1+3) / (4+2+1+3) = 0.66667 which means that 66% of the data is anomalous which is a lot greater than our set threshold so we set off an alarm to fix the system.
Assume we set FCthreshold to 10 percent then using (6) we can find the frequency of appearance of the “non-normal” data.
45
> FCthreshold
The computed value is equal to 0.8 which means that the “non-normal” data has appeared 80% more frequently than our allowed preset threshold value of 10% and as such we need to send an alarm to alert the responsible persons.
4. SYSTEM SETUP AND RESULTS
The simulation was executed on a linux virtual machine running on a 2 gigabyte RAM memory with 4 cores of an Intel i7 2.50 gigahertz processor. We used the madoka data sketching library [13] which is built using C++, has its own compiler and uses the MurmurHash3 to compute its hash values.
The table and graphs represent how the processing time increases with the influx of data arriving at the sketch. The processing time rises linearly at a rate of approximately 2 seconds for every data item; after the 2000 item mark the data starts rising exponentially to the increase of items being added to the sketch. Notice that even with the increase in data the sketch size remains unchanged.
Table 4 - Results of running different data sets
DATA SET
PROCESSING TIME(S)
TABLE SIZE(BYTES)
FILE SIZE(BYTES)
100 208 8388608 8388688
1000 2037 8388608 8388688
2000 4039 8388608 8388688
4000 9351 8388608 8388688
6000 14692 8388608 8388688
8000 17913 8388608 8388688
10000 24407 8388608 8388688
15000 35171 8388608 8388688
Figure 3 - Variation of processing time with the increase in set size
Discussion
At the start of the sketch all the elements are initialized to zero to indicate that the sketch is empty. As data starts coming in and the appropriate sketch elements are incremented, computations are made to determine whether
NORMAL MILD HIGH CRITICAL T1 T2 T3 CLOSE FAR
H1 4 2 1 3 0.9 1.0 0.6 4 1
H2 4 2 1 3
H3 4 2 1 3
H4 4 2 1 3
H5 4 2 1 3
– 164 –
2020 ITU Kaleidoscope Academic Conference

an element is near or far based on arrival time using equations 4 and 5 along with setting the hash depth to 10 contribute to the two second computation time per data item. However, after the data starts scaling beyond 2000 data items we see a considerable increase in processing time which means that the sketch is starting to get saturated. We see a real issue as the data escalates to between the 10000-15000 items marking a real breakdown in processing time. As such to keep the sketch efficient and lightweight we recommend using a sketch size of no more than 4000 data items depending on usage scenario before clearing the sketch for two reasons a) reduce wait time before having to do a system checkup; b) some situations are time sensitive requiring immediate attention. We mentioned earlier that we incorporated a timer into the design to check the data more frequently and this way the user doesn’t have to wait for the sketch to reach a preassigned byte size to check the data.
We believe that the solution can be versatile in situations where some time delay is acceptable like hospital floor recovery rooms or social network fraudulent account checking with the data size being modified depending on preference.
5. CONCLUSION
Our segmented time controlled count-min sketch provides a new way of looking at the incoming data. The segmented time controlled count-min sketch reduces collisions by providing more hash functions and the choice to clear the sketch after either a maximum elapsed time or data item count is reached. Traditionally, the count-min sketch looks at the minimum values produced by the hash functions for a particular value which could produce misleading results especially if the sketch is saturated so we decided to section the values into categories based on a predetermined range. We also introduced the time element into the sketch as a way of determining the frequency of the anomalous data. We also proved the compactness of the sketch design by showing its consistency with the data increase.
REFERENCES [1] Cormode, G., & Muthukrishnan, M. (2011).
Approximating data with the count-min sketch. IEEE software, 29(1), 64-69.
[2] P. Flajolet, Éric Fusy, O. Gandouet, and F. Meunier.Hyperloglog: The analysis of a near-optimal cardinality estimation algorithm. In Analysis of Algorithms (AOFA), pages 127–146, 2007.
[3] Yang, T., Jiang, J., Liu, P., Huang, Q., Gong, J., Zhou, Y., ... & Uhlig, S. (2018, August). Elastic sketch: Adaptive and fast network-wide measurements. In Proceedings of the 2018 Conference of the ACM Special Interest Group on Data Communication (pp. 561-575). ACM.
[4] Rettig, L., Khayati, M., Cudré-Mauroux, P., & Piórkowski, M. (2019). Online anomaly detection over big data streams. In Applied Data Science (pp. 289-312). Springer, Cham.
[5] Guha, S., Mishra, N., Roy, G., & Schrijvers, O. (2016, June). Robust random cut forest based anomaly detection on streams. In International conference on machine learning (pp. 2712-2721).
[6] Dewaele, G., Borgnat, P., Abry, P., Aussibal, J., Gallon, L., Owezarski, P., & Veitch, D. Statistical Sketch based Anomaly Detection and Validation using an Anomaly Database.
[7] Li, X., Bian, F., Crovella, M., Diot, C., Govindan, R., Iannaccone, G., & Lakhina, A. (2006, October). Detection and identification of network anomalies using sketch subspaces. In Proceedings of the 6th ACM SIGCOMM conference on Internet measurement (pp. 147-152). ACM.
[8] Huang, H., & Kasiviswanathan, S. P. (2015). Streaming anomaly detection using randomized matrix sketching. Proceedings of the VLDB Endowment, 9(3), 192-203.
[9] Shamseddine, M., Itani, W., Chehab, A., & Kayssi, A. (2018). Network Programming and Probabilistic Sketching for Securing the Data Plane. Security and Communication Networks, 2018.
[10] Lakhina, A., Crovella, M., & Diot, C. (2005, August). Mining anomalies using traffic feature distributions. In ACM SIGCOMM computer communication review (Vol. 35, No. 4, pp. 217-228). ACM.
[11] Kulkarni, A., Shea, C., Homayoun, H., & Mohsenin, T. (2017, March). Less: Big data sketching and encryption on low power platform. In Design, Automation & Test in Europe Conference & Exhibition (DATE), 2017 (pp. 1631-1634). IEEE.
[12] Gelogo, Y. E., Hwang, H. J., & Kim, H. K. (2015). Internet of things (IoT) framework for u-healthcare system. International Journal of Smart Home, 9(11), 323-330.
[13] https://www.s-yata.jp/madoka/
– 165 –
Industry-driven digital transformation


ABSTRACTS


Session 1: The path towards digital transformation1
S1.1 Toward a typology of "going digital"
Cheng Gong and Vincent Ribiere, Bangkok University, Thailand
With the development of digital technologies, the lines defining traditional industries are
blurring. However, there is still a lack of a standard or shared common understanding of digital
transformation in terms of its nature and content, change process, underlying mechanisms, and
desired outcomes as they are still under-specified. To build a common ground for choosing and
using appropriate approaches to manage the "going digital" journey, this paper attempts to
illustrate how digital transformation occurs with a proposed typology from a change management
perspective based on the cross-case analysis of 103 organizational case studies, and to clarify the
essential attributes of an (organizational) digital transformation and how they can be classified
into four different types: digitalization, digital mutation, digital metamorphosis, and digital
transformation.
S1.2 Analysis on the social and economic impacts of Internet platforms
Anqi Zheng, China Academy of Information and Communications Technology (CAICT), China
In recent years, the global economy has been going through a critical period of economic growth
driver transformation, with further economic slowdown. At the same time, the outbreak of
COVID-19 has brought a severe blow to the world’s economy. Against these backdrops, the
digital economy has presented extraordinary resilience of development, bringing unprecedented
opportunities to various industries and injecting new momentum to social and economic
development. How large is the impact of the Internet platform economy on economic and social
development? Will it increase the overall employment or influence the employment structure?
Has the Internet platform truly stabilized the economy and society during the outbreak? Through
case studies on the survey data from WeChat during 2019-2020, this paper employs
questionnaire-based statistical approach and the expenditure approach applied in measuring
national economic accounting to unveil the impacts of Internet platforms on economic and social
development, hoping to provide reference to future studies in the field.
S1.3 5G Healthcare applications in Covid-19 prevention and control
Haiying Ren, China Academy of Information and Communications Technology (CAICT), China;
Jianfeng Shen, National Health Commission of the PRC, China; Xiaoyong Tang, China Mobile
(Chengdu) Industrial Research Institute, China; Tianyi Feng, China Academy of Information
and Communications Technology (CAICT), China
This paper mainly focuses on the application of 5G mobile communication systems in COVID-
19 prevention and control. Firstly, for the different stages of epidemic prevention and control,
we give a detailed introduction for the application cases. Secondly, the application of the
epidemic is summarized, and the results obtained by each application are analyzed. Then, the
problems and challenge faced by 5G healthcare applications during the epidemic are analyzed.
In response to these problems and challenges, we put forward suggestions for the next step. The
summary, analysis and work suggestions made in this article, provide an experience for the world
to fight against the COVID-19 epidemic. In addition, the research in this paper helps to promote
the construction of 5G medical and health standards systems, and provides a reference for the
integrated development of 5G networks and medical health.
1 Papers marked with an “*” were nominated for the three best paper awards.
– 169 –

Session 2: Design principles, architecture and protocols for the digital transformation
S2.1 Lightweight and instant access technologies and protocols to boost digital transformations Yihua Ma, Zhifeng Yuan, Weimin Li and Zhigang Li, ZTE Corporation and State Key Laboratory of Mobile Network and Mobile Multimedia, China
The further integration of telecommunications and industry has been considerable and is expected to bring significant benefits to society and economics. It also leads to some evolution trends for next-generation communication systems, including further rises in machine-type communications (MTC), uplink-dominated systems, and decentralized structures. However, the existing access protocols are not friendly to these trends. This paper analyzes the problems of existing access protocols and provides novel access technologies to solve them. These technologies include contention-based NOMA, data features, enhanced pilot design and successive interference cancellation (SIC) of diversity. With these key enablers, lightweight and instant access can be realized, and some potential modifications of protocols are analyzed. Finally, this paper uses massive and critical scenarios in digital transformations to show the great necessity of introducing novel access technologies into future communication protocols.
S2.2 Automation of computational resource control of cyber-physical systems with machine learning*
Ved P. Kafle and Abu Hena Al Muktadir, National Institute of Information and Communications Technology (NICT), Japan
Cyber-physical systems require the quality of service (QoS) guaranteed performance of service functions and processes executed in cyberspace. Because of low-latency requirements, most of such functions must be executed in edge computing infrastructure, where computational resources are limited. For efficient management of limited available resources in edge cloud to meet very low-latency requirements of services, this paper proposes a dynamic resource control scheme to adjust computational resources allocated to virtual network functions (VNFs). The scheme employs machine learning (ML) techniques composed of multiple regression models, which are continuously retrained online by using performance data collected from the running system. We demonstrate its effectiveness through experimental evaluation results obtained from an implementation of an IoT-directory service function in a resource virtualization platform provided by Docker containers in cyberspace. The IoT-directory service, whose architecture is based on Recommendation ITU-T Y.3074, is a scalable system that can store a huge amount of control information of a billion IoT devices in the form of name records and provides a very fast lookup service with the latency of a few milliseconds. The proposed scheme is related to ML-based network control and management methods currently being standardized in the ITU-T Study Group 13.
– 170 –

Session 3: Wireless infrastructure and digital transformation
S3.1 Digital transformation via 5G: Deployment plans* Abolfazl Zakeri, Narges Gholipoor, Mohsen Tajallifar and Sina Ebrahimi, Tarbiat Modares University, Iran; Mohammad Reza Javan, Shahrood University of Technology, Iran; Nader Mokari and Ahmad R. Sharafat, Tarbiat Modares University, Iran
Digital transformation is indispensable for achieving sustainable development, and deployment of fifth-generation wireless networks (5G) is instrumental for making digital transformation a reality. There are a number of challenges and technical choices that influence 5G deployment with impacts on efficiency, interoperability, and associated costs. These are of significant importance as there is no roadmap that would be universally applicable to all network operators for deploying 5G and beyond. In this paper, we contextualize various technical options for 5G deployment and discuss their impacts. Specifically, we focus on the timely utilization of various standards pertaining to radio access network (RAN), transport network (TN), and core network (CN) with a view to enhancing interoperability with existing networks/facilities. We also discuss how 5G standards are evolving.
S3.2 Flexible multiplexing mechanism for coexistence of URLLC and eMBB services in 5G networks*
Kai Xiao and Xing Liu, ZTE Corporation and State Key Laboratory of Mobile Network and Mobile Multimedia, China; Xianghui Han, Peng Hao, Junfeng Zhang, Dong Zhou and Xingguang Wei, ZTE Corporation, China
5G mobile networks are envisioned to support both evolved mobile broadband (eMBB) and ultra-reliable and low latency communications (URLLC), which may coexist and interfere with each other in the same service cell in many scenarios. In this paper, we propose a dynamic 2-dimension bitmap resource indication to cancel eMBB services with a finer uplink cancellation granularity and a lower probability of false cancellation. Meanwhile, a resource indication based power control method is introduced to dynamically indicate different power control parameters to the user equipment (UE) based on different time-frequency resource groups and the proportion of overlapping resources, by which the reliability of URLLC transmission is guaranteed while the impact on performance of the eMBB service is minimized. Furthermore, a dynamic selection mechanism is proposed to accommodate the varying cases in different scenarios. Extensive system level simulations are conducted and the simulation results show that about 10.54% more URLLC UEs satisfy the requirements, and the user perceived throughput of eMBB UEs is increased by 23.26%.
S3.3 Wireless technology and protocol for IIoT and digital twins
Jie Tan, Xiubin Sha, Bo Dai and Ting Lu, ZTE Corporation and State Key Laboratory of Mobile Network and Mobile Multimedia Technology, China
The industrial Internet of things (IIoT) is an important engine for manufacturing enterprises to provide intelligent products and services. The data analysis model represented by digital twins is the core of IIoT development in the manufacturing industry. With the development of IIoT, more and more attention has been paid to the application of ultra-reliable and low latency communications (URLLC) in the field of IIoT. This paper mainly introduces the development of 3GPP for URLLC in reducing delay and enhancing reliability, as well as the research on little jitter and high transmission efficiency, and further analyzes the enhanced key technologies required in the IIoT. Finally, the application of IIoT in digital twins is analyzed according to the actual situation.
– 171 –

Session 4: Digital transformation in daily life
S4.1 A technique for extracting the intention of messengers in social media Mohamed Fazil Mohamed Firdhous and Balakrishnan Nalin Prashanth, University of Moratuwa, Sri Lanka
Today social media has become an integral part of human life. Though there are many advantages social media has some shortcomings, especially when it comes to young users. Parents generally do not want their young children to have social media accounts. Even if some parents allow their young children to have their own accounts, they want them to use it under their active supervision. This is mainly due to the reason that parents fear that children may be exposed to inappropriate content, or may become victims of abuse by cyber-criminals. In this paper, the authors propose a technique that can extract the intention of users of online chatting by converting the non-text information along with misspelled and abbreviated text into meaningful text and analyzing it to understand the true motive of the messenger. The tests conducted on the technique show that it performs better than a cosine similarity test within the domain of online chatting. The other main advantage of this technique is that it can be integrated with any social media platform with relative ease making it secure even for young children.
S4.2 Towards a digital process platform for future construction sites Hans Aoyang Zhou, Aymen Gannouni, Thomas Otte, Jonas Odenthal, Anas Abdelrazeq and Frank Hees, RWTH Aachen University, Germany
When it comes to digitalization, construction sites are still at the beginning of an ongoing transformation process. Two major causes are the complexity of construction site environments and the lack of interoperability between the different actors, such as machines and site suppliers that are involved in the construction project. This has direct implications on the efficiency, quality, and production time of construction projects. Thus, there is a strong need to fill this digitalization gap by considering the latest advancements in the Internet of Things (IoT), as well as edge and cloud computing. In this paper, we suggest a data-driven approach for construction sites, in which we extract data from machines, send it to a central data storage with scalable computational resources and analyze it to improve the existing construction processes. For that, we studied requirements of selected construction site processes and designed a communication architecture that scales with the complex characteristics of real-world applications. Additionally, we propose a digital process platform that supports a wide range of users with their different roles on construction sites and builds the foundation for further research, implementation, and evaluation of according construction site innovations. With the proposed platform framework, we extend the construction site towards an integrated Cyber-Physical System (CPS) and contribute to the standardization of communication infrastructures within the construction sector by merging different solutions from the area of information and communication technologies.
– 172 –
Session 5: Augmented reality and tourism
S5.1 An immersive mobile application for improved learning and virtual tour experience: A nature reserve perspective Carmenita Oersen, Ruchen Wyngaard and Lebogang Nkabinde, University of the Western Cape, South Africa
The purpose of this study was to develop an immersive virtual reality application for the University of Western Cape’s nature reserve in South Africa. For this focus on a nature reserve project, the project team was requested to build a self-guided tour capable of achieving knowledge transfer, and which has aesthetic pleasure. The study was informed by the peculiar challenge of the nature reserve and existing literature to identify gaps that may occur in the body of knowledge. The scrum project methodology was used to manage the life cycle of the project. The application was successfully built within the given time frame and the client’s feedback was overwhelmingly positive.
S5.2 Self-guided virtual tour using augmented reality Aphile Kondlo, Andre Henney, Antoine Bagula, Olasupo Ajayi and Laurenda Van Breda, University of the Western Cape, South Africa
The Cape Flats Nature Reserve, situated in the Western Cape, South Africa provides refuge to over 200 plant species, many endemic to the Western Cape. As part of the reserve's recreational activities, scheduled guided tours are offered to the public. The tours focus on the ecological importance and educational aspect of the reserve. A complete tour usually takes more than an hour. Due to the lack of trained tour guides and its strenuous nature, tours are only offered once daily. This has been identified as a challenge by the management of the nature reserve. In this paper a solution to the challenge using an augmented reality mobile application is proposed. The application allows visitors to experience the nature reserve in their own time without a guide. Augmented reality markers are placed at points of interest around the reserve. These in conjunction with the mobile application provide information about plants thereby mimicking actual tour guides. Outlines for the design and development of this self-guided tour application and the results of user acceptance and unit tests are provided in this paper.
– 173 –
Session 6: Immersive technologies in farming
S6.1 Immersive technologies for development: An analysis of agriculture Omowunmi Isafiade and Ofentse Mabiletsa, University of the Western Cape, South Africa
Agricultural development is key to any economic development. Immersive technology plays a catalytic role and offers smart and sustainable choices to farmers who want to improve on agricultural productivity, and to agricultural training institutes that seek to use modern technology to advance pedagogy and reduce fatalities and operating costs in the learning space, among others. Currently, there are limited descriptive literature reviews in the area of immersive technology in agriculture, hereafter referred to as AVR-Agric. This paper presents a systematic literature review (SLR), which offers a structured, methodical, and rigorous approach to the understanding of the trend of research in AVR-Agric, and the least and most researched issues. This study explores and examines the current trends in the immersive technology-based agriculture areas, and provides a credible intellectual guide for future research direction. The SLR was limited to existing applications and peer-reviewed conference and journal articles published from 2006 to 2020. The results showed that virtual reality was implemented in 41% of the papers reviewed, augmented reality was found in 53%, while only 6% considered mixed-reality applications. The study also showed that developments that incorporate IoT, blockchain, and machine-learning technologies are still at their stage of exploration and advancement.
S6.2 Immersive interactive technology: A case study of a wine farm Ofentse Mabiletsa, Omowunmi Isafiade, Sarel J. Viljoen, Jason Farrell and Lwando Ngqwemla, University of the Western Cape, South Africa
Immersive technologies have paved a unique way of performing agricultural activities as well as learning and interacting with 3D content, among others. Moreover, the current situation from the COVID-19 pandemic has further created the need to develop solutions that can help the agriculture industry to stay relevant and ahead of potential post-COVID-19 challenges. This paper presents an immersive virtual reality application using a wine farm as a case study. The developed farm marketing application used participatory design and SCRUM methodology to showcase a wine farm and the wine production process. The application provides a virtual walk-through of the vineyards (lookout point), the lodge, the community garden, the conference facilities, as well as the cellar in 3D 360-degree rendering. Current basic 360-degree exploration applications exist but none have incorporated 3D 360-degree exploration as presented in the current research. The immersive experience provides a more realistic experience and feel of what is available on the farm. Results and feedback confirm that the farm marketing application shows promise in promoting wine farm marketing and other farm offerings.
– 174 –

Session 7: AI, machine learning and digital transformation
S7.1 AI-based W-band suspicious object detection system for moving persons using GAN: Solutions,
performance evaluation and standardization activities*
Yutaka Katsuyama, Keping Yu, San Hlaing Myint, Toshio Sato, Zheng Wen and Xin Qi, Waseda
University, Japan
With the intensification of conflicts in different regions, the W-band suspicious object detection
system is an essential security means to prevent terrorist attacks and is widely used in many crucial
places such as airports. Because artificial intelligence can performhighly reliable and accurate
services in the field of image recognition, it is used in suspicious object detection systems to
increase the recognition rate for suspicious objects. However, it is challenging to establish a
complete suspicious object database, and obtaining sufficient millimeter-wave images of
suspicious objects from experiments for AI training is not realistic. To address this issue, this paper
verifies the feasibility to generate a large number of millimeter-wave images for AI training by
generative adversarial networks. Moreover, we also evaluate the factors that affect the AI
recognition rate when the original images used for CNN training are insufficient and how to
increase the service quality of AI-based W-band suspicious object detection systems for moving
persons. In parallel, all the international standardization organizations have been collectively
advancing the novel technologies of AI. We update the reader with information about AI research
and standardization related activities in this paper.
S7.2 An AI-based optimization of handover strategy in non-terrestrial networks*
Chenchen Zhang, Nan Zhang, Wei Cao, Kaibo Tian and Zhen Yang, ZTE Corporation and State
Key Laboratory of Mobile Network and Mobile Multimedia Technology, China
A complicated radio resource management, e.g., handover condition, will be suffered by the user
in non-terrestrial networks due to the impact of high mobility and hierarchical layouts which co-
exist with terrestrial networks or various platforms at different altitudes. It is necessary to optimize
the handover strategy to reduce the signaling overhead and improve the service continuity. In this
paper, a new handover strategy is proposed based on the convolutional neural network. Firstly, the
handover process is modeled as a directed graph. Suppose a user knows its future signal strength,
then it can search for the best handover strategy based on the graph. Secondly, a convolutional
neural network is used to extract the underlying regularity of the best handover strategies of
different users, based on which any user can make near-optimal handover decision according to
its historical signal strength. Numerical simulation shows that the proposed handover strategy can
efficiently reduce the handover number while ensuring the signal strength.
S7.3 BSR: A balanced framework for single image super resolution
Dehui Kong, State Key Laboratory of Mobile Network and Mobile Multimedia Technology and
ZTE Microelectronics Research Institute, China; Fang Zhu, ZTE Corporation, China; Yang Wei,
Song Jianjun, Zhu Tongtong and Bengang Lou, Sanechips, China; Ke Xu, State Key Laboratory
of Mobile Network and Mobile Multimedia Technology and ZTE Microelectronics Research
Institute, China
A complicated radio resource management, e.g., handover condition, will be suffered by the user
in non-terrestrial networks due to the impact of high mobility and hierarchical layouts which co-
exist with terrestrial networks or various platforms at different altitudes. It is necessary to optimize
the handover strategy to reduce the signaling overhead and improve the service continuity. In this
paper, a new handover strategy is proposed based on the convolutional neural network. Firstly, the
handover process is modeled as a directed graph. Suppose a user knows its future signal strength,
then it can search for the best handover strategy based on the graph. Secondly, a convolutional
neural network is used to extract the underlying regularity of the best handover strategies of
different users, based on which any user can make near-optimal handover decision according to
its historical signal strength. Numerical simulation shows that the proposed handover strategy can
efficiently reduce the handover number while ensuring the signal strength.
– 175 –

Session 8: Security in industrial applications
S8.1 PERT: Payload encoding representation from transformer for encrypted traffic classification Hong Ye He, Zhi Guo Yang and Xiang Ning Chen, ZTE Corporation, China
Traffic identification becomes more important yet more challenging as related encryption techniques are rapidly developing nowadays. In difference to recent deep learning methods that apply image processing to solve such encrypted traffic problems, in this paper, we propose a method named Payload Encoding Representation from Transformer (PERT) to perform automatic traffic feature extraction using a state-of-the-art dynamic word embedding technique. Based on this, we further provide a traffic classification framework in which unlabeled traffic is utilized to pre-train an encoding network that learns the contextual distribution of traffic payload bytes. Then, the downward classification reuses the pre-trained network to obtain an enhanced classification result. By implementing experiments on a public encrypted traffic data set and our captured Android HTTPS traffic, we prove the proposed method can achieve an obvious better effectiveness than other compared baselines. To the best of our knowledge, this is the first time the encrypted traffic classification with the dynamic word embedding alone with its pre-training strategy has been addressed.
S8.2 Visual action recognition using deep learning in video surveillance systems Dhananjay Kumar, Priyanka T and Aishwarya Murugesh, Anna University, India; Ved P. Kafle, National Institute of Information and Communications Technology (NICT), Japan
The skeleton tracking technique allows the usage of the skeleton information of human-like objects for action recognition. The major challenge in action recognition in a video surveillance system is the large variability across and within subjects. In this paper, we propose a deep-learning-based novel framework to recognize human actions using skeleton estimation. The main component of the framework consists of pose estimation using a stacked hourglass network (HGN). The pose estimation module provides the skeleton joint points of humans. Since the position of skeleton varies according to the point of view, we apply transformations on the skeleton points to make it invariable to rotation and position. The skeleton joint positions are identified using HGN-based deep neural networks (HGN-DNN), and the feature extraction and classification is carried out to obtain the action class. The skeleton action sequence is encoded using Fisher Vector before classification. The proposed system complies with Recommendation ITU-T H.626.5 "Architecture for intelligent visual surveillance systems", and has been evaluated over benchmarked human action recognition data sets. The evaluation results show that the system performance achieves a precision of 85% and the accuracy of 95.6% in recognizing actions like wave, punch, kick, etc. The HGN-DNN model meets the requirements and service description specified in Recommendation ITU-T F.743.
S8.3 STCCS: Segmented time controlled count-min sketch Ismail Khram and Maha Shamseddine, Beirut Arab University, Lebanon; Wassim Itani, University of Houston-Victoria, Texas, USA
IoT is a concept consisting of many components powered by different techniques and technologies. However, due to computation restrictions, encryption algorithms had to be adapted, often at the expense of lower data security levels and strength. To maintain data privacy between source and sink we present in this paper a data sketching algorithm that utilizes bandwidth by providing a summary of the data to the cloud. The input data stream goes through a hashing algorithm which produces a hexadecimal representation of the data before going through the sketching algorithm. At the algorithm the data is categorized and the corresponding hash cell value updated. Note is also taken of the arrival time of the data considered anomalous to allow the manager to take corrective action if it is deduced that the periodic appearance of the information is successive in nature.
– 176 –

INDEX OF AUTHORS


Index of Authors
Abdelrazeq, Anas. ........................................... 73
Ajayi, Olasupo................................................... 91
Al Muktadir, Abu Hena ..................................... 27
Antonino, Pablo Oliveira ................................ xxiii
Bagula, Antoine ............................................... 91
Bärring, Maja ................................................... xlv
Cao, Wei ....................................................... 125
Chen, Xiang Ning ............................................ 143
Dai, Bo ............................................................ 55
Drobot, Adam T. ............................................ xxxi
Ebrahimi, Sina ................................................. 37
Farrell, Jason ................................................. 107
Feng, Tianyi ...................................................... 15
Gannouni, Aymen ........................................... 73
Gholipoor, Narges ............................................. 37
Gong, Cheng ....................................................... 1
Han, Xianghui ................................................. 45
Hao, Peng .......................................................... 45
He, Hong Ye ................................................... 143
Hees, Frank ....................................................... 73
Helu, Moneer.................................................... xlv
Henney, Andre .................................................. 91
Isafiade, Omowunmi ................................ 99, 107
Itani, Wassim................................................... 159
Jianjun, Song .................................................. 131
Johansson, Björn ............................................... xlv
Kafle, Ved P. ........................................... 27, 151
Katsuyama, Yutaka .......................................... 117
Khram, Ismail .................................................. 159
Kondlo, Aphile .................................................. 91
Kong, Dehui..................................................... 131
Kuhn, Thomas ................................................xxiii
Kumar, Dhananjay ........................................... 151
Li, Weimin ....................................................... 21
Li, Zhigang ........................................................ 21
Liu, Xing............................................................ 45
Lou, Bengang................................................... 131
Lu, Ting ............................................................. 55
Ma, Yihua ....................................................... 21
Mabiletsa, Ofentse ..................................... 99, 107
Mohamed Firdhous, Mohamed Fazil ................. 65
Mokari, Nader .................................................... 37
Murugesh, Aishwarya ...................................... 151
Myint, San Hlaing ............................................ 117
Nakao, Akihiro ................................................ xix
Ngqwemla, Lwando ......................................... 107
Nkabinde, Lebogang .......................................... 83
Odenthal, Jonas................................................ 73
Oersen, Carmenita ............................................. 83
Otte, Thomas ..................................................... 73
Prashanth, Balakrishnan Nalin ......................... 65
Qi, Xin ........................................................... 117
– 179 –

Ren, Haiying ................................................... 15
Reza Javan, Mohammad .................................... 37
Ribiere, Vincent .................................................. 1
Saracco, Roberto .............................................. xv
Sato, Toshio .................................................... 117
Schnicke, Frank .............................................. xxiii
Sha, Xiubin........................................................ 55
Shamseddine, Maha ........................................ 159
Shao, Guodong ................................................. xlv
Sharafat, Ahmad R. .......................................... 37
Shen, Jianfeng ................................................... 15
T, Priyanka .................................................... 151
Tajallifar, Mohsen ............................................. 37
Tan, Jie .............................................................. 55
Tang, Xiaoyong ................................................. 15
Tian, Kaibo...................................................... 125
Tongtong, Zhu ................................................. 131
Van Breda, Laurenda ....................................... 91
Viljoen, Sarel J. ............................................... 107
Wei, Xingguang .............................................. 45
Wei, Yang ........................................................ 131
Wen, Zheng ..................................................... 117
Wyngaard, Ruchen ............................................ 83
Xiao, Kai .......................................................... 45
Xu, Ke ............................................................. 131
Yang, Zhen .................................................... 125
Yang, Zhi Guo ................................................. 143
Yu, Keping ...................................................... 117
Yuan, Zhifeng .................................................... 21
Zakeri, Abolfazl ............................................... 37
Zhang, Chenchen ............................................. 125
Zhang, Junfeng .................................................. 45
Zhang, Nan ...................................................... 125
Zheng, Anqi ......................................................... 9
Zhou, Dong ........................................................ 45
Zhou, Hans Aoyang ........................................... 73
Zhu, Fang ......................................................... 131
– 180 –


International Telecommunication
UnionPlace des Nations
CH-1211 Geneva 20Switzerland
Published in SwitzerlandGeneva, 2020
ISBN: 978-92-61-31391-3
9 7 8 9 2 6 1 3 1 3 9 1 3


![New MPEG.ppt [Read-Only] - ITU](https://static.fdokumen.com/doc/165x107/631cc1f476d2a4450503afa7/new-mpegppt-read-only-itu.jpg)

