Conference Proceedings - Durgadevi Saraf Institute of ...
197
i Conference Proceedings
-
Upload
khangminh22 -
Category
Documents
-
view
4 -
download
0
Transcript of Conference Proceedings - Durgadevi Saraf Institute of ...

i
Conference Proceedings
ii
DONOR’S MESSAGE
Shri Vishwaprakash Harlalka
Donor, Remsons Centre for Management Research,
(In Memory of Radhadevi Harlalka)
Durgadevi Saraf Institute of Management Studies
Research is an integral part of a management institution for its growth and
development. I am happy to know that Durgadevi Saraf Institute of
Management Studies is playing an active role in the area of research under the
Remsons Centre for Management Research. The institute is organizing an
International Conference on the theme ‘The Rise of Asia - Opportunities and
Challenges’ to be held on 14th March, 2014. The conference will be inaugurated
by Dr. Liu Youfa (Consul General of People’s Republic of China) who will also
deliver the key note address. Many research papers will also be presented in
the conference.
I compliment Dr. Sharad Kumar, Officiating Director and Head, Remsons Centre
for Management Research and all his team for organizing the conference and
wish the conference a grand success.
iii
chairman’S MESSAGE
Mr. Ashok M. Saraf
Chairman, Governing Board,
Durgadevi Saraf Institute of Management Studies
I have great pleasure to know that Durgadevi Saraf Institute of Management
Studies is hosting an International Conference on the theme “The Rise of Asia
- Opportunities and Challenges” to be held on 14th March, 2014 at the
institute’s premises under Remsons Centre for Management Research.
It is a matter of great pride that the conference will be inaugurated by Dr.
Liu Youfa (Consul General of People’s Republic of China) who will also deliver
the key note address. The conference will be attended by a large number of
academicians, professionals, research scholars, policy makers and students.
Many research papers will also be presented in the Conference.
I take this opportunity to compliment Dr. Sharad Kumar, Officiating Director
and Head, Remsons Centre of Management Research and all staff for this
unique endeavour to host a conference on one of the most critical issues for
Asian economic growth in times of uncertainity. I wish a grand success to the
conference.
iv
WELCOME ADDRESS
Good Morning Ladies and Gentlemen !
It is my great pleasure to welcome you all to our first International Conference today.
My special welcome to Dr. Liu Youfa, the Consul General of China, who has kindly
agreed to inaugurate the Conference as well as to be the Chief Guest. Keeping in
view the theme of the conference, ie. Rise of Asia: Challenges and Opportunities,
there cannot be any one else other than Dr Youfa whom we expect to share with us
the success story of China which has driven the Asian growth to a higher trajectory
at the time of western economic crises.
I also welcome our distinguished Researchers from Academia and Industry who are
here to present their papers in this conference. I also welcome the invitees from other
Business Schools and corporates who had shown their interest in participating in our
conference. I also welcome our trust members and invitees from our sister
institutions who have come to attend the inaugural session. I also welcome my
faculty colleagues and our Students in this conference.
Before elaborating the theme of the conference, I may like to give a brief about our
Institute. Our institute is quite new, just completing four years of its existence. It
offers Mumbai University MMS Programme in four streams and Part-time Post
Graduate programmes in Finance, Marketing and HR. We also conduct a flagship
programme of PGDM approved by AICTE and also a number of short duration and
specialized programmes catering to the needs of various segments. This institute has
recently been adjudged as the fastest growing private educational institute 2012-13 in
the “Business School Category” by Process Advisors and Evaluators – KPMG in
India. The Institute has also recently obtained ISO Certification.
This conference is being organized under the aegis of Remsons Centre for
Management Research. The Remsons Centre for Management Research is an
advanced centre of excellence focusing on developing contemporary and usable
research in various areas of Management. This Centre is set up to reiterate DSIMS’s
commitment to bring academic relevance to industry practices with the help of the
magnanimous donation from Remsons Group of Companies. It is set up by Shri
Vishvaprakashji Harlalka in the memory of his mother Smt. Radhadevi Harlalka.
v
Coming back to the theme of our conference, it is well known that the impact of
western crises which was triggered by the US sub-prime had minimal impact on
most of Asian countries. Asia covers over 29% of the Earth's land area and has a
human population of over 4.2 billion which accounts for about 60% of the world
population. The populations of China and India together are estimated to be around
2.6 billion people. Economically, most of Asia is traditionally considered part of the
"Second World", with the significant exception of the industrialized "First World"
nations of Israel, Japan, and South Korea.
As in all world regions, the wealth of Asia differs widely between, and within, states.
This is due to its vast size, meaning a huge range of differing cultures, environments,
historical ties and government systems. Wealth (if measured by GDP per capita) is
mostly concentrated in East Asian territories as well in oil rich countries in West
Asia. Asia is currently undergoing rapid growth and industrialization spearheaded
by China and India - the two fastest growing major economies in the world. Asia has
accumulated over US$4 trillion of foreign exchange reserves - more than half of the
world's total.
Thus, it is interesting to see the opportunities available to Asia for continuing its
growth trajectory and the challenges to be tackled.
I again welcome each and every one in this conference and expect fruitful
deliberations.
Dr. Sharad Kumar
Remsons Chair Professor for
Management Research

vi
Editorial
The unprecedented level of growth in the major Asian economies have lately
been resonating in the global financial market. This economic growth
transformed the global business landscape and catapulted some of the East
Asian economies into major players in the world market. Not only there was
a marked change in the lives of millions in this part of the planet, it also
resulted in making some of the progressive Asian Economies like China,
India, Singapore and Malaysia the cynosure of the eyes of advanced
economies of the West. This unabated growth which started in the early
1990s and often referred to as the “Asian Miracle” continued till 2007. There
were some minor shocks in the global financial meltdown in 2008, however,
India and China’s growth story sustained the momentum and noticeably,
there was a shift in the economic center of gravity from the developed
economies to the newly emerging economies of the East. Geopolitical
commentators have observed that India, along with China will emerge as the
two largest and mightiest economies in the coming decades.
It is critically imperative to analyze the rise in Asia from the viewpoint of
business leadership and policy analyst to evaluate the underlying economic
opportunities and risks in Asia. There is a necessity to emerge a well-
developed understanding of the roots to success of the Asian economies,
context analysis of the region with respect to socio-political, economic,
cultural and technological changes and scenario building for the medium to
long-term for the regional economies of Asia. These rising nations are
redefining the nature of relationship based on international cooperation.
China is by far the dominant Asian economy. China’s dominance in the
region stems from the contribution in infrastructure, telecommunications,
education and cultural investments in the economies of Cambodia,
Mongolia, Philippines, Vietnam, Laos and Myanmar. As already stated, India
and Thailand have consistent presence as development partners in the
region. The APEC and ASEAN integration is a growing testimony to the rise
of Asian superpowers and re-balancing of trade dynamics in the Asia Pacific.
The International Conference at Durgadevi Saraf Institute of Management
Studies (DSIMS), Mumbai on 14th March, 2014 aptly conveys the new
economic order of the rapidly emerging Asian economies and highlights the
political and business strategies to harness the strong economic
fundamentals and the growth potential of the region.

vii
The papers presented in the International Conference on the theme "The
Rise of Asia - Opportunities and Challenges" was organized by Durgadevi
Saraf Institute of Management Studies (DSIMS), Mumbai on 14th March,
2014 are collected as a part of the post Conference Proceedings.
Nine research papers are presented in this Proceeding.
Following the footsteps of Robert Mumdell’s classical work on OCA, the
authors Prof. C.D. Shreedharan and Prof. Arindam Bandyopadhyay’s work
‘Determining Feasibility of Optimal Currency Area for SAARC Region based
on Political Variables’ is an endeavor toward assessing the feasibility of OCA
formation in the SAARC region.
Sneha Srinivasan and Syed A A Farhan’s article on “A Roadmap to Regional
Integration: Micro-financing Clean Energy for Sustainable Livelihood across
Asia” mutual reciprocity of energy and financial inclusion toward creation of
sustainable livelihood.
The work by Prof. Sharad Kumar and Prof. Dinesh Rajput on “External
Sector Developments in Select Asian Countries During 2008-12: A
Comparative Study” highlights the performance of external sector in the
Asian region and offers critical insight on comparative analysis of the
external sector development of Asian countries included in BRI and N11
group during post crises period i.e. from 2008 to 2012.
Prof. Janardhana A in his work “China: A threat or opportunity for India”
examines the country level competitiveness of China and India and flags
important areas of competition and trade relations.
Prof. R. Kannan’s article “Role of India and Asia in the Global Economy”
brings forth the economic growth in Asia and possible synergies between
India and China to sustain the growth momentum.
The research article on “Capital Markets Development and Economic Growth
- An Asian Perspective” authored by Prof. Sarat Kumar Malik & Prof. Akriti
studies the development of capital markets in Asian countries and analyzes
the quantum and direction of FII inflows in India.
Prof. Sharmila Bonnerjee, Prof. Rusha Das and Prof. Sumana Chaudhuri in
their working paper on “Integrating India into ASEAN: An Infrastructural
Perspective” analyzes the role of cross border transport infrastructure in
promoting economic growth through a case study of India – Myanmar –
Thailand Trilateral Highway project under the aegis of Remsons Center for
Management Studies and Research.

viii
Prof. Mohinder Pal Singh in his work “Strategic and Economic Dimensions
of Indo-Myanmar Relations” focuses on growing synergy between India and
Myanmar toward strengthening of strategic, economic, cultural ties
between these two nations.
Prof. Prerna Goyal Ramuka and Prof. Kusum Pawar in their work “A review
of Corporate Social Responsibility in Asia with special reference to China,
India and Japan” reviews the evolution and importance of Corporate Social
Responsibility (CSR) in Asian countries.
This is a unique endeavor on the part of the Institute (DSIMS) under the
aegis of Remsons Centre for Management Studies & Research to host an
International Conference on one of the most critical strategic dimensions of
the Asian growth trajectories in times of uncertainty. It is hoped that the
Conference Proceedings will be useful to future researchers and
academicians to understand the changing paradigms of Asian economies in
contemporary times.
Sumana Chaudhuri
Editor
ix
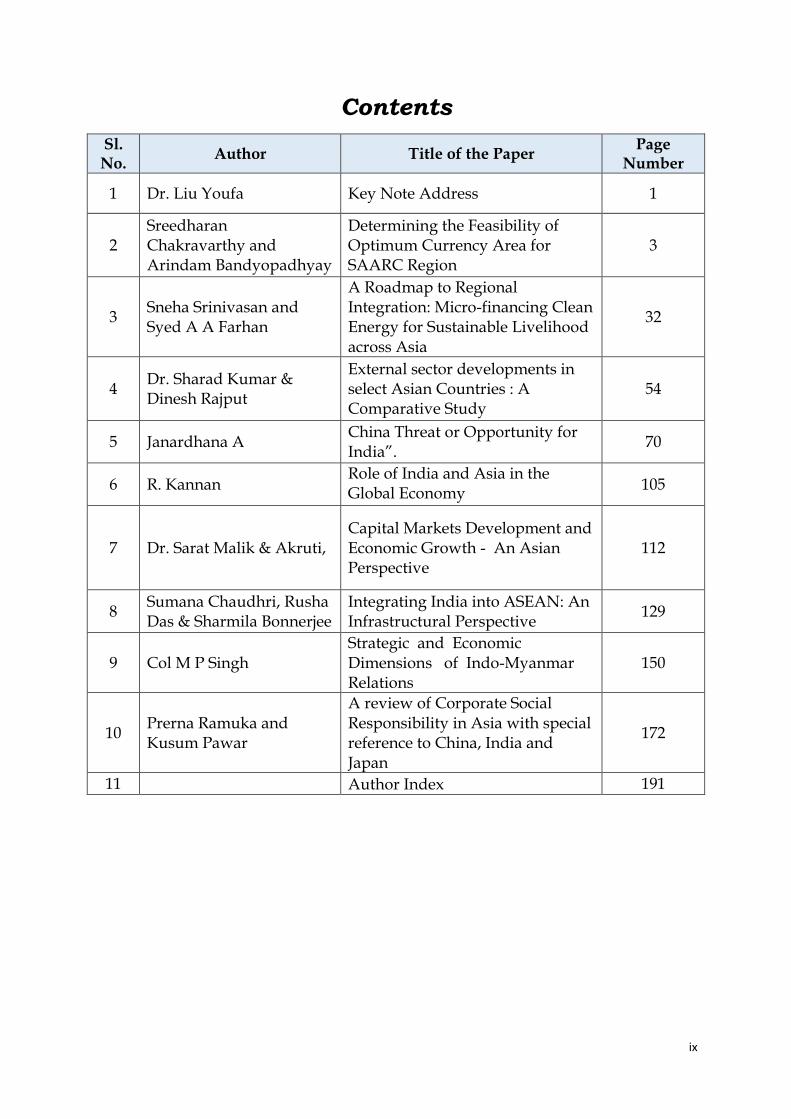
Contents
Sl. No.
Author Title of the Paper Page
Number
1 Dr. Liu Youfa Key Note Address 1
2 Sreedharan Chakravarthy and Arindam Bandyopadhyay
Determining the Feasibility of Optimum Currency Area for SAARC Region
3
3 Sneha Srinivasan and Syed A A Farhan
A Roadmap to Regional Integration: Micro-financing Clean Energy for Sustainable Livelihood across Asia
32
4 Dr. Sharad Kumar & Dinesh Rajput
External sector developments in select Asian Countries : A Comparative Study
54
5 Janardhana A China Threat or Opportunity for India”.
70
6 R. Kannan Role of India and Asia in the Global Economy
105
7 Dr. Sarat Malik & Akruti, Capital Markets Development and Economic Growth - An Asian Perspective
112
8 Sumana Chaudhri, Rusha Das & Sharmila Bonnerjee
Integrating India into ASEAN: An Infrastructural Perspective
129
9 Col M P Singh Strategic and Economic Dimensions of Indo-Myanmar Relations
150
10 Prerna Ramuka and Kusum Pawar
A review of Corporate Social Responsibility in Asia with special reference to China, India and Japan
172
11 Author Index 191
1
Keynote Address by Dr. Liu Youfa
(Consul General of People’s Republic of China)
Dear researchers, students and faculty members,
I would like to begin by thanking DSIMS for inviting me as a keynote speaker for the
conference. I accepted the invitation immediately because the subject “Rise of Asia –
Opportunities and Challenges” is dear to me and I can speak my natural thoughts not
as a Consulate General but as a Professor. I still hold the position of Professor and
would like to speak as one, for this address.
I cannot but stress the importance of strong bilateral ties between India and China. The
focus of my talk would be how India and China can dominate the world economy if
they join forces.
Let me make a few points regarding the combined strength of India and China. India
and China together account for more than half of the global population and nearly half
of the world land mass. India and China are both “rising” economies, as they have not
yet fully risen, but will achieve full potential in the near future. The growth of middle
class population is highest in India and China and in just a few years; the combined
middle class population in India and China will exceed that in US and Europe.
I have divided my presentation into three parts as follows:
a. Asia’s economic position post 2008 financial crisis.
b. Challenges faced by Asia.
c. What Asia can do to overcome these challenges.
Both India and China are growing economic engines and would turn into new
economic engines as the world economy recovers. In today’s world, India and China
are some of the few economies still growing strongly, producing almost half of the
world output. Hence, for Asia to rise and dominate the world in economic terms, it is
imperative that India and China join hands and work towards a common goal of world
economic dominance by focussing on their core competencies. This is the main theme
and focus of my address.
India and China both have a large labour market. It is important that we achieve
sustainable growth by collaboration and understand that sub regional integration is the

2
key to rise of Asia. India and China are no longer developing but developed economies,
similar to Taiwan, Hong Kong and Singapore. In India, Tatas are a global conglomerate.
The huge FDI inflow in India and China is based not on cheap labour, but on skilled
labour. China is strong in manufacturing while India is strong in services and IT sector.
With a large middle class population and skilled labour, both India and China are
poised for growth. In China, FDI inflow and outflow is almost equal indicating the rise
of China as an Asian superpower.
India and China need a stronger education system as the number of universities in US
is more than in entire Asia. Both India and China have vast consumption potential
making us global players in economic production. Earlier G7 countries set the rules and
price for products and services, but now India and China should be price setters rather
than price takers. Unfortunately, we are yet to dictate our terms as far as the pricing of
our skilled labour force is concerned. I hope this scenario will not continue in near
future.
I would like to conclude my address by highlighting the challenges faced by India and
China in becoming economic super powers viz. export import imbalance, inflation and
other infrastructural bottlenecks. We need to jointly tackle these impediments so as to
achieve our goal of an economic super power. The one thing that I feel is mandatory for
achieving a higher growth and facilitating our other under developed nations is to have
better economic and political relations with our neighbours, by building economic
corridors.

3
Determining Feasibility of Optimal Currency Area for SAARC
Region Based on Political Variables
Prof. C.D. Shreedharan
Adjunct Professor
Narsee Monjee Institute of Management Studies
Mumbai-400 056
Contact Number: +91-9820107379
and
Arindam Bandyopadhyay
Alumni of Narsee Monjee Institute of Management Studies
Project Director, Hexaware Technologies Limited
Navi Mumbai-400 710
Contact Number: +91-9820672626

4
Synopsis
Professor Robert Mundell of Columbia university conceived the theory of
Optimum Currency Area(OCA) in 1961.According to him the main criteria for
designing an OCA is the degree of factor mobility within the zone which
provides an adjustment mechanism. Euro zone is an example of this theory. A
region facing “symmetric economic shocks” can be conducive to form an OCA.
But OCA being endogeneous by nature, the OCA theory in reverse also holds
true. In other words, once an OCA has been formed economic parity can be
achieved with a little effort. But for the reverse OCA to operate, significant
political willingness is necessary. It is well documented that international
trade is affected by economic variables. However, the effects of political
variables on trade are also significant. Between countries having friendly
relations, political agenda can enhance trade through protectionism; whereas,
between hostile nations political interventions can block trade. It is also
observed that trade facilitation & currency exchange coordination are a
potential source of political cooperation between nations. In spite of these
factors, economists in large part have not studied the relationship between
exchange rate volatility and political interference between nations.
In this paper the authors analyze the relationship between Exchange Rate
Variability (ER) and the OCA Political Variables (i.e., Rule-of-Law(RL),
Government-Effectiveness(GE), Control of Corruption(CC),Regulatory-
Quality(RQ),Political-Stability-&-Absence-of- violence/Terrorism (PS) and Voice-&-
Accountability(VA)) among the countries of the SAARC region & ascertain the
feasibility of forming OCA for the region. The Multiple Linear Regression
function, Y=f(X) has been used as the basal of the deterministic model
Keywords:
Optimum currency area (OCA), SAARC Region, political variables, exchange
rate volatility, Euro-zone debt crisis

5
Introduction
South Asian Association for Regional Cooperation (SAARC) was established in
1985 with Bangladesh, Bhutan, India, Maldives, Nepal, Pakistan and Sri
Lanka as its member nations, with the objective of promoting greater
macroeconomic coordination within the South Asian region. Afghanistan joined
the SAARC in 2007. SAARC Secretariat is headquartered in Katmandu, Nepal.
The South Asian Preferential Trade Agreement (SAPTA)1 was signed in 1995
and subsequently in April 2006, the member states signed the South Asian
Free Trade Area (SAFTA)2.Despite the signing of SAFTA regional integration in
South Asia is still a far cry (Kher, 2012), and with persistent regional conflicts
the resultant being that SAARC countries have not been able to take the full
benefit of these agreements.
Common Currency for SAARC Region
Introducing a common currency in the SAARC region will significantly enhance
trade and create employment in the region. It will bestow unified identity to the
countries of the SAARC region and introduce exchange rate stability. Volatility
in exchange rate provokes price uncertainty, triggering increased adjustment
costs and decreases the efficiency of resource allocation in domestic markets
(Masron and Yusop, 2006). Volatility in Exchange rates are caused by
economic variables like inflation, current account deficits, fiscal deficits,
interest rate changes, currency speculation by dealers and merchants, etc.
Ghani and Iyer (2010)3 observed that political factors like violence, conflicts
etc. retard economic growth. Countries ravaged by persistent regional and
inter-government political conflicts are slow to grow. Since exchange rates
stability greatly contributes to overall GDP in a region, the study of the political
variables impacting the exchange rates become relevant.
1http://saarc-sec.org/areaofcooperation/detail.php?activity_id=4
2http://saarc-sec.org/areaofcooperation/detail.php?activity_id=5
3 Rodan, G. (Ed.). (2013).Political Oppositions in Industrializing Asia. Routledge..
6
The largest and most significant currency union is the Economic and Monetary
Union of the European Union (EMU). The Treaty of Maastricht, signed in 1992,
created the European Union in 1993, and led to the adoption of a single
currency the Euro(€) in 2000 by 11 (now 18) of its 28 its member states. The
European Central Bank (ECB) is the central bank for Euro-zone and
administers the monetary policies of the Euro-zone. The theory of optimum
currency areas (OCA) explores the criteria as well as the costs and benefits of
forming a common currency area. (Broz, 2005).
Literature review on the formation of an OCA in Asian region
Masron and Yusop (2006) investigated how well macro economic variables will
work in the context of the ASEAN region when the Singapore Dollar, given its
relative stability, is used as an anchor currency for OCA. Their results
indicated that economic variables play an important role in explaining bilateral
exchange rate volatility. In addition, exchange rate volatility exerts a negative
impact on bilateral trade and gross domestic product (GDP). It is also a source
of divergence among ASEAN members.
Taguchi (2010) examined the economic feasibility of forming a regional
currency block in Asia, by adopting Generalized Purchasing Power Parity (G-
PPP) approach to identify the existence of common trends in real exchange
rates among a group of countries. South Asia, as a group, passed the G-PPP
condition.
Gopinath (2005) researched to examine the suitability of SAARC for an
optimum currency area on the basis of three criteria viz., intensity of trade,
shock symmetry and homogeneity of economies. His study revealed that
SAARC is ill suited for a common currency, as the extent of trade is extremely
low, idiosyncratic, economies are heterogeneous. Forhad (2013) found that low
share of intra-regional trade, low degree of factor mobility and lack of political
integration would suggest that introduction of a common currency is not
feasible across the SAARC countries.

7
Hooy & Choong (2010) observed that real exchange rate volatility was found to
have a significant and negative impact on the export demand of most of the
SAARC countries. This implied that higher exchange rate fluctuation did not
encourage intra-regional trade within SAARC region.
Kher (2012) concluded that although regional integration in South Asia is still
a distant priority for South Asian countries, the changes in the world economic
order and recent developments in South Asia made it pertinent to re-look at
the case of integration in South Asia. She examined the politico- economic
factors that create impediments to economic integration in the region. Her
study looked at regional integration arrangements in other parts of the world to
identify key lessons for South Asia. Further, she also examined the role of legal
instruments in South and Southeast Asia in the area of trade and investment
which are required for regional integration.
Chowdhury, Chowdhury and Haque (2008) observed that formation of regional
integration has been greatly successful in bringing historically hostile
countries together. The classic example is the state in the European Union and
the South East Asia where economic dimensions have brought long time foes
in the same dais. The basic premise on which SAARC was founded was that by
activating cooperative cultural identities and economic interests, political
conflicts and tensions in South Asia could be moderated, if not completely
eliminated. It looks advantageous if SAARC countries could adopt a single
currency-thereby substantially enhancing their bargaining power together in
the world market. A common currency’s attraction is that it doesn’t represent
the currency of any single country. It’s advantageous to deal with a lesser
number of currencies since each time one converts a currency there is a huge
loss. The common currency regime, when achieved, can present substantial
benefits to the region. With uncertainty about exchange rates removed, and
transaction costs reduce. Trade and investment in the region can get a big
boost. Also with money creation under regional guidelines, there would be
better prospects of synchronization of inflation, interest rate and GDP growth,
all of which can contribute to accelerated growth and poverty reduction.

8
Objective of the Study
This paper attempts to establish whether changes in political variables have
any significant influence on changes in exchange rate for each of the eight
currencies of the SAARC region. Secondly, it aims to find which political
variables have a stronger effect on changes in the individual currency
exchange rates, thereby establishing whether there exists similarity of political
shock effects on each of the SAARC nations. Thirdly, based on the degree of
political variables’ influence on the exchange rates, it tries to analyze the
feasibility of using any of the existing currencies while forming the Optimum
Currency Area.
The following table gives the Exchange Rate Regime followed by the eight
member countries of the SAARC region:
Country Currency Used ISO 4217 Code
Exchange Rate Regime
Afghanistan Afghan Afghani AFN Managed Float
Bangladesh Bangladeshi Taka BDK Managed Float
Bhutan Bhutanese Ngultrum BTN Fixed Peg
India Indian Rupee INR Managed Float
Maldives Maldivian Rupee MVR Fixed Peg
Nepal Nepalese Rupee NPR Fixed Peg
Pakistan Pakistani Rupee PKR Managed Float
Sri Lanka Sri Lankan Rupee LKR Managed Float
It may be seen that five countries follow managed floating regime (India,
Pakistan, Sri Lanka, Afghanistan & Bangladesh) while three countries follow
fixed peg regimes (Bhutan, Nepal & Maldives).
9
Research Hypotheses
Taking into account the exchange rate regimes followed by member countries
of SAARC region and the six most important ‘political variables’, namely, Rule-
of-Law(RL), Government-Effectiveness(GE), Control of Corruption(CC), Regulatory-
Quality(RQ), Political-Stability-&-Absence-of-Violence/Terrorism(PS) and Voice-&-
Accountability(VA), the authors have formed the following hypotheses :-
H0: Political variables affect the exchange rate variability
H1: Political variables do not affect exchange rate variability
H3: Political variables will influence the formation of OCA in SAARC region
H4: Political variables will not influence the formation of OCA in SAARC region
Deterministic Model and Estimation Procedure
Dependent Variable
This research paper takes into account the six political variables mentioned
below as independent variables which influence the Exchange Rate Variability
(ER) of the SAARC countries. The dependent variable is Exchange Rate
Variability (ER).
ER is taken as the change in exchange rate of two consecutive years as on
31st December. For example, the change in exchange rate year 2001 less that
of year 2000.
Independent Variables
1) Rule-of-Law(RL):
Reflects perceptions of the extent to which agents have confidence in and abide
by the rules of society, and in particular the quality of contract enforcement,
property rights, the police, and the courts, as well as the likelihood of crime
and violence.
2) Government-Effectiveness(GE):
Reflects perceptions of the quality of public services, the quality of the civil
service and the degree of its independence from political pressures, the quality
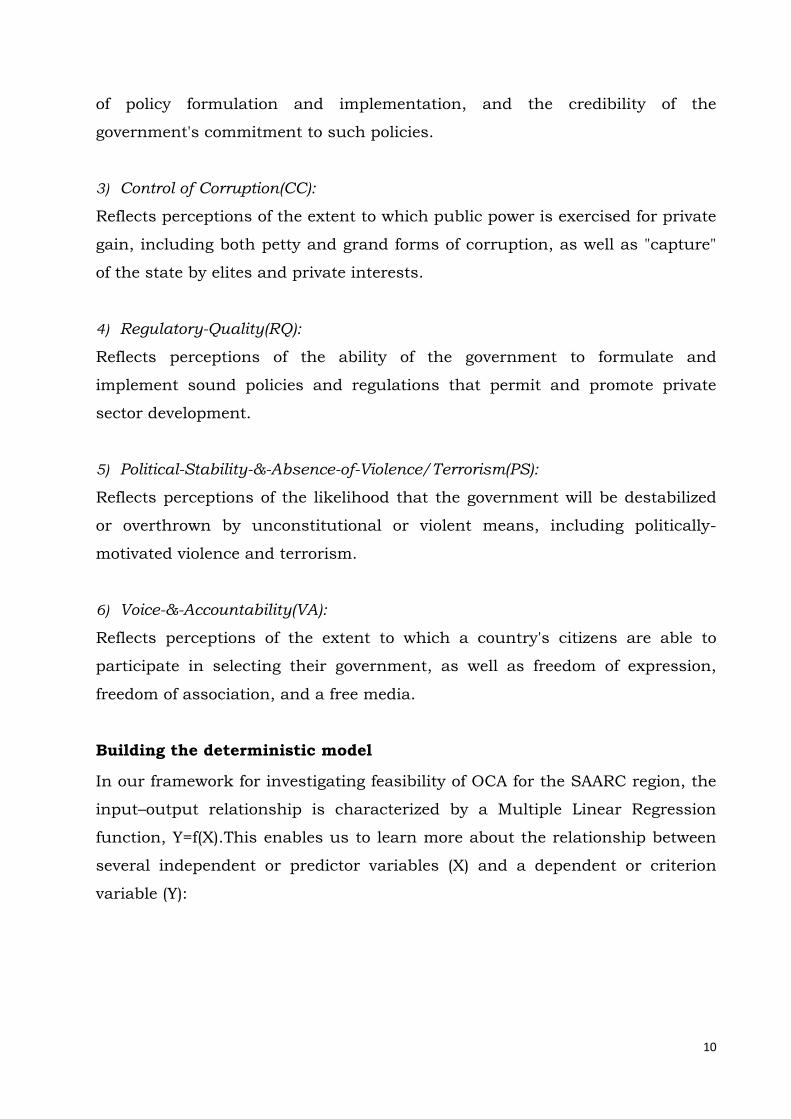
10
of policy formulation and implementation, and the credibility of the
government's commitment to such policies.
3) Control of Corruption(CC):
Reflects perceptions of the extent to which public power is exercised for private
gain, including both petty and grand forms of corruption, as well as "capture"
of the state by elites and private interests.
4) Regulatory-Quality(RQ):
Reflects perceptions of the ability of the government to formulate and
implement sound policies and regulations that permit and promote private
sector development.
5) Political-Stability-&-Absence-of-Violence/Terrorism(PS):
Reflects perceptions of the likelihood that the government will be destabilized
or overthrown by unconstitutional or violent means, including politically-
motivated violence and terrorism.
6) Voice-&-Accountability(VA):
Reflects perceptions of the extent to which a country's citizens are able to
participate in selecting their government, as well as freedom of expression,
freedom of association, and a free media.
Building the deterministic model
In our framework for investigating feasibility of OCA for the SAARC region, the
input–output relationship is characterized by a Multiple Linear Regression
function, Y=f(X).This enables us to learn more about the relationship between
several independent or predictor variables (X) and a dependent or criterion
variable (Y):

11
Y = c + ∑mi Xi + ε ………………………..(1)
Our Deterministic Model takes the form:
ER = α0 + ∑βi*OCAi + ε …………….. (2)
where OCA is the optimum currency area political parameters. Substituting
the proxy for OCA, we get:
ER = α0 + β0*RL + β1*GE + β2*CC + β3*RQ + β4*PS + β5*VA + ε
……………………….. (3) where…
ER is change in Exchange Rate of currency of a country
RL is change in Rule-of-Law of country
GE is change in Government-Effectiveness of country
CC is change in Control-of-Corruption of country
RQ is change in Regulatory-Quality of country
PS is change in Political-Stability and Absence-of-
Violence/Terrorism of country
VA is change in Voice-and-Accountability of country
α0 is the Intercept representing the Economic variables; the
intercept is kept equal to zero to nullify effect of other
factors on dependent variable ER
β0, β1, β2, β3, β4, β5 are the coefficients of RL, GE, CC, RQ, PS and
VA respectively
ε is the error term
Methodology
The values of the 6 independent variables were accessed from The Worldwide
Governance Indicators (WGI), 2013 Update, World Bank Group (See annexure
B) for SAARC countries.
(http://info.worldbank.org/governance/wgi/index.aspx#home)
The values of dependent variable for the respective SAARC currencies against
US$ were accessed from (http://exchangerateweb.com/others/historical-
rates.php?).
12
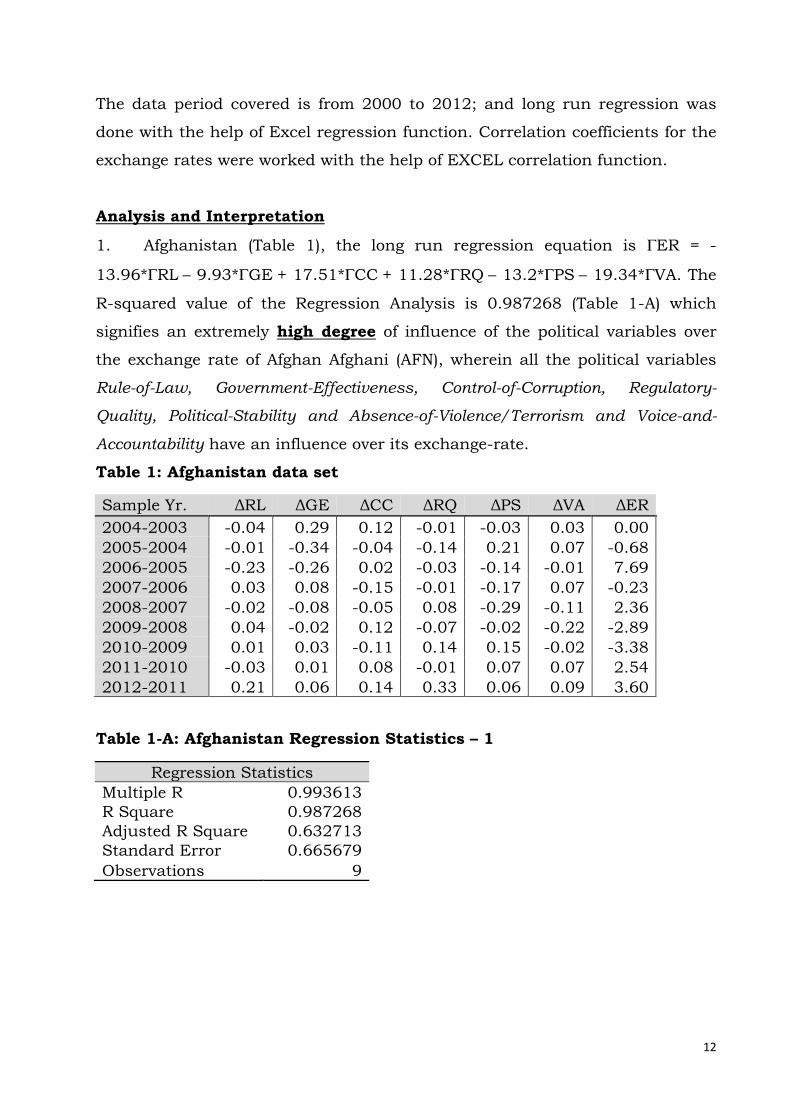
The data period covered is from 2000 to 2012; and long run regression was
done with the help of Excel regression function. Correlation coefficients for the
exchange rates were worked with the help of EXCEL correlation function.
Analysis and Interpretation
1. Afghanistan (Table 1), the long run regression equation is ER = -
13.96*RL – 9.93*GE + 17.51*CC + 11.28*RQ – 13.2*PS – 19.34*VA. The
R-squared value of the Regression Analysis is 0.987268 (Table 1-A) which
signifies an extremely high degree of influence of the political variables over
the exchange rate of Afghan Afghani (AFN), wherein all the political variables
Rule-of-Law, Government-Effectiveness, Control-of-Corruption, Regulatory-
Quality, Political-Stability and Absence-of-Violence/Terrorism and Voice-and-
Accountability have an influence over its exchange-rate.
Table 1: Afghanistan data set
Sample Yr. ΔRL ΔGE ΔCC ΔRQ ΔPS ΔVA ΔER
2004-2003 -0.04 0.29 0.12 -0.01 -0.03 0.03 0.00
2005-2004 -0.01 -0.34 -0.04 -0.14 0.21 0.07 -0.68
2006-2005 -0.23 -0.26 0.02 -0.03 -0.14 -0.01 7.69
2007-2006 0.03 0.08 -0.15 -0.01 -0.17 0.07 -0.23
2008-2007 -0.02 -0.08 -0.05 0.08 -0.29 -0.11 2.36
2009-2008 0.04 -0.02 0.12 -0.07 -0.02 -0.22 -2.89
2010-2009 0.01 0.03 -0.11 0.14 0.15 -0.02 -3.38
2011-2010 -0.03 0.01 0.08 -0.01 0.07 0.07 2.54
2012-2011 0.21 0.06 0.14 0.33 0.06 0.09 3.60
Table 1-A: Afghanistan Regression Statistics – 1
Regression Statistics
Multiple R 0.993613
R Square 0.987268
Adjusted R Square 0.632713
Standard Error 0.665679
Observations 9

13
Table 1-B: Afghanistan Regression Statistics - 2
Coefficients Standard Error t Stat P-value Lower 95% Upper 95%
Intercept 0 #N/A #N/A #N/A #N/A #N/A
ΔRL -13.9634 2.956551 -4.72286 0.017983 -23.3725 -4.55433
ΔGE -9.9264 1.442221 -6.88272 0.006283 -14.5162 -5.33661
ΔCC 17.51198 2.340942 7.48074 0.004947 10.06206 24.9619
ΔRQ 11.28128 2.200572 5.126522 0.014371 4.278079 18.28448
ΔPS -13.2012 1.810409 -7.29185 0.005325 -18.9628 -7.4397
ΔVA 19.34006 2.570819 7.522916 0.004868 11.15856 27.52155
2. Bangladesh (Table 2), the long run regression equation is ER = -
2.92*RL – 110.16*GE + 18.17*CC + 25.55*RQ + 12.17*PS + 11.9*VA.
The R-squared value of the Regression Analysis is 0.722282 (Table 5) which
signifies a very high degree of influence of the political variables over the
exchange rate of Bangladeshi Taka (BDT), in particular the political variables
Government-Effectiveness and Regulatory-Quality have an extremely high
influence over its exchange-rate.
Table 2: Bangladesh data set
Sample Yr. ΔRL ΔGE ΔCC ΔRQ ΔPS ΔVA ΔER
2001-2000 0.01 -0.03 -0.06 -0.03 -0.08 -0.05 0.84
2002-2001 0.03 -0.10 -0.18 -0.10 -0.23 -0.16 1.25
2003-2002 -0.12 -0.01 -0.16 0.09 -0.06 -0.11 1.07
2004-2003 0.03 -0.07 -0.15 -0.17 -0.24 -0.05 1.21
2005-2004 0.03 -0.09 0.08 0.06 -0.46 0.08 7.98
2006-2005 0.08 0.09 -0.01 0.08 0.37 0.12 0.51
2007-2006 0.05 0.09 0.38 0.05 -0.02 -0.06 0.39
2008-2007 0.08 -0.03 0.03 0.02 0.02 0.07 1.04
2009-2008 -0.02 -0.08 -0.01 0.04 -0.06 0.17 16.00
2010-2009 -0.01 0.04 0.00 0.01 0.14 0.02 1.72
2011-2010 0.07 -0.01 -0.02 0.03 0.01 -0.04 4.10
2012-2011 -0.20 -0.07 0.18 -0.16 0.04 -0.09 7.13
Table 2-A: Bangladesh Regression Statistics - 1
Regression Statistics
Multiple R 0.849872
R Square 0.722282
Adjusted R Square 0.324184
Standard Error 4.28483
Observations 12

14
Table 2-B: Bangladesh Regression Statistics - 2
Coefficients
Standard Error
t Stat P-value Lower 95% Upper 95%
Intercept 0 #N/A #N/A #N/A #N/A #N/A
ΔRL -2.91795 19.49051 -0.14971 0.885898 -50.6095 44.7736 ΔGE -110.156 45.18836 -2.43772 0.050629 -220.728 0.415566
ΔCC 18.16874 10.31721 1.761013 0.128715 -7.07656 43.41405
ΔRQ 25.55144 21.43939 1.191799 0.278338 -26.9089 78.01174
ΔPS 12.11646 12.3782 0.978855 0.365454 -18.1719 42.40482
ΔVA 11.8968 19.02248 0.625407 0.55473 -34.6495 58.44312
3. Bhutan (Table 3), the long run regression equation is ER = – 4.57*RL –
7.82*GE – 15.37*CC + 3.23*RQ + 8.81*PS + 13.64*VA. The R-squared
value of the Regression Analysis is 0.434578 (Table 3A) which signifies a low
degree of influence of the political variables over the exchange rate of
Bhutanese Ngultrum (BTN), wherein none of the political variables have
influence over its exchange-rate.
Table 3: Bhutan data set
Sample Yr. ΔRL ΔGE ΔCC ΔRQ ΔPS ΔVA ΔER
2001-2000 -0.02 -0.01 0.05 -0.02 0.05 -0.06 1.37
2002-2001 -0.06 -0.03 0.15 -0.07 0.14 -0.19 -0.43
2003-2002 0.14 -0.35 0.17 0.46 0.31 0.04 -2.37
2004-2003 0.12 -0.52 -0.14 -0.80 0.27 0.27 0.00
2005-2004 0.01 0.42 0.13 0.38 0.13 -0.11 -0.25
2006-2005 -0.11 -0.10 -0.09 -0.17 0.00 0.03 -0.68
2007-2006 0.12 0.02 0.08 -0.13 -0.69 0.17 -4.89
2008-2007 0.00 0.03 0.03 -0.10 0.13 0.28 8.81
2009-2008 -0.19 0.26 0.04 -0.27 0.06 0.05 -1.62
2010-2009 -0.06 0.09 0.01 -0.10 -0.04 0.06 -1.75
2011-2010 0.03 0.05 -0.09 0.02 0.08 0.00 8.19
2012-2011 0.05 -0.14 0.09 0.06 -0.04 0.13 1.76
Table 3-A: Bhutan Regression Statistics - 1
Regression Statistics
Multiple R 0.659225
R Square 0.434578
Adjusted R Square -0.20327
Standard Error 4.180946
Observations 12
15
Table 3-B: Bhutan Regression Statistics - 2
Coefficients Standard
Error t Stat P-value
Lower
95% Upper 95%
Intercept 0 #N/A #N/A #N/A #N/A #N/A
ΔRL 4.568177 20.44686 0.223417 0.830623 -45.4635 54.59985 ΔGE 7.824639 8.515166 0.918906 0.393586 -13.0112 28.6605
ΔCC -15.3739 14.91107 -1.03104 0.342279 -51.86 21.11217
ΔRQ 3.227549 6.806927 0.474156 0.652151 -13.4284 19.8835
ΔPS 8.814793 5.70021 1.546398 0.172969 -5.13312 22.76271
ΔVA 13.64446 11.50403 1.186059 0.280433 -14.5049 41.7938
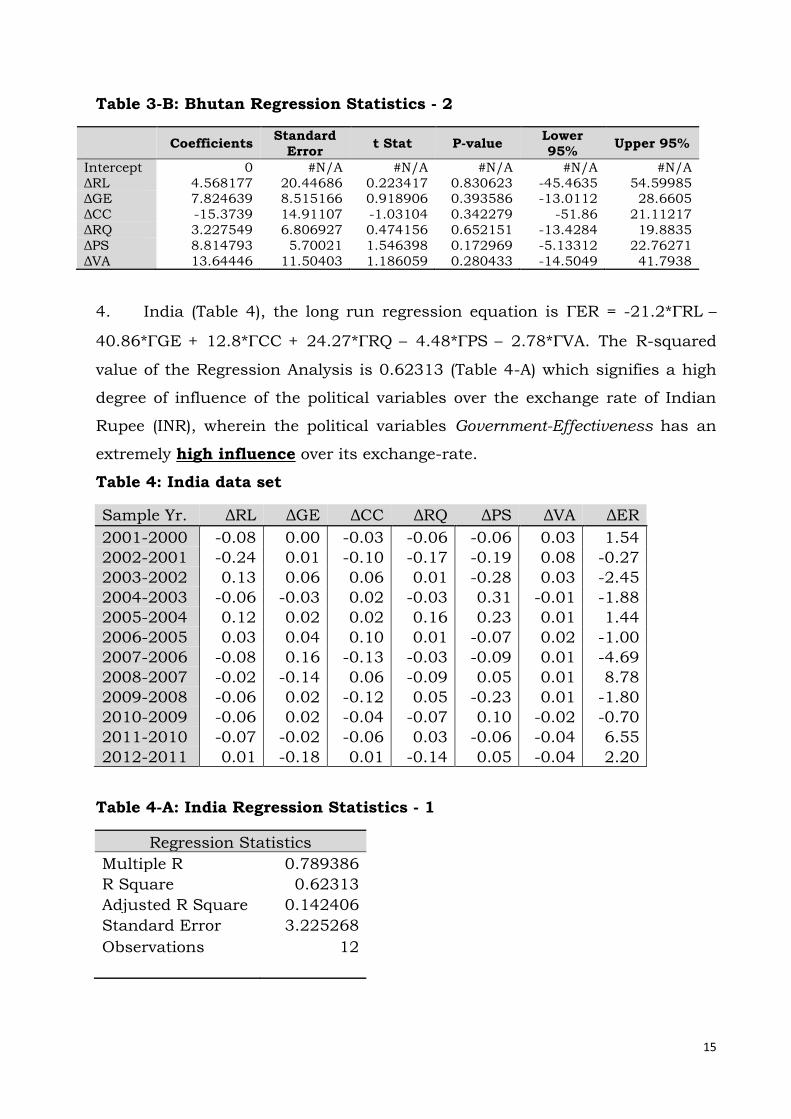
4. India (Table 4), the long run regression equation is ER = -21.2*RL –
40.86*GE + 12.8*CC + 24.27*RQ – 4.48*PS – 2.78*VA. The R-squared
value of the Regression Analysis is 0.62313 (Table 4-A) which signifies a high
degree of influence of the political variables over the exchange rate of Indian
Rupee (INR), wherein the political variables Government-Effectiveness has an
extremely high influence over its exchange-rate.
Table 4: India data set
Sample Yr. ΔRL ΔGE ΔCC ΔRQ ΔPS ΔVA ΔER
2001-2000 -0.08 0.00 -0.03 -0.06 -0.06 0.03 1.54
2002-2001 -0.24 0.01 -0.10 -0.17 -0.19 0.08 -0.27
2003-2002 0.13 0.06 0.06 0.01 -0.28 0.03 -2.45
2004-2003 -0.06 -0.03 0.02 -0.03 0.31 -0.01 -1.88
2005-2004 0.12 0.02 0.02 0.16 0.23 0.01 1.44
2006-2005 0.03 0.04 0.10 0.01 -0.07 0.02 -1.00
2007-2006 -0.08 0.16 -0.13 -0.03 -0.09 0.01 -4.69
2008-2007 -0.02 -0.14 0.06 -0.09 0.05 0.01 8.78
2009-2008 -0.06 0.02 -0.12 0.05 -0.23 0.01 -1.80
2010-2009 -0.06 0.02 -0.04 -0.07 0.10 -0.02 -0.70
2011-2010 -0.07 -0.02 -0.06 0.03 -0.06 -0.04 6.55
2012-2011 0.01 -0.18 0.01 -0.14 0.05 -0.04 2.20
Table 4-A: India Regression Statistics - 1
Regression Statistics
Multiple R 0.789386
R Square 0.62313
Adjusted R Square 0.142406
Standard Error 3.225268
Observations 12

16
Table 4-B: India Regression Statistics - 2
Coefficients
Standard Error
t Stat P-value Lower
95% Upper
95%
Intercept 0 #N/A #N/A #N/A #N/A #N/A ΔRL -21.2005 21.27284 -0.9966 0.357438 -73.2533 30.85228
ΔGE -40.8623 16.41098 -2.48994 0.047166 -81.0185 -0.70607 ΔCC 12.80364 24.15733 0.53001 0.615136 -46.3072 71.9145
ΔRQ 24.27321 18.56748 1.307297 0.238972 -21.1598 69.7062 ΔPS -4.48493 7.028142 -0.63814 0.546952 -21.6822 12.71232 ΔVA -2.78094 40.51288 -0.06864 0.947504 -101.912 96.3505
5. Maldives (Table 5), the long run regression equation is ER = – 5.32*RL
– 2.42*GE – 0.658*CC + 2.21*RQ – 0.081*PS – 1.37*VA. The R-squared
value of the Regression Analysis is 0.699984 (Table 5-A) which signifies a high
degree of influence of the political variables over the exchange rate of Maldivian
Rufiyaa (MVR), wherein the political variables Rule-of-Law has a high
influence over its exchange-rate.
Table 5: Maldives data set
Sample Yr. ΔRL ΔGE ΔCC ΔRQ ΔPS ΔVA ΔER
2001-2000 -0.08 0.00 0.03 0.02 -0.02 -0.04 0.00
2002-2001 -0.23 0.00 0.10 0.06 -0.07 -0.11 0.92
2003-2002 0.09 -0.27 0.21 -0.18 0.00 -0.39 0.00
2004-2003 -0.08 -0.12 -0.22 -0.67 -0.49 -0.20 0.06
2005-2004 0.15 0.27 -0.13 0.54 0.30 0.13 -0.15
2006-2005 -0.11 -0.12 -0.23 -0.15 -0.04 -0.01 0.05
2007-2006 -0.14 -0.03 -0.30 -0.32 -0.70 0.09 -0.03
2008-2007 -0.14 -0.28 -0.04 -0.37 -0.24 0.60 -0.02
2009-2008 -0.01 -0.18 0.19 -0.02 -0.07 0.22 0.00
2010-2009 -0.16 0.24 0.16 0.02 0.09 -0.01 0.03
2011-2010 -0.24 -0.10 0.00 -0.01 -0.08 -0.11 2.78
2012-2011 0.07 0.15 0.08 0.06 -0.07 -0.31 -0.04
Table 5-A: Maldives Regression Statistics - 1
Regression Statistics
Multiple R 0.83665
R Square 0.699984 Adjusted R Square 0.283303 Standard Error 0.656027
Observations 12

17
Table 5-B: Maldives Regression Statistics - 2
Coefficients Standard
Error t Stat P-value
Lower 95%
Upper 95%
Intercept 0 #N/A #N/A #N/A #N/A #N/A ΔRL -5.32221 1.624469 -3.27628 0.016901 -9.29715 -1.34728
ΔGE -2.4217 1.623699 -1.49147 0.186435 -6.39474 1.551353 ΔCC -0.65753 1.476532 -0.44532 0.671703 -4.27048 2.95541
ΔRQ 2.206147 1.445453 1.526267 0.177794 -1.33075 5.743043 ΔPS -0.08112 1.437885 -0.05642 0.95684 -3.5995 3.437255 ΔVA -1.36651 0.825956 -1.65446 0.149116 -3.38756 0.654527
6. Nepal (Table 6), the long run regression equation is ER = – 0.02995*RL
+ 4.75*GE + 3.26*CC – 4.45*RQ + 18.33*PS – 15.46*VA. The R-squared
value of the Regression Analysis is 0.20259 (Table 6-A) which signifies an
extremely low degree of influence of the change in political variables over the
exchange rate of Nepalese Rupee (NPR), wherein none of the political variables
have an influence over its exchange-rate.
Table 6: Nepal data set
Sample Yr. ΔRL ΔGE ΔCC ΔRQ ΔPS ΔVA ΔER
2001-2000 -0.05 0.00 -0.03 0.00 -0.14 -0.14 -1.26
2002-2001 -0.15 0.00 -0.08 -0.01 -0.42 -0.41 0.06
2003-2002 -0.09 -0.08 0.20 0.15 -0.15 -0.07 -2.77
2004-2003 -0.14 -0.18 -0.33 -0.10 -0.17 -0.23 -0.70
2005-2004 -0.08 -0.09 0.02 0.03 0.01 -0.05 2.09
2006-2005 0.21 0.06 0.28 0.00 0.19 0.29 -2.25
2007-2006 -0.01 0.13 0.02 -0.05 0.01 0.31 0.00
2008-2007 -0.08 -0.10 -0.06 -0.06 0.07 0.06 7.90
2009-2008 -0.18 -0.18 -0.24 -0.08 0.22 0.06 -3.25
2010-2009 -0.10 0.08 -0.03 -0.04 0.03 -0.01 -1.45
2011-2010 0.06 -0.02 0.02 0.02 0.17 -0.02 12.40
2012-2011 0.16 -0.11 -0.01 -0.09 0.04 -0.20 2.55
Table 6-A: Nepal Regression Statistics – 1
Regression Statistics
Multiple R 0.4501
R Square 0.20259
Adjusted R Square -0.62859
Standard Error 5.816049
Observations 12
18
Table 6-B: Nepal Regression Statistics - 2
Coefficients
Standard Error
t Stat P-value Lower
95% Upper
95%
Intercept 0 #N/A #N/A #N/A #N/A #N/A ΔRL -0.02995 24.85313 -0.00121 0.999078 -60.8434 60.78347
ΔGE 4.754434 24.85645 0.191276 0.854618 -56.0671 65.57597 ΔCC 3.259243 26.93176 0.121019 0.907627 -62.6404 69.15889
ΔRQ -4.45444 42.41493 -0.10502 0.919782 -108.24 99.33115 ΔPS 18.33424 19.44816 0.942724 0.382215 -29.2537 65.92216
ΔVA -15.4626 17.8986 -0.8639 0.420831 -59.2589 28.33369
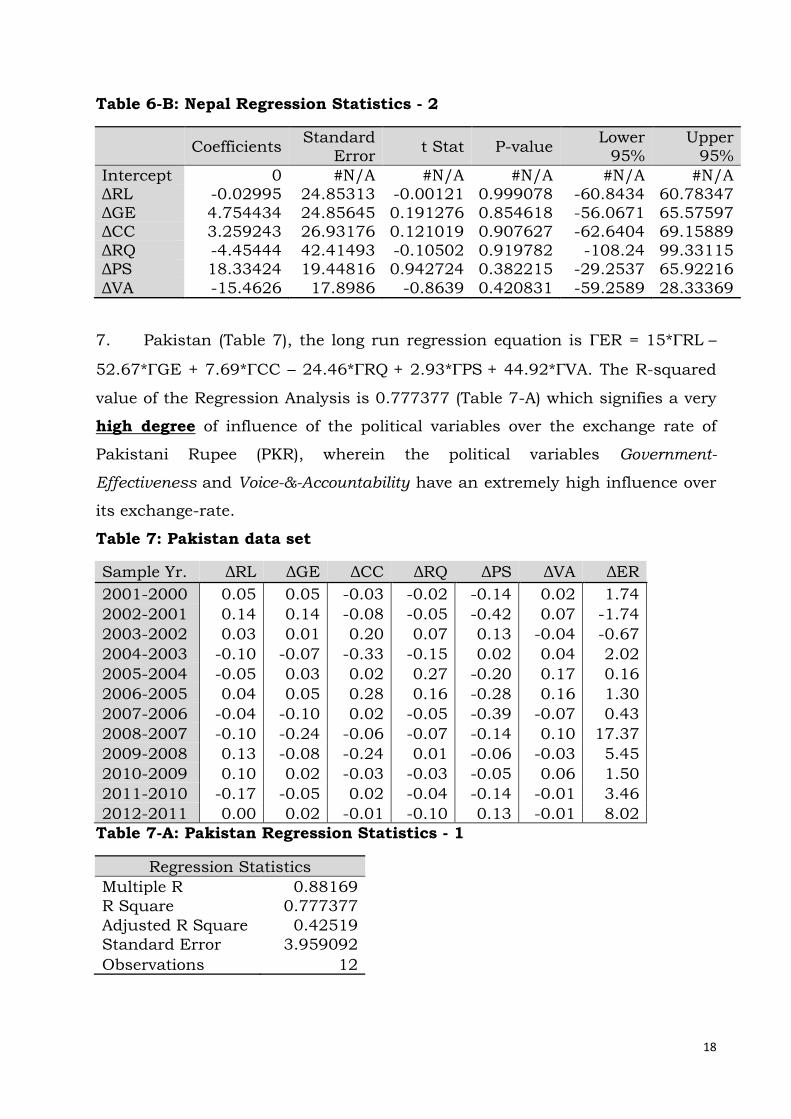
7. Pakistan (Table 7), the long run regression equation is ER = 15*RL –
52.67*GE + 7.69*CC – 24.46*RQ + 2.93*PS + 44.92*VA. The R-squared
value of the Regression Analysis is 0.777377 (Table 7-A) which signifies a very
high degree of influence of the political variables over the exchange rate of
Pakistani Rupee (PKR), wherein the political variables Government-
Effectiveness and Voice-&-Accountability have an extremely high influence over
its exchange-rate.
Table 7: Pakistan data set
Sample Yr. ΔRL ΔGE ΔCC ΔRQ ΔPS ΔVA ΔER
2001-2000 0.05 0.05 -0.03 -0.02 -0.14 0.02 1.74
2002-2001 0.14 0.14 -0.08 -0.05 -0.42 0.07 -1.74
2003-2002 0.03 0.01 0.20 0.07 0.13 -0.04 -0.67
2004-2003 -0.10 -0.07 -0.33 -0.15 0.02 0.04 2.02
2005-2004 -0.05 0.03 0.02 0.27 -0.20 0.17 0.16
2006-2005 0.04 0.05 0.28 0.16 -0.28 0.16 1.30
2007-2006 -0.04 -0.10 0.02 -0.05 -0.39 -0.07 0.43
2008-2007 -0.10 -0.24 -0.06 -0.07 -0.14 0.10 17.37
2009-2008 0.13 -0.08 -0.24 0.01 -0.06 -0.03 5.45
2010-2009 0.10 0.02 -0.03 -0.03 -0.05 0.06 1.50
2011-2010 -0.17 -0.05 0.02 -0.04 -0.14 -0.01 3.46
2012-2011 0.00 0.02 -0.01 -0.10 0.13 -0.01 8.02
Table 7-A: Pakistan Regression Statistics - 1
Regression Statistics
Multiple R 0.88169
R Square 0.777377
Adjusted R Square 0.42519
Standard Error 3.959092
Observations 12
19
Table 7-B: Pakistan Regression Statistics - 2
Coefficient
s
Standard
Error t Stat P-value
Lower
95% Upper 95%
Intercept 0 #N/A #N/A #N/A #N/A #N/A
ΔRL 15.00352 14.90705 1.006471 0.353039 -21.4727 51.47976
ΔGE -52.6662 15.88638 -3.31518 0.016101 -91.5388 -13.7936
ΔCC 7.685183 9.47839 0.810811 0.448433 -15.5076 30.87797
ΔRQ -24.4567 15.23116 -1.6057 0.159463 -61.726 12.81265
ΔPS 2.933995 6.366509 0.460848 0.661139 -12.6443 18.51228
ΔVA 44.91618 18.98336 2.366082 0.055818 -1.53441 91.36678
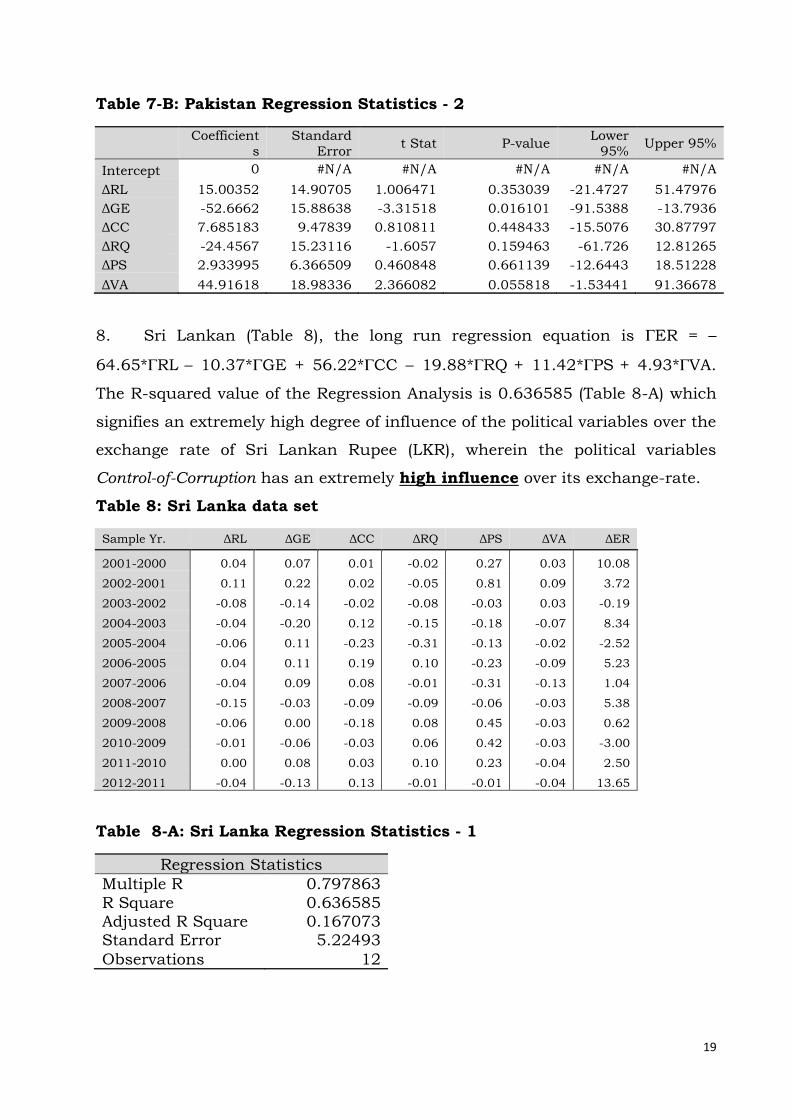
8. Sri Lankan (Table 8), the long run regression equation is ER = –
64.65*RL – 10.37*GE + 56.22*CC – 19.88*RQ + 11.42*PS + 4.93*VA.
The R-squared value of the Regression Analysis is 0.636585 (Table 8-A) which
signifies an extremely high degree of influence of the political variables over the
exchange rate of Sri Lankan Rupee (LKR), wherein the political variables
Control-of-Corruption has an extremely high influence over its exchange-rate.
Table 8: Sri Lanka data set
Sample Yr. ΔRL ΔGE ΔCC ΔRQ ΔPS ΔVA ΔER
2001-2000 0.04 0.07 0.01 -0.02 0.27 0.03 10.08
2002-2001 0.11 0.22 0.02 -0.05 0.81 0.09 3.72
2003-2002 -0.08 -0.14 -0.02 -0.08 -0.03 0.03 -0.19
2004-2003 -0.04 -0.20 0.12 -0.15 -0.18 -0.07 8.34
2005-2004 -0.06 0.11 -0.23 -0.31 -0.13 -0.02 -2.52
2006-2005 0.04 0.11 0.19 0.10 -0.23 -0.09 5.23
2007-2006 -0.04 0.09 0.08 -0.01 -0.31 -0.13 1.04
2008-2007 -0.15 -0.03 -0.09 -0.09 -0.06 -0.03 5.38
2009-2008 -0.06 0.00 -0.18 0.08 0.45 -0.03 0.62
2010-2009 -0.01 -0.06 -0.03 0.06 0.42 -0.03 -3.00
2011-2010 0.00 0.08 0.03 0.10 0.23 -0.04 2.50
2012-2011 -0.04 -0.13 0.13 -0.01 -0.01 -0.04 13.65
Table 8-A: Sri Lanka Regression Statistics - 1
Regression Statistics
Multiple R 0.797863
R Square 0.636585 Adjusted R Square 0.167073 Standard Error 5.22493
Observations 12

20
Table 8-B: Sri Lanka Regression Statistics - 2
Coefficients
Standard Error
t Stat P-value Lower 95% Upper
95%
Intercept 0 #N/A #N/A #N/A #N/A #N/A ΔRL -64.65210 46.62014 -1.38678 0.214834 -178.727 49.4233 ΔGE 10.37154 19.14892 0.541625 0.607587 -36.4842 57.22726 ΔCC 56.22271 21.51970 2.612616 0.039980 3.565897 108.8795 ΔRQ -19.88450 15.34802 -1.29557 0.242730 -57.4397 17.67076 ΔPS 11.42204 5.765726 1.981024 0.094889 -2.68618 25.53026 ΔVA 4.925797 39.25370 0.125486 0.904238 -91.1246 100.9761
Exchange rate correlation Analysis
From Table 9, we observe that there is a very high degree of positive
correlation between Indian INR, Nepalese NPR, Bhutanese BTN, Maldivian
MVR and Pakistani PKR, However, Bangladeshi Taka BDT, Afghan AFN and Sri
Lankan LKR do not have correlation with any of the SAARC currencies.
Table 9: Correlation between the various SAARC currencies
Country
Afghanistan
Bangladesh
Bhutan
India Maldive
s Nepal
Pakistan
Sri Lank
a
ISO 4217
AFN BDT BTN INR MVR NPR PKR LKR
Afghanistan
AFN 1.000 -0.386 0.356 0.306 0.183 0.264 0.184 0.591
Bangladesh
BDT -0.386 1.000 -0.044 -
0.005 -0.047
-0.060
0.156 -
0.144
Bhutan BTN 0.356 -0.044 1.000 0.970 0.557 0.867 0.690 0.312
India INR 0.306 -0.005 0.970 1.000 0.455 0.845 0.710 0.241
Maldives MVR 0.183 -0.047 0.557 0.455 1.000 0.716 -0.064
-0.055
Nepal NPR 0.264 -0.060 0.867 0.845 0.716 1.000 0.499 0.100
Pakistan PKR 0.184 0.156 0.690 0.710 -0.064 0.499 1.000 0.344
Sri Lanka LKR 0.591 -0.144 0.312 0.241 -0.055 0.100 0.344 1.000
21
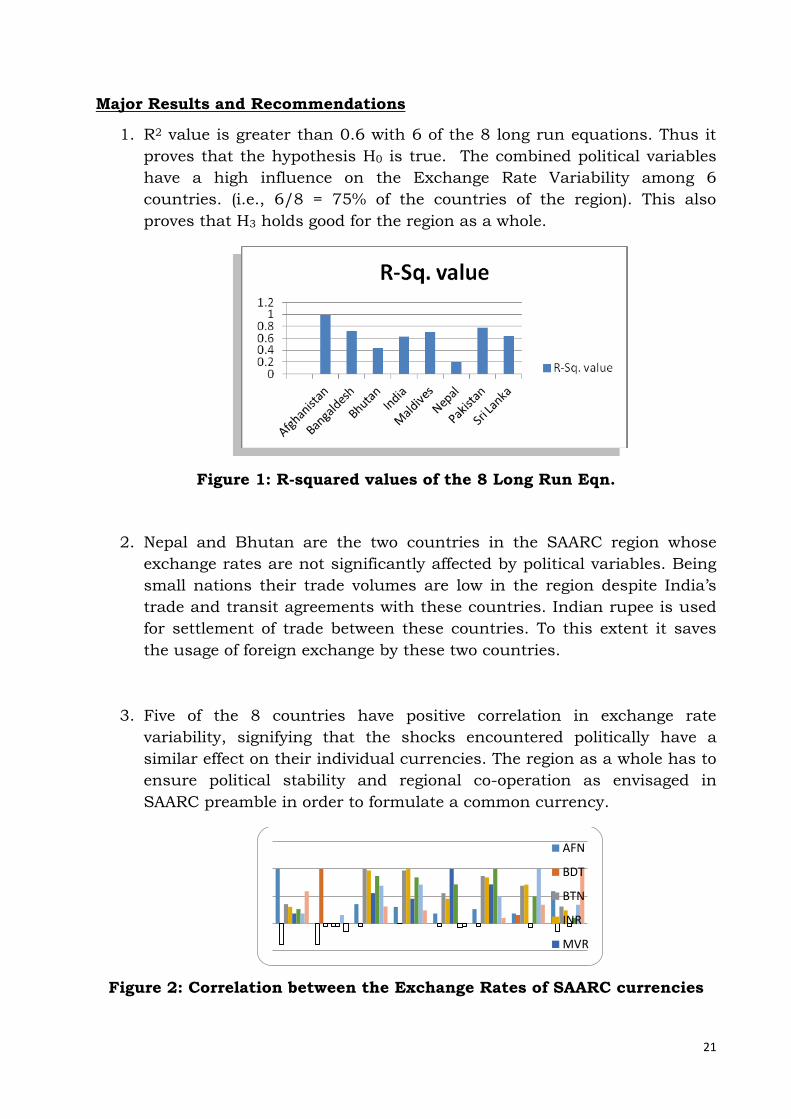
Major Results and Recommendations
1. R2 value is greater than 0.6 with 6 of the 8 long run equations. Thus it
proves that the hypothesis H0 is true. The combined political variables
have a high influence on the Exchange Rate Variability among 6
countries. (i.e., 6/8 = 75% of the countries of the region). This also
proves that H3 holds good for the region as a whole.
Figure 1: R-squared values of the 8 Long Run Eqn.
2. Nepal and Bhutan are the two countries in the SAARC region whose
exchange rates are not significantly affected by political variables. Being
small nations their trade volumes are low in the region despite India’s
trade and transit agreements with these countries. Indian rupee is used
for settlement of trade between these countries. To this extent it saves
the usage of foreign exchange by these two countries.
3. Five of the 8 countries have positive correlation in exchange rate
variability, signifying that the shocks encountered politically have a
similar effect on their individual currencies. The region as a whole has to
ensure political stability and regional co-operation as envisaged in
SAARC preamble in order to formulate a common currency.
Figure 2: Correlation between the Exchange Rates of SAARC currencies
AFN
BDT
BTN
INR
MVR

22
4. Major currencies of the SAARC region viz. INR, PKR, BDT, MVR and LKR
are not in correlation with each other; therefore, choosing any of the
existing currencies as a common currency may not be a viable solution.
5. It is advisable to introduce a new common currency say “SARC “(South
Asian Regional Currency) so that every country can give up its legacy
currency. The new currency will be legal tender in all the SAARC
countries. However existing contracts in the respective currencies will be
allowed to continue till its maturity.
6. A common Central Bank called SAARC Central Bank (SCB) can be
established on the lines of European Central Bank to print the common
currency and frame the common monetary policy for the SAARC region.
7. The common currency may also a freely floating currency against the
global currencies like US$, Euro, Japanese Yen ,British Pound etc in all
leading centers of the SAARC region.
8. The common currency (SARC) may be allowed to be quoted in Dubai,
Singapore markets where SAARC country population is sizeable .This
will help prevent Non-Deliverable Forward (NDF) market from growing
further in INR .
9. Since SAARC has only 8 members the common currency is feasible. But
political will to establish the same is required. India being the largest
country in this region can take the lead in both ways by convincing their
citizens as well as the neighboring countries.
Application or Implications
The authors opine that formation of Single Currency in SAARC region(OCA) is
feasible and the benefits outweigh the loss of monetary policy freedom. As
political variables exert great influence on the exchange rate of major countries
in SAARC region the nations require the will to establish Rule-of-Law.
Governments should promote – Effectiveness in administration and Control-
Corruption, ensure Regulatory-Quality & Political-Stability besides encouraging

23
Voice-and-Accountability. Needless to say these Governments ensure Absence-
of-Violence/Terrorism to make the common currency a reality. Furthermore,
SAARC countries have lot of lessons to learn from Euro Crisis for SAARC OCA.
The real test for the Euro has come now as euro zone experiences region wide
asymmetric shocks. Countries like Greece, Portugal & Spain are facing acute
debt repayment problems. A successful response to these shocks will require
wage, price and fiscal coordination among euro zone countries. The developed
countries like Germany & France expect more of fiscal discipline from these
debt ridden countries to bail them out. The implication is that SAARC region
will do well to avoid high indebtedness to ensure sustainability of the common
currency if and when established.
Future Scope
There is considerable scope for doing further research on the impact of various
political factors which influence exchange rate volatility. As the currencies of
the SAARC region are floating, supply and demand of foreign exchange can be
affected by political factors. Further studies will reveal the impact of politico-
economic factors in sustaining a common currency for the region.
24
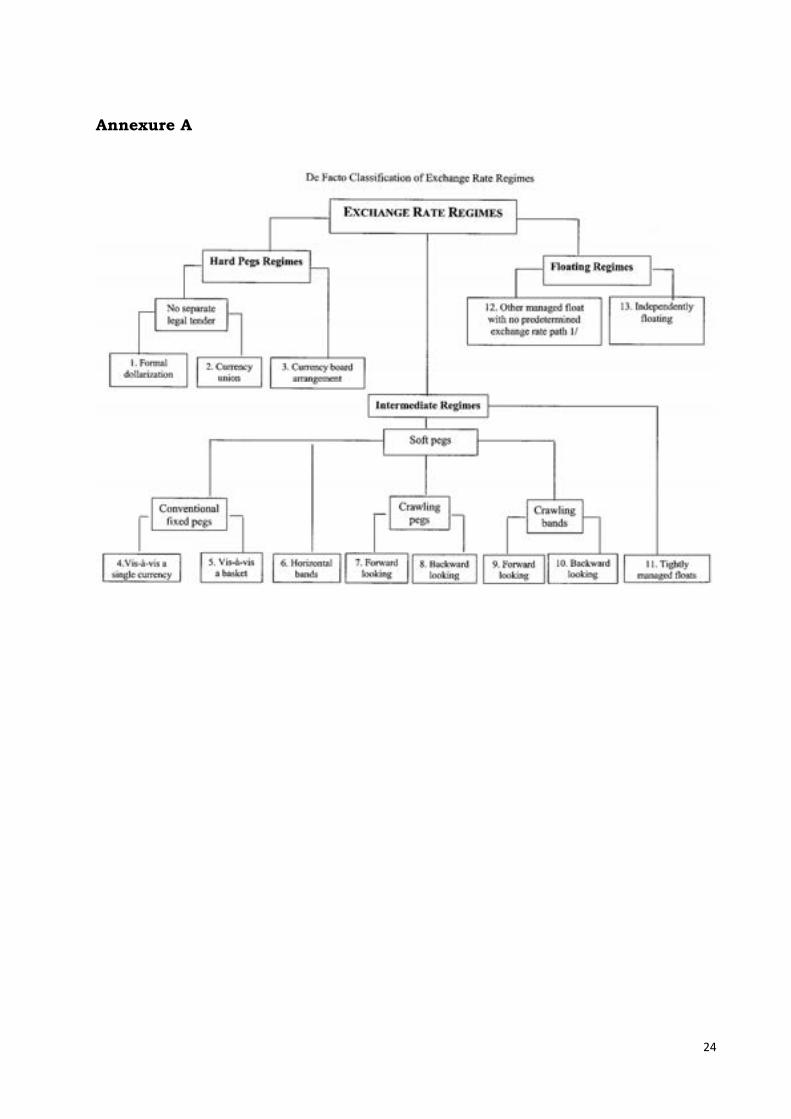
Annexure A

25
Annexure B
Table 2: Data of Afghanistan
Year Rule of
Law Govt.
Effectiveness Control of Corruption
Regulatory Quality
Political Stability
Voice and Accountability
AFN/USD as on
31st Dec
2000 -1.77 -2.32 -1.91 -2.19 -2.57 -1.98 4750
2001 -1.77 -2.15 -1.79 -2.11 -2.48 -1.88 4726.25
2002 -1.77 -1.64 -1.43 -1.87 -2.21 -1.57 4726.25
2003 -1.67 -1.18 -1.55 -1.49 -2.26 -1.28 42.79
2004 -1.71 -0.88 -1.42 -1.50 -2.30 -1.25 42.79
2005 -1.72 -1.23 -1.46 -1.65 -2.09 -1.18 42.11
2006 -1.96 -1.49 -1.44 -1.67 -2.23 -1.19 49.8
2007 -1.92 -1.40 -1.59 -1.68 -2.40 -1.12 49.57
2008 -1.95 -1.48 -1.64 -1.60 -2.69 -1.24 51.93
2009 -1.91 -1.50 -1.51 -1.67 -2.70 -1.46 49.04
2010 -1.90 -1.47 -1.62 -1.53 -2.55 -1.48 45.66
2011 -1.93 -1.46 -1.55 -1.54 -2.48 -1.41 48.2
2012 -1.72 -1.40 -1.41 -1.21 -2.42 -1.32
51.8
Table 3: Data of Bangladesh
Year Rule of
Law Govt.
Effectiveness Control of Corruption
Regulatory Quality
Political Stability
Voice and Accountability
BDT/USD as on
31st Dec
2000 -0.95 -0.56 -0.94 -0.87 -0.77 -0.31 53.85
2001 -0.93 -0.60 -1.00 -0.91 -0.84 -0.37 54.69
2002 -0.90 -0.70 -1.18 -1.01 -1.08 -0.52 55.94
2003 -1.02 -0.71 -1.33 -0.92 -1.14 -0.63 57.01
2004 -1.00 -0.78 -1.49 -1.10 -1.38 -0.68 58.22
2005 -0.97 -0.86 -1.41 -1.03 -1.84 -0.60 66.20
2006 -0.89 -0.77 -1.42 -0.96 -1.48 -0.48 66.71
2007 -0.83 -0.68 -1.05 -0.91 -1.50 -0.54 67.10
2008 -0.76 -0.71 -1.02 -0.89 -1.48 -0.47 68.14
2009 -0.77 -0.79 -1.03 -0.85 -1.54 -0.30 84.14
2010 -0.79 -0.75 -1.02 -0.83 -1.40 -0.28 85.86
2011 -0.71 -0.76 -1.05 -0.80 -1.39 -0.32 89.96
2012 -0.91 -0.83 -0.87 -0.96 -1.35 -0.42 97.09

26
Table 4: Data of Bhutan
Year Rule of
Law
Govt. Effectivenes
s
Control of Corruptio
n
Regulatory Quality
Political Stabilit
y
Voice and Accountabilit
y
BTN/USD as on 31st Dec
2000 0.18 0.78 0.38 -0.37 0.41 -0.98 46.68
2001 0.16 0.77 0.43 -0.40 0.46 -1.04 48.05
2002 0.09 0.73 0.58 -0.47 0.60 -1.23 47.62
2003 0.23 0.38 0.75 -0.01 0.91 -1.19 45.25
2004 0.36 -0.14 0.62 -0.81 1.17 -0.92 45.25
2005 0.36 0.28 0.75 -0.43 1.30 -1.03 45.00
2006 0.26 0.18 0.66 -0.60 1.31 -1.01 44.32
2007 0.37 0.19 0.74 -0.73 0.62 -0.84 39.43
2008 0.37 0.22 0.77 -0.83 0.75 -0.56 48.24
2009 0.18 0.48 0.81 -1.10 0.82 -0.51 46.62
2010 0.12 0.57 0.82 -1.19 0.77 -0.46 44.87
2011 0.14 0.62 0.74 -1.18 0.86 -0.46 53.05
5
2012 0.19 0.48 0.82 -1.12 0.81 -0.32
54.81
Table 5: Data of India
Year Rule of
Law Govt.
Effectiveness Control of Corruption
Regulatory Quality
Political Stability
Voice and Accountability
INR/USD as on
31st Dec
2000 0.28 -0.14 -0.37 -0.16 -0.99 0.26 46.73
2001 0.20 -0.14 -0.40 -0.21 -1.05 0.28 48.27
2002 -0.04 -0.13 -0.50 -0.38 -1.24 0.36 48
2003 0.10 -0.07 -0.44 -0.36 -1.53 0.39 45.55
2004 0.04 -0.10 -0.41 -0.40 -1.22 0.38 43.67
2005 0.16 -0.08 -0.40 -0.24 -0.99 0.39 45.11
2006 0.19 -0.05 -0.30 -0.23 -1.06 0.42 44.11
2007 0.11 0.11 -0.42 -0.27 -1.15 0.43 39.42
2008 0.09 -0.03 -0.36 -0.36 -1.10 0.44 48.2
2009 0.02 -0.01 -0.48 -0.30 -1.33 0.45 46.4
2010 -0.04 0.02 -0.51 -0.37 -1.23 0.43 45.7
2011 -0.11 -0.01 -0.57 -0.33 -1.29 0.39 52.25
2012 -0.10 -0.18 -0.57 -0.47 -1.25 0.35
54.45
27
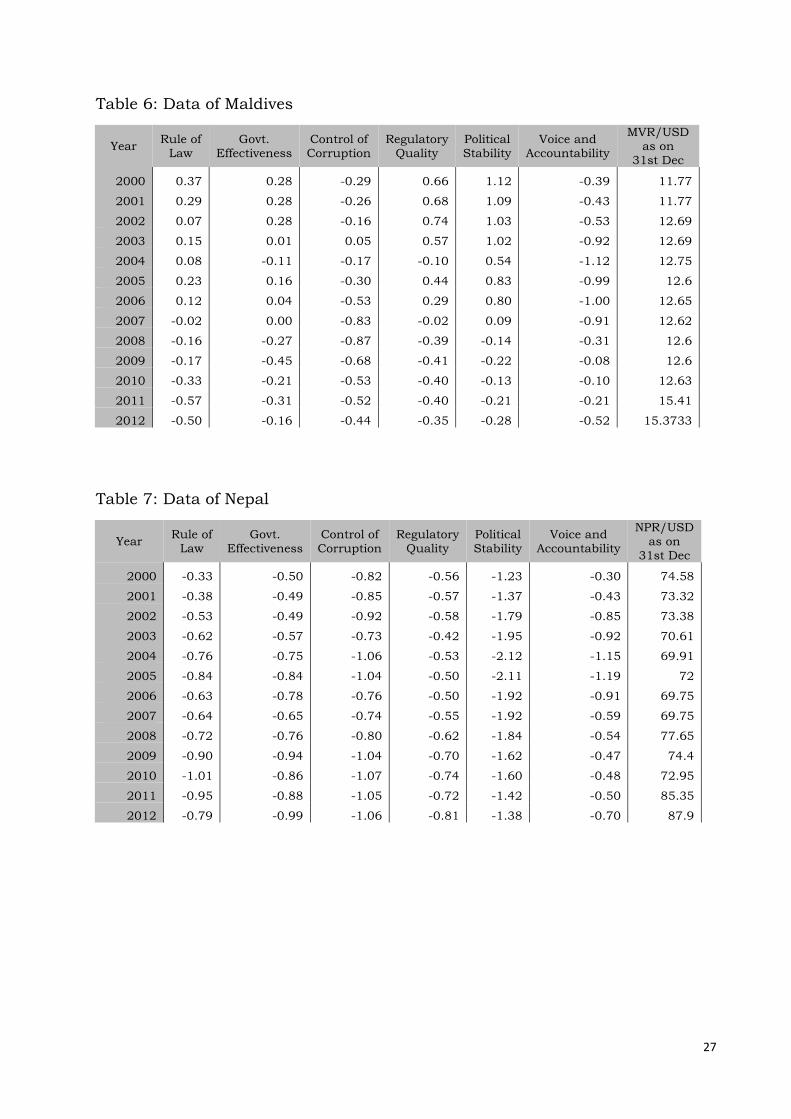
Table 6: Data of Maldives
Year Rule of
Law Govt.
Effectiveness Control of Corruption
Regulatory Quality
Political Stability
Voice and Accountability
MVR/USD as on
31st Dec
2000 0.37 0.28 -0.29 0.66 1.12 -0.39 11.77
2001 0.29 0.28 -0.26 0.68 1.09 -0.43 11.77
2002 0.07 0.28 -0.16 0.74 1.03 -0.53 12.69
2003 0.15 0.01 0.05 0.57 1.02 -0.92 12.69
2004 0.08 -0.11 -0.17 -0.10 0.54 -1.12 12.75
2005 0.23 0.16 -0.30 0.44 0.83 -0.99 12.6
2006 0.12 0.04 -0.53 0.29 0.80 -1.00 12.65
2007 -0.02 0.00 -0.83 -0.02 0.09 -0.91 12.62
2008 -0.16 -0.27 -0.87 -0.39 -0.14 -0.31 12.6
2009 -0.17 -0.45 -0.68 -0.41 -0.22 -0.08 12.6
2010 -0.33 -0.21 -0.53 -0.40 -0.13 -0.10 12.63
2011 -0.57 -0.31 -0.52 -0.40 -0.21 -0.21 15.41
2012 -0.50 -0.16 -0.44 -0.35 -0.28 -0.52
15.3733
Table 7: Data of Nepal
Year Rule of
Law Govt.
Effectiveness Control of Corruption
Regulatory Quality
Political Stability
Voice and Accountability
NPR/USD as on
31st Dec
2000 -0.33 -0.50 -0.82 -0.56 -1.23 -0.30 74.58
2001 -0.38 -0.49 -0.85 -0.57 -1.37 -0.43 73.32
2002 -0.53 -0.49 -0.92 -0.58 -1.79 -0.85 73.38
2003 -0.62 -0.57 -0.73 -0.42 -1.95 -0.92 70.61
2004 -0.76 -0.75 -1.06 -0.53 -2.12 -1.15 69.91
2005 -0.84 -0.84 -1.04 -0.50 -2.11 -1.19 72
2006 -0.63 -0.78 -0.76 -0.50 -1.92 -0.91 69.75
2007 -0.64 -0.65 -0.74 -0.55 -1.92 -0.59 69.75
2008 -0.72 -0.76 -0.80 -0.62 -1.84 -0.54 77.65
2009 -0.90 -0.94 -1.04 -0.70 -1.62 -0.47 74.4
2010 -1.01 -0.86 -1.07 -0.74 -1.60 -0.48 72.95
2011 -0.95 -0.88 -1.05 -0.72 -1.42 -0.50 85.35
2012 -0.79 -0.99 -1.06 -0.81 -1.38 -0.70
87.9

28
Table 8: Data of Pakistan
Year Rule of
Law Govt.
Effectiveness Control of Corruption
Regulatory Quality
Political Stability
Voice and Accountability
PKR/USD as on
31st Dec
2000 -0.95 -0.58 -0.82 -0.73 -1.14 -1.32 58.14
2001 -0.90 -0.53 -0.85 -0.75 -1.28 -1.29 59.88
2002 -0.75 -0.39 -0.92 -0.79 -1.70 -1.22 58.14
2003 -0.73 -0.39 -0.73 -0.73 -1.58 -1.26 57.47
2004 -0.83 -0.45 -1.06 -0.88 -1.56 -1.23 59.49
2005 -0.88 -0.42 -1.04 -0.61 -1.76 -1.06 59.65
2006 -0.84 -0.37 -0.76 -0.45 -2.04 -0.90 60.95
2007 -0.88 -0.46 -0.74 -0.50 -2.43 -0.97 61.38
2008 -0.98 -0.70 -0.80 -0.57 -2.57 -0.87 78.75
2009 -0.84 -0.78 -1.04 -0.55 -2.63 -0.90 84.2
2010 -0.74 -0.76 -1.07 -0.58 -2.67 -0.84 85.7
2011 -0.91 -0.81 -1.05 -0.63 -2.81 -0.85 89.16
2012 -0.91 -0.79 -1.06 -0.73 -2.68 -0.87
97.18
Table 9: Data of Sri Lanka
Year Rule of
Law Govt.
Effectiveness Control of Corruption
Regulatory Quality
Political Stability
Voice and Accountability
LKR/USD as on
31st Dec
2000 0.17 -0.35 -0.26 0.25 -1.93 -0.27 82.65
2001 0.21 -0.28 -0.26 0.23 -1.66 -0.24 92.73
2002 0.32 -0.06 -0.24 0.18 -0.85 -0.15 96.45
2003 0.24 -0.20 -0.26 0.10 -0.88 -0.12 96.26
2004 0.20 -0.40 -0.14 -0.04 -1.06 -0.19 104.6
2005 0.15 -0.29 -0.37 -0.35 -1.19 -0.21 102.08
2006 0.19 -0.18 -0.18 -0.25 -1.43 -0.30 107.31
2007 0.14 -0.09 -0.10 -0.26 -1.74 -0.43 108.35
2008 0.00 -0.12 -0.19 -0.35 -1.80 -0.46 113.73
2009 -0.07 -0.12 -0.37 -0.26 -1.35 -0.49 114.35
2010 -0.08 -0.18 -0.40 -0.20 -0.92 -0.52 111.35
2011 -0.07 -0.10 -0.37 -0.11 -0.70 -0.56 113.85
2012 -0.11 -0.24 -0.24 -0.12 -0.71 -0.60
127.5

29
Annexure C
Source: http://www.voxeu.org/article/conflict-and-development-lessons-
south-asia

30
References
Anup Chowdhury, Suman Paul Chowdhury and Shamim Ehsanul Haque
(2008). Prospects and possibilities of Introducing a Common Currency in SAARC Countries, BRAC University Journal, volume V, number 2, 2008,
pp. 67-79 http://dspace.bracu.ac.bd/bitstream/handle/10361/434/Anup.Chowd
hury.pdf?sequence=1
Chee-Wooi Hooy and Chee-Keong Choong (2010). Export Demand within
SAARC members: Does exchange rate volatility matter? Int. Journal of Economics and Management 4(2): 373 – 390 (2010) ISSN 1823 - 836X
http://econ.upm.edu.my/ijem/vol4no2/bab10.pdf Currency Exchange Rates were retrieved from
http://exchangerateweb.com/others/historical-rates.php? Ejaz Ghani and Lakshmi Iyer (2010). Conflict and Development – Lessons from
South - Asia. Economic Premise, World Bank, September 2010, Number 31
http://siteresources.worldbank.org/INTPREMNET/Resources/EP31.pdf
Hiroyuki Taguchi (2010). Feasibility of Currency Unions in Asia ― An Assessment Using Generalized Purchasing Power Parity, Policy Research
Institute, Ministry of Finance, Japan, Public Policy Review, Vol.6, No.5, June 2010 http://www.mof.go.jp/english/pri/publication/pp_review/ppr011/ppr0
11e.pdf
Md. Abdur Rahman Forhad (2013, 31 July). Single currency in SAARC countries
not feasible, The Financial Express. Retrieved from
http://www.thefinancialexpress-
bd.com/print.php?ref=MjBfMDdfMzFfMTNfMV8yN18xNzg0Mjk=
Priyanka Kher (2012). Political Economy of Regional Integration in South Asia., UNCTAD, BACKGROUND PAPER NO. RVC 5 http://unctad.org/en/PublicationsLibrary/ecidc2013misc1_bp5.pdf
Rodan, G. (Ed.). (2013). Political Oppositions in Industrializing Asia. Routledge.
http://books.google.co.in/books?hl=en&lr=&id=LV1h3D4HpD8C&oi=fnd
&pg=PP4&dq=Political+Oppositions+in+Industrializing+Asia&ots=eGBaHO2Q-
w&sig=LCEhRPKZ3AeDIpoM5CGFVduhhUY#v=onepage&q=Political%20Opposi
tions%20in%20Industrializing%20Asia&f=false

31
T. Gopinath (2005). A Common Currency for SAARC: Is it feasible or a pipe
dream?, The IUP Journal of Applied Economics
http://socionet.ru/publication.xml?h=repec:icf:icfjae:v:01:y:2005:i:2:p:8
0-98&l=en
Tajul Ariffin Masron and Zulkornain Yusop (2006). Optimum Currency Area Criteria and
Volatility in ASEAN, AAMJAF, Vol. 2, No. 2, 1–17, 2006
http://web.usm.my/journal/aamjaf/vol%202-2/2-2-1.pdf
Tanja Broz (2005). The Theory of Optimum Currency Areas: A Literature
Review Privredna
kretanja i ekonomska politika 104 / 2005. ekonomska politika 104 /
2005.
http://www.researchgate.net/publication/242399243_2_The_Theory_of_
Optimum_Currency_Areas_A_Literature_Review WGI parameters were retrieved from
http://info.worldbank.org/governance/wgi/index.aspx#home

32
A Roadmap to Regional Integration: Micro-financing Clean Energy for Sustainable Livelihoods across Asia
Sneha Srinivasan and Syed A A Farhan
Jindal School of International Affairs, O.P. Jindal Global University, Haryana, India
Abstract
Sustainable livelihood is an integrated and a people-centric approach to
poverty eradication. Sustainable Livelihood extends beyond the conventional
perspective and was first introduced by the Brundtland Commission on
Environment and Development and was further expanded by the 1992 United
Nations Conference on Environment and Development. The Conference
advocated for the achievement of sustainable livelihoods as a broad goal for
poverty eradication and as means of addressing the hitherto unexplored ideas
of vulnerability and social exclusion. Sustainable livelihood is considered as a
proposal to improve the abilities of poor people to attain a living that is
economically, socially, and ecologically sustainable. Funding clean energy
projects addresses the many issues underlined within the framework of
sustainable livelihood.
Climate change is an unequivocal reality according to the Intergovernmental
Panel on Climate Change. Rapid development, consumption of resources and
creation of waste is leading to a much polluted world. The Human
Development Report (1994) has included environment as a part of human
security. Climate change accelerated by carbon emissions and ozone layer
depletion spells very disturbing future scenarios. Ecosystems are being
destroyed due to rapid industrialization and man-made environmental
disasters. Environmental policies and green ways of development are being
implemented across the world. It has been well established that sustainable

33
development can birth from environmental friendly projects. This forms the
essence for building or promoting green energy.
Energy is the most essential input for powering development. Availability of
energy accelerates not only the agricultural, industrial and business sector but
also enhances the quality of human life. Lack of energy makes rural
electrification impossible leading to stagnation of growth and further
marginalization of the rural poor. The energy demand-pulls from business
requirements and domestic needs compel the use of non-renewable source of
energy at an alarmingly increasing rate causing depletion of resources as well
as environmental degradation. Development has to be sustainable i.e., the
aspirations of development should not compromise on the needs of the future.
Hence, there is a greater onus on the clean and renewable sources of energy to
provide power and contribute to the alleviation of poverty. The central feature
of renewable sources of energy is the initial establishment costs. These costs
are one-time and the benefits reaped from such investments are aplenty.
Investments in clean energy can aid in development which will help in
achieving sustainable livelihoods for the poor.
Asia is fast growing and its demands for energy are ever increasing. The ever
growing demand cannot be met only by the depleting nonrenewable sources of
energy. The charge of powering emerging economies in Asia then falls on clean
and renewable sources of energy. The underlying characteristics of many Asian
countries are concentration of population in rural areas, poor infrastructure,
and low-incomes. These characteristics spawn investors to consider
implementation of businesses in rural regions as a venture of high risk and low
profit investment. So it becomes crucial to first improve the infrastructure for
power in rural regions to boost income. This can be achieved by targeted
lending of microcredit and designing financial instruments for the purposes of
setting up clean energy and addressing the capital needs of business sector
and end-users and the requirements of impact investment.
34
ASEAN as such lags behind in reaching its full potential compared to other
regional institutions. The reason for lack of economic integration is the focus
on the bilateral trade deals or Free Trade Agreements. These are inadequate in
dealing with cross regional trade issues. Moreover these are driven by
geopolitical alignment of the countries. The solution then lies in a streamlined
trade agreement that involves a program for regional economic integration and
cooperation. This would help achieve the idea of an ASEAN Economic
Community. The main object of such integration would aid in bringing about
frameworks that stimulate micro-financing of clean energy projects thereby
creating sustainable livelihoods across ASEAN.
This paper will first establish the idea of how energy inclusion and financial
inclusion are mutually constitutive and then emphasize how microfinance
could complement such development. Finally, the paper shall propose a
framework for Asian integration in the field of micro-financing of green energy
for sustainable livelihoods. It will suggest an alternative to free trade
agreements in the region. Upgrading previous trade agreements in this field
could act as a stepping stone for a mega-regional cooperation for sustainable
development for all. It could be a significant revolution in global trading system
ultimately producing a conducive environment to promote sustainable
livelihoods across Asia.
Key Words
Micro-finance, Clean Energy, Sustainable Livelihood, Emerging Economies,
Regional Integration
35
Introduction
The smartest way to live in the present is the sustainable way. Sustainability
has become a constant and truistic refrain that calls for fulfilling the present
and future needs. Sustainable needs are not only associated with
environmental factors but also with temporal, spatial, economic, social and
political factors. This multidimensionality provides proof of its importance.
Sustainability has become bigger than just survival. It sows and germinates
the seeds of change in the way lives are led in the present and the future. The
future of an emerging and resilient Asia depends upon the extent to which
Asia’s meteoric rise is sustainable. Asia’s emerging economies are, by far,
highly agrarian, and population is concentrated in rural areas. Hence, it
becomes rational, beneficial and manageable to indoctrinate the concept of
sustainability in development models. One such model is micro financing clean
energy for sustainable livelihoods. This paper will extensively look at this
development model and attempt to provide a link between this model and
regional integration in Asia. It is intrinsically assumed that regional integration
provides for positive coexistence, unity and peace. The vision is not to advocate
a sporadic rise of Asia that is short lived, but to promote a sustainable Asia.
This vision is riddled with its own naysayers but as Jeffrey D. Sachs puts it,
“[the] energy and daring is to resist noes, until the final yes has been
achieved.”
The paper is divided into two halves. The first half of the paper will deal with
the concepts of microfinance, green energy, and sustainable livelihoods and
give basic outlines of the ideas contained within them. The second half of the
paper will focus on regional integration in Asia and attempt to come up with a
futuristic framework to create a roadmap for the same through micro financing
clean energy for sustainable livelihoods.

36
Part 1: Micro-financing Clean Energy for Sustainable Livelihoods.
Microfinance: “Little drops of water make the mighty ocean.” - Julia Carney
The birth of microfinance is from the idea that the poor are financially
excluded and that such exclusion will not assist in achieving the first of the
eight millennium development goals of the United Nations Development
Programme (UNDP) which is to eradicate extreme poverty. Microfinance, once
associated exclusively with small value loans to poor, is now used to refer to a
broad array of products (including payments, savings and insurance) tailored
to meet the needs of the low-income individuals. Microfinance believes in the
creditworthiness of the poor and in the ability of the poor to run business
viably, build assets, generate income and manage risks (Yunus, 2007). At the
micro level, microfinance provides access to finance to the poor households
and helps them in building assets, income generation, smooth consumption,
and risk management. At the policy level, decision-makers have realized the
effectiveness and efficiency of an inclusive financial system in execution of
social policies. At the macro level, a deeper financial intervention in the
economy leads to more growth and less inequality.
Traditionally, the poor had to use the informal financial sector like the
moneylenders, to fulfill their financial needs. Their vulnerability and urgent
financial needs presses them to accept exploitative methods employed by the
usurious moneylenders who charge exorbitant rates of interest, further
exacerbating their condition. Thus the poor are in a constant and vicious cycle
of poverty. Micro-financing institutionalizes the financial sector for the poor by
giving them access to finance through the formal sectors (commercial banks)
thus protecting them from the exploitive moneylenders and providing them
with the chance to escape the cycle of poverty.
37
Clean Energy: “In the long run, we are all dead” - John M. Keynes
Clean energy is an ambiguous term. With no agreed definition, it is often
confused with nuclear energy or natural gas. Clean energy refers to the heat
and electricity produced from renewable sources such as wind, sun, water,
biomass etc. resulting in little or no pollution. The need for clean energy
resides in understanding the alarming situation of the global environment and
the greater economic benefits in terms of long term profitability and
sustainability.
The state of current environment beseeches for implementing clean modes of
energy as exploitation of natural resources at current rates will deplete them
within 50 years. Rapid development, consumption of resources and creation of
waste is leading to a polluted world. Pollution is identified as the root cause of
ozone depletion and climate change which is “an unequivocal reality”
(Intergovernmental Panel on Climate Change). Ecosystems are being destroyed
due to rapid industrialization and man-made environmental disasters. The
IPCC summary states that sustained global warming would lead to the near-
complete loss of the Greenland ice sheet, increase the prevalence of droughts
in the Mediterranean and West Africa. Our common future looks bleak and
presents a highly disturbing picture. There is urgency to control the current
rates of global warming as further warming will worsen the control process. To
ameliorate the current situation, the UN and its agencies have been
introducing various programs to promote conservation of the environment. The
Human Development Report (1994) included environment as part of human
security. The need to cut emissions is imperative as the long terms
implications of rising temperature do not decline for at least a thousand years
(Solomon et al, 2009), impacting future generations. The extent of future
degradation depends on shifting to a development curve that is clean and
sustainable. Even if environmental aspects are not considered, mankind’s
dependence on a finite resource to meet its energy needs is not economical.
Alternative modes of energy are important for any developing country as part of
an intelligent energy policy. Fossil fuels are finite and shortage of supply of
38
these resources will be faced. Developmental demands are increasing
exponentially driving up fuel prices. It is highly pragmatic and economical to
shift to renewable resources to meet the surging energy needs and demands.
The transition will have to take place, either on states’ own terms or forced due
to necessity.
Sustainable Livelihoods: Does micro-financing clean energy create sustainable
livelihoods?
Sustainable livelihoods (SL) was introduced in the 1987 Report titled Our
Common Future also popularly known as the Brundtland Report. SL is a
people centric approach that provides a holistic yet flexible framework for
understanding, measuring and analyzing poverty. It is an integrated
development method targeting sustainable development. It focuses and builds
on people’s perceived strengths and opportunities and not on their problems
and needs. Such focus directs priority in not just identifying the lack of assets
of the poor but also what assets they own which helps in setting up
interventions based on both capacities and needs. By addressing the
constraints and taking advantage of the opportunities, SL builds on everyday
realities and supports poor people in their pursuit of sustainable livelihoods.
The essence of SL is to bring sustainability to poverty reduction.
Many instances all over the world prove that micro-financing clean energy
solutions does in fact create sustainable livelihoods (Yunus, 2007). The base of
any business in the rural areas is power and electricity and it is a known fact
that the labor force in the economies of Asia are entrenched in the rural areas.
Additionally, many of the rural areas are off the grid which implies that the
major proportion of the rural workforce remain idle and thus poor.
Advantageously, the rural areas are endowed with renewable resources which
can be harnessed effectively and efficiently. Investment in renewable energy
sources is one-time and the benefits reaped are sustainably long-lasting.
Microfinancing clean energy solutions for sustainable livelihoods can be done
in two ways: either, microfinance the vendor providing the renewable energy

39
solutions/products or, the vendor himself offers the solutions/products to the
customers on micro-credit. Another method identified is micro-franchising
whereby the small business can be easily replicated by following proven
marketing and operational concepts. Whatever may be the method, the result
is creation of livelihoods that are sustainable.
The benefits of microfinancing clean energy for sustainable livelihoods are
multidimensional. At the micro level, it provides the consumer choices. Usually
when a person requires energy or electricity, they purchase it from the
government as everyone can’t own a thermal power plant. On the other hand,
clean energy uses renewable sources such as sun, wind, water etc. that can
impart choice to the individual. It proves to be a successful business model
that provides returns which can be used to pay off the credit taken to set up
the business. At the macro level, considerable development in the rural
economy would be witnessed which will contribute to the overall development
of the economy where many environment, social and economic evils are
mitigated. Environmentally, clean energy will reduce the pressure on the non-
renewable sources of energy and will help in pollution control. Socially,
livelihoods based on clean energy will curtail migration and its effects like
urbanization, crowding of cities etc.; help in generating employment
opportunities; reduce poverty; and have health benefits (clean energy does not
harm the health of both the direct and indirect consumers). Economically,
optimum utilization of resources is achieved. The delinking of energy needs
from the national government leads to economic stability, as they don’t rely on
fluctuating prices or shortages due to external factors. Also energy rates aren’t
dependent on unstable foreign markets (e.g. oil market). To illustrate, creation
of wind farms in rural areas has the ability to fulfill a substantive percentage of
energy requirements. Barring the unfavorable aspect of intermittence of wind,
it has a huge return on investment. A one-time investment leads to an endless
renewable power resource thereby generating rural livelihoods that are
profitable and sustainable. The savings earned by shifting to clean energy
encourages promotion of clean energy.

40
The environmental, social and economic benefits that tag along with clean
energy, complement the need and linkage of microfinance to it. Microfinancing
clean energy in the rural community has the capacity to act as a catalyst to
provide energy as well as means for creating sustainable livelihoods to
eradicate poverty.
The Asia Picture:
Countries in Asia are developing at unprecedented rates and such development
is heavily propelled by tremendous amount of power. With the non-renewable
sources of energy causing pollution and at the same time undergoing
depletion, the onus rests on the renewable energy to step up and drive the
power-hungry emerging economies of the orient. Clean energy sources are
constantly supplied by nature, facilitating easy accessibility to clean energy
sources and thus aids in energy inclusion of every square inch of the world.
However, the investments in technologies harnessing the clean energy is yet to
gain popularity. With easier movement of capital across borders, it is rational
to expect financial inclusion to address the financing of clean energy for
sustainable livelihoods. Asia with its rich natural endowments can definitely
benefit from harnessing the clean energy sources to power its development
strategies that are not only viable but also highly sustainable.
Energy and finance are mutually constitutive, (Figure 1) especially in the Asia
region as without energy, business cannot run and without finance, producing
energy is an impossible task. With both developmental and environmental
concerns gaining seriousness and urgency, the only option available is clean
energy. Financial and energy inclusion of rural Asia necessitates the
availability of microfinance for clean energy. Micro financing clean energy apart
from creating sustainable livelihoods, helps in decentralizing and de-
monopolizing the power sector in many countries. The right to have power
rests with the consumers themselves and is not dependent on the public sector
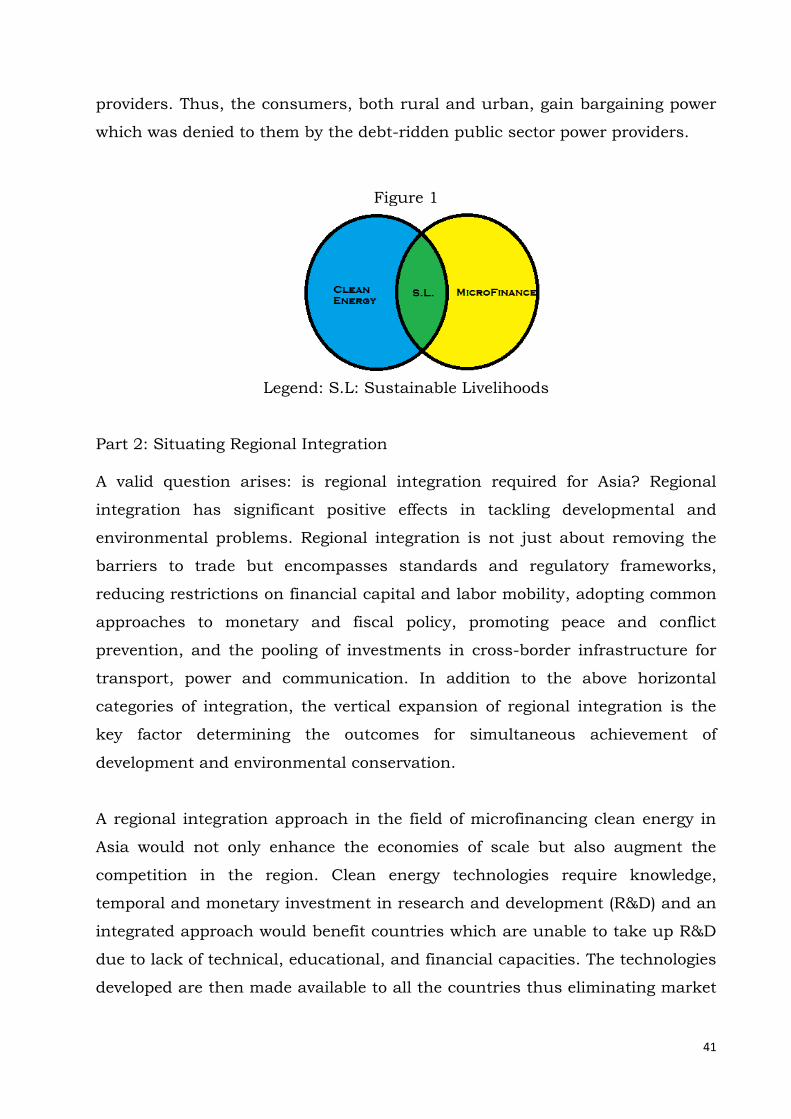
41
providers. Thus, the consumers, both rural and urban, gain bargaining power
which was denied to them by the debt-ridden public sector power providers.
Figure 1
Legend: S.L: Sustainable Livelihoods
Part 2: Situating Regional Integration
A valid question arises: is regional integration required for Asia? Regional
integration has significant positive effects in tackling developmental and
environmental problems. Regional integration is not just about removing the
barriers to trade but encompasses standards and regulatory frameworks,
reducing restrictions on financial capital and labor mobility, adopting common
approaches to monetary and fiscal policy, promoting peace and conflict
prevention, and the pooling of investments in cross-border infrastructure for
transport, power and communication. In addition to the above horizontal
categories of integration, the vertical expansion of regional integration is the
key factor determining the outcomes for simultaneous achievement of
development and environmental conservation.
A regional integration approach in the field of microfinancing clean energy in
Asia would not only enhance the economies of scale but also augment the
competition in the region. Clean energy technologies require knowledge,
temporal and monetary investment in research and development (R&D) and an
integrated approach would benefit countries which are unable to take up R&D
due to lack of technical, educational, and financial capacities. The technologies
developed are then made available to all the countries thus eliminating market
42
discriminatory practices in the region. There is a greater degree of market
organization and optimum resource allocation. Such are the economic benefits.
The non-economic benefits are not any less either. The countries in the region
are able to tackle common problems like environmental degradation through a
collective approach to arrive at a common action as solution. It further leads to
consensus building useful in regional political and security issues. Politically,
it also improves the collective bargaining power of the developing countries vis-
a-vis developed countries. With such positive effects of regional integration, the
Asian region would definitely benefit the developing countries to tackle both
development and environment issues.
Microfinancing clean energy is at present highly informal and requires
institutionalization at the regional level to cater to the special and tailored
requirements of the Asia region. The next section will deal with the approaches
to institutionalization of microfinancing clean energy.
Organization and Institutionalization of Clean Energy:
The organization and institutionalization of microfinance of clean energy for
sustainable livelihoods in Asia has been carried out through different
approaches. The approaches that are identified are given below:
1. Privatized Approach:
The private sector, either directly or indirectly, is involved in providing
microfinance for clean energy for sustainable livelihoods. Direct involvement
includes selling of clean energy solutions at micro-credit. Indirect
involvement mainly deals with micro-franchising where the franchiser sets
standards for the supplying the solutions at a fee to a franchisee. Though
there is a marked increase in popularity in the privatized approach the only
major drawback is the extent of operation which is considerably limited to
households, non-extension of the operation to the community as a whole and
the incapacity of the solutions to generate power for business and industrial
purposes.

43
2. Governmental Approach:
Governments across Asia recognize the need to promote clean energy for
sustainable livelihoods as demonstrated by India’s National Solar Mission.
This recognition is translated into action when governments introduce
different policies and programmes to stimulate investments in clean energy
especially in wind and solar energy. Unfortunately, these policies and
programmes are mired with delays and implementation bottlenecks.
Moreover, proper feedback mechanism is not in place as evidenced by the
technical glitches concerned with servicing, repairs and upgradation,
encountered after the set-up of large-scale clean energy farms. Corruption
practices of officials involved in the process of implementation create
accountability and responsibility issues. Another major drawback that can
be identified when large-scale farms are set up is the emphasis on power
distribution by the public utilities which foster monopolizing the power
distribution sector. Monopoly of power distribution creates inequalities and
thus does not help in promoting sustainable livelihoods. Such technical,
administrative and economic obstacles engender the futility of the whole
policy or programme.
3. Intergovernmental Approach:
The intergovernmental approach is further classified into bilateral,
multilateral and liberal-regional institutions. Each category is critically
discussed below.
[A] Bilateral Agreements
The Asian community comprises of various bilateral agreements. As
these are easier to negotiate and pursue, they are preferred over the
multilateral agreements. These agreements have formed a well-knit mesh
between nations. They justify an economic principle of interdependence
that drive trade and investment in the region. With the exception of their
primary appeal of being quick and easy, these fail in handling genuine
issues. Most of the bilateral agreements in Asia ignore important and
44
sensitive issues regarding environment, agriculture, sustainability etc.
Moreover, only a handful deal with trade-related measures. It is also
extremely difficult to judge the trade policy environment, even if they are
predicated on the notion of reducing barriers. Another major caveat of
bilateral agreements are that they are based on the selective choice of
trading partners and sectors to be liberalized in a preferential – that is,
discriminatory (WTO Annual Report 2001). Political hues color the
reason for establishing bilateral agreements sometimes and the
fundamental necessity is lost in the political hues. Bilateralism also
doesn’t work in issues like Climate Change where the transaction costs
are high. It is replete with skewed trade power, and powerful states use
bilateral bargaining to gain leverage over weaker counterparts (Gruber
(2000) and Guzman (1998) in Thompson and Verdier). There is also a
possibility of duplication where two bilateral treaties in the same region
between two different countries are working to solve a common global
issue. The overlaps and duplications create ineffectiveness in terms of
addressing a single issue. Finally, bilateral agreements in the field of
micro-financing green energy simply do not work as these are trade
diverting which worsens welfare. It should be remembered that only a
trade creating agreements lead to welfare improvisation.( Refer to note 1)
[B] Multilateral Agreements
Multilateral agreements are considered substantially better as the
responsibilities and risks are distributed among the nations and the
situation is more strategically and economically beneficial for individual
states. Especially on a global issue such as climate change, bilateral
agreements to promote green energy usage is of very little incentive.
Rather multilateral agreements are considered better to join in this
arena. Further, regional agreements are even more promising than
simple multilateralism. Regional multilateralism could act as a building
block to move towards a global economy. The phenomenon of EFTA
(European Free Trade Association) countries seeking to link with the
European Community and several South American trading agreements
45
wishing to join the NAFTA (North American Free Trade Agreement) shows
regionalism can expand membership to join the world economy.
Unfortunately, they also face their drawbacks in the Asian perspective as
there are high power asymmetries in the region. Deals sometimes favor
the biggest member at the expense of smaller nations. Power politics also
play a part in major international relations and in these agreements. In
ASEAN (Association of Southeast Asian Nations) or SAARC (South Asian
Association for Regional Cooperation) bargaining power is a direct
function of its economic size relative to the other countries (Melo and
Panagariya, 1995). Economically, it can also divide the world market into
competing trade blocs. Multilateralism isn’t very effective when the
transaction costs are low as it doesn’t provide much incentive. With
member surplus, it has high volatility in terms of free riding by small
nations under a multilateral bargain. Nations not joining the Kyoto
Protocol or ratifying it shows how multilateral regimes have a high
probability of exclusion. This free riding can also lead to countries
shirking their responsibilities and can create defection in some cases
among nation-states.
[C] Liberal-Regional Institutions: Asian Development Bank (ADB)
A regional bank for the purposes of promoting development in the Asian
region has identified the necessity to encourage clean energy for
sustainable livelihoods. The bank has further recognized the capacity of
microfinance in such ventures. The bank catalyzed by the donations
from the member countries faces snags as enumerated by Grainne
Ryder(2000) in his paper “Why Consumers and Citizens Should Pull the
Plug on the Asian Development Bank?” which clearly highlights the flaws
of the presence of ADB in the electricity sector. The debt ridden utilities
of ADB finance community and environment damaging projects. With
substantial amount of finance for power projects in Asia provide no
result as the utilities that are involved in producing, selling and
distributing power are knee deep in incompetence and corruption.
Further, these investments are not subject to market discipline and

46
public oversight thus denying accountability of donations of member
countries. Additionally, the investments are done without responsibility.
The absence of penalty on ADB further compounds the problem of
accountability. There is no leniency on the repayment of loans for a
failed project. The borrowers have to repay the loan for the project
irrespective of its success or failure. This places additional and sustained
burden on present and future taxpayers thus institutionalizing the cycle
of debt. Barring the minimum development projects the bank supports,
it unfortunately fosters monopoly of the public sector utilities over selling
and distribution of power and cronyism. On examining the recipients of
loans disbursed by ADB, it is found that most of the recipients are high
or middle income countries which have the ability to repay. This is highly
discriminatory and further deepens the rich-poor divide. With the extent
and degree of the problems of ADB in the electricity sector, we can
conclude that ADB does not provide solution to the energy crises but
exacerbates the problem further.
Preliminary Conclusions:
There is always a breadth-versus-depth dilemma between these two types of
arrangements. (Gilligan in Thompson and Verdier). As other authors have
suggested that the idea is not which is better: multilateralism or bilateralism,
but rather a more constructive answer to move beyond the fallacies of both.
The more productive solution then lies in thinking beyond the ADB, bilateral
and multilateral agreements. It lies in forming a more streamlined and
comprehensive framework which integrates economies and creates
development. It will help in implementing an idea for Asian connectivity. This
idea of micro liberal institutionalism could start a domino effect for even more
such regional cooperation leading to mutual development.

47
Theoretical Framework:
Institutions are autonomous agents in the international relations arena. The
costs to establish and sustain these institutions stimulate higher level of
welfare to signatories than the status quo. Institutions are established because
of the presence of transaction costs and information asymmetries. An
institution is created because agreements may be incomplete contracts and
because of a demand for an arbitrator or an honest broker. The institution is
often vested with substantial authority and given important responsibilities.
The failure of the Copenhagen Summit to produce a binding international
agreement shows that environmental issues require global solutions (King
2011). As the payoff structure and timeline of future scenarios is long, these
should be handled by an organization dedicated and designed specifically to
the cause. As liberal institutionalism explains, the reason for failure was
because the payoff structure was that of a Prisoners’ Dilemma, and because
the shadow of the future was short, making the existent Prisoners’ Dilemma
single-play in nature; a single-play game being the least cooperative type of
Prisoners’ Dilemma. So in effect, it is safe to summarize that for a model and
effective agreement the result should be an institution. Institutions also
mediate market formation and this would help in building roots for using
microfinance for sustainable development (Rankin, 2008). The unbounded
structure of an institution helps in creating an arena of ongoing debate over
culturally constructed meanings and practices of assemblage (Li, 2007). These
can be as local as possible because microfinance in Asia targets the rural
communities. The institution that is to be proposed will be in line with
functionalism. The establishment and sustenance of such institution should
be based on the common index of need and function for promoting
microfinance of clean energy for sustainable livelihoods. Functionalism-based
institutions encourages shared understandings of the common problem and
stimulates collective action as remedy which augments cooperation in the Asia
region. This form of integration is understood as transitional where instead of
nations, an organization promotes cooperation, organization and mobilization

48
from top to bottom. The development will be transcendental where it arises
from bottom to top.
A New Outlook:
With the approaches critically analyzed in the previous section, one major
observation crops up: the dichotomy of the private and that of the governments
(inter and intra). The private players including the NGOs are involved in the
distribution end and are not involved in the policy-making and investments
process at all. On the other hand, the government (inter and intra) are more
involved with the policy-making and investments that they are not able to
address the bottom-end problems. To tackle the problems faced, it is
imperative to integrate the private and the governmental players.
The private players have the capacities to bring with them
(1) Knowledge about the consumer demand,
(2) New clean technologies helping in supply of power which is provided by the
scientific community, and
(3) The necessary capital, in case of large private players.
(4) Non-governmental organizations bring their capabilities of networking and
identifying the non-economic and urgent energy needs.
All of the above together endorse competitive practices in the generation,
selling and distribution of clean power.
The governmental players have the capacities to
(1) Facilitate easy transfer of technology by reducing the tariffs on imports,
(2) Regulate the competition in the market to deter monopolistic practices,
(3) Provide tax benefits to private players involved in promoting clean energy
solutions
(4) Bring in cooperation in investments and implementation across borders
through agreements.
(5) Invest in research and development of clean energy technologies.
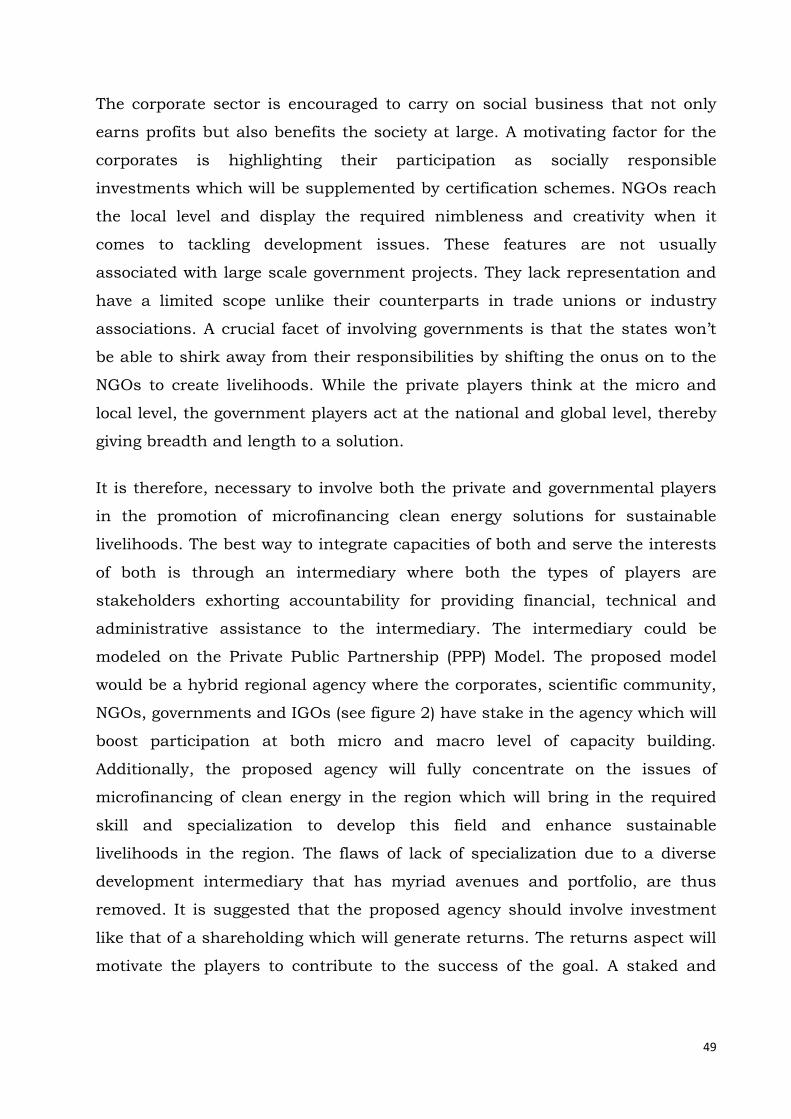
49
The corporate sector is encouraged to carry on social business that not only
earns profits but also benefits the society at large. A motivating factor for the
corporates is highlighting their participation as socially responsible
investments which will be supplemented by certification schemes. NGOs reach
the local level and display the required nimbleness and creativity when it
comes to tackling development issues. These features are not usually
associated with large scale government projects. They lack representation and
have a limited scope unlike their counterparts in trade unions or industry
associations. A crucial facet of involving governments is that the states won’t
be able to shirk away from their responsibilities by shifting the onus on to the
NGOs to create livelihoods. While the private players think at the micro and
local level, the government players act at the national and global level, thereby
giving breadth and length to a solution.
It is therefore, necessary to involve both the private and governmental players
in the promotion of microfinancing clean energy solutions for sustainable
livelihoods. The best way to integrate capacities of both and serve the interests
of both is through an intermediary where both the types of players are
stakeholders exhorting accountability for providing financial, technical and
administrative assistance to the intermediary. The intermediary could be
modeled on the Private Public Partnership (PPP) Model. The proposed model
would be a hybrid regional agency where the corporates, scientific community,
NGOs, governments and IGOs (see figure 2) have stake in the agency which will
boost participation at both micro and macro level of capacity building.
Additionally, the proposed agency will fully concentrate on the issues of
microfinancing of clean energy in the region which will bring in the required
skill and specialization to develop this field and enhance sustainable
livelihoods in the region. The flaws of lack of specialization due to a diverse
development intermediary that has myriad avenues and portfolio, are thus
removed. It is suggested that the proposed agency should involve investment
like that of a shareholding which will generate returns. The returns aspect will
motivate the players to contribute to the success of the goal. A staked and
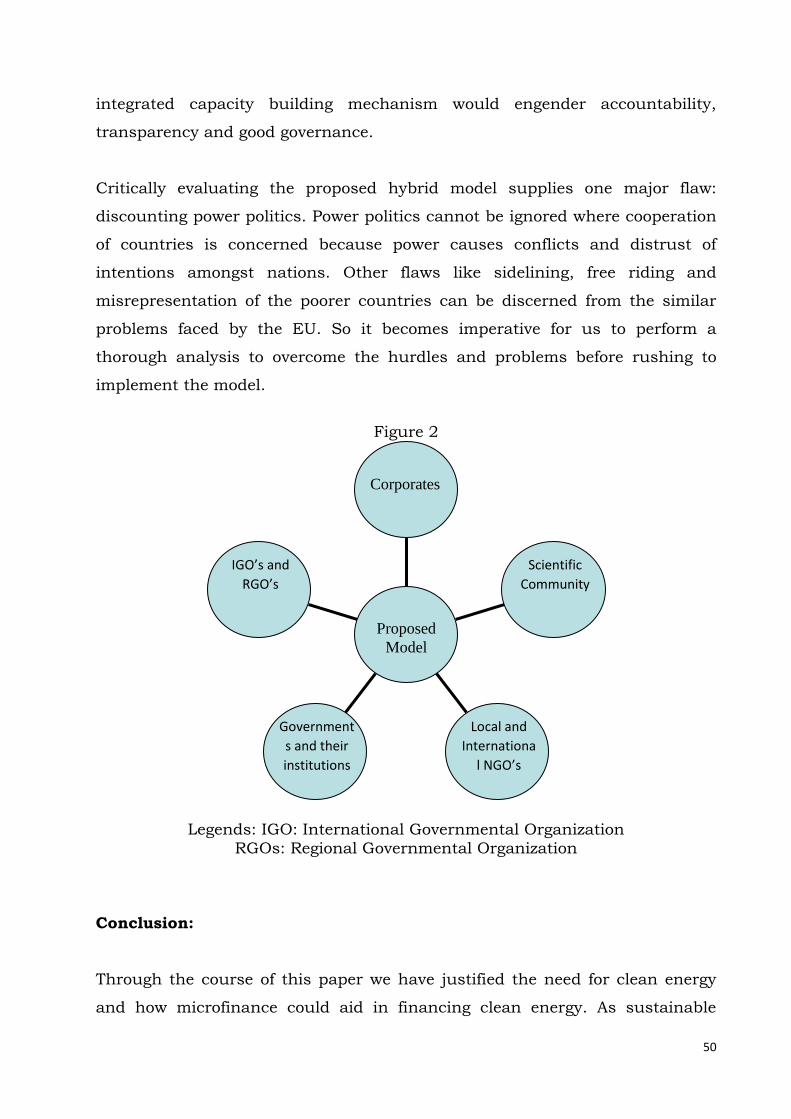
50
integrated capacity building mechanism would engender accountability,
transparency and good governance.
Critically evaluating the proposed hybrid model supplies one major flaw:
discounting power politics. Power politics cannot be ignored where cooperation
of countries is concerned because power causes conflicts and distrust of
intentions amongst nations. Other flaws like sidelining, free riding and
misrepresentation of the poorer countries can be discerned from the similar
problems faced by the EU. So it becomes imperative for us to perform a
thorough analysis to overcome the hurdles and problems before rushing to
implement the model.
Figure 2
Legends: IGO: International Governmental Organization
RGOs: Regional Governmental Organization
Conclusion:
Through the course of this paper we have justified the need for clean energy
and how microfinance could aid in financing clean energy. As sustainable
IGO’s and
RGO’s
Government
s and their
institutions
Local and
Internationa
l NGO’s
Scientific
Community
Corporates
Proposed
Model

51
livelihoods originate from the use of clean energy, it is also the most pragmatic
path to development. We have argued that issues concerning the environment
being global issues are better tackled through a regional grouping as it is more
economically viable. Moreover, we tried to explain that in Asia, a diverse
continent, integration and solving global problems should be done by an
institution rather than bilateral and multilateral agreements. As ADB has
failed to perform due to its detachment from the grass-root level, we finally
suggest that the solution lies in an institution solely dedicated to micro-
financing clean renewable energy solutions across Asia, integrating and
bringing them together in the process. We are aware there is no one solution.
We are proposing one of the possible solutions and not ‘the’ solution. There are
many ways of regional integration and the proposed model is one of the
roadmaps towards regional integration for a new, cohesive and developed Asia.
Notes: 1.To expand, Viner (1950) (and numerous economists from that
point forward) exhibited that while products from a partner country in a PTA
are shabbier and more abundant than under a more widespread Most Favored
Nation (MFN) tariff approach (what Viner (1950) called 'trade creation'), the in
general welfare profits are all the more, as is put, vague. This is on the grounds
that potential imports from countries outside the PTA are significantly more
unmanageable to the domesticated purchaser, bringing on a sharp drop in
exchange, what Viner (1950) called 'trade diversion', prompting a sharp drop in
welfare in the excluded countries.

52
References
Alexander Thompson, Daniel Verdier Multilateralism, Bilateralism and Regime Design, Department of Political Science, Ohio State University
Aprajita Singh, Green Microfinance (presentation), University of Pune.
Asia Productivity Organization Report, 2006, Regulatory Architecture for Microfinance in Asia, Asia Productivity Organization, Tokyo
Brad R. King, 2011, The Failure of Copenhagen: A Neo-Liberal Institutionalist Perspective, Mapping Politics, Volume 3.
ESCAP 2012, Growing Together: Economic Integration for an Inclusive and Sustainable Asia Pacific Century, United Nations Publications, Bangkok.
Jaime de Melo and Arvind Panagariya (Eds), 1995, New Dimensions in
Regional Integration, Cambridge University Press, UK Jacob Viner, 1950, The Customs Unions Issue, Oxford University Press, USA,
Chapter 4 Kate O’Neil, 2009, The Environment and International Relations, Cambridge
University Press, UK
Katharine N. Rankin, 2008, Manufacturing Rural Finance in Asia: Institutional Assemblages, Market Societies, Entrepreneurial Subjects, Volume 39, Issue 6, Pages 1965–1977
Kevin Byrne, 2006, The Future of External European Trade Policy-The Bilateralism vs. Multilateralism Debate, Student Economic Review, Volume
20, Page 155-163
Kola O. Odeku, 2013, The Use of Renewable Energy to Promote Sustainable Rural Livelihoods in the Remote Isolated Rural Areas, Journal of Human Ecology, Volume 43 Issue 2
Micro-energy International, Fair and Sustainable Energy Access for all,
http://microenergy-project.de/index.php?id=533 Muhammad Yunus with Allan Jolis, 2007, Banker to the Poor, Penguin Books,
New Delhi. Nagraj Adve, 2014, The IPCC’s Summary for Policymakers- A Comment,
Economic and Political Weekly, Volume XLIX, Issue 2.
Nicolas Sireau, 2011, Microfranchising: How Social Entrepreneurs are Building a Road to New Development, Greenleaf Publishing, UK.
53
Shalmali Guttal, Walden Bello, Jenina Joy Chavez-Malaluan, Grainne Ryder, et al, 2000, Creating Poverty: The ADB in Asia, Focus on the Global South
Solomon S et al, 2009, Irreversible Climate Change due to Carbon Dioxide
Emissions, Proceedings of the National Academy of Sciences, Pp 1704-09 Tania Murray Li, 2007, Practices of Assemblage and Community Forest
Management, Economy and Society, Volume 36 Issue 2, Pp.263–293. UNDP Team, April 2011, Regional Integration and Human Development: A
pathway for Africa, UNDP, USA
World Trade Report, 2007, Six Decades Of Multilateral Trade Cooperation: What Have We Learnt? , WTO, Geneva
WTO, 2001, Annual Report, WTO, Geneva, p.88
54
EXTERNAL SECTOR DEVELOPMENTS IN SELECT ASIAN
COUNTRIES DURING 2008-12: A COMPARATIVE STUDY*
By
Dr. Sharad Kumar4
Mr. Dinesh Rajput5
*Research is done under aegis of Remsons centre for Management Research at Durgadevi Saraf Institute of Management Studies, Mumbai
ABSTRACT
The impact of 2008 global crisis was minimal in Asian countries. The growth
rate of China and India remained significantly higher than the rest of the
world. The BRIC countries which predominantly include two major Asian
economies viz. China and India were expected to be the major economic powers
by 2050 as per the Goldman Sachs report of 2003. The BRIC thesis posits that
China and India will become the world's dominant suppliers of manufactured
goods and services, respectively. Goldman Sachs came in 2005 with another
group of potential fast growing economies, the so called Next Eleven or N11.
This group includes economies which can potentially become among the
biggest ones in the world. This also implies that they should be seen as
potentially great investment opportunities. Thus, these countries provide
greater opportunities to international investors which are driven by consistent
and stable economic performance of these countries despite the 2008 economic
crisis. The BRIC and N11 countries together hold over 4 million people
representing almost 70% of the world population implying that, should
current trends continue, they will represent a much bigger chunk of the world
economy. The present study is aiming at comparative analysis of the external
sector development of Asian countries included in BRI and N11 group during
post crises period i.e. from 2008 to 2012 viz Volume of Imports (% change),
Volume of Exports (% change), Current Account Balance (in US$ bn), Current
4 Officiating Director and Remsons Chair Professor for Management Research
5 Assistant Professor

55
Account Balance (as % of GDP), Foreign direct investment, External debt,
Nominal and Real Effective Exchange Rates, Reserves (as a ratio of annual
imports), etc. in respect of Asian countries included in BRIC and N11.
The analysis of data of Asian countries covered under BRIC and N11 during
2008 to 2012 confirmed that there was not any major setback faced by these
countries due the financial crises triggered by US subprime. There has been
some slowdown in the growth of both imports and exports during 2009 but the
recovery has taken place quickly in subsequent period. The analysis of current
account balances revealed that the current account balance of China remained
extremely high due to their high exports. Only India and Indonesia had shown
the current account deficit. India was always in deficit which significantly
increased year by year due to its high oil import bills. The level of current
account deficit (CAD) as a ratio of GDP for India has been a major concern
during 2011 and onwards despite of lower import growth. It may be observed
that except for China and Philippines, the currency of all other countries have
devaluated compared to US$. Pakistani currency has devaluated maximum.
The foreign exchange reserves for China remained extremely high due to their
high exports, which have been consistently growing. India and Korea were also
having significantly higher level of reserves compared to other countries.
Key Words: External Sector Developments, BRIC, N11, Imports, Exports,
Current Account Balances
Introduction
The Global Financial Crisis of 2008, triggered by the US housing bubble had a
devastating impact on western economy. This sub-prime crisis has also
resulted in global recession and contributed to the European sovereign-debt
crises. However, the impact of this global crisis was minimal in Asian
countries. The growth rate of China and India remained significantly higher
than the rest of the world. The BRIC countries (Brazil, Russia, India and
China) which predominantly include two major Asian economies viz. China and

56
India were expected to be the major economic powers by 2050 as per the
Goldman Sachs report of 2003. The BRIC thesis posits that China and India
will become the world's dominant suppliers of manufactured goods and
services, respectively. It is really unjustifiable to still call a country like China
as an emerging economy, which has emerged as the second biggest economy in
the world. Due to lower labour and production costs, many companies also cite
BRIC as a source of foreign expansion opportunity.
The group of the BRIC economies is quite known and the concept has been
successfully adopted by politicians, researchers and media. Goldman Sachs
came in 2005 with another group of potential fast growing economies, the so
called Next Eleven or N11. However, this N11 idea has had until now a harder
way to be generally adopted. This group includes majority of Asian countries
viz. Bangladesh, Indonesia, Iran, Pakistan, Philippines Vietnam and South
Korea, (and transcontinental country like Turkey). According to Jim O’Neill (the
same person who coined the term BRIC), this group includes economies which
can potentially become among the biggest ones in the world. This also implies
that they should be seen as potentially great investment opportunities. Thus,
these countries provide greater opportunities to international investors which
are driven by consistent and stable economic performance of these countries
despite the 2008 economic crisis. The BRIC and N11 countries together hold
over 4 million people representing almost 70% of the world population implying
that, should current trends continue, they will represent a much bigger chunk
of the world economy.
The Asian countries included in N11 group have an extremely diverse
composition. On one side, it includes advanced Asian economy like South
Korea and newly industrialized economies like Indonesia, Philippines and Iran
on the other it also includes the developing economies like Vietnam, Pakistan
and underdeveloped country like Bangladesh. Thus, it becomes interesting to
analyse the trends of external sector development variables of these Asian
countries post 2008 i.e post global crises in order to draw a comparison picture
of these countries and to see the future trends.
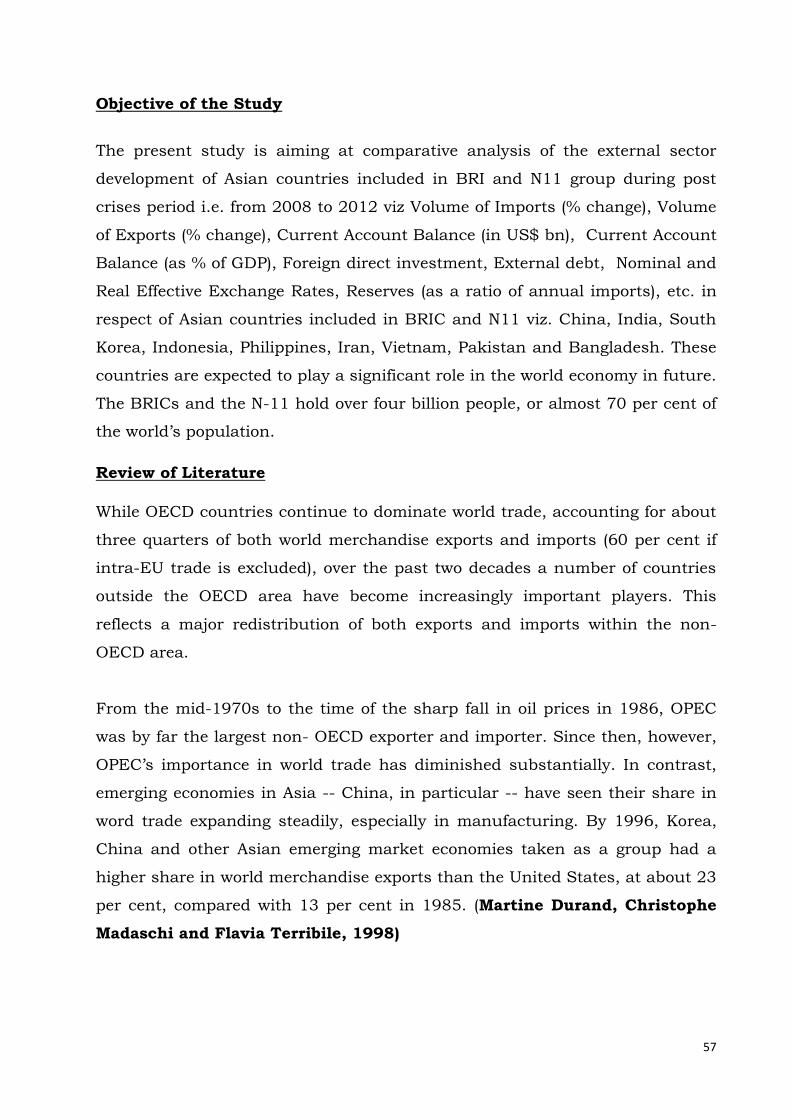
57
Objective of the Study
The present study is aiming at comparative analysis of the external sector
development of Asian countries included in BRI and N11 group during post
crises period i.e. from 2008 to 2012 viz Volume of Imports (% change), Volume
of Exports (% change), Current Account Balance (in US$ bn), Current Account
Balance (as % of GDP), Foreign direct investment, External debt, Nominal and
Real Effective Exchange Rates, Reserves (as a ratio of annual imports), etc. in
respect of Asian countries included in BRIC and N11 viz. China, India, South
Korea, Indonesia, Philippines, Iran, Vietnam, Pakistan and Bangladesh. These
countries are expected to play a significant role in the world economy in future.
The BRICs and the N-11 hold over four billion people, or almost 70 per cent of
the world’s population.
Review of Literature
While OECD countries continue to dominate world trade, accounting for about
three quarters of both world merchandise exports and imports (60 per cent if
intra-EU trade is excluded), over the past two decades a number of countries
outside the OECD area have become increasingly important players. This
reflects a major redistribution of both exports and imports within the non-
OECD area.
From the mid-1970s to the time of the sharp fall in oil prices in 1986, OPEC
was by far the largest non- OECD exporter and importer. Since then, however,
OPEC’s importance in world trade has diminished substantially. In contrast,
emerging economies in Asia -- China, in particular -- have seen their share in
word trade expanding steadily, especially in manufacturing. By 1996, Korea,
China and other Asian emerging market economies taken as a group had a
higher share in world merchandise exports than the United States, at about 23
per cent, compared with 13 per cent in 1985. (Martine Durand, Christophe
Madaschi and Flavia Terribile, 1998)

58
Estimates show that 70% of world growth over the next few years will come
from emerging markets, with China and India accounting for 40% of that
growth. Adjusted for variations in purchasing power parity, the ascent of
emerging markets is even more impressive: the International Monetary Fund
(IMF) forecasts that the total GDP of emerging markets could overtake that of
the developed economies as early as 2014. The forecasts suggest that investors
will continue to invest in emerging markets for some time to come. The
emerging markets already attract almost 50% of foreign direct investment (FDI)
global inflows and account for 25% of FDI outflows. (Ernst & Young, 2011)
The N11 ‘dream’ is different kind of story to the BRICs. At its heart, the BRICs
growth story is just not about growth. It is about scale and seismic shift in the
pattern of global activity. Although the N11 influence could grow, as we have
shown, it will never be a global story at that level. Certainly, a few of N11 could
join the world’s largest economies and several more may become large regional
economies. Their interaction with BRICs – particularly in East Asia and the
Sub-Continent – may also reinforce the kinds of shift in the global economy
that we have identified there. And some – such as Vietnam – seem plausible
candidates for the kind of sustained, structural high growth path exemplified
by China and India. (Dominic Wilson and Anna Stupnytska, 2007)
The most dynamic region in the world economy today is Asia. Asia is growing
at more than twice the rate of the other developing regions. This growth is
possible because of a policy orientation, which stresses free movement of
capital, goods and services across the national boundaries. The result is the
enhancement of economic efficiency and transfer of technology which foster
shifts in production and comparative advantages. All the countries in this
group, except the Philippines, grew at over 7 percent of GDP, led by high rates
of investment and export growth. It is useful to make a distinction between the
long-established, fast-growing market economies of Indonesia, Malaysia
Philippines, and Thailand and the centrally planned economies of Cambodia,

59
Laos, Myanmar and Vietnam, which are each now making their transition to a
market economy.
Cross border flows of capital, commodities, labour and technology will have to
play a major role in this optimistic assessment of Asia’s growth. The
elimination of barriers in these cross border flows is quite critical for
sustaining high growth in the region. Central to the whole process is regional
cooperation, which includes policy coordination in the removal of trade
restrictions and tariff barrier, the facilitation of inter country capital
movements and the coordination of policies on labour migration. Cross-border
infrastructures would also play an important role. Intra-regional cooperation
would help to provide railroads, roads, port, power and telecommunications
that would facilitate the flow of capital, labour, technology and commodities
across countries within the region. (Prof. Dr. Li Choy Chong and Peter
Lindstrom, 2000)
Methodology
The study is based on the secondary data on variables reflecting internal sector
developments from the published sources of IMF, World Economic Outlook
Database, RBI, BIS, World Data Bank, Global Economic Monitor (GEM), The
World Bank Group etc.
The data is presented in the forms of Tables and Graphs for comparative study
and trend analysis.
Data Analysis
Table I: Volume of Imports (as % change from previous year)
Sr.No. Country 2008 2009 2010 2011 2012
1 Bangladesh 1.558 22.508 12.910 4.997 6.537
2 China 3.810 4.180 20.097 10.090 6.238
3 India 7.583 6.629 14.858 8.146 1.788
4 Indonesia 21.042 -10.629 27.140 13.484 14.000
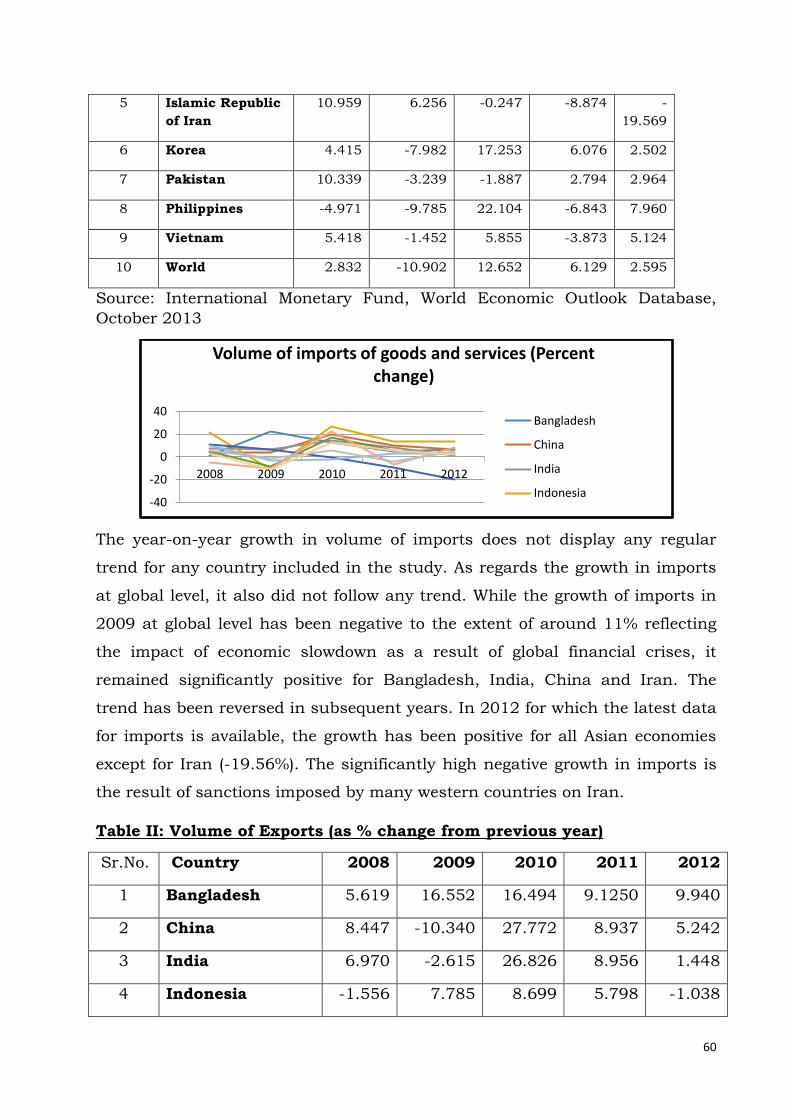
60
5 Islamic Republic
of Iran
10.959 6.256 -0.247 -8.874 -
19.569
6 Korea 4.415 -7.982 17.253 6.076 2.502
7 Pakistan 10.339 -3.239 -1.887 2.794 2.964
8 Philippines -4.971 -9.785 22.104 -6.843 7.960
9 Vietnam 5.418 -1.452 5.855 -3.873 5.124
10 World 2.832 -10.902 12.652 6.129 2.595
Source: International Monetary Fund, World Economic Outlook Database,
October 2013
The year-on-year growth in volume of imports does not display any regular
trend for any country included in the study. As regards the growth in imports
at global level, it also did not follow any trend. While the growth of imports in
2009 at global level has been negative to the extent of around 11% reflecting
the impact of economic slowdown as a result of global financial crises, it
remained significantly positive for Bangladesh, India, China and Iran. The
trend has been reversed in subsequent years. In 2012 for which the latest data
for imports is available, the growth has been positive for all Asian economies
except for Iran (-19.56%). The significantly high negative growth in imports is
the result of sanctions imposed by many western countries on Iran.
Table II: Volume of Exports (as % change from previous year)
Sr.No. Country 2008 2009 2010 2011 2012
1 Bangladesh 5.619 16.552 16.494 9.1250 9.940
2 China 8.447 -10.340 27.772 8.937 5.242
3 India 6.970 -2.615 26.826 8.956 1.448
4 Indonesia -1.556 7.785 8.699 5.798 -1.038
-40
-20
0
20
40
2008 2009 2010 2011 2012
Volume of imports of goods and services (Percent change)
Bangladesh
China
India
Indonesia

61
5 Islamic Republic
of Iran
-1.856 5.692 11.254 -1.896 -27.661
6 Korea 6.614 -1.197 14.680 9.134 4.178
7 Pakistan 1.647 -2.684 0.641 7.751 0.105
8 Philippines -8.411 -8.740 26.959 -6.600 9.699
9 Vietnam 2.908 2.627 6.705 3.844 16.168
10 World 2.735 -10.366 12.921 6.084 2.831
Source: International Monetary Fund, World Economic Outlook Database,
October 2013
Similar to the year-on-year growth in imports, the growth in exports also did
not follow any regular trend. It is evident from the data that the global exports
in 2009 have gone into negative zone to the extent of 10.366% (similar to the
import trends) reflecting the severe impact of global recession on account of
global financial crises. The trend has been quickly reversed in subsequent
years. In 2012, almost all the Asian economies had positive export growth. Iran
again showed a high negative growth (-27.661) reflecting the impact of
sanctions. Only the growth of exports of India, Pakistan and Indonesia was
lower than the global growth rate of exports.
Table III: Current Account Balance (in bn US$)
Sr.No. Country 2008 2009 2010 2011 2012
1 Bangladesh 1.182 2.663 0.507 -1.553 0.823
2 China 420.569 243.257 237.810 136.097 193.139
3 India -27.913 -38.182 -45.946 -78.154 -88.163
-40
-30
-20
-10
0
10
20
30
40
2008 2009 2010 2011 2012
Volume of exports of goods and services (Percent change)
Bangladesh
China
India
Indonesia
Islamic Republic of Iran
Korea
Pakistan
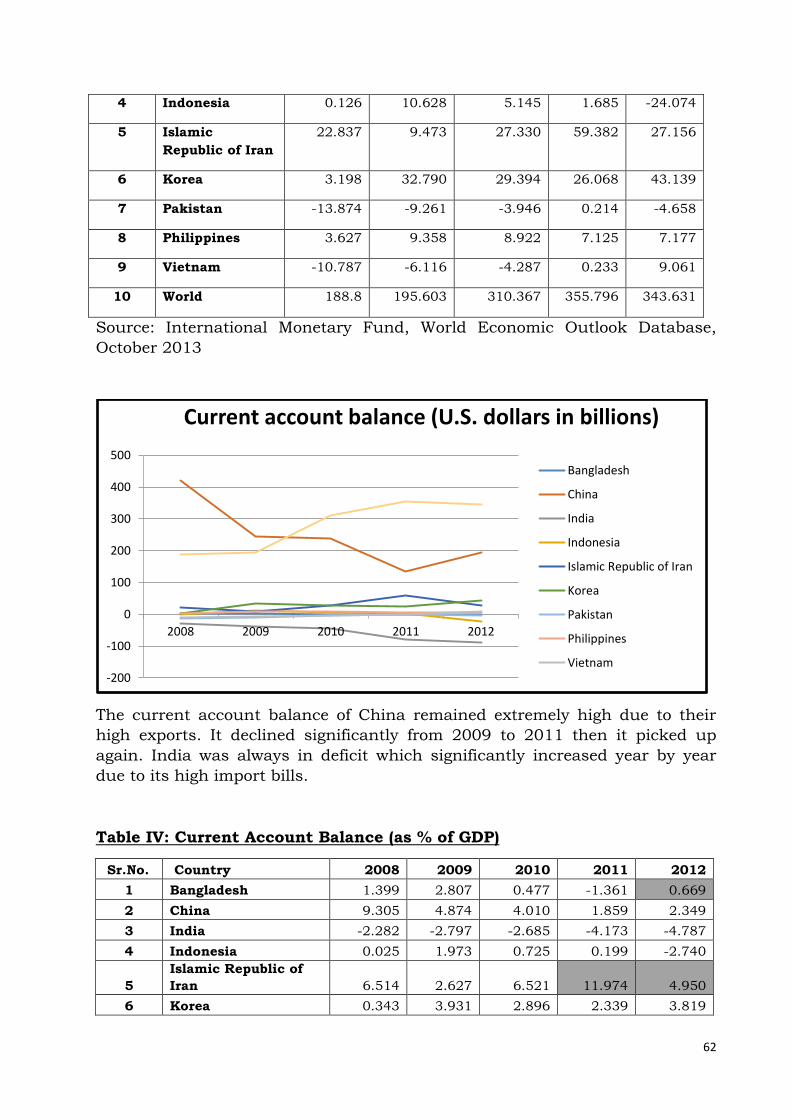
62
4 Indonesia 0.126 10.628 5.145 1.685 -24.074
5 Islamic
Republic of Iran
22.837 9.473 27.330 59.382 27.156
6 Korea 3.198 32.790 29.394 26.068 43.139
7 Pakistan -13.874 -9.261 -3.946 0.214 -4.658
8 Philippines 3.627 9.358 8.922 7.125 7.177
9 Vietnam -10.787 -6.116 -4.287 0.233 9.061
10 World 188.8 195.603 310.367 355.796 343.631
Source: International Monetary Fund, World Economic Outlook Database,
October 2013
The current account balance of China remained extremely high due to their
high exports. It declined significantly from 2009 to 2011 then it picked up
again. India was always in deficit which significantly increased year by year
due to its high import bills.
Table IV: Current Account Balance (as % of GDP)
Sr.No. Country 2008 2009 2010 2011 2012
1 Bangladesh 1.399 2.807 0.477 -1.361 0.669
2 China 9.305 4.874 4.010 1.859 2.349
3 India -2.282 -2.797 -2.685 -4.173 -4.787
4 Indonesia 0.025 1.973 0.725 0.199 -2.740
5
Islamic Republic of
Iran 6.514 2.627 6.521 11.974 4.950
6 Korea 0.343 3.931 2.896 2.339 3.819
-200
-100
0
100
200
300
400
500
2008 2009 2010 2011 2012
Current account balance (U.S. dollars in billions)
Bangladesh
China
India
Indonesia
Islamic Republic of Iran
Korea
Pakistan
Philippines
Vietnam
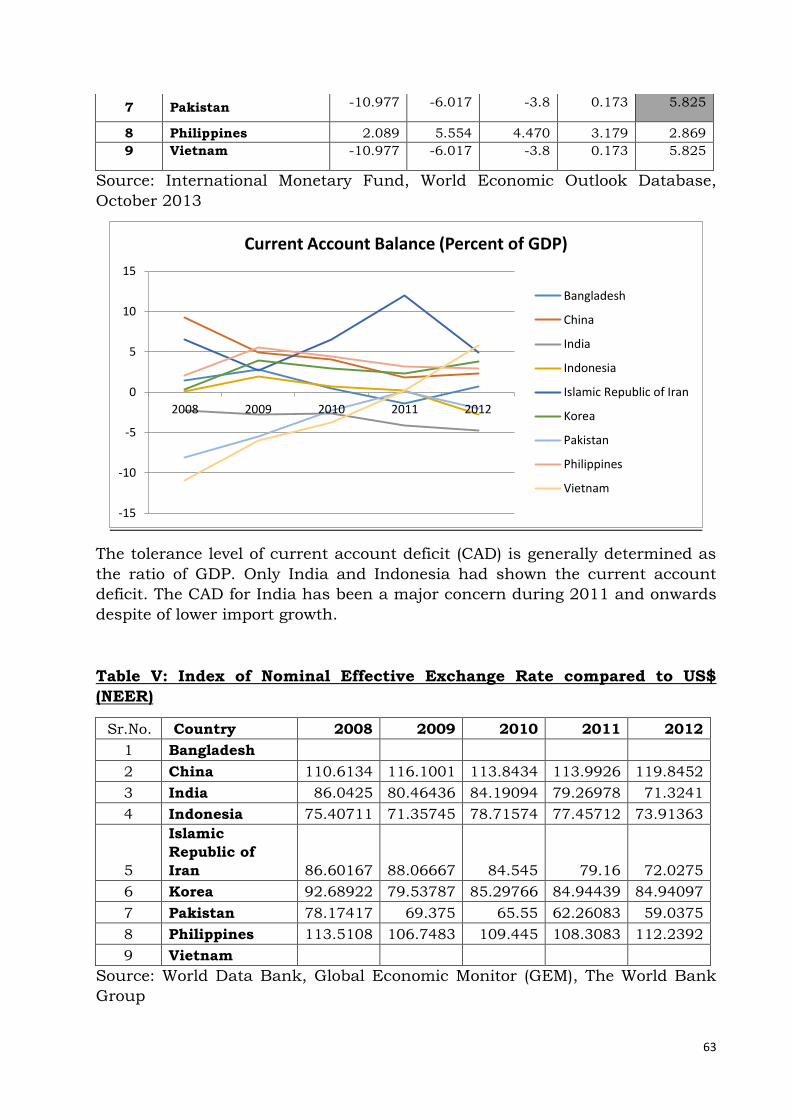
63
7 Pakistan -10.977 -6.017 -3.8 0.173 5.825
8 Philippines 2.089 5.554 4.470 3.179 2.869
9 Vietnam -10.977 -6.017 -3.8 0.173 5.825
Source: International Monetary Fund, World Economic Outlook Database,
October 2013
The tolerance level of current account deficit (CAD) is generally determined as
the ratio of GDP. Only India and Indonesia had shown the current account
deficit. The CAD for India has been a major concern during 2011 and onwards
despite of lower import growth.
Table V: Index of Nominal Effective Exchange Rate compared to US$
(NEER)
Sr.No. Country 2008 2009 2010 2011 2012
1 Bangladesh
2 China 110.6134 116.1001 113.8434 113.9926 119.8452
3 India 86.0425 80.46436 84.19094 79.26978 71.3241
4 Indonesia 75.40711 71.35745 78.71574 77.45712 73.91363
5
Islamic
Republic of
Iran 86.60167 88.06667 84.545 79.16 72.0275
6 Korea 92.68922 79.53787 85.29766 84.94439 84.94097
7 Pakistan 78.17417 69.375 65.55 62.26083 59.0375
8 Philippines 113.5108 106.7483 109.445 108.3083 112.2392
9 Vietnam
Source: World Data Bank, Global Economic Monitor (GEM), The World Bank
Group
-15
-10
-5
0
5
10
15
2008 2009 2010 2011 2012
Current Account Balance (Percent of GDP)
Bangladesh
China
India
Indonesia
Islamic Republic of Iran
Korea
Pakistan
Philippines
Vietnam
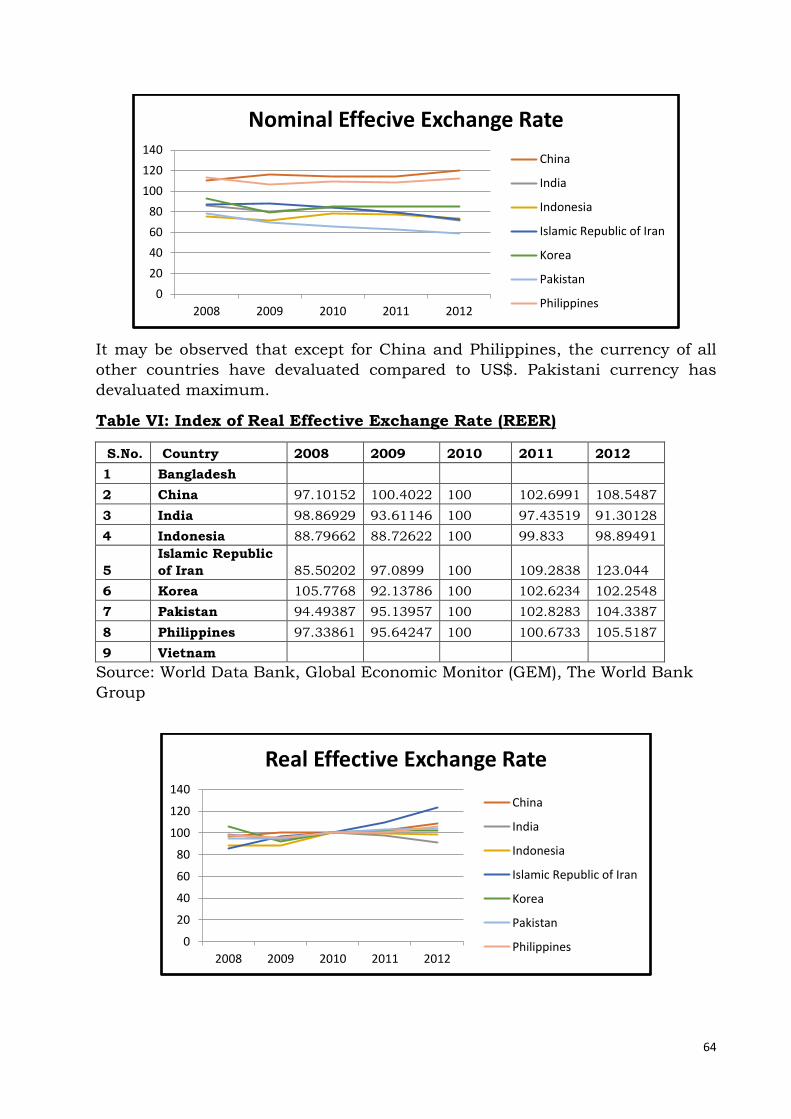
64
It may be observed that except for China and Philippines, the currency of all
other countries have devaluated compared to US$. Pakistani currency has
devaluated maximum.
Table VI: Index of Real Effective Exchange Rate (REER)
S.No. Country 2008 2009 2010 2011 2012
1 Bangladesh
2 China 97.10152 100.4022 100 102.6991 108.5487
3 India 98.86929 93.61146 100 97.43519 91.30128
4 Indonesia 88.79662 88.72622 100 99.833 98.89491
5
Islamic Republic
of Iran 85.50202 97.0899 100 109.2838 123.044
6 Korea 105.7768 92.13786 100 102.6234 102.2548
7 Pakistan 94.49387 95.13957 100 102.8283 104.3387
8 Philippines 97.33861 95.64247 100 100.6733 105.5187
9 Vietnam
Source: World Data Bank, Global Economic Monitor (GEM), The World Bank
Group
0
20
40
60
80
100
120
140
2008 2009 2010 2011 2012
Nominal Effecive Exchange Rate
China
India
Indonesia
Islamic Republic of Iran
Korea
Pakistan
Philippines
0
20
40
60
80
100
120
140
2008 2009 2010 2011 2012
Real Effective Exchange Rate
China
India
Indonesia
Islamic Republic of Iran
Korea
Pakistan
Philippines

65
The index of Real Effective Exchange Rate with the base year 2010 has
appreciated for all other countries except India and Indonesia. India has faced
the higher inflation which has resulted into depreciation of Indian currency in
real terms.
Table VII: Total Reserves (in mn US$)
S.No. Country 2008 2009 2010 2011 2012
1 Bangladesh 5689 10219 10564 8510 12031
2 China 1949260 2416044 2866079 3202086 3333386
3 India 247419 265182 275277 271285 270586
4 Indonesia 49597 63563 92908 106539 108837
5
Islamic Republic
of Iran
6 Korea 201144 269933 291491 304255 323207
7 Pakistan 7194 11318 14346 14528 10241
8 Philippines 33193 38783 55363 67290 73478
9 Vietnam 23890 16447 12467 13539 25573
Source: World Data Bank, Global Economic Monitor (GEM), The World Bank
Group
0
50000
100000
150000
200000
250000
300000
350000
2008 2009 2010 2011 2012
Total Reserves (Mn $)
Bangladesh
India
Indonesia
Islamic Republic of Iran
Korea
Pakistan
Philippines
Vietnam

66
The foreign exchange reserves for China were much higher compared to
combined reserve position of all other countries included in the study. It has
been consistently growing significantly. India and Korea were also having
significantly higher level of reserves compared to other countries.
Summary of Findings and Conclusions
The analysis of data related to external sector developments of Asian countries
covered under BRIC and N11 during 2008 to 2012 confirmed that there was
not any major setback faced by these countries due the financial crises
triggered by US subprime.
There has been some slowdown in the growth of both imports and exports
during 2009 but the recovery has taken place quickly in subsequent period.
Iran suffered a great setback both in growth of imports and exports mainly due
to sanctions imposed by US and other western countries.
The analysis of current account balances revealed that the current account
balance of China remained extremely high due to their high exports. It however
declined significantly from 2009 to 2011 then it picked up again. Only India
and Indonesia had shown the current account deficit India was always in
deficit which significantly increased year by year due to its high import bills.
The level of current account deficit (CAD) as a ratio of GDP for India has been a
major concern during 2011 and onwards despite of lower import growth.
0
500000
1000000
1500000
2000000
2500000
3000000
3500000
4000000
2008 2009 2010 2011 2012
Total Reserves (Mn $)
China

67
It may be observed that except for China and Philippines, the currency of all
other countries have devaluated compared to US$. Pakistani currency has
devaluated maximum. The index of Real Effective Exchange Rate with the base
year 2010 has appreciated for all other countries except India and Indonesia.
India has faced the higher inflation which has resulted into depreciation of
Indian currency in real terms.
The foreign exchange reserves for China were very high due to their high
exports. It has been consistently growing significantly. India and Korea were
also having significantly higher level of reserves compared to other countries.
Bibliography
Lindstrom, P. D. (2000). New Developments in Emerging Asia: Business
Opportunities in new Markets and Technology. The Asia Research Centre, The
Research Institute for International Management, The University of St. Gallen .
Martine Durand, C. M. (1998). Trends in oecd countries’ international
competitiveness : the influence of emerging market economies : economics
department working papers n0. 195. Organisation for Economic Co-operation
and Development .
Stupnytska, D. W. (2007). The N-11: More Than an Acronym, Global
Economics Paper No: 153. Goldman Sachs Research .
(2011). Tracking global trends: How six key developments are shaping the
business world. UK: Ernst & Young Global Limited.
68
China: A threat or opportunity for India
Janardhana A
Abstract
This paper examines threat and opportunity of a rise in Chinese
economy in the world market by using trade similarity and complementarity
indices. Our findings indicate that India faces tough competition from China
in products related to clothing, textile, leather products and capital goods.
Further, there is a weak complementarity between India and China. This is
due to Chinese markets are still not open for Indian goods but are open to
other ASEAN countries like Thailand and Malaysia. Though, India started its
comprehensive trade policy reform a decade later than China, the achievement
is far below expectations.
Key words
Trade liberalization, Trade Indices, Similarity index, Trade complementarity
index, India and China
Introduction
Over the past decade, China has turned out to be one of the key players
in global economy. The emergence of China as a competitor in the world
market has led both private and public sectors in many countries to pay more
attention to its trade and development. The nation has experienced
tremendous changes in its economic development, especially significant
increases in real income and trade with other countries. At the same time in
India both private and public sectors have played crucial role in economic
development. The trade between two countries rose reached US$73.9 billion in
2011 from US$ 33.9 million in 1992. China's current share in global exports
and imports are 10.5 percent and 9.823 percent, while India's share in global

69
exports and imports are 1.5 percent and 2.645 percent in 2010.6 This is due
to China's proportion of large middle-income group, cheaper labor cost and
change production from low technology production to high-tech production.
Though, India started its comprehensive trade policy reforms a decade later
than China, but the achievement has far below expectations. With unclear
evidence on the role of China on Indian economy, it is necessary to assess the
rise in the Chinese economy in the world market provides an opportunity or
threat to Indian products.
Therefore, this paper investigates the relationship between India and
China. Precisely, we would like to ask a key question; would the rise in the
Chinese economy in the world market provide an opportunity or threat to
Indian products. To answer this question, this paper divides the analysis into
two components: The first component is to examine the trade policy in Indian
economy, especially after reform period and then briefly look at trade policy
reform in China. Trends and patterns of trade at the aggregate level in India
and China are presented. The second part is to use quantitative analysis
approach to analyze an opportunity and threat of Chinese to Indian economies.
Two indices are used with the disaggregate trade data in India and China (i.e. 6
digits-HS level).
Objective
(1) To understand the trade liberalization process in India and its
implications on trade in India and China
(2) To examine the threat and opportunity of a rise in Chinese economy in
the world market by using trade similarity and complementarity indices, respectively with disaggregated trade data, i.e. 6 digit HS level. (Note that
this study also compares trade complemnetarity between India and China with China and other two East Asian economies, i.e. Thailand and Malaysia)
6 Economic Survey of India

70
Scope and Limitations
The data used in the paper were from UNCTAD (United Nations
Conference on Trade and Development) in the format of Harmonize System 6
digit level in the period of 2003, 2006, and 2009. The similarity index (SI) and
trade complementarity index (TCI) will be applied as the methodology in
analyzing the similarity and complementarity in each product. Two key export
countries Thailand and Malaysia are chosen from ASEAN region to analyze TCI
with China.
Though, other Asian countries (such as South Asian and East Asian)
have been giving tough competition in world market for India, the study mainly
focuses as on India and China only. Another important limitation is that we
have not included services sectors in the analysis, though it is large share
contributing to the Indian GDP.
Advantage and the Usefulness of this Study
Useful points of this study are as follows: (i) it will help us understand
trade liberalization process and policies barriers before liberalization and
reduction in policy barriers after liberalization with reference to India and
china. (ii) It helps us to understand about trade pattern between two biggest
Asian economies in the world market and the proxy of threat between these
two countries (through the applying similarity index). (iii) Finally it helps us to
understand complementarity between India and China by comparing with
other ASEAN economies.
India and China Trade Overview
Currently India and China are the two key players in the global market.
With the onset of economic liberalization both countries have benefited from
the trade. It has created new opportunities for both the economies in domestic
and international markets. Prior to trade reforms China and India contributed
to world exports with a share of 1.8 percent and 0.5 percent respectively,

71
whereas, it was 9.7 percent and 1.3 percent in 2009.7 The trade registered a
twelve fold increase, since its economic liberalization, from US$ 45.16 billion in
1992 to US$570.437 billion 2010. The exports and imports have grown at 11
and 14 fold respectively during this period (from US$ 20.711 billion and US$
24.45 billion to US$ 220.408billion and US$ 350.029 billion). Since Chinese
economic reforms occurred a decade earlier to India, the trade has registered
an 18 fold increase in 1992 from US$165.52 million to US$2.973 trillion in
2010.
Indian merchandised trade became more diverse in mid 1990s due to
increase in exports to developing Asian countries (IMF, 2012). During 2000-
2010 the China imports have shown rapid growth compare to exports at
annual average growth rate of 22.3 percent compare to 21.9 percent that of
exports. A similar pattern has been observed in India as well. China’s share
in world exports increased between 2000 and 2010 at an annual growth rate of
21.9 percent due to increase in share of trade emerging and developing
countries. Similarly, the performance Indian export has been stronger since
2000, the share in world exports increased during 2000 - 2010 at an annual
growth rate of 19.72 percent. This is due to Indian exports had moved into
dynamic segments such as organic chemicals, petroleum chemical and
electrical equipment (IMF, 2006) and diversification in exports among
developing countries of Asia and ASEAN countries increased from 38.7 per
cent to 56.2 per cent, and decrease in the share of exports in Europe and the
USA fell from 46.9 per cent to 30.8 per cent during in 2000 to 2010 (IMF,
2012).
7 Economic survey of India

72
Figure 2: India and China trade in world market Source: UNCTAD
In the current scenario (2010), the world merchandise trade growth rate
is 21.79 percent, but China and India stood at staggering figure of 34.73
percent and 28.72 percent8. However, India’s growth in trade was higher than
world trade particularly in two periods, first just following 1990 reforms and
second after 20039. Overall, Indian export growth is making 24.51 percent
plus growth since 1992-2010, but the contribution in world trade is still
limited. This is because the market penetration has been slower than China
and other ASEAN countries due to poor infrastructure and regulation burden,
which has increased transportation cost and cumbersome and procedures on
imports and exports, Non agriculture tariff and Non trade barriers (NTB) is
higher than South Asian countries, developing countries of Asia and ASEAN
countries and ease of trade (IMF, 2006), (IMF, 2012).
Bilateral Trade between China and India
The bilateral trade between India and China has reached US$73.9 billion
in 2011 from US$ 33.9 million in 1992, the increase in the trade more than
200 percent during this period. During, 1993 - 2010 the annual growth rate of
trade between these two countries stood at about 31.55 percent. In fact, 2002-
04 Indian exports (57.17 percent) performance was dominated over Chinese 8 Economic Survey of India
9 Economic Survey of India
73
imports (48.53 percent). Thereafter, since 2005, there has been a constant
increase in trade gap between the two countries and it is growing at a faster
rate. The trade gap between these two countries has grown from just over $4
billion in 2006 to just under $20 billion in 2010. In 2009, the bilateral trade
was worth $43.38 billion of that, Indian exports were a mere $13.714 billion,
compared to China's exports of $29.66 billion. This is because of Chinese non
tariff trade barriers for Indian goods, where India has a competitive advantage.
Further, India exports low value raw materials and intermediate products and
imports high value capital goods from China.
In the current scenario Chinese imports are characterized by primary
products, raw material and intermediate products. Table 1 shows that Chinese
import of principal commodities from India 1992 to 2011; during this period
the trade structure underwent several changes. The import structure was
dominated by manufactured goods classified chiefly by material crude
materials, inedible, fuels Chemicals and related products and food and lives
animals; whereas, from 2002 to 2010, crude materials such as iron ore
dominated major portion of the trade, and trend has been increasing over the
years. Since, 1992-2001, food and live animals have also shared major
portion of the import. Between, 1996-1998 it stood at 25.54 percent of total
trade but later it gradually dropped to 6.26 percent in 2001 and 2.31 percent
in 2011. This is due to agriculture sector has been controlled by government
over imports and exports in this sector through State-Trading Enterprises and
non tariff barriers on Indian agricultural products in China (RBI, 2013).
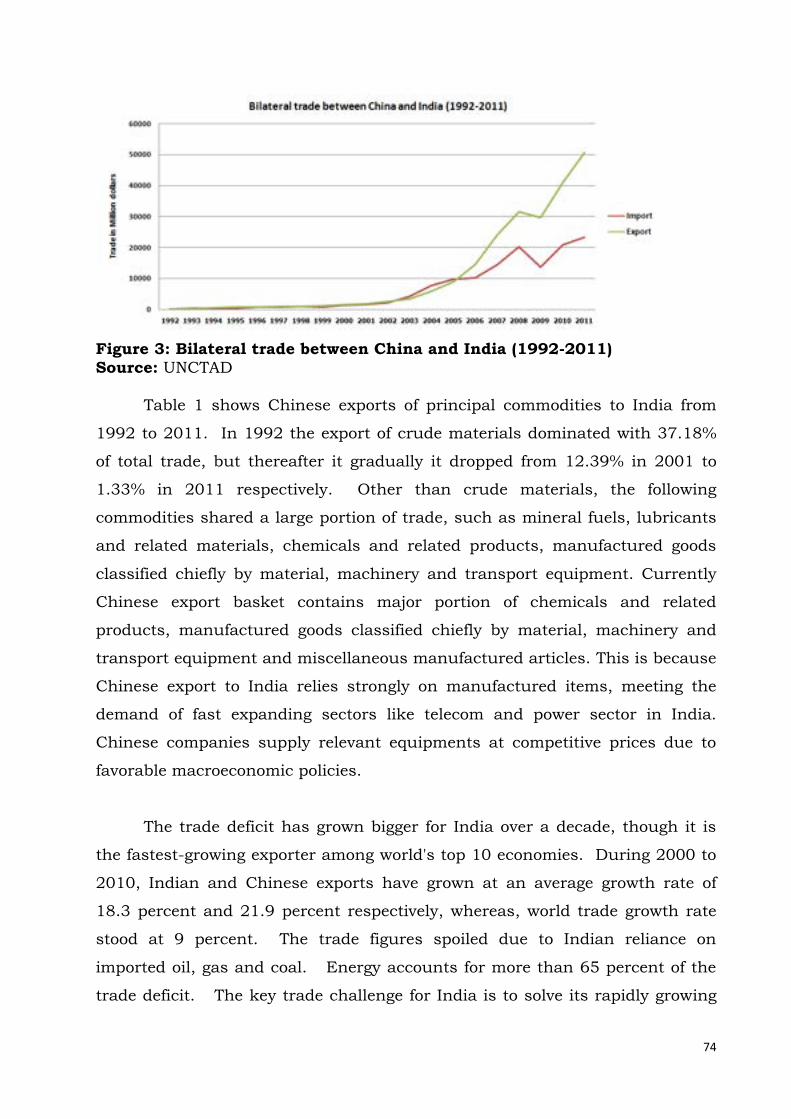
74
Figure 3: Bilateral trade between China and India (1992-2011) Source: UNCTAD
Table 1 shows Chinese exports of principal commodities to India from
1992 to 2011. In 1992 the export of crude materials dominated with 37.18%
of total trade, but thereafter it gradually it dropped from 12.39% in 2001 to
1.33% in 2011 respectively. Other than crude materials, the following
commodities shared a large portion of trade, such as mineral fuels, lubricants
and related materials, chemicals and related products, manufactured goods
classified chiefly by material, machinery and transport equipment. Currently
Chinese export basket contains major portion of chemicals and related
products, manufactured goods classified chiefly by material, machinery and
transport equipment and miscellaneous manufactured articles. This is because
Chinese export to India relies strongly on manufactured items, meeting the
demand of fast expanding sectors like telecom and power sector in India.
Chinese companies supply relevant equipments at competitive prices due to
favorable macroeconomic policies.
The trade deficit has grown bigger for India over a decade, though it is
the fastest-growing exporter among world's top 10 economies. During 2000 to
2010, Indian and Chinese exports have grown at an average growth rate of
18.3 percent and 21.9 percent respectively, whereas, world trade growth rate
stood at 9 percent. The trade figures spoiled due to Indian reliance on
imported oil, gas and coal. Energy accounts for more than 65 percent of the
trade deficit. The key trade challenge for India is to solve its rapidly growing
75
need for energy coupled with the rapidly increasing price of energy resources.
Therefore, India should expand exports in the sectors like manufacturing
(textiles and clothing), since is China moving from labor intensive products to
more advanced technology oriented products, automobile manufacturing
through joint ventures and pharmaceuticals where China lack in producing
generic branded pharmaceuticals products to reduce the trade gap. (RBI,
2013).

76
Table 1: China trade with India by commodity in selected years
SITC
code
Description
(Imports) 1992 1995 2000 2005 2010 2011
0 Food and live
animals
9.62% 7.06% 9.23% 1.58% 1.93% 2.31%
1 Beverages and
tobacco
0.86% NA 0.00% 0.00% 0.00% 0.00%
2
Crude
materials,
inedible, except
fuels
61.73% 44.46% 37.99% 65.25% 68.06% 59.66%
3
Mineral fuels,
lubricants and
related
materials
2.14% 2.38% 2.09% 0.58% 1.63% 0.41%
4
Animal and
vegetable oils,
fats and waxes
0.18% 7.22% 2.06% 0.57% 1.25% 1.41%
5
Chemicals and
related
products, n.e.s
6.04% 11.64% 17.15% 10.63% 6.73% 8.79%
6
Manufactured
goods classified
chiefly by
material
17.38% 21.81% 25.67% 16.40% 14.82% 20.89%
7
Machinery and
transport
equipment
0.91% 3.95% 3.69% 3.85% 4.11% 4.41%
8
Miscellaneous
manufactured
articles
0.90% 1.17% 2.12% 0.88% 1.41% 2.11%
9
Commodities
and
transactions
not classified
elsewhere in
the SITC
0.23% 0.32% NA 0.26% 0.06% 0.00%
100.00% 100.00% 100.00% 100.00% 100.00% 100.00%

77
SITC
code
Description
(Exports) 1992 1995 2000 2005 2010 2011
0 Food and live
animals 3.17% 3.83% 2.15% 0.52% 0.53% 0.46%
1 Beverages and
tobacco NA NA 0.04% 0.00% 0.01% 0.01%
2
Crude
materials,
inedible,
except fuels
37.18% 14.72% 14.14% 3.15% 1.27% 1.33%
3
Mineral fuels,
lubricants
and related
materials
11.23% 14.06% 17.15% 5.70% 1.08% 1.32%
4
Animal and
vegetable oils,
fats and
waxes
0.18% 0.42% 0.06% 0.02% 0.01% 0.01%
5
Chemicals
and related
products,
n.e.s
27.53% 36.58% 26.21% 19.42% 19.32% 20.76%
6
Manufactured
goods
classified
chiefly by
material
10.62% 11.45% 13.73% 26.20% 20.64% 20.32%
7
Machinery
and transport
equipment
6.94% 15.24% 20.89% 38.90% 49.56% 48.10%
8
Miscellaneous
manufactured
articles
3.16% 3.71% 5.62% 5.97% 7.48% 7.58%
9
Commodities
and
transactions
not classified
elsewhere in
the SITC
NA NA 0.01% 0.11% 0.10% 0.11%
100.00% 100.00% 100.00% 100.00% 100.00% 100.00%
Source: UNCTAD

78
Literature Review
Finger and Kreinin,(1979) says if exports are dissimilar – subject to little
or no ‘commodity overlap', there is little scope for trade diversion and
similarity of exports between any two countries or groups of countries can
be used as a criterion to assess the degree to which their economic structure
is becoming more similar or more divergent.
Kosekshyaoghu, (2001) explains similarity of exports between Turkey and
the EU12 in world market and compares similarity of exports from Turkey
with that of southern European members of the EU; Spain, Portugal and
Greece, in terms of similarity of their factor endowments during 1975-1990.
The indices calculated for sixty-five commodities; twenty-four of which
defined as agricultural (SITC 0, 1, 2 and 4) and forty-one as manufactured
(SITC 5-9), at two-digit level.
Quereshi, (2006) assesses the international competitive effect of both
Asian drivers on different regions of the world such as Africa, Asia, Europe,
Latin America and North America in the world market. The competitiveness
and complementarity between China and India using trade indices such as
similarity index (SI) and complementarity indices and using export and
import data disaggregated at the three digit Standard International Trade
Classification (SITC) level for period of 2000-04.
Bernadette, (2008) discusses structural complementarity between EU
and Korea in the context of regional integration. It measures whether
economic structural complementarity in the case of free trade agreement
(FTA) of these two countries is more desirable or not. Author emphasizes
that the way these two countries specialize in different industries is a useful
tool for the analysis of the likely impact of trade liberalization. On the other
hand, similarity index is calculated to measure commodity distribution of
the EU's and Korea's exports to the rest of the world. The TCI & SI indices

79
calculated for the same time period (1996, 2000 and 2006) and levels of
aggregation is 2-digit.
India Trade Policy Pre Reforms Period
Trade policy reforms in India have been substantial since late 1980s
and early1990s. Prior to the reform period, trade policies were classified as
import-substitution regime while the 1990s saw more liberalized and an
improved business environment relating to trade. This section reviews trade
policies in India by focusing on the policy during the post-reform period
(1991 onwards). Comparisons of trade policies between pre- and post-reform
phases have also been included in this section.
Import policy
The Import policy of the GOI during pre-reform period had two
components i.e. (i) import restrictions and (ii) Import Substitution (IS). The
main objective of import substitution was to find a solution to the
inadequate foreign transaction for the import of more essential commodities
and achieve self reliance in manufacturing. Similarly, the objective of
developing import restrictions was to encourage large industrialization and
overcome severe shortage of foreign exchange. Quantitative restrictions
(import ceiling) and import licenses were used as the key instruments, but
varied from industry to industry.
The strategy of import substitution was enforced in three phases: (i)
import substitution in domestic manufacturing of consumer goods, (ii) the
change of import substitution towards capital goods, and (iii) the policy shift
towards decreasing the reliance on imported knowledge by developing and
encouraging the use of native skills. The policy of import substitution helped
save foreign exchange and structure of imports. Many products, which were
imported earlier, could be produced within the country. Import substitution
occurred during the period of 1950–51 to 1956–66. This policy accounted
for 1/4th of the whole growth of output and almost half of the growth of the
capital goods.

80
The export policy
Export policy during the pre-reform period was classified into three
phases: Phase 1 from (1952 - 66) up to (1966-1973) the commencement of
planning to the period of oil shock, Phase 2 – the period from 1973 –1983,
and Phase 3 – during the latter half of the sixth plan (1983–1985) and
duration of the entire seventh plan (1985–1990).
The period of the first phase is again divided into two sub - periods,
i.e. (i) 1952–66 (ii) 1966–73. The year 1952–66 was characterized as a
passive export policy with the objective of increasing exports. During this
period the policies were, “Export policies which were started during the
second world war and carried over for much of the early part of the decade
in the case of important foreign exchange earning commodities like jute, tea,
cotton textiles, oilseeds and vegetable oil, raw cotton, hides and skins etc.;
Export duties which affected several export commodities through most of the
decade; and The growing strength of domestic demand accentuated during
some periods by GOI promotional activities ( Bhagwati, Jagdish and Padma
Desai, 1970)”.
During 1966–73 the GOI made devaluation of rupee by 36.5 in
terms of gold in June 1965. Main objectives behind this devaluation were “to
lead to expansion in export earnings since Indian goods would be cheaper in
international market, to decrease in the import from abroad, and attract
more tourists from abroad and discourage Indian tourists aboard”.
During 1973–1983, GOI took several initiatives in order to increase
exports. One such measure was the devaluation of Indian currency (NEER)
continually during 1970s. The focal point of the devaluation was to offer
cheaper Indian goods in international market. Given the lower rate of
inflation at home compared to the outside world, this also meant a sharper
downward movement in the real effective exchange rate (REER). This
resulted in an increase in relative profitability from exports (Deepak Nayyar).

81
The pace of trade reforms picked up significantly only in 1985, the
major changes were made during 1985-98. As result, exports, registered a
healthy annual growth of 14.4 percent during 1985-90 compare to 1.2
percent growth rate during 1980–85. Hence, the performance of external
sector to GDP improved considerably and impact of these changes led to
GDP grew at annual rate of 7.6 percent from 1988–89 to 1990–91.
The reforms during this period were (i) The Open Grant License (OGL)
list was steadily expanded for capital and intermediate inputs, during 1976
– 1990. This initiative led to increase in productivity, (ii) the decline in the
share of canalized imports (from 67 to 27 percent between 1981 and 1987)
gave an opportunity for entrepreneurs to import of machinery and raw
materials, (iii) Replenishment (REP) licenses helped to expand imports, (iv)
Relaxation of industrial controls and related reforms (v) Industrial
delicensing between 1985 to 1990 gave major boost to import machinery
and raw-material without any restrictions, as result improvement in
production capacity (vi) Correcting the overvaluation of the real exchange
rate by nominal depreciation of the rupee (IMF,1997).
Overall during 1983 to 1990 witnessed the policy implementation
with an objective of higher export promotion strategy. While incentives for
export production were enhanced, export themselves were now being viewed
as an essential element of industrial with development policies. During this
period, policies emphasized more on technology upgradation, increase in
plant size, freer imports, and domestic and international competition in the
entire industrial sector as being essential for export promotion. It is also
possible to distinguish this duration as the beginning of a new long term
perspective of about trade policies and industrialization, which provided a
contrast with the approach of the earlier planning.

82
Trade Liberalization
The initiative of trade policy liberalization was meant to increase
export production and modernization of native industry and promote
international trade. Trade liberalization would, in turn, encourage Indian
exporters in foreign market by enhancing their competitiveness. The import
policies were aimed at helping Indian exporters with critical inputs and
necessary capital goods to improve their production along with technology
up gradation. Therefore, import and export liberalization focused on long
term stable policies to facilitate smoother planning of their international
businesses.
GOI took trade liberalization initiatives with the objective of (i)
providing easy access to inputs for maximizing the exports, (ii) up gradation
of technology through Open General License (OGL), (iii) improving the
quality to compete in world market, and (iv) fresh momentum provided for
export promotion by providing incentives and improving the quality of
administration. Hence, in principle, we can say that GOI allowed importing
capital goods (which has high export potential and not available in the
country) to help growth of export production for prioritized industries.
Therefore with this initiative, new capacities for the export sector, up
gradation technology and products were created. The above objectives were
made by considering the facts and constraints of domestic and external
resources.
Post Reform Period
During the pre - reform period, trade policy systems were complicated
and involved complex administration processes. There were several
categories of importers; various sorts of permits and alternate mechanism of
importing etc were provided to these importers. These complex processes
came to an end during the reform period.
83
In 1991, the trade reforms allowed trading groups or houses to trade
in a wide range of goods. In order to promote exports, GOI allowed trading
houses to setup with 51% foreign equity. Under the 1992–97 trade policy,
trading houses and export houses were provided the benefit of self-
certification under the advance license systems that permitted duty free
imports for exports. GOI brought Special Economic Zones (SEZs) policy by
2005, but it came into effect only in 2006. The major objective of the SEZs
were promotion of exports, endorsement of exports of commodities and
services, overseas sources, creation of more activity, endorsement of
investment from domestic and Creation of employment opportunities and
expansion in infrastructure services.
In 1999 GOI planned to replace export processing zones (EPZs) to free
trading zones (FTZs). FTZs were authorized to make any manufacturing or
trading activities, and these zones were not restricted with regular norms
such as pre-determined obligation, value addition etc. In order to create
trade related infrastructure to make easy for import and export of goods and
services with any transaction cost.
The Exim policy 2001 introduced the concept of Agriculture Export
Zones (AEZs), to give primacy to the promotion of agriculture exports and
affect recognition of exports efforts on the basis of specific products and
specific geographical areas. Market access initiative scheme was launched
in 2001–02 with the objective of market access and marketing promotion
efforts abroad. Features of this scheme were in-depth market study for
selected goods in specific regions to produce data for endorsement of exports
from India, and assist promotion of Indian goods. Exhibition of Indian
products and Indian brands in the international market through showrooms
and warehouses setup in rental premises by identification of exporters,
display in identified leading departmental stores/total exhibition/trade fairs
etc. were the goals, this scheme also allowed certain quality of product up
gradation activities based on the market type.

84
The FTP (2004–09) announced a number of ‘rationalization
procedures’ for decreasing transaction costs and simplifying procedures.
These included (1) exemption of small exporters (minimum turnover at least
5 crore) who incur high transactional cost from furnishing bank guarantee,
(2) import of capital goods (second hand) without any large depreciation
obligation, (3) exemption from service tax for all exports including exports
from DTA (domestic tariff area), (4) slashed number of returns and forms to
be filed etc.
Further, it has identified sectors to provide thrust that having
prospects for export expansion and potential for employment generation.
These thrust sectors include agriculture, handlooms and handicrafts, gems
& jewellery and leather and footwear sectors. Introduced new export
promotion schemes such as Target Plus to accelerate growth of exports, to
boost exports of agriculture related and other value added products under
Vishesh Krishi Upaj Yojana, Free Trade and Warehousing Zone to create
trade-related infrastructure to facilitate trade with freedom to carry out
trade transactions in convertible currencies.
The objective of the current (2009–14) foreign trade policies (FTP) are
as follows: (i) short term priority: help those sectors which are badly affected
due to global financial crisis and stop the declining trend of exports (ii) Long
term policy: aim of this policy is to increase India’s share in global trade
twice or twofold by 2020.
In order to increase the export growth after the global financial crisis,
FTP added more markets in its portfolio. These markets include 16 new
markets from Latin America, 10 from Asia Oceania and comparatively larger
markets in South Africa.
With a goal of increasing diversification of partners and products, GOI
introduced special incentives for those who provided for exports under the
scheme of Focus Market Scheme (FMS) and Focus Product Scheme (FPS).
Increased scope of Market linked Focus Product Scheme (MLFPS) by

85
including products related to 153ITC (HS) code at 4 digit level. Technology
up gradation for export sector under EPCG scheme at zero duty, towns of
export excellence for handicrafts, leather products and horticulture products
has been introduced.
In order to reduce transaction and handling cost for unpreserved agriculture
products, a single window system has been introduced to facilitate exports.
Foreign policy trade 2009–14 allowed zero duty on capital goods, in
which India has a comparative advantage, on items like labor intensive
apparels and textiles, handicraft and leather. The New FTP policies have
taken several measures and rationalized procedures to decrease the
transaction costs exports including (i) application procedures and
redemption forms for EPCG (Export Promotion Capital Goods Scheme) being
liberalized, (ii) slashed import License fee (iii) permission for exporters to
carry with them merchandise worth $5 million against the $2 million
allowed earlier.
China foreign trade policy
Introduction
Several studies have been undertaken on China trade policies and its
development (S.Bhalla, 1995; Weiguo Lu, 1995 and Francoise Lemonie,
1996). Prior to reform in China, trade accounted for $21 billion and foreign
direct investment was nil. The trade policies during pre reform period were
based on self sufficiency, import substitution, and direct administrative
intervention. The imports restriction were subjected to high tariffs, import
quotas, licensing and import monopolies. During this period foreign trade
was meant for making up domestic shortages by imports and to smoothen
out excessive goods in economy. The foreign trade was totally controlled by
the central government with a few foreign trading corporations (FTCs).
During pre-reform period Chinese export firms had little or no incentives on
exports; whether the goods are sold in foreign or domestic markets, the price

86
received the same price. As a result firms suffered with no gain in foreign
exchange and firms were indirectly discouraged with respect to exports.
In the late 1970s China took initiation of opening up of the economy
with the motivation of economic development and modernization. The
emphasis was more on decentralization of foreign trade decisions and
therefore implemented export promotion activities, though import
liberalizations were much slower than the exports. Export promotion was
the core strategy with motivation towards constructing a competitive export
sector. This plan was made by using a competitive comparative advantage of
labor intensive production. The external international environment and the
internal regional background provided this country with particular
prospects and limitations that influenced their strategies. These economic
reforms resulted in increased productivity (with a better allocation of
resources and increase in efficiency) and higher growth rate of the Chinese
economy.
Trade liberalization
The main objective of the Chinese trade liberalization was to achieve
growth in export, changes in commodity structure and geographical
distribution, and integration into the world economy for future growth and
trade prospects. There were two key components of trade liberalization –
decentralization of economic decision making power and rationalization of
prices based on market forces (as a result now market plays a significant
role in influencing prices of both producer and consumer goods).
Decentralization of trading rights
In the Chinese economy, due to size of the country central planning
was incomplete, and its level of growth, and policies relating to
decentralization. Therefore, Chinese started their trade reforms with the
introduction of decentralizing trade rights to respective ministries, local
administration and producing firms. In 1984, as a result of progressively

87
relaxed monopoly foreign trade, the number monopolized foreign trade
corporations (FTCs) decreased and FTCs became an independent entity with
respect to financial operation, and each state allowed creation of its own
FTC. As a result the numbers of FTCs were improved from 12 to 1000
during 1986 to 1994. Other than this they introduced tariff reductions and
concessions for increasing export-oriented activities. Furthermore, in the
late 1980s, they created production-oriented networks for exports to achieve
enhanced performance of firms for selected industrial sectors by using
financing and supplying inputs for production.
This made competition in upstream suppliers and downstream
distributors (FTCs now has to compete in foreign market as well as supply
in domestic market) stiffer. Besides, joint ventures with foreign companies
made production and exports bigger, and privileges were given to perform
foreign trade operations directly. In the process of decentralization, Chinese
government strengthened its macroeconomic control over foreign trade and
improved the governing system for foreign trade. The process also included
rational approach towards regulation of foreign trade by effective
management of exchanges rates, customs duties, taxes and credits.
In 1995, China made major reforms which included substantial
reduction in tariff, the average tariff decreased by 24–25%, along with
elimination of quotas and licenses, and a major decrease in quantitative
restriction on commodities. Now the view towards trade policies were more
inclined towards FDI. As a result, decrease in the bias for exports related
activities and whereas imports were readjustment according to domestic
demand.
Foreign exchange system
An outcome of trade liberalizations was the foreign exchange policies
becoming an important aspect of trade policies. Chinese exchange rate
regime was implemented in three phases – a) Retention and adjustment of
Foreign exchange system within development framework from 1979 to 1986,

88
b) Planning market double track system from 1987 to 1993, and c) After
1994 amalgamation of foreign trade exchange rates.
From a period of 1979 to 1986 foreign exchange system was within
the planning framework. Under this framework they introduced foreign
exchange retention system and devaluation of Chinese currency for trade
related transactions, and allowed exporting firms and government
administration to retain and use some portion of foreign exchange they
earned beyond or above level made by the plan, though these earning were
limited and heavily regulated. During this period the foreign trade saw very
small growth due to continuous devaluation of Chinese currency. The main
reason for this slow growth was the whole economic system and planning
being in its early stages. And a lack of well-developed secondary market
played a role, which destabilized effectiveness of the incentive system.
Retention plans were highly characterized based on type of industry and
geographic locations.
After 1994 foreign exchange reforms retention scheme was terminated
based on foreign exchange policies. As a result exporters suppose to change
their currency earnings, which made imports easier.
During 1987–93, this phase was more of a market oriented regime
compared to that of the planned exchange rate regime. After introduction of
swap market, by 1993 80 percent of foreign exchange earnings were priced
at the swap rate, clearly indicating how market forces dominated in
determining foreign exchange rate. The characteristic of this phase was an
overvalued official rate and an undervalued swap rate. An undervalued
official rate led an implicit tax on exports and undervalued swap rate an
implicit duty on imports.

89
In 1994 China took another initiative with respect to foreign exchange
regime. The main objectives of this regime are as follows: (i) Merging of
official and market exchange rate (ii) RMB settlement system was used
instead of foreign exchange retention system for all export earnings. (iii)
Removal of constraints for using of foreign exchanges in current account
transactions for acquiring and (iv) Usage of Inter-bank foreign exchange
market via a system of managing float instead of swap system.
An important implication these new policies was that foreign exchange
control instrument was no longer used to control imports. The future trade
of China became more dependent on market forces, responsiveness of firms
to price signals, and other measures such as tariff and quota.
In the end, Open-door policy in China was initiated in the late 1970s,
and gained great momentum in the late 1980s and early 1990s, along with
overall economic reforms. Though they introduced new FDI measures to
enhance the export oriented activities, import liberalization was lagging
behind exports. FTCs are still under administrative control of both central
and local. In order to obtain WTO membership China decreased barriers on
imports. Though some of the import restriction and administrative control
were eased, most of the import activities remained the same. The
administrative control was maintained through FTCs (called “Canalisation”).
Unlike other developing countries China put higher tariff on consumer and
producer goods. The tariff is high, and sometime they became unaffordable.
Methodology
Two indices are adopted in this chapter are the Similarity index (SI)
(Kreinin and Finger 1979) and Trade Complementarity Index (TCI) (Michaley,
1996). In order to calculate the similarity of the exports between any two
countries to a third market, SI is used. The objective of SI is to assess
similarity or patterns of exports across product categories between any two
countries, from which an assessment of the degree to which their trade

90
structure becomes more similar or more divergent, can be accomplished. By
contrast, TCI is used to assess structural complementarity of trade between
two countries, whether these two countries complement to each other.
Similarity Index (SI)
Our primary interest is to identify the trade linkages between India
and China, with both cross-sectional and time series analyses. Our objective
is to assess ‘how similar are India and China exports?’ and ‘How competitive
are India and China exports in third market?’ Finally, ‘Are the export
similarities between India and China divergent or convergent? And what are
the driving forces behind these trends?. Thus, we need to apply similarity
index.
Assessment of similarity of the export composition or patterns
between any two countries or group of groups is given by the equation (1).
S (xy, z) = { Minimum [Xi (xz), Xi (yz)]} 100 -------------- (1)
(Or) S (xy, z) = {Mini (xz) +Mini (yz)} 100 -------------- (1)
'x' (India) and 'y' (China) to market 'z' (world), Xi (xz) is the share of commodity i in x's exports to z.
Similarly Xi (yz) is the share of commodity i in y’s exports to z.
If the commodity distribution of a's and b's exports are identical (Xi
(ac) = Xi (bc) for each i), the index will take on a value of 100. Suppose a's
and b's export patterns are totally dissimilar (for each Xi (ac) >0, Xi (bc) = 0,
or vice versa), the index will take on a value of zero. Finally, one can
observe changes over time in the similarity of exports between any two
countries or groups of countries, and thereby assess the degree to which
their economic structure becomes more similar or divergent.
While measuring SI, in order to eliminate the influence of relative sizes
or scales of total exports, the exports of, say ‘a’, must be rescaled so that
they are equal in total to those of ‘b'.

91
An advantage of such an index over other measures is that it requires
only international trade data, and these are available on a standardized
basis for all countries. In what follows we present and explain an index of
export similarity.
Limitations of Similarity Index
Disaggregation is needed to ensure that the similarity index can
provide more accurate measures. The high similarity index could occur from
using an aggregate trade data. In addition, size of exports from each
exporting country does matter and it is not taken into account by this index.
Results from this index include impacts of trade, investment and exchange
rate policies from these two countries.
Trade Complementatrity Index (TCI)
The ‘structural complementarity of trade’ between regions A and B is
measured by TCI. The low level of TCI indicates that limited access of region
B into A. However, such dissimilarity in structure between the two regions
could provide an opportunity for trade expansion in the future between the
two economies. In other words, this may increase chances for a more
successful FTA between these two countries. The TCI is represented as
follows (TCI: Michaley, 1996)
𝑻𝑪𝑰(𝒙𝒚) = 𝟏𝟎𝟎 ∗ [𝟏 −∑|𝑰𝒎𝒑𝒐𝒓𝒕𝒔𝒊𝒙 − 𝑬𝒙𝒑𝒐𝒓𝒕𝒔𝒊𝒚
𝟐|
𝒏
𝒊=𝟏
]
Where x=China
y=India i=common good (e.g. manufacturing goods, electronic goods)
| |= absolute value (i.e., Negative sign is neglected) Import ix = China total import of good i from World Export iy = India total export of good i to China
The TCI is a measure of potential trade between two partners by
comparing the export portfolio of country x to the import portfolio of
country. If TCI is low, then it indicates that no goods exported by one
country or imported by the other (i.e. TCI = 0, means there is no

92
complementarity), and if TCI is high then, the export and import structure
exactly complements each other between two countries (i.e. TCI = 100,
means there is high complementarity). Intuitively, the index indicates
whether there is a complementarity between the demand by one country
and the supply by the other. In the index logic, trade complementarity
between two partners is considered to be high when the products imported
by country x are the same as the ones exported by country y. (Note:
However, the TCI has an inherent size bias, i.e. a sub region whose export
portfolio is limited (or smaller than other sub regions) will end up with having
a lower TCI value.)
Data for Analysis
The data were obtained from UNCTAD in Harmonize System at 6 digit
level for the period of 2003, 2006, and 2009. The Similarity Index (SI) and
Trade Complementarity Index (TCI) are calculated from 6 digits and then
summarized into 2 digits in order to analyze the SI and TCI of India
according to product categories. The country chosen to compare similarity
and complementarity in trade with India is China. For assessing trade
complementarity (TCI) in addition to comparing India with China, we also
compare two ASEAN countries, i.e. Thailand and Malaysia, with China.
Comparing India with other ASEAN countries in Chinese market would help
us to clearly reveal opportunity of India trade within the Chinese market.
Findings and Analysis
Similarity Index (SI)
The result of Similarity Index for 2003, 2006 and 2009 is 24.5%,
24.47% and 26.0% respectively. Hence, there is a moderately low degree of
similarity between India and China, there has been a slow progress in their
similarity in export structure. According to Table appendix A-1, disaggregate
data show that the export structures of products between India and China
were not similar over the period for 2003, 2006 and 2009. Though
similarities in export structure are quite insignificant, India is facing
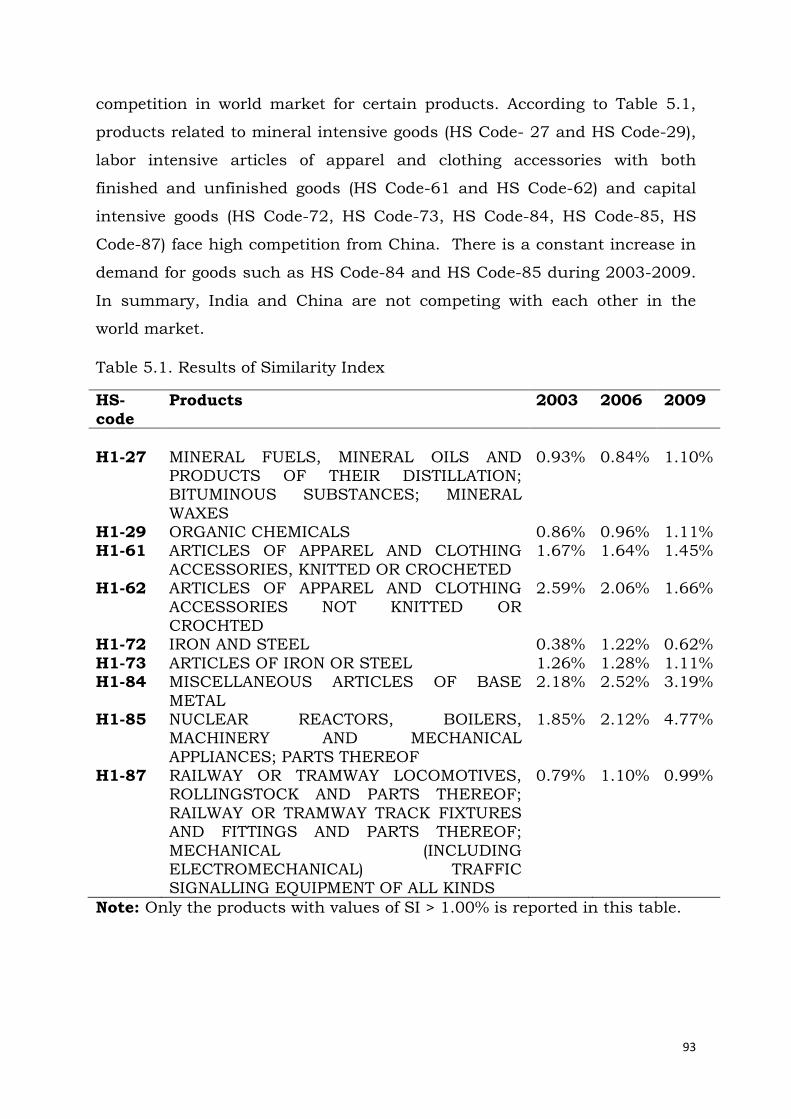
93
competition in world market for certain products. According to Table 5.1,
products related to mineral intensive goods (HS Code- 27 and HS Code-29),
labor intensive articles of apparel and clothing accessories with both
finished and unfinished goods (HS Code-61 and HS Code-62) and capital
intensive goods (HS Code-72, HS Code-73, HS Code-84, HS Code-85, HS
Code-87) face high competition from China. There is a constant increase in
demand for goods such as HS Code-84 and HS Code-85 during 2003-2009.
In summary, India and China are not competing with each other in the
world market.
Table 5.1. Results of Similarity Index
HS-
code
Products 2003 2006 2009
H1-27 MINERAL FUELS, MINERAL OILS AND PRODUCTS OF THEIR DISTILLATION; BITUMINOUS SUBSTANCES; MINERAL
WAXES
0.93% 0.84% 1.10%
H1-29 ORGANIC CHEMICALS 0.86% 0.96% 1.11% H1-61 ARTICLES OF APPAREL AND CLOTHING
ACCESSORIES, KNITTED OR CROCHETED
1.67% 1.64% 1.45%
H1-62 ARTICLES OF APPAREL AND CLOTHING
ACCESSORIES NOT KNITTED OR CROCHTED
2.59% 2.06% 1.66%
H1-72 IRON AND STEEL 0.38% 1.22% 0.62%
H1-73 ARTICLES OF IRON OR STEEL 1.26% 1.28% 1.11% H1-84 MISCELLANEOUS ARTICLES OF BASE
METAL
2.18% 2.52% 3.19%
H1-85 NUCLEAR REACTORS, BOILERS, MACHINERY AND MECHANICAL
APPLIANCES; PARTS THEREOF
1.85% 2.12% 4.77%
H1-87 RAILWAY OR TRAMWAY LOCOMOTIVES, ROLLINGSTOCK AND PARTS THEREOF;
RAILWAY OR TRAMWAY TRACK FIXTURES AND FITTINGS AND PARTS THEREOF;
MECHANICAL (INCLUDING ELECTROMECHANICAL) TRAFFIC SIGNALLING EQUIPMENT OF ALL KINDS
0.79% 1.10% 0.99%
Note: Only the products with values of SI > 1.00% is reported in this table.
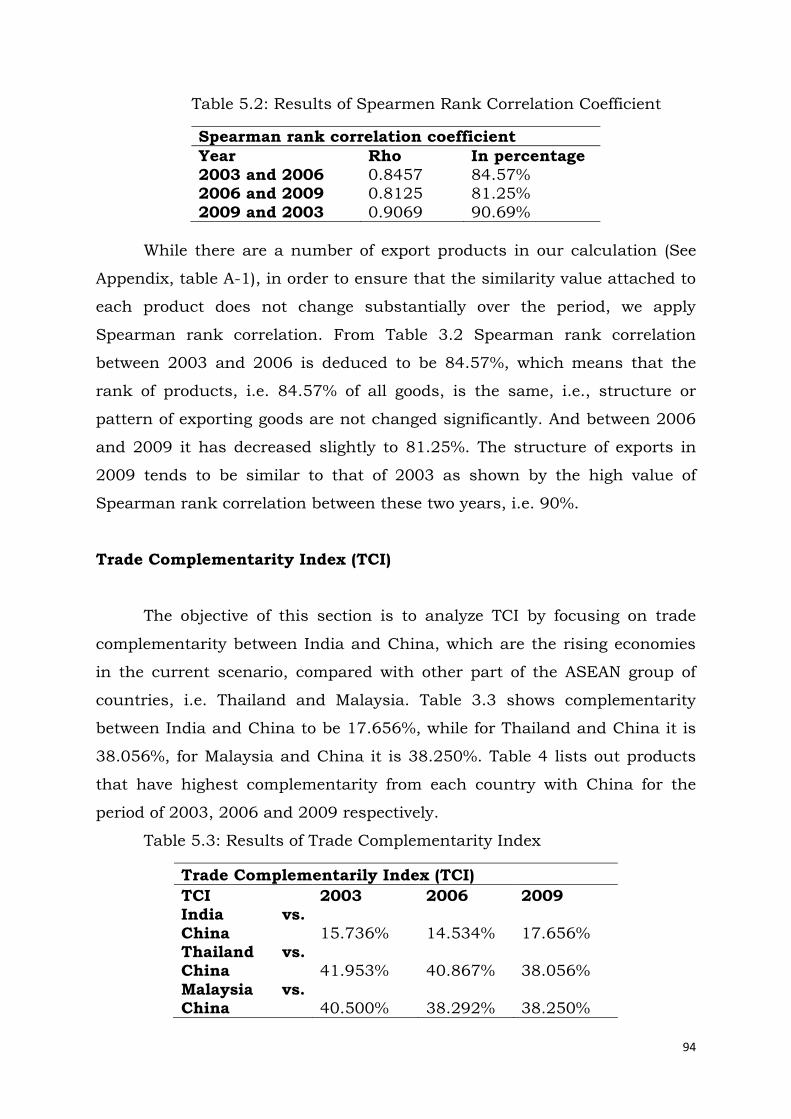
94
Table 5.2: Results of Spearmen Rank Correlation Coefficient
Spearman rank correlation coefficient
Year Rho In percentage
2003 and 2006 0.8457 84.57% 2006 and 2009 0.8125 81.25%
2009 and 2003 0.9069 90.69%
While there are a number of export products in our calculation (See
Appendix, table A-1), in order to ensure that the similarity value attached to
each product does not change substantially over the period, we apply
Spearman rank correlation. From Table 3.2 Spearman rank correlation
between 2003 and 2006 is deduced to be 84.57%, which means that the
rank of products, i.e. 84.57% of all goods, is the same, i.e., structure or
pattern of exporting goods are not changed significantly. And between 2006
and 2009 it has decreased slightly to 81.25%. The structure of exports in
2009 tends to be similar to that of 2003 as shown by the high value of
Spearman rank correlation between these two years, i.e. 90%.
Trade Complementarity Index (TCI)
The objective of this section is to analyze TCI by focusing on trade
complementarity between India and China, which are the rising economies
in the current scenario, compared with other part of the ASEAN group of
countries, i.e. Thailand and Malaysia. Table 3.3 shows complementarity
between India and China to be 17.656%, while for Thailand and China it is
38.056%, for Malaysia and China it is 38.250%. Table 4 lists out products
that have highest complementarity from each country with China for the
period of 2003, 2006 and 2009 respectively.
Table 5.3: Results of Trade Complementarity Index
Trade Complementarily Index (TCI)
TCI 2003 2006 2009 India vs.
China 15.736% 14.534% 17.656% Thailand vs. China 41.953% 40.867% 38.056%
Malaysia vs. China 40.500% 38.292% 38.250%
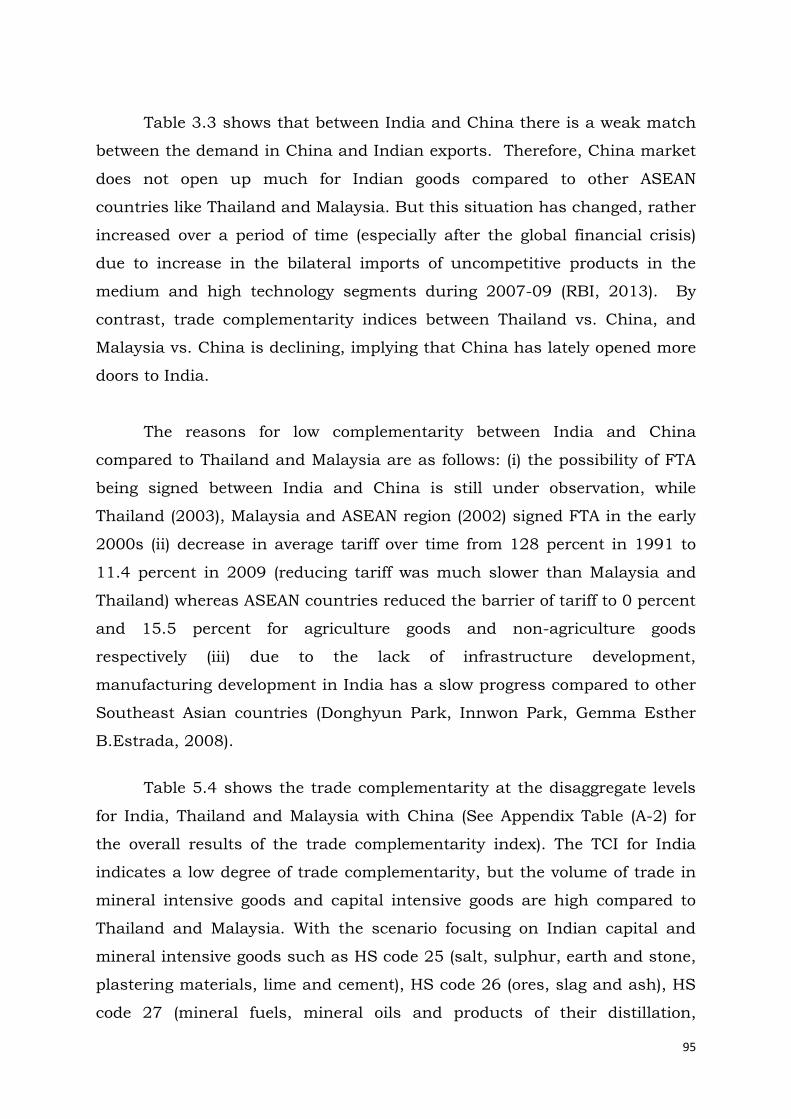
95
Table 3.3 shows that between India and China there is a weak match
between the demand in China and Indian exports. Therefore, China market
does not open up much for Indian goods compared to other ASEAN
countries like Thailand and Malaysia. But this situation has changed, rather
increased over a period of time (especially after the global financial crisis)
due to increase in the bilateral imports of uncompetitive products in the
medium and high technology segments during 2007-09 (RBI, 2013). By
contrast, trade complementarity indices between Thailand vs. China, and
Malaysia vs. China is declining, implying that China has lately opened more
doors to India.
The reasons for low complementarity between India and China
compared to Thailand and Malaysia are as follows: (i) the possibility of FTA
being signed between India and China is still under observation, while
Thailand (2003), Malaysia and ASEAN region (2002) signed FTA in the early
2000s (ii) decrease in average tariff over time from 128 percent in 1991 to
11.4 percent in 2009 (reducing tariff was much slower than Malaysia and
Thailand) whereas ASEAN countries reduced the barrier of tariff to 0 percent
and 15.5 percent for agriculture goods and non-agriculture goods
respectively (iii) due to the lack of infrastructure development,
manufacturing development in India has a slow progress compared to other
Southeast Asian countries (Donghyun Park, Innwon Park, Gemma Esther
B.Estrada, 2008).
Table 5.4 shows the trade complementarity at the disaggregate levels
for India, Thailand and Malaysia with China (See Appendix Table (A-2) for
the overall results of the trade complementarity index). The TCI for India
indicates a low degree of trade complementarity, but the volume of trade in
mineral intensive goods and capital intensive goods are high compared to
Thailand and Malaysia. With the scenario focusing on Indian capital and
mineral intensive goods such as HS code 25 (salt, sulphur, earth and stone,
plastering materials, lime and cement), HS code 26 (ores, slag and ash), HS
code 27 (mineral fuels, mineral oils and products of their distillation,

96
bituminous substances, mineral waxes) and HS code 28 (inorganic
chemical, organic or inorganic compounds of precious metals, rare earth
metals or radioactive elements or isotopes), and capital intensive goods such
as HS code 72 (iron and steel), HS code 74 (copper and articles), HS code 83
(base metals), HS code 84 (nuclear reactors, boilers, machinery and
mechanical appliances), HS code 85 (electrical machinery and equipment
and parts), HS code 86 (rolling stock and parts, railway locomotives), HS
code 87 (vehicles other than railways) and HS code 90 (surgical instruments
and apparatus, parts and accessories) are dominating, in comparison to
Malaysia and Thailand. In summary, for India, it shows a high level of
complementarity in the mineral goods (HS code 25, HS code 26, HS code 27,
HS code 28) and capital intensive goods (HS code 72, HS code 74, HS code
83, HS code 84, HS code 85, HS code 87, HS code 86, HS code 90), and it is
steadily improving between (2003 to 2009) compared to Thailand and
Malaysia.
All in all, both similarity and complemntarity indices show that India
and China are still not in competition in the world market, and the threat of
China to India in the world market is relatively limited. However, based on
TCI, the Chinese market is not open to most Indian products, except
mineral intensive products and capital intensive goods. Other Asian
countries, especially east and southeast ssia are still key trading partners
with China. However, it seems that the complementarity between India and
China has increased to 17.656% in 2009 since 15.736% in 2003, implying
China’s open door for more Indian products, i.e. more opportunity for Indian
products in Chinese market. Simultaneously, exports from other important
partners such as Thailand and Malaysia have decreased in the Chinese
market, especially after the global financial crisis. Thus, more opportunities
have opened for Indian products in the Chinese market.

97
Table 5.4: Trade Complementarily Index (TCI)
HS-code
Products India Thailand Malaysia
2003 2006 2009 2003 2006 2009 2003 2006 2009
HS-07
EDIBLE VEGETABLES AND CERTAIN ROOTS AND TUBERS
0.12%
0.17%
0.12%
0.84%
1.31%
1.13%
0.03%
0.05%
0.05%
HS-12
OIL SEED OLEAGINOUS FRUIT;
MISCELLANEOUS GRAIN, SEEDS
AND FRUIT; INDUSTRIAL OR MEDICINAL PLANTS; STRAW AND FODDER
1.06
%
0.55
%
1.09
%
0.69
%
0.52
%
1.05
%
0.69
%
0.51
%
1.04
%
HS-15
ANIMAL OR VEGETABLE FATS AND OILS AND THEIR CLEAVAGE PRODUCTS; PREPARED EDIBLE FATS; ANIMAL OR VEGETABLE WAXES
0.53%
0.54%
0.85%
0.33%
0.23%
0.40%
3.92%
3.37%
4.19%
HS-25
SALT; SULPHUR; EARTH AND
STONE; PLASTERING MATERIALS, LIME AND CEMENT
15.42%
1.18%
1.06%
0.16%
0.14%
0.15%
0.13%
0.13%
0.12%
HS-26
ORES, SLAG AND ASH
24.55%
26.71%
0.87%
2.00%
3.25%
0.85%
1.97%
3.26%
HS-27
MINERAL FUELS, MINERAL OILS AND PRODUCTS OF THEIR
DISTILLATION; BITUMINOUS SUBSTANCES; MINERAL WAXES
3.37
%
5.34
%
6.01
%
1.59
%
3.80
%
5.60
%
1.42
%
4.83
%
4.72
%
HS-28
INORGANIC CHEMICAL; ORGANIC OR INORGANIC COMPOUNDS OF PRECIOUS METALS, OF RARE EARTH METALS, OF RADIOACTIVE ELEMENTS OR OF ISOTOPES
1.50%
1.43%
0.47%
0.34%
0.39%
0.31%
0.46%
0.32%
HS-29
ORGANIC CHEMICALS
3.65%
3.68%
3.15%
2.41%
3.62%
2.55%
2.25%
2.24%
1.81%
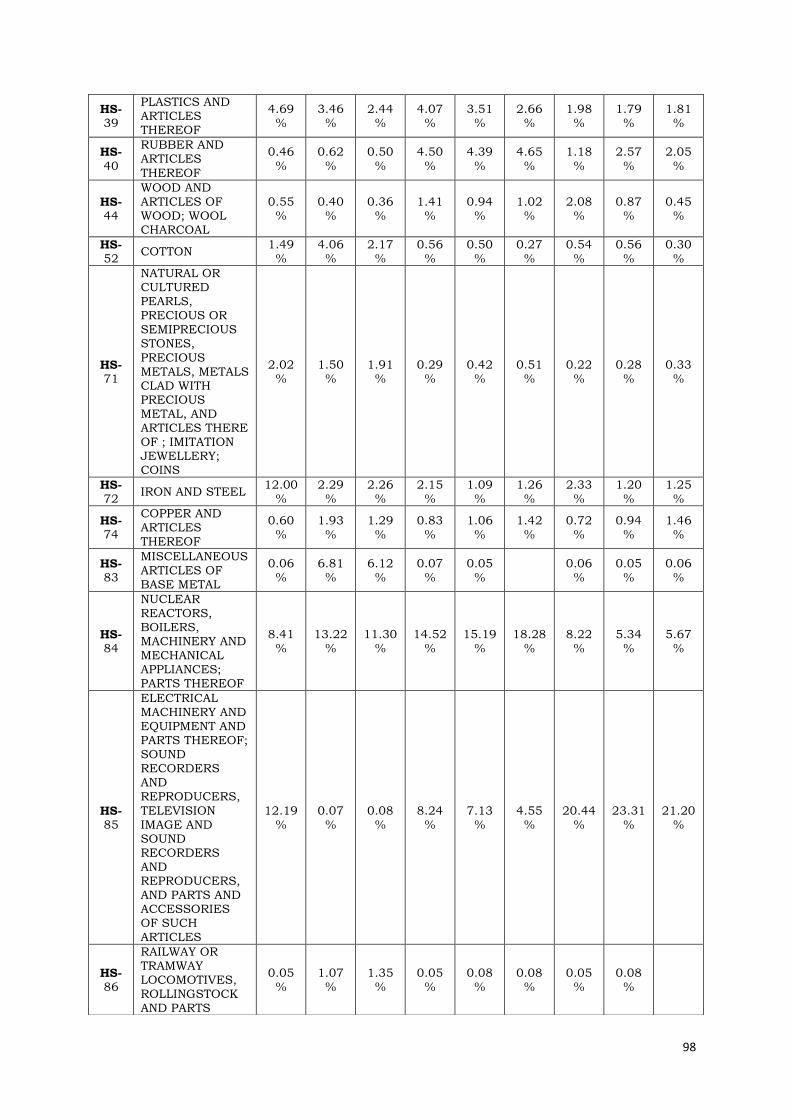
98
HS-39
PLASTICS AND ARTICLES THEREOF
4.69%
3.46%
2.44%
4.07%
3.51%
2.66%
1.98%
1.79%
1.81%
HS-40
RUBBER AND ARTICLES
THEREOF
0.46
%
0.62
%
0.50
%
4.50
%
4.39
%
4.65
%
1.18
%
2.57
%
2.05
%
HS-44
WOOD AND ARTICLES OF WOOD; WOOL CHARCOAL
0.55%
0.40%
0.36%
1.41%
0.94%
1.02%
2.08%
0.87%
0.45%
HS-52
COTTON 1.49
% 4.06
% 2.17
% 0.56
% 0.50
% 0.27
% 0.54
% 0.56
% 0.30
%
HS-71
NATURAL OR CULTURED PEARLS, PRECIOUS OR
SEMIPRECIOUS STONES,
PRECIOUS METALS, METALS CLAD WITH PRECIOUS METAL, AND ARTICLES THERE OF ; IMITATION JEWELLERY; COINS
2.02%
1.50%
1.91%
0.29%
0.42%
0.51%
0.22%
0.28%
0.33%
HS-72
IRON AND STEEL 12.00
% 2.29
% 2.26
% 2.15
% 1.09
% 1.26
% 2.33
% 1.20
% 1.25
%
HS-74
COPPER AND ARTICLES THEREOF
0.60%
1.93%
1.29%
0.83%
1.06%
1.42%
0.72%
0.94%
1.46%
HS-83
MISCELLANEOUS ARTICLES OF BASE METAL
0.06%
6.81%
6.12%
0.07%
0.05%
0.06%
0.05%
0.06%
HS-84
NUCLEAR REACTORS, BOILERS, MACHINERY AND MECHANICAL APPLIANCES; PARTS THEREOF
8.41%
13.22%
11.30%
14.52%
15.19%
18.28%
8.22%
5.34%
5.67%
HS-85
ELECTRICAL MACHINERY AND EQUIPMENT AND PARTS THEREOF; SOUND
RECORDERS AND REPRODUCERS,
TELEVISION IMAGE AND SOUND RECORDERS AND REPRODUCERS, AND PARTS AND ACCESSORIES OF SUCH ARTICLES
12.19%
0.07%
0.08%
8.24%
7.13%
4.55%
20.44%
23.31%
21.20%
HS-86
RAILWAY OR TRAMWAY LOCOMOTIVES, ROLLINGSTOCK AND PARTS
0.05%
1.07%
1.35%
0.05%
0.08%
0.08%
0.05%
0.08%

99
Note: Only products with values of TCI > 1.00% is reported in this table
THEREOF; RAILWAY OR TRAMWAY TRACK FIXTURES AND FITTINGS AND PARTS THEREOF; MECHANICAL (INCLUDING ELECTROMECHA
NICAL) TRAFFIC SIGNALLING EQUIPMENT OF ALL KINDS
HS-87
VEHICLES OTHER THAN RALIWAY OR
TRAMWAY ROLLINGSTOCK, AND PARTS AND ACCESSORIES THEREOF
1.37%
0.69%
0.52%
1.28%
0.93%
1.32%
1.41%
1.09%
HS-90
OPTICAL, PHOTOGRAPHIC, CINEMATOGRAPHIC, MEASUREING, CHECKING,
PRECISION, MEDICAL OR SURGICAL INSTRUMNTS AND APPARATUS; PARTS AND ACCESSORIES THEREOF
3.19%
0.08%
0.08%
3.06%
3.65%
2.97%
2.59%
3.52%
3.28%

100
Concluding Observations
The China and India trade reforms took place in a gradual and
sequential manner. Though, India started its comprehensive trade policy
reforms a decade later than China, but the achievement has far below
expectations. Mainly due to poor performance of industrial growth and
declined in the share of agriculture was absorbed by services sector. Market
penetration has been slower than China and other ASEAN countries due to
poor infrastructure and regulation burden, which has increased
transportation cost and cumbersome and procedures on imports and
exports. Finally, ease of trade, non agriculture tariff and non trade barriers
(NTB) is higher than South Asian countries (SAC), ASEAN and developing
countries of Asia.
In the context of bilateral trade between these two countries, there is
an increase in trade deficit since 2005, due to China higher tariff on goods
where India has competitive advantage. Therefore, India should expand
exports in the sectors like manufacturing (textiles and clothing), since is
China moving from labor intensive products to more advanced technology
oriented products, automobile manufacturing through joint ventures and
pharmaceuticals where China lack in producing generic branded
pharmaceuticals products to reduce the trade gap.
The results of Similarity Index (SI) and Trade Complementarity Index
(TCI) shows that India and China are not competitors in the world market,
but India faces tough competition from China in labor intensive products
such as textiles and clothing (HS-code 61 and HS-code 62), miscellaneous
articles of base metals (HS code-84), and capital intensive goods (HS-code
85 and HS-code 87). This result implies that threat from Chinese products
is relatively limited. Further, TCI between India and China indicates that
Chinese market is still not open for Indian goods compared to other
countries like Thailand and Malaysia. The complementarity between
Malaysia and Thailand is higher than India. However, there is an increase

101
in trade complementarity with India after the global financial crisis due to
increase in imports uncompetitive products related to medium and high
technology segments during 2007-09. Therefore, there is a limited scope for
prospective of escalation in trade relations between these two countries.
References
1. Arvind Panagariya (2004), “India in the 1980s and 1990s: A Triumph of Reforms”, IMF Working Paper No.43
2. Bhagwati, Jagdish and Padma Desai, 1970, India: Planning for Industrialization, London: Oxford University press.
3. Charan Wadhva (1988), “Import and Export Policy 1988-91: A Provisional Appraisal”, Economic and Political Weekly, Vol. 23, No. 26 (Jun. 25, 1988), pp. 1331-1337
4. Deepak Nayyar “India’s export performance 1970-85: Underlying factors and constraints.”
5. J. M. Finger and M. E. Kreinin (1979), “A Measure of `Export Similarity' and Its Possible Uses”, the Economic Journal, Vol. 89, No. 356 (Dec., 1979), pp. 905-912
6. Lawrence R. Lawlor Source (1980), “Overlap, Similarity, and Competition Coefficients”, Ecology, Vol. 61, No. 2, pp. 245-251
7. Sanjaya Lall (1999), “India's Manufactured Exports: Comparative
Structure and Prospects”, World Development Vol. 27, No. 10, pp. 1769±1786, 1999
8. Bernadette Andreosso-O’Callaghan (2008), “Economic structural complementarity: how viable is the Korea-EU FTA?” Journal of Economic Studies Vol. 36 No. 2, 2009 pp. 147-167
9. Ding Dong and Iyabo Masha (2012), “India’s growth spillovers to south Asia”, IMF working paper No.56.
10. Donghyun Park, Innwon Park, Gemma Esther B. Estrada (2008), “Prospects of an ASEAN–People’s Republic of China Free Trade Area: A Qualitative and Quantitative Analysis” ADB Economics Working Paper
Series No. 130 11. Douglas H. Brooks and Benno Ferrarini (2010), “Changing Trade
Costs between People's Republic of China and India”, ADB Economics
Working Paper Series No. 203 12. Dr. Weiguo Lu (1995), Reforms of china’s foreign trade policy”,
Department of Parliamentary Library, Parliamentary Research Service, Research Paper No.19, 1995-96
13. Eric V. Edmonds, Nina Pavcnik, and Petia Topalova (2007), “Trade
adjustment and human capital investment: Evidence from Indian Tariff Reform”, IMF working paper No.94.
14. Françoise Lemoine (1996), “A Comparison between China and the CEECs”, CEPII
15. Jerald Schiff, Enric Fernandez, Renu Kohli, Sudip Mohapatra,(2006),
“India: Selected Issues”, IMF Country Report No. 06/56

102
16. Michaely, M (1996), “Trade Preferential Agreements in Latin America: An Ex Ante Assessment,” Policy Research Working Paper, No. 1583,
World Bank. 17. N. N. Kotlyarov (2010), “The major direction of India’s foreign trade
development” International and regional economy, vol. 510, 18. Pankaj Ghemawat and Murali Patibandla (1998), “India's Exports
since the Reforms”, Economic and Political Weekly, Vol. 33, No. 20 (May
16-22, 1998), pp. 1196-1198 19. Qureshi, Mahvash Saeed, and Guanghua Wan (2008), "Trade
Expansion of China and India: Threat or Opportunity?" The World
Economy: 1327-1350. 20. S. Bhalla (1995), “Recent Economic Reforms in China and India”
Asian Survey, Vol. 35, No. 6 (Jun., 1995), pp. 555-572 21. SK Mohanty, (2013), “India-China Bilateral Trade Relationship” RBI
Research Study
22. Vaillant, M. and Ons, A. (2002), “Preferential trading arrangements between the European Union and South America: the political economy
of free trade zones in practice”, The World Economy, Vol. 25 No. 10, pp. 1433-68.
URL
U1: Ajai chopra, Woosik chu, Oliver fratzscher (1995), “structural reforms and implications for investment and growth”, international Monetary Fund
(IMF), Occasional Paper 134.
(http://books.google.co.in/books?hl=th&lr=&id=DnHdIntTqrcC&oi=fnd&pg=PP9&dq=EXTERNAL+ECONOMIC+SITUATION+IN+INDIA&ots=3PTvFXm3Om&sig=r5fgYG6r06dAAsJwvkL8hx4UNqc#v=onepage&q&f=false)
U2: Trade Policy Review; China, WTO, (http://www.wto.org/english/tratop_e/tpr_e/tp330_e.htm)
U3: Tariff structure of India from 1990-2009,
(http://planningcommission.nic.in/data/datatable/index.php?data=datatab)
U4: The US-China Business Council, China Trade structure (2010), (http://www.uschina.org)
U5: India and China Bilateral agreement, (http://www.bilaterals.org/spip.php?article11731)
U6: Economic survey of India (http://indiabudget.nic.in/index)
U7: Directorate General of Foreign Trade, Foreign Trade Policy
(http://dgft.gov.in)
103
Role of India and Asia in the Global Economy
R. Kannan
The Asia’s role in Global Economic Development is becoming significant
after the recent economic and banking crisis in the world. The global crisis
had an impact on the economic performance of all the economies in the
world but the countries from Asia were still able to report growth rates
which were higher than the growth rates reported in other parts of the
world. Asia contributes to more than 50% of incremental economic growth
in the world.
Within Asia, India and China continue to have a major contribution to the
economic growth. The sheer size of the population of both countries and the
continued demand for products and services in two countries continue to
sustain the economic growth today and this will be the trend in future.
India and China were playing a major role in the Global Economy before the
rise of UK. After the dominance of UK, USA Started playing a major role in
the global economic development. After the World War II, Japan was growing
very fast and then we saw the rise of countries from ASEAN. From 1980
onwards, the economic growth in China started gaining momentum and the
country is still able to sustain the high growth today. From 2001, we heard
the concept of BRIC and terms like VISTA, CIVET, MENA and MINT and how
they can contribute to the global growth.
India and China are in the process of regaining their prominence in the
world and China is already leading the world in terms of Forex reserves with
a forex reserves of more than 3.8 trillion dollars. The road to regaining the
competitiveness is strewn with both opportunities and risks. To achieve the
potential today, both countries have to carefully calibrate their movements
in the Economic, Political, Social, Cultural, Technological, Security and
Environmental aspects.

104
India and China have to work very closely in all these areas to realise the
full potential of Asia.
Economy: Indian Economy after reporting a good growth for few years saw
the rate of growth decline due to both internal and external factors. The
potential for growth is still at 8% and the solutions are available to achieve
the 8% growth. What is required is the consensus building among the
various stake holders in adoption of the policies for achieving the growth.
The sectors like manufacturing and agriculture have to be given more
importance, going forward. The proposed Industrial corridor projects in
India will provide a momentum to the growth and there is an increased
interest from various countries in the world to participate in these projects
and FDI is likely to come through this route to support these projects. It
should be possible to increase the contribution of industry to country’s GDP
to 25% from the present level of 15% by increasing the alliances with
countries like Japan, US, China, UK, etc in the world.
There were concerns regarding the fiscal deficit and current account deficit
and it has been proven in the recent past that by adopting innovative
policies it should be possible to bring down the deficit. India is inherently
strong due to its large informal sector which was one of the main reasons for
India weathering the storm during the crisis. This sector can play a major
role in sustaining the growth rate and creating employment opportunities in
the Indian Economy.
India has been recognized today as an IT Hub, Pharma Hub, R&D Hub,
Automotive Hub, Diamond and Jewellery Hub, Leather Hub and global
companies in these areas had increased their interest in India and new
units are being set up in these areas. Global sourcing companies also had
established their offices in India apart from China. These sectors in India
will continue to do well going forward.
China’s continued Economic growth had helped to gain the global leadership
role today and the country has trade balance with many of the countries in
the world. The focus on creating large industries with government and bank
105
financing support enabled Chinese companies to emerge as the largest
companies in the world in the sectors, they operate today. So far the
economic growth was driven by the strategy of exports as well as inflow of
FDI. After the recent crisis and reduced demand for exports, there was a
need for rebalancing the economy. The need to focus on creating internal
demand had become paramount. In the recent past, there were also
concerns about the rising inflation and interest rates.
China has to continue the engagement with other counties in the world and
apart from focussing on exports, there is also a need to look at reducing the
trade balance with other countries in the world. If Yuan, continues to rise, it
will erode the competitiveness of exports. The Yuan level could be
maintained only by reducing the trade balance with other countries. To
ensure the continued availability of resources, the country already had
acquired mines and industrial production facilities in many parts of the
world. China is the largest foreign investor in US treasury bonds today and
because of this reason, there is a need to ensure the stability and strength
of the dollar. China’s efforts to make Yuan as one of the major currencies for
trading will take shape in a few years and Dollar will continue to have its
dominance for many more years to come.
China’s economic growth was mainly driven by focus on Industrial growth
and it has emerged as the power house for manufacturing in the world
today. Starting from a strategy of producing low cost goods , there is now a
movement towards manufacturing of high quality , high value goods in the
manufacturing sector. The country has to liberalise FDI and strengthen the
Trade and Patent laws to ensure a benign environment for foreign investors.
Going forward, there should be an increased focus on developing the
domestic market and increasing the purchasing power of workers in the
country.
Society: India is a multicultural society and there is a lot of diversity in
Customs, habits and Income levels. In the last few years, the society had
gone through a big transformation and the consumers are able to exercise
the choice for the products, they prefer. The liberalisation of economy has
106
created hyper competition in many industries. As per the latest
classification, the Indian consumer is categorised into twelve income groups
and there is a constant upward movement of people from one level to other
level. There is a free movement of labour from one city to another city and
there is a lot of internal migration whereby people from rural areas move to
urban areas. The mobile technology revolution in the country has helped
even Semi urban and rural areas to look at aspects relating to urbanisation
and the government’s schemes on providing employment for minimum
number of days work in rural areas have created employment opportunities
for people. The services as a sector is also developing well in rural areas .
There is a movement away from Joint family system to nuclear family
system. These trends create a huge demand for consumer products of
various categories at different price points. This has attracted the attention
of global marketers to India.
In China, the demand for high end products had seen a big rise in demand
over the years. The purchasing power of people in urban areas has gone up
significantly. System of providing work permits to workers to work in a city
has restricted the movement of labour and depressed the wages in the
manufacturing sector. Many of the workers at the lower level come to work
from far away distances. But the recent trend in increase in wage levels, if it
continues, will create different income segments and create new class of
customer segments for the products. This will also result in consumer boom,
which would partly offset the reduced demand for products from exports.
The government has taken measures to increase the population and now
people are allowed to have more than one child in a family.
The trends witnessed above, will help to create new products for the local
markets, which could be exported at a later stage.
Political and Security Issues: India being the largest democracy in the
world, the decisions at the government level have to be taken after taking
the consensus of various stake holders in the Economy. There are forces
which act against the pro economic growth policies because of which the
economic momentum slows down. The country has an approach to keep

107
very cordial relations with others and by itself does not take initiatives which
challenges the sovereignty of other nations. India is part of various
Economic Alliance forums in the world and considering its contribution,
there is an effort to obtain a permanent seat in the UN Security Council.
The country helps the adjacent countries in aspects relating to technology
and training aspects. In the last few years, there were lot of internal issues
relating to terrorism in various pockets of the country which are creating
concerns on maintaining a peaceful atmosphere. There is an increased
interest from most of the countries in the world to partner with India in all
the growth initiatives and there is a foreign business delegation visiting
India every week to identify opportunities for doing business. India has
moved ahead in various reforms including passing of RTI act and
empowering the Panchayat Institutions in the country. In line with the
increase in economic prosperity, the country also increased its defence
budget. Multilateral institutions are also supportive of India’s growth
initiatives and after the recent geo political issues in the Asian region, Japan
and US had shown increased interest in enhancing the tie up with India.
India has joined the nuclear club now and this should help to increase the
power generation from this source. China has emerged as the leading
partner for India in trade and China runs a huge trade surplus with India
today.
The present government in China will last for 10 years and they had already
drawn a plan to maintain the economic growth of China. Since China has
gained leading economic status in the world today, in line with the economic
status, it is trying to match the political status by increasing its influence on
many countries in the world. In terms of its growth ambitions, it is trying to
achieve this by acquiring the natural resources from regions like Africa and
has allowed its leading companies to take over the ailing MNC’s from the
developed world. Its economic engagement with many countries are helping
China to maintain the growth rate. Since its objective is to increase its
political influence, it is facing opposition from the entrenched players in the
world. The present form of merit based Government system is likely to

108
continue in China which is good to maintain its economic growth. To gain
political influence, China is also giving military aid to countries, low interest
loans for equipment purchase from China and various other incentives to
obtain political support. But the recent moves on Territorial disputes, have
created concerns among US and neighbouring countries.
Going forward, both the countries should use the political dispensation to
increase the economic engagement with other countries in Asia including
Myanmar, Vietnam, Malaysia, Singapore, etc. The disputes with the
neighbouring countries should be brought to an end by announcing
ceasefire. Both countries in alliance with Japan should engage in
consultation on the matters to be addressed relating to multilateral
institutions as well as developing the Asia as the Economic Hub of the
world. The political influence over other countries should be exercised
through increased economic engagement rather than seeking territorial
advances. The recent past indicates that as countries grow in economic
might, the number of wars saw a decline. Most of the time, the countries
take a posture to threaten other countries without intention to go for a war.
Instead of this strategy, the best to way to achieve the political influence is
through adopting a strategy of win win and identify action plans for mutual
cooperation. There should also be consultations on addressing the internal
terrorism issues and sharing the best practices between the countries in
addressing this issue.
Technology: The recent developments in communication and mobile
technologies had a significant impact on most of the economies and how the
business is being done. Both India and China have benefited a lot from the
mobile technologies and the social / financial inclusion could be achieved
through adopting more applications of this technologies.
In other areas, there is still lot of gap in availability of technologies which is
being bridged through creating strategic alliances with the leading players in
the world. The leading companies in the world from various sectors are
already present in both countries and all of them want to increase their
engagement.

109
India was successful in some of the space initiatives and in the process of
developing a robust domestic Defence manufacturing base. China is already
advanced in the technologies relating to warfare and it is in the process of
manufacturing its own Air craft for commercial purposes. Both countries
have their own home grown labour intensive technologies which are in wide
use across the country. There is an increased need felt for creating patents
for the local products and systems are put in place to create more patents.
The low cost labour intensive technologies in both countries could be
transferred to countries where there is a strategy to promote SME’s.
Environmental issues: There is a pressure on both countries to reduce the
pollution levels. But on per capita basis, the levels are still low. Considering
the need for further economic growth and increased level of manufacturing,
it would be impossible to meet the global standards. Few more years are
required for China and India to move towards to the global standards. In the
meanwhile, we have to build a consensus on the need for pursuing the
manufacturing strategy and this could be done with the help of emerging
environment friendly technologies.
In the coming years, opportunities and Challenges are many for the
countries from Asia. India and China are well poised to capitalize on these
opportunities. India and China has to co-operate in all the endeavours as
partners in progress and the focus of partnership should be based on
economic fundamentals and the influence of political considerations should
become secondary, while realizing the opportunities. India, China and Japan
can take a joint leadership in realizing the full potential of Asia’s Economic
Growth and let us hope Economic collaboration will take precedence over all
other collaborations between these countries.

110
Capital Markets Development and Economic Growth
: An Asian Perspective
Dr. Sarat Kumar Malik & Ms Akriti
Executive Summary
Capital markets play a significant role in the economic development of a
nation. Well functioning markets insure that both corporations and
investors get or receive fair prices for their securities. The existence of well-
developed capital markets augments the efficiency of the allocation of
financial resources in an economy. Capital market development is being
seen as an essential factor for the long-term growth prospects of the
country. Besides stimulating economic growth, a well-developed capital
market contributes significantly to the further development of the financial
sector. In particular, a well developed capital market will introduce new
financial products and incentives for existing financial institutions to
become more competitive. In other words, it will enhance market
mechanisms in the financial sector with benefits for the economy. Efficient
capital markets are important as they contribute to a better pricing and
allocation of financial resources. Furthermore, a well-developed domestic
capital market attracts foreign investors, which in addition contributes to
the growth of the nation. Strong capital markets provide high-quality and
easily accessible information that lowers transaction costs, which in turn
improves resource allocation and boosts economic growth.
The paper examines the importance of capital markets in facilitating
superior economic performance. It studies how the well-developed capital
markets generates economic benefits and leads to growth of an economy.
Key Words: Asian economies, Capital markets, SEBI, Economy growth,
Developments

111
Introduction
Across the globe, the financial markets have been a strong determinant in
the overall economic growth of any country. Developed, stable and mature
capital markets helps in channelizing household savings towards capital
formation which indeed leads to economic growth. The objective of economic
growth in any country is to promote the well-being and improve the
standard of living of its people. Capital market plays an extremely important
role in promoting and sustaining the growth of an economy and provides an
efficient means of resource mobilization and allocation. Instruments such as
bonds, equities, units of mutual funds etc. definitely provides diverse
investment avenue for the public. Uncertain outlook of the global economy
and sluggish growth in many countries have further augmented the need to
raise capital from domestic sources to finance the country's overall growth.
A well-functioning stock market helps the growth process in an economy by
increasing savings, allocating investment resources efficiently and ensuring
better utilization of the existing resources. It encourages savings by
providing the households with an additional instrument which may better
meet their risk-return preferences and liquidity needs. It accelerates growth
by facilitating the ability to trade ownership of funds without disrupting the
production processes within firms and allowing agents/investors to diversify
portfolios. It encourages firm investment by increasing the liquidity of
investment, reducing productivity risks and improving firm efficiency. The
stock market also plays a crucial role in allocating capital to the corporate
sector which has beneficial effects for the rest of the economy. Developed
capital markets leads to macro-economic benefits like higher economic
growth, increased productivity and capital growth, improved employment
opportunities, flexible financing for companies and a better developed
financial sector.

112
It is needless to say that the financial markets (banks and the securities
markets) finance economic growth. The banks and securities markets are
two competing mechanisms to channel savings to investment. The securities
markets score over banks in the allocational efficiency, as it allocates
savings to those investments which have potential to yield higher returns.
**This paper is written by Dr. Sarat Kumar Malik, Joint Director, SEBI and Ms.
Akriti, Officer-Research SEBI. The views expressed in the paper are that of the
authors and do not necessarily reflect views of the SEBI
This inevitably leads to higher returns to savers on their savings and higher
productivity on investments to enterprises. Hence, to the extent economic
growth depends on the rate of return on investments, securities market
promotes economic growth.
The existence of a link between stock market development and economic
growth has long been debated and well researched. Indeed, empirical work
by early economists produced considerable evidence about the direct
relationship between stock markets and growth of an economy. Specifically,
Greenwood and Smith (1966) indicated that large stock markets can lower
the cost of mobilizing savings and thereby facilitate the investment in the
most productive technologies. Luintel and Khan (1999) explored bi-
directional causality test between financial development and economic
growth; they found that the financial stock market affects economic growth.
Obstfeld (1994) shows that international risk sharing through
internationally integrated stock markets improves resource allocation and
accelerates growth. Bencivenga, et. al. (1996) and Levine (1991) have argued
that stock market liquidity --the ability to trade equity easily-- plays a key
role in economic growth. Raymond Atje and Jovanovic (1993) in their cross-
country study of stock markets and economic growth found that there exists
a significant correlation between growth over the period 1980-1988 and the
value of stock markets for 40 countries. Sarat Malik (2003) argues that the
stock market development remain positively and significantly correlated with
economic growth. The World Bank study ("Stock Markets: A spur to
economic growth" Ross levine) clearly states that GDP grows faster in

113
economies with more liquid capital. The reason behind this argument is very
simple. Liquid markets make investments less risky which in turn allows
the savers to acquire and sell assets quickly and cheaply and therefore by
making investments less risky and more profitable it leads to more
investment, increased productivity and therefore higher economic growth.
However, the developments of the capital markets have its own challenges
and if it is not managed properly it can lead to frauds, volatility, speculative
activities etc. "Financial Structures and Economic Development in India: An
Empirical Evaluation" RBI working paper by S Sahoo, empirically evaluates
the role of financial structures in economic development of India. An
assessment of various indicators of financial development reveals that both
the bank-based and market-based intermediation processes have undergone
remarkable improvements in the last six decades. While credit disbursement
by Indian banks has increased sharply in the past decades, it is still far
below the world average level and even below the level in its emerging
market and developing economies (EDEs) peers. However, in the recent
years, the market capitalization of Indian stock market has increased
sharply reflecting more reliance on market-based sources of funding. The
analysis revealed that both bank-based and market-based indicators of
financial depth have positive impact on economic development in India.
The Indian capital markets have evolved dramatically over the past two
decades. However, there is a long way to go when compared to other
countries. The total market capitalization at the India's largest stock
exchange NSE is nearly 62.2 per cent of the GDP as compared Thailand and
Korea 100 per cent, Malaysia 150 per cent. The total Debt Capital Market in
India is only 34 per cent of GDP as compared to China 49 per cent and
corporate debt market in India is even smaller which accounts to 8 per cent
of GDP as compared to 16 per cent of China. India has a very high amount
of savings rate along with China. The gross domestic savings as a per cent of
GDP increased from 28.72 in 2004-05 to 32.40 in 2012-13. The gross
domestic capital formation as a per cent of GDP stood at 32.41 during
2004-05 and increased to 36.82 in the year 2007-08. However, there was a

114
decline in the year 2008-09 and currently (2012-13) it stands at 31.80 per
cent of GDP. Thus, we can see that savings and investment have increased
considerably which gives an optimistic view of countries economic growth.
This main objective of this paper is to study the importance of capital
markets in facilitating superior economic performance. It studies how the
well-developed capital markets generates economic benefits and leads to
growth of an economy. It tries to study that when household savings are
mobilized in capital markets through IPOs, mutual funds units and other
investment instruments this money helps in stimulating the overall growth
of the economy. When the money flows into capital markets it is then
invested in long term projects which leads to increased production, it fosters
job creation, enhances infrastructure development etc. and leads to overall
development of the nation.
Primary Markets- Resource Mobilization
The primary market is an significant part of capital market, which deals
with issuance of new securities. It enables corporate, public sector
institutions as well as the government to raise resources (through issuance
of debt or equity based securities), to meet their capital requirements. The
most widespread way for firms to raise capital in the primary market is
through Initial Public Offer (IPO). In an IPO, a company or a group floats
new securities for subscription by the public. The issuing company receives
cash proceeds from the sale, which are then used to fund operations or
expand the business. It is only after an IPO that a security becomes
available for trading in the secondary market of the stock exchange
platform. When securities are offered solely to the existing shareholders of a
company, as opposed to the general public, it is known as the Rights Issue.
In addition to domestic market, companies can also raise capital in the
international market through the issuance of American Depository Receipts
(ADRs), Global Depository Receipts (GDRs) and also by way of External
Commercial Borrowings (ECBs).

115
Table 1 provides statistics on the resources mobilized from the primary
markets in India. As can be seen in the table, total resources mobilized in
2012–13 increased to ` 32,455 crore as compared to ` 6,108 crore in 2000-
01. This shows that in more than 10 years span a huge amount of
household savings are mobilized in the capital market which allows the
company to fund both organic growth (modernization and upgrade of
production facilities, implementation of capital-intensive projects) and
acquisitive expansion which in turn fuels the growth of the economy.
Table 1: Resources Mobilized from the Primary Market (Amt in `crore)
Year Total
Category - wise Issuer Type
Public Rights Listed IPOs
No. Amount No. Amount No. Amount No. Amount No. Amount
2000-01 151 6,108 124 5,378 27 729 37 3,385 114 2,722
2001-02 35 7,543 20 6,502 15 1,041 28 6,341 7 1,202
2002-03 26 4,070 14 3,639 12 431 20 3,032 6 1,039
2003-04 57 23,272 35 22,265 22 1,007 36 19,838 21 3,434
2004-05 60 28,256 34 24,640 26 3,616 37 14,507 23 13,749
2005-06 139 27,382 103 23,294 36 4,088 60 16,446 79 10,936
2006-07 124 33,508 85 29,796 39 3,710 47 5,002 77 28,504
2007-08 124 87,029 92 54,511 32 32,518 39 44,434 85 42,595
2008-09 47 16,220 22 3,582 25 12,638 26 14,138 21 2,082
2009-10 76 57,555 47 49,236 29 8,319 37 32,859 39 24,696
2010-11 91 67,609 68 58,105 23 9,503 38 32,049 53 35,559
2011-12 71 48,468 55 46,093 16 2,375 17 6,953 54 41,515
2012-13 69 32,455 53 23,510 16 8,945 36 25,927 33 6,528
Note: Instrument-wise break up may not tally to the total number of issues, as for one issue there could be more than one instruments.
Source: SEBI
Chart 1: Total number of issues in Primary Market
0
50
100
150
200
20
00
-…
20
01
-…
20
02
-…
20
03
-…
20
04
-…
20
06
-…
20
07
-…
20
08
-…
20
09
-…
20
10
-…
20
11
-…
20
12
-…
Total number of issues
Totalnumber…

116
Chart 2 : Total amount mobilized in Primary Market
Stock Market capitalization to GDP
Stock market capitalization to GDP is of importance as it is an indicator of
stock market size. It is a notable and important metric regarding stock
market valuation and helps in knowing the possible direction of the
markets. Investors use this ratio to get some sense of the valuation of an
equity market and it is expressed as percentage. It compares market
capitalization to the size of the economy and mainly reveals the intensity
and depth of the stock markets in an economy. As seen in Table 2, the BSE
market capitalization to GDP ratio increased from 27.4 per cent in 2000-01
to 73.2 per cent in 2012-13. The NSE market capitalization to GDP ratio
stood at 71.5 per cent in 2012-13 as compared to 31.5 in 2000-01. At the
peak of markets in the year 2007-08, the BSE market capitalization to GDP
ratio went up to almost 103 per cent. However, there was a sharp fall during
2008-09 but that was primarily due to global crisis. The increased market
capitalization to GDP ratio over the years highlights the increased depth of
the capital markets in the Indian economy.
Table 2: Indicators of Liquidity (per cent)
Year BSE MCap/GDP NSE MCap/GDP
2000-01 27.4 31.5
2001-02 26.9 28.0
2002-03 23.3 21.9
2003-04 43.4 40.6
2004-05 52.4 48.9
0
20,000
40,000
60,000
80,000
1,00,000
Amount Mobilized (in `crore)
Amount Mobilized (in`crore)

117
2005-06 81.8 76.2
2006-07 82.6 78.4
2007-08 103.0 97.4
2008-09 55.3 51.9
2009-10 94.1 91.7
2010-11 94.1 92.2
2011-12 110.4 108.3
2012-13 73.2 71.5
*Advance Estimate of GDP at market prices for 2012-13 (at 2004-05 prices) is considered
Source: SEBI Market capitalization
Market capitalization determines the value of a company, and how likely it is
to grow. It represents the collective value of a company or stock and is
obtained by multiplying the number of shares outstanding by their
current price per share. It allows investors to understand the relative size of
one company versus another. Market capitalization can also be used to
refer to the economic health of a region or a country. The formula for the
market capitalization of a region or a country can be found by adding up the
market capitalizations of all firms in the region. It measures not only what a
company is worth in the open market, but also the market's perception of its
future prospects because it reflects what investors are willing to pay for its
stock after determining the returns and the risk in the share.
The market capitalization of BSE stood at `63, 87,887 crore and that of NSE
at `62,39,035 crore at the end of financial year 2012-13. (Table3) The
market capitalization changes with time as a result of factors like company
performance, economic factors like inflation, interest rates, etc. In India, you
can find companies with market capitalization ranging from a few lakh to as
much as few lakh crores. As a result, companies are usually classified as
large-cap, mid-cap and small-cap companies. Even though there is not
universal agreement on the exact cutoffs small cap companies usually have
a market capitalization of between $150 million to $500 million and are
relatively risky but have experienced rapid growth. Mid cap companies can
have market capitalizations ranging anywhere from $500 million to $5

118
billion. These companies tend to have achieved a degree of stability while
still experiencing growth on their way to large capitalization. Finally, large
cap companies have market capitalizations of $5 billion or more. This
category includes the big blue chip companies that are household names to
most investors. Although investors in stocks in any market capitalization
category incur risk, surprises have traditionally been less likely among these
blue chip companies. While the categories of market capitalization are fluid
and changing, most investors would agree that market capitalization is the
most important determinant of a company's size because it reflects market
value, and therefore, expectations about a company's future.
Table 3: Annual Averages of Share Price Indices and Market capitalization
Year BSE Sensex S&P CNX Nifty
Market capitalization (`crore)
BSE NSE
2000-01 4,270 1,335 5,71,553 6,57,847
2001-02 3,332 1,077 6,12,224 6,36,861
2002-03 3,206 1,037 5,72,198 5,37,133
2003-04 4,492 1,428 12,01,207 11,20,976
2004-05 5,741 1,805 16,98,428 15,85,585
2005-06 8,280 2,513 30,22,191 28,13,201
2006-07 12,277 3,572 35,45,041 33,67,350
2007-08 16,569 4,897 51,38,014 48,58,122
2008-09 12,366 3,731 30,86,075 28,96,194
2009-10 15,585 4,658 61,65,619 60,09,173
2010-11 18,605 5,584 68,39,084 67,02,616
2011-12 17,423 5,243 62,14,941 60,96,518
2012-13 18,836 5,683 63,87,887 62,39,035
Source: BSE,NSE. As can be seen in Table 4 the market capitalization of various Asian
economies also increased over time. Market capitalization of Shenzhen stock
exchange increased 762 per cent from 2004 to 2012, followed by Philippines
SE 701 per cent, Indonesia SE 484 per cent.
Table 4: International Equity Market (Market capitalization) US $million
Exchange 2004 2005 2006 2007 2008 2009 2010 2011 2012
Australian SE 7,76,403
8,04,015
10,95,858
12,98,315
6,83,872
12,61,909
14,54,491
11,98,187
13,86,874
Bursa Malaysia 1,81,624
1,80,518
2,35,581
3,25,290
1,89,239
2,89,219
4,08,689
3,95,624
4,66,588
Colombo SE 3,657 5,720 7,769 7,553 4,286 9,547 19,924 19,437 16,974
Hong Kong Exchanges
8,61,463
10,54,999
17,14,953
26,54,416
13,28,768
23,05,143
27,11,316
22,58,035
28,31,946

119
Source: World Federation of Exchanges Foreign Institutional Investors (FIIs)
Foreign institutional investors play a very significant role in an economy.
These are the big institutions who invest substantial amount of money in
the markets. With the buying of securities by these big players, markets
trend to move upward and vice-versa. They put forth strong influence on the
total inflows coming into the economy. We know the need for foreign capital
arises due to shortage of capital domestically. From 1992, Foreign
Institutional Investors (FIIs) have been allowed to invest in all securities
traded on the primary and secondary markets, including shares, debentures
and warrants issued by companies which were listed or were to be listed on
the Stock Exchanges in India and in schemes floated by domestic mutual
funds. Foreign Institutional Investor refer to outside companies investing in
the financial markets of India. Increased inflow of foreign funds leads to
lowers cost of capital, access to cheap global credit, enhanced domestic
savings and investments and higher asset prices in the Indian market.
There are more than 1700 foreign institutional investors registered with
SEBI as on March 2013. The FIIs are considered an effective channel for the
market performance by encouraging investment from all classes of investors
which further leads to growth in financial market. Foreign Institutional
Investors (FIIs) registered with SEBI are eligible to purchase shares and
convertible debentures issued by Indian companies under the Portfolio
Investment Scheme (PIS). In the Budget 2011-I2, the Government of India,
Indonesia SE 73,251
81,428 1,38,886
2,11,693
98,761 2,14,941
3,60,388
3,90,107
4,28,223
Korea Exchange
3,89,473
7,18,011
8,34,404
11,22,606
4,70,798
8,34,597
10,91,911
9,96,140
11,79,419
Philippine SE 28,602
39,818 68,270 1,02,853
52,031 86,349 1,57,321
1,65,066
2,29,317
Shanghai SE 3,14,316
2,86,190
9,17,508
36,94,348
14,25,354
27,04,778
27,16,470
23,57,423
25,47,204
Shenzhen SE 1,33,405
1,15,662
2,27,947
7,84,519
3,53,430
8,68,374
13,11,370
10,54,685
11,50,172
Singapore Exchange
2,17,618
2,57,341
3,84,286
5,39,177
2,64,974
4,81,247
6,47,226
5,98,273
7,65,078
Thailand SE 1,15,390
1,23,885
1,40,161
1,97,129
1,03,128
1,76,956
2,77,732
2,68,489
3,89,756

120
allowed Qualified Foreign investors (QFIs), who meet the KYC norms, to
directly invest in Indian equity mutual fund (MF) schemes and in MF debt
schemes that invest in infrastructure. In order to further widen the class of
investors, attract more foreign funds, reduce volatility, and deepen the
Indian capital markets market, in January 2012, the Government expanded
this scheme to allow QFIs to directly invest in Indian equity markets. In the
budget 2012-13, Government announced its intention to permit QFIs to
invest in corporate bonds in India.
Table 5: Trends in FII Investment for Portfolio Investment
Year Gross Purchases
(` crore)
Gross Sales
( ` crore)
Net Investment
( ` crore)
Net Investment**
(US $ mn.)
2000-01 74,051 64,118 9,933 2,160
2001-02 50,071 41,308 8,763 1,839
2002-03 47,062 44,372 2,689 566
2003-04 1,44,855 99,091 45,764 10,005
2004-05 2,16,951 1,71,071 45,880 10,352
2005-06 3,46,976 3,05,509 41,467 9,363
2006-07 5,20,506 4,89,665 30,841 6,821
2007-08 9,48,018 8,81,839 66,179 16,442
2008-09 6,14,576 6,60,386 -45,811 -9,837
2009-10 8,46,433 7,03,776 1,42,658 30,252
2010-11 9,92,596 8,46,158 1,46,438 32,226
2011-12 9,21,285 8,27,562 93,725 18,923
2012-13 9,04,845 7,36,481 1,68,367 31,047
Source: SEBI
Net investment flows have increased from `9,933 crore in 2000-01 to
`1,68,367 crore in 2012-13. However, there was a huge outflow witnessed in
the year 2008-09 reflecting the peak of the global financial crises.(Table 5)
Chart 3: FII Net Investment
-2,00,000.00
0.00
2,00,000.00
4,00,000.00
6,00,000.00
8,00,000.00
10,00,000.00
12,00,000.00
Gross Purchases ( `crore)
Gross Sales ( ` crore)
Net Investment ( ` crore)
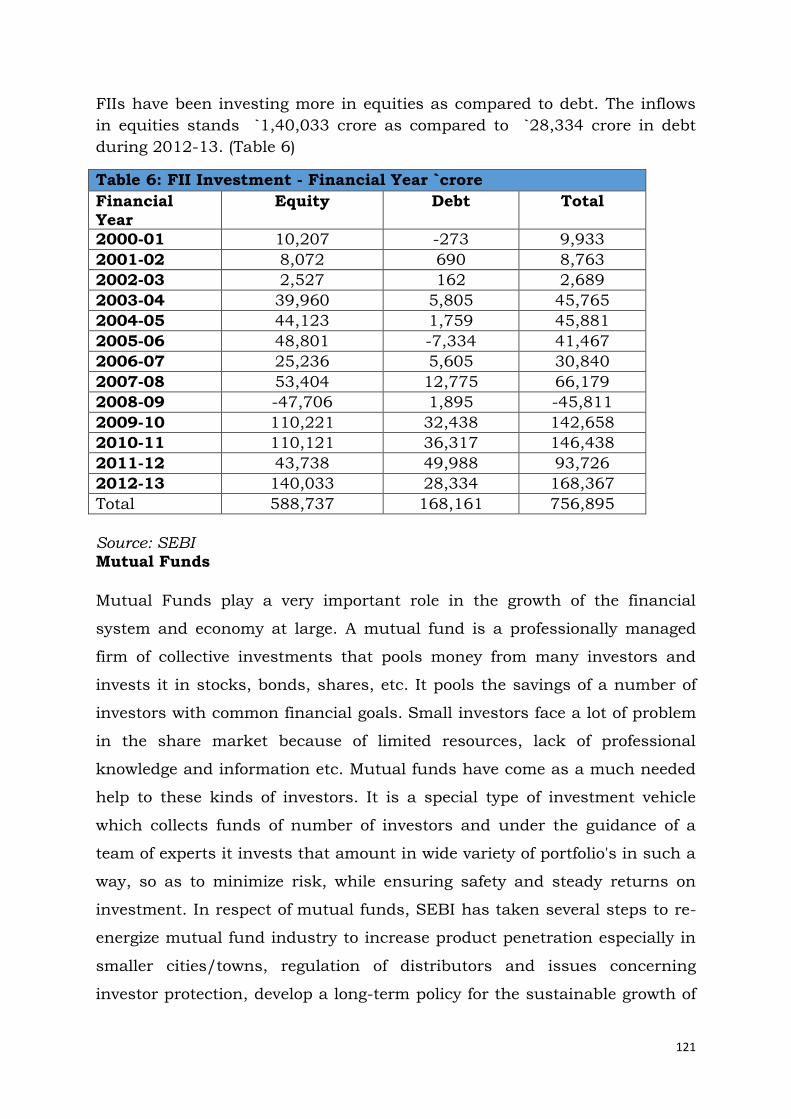
121
FIIs have been investing more in equities as compared to debt. The inflows
in equities stands `1,40,033 crore as compared to `28,334 crore in debt
during 2012-13. (Table 6)
Table 6: FII Investment - Financial Year `crore
Financial
Year
Equity Debt Total
2000-01 10,207 -273 9,933
2001-02 8,072 690 8,763
2002-03 2,527 162 2,689
2003-04 39,960 5,805 45,765
2004-05 44,123 1,759 45,881
2005-06 48,801 -7,334 41,467
2006-07 25,236 5,605 30,840
2007-08 53,404 12,775 66,179
2008-09 -47,706 1,895 -45,811
2009-10 110,221 32,438 142,658
2010-11 110,121 36,317 146,438
2011-12 43,738 49,988 93,726
2012-13 140,033 28,334 168,367
Total 588,737 168,161 756,895
Source: SEBI Mutual Funds
Mutual Funds play a very important role in the growth of the financial
system and economy at large. A mutual fund is a professionally managed
firm of collective investments that pools money from many investors and
invests it in stocks, bonds, shares, etc. It pools the savings of a number of
investors with common financial goals. Small investors face a lot of problem
in the share market because of limited resources, lack of professional
knowledge and information etc. Mutual funds have come as a much needed
help to these kinds of investors. It is a special type of investment vehicle
which collects funds of number of investors and under the guidance of a
team of experts it invests that amount in wide variety of portfolio's in such a
way, so as to minimize risk, while ensuring safety and steady returns on
investment. In respect of mutual funds, SEBI has taken several steps to re-
energize mutual fund industry to increase product penetration especially in
smaller cities/towns, regulation of distributors and issues concerning
investor protection, develop a long-term policy for the sustainable growth of
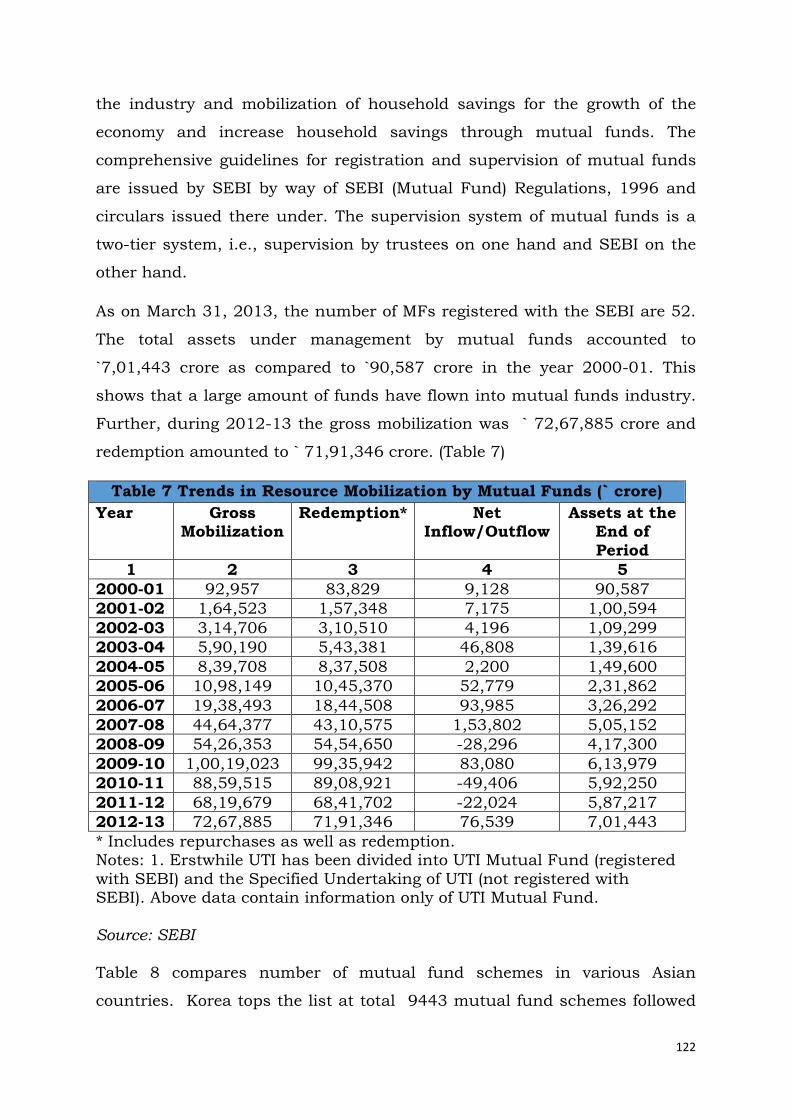
122
the industry and mobilization of household savings for the growth of the
economy and increase household savings through mutual funds. The
comprehensive guidelines for registration and supervision of mutual funds
are issued by SEBI by way of SEBI (Mutual Fund) Regulations, 1996 and
circulars issued there under. The supervision system of mutual funds is a
two-tier system, i.e., supervision by trustees on one hand and SEBI on the
other hand.
As on March 31, 2013, the number of MFs registered with the SEBI are 52.
The total assets under management by mutual funds accounted to
`7,01,443 crore as compared to `90,587 crore in the year 2000-01. This
shows that a large amount of funds have flown into mutual funds industry.
Further, during 2012-13 the gross mobilization was ` 72,67,885 crore and
redemption amounted to ` 71,91,346 crore. (Table 7)
Table 7 Trends in Resource Mobilization by Mutual Funds (` crore)
Year Gross Mobilization
Redemption* Net Inflow/Outflow
Assets at the End of
Period
1 2 3 4 5
2000-01 92,957 83,829 9,128 90,587
2001-02 1,64,523 1,57,348 7,175 1,00,594
2002-03 3,14,706 3,10,510 4,196 1,09,299
2003-04 5,90,190 5,43,381 46,808 1,39,616
2004-05 8,39,708 8,37,508 2,200 1,49,600
2005-06 10,98,149 10,45,370 52,779 2,31,862
2006-07 19,38,493 18,44,508 93,985 3,26,292
2007-08 44,64,377 43,10,575 1,53,802 5,05,152
2008-09 54,26,353 54,54,650 -28,296 4,17,300
2009-10 1,00,19,023 99,35,942 83,080 6,13,979
2010-11 88,59,515 89,08,921 -49,406 5,92,250
2011-12 68,19,679 68,41,702 -22,024 5,87,217
2012-13 72,67,885 71,91,346 76,539 7,01,443
* Includes repurchases as well as redemption. Notes: 1. Erstwhile UTI has been divided into UTI Mutual Fund (registered
with SEBI) and the Specified Undertaking of UTI (not registered with SEBI). Above data contain information only of UTI Mutual Fund.
Source: SEBI
Table 8 compares number of mutual fund schemes in various Asian
countries. Korea tops the list at total 9443 mutual fund schemes followed
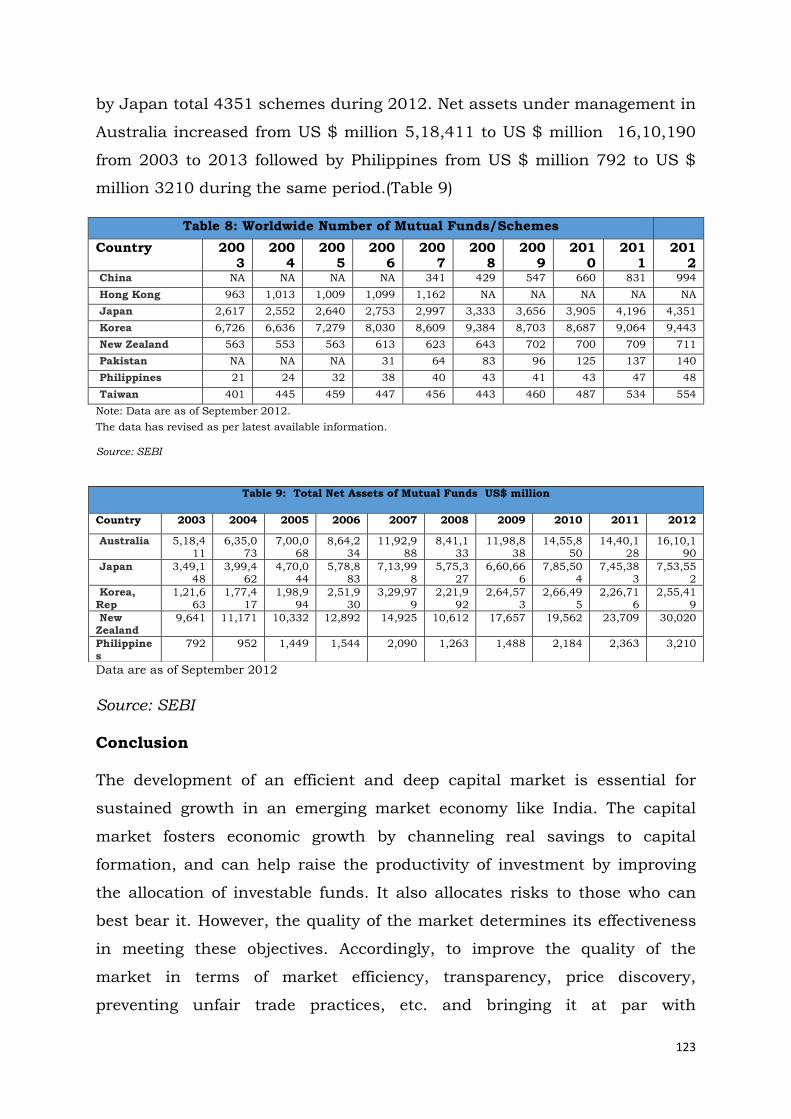
123
by Japan total 4351 schemes during 2012. Net assets under management in
Australia increased from US $ million 5,18,411 to US $ million 16,10,190
from 2003 to 2013 followed by Philippines from US $ million 792 to US $
million 3210 during the same period.(Table 9)
Table 8: Worldwide Number of Mutual Funds/Schemes
Country 2003
2004
2005
2006
2007
2008
2009
2010
2011
2012
China NA NA NA NA 341 429 547 660 831 994
Hong Kong 963 1,013 1,009 1,099 1,162 NA NA NA NA NA
Japan 2,617 2,552 2,640 2,753 2,997 3,333 3,656 3,905 4,196 4,351
Korea 6,726 6,636 7,279 8,030 8,609 9,384 8,703 8,687 9,064 9,443
New Zealand 563 553 563 613 623 643 702 700 709 711
Pakistan NA NA NA 31 64 83 96 125 137 140
Philippines 21 24 32 38 40 43 41 43 47 48
Taiwan 401 445 459 447 456 443 460 487 534 554
Note: Data are as of September 2012.
The data has revised as per latest available information. Source: SEBI
Data are as of September 2012
Source: SEBI
Conclusion The development of an efficient and deep capital market is essential for
sustained growth in an emerging market economy like India. The capital
market fosters economic growth by channeling real savings to capital
formation, and can help raise the productivity of investment by improving
the allocation of investable funds. It also allocates risks to those who can
best bear it. However, the quality of the market determines its effectiveness
in meeting these objectives. Accordingly, to improve the quality of the
market in terms of market efficiency, transparency, price discovery,
preventing unfair trade practices, etc. and bringing it at par with
Table 9: Total Net Assets of Mutual Funds US$ million
Country 2003 2004 2005 2006 2007 2008 2009 2010 2011 2012
Australia 5,18,411
6,35,073
7,00,068
8,64,234
11,92,988
8,41,133
11,98,838
14,55,850
14,40,128
16,10,190
Japan 3,49,148
3,99,462
4,70,044
5,78,883
7,13,998
5,75,327
6,60,666
7,85,504
7,45,383
7,53,552
Korea,
Rep
1,21,6
63
1,77,4
17
1,98,9
94
2,51,9
30
3,29,97
9
2,21,9
92
2,64,57
3
2,66,49
5
2,26,71
6
2,55,41
9
New Zealand
9,641 11,171 10,332 12,892 14,925 10,612 17,657 19,562 23,709 30,020
Philippines
792 952 1,449 1,544 2,090 1,263 1,488 2,184 2,363 3,210

124
international standards, a package of reforms comprising measures to
liberalize, regulate and develop the Indian capital market have been
implemented since the early 1990s. As a result of these initiatives, capital
markets in India have emerged as an important source of funds for Indian
companies and also as an avenue for the small and retail investors to
productively channelizing their savings. The development of the capital
markets also provides significant benefits to the average citizen. Most
importantly, it has led to more jobs and higher wages leading to overall
escalation of the nation.
References
Atje Raymond and Jovanovic Boyan (1993), Stock Markets and
Development, European Economic Review, April, 37 (2/3)
Brad Cominicioli, Illinois Wesleyan,"The stock market as a leading
indicator: An application of Granger Causality", 1996
Bencivenga, Valerie and Bruce Smith, 1991. Financial
Intermediation and
Endogenous Growth," Review of Economic Studies, 1991, pp. 195-
209.
CSO data
Greenwood, J., and B. Smith. 1996. Financial Markets in
Development and the Development of Financial Markets. Journal of
Economic Dynamics and Control, Vol. 21: 145 -81.
King Robert G. And Levine Ross (1993a),Finance and Growth:
Schumpeter Might Be Right, Quarterly Journal of Economics, August,
108(3), pp. 717-38
Levine Ross (1997), Financial Development and Economic Growth:
Views and Agenda, Journal of Economic Literature, June, pp.688-726
Levine R. and Zervos A., 1998. Stock Markets, Banks, and Economic
Growth.
National Stock Exchange, ISMR-2013
125
Obstfeld, M. 1994. Risk-Taking, Global Diversification, and Growth.
American Economic Review, Vol. 84:1310-29
Sarat Malik, Stock Market development and Economic growth: The
Evidence from India, SEBI Bulletin, Vol 1, Part 3, March 2003, 20
S. Sahoo, Financial Structures and Economic Development in India:
An Empirical Evaluation, March 2013
SEBI, Annual Report, 2012-13
SEBI, Hand Book of Statistics ,2012
William C. Dudley, R. Glenn Hubbard, "How capital markets enhance
economic performance and facilitate job creation" November 2004
World Bank. 2000. World Development Indicators CD-ROM. (The
World Bank, Washington D.C.)
Contact Details:
Dr. Sarat Malik, Joint Director SEBI Email- [email protected]
Ph -022-26441280
Ms. Akriti, Officer- Research SEBI Email- [email protected]
Ph- 022-26449299

126
INTEGRATING INDIA INTO THE ASEAN
: AN INFRASTRUCTURAL PERSPECTIVE10
Sumana Chaudhuri
Rusha Das
Sharmila Bonnerjee
Abstract
For the past two decades APEC & ASEAN have been working to promote
regional economic integration in Asia. The vision & mission of both the
organisations are more or less similar. Both aims to strengthen regional
economic integration through trade & investment liberalisation. Both the
bodies try to cooperate with the initiatives of APEC 2015 on lowering trade
and business cost and ASEAN’s initiative on regional connectivity.
Connectivity is chosen as a focal issue since ASEAN, in 2010, adopted the
Master Plan of ASEAN Connectivity (MPAC) focusing on physical,
institutional and people to people connectivity. This conceptual review paper
highlights the ASEAN’s objective of physical connectivity with respect to
ASEAN – India integration in the perspective of enhanced trade and
commerce through cross border road transportation infrastructure. Since
Jan, 2010 as India entered into Free Trade Agreement ( AIFTA) with ASEAN
the immediate need which has been felt to strengthen this regional economic
integration is to build proper infrastructure. Infrastructure is such a critical
factor which not only removes trade & investment impediments but also
enhances supply chain connectivity and improve business environment on a
sustainable basis across the border. This paper attempts to describe a
conceptual framework designed to predict the direct & indirect economic
impacts of a road infrastructure project connecting three economies (India-
Myanmar- Thailand) toward a designated freight corridor on the Trilateral
Highway route.
Keywords: Trilateral Highway; ASEAN; APEC-2015; Economic integration; CBTI
10 Research is done under Remsons Chair for Management Research at
Durgadevi Saraf Institute of Management Studies, Mumbai

127
INTRODUCTION
Background
For most of the past 30 years, no region of the world has been more
economically dynamic than Asia. While much of the developing world failed
to keep pace with economic growth in the advanced industrial countries over
this period, the nations of East Asia grew at historically unprecedented
rates. This economic growth transformed the patterns of world trade, lifted
millions out of absolute poverty, and so captivated the attention of Western
economists and business leaders that it was commonplace by the early
1990s to refer to economic achievements of these countries as the “East
Asian miracle (Lee, 2014). But this dynamism in growth was somewhat
skewed, like the growth trajectory of South East Asian (ASEAN) economies
excluding Singapore was lying behind that of East Asian (China and NICs
like Hong Kong, Taiwan & S.Korea). To create Asian continent as an Engine
of growth for the global economy some “Flying Geese” pattern of economic
development is required for ASEAN economies where the number of states
differ in terms of their size & the level of development. In late 20th century
the need has been felt and the Asian economies have been moving towards
deeper regional integration to enjoy self generating growth, share prosperity,
increasing self-reliance and thereby reducing the dependence on Western
economies.
It has been identified that infrastructure can play the role of a key
contributing factor behind generating growth in ASEAN economy. It is only
infrastructure which not only raises GDP which are mere in numbers but
also increases productivity and efficiency of the factors which generates the
GDP. In this context Prof Krugman can be quoted “Asian growth..... seems
to be driven by extraordinary growth in inputs like labour and capital rather
than gains in efficiency”. So to achieve a growth which is sustainable, the
productivity has to be risen and that can be attained through trade (cross-
border trade). And this Gains from Trade can only be realized by building
required infrastructure, both hard and soft.
128
Connectivity promotes trade, brings people closer, and integrates the
economies. Openness or globalization is potentially beneficial to all but
require appropriate policy designs to realize it. Improving connectivity is
essential for the region’s prosperity, continued growth and, most
importantly, poverty reduction.
Literature review
Roads & highways are seen as being the quintessential infrastructure
investment in much of the theoretical literature on economic growth (Barro,
1995). Several studies have found out that there is a positive effect of
interstate highways on productivity growth (T.E & J.S, 1988). In the similar
lines Carlino et al,1987 found that greater interstate highway density was
associated with higher levels of manufacturing employment and total
employment in counties overall. Aschauer (1993) also argues that the public
infrastructure such as streets and highways, mass transit, water and sewer
systems, and the like should be considered as a factor of production, along
with labour and private capital, in the private sector production process.
Therefore, to raise productivity growth countries must boost the rate of
capital accumulation on the tangible capital such as plant and equipment,
or intangible capital such as that generated by research and development
expenditures.
According to Asacheur’s (1989) pioneered research on the impact of the
infrastructure investment on output and productivity growth, it has been
seen that relatively slower growth in public capital accumulation in the
United States during the 1970s and 80s was largely responsible for the
private sector productivity slowdown and at that time the private output
elasticity with respect to public capital was about 0.42 indicating a sizable
level of sensitivity.
Lynde and Richmond (1993) investigated the causes for the decline in the
US output and productivity growth since the early 1970s. They found that
the services of the public capital are an important part of the production
129
process and that about 40% of the productivity decline in the United States
was explained by the fall in public capital-labour ratio. Furthermore, Ford
and Poret (1991) suggest that cross-country differences in productivity
growth might also be explained partly by differences in levels of
infrastructure spending.
Asian Economies have grown rapidly over the last few decades. Several
scholars have noted its economic success as the Rise of Asia particularly led
by seven economies; China, India, Indonesia, Japan, Republic of Korea,
Malaysia and Thailand. These leading economies have combined total
population of 3.1 billion (78 percent of Asia) and a GDP of USD 14.2 trillion
(87 percent of Asia) in 2010 (Htun et al., 2011). While those countries have
achieved high growth rates and caught up with wealthier countries, some
others, however, have achieved little or no growth. Since the 1990s, Asian
economies have been moving towards deeper regional integration to enjoy
growth together and to share prosperity. Although size of the economy and
level of development in the region are quite diverse, it does not matter to
such integration.
Barriers to cross border trade are one of the biggest impediments toward
growth of ASEAN economies. This is more applicable in case of land locked
countries, without access to major sea ports. The problem becomes more
acute when we review India’s integration with ASEAN economies, which has
been largely remain insulated from each other as a result of physical
bottleneck in cross – country logistics or geo-political concerns. As Asia
becomes the engine of growth for the global economy, the ASEAN and India
must capitalize on their partnership through enhanced connectivity to reap
the benefits" (Htun, et al., 2011). In the above perspective of connectivity
between ASEAN and India, in 2010, the East Asia Summit (EAS) countries
adopted a comprehensive strategy for smart, sustainable and inclusive
growth. At the 17th ASEAN Summit in 2010, the leaders adopted the Master
Plan on ASEAN Connectivity(MPAC), which identifies key strategies and
actions to enhance the region’s connectivity in three dimensions: physical,

130
institutional, and “people-to-people” (op. cit.,2011). It shows the way ahead
for Asia in regional integration. The Asia’s aim to single market would
depend on the existence of a seamless, flexible and efficient logistics and
transportation system. ASEAN has become India’s one of the largest trading
partners in recent years. India’s trade with ASEAN has increased from US$
7.13 billion in 2000 to US$ 41.32 billion in 2009. Grown at 22 percent in
the last decade, India’s trade with ASEAN presently shares about 10 percent
of India’s global trade, compared to 8 percent of 2000. India’s export to
ASEAN has been growing faster than her imports from ASEAN. In 2009,
India’s import from ASEAN was US$ 24 billion and the export to the region
was US$ 17billion. Total bilateral trade between ASEAN and India reached
$75.6 billion in 2012, surpassing the target of $70 billion. Now, with the
implementation of the India-ASEAN comprehensive economic partnership,
the target for two-way trade has been set at $100 billion by 2015, for which
an integrated transport network would be the key (Basu, 2014).
However, the growth momentum initiated in the ASEAN economies have
been able to generate sufficient impetus toward forging international freight
corridors like rail or road networks for medium to long – distance
transportation hauls. In this direction, the establishment of a 1360 kms
long Trilateral Highway from Moreh (India)/ Tamu (Myanmar) to Myawaddy
(Myanmar)/ Mae Sot (Thailand) via Myanmar was agreed by the three
Governments in April 2002. The India – Myanmar and Thailand Joint Task
Force on Trilateral Highway met in New Delhi on September 10 – 11, 2012.
It was agreed to work towards completion of the Trilateral Connectivity by
2016.
This is a conceptual review paper relating cross border transport
infrastructure based on the case of Trilateral Highway Project connecting
three countries- India, Myanmar and Thailand.

131
APEC AND ASEAN COOPERATION:
APEC
APEC has consistently focused on the trade and investment liberalisation
process of eliminating tariff and non-tariff barriers (NTBs), as articulated in
the Bogor Goals in 1994. However, with rapid economic growth and
changing global dynamics, it began addressing new issues such as behind-
the-border trade restrictions, including common standards on certain
aspects of trade, customs and e-commerce, and promoting business mobility
(Das, Thao, & James, 2013).
APEC’s “Supply Chain Connectivity Framework/ Action Plan (SCFAP
2010-2015)” includes trade logistics in the trade facilitation agenda
because as per World Bank’s study in 2002 APEC countries differ
substantially in the quality of their logistics and trade facilitation across a
broad range of measures. Therefore to enhance trade APEC should atleast
bring economically lagging countries upto median performance levels.
Consequently SCFAP aims to reduce trade time, cost and uncertainty by
10% by 2015. In order to achieve this target SCFAP 2009 counteracts the
eight critical supply chains ‘CHOKEPOINTS’, discussed in the table below.
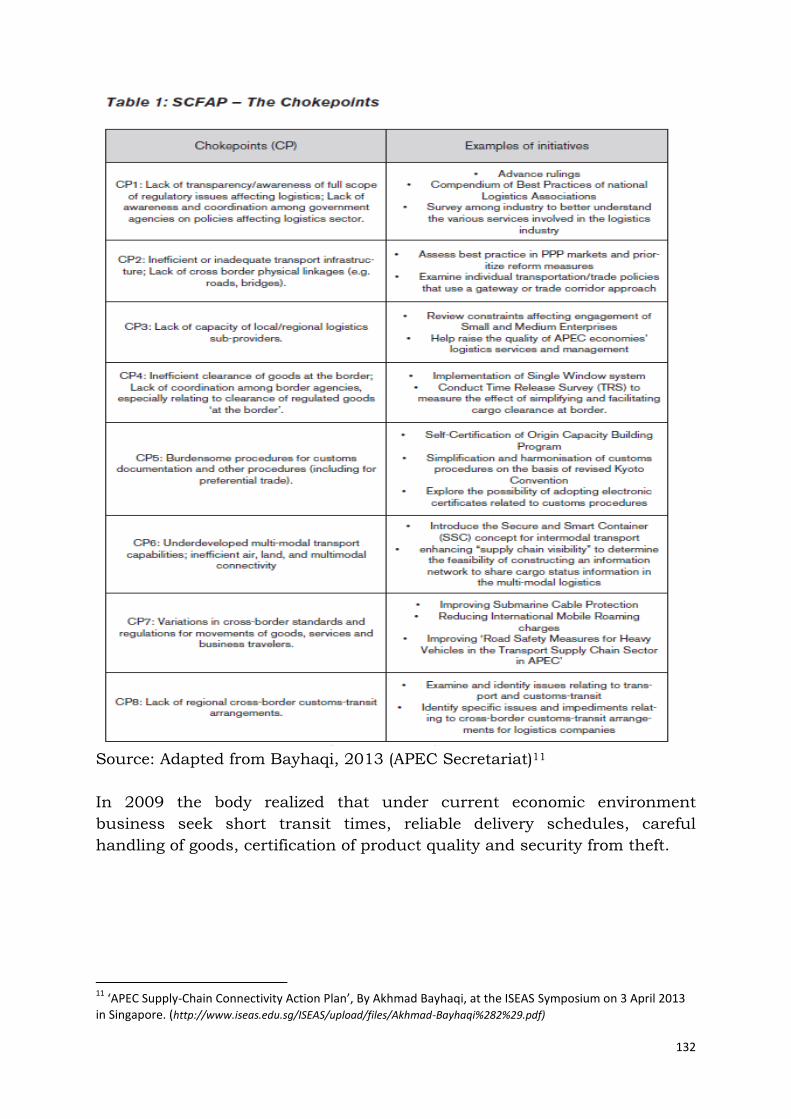
132
Source: Adapted from Bayhaqi, 2013 (APEC Secretariat)11
In 2009 the body realized that under current economic environment
business seek short transit times, reliable delivery schedules, careful
handling of goods, certification of product quality and security from theft.
11
‘APEC Supply-Chain Connectivity Action Plan’, By Akhmad Bayhaqi, at the ISEAS Symposium on 3 April 2013 in Singapore. (http://www.iseas.edu.sg/ISEAS/upload/files/Akhmad-Bayhaqi%282%29.pdf)
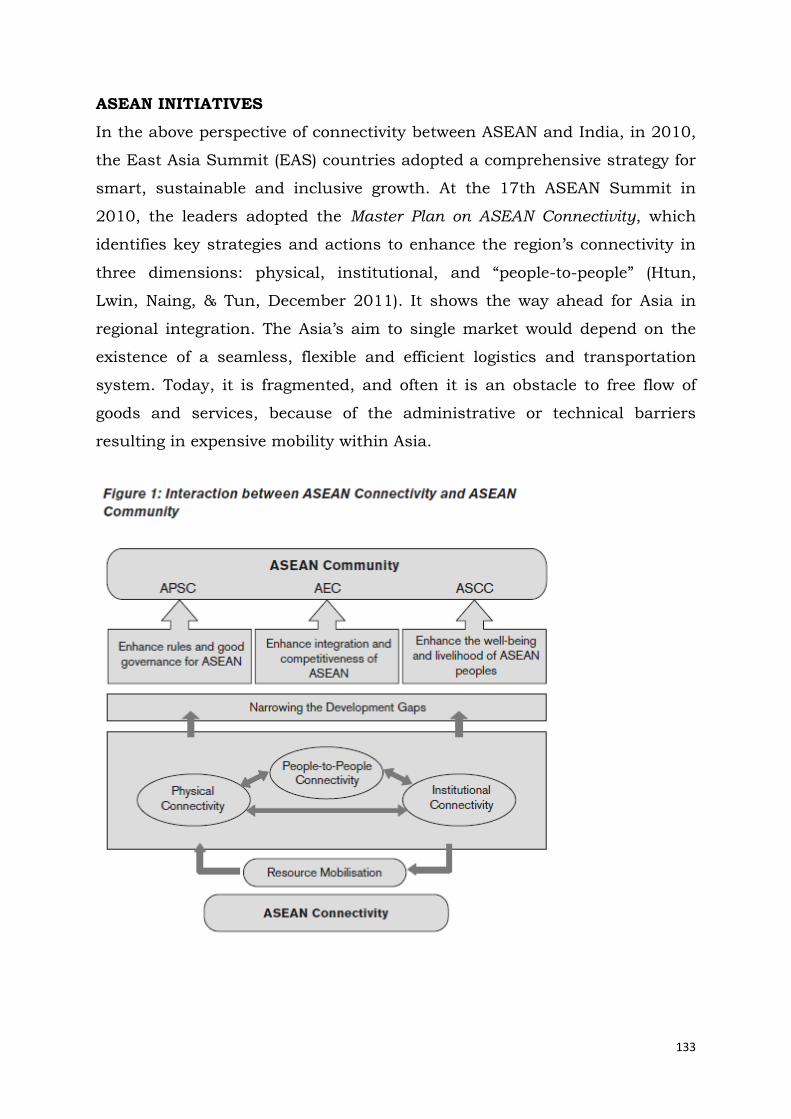
133
ASEAN INITIATIVES
In the above perspective of connectivity between ASEAN and India, in 2010,
the East Asia Summit (EAS) countries adopted a comprehensive strategy for
smart, sustainable and inclusive growth. At the 17th ASEAN Summit in
2010, the leaders adopted the Master Plan on ASEAN Connectivity, which
identifies key strategies and actions to enhance the region’s connectivity in
three dimensions: physical, institutional, and “people-to-people” (Htun,
Lwin, Naing, & Tun, December 2011). It shows the way ahead for Asia in
regional integration. The Asia’s aim to single market would depend on the
existence of a seamless, flexible and efficient logistics and transportation
system. Today, it is fragmented, and often it is an obstacle to free flow of
goods and services, because of the administrative or technical barriers
resulting in expensive mobility within Asia.

134
APEC AND ASEAN: MUTUAL COOPOERATION
Seven broad areas of collaboration have been identified as possible to
initiate APEC and ASEAN collaboration:
Customs procedures.
Risk management methodologies.
Single window procedures.
Aviation and multimodal transport.
Mutual recognition agreements and
Harmonization of devices.
INTEGRATING INDIA
The strong growth of the Indian economy has already made a significant
impact on the Asian economy. A considerable part of Asia’s supply of
primary goods originates from India. India sources intermediate goods and
natural resources from Asia. Therefore, growth is strong, and the netex port
values are very important for Indian as well as Asian economy. Asia’s supply
of strategic resources and goods is a vital issue and, therefore, should be
given greater attention.
India’s trade, primarily due to FTAs, is expected to increase manifolds in the
coming years. ASEAN-India FTA is central to India’s growing engagement
with her eastern neighbours. Accompanying this growth will be an increase
in the demand of both national and international infrastructure, for both
production and consumption, and international trade purposes.
Undoubtedly, failure to respond to this demand will slow down India’s trade
and hamper the growth process.
In order to deepen economic integration among East Asian countries, the
Economic Research Institute of ASEAN and East Asia (ERIA) conducted a
series of research projects in 2009 to develop a Comprehensive Asia
Development Plan (CADP) in response to the request from the East Asia
Summit (EAS) (Htun, Lwin, Naing, & Tun, December 2011). The CADP
provides;

135
(i) A grand spatial design for infrastructure development in East Asia armed
with a consistent conceptual framework based on new waves of
international trade theory such as the fragmentation theory and new
economic geography,
(ii) Simulation analyses on the impacts of logistic enhancement to the
region, using the Geographical Simulation Model (ERIA/IDE-GSM), and
(iii) A list of prospective infrastructure projects in consistence with the
aforementioned conceptual framework.
Although the CADP has successfully fulfilled the initial mission, there still
remain a number of issues which require further studies. Out of these
outstanding issues, a study to develop a basic strategy to enhance the
ASEAN-India connectivity is selected as one of the sub-project under phase
2 of the CADP. As explicitly stated in the Master Plan on ASEAN
Connectivity, ASEAN put an emphasis on connectivity with the neighbouring
countries, including China, India, and other EAS countries. While both
China and India are the emerging economic superpowers in the region and
the immediate neighbours to ASEAN, the extents of the connectivity with
ASEAN differ significantly.
The feasibility of this type of regional integration between India and ASEAN
not only depends on robust and improved infrastructure between the two
but it should be complemented by appropriate policies and regulations, and
participation of the private sector. At the same time, we also need policies
and regulations to foster an effective cross-border movement of goods,
services, and people. Harmonizing and simplifying the customs procedures,
information sharing, customs modernization, establishing transparent
transit rules, and improving logistics in general are also critical to
infrastructure expansion.

136
At this very initial stage, the emerging regional physical connectivity
architecture between India and ASEAN is showing two important features –
first, the national connectivity having regional implications such as Delhi–
Mumbai Industrial Corridor (DMIC), and second, the regional connectivity
showing regional (or international) implications such as Mekong–India
Economic Corridor (MIEC), Trilateral Highway (TH) between India, Myanmar,
and Thailand along the Asian Highway (AH) No.1, and Kaladan Multimodal
Transit Transport Project (KMTTP), to mention a few (ASEAN-India
Connectivity Report-India country study, 2012).
To start with, India has proposed extending the Trilateral Highway project
connecting India, Myanmar and Thailand to neighbouring Cambodia and
Vietnam. The idea is to set up special economic zones along this highway
and provide seamless connectivity through these countries by 2016, by
when the projects are expected to become operational. Right now, work is on
to repair and strengthen 71 bridges that link this stretch (Basu, 2014).
To ensure greater success of this highway project, Prime Minister
Manmohan Singh proposed an ASEAN-India Transit Transport Agreement
(AITTA) at the India-ASEAN Summit in Brunei Darussalam in October 2013.
Once the agreement comes into force -likely by 2015- vehicles from
association countries will be able to cross international borders without
much documentation (Basu, 2014).
CONCEPTUAL FRAMEWORK
The conceptual framework of the Comprehensive Asia Development Plan
(CADP) is based on fragmentation theory and new economic geography. It is
more efficient to produce goods through fragmentation by relocating each
production process to the best place to make the best use of the location
advantage than to locate whole production processes with different factor
intensities in one place. This explains the benefits of fragmentation.

137
New economic geography claims that it is required to properly control
agglomeration effects and dispersion effects which have influence between
industrial agglomerations and surrounding areas . Once an industrial
agglomeration is formed, many more firms will approach to the industrial
agglomeration, seeking convenience of component procurement and
accessibility to a large market. This is an agglomeration effect. On the other
hand, if an industrial agglomeration is developed, production costs, such as
wages and rents, will increase and some firms will try to leave the industrial
agglomeration. This is a dispersion effect. If the service link cost is reduced
by infrastructure development, trade liberalization and/or facilitation, and
other policy measures, the dispersion effect could be relatively increased, as
the disadvantage to locate in a remote area could be mitigated by improved
business environment. Furthermore, to promote relocation of production
processes to areas with low wage levels, basic economic infrastructures,
such as electricity and water, need to be improved in the areas.(ASEAN-
India Connectivity Report-India country study, 2012).
ASEAN INDIA TRADE RELATIONSHIP
Merchandise trade between ASEAN and India also recorded a significant
increase from US$ 7.1 billion in 2000 to US$ 41.3 billion in 2009, with a
CAGR of 21.6%. For ASEAN, India’s share as the destination of merchandise
export and as the origin of merchandise import doubled from 1.6% and 1.0%
in 2000 to 3.3% and 2.1% in 2009, respectively. For India, ASEAN’s share as
the destination of merchandise export increased rapidly from 6.5% in 2000
to 10.6% in 2009, whereas ASEAN’s share as the origin of merchandise
import recorded a slight decline from 11.0% in 2000 to 9.1% in 2009,
indicating the slow progress of ASEAN in penetrating into Indian market.
Meanwhile, the proportion of machinery in ASEAN’s total imports from India
has doubled during the 5 years to 2009, from 9.8% to 19.3%, though not to
the level of the machinery’s share for the ASEAN’s export side, which has
been more than 30% since 2000. In relative terms, ASEAN Member States
tend to export more machinery parts to and import more finished machinery

138
products from India, compared to two decades. In the ASEAN’s machinery
exports to India, computer parts and accessories and electric integrated
circuits are the top two goods, constituting more than 10% shares in major
exporters, namely Singapore, Malaysia, and Thailand (ASEAN-India
Connectivity Report-India country study, 2012).
Although Myanmar’s share in the regional trade is still limited, Myanmar
has steadily increased its international trade since the introduction of an
open door policy in 1988 under the military government. During the last two
decades, Myanmar’s export increased from US$ 466 million in FY1991/92
to US$ 8,864 million in FY2010/11 with a CAGR of 16.8%, and Myanmar’s
import increased from US$ 851 million in FY1991/92 to US$ 6,415 million
in FY2010/11 with a CAGR of 11.2%. The high export growth was not
severely affected by the import ban imposed by the United States in 2003,
mainly because of the rapid expansion of trade with two neighbouring
countries, Thailand and China7. The share of Thailand in Myanmar’s trade
(export + import) doubled from 15.2% in FY2000/01 to 30.4% in
FY2009/10, reflecting the increase of Myanmar’s export of natural gas to
Thailand through pipelines.
The comparable figures for China expanded more than a double from 12.0%
to 24.2%, and this figure is likely to grow further once natural gas export the
gas pipeline to China is completed in 2013. In contrast, Myanmar’s trade
with other neighbouring countries has been sluggish during the last decade.
The share of India in Myanmar’s trade marked a rather slow expansion from
8.9% in FY2000/01 to 10.3% in FY2009/10.
Globalization has made, at present and in the future, the Asian Region as
the main area for trading and economic growth that is derived from the
driving force coming from countries such as China and India. Increased
consumers’ demand in both countries is the driving force for the regional
economic growth. Thailand is a country with natural geographic

139
comparative advantage and is strategically positioned between India and
China.
The geographical location of Thailand enables the country to be the
connectivity hub for economic and trade linkages to new markets such as
China and India. The characteristics of the country’s location between the
Indian Ocean and the Pacific Ocean also places it on the main crude oil
transport routes between the producing countries in the Middle East and
the important consuming countries such as China, Japan and South Korea.
Therefore, the western seashore (Andaman) has high potential for being the
new economic route between the main global energy source and the major
energy consumers.
Freight transport networks and international trading routes especially
between China and India and the major markets of the world that passes
through Thailand can save transport cost and time for both countries.

140
CROSS BORDER TRANSPORT INFRASTRUCTURE
CBTI is defined as the infrastructure required for transportation that
crosses multiple national borders. It comprehensively includes physical
“hard infrastructure” such as ports, railways, highways, cargo Trans
shipment facilities, international border facilities, weighbridges (truck
scales), and inland container depots (ICDs), as well as “soft infrastructure”
such as transport laws/regulations related to border crossing (e.g., customs
clearance, quarantine), and organizational systems and resources for
smoothly operating and maintaining the hard infrastructure (The Research
on Cross Border Trasport Infrastructure, 2009).
Our working research paper concentrates only on Hard Infrastructure with
respect to regional integration of India and its two ASEAN neighbours viz.
Myanmar and Thailand. In this context we attempt to describe a conceptual
framework designed to predict the direct and indirect economic impacts of a
road infrastructure project- “The Trilateral Highway” connecting the three
economies.
COUNTRY SPECIFIC ANALYSIS
Macro Economic Indicators India Myanmar Thailand
Year 2012-13 2012-13 2012-13
Total Population (in million) 1213 61.0 64.36
GDP (In billion USD) 1842.7 82.72 366
GDP Growth Rate 4.90% 6.50% 2.90%
Export (% of GDP at current Market Prices) 16.9 11.53 61.7
Import (% of GDP at current Market Prices) 26.5 6.64 59.3
Source: Researchers’ own table using ADB Statistical Database and World
Bank Database.
India–Myanmar–Thailand Trilateral Highway (IMTTH) is a cross-border
transportation network being financed by the Governments of India,

141
Myanmar and Thailand.41 Tri-lateral highway shall ensure connectivity
from Moreh in India to Mae Sot in Thailand via Myanmar. Substantial
progress had been achieved in preparation of Detailed Project Report (DPR)
for roads and causeways in Myanmar.
Two routes are under consideration, one through Mandalay and another not
through Mandalay. Myanmar has requested route through Mandalay to be
accepted by India. As Imphal-Mandalay bus service will start, it is desirable
that Tri-lateral Highway route passes through Mandalay which is an
important commercial city. The two routes are:
Moreh (India) – Tamu-Kalewa-Chaungma-Yinmabin-Pale-Kyadet-Lingadaw-
Pakokku-Bagan-Kyaukpadaung-Meiktila bypass-Taungoo-Oktwin-Payagyi-
Theinzayat-Thaton-Hpaan Kawareik-Myawaddy-Mae Sot (Thailand) (not
through Mandalay)
Moreh (India) – Tamu-Kalewa-Yagyi-Chaungma-Monywa – Mandalay –
Meiktila bypass-Taungoo-Oktwin-Payagyi-Theinzayat-Thaton-Hpaan
Kawkareik-Myawaddy-Mae Sot (through Mandalay)
Stretch between Kalewa-Yagyi-Chaungma-Monywa is not well developed. A
tabulated position of the Trilateral Highway (Mandalay alignment) from
available information after discussion with MEA officials and note circulated
by ASEAN Multilateral Division is given below:
Myanmar – India
Sl.No. Stretch Remarks
1. Tamu-Kalewa Part of the Friendship Road. Good condition.
2. Kalewa-Yagyi Myanmar wants India to construct the
Kalewa-Yagyi stretch.

142
3. Yagyi-Chaungma-
Monywa
India wants Myanmar to construct the Yagyi-
Chaungma-Monywa stretch. It is understood
that section Yagyi-Chaungma-Monywa is
under construction on BOT basis.
4. Monywa-Mandalay Monywa-Mandalay stretch is already
developed.
5. Mandalay-Meiktila
bypass MEA to tell status.
6. Meiktila bypass-
Taungoo-Oktwin-
Payagyi
The section between Meiktila and Payagyi is
part of the Yangon-Mandalay highway that
has been constructed.
7. Payagyi-Theinzayat-
Thaton MEA to tell status.
8. Thaton-
Mawlamyine-
Kawkareik
It is understood that for the Thaton-
Mawlamyine - Kawkareik sector, the
Government of Myanmar has apparently
sought a loan from ADB.
9. Kawkareik-
Myawaddy
It appears that the Myanmar Government
shall be completing the road construction
between Myawaddy-Kawkareik out of its own
resources soon.
10. Myawaddy-Mae Sot MEA to tell status.
Table 1: Project Status of the Tri-lateral Highway (Source: Ministry of
Development of North Eastern Region, Government of India, accessed from
http://mdoner.gov.in/content/myanmar on 13 January 2014)
It is expected that agreement between India and Myanmar on this issue will
be arrived soon. Ministry of External Affairs (MEA), Government of India
stresses the need to pursue further on route alignments for extending this
Highway to Cambodia, Lao PDR and Vietnam. These infrastructure projects
demand enormous finances. Indian Ambassador to Thailand Mr. Anil
Wadhwa, while speaking at the Symposium: “Towards Realization of the
143
ASEAN Connectivity plus: Moving Forward With Asean-India Connectivity”
on 27 November 2013 at Bangkok, observed that “We should think of
innovative ways of financing and executing these projects, which draw upon
the expertise and resources of the private sector.”
Methodology and Data Sources
Planning reports from Ministry of Development of North Eastern Region,
Government of India and Ministry of External Affairs, Government of India
would be crucial inputs in the initial stages of the project feasibility analysis.
International literatures contains specifics about the methodological
approaches for studies in road corridor infrastructure projects, however, we
came across very few studies focusing on inter – country road corridor
studies spanning three different government administrations at varying
levels of socio-economic development.
Data Sources
The analysis would be driven by secondary data sourced from the published
reports, including the Detailed Project Reports (DPR) published by Ministry
of Development of North Eastern Region and Ministry of External Affairs,
Government of India. Also Reports on India – ASEAN integration would be
obtained from Ministry of Foreign Affairs (MOFA), Republic of the Union of
Myanmar and Ministry of Foreign Affairs, Kingdom of Thailand. Additionally,
Internal Reports from Asian Development Bank (ADB) would be accessed to
get the project details and statements of project finance. Other data like time
required for point to point communication across nodes on the tri-lateral
highway and economic impact on the region interspersed across the
highway would be obtained from Economic Research Institute for ASEAN
and East Asia (ERIA).

144
Methodology
We would like to base most of our research on legitimate sources of
information as stated in the data sources above. This paper shall attempt to
describe a conceptual framework designed to predict the direct and indirect
economic impacts of a road infrastructure project connecting three
economies toward a designated freight corridor on the trilateral highway
route. Meta-Analysis would be used to pool together the results of the best
evidences from economic impact analysis of similar cross – country road
transport infrastructure projects and applying them in the context of Tri-
lateral Highway Project.
Conclusion:
In view of the potential benefits for both ASEAN and India it is highly
important to develop an appropriate strategy to enhance the connectivity
between them. At the same time enhancing connectivity requires regional
institution to build and manage the cross border infrastructure.
Our paper highlights one such cross border highway infrastructure project
such as the Trilateral Highway Project which aims at establishing an
economic integration resulting in mutual regional trade benefits between the
countries India, Myanmar and Thailand.
One of the major obstacles to the expansion of trade between India and
ASEAN is the high cost of moving goods across the borders. Improved
connectivity would reduce trade costs, raise country’s comparative
advantage and trade flows, expand markets, and reduce poverty, and
increase country’s welfare and quality of life of its citizens. Multiple effective
cross border and national transport projects mean stronger ASEAN–India
connectivity. An integrated connectivity would also provide substantial
benefits to landlocked and small island countries of the region as well as to
poor and small countries by giving them low-cost access to world market.

145
Better connectivity between India and ASEAN can infuse new dynamism in
the region’s production network. Stronger production network would
enhance trade and investment, and thereby deepen the East Asian
integration process. To sustain the regional production network, we need to
improve the trade costs and country’s comparative advantage in trade. The
catalyst to regional production network is the lowering trade costs. ASEAN–
India connectivity would help unlock the tremendous potential of the region
by removing constraints and bottlenecks to growth.
Our paper is a case study which takes into account the proposed Trilateral
Highway as a means for integrating India with ASEAN on the basis of gains
from trade and inter and intra regional economic integration. This is a
working paper which would take such land locked countries as its model
and will attempt to depict the comparative increase in economic, trade and
cultural integration between the countries involved.
REFERENCE
ASEAN-India Connectivity Report-India country study, (2012), New Delhi:
Research and Information System for Developing Countries.
Barro, S.-i.-M. (1995). Economic Growth. New York, NY: McGraw Hil.
Basu, N. ( 2014, November 19). India gets on the highway to growth in
Southeast Asia. Business Standard .
Carlino, G. M., G.A, C., & E.S, M. (1987). The determinants of county
growth. Journal of Regional Science 27 , 39-54.
D, A. (1989). Is public expenditure productive?23 (March). Journal of
Monetary Economics , 177-200.
Das, B. S., Thao, T. P., & James, C. R. (2013). APEC and ASEAN
CONNECTIVITY: Areas of Mutual Interest and prospects of cooperation.
ISEAS PERSPECTIVE .
De, P. (December 2011). ASEAN-India Connectivity:An Indian Perspective.
ERIA Research Project Report 2010, No. 7.
G.A, C., & R, V. (1992). Accounting for differences in aggregate state
productivity. Regional Science and Urban Economics 22, , 597–617.

146
Garcia-Mila, T. M., T., G. M., & T.J, M. (229–241). The contribution of
publicly provided inputs to states economies. Regional Science and Urban
Economics 22 , 229–241.
Holtz-Eakin, D. S., D, H.-E., & A.E, S. (1995a.). Infrastructure in a
structural model of economic growth. Regional Science and Urban Economics
25 (2), , 131–151.
Htun, K. M., Lwin, N. N., Naing, T. H., & Tun, K. ( December 2011). ASEAN-
India Connectivity: A Myanmar Perspective. ERIA Research Project Report
2010, No. 7.
MPAC, ASEAN Secretariat, (June 2011)
T.E, K., & J.S, Y. (1988). Measuring the benefits of a large public
investment: the case of the U.S. Journal of Public Economics 36 , Journal of
Public Economics.
The Research on Cross Border Trasport Infrastructure, 2009, JICA
147
Strategic and Economic Dimensions of Indo
– Myanmar Relations
Mohinder Pal Singh
Introduction
The Indo-Myanmar relationship is witnessing an unprecedented upswing in
the last two decades. The recent pace of reforms have brought this
erstwhile pariah state back into the main stream of world politics. As a
result of the reforms most countries have not only lifted the sanctions
but also started engaging with the government. Though the present regime
under President Thein Sein seems to be moving in the right direction by
the reformation process, yet there are spots of skepticism which is
making the government and private investors tread cautiously. The prime
concern being the sustenance of basic tenets of democracy and its
constitutional governance. The increasing interests of nations and
multinational companies have not only accelerated the rejuvenation of
Myanmar’s dwindling economy but also the reform movements.
Undoubtedly, the strategic cross roads on which Myanmar lies and its
mammoth untapped energy reserves are some of the reasons being
talked about . Both India and China have long boundaries with
Myanmar and thus have their interest in the region. China made an early
foray in the nineties when the rest of the world had severed their ties with
the military repressive regime, it made huge investments in infrastructure
and supply of military hardware. Realising the strategic importance of
the country India launched its ‘Look East Policy’ and changed its
stance from ‘ indifference’ to ‘engagement’ with the military regime. . In
order to study the past, present and future of Indo-Myanmar relations
it becomes imperative to see it through the prism of the Chinese and
US interests and the huge investments made in that country. With the
two decade old pro-China tilt in Myanmar’s history, India has set its goal
to consolidate its growing trade and diplomatic links.

148
With a total area of 678,500 sq km , Myanmar is the largest state among
the Southeast Asian mainland states1. Its 5876 kilometer land border is
shared by five countries namely China , India, Thailand, Laos and
Bangladesh. The country is pleated by a number of perennial rivers which
flow from north to south . Some of these rivers like Irrawaddy are large
bodies of water and being used for good inland water transportation and
trade. Salween, Chindwin, Sittang are some of the other important rivers
which apart from providing a livelihood for thousands of locals living
along the banks, these rivers are a major source of water for irrigation
and lately for hydroelectric power generation. The rail and road
infrastructure is poor and most of the transport corridors are along the
rivers in the North-South direction. The country has only 3440 kilometres
of paved roads including highways. The population of Myanmar is 56
million with an average of 73.5 people per sq km. Most of the population
in the central Irrawaddy plains and the density is scarce among the ethnic
population residing in the rugged mountain ranges towards the north,
west and east. Yangon , Mandalay and Moulmein are the only few cities
which have developed into big cities. And about 70% of the total population
still resides in the rural areas which consist of small towns and villages.
A large expanse of the country stays covered by forests and hence large
reserves of teak.
The aim of this paper is to delve into the strategic importance of
Myanmar in the region and and predict a pragmatic road ahead for both
countries to engage strategically and economically. However, any
assessment of the relations would be incomplete without examining the
historical developments followed by the political and strategic
perspectives. As far as Indo-Myanmar relations are concerned, apart
from examining the historical ties between the nations, in the present set
up it becomes imperative to understand the ‘China Factor’ and the ‘US
factor’ whose interests too collide in Myanmar.
149
Historical Overview
Whilst the British were making inroads into the Indian sub continent in
the eighteenth century Myanmar was also annexed into the British empire
and treated as a province of India. Myanmar was later separated from
India in 19372. According to Martin Smith, the British preferred the
ethnic minorities like Chin, Kachin and Karen for recruitment into the
colonial Army. Andrew Selth felt that British considered these tribals as
‘martial races’. The British believed that the Burmans were not good
soldiers. Hence, the army remained predominantly non-Burmese.
In the late 1930s, seeds of independence struggle were seen in the
country with the rise of some nationalist leaders , prominent among them
was Gen Aung San. However , by 1941 the Japanese ousted the British
and established their regime. The Japanese ruled Myanmar till 1945. It
was during this time they exploited the anti-British sentiments of the
people and promised them self-rule. The Burmese looked forward to the
Japanese for fulfilling their promise of granting them independence. But
this did not happen. By 1943, frustration began to set in the Burmese
people. In a haste, the Japanese appointed a Burmese Government but
that too was subservient to the Japanese Army Commander in Burma.
With Ne Win was appointed as Commander-in-Chief of Burmese National
Army(BNA) and Gen Aung San as Defence Minister in the Burmese adhoc
government. The Japanese thought that the Burmese would be pleased,
but the ground reality was otherwise. In 1944 the tables had turned
against the Axis powers in Europe and the return of the Britishers was
imminent, the BNA inwardly was supporting the British. In March 1945 ,
Gen Aung San and his BNA took up arms alongside the British and
ousted the Japanese.3
However, the impact of these four years of Japanese rule was immense
on the situation in Burma. The Burmese had got a feeling of semi-
independence and after the return of the British, the same was conveyed
in very serious terms. It also coincided with the formation of United
Nations which was promoting the de-colonisation drive. In 1948 , after a

150
giving a hastily prepared constitution and elections the British granted
Myanmar independence. Before this, the ethnic tribal areas or the frontier
areas having ethnic groups like Karens, Chin, Shan, Kachins were called
to participate in talks in the formation of the new nation. This historic
Conference was held in Panglong in 1948, where various ethnic groups
signed to be members of the union but with a clause that their autonomy
will be maintained4.
The British left a constitutional government under U Nu. What U Nu had
inherited was a strife-striken country which was replete with political
and ethnic disputes. The Burmese enigmatic leader Aung San was
instrumental in binding the ethnic groups together. However, after his
assassination the fissiparous tendencies re-surfaced which U Nu was
unable to bind effectively. By 1949 a number of serious insurgencies had
started by these ethnic groups. Nu’s regime was popular but weak in
controlling the rising disputes. In a coup d’ etet Gen Ne Win took over
the reins of the nation in 1962 . He set aside the the 1948 constitution
and formed a Revolutionary Council under his own leadership. He
subsequently established what is generally referred to as ‘ Burmese Way
of Socialism” by establishing a one-party rule of Burma Socialist
Programme Party (BSPP) , which he headed. This period saw a serious
economic decline of the already suffering economy5.
The 1988 Uprising. In 1988 was a epoch-making era in the history of
Burma. A student unrest which started from Rangoon became volatile
and spread into a massive country wide protest. Ne Win stepped down,
but he was believed to still retain influence in the national politics . At first,
the unrest was put down with the use of force on the demonstrators as
the military attempted to maintain its position. The regime’s control came
under increasingly serious threat , prompting efforts to resolve the problems
peacefully. When these proved to be unsuccessful, the BSPP’s decided to
hold free elections and to bar the military from direct involvement in politics.
151
However, the armed forces again staged a coup in September 1988 and took
over the control of the country(the third in the history of Myanmar).
According to Aung Maung it was not clear whether the whole episode had
been an internal power struggle between the party and the military, or a
grand strategy to perpetuate their joint influence.6
The military regime set up State Law and Order Restoration Council
(SLORC) to run the country, renamed Myanmar, until elections could be
held. Elections took place in 1990 and the opposition National League for
Democracy (NLD), led by Aung San Suu Kyi, the daughter of independence
hero General Aung San, won absolute majority of votes and seats. The
SLORC refused to recognise the results of the election, and instead it
continued its repressive rule. There were wide spread protests by pro-
democracy groups and NLD supporters across the country and appeals
from US and European Union countries . The regime did not budge and
instead held Ms Suu Kyi under house arrest and imprisoned all important
leaders of the NLD. The world called these elections a ‘sham’. What
followed was a almost unanimous international boycott in terms of
economic sanctions.
In a subtle move in 1997 the SLORC was replaced by a State Peace and
Development Council (SPDC), but without any change in their leadership
nor in the nature of the regime. Political prisoners were still held, and Ms
Suu Kyi was placed under house arrest again from 2000 to 2002 and from
2003 till 2010. This period also saw a reframing of a new
Constitution(formed in 2008) for the country. The Constitution was
highly skewed towards the military regime which gave them 25% of the
seats in both houses of the parliament . As per this constitution elections
could only be held for 75% of the seats in Pyithu Hluttaw(lower house)
and Amyotha Hluttaw( Upper House) of a bicarmal parliament.7
2010 Elections. The 2010 election were held as per the new
constitution. The new law annulled the 1990 elections and also
prevented the main opposition leader Aung San Suu Kyi of NLD from

152
running for President’s office8. NLD boycotted the elections. It was a
big setback for the regime but they still carried on without NLD. Foreign
media was not allowed and own media was always under a check so the
world called it a sham again. Military backed USDP won the elections
and formed the government. However, the new government soon showed
signs of bringing in serious reforms.
The Indo-Myanmar Strategic Ties
India-Myanmar ties are rooted in shared historical, ethnic, cultural and
religious ties. India and Myanmar share a long land border of over 1600
kilometers touching India’a four eastern states Mizoram, Manipur,
Nagaland and Arunachal Pradesh . A large population of Indian origin
(according to some estimates about 2.5 million) had settled in Myanmar
during the British rule. On 4 January 1948, when Myanmar attained
independence from the colonial rule India was its natural partner as both
the nations had been a part of the same British rule for over hundred
years. Prime Minister Jawaharlal Nehru referred to the shared future
awaiting both countries. “As in the past, so in the future, the people of India
will stand shoulder to shoulder with the people of Burma, and whether we
have to share good fortune or ill fortune, we shall share it together. This is a
great and solemn day not only for Burma, but for India, and for the whole of
Asia”. India and Myanmar signed a ‘treaty of friendship in 1951 and for
the next decade or so under the U Nu regime the relations between
India and Myanmar were cordial9.
As both countries emerged as sovereign nation-states from the British
empire , India and Burma adhered to the five principles of peaceful co-
existence which was formulated at Bandung Conference in 1954 as the core
of their foreign policies towards each other.. These were: (1) Mutual respect
for each other’s territorial integrity and sovereignty; (2) Mutual non-
aggression; (3) Mutual non-interference in each other’s internal affairs; (4)
Equality and mutual benefit; and (5) Peaceful co-existence10. Both
countries were also active in the non-aligned movement. However, the
military takeover and isolationist policies of the Gen Ne Win’s regime

153
brought the relations to turbulence. This period saw large scale
nationalization of industries, and repression of minorities. During the
decade of sixties a large number of Indian settlers were even expelled
from Myanmar. By 1964 this figure had reached over 10000 refugees
which did not go well with the Indian government 11.
The student unrest in Aug 1988, brought this suppressant regime to an
end. However the strong military did not let the opportunity go and once
again took over the reins of the nation. In order to quell the unrest they
promised elections which were held in 1990. Aung San Suu Kyi popularity
brought the National League of Democracy(NLD) to win the elections but
the military junta refused to hand over the power to them. The complete
world was watching the developments very closely . When National League
for Democracy (NLD) workers protested they were arrested and put
behind bars. The rampant human right abuse prompted the USA,UK
and European union to impose economic sanctions. India too did not
engage with the military regime and supported Aung San Suu Kyi.
India’s former Foreign Secretary, J. N. Dixit wrote, “Indo-Myanmar relations
went into a negative spin in 1990, when the military authorities of
Myanmar refused to accept the 1990 electoral verdict of the Burmese people
in which Aung San Suu Kyi, the leader of the NLD, emerged victorious12” .
However , seeing the sudden forays made by China in Myanmar made
India to seriously re-think of its foreign policy from idealism to
pragmatism13 . This policy shift was mainly due to five factors; economic
development of India’s eastern states, India’s increased interest in trade
with ASEAN of which Myanmar was a member, India’s quest for energy
security, and increased China’s influence near its eastern borders and
unlikelihood of a change in the military in the foreseeable future of
Myanmar14. In 1996 India began engaging with the military regime and
opened bilateral trade. This shift to realpolitik towards Yangon was
mainly seen in the period of Mr Narsimha Rao and Mr Vajpayee regime15.
Today China is a key player in Myanmar’s economy and their defence
ties are in solid footing . For China, friendly Myanmar meant two things,
154
one a closer approach to the Indian Ocean and less dependence on Strait
of Malacca for oil transportation and two, tapping of large energy reserves
in Irrawaddy basin.
India’s Look East Policy.
In early nineties India made a major strategic shift by adopting its
famous ‘Look East Policy’. The policy involved engaging with the countries
of Southeast Asia. The next few years saw a number of visits of dignitaries
from India and Myanmar exchange visits. India whilst still supportive of
the pro-democracy movement, began to actively engage with the military
junta and tried to revive the old ties. However, the road was not easy
now as the China had already made huge investments in almost every
sector in Myanmar. Shyam Saran, the former Indian Ambassador to
Myanmar in 1997 said that, “the relations were still frigid”.16 In November
2000, Gen Maung Aye, the second-most prominent leader of Myanmar’s
military junta, brought a high-powered delegation including Deputy Prime
Minister Lt. Gen. Tin Hla along with a team ministers to New Delhi. The
then India’s Home Minister, L.K. Advani, tried to break the frigidity and
talked about warming up of ties between the two countries. This visit was
followed by a six day visit of Gen Than Shwe to New Delhi in 2004 and
in 2006 President Abdul Kalam visit to Yangon. During these visits, a
number of bilateral treaties were signed relating from sharing of cultural
, social ties to technology and military cooperation. Subsequent years saw
the Government of India’s active involvement in over a dozen projects in
Myanmar, both in infrastructural and non-infrastructural areas. These
include upgradation and resurfacing of the 160 km. long Tamu-Kalewa-
Kalemyo road; construction and upgradation of the Rhi-Tiddim Road in
Myanmar; the Mega Rs 1500 Crore Kaladan Multimodal Transport Project,
which is going to link the north-eastern states via the Bay of Bengal and
Myanmar route17. An ADSL project for high speed data link in 32 Myanmar
cities has been completed by TCIL, ONGC, GAIL and ESSAR are
participants in the energy sector in Myanmar. M/s RITES is involved in

155
development of the rail transportation system and in supply of railway
coaches, locos and parts. In September 2008, NHPC signed an agreement
for development of the Tamanthi and Shwezaye Hydro-Electric Power
project in Chindwin River . A heavy turbo-truck assembly plant set up in
Myanmar by TATA Motors with GOI financial assistance was inaugurated on
December 31, 2010.
Other projects include revamping of the Ananda Temple in Bagan,
upgradation of the Yangon Children’s Hospital and Sittwe General Hospital.
India has also assisted in the reconstruction of 1 high school and 6 primary
schools in Tarlay township, the area worst affected by the severe
earthquake that struck north-eastern Myanmar in March 2011.18
However what needs to be kept in mind by the Indian Industry and the
Government is the wider interest of the north eastern states so that the
dividends of growth are seen on both sides of the border areas. A
proper roadmap of Govt-Industry plan should include such sectors
which not only gives inclusive growth to Myanmar but also regional
growth for our eastern states. The invitation to invest in Oil and Energy
sector by President Thein Sein must be utilized by the Government
keeping in mind that China has already commissioned the Shwe Gas
pipeline and pumping Natural Gas from Shwe to Kunming . We too must
think in terms of harnessing the energy reserves in Myanmar and may be
creating some energy-processing hubs in the eastern states for
subsequent usage in the development of the adjoining areas. Setting up
of ancillary industry for supply to specific projects in Myanmar can
also be planned and some economic zones can be specified for such
purpose. The proposals must also stress upon the development of road and
communication infrastructure to support the projects undertaken through
the land route. A proper planning of the projects can have a long term
impact of development for both the economies; Myanmar and the North
East India. Its time for us to reframe our ‘Look-East’ Policy to make it
into ‘Look-East through North-East’.
156
After the new government came to power in 2010 high level visits have
been a regular feature of India-Myanmar relations which have given a
further fillip to the strategic and economic relations. President Thein Sein
paid a State visit to India on October 12-15, 2011 and had a meeting with
the Prime Minister of India, Dr. Manmohan Singh, which was followed by
delegation level talks. President Thein Sein was accompanied by Chief of
General Staff Lt Gen Hla Htay Win and 11 Union Ministers and one Union
Deputy Minister and senior officials. In December 2011 Speaker of Pyithu
Hluttaw (Lower House) Thura U Shwe Mann led a high level parliamentary
delegation to India.The objective of the visit was to share India’s experience
in parliamentary practices and procedures with the visiting Myanmar
delegation. Myanmar Foreign Minister U Wunna Maung Lwin paid an
official visit to India from January 22-26, 2012. These visits were finally
followed by Prime Minister of India Dr. Manmohan Singh’s visit to Myanmar
in May 2012 18. This was the first visit of and Indian PM in 25 years.
During the visit, several new initiatives were announced and signed 12
MoUs and agreements including extension of a new line of credit worth
US$500 million .
Economic Ties and Bilateral Trade
Owing to the opening of Myanmar’s economy in the last three years, the
economic condition of Myanmar has shown improvement. Its Real GDP
growth has shown reasonable improvement of 4.7% in 2008 to 5.5% in
2013 and likely to touch 6.2% in 201419. Its overall exports too have
grown from US$ 8.11 bn in 2011-12 to 8.9 bn in 2012-13. The Indian
industry is showing increasing interest in Myanmar. As per Ministry of
External Affairs (MEA) report, India-Myanmar trade has grown
exponentially in the last few years. From a meagre US$ 12.4 million in
1980-81 to US$ 1070.88 million in 2010-11, $1.87 billion in 2011-12 and
US$ 1.98 bn in 2012-13, it is likely to touch $3bn by 2015. India accounted
for 15 percent of Myanmar’s global exports in 2012 and ranked as the
second largest export market after Thailand which is at 41% and China
was at 14 percent. However as far as Myanmar’s imports were concerned

157
India’s share was a meagre 3 percent with China at 37% and Thailand at
20%. India generally maintains a trade deficit with Myanmar which also
has increased form $293 mn in 2001 to US$ 860 in 2012-13. India's
imports from Myanmar are dominated by agricultural items (beans, pulses
and forest based products form 90% of our imports). India’s main exports to
Myanmar are primary and semi-finished steel and pharmaceuticals,
machinery, electrical and electronic equipment etc20..
In December 2012 President Thein Sein special visit to India and his
closed door meeting with the members of CII(along with representatives of
the government) at Mumbai assumes significance in terms of investment
opportunities and also for India’s strategic interests in the region. The
President invited India’s industry captains to invest in agriculture, energy
and infrastructure. The CII has reciprocated Thein Sein’s gesture by
proposing five points of connectivity between the two countries in culture
and commerce; promoting integration and synergy in power and railway
sectors; appropriate banking arrangements to foster trade and investment;
enhancing bilateral engagement in trade protection, and co-operation and
collaboration in industries like tourism and software. In June 2013 India
and Myanmar have agreed to take the ambit of trade to include textiles,
infrastructure, oil and gas. India’s Commerce and Industry Minister Mr
Anand Sharma visited Myanmar in Jun 2013 and offered India’s
commitment to help Myanmar in strengthening the banking system as we
inherit common banking laws21. At present India is the fourth largest trade
partner of Myanmar after China, Thailand, and Singapore.
(source-CII)
0
200
400
600
800
1000
1200
1400
1600
2004-05 2005-06 2006-07 2007-08 2008-09 2009-10 2010-11 2011-12 2012-13
US
$ M
illi
on
Exports
Imports
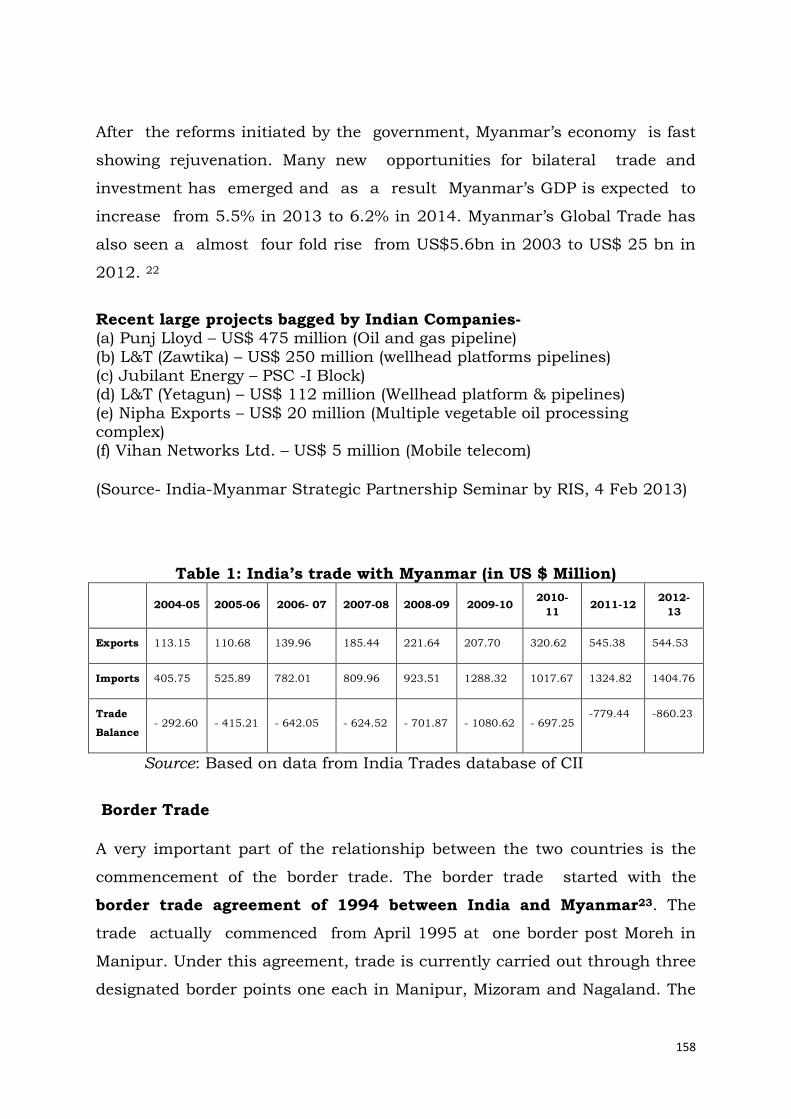
158
After the reforms initiated by the government, Myanmar’s economy is fast
showing rejuvenation. Many new opportunities for bilateral trade and
investment has emerged and as a result Myanmar’s GDP is expected to
increase from 5.5% in 2013 to 6.2% in 2014. Myanmar’s Global Trade has
also seen a almost four fold rise from US$5.6bn in 2003 to US$ 25 bn in
2012. 22
Recent large projects bagged by Indian Companies- (a) Punj Lloyd – US$ 475 million (Oil and gas pipeline)
(b) L&T (Zawtika) – US$ 250 million (wellhead platforms pipelines) (c) Jubilant Energy – PSC -I Block) (d) L&T (Yetagun) – US$ 112 million (Wellhead platform & pipelines)
(e) Nipha Exports – US$ 20 million (Multiple vegetable oil processing complex) (f) Vihan Networks Ltd. – US$ 5 million (Mobile telecom)
(Source- India-Myanmar Strategic Partnership Seminar by RIS, 4 Feb 2013)
Table 1: India’s trade with Myanmar (in US $ Million)
2004-05 2005-06 2006- 07 2007-08 2008-09 2009-10 2010-
11 2011-12
2012-
13
Exports 113.15 110.68 139.96 185.44 221.64 207.70 320.62 545.38 544.53
Imports 405.75 525.89 782.01 809.96 923.51 1288.32 1017.67 1324.82 1404.76
Trade
Balance - 292.60 - 415.21 - 642.05 - 624.52 - 701.87 - 1080.62 - 697.25
-779.44 -860.23
Source: Based on data from India Trades database of CII
Border Trade
A very important part of the relationship between the two countries is the
commencement of the border trade. The border trade started with the
border trade agreement of 1994 between India and Myanmar23. The
trade actually commenced from April 1995 at one border post Moreh in
Manipur. Under this agreement, trade is currently carried out through three
designated border points one each in Manipur, Mizoram and Nagaland. The
159
agreement accords a formal sanction to informal border trade between the
two countries. It holds importance in promoting economic ties between the
two countries. Initially the agreement provided for cross border trade in 22
products, mainly agricultural products, increased to 40 commodities in
2008 and the list was further augmented to 62 items in 2012. The latest
items includes Agricultural machinery, bicycles, coal, electric appliances,
fabricated steel products etc24.
The Border trade
reached US $ 13.73 million in 2009‐10, which is much less as compared wit
Myanmar‐China and Myanmar‐Thailand Border Trades.
Two border trade points, Moreh‐Tamu
(1995) and Zowkhathar‐Rhi (2004) have been operationalized so far with an
agreement on a third trade point, Avakhung‐Leshi concluded recently.
However lack of infrastructure on both sides of the border remains a major
limitation to augment border trade.
In 2011-12, Myanmar recorded a 58 percent hike in its overall
border trade with USD 3.367 billion; However India‐Myanmar border
trade in that period amounted to USD 15.409 million only .
Subsequently due to the efforts made by Government of India , in 2012-
13 this border trade grew to more than double at USD 36.2 million.
The External Parameters
The China Factor. Looking at Myanmar from the Indian perspective
whether strategically or economically, it is important to study the ‘China
Factor’ which is playing a vital role in the present day scenario. Historically
Myanmar and China were never close allies. After independence, the Sino-
Myanmar relations did not proceed well as the countries had different
ideologies: China had just established its communist government after
22 years of struggle, and British had left Myanmar with a democratic
set up akin to India. However, the Burma Communist Party(BCP) got a
fillip in its activity in the late fifties. The BCP activism was soon evident in

160
the streets of Yangon where students were seen to be wearing Mao
Badges. As a result of this apathy , anti-Chinese riots broke out in
Rangoon on 26 June 196725. This resulted in a large scale exudus of
Chinese from Myanmar ,which led to the deterioration of Sino-Burmese
relations for a long time. From 1970 till 1990 the relations remained
luke-warm and there was no major activities undertaken .
The Chinese factor became evident after the 1990 isolation of Myanmar
due to militarsed set up and human rights violation by the military
regime. China seized the opportunity and made diplomatic inroads
inspite of the chagrin by rest of the world. Myanmar’s hapless regime
welcomed the olive branch shown by China. The ruling Military junta first
needed to upgrade its defence forces with modern weapons and equipment.
China supplied Myanmar with numerous modern weapons systems and
equipment worth millions of dollars since 1990 and also provided the
training to pilots26.
This initially weapon supply included wide range of tanks, armoured
cars, towed and self-propelled artillery guns in addition to naval vassals
and communication equipment. Some analyst construed the proximity of
Sino-Burmese collaboration, when Indian Coast Guard captured three
Chinese Trawlers in Indian waters. These vessels were flying Burmese
flag and had electronic surveillance on board27. It was also reported
that China was helping Myanmar build a naval base with some
surveillance equipment at Coco Islands in the Bay of Bengal. Coco
islands form a group is islands about 30 kilometers from the Andamans
group of Islands. The Myanmar government have denied any such
reports28.
In geo-strategic and geo economic dimensions, Myanmar is important
to China. Myanmar has tremendous oil and gas reserves. It can yield a
‘landbridge’ between under developed Yunnan province and Indian ocean.
With Myanmar , Laos and Thailand China can form a sub-regional
grouping29. Since 1988 China has provided Myanmar with considerable
amount of aid, preferential loans and even cancelled some debts. By 2005

161
the total aid from China had reached US$ 100 million. By 2002 Chinese
companies had invested in 800 projects worth US $2 billion. The best
example of how a strategic move and yield economic dividends was evident
in 2007. On January 12,2007 , China wielded its veto at the United
Nations Security Council over a draft resolution on Human Rights abuse
by Myanmar regime tabled by the US and UK, on the ground that the
issues faced by Myanmar were internal30
Soon afterwards , China clinched up a 800 kilometer pipeline project
linking Kunming , Capital of Yunnan province to Bay of Bengal. Rail and
road route is likely to follow. This route to the Indian Ocean begins to
solve what Hu Jintao , the former President called China’s “Malacca
Dilemma” It is worth mentioning here that 80% of China’s oil import
passes through the 200 kilometer wide strait between Malaysia and
Sumatra(Indonesia) , which is known to be under US navy control. 31
This was followed by Chinese huge investment on Myitsone project of $
3.6 bn. By 2010 the Chinese influence over Myanmar was visible
beyond doubt to the complete world. A US senator Jim Webb once
commented ‘ Burma is risking being a province of China’. The new
Government headed by Thein Sein and emergence of the main opposition
leader on the scene. The new government showed signs of serious reforms
and this brought the liquidation of sanctions by the USA and the EU.
However, the pipeline was commissioned in May, 2013. Though the US
and the EU have opened its door to Myanmar reforms yet China’s
influence does not seem to waning in the near future. Myanmar has
constantly denied any Chinese military presence within its borders. For
China Myanmar is an important window opening into the Indian Ocean.
The Chinese and Myanmarese governments have negotiated to build a
highway and a railway along the pipelines to connect Kunming with the new
deep-sea port and the industrial zone at Kyaukpyu. This is expected to be
completed by 2015. Its completion will fuel progress for entire populations in
the pipeline region, and further enhance connectivity and long-term
economic links between Kunming and Kyaukpyu. For China, this project

162
will bring opportunities to its economically underdeveloped Yunnan and
Sichuan provinces32. Currently, southeast China is the only region in the
country that lacks oil refineries. It is expected that the pipelines will not only
alleviate Yunnan Province’s oil shortages but also diversify its economic
activities. This oil pipeline will give Myanmar US $ 900 million annually
as tariff and in turn China Saves it’s the Malacca strait for its oil tanker
ships33. This is how the pipeline project becomes a win-win situation for
both the countries.
Strategically, the use of Myanmar as a ‘landbridge’ to the Indian Ocean
and its establishment of regional hegemonic relations with other littoral
states sometimes referred to as ‘string of pearls’ will remain top priority
for the Chinese34. To India ,this is cause of serious concern in the times to
come. Though India has tried to break this string by establishment of
strong bilateral ties with Vietnam and Myanmar yet the China Factor will
remain an important part of India’s foreign policy imperatives towards
Myanmar35.
The US Factor. The US interest in Myanmar’s affairs has not been a
recent one . Infact during the cold war period for almost two decades of 60s
and 70s, US was probably Myanmar’s best friend. The Myanmar military
regime’s President Gen Ne Win visited USA in Sep, 196636. During this
period there was a notable Chinese support to the Communist party in
Myanmar. The US-Myanmar relations only plummeted after the 1988
uprising and non adherence to the 1990 election results. For over 20
years after the 1990 military takeover, US had imposed strong
economic and trade sanctions and cut off all diplomatic relations. The U.S.
sanctions on Burma were imposed due to what the U.S. government saw the
ruling military junta, the State Peace and Development Council’s (SPDC),
disregarding for human rights and civil liberties of the people there. These
sanctions included visa bans, restrictions on financial services, prohibitions
of Burmese imported goods, a ban on new investments in Burma, and
constraints on U.S. assistance to Burma37. The easing of US sanctions

163
began from May 2012 . It also named its first ambassador to Myanmar in
22 years39 . Myanmar is important to the U.S. for a number of reasons,
particularly “location, location, location,” said Karl D. Jackson, a professor
at Johns Hopkins University’s Paul H. Nitze School of Advanced
International Studies in Washington, D.C., during testimony before a Senate
subcommittee last year.“It is strategically situated below China, between the
emerging mega-nations of Asia — India and China,” Nitze said. If Myanmar
were to become a full-fledge client state of China, this would change the
regional strategic balance.38
The reasons for the move is generally believed to be two folds, one,
China’s arrival till the Indian Ocean via Myanmar through construction
of a pipeline and two, the signs of return of Democratic values by the
regime as evident in the election of the erstwhile imprisoned leader Daw
Suu Kyi.
The second half of 2012 saw the historic visits of Aung San Suu Kyi and
President Thein Sein to Washington and this was followed by a short
reciprocal visit by President Barak Obama at Yangon on November 19,
2012. This historic visit not only endorsed US acceptence but opened
flood gates for further reforms and aid. Speaking to Students at Yangon
University during his six hour tour, he said,” "Today I've come to keep my
promise and extend the hand of friendship. "Reforms launched from the top of
society must meet the aspirations of citizens who form its foundation. The
flickers of progress that we have seen must not be extinguished.” He later
met President Thein Sein and main opposition leader Aung San Suu Kyi39.
Shortly afterwards the US Aid was launched for Myanmar with a initial
allotment of USD 170 Million. This visit was shortly followed by
suspension of work at a mega $3.6 billion Myitsone Hydro Project being
done by a Chinese conglomerate. The Myanmar government sited
environmental reasons for this move.
164
The Road Ahead to Bolster Ties
The recent developments in Myanmar has brought in plethora of
democratic and economic reforms, which could probably transform the
country. According to McKinsey Global Institute, Myanmar's economy could
quadruple in size to $200bn, with annual growth of 8 percent by 2030. Till
now, China has already invested $14bn in energy and infrastructure
projects and now India and other countries are also wanting to move
in. These mind boggling figures of opportunity brings Myanmar to the
centre stage of world politics where countries around the world seem to
be vying to push their companies into making new investments. Myanmar
is welcoming this phase in its history. The second issue is of course the
rising influence of China in the region in general and Myanmar in
particular. Till the 2010 elections, question in everyone’s mind was ,
has Myanmar become China’s pawn? And this questions seemed to worry
not only western powers but surprisingly Myanmar too, whose people
were becoming vary of ‘unfriendly ways’ of Chinese companies operating
some large projects in the country. Last but not the least, fast paced
development in the last two years in Myanmar have totally changed the
shape of things. The sudden pledging of unflinching support of Japan and
US only goes to prove this point.
Amidst these concentric circles of international interests and diplomacy ,
India has to tread on its chosen path of harmonic relations. India is
neither a economic giant like China, or a monolith power like USA , nor
a rich economy like Japan which can wave of a billion dollar loan. India
is simply a big democratic power in the region and what India can offer
is ‘strong democratic values’ and economic support. It is a well known
that India occupies a important role in the regional dynamics of
Myanmar. India is not only seeing a responsible democratic nation on its
eastern border but also is helping it to become one. On the day of
Myanmar independence, Indian Prime Minister Jawaharlal Nehru said, “As
in the past, so in the future, the people of India will stand shoulder to
shoulder with the people of Burma, and whether we have to share

165
good fortune or ill fortune, we shall share it together. This is a great
and solemn day not only for Burma, but for India, and for the whole
of Asia.” The day does not seem too far when both the countries would
fulfill their dream. With a number of reforms already in place all eyes are
on 2015 elections which is likely to be held under close world scrutiny.
It is hoped that people of Myanmar will opt for a new democratic setup.
India should not lose opportunity an supporting the democratic setup so
that both the countries can collaborate adequately in cultural, economic
and strategic fields.
References
1 . Andrew Selth, Burma :A Strategic Perspective, Working paper No 13,
Australian National
University, 2001.
2. Martin Smith, Burma: Time for Change, Report , Minority Rights Group
International, 2002,Pp6-7.
3. Zaiton bte Johari, The Role of Tatmadaw in Modern Day Burma: An Analysis, Naval Postgraduate School, Monterey, California.2000,p 12
4. Panglong Conference- It was held in February 1947 at Panglong in
the Shan State in Burma between the Shan, Kachin and Chin ethnic minority leaders and Aung San, head of the interim Burmese government. U Aung Zan Wai, U Pe Khin, Major Aung, Sir Maung Gyi, Dr. Sein Mya Maung
and Myoma U Than Kywe were among the negotiators of the historical Panglong Conference negotiated with Bamar representative General Aung San and other ethnic leaders in 1947. All these leaders unanimously
decided to join the Union of Burma. On the agenda was the united struggle for independence from Britain and the future of Burma after independence
as a unified republic. 5.Mohammad Faisal Keling, Lt Col Dr Mohamad Nasir Saludin, Otto F Von,
Mohd Naeim Ajis, Md Shulri Shuib,A historical Approach to Myanmar’s Democratic Process, Journal Of Asia Paciffic Studies Vol 1, No 2 pp132-
133. 6.Maung Aung Myoe, A Historical Overview of Political Transition in
Myanmar since 1988, Asia Research institute, National University of Singapore, Working paper No 95, 2007,Pp4-5.

166
7. Mung Aung Myoe, Historical Overview of Political Transition in Myanmar
since 1988, , Asia Research Institute, National University of
Singapore,2007, pp 4-6
8. Kyaw Yin Hling, Political Impasse in Myanmar, South East Asia Research
Centre working paper No111,City University of Hong Kong,2011.Pp 21-22
9. Thin Thin Aung & Soe Myint, “India-Burma Relations”,
http://www.idea.int/asia_pacific/burma/upload/chap4.pdf ,22 June 2011,
10. Lien H Sakhong, The Future of Indo-Burma Relations, View from
Divided Peoples.2010.
11. Routrey, India-Myanmar Relations: Triumph of Pragmatism, Volume
1, Issue 1, October, Jindal Journal of International Affairs, OP Jindal
Global University , 2011.
12. J N Dixit, “Road to Mandalay”, Telegraph, 22 March 2006.
13. Bibhu Prasad Routray, India-Myanmar Relations:Triumph of
Pragmatism, Jindal Journal of International Affairs, OP Jindal Global
University.Pp299-321, Vol 1,Oct 2011
14. Zhao Hong, The China-Myanmar Energy Pipelines: Risks and Benefits,
ISEAS Singapore,2013
15. Gen VP Malik, Reflections on Indo-Myanmar Relations, Scholar
Warrior, Autumn 2012
16. Shyam Saran, “The Virtue of Pragmatism”, Times of India, 7 August
2010.
17. Aung Marm Oo, Indian Look East Policy and the Kaladan Project of
Western Burma, www.mizzima.com, Jan 24 , 2013
18. India-Myanmar Relations, Ministry of External Affairs paper ,
www.mea.gov.in
19. Enhancing India-Myanmar Trade and investment Relations: A brief
Analysis, Export –Import Bank of India Working Paper No23, 2013
20. India Myanmar expanding Bilateral Cooperation, CII note 2013.
21. Myanmar Beckons, Times Of India, May 29,2012
22. Augmenting Bilateral Trade Between India And Myanmar, Indian
Chamber of Commerce,2012
167
23. T B Singh,A study on Indo-Myanmar Border Trade, 2007.
24. Indo-Myanmar Border Trade DGFT Public Notice no30/(RE
2012)/2009-14
25. Andrew Selth, Burma’s China Connection and the Indian Ocean Region ,Strategic and Defence Studies Centre, National Library of Australia,
Working Paper No 377,2003 26. Thant Myint U, Where China Meets India, Published by Faber and Faber,London, Pp135-136,2012.
27. Hongwei Fan,The 1967 anti-Chinese riots in Burma and Sino-Burmese relations, Journal of Southeast Asian Studies,Vol. 43, No. 2 (June
2012), pp. 234-256. 28. Li Chenyang, China-Myanmar Comprehensive Strategic Cooperation,
Journal of Current South Asian Studies,2012.
29. Andrew Selth, Burmas Coco islands:rumours and Realities in the
Indian Ocean,Working paper 101, City University of Hong Kong, 2008.Pp8-
10
30. Poon Kim Shee, The Political Economy of China-Myanmar Relations:
Strategic And Economic Dimensions, The International Studies Association
of Ritsumeikan University: Ritsumeikan Annual Review of International
Studies, 2002. ISSN 1347-8214. Vol.1, pp. 33-53 2003
31. Andrew Selth, Burma’s China Connection and the Indian Ocean
Region ,Strategic and Defence Studies Centre, National Library of Australia,
Working Paper No 377,2003
32. Zhao Hong, The China-Myanmar Energy Pipelines: Risks and Benefits,
ISEAS Singapore,2013
33. David Pilling, Pipeline marks Scramble for Myanmar. 34. Andrew Selth, Burma’s China Connection and the Indian Ocean
Region, National Library of Australia, working Paper No 377,2003 35. Billy Tea, China and Myanmar Strategic Interests, Strategies and the
Road Ahead,Institute of Peace and Conflict Studies, New Delhi,2010. 36. The Rise and Fall OF Gen Ne Win, The Irrawaddy, September 1997, Vol 5 , No 6. Burma in Revolt—Bertil Lintner.
http://www2.irrawaddy.org/article.php?art_id=884 37. Micheal F Martin, US Sanctions on Burma, Congressional Research Service, 2012.
38. A new Chapter in US- Burma Relations,VOA editorial, May 23,2013. Derek Mitchell, a veteran diplomat and Asia specialist , presented his
papers to President Thein Sein on July 11, 2012. 39. Wyatt Olson, US marks closer ties with Myanmar, but China's
influence lingers, Starts and Stripes May 20,1013.

168
40. BBC, November 19 ,2012. http://www.bbc.co.uk/news/world-asia-
20386066
Lt Col Mohinder Pal Singh is on study leave at the Department of Defence
and Strategic Studies, University of Allahabad. It is “ certified that the views expressed and suggestions made in the article are made by the author in his personal capacity and do not have any official endorsement.”

169
A review of Corporate Social Responsibility in Asia with
special reference to China, India and Japan
Prerna Goyal Ramuka12 | Kusum Pawar13
Abstract
As Asia is increasingly the “factory” as well as an important world market,
businesses have increased their Asian presence. Many supply chains now
have start and end points in Asia.
Asia’s economic development is giving rise to new challenges for local and
overseas corporations. Levels of pollution and toxicity have risen while
health concerns such as obesity and diabetes have intensified. The growing
middle class across Asia is well-educated, well-informed and empowered to
express their interests more clearly.14 Meanwhile, Asian businesses abroad
have been challenged for their employment practices and influence over
governments.15 In this era of growing Asian economies and corporate
ventures becoming increasingly multinational, big challenges are emerging
in the form of corporate social responsibility and business ethics. The paper
reviews the evolution and importance of Corporate Social Responsibility
(CSR) and its rise in Asia. It also examines the state of CSR in China, Japan
and India; the fastest emerging economies of Asia.
Key words: Corporate Social Responsibility, Asia, China, India, Japan
*Research is done under aegis of Remsons centre for Management Research at
Durgadevi Saraf Institute of Management Studies, Mumbai
12 Assistant Professor, Durgadevi Saraf Institute of Management Studies, Mumbai 13 Assistant Professor, Durgadevi Saraf Institute of Management Studies, Mumbai 14 Jem Bendell and Chew Ng, “Characteristics of Asian CSR”, Lien Centre for Social Innovation, 2009
15 Jem Bendell and Chew Ng, Introduction, in “The Eastern Turn in Responsible Enterprise: A Yearly Review of Corporate Responsibility”, Jem Bendell et. al
Philippines: Lifeworth, 2009

170
1. Introduction
Major developments in the flow of funding, growing but often untapped
philanthropic resources, and a shift in the role of government, as well as
new social investment models and impact measurement tools, are
significant changes occurring in the social sector. More companies are
entering a reformed, competitive field of social change with new
entrepreneurial models, established traditional organizations, and
innovative funding strategies fueling widespread success. Rangan et al.
(2008) note that the sector remains on the brink of several possible futures,
including consolidation, entrepreneurial growth, and expressive
experimentation. But the scenario that unfolds over the next 20 years will
depend largely on the ability of emerging social sector leaders to make a leap
forward in thought and action to capitalize on the abundant potential for
social change.
A rich historical account of the evolution of organizations' approach to
societal responsibilities over the last fifty years has been provided by Carroll
(2006). A study by Wing et al. (2008) shows that today, the United States
has more than 1.4 million non-profit organizations, and they account for 5
percent of GDP while individual charitable giving alone has reached a high
of $300 billion. They estimate that by 2052, $6 trillion will flow directly to
social enterprise organizations. Concurrently, a new generation of business
leaders and philanthropists are experimenting with hybrid forms of social
enterprises. Over the past two decades, the traditional concept and practice
of philanthropy has undergone a significant evolution into a variety of
labels, such as social consciousness, corporate citizenship, triple bottom
line, and strategic philanthropy (Zadek 2001; Carroll 2006; Visser et al.
2007; Googins and Rochlin 2007). While significant progress is being made
in involving organizations in social causes, a national survey (Center for
Corporate Citizenship 2004) in the USA revealed that most firms have not
been able to significantly integrate Social Responsibility into their
organizations. Googins and Rochlin (2006) state: “What is clear is the
widespread agreement on the need for a more active and strategic

171
citizenship,” and they also note that there is no dominant framework or
model for bringing that about. The required change will not come about from
doing more of the same or making incremental changes. This study aims at
analyzing the present state of corporate social responsibility in Asia. It
further overviews the state of CSR in the three superpowers of
Asia; China, India and Japan.
2. The Evolution of the Social Sector
The study of literature helps to identify a smooth movement of
social/welfare services from government to the private (voluntary/nonprofit)
sector to the corporate sector. Austin et al. (2007) observe a constant
blurring of boundaries (figure 1) among sectors leading to the emergence of
a fourth sector (Fourth Sector Network. 1997-2008).
Figure 1: Blurring of Boundaries among Sectors
GOVERNMENT
•Government started outsourcing work to NGOs.
•The share of world bank projects with some degree of “civil society” involvement (encompassing NGO participation) increased from 6 percent in the late 1980s to over 70 percent in 2006 (World Bank, 1995; 2006a).
PRIVATE VOLUNTARY
SECTOR
•NGOs started looking for Corporate funding due to limited resources and intense competition.
•The need to bring in professionalism and innovation in management led to merging in the corporate sector.
PRIVATE CORPORATE
SECTOR
•Searching for innovative strategies that will counter the mounting pressures felt by corporations from various publics.
•Entering into partnerships with both Govt. and the Voluntary sector to facilitate social change.

172
The traditional functions of the state have been law, justice and order. A
welfare state has a much-expanded role ensuring its citizens, public utilities
like road, power and water supply. The state also provides merit goods such
as education and health services that have positive externalities. Most of
these services have been traditionally provided through in-house facilities of
governments, financed and managed directly by them.
But then a new wave of Public-private- partnership (PPP), an approach
under which services are delivered by the private sector (non-profit/for-
profit organizations) while the responsibility for providing the service rests
with the government, was seen. This partnership takes two major forms
(figure 2 & 3).
Figure 2: Reimbursement Model of Providing Services
provides services
pays for the service
(reimburse)
PRIVATE
PARTNER
GOVT.

173
Figure 3: Contractual Model of Providing Services
In the developing world, ‘classical philanthropy’ such as building schools,
hospitals and cultural institutions, far from being an add-on, is driven by
social necessity. In order to effectively operate amidst inadequate state
welfare, healthcare, education and infrastructure, business has had to step
in. In post-colonial and post-conflict countries business has had to
contribute to nation-building, thereby innovatively redefining the
parameters of what constitutes CSR.
A Brief Guide to Understanding the Social Sector (2003); developed by the
Center for the Advancement of Social Entrepreneurship at Duke University’s
Fuqua School of Business; brings to light that the social sector, also known
as the fourth sector, traditionally is divided into various sub-sectors and has
different forms like nonprofits, for-profit, hybrid, or cooperative
organizations etc. with the primary mission of creating social value, not
economic value for their owners or employees or consumption value for their
customers. Harvard Business School professor Jane Wei-Skillem, says that "
Without question, the social sector has contributed in significant ways to
addressing major societal problems, yet traditional approaches are still
falling short, especially as the intensity and complexity of social problems
has grown."
provides services
enters into a contract
GOVT.
PRIVATE
PARTNER
174
3. Corporate Social Responsibility
Corporate Social Responsibility (CSR) has been defined by Enderle and Tavis
(1998) as "the policy and practice of a corporation’s social involvement over
and beyond its legal obligations for the benefit of the society at large".
Chapple and Moon (2005) define Corporate Social Responsibility (CSR) as
‘the social involvement, responsiveness, and accountability of companies
apart from their core profit activities and beyond the requirements of the law
and what is otherwise required by government’. According to McIntosh et al.
(1998), being socially responsible has been a concern very much related to
the rationale that businesses are more likely to do well in a flourishing
society than in one that is falling apart. Over the past decades both the
concept and the practice have evolved as a reflection of the challenges
created from an ever-changing society. Bronn and Vrioni (2001) believe that
in today's competitive marketplace, altruistic intentions alone can no longer
justify charitable giving and expenditures related to philanthropic activities.
Sophisticated customers and stakeholders are looking at the behavior of the
firm; are they donating just to gain good will or are they truly concerned
about particular issues?
4. CSR in Asia
According to Sharma (2010), Asian corporate philanthropy has always
existed in one form or another. “The national institutional structures of
philanthropy and community involvement in many of today’s leading
economies in Asia are only just catching up with what has long existed in
the West for well over a century. In most Asian countries philanthropy has,
until recently, been a communitarian effort. Asian philanthropists have
preferred to be personally involved in the grant-making process, in contrast
to the more formalized approaches of the West.” 16
16 Bindu Sharma, “Discovering the Asian Form of Corporate Social Responsibility”, Lien Centre for Social Innovation, 2010

175
Though the Asian companies are adopting the concept of corporate social
responsibility (CSR) from the Western principles of liberal democracy, justice
and social equity, many of these western principles may not apply to them.
This is because the Asian firms, operating in fast-growing economies with
different environmental and labor standards, face unique issues. One such
important issue is that there is a significant wealth gap in many Asian
countries which contains some of the world’s fastest-growing economies
alongside slowly developing legal and corporate-governance systems.
Investors who have a focus on CSR need to assess regional CSR through a
set of “Asian lenses”.17
Bendell and Ng (2009)18, in their study observe that contemporary Asian
CSR is familial, governmental, practical, informal, religious and non-global,
in comparison to the West. They believe that an overarching sense of
compliance-style management can hinder the practice and development of
business ethics. Looking at Asia’s status as an economic powerhouse in the
world economy, it might be reasonable to assume that the level of Corporate
Social Responsibility (CSR) activity would be proportionate. However, in
frequent comparisons of CSR across countries, Asia seems to fall short.
Although CSR is not unknown in Asia, the understanding and its
importance has tended to lag behind developments in Europe and North
America.19 The understanding of CSR has not kept pace with the
expectations and demands placed on business by the various stakeholders,
including consumers and governments. It would thus be worthwhile to
understand the present state and the opportunities and challenges that CSR
poses on Asian companies.
Amongst these challenges, CSR can be viewed as an opportunity as well. In
the twenty-first century, in tandem with developments in advanced
economies in North America and Europe, CSR has acquired renewed vigor in
17 CLSA Asia-Pacific Markets, “Ethical Asia”, 2009
18 Jem Bendell and Chew Ng, “Characteristics of Asian CSR”, Lien Centre for Social Innovation, 2009 19 David B. Montgomery, “Asian Management Education: Some Twenty-First Century Issues,” Journal of Public Policy and Marketing, 24 no. 1 (2005);
Richard Welford, “Corporate Social Responsibility in Europe and Asia: Critical Elements and Best Practice,” Journal of Corporate Citizenship, 13 (2004).

176
the corporate landscape in Asia, in which the notion of corporate credibility,
linked with how a company conducts its business and makes its profits, is
of growing importance.20 CSR reporting in Asia is rising fast. The CLSA
“Ethical Asia” report (2010) shows that the region now accounts for more
than 20% of global CSR reports versus 12% just five years ago. Many Asian
countries are now setting up philanthropic foundations, as a way of
implementing CSR, along the lines of Western corporate foundations.
5. Emerging need for CSR in Asia
5.1. Changing Dynamics of the Business World
Pressure from Various Publics
In the current scenario any choice an organization makes has a direct
influence on the survival of large parts of society, the environment and the
world at large. The bottom line is: Organizations individually and collectively
determine the future and do affect all of us.
Climate change, economic and financial crises, environmental disasters,
nuclear risks etc. – are triggering important questions like how we behave,
consume and lead our lives - and how we do business? There is an
increasing pressure on companies to transform current practices towards a
more sustainable paradigm. There is an expanding consciousness among
business leaders, consumers, activists and policy makers across Asia. The
"winds of change" are requiring not only NGOs and NPOs, but businesses to
address the urgent issues on environmental sustainability, social justice
and broad-based prosperity. Various stakeholders are standing up for their
rights. The World Economic Forum Survey Report 2003 concludes that
"People have started to view large companies as too powerful, and as
20 Patrick L.Smith “Asians Demanding Greater Corporate Responsiveness,” International Herald Tribune, October 25, 2006; Jedrej George Frynas, “Corporate
Social Responsibility in Emerging Economies,” Journal of Corporate Citizenship, 24 (2006).

177
untruthful, unfair, and unethical." This is creating an immense pressure on
Asian organizations to rethink and fostering new ways of working in a more
socially relevant manner.
Value Based Organizations
Previous research (Austin and Reficco, 2009) shows that corporations are
continually applying values to everything they do, from a marketing
standpoint, from a product development standpoint, who they hire, how
they hire and how they treat their people.
A Timberland Human Resources manager notes, “The awareness of values is
what we are trying to raise with folks. It’s no longer going to be acceptable
just to get the business result.”
Bill Gates, Microsoft founder and philanthropist believes that "We are living
in a phenomenal age... finding approaches that meet the needs of the poor in
ways that generate profits and recognition for business, we will have found a
sustainable way to reduce poverty in the world."
As Asian economies grow and corporate ventures become increasingly
multinational, big challenges are emerging for corporate social responsibility
and business ethics.
5.2. Sustainability Requirements
The sustainability threats posed to corporations across countries in Asia
require them to migrate from one of maximizing returns to investors to
optimizing returns to stakeholders. The underlying premise is that serving
such a broader constituency will make the company more sustainable. This
amplified purpose means that the company is producing both economic and
social value, which some have referred to as a double or triple (if one breaks
out environmental value as a separate category) bottom line (Austin and
178
Reficco, 2009), or “blended value” (Emerson 2000, 2003, March 2006;
Emerson and Bonini 2003). An increasing need, for companies to discover
ways to make these returns complementary and synergistic rather than
competing (Paine 2003), has been observed. Various studies show the
emergence of a multitude of indicators, standards, and codes that report
performance to the internal and external stakeholders across Asia. Asian
companies are being pushed to integrate business and sustainability in
innovative ways.
5.3. Need for Disruptive Social Innovation
The penetration of the social realm into corporate strategy of Asian
companies has gathered momentum in the last years. The movement for
CSR has “won the battle of ideas” (Crook 2005). By now, most well managed
companies have adopted the practices and certifications de rigueur in their
industries, having gone through what Zadek (2004) calls the “defensive” and
the “compliance” stages of CSR. Managing the social and environmental
footprint of economic activity is generally accepted as part of the cost of
doing business. But much remains to be done. If organizations are to move
their social activities from satisfying behaviour and take their commitment
to society and the environment to the next level, they will need to rethink
their current approaches and innovate, tapping into the creativity of every
individual. Companies need to look ahead of mere compliance and have to
create disruptive change in the pursuit of new opportunities.
Research shows (Austin and Reficco, 2009) that a social change is
happening but that is all about simply applying existing business expertise
and market-based skills to nonprofits. The opportunities and challenges in
the social sector require social transformation i.e. not only the creative
combination and adaptation of social and commercial approaches, but also

179
the development of new conceptual frameworks and strategies tailored
specifically to social value creation.
6. CSR in India
In India CSR has evolved in four phases:
Phase 1 - Pre Industrialization period: (upto 1850): The rich and wealthy
merchants shared a part of their wealth with the society by setting up
temples, helping the poor population during times of Famine and Epidemics
spread. Their intention, however, was to gain goodwill and fame in the
society. With the advent of Colonial rule in India the approach towards CSR
changed and it was governed by caste groups and political inclinations of
the industrial families like Tata, Godrej, Bajaj, Modi, etc.
Phase 2 - During Independence Movement (from 1900 to 1947): During
the Independence movement the concept of “Trusteeship” evolved as
introduced by Mahatma Gandhi. He stressed that Indian companies should
be like “Temples of Modern India” and work dedicatedly towards socio-
economic development of the country. This philosophy influenced
establishment of schools and colleges set up and run by business owned
trusts.
Phase 3 - The Era of Command and Control (1960-1980): This was the
era of Mixed Economy and emergence of Public Sector Undertakings (PSUs).
Private sector was surrounded by stringent rules and regulations, high taxes
and restrictions. The objective of PSUs was to ensure equal distribution of
wealth and resources but they were only effective to a limited extent. This
resulted in shift of focus from public to private sector. A national workshop
involving academicians, politicians and business men was set up to
reconcile CSR. The emphasis was put on transparency, Social accountability
and regular communication with Stakeholders.
Phase 4 - Era of Liberalization (from 1980 till date): This era marked
advent of LPG. Control and licensing were relaxed. Many Local and Global

180
private players entered Indian Markets. This era earmarked rapid growth of
economy and the companies operating in India. This growth had positive
impact on their willingness to contribute more towards the society. The
companies in this era abandoned the traditional forms of CSR and adopted
novel practices to integrate CSR into a sustainable growth strategy. Around
64% of the companies started CSR programs between 1991 and 2005.21
Current State of CSR in India: As already established CSR is not a new
concept in India. Corporate like Tata, Birla and IOC have been involved in
CSR activities since their very inception. The current wave of CSR, however,
differs from the past trend. The social responsibility is no longer focused on
social concerns only; it takes into focus the environmental issues as well.
Many large companies are a part of “multi-stakeholder initiatives” and
“public-private partnerships”. CSR practices are now a comprehensive
part of business strategy and processes. Indian companies have realized
that CSR is not just an indirect expense but is a lucrative strategy to gain
and protect reputation, create a positive brand image, improve the morale of
employees, project goodwill and desirable public perception of the company.
The companies have dedicated CSR teams to formulate strategies and
policies for their CSR initiatives. The various methods and initiatives run by
Indian companies can be clubbed into two categories, namely
Comprehensive Initiatives like medical and sanitation facilities, building
schools and houses, village empowerment, making the rural population self-
reliant through vocation training and knowledge of business operations, and
Sporadic Initiatives like health camps for free check up, treatment and
awareness, collaboration with NGOs, education camps, sabbatical to
employees for offering voluntary services etc.
In the recent mandate under the Companies Act, 2013, any company having
a net worth of rupees 500 crore or more or a turnover of rupees 1,000 crore
or more or a net profit of rupees 5 crore or more should mandatorily spend
21
Bindu Sharma, “Discovering the Asian Form of Corporate Social Responsibility”, Lien Centre for Social Innovation, 2010

181
2% of their net profits per fiscal on CSR activities. The rules will come into
effect from 1 April 2014.22
Still there some companies who are reluctant to share the budget allocation
to CSR. Many CSR initiatives are a “green wash”. Around 40% companies
run CSR initiative for tax exemption and because they feel it is mandatory.23
India is facing many problems viz. unclear, unpractical and poorly
monitored regulations, poor infrastructure, a complicated tax system, and
too much bureaucracy. These issues should be arrested to take the CSR
interventions to another level. We must develop broad frameworks on
corporate governance and penalties for non-compliance should be strictly
implemented. As per the recent surveys CSR is fast gaining momentum in
India and will continue in coming future.
7. CSR in China
In 1970s Chinese Communist Party (CCP) identified that China lagged
behind many developed countries as far as energy efficiency and pollution
control was concerned. They made efforts to achieve sustainable
development through social responsibilities.
In 1995 eco-construction program was initiated in China to manage and
promote development of sustainable communities. This program includes
development of Eco-Provinces, Eco-communities and Environmental-
Protection Model Cities. However, instead of an improvement researchers
have noticed a decline in the results of the projects initiated by the MEP Liu
(2008, 2009).
Since 2004 CSR has become a prominent issue in China and it is apparent
in the Five Year Plans of China. This is also evident from the fact that in
2006 State Grid was the only company in China to file a CSR report. In
22 "The Flag Off of CSR Rules: India Inc.’s To-Do List for Compliance to Section -135", Forbes. 4 March 2014. Retrieved 7 March 2014 23 Bindu Sharma, “Discovering the Asian Form of Corporate Social Responsibility”, Lien Centre for Social Innovation, 2010

182
2012, 1,722 Chinese companies filed CSR reports, according to a study by
Syntao, a sustainability consultant. Indeed, almost a quarter of large state-
owned enterprises in China filed CSR reports in 2012. CSR has gained more
weight age in Chinese economic, political and academic arena. The
stimulation for CSR in China has come from both global and domestic
forces.
This trend has emerged due to China’s entry into the World Trade
Organization (WTO), its economic integration into the world market and rise
in awareness levels of Chinese citizens. International customers increasingly
demand companies to undergo CSR audit and to fulfill this demand,
Chinese government has backed initiatives like introduction of the Labor
Contract Law, Taida Environmental Index (in Shenzhen Stock
Exchange) and SASAC initiative by State Council. Another powerful
example of Chinese government’s commitment to CSR becomes evident from
Article 5 of the 2006 Chinese Company Law, which requires companies
to “undertake social responsibility” during the course of business.
CSR measures undertaken in China include offering reliable, eco-friendly
and safe products, labor protection and welfare plans, corporate
philanthropy and charitable activities and community development projects.
One such example is direct monetary donation given by Chinese companies
to the earthquake affected area of Southwest China, following the Sichuan
Earthquake. Many Chinese corporations have established CSR guidelines
which are incorporated into their sustainable business strategy. Another
prominent practice is called Creating Shared Value (CSV), which means
greater joint value in collaboration with communities. The prerequisite for
an effective corporation is healthy and educated workforce, sustainable
resources, and agile government.
Some private initiatives include Responsible Supply Chain Association’s
CSC9000T and the Chinese industrial associations’ joint declaration of the
Chinese CSR Industrial Principles.

183
However, unlike western countries, in China, CSR is still the prerogative of
government and is more prominent in state-owned enterprise (SOE). Chan
and Ma (2004) believe that China keeps continue to push for rapid economic
growth at the costs of the environment, which is being supported by
economic growth theories. This has created imbalance between
implementation of CSR in private sector and SOEs. Another imbalance in
China is between Rural and Urban communities. The challenge is green
washing by many Chinese companies. Although some Chinese companies
are internationally recognized for their CSR interventions, it’s not clear
whether the same has been converted into genuine social and environmental
concern.
8. CSR in Japan
CSR in Japan is strongly rooted in Keizai Doyukai’s 1956 Revolution. The
resolution of introducing CSR in Japan was also based on a book by Howard
R. Bowen called “Social Responsibilities of the Businessman”. The book was
published in the U.S.in 1953 and was translated into Japanese in 1960.
During 1960s Japan was struggling with numerous pollution problems
which led to distrust and antagonism of the public towards the companies
perceived as contributing to this issue. These issues were resolved case-by-
case and basic laws regulating the pollution levels were introduced. This
was the first phase of CSR in Japan. In the second phase during 1970s
there was huge criticism and outcry for supremacy of corporate profits in
post-oil shock era. As of result of public outrage anti-pollution departments
and foundations to return profits were set up by the companies. Phase three
(1980s) was demarcated by excess liquidity, bubble economy expand,
soaring land prices, low standard of living-“rabbit-hutch” dwellings, long
work hours, unequal treatment of men and women. As of result of this, the
concept of “good corporate citizen” was developed. Companies initiated
philanthropic activities by means of contribution in academics, art, welfare,

184
and international exchange. Phase four (1990s) witnessed series of blow to
Japanese companies due to Bubble collapse. Other issues were business
ethics, global warming. To address these issues Keidanren formulated
Charter for Good Corporate Behaviour and Companies set up global
environment departments to engage in social contribution. A new era of CSR
began in Phase five. Corporate scandals surfaced leading to crisis of
stakeholders. This led to extension of CSR to corporate ethics, compliance,
accountability and disclosure. Socially Responsible Investment (SRI)
funds emerged, CSR ratings became widespread and companies established
CSR departments. The year 2003 is recognized as start of CSR management
era. Currently the level of CSR is good in some areas and needs
improvement in few others. Japan has actively participated in numerous
environmental groups such as the Intergovernmental Panel on Climate
Change, United Nations Environmental Program, United Nations Population
Fund and the Global Environment Facilities. All in all, since the environment
has received so much attention since the late 1960s, Japan now occupies a
leading position among high-density populated countries in terms of
environmental sustainability (Hasegawa & Noronha, 2009).
Some aspects that need further development are tendency of Japanese
companies to cover up major issues and problems, limited opportunities for
minority, privacy policy for customers, CSR standards for suppliers,
opportunities for women, improving employability of personnel, work life
balance, equitable working conditions and transparent business practices
etc
9. Findings and Conclusions
Japan was the first of the three countries to officially recognize the need for
active CSR. 21,779 Japanese companies have received an ISO14001
certification, which is the highest amount in the world being thus better
than 19000 companies in China and much better than 1500 companies in
India (Peglau, 2010). In addition, according to the Organizations Using the

185
Guidelines, 2010, there are currently 95 Japanese companies that have
reported their organizational performance to the GRI, which puts Japan
ahead of both China (48) and India (9). But when it comes to improving the
employability of personnel, the opportunities for women and the
opportunities for minorities, Japan is lacking with a significantly low
number of 2 Japanese facilities certified with the SA8000, compared to 316
in China and even 508 in India (SA8000 Certified Facilities, 2010).
These findings set Japanese CSR apart from that found in other Asian
countries (Fukukawa & Moon 2008). China is doing very well in the
ISO14001 standard and average in the GRI, while India comes out best
according to the SA8000 standard but is doing not so good in the ISO14001
and GRI.
Conclusion
The rapid economic expansion in Asia, which coincides with the latest CSR
evolution, provides a unique opportunity for Asian companies. CSR in Asia
is now becoming recognized as a means of addressing a spectrum of
stakeholder expectations that has a direct impact on improving profit and
increasing shareholder value. Asian companies are being pushed to
integrate business and sustainability in innovative ways. Nonetheless, there
is still need for greater improvement on environmental and social issues. For
companies to succeed in China, India and Japan; one of the most dynamic
sites in Asia for developing new products, processes, and business models;
it will increasingly be about competing to create sustainable value in an
uncertain and environmentally constrained world. As Asia’s influence in
international markets and on the global policy stage increases, active
engagement in CSR offers an opportunity to influence one of the most
powerful forces shaping the landscape for global business and sustainable
development.
This paper has a range of implications for policy, practice and research
arising from opportunities and challenges of CSR in Asia.
186
References
Jem Bendell and Chew Ng, “Characteristics of Asian CSR”, Lien Centre for
Social Innovation, 2009
Jem Bendell and Chew Ng, Introduction, in “The Eastern Turn in Responsible
Enterprise: A Yearly Review of Corporate Responsibility”, Jem Bendell et. al
Philippines: Lifeworth, 2009
Wendy Chapple and Jeremy Moon, “Corporate Social Responsibility (CSR) in
Asia,” Business and Society, 44 (2005): 415 – 41
Bindu Sharma, “Discovering the Asian Form of Corporate Social
Responsibility”, Lien Centre for Social Innovation, 2010
CLSA Asia-Pacific Markets, “Ethical Asia”, 2009
David B. Montgomery, “Asian Management Education: Some Twenty-First
Century Issues,” Journal of Public Policy and Marketing, 24 no. 1 (2005);
Richard Welford, “Corporate Social Responsibility in Europe and Asia: Critical
Elements and Best Practice,” Journal of Corporate Citizenship, 13 (2004).
Patrick L.Smith “Asians Demanding Greater Corporate Responsiveness,”
International Herald Tribune, October 25, 2006;
Jedrej George Frynas, “Corporate Social Responsibility in Emerging
Economies,” Journal of Corporate Citizenship, 24 (2006).
"The Flag Off of CSR Rules: India Inc.’s To-Do List for Compliance to Section -
135", Forbes. 4 March 2014. Retrieved 7 March 2014
Ethical Corporation, “CSR in India - Seeing is believing”, EC Newsdesk,
August 15, 2006.
http://www.ethicalcorp.com/content.asp?ContentID=4437.
Calvin M. Boardman and Hideaki Kiyoshi Kato, “The Confucian Roots of
Business Kyosei”, Journal of Business Ethics, 48: 317-333.

187
http://www.sel.eesc.usp.br/informatica/graduacao/material/etica/private/
the_confucian_roots_of_business_kyosei.pdf.
Masahiko Kawamura, “The Evolution of Corporate Social Responsibility in
Japan (Part 1)—Parallels with the History of Corporate Reform,” 8.

188
Author Index
SL. No. Name of the author Contact no.s E-mail ID Title of the Topic
1
Sreedharan
Chakravarthy and
Arindam
Bandyopadhyay
Determining the
Feasibility of Optimum
Currency Area for
SAARC Region
2Sneha Srinivasan and
Syed A A Farhan
91 881 404 9251
91 805 952 [email protected]
A Roadmap to Regional
Integration: Micro-
financing Clean
Energy for Sustainable
Livelihood across Asia
3Dr. Sharad Kumar &
Dinesh Rajput9820409406
A Comperitive Study of
external sector
developments in select
Asian Countries
4 Janardhana A [email protected] Threat or
Opportunity for India”.
5 Mr. Kannan 98203 53825
[email protected] Role of India and Asia
in the Global Economy
6
Dr. Sarat Malik (Joint
Director, SEBI ) & Ms.
Akruti, (Officer-
Research SEBI. )
91-22-26449280 & 91-
9819400897
Capital Markets
Development and
Economic Growth -
An Asian Perspective
7
Sumana Chudhri &
Rusha Das &
Sharmila Bonnerjee
Integrating India into
ASEAN: An
Infrastructural
Perspective
8 Col M P Singh 8009584404 [email protected]
Strategic and
Economic
Dimensions of Indo-
Myanmar Relations
9Prerna Ramuka and
Kusum Pawar
A review of Corporate
Social Responsibility
in Asia with special
reference to China,
India and Japan
10 Dr. Liu Youfa, Consul General of China [email protected]